UNITED STATES
SECURITIES AND EXCHANGE COMMISSION
WASHINGTON, D.C. 20549
FORM N-CSR
CERTIFIED SHAREHOLDER REPORT OF REGISTERED
MANAGEMENT INVESTMENT COMPANIES
Investment Company Act file number 811-4108
Oppenheimer Variable Account Funds
(Exact name of registrant as specified in charter)
6803 South Tucson Way, Centennial, Colorado 80112-3924
(Address of principal executive offices) (Zip code)
Arthur S. Gabinet
OFI Global Asset Management, Inc.
Two World Financial Center, New York, New York 10281-1008
(Name and address of agent for service)
Registrant’s telephone number, including area code: (303) 768-3200
Date of fiscal year end: December 31
Date of reporting period: 12/31/2013
Item 1. Reports to Stockholders.
| | | | |
| December 31, 2013 | | |
| | | Oppenheimer Discovery Mid Cap Growth Fund/VA* A Series of Oppenheimer Variable Account Funds | | Annual Report |
| | |
| | ANNUAL REPORT Listing of Top Holdings Fund Performance Discussion Financial Statements *Prior to 4/30/13, the Fund’s name was Oppenheimer Small- & Mid-Cap Growth Fund/VA | | |

Portfolio Manager: Ronald J. Zibelli, Jr., CFA
| | | | | | | | | | | | |
Average Annual Total Returns For the Periods Ended 12/31/13 | |
| | | 1-Year | | | 5-Year | | | 10-Year | |
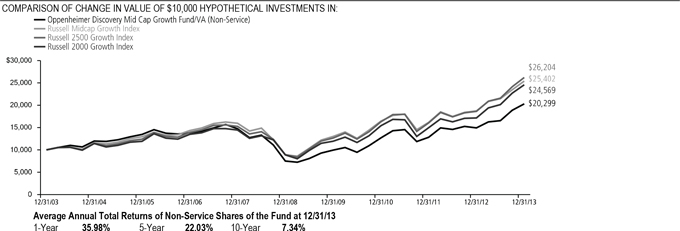
Non-Service Shares | | | 35.98 | % | | | 22.03% | | | | 7.34% | |
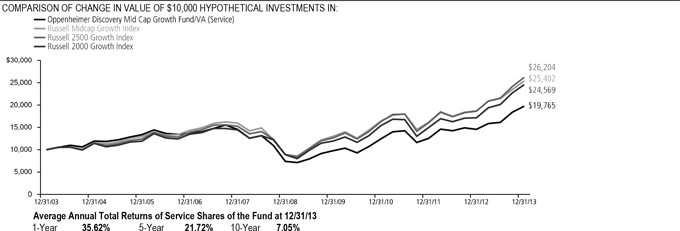
Service Shares | | | 35.62 | % | | | 21.72% | | | | 7.05% | |
Performance data quoted represents past performance, which does not guarantee future results. The investment return and principal value of an investment in the Fund will fluctuate so that an investor’s shares, when redeemed, may be worth more or less than their original cost. Current performance may be lower or higher than the performance quoted. For performance data current to the most recent month end, call us at 1.800.988.8287. The Fund’s total returns should not be expected to be the same as the returns of other funds, whether or not both funds have the same portfolio managers and/or similar names. The Fund’s total returns include changes in share price and reinvested distributions but do not include the charges associated with the separate account products that offer this Fund. Such performance would have been lower if such charges were taken into account.
| | | | |
TOP TEN COMMON STOCK HOLDINGS | | | | |
Tractor Supply Co. | | | 2.2 | % |
Affiliated Managers Group, Inc. | | | 1.9 | |
LinkedIn Corp., Cl. A | | | 1.9 | |
CoStar Group, Inc. | | | 1.7 | |
B/E Aerospace, Inc. | | | 1.6 | |
Wabtec Corp. | | | 1.5 | |
Actavis plc | | | 1.5 | |
Under Armour, Inc., Cl. A | | | 1.5 | |
Hexcel Corp. | | | 1.5 | |
Kansas City Southern | | | 1.5 | |
Portfolio holdings and allocations are subject to change. Percentages are as of December 31, 2013, and are based on net assets. For more current Fund holdings, please visit oppenheimerfunds.com.
SECTOR ALLOCATION
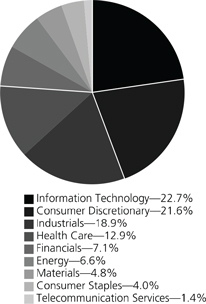
Portfolio holdings and allocations are subject to change. Percentages are as of December 31, 2013, and are based on the total market value of common stocks.
2 OPPENHEIMER DISCOVERY MID CAP GROWTH FUND/VA
| | |
Fund Performance Discussion |
The Fund’s Non-Service shares produced a total return of 35.98% during the one-year reporting period ended December 31, 2013, outperforming the Russell Midcap Growth Index (the “Index”), which returned 35.74%. During the reporting period, the Fund enjoyed good relative performance in the industrials, financials, information technology and energy sectors largely due to positive stock selection. The Fund underperformed the Index in the consumer discretionary sector due to relatively weak stock selection, and in the consumer staples sector, where less favorable stock selection and an underweight position detracted.
For the trailing 3-year period ended December 31, 2013, the Fund’s Non-Service shares produced an annualized return of 16.98% compared to 15.63% for the Russell Midcap Growth Index.
MARKET OVERVIEW
Equities in the U.S. and developed markets throughout the world delivered strong performance in 2013. Accommodative monetary policies on the part of central banks in the U.S., Europe and Japan, combined with supportive equity valuations relative to bonds, were instrumental in this performance. Signs that the U.S. economy was on the mend, demonstrated by rising house prices, also helped sentiment toward stocks. While equities performed well for the year, numerous concerns remained. Namely, in late May, relatively hawkish remarks by Federal Reserve (“Fed”) chairman Ben Bernanke were widely interpreted as a signal that U.S. monetary policymakers would begin to back away from their quantitative easing program sooner than expected, sparking heightened volatility in financial markets throughout the world. Additionally, fears began to creep into the market about a possible slowdown in the world’s emerging economies. However, market conditions generally stabilized over the summer of 2013. While the Fed unexpectedly refrained from reducing its monthly bond purchases in September, in December, the Central Bank announced that it would reduce its monthly bond purchases by $10 billion, from $85 billion to $75 billion, starting in January 2014. The Fed also announced that it would continue to hold short-term interest rates at very low levels until unemployment in the United States subsided below 6.5%. This was lower than its earlier 7% target.
TOP INDIVIDUAL CONTRIBUTORS
During the period, two information technology companies were top performers, LinkedIn Corp. and CoStar Group, Inc. LinkedIn, the largest professional networking website, released strong earnings results throughout the year and all three of the company’s segments grew significantly faster than the overall market. CoStar Group is a leading provider of information services to the commercial real estate industry. As commercial real estate activity accelerated through the year, CoStar reported a series of strong quarterly results. The company also benefited from its 2012 acquisition of LoopNet, as synergies appear to be greater than expected.
Other strong performers during the period included health care company Actavis plc, consumer discretionary stock Tractor Supply Co. and financial services company Affiliated Managers Group, Inc. Actavis has become one of the largest generic drug companies in the world through a series of strategic acquisitions and new generic drug launches. Their most recent acquisition of Warner Chilcott was announced in May 2013 and we believe it will be accretive to earnings. We have owned Actavis for a number of years and it has grown into our largest health care holding. Tractor Supply is the largest domestic operator of retail farm and ranch stores. The company performed positively despite sizable weather challenges.
Our long-term investment in the Affiliated Managers Group, Inc. (“AMG”) made a strong contribution during the period. AMG is an asset management company providing investment management services to mutual funds, institutional clients, and high net worth individuals. Strong relative performance by the company’s affiliate investment managers led to large inflows during the period. AMG remains our largest holding in the financial services sector.
TOP INDIVIDUAL DETRACTORS
The most significant detractors from performance this period were Rackspace Hosting, Inc., Aruba Networks, Inc. and SolarWinds, Inc. Rackspace reported weak results early in 2013 due to unexpected price competition in their core web hosting market. Aruba Networks, a supplier of wireless LAN (WLAN) systems for enterprises, reported disappointing third quarter results and fourth quarter guidance due largely to delayed customer orders. SolarWinds, a provider of infrastructure management tools, reported first quarter revenue below street estimates as growth from new licenses slowed. We sold our position in these three stocks during the period.
STRATEGY & OUTLOOK
At the end of the reporting period relative to the Index, the Fund was overweight in the information technology, industrials and energy sectors while most underweight in consumer discretionary, consumer staples, materials and financials.
Our long-term investment process is unchanged as we focus on outperforming the Index with superior stock selection. We seek dynamic companies with above-average and sustainable revenue and earnings growth potential. We also continue to favor well-established, high-quality growth companies with proven management teams.
3 OPPENHEIMER DISCOVERY MID CAP GROWTH FUND/VA
The macroeconomic environment remains characterized by modest economic expansion, slow corporate profit growth and low (albeit more volatile) interest rates. We believe this environment places a bigger premium on companies that can generate organic growth, which is a favorable backdrop for the Fund.
Investors should consider the Fund’s investment objective, risks, charges and expenses carefully before investing. The Fund’s prospectus and summary prospectus contain this and other information about the Fund, and may be obtained by asking your financial advisor or calling us at 1.800.988.8287. Read prospectuses and summary prospectuses carefully before investing.
Total returns include changes in share price and reinvestment of dividends and capital gains distributions in a hypothetical investment for the periods shown.
The Fund’s investment strategy and focus can change over time. The mention of specific fund holdings does not constitute a recommendation by OppenheimerFunds, Inc. or its affiliates.
Shares of Oppenheimer funds are not deposits or obligations of any bank, are not guaranteed by any bank, are not insured by the FDIC or any other agency, and involve investment risks, including the possible loss of the principal amount invested.
Comparing the Fund’s Performance to the Market. The graphs that follow show the performance of a hypothetical $10,000 investment in each share class of the Fund held until December 31, 2013. Performance is measured over a ten-fiscal-year period for both Classes. Performance information does not reflect charges that apply to separate accounts investing in the Fund. If these charges were taken into account, performance would be lower. The graphs assume that all dividends and capital gains distributions were reinvested in additional shares. Past performance cannot guarantee future results. The Fund’s performance is compared to the performance of the Russell Midcap Growth Index, the Russell 2500 Growth Index and the Russell 2000 Growth Index. The Russell Midcap Growth Index measures the performance of the mid-cap growth segment of the U.S. equity universe. It includes those Russell Midcap Index companies with higher price-to-book ratios and higher forecasted growth values. The Russell 2500 Growth Index measures the performance of the small to mid-cap growth segment of the U.S. equity universe. It includes those Russell 2500 Index companies with higher price-to-book ratios and higher forecasted growth values. The Russell 2000 Growth Index measures the performance of the small-cap growth segment of the U.S. equity universe. It includes those Russell 2000 Index companies with higher price-to-book ratios and higher forecasted growth values. The Fund has changed its benchmarks from the Russell Midcap Growth Index, the Russell 2500 Growth Index and the Russell 2000 Growth Index to the Russell Midcap Growth Index, which it believes is a more appropriate measure of the Fund’s performance. Indices are unmanaged and cannot be purchased directly by investors. Index performance includes reinvestment of income, but does not reflect transaction costs, fees, expenses or taxes. Index performance is shown for illustrative purposes only as a benchmark for the Fund’s performance, and does not predict or depict performance of the Fund. The Fund’s performance reflects the effects of the Fund’s business and operating expenses.
4 OPPENHEIMER DISCOVERY MID CAP GROWTH FUND/VA
Performance data quoted represents past performance, which does not guarantee future results. The investment return and principal value of an investment in the Fund will fluctuate so that an investor’s shares, when redeemed, may be worth more or less than their original cost. Current performance may be lower or higher than the performance quoted. For performance data current to the most recent month end, call us at 1.800.988.8287. The Fund’s total returns should not be expected to be the same as the returns of other funds, whether or not both funds have the same portfolio managers and/or similar names. The Fund’s total returns include changes in share price and reinvested distributions but do not include the charges associated with the separate account products that offer this Fund. Such performance would have been lower if such charges were taken into account.
5 OPPENHEIMER DISCOVERY MID CAP GROWTH FUND/VA
Fund Expenses. As a shareholder of the Fund, you incur two types of costs: (1) transaction costs and (2) ongoing costs, including management fees; distribution and service fees; and other Fund expenses. These examples are intended to help you understand your ongoing costs (in dollars) of investing in the Fund and to compare these costs with the ongoing costs of investing in other mutual funds.
The examples are based on an investment of $1,000.00 invested at the beginning of the period and held for the entire 6-month period ended December 31, 2013.
Actual Expenses. The first section of the table provides information about actual account values and actual expenses. You may use the information in this section for the class of shares you hold, together with the amount you invested, to estimate the expense that you paid over the period. Simply divide your account value by $1,000.00 (for example, an $8,600.00 account value divided by $1,000.00 = 8.60), then multiply the result by the number in the first section under the heading entitled “Expenses Paid During Period” to estimate the expenses you paid on your account during this period.
Hypothetical Example for Comparison Purposes.
The second section of the table provides information about hypothetical account values and hypothetical expenses based on the Fund’s actual expense ratio for each class of shares, and an assumed rate of return of 5% per year for each class before expenses, which is not the actual return. The hypothetical account values and expenses may not be used to estimate the actual ending account balance or expenses you paid for the period. You may use this information to compare the ongoing costs of investing in the Fund and other funds. To do so, compare this 5% hypothetical example for the class of shares you hold with the 5% hypothetical examples that appear in the shareholder reports of the other funds.
Please note that the expenses shown in the table are meant to highlight your ongoing costs only and do not reflect any charges associated with the separate accounts that offer this Fund. Therefore, the “hypothetical” lines of the table are useful in comparing ongoing costs only, and will not help you determine the relative total costs of owning different funds. In addition, if these separate account charges were included your costs would have been higher.
| | | | | | | | | | | | | | |
| Actual | | Beginning
Account
Value
July 1, 2013 | | | Ending
Account
Value
December 31, 2013 | | | Expenses
Paid During
6 Months Ended
December 31, 2013 | | | |
Non-Service shares | | $ | 1,000.00 | | | $ | 1,226.90 | | | $ | 4.50 | | | |
Service shares | | | 1,000.00 | | | | 1,225.30 | | | | 5.85 | | | |
| | | | |
Hypothetical | | | | | | | | | | | | | | |
(5% return before expenses) | | | | | | | | | | | | | | |
Non-Service shares | | | 1,000.00 | | | | 1,021.17 | | | | 4.08 | | | |
Service shares | | | 1,000.00 | | | | 1,019.96 | | | | 5.31 | | | |
Expenses are equal to the Fund’s annualized expense ratio for that class, multiplied by the average account value over the period, multiplied by 184/365 (to reflect the one-half year period). Those annualized expense ratios, excluding indirect expenses from affiliated funds, based on the 6-month period ended December 31, 2013 are as follows:
| | | | | | | | | | |
| Class | | Expense Ratios | | |
Non-Service shares | | | | 0.80 | % | | |
Service shares | | | | 1.04 | | | |
The expense ratios reflect contractual waivers and/or reimbursements of expenses by the Fund’s Manager. Some of these undertakings may be modified or terminated at any time, unless approved by the Board of Trustees. The “Financial Highlights” tables in the Fund’s financial statements, included in this report, also show the gross expense ratios, without such waivers or reimbursements and reduction to custodian expenses, if applicable.
6 OPPENHEIMER DISCOVERY MID CAP GROWTH FUND/VA
STATEMENT OF INVESTMENTS December 31, 2013
| | | | | | | | | | |
| | | Shares | | | Value | | | |
Common Stocks—99.3% | | | | | | | |
Consumer Discretionary—21.6% | | | | | | | |
Auto Components—1.7% | | | | | | | |
| Delphi Automotive plc | | | 121,850 | | | $ | 7,326,840 | | | |
| TRW Automotive Holdings Corp.1 | | | 69,210 | | | | 5,148,532 | | | |
| | | | | | | | 12,475,372 | | | |
| Distributors—1.4% | | | |
| LKQ Corp.1 | | | 313,780 | | | | 10,323,362 | | | |
| Hotels, Restaurants & Leisure—3.5% | | | |
| Chipotle Mexican Grill, Inc.1 | | | 12,920 | | | | 6,883,518 | | | |
| Domino’s Pizza, Inc. | | | 52,320 | | | | 3,644,088 | | | |
| Dunkin’ Brands Group, Inc. | | | 159,690 | | | | 7,697,058 | | | |
| Hilton Worldwide Holdings, Inc.1 | | | 18,210 | | | | 405,172 | | | |
| Wynn Resorts Ltd. | | | 42,060 | | | | 8,168,473 | | | |
| | | | | | | | 26,798,309 | | | |
| Household Durables—1.3% | | | |
| Harman International Industries, Inc. | | | 124,680 | | | | 10,205,058 | | | |
| Internet & Catalog Retail—2.0% | | | |
| Netflix, Inc.1 | | | 26,290 | | | | 9,679,189 | | | |
| TripAdvisor, Inc.1 | | | 49,350 | | | | 4,087,660 | | | |
| zulily, inc., Cl. A1 | | | 34,230 | | | | 1,418,149 | | | |
| | | | | | | | 15,184,998 | | | |
| Leisure Equipment & Products—1.2% | | | |
| Polaris Industries, Inc. | | | 61,560 | | | | 8,965,598 | | | |
| Media—2.5% | | | |
| AMC Networks, Inc., Cl. A1 | | | 100,860 | | | | 6,869,575 | | | |
| Lions Gate Entertainment Corp. | | | 259,290 | | | | 8,209,121 | | | |
| Sinclair Broadcast Group, Inc., Cl. A | | | 100,950 | | | | 3,606,943 | | | |
| | | | | | | | 18,685,639 | | | |
| Specialty Retail—4.7% | | | |
| Conn’s, Inc.1 | | | 39,918 | | | | 3,145,139 | | | |
| GNC Holdings, Inc., Cl. A | | | 110,740 | | | | 6,472,753 | | | |
| Lumber Liquidators Holdings, Inc.1 | | | 41,120 | | | | 4,230,837 | | | |
| O’Reilly Automotive, Inc.1 | | | 43,430 | | | | 5,589,875 | | | |
| Tractor Supply Co. | | | 216,250 | | | | 16,776,675 | | | |
| | | | | | | | 36,215,279 | | | |
| Textiles, Apparel & Luxury Goods—3.3% | | | |
| Deckers Outdoor Corp.1 | | | 45,370 | | | | 3,831,950 | | | |
| Michael Kors Holdings Ltd.1 | | | 119,280 | | | | 9,684,343 | | | |
| Under Armour, Inc., Cl. A1 | | | 128,290 | | | | 11,199,717 | | | |
| | | | | | | | 24,716,010 | | | |
| Consumer Staples—4.0% | | | | | | | | | | |
| Beverages—0.7% | | | |
| Constellation Brands, Inc., Cl. A1 | | | 79,650 | | | | 5,605,767 | | | |
| Food & Staples Retailing—1.8% | | | |
| Sprouts Farmers Market, Inc.1 | | | 76,080 | | | | 2,923,754 | | | |
| Whole Foods Market, Inc. | | | 190,070 | | | | 10,991,748 | | | |
| | | | | | | | 13,915,502 | | | |
| Food Products—0.4% | | | |
| Hormel Foods Corp. | | | 74,900 | | | | 3,383,233 | | | |
| Personal Products—1.1% | | | |
| Nu Skin Enterprises, Inc., Cl. A | | | 58,208 | | | | 8,045,510 | | | |
| Energy—6.7% | | | | | | | | | | |
| Energy Equipment & Services—3.0% | | | |
| Bristow Group, Inc. | | | 46,400 | | | | 3,482,784 | | | |
| Core Laboratories NV | | | 19,320 | | | | 3,689,154 | | | |
| Dril-Quip, Inc.1 | | | 68,200 | | | | 7,497,226 | | | |
| Oceaneering International, Inc. | | | 92,590 | | | | 7,303,499 | | | |
| | | | | | | | 21,972,663 | | | |
| Oil, Gas & Consumable Fuels—3.7% | | | |
| Antero Resources Corp.1 | | | 67,330 | | | | 4,271,415 | | | |
| Cabot Oil & Gas Corp. | | | 109,060 | | | | 4,227,166 | | | |
| Concho Resources, Inc.1 | | | 36,280 | | | | 3,918,240 | | | |
| Gulfport Energy Corp.1 | | | 106,580 | | | | 6,730,527 | | | |
| Oasis Petroleum, Inc.1 | | | 188,590 | | | | 8,858,072 | | | |
| | | | | | | | 28,005,420 | | | |
| Financials—7.1% | | | | | | | | | | |
| Capital Markets—3.5% | | | |
| Affiliated Managers Group, Inc.1 | | | 66,270 | | | | 14,372,638 | | | |
| Financial Engines, Inc. | | | 123,920 | | | | 8,609,962 | | | |
| | | | | | | | | | |
| | | Shares | | | Value | | | |
| Capital Markets (Continued) | | | |
| Waddell & Reed Financial, Inc., Cl. A | | | 58,830 | | | $ | 3,831,010 | | | |
| | | | | | | | 26,813,610 | | | |
| Commercial Banks—3.1% | | | |
| First Republic Bank | | | 110,540 | | | | 5,786,769 | | | |
| Signature Bank1 | | | 92,080 | | | | 9,891,234 | | | |
| SVB Financial Group1 | | | 73,130 | | | | 7,668,412 | | | |
| | | | | | | | 23,346,415 | | | |
| Diversified Financial Services—0.5% | | | |
| MarketAxess Holdings, Inc. | | | 55,620 | | | | 3,719,309 | | | |
| Health Care—12.8% | | | | | | | | | | |
| Biotechnology—1.6% | | | |
| BioMarin Pharmaceutical, Inc.1 | | | 59,160 | | | | 4,157,173 | | | |
| Incyte Corp.1 | | | 129,490 | | | | 6,556,079 | | | |
| Pharmacyclics, Inc.1 | | | 14,840 | | | | 1,569,775 | | | |
| | | | | | | | 12,283,027 | | | |
| Health Care Equipment & Supplies—1.0% | | | |
| Align Technology, Inc.1 | | | 66,060 | | | | 3,775,329 | | | |
| Cooper Cos., Inc. (The) | | | 29,720 | | | | 3,680,525 | | | |
| | | | | | | | 7,455,854 | | | |
| Health Care Providers & Services—4.4% | | | |
| AmerisourceBergen Corp., Cl. A | | | 108,930 | | | | 7,658,868 | | | |
| Centene Corp.1 | | | 113,430 | | | | 6,686,698 | | | |
| Envision Healthcare Holdings, Inc.1 | | | 172,090 | | | | 6,112,637 | | | |
| Team Health Holdings, Inc.1 | | | 116,960 | | | | 5,327,528 | | | |
| Universal Health Services, Inc., Cl. B | | | 94,440 | | | | 7,674,194 | | | |
| | | | | | | | 33,459,925 | | | |
| Health Care Technology—1.9% | | | |
| athenahealth, Inc.1 | | | 36,470 | | | | 4,905,215 | | | |
| Cerner Corp.1 | | | 179,850 | | | | 10,024,839 | | | |
| | | | | | | | 14,930,054 | | | |
| Life Sciences Tools & Services—1.9% | | | |
| Covance, Inc.1 | | | 63,290 | | | | 5,573,317 | | | |
| Illumina, Inc.1 | | | 81,200 | | | | 8,982,344 | | | |
| | | | | | | | 14,555,661 | | | |
| Pharmaceuticals—2.0% | | | |
| Actavis plc1 | | | 67,430 | | | | 11,328,240 | | | |
| Jazz Pharmaceuticals plc1 | | | 30,160 | | | | 3,817,050 | | | |
| | | | | | | | 15,145,290 | | | |
| Industrials—18.5% | | | | | | | | | | |
| Aerospace & Defense—3.0% | | | |
| B/E Aerospace, Inc.1 | | | 137,056 | | | | 11,927,984 | | | |
| Hexcel Corp.1 | | | 249,140 | | | | 11,134,067 | | | |
| | | | | | | | 23,062,051 | | | |
| Airlines—0.7% | | | |
| Copa Holdings SA, Cl. A | | | 31,330 | | | | 5,016,246 | | | |
| Building Products—2.3% | | | |
| A.O. Smith Corp. | | | 191,720 | | | | 10,341,377 | | | |
| Fortune Brands Home & Security, Inc. | | | 151,270 | | | | 6,913,039 | | | |
| | | | | | | | 17,254,416 | | | |
| Electrical Equipment—2.4% | | | |
| Acuity Brands, Inc. | | | 71,790 | | | | 7,848,083 | | | |
| AMETEK, Inc. | | | 170,302 | | | | 8,969,806 | | | |
| SolarCity Corp.1 | | | 32,530 | | | | 1,848,355 | | | |
| | | | | | | | 18,666,244 | | | |
| Machinery—6.7% | | | |
| Colfax Corp.1 | | | 66,300 | | | | 4,222,647 | | | |
| Flowserve Corp. | | | 50,420 | | | | 3,974,609 | | | |
| Graco, Inc. | | | 56,130 | | | | 4,384,876 | | | |
| Middleby Corp. (The)1 | | | 34,730 | | | | 8,334,158 | | | |
| Pall Corp. | | | 45,590 | | | | 3,891,106 | | | |
| Pentair Ltd. | | | 82,460 | | | | 6,404,668 | | | |
| Proto Labs, Inc.1 | | | 51,090 | | | | 3,636,586 | | | |
| WABCO Holdings, Inc.1 | | | 61,310 | | | | 5,726,967 | | | |
| Wabtec Corp. | | | 153,960 | | | | 11,434,609 | | | |
| | | | | | | | 52,010,226 | | | |
| Professional Services—0.7% | | | |
| Towers Watson & Co., Cl. A | | | 44,420 | | | | 5,668,436 | | | |
| Road & Rail—1.5% | | | |
| Kansas City Southern | | | 89,430 | | | | 11,074,117 | | | |
7 OPPENHEIMER DISCOVERY MID CAP GROWTH FUND/VA
STATEMENT OF INVESTMENTS Continued
| | | | | | | | | | |
| | | Shares | | | Value | | | |
| Trading Companies & Distributors—1.2% | | | |
| United Rentals, Inc.1 | | | 120,230 | | | $ | 9,371,928 | | | |
| Information Technology—22.6% | | | |
| Computers & Peripherals—1.3% | | | |
| Stratasys Ltd.1 | | | 71,990 | | | | 9,697,053 | | | |
| Internet Software & Services—6.5% | | | |
| Cornerstone OnDemand, Inc.1 | | | 147,140 | | | | 7,848,448 | | | |
| CoStar Group, Inc.1 | | | 70,470 | | | | 13,007,353 | | | |
| Criteo SA, Sponsored ADR1 | | | 16,810 | | | | 574,902 | | | |
| LinkedIn Corp., Cl. A1 | | | 66,170 | | | | 14,347,641 | | | |
| Pandora Media, Inc.1 | | | 192,940 | | | | 5,132,204 | | | |
| Yelp, Inc., Cl. A1 | | | 64,090 | | | | 4,419,005 | | | |
| Zillow, Inc., Cl. A1 | | | 44,190 | | | | 3,611,649 | | | |
| | | | | | | | 48,941,202 | | | |
| IT Services—2.8% | | | |
| Alliance Data Systems Corp.1 | | | 32,840 | | | | 8,634,621 | | | |
| FleetCor Technologies, Inc.1 | | | 68,170 | | | | 7,987,479 | | | |
| MAXIMUS, Inc. | | | 118,010 | | | | 5,191,260 | | | |
| | | | | | | | 21,813,360 | | | |
| Semiconductors & Semiconductor Equipment—1.7% | | | |
| NXP Semiconductors NV1 | | | 127,090 | | | | 5,837,244 | | | |
| Xilinx, Inc. | | | 143,110 | | | | 6,571,611 | | | |
| | | | | | | | 12,408,855 | | | |
| Software—10.3% | | | |
| Aspen Technology, Inc.1 | | | 215,430 | | | | 9,004,974 | | | |
| Autodesk, Inc.1 | | | 75,950 | | | | 3,822,563 | | | |
| CommVault Systems, Inc.1 | | | 106,110 | | | | 7,945,517 | | | |
| Concur Technologies, Inc.1 | | | 86,498 | | | | 8,924,864 | | | |
| FireEye, Inc.1 | | | 7,070 | | | | 308,323 | | | |
| Guidewire Software, Inc.1 | | | 116,270 | | | | 5,705,369 | | | |
| NetSuite, Inc.1 | | | 100,257 | | | | 10,328,476 | | | |
| ServiceNow, Inc.1 | | | 156,530 | | | | 8,767,245 | | | |
| Splunk, Inc.1 | | | 130,450 | | | | 8,958,001 | | | |
| Tableau Software, Inc., Cl. A1 | | | 71,100 | | | | 4,900,923 | | | |
| Ultimate Software Group, Inc. (The)1 | | | 58,800 | | | | 9,009,336 | | | |
| Workday, Inc., Cl. A1 | | | 14,570 | | | | 1,211,641 | | | |
| | | | | | | 78,887,232 | | | |
| | | | | | | | | | |
| | | Shares | | | Value | | | |
| Materials—4.6% | | | |
| Chemicals—2.5% | | | |
| Methanex Corp. | | | 58,490 | | | $ | 3,464,948 | | | |
| PolyOne Corp. | | | 108,740 | | | | 3,843,959 | | | |
| Sherwin-Williams Co. (The) | | | 21,290 | | | | 3,906,715 | | | |
| Westlake Chemical Corp. | | | 65,910 | | | | 8,045,634 | | | |
| | | | | | | | 19,261,256 | | | |
| Construction Materials—0.8% | | | |
| Eagle Materials, Inc. | | | 74,590 | | | | 5,775,504 | | | |
| Containers & Packaging—0.5% | | | |
| Rock-Tenn Co., Cl. A | | | 39,860 | | | | 4,185,699 | | | |
| Metals & Mining—0.6% | | | |
| Carpenter Technology Corp. | | | 77,790 | | | | 4,838,538 | | | |
| Paper & Forest Products—0.2% | | | |
| KapStone Paper & Packaging Corp.1 | | | 34,010 | | | | 1,899,799 | | | |
| Telecommunication Services—1.4% | | | |
| Wireless Telecommunication Services—1.4% | | | |
| SBA Communications Corp., Cl. A1 | | | 119,840 | | | | 10,766,426 | | | |
Total Common Stocks (Cost $511,038,668) | | | | 756,805,453 | | | |
| | | | | | | | | | |
| Investment Company—0.7% | | | | | | | | | | |
Oppenheimer Institutional Money Market Fund, Cl. E, 0.09%2,3 (Cost $5,136,594) | | | 5,136,594 | | | | 5,136,594 | | | |
Total Investments, at Value (Cost $516,175,262) | | | 100.0 | % | | | 761,942,047 | | | |
| Assets in Excess of Other Liabilities | | | 0.0 | | | | 12,553 | | | |
| Net Assets | | | 100.0 | % | | $ | 761,954,600 | | | |
Footnotes to Statement of Investments
1. Non-income producing security.
2. Is or was an affiliate, as defined in the Investment Company Act of 1940, at or during the period ended December 31, 2013, by virtue of the Fund owning at least 5% of the voting securities of the issuer or as a result of the Fund and the issuer having the same investment adviser. Transactions during the period in which the issuer was an affiliate are as follows:
| | | | | | | | | | | | | | | | |
| | | Shares
December 31, 2012 | | | Gross
Additions | | | Gross
Reductions | | | Shares
December 31, 2013 | |
Oppenheimer Institutional Money Market Fund, Cl. E | | | 11,313,011 | | | | 276,502,708 | | | | 282,679,125 | | | | 5,136,594 | |
| | | | |
| | | | | | | | | Value | | | Income | |
Oppenheimer Institutional Money Market Fund, Cl. E | | | | | | | | | | $ | 5,136,594 | | | $ | 9,846 | |
3. Rate shown is the 7-day yield as of December 31, 2013.
See accompanying Notes to Financial Statements.
8 OPPENHEIMER DISCOVERY MID CAP GROWTH FUND/VA
| | |
STATEMENT OF ASSETS AND LIABILITIES December 31, 2013 |
| | | | |
Assets | | | | |
Investments, at value—see accompanying statement of investments: | | | | |
Unaffiliated companies (cost $511,038,668) | | $ | 756,805,453 | |
Affiliated companies (cost $5,136,594) | | | 5,136,594 | |
| | | | 761,942,047 | |
Cash | | | 1,000 | |
Receivables and other assets: | | | | |
Investments sold | | | 1,429,635 | |
Shares of beneficial interest sold | | | 198,255 | |
Dividends | | | 61,668 | |
Expense waivers/reimbursements due from manager | | | 1,890 | |
Other | | | 40,778 | |
Total assets | | | 763,675,273 | |
|
| |
Liabilities | | | | |
Payables and other liabilities: | | | | |
Shares of beneficial interest redeemed | | | 1,567,057 | |
Transfer and shareholder servicing agent fees | | | 63,294 | |
Trustees’ compensation | | | 36,274 | |
Shareholder communications | | | 23,877 | |
Distribution and service plan fees | | | 7,911 | |
Other | | | 22,260 | |
Total liabilities | | | 1,720,673 | |
|
| | |
Net Assets | | $ | 761,954,600 | |
|
| |
Composition of Net Assets | | | | |
Par value of shares of beneficial interest | | $ | 10,242 | |
Additional paid-in capital | | | 568,484,820 | |
Accumulated net investment loss | | | (53,163 | ) |
Accumulated net realized loss on investments | | | (52,254,084 | ) |
Net unrealized appreciation on investments | | | 245,766,785 | |
Net Assets | | $ | 761,954,600 | |
|
| |
Net Asset Value Per Share | | | | |
Non-Service Shares: | | | | |
| Net asset value, redemption price (excludes applicable contingent deferred sales charge) and offering price per share (based on net assets of $725,405,735 and 9,735,984 shares of beneficial interest outstanding) | | | $74.51 | |
| |
Service Shares: | | | | |
| Net asset value, redemption price (excludes applicable contingent deferred sales charge) and offering price per share (based on net assets of $36,548,865 and 506,059 shares of beneficial interest outstanding) | | | $72.22 | |
See accompanying Notes to Financial Statements.
9 OPPENHEIMER DISCOVERY MID CAP GROWTH FUND/VA
| | |
STATEMENT OF OPERATIONS For the Year Ended December 31, 2013 |
| | | | |
Investment Income | | | | |
Dividends: | | | | |
Unaffiliated companies (net of foreign withholding taxes of $3,700) | | $ | 3,648,538 | |
Affiliated companies | | | 9,846 | |
Interest | | | 29 | |
Total investment income | | | 3,658,413 | |
|
| | |
Expenses | | | | |
Management fees | | | 4,677,970 | |
Distribution and service plan fees - Service shares | | | 90,237 | |
Transfer and shareholder servicing agent fees: | | | | |
Non-Service shares | | | 618,393 | |
Service shares | | | 35,848 | |
Shareholder communications: | | | | |
Non-Service shares | | | 90,520 | |
Service shares | | | 5,063 | |
Custodian fees and expenses | | | 3,696 | |
Trustees’ compensation | | | 35,577 | |
Other | | | 57,919 | |
Total expenses | | | 5,615,223 | |
Less waivers and reimbursements of expenses | | | (267,471 | ) |
Net expenses | | | 5,347,752 | |
|
| | |
Net Investment Loss | | | (1,689,339 | ) |
|
| | |
Realized and Unrealized Gain | | | | |
Net realized gain on investments from unaffiliated companies | | | 122,245,177 | |
Net change in unrealized appreciation/depreciation on investments | | | 79,850,119 | |
|
| | |
Net Increase in Net Assets Resulting from Operations | | $ | 200,405,957 | |
See accompanying Notes to Financial Statements.
10 OPPENHEIMER DISCOVERY MID CAP GROWTH FUND/VA
| | |
STATEMENTS OF CHANGES IN NET ASSETS |
| | | | | | | | | | |
| | | Year Ended
December 31, 2013 | | | | | Year Ended
December 31, 2012 | |
Operations | | | | | | | | | | |
Net investment income (loss) | | $ | (1,689,339) | | | | | $ | 65,784 | |
Net realized gain | | | 122,245,177 | | | | | | 50,857,244 | |
Net change in unrealized appreciation/depreciation | | | 79,850,119 | | | | | | 42,312,507 | |
Net increase in net assets resulting from operations | | | 200,405,957 | | | | | | 93,235,535 | |
|
| |
Dividends and/or Distributions to Shareholders | | | | | | | | | | |
Dividends from net investment income: | | | | | | | | | | |
Non-Service shares | | | (73,101) | | | | | | — | |
Service shares | | | — | | | | | | — | |
| | | (73,101) | | | | | | — | |
|
| |
Beneficial Interest Transactions | | | | | | | | | | |
Net increase (decrease) in net assets resulting from beneficial interest transactions: | | | | | | | | | | |
Non-Service shares | | | (22,913,255) | | | | | | (71,703,483 | ) |
Service shares | | | (10,340,669) | | | | | | (5,448,961 | ) |
| | | (33,253,924) | | | | | | (77,152,444 | ) |
|
| |
Net Assets | | | | | | | | | | |
Total increase | | | 167,078,932 | | | | | | 16,083,091 | |
Beginning of period | | | 594,875,668 | | | | | | 578,792,577 | |
| | | |
End of period (including accumulated net investment income (loss) of $(53,163) and $42,730, respectively) | | $ | 761,954,600 | | | | | $ | 594,875,668 | |
See accompanying Notes to Financial Statements.
11 OPPENHEIMER DISCOVERY MID CAP GROWTH FUND/VA
| | | | | | | | | | | | | | | | | | | | |
Non-Service Shares | |
| Year Ended
December
31, 2013 |
| |
| Year Ended
December
31, 2012 |
| |
| Year Ended
December
30, 2011 |
1 | |
| Year Ended
December
31, 2010 |
| |
| Year Ended
December
31, 2009 |
|
Per Share Operating Data | | | | | | | | | | | | | | | | | | | | |
Net asset value, beginning of period | | $ | 54.80 | | | $ | 47.06 | | | $ | 46.55 | | | $ | 36.52 | | | $ | 27.54 | |
Income (loss) from investment operations: | | | | | | | | | | | | | | | | | | | | |
Net investment income (loss)2 | | | (0.16 | ) | | | 0.01 | | | | (0.26 | ) | | | (0.11 | ) | | | (0.05 | ) |
Net realized and unrealized gain | | | 19.88 | | | | 7.73 | | | | 0.77 | | | | 10.14 | | | | 9.03 | |
Total from investment operations | | | 19.72 | | | | 7.74 | | | | 0.51 | | | | 10.03 | | | | 8.98 | |
Dividends and/or distributions to shareholders: | | | | | | | | | | | | | | | | | | | | |
Dividends from net investment income | | | (0.01 | ) | | | 0.00 | | | | 0.00 | | | | 0.00 | | | | 0.00 | |
Net asset value, end of period | | $ | 74.51 | | | $ | 54.80 | | | $ | 47.06 | | | $ | 46.55 | | | $ | 36.52 | |
| | | | | |
| | | | | | | | | | | | | | | | | | | | | |
Total Return, at Net Asset Value3 | | | 35.98% | | | | 16.45% | | | | 1.09% | | | | 27.46% | | | | 32.61% | |
| | | | | | | | | | | | | | | | | | | | | |
Ratios/Supplemental Data | | | | | | | | | | | | | | | | | | | | |
Net assets, end of period (in thousands) | | $ | 725,406 | | | $ | 558,934 | | | $ | 543,020 | | | $ | 611,872 | | | $ | 547,683 | |
Average net assets (in thousands) | | $ | 618,970 | | | $ | 575,072 | | | $ | 605,083 | | | $ | 548,739 | | | $ | 478,968 | |
Ratios to average net assets:4 | | | | | | | | | | | | | | | | | | | | |
Net investment income (loss) | | | (0.24)% | | | | 0.03% | | | | (0.53)% | | | | (0.29)% | | | | (0.17)% | |
Total expenses5 | | | 0.84% | | | | 0.85% | | | | 0.84% | | | | 0.85% | | | | 0.86% | |
| Expenses after payments, waivers and/or reimbursements and reduction to custodian expenses | | | 0.80% | | | | 0.80% | | | | 0.80% | | | | 0.76% | | | | 0.71% | |
Portfolio turnover rate | | | 84% | | | | 66% | | | | 91% | | | | 95% | | | | 102% | |
1. December 30, 2011 represents the last business day of the Fund’s reporting period.
2. Per share amounts calculated based on the average shares outstanding during the period.
3. Assumes an initial investment on the business day before the first day of the fiscal period, with all dividends and distributions reinvested in additional shares on the reinvestment date, and redemption at the net asset value calculated on the last business day of the fiscal period. Total returns are not annualized for periods less than one full year. Total return information does not reflect expenses that apply at the separate account level or to related insurance products. Inclusion of these charges would reduce the total return figures for all periods shown. Returns do not reflect the deduction of taxes that a shareholder would pay on fund distributions or the redemption of fund shares.
4. Annualized for periods less than one full year.
5. Total expenses including indirect expenses from affiliated fund were as follows:
| | | | |
Year Ended December 31, 2013 | | | 0.84 | % |
Year Ended December 31, 2012 | | | 0.85 | % |
Year Ended December 30, 2011 | | | 0.84 | % |
Year Ended December 31, 2010 | | | 0.85 | % |
Year Ended December 31, 2009 | | | 0.86 | % |
See accompanying Notes to Financial Statements.
12 OPPENHEIMER DISCOVERY MID CAP GROWTH FUND/VA
| | | | | | | | | | | | | | | | | | | | |
Service Shares | |
| Year Ended
December
31, 2013 |
| |
| Year Ended
December
31, 2012 |
| |
| Year Ended
December
30, 2011 |
1 | |
| Year Ended
December
31, 2010 |
| |
| Year Ended
December
31, 2009 |
|
Per Share Operating Data | | | | | | | | | | | | | | | | | | | | |
Net asset value, beginning of period | | $ | 53.25 | | | $ | 45.84 | | | $ | 45.46 | | | $ | 35.75 | | | $ | 27.03 | |
Income (loss) from investment operations: | | | | | | | | | | | | | | | | | | | | |
Net investment loss2 | | | (0.30 | ) | | | (0.12 | ) | | | (0.37 | ) | | | (0.20 | ) | | | (0.13 | ) |
Net realized and unrealized gain | | | 19.27 | | | | 7.53 | | | | 0.75 | | | | 9.91 | | | | 8.85 | |
Total from investment operations | | | 18.97 | | | | 7.41 | | | | 0.38 | | | | 9.71 | | | | 8.72 | |
Dividends and/or distributions to shareholders: | | | | | | | | | | | | | | | | | | | | |
Dividends from net investment income | | | 0.00 | | | | 0.00 | | | | 0.00 | | | | 0.00 | | | | 0.00 | |
Net asset value, end of period | | $ | 72.22 | | | $ | 53.25 | | | $ | 45.84 | | | $ | 45.46 | | | $ | 35.75 | |
| | | | | |
| | | | | | | | | | | | | | | | | | | | | |
Total Return, at Net Asset Value3 | | | 35.62% | | | | 16.17% | | | | 0.83% | | | | 27.16% | | | | 32.26% | |
| | | | | | | | | | | | | | | | | | | | | |
Ratios/Supplemental Data | | | | | | | | | | | | | | | | | | | | |
Net assets, end of period (in thousands) | | $ | 36,549 | | | $ | 35,942 | | | $ | 35,773 | | | $ | 32,669 | | | $ | 26,098 | |
Average net assets (in thousands) | | $ | 35,905 | | | $ | 37,842 | | | $ | 37,775 | | | $ | 27,552 | | | $ | 22,605 | |
Ratios to average net assets:4 | | | | | | | | | | | | | | | | | | | | |
Net investment loss | | | (0.49)% | | | | (0.22)% | | | | (0.78)% | | | | (0.53)% | | | | (0.44)% | |
Total expenses5 | | | 1.09% | | | | 1.10% | | | | 1.09% | | | | 1.10% | | | | 1.12% | |
| Expenses after payments, waivers and/or reimbursements and reduction to custodian expenses | | | 1.05% | | | | 1.05% | | | | 1.05% | | | | 1.01% | | | | 0.97% | |
Portfolio turnover rate | | | 84% | | | | 66% | | | | 91% | | | | 95% | | | | 102% | |
1. December 30, 2011 represents the last business day of the Fund’s reporting period.
2. Per share amounts calculated based on the average shares outstanding during the period.
3. Assumes an initial investment on the business day before the first day of the fiscal period, with all dividends and distributions reinvested in additional shares on the reinvestment date, and redemption at the net asset value calculated on the last business day of the fiscal period. Total returns are not annualized for periods less than one full year. Total return information does not reflect expenses that apply at the separate account level or to related insurance products. Inclusion of these charges would reduce the total return figures for all periods shown. Returns do not reflect the deduction of taxes that a shareholder would pay on fund distributions or the redemption of fund shares.
4. Annualized for periods less than one full year.
5. Total expenses including indirect expenses from affiliated fund were as follows:
| | | | |
Year Ended December 31, 2013 | | | 1.09 | % |
Year Ended December 31, 2012 | | | 1.10 | % |
Year Ended December 30, 2011 | | | 1.09 | % |
Year Ended December 31, 2010 | | | 1.10 | % |
Year Ended December 31, 2009 | | | 1.12 | % |
See accompanying Notes to Financial Statements.
13 OPPENHEIMER DISCOVERY MID CAP GROWTH FUND/VA
| | |
NOTES TO FINANCIAL STATEMENTS December 31, 2013 |
1. Significant Accounting Policies
Oppenheimer Discovery Mid-Cap Growth Fund/VA (the “Fund”), formerly Oppenheimer Small- & Mid-Cap Growth Fund/VA, is a separate series of Oppenheimer Variable Account Funds, as a diversified open-end management investment company registered under the Investment Company Act of 1940, as amended. The Fund’s investment objective is to seek capital appreciation. The Fund’s investment adviser is OFI Global Asset Management, Inc. (“OFI Global” or the “Manager”), a wholly-owned subsidiary of OppenheimerFunds Inc. (“OFI” or the “Sub-Adviser”). The Manager has entered into a sub-advisory agreement with OFI. Shares of the Fund are sold only to separate accounts of life insurance companies.
The Fund offers two classes of shares. Both classes are sold at their offering price, which is the net asset value per share, to separate investment accounts of participating insurance companies as an underlying investment for variable life insurance policies, variable annuity contracts or other investment products. The class of shares designated as Service shares is subject to a distribution and service plan. Both classes of shares have identical rights and voting privileges with respect to the Fund in general and exclusive voting rights on matters that affect that class alone. Earnings, net assets and net asset value per share may differ due to each class having its own expenses, such as transfer and shareholder servicing agent fees and shareholder communications, directly attributable to that class.
The following is a summary of significant accounting policies consistently followed by the Fund.
Investment in Oppenheimer Institutional Money Market Fund. The Fund is permitted to invest daily available cash balances in an affiliated money market fund. The Fund may invest the available cash in Class E shares of Oppenheimer Institutional Money Market Fund (“IMMF”) to seek current income while preserving liquidity. IMMF is a registered open-end management investment company, regulated as a money market fund under the Investment Company Act of 1940, as amended. The Manager is the investment adviser of IMMF, and the Sub-Adviser provides investment and related advisory services to IMMF. When applicable, the Fund’s investment in IMMF is included in the Statement of Investments. Shares of IMMF are valued at their net asset value per share. As a shareholder, the Fund is subject to its proportional share of IMMF’s Class E expenses, including its management fee. The Manager will waive fees and/or reimburse Fund expenses in an amount equal to the indirect management fees incurred through the Fund’s investment in IMMF.
Allocation of Income, Expenses, Gains and Losses. Income, expenses (other than those attributable to a specific class), gains and losses are allocated on a daily basis to each class of shares based upon the relative proportion of net assets represented by such class. Operating expenses directly attributable to a specific class are charged against the operations of that class.
Federal Taxes. The Fund intends to comply with provisions of the Internal Revenue Code applicable to regulated investment companies and to distribute substantially all of its investment company taxable income, including any net realized gain on investments not offset by capital loss carryforwards, if any, to shareholders. Therefore, no federal income or excise tax provision is required. The Fund files income tax returns in U.S. federal and applicable state jurisdictions. The statute of limitations on the Fund’s tax return filings generally remain open for the three preceding fiscal reporting period ends.
The tax components of capital shown in the following table represent distribution requirements the Fund must satisfy under the income tax regulations, losses the Fund may be able to offset against income and gains realized in future years and unrealized appreciation or depreciation of securities and other investments for federal income tax purposes.
| | | | | | | | | | | | | | |
Undistributed
Net Investment
Income | | | | Undistributed
Long-Term
Gain | | | Accumulated
Loss
Carryforward1,2,3,4 | | | Net Unrealized
Appreciation
Based on cost of
Securities and
Other Investments
for Federal Income
Tax Purposes | |
$— | | | | | $— | | | | $52,017,743 | | | | $245,530,435 | |
1. As of December 31, 2013, the Fund had $50,885,832 of net capital loss carryforwards available to offset future realized capital gains, if any, and thereby reduce future taxable gain distributions. Details of the capital loss carryforwards are included in the table below. Capital loss carryovers with no expiration, if any, must be utilized prior to those with expiration dates.
| | | | |
| Expiring | | | |
2017 | | | $50,885,832 | |
2. As of December 31, 2013, the Fund had $1,131,911 of post-October losses available to offset future realized capital gains, if any.
3. During the fiscal year ended December 31, 2013, the Fund utilized $121,849,981 of capital loss carryforward to offset capital gains realized in that fiscal year.
4. During the fiscal year ended December 31, 2012, the Fund utilized $44,334,654 of capital loss carryforward to offset capital gains realized in that fiscal year.
Net investment income (loss) and net realized gain (loss) may differ for financial statement and tax purposes. The character of dividends and distributions made during the fiscal year from net investment income or net realized gains may differ from their ultimate characterization for federal income tax purposes. Also, due to timing of dividends and distributions, the fiscal year in which amounts are distributed may differ from the fiscal year in which the income or net realized gain was recorded by the Fund.
Accordingly, the following amounts have been reclassified for December 31, 2013. Net assets of the Fund were unaffected by the reclassifications.
14 OPPENHEIMER DISCOVERY MID CAP GROWTH FUND/VA
1. Significant Accounting Policies (Continued)
| | | | |
Reduction to Paid-in Capital | | Reduction
to Accumulated
Net Investment
Loss | |
$1,666,547 | | | $1,666,547 | |
The tax character of distributions paid during the years ended December 31, 2013 and December 31, 2012 was as follows:
| | | | | | | | |
| | | Year Ended
December 31, 2013 | | | Year Ended
December 31, 2012 | |
Distributions paid from: | | | | | | | | |
Ordinary income | | $ | 73,101 | | | $ | — | |
The aggregate cost of securities and other investments and the composition of unrealized appreciation and depreciation of securities and other investments for federal income tax purposes as of December 31, 2013 are noted in the following table. The primary difference between book and tax appreciation or depreciation of securities and other investments, if applicable, is attributable to the tax deferral of losses or tax realization of financial statement unrealized gain or loss.
| | | | |
Federal tax cost of securities | | $ | 516,411,612 | |
| | | | |
Gross unrealized appreciation | | $ | 246,805,712 | |
Gross unrealized depreciation | | | (1,275,277) | |
| | | | |
Net unrealized appreciation | | $ | 245,530,435 | |
| | | | |
Trustees’ Compensation. The Board of Trustees has adopted a compensation deferral plan for independent trustees that enables trustees to elect to defer receipt of all or a portion of the annual compensation they are entitled to receive from the Fund. For purposes of determining the amount owed to the Trustee under the plan, deferred amounts are treated as though equal dollar amounts had been invested in shares of the Fund or in other Oppenheimer funds selected by the Trustee. The Fund purchases shares of the funds selected for deferral by the Trustee in amounts equal to his or her deemed investment, resulting in a Fund asset equal to the deferred compensation liability. Such assets are included as a component of “Other” within the asset section of the Statement of Assets and Liabilities. Deferral of trustees’ fees under the plan will not affect the net assets of the Fund, and will not materially affect the Fund’s assets, liabilities or net investment income per share. Amounts will be deferred until distributed in accordance with the compensation deferral plan.
Dividends and Distributions to Shareholders. Dividends and distributions to shareholders, which are determined in accordance with income tax regulations and may differ from U.S. generally accepted accounting principles, are recorded on the ex-dividend date. Income and capital gain distributions, if any, are declared and paid annually or at other times as deemed necessary by the Manager.
Investment Income. Dividend income is recorded on the ex-dividend date or upon ex-dividend notification in the case of certain foreign dividends where the ex-dividend date may have passed. Non-cash dividends included in dividend income, if any, are recorded at the fair market value of the securities received. Interest income is recognized on an accrual basis. Discount and premium, which are included in interest income on the Statement of Operations, are amortized or accreted daily.
Custodian Fees. “Custodian fees and expenses” in the Statement of Operations may include interest expense incurred by the Fund on any cash overdrafts of its custodian account during the period. Such cash overdrafts may result from the effects of failed trades in portfolio securities and from cash outflows resulting from unanticipated shareholder redemption activity. The Fund pays interest to its custodian on such cash overdrafts, to the extent they are not offset by positive cash balances maintained by the Fund, at a rate equal to the Federal Funds Rate plus 0.50%. The “Reduction to custodian expenses” line item, if applicable, represents earnings on cash balances maintained by the Fund during the period. Such interest expense and other custodian fees may be paid with these earnings.
Security Transactions. Security transactions are recorded on the trade date. Realized gains and losses on securities sold are determined on the basis of identified cost.
Indemnifications. The Fund’s organizational documents provide current and former trustees and officers with a limited indemnification against liabilities arising in connection with the performance of their duties to the Fund. In the normal course of business, the Fund may also enter into contracts that provide general indemnifications. The Fund’s maximum exposure under these arrangements is unknown as this would be dependent on future claims that may be made against the Fund. The risk of material loss from such claims is considered remote.
Other. The preparation of financial statements in conformity with accounting principles generally accepted in the United States of America requires management to make estimates and assumptions that affect the reported amounts of assets and liabilities and disclosure of contingent assets and
15 OPPENHEIMER DISCOVERY MID CAP GROWTH FUND/VA
| | |
NOTES TO FINANCIAL STATEMENTS Continued |
1. Significant Accounting Policies (Continued)
liabilities at the date of the financial statements and the reported amounts of increases and decreases in net assets from operations during the reporting period. Actual results could differ from those estimates.
2. Securities Valuation
The Fund calculates the net asset value of its shares as of the close of the New York Stock Exchange (the “Exchange”), normally 4:00 P.M. Eastern time, on each day the Exchange is open for trading.
The Fund’s Board has adopted procedures for the valuation of the Fund’s securities and has delegated the day-to-day responsibility for valuation determinations under those procedures to the Manager. The Manager has established a Valuation Committee which is responsible for determining a “fair valuation” for any security for which market quotations are not “readily available.” The Valuation Committee’s fair valuation determinations are subject to review, approval and ratification by the Fund’s Board at its next regularly scheduled meeting covering the calendar quarter in which the fair valuation was determined.
Valuation Methods and Inputs
Securities are valued using unadjusted quoted market prices, when available, as supplied primarily by third party pricing services or dealers.
The following methodologies are used to determine the market value or the fair value of the types of securities described below:
Securities traded on a registered U.S. securities exchange (including exchange-traded derivatives other than futures and futures options) are valued based on the last sale price of the security reported on the principal exchange on which it is traded, prior to the time when the Fund’s assets are valued. In the absence of a sale, the security is valued at the last sale price on the prior trading day, if it is within the spread of the current day’s closing “bid” and “asked” prices, and if not, at the current day’s closing bid price. A security of a foreign issuer traded on a foreign exchange, but not listed on a registered U.S. securities exchange, is valued based on the last sale price on the principal exchange on which the security is traded, as identified by the third party pricing service used by the Manager, prior to the time when the Fund’s assets are valued. If the last sale price is unavailable, the security is valued at the most recent official closing price on the principal exchange on which it is traded. If the last sales price or official closing price for a foreign security is not available, the security is valued at the mean between the bid and asked price per the exchange or, if not available from the exchange, obtained from two dealers. If bid and asked prices are not available from either the exchange or two dealers, the security is valued by using one of the following methodologies (listed in order of priority); (1) using a bid from the exchange, (2) the mean between the bid and asked price as provided by a single dealer, or (3) a bid from a single dealer.
Shares of a registered investment company that are not traded on an exchange are valued at that investment company’s net asset value per share.
Corporate and government debt securities (of U.S. or foreign issuers) and municipal debt securities, event-linked bonds, loans, mortgage-backed securities, collateralized mortgage obligations, and asset-backed securities are valued at the mean between the “bid” and “asked” prices utilizing evaluated prices obtained from third party pricing services or broker-dealers who may use matrix pricing methods to determine the evaluated prices.
Short-term money market type debt securities with a remaining maturity of sixty days or less are valued at cost adjusted by the amortization of discount or premium to maturity (amortized cost), which approximates market value. Short-term debt securities with a remaining maturity in excess of sixty days are valued at the mean between the “bid” and “asked” prices utilizing evaluated prices obtained from third party pricing services or broker-dealers.
A description of the standard inputs that may generally be considered by the third party pricing vendors in determining their evaluated prices is provided below.
| | |
| Security Type | | Standard inputs generally considered by third-party pricing vendors |
| Corporate debt, government debt, municipal, mortgage-backed and asset-backed securities | | Reported trade data, broker-dealer price quotations, benchmark yields, issuer spreads on comparable securities, the credit quality, yield, maturity, and other appropriate factors. |
| Loans | | Information obtained from market participants regarding reported trade data and broker-dealer price quotations. |
| Event-linked bonds | | Information obtained from market participants regarding reported trade data and broker-dealer price quotations. |
If a market value or price cannot be determined for a security using the methodologies described above, or if, in the “good faith” opinion of the Manager, the market value or price obtained does not constitute a “readily available market quotation,” or a significant event has occurred that would materially affect the value of the security the security is fair valued either (i) by a standardized fair valuation methodology applicable to the security type or the significant event as previously approved by the Valuation Committee and the Fund’s Board or (ii) as determined in good faith by the Manager’s Valuation Committee. The Valuation Committee considers all relevant facts that are reasonably available, through either public information or information available to the Manager, when determining the fair value of a security. Fair value determinations by the Manager are subject to review, approval and ratification by the Fund’s Board at its next regularly scheduled meeting covering the calendar quarter in which the fair valuation was determined. Those fair valuation standardized methodologies include, but are not limited to, valuing securities at the last sale price or initially at cost and subsequently adjusting the value based on: changes in company specific fundamentals, changes in an appropriate securities index, or changes in the value of similar securities which may be further adjusted for any discounts related to security-specific resale restrictions. When possible, such methodologies use observable market inputs such as unadjusted quoted prices of similar securities, observable interest rates, currency rates and yield
16 OPPENHEIMER DISCOVERY MID CAP GROWTH FUND/VA
2. Securities Valuation
curves. The methodologies used for valuing securities are not necessarily an indication of the risks associated with investing in those securities nor can it be assured that the Fund can obtain the fair value assigned to a security if it were to sell the security.
To assess the continuing appropriateness of security valuations, the Manager, or its third party service provider who is subject to oversight by the Manager, regularly compares prior day prices, prices on comparable securities, and sale prices to the current day prices and challenges those prices exceeding certain tolerance levels with the third party pricing service or broker source. For those securities valued by fair valuations, whether through a standardized fair valuation methodology or a fair valuation determination, the Valuation Committee reviews and affirms the reasonableness of the valuations based on such methodologies and fair valuation determinations on a regular basis after considering all relevant information that is reasonably available.
Classifications
Each investment asset or liability of the Fund is assigned a level at measurement date based on the significance and source of the inputs to its valuation. Various data inputs are used in determining the value of each of the Fund’s investments as of the reporting period end. These data inputs are categorized in the following hierarchy under applicable financial accounting standards:
1) Level 1-unadjusted quoted prices in active markets for identical assets or liabilities (including securities actively traded on a securities exchange)
2) Level 2-inputs other than unadjusted quoted prices that are observable for the asset or liability (such as unadjusted quoted prices for similar assets and market corroborated inputs such as interest rates, prepayment speeds, credit risks, etc.)
3) Level 3-significant unobservable inputs (including the Manager’s own judgments about assumptions that market participants would use in pricing asset or liability).
The inputs used for valuing securities are not necessarily an indication of the risks associated with investing in those securities.
The table below categorizes amounts that are included in the Fund’s Statement of Assets and Liabilities as of December 31, 2013 based on valuation input level:
| | | | | | | | | | | | | | | | |
| | | Level 1—
Unadjusted
Quoted Prices | | | Level 2—
Other Significant
Observable Inputs | | | Level 3—
Significant
Unobservable
Inputs | | | Value | |
Assets Table | | | | | | | | | | | | | | | | |
Investments, at Value: | | | | | | | | | | | | | | | | |
Common Stocks | | | | | | | | | | | | | | | | |
Consumer Discretionary | | $ | 163,569,625 | | | $ | — | | | $ | — | | | $ | 163,569,625 | |
Consumer Staples | | | 30,950,012 | | | | — | | | | — | | | | 30,950,012 | |
Energy | | | 49,978,083 | | | | — | | | | — | | | | 49,978,083 | |
Financials | | | 53,879,334 | | | | — | | | | — | | | | 53,879,334 | |
Health Care | | | 97,829,811 | | | | — | | | | — | | | | 97,829,811 | |
Industrials | | | 142,123,664 | | | | — | | | | — | | | | 142,123,664 | |
Information Technology | | | 171,747,702 | | | | — | | | | — | | | | 171,747,702 | |
Materials | | | 35,960,796 | | | | — | | | | — | | | | 35,960,796 | |
Telecommunication Services | | | 10,766,426 | | | | — | | | | — | | | | 10,766,426 | |
Investment Company | | | 5,136,594 | | | | — | | | | — | | | | 5,136,594 | |
| | | | |
Total Assets | | $ | 761,942,047 | | | $ | — | | | $ | — | | | $ | 761,942,047 | |
| | | | |
Currency contracts and forwards, if any, are reported at their unrealized appreciation/ depreciation at measurement date, which represents the change in the contract’s value from trade date. Futures, if any, are reported at their variation margin at measurement date, which represents the amount due to/from the Fund at that date. All additional assets and liabilities included in the above table are reported at their market value at measurement date.
3. Shares of Beneficial Interest
The Fund has authorized an unlimited number of $0.001 par value shares of beneficial interest of each class. Transactions in shares of beneficial interest were as follows:
| | | | | | | | | | | | | | | | | | | | |
| | | Year Ended December 31, 2013 | | | | | Year Ended December 31, 2012 | | | |
| | | Shares | | | Amount | | | | | Shares | | | Amount | | | |
Non-Service Shares | | | | | | | | | | | | | | | | | | | | |
Sold | | | 1,267,875 | | | $ | 87,221,834 | | | | | | 424,674 | | | $ | 22,730,798 | | | |
Dividends and/or distributions reinvested | | | 1,176 | | | | 73,101 | | | | | | — | | | | — | | | |
Redeemed | | | (1,732,026 | ) | | | (110,208,190 | ) | | | | | (1,765,118 | ) | | | (94,434,281) | | | |
| | | |
Net decrease | | | (462,975 | ) | | $ | (22,913,255) | | | | | | (1,340,444) | | | $ | (71,703,483) | | | |
| | | |
| | | | | | | | | | | | | | | | | | | | |
Service Shares | | | | | | | | | | | | | | | | | | | | |
Sold | | | 78,939 | | | $ | 4,862,175 | | | | | | 138,098 | | | $ | 7,173,273 | | | |
Redeemed | | | (247,872 | ) | | | (15,202,844 | ) | | | | | (243,546 | ) | | | (12,622,234 | ) | | |
| | | |
Net decrease | | | (168,933 | ) | | $ | (10,340,669 | ) | | | | | (105,448 | ) | | $ | (5,448,961 | ) | | |
| | | |
17 OPPENHEIMER DISCOVERY MID CAP GROWTH FUND/VA
| | |
NOTES TO FINANCIAL STATEMENTS Continued |
4. Purchases and Sales of Securities
The aggregate cost of purchases and proceeds from sales of securities, other than short-term obligations and investments in IMMF, for the year ended December 31, 2013 were as follows:
| | | | | | | | | | |
| | | Purchases | | | | | Sales | |
Investment securities | | | $542,669,332 | | | | | | $566,489,270 | |
5. Fees and Other Transactions with Affiliates
Management Fees. Under the investment advisory agreement, the Fund pays the Manager a management fee based on the daily net assets of the Fund at an annual rate as shown in the following table:
| | | | |
| Fee Schedule | | | |
Up to $200 million | | | 0.75% | |
Next $200 million | | | 0.72 | |
Next $200 million | | | 0.69 | |
Next $200 million | | | 0.66 | |
Next $700 million | | | 0.60 | |
Over $1.5 billion | | | 0.58 | |
Sub-Adviser Fees. The Manager has retained the Sub-Adviser to provide the day-to-day portfolio management of the Fund. Under the Sub-Advisory Agreement, the Manager pays the Sub-Adviser an annual fee in monthly installments, equal to a percentage of the investment management fee collected by the Manager from the Fund, which shall be calculated after any investment management fee waivers. The fee paid to the Sub-Adviser is paid by the Manager, not by the Fund.
Transfer Agent Fees. OFI Global (the “Transfer Agent”) serves as the transfer and shareholder servicing agent for the Fund. Fees incurred by the Fund with respect to these services are detailed in the Statement of Operations.
Sub-Transfer Agent Fees. The Transfer Agent has retained Shareholder Services, Inc., a wholly-owned subsidiary of OFI (the “Sub-Transfer Agent”), to provide the day-to-day transfer agent and shareholder servicing of the Fund. Under the Sub-Transfer Agency Agreement, the Transfer Agent pays the Sub-Transfer Agent an annual fee in monthly installments, equal to a percentage of the transfer agent fee collected by the Transfer Agent from the Fund, which shall be calculated after any applicable fee waivers. The fee paid to the Sub-Transfer Agent is paid by the Transfer Agent, not by the Fund.
Distribution and Service Plan for Service Shares. The Fund has adopted a Distribution and Service Plan (the “Plan”) in accordance with Rule 12b-1 under the Investment Company Act of 1940 for Service shares to pay OppenheimerFunds Distributor, Inc. (the “Distributor”), for distribution related services, personal service and account maintenance for the Fund’s Service shares. Under the Plan, payments are made periodically at an annual rate of 0.25% of the daily net assets of Service shares of the Fund. The Distributor currently uses all of those fees to compensate sponsors of the insurance product that offers Fund shares, for providing personal service and maintenance of accounts of their variable contract owners that hold Service shares. These fees are paid out of the Fund’s assets on an on-going basis and increase operating expenses of the Service shares, which results in lower performance compared to the Fund’s shares that are not subject to a service fee. Fees incurred by the Fund under the Plan are detailed in the Statement of Operations.
Waivers and Reimbursements of Expenses. The Manager has contractually agreed to limit the Fund’s expenses after payments, waivers and/or reimbursements and reduction to custodian expenses, excluding expenses incurred directly or indirectly by the Fund as a result of investments in other investment companies, wholly-owned subsidiaries and pooled investment vehicles; so that those expenses, as percentages of daily net assets, will not exceed the annual rate of 0.80% for Non-Service shares and 1.05% for Service shares. During the year ended December 31, 2013, the Manager waived fees and/or reimbursed the Fund $243,578 and $15,480 for Non-Service and Service shares, respectively.
The Manager will waive fees and/or reimburse Fund expenses in an amount equal to the indirect management fees incurred through the Fund’s investment in IMMF. During the year ended December 31, 2013, the Manager waived fees and/or reimbursed the Fund $8,413 for IMMF management fees.
Some of these undertakings may be modified or terminated at any time; some may not be modified or terminated until after one year from the date of the current prospectus, as indicated therein.
6. Pending Litigation
Since 2009, seven class action lawsuits have been pending in the U.S. District Court for the District of Colorado against OppenheimerFunds, Inc. (“OFI”), OppenheimerFunds Distributor, Inc., the Fund’s principal underwriter and distributor (the “Distributor”), and certain funds (but not including the Fund) advised by OFI Global Asset Management, Inc. and distributed by the Distributor (the “Defendant Funds”). The lawsuits also name as defendants certain officers and current and former trustees of the respective Defendant Funds. The lawsuits raise claims under federal securities law and allege, among other things, that the disclosure documents of the respective Defendant Funds contained misrepresentations and omissions and that the respective Defendant Funds’ investment policies were not followed. The plaintiffs in these actions seek unspecified damages, equitable relief and awards of attorneys’ fees and litigation expenses. The Defendant Funds’ Boards of Trustees have also engaged counsel to represent the Funds and the present and
18 OPPENHEIMER DISCOVERY MID CAP GROWTH FUND/VA
6. Pending Litigation (Continued)
former Independent Trustees named in those suits. On August 26, 2013, the parties in six of these lawsuits executed a memorandum of understanding setting forth the terms of proposed settlements of those actions. The proposed settlements are subject to a variety of contingencies, including the execution of settlement agreements, which will require preliminary and final approval by the court. The proposed settlements do not resolve a seventh outstanding lawsuit relating to Oppenheimer California Municipal Fund.
Other class action and individual lawsuits have been filed since 2008 in various state and federal courts against OFI and certain of its affiliates by investors seeking to recover investments they allegedly lost as a result of the “Ponzi” scheme run by Bernard L. Madoff and his firm, Bernard L. Madoff Investment Securities, LLC (“BLMIS”). Plaintiffs in these suits allege that they suffered losses as a result of their investments in several funds managed by an affiliate of OFI and assert a variety of claims, including breach of fiduciary duty, fraud, negligent misrepresentation, unjust enrichment, and violation of federal and state securities laws and regulations, among others. They seek unspecified damages, equitable relief and awards of attorneys’ fees and litigation expenses. Neither the Distributor, nor any of the Oppenheimer mutual funds, their independent trustees or directors are named as defendants in these lawsuits. None of the Oppenheimer mutual funds invested in any funds or accounts managed by Madoff or BLMIS. On February 28, 2011, a stipulation of partial settlement of three groups of consolidated putative class action lawsuits relating to these matters was filed in the U.S. District Court for the Southern District of New York. On August 19, 2011, the court entered an order and final judgment approving the settlement as fair, reasonable and adequate. In September 2011, certain parties filed notices of appeal from the court’s order approving the settlement. The settlement does not resolve other outstanding lawsuits against OFI and its affiliates relating to BLMIS.
On April 16, 2010, a lawsuit was filed in New York state court against (i) OFI, (ii) an affiliate of OFI and (iii) AAArdvark IV Funding Limited (“AAArdvark IV”), an entity advised by OFI’s affiliate, in connection with investments made by the plaintiffs in AAArdvark IV. Plaintiffs allege breach of contract and common law fraud claims against the defendants and seek compensatory damages, costs and disbursements, including attorney fees. On April 11, 2013, the court granted defendants’ motion for summary judgment, dismissing plaintiffs’ fraud claim with prejudice and dismissing their contract claim without prejudice, and granted plaintiffs leave to replead their contract claim to assert a cause of action for specific performance within 30 days. On May 9, 2013, plaintiffs filed a notice of appeal from the court’s dismissal order. On January 7, 2014, the appellate court affirmed the trial court’s dismissal order. On July 15, 2011, a lawsuit was filed in New York state court against OFI, an affiliate of OFI and AAArdvark Funding Limited (“AAArdvark I”), an entity advised by OFI’s affiliate, in connection with investments made by the plaintiffs in AAArdvark I. The complaint alleges breach of contract and common law fraud claims against the defendants and seeks compensatory damages, costs and disbursements, including attorney fees. On November 9, 2011, a lawsuit was filed in New York state court against OFI, an affiliate of OFI and AAArdvark XS Funding Limited (“AAArdvark XS”), an entity advised by OFI’s affiliate, in connection with investments made by the plaintiffs in AAArdvark XS. The complaint alleged breach of contract against the defendants and sought compensatory damages, costs and disbursements, including attorney fees. On November 8, 2013, the parties filed a stipulation of discontinuance dismissing the lawsuit with prejudice.
OFI believes the lawsuits and appeals described above are without legal merit and, with the exception of actions it has settled, is defending against them vigorously. While it is premature to render any opinion as to the outcome in these lawsuits, or whether any costs that the Defendant Funds may bear in defending the suits might not be reimbursed by insurance, OFI believes that these suits should not impair the ability of OFI or the Distributor to perform their respective duties to the Fund, and that the outcome of all of the suits together should not have any material effect on the operations of any of the Oppenheimer mutual funds.
19 OPPENHEIMER DISCOVERY MID CAP GROWTH FUND/VA
| | |
REPORT OF INDEPENDENT REGISTERED PUBLIC ACCOUNTING FIRM |
The Board of Trustees and Shareholders of Oppenheimer Variable Account Funds:
We have audited the accompanying statement of assets and liabilities of Oppenheimer Discovery Mid Cap Growth Fund/VA, formerly Oppenheimer Small- & Mid-Cap Growth Fund/VA (a separate series of Oppenheimer Variable Account Funds), including the statement of investments, as of December 31, 2013, and the related statement of operations for the year then ended, the statements of changes in net assets for each of the years in the two-year period then ended, and the financial highlights for each of the years in the five-year period then ended. These financial statements and financial highlights are the responsibility of the Fund’s management. Our responsibility is to express an opinion on these financial statements and financial highlights based on our audits.
We conducted our audits in accordance with the standards of the Public Company Accounting Oversight Board (United States). Those standards require that we plan and perform the audit to obtain reasonable assurance about whether the financial statements and financial highlights are free of material misstatement. An audit includes examining, on a test basis, evidence supporting the amounts and disclosures in the financial statements. Our procedures included confirmation of securities owned as of December 31, 2013, by correspondence with the custodian and transfer agent. An audit also includes assessing the accounting principles used and significant estimates made by management, as well as evaluating the overall financial statement presentation. We believe that our audits provide a reasonable basis for our opinion.
In our opinion, the financial statements and financial highlights referred to above present fairly, in all material respects, the financial position of Oppenheimer Discovery Mid Cap Growth Fund/VA as of December 31, 2013, the results of its operations for the year then ended, the changes in its net assets for each of the years in the two-year period then ended, and the financial highlights for each of the years in the five-year period then ended, in conformity with U.S. generally accepted accounting principles.
KPMGLLP
Denver, Colorado
February 14, 2014
20 OPPENHEIMER DISCOVERY MID CAP GROWTH FUND/VA
| | |
FEDERAL INCOME TAX INFORMATION Unaudited |
In early 2014, if applicable, shareholders of record received information regarding all dividends and distributions paid to them by the Fund during calendar year 2013.
The foregoing information is presented to assist shareholders in reporting distributions received from the Fund to the Internal Revenue Service. Because of the complexity of the federal regulations which may affect your individual tax return and the many variations in state and local tax regulations, we recommend that you consult your tax advisor for specific guidance.
21 OPPENHEIMER DISCOVERY MID CAP GROWTH FUND/VA
| | |
BOARD APPROVAL OF THE FUND’S INVESTMENT ADVISORY AND SUB-ADVISORY AGREEMENTS Unaudited |
The Fund has entered into an investment advisory agreement with OFI Global Asset Management, Inc. (“OFI Global” or the “Adviser”), a wholly-owned subsidiary of OppenheimerFunds, Inc. (“OFI” or the “Sub-Adviser”) (“OFI Global” and “OFI” together the “Managers”) and OFI Global has entered into a sub-advisory agreement with OFI whereby OFI provides investment sub-advisory services to the Fund (collectively, the “Agreements”). Each year, the Board of Trustees (the “Board”), including a majority of the independent Trustees, is required to determine whether to renew the Agreements. The Investment Company Act of 1940, as amended, requires that the Board request and evaluate, and that the Managers provide, such information as may be reasonably necessary to evaluate the terms of the Agreements. The Board employs an independent consultant to prepare a report that provides information, including comparative information that the Board requests for that purpose. In addition to in-person meetings focused on this evaluation, the Board receives information throughout the year regarding Fund services, fees, expenses and performance.
The Adviser, Sub-Adviser and the independent consultant provided information to the Board on the following factors: (i) the nature, quality and extent of the Managers’ services, (ii) the investment performance of the Fund and the Managers, (iii) the fees and expenses of the Fund, including comparative expense information, (iv) the profitability of the Managers and their affiliates, including an analysis of the cost of providing services, (v) whether economies of scale are realized as the Fund grows and whether fee levels reflect these economies of scale for Fund investors and (vi) other benefits to the Managers from their relationship with the Fund. The Board was aware that there are alternatives to retaining the Managers.
Outlined below is a summary of the principal information considered by the Board as well as the Board’s conclusions.
Nature, Quality and Extent of Services. The Board considered information about the nature, quality and extent of the services provided to the Fund and information regarding the Managers’ key personnel who provide such services. The Sub-Adviser’s duties include providing the Fund with the services of the portfolio manager and the Sub-Adviser’s investment team, who provide research, analysis and other advisory services in regard to the Fund’s investments; securities trading services; oversight of third-party service providers; monitoring compliance with applicable Fund policies and procedures and adherence to the Fund’s investment restrictions; and risk management. The Managers are responsible for providing certain administrative services to the Fund as well. Those services include providing and supervising all administrative and clerical personnel who are necessary in order to provide effective corporate administration for the Fund; compiling and maintaining records with respect to the Fund’s operations; preparing and filing reports required by the Securities and Exchange Commission; preparing periodic reports regarding the operations of the Fund for its shareholders; preparing proxy materials for shareholder meetings; and preparing the registration statements required by Federal and state securities laws for the sale of the Fund’s shares. The Managers also provide the Fund with office space, facilities and equipment.
The Board also considered the quality of the services provided and the quality of the Managers’ resources that are available to the Fund. The Board took account of the fact that the Sub-Adviser has had over fifty years of experience as an investment adviser and that its assets under management rank it among the top mutual fund managers in the United States. The Board evaluated the Sub-Adviser’s advisory, administrative, accounting, legal, compliance services and risk management, and information the Board has received regarding the experience and professional qualifications of the Managers’ key personnel and the size and functions of its staff. In its evaluation of the quality of the portfolio management services provided, the Board considered the experience of Ronald Zibelli, Jr., the portfolio manager for the Fund, and the Sub-Adviser’s investment team and analysts. The Board members also considered the totality of their experiences with the Managers as directors or trustees of the Fund and other funds advised by the Managers. The Board considered information regarding the quality of services provided by affiliates of the Managers, which its members have become knowledgeable about in connection with the renewal of the Fund’s service agreements. The Board concluded, in light of the Managers’ experience, reputation, personnel, operations and resources that the Fund benefits from the services provided under the Agreement.
Investment Performance of the Fund, the Adviser and the Sub-Adviser. Throughout the year, the Manager provided information on the investment performance of the Fund, including comparative performance information. The Board also reviewed information, prepared by the Manager and by the independent consultant, comparing the Fund’s historical performance to relevant market indices and to the performance of other mid-cap growth funds underlying variable insurance products. The Board considered that the Fund outperformed its performance category median for the one- and three-year periods but underperformed for the five- and ten-year periods. The Board also considered the Fund’s recent improved performance, ranking in the top quintile of its performance category for the three-year period and in the second quintile for the one-year period.
Costs of Services by the Adviser. The Board reviewed the fees paid to the Manager and the other expenses borne by the Fund. The independent consultant provided comparative data in regard to the fees and expenses of the Fund and other mid-cap growth funds underlying variable insurance products. In reviewing the fees and expenses charged to the VA funds, the Board considered the Manager’s assertion that, because there is much greater disparity in the fees and services that may be provided by a manager to a VA fund as opposed to a retail fund, when comparing the expenses of the various VA funds to those of retail funds, it is most appropriate to focus on total expenses (rather than on the management fees). Accordingly, while the Board reviewed and considered all expenses, it focused on total expenses. The Board considered that the Fund’s contractual management fees and total expenses, after waivers, were lower than its peer group median and category median. Within the total asset range of $500 million to $1 billion, the Fund’s effective rate was lower than its peer group median and category median. The Board noted that the Manager has contractually agreed to limit the Fund’s total annual operating expenses so that those expenses, as percentages of daily net assets, will not exceed the annual rate of 0.80% for Non-Service Shares and 1.05% for Service Shares. This contractual expense limitation may not be amended or withdrawn until one year after the date of the Fund’s prospectus, unless approved by the Board.
Economies of Scale and Profits Realized by the Adviser and Sub-Adviser. The Board considered information regarding the Managers’ costs in serving as the Fund’s investment adviser and sub-adviser, including the costs associated with the personnel and systems necessary to manage the Fund, and information regarding the Managers’ profitability from their relationship with the Fund. The Board reviewed whether the Managers may realize economies of scale in managing and supporting the Fund. The Board noted that the Fund currently has management fee breakpoints, which are intended to share with Fund shareholders economies of scale that may exist as the Fund’s assets grow.
Other Benefits to the Managers. In addition to considering the profits realized by the Managers, the Board considered information that was provided regarding the direct and indirect benefits the Managers receive as a result of their relationship with the Fund, including compensation paid to
22 OPPENHEIMER DISCOVERY MID CAP GROWTH FUND/VA
the Managers’ affiliates and research provided to the Adviser in connection with permissible brokerage arrangements (soft dollar arrangements). The Board also considered that the Managers must be able to pay and retain experienced professional personnel at competitive rates to provide quality services to the Fund.
Conclusions. These factors were also considered by the independent Trustees meeting separately from the full Board, assisted by experienced counsel to the Fund and to the independent Trustees. Fund counsel and the independent Trustees’ counsel are independent of the Managers within the meaning and intent of the Securities and Exchange Commission Rules.
Based on its review of the information it received and its evaluations described above, the Board, including a majority of the independent Trustees, decided to continue the Agreements through August 31, 2014. In arriving at its decision, the Board did not identify any factor or factors as being more important than others, but considered all of the above information, and considered the terms and conditions of the Agreements, including the management fees, in light of all the surrounding circumstances.
23 OPPENHEIMER DISCOVERY MID CAP GROWTH FUND/VA
| | |
PORTFOLIO PROXY VOTING POLICIES AND PROCEDURES; UPDATES TO STATEMENTS OF INVESTMENTS Unaudited |
The Fund has adopted Portfolio Proxy Voting Policies and Procedures under which the Fund votes proxies relating to securities (“portfolio proxies”) held by the Fund. A description of the Fund’s Portfolio Proxy Voting Policies and Procedures is available (i) without charge, upon request, by calling the Fund toll-free at 1.800.CALL OPP (225.5677), (ii) on the Fund’s website at oppenheimerfunds.com, and (iii) on the SEC’s website at www.sec.gov. In addition, the Fund is required to file Form N-PX, with its complete proxy voting record for the 12 months ended June 30th, no later than August 31st of each year. The Fund’s voting record is available (i) without charge, upon request, by calling the Fund toll-free at 1.800.CALL OPP (225.5677), and (ii) in the Form N-PX filing on the SEC’s website at www.sec.gov.
The Fund files its complete schedule of portfolio holdings with the SEC for the first quarter and the third quarter of each fiscal year on Form N-Q. The Fund’s Form N-Q filings are available on the SEC’s website at www.sec.gov. Those forms may be reviewed and copied at the SEC’s Public Reference Room in Washington, D.C. Information on the operation of the Public Reference Room may be obtained by calling 1-800-SEC-0330.
24 OPPENHEIMER DISCOVERY MID CAP GROWTH FUND/VA
| | |
TRUSTESS AND OFFICERS Unaudited |
| | |
Name, Position(s) Held with the Fund,
Length of Service, Year of Birth | | Principal Occupation(s) During the Past 5 Years; Other Trusteeships/Directorships Held; Number of Portfolios in the Fund Complex Currently Overseen |
| |
| INDEPENDENT TRUSTEES | | The address of each Trustee in the chart below is 6803 S. Tucson Way, Centennial, Colorado 80112-3924. Each Trustee serves for an indefinite term, or until his or her resignation, retirement, death or removal. |
| |
Sam Freedman, Chairman of the Board of Trustees (since 2013) and Trustee (since 1996) Year of Birth: 1940 | | Director of Colorado UpLIFT (charitable organization) (since September 1984). Mr. Freedman held several positions with the Sub-Adviser and with subsidiary or affiliated companies of the Sub-Adviser (until October 1994). Oversees 39 portfolios in the OppenheimerFunds complex. Mr. Freedman has served on the Boards of certain Oppenheimer funds since 1996, during which time he has become familiar with the Fund’s (and other Oppenheimer funds’) financial, accounting, regulatory and investment matters and has contributed to the Boards’ deliberations. |
| |
Edward L. Cameron, Trustee (since 1999) Year of Birth: 1938 | | Member of The Life Guard of Mount Vernon (George Washington historical site) (June 2000-June 2006); Partner of PricewaterhouseCoopers LLP (accounting firm) (July 1974-June 1999); Chairman of Price Waterhouse LLP Global Investment Management Industry Services Group (accounting firm) (July 1994-June 1998). Oversees 39 portfolios in the OppenheimerFunds complex. Mr. Cameron has served on the Boards of certain Oppenheimer funds since 1999, during which time he has become familiar with the Fund’s (and other Oppenheimer funds’) financial, accounting, regulatory and investment matters and has contributed to the Boards’ deliberations. |
| |
Jon S. Fossel, Trustee (since 1990) Year of Birth: 1942 | | Chairman of the Board (2006-December 2011) and Director (June 2002-December 2011) of UNUMProvident (insurance company); Director of Northwestern Energy Corp. (public utility corporation) (November 2004-December 2009); Director of P.R. Pharmaceuticals (October 1999-October 2003); Director of Rocky Mountain Elk Foundation (non-profit organization) (February 1998-February 2003 and February 2005-February 2007); Chairman and Director (until October 1996) and President and Chief Executive Officer (until October 1995) of the Sub-Adviser; President, Chief Executive Officer and Director of the following: Oppenheimer Acquisition Corp. (“OAC”) (parent holding company of the Sub-Adviser), Shareholders Services, Inc. and Shareholder Financial Services, Inc. (until October 1995). Oversees 39 portfolios in the OppenheimerFunds complex. Mr. Fossel has served on the Boards of certain Oppenheimer funds since 1990, during which time he has become familiar with the Fund’s (and other Oppenheimer funds’) financial, accounting, regulatory and investment matters and has contributed to the Boards’ deliberations. |
| |
Richard F. Grabish, Trustee (since 2012) Year of Birth: 1948 | | Formerly Senior Vice President and Assistant Director of Sales and Marketing (March 1997-December 2007), Director (March 1987-December 2007) and Manager of Private Client Services (June 1985-June 2005) of A.G. Edwards & Sons, Inc. (broker/dealer and investment firm); Chairman and Chief Executive Officer of A.G. Edwards Trust Company, FSB (March 2001-December 2007); President and Vice Chairman of A.G. Edwards Trust Company, FSB (investment adviser) (April 1987-March 2001); President of A.G. Edwards Trust Company, FSB (investment adviser) (June 2005-December 2007). Oversees 39 portfolios in the OppenheimerFunds complex. Mr. Grabish has served on the Boards of certain Oppenheimer funds since 2001, during which time he has become familiar with the Fund’s (and other Oppenheimer funds’) financial, accounting, regulatory and investment matters and has contributed to the Boards’ deliberations. |
| |
Beverly L. Hamilton, Trustee (since 2002) Year of Birth: 1946 | | Trustee of Monterey Institute for International Studies (educational organization) (since February 2000); Board Member of Middlebury College (educational organization) (December 2005-June 2011); Chairman (since 2010) of American Funds’ Emerging Markets Growth Fund, Inc. (mutual fund); Director of The California Endowment (philanthropic organization) (April 2002-April 2008); Director (February 2002-2005) and Chairman of Trustees (2006-2007) of the Community Hospital of Monterey Peninsula; Director (October 1991-2005); Vice Chairman (2006-2009) of American Funds’ Emerging Markets Growth Fund, Inc. (mutual fund); President of ARCO Investment Management Company (February 1991-April 2000); Member of the investment committees of The Rockefeller Foundation (2001-2006) and The University of Michigan (since 2000); Advisor at Credit Suisse First Boston’s Sprout venture capital unit (venture capital fund) (1994-January 2005); Trustee of MassMutual Institutional Funds (investment company) (1996-June 2004); Trustee of MML Series Investment Fund (investment company) (April 1989-June 2004); Member of the investment committee of Hartford Hospital (2000-2003); and Advisor to Unilever (Holland) pension fund (2000-2003). Oversees 39 portfolios in the OppenheimerFunds complex. Ms. Hamilton has served on the Boards of certain Oppenheimer funds since 2002, during which time she has become familiar with the Fund’s (and other Oppenheimer funds’) financial, accounting, regulatory and investment matters and has contributed to the Boards’ deliberations. |
| |
Victoria J. Herget, Trustee (since 2012) Year of Birth: 1951 | | Independent Director of the First American Funds (mutual fund family) (2003-2011); former Managing Director (1993-2001), Principal (1985-1993), Vice President (1978-1985) and Assistant Vice President (1973-1978) of Zurich Scudder Investments (and its predecessor firms); Board Chair (2008-Present) and Director (2004-Present), United Educators (insurance company); Trustee (1992-2007), Chair of the Board of Trustees (1999-2007), Investment Committee Chair (1994-1999) and Investment Committee member (2007-2010) of Wellesley College; Trustee (since 2000) and Chair (since 2010), Newberry Library; Trustee, Mather LifeWays (since 2001); Trustee, BoardSource (2006-2009) and Chicago City Day School (1994-2005). Oversees 39 portfolios in the OppenheimerFunds complex. Ms. Herget has served on the Boards of certain Oppenheimer funds since 2012, during which time she has become familiar with the Fund’s (and other Oppenheimer funds’) financial, accounting, regulatory and investment matters and has contributed to the Boards’ deliberations. |
| |
Robert J. Malone, Trustee (since 2002) Year of Birth: 1944 | | Chairman of the Board (since 2012) and Director (since August 2005) of Jones International University (educational organization) (since August 2005); Chairman, Chief Executive Officer and Director of Steele Street Bank Trust (commercial banking) (since August 2003); Trustee of the Gallagher Family Foundation (non-profit organization) (since 2000); Board of Directors of Opera Colorado Foundation (non-profit organization) (2008-2012); Director of Colorado UpLIFT (charitable organization) (1986-2010); Director of Jones Knowledge, Inc. (2006-2010); Former Chairman of U.S. Bank-Colorado (subsidiary of U.S. Bancorp and formerly Colorado National Bank) (July 1996-April 1999); Director of Commercial Assets, Inc. (real estate investment trust) (1993-2000); Director of U.S. Exploration, Inc. (oil and gas exploration) (1997-February 2004); Chairman of the Board (1991-1994) and Trustee (1985-1994) of Regis University; and Chairman of the Board (1990-1991 and Trustee (1984-1999) of Young Presidents Organization. Oversees 39 portfolios in the OppenheimerFunds complex. Mr. Malone has served on the Boards of certain Oppenheimer funds since 2002, during which time he has become familiar with the Fund’s (and other Oppenheimer funds’) financial, accounting, regulatory and investment matters and has contributed to the Boards’ deliberations. |
25 OPPENHEIMER DISCOVERY MID CAP GROWTH FUND/VA
| | |
TRUSTESS AND OFFICERS Unaudited / Continued |
| | |
| |
F. William Marshall, Jr., Trustee (since 2001) Year of Birth: 1942 | | Trustee Emeritus of Worcester Polytech Institute (WPI) (private university) (since 2009); Trustee of MassMutual Select Funds (formerly MassMutual Institutional Funds) (investment company) (since 1996), MML Series Investment Fund (investment company) (since 1996) and Mass Mutual Premier Funds (investment company) (since January 2012); President and Treasurer of the SIS Fund (private charitable fund) (January 1999 – March 2011); Former Trustee of WPI (1985-2008); Former Chairman of the Board (2004-2006) and Former Chairman of the Investment Committee of WPI (1994-2008); Chairman of SIS & Family Bank, F.S.B. (formerly SIS Bank) (commercial bank) (January 1999-July 1999); Executive Vice President of Peoples Heritage Financial Group, Inc. (commercial bank) (January 1999-July 1999); and Former President and Chief Executive Officer of SIS Bancorp. (1993-1999). Oversees 43 portfolios in the OppenheimerFunds complex. Mr. Marshall has served on the Boards of certain Oppenheimer funds since 2000, during which time he has become familiar with the Fund’s (and other Oppenheimer funds’) financial, accounting, regulatory and investment matters and has contributed to the Boards’ deliberations. |
| |
Karen L. Stuckey, Trustee (since 2012) Year of Birth: 1953 | | Partner (1990-2012) of PricewaterhouseCoopers LLP (held various positions 1975-1990); Emeritus Trustee (since 2006), Trustee (1992-2006) and member of Executive, Nominating and Audit Committees and Chair of Finance Committee of Lehigh University; and member, Women’s Investment Management Forum since inception. Oversees 39 portfolios in the OppenheimerFunds complex. Ms. Stuckey has served on the Boards of certain Oppenheimer funds since 2012, during which time she has become familiar with the Fund’s (and other Oppenheimer funds’) financial, accounting, regulatory and investment matters and has contributed to the Boards’ deliberations. |
| |
James D. Vaughn, Trustee (since 2012) Year of Birth: 1945 | | Retired; former managing partner (1994-2001) of Denver office of Deloitte & Touche LLP, (held various positions 1969-1993); Trustee and Chairman of the Audit Committee of Schroder Funds (2003-2012); Board member and Chairman of Audit Committee of AMG National Trust Bank (since 2005); Trustee and Investment Committee member, University of South Dakota Foundation (since 1996); Board member, Audit Committee Member and past Board Chair, Junior Achievement (since 1993); former Board member, Mile High United Way, Boys and Girls Clubs, Boy Scouts, Colorado Business Committee for the Arts, Economic Club of Colorado and Metro Denver Network. Oversees 39 portfolios in the OppenheimerFunds complex. Mr. Vaughn has served on the Boards of certain Oppenheimer funds since 2012, during which time he has become familiar with the Fund’s (and other Oppenheimer funds’) financial, accounting, regulatory and investment matters and has contributed to the Boards’ deliberations. |
| | |
INTERESTED TRUSTEE AND OFFICER | | Mr. Glavin is an “Interested Trustee” because he is affiliated with the Manager and the Sub-Adviser by virtue of his positions as an officer and director of the Manager and a director of the Sub-Adviser, and as a shareholder of the Sub-Adviser’s parent company. Both as a Trustee and as an officer, he serves for an indefinite term, or until his resignation, retirement, death or removal. Mr. Glavin’s address is Two World Financial Center, 225 Liberty Street, 11th Floor, New York, New York 10281-1008. |
| |
William F. Glavin, Jr., Trustee, President and Principal Executive Officer (since 2009) Year of Birth: 1958 | | Director, Chairman and Chief Executive Officer of the Manager (since January 2013); President of the Manager (January 2013-May 2013); Chairman of the Sub-Adviser (December 2009-December 2012); Chief Executive Officer (January 2009-December 2012) and Director of the Sub-Adviser (since January 2009); President of the Sub-Adviser (May 2009-December 2012); Management Director (since June 2009), President (since December 2009) and Chief Executive Officer (since January 2011) of Oppenheimer Acquisition Corp. (“OAC”) (the Sub-Adviser’s parent holding company); Director of Oppenheimer Real Asset Management, Inc. (since March 2010); Executive Vice President (March 2006-February 2009) and Chief Operating Officer (July 2007-February 2009) of Massachusetts Mutual Life Insurance Company (OAC’s parent company); Director (May 2004-March 2006) and Chief Operating Officer and Chief Compliance Officer (May 2004-January 2005), President (January 2005-March 2006) and Chief Executive Officer (June 2005-March 2006) of Babson Capital Management LLC; Director (March 2005-March 2006), President (May 2003-March 2006) and Chief Compliance Officer (July 2005-March 2006) of Babson Capital Securities, Inc. (a broker-dealer); President (May 2003-March 2006) of Babson Investment Company, Inc.; Director (May 2004-August 2006) of Babson Capital Europe Limited; Director (May 2004-October 2006) of Babson Capital Guernsey Limited; Director (May 2004-March 2006) of Babson Capital Management LLC; Non-Executive Director (March 2005-March 2007) of Baring Asset Management Limited; Director (February 2005-June 2006) Baring Pension Trustees Limited; Director and Treasurer (December 2003-November 2006) of Charter Oak Capital Management, Inc.; Director (May 2006-September 2006) of C.M. Benefit Insurance Company; Director (May 2008-June 2009) and Executive Vice President (June 2007-July 2009) of C.M. Life Insurance Company; President (March 2006-May 2007) of MassMutual Assignment Company; Director (January 2005-December 2006), Deputy Chairman (March 2005-December 2006) and President (February 2005-March 2005) of MassMutual Holdings (Bermuda) Limited; Director (May 2008-June 2009) and Executive Vice President (June 2007-July 2009) of MML Bay State Life Insurance Company; Chief Executive Officer and President (April 2007-January 2009) of MML Distributors, LLC; and Chairman (March 2006-December 2008) and Chief Executive Officer (May 2007-December 2008) of MML Investors Services, Inc. An officer of 90 portfolios in the OppenheimerFunds complex. |
| | |
OTHER OFFICERS OF THE FUND | | The addresses of the Officers in the chart below are as follows: for Messrs. Zibelli, Jr., Gabinet and Ms. Nasta, Two World Financial Center, 225 Liberty Street, New York, New York 10281-1008, for Messrs. Vandehey and Wixted, 6803 S. Tucson Way, Centennial, Colorado 80112-3924. Each Officer serves for an indefinite term or until his or her resignation, retirement, death or removal. |
| |
Ronald J. Zibelli, Jr., Vice President (since 2008) Year of Birth: 1959 | | Vice President and Senior Portfolio Manager of the Sub-Adviser (since May 2006). Prior to joining the Sub-Adviser, he spent six years at Merrill Lynch Investment Managers, during which time he was a Managing Director and Small Cap Growth Team Leader, responsible for managing 11 portfolios. Prior to joining Merrill Lynch Investment Managers, Mr. Zibelli spent 12 years with Chase Manhattan Bank, including two years as Senior Portfolio Manager (U.S. Small Cap Equity) at Chase Asset Management. A portfolio manager and an officer of other portfolios in the OppenheimerFunds complex. |
| |
Arthur S. Gabinet, Secretary and Chief Legal Officer (since 2011) Year of Birth: 1958 | | Executive Vice President, Secretary and General Counsel of the Manager (since January 2013); General Counsel OFI SteelPath, Inc. (since January 2013); Executive Vice President (May 2010-December 2012) and General Counsel (since January 2011) of the Sub-Adviser; General Counsel of the Distributor (since January 2011); General Counsel of Centennial Asset Management Corporation (January 2011-December 2012); Executive Vice President (January 2011-December 2012) and General Counsel of HarbourView Asset Management Corporation (since January 2011); Assistant Secretary (since January 2011) and Director (since January 2011) of OppenheimerFunds International Ltd. and OppenheimerFunds plc; Director of Oppenheimer Real Asset Management, Inc. (January 2011-December 2012) and General Counsel (since January 2011); Executive Vice President (January 2011-December 2011) and General Counsel of Shareholder Financial Services, Inc. and Shareholder Services, Inc. (since January 2011); Executive Vice |
26 OPPENHEIMER DISCOVERY MID CAP GROWTH FUND/VA
| | |
| |
Arthur S. Gabinet, Continued | | President (January 2011-December 2012) and General Counsel of OFI Private Investments Inc. (since January 2011); Vice President of OppenheimerFunds Legacy Program (January 2011-December 2011); Executive Vice President (January 2011-December 2012) and General Counsel of OFI Institutional Asset Management, Inc. (since January 2011); General Counsel, Asset Management of the Sub-Adviser (May 2010-December 2010); Principal, The Vanguard Group (November 2005-April 2010); District Administrator, U.S. Securities and Exchange Commission (January 2003-October 2005). An officer of 90 portfolios in the OppenheimerFunds complex. |
| |
Christina M. Nasta, Vice President and Chief Business Officer (since 2011) Year of Birth: 1973 | | Senior Vice President of OppenheimerFunds Distributor, Inc. (since January 2013); Senior Vice President of the Sub-Adviser (July 2010-December 2012); Vice President of the Sub-Adviser (January 2003-July 2010); Vice President of OppenheimerFunds Distributor, Inc. (January 2003-July 2010). An officer of 90 portfolios in the OppenheimerFunds complex. |
| |
Mark S. Vandehey, Vice President and Chief Compliance Officer (since 2004) Year of Birth: 1950 | | Senior Vice President and Chief Compliance Officer of the Manager (since January 2013); Chief Compliance Officer of OFI SteelPath, Inc. (since January 2013); Senior Vice President of the Sub-Adviser (March 2004-December 2012); Chief Compliance Officer of the Sub-Adviser, OppenheimerFunds Distributor, Inc., OFI Trust Company, OFI Institutional Asset Management, Inc., Oppenheimer Real Asset Management, Inc., OFI Private Investments, Inc., Harborview Asset Management Corporation, Trinity Investment Management Corporation, and Shareholder Services, Inc. (since March 2004); Vice President of OppenheimerFunds Distributor, Inc., Centennial Asset Management Corporation and Shareholder Services, Inc. (June 1983-December 2012). An officer of 90 portfolios in the OppenheimerFunds complex. |
| |
Brian W. Wixted, Treasurer and Principal Financial & Accounting Officer (since 1999) Year of Birth: 1959 | | Senior Vice President of the Manager (since January 2013); Treasurer of the Sub-Adviser, HarbourView Asset Management Corporation, Shareholder Financial Services, Inc., Shareholder Services, Inc., and Oppenheimer Real Asset Management, Inc. (March 1999-June 2008), OFI Private Investments, Inc. (March 2000-June 2008), OppenheimerFunds International Ltd. and OppenheimerFunds plc (since May 2000), OFI Institutional Asset Management, Inc. (November 2000-June 2008), and OppenheimerFunds Legacy Program (charitable trust program established by the Sub-Adviser) (June 2003-December 2011); Treasurer and Chief Financial Officer of OFI Trust Company (since May 2000); Assistant Treasurer of Oppenheimer Acquisition Corporation (March 1999-June 2008). An officer of 90 portfolios in the OppenheimerFunds complex. |
The Fund’s Statement of Additional Information contains additional information about the Fund’s Trustees and Officers and is available without charge, upon request, by calling 1.800.988.8287.
27 OPPENHEIMER DISCOVERY MID CAP GROWTH FUND/VA
OPPENHEIMER DISCOVERY MID CAP GROWTH FUND/VA
| | |
| A Series of Oppenheimer Variable Account Funds |
| |
| Manager | | OFI Global Asset Management, Inc. |
| |
| Sub-Adviser | | OppenheimerFunds, Inc. |
| |
| Distributor | | OppenheimerFunds Distributor, Inc. |
| |
Transfer and
Shareholder
Servicing Agent | | OFI Global Asset Management, Inc. |
| |
| Sub-Transfer Agent | | Shareholder Services, Inc. DBA OppenheimerFunds Services |
| |
Independent
Registered
Public
Accounting
Firm | | KPMGLLP |
| |
| Counsel | | K&L Gates LLP |
| |
| | Before investing, investors should carefully consider a fund’s investment objectives, risks, charges and expenses. Fund prospectuses and summary prospectuses contain this and other information about the funds, and may be obtained by asking your financial advisor, or calling us at 1.800.988.8287. Read prospectuses and summary prospectuses carefully before investing. |
| | © 2014 OppenheimerFunds, Inc. All rights reserved. Oppenheimer funds are distributed by OppenheimerFunds Distributor, Inc. |
| | | | | | |
| December 31, 2013 | | | | |
| | | Oppenheimer Capital Income Fund/VA* A Series of Oppenheimer Variable Account Funds | | | Annual Report | |
| | |
| | ANNUAL REPORT Listing of Top Holdings Fund Performance Discussion Financial Statements *Prior to 4/30/13, the Fund’s name was Oppenheimer Balanced Fund/VA | | | | |

Portfolio Managers: Magnus Krantz1 and Krishna Memani
Average Annual Total Returns
For the Periods Ended 12/31/13
| | | | | | | | | | | | |
| | | 1-Year | | | 5-Year | | | 10-Year | |
Non-Service Shares | | | 13.17 | % | | | 12.00 | % | | | 2.77% | |
Service Shares | | | 12.83 | % | | | 11.71 | % | | | 2.51% | |
Performance data quoted represents past performance, which does not guarantee future results. The investment return and principal value of an investment in the Fund will fluctuate so that an investor’s shares, when redeemed, may be worth more or less than their original cost. Current performance may be lower or higher than the performance quoted. For performance data current to the most recent month end, call us at 1.800.988.8287. The Fund’s total returns should not be expected to be the same as the returns of other funds, whether or not both funds have the same portfolio managers and/or similar names. The Fund’s total returns include changes in share price and reinvested distributions but do not include the charges associated with the separate account products that offer this Fund. Such performance would have been lower if such charges were taken into account.
1. Effective April 30, 2013.
| | | | |
TOP TEN COMMON STOCK HOLDINGS | | | | |
Apple, Inc. | | | 1.1 | % |
Google, Inc., Cl. A | | | 1.1 | |
Pfizer, Inc. | | | 1.0 | |
Discover Financial Services | | | 0.9 | |
Chevron Corp. | | | 0.9 | |
JPMorgan Chase & Co. | | | 0.9 | |
Actavis plc | | | 0.8 | |
Philip Morris International, Inc. | | | 0.8 | |
Mondelez International, Inc., Cl. A | | | 0.8 | |
Citigroup, Inc. | | | 0.8 | |
Portfolio holdings and allocations are subject to change. Percentages are as of December 31, 2013, and are based on net assets. For more current Fund holdings, please visit oppenheimerfunds.com.
PORTFOLIO ALLOCATION
| | | | |
Common Stocks | | | 33.3 | % |
Mortgage-Backed Obligations | | | | |
Government Agency | | | 18.9 | |
Non-Agency | | | 7.2 | |
Non-Convertible Corporate Bonds and Notes | | | 24.1 | |
Asset-Backed Securities | | | 9.0 | |
Investment Company | | | | |
Oppenheimer Institutional Money Market Fund | | | 6.8 | |
U.S. Government Obligations | | | 0.7 | |
Portfolio holdings and allocations are subject to change. Percentages are as of December 31, 2013, and are based on the total market value of investments.
2 OPPENHEIMER CAPITAL INCOME FUND/VA
Fund Performance Discussion
The Fund’s Non-Service shares produced a total return of 13.17% during the one-year reporting period ended December 31, 2013. On a relative basis, the Fund outperformed its Reference Index, which returned 12.04%. The Fund’s Reference Index is a customized weighted index currently comprised of the following underlying broad-based security indices: 65% of the Barclays U.S. Aggregate Bond Index and 35% of the Russell 3000 Index. Measured separately, the Barclays U.S. Aggregate Bond Index returned -2.02% and the Russell 3000 Index returned 33.55%.
MARKET OVERVIEW
Accommodative monetary policies on the part of central banks in the U.S., Europe and Japan, combined with an improving economic outlook, resulted in a rally among risk equities and higher-yielding bonds over the first four months of 2013. At the same time, yields of U.S. government securities remained near historical lows due to the Federal Reserve’s (the “Fed’s”) massive bond buying program. These developments drove financial markets higher through the early spring of 2013. At that time, economic data appeared to confirm that the United States, Europe and Japan had engineered a sustained economic rebound, but investors responded negatively to disappointing economic data from China, India, Brazil, and other emerging markets. The ensuing “flight to quality” toward traditional safe havens produced sharp dislocations in emerging equity, fixed-income and currency markets. In late May, relatively hawkish remarks by Fed chairman Ben Bernanke were widely interpreted as a signal that U.S. monetary policymakers would begin to back away from their quantitative easing program sooner than expected, sparking heightened volatility in financial markets throughout the world. However, market conditions generally stabilized over the summer of 2013. In October, the U.S. Congress managed to reach a bipartisan agreement to raise the national debt ceiling, and did so well ahead of the potential default deadline. While the Fed unexpectedly refrained from reducing its monthly bond purchases in September, in December the Central Bank announced that it would reduce its monthly bond purchases by $10 billion, from $85 billion to $75 billion, starting in January 2014. The Fed also announced that it would continue to hold short-term interest rates at very low levels until unemployment in the United States subsided below 6.5%. This was lower than its earlier 7% target.
EQUITY STRATEGY REVIEW
The equity strategy outperformed the Russell 3000 Index this period, and only underperformed in one sector. Outperformance was driven by stronger relative stock selection and an underweight position in telecommunication services, along with stronger stock selection in the consumer staples and financials sectors. Consumer discretionary was the sole underperforming sector, due to less favorable stock selection.
The equity strategy’s strongest performing holdings this period were Walgreen Co., Actavis plc and Chevron Corp. In 2012, Walgreen acquired a 45% stake in European pharmacy chain Alliance Boots. Synergies between the companies appeared strong during the period. We exited our position in Walgreen by period end. Actavis is a branded and generic drug company whose shares spiked when management announced it was combining operations with Warner Chilcott – a leading specialty pharmaceutical company based in Ireland. The merged entity is expected to benefit from revenue synergies, with complementary product lines, and cost rationalization – both of which we believe have the potential to contribute to rising profits. The merger would also allow the company to reincorporate in Ireland, which could result in a significantly lower tax rate that would provide the potential not only to boost profits, but also cash generation. Oil company Chevron’s stock was driven partly by higher refining profitability and a rise in upstream volumes.
Detractors from performance included information technology stocks Aruba Networks, Inc. and International Business Machines Corp. (“IBM”), and financials stock Digital Realty Trust, Inc. Over the first half of the period, fundamentals of many technology companies suffered from the macroeconomic headwinds that impacted enterprise spending. Networking company Aruba Networks’ earnings growth may have also been hurt due to discounting by competitor Cisco Systems. IBM reported disappointing revenues and earnings over the second quarter of 2013, due in part to delayed signings of new software and hardware bookings. A stronger dollar also negatively impacted top line growth. We exited our positions in both Aruba Networks and IBM during the reporting period.
Digital Realty owns and/or manages data centers on behalf of corporate and technology-related tenants throughout the U.S. and England. A quarterly result that missed expectations and management’s subsequent guidance below consensus estimates caused Digital’s stock price to retreat. The shortfall was largely attributed to delays in lease commencements. Partially offsetting the disappointing news was an unexpected share repurchase announcement. We have maintained our holdings in Digital as we expect demand to remain robust for data center management services and Digital should be well-positioned to compete for “Global 1000” contracts.
FIXED-INCOME STRATEGY REVIEW
In what was a volatile period for fixed-income markets, the Fund’s fixed-income strategy experienced a slight decline, but outperformed the Barclays U.S. Aggregate Bond Index. During the reporting period, the fixed-income strategy remained significantly underweight government bonds and favored corporate bonds, mortgage-backed securities and structured products. This positioning benefited the Fund’s relative performance during the period, as higher-yielding fixed income sectors outperformed the performance of U.S. Treasuries. The fixed-income strategy’s exposure to corporate bonds produced positive results this period and was a primary outperformer to relative performance. Within the corporate bond allocation, an overweight to the financial sector was beneficial to
3 OPPENHEIMER CAPITAL INCOME FUND/VA
performance as a review of the sector by Moody’s in November resulted in a positive outcome for many banks that were at risk of losing their investment grade rating. The fixed-income strategy also benefited from a modest allocation to high yield bonds which saw significant spread compression throughout the year.
The fixed-income strategy’s investments in non-agency mortgage-backed securities (“MBS”), commercial mortgage-backed securities (“CMBS”) and asset backed securities (“ABS”) also benefited performance for the one-year period. However, its allocation to agency MBS produced slight negative results. Before the Fed’s comments on tapering in May, we started reducing our position in agency MBS since we felt they were vulnerable to policy changes. This decision helped limit their negative impact on the fixed-income strategy when interest rates rose and volatility in the mortgage market increased over the second half of the reporting period.
Investors should consider the Fund’s investment objective, risks, charges and expenses carefully before investing. The Fund’s prospectus and summary prospectus contain this and other information about the Fund, and may be obtained by asking your financial advisor or calling us at 1.800.988.8287. Read prospectuses and summary prospectuses carefully before investing.
Total returns include changes in share price and reinvestment of dividends and capital gains distributions in a hypothetical investment for the periods shown.
The Fund’s investment strategy and focus can change over time. The mention of specific fund holdings does not constitute a recommendation by OppenheimerFunds, Inc. or its affiliates.
Shares of Oppenheimer funds are not deposits or obligations of any bank, are not guaranteed by any bank, are not insured by the FDIC or any other agency, and involve investment risks, including the possible loss of the principal amount invested.
Comparing the Fund’s Performance to the Market. The graphs that follow show the performance of a hypothetical $10,000 investment in each share class of the Fund held until December 31, 2013. Performance is measured over a ten-fiscal-year period for both Classes. Performance information does not reflect charges that apply to separate accounts investing in the Fund. If these charges were taken into account, performance would be lower. The graphs assume that all dividends and capital gains distributions were reinvested in additional shares.
The Fund’s performance is compared to the performance of the Russell 3000 Index, the Barclays U.S. Aggregate Bond Index, the Russell 1000 Value Index, the S&P 500 Index and the Fund’s Reference Index. The Russell 3000 Index measures the performance of the largest 3,000 U.S. companies, representing approximately 98% of the investable U.S. equity market. The Barclays U.S. Aggregate Bond Index is an index of U.S dollar-denominated, investment-grade U.S. corporate government and mortgage-backed securities. The Russell 1000 Value Index measures the performance of the large-cap value segment of the U.S. equity universe. It includes those Russell 1000 companies with lower price-to-book ratios and lower expected growth values. The S&P 500 Index is a capitalization-weighted index of 500 stocks intended to be a representative sample of leading companies in leading industries within the U.S. economy. The Fund’s Reference Index is a customized weighted index currently comprised of 65% of the Barclays U.S. Aggregate Bond Index and 35% of the Russell 3000 Index. The Fund has changed its benchmarks from the S&P 500 Index, the Barclays U.S. Aggregate Bond Index, and the Russell 1000 Value Index to the Russell 3000 Index, the Barclays U.S. Aggregate bond Index, and the Reference Index, which it believes are more appropriate measures of the Fund’s performance. Indices are unmanaged and cannot be purchased directly by investors. Index performance includes reinvestment of income, but does not reflect transaction costs, fees, expenses or taxes. Index performance is shown for illustrative purposes only as a benchmark for the Fund’s performance, and does not predict or depict performance of the Fund. The Fund’s performance reflects the effects of the Fund’s business and operating expenses.
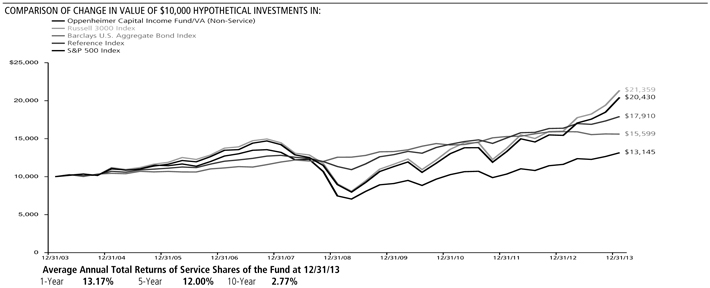
4 OPPENHEIMER CAPITAL INCOME FUND/VA
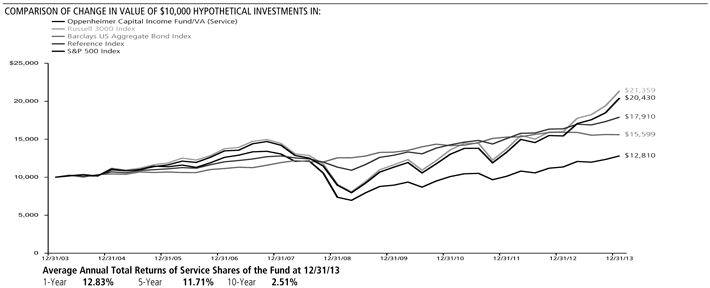
Performance data quoted represents past performance, which does not guarantee future results. The investment return and principal value of an investment in the Fund will fluctuate so that an investor’s shares, when redeemed, may be worth more or less than their original cost. Current performance may be lower or higher than the performance quoted. For performance data current to the most recent month end, call us at 1.800.988.8287. The Fund’s total returns should not be expected to be the same as the returns of other funds, whether or not both funds have the same portfolio managers and/or similar names. The Fund’s total returns include changes in share price and reinvested distributions but do not include the charges associated with the separate account products that offer this Fund. Such performance would have been lower if such charges were taken into account.
5 OPPENHEIMER CAPITAL INCOME FUND/VA
Fund Expenses. As a shareholder of the Fund, you incur two types of costs: (1) transaction costs and (2) ongoing costs, including management fees; distribution and service fees; and other Fund expenses. These examples are intended to help you understand your ongoing costs (in dollars) of investing in the Fund and to compare these costs with the ongoing costs of investing in other mutual funds.
The examples are based on an investment of $1,000.00 invested at the beginning of the period and held for the entire 6-month period ended December 31, 2013.
Actual Expenses. The first section of the table provides information about actual account values and actual expenses. You may use the information in this section for the class of shares you hold, together with the amount you invested, to estimate the expense that you paid over the period. Simply divide your account value by $1,000.00 (for example, an $8,600.00 account value divided by $1,000.00 = 8.60), then multiply the result by the number in the first section under the heading entitled “Expenses Paid During Period” to estimate the expenses you paid on your account during this period.
Hypothetical Example for Comparison Purposes.
The second section of the table provides information about hypothetical account values and hypothetical expenses based on the Fund’s actual expense ratio for each class of shares, and an assumed rate of return of 5% per year for each class before expenses, which is not the actual return. The hypothetical account values and expenses may not be used to estimate the actual ending account balance or expenses you paid for the period. You may use this information to compare the ongoing costs of investing in the Fund and other funds. To do so, compare this 5% hypothetical example for the class of shares you hold with the 5% hypothetical examples that appear in the shareholder reports of the other funds.
Please note that the expenses shown in the table are meant to highlight your ongoing costs only and do not reflect any charges associated with the separate accounts that offer this Fund. Therefore, the “hypothetical” lines of the table are useful in comparing ongoing costs only, and will not help you determine the relative total costs of owning different funds. In addition, if these separate account charges were included your costs would have been higher.
| | | | | | | | | | | | | | | | | | |
| Actual | | Beginning
Account
Value
July 1, 2013 | | | | | Ending Account
Value
December 31, 2013 | | | | | Expenses
Paid During
6 Months Ended
December 31, 2013 | | | |
Non-Service shares | | $ | 1,000.00 | | | | | $ | 1,071.20 | | | | | $ | 3.50 | | | |
Service shares | | | 1,000.00 | | | | | | 1,068.90 | | | | | | 4.81 | | | |
| | | | | | |
Hypothetical | | | | | | | | | | | | | | | | | | |
(5% return before expenses) | | | | | | | | | | | | | | | | | | |
Non-Service shares | | | 1,000.00 | | | | | | 1,021.83 | | | | | | 3.42 | | | |
Service shares | | | 1,000.00 | | | | | | 1,020.57 | | | | | | 4.70 | | | |
Expenses are equal to the Fund’s annualized expense ratio for that class, multiplied by the average account value over the period, multiplied by 184/365 (to reflect the one-half year period). Those annualized expense ratios, excluding indirect expenses from affiliated funds, based on the 6-month period ended December 31, 2013 are as follows:
| | | | | | | | | | |
| Class | | Expense Ratios | | |
Non-Service shares | | | | 0.67 | % | | |
Service shares | | | | 0.92 | | | |
The expense ratios reflect contractual waivers and/or reimbursements of expenses by the Fund’s Manager. Some of these undertakings may be modified or terminated at any time, unless approved by the Board of Trustees. The “Financial Highlights” tables in the Fund’s financial statements, included in this report, also show the gross expense ratios, without such waivers or reimbursements and reduction to custodian expenses, if applicable.
6 OPPENHEIMER CAPITAL INCOME FUND/VA
STATEMENT OF INVESTMENTS December 31, 2013
| | | | | | | | | | |
| | | Shares | | | Value | | | |
Common Stocks—34.5% | | | | | | | | | | |
Consumer Discretionary—4.4% | | | | | | | | | | |
Auto Components—0.4% | | | | | | | | | | |
Delphi Automotive plc | | | 16,870 | | | $ | 1,014,393 | | | |
Diversified Consumer Services—0.4% | | | |
LifeLock, Inc.1 | | | 62,140 | | | | 1,019,717 | | | |
Household Durables—0.3% | | | | | | | | | | |
Toll Brothers, Inc.1 | | | 22,620 | | | | 836,940 | | | |
Media—0.9% | | | | | | | | | | |
Comcast Corp., Cl. A | | | 24,800 | | | | 1,288,732 | | | |
Time Warner, Inc. | | | 18,520 | | | | 1,291,214 | | | |
| | | | | | | | 2,579,946 | | | |
Specialty Retail—1.8% | | | | | | | | | | |
AutoZone, Inc.1 | | | 3,350 | | | | 1,601,099 | | | |
Pier 1 Imports, Inc. | | | 44,920 | | | | 1,036,754 | | | |
Ross Stores, Inc. | | | 15,680 | | | | 1,174,902 | | | |
Signet Jewelers Ltd. | | | 15,200 | | | | 1,196,240 | | | |
| | | | | | | | 5,008,995 | | | |
Textiles, Apparel & Luxury Goods—0.6% | | | |
PVH Corp. | | | 11,570 | | | | 1,573,751 | | | |
Consumer Staples—3.3% | | | | | | | | | | |
Food Products—1.4% | | | | | | | | | | |
Flowers Foods, Inc. | | | 74,845 | | | | 1,606,922 | | | |
Mondelez International, Inc., Cl. A | | | 65,210 | | | | 2,301,913 | | | |
| | | | | | | | 3,908,835 | | | |
Household Products—0.9% | | | | | | | | | | |
Henkel AG & Co. KGaA | | | 13,425 | | | | 1,399,650 | | | |
Henkel AG & Co. KGaA, Preference | | | 10,818 | | | | 1,255,007 | | | |
| | | | | | | | 2,654,657 | | | |
Personal Products—0.2% | | | | | | | | | | |
Nu Skin Enterprises, Inc., Cl. A | | | 3,910 | | | | 540,440 | | | |
Tobacco—0.8% | | | | | | | | | | |
Philip Morris International, Inc. | | | 26,860 | | | | 2,340,312 | | | |
Energy—3.3% | | | | | | | | | | |
Energy Equipment & Services—0.7% | | | |
National Oilwell Varco, Inc. | | | 25,060 | | | | 1,993,022 | | | |
Oil, Gas & Consumable Fuels—2.6% | | | | | | | | | | |
Chevron Corp. | | | 20,580 | | | | 2,570,648 | | | |
EPL Oil & Gas, Inc.1 | | | 15,430 | | | | 439,755 | | | |
Kinder Morgan, Inc. | | | 15,030 | | | | 541,080 | | | |
Noble Energy, Inc. | | | 30,310 | | | | 2,064,414 | | | |
PAA Natural Gas Storage LP | | | 22,680 | | | | 521,640 | | | |
Western Refining, Inc. | | | 32,960 | | | | 1,397,834 | | | |
| | | | | | | | 7,535,371 | | | |
Financials—6.1% | | | | | | | | | | |
Capital Markets—0.3% | | | | | | | | | | |
WisdomTree Investments, Inc.1 | | | 42,790 | | | | 757,811 | | | |
Commercial Banks—1.0% | | | | | | | | | | |
CIT Group, Inc. | | | 42,270 | | | | 2,203,535 | | | |
Webster Financial Corp. | | | 18,620 | | | | 580,572 | | | |
| | | | | | | | 2,784,107 | | | |
Consumer Finance—0.9% | | | | | | | | | | |
Discover Financial Services | | | 46,880 | | | | 2,622,936 | | | |
Diversified Financial Services—1.7% | | | |
Citigroup, Inc. | | | 44,040 | | | | 2,294,924 | | | |
JPMorgan Chase & Co. | | | 42,150 | | | | 2,464,932 | | | |
| | | | | | | | 4,759,856 | | | |
Insurance—0.8% | | | | | | | | | | |
American International Group, Inc. | | | 24,960 | | | | 1,274,208 | | | |
Fidelity National Financial, Inc., Cl. A | | | 38,610 | | | | 1,252,895 | | | |
| | | | | | | | 2,527,103 | | | |
Real Estate Investment Trusts (REITs)—0.7% | | | |
| Apollo Commercial Real Estate Finance, Inc. | | | 58,470 | | | | 950,138 | | | |
Digital Realty Trust, Inc. | | | 23,830 | | | | 1,170,530 | | | |
| | | | | | | | 2,120,668 | | | |
Thrifts & Mortgage Finance—0.7% | | | | | | | | | | |
Home Loan Servicing Solutions Ltd. | | | 34,140 | | | | 784,196 | | | |
Ocwen Financial Corp.1 | | | 20,980 | | | | 1,163,341 | | | |
| | | | | | | 1,947,537 | | | |
| | | | | | | | |
| | | Shares | | | Value | |
Health Care—4.8% | | | | | | | | |
Biotechnology—0.7% | | | | | | | | |
Celldex Therapeutics, Inc.1 | | | 10,170 | | | $ | 246,216 | |
Gilead Sciences, Inc.1 | | | 18,060 | | | | 1,357,209 | |
Medivation, Inc.1 | | | 6,730 | | | | 429,509 | |
| | | | | | | | 2,032,934 | |
Health Care Equipment & Supplies—0.4% | | | | | | | | |
Covidien plc | | | 18,080 | | | | 1,231,248 | |
Health Care Providers & Services—0.7% | | | | | | | | |
Omnicare, Inc. | | | 11,890 | | | | 717,680 | |
Team Health Holdings, Inc.1 | | | 11,480 | | | | 522,914 | |
Universal Health Services, Inc., Cl. B | | | 11,300 | | | | 918,238 | |
| | | | | | | | 2,158,832 | |
Pharmaceuticals—3.0% | | | | | | | | |
AbbVie, Inc. | | | 22,790 | | | | 1,203,540 | |
Actavis plc1 | | | 14,180 | | | | 2,382,240 | |
Allergan, Inc. | | | 9,880 | | | | 1,097,470 | |
Bristol-Myers Squibb Co. | | | 10,100 | | | | 536,815 | |
Pfizer, Inc. | | | 93,025 | | | | 2,849,356 | |
Zoetis, Inc. | | | 15,986 | | | | 522,582 | |
| | | | | | | | 8,592,003 | |
Industrials—4.6% | | | | | | | | |
Commercial Services & Supplies—1.0% | | | | | | | | |
Mobile Mini, Inc.1 | | | 24,280 | | | | 999,850 | |
Tyco International Ltd. | | | 48,080 | | | | 1,973,203 | |
| | | | | | | | 2,973,053 | |
Construction & Engineering—0.3% | | | | | | | | |
AECOM Technology Corp.1 | | | 15,730 | | | | 462,934 | |
KBR, Inc. | | | 7,630 | | | | 243,321 | |
| | | | | | | | 706,255 | |
Industrial Conglomerates—0.7% | | | | | | | | |
General Electric Co. | | | 72,420 | | | | 2,029,933 | |
Machinery—1.0% | | | | | | | | |
Deere & Co. | | | 11,050 | | | | 1,009,197 | |
Greenbrier Cos., Inc. (The)1 | | | 19,710 | | | | 647,276 | |
Joy Global, Inc. | | | 19,200 | | | | 1,123,008 | |
| | | | | | | | 2,779,481 | |
Professional Services—0.9% | | | | | | | | |
Robert Half International, Inc. | | | 31,440 | | | | 1,320,166 | |
Towers Watson & Co., Cl. A | | | 9,930 | | | | 1,267,167 | |
| | | | | | | | 2,587,333 | |
Road & Rail—0.7% | | | | | | | | |
Canadian National Railway Co. | | | 35,050 | | | | 1,998,551 | |
Information Technology—5.9% | | | | | | | | |
Communications Equipment—0.3% | | | | | | | | |
Finisar Corp.1 | | | 31,330 | | | | 749,414 | |
Computers & Peripherals—1.7% | | | | | | | | |
Apple, Inc. | | | 5,710 | | | | 3,204,016 | |
Western Digital Corp. | | | 19,050 | | | | 1,598,295 | |
| | | | | | | | 4,802,311 | |
Internet Software & Services—1.9% | | | | | | | | |
Facebook, Inc., Cl. A1 | | | 30,240 | | | | 1,652,918 | |
Google, Inc., Cl. A1 | | | 2,670 | | | | 2,992,296 | |
Web.com Group, Inc.1 | | | 18,000 | | | | 572,220 | |
| | | | | | | | 5,217,434 | |
IT Services—0.6% | | | | | | | | |
Amdocs Ltd. | | | 18,380 | | | | 757,991 | |
MasterCard, Inc., Cl. A | | | 920 | | | | 768,623 | |
| | | | | | | | 1,526,614 | |
Semiconductors & Semiconductor Equipment—0.4% | |
Cavium, Inc.1 | | | 13,400 | | | | 462,434 | |
Skyworks Solutions, Inc.1 | | | 20,990 | | | | 599,474 | |
| | | | | | | | 1,061,908 | |
Software—1.0% | | | | | | | | |
Fortinet, Inc.1 | | | 36,330 | | | | 694,993 | |
Guidewire Software, Inc.1 | | | 11,170 | | | | 548,112 | |
Infoblox, Inc.1 | | | 15,460 | | | | 510,489 | |
ServiceNow, Inc.1 | | | 9,270 | | | | 519,213 | |
7 OPPENHEIMER CAPITAL INCOME FUND/VA
STATEMENT OF INVESTMENTS Continued
| | | | | | | | | | |
| | | Shares | | | Value | | | |
| Software (Continued) | | | |
| Splunk, Inc.1 | | | 7,960 | | | $ | 546,613 | | | |
| | | | | | | | 2,819,420 | | | |
| Materials—1.6% | | | | | | | | | | |
| Chemicals—0.6% | | | | | | | | | | |
| Air Products & Chemicals, Inc. | | | 7,100 | | | | 793,638 | | | |
| W.R. Grace & Co.1 | | | 8,680 | | | | 858,192 | | | |
| | | | | | | | 1,651,830 | | | |
| Construction Materials—0.4% | | | |
| Vulcan Materials Co. | | | 19,310 | | | | 1,147,400 | | | |
| Containers & Packaging—0.3% | | | |
| Packaging Corp. of America | | | 14,210 | | | | 899,209 | | | |
| Metals & Mining—0.3% | | | |
| Kaiser Aluminum Corp. | | | 11,080 | | | | 778,259 | | | |
| Telecommunication Services—0.0% | | | |
| Diversified Telecommunication Services—0.0% | | | |
| ORBCOMM, Inc.1 | | | 375 | | | | 2,378 | | | |
| Utilities—0.5% | | | |
| Electric Utilities—0.5% | | | |
| Exelon Corp. | | | 51,370 | | | | 1,407,024 | | | |
| Total Common Stocks (Cost $82,257,133) | | | | | | | 97,679,221 | | | |
| | | Principal
Amount | | | | | | |
| Asset-Backed Securities—9.4% | | | |
| American Credit Acceptance Receivables Trust: | | | |
| Series 2012-2, Cl. A, 1.89%, 7/15/162 | | $ | 105,744 | | | | 106,099 | | | |
| Series 2012-3, Cl. A, 1.64%, 11/15/162 | | | 53,209 | | | | 53,319 | | | |
| Series 2012-3, Cl. C, 2.78%, 9/17/182 | | | 955,000 | | | | 962,129 | | | |
| Series 2013-2, Cl. B, 2.84%, 5/15/192 | | | 443,000 | | | | 444,173 | | | |
| AmeriCredit Automobile Receivables Trust: | | | |
| Series 2011-1, Cl. D, 4.26%, 2/8/17 | | | 90,000 | | | | 93,601 | | | |
| Series 2011-2, Cl. D, 4.00%, 5/8/17 | | | 300,000 | | | | 310,469 | | | |
| Series 2011-4, Cl. D, 4.08%, 9/8/17 | | | 500,000 | | | | 522,519 | | | |
| Series 2011-5, Cl. D, 5.05%, 12/8/17 | | | 305,000 | | | | 326,112 | | | |
| Series 2012-2, Cl. D, 3.38%, 4/9/18 | | | 455,000 | | | | 471,562 | | | |
| Series 2012-4, Cl. D, 2.68%, 10/9/18 | | | 70,000 | | | | 70,650 | | | |
| Series 2012-5, Cl. C, 1.69%, 11/8/18 | | | 165,000 | | | | 164,842 | | | |
| Series 2012-5, Cl. D, 2.35%, 12/10/18 | | | 925,000 | | | | 925,179 | | | |
| Series 2013-1, Cl. C, 1.57%, 1/8/19 | | | 725,000 | | | | 717,882 | | | |
| Series 2013-1, Cl. D, 2.09%, 2/8/19 | | | 195,000 | | | | 193,800 | | | |
| Series 2013-2, Cl. D, 2.42%, 5/8/19 | | | 310,000 | | | | 307,919 | | | |
| Series 2013-3, Cl. D, 3.00%, 7/8/19 | | | 330,000 | | | | 331,956 | | | |
| Series 2013-4, Cl. D, 3.31%, 10/8/19 | | | 677,000 | | | | 687,129 | | | |
| Series 2013-5, Cl. D, 2.86%, 12/8/19 | | | 165,000 | | | | 164,616 | | | |
| Capital Auto Receivables Asset Trust, Series 2013-1, Cl. D, 2.19%, 9/20/21 | | | 125,000 | | | | 122,618 | | | |
| Carfinance Capital Auto Trust: | | | | | | | | | | |
| Series 2013-1A, Cl. A, 1.65%, 7/17/172 | | | 126,123 | | | | 125,871 | | | |
| Series 2013-2A, Cl. B, 3.15%, 8/15/192 | | | 635,000 | | | | 634,418 | | | |
| Centre Point Funding LLC, Series 2010-1A, Cl. 1, 5.43%, 7/20/162 | | | 40,829 | | | | 42,254 | | | |
| CPS Auto Receivables Trust: | | | | | | | | | | |
| Series 2012-B, Cl. A, 2.52%, 9/16/192 | | | 209,931 | | | | 211,138 | | | |
| Series 2012-C, Cl. A, 1.82%, 12/16/192 | | | 73,125 | | | | 72,821 | | | |
| Credit Acceptance Auto Loan Trust: | | | | | | | | | | |
| Series 2012-1A, Cl. A, 2.20%, 9/16/192 | | | 175,000 | | | | 176,257 | | | |
| Series 2012-2A, Cl. A, 1.52%, 3/16/202 | | | 950,000 | | | | 952,975 | | | |
| Series 2012-2A, Cl. B, 2.21%, 9/15/202 | | | 50,000 | | | | 50,280 | | | |
| Series 2013-1A, Cl. B, 1.83%, 4/15/212 | | | 165,000 | | | | 163,972 | | | |
| Series 2013-2A, Cl. B, 2.26%, 10/15/213 | | | 310,000 | | | | 309,308 | | | |
| DT Auto Owner Trust: | | | | | | | | | | |
| Series 2011-3A, Cl. C, 4.03%, 2/15/172 | | | 110,248 | | | | 110,384 | | | |
| Series 2012-1A, Cl. D, 4.94%, 7/16/182 | | | 150,000 | | | | 154,763 | | | |
| Series 2012-2A, Cl. D, 4.35%, 3/15/192 | | | 470,000 | | | | 484,758 | | | |
| Series 2013-1A, Cl. D, 3.74%, 5/15/202 | | | 200,000 | | | | 200,459 | | | |
| Series 2013-2A, Cl. D, 4.18%, 6/15/202 | | | 505,000 | | | | 507,310 | | | |
| Exeter Automobile Receivables Trust: | | | | | | | | | | |
| Series 2012-2A, Cl. B, 2.22%, 12/15/172 | | | 130,000 | | | | 129,675 | | | |
| | | | | | | | | | |
| | | | | | | | | | |
| | | | | | | | | | |
| | | | | | | | | | |
| | | | | | | | | | |
| | | | | | | | | | |
| | | | | | | | | | |
| | | | | | | | | | |
| | | | | | | | | | |
| | | | | | | | | | |
| | | | | | | | | | |
| | | | | | | | | | |
| | | Principal
Amount | | | Value | | | |
| Asset-Backed Securities (Continued) | | | |
| Exeter Automobile Receivables Trust: Exeter | | | | | | | | | | |
| Automobile Receivables Trust: (Continued) | | | | | | | | | | |
| Series 2012-2A, Cl. C, 3.06%, 7/16/182 | | $ | 516,000 | | | $ | 513,060 | | | |
| Series 2013-2A, Cl. B, 3.09%, 7/16/182 | | | 940,000 | | | | 946,049 | | | |
| Series 2013-2A, Cl. C, 4.35%, 1/15/192 | | | 480,000 | | | | 483,657 | | | |
| First Investors Auto Owner Trust: | | | | | | | | | | |
| Series 2012-1A, Cl. D, 5.65%, 4/15/182 | | | 140,000 | | | | 147,231 | | | |
| Series 2013-3A, Cl. B, 2.32%, 10/15/192 | | | 465,000 | | | | 462,555 | | | |
| Series 2013-3A, Cl. C, 2.91%, 1/15/202 | | | 200,000 | | | | 198,726 | | | |
| Series 2013-3A, Cl. D, 3.67%, 5/15/202 | | | 145,000 | | | | 144,017 | | | |
| Ford Credit Auto Owner Trust, Series 2013-A, Cl. D, 1.86%, 8/15/19 | | | 195,000 | | | | 193,238 | | | |
| Ford Credit Floorplan Master Owner Trust A: | | | | | | | | | | |
| Series 2012-1, Cl. A, 0.637%, 1/15/164 | | | 155,000 | | | | 155,016 | | | |
| Series 2012-2, Cl. C, 2.86%, 1/15/19 | | | 215,000 | | | | 220,702 | | | |
| FRS I LLC, Series 2013-1A, Cl. A1, 1.80%, 4/15/432 | | | 71,632 | | | | 71,121 | | | |
| Prestige Auto Receivables Trust, Series 2011-1A, Cl. D, 5.18%, 7/16/182 | | | 300,000 | | | | 309,115 | | | |
| Santander Drive Auto Receivables Trust: | | | | | | | | | | |
| Series 2010-A, Cl. A3, 1.83%, 11/17/142 | | | 6,637 | | | | 6,642 | | | |
| Series 2011-1, Cl. D, 4.01%, 2/15/17 | | | 360,000 | | | | 374,340 | | | |
| Series 2011-S2A, Cl. D, 3.35%, 6/15/173 | | | 1,452 | | | | 1,455 | | | |
| Series 2012-1, Cl. C, 3.78%, 11/15/17 | | | 25,000 | | | | 25,856 | | | |
| Series 2012-2, Cl. C, 3.20%, 2/15/18 | | | 345,000 | | | | 354,690 | | | |
| Series 2012-2, Cl. D, 3.87%, 2/15/18 | | | 375,000 | | | | 393,810 | | | |
| Series 2012-3, Cl. C, 3.01%, 4/16/18 | | | 900,000 | | | | 926,558 | | | |
| Series 2012-4, Cl. C, 2.94%, 12/15/17 | | | 770,000 | | | | 792,797 | | | |
| Series 2012-4, Cl. D, 3.50%, 7/15/16 | | | 495,000 | | | | 516,709 | | | |
| Series 2012-5, Cl. C, 2.70%, 8/15/18 | | | 995,000 | | | | 1,022,614 | | | |
| Series 2012-5, Cl. D, 3.30%, 9/17/18 | | | 540,000 | | | | 556,351 | | | |
| Series 2012-6, Cl. D, 2.52%, 9/17/18 | | | 235,000 | | | | 235,879 | | | |
| Series 2012-AA, Cl. D, 2.46%, 12/17/182 | | | 945,000 | | | | 943,764 | | | |
| Series 2013-1, Cl. C, 1.76%, 1/15/19 | | | 295,000 | | | | 292,843 | | | |
| Series 2013-1, Cl. D, 2.27%, 1/15/19 | | | 155,000 | | | | 153,380 | | | |
| Series 2013-2, Cl. D, 2.57%, 3/15/19 | | | 715,000 | | | | 712,178 | | | |
| Series 2013-3, Cl. C, 1.81%, 4/15/19 | | | 950,000 | | | | 944,374 | | | |
| Series 2013-3, Cl. D, 2.42%, 4/15/19 | | | 245,000 | | | | 242,465 | | | |
| Series 2013-4, Cl. D, 3.92%, 1/15/20 | | | 130,000 | | | | 134,925 | | | |
| Series 2013-5, Cl. C, 2.25%, 6/17/19 | | | 715,000 | | | | 713,167 | | | |
| Series 2013-A, Cl. C, 3.12%, 8/15/172 | | | 315,000 | | | | 323,329 | | | |
| SNAAC Auto Receivables Trust: | | | | | | | | | | |
| Series 2012-1A, Cl. A, 1.78%, 6/15/162 | | | 21,703 | | | | 21,732 | | | |
| Series 2012-1A, Cl. C, 4.38%, 6/15/172 | | | 125,000 | | | | 127,874 | | | |
| Series 2013-1A, Cl. B, 2.09%, 7/16/182 | | | 90,000 | | | | 89,793 | | | |
| Series 2013-1A, Cl. C, 3.07%, 8/15/182 | | | 100,000 | | | | 99,436 | | | |
| United Auto Credit Securitization Trust: | | | | | | | | | | |
| Series 2012-1, Cl. A2, 1.10%, 3/16/152 | | | 25,576 | | | | 25,575 | | | |
| Series 2012-1, Cl. B, 1.87%, 9/15/152 | | | 170,000 | | | | 169,989 | | | |
| Series 2012-1, Cl. C, 2.52%, 3/15/162 | | | 120,000 | | | | 119,968 | | | |
| Series 2012-1, Cl. D, 3.12%, 3/15/182 | | | 605,000 | | | | 604,835 | | | |
| Series 2013-1, Cl. B, 1.74%, 4/15/162 | | | 265,000 | | | | 264,733 | | | |
| Series 2013-1, Cl. C, 2.22%, 12/15/172 | | | 170,000 | | | | 169,760 | | | |
| Series 2013-1, Cl. D, 2.90%, 12/15/172 | | | 30,000 | | | | 29,941 | | | |
| Total Asset-Backed Securities (Cost $26,450,264) | | | | | | | 26,539,466 | | | |
| | | | | | | | | | |
| Mortgage-Backed Obligations—27.0% | | | |
| Government Agency—19.8% | | | | | | | | | | |
| FHLMC/FNMA/FHLB/Sponsored—19.6% | | | |
| Federal Home Loan Mortgage Corp. Gold Pool: | | | | | | | | | | |
| 4.50%, 10/1/18 | | | 69,156 | | | | 73,428 | | | |
| 5.00%, 12/1/34 | | | 4,694 | | | | 5,090 | | | |
| 5.50%, 9/1/39 | | | 756,625 | | | | 835,186 | | | |
| 6.50%, 4/1/18-4/1/34 | | | 61,470 | | | | 68,246 | | | |
| 7.00%, 10/1/31-10/1/37 | | | 309,823 | | | | 345,650 | | | |
| 8.00%, 4/1/16 | | | 12,664 | | | | 13,178 | | | |
| 9.00%, 8/1/22-5/1/25 | | | 7,891 | | | | 8,771 | | | |
| Federal Home Loan Mortgage Corp., Interest-Only | | | | | | | | | | |
| Stripped Mtg.-Backed Security: | | | | | | | | | | |
| Series 183, Cl. IO, 14.899%, 4/1/275 | | | 129,094 | | | | 30,538 | | | |
| Series 192, Cl. IO, 9.722%, 2/1/285 | | | 35,193 | | | | 6,251 | | | |
8 OPPENHEIMER CAPITAL INCOME FUND/VA
| | | | | | | | | | |
| | | Principal Amount | | | Value | | | |
FHLMC/FNMA/FHLB/Sponsored (Continued) | | | |
Federal Home Loan Mortgage Corp., Interest-Only | | | |
Stripped Mtg.-Backed Security: (Continued) | | | |
Series 243, Cl. 6, 0.00%, 12/15/325,6 | | $ | 110,004 | | | $ | 16,938 | | | |
Federal Home Loan Mortgage Corp., Principal-Only | | | |
Stripped Mtg.-Backed Security, Series 176, Cl. PO, | | | |
3.885%, 6/1/267 | | | 38,636 | | | | 36,525 | | | |
Federal Home Loan Mortgage Corp., Real Estate Mtg. | | | |
Investment Conduit Multiclass Pass-Through Certificates: | | | |
Series 2426, Cl. BG, 6.00%, 3/15/17 | | | 119,661 | | | | 126,830 | | | |
Series 2427, Cl. ZM, 6.50%, 3/1/32 | | | 198,777 | | | | 222,560 | | | |
Series 2461, Cl. PZ, 6.50%, 6/1/32 | | | 98,186 | | | | 110,861 | | | |
Series 2500, Cl. FD, 0.667%, 3/15/324 | | | 15,260 | | | | 15,353 | | | |
Series 2526, Cl. FE, 0.567%, 6/15/294 | | | 18,117 | | | | 18,154 | | | |
Series 2551, Cl. FD, 0.567%, 1/15/334 | | | 11,725 | | | | 11,751 | | | |
Series 2626, Cl. TB, 5.00%, 6/15/33 | | | 254,289 | | | | 275,928 | | | |
Series 2707, Cl. QE, 4.50%, 11/15/18 | | | 655,172 | | | | 696,826 | | | |
Series 3025, Cl. SJ, 24.139%, 8/15/354 | | | 35,432 | | | | 54,418 | | | |
Series 3030, Cl. FL, 0.567%, 9/15/354 | | | 183,260 | | | | 183,212 | | | |
Series 3815, Cl. BD, 3.00%, 10/15/20 | | | 27,395 | | | | 28,331 | | | |
Series 3822, Cl. JA, 5.00%, 6/1/40 | | | 194,681 | | | | 204,971 | | | |
Series 3840, Cl. CA, 2.00%, 9/15/18 | | | 20,004 | | | | 20,419 | | | |
Series 3848, Cl. WL, 4.00%, 4/1/40 | | | 244,466 | | | | 253,197 | | | |
Series 4221, Cl. HJ, 1.50%, 7/15/23 | | | 1,334,934 | | | | 1,328,635 | | | |
Federal Home Loan Mortgage Corp., Real Estate Mtg. | | | |
Investment Conduit Multiclass Pass-Through Certificates, | | | |
Interest-Only Stripped Mtg.-Backed Security: | | | |
Series 2130, Cl. SC, 53.212%, 3/15/295 | | | 122,333 | | | | 22,716 | | | |
Series 2796, Cl. SD, 55.303%, 7/15/265 | | | 166,448 | | | | 28,149 | | | |
Series 2802, Cl. AS, 0.00%, 4/15/335,8 | | | 15,893 | | | | 213 | | | |
Series 2920, Cl. S, 55.266%, 1/15/355 | | | 813,196 | | | | 130,243 | | | |
Series 2922, Cl. SE, 7.411%, 2/15/355 | | | 49,296 | | | | 7,958 | | | |
Series 3201, Cl. SG, 5.725%, 8/15/365 | | | 131,368 | | | | 23,079 | | | |
Series 3397, Cl. GS, 14.135%, 12/15/375 | | | 57,106 | | | | 10,209 | | | |
Series 3424, Cl. EI, 2.161%, 4/15/385 | | | 48,892 | | | | 5,620 | | | |
Series 3450, Cl. BI, 12.596%, 5/15/385 | | | 154,454 | | | | 23,297 | | | |
Series 3606, Cl. SN, 4.873%, 12/15/395 | | | 84,083 | | | | 14,038 | | | |
Federal National Mortgage Assn.: | | | | | | | | | | |
2.50%, 1/1/299 | | | 3,170,000 | | | | 3,138,300 | | | |
3.00%, 1/1/299 | | | 1,895,000 | | | | 1,934,454 | | | |
3.50%, 1/1/29-1/1/449 | | | 10,680,000 | | | | 10,666,512 | | | |
4.00%, 1/1/29-1/1/449 | | | 12,815,000 | | | | 13,224,168 | | | |
4.50%, 1/1/29-1/1/449 | | | 7,884,000 | | | | 8,360,075 | | | |
5.00%, 1/1/449 | | | 2,670,000 | | | | 2,900,080 | | | |
6.00%, 1/1/449 | | | 425,000 | | | | 471,451 | | | |
Federal National Mortgage Assn. Pool: | | | | | | | | | | |
3.50%, 2/1/22 | | | 312,082 | | | | 328,175 | | | |
5.50%, 9/1/20 | | | 5,464 | | | | 5,968 | | | |
6.00%, 11/1/17-3/1/37 | | | 411,475 | | | | 455,445 | | | |
6.50%, 5/1/17-10/1/19 | | | 102,439 | | | | 108,604 | | | |
7.00%, 11/1/17-10/1/35 | | | 43,380 | | | | 46,564 | | | |
7.50%, 1/1/33 | | | 116,687 | | | | 135,534 | | | |
8.50%, 7/1/32 | | | 6,513 | | | | 7,562 | | | |
Federal National Mortgage Assn., Interest-Only | | | |
Stripped Mtg.-Backed Security: | | | |
Series 222, Cl. 2, 23.753%, 6/1/235 | | | 279,348 | | | | 60,400 | | | |
Series 233, Cl. 2, 42.102%, 8/1/235 | | | 198,676 | | | | 38,304 | | | |
Series 252, Cl. 2, 41.618%, 11/1/235 | | | 257,407 | | | | 60,465 | | | |
Series 319, Cl. 2, 2.143%, 2/1/325 | | | 57,726 | | | | 11,031 | | | |
Series 320, Cl. 2, 9.852%, 4/1/325 | | | 18,313 | | | | 4,608 | | | |
Series 321, Cl. 2, 0.00%, 4/1/325,6 | | | 206,038 | | | | 38,591 | | | |
Series 331, Cl. 9, 0.00%, 2/1/335,6 | | | 219,937 | | | | 48,756 | | | |
Series 334, Cl. 17, 6.483%, 2/1/335 | | | 132,911 | | | | 30,506 | | | |
Series 339, Cl. 12, 0.00%, 6/25/335,6 | | | 196,162 | | | | 39,382 | | | |
Series 339, Cl. 7, 0.00%, 8/1/335,6 | | | 552,671 | | | | 107,711 | | | |
Series 343, Cl. 13, 0.00%, 9/1/335,6 | | | 185,391 | | | | 35,162 | | | |
Series 345, Cl. 9, 0.00%, 1/1/345,6 | | | 162,372 | | | | 32,653 | | | |
Series 351, Cl. 10, 0.00%, 4/1/345,6 | | | 25,579 | | | | 4,798 | | | |
Series 351, Cl. 8, 0.00%, 4/1/345,6 | | | 85,184 | | | | 16,085 | | | |
Series 356, Cl. 10, 0.00%, 6/1/355,6 | | | 61,445 | | | | 11,604 | | | |
| | | | | | | | | | |
| | | | | | | | | | |
| | | | | | | | |
| | | Principal Amount | | | Value | |
FHLMC/FNMA/FHLB/Sponsored (Continued) | |
Federal National Mortgage Assn., Interest-Only | |
Stripped Mtg.-Backed Security: (Continued) | |
Series 356, Cl. 12, 0.00%, 2/1/355,6 | | $ | 33,001 | | | $ | 6,210 | |
Series 362, Cl. 13, 0.00%, 8/1/355,6 | | | 228,345 | | | | 43,347 | |
Series 364, Cl. 16, 0.00%, 9/1/355,6 | | | 157,646 | | | | 29,673 | |
Federal National Mortgage Assn., Real Estate Mtg. | |
Investment Conduit Multiclass Pass-Through Certificates: | |
Series 1998-61, Cl. PL, 6.00%, 11/25/28 | | | 90,168 | | | | 100,270 | |
Series 2003-130, Cl. CS, 13.771%, 12/25/334 | | | 23,680 | | | | 28,397 | |
Series 2003-28, Cl. KG, 5.50%, 4/25/23 | | | 424,709 | | | | 466,872 | |
Series 2003-84, Cl. GE, 4.50%, 9/25/18 | | | 42,914 | | | | 45,519 | |
Series 2004-101, Cl. BG, 5.00%, 1/25/20 | | | 391,167 | | | | 410,573 | |
Series 2004-25, Cl. PC, 5.50%, 1/25/34 | | | 350,000 | | | | 375,460 | |
Series 2005-104, Cl. MC, 5.50%, 12/25/25 | | | 451,330 | | | | 496,773 | |
Series 2005-31, Cl. PB, 5.50%, 4/25/35 | | | 250,000 | | | | 276,386 | |
Series 2005-73, Cl. DF, 0.415%, 8/25/354 | | | 455,817 | | | | 455,800 | |
Series 2006-11, Cl. PS, 23.963%, 3/25/364 | | | 125,840 | | | | 193,622 | |
Series 2006-46, Cl. SW, 23.596%, 6/25/364 | | | 99,425 | | | | 153,354 | |
Series 2006-50, Cl. KS, 23.597%, 6/25/364 | | | 21,667 | | | | 33,548 | |
Series 2007-109, Cl. NF, 0.715%, 12/25/374 | | | 259,907 | | | | 262,349 | |
Series 2008-14, Cl. BA, 4.25%, 3/25/23 | | | 188,076 | | | | 198,856 | |
Series 2009-36, Cl. FA, 1.105%, 6/25/374 | | | 179,673 | | | | 181,430 | |
Series 2009-37, Cl. HA, 4.00%, 4/25/19 | | | 174,294 | | | | 183,197 | |
Series 2009-70, Cl. NT, 4.00%, 8/25/19 | | | 19,197 | | | | 20,176 | |
Series 2009-70, Cl. TL, 4.00%, 8/25/19 | | | 1,873,259 | | | | 1,968,800 | |
Series 2010-43, Cl. KG, 3.00%, 1/25/21 | | | 263,079 | | | | 273,834 | |
Series 2011-15, Cl. DA, 4.00%, 3/25/41 | | | 90,367 | | | | 95,014 | |
Series 2011-3, Cl. KA, 5.00%, 4/25/40 | | | 295,601 | | | | 321,729 | |
Series 2011-38, Cl. AH, 2.75%, 5/25/20 | | | 22,149 | | | | 22,894 | |
Series 2011-82, Cl. AD, 4.00%, 8/25/26 | | | 567,576 | | | | 598,549 | |
Federal National Mortgage Assn., Real Estate Mtg. | |
Investment Conduit Multiclass Pass-Through Certificates, | |
Interest-Only Stripped Mtg.-Backed Security: | | | | | | | | |
Series 2001-65, Cl. S, 26.166%, 11/25/315 | | | 216,547 | | | | 40,445 | |
Series 2001-81, Cl. S, 25.333%, 1/25/325 | | | 55,863 | | | | 10,926 | |
Series 2002-47, Cl. NS, 31.607%, 4/25/325 | | | 156,510 | | | | 29,623 | |
Series 2002-51, Cl. S, 31.80%, 8/25/325 | | | 143,713 | | | | 27,196 | |
Series 2002-52, Cl. SD, 36.798%, 9/25/325 | | | 196,686 | | | | 37,334 | |
Series 2002-77, Cl. SH, 37.731%, 12/18/325 | | | 86,182 | | | | 16,461 | |
Series 2002-84, Cl. SA, 32.015%, 12/25/325 | | | 215,475 | | | | 39,234 | |
Series 2002-9, Cl. MS, 25.84%, 3/25/325 | | | 60,467 | | | | 10,609 | |
Series 2003-33, Cl. SP, 26.764%, 5/25/335 | | | 232,520 | | | | 50,786 | |
Series 2003-4, Cl. S, 28.509%, 2/25/335 | | | 135,964 | | | | 25,474 | |
Series 2003-46, Cl. IH, 0.00%, 6/25/235,6 | | | 498,294 | | | | 66,535 | |
Series 2004-54, Cl. DS, 41.562%, 11/25/305 | | | 156,128 | | | | 30,795 | |
Series 2004-56, Cl. SE, 9.747%, 10/25/335 | | | 45,461 | | | | 7,405 | |
Series 2005-12, Cl. SC, 11.374%, 3/25/355 | | | 24,718 | | | | 5,419 | |
Series 2005-14, Cl. SE, 37.007%, 3/25/355 | | | 78,477 | | | | 12,026 | |
Series 2005-40, Cl. SA, 49.803%, 5/25/355 | | | 426,421 | | | | 80,348 | |
Series 2005-52, Cl. JH, 4.222%, 5/25/355 | | | 1,020,939 | | | | 185,588 | |
Series 2005-93, Cl. SI, 16.921%, 10/25/355 | | | 109,059 | | | | 17,989 | |
Series 2007-88, Cl. XI, 33.138%, 6/25/375 | | | 288,492 | | | | 39,242 | |
Series 2008-55, Cl. SA, 17.209%, 7/25/385 | | | 181,720 | | | | 25,508 | |
Series 2009-8, Cl. BS, 0.00%, 2/25/245,6 | | | 73,949 | | | | 6,452 | |
Series 2012-40, Cl. PI, 2.618%, 4/25/415 | | | 439,343 | | | | 84,533 | |
Federal National Mortgage Assn., Real Estate Mtg. | |
Investment Conduit Multiclass Pass-Through | |
Certificates, Principal-Only Stripped Mtg.-Backed | |
| Security, Series 1993-184, Cl. M, 4.456%, 9/25/237 | | | 101,438 | | | | 93,937 | |
| | | | | | | | 55,766,214 | |
GNMA/Guaranteed—0.2% | | | | | | | | |
Government National Mortgage Assn. I Pool: | | | | | | | | |
7.00%, 1/15/24 | | | 63,284 | | | | 69,518 | |
7.50%, 1/15/23-6/15/24 | | | 50,187 | | | | 54,932 | |
8.00%, 5/15/17-4/15/23 | | | 37,109 | | | | 41,044 | |
8.50%, 8/15/17-12/15/17 | | | 9,445 | | | | 10,007 | |
Government National Mortgage Assn., Interest-Only | |
Stripped Mtg.-Backed Security: | |
Series 2002-15, Cl. SM, 61.184%, 2/16/325 | | | 251,523 | | | | 45,981 | |
9 OPPENHEIMER CAPITAL INCOME FUND/VA
STATEMENTOF INVESTMENTS Continued
| | | | | | | | | | |
| | | Principal
Amount | | | Value | | | |
GNMA/Guaranteed (Continued) | | | | | | | |
| Government National Mortgage Assn., Interest-Only | | | | | | | | | | |
| Stripped Mtg.-Backed Security: | | | | | | | | | | |
| Series 2002-76, Cl. SY, 63.894%, 12/16/265 | | $ | 552,165 | | | $ | 98,394 | | | |
| Series 2007-17, Cl. AI, 14.369%, 4/16/375 | | | 561,337 | | | | 93,305 | | | |
| Series 2011-52, Cl. HS, 8.539%, 4/16/415 | | | 275,591 | | | | 47,184 | | | |
| | | | | | | | 460,365 | | | |
| Non-Agency—7.2% | | | | | | | | | | |
| Commercial—5.5% | | | | | | | | | | |
| Banc of America Commercial Mortgage Trust: | | | | | | | | | | |
| Series 2006-5, Cl. AM, 5.448%, 9/10/47 | | | 85,000 | | | | 91,132 | | | |
| Series 2006-6, Cl. AM, 5.39%, 10/10/45 | | | 530,000 | | | | 575,367 | | | |
| Bear Stearns Adjustable Rate Mortgage Trust, | | | | | | | | | | |
| Series 2005-9, Cl. A1, 2.43%, 10/25/354 | | | 762,322 | | | | 751,428 | | | |
| CD Commercial Mortgage Trust, Series 2006-CD2, | | | | | | | | | | |
| Cl. AM, 5.351%, 1/15/464 | | | 485,000 | | | | 521,385 | | | |
| Citigroup Commercial Mortgage Trust: | | | | | | | | | | |
| Series 2008-C7, Cl. AM, 6.132%, 12/1/494 | | | 90,000 | | | | 99,994 | | | |
| Series 20113-GCJ11, 4.607%, 4/10/462 | | | 185,000 | | | | 160,096 | | | |
| COMM Mortgage Trust: | | | | | | | | | | |
| Series 2006-C7, Cl. AM, 5.777%, 6/10/464 | | | 855,000 | | | | 920,429 | | | |
| Series 2012-CR4, Cl. D, 4.577%, 10/15/452,4 | | | 185,000 | | | | 165,061 | | | |
| Series 2012-CR5, Cl. E, 4.335%, 12/10/452,4 | | | 225,000 | | | | 196,666 | | | |
| Series 2013-CR7, Cl. D, 4.36%, 3/10/462,4 | | | 200,000 | | | | 167,141 | | | |
| COMM Mortgage Trust, Interest-Only Stripped Mtg.- Backed Security: | | | | | | | | | | |
| Series 2010-C1, Cl. XPA, 0%, 7/10/462,5,6 | | | 2,801,199 | | | | 111,638 | | | |
| Series 2012-CR5, Cl. XA, 1.184%, 12/10/455 | | | 443,247 | | | | 46,657 | | | |
| Commercial Mortgage Trust, Series 2006-GG7, | | | | | | | | | | |
| Cl. AM, 5.82%, 7/10/384 | | | 190,000 | | | | 207,695 | | | |
| Countrywide Alternative Loan Trust, Series 2006-J2, | | | | | | | | | | |
| Cl. A7, 6%, 4/25/36 | | | 12,827 | | | | 11,615 | | | |
| Countrywide Home Loans, Series 2007-J3, Cl. A9, 6%, 7/1/37 | | | 26,688 | | | | 23,264 | | | |
| Credit Suisse Commercial Mortgage Trust: | | | | | | | | | | |
| Series 2006-6, Cl. 1A4, 6.00%, 7/25/36 | | | 256,231 | | | | 199,241 | | | |
| Series 2006-C1, Cl. AJ, 5.465%, 2/15/394 | | | 208,000 | | | | 221,242 | | | |
| Credit Suisse First Boston Commercial Trust, Series 2005-C6, Cl. AJ, 5.23%, 12/15/404 | | | 275,000 | | | | 290,712 | | | |
| DBUBS Mortgage Trust, Series 2011-LC1A, Cl. E, 5.557%, 11/10/462,4 | | | 50,000 | | | | 51,176 | | | |
| Deutsche Alt-B Securities, Inc. Mortgage Loan Trust, Series 2006-AB4, Cl. A1A, 6.005%, 10/25/364 | | | 256,507 | | | | 192,393 | | | |
| EverBank Mortgage Loan Trust, Series 2013-1, Cl. A1, 2.25%, 3/25/432,4 | | | 428,350 | | | | 381,424 | | | |
| First Horizon Alternative Mortgage Securities Trust: | | | | | | | | | | |
| Series 2004-FA2, Cl. 3A1, 6.00%, 1/25/35 | | | 201,008 | | | | 200,321 | | | |
| Series 2005-FA8, Cl. 1A6, 0.815%, 11/25/354 | | | 194,362 | | | | 147,553 | | | |
| Series 2005-FA9, Cl. A4A, 5.50%, 12/25/35 | | | 17,630 | | | | 15,591 | | | |
| Series 2007-FA2, Cl. 1A1, 5.50%, 4/1/37 | | | 449,041 | | | | 334,656 | | | |
| Series 2007-FA4, Cl. 1A6, 6.25%, 8/25/374 | | | 227,530 | | | | 190,690 | | | |
| FREMF Mortgage Trust: | | | | | | | | | | |
| Series 2013-K25, Cl. C, 3.618%, 11/25/452,4 | | | 60,000 | | | | 50,208 | | | |
| Series 2013-K26, Cl. C, 3.60%, 12/25/452,4 | | | 40,000 | | | | 33,469 | | | |
| Series 2013-K27, Cl. C, 3.497%, 1/25/462,4 | | | 110,000 | | | | 91,065 | | | |
| Series 2013-K28, Cl. C, 3.494%, 6/25/462,4 | | | 110,000 | | | | 89,674 | | | |
| Series 2013-K712, Cl. C, 3.367%, 5/25/452,4 | | | 110,000 | | | | 99,248 | | | |
| GCCFC Commercial Mortgage Trust: | | | | | | | | | | |
| Series 2007-GG11, Cl. AM, 5.867%, 12/1/494 | | | 500,000 | | | | 549,148 | | | |
| Series 2007-GG9, Cl. AM, 5.475%, 3/10/39 | | | 615,000 | | | | 656,036 | | | |
| GE Capital Commercial Mortgage Corp., Series 2005- C4, Cl. AJ, 5.311%, 11/10/454 | | | 430,000 | | | | 419,047 | | | |
| GS Mortgage Securities Trust: | | | | | | | | | | |
| Series 2006-GG6, Cl. AM, 5.622%, 4/10/384 | | | 200,000 | | | | 216,627 | | | |
| Series 2011-GC3, Cl. A1, 2.331%, 3/10/442 | | | 108,953 | | | | 110,179 | | | |
| GSR Mortgage Loan Trust, Series 2005-AR4, Cl. 6A1, 5.221%, 7/25/354 | | | 72,618 | | | | 71,991 | | | |
| JP Morgan Chase Commercial Mortgage Securities Trust: | | | | | | | | | | |
| Series 2006-CB16, Cl. AJ, 5.623%, 5/12/45 | | | 470,000 | | | | 460,259 | | | |
| Series 2006-LDP8, Cl. AJ, 5.48%, 5/15/454 | | | 450,000 | | | | 469,822 | | | |
| | | | | | | | |
| | | Principal
Amount | | | Value | |
Commercial (Continued) | | | | | |
| JP Morgan Chase Commercial Mortgage Securities | | | | | | | | |
| Trust: Continued | | | | | | | | |
| Series 2007-LDPX, Cl. A3S, 5.317%, 1/15/49 | | $ | 239,954 | | | $ | 239,662 | |
| Series 2011-C3, Cl. A1, 1.875%, 2/15/462 | | | 116,105 | | | | 116,619 | |
| JP Morgan Mortgage Trust, Series 2007-S3, Cl. 1A90, 7%, 8/25/37 | | | 238,522 | | | | 218,514 | |
| JPMorgan Re-Securitization Trust, Series 2009-5, Cl. 1A2, 2.612%, 7/26/362,4 | | | 256,801 | | | | 198,771 | |
| MASTR Adjustable Rate Mortgages Trust, Series 2004- 13, Cl. 2A2, 2.644%, 4/21/344 | | | 109,968 | | | | 113,483 | |
| Merrill Lynch Mortgage Trust, Series 2006-C2, Cl. AM, 5.782%, 8/12/434 | | | 610,000 | | | | 670,320 | |
| Morgan Stanley Bank of America Merrill Lynch Trust: | | | | | | | | |
| Series 2012-C6, Cl. E, 4.664%, 11/15/452,4 | | | 95,000 | | | | 85,312 | |
| Series 2013-C7, Cl. D, 4.304%, 2/15/462,4 | | | 115,000 | | | | 99,597 | |
| Series 2013-C8, Cl. D, 4.172%, 12/15/482,4 | | | 80,000 | | | | 68,026 | |
| Morgan Stanley Capital I Trust: | | | | | | | | |
| Series 2007-IQ13, Cl. AM, 5.406%, 3/15/44 | | | 325,000 | | | | 353,936 | |
| Series 2007-IQ15, Cl. AM, 5.91%, 6/1/494 | | | 345,000 | | | | 372,238 | |
| Morgan Stanley Reremic Trust, Series 2012-R3, Cl. 1B, 2.065%, 11/26/363,4 | | | 263,373 | | | | 145,477 | |
| Structured Adjustable Rate Mortgage Loan Trust: | | | | | | | | |
| Series 2004-10, Cl. 2A, 2.394%, 8/25/344 | | | 473,845 | | | | 461,169 | |
| Series 2006-4, Cl. 6A, 5.09%, 5/25/364 | | | 141,229 | | | | 119,176 | |
| Series 2007-6, Cl. 3A1, 4.701%, 7/25/374 | | | 231,926 | | | | 182,865 | |
| UBS-Barclays Commercial Mortgage Trust, Series 2012-C2, Cl. E, 4.891%, 5/1/632,4 | | | 45,000 | | | | 39,847 | |
| WaMu Mortgage Pass-Through Certificates Trust, Series 2005-AR14, Cl. 1A4, 2.381%, 12/25/354 | | | 115,170 | | | | 106,373 | |
| Wells Fargo Mortgage-Backed Securities Trust: | | | | | | | | |
| Series 2005-AR1, Cl. 1A1, 2.61%, 2/25/354 | | | 47,871 | | | | 47,867 | |
| Series 2005-AR15, Cl. 1A6, 2.607%, 9/25/354 | | | 649,134 | | | | 609,657 | |
| Series 2006-AR7, Cl. 2A4, 2.616%, 5/1/364 | | | 294,273 | | | | 274,665 | |
| Series 2007-16, Cl. 1A1, 6.00%, 12/28/37 | | | 186,475 | | | | 195,198 | |
| Series 2007-AR8, Cl. A1, 5.917%, 11/25/374 | | | 683,709 | | | | 615,446 | |
| WF-RBS Commercial Mortgage Trust: | | | | | | | | |
| Series 2012-C10, Cl. D, 4.46%, 12/15/452,4 | | | 50,000 | | | | 43,339 | |
| Series 2012-C7, Cl. E, 4.848%, 6/15/452,4 | | | 80,000 | | | | 72,864 | |
| Series 2012-C8, Cl. E, 4.878%, 8/15/452,4 | | | 95,000 | | | | 87,262 | |
| Series 2013-C11, Cl. D, 4.184%, 3/15/452,4 | | | 49,000 | | | | 41,823 | |
| Series 2013-C15, Cl. D, 4.486%, 8/15/462,4 | | | 225,000 | | | | 192,345 | |
| WF-RBS Commercial Mortgage Trust, Interest-Only Commercial Mtg. Pass-Through Certificates, Series 2011-C3, Cl. XA, 0%, 3/15/442,5 | | | 4,001,621 | | | | 270,748 | |
| | | | | | | | 15,633,939 | |
Multi-Family—0.2% | | | | | | | | |
| Citigroup Mortgage Loan Trust, Inc., Series 2006-AR3, Cl. 1A2A, 5.432%, 6/25/364 | | | 135,049 | | | | 124,147 | |
| Countrywide Alternative Loan Trust: | | | | | | | | |
| Series 2005-86CB, Cl. A8, 5.50%, 2/25/36 | | | 49,127 | | | | 43,648 | |
| Series 2005-J14, Cl. A7, 5.50%, 12/25/35 | | | 95,534 | | | | 82,739 | |
| Series 2006-24CB, Cl. A12, 5.75%, 6/25/36 | | | 118,114 | | | | 100,117 | |
| JP Morgan Mortgage Trust, Series 2007-A3, Cl. 3A2M, 4.713%, 5/15/374 | | | 28,557 | | | | 27,604 | |
| Wells Fargo Mortgage-Backed Securities Trust, | | | | | | | | |
| Series 2006-AR2, Cl. 2A3, 2.628%, 3/25/364 | | | 59,155 | | | | 58,587 | |
| | | | | | | | 436,842 | |
Residential—1.5% | | | | | | | | |
| Argent Securities, Inc., Series 2004-W8, Cl. A2, 1.125%, 5/25/344 | | | 126,524 | | | | 122,376 | |
| Banc of America Commercial Mortgage Trust, Series 2007-4, Cl. AM, 5.813%, 2/1/514 | | | 820,000 | | | | 906,239 | |
| Banc of America Funding Trust: | | | | | | | | |
| Series 2007-1, Cl. 1A3, 6.00%, 1/25/37 | | | 143,466 | | | | 126,545 | |
| Series 2007-C, Cl. 1A4, 5.359%, 5/20/364 | | | 57,313 | | | | 55,128 | |
| Banc of America Mortgage Trust, Series 2004-E, | | | | | | | | |
| Cl. 2A6, 2.834%, 6/25/344 | | | 157,731 | | | | 156,374 | |
| Carrington Mortgage Loan Trust, Series 2006-FRE1, | | | | | | | | |
| Cl. A2, 0.275%, 7/25/364 | | | 116,135 | | | | 113,177 | |
10 OPPENHEIMER CAPITAL INCOME FUND/VA
| | | | | | | | | | |
| | | Principal
Amount | | | Value | | | |
Residential (Continued) | | | | | | | | | | |
| CD Commercial Mortgage Trust, Series 2007-CD4, Cl. AMFX, 5.366%, 12/11/494 | | $ | 885,000 | | | $ | 917,019 | | | |
| Countrywide Alternative Loan Trust, Series 2005-29CB, Cl. A4, 5%, 7/25/35 | | | 581,800 | | | | 501,420 | | | |
| Countrywide Asset-Backed Certificates: | | | | | | | | | | |
| Series 2005-16, Cl. 2AF2, 5.021%, 5/25/364 | | | 234,842 | | | | 243,415 | | | |
| Series 2006-25, Cl. 2A2, 0.285%, 6/25/474 | | | 2,960 | | | | 2,964 | | | |
| Countrywide Home Loans: | | | | | | | | | | |
| Series 2005-26, Cl. 1A8, 5.50%, 11/1/35 | | | 175,126 | | | | 164,559 | | | |
| Series 2005-29, Cl. A1, 5.75%, 12/25/35 | | | 96,658 | | | | 88,102 | | | |
| Series 2006-17, Cl. A2, 6.00%, 12/25/36 | | | 222,880 | | | | 198,371 | | | |
| Series 2006-6, Cl. A3, 6.00%, 4/25/36 | | | 88,708 | | | | 81,738 | | | |
| GSR Mortgage Loan Trust, Series 2006-5F, Cl. 2A1, 6%, 6/25/36 | | | 66,837 | | | | 65,294 | | | |
| RALI Trust: | | | | | | | | | | |
| Series 2003-QS1, Cl. A2, 5.75%, 1/1/33 | | | 63,230 | | | | 64,542 | | | |
| Series 2006-QS13, Cl. 1A8, 6.00%, 9/1/36 | | | 18,034 | | | | 13,716 | | | |
| Residential Asset Securitization Trust, Series 2005-A15, Cl. 1A4, 5.75%, 2/1/36 | | | 28,036 | | | | 25,401 | | | |
| WaMu Mortgage Pass-Through Certificates Trust, Series 2006-AR18, Cl. 3A1, 4.202%, 1/1/374 | | | 66,668 | | | | 59,844 | | | |
| Wells Fargo Alternative Loan Trust, Series 2007-PA5, Cl. 1A1, 6.25%, 11/25/37 | | | 196,258 | | | | 178,018 | | | |
| Wells Fargo Mortgage-Backed Securities Trust: | | | | | | | | | | |
| Series 2005-9, Cl. 2A6, 5.25%, 10/25/35 | | | 73,471 | | | | 75,784 | | | |
| Series 2006-AR14, Cl. 1A2, 5.584%, 10/1/364 | | | 127,562 | | | | 122,315 | | | |
| | | | | | | 4,282,341 | | | |
Total Mortgage-Backed Obligations (Cost $76,429,079) | | | | | | | 76,579,701 | | | |
| | | | | | | | | | |
| U.S. Government Obligations—0.8% | | | |
| Federal Home Loan Mortgage Corp. Nts.: | | | | | | | | | | |
| 0.875%, 10/14/16-3/7/18 | | | 581,000 | | | | 574,324 | | | |
| 1.25%, 5/12/17 | | | 55,000 | | | | 55,405 | | | |
| 1.375%, 5/1/20 | | | 265,000 | | | | 248,615 | | | |
| 1.75%, 5/30/19 | | | 80,000 | | | | 78,644 | | | |
| 2.375%, 1/13/2210 | | | 611,000 | | | | 584,283 | | | |
| 5.50%, 7/18/16 | | | 65,000 | | | | 72,971 | | | |
| Federal National Mortgage Assn. Nts.: | | | | | | | | | | |
| 1.125%, 4/27/17 | | | 191,000 | | | | 191,837 | | | |
| 1.625%, 11/27/18 | | | 135,000 | | | | 133,968 | | | |
| 1.875%, 9/18/18 | | | 117,000 | | | | 117,850 | | | |
| 5.375%, 6/12/17 | | | 75,000 | | | | 85,805 | | | |
| Total U.S. Government Obligations (Cost $2,182,530) | | | | | | | 2,143,702 | | | |
| | | | | | | | | | |
| Non-Convertible Corporate Bonds and Notes—25.0% | | | |
| Consumer Discretionary—3.0% | | | |
| Auto Components—0.3% | | | |
| Dana Holding Corp., 6.75% Sr. Unsec. Nts., 2/15/21 | | | 439,000 | | | | 474,120 | | | |
| TRW Automotive, Inc., 4.50% Sr. Unsec. Nts., 3/1/212 | | | 290,000 | | | | 294,350 | | | |
| | | | | | | 768,470 | | | |
| Automobiles—0.9% | | | |
| Daimler Finance North America LLC: | | | | | | | | | | |
| 1.30% Sr. Unsec. Nts., 7/31/152 | | | 463,000 | | | | 465,897 | | | |
| 8.50% Sr. Unsec. Unsub. Nts., 1/18/31 | | | 252,000 | | | | 365,946 | | | |
| Ford Motor Credit Co. LLC, 5.875% Sr. Unsec. Unsub. | | | | | | | | | | |
| Nts., 8/2/21 | | | 973,000 | | | | 1,103,405 | | | |
| General Motors Co., 6.25% Sr. Unsec. Nts., 10/2/432 | | | 437,000 | | | | 456,119 | | | |
| | | | | | | 2,391,367 | | | |
| Hotels, Restaurants & Leisure—0.4% | | | |
| Brinker International, Inc., 2.60% Sr. Unsec. Nts., 5/15/18 | | | 151,000 | | | | 148,709 | | | |
| Carnival Corp., 1.20% Sr. Unsec. Nts., 2/5/16 | | | 465,000 | | | | 463,927 | | | |
| Starwood Hotels & Resorts Worldwide, Inc.: | | | | | | | | | | |
| 7.15% Sr. Unsec. Unsub. Nts., 12/1/19 | | | 164,000 | | | | 195,971 | | | |
| 7.375% Sr. Unsec. Nts., 11/15/15 | | | 172,000 | | | | 190,836 | | | |
| | | | | | | 999,443 | | | |
| | | | | | | | | | |
| | | Principal
Amount | | | Value | | | |
Household Durables—0.4% | | | |
| Jarden Corp., 6.125% Sr. Unsec. Nts., 11/15/22 | | $ | 438,000 | | | $ | 470,850 | | | |
| Toll Brothers Finance Corp., 4% Sr. Unsec. Nts., 12/31/18 | | | 463,000 | | | | 472,260 | | | |
| | | | | | | 943,110 | | | |
| Media—0.5% | | | |
| Comcast Cable Communications Holdings, Inc., 9.455% Sr. Unsec. Nts., 11/15/22 | | | 205,000 | | | | 284,023 | | | |
| Comcast Corp., 4.65% Sr. Unsec. Unsub. Nts., 7/15/42 | | | 353,000 | | | | 328,581 | | | |
| Historic TW, Inc.: | | | | | | | | | | |
| 8.05% Sr. Unsec. Nts., 1/15/16 | | | 77,000 | | | | 87,159 | | | |
| 9.15% Debs., 2/1/23 | | | 38,000 | | | | 50,406 | | | |
| Interpublic Group of Cos., Inc. (The), 6.25% Sr. Unsec. Nts., 11/15/14 | | | 155,000 | | | | 161,781 | | | |
| Lamar Media Corp., 5% Sr. Unsec. Sub. Nts., 5/1/23 | | | 496,000 | | | | 473,680 | | | |
| News America, Inc., 6.15% Sr. Unsec. Nts., 2/15/41 | | | 168,000 | | | | 187,281 | | | |
| Time Warner, Inc., 5.35% Sr. Unsec. Nts., 12/15/43 | | | 132,000 | | | | 133,712 | | | |
| WPP Finance 2010, 5.625% Sr. Unsec. Nts., 11/15/43 | | | 152,000 | | | | 150,504 | | | |
| | | | | | | 1,857,127 | | | |
| Multiline Retail—0.3% | | | |
| Dollar General Corp., 4.125% Sr. Unsec. Nts., 7/15/17 | | | 498,000 | | | | 528,972 | | | |
| Macy’s Retail Holdings, Inc., 5.75% Sr. Unsec. Nts., 7/15/14 | | | 414,000 | | | | 425,134 | | | |
| | | | | | | 954,106 | | | |
| Specialty Retail—0.1% | | | |
| Home Depot, Inc. (The), 4.875% Sr. Unsec. Nts., 2/15/44 | | | 167,000 | | | | 169,140 | | | |
| L Brands, Inc., 8.50% Sr. Unsec. Nts., 6/15/19 | | | 136,000 | | | | 163,880 | | | |
| Rent-A-Center, Inc., 4.75% Sr. Unsec. Nts., 5/1/21 | | | 480,000 | | | | 453,000 | | | |
| | | | | | | 786,020 | | | |
| Textiles, Apparel & Luxury Goods—0.1% | | | |
| PVH Corp., 4.50% Sr. Unsec. Unsub. Nts., 12/15/22 | | | 472,000 | | | | 449,580 | | | |
| Consumer Staples—1.3% | | | |
| Beverages—0.5% | | | |
| Anheuser-Busch InBev Worldwide, Inc., 8.20% Sr. Unsec. Unsub. Nts., 1/15/39 | | | 366,000 | | | | 535,405 | | | |
| Constellation Brands, Inc., 3.75% Sr. Unsec. Nts., 5/1/21 | | | 472,000 | | | | 444,860 | | | |
| Foster’s Finance Corp., 4.875% Sr. Unsec. Nts., 10/1/142 | | | 270,000 | | | | 278,334 | | | |
| SABMiller Holdings, Inc., 4.95% Sr. Unsec. Unsub. Nts., 1/15/422 | | | 235,000 | | | | 233,468 | | | |
| | | | | | | 1,492,067 | | | |
| Food & Staples Retailing—0.2% | | | |
| Delhaize Group SA, 5.70% Sr. Unsec. Nts., 10/1/40 | | | 245,000 | | | | 232,335 | | | |
| Safeway, Inc., 5.625% Sr. Unsec. Nts., 8/15/14 | | | 98,000 | | | | 100,526 | | | |
| Wal-Mart Stores, Inc., 4% Sr. Unsec. Unsub. Nts., 4/11/43 | | | 375,000 | | | | 333,829 | | | |
| | | | | | | 666,690 | | | |
| Food Products—0.2% | | | |
| Bunge Ltd. Finance Corp.: | | | | | | | | | | |
| 5.10% Sr. Unsec. Unsub. Nts., 7/15/15 | | | 381,000 | | | | 403,454 | | | |
| 5.35% Sr. Unsec. Unsub. Nts., 4/15/14 | | | 34,000 | | | | 34,435 | | | |
| 8.50% Sr. Unsec. Nts., 6/15/19 | | | 270,000 | | | | 331,891 | | | |
| | | | | | | 769,780 | | | |
| Personal Products—0.2% | | | |
| Avon Products, Inc., 5% Sr. Unsec. Nts., 3/15/23 | | | 496,000 | | | | 482,378 | | | |
| Tobacco—0.2% | | | |
| Altria Group, Inc., 10.20% Sr. Unsec. Nts., 2/6/39 | | | 250,000 | | | | 390,125 | | | |
| Lorillard Tobacco Co., 3.75% Sr. Unsec. Nts., 5/20/23 | | | 269,000 | | | | 244,974 | | | |
| | | | | | | 635,099 | | | |
| Energy—3.3% | | | |
| Energy Equipment & Services—0.5% | | | |
| Ensco plc, 4.70% Sr. Unsec. Nts., 3/15/21 | | | 532,000 | | | | 562,872 | | | |
| Noble Holding International Ltd., 7.375% Sr. Unsec. Nts., 3/15/14 | | | 276,000 | | | | 279,641 | | | |
11 OPPENHEIMER CAPITAL INCOME FUND/VA
STATEMENT OF INVESTMENTS Continued
| | | | | | | | | | |
| | | Principal
Amount | | | Value | | | |
Energy Equipment & Services (Continued) | | | |
| Rowan Cos., Inc., 4.875% Sr. Unsec. Unsub. Nts., 6/1/22 | | $ | 349,000 | | | $ | 354,255 | | | |
| Weatherford International Ltd., 5.95% Sr. Unsec. Nts., 4/15/42 | | | 295,000 | | | | 295,639 | | | |
| | | | | | | | 1,492,407 | | | |
| Oil, Gas & Consumable Fuels—2.8% | | | |
| Anadarko Petroleum Corp.: | | | | | | | | | | |
| 6.20% Sr. Unsec. Nts., 3/15/40 | | | 172,000 | | | | 190,295 | | | |
| 7.625% Sr. Unsec. Nts., 3/15/14 | | | 206,000 | | | | 208,749 | | | |
| Canadian Oil Sands Ltd., 6% Sr. Unsec. Nts., 4/1/422 | | | 206,000 | | | | 210,704 | | | |
| Cimarex Energy Co., 5.875% Sr. Unsec. Unsub. Nts., 5/1/22 | | | 472,000 | | | | 502,680 | | | |
| CNOOC Finance 2013 Ltd., 4.25% Sr. Unsec. Unsub. Nts., 5/9/43 | | | 164,000 | | | | 138,212 | | | |
| Continental Resources, Inc., 4.50% Sr. Unsec. Nts., 4/15/23 | | | 509,000 | | | | 516,635 | | | |
| Copano Energy LLC/Copano Energy Finance Corp., 7.125% Sr. Unsec. Unsub. Nts., 4/1/21 | | | 657,000 | | | | 757,168 | | | |
| DCP Midstream LLC, 5.375% Sr. Unsec. Nts., 10/15/152 | | | 342,000 | | | | 363,921 | | | |
| DCP Midstream Operating LP: | | | | | | | | | | |
| 2.50% Sr. Unsec. Unsub. Nts., 12/1/17 | | | 405,000 | | | | 403,458 | | | |
| 3.875% Sr. Unsec. Nts., 3/15/23 | | | 237,000 | | | | 218,319 | | | |
| Enbridge Energy Partners LP, 5.35% Sr. Unsec. Nts., 12/15/14 | | | 209,000 | | | | 218,081 | | | |
| EnCana Holdings Finance Corp., 5.80% Sr. Unsec. Unsub. Nts., 5/1/14 | | | 139,000 | | | | 141,412 | | | |
| Energy Transfer Partners LP, 8.50% Sr. Unsec. Nts., 4/15/14 | | | 180,000 | | | | 183,800 | | | |
| Origin Energy Finance Ltd., 3.50% Sr. Unsec. Nts., 10/9/182 | | | 421,000 | | | | 423,327 | | | |
| Range Resources Corp., 5.75% Sr. Unsec. Sub. Nts., 6/1/21 | | | 435,000 | | | | 463,275 | | | |
| Ras Laffan Liquefied Natural Gas Co. Ltd. III, 5.50% Sr. Sec. Nts., 9/30/142 | | | 291,000 | | | | 301,185 | | | |
| Rockies Express Pipeline LLC, 3.90% Sr. Unsec. Unsub. Nts., 4/15/152 | | | 454,000 | | | | 455,135 | | | |
| Southwestern Energy Co., 4.10% Sr. Unsec. Nts., 3/15/22 | | | 255,000 | | | | 252,862 | | | |
| Spectra Energy Partners LP: | | | | | | | | | | |
| 4.60% Sr. Unsec. Nts., 6/15/21 | | | 277,000 | | | | 287,226 | | | |
| 4.75% Sr. Unsec. Nts., 3/15/24 | | | 229,000 | | | | 233,526 | | | |
| Talisman Energy, Inc., 3.75% Sr. Unsec. Nts., 2/1/21 | | | 311,000 | | | | 301,559 | | | |
| Whiting Petroleum Corp., 5.75% Sr. Unsec. Nts., 3/15/21 | | | 465,000 | | | | 482,438 | | | |
| Williams Cos., Inc. (The), 3.70% Sr. Unsec. Unsub. Nts., 1/15/239 | | | 114,000 | | | | 99,533 | | | |
| Woodside Finance Ltd., 4.60% Sr. Unsec. Unsub. Nts., 5/10/212 | | | 372,000 | | | | 389,671 | | | |
| | | | | | | | 7,743,171 | | | |
| Financials—9.2% | | | |
| Capital Markets—1.4% | | | |
| Blackstone Holdings Finance Co. LLC, 6.625% Sr. Unsec. Nts., 8/15/192 | | | 614,000 | | | | 717,425 | | | |
| Carlyle Holdings II Finance LLC, 5.625% Sr. Sec. Nts., 3/30/432 | | | 243,000 | | | | 239,773 | | | |
| Deutsche Bank AG, 4.296% Jr. Sub. Nts., 5/24/284 | | | 484,000 | | | | 438,330 | | | |
| Goldman Sachs Capital I, 6.345% Sub. Nts., 2/15/34 | | | 469,000 | | | | 473,306 | | | |
| Goldman Sachs Group, Inc. (The), 2.90% Sr. Unsec. Nts., 7/19/18 | | | 814,000 | | | | 828,859 | | | |
| Lazard Group LLC, 4.25% Sr. Unsec. Nts., 11/14/20 | | | 297,000 | | | | 296,450 | | | |
| Morgan Stanley, 5% Sub. Nts., 11/24/25 | | | 465,000 | | | | 466,576 | | | |
| Northern Trust Corp., 3.95% Sub. Nts., 10/30/25 | | | 180,000 | | | | 175,482 | | | |
| Raymond James Financial, Inc., 5.625% Sr. Unsec. Unsub. Nts., 4/1/24 | | | 265,000 | | | | 278,101 | | | |
| | | | | | | | 3,914,302 | | | |
| Commercial Banks—3.0% | | | |
| Amsouth Bank NA, 5.20% Sub. Nts., 4/1/15 | | | 276,000 | | | | 289,198 | | | |
| | | | | | | | | | |
| | | Principal
Amount | | | Value | | | |
| Commercial Banks (Continued) | | | |
| Barclays Bank plc, 5.14% Sub. Nts., 10/14/20 | | $ | 460,000 | | | $ | 489,967 | | | |
| BPCE SA, 5.70% Sub. Nts., 10/22/232 | | | 465,000 | | | | 480,010 | | | |
| Commerzbank AG, 8.125% Sub. Nts., 9/19/232 | | | 458,000 | | | | 507,235 | | | |
| Credit Agricole SA, 6.637% Jr. Sub. Perpetual Bonds2,4,11 | | | 736,000 | | | | 739,650 | | | |
| HSBC Finance Capital Trust IX, 5.911% Unsec. Sub. Nts., 11/30/354 | | | 1,120,000 | | | | 1,159,200 | | | |
| Lloyds TSB Bank plc, 6.50% Unsec. Sub. Nts., 9/14/202 | | | 683,000 | | | | 776,585 | | | |
| PNC Financial Services Group, Inc. (The), 4.85% Jr. Sub. Perpetual Bonds, Series R4,11 | | | 496,000 | | | | 445,408 | | | |
| Rabobank Capital Funding Trust III, 5.254% Jr. Sub. Perpetual Bonds2,4,11 | | | 751,000 | | | | 786,672 | | | |
| Regions Bank, 7.50% Sub. Nts., 5/15/18 | | | 150,000 | | | | 177,868 | | | |
| Royal Bank of Scotland Group plc, 7.64% Jr. Sub. Perpetual Bonds, Series U4,11 | | | 500,000 | | | | 492,500 | | | |
| Santander Holdings USA, Inc., 3.45% Sr. Unsec. Nts., 8/27/18 | | | 166,000 | | | | 170,358 | | | |
| Santander UK plc, 5% Sub. Nts., 11/7/232 | | | 370,000 | | | | 371,504 | | | |
| Societe Generale SA, 5.922% Jr. Sub. Perpetual Bonds2,4,11 | | | 440,000 | | | | 461,843 | | | |
| SunTrust Banks, Inc., 3.60% Sr. Unsec. Nts., 4/15/16 | | | 212,000 | | | | 223,413 | | | |
| Wells Fargo & Co., 7.98% Jr. Sub. Perpetual Bonds, Series K4,11 | | | 327,000 | | | | 366,240 | | | |
| | | | | | | | 7,937,651 | | | |
| Consumer Finance—0.4% | | | |
| Ally Financial, Inc., 4.75% Sr. Unsec. Nts., 9/10/18 | | | 455,000 | | | | 477,750 | | | |
| Discover Financial Services, 3.85% Sr. Unsec. Unsub. Nts., 11/21/22 | | | 552,000 | | | | 523,563 | | | |
| | | | | | | | 1,001,313 | | | |
| Diversified Financial Services—1.5% | | | |
| ABN AMRO Bank NV, 2.50% Sr. Unsec. Nts., 10/30/182 | | | 750,000 | | | | 748,755 | | | |
| Citigroup, Inc., 6.675% Sub. Nts., 9/13/43 | | | 405,000 | | | | 466,106 | | | |
| ING Bank NV, 5.80% Sub. Nts., 9/25/232 | | | 371,000 | | | | 388,044 | | | |
| ING US, Inc., 5.65% Jr. Sub. Nts., 5/15/534 | | | 495,000 | | | | 481,511 | | | |
| Leucadia National Corp., 5.50% Sr. Unsec. Nts., 10/18/23 | | | 652,000 | | | | 651,838 | | | |
| Macquarie Bank Ltd., 6.625% Unsec. Sub. Nts., 4/7/212 | | | 736,000 | | | | 814,183 | | | |
| Merrill Lynch & Co., Inc., 7.75% Jr. Sub. Nts., 5/14/38 | | | 404,000 | | | | 521,692 | | | |
| | | | | | | | 4,072,129 | | | |
| Insurance—2.2% | | | |
| Aon plc, 4% Sr. Unsec. Nts., 11/27/23 | | | 741,000 | | | | 727,229 | | | |
| Arch Capital Group US, Inc., 5.144% Sr. Unsec. Nts., 11/1/43 | | | 419,000 | | | | 419,054 | | | |
| CNA Financial Corp.: | | | | | | | | | | |
| 5.75% Sr. Unsec. Unsub. Nts., 8/15/21 | | | 480,000 | | | | 537,964 | | | |
| 5.875% Sr. Unsec. Unsub. Nts., 8/15/20 | | | 169,000 | | | | 192,809 | | | |
| Five Corners Funding Trust, 4.419% Unsec. Nts., 11/15/232 | | | 374,000 | | | | 368,790 | | | |
| Genworth Holdings, Inc., 4.80% Sr. Unsec. Nts., 2/15/24 | | | 733,000 | | | | 724,283 | | | |
| Gulf South Pipeline Co. LP, 5.05% Sr. Unsec. Nts., 2/1/152 | | | 260,000 | | | | 271,089 | | | |
| Liberty Mutual Group, Inc., 4.25% Sr. Unsec. Nts., 6/15/232 | | | 380,000 | | | | 367,028 | | | |
| Lincoln National Corp., 6.05% Jr. Unsec. Sub. Nts., 4/20/674 | | | 811,000 | | | | 808,972 | | | |
| Marsh & McLennan Cos., Inc., 5.375% Sr. Unsec. Nts., 7/15/14 | | | 64,000 | | | | 65,550 | | | |
| Prudential Financial, Inc., 5.20% Jr. Sub. Nts., 3/15/444 | | | 331,000 | | | | 321,898 | | | |
| QBE Insurance Group Ltd., 2.40% Sr. Unsec. Nts., 5/1/182 | | | 575,000 | | | | 552,704 | | | |
| Swiss Re Capital I LP, 6.854% Jr. Sub. Perpetual Bonds2,4,11 | | | 780,000 | | | | 828,360 | | | |
| ZFS Finance USA Trust V, 6.50% Jr. Sub. Nts., 5/9/372,4 | | | 437,000 | | | | 467,590 | | | |
| | | | | | | 6,653,320 | | | |
12 OPPENHEIMER CAPITAL INCOME FUND/VA
| | | | | | | | | | |
| | | Principal
Amount | | | Value | | | |
| Real Estate Investment Trusts (REITs)—0.7% | | | |
| American Tower Corp.: | | | |
| 5.05% Sr. Unsec. Unsub. Nts., 9/1/20 | | $ | 285,000 | | | $ | 301,456 | | | |
| 7.00% Sr. Unsec. Nts., 10/15/17 | | | 294,000 | | | | 339,016 | | | |
| Corrections Corp. of America, 4.125% Sr. Unsec. Nts., 4/1/20 | | | 110,000 | | | | 108,350 | | | |
| Hospitality Properties Trust, 5.125% Sr. Unsec. Nts., 2/15/15 | | | 262,000 | | | | 268,035 | | | |
| Host Hotels & Resorts LP, 3.75% Sr. Unsec. Nts., 10/15/23 | | | 328,000 | | | | 304,225 | | | |
| National Retail Properties, Inc., 6.25% Sr. Unsec. Nts., 6/15/14 | | | 211,000 | | | | 215,951 | | | |
| ProLogis LP, 5.625% Sr. Unsec. Nts., 11/15/16 | | | 409,000 | | | | 455,399 | | | |
| | | | | | | | 1,992,432 | | | |
| Health Care—1.1% | | | |
| Biotechnology—0.3% | | | |
| Celgene Corp., 3.25% Sr. Unsec. Nts., 8/15/22 | | | 522,000 | | | | 494,371 | | | |
| Gilead Sciences, Inc., 5.65% Sr. Unsec. Unsub. Nts., 12/1/41 | | | 247,000 | | | | 275,032 | | | |
| | | | | | | | 769,403 | | | |
| Health Care Equipment & Supplies—0.3% | | | |
| Boston Scientific Corp., 4.125% Sr. Unsec. Nts., 10/1/23 | | | 465,000 | | | | 461,402 | | | |
| DENTSPLY International, Inc., 2.75% Sr. Unsec. Nts., 8/15/16 | | | 425,000 | | | | 437,558 | | | |
| | | | | | | | 898,960 | | | |
| Health Care Providers & Services—0.1% | | | |
| Fresenius Medical Care US Finance II, Inc., 5.875% Sr. Unsec. Nts., 1/31/222 | | | 181,000 | | | | 191,860 | | | |
| Life Sciences Tools & Services—0.1% | | | |
| Thermo Fisher Scientific, Inc.: | | | | | | | | | | |
| 4.15% Sr. Unsec. Nts., 2/1/24 | | | 392,000 | | | | 388,417 | | | |
| 5.30% Sr. Unsec. Nts., 2/1/44 | | | 165,000 | | | | 166,883 | | | |
| | | | | | | | 555,300 | | | |
| Pharmaceuticals—0.3% | | | |
| Hospira, Inc., 5.20% Sr. Unsec. Nts., 8/12/20 | | | 441,000 | | | | 457,657 | | | |
| Mallinckrodt International Finance SA, 3.50% Sr. Unsec. Unsub. Nts., 4/15/182 | | | 218,000 | | | | 213,969 | | | |
| Zoetis, Inc., 1.875% Sr. Unsec. Nts., 2/1/18 | | | 158,000 | | | | 156,784 | | | |
| | | | | | | | 828,410 | | | |
| Industrials—1.7% | | | |
| Aerospace & Defense—0.3% | | | |
| B/E Aerospace, Inc., 5.25% Sr. Unsec. Nts., 4/1/22 | | | 444,000 | | | | 452,880 | | | |
| Huntington Ingalls Industries, Inc., 7.125% Sr. Unsec. Unsub. Nts., 3/15/21 | | | 430,000 | | | | 474,075 | | | |
| | | | | | | | 926,955 | | | |
| Building Products—0.2% | | | |
| Owens Corning, 4.20% Sr. Unsec. Nts., 12/15/22 | | | 505,000 | | | | 482,398 | | | |
| Commercial Services & Supplies—0.2% | | | |
| Clean Harbors, Inc., 5.25% Sr. Unsec. Unsub. Nts., 8/1/20 | | | 468,000 | | | | 484,380 | | | |
| Industrial Conglomerates—0.2% | | | |
| General Electric Capital Corp., 5.25% Jr. Sub. Perpetual Bonds4,11 | | | 500,000 | | | | 471,250 | | | |
| Machinery—0.2% | | | |
| Crane Co., 4.45% Sr. Unsec. Nts., 12/15/23 | | | 234,000 | | | | 231,376 | | | |
| Ingersoll-Rand Global Holding Co. Ltd., 4.25% Sr. Unsec. Nts., 6/15/232 | | | 410,000 | | | | 400,589 | | | |
| | | | | | | | 631,965 | | | |
| Professional Services—0.2% | | | |
| Nielsen Finance LLC/Nielsen Finance Co., 4.50% Sr. Unsec. Nts., 10/1/20 | | | 470,000 | | | | 459,425 | | | |
| Road & Rail—0.2% | | | |
| Kansas City Southern Railway Co., 4.30% Sr. Unsec. Nts., 5/15/432 | | | 117,000 | | | | 102,128 | | | |
| Penske Truck Leasing Co. LP/PTL Finance Corp.: | | | | | | | | | | |
| 2.50% Sr. Unsec. Nts., 7/11/142 | | | 289,000 | | | | 291,390 | | | |
| 4.25% Sr. Unsec. Nts., 1/17/232 | | | 250,000 | | | | 243,561 | | | |
| | | | | | | 637,079 | | | |
| | | | | | | | |
| | | Principal
Amount | | | Value | |
| Trading Companies & Distributors—0.2% | |
| International Lease Finance Corp., 5.875% Sr. Unsec. Unsub. Nts., 4/1/19 | | $ | 437,000 | | | $ | 467,590 | |
| Information Technology—1.0% | |
| Computers & Peripherals—0.3% | |
Hewlett-Packard Co.: | |
2.65% Sr. Unsec. Unsub. Nts., 6/1/16 | | | 443,000 | | | | 456,698 | |
| 4.75% Sr. Unsec. Nts., 6/2/14 | | | 144,000 | | | | 146,321 | |
| Seagate HDD Cayman, 3.75% Sr. Unsec. Nts., 11/15/182 | | | 410,000 | | | | 415,638 | |
| | | | | | | | 1,018,657 | |
| Electronic Equipment, Instruments, & Components—0.4% | |
| Amphenol Corp., 4.75% Sr. Unsec. Nts., 11/15/14 | | | 79,000 | | | | 81,648 | |
| Arrow Electronics, Inc., 5.125% Sr. Unsec. Unsub. Nts., 3/1/21 | | | 525,000 | | | | 537,397 | |
| Avnet, Inc., 4.875% Sr. Unsec. Unsub. Nts., 12/1/22 | | | 550,000 | | | | 552,492 | |
| | | | | | | | 1,171,537 | |
| IT Services—0.1% | |
| Fidelity National Information Services, Inc., 3.50% Sr. Unsec. Nts., 4/15/23 | | | 244,000 | | | | 222,486 | |
| Office Electronics—0.2% | |
| Xerox Corp., 4.25% Sr. Unsec. Nts., 2/15/15 | | | 449,000 | | | | 465,933 | |
| Materials—2.1% | |
| Chemicals—0.4% | |
| LYB International Finance BV, 5.25% Sr. Unsec. Nts., 7/15/43 | | | 144,000 | | | | 144,789 | |
| Rockwood Specialties Group, Inc., 4.625% Sr. Unsec. Nts., 10/15/20 | | | 450,000 | | | | 461,812 | |
| RPM International, Inc., 3.45% Sr. Unsec. Unsub. Nts., 11/15/22 | | | 234,000 | | | | 213,756 | |
| Sherwin-Williams Co. (The), 4% Sr. Unsec. Unsub. Nts., 12/15/42 | | | 268,000 | | | | 230,028 | |
| | | | | | | | 1,050,385 | |
| Construction Materials—0.2% | |
| CRH America, Inc., 4.125% Sr. Unsec. Nts., 1/15/16 | | | 440,000 | | | | 464,478 | |
| Containers & Packaging—0.5% | |
| Crown Americas LLC/Crown Americas Capital Corp. III, 6.25% Sr. Unsec. Nts., 2/1/21 | | | 428,000 | | | | 466,520 | |
| Packaging Corp. of America, 4.50% Sr. Unsec. Nts., 11/1/23 | | | 358,000 | | | | 359,067 | |
| Rock Tenn Co., 3.50% Sr. Unsec. Unsub. Nts., 3/1/20 | | | 464,000 | | | | 456,518 | |
| | | | | | | | 1,282,105 | |
| Metals & Mining—0.8% | |
| Allegheny Technologies, Inc., 5.95% Sr. Unsec. Unsub. Nts., 1/15/21 | | | 282,000 | | | | 292,618 | |
| Barrick Gold Corp., 3.85% Sr. Unsec. Nts., 4/1/22 | | | 220,000 | | | | 198,200 | |
| Carpenter Technology Corp., 4.45% Sr. Unsec. Unsub. Nts., 3/1/23 | | | 159,000 | | | | 152,611 | |
| Cliffs Natural Resources, Inc., 3.95% Sr. Unsec. Unsub. Nts., 1/15/18 | | | 440,000 | | | | 444,531 | |
| Freeport-McMoRan Copper & Gold, Inc.: | | | | | | | | |
1.40% Sr. Unsec. Nts., 2/13/15 | | | 464,000 | | | | 466,718 | |
| 3.875% Sr. Unsec. Nts., 3/15/23 | | | 485,000 | | | | 458,794 | |
Glencore Canada Corp.: | | | | | | | | |
5.375% Sr. Unsec. Unsub. Nts., 6/1/15 | | | 135,000 | | | | 141,579 | |
| 6.00% Sr. Unsec. Unsub. Nts., 10/15/15 | | | 264,000 | | | | 285,998 | |
| | | | | | | | 2,441,049 | |
| Paper & Forest Products—0.2% | |
| Georgia-Pacific LLC, 3.734% Sr. Unsec. Nts., 7/15/232 | | | 350,000 | | | | 336,989 | |
| International Paper Co., 6% Sr. Unsec. Unsub. Nts., 11/15/41 | | | 170,000 | | | | 184,653 | |
| | | | | | | | 521,642 | |
| Telecommunication Services—1.4% | |
| Diversified Telecommunication Services—1.2% | |
| British Telecommunications plc, 9.625% Sr. Unsec. Nts., 12/15/30 | | | 293,000 | | | | 437,295 | |
| Frontier Communications Corp., 8.50% Sr. Unsec. Nts., 4/15/20 | | | 405,000 | | | | 455,625 | |
| Koninklijke KPN NV, 7% Sr. Sub. Nts., 3/28/732,4 | | | 451,000 | | | | 457,272 | |
13 OPPENHEIMER CAPITAL INCOME FUND/VA
STATEMENTOF INVESTMENTS Continued
| | | | | | | | | | |
| | | Principal
Amount | | | Value | | | |
Diversified Telecommunication Services (Continued) | | | |
| MetroPCS Wireless, Inc., 6.25% Sr. Unsec. Unsub. Nts., 4/1/212 | | $ | 455,000 | | | $ | 473,769 | | | |
| Telecom Italia Capital SA, 7.721% Sr. Unsec. Unsub. Nts., 6/4/38 | | | 277,000 | | | | 278,385 | | | |
| Telefonica Emisiones SAU, 7.045% Sr. Unsec. Unsub. Nts., 6/20/36 | | | 288,000 | | | | 318,042 | | | |
Verizon Communications, Inc.: | | | | | | | | | | |
| 6.40% Sr. Unsec. Nts., 2/15/38 | | | 223,000 | | | | 250,472 | | | |
| 6.55% Sr. Unsec. Nts., 9/15/43 | | | 566,000 | | | | 662,343 | | | |
| | | | | | | | 3,333,203 | | | |
Wireless Telecommunication Services—0.2% | | | |
| America Movil SAB de CV, 4.375% Sr. Unsec. Unsub. Nts., 7/16/42 | | | 361,000 | | | | 300,679 | | | |
| CC Holdings GS V LLC/Crown Castle GS III Corp., 3.849% Sr. Sec. Nts., 4/15/23 | | | 255,000 | | | | 238,788 | | | |
Vodafone Group plc: | | | | | | | | | | |
| 4.375% Sr. Unsec. Unsub. Nts., 2/19/43 | | | 142,000 | | | | 122,736 | | | |
| 6.25% Sr. Unsec. Nts., 11/30/32 | | | 150,000 | | | | 164,168 | | | |
| | | | | | | | 826,371 | | | |
| Utilities—0.9% | | | |
| Electric Utilities—0.7% | | | |
| Edison International, 3.75% Sr. Unsec. Unsub. Nts., 9/15/17 | | | 491,000 | | | | 514,807 | | | |
| Exelon Generation Co. LLC, 4.25% Sr. Unsec. Unsub. Nts., 6/15/22 | | | 257,000 | | | | 246,385 | | | |
| ITC Holdings Corp., 5.30% Sr. Unsec. Nts., 7/1/43 | | | 203,000 | | | | 199,629 | | | |
| Jersey Central Power & Light Co., 4.70% Sr. Unsec. Nts., 4/1/242 | | | 237,000 | | | | 234,667 | | | |
| PPL Capital Funding, Inc., 3.50% Sr. Unsec. Unsub. Nts., 12/1/22 | | | 223,000 | | | | 210,674 | | | |
| PPL WEM Holdings plc, 5.375% Sr. Unsec. Unsub. Nts., 5/1/212 | | | 290,000 | | | | 308,438 | | | |
| | | | | | | 1,714,600 | | | |
| | | | | | | | | | |
| | | | | | | | |
| | | Principal
Amount | | | Value | |
| |
Energy Traders—0.1% | |
| |
| Dayton Power & Light Co., 1.875% Sr. Sec. Nts., 9/15/162 | | $ | 329,000 | | | $ | 331,882 | |
| |
| Multi-Utilities—0.1% | |
| |
| CMS Energy Corp., 5.05% Sr. Unsec. Unsub. Nts., 3/15/22 | | | 172,000 | | | | 185,742 | |
| | | | | | | | |
| Total Non-Convertible Corporate Bonds and Notes (Cost $70,219,747) | | | | | | | 70,837,007 | |
| | |
| | | Shares | | | | |
| |
Investment Company—7.0% | |
| Oppenheimer Institutional Money Market Fund, Cl. E, 0.09%12,13 (Cost $19,917,607) | | | 19,917,607 | | | | 19,917,607 | |
| |
| Total Investments, at Value (Cost $277,456,360) | | | 103.7% | | | | 293,696,704 | |
| | | | |
| Liabilities in Excess of Other Assets | | | (3.7) | | | | (10,398,364) | |
| | | | |
| Net Assets | | | 100.0% | | | $ | 283,298,340 | |
| | | | |
Footnotes to Statement of Investments
1. Non-income producing security.
2. Represents securities sold under Rule 144A, which are exempt from registration under the Securities Act of 1933, as amended. These securities have been determined to be liquid under guidelines established by the Board of Trustees. These securities amount to $32,641,058 or 11.52% of the Fund’s net assets as of December 31, 2013.
3. Restricted security. The aggregate value of restricted securities as of December 31, 2013 was $456,240, which represents 0.16% of the Fund’s net assets. See Note 7 of the accompanying Notes. Information concerning restricted securities is as follows:
| | | | | | | | | | | | | | | | |
| Security | | Acquisition
Dates | | | Cost | | | Value | | | Unrealized Appreciation/ (Depreciation) | |
| |
| Credit Acceptance Auto Loan Trust, Series 2013-2A, Cl. B, 2.26%, 10/15/21 | | | 10/22/13 | | | $ | 309,913 | | | $ | 309,308 | | | $ | (605) | |
| Morgan Stanley Reremic Trust, Series 2012-R3, Cl. 1B, 2.065%, 11/26/36 | | | 10/24/12 | | | | 131,537 | | | | 145,477 | | | | 13,940 | |
| Santander Drive Auto Receivables Trust, Series 2011-S2A, Cl. D, 3.35%, 6/15/17 | | | 5/19/11-4/9/13 | | | | 1,454 | | | | 1,455 | | | | 1 | |
| | | | | | | | |
| | | | | | $ | 442,904 | | | $ | 456,240 | | | $ | 13,336 | |
| | | | | | | | |
4. Represents the current interest rate for a variable or increasing rate security.
5. Interest-Only Strips represent the right to receive the monthly interest payments on an underlying pool of mortgage loans. These securities typically decline in price as interest rates decline. Most other fixed income securities increase in price when interest rates decline. The principal amount of the underlying pool represents the notional amount on which current interest is calculated. The price of these securities is typically more sensitive to changes in prepayment rates than traditional mortgage-backed securities (for example, GNMA pass-throughs). Interest rates disclosed represent current yields based upon the current cost basis and estimated timing and amount of future cash flows. These securities amount to $2,502,370 or 0.88% of the Fund’s net assets as of December 31, 2013.
6. Interest rate is less than 0.0005%.
7. Principal-Only Strips represent the right to receive the monthly principal payments on an underlying pool of mortgage loans. The value of these securities generally increases as interest rates decline and prepayment rates rise. The price of these securities is typically more volatile than that of coupon-bearing bonds of the same maturity. Interest rates disclosed represent current yields based upon the current cost basis and estimated timing of future cash flows. These securities amount to $130,462 or 0.05% of the Fund’s net assets as of December 31, 2013.
8. The current amortization rate of the security’s cost basis exceeds the future interest payments currently estimated to be received. Both the amortization rate and interest payments are contingent on future mortgage pre-payment speeds and are therefore subject to change.
9. All or a portion of the security position is when-issued or delayed delivery to be delivered and settled after December 31, 2013. See Note 1 of the accompanying Notes.
14 OPPENHEIMER CAPITAL INCOME FUND/VA
| | |
Footnotes to Statement of Investments (Continued) |
10. All or a portion of the security position is held in accounts at a futures clearing merchant and pledged to cover margin requirements on open futures contracts and written options on futures, if applicable. The aggregate market value of such securities is $584,283. See Note 6 of the accompanying Notes.
11. This bond has no contractual maturity date, is not redeemable and contractually pays an indefinite stream of interest. Rate reported represents the current interest rate for this variable rate security.
12. Is or was an affiliate, as defined in the Investment Company Act of 1940, at or during the period ended December 31, 2013, by virtue of the Fund owning at least 5% of the voting securities of the issuer or as a result of the Fund and the issuer having the same investment adviser. Transactions during the period in which the issuer was an affiliate are as follows:
| | | | | | | | | | | | | | | | |
| | | Shares
December 31, 2012 | | | Gross
Additions | | | Gross
Reductions | | | Shares
December 31, 2013 | |
Oppenheimer Institutional Money Market Fund, Cl. E | | | 19,691,265 | | | | 42,627,851 | | | | 42,401,509 | | | | 19,917,607 | |
| | | | |
| | | | | | | | | Value | | | Income | |
Oppenheimer Institutional Money Market Fund, Cl. E | | | | | | | | | | $ | 19,917,607 | | | $ | 24,668 | |
| 13. | Rate shown is the 7-day yield as of December 31, 2013. |
|
Futures Contracts as of December 31, 2013: |
| | | | | | | | | | | | | | | | | | | | |
| Description | | Exchange | | | Buy/Sell | | | Expiration Date | | | Number of Contracts | | | Unrealized Appreciation
(Depreciation) | |
U.S. Treasury Long Bonds | | | CBT | | | | Buy | | | | 3/20/14 | | | | 41 | | | $ | (33,241) | |
U.S. Treasury Nts., 2 yr. | | | CBT | | | | Buy | | | | 3/31/14 | | | | 40 | | | | (12,447) | |
U.S. Treasury Nts., 5 yr. | | | CBT | | | | Sell | | | | 3/31/14 | | | | 87 | | | | 133,634 | |
U.S. Treasury Nts., 10 yr. | | | CBT | | | | Buy | | | | 3/20/14 | | | | 40 | | | | (52,824) | |
U.S. Treasury Ultra Bonds | | | CBT | | | | Buy | | | | 3/20/14 | | | | 34 | | | | (90,553) | |
| | | | | | | | | | | | | | | | | | | | |
| | | | | | | | | | | | | | | | | | $ | (55,431) | |
| | | | | | | | | | | | | | | | | | | | |
Glossary:
| | | | |
| Exchange Abbreviations: | | | | |
| CBT | | Chicago Board of Trade | | |
See accompanying Notes to Financial Statements.
15 OPPENHEIMER CAPITAL INCOME FUND/VA
| | |
�� STATEMENT OF ASSETS AND LIABILITIES December 31, 2013 |
| | | | |
| |
Assets | | | | |
Investments, at value—see accompanying statement of investments: | | | | |
Unaffiliated companies (cost $257,538,753) | | $ | 273,779,097 | |
Affiliated companies (cost $19,917,607) | | | 19,917,607 | |
| | | | |
| | | 293,696,704 | |
| |
Cash | | | 29,093,735 | |
| |
Receivables and other assets: | | | | |
Investments sold (including $7,647,296 sold on a when-issued or delayed delivery basis) | | | 8,709,512 | |
Interest, dividends and principal paydowns | | | 1,203,496 | |
Variation margin receivable | | | 8,156 | |
Other | | | 37,015 | |
| | | | |
Total assets | | | 332,748,618 | |
|
| |
Liabilities | | | | |
Payables and other liabilities: | | | | |
Investments purchased (including $48,496,502 purchased on a when-issued or delayed delivery basis) | | | 49,154,122 | |
Shares of beneficial interest redeemed | | | 119,536 | |
Variation margin payable | | | 53,719 | |
Trustees’ compensation | | | 32,664 | |
Transfer and shareholder servicing agent fees | | | 24,047 | |
Distribution and service plan fees | | | 15,343 | |
Shareholder communications | | | 13,202 | |
Other | | | 37,645 | |
| | | | |
Total liabilities | | | 49,450,278 | |
|
| |
Net Assets | | $ | 283,298,340 | |
| | | | |
|
| |
Composition of Net Assets | | | | |
Par value of shares of beneficial interest | | $ | 20,539 | |
| |
Additional paid-in capital | | | 294,341,156 | |
| |
Accumulated net investment income | | | 5,608,389 | |
| |
Accumulated net realized loss on investments and foreign currency transactions | | | (32,857,045) | |
| |
Net unrealized appreciation on investments and translation of assets and liabilities denominated in foreign currencies | | | 16,185,301 | |
| | | | |
Net Assets | | $ | 283,298,340 | |
| | | | |
|
| |
Net Asset Value Per Share | | | | |
Non-Service Shares: | | | | |
Net asset value, redemption price (excludes applicable contingent deferred sales charge) and offering price per share (based on net assets of $213,696,987 and 15,444,685 shares of beneficial interest outstanding) | | | $13.84 | |
| |
| |
Service Shares: | | | | |
Net asset value, redemption price (excludes applicable contingent deferred sales charge) and offering price per share (based on net assets of $69,601,353 and 5,094,693 shares of beneficial interest outstanding) | | | $13.66 | |
See accompanying Notes to Financial Statements.
16 OPPENHEIMER CAPITAL INCOME FUND/VA
STATEMENTOF OPERATIONS For the Year Ended December 31, 2013
| | | | |
| |
Investment Income | | | | |
Interest | | $ | 5,199,154 | |
| |
Dividends: | | | | |
Unaffiliated companies (net of foreign withholding taxes of $14,447) | | | 2,157,428 | |
Affiliated companies | | | 24,668 | |
| | | | |
Total investment income | | | 7,381,250 | |
| |
Expenses | | | | |
Management fees | | | 2,156,897 | |
| |
Distribution and service plan fees: | | | | |
Service shares | | | 181,283 | |
| |
Transfer and shareholder servicing agent fees: | | | | |
Non-Service shares | | | 218,668 | |
Service shares | | | 72,521 | |
| |
Shareholder communications: | | | | |
Non-Service shares | | | 35,208 | |
Service shares | | | 11,656 | |
| |
Custodian fees and expenses | | | 31,298 | |
| |
Trustees’ compensation | | | 16,208 | |
| |
Other | | | 55,800 | |
| | | | |
Total expenses | | | 2,779,539 | |
Less waivers and reimbursements of expenses | | | (646,006) | |
| | | | |
Net expenses | | | 2,133,533 | |
| |
Net Investment Income | | | 5,247,717 | |
| |
Realized and Unrealized Gain (Loss) | | | | |
Net realized gain (loss) on: | | | | |
Investments from unaffiliated companies | | | 39,702,555 | |
Closing and expiration of futures contracts | | | (1,863,466) | |
Foreign currency transactions | | | 4,746 | |
Swap contracts | | | (129,384) | |
| | | | |
Net realized gain | | | 37,714,451 | |
| |
Net change in unrealized appreciation/depreciation on: | | | | |
Investments | | | (7,250,252) | |
Translation of assets and liabilities denominated in foreign currencies | | | 107,775 | |
Futures contracts | | | (56,087) | |
| | | | |
Net change in unrealized appreciation/depreciation | | | (7,198,564) | |
| |
Net Increase in Net Assets Resulting from Operations | | $ | 35,763,604 | |
| | | | |
See accompanying Notes to Financial Statements.
17 OPPENHEIMER CAPITAL INCOME FUND/VA
STATEMENTSOF CHANGES IN NET ASSETS
| | | | | | | | |
| | | Year Ended
December 31, 2013 | | | Year Ended
December 31, 2012 | |
| |
Operations | | | | | | | | |
Net investment income | | $ | 5,247,717 | | | $ | 6,382,885 | |
| |
Net realized gain | | | 37,714,451 | | | | 10,623,927 | |
| |
Net change in unrealized appreciation/depreciation | | | (7,198,564) | | | | 11,671,534 | |
| | | | | | | | |
Net increase in net assets resulting from operations | | | 35,763,604 | | | | 28,678,346 | |
|
| |
Dividends and/or Distributions to Shareholders | | | | | | | | |
Dividends from net investment income: | | | | | | | | |
Non-Service shares | | | (5,107,178) | | | | (3,027,836) | |
Service shares | | | (1,549,784) | | | | (910,776) | |
| | | | |
| | | (6,656,962) | | | | (3,938,612) | |
|
| |
Beneficial Interest Transactions | | | | | | | | |
Net increase (decrease) in net assets resulting from beneficial interest transactions: | | | | | | | | |
Non-Service shares | | | (26,201,767) | | | | 72,773,444 | |
Service shares | | | (10,510,886) | | | | (12,542,888) | |
| | | | | | | | |
| | | (36,712,653) | | | | 60,230,556 | |
|
| |
Net Assets | | | | | | | | |
Total increase (decrease) | | | (7,606,011) | | | | 84,970,290 | |
| |
Beginning of period | | | 290,904,351 | | | | 205,934,061 | |
| | | | | | | | |
End of period (including accumulated net investment income of $5,608,389 and $6,595,479, respectively) | | $ | 283,298,340 | | | $ | 290,904,351 | |
| | | | |
See accompanying Notes to Financial Statements.
18 OPPENHEIMER CAPITAL INCOME FUND/VA
FINANCIAL HIGHLIGHTS
| | | | | | | | | | | | | | | | | | | | |
| Non-Service Shares | | Year Ended December 31, 2013 | | | Year Ended December 31, 2012 | | | Year Ended December 30, 20111 | | | Year Ended December 31, 2010 | | | Year Ended December 31, 2009 | |
| |
Per Share Operating Data | | | | | | | | | | | | | | | | | | | | |
Net asset value, beginning of period | | $ | 12.52 | | | $ | 11.30 | | | $ | 11.47 | | | $ | 10.30 �� | | | $ | 8.45 | |
| |
Income (loss) from investment operations: | | | | | | | | | | | | | | | | | | | | |
Net investment income2 | | | 0.25 | | | | 0.29 | | | | 0.20 | | | | 0.23 | | | | 0.25 | |
Net realized and unrealized gain (loss) | | | 1.38 | | | | 1.09 | | | | (0.11) | | | | 1.09 | | | | 1.60 | |
| | | | |
Total from investment operations | | | 1.63 | | | | 1.38 | | | | 0.09 | | | | 1.32 | | | | 1.85 | |
| |
Dividends and/or distributions to shareholders: | | | | | | | | | | | | | | | | | | | | |
Dividends from net investment income | | | (0.31) | | | | (0.16) | | | | (0.26) | | | | (0.15) | | | | 0.00 | |
| |
Net asset value, end of period | | $ | 13.84 | | | $ | 12.52 | | | $ | 11.30 | | | $ | 11.47 | | | $ | 10.30 | |
| | | | |
| |
Total Return, at Net Asset Value3 | | | 13.17% | | | | 12.34% | | | | 0.72% | | | | 12.91% | | | | 21.89% | |
| |
Ratios/Supplemental Data | | | | | | | | | | | | | | | | | | | | |
Net assets, end of period (in thousands) | | $ | 213,697 | | | $ | 218,032 | | | $ | 128,383 | | | $ | 150,622 | | | $ | 159,797 | |
| |
Average net assets (in thousands) | | $ | 218,090 | | | $ | 191,416 | | | $ | 141,848 | | | $ | 151,620 | | | $ | 159,013 | |
| |
Ratios to average net assets:4 | | | | | | | | | | | | | | | | | | | | |
Net investment income | | | 1.87% | | | | 2.46% | | | | 1.70% | | | | 2.13% | | | | 2.71% | |
Total expenses5 | | | 0.89% | | | | 0.90% | | | | 0.91% | | | | 0.91% | | | | 0.89% | |
| Expenses after payments, waivers and/or reimbursements and reduction to custodian expenses | | | 0.66% | | | | 0.66% | | | | 0.67% | | | | 0.65% | | | | 0.60% | |
| |
Portfolio turnover rate6 | | | 187% | | | | 110% | | | | 102% | | | | 54% | | | | 87% | |
1. December 30, 2011 represents the last business day of the Fund’s reporting period.
2. Per share amounts calculated based on the average shares outstanding during the period.
3. Assumes an initial investment on the business day before the first day of the fiscal period, with all dividends and distributions reinvested in additional shares on the reinvestment date, and redemption at the net asset value calculated on the last business day of the fiscal period. Total returns are not annualized for periods less than one full year. Total return information does not reflect expenses that apply at the separate account level or to related insurance products. Inclusion of these charges would reduce the total return figures for all periods shown. Returns do not reflect the deduction of taxes that a shareholder would pay on fund distributions or the redemption of fund shares.
4. Annualized for periods less than one full year.
5. Total expenses including indirect expenses from affiliated fund were as follows:
| | | | | | | | | | |
| | Year Ended December 31, 2013 | | | 0 .90% | | | | | |
| | Year Ended December 31, 2012 | | | 0 .91% | | | | | |
| | Year Ended December 30, 2011 | | | 0 .93% | | | | | |
| | Year Ended December 31, 2010 | | | 0 .92% | | | | | |
| | Year Ended December 31, 2009 | | | 0 .91% | | | | | |
| 6. The portfolio turnover rate excludes purchase and sale transactions of To Be Announced (TBA) mortgage-related securities as follows: |
| | | | | Purchase Transactions | | | Sale Transactions | | |
| | | | |
| | Year Ended December 31, 2013 | | | $794,398,216 | | | $800,879,825 | | |
| | Year Ended December 31, 2012 | | | $555,111,600 | | | $549,805,766 | | |
| | Year Ended December 30, 2011 | | | $450,804,195 | | | $453,759,282 | | |
| | Year Ended December 31, 2010 | | | $412,930,431 | | | $414,511,903 | | |
| | Year Ended December 31, 2009 | | | $504,698,365 | | | $520,212,670 | | |
See accompanying Notes to Financial Statements.
19 OPPENHEIMER CAPITAL INCOME FUND/VA
FINANCIAL HIGHLIGHTS
| | | | | | | | | | | | | | | | | | | | |
| Service Shares | | Year Ended
December 31, 2013 | | | Year Ended
December 31,
2012 | | | Year Ended
December 30,
20111 | | | Year Ended
December 31,
2010 | | | Year Ended
December 31,
2009 | |
| |
Per Share Operating Data | | | | | | | | | | | | | | | | | | | | |
Net asset value, beginning of period | | $ | 12.37 | | | $ | 11.17 | | | $ | 11.35 | | | $ | 10.19 | | | $ | 8.38 | |
| |
Income (loss) from investment operations: | | | | | | | | | | | | | | | | | | | | |
Net investment income2 | | | 0.21 | | | | 0.26 | | | | 0.16 | | | | 0.20 | | | | 0.22 | |
Net realized and unrealized gain (loss) | | | 1.36 | | | | 1.08 | | | | (0.11) | | | | 1.08 | | | | 1.59 | |
| | | | |
Total from investment operations | | | 1.57 | | | | 1.34 | | | | 0.05 | | | | 1.28 | | | | 1.81 | |
| |
Dividends and/or distributions to shareholders: | | | | | | | | | | | | | | | | | | | | |
Dividends from net investment income | | | (0.28) | | | | (0.14) | | | | (0.23) | | | | (0.12) | | | | 0.00 | |
| |
Net asset value, end of period | | $ | 13.66 | | | $ | 12.37 | | | $ | 11.17 | | | $ | 11.35 | | | $ | 10.19 | |
| | | | |
| |
Total Return, at Net Asset Value3 | | | 12.83% | | | | 12.11% | | | | 0.38% | | | | 12.68% | | | | 21.60% | |
| |
Ratios/Supplemental Data | | | | | | | | | | | | | | | | | | | | |
Net assets, end of period (in thousands) | | $ | 69,601 | | | $ | 72,872 | | | $ | 77,551 | | | $ | 89,580 | | | $ | 88,746 | |
| |
Average net assets (in thousands) | | $ | 72,332 | | | $ | 76,257 | | | $ | 85,157 | | | $ | 87,280 | | | $ | 77,101 | |
| |
Ratios to average net assets:4 | | | | | | | | | | | | | | | | | | | | |
Net investment income | | | 1.62% | | | | 2.18% | | | | 1.45% | | | | 1.87% | | | | 2.42% | |
Total expenses5 | | | 1.15% | | | | 1.16% | | | | 1.16% | | | | 1.16% | | | | 1.15% | |
| Expenses after payments, waivers and/or reimbursements and reduction to custodian expenses | | | 0.92% | | | | 0.92% | | | | 0.92% | | | | 0.90% | | | | 0.85% | |
| |
Portfolio turnover rate6 | | | 187% | | | | 110% | | | | 102% | | | | 54% | | | | 87% | |
1. December 30, 2011 represents the last business day of the Fund’s reporting period.
2. Per share amounts calculated based on the average shares outstanding during the period.
3. Assumes an initial investment on the business day before the first day of the fiscal period, with all dividends and distributions reinvested in additional shares on the reinvestment date, and redemption at the net asset value calculated on the last business day of the fiscal period. Total returns are not annualized for periods less than one full year. Total return information does not reflect expenses that apply at the separate account level or to related insurance products. Inclusion of these charges would reduce the total return figures for all periods shown. Returns do not reflect the deduction of taxes that a shareholder would pay on fund distributions or the redemption of fund shares.
4. Annualized for periods less than one full year.
5. Total expenses including indirect expenses from affiliated fund were as follows:
| | | | | | | | | | |
| | Year Ended December 31, 2013 | | | 1 .16% | | | | | |
| | Year Ended December 31, 2012 | | | 1 .17% | | | | | |
| | Year Ended December 30, 2011 | | | 1 .18% | | | | | |
| | Year Ended December 31, 2010 | | | 1 .17% | | | | | |
| | Year Ended December 31, 2009 | | | 1 .17% | | | | | |
| 6. The portfolio turnover rate excludes purchase and sale transactions of To Be Announced (TBA) mortgage-related securities as follows: |
| | | | | Purchase Transactions | | | Sale Transactions | | |
| | | | |
| | Year Ended December 31, 2013 | | | $794,398,216 | | | $800,879,825 | | |
| | Year Ended December 31, 2012 | | | $555,111,600 | | | $549,805,766 | | |
| | Year Ended December 30, 2011 | | | $450,804,195 | | | $453,759,282 | | |
| | Year Ended December 31, 2010 | | | $412,930,431 | | | $414,511,903 | | |
| | Year Ended December 31, 2009 | | | $504,698,365 | | | $520,212,670 | | |
See accompanying Notes to Financial Statements.
20 OPPENHEIMER CAPITAL INCOME FUND/VA
NOTESTO FINANCIAL STATEMENTS December 31, 2013
1. Significant Accounting Policies
Oppenheimer Capital Income Fund/VA (the “Fund”), formerly Oppenheimer Balanced Fund/VA, is a separate series of Oppenheimer Variable Account Funds, a diversified open-end management investment company registered under the Investment Company Act of 1940, as amended. The Fund’s investment objective is to seek total return. The Fund’s investment adviser is OFI Global Asset Management, Inc. (“OFI Global” or the “Manager”), a wholly-owned subsidiary of OppenheimerFunds, Inc. (“OFI” or the “Sub-Adviser”). The Manager has entered into a sub-advisory agreement with OFI. Shares of the Fund are sold only to separate accounts of life insurance companies.
The Fund offers two classes of shares. Both classes are sold at their offering price, which is the net asset value per share, to separate investment accounts of participating insurance companies as an underlying investment for variable life insurance policies, variable annuity contracts or other investment products. The class of shares designated as Service shares is subject to a distribution and service plan. Both classes of shares have identical rights and voting privileges with respect to the Fund in general and exclusive voting rights on matters that affect that class alone. Earnings, net assets and net asset value per share may differ due to each class having its own expenses, such as transfer and shareholder servicing agent fees and shareholder communications, directly attributable to that class.
The following is a summary of significant accounting policies consistently followed by the Fund.
Securities on a When-Issued or Delayed Delivery Basis. The Fund may purchase securities on a “when-issued” basis, and may purchase or sell securities on a “delayed delivery” basis. “When-issued” or “delayed delivery” refers to securities whose terms and indenture are available and for which a market exists, but which are not available for immediate delivery. Delivery and payment for securities that have been purchased by the Fund on a when-issued basis normally takes place within six months and possibly as long as two years or more after the trade date. During this period, such securities do not earn interest, are subject to market fluctuation and may increase or decrease in value prior to their delivery. The purchase of securities on a when-issued basis may increase the volatility of the Fund’s net asset value to the extent the Fund executes such transactions while remaining substantially fully invested. When the Fund engages in when-issued or delayed delivery transactions, it relies on the buyer or seller, as the case may be, to complete the transaction. Their failure to do so may cause the Fund to lose the opportunity to obtain or dispose of the security at a price and yield it considers advantageous. The Fund may also sell securities that it purchased on a when-issued basis or forward commitment prior to settlement of the original purchase.
As of December 31, 2013, the Fund had purchased securities issued on a when-issued or delayed delivery basis and sold securities issued on a delayed delivery basis as follows:
| | | | |
| | | When-Issued or
Delayed Delivery
Basis Transactions | |
| |
Purchased securities | | | $48,496,502 | |
Sold securities | | | 7,647,296 | |
The Fund may enter into “forward roll” transactions with respect to mortgage-related securities. In this type of transaction, the Fund sells a mortgage-related security to a buyer and simultaneously agrees to repurchase a similar security (same type, coupon and maturity) at a later date at a set price. During the period between the sale and the repurchase, the Fund will not be entitled to receive interest and principal payments on the securities that have been sold. The Fund records the incremental difference between the forward purchase and sale of each forward roll as realized gain (loss) on investments or as fee income in the case of such transactions that have an associated fee in lieu of a difference in the forward purchase and sale price.
Forward roll transactions may be deemed to entail embedded leverage since the Fund purchases mortgage-related securities with extended settlement dates rather than paying for the securities under a normal settlement cycle. This embedded leverage increases the Fund’s market value of investments relative to its net assets which can incrementally increase the volatility of the Fund’s performance. Forward roll transactions can be replicated over multiple settlement periods.
Risks of entering into forward roll transactions include the potential inability of the counterparty to meet the terms of the agreement; the potential of the Fund to receive inferior securities at redelivery as compared to the securities sold to the counterparty; and counterparty credit risk.
Investment in Oppenheimer Institutional Money Market Fund. The Fund is permitted to invest daily available cash balances in an affiliated money market fund. The Fund may invest the available cash in Class E shares of Oppenheimer Institutional Money Market Fund (“IMMF”) to seek current income while preserving liquidity. IMMF is a registered open-end management investment company, regulated as a money market fund under the Investment Company Act of 1940, as amended. The Manager is the investment adviser of IMMF, and the Sub-Adviser provides investment and related advisory services to IMMF. When applicable, the Fund’s investment in IMMF is included in the Statement of Investments. Shares of IMMF are valued at their net asset value per share. As a shareholder, the Fund is subject to its proportional share of IMMF’s Class E expenses, including its management fee. The Manager will waive fees and/or reimburse Fund expenses in an amount equal to the indirect management fees incurred through the Fund’s investment in IMMF.
Foreign Currency Translation. The Fund’s accounting records are maintained in U.S. dollars. The values of securities denominated in foreign currencies and amounts related to the purchase and sale of foreign securities and foreign investment income are translated into U.S. dollars as of the close of the New York Stock Exchange (the “Exchange”), normally 4:00 P.M. Eastern time, on each day the Exchange is open for trading. Foreign exchange rates may be valued primarily using a reliable bank, dealer or service authorized by the Board of Trustees.
21 OPPENHEIMER CAPITAL INCOME FUND/VA
NOTESTO FINANCIAL STATEMENTS Continued
1. Significant Accounting Policies (Continued)
Reported net realized gains and losses from foreign currency transactions arise from sales of portfolio securities, sales and maturities of short-term securities, sales of foreign currencies, exchange rate fluctuations between the trade and settlement dates on securities transactions, and the difference between the amounts of dividends, interest, and foreign withholding taxes recorded on the Fund’s books and the U.S. dollar equivalent of the amounts actually received or paid. Net unrealized appreciation and depreciation on the translation of assets and liabilities denominated in foreign currencies arise from changes in the values of assets and liabilities, including investments in securities at fiscal period end, resulting from changes in exchange rates.
The effect of changes in foreign currency exchange rates on investments is separately identified from the fluctuations arising from changes in market values of securities held and reported with all other foreign currency gains and losses in the Fund’s Statement of Operations.
Allocation of Income, Expenses, Gains and Losses. Income, expenses (other than those attributable to a specific class), gains and losses are allocated on a daily basis to each class of shares based upon the relative proportion of net assets represented by such class. Operating expenses directly attributable to a specific class are charged against the operations of that class.
Federal Taxes. The Fund intends to comply with provisions of the Internal Revenue Code applicable to regulated investment companies and to distribute substantially all of its investment company taxable income, including any net realized gain on investments not offset by capital loss carryforwards, if any, to shareholders. Therefore, no federal income or excise tax provision is required. The Fund files income tax returns in U.S. federal and applicable state jurisdictions. The statute of limitations on the Fund’s tax return filings generally remain open for the three preceding fiscal reporting period ends.
The tax components of capital shown in the following table represent distribution requirements the Fund must satisfy under the income tax regulations, losses the Fund may be able to offset against income and gains realized in future years and unrealized appreciation or depreciation of securities and other investments for federal income tax purposes.
| | | | | | | | | | | | |
Undistributed Net Investment Income | | Undistributed
Long-Term
Gain | | | Accumulated
Loss
Carryforward1,2,3 | | | Net Unrealized Appreciation Based on cost of Securities and
Other Investments
for Federal Income
Tax Purposes | |
| |
$5,621,394 | | | $— | | | | $32,864,475 | | | | $16,202,654 | |
1. As of December 31, 2013, the Fund had $32,864,475 of net capital loss carryforwards available to offset future realized capital gains, if any, and thereby reduce future taxable gain distributions. Details of the capital loss carryforwards are included in the table below. Capital loss carryovers with no expiration, if any, must be utilized prior to those with expiration dates.
| | | | |
| Expiring | | | |
| |
2015 | | $ | 6,646,488 | |
2016 | | | 3,323,244 | |
2017 | | | 22,894,743 | |
| | | | |
Total | | $ | 32,864,475 | |
| | | | |
Of these losses, $9,969,732 are subject to loss limitation rules resulting from merger activity. These limitations generally reduce the utilization of these losses to a maximum of $3,323,244 per year.
2. During the fiscal year ended December 31, 2013, the Fund utilized $36,236,660 of capital loss carryforward to offset capital gains realized in that fiscal year.
3. During the fiscal year ended December 31, 2012, the Fund utilized $4,569,082 of capital loss carryforward to offset capital gains realized in that fiscal year.
Net investment income (loss) and net realized gain (loss) may differ for financial statement and tax purposes. The character of dividends and distributions made during the fiscal year from net investment income or net realized gains may differ from their ultimate characterization for federal income tax purposes. Also, due to timing of dividends and distributions, the fiscal year in which amounts are distributed may differ from the fiscal year in which the income or net realized gain was recorded by the Fund.
Accordingly, the following amounts have been reclassified for December 31, 2013. Net assets of the Fund were unaffected by the reclassifications.
| | | | | | | | |
Reduction to Paid-in Capital | | Increase to Accumulated Net Investment Income | | | Increase to Accumulated Net Realized Loss on Investments | |
| |
$27,060 | | | $422,155 | | | | $395,095 | |
The tax character of distributions paid during the years ended December 31, 2013 and December 31, 2012 was as follows:
| | | | | | | | |
| | | Year Ended
December 31, 2013 | | | Year Ended
December 31, 2012 | |
| |
Distributions paid from: | | | | | | | | |
Ordinary income | | $ | 6,656,962 | | | $ | 3,938,612 | |
22 OPPENHEIMER CAPITAL INCOME FUND/VA
1. Significant Accounting Policies (Continued)
The aggregate cost of securities and other investments and the composition of unrealized appreciation and depreciation of securities and other investments for federal income tax purposes as of December 31, 2013 are noted in the following table. The primary difference between book and tax appreciation or depreciation of securities and other investments, if applicable, is attributable to the tax deferral of losses or tax realization of financial statement unrealized gain or loss.
| | | | |
Federal tax cost of securities | | $ | 277,494,379 | |
Federal tax cost of other investments | | | 13,227,559 | |
| | | | |
Total federal tax cost | | $ | 290,721,938 | |
| | | | |
Gross unrealized appreciation | | $ | 19,721,086 | |
Gross unrealized depreciation | | | (3,518,432) | |
| | | | |
Net unrealized appreciation | | $ | 16,202,654 | |
| | | | |
Trustees’ Compensation. The Board of Trustees has adopted a compensation deferral plan for independent trustees that enables trustees to elect to defer receipt of all or a portion of the annual compensation they are entitled to receive from the Fund. For purposes of determining the amount owed to the Trustee under the plan, deferred amounts are treated as though equal dollar amounts had been invested in shares of the Fund or in other Oppenheimer funds selected by the Trustee. The Fund purchases shares of the funds selected for deferral by the Trustee in amounts equal to his or her deemed investment, resulting in a Fund asset equal to the deferred compensation liability. Such assets are included as a component of “Other” within the asset section of the Statement of Assets and Liabilities. Deferral of trustees’ fees under the plan will not affect the net assets of the Fund, and will not materially affect the Fund’s assets, liabilities or net investment income per share. Amounts will be deferred until distributed in accordance with the compensation deferral plan.
Dividends and Distributions to Shareholders. Dividends and distributions to shareholders, which are determined in accordance with income tax regulations and may differ from U.S. generally accepted accounting principles, are recorded on the ex-dividend date. Income and capital gain distributions, if any, are declared and paid annually or at other times as deemed necessary by the Manager.
Investment Income. Dividend income is recorded on the ex-dividend date or upon ex-dividend notification in the case of certain foreign dividends where the ex-dividend date may have passed. Non-cash dividends included in dividend income, if any, are recorded at the fair market value of the securities received. Interest income is recognized on an accrual basis. Discount and premium, which are included in interest income on the Statement of Operations, are amortized or accreted daily.
Custodian Fees. “Custodian fees and expenses” in the Statement of Operations may include interest expense incurred by the Fund on any cash overdrafts of its custodian account during the period. Such cash overdrafts may result from the effects of failed trades in portfolio securities and from cash outflows resulting from unanticipated shareholder redemption activity. The Fund pays interest to its custodian on such cash overdrafts, to the extent they are not offset by positive cash balances maintained by the Fund, at a rate equal to the Federal Funds Rate plus 0.50%. The “Reduction to custodian expenses” line item, if applicable, represents earnings on cash balances maintained by the Fund during the period. Such interest expense and other custodian fees may be paid with these earnings.
Security Transactions. Security transactions are recorded on the trade date. Realized gains and losses on securities sold are determined on the basis of identified cost.
Indemnifications. The Fund’s organizational documents provide current and former trustees and officers with a limited indemnification against liabilities arising in connection with the performance of their duties to the Fund. In the normal course of business, the Fund may also enter into contracts that provide general indemnifications. The Fund’s maximum exposure under these arrangements is unknown as this would be dependent on future claims that may be made against the Fund. The risk of material loss from such claims is considered remote.
Other. The preparation of financial statements in conformity with accounting principles generally accepted in the United States of America requires management to make estimates and assumptions that affect the reported amounts of assets and liabilities and disclosure of contingent assets and liabilities at the date of the financial statements and the reported amounts of increases and decreases in net assets from operations during the reporting period. Actual results could differ from those estimates.
2. Securities Valuation
The Fund calculates the net asset value of its shares as of the close of the New York Stock Exchange (the “Exchange”), normally 4:00 P.M. Eastern time, on each day the Exchange is open for trading.
The Fund’s Board has adopted procedures for the valuation of the Fund’s securities and has delegated the day-to-day responsibility for valuation determinations under those procedures to the Manager. The Manager has established a Valuation Committee which is responsible for determining a “fair valuation” for any security for which market quotations are not “readily available.” The Valuation Committee’s fair valuation determinations are subject to review, approval and ratification by the Fund’s Board at its next regularly scheduled meeting covering the calendar quarter in which the fair valuation was determined.
23 OPPENHEIMER CAPITAL INCOME FUND/VA
NOTESTO FINANCIAL STATEMENTS Continued
2. Securities Valuation (Continued)
Valuation Methods and Inputs
Securities are valued using unadjusted quoted market prices, when available, as supplied primarily by third party pricing services or dealers.
The following methodologies are used to determine the market value or the fair value of the types of securities described below:
Securities traded on a registered U.S. securities exchange (including exchange-traded derivatives other than futures and futures options) are valued based on the last sale price of the security reported on the principal exchange on which it is traded, prior to the time when the Fund’s assets are valued. In the absence of a sale, the security is valued at the last sale price on the prior trading day, if it is within the spread of the current day’s closing “bid” and “asked” prices, and if not, at the current day’s closing bid price. A security of a foreign issuer traded on a foreign exchange, but not listed on a registered U.S. securities exchange, is valued based on the last sale price on the principal exchange on which the security is traded, as identified by the third party pricing service used by the Manager, prior to the time when the Fund’s assets are valued. If the last sale price is unavailable, the security is valued at the most recent official closing price on the principal exchange on which it is traded. If the last sales price or official closing price for a foreign security is not available, the security is valued at the mean between the bid and asked price per the exchange or, if not available from the exchange, obtained from two dealers. If bid and asked prices are not available from either the exchange or two dealers, the security is valued by using one of the following methodologies (listed in order of priority); (1) using a bid from the exchange, (2) the mean between the bid and asked price as provided by a single dealer, or (3) a bid from a single dealer.
Shares of a registered investment company that are not traded on an exchange are valued at that investment company’s net asset value per share.
Corporate and government debt securities (of U.S. or foreign issuers) and municipal debt securities, event-linked bonds, loans, mortgage-backed securities, collateralized mortgage obligations, and asset-backed securities are valued at the mean between the “bid” and “asked” prices utilizing evaluated prices obtained from third party pricing services or broker-dealers who may use matrix pricing methods to determine the evaluated prices.
Short-term money market type debt securities with a remaining maturity of sixty days or less are valued at cost adjusted by the amortization of discount or premium to maturity (amortized cost), which approximates market value. Short-term debt securities with a remaining maturity in excess of sixty days are valued at the mean between the “bid” and “asked” prices utilizing evaluated prices obtained from third party pricing services or broker-dealers.
Futures contracts and futures options traded on a commodities or futures exchange will be valued at the final settlement price or official closing price on the principal exchange as reported by such principal exchange at its trading session ending at, or most recently prior to, the time when the Fund’s assets are valued.
A description of the standard inputs that may generally be considered by the third party pricing vendors in determining their evaluated prices is provided below.
| | |
| Security Type | | Standard inputs generally considered by third-party pricing vendors |
| Corporate debt, government debt, municipal, mortgage-backed and asset-backed securities | | Reported trade data, broker-dealer price quotations, benchmark yields, issuer spreads on comparable securities, the credit quality, yield, maturity, and other appropriate factors. |
| Loans | | Information obtained from market participants regarding reported trade data and broker-dealer price quotations. |
| Event-linked bonds | | Information obtained from market participants regarding reported trade data and broker-dealer price quotations. |
| Structured securities | | Relevant market information such as the price of underlying financial instruments, stock market indices, foreign currencies, interest rate spreads, commodities, or the occurrence of other specific events. |
| Swaps | | Relevant market information, including underlying reference assets such as credit spreads, credit event probabilities, index values, individual security values, forward interest rates, variable interest rates, volatility measures, and forward currency rates. |
If a market value or price cannot be determined for a security using the methodologies described above, or if, in the “good faith” opinion of the Manager, the market value or price obtained does not constitute a “readily available market quotation,” or a significant event has occurred that would materially affect the value of the security the security is fair valued either (i) by a standardized fair valuation methodology applicable to the security type or the significant event as previously approved by the Valuation Committee and the Fund’s Board or (ii) as determined in good faith by the Manager’s Valuation Committee. The Valuation Committee considers all relevant facts that are reasonably available, through either public information or information available to the Manager, when determining the fair value of a security. Fair value determinations by the Manager are subject to review, approval and ratification by the Fund’s Board at its next regularly scheduled meeting covering the calendar quarter in which the fair valuation was determined. Those fair valuation standardized methodologies include, but are not limited to, valuing securities at the last sale price or initially at cost and subsequently adjusting the value based on: changes in company specific fundamentals, changes in an appropriate securities index, or changes in the value of similar securities which may be further adjusted for any discounts related to security-specific resale restrictions. When possible, such methodologies use observable market inputs such as unadjusted quoted prices of similar securities, observable interest rates, currency rates and yield curves. The methodologies used for valuing securities are not necessarily an indication of the risks associated with investing in those securities nor can it be assured that the Fund can obtain the fair value assigned to a security if it were to sell the security.
To assess the continuing appropriateness of security valuations, the Manager, or its third party service provider who is subject to oversight by the Manager, regularly compares prior day prices, prices on comparable securities, and sale prices to the current day prices and challenges those prices exceeding certain tolerance levels with the third party pricing service or broker source. For those securities valued by fair valuations, whether through a
24 OPPENHEIMER CAPITAL INCOME FUND/VA
2. Securities Valuation (Continued)
standardized fair valuation methodology or a fair valuation determination, the Valuation Committee reviews and affirms the reasonableness of the valuations based on such methodologies and fair valuation determinations on a regular basis after considering all relevant information that is reasonably available.
Classifications
Each investment asset or liability of the Fund is assigned a level at measurement date based on the significance and source of the inputs to its valuation. Various data inputs are used in determining the value of each of the Fund’s investments as of the reporting period end. These data inputs are categorized in the following hierarchy under applicable financial accounting standards:
1) Level 1-unadjusted quoted prices in active markets for identical assets or liabilities (including securities actively traded on a securities exchange)
2) Level 2-inputs other than unadjusted quoted prices that are observable for the asset or liability (such as unadjusted quoted prices for similar assets and market corroborated inputs such as interest rates, prepayment speeds, credit risks, etc.)
3) Level 3-significant unobservable inputs (including the Manager’s own judgments about assumptions that market participants would use in pricing the asset or liability).
The inputs used for valuing securities are not necessarily an indication of the risks associated with investing in those securities.
The table below categorizes amounts that are included in the Fund’s Statement of Assets and Liabilities as of December 31, 2013 based on valuation input level:
| | | | | | | | | | | | | | | | |
| | | Level 1— Unadjusted Quoted Prices | | | Level 2— Other Significant
Observable Inputs | | | Level 3—
Significant
Unobservable
Inputs | | | Value | |
Assets Table | | | | | | | | | | | | | | | | |
Investments, at Value: | | | | | | | | | | | | | | | | |
Common Stocks | | | | | | | | | | | | | | | | |
Consumer Discretionary | | $ | 12,033,742 | | | $ | — | | | $ | — | | | $ | 12,033,742 | |
Consumer Staples | | | 6,789,587 | | | | 2,654,657 | | | | — | | | | 9,444,244 | |
Energy | | | 9,528,393 | | | | — | | | | — | | | | 9,528,393 | |
Financials | | | 17,520,018 | | | | — | | | | — | | | | 17,520,018 | |
Health Care | | | 14,015,017 | | | | — | | | | — | | | | 14,015,017 | |
Industrials | | | 13,074,606 | | | | — | | | | — | �� | | | 13,074,606 | |
Information Technology | | | 16,177,101 | | | | — | | | | — | | | | 16,177,101 | |
Materials | | | 4,476,698 | | | | — | | | | — | | | | 4,476,698 | |
Telecommunication Services | | | 2,378 | | | | — | | | | — | | | | 2,378 | |
Utilities | | | 1,407,024 | | | | — | | | | — | | | | 1,407,024 | |
Asset-Backed Securities | | | — | | | | 26,539,466 | | | | — | | | | 26,539,466 | |
Mortgage-Backed Obligations | | | — | | | | 76,579,701 | | | | — | | | | 76,579,701 | |
U.S. Government Obligations | | | — | | | | 2,143,702 | | | | — | | | | 2,143,702 | |
Non-Convertible Corporate Bonds and Notes | | | — | | | | 70,837,007 | | | | — | | | | 70,837,007 | |
Investment Company | | | 19,917,607 | | | | — | | | | — | | | | 19,917,607 | |
Total Investments, at Value | | | 114,942,171 | | | | 178,754,533 | | | | — | | | | 293,696,704 | |
Other Financial Instruments: | | | | | | | | | | | | | | | | |
Variation margin receivable | | | 8,156 | | | | — | | | | — | | | | 8,156 | |
Total Assets | | $ | 114,950,327 | | | $ | 178,751,213 | | | $ | — | | | $ | 293,704,860 | |
Liabilities Table | | | | | | | | | | | | | | | | |
Other Financial Instruments: | | | | | | | | | | | | | | | | |
Variation margin payable | | $ | (53,719) | | | $ | — | | | $ | — | | | $ | (53,719) | |
Total Liabilities | | $ | (53,719) | | | $ | — | | | $ | — | | | $ | (53,719) | |
Currency contracts and forwards, if any, are reported at their unrealized appreciation/ depreciation at measurement date, which represents the change in the contract’s value from trade date. Futures, if any, are reported at their variation margin at measurement date, which represents the amount due to/from the Fund at that date. All additional assets and liabilities included in the above table are reported at their market value at measurement date.
3. Shares of Beneficial Interest
The Fund has authorized an unlimited number of $0.001 par value shares of beneficial interest of each class. Transactions in shares of beneficial interest were as follows:
25 OPPENHEIMER CAPITAL INCOME FUND/VA
NOTESTO FINANCIAL STATEMENTS Continued
3. Shares of Beneficial Interest (Continued)
| | | | | | | | | | | | | | | | |
| | | Year Ended December 31, 2013 | | | Year Ended December 31, 2012 | |
| | | Shares | | | Amount | | | Shares | | | Amount | |
Non-Service Shares | | | | | | | | | | | | | | | | |
Sold | | | 172,668 | | | $ | 2,290,240 | | | | 245,214 | | | $ | 2,929,071 | |
Dividends and/or distributions reinvested | | | 387,201 | | | | 5,107,178 | | | | 261,020 | | | | 3,027,836 | |
Acquisition—Note 8 | | | — | | | | — | | | | 8,473,818 | | | | 101,940,025 | |
Redeemed | | | (2,531,989) | | | | (33,599,185) | | | | (2,929,508) | | | | (35,123,488) | |
| | | | |
Net increase (decrease) | | | (1,972,120) | | | $ | (26,201,767) | | | | 6,050,544 | | | $ | 72,773,444 | |
| | | | |
| | | | | | | | | | | | | | | | | |
Service Shares | | | | | | | | | | | | | | | | |
Sold | | | 183,862 | | | $ | 2,416,107 | | | | 297,913 | | | $ | 3,538,468 | |
Dividends and/or distributions reinvested | | | 118,848 | | | | 1,549,784 | | | | 79,405 | | | | 910,776 | |
Redeemed | | | (1,100,257) | | | | (14,476,777) | | | | (1,428,994) | | | | (16,992,132) | |
| | | | |
Net decrease | | | (797,547) | | | $ | (10,510,886) | | | | (1,051,676) | | | $ | (12,542,888) | |
| | | | |
4. Purchases and Sales of Securities
The aggregate cost of purchases and proceeds from sales of securities, other than short-term obligations and investments in IMMF, for the year ended December 31, 2013 were as follows:
| | | | | | | | | | | | | | |
| | | | | Purchases | | | | | Sales | | | |
| | | | | |
| | Investment securities | | $ | 447,518,296 | | | | | $ | 512,907,736 | | | |
| | U.S. government and government agency obligations | | | 7,635,915 | | | | | | 4,161,099 | | | |
| | To Be Announced (TBA) mortgage-related securities | | | 794,398,216 | | | | | | 800,879,825 | | | |
5. Fees and Other Transactions with Affiliates
Management Fees. Under the investment advisory agreement, the Fund pays the Manager a management fee based on the daily net assets of the Fund at an annual rate as shown in the following table:
| | | | |
| Fee Schedule | | | |
Up to $200 million | | | 0.75% | |
Next $200 million | | | 0.72 | |
Next $200 million | | | 0.69 | |
Next $200 million | | | 0.66 | |
Over $800 million | | | 0.60 | |
Sub-Adviser Fees. The Manager has retained the Sub-Adviser to provide the day-to-day portfolio management of the Fund. Under the Sub-Advisory Agreement, the Manager pays the Sub-Adviser an annual fee in monthly installments, equal to a percentage of the investment management fee collected by the Manager from the Fund, which shall be calculated after any investment management fee waivers. The fee paid to the Sub-Adviser is paid by the Manager, not by the Fund.
Transfer Agent Fees. OFI Global (the “Transfer Agent”) serves as the transfer and shareholder servicing agent for the Fund. Fees incurred by the Fund with respect to these services are detailed in the Statement of Operations.
Sub-Transfer Agent Fees. The Transfer Agent has retained Shareholder Services, Inc., a wholly-owned subsidiary of OFI (the “Sub-Transfer Agent”), to provide the day-to-day transfer agent and shareholder servicing of the Fund. Under the Sub-Transfer Agency Agreement, the Transfer Agent pays the Sub-Transfer Agent an annual fee in monthly installments, equal to a percentage of the transfer agent fee collected by the Transfer Agent from the Fund, which shall be calculated after any applicable fee waivers. The fee paid to the Sub-Transfer Agent is paid by the Transfer Agent, not by the Fund.
Distribution and Service Plan for Service Shares. The Fund has adopted a Distribution and Service Plan (the “Plan”) in accordance with Rule 12b-1 under the Investment Company Act of 1940 for Service shares to pay OppenheimerFunds Distributor, Inc. (the “Distributor”), for distribution related services, personal service and account maintenance for the Fund’s Service shares. Under the Plan, payments are made periodically at an annual rate of 0.25% of the daily net assets of Service shares of the Fund. The Distributor currently uses all of those fees to compensate sponsors of the insurance product that offers Fund shares, for providing personal service and maintenance of accounts of their variable contract owners that hold Service shares. These fees are paid out of the Fund’s assets on an on-going basis and increase operating expenses of the Service shares, which results in lower performance compared to the Fund’s shares that are not subject to a service fee. Fees incurred by the Fund under the Plan are detailed in the Statement of Operations.
Waivers and Reimbursements of Expenses. The Manager has contractually agreed to limit the Fund’s expenses after payments, waivers and/or reimbursements and reduction to custodian expenses, excluding expenses incurred directly or indirectly by the Fund as a result of investments in other investment companies, wholly-owned subsidiaries and pooled investment vehicles; so that those expenses, as percentages of daily net assets, will not
26 OPPENHEIMER CAPITAL INCOME FUND/VA
| | |
5. Fees and Other Transactions with Affiliates (Continued) |
exceed the annual rate of 0.67% for Non-Service shares and 0.92% for Service shares. During the year ended December 31, 2013, the Manager waived fees and/or reimbursed the Fund $469,413 and $155,544 for Non-Service and Service shares, respectively.
The Manager will waive fees and/or reimburse Fund expenses in an amount equal to the indirect management fees incurred through the Fund’s investment in IMMF. During the year ended December 31, 2013, the Manager waived fees and/or reimbursed the Fund $21,049 for IMMF management fees.
Some of these undertakings may be modified or terminated at any time; some may not be modified or terminated until after one year from the date of the current prospectus, as indicated therein.
6. Risk Exposures and the Use of Derivative Instruments
The Fund’s investment objectives not only permit the Fund to purchase investment securities, they also allow the Fund to enter into various types of derivatives contracts, including, but not limited to, futures contracts, forward currency exchange contracts, credit default swaps, interest rate swaps, total return swaps, variance swaps and purchased and written options. In doing so, the Fund will employ strategies in differing combinations to permit it to increase, decrease, or change the level or types of exposure to market risk factors. These instruments may allow the Fund to pursue its objectives more quickly and efficiently than if it were to make direct purchases or sales of securities capable of effecting a similar response to market factors. Such contracts may be entered into through a bilateral over-the-counter (“OTC”) transaction, or through a securities or futures exchange and cleared through a clearinghouse.
Market Risk Factors. In accordance with its investment objectives, the Fund may use derivatives to increase or decrease its exposure to one or more of the following market risk factors:
Commodity Risk. Commodity risk relates to the change in value of commodities or commodity indexes as they relate to increases or decreases in the commodities market. Commodities are physical assets that have tangible properties. Examples of these types of assets are crude oil, heating oil, metals, livestock, and agricultural products.
Credit Risk. Credit risk relates to the ability of the issuer to meet interest and principal payments, or both, as they come due. In general, lower-grade, higher-yield bonds are subject to credit risk to a greater extent than lower-yield, higher-quality bonds.
Equity Risk. Equity risk relates to the change in value of equity securities as they relate to increases or decreases in the general market.
Foreign Exchange Rate Risk. Foreign exchange rate risk relates to the change in the U.S. dollar value of a security held that is denominated in a foreign currency. The U.S. dollar value of a foreign currency denominated security will decrease as the dollar appreciates against the currency, while the U.S. dollar value will increase as the dollar depreciates against the currency.
Interest Rate Risk. Interest rate risk refers to the fluctuations in value of fixed-income securities resulting from the inverse relationship between price and yield. For example, an increase in general interest rates will tend to reduce the market value of already issued fixed-income investments, and a decline in general interest rates will tend to increase their value. In addition, debt securities with longer maturities, which tend to have higher yields, are subject to potentially greater fluctuations in value from changes in interest rates than obligations with shorter maturities.
Volatility Risk. Volatility risk refers to the magnitude of the movement, but not the direction of the movement, in a financial instrument’s price over a defined time period. Large increases or decreases in a financial instrument’s price over a relative time period typically indicate greater volatility risk, while small increases or decreases in its price typically indicate lower volatility risk.
Derivatives may have little or no initial cash investment relative to their market value exposure and therefore can produce significant gains or losses in excess of their cost due to unanticipated changes in the market risk factors and the overall market. This use of embedded leverage allows the Fund to increase its market value exposure relative to its net assets and can substantially increase the volatility of the Fund’s performance. In instances where the Fund is using derivatives to decrease, or hedge, exposures to market risk factors for securities held by the Fund, there are also risks that those derivatives may not perform as expected resulting in losses for the combined or hedged positions. Some derivatives have the potential for unlimited loss, regardless of the size of the Fund’s initial investment.
Additional associated risks from investing in derivatives also exist and potentially could have significant effects on the valuation of the derivative and the Fund. Typically, the associated risks are not the risks that the Fund is attempting to increase or decrease exposure to, per its investment objectives, but are the additional risks from investing in derivatives. Examples of these associated risks are liquidity risk, which is the risk that the Fund will not be able to sell the derivative in the open market in a timely manner, and counterparty credit risk, which is the risk that the counterparty will not fulfill its obligation to the Fund.
The Fund’s actual exposures to these market risk factors and associated risks during the period are discussed in further detail, by derivative type, below.
Futures Contracts
A futures contract is a commitment to buy or sell a specific amount of a commodity, financial instrument or currency at a negotiated price on a stipulated future date. The Fund may buy and sell futures contracts and may also buy or write put or call options on these futures contracts. Futures contracts and options thereon are generally entered into on a regulated futures exchange and cleared through a clearinghouse associated with the exchange.
Upon entering into a futures contract, the Fund is required to deposit either cash or securities (initial margin) in an amount equal to a certain percentage of the contract value in an account registered in the futures commission merchant’s name. Subsequent payments (variation margin) are paid to or from the futures commission merchant each day equal to the daily changes in the contract value. Such payments are recorded as unrealized gains
27 OPPENHEIMER CAPITAL INCOME FUND/VA
NOTESTO FINANCIAL STATEMENTS Continued
6. Risk Exposures and the Use of Derivative Instruments (Continued)
and losses. Should the Fund fail to make requested variation margin payments, the futures commission merchant can gain access to the initial margin to satisfy the Fund’s payment obligations.
Futures contracts are reported on a schedule following the Statement of Investments. Securities held by a futures commission merchant to cover initial margin requirements on open futures contracts are noted in the Statement of Investments. Cash held by a futures commission merchant to cover initial margin requirements on open futures contracts and the receivable and/or payable for the daily mark to market for the variation margin are noted in the Statement of Assets and Liabilities. The net change in unrealized appreciation and depreciation is reported in the Statement of Operations. Realized gains (losses) are reported in the Statement of Operations at the closing or expiration of futures contracts.
The Fund has purchased futures contracts on various bonds and notes to increase exposure to interest rate risk.
The Fund has sold futures contracts on various bonds and notes to decrease exposure to interest rate risk.
During the year ended December 31, 2013, the Fund had an ending monthly average market value of $15,041,246 and $15,732,851 on futures contracts purchased and sold, respectively.
Additional associated risks of entering into futures contracts (and related options) include the possibility that there may be an illiquid market where the Fund is unable to liquidate the contract or enter into an offsetting position and, if used for hedging purposes, the risk that the price of the contract will correlate imperfectly with the prices of the Fund’s securities.
Swap Contracts
The Fund may enter into swap contract agreements with a counterparty to exchange a series of cash flows based on either specified reference rates, the price or volatility of asset or non-asset references, or the occurrence of a credit event, over a specified period. Swaps can be executed in a bi-lateral privately negotiated arrangement with a dealer in an OTC transaction (“OTC swaps”) or executed on a regulated market. Certain swaps, regardless of the venue of their execution, are required to be cleared through a clearinghouse (“cleared swaps”). Swap contracts may include interest rate, equity, debt, index, total return, credit default, currency, and volatility swaps.
Swap contracts are reported on a schedule following the Statement of Investments. Daily changes in the value of cleared swaps are reported as variation margin receivable or payable on the Statement of Assets and Liabilities. The values of OTC swap contracts are aggregated by positive and negative values and disclosed separately on the Statement of Assets and Liabilities. The unrealized appreciation (depreciation) related to the change in the valuation of the notional amount of the swap is combined with the accrued interest due to (owed by) the Fund, if any, at termination or settlement. The net change in this amount during the period is included on the Statement of Operations. The Fund also records any periodic payments received from (paid to) the counterparty, including at termination, under such contracts as realized gain (loss) on the Statement of Operations.
Swap contract agreements are exposed to the market risk factor of the specific underlying reference rate or asset. Swap contracts are typically more attractively priced compared to similar investments in related cash securities because they isolate the risk to one market risk factor and eliminate the other market risk factors. Investments in cash securities (for instance bonds) have exposure to multiple risk factors (credit and interest rate risk). Because swaps have embedded leverage, they can expose the Fund to substantial risk in the isolated market risk factor.
Credit Default Swap Contracts. A credit default swap is a contract that enables an investor to buy or sell protection against a defined-issuer credit event, such as the issuer’s failure to make timely payments of interest or principal on a debt security, bankruptcy or restructuring. The Fund may enter into credit default swaps either by buying or selling protection on a corporate issuer, sovereign issuer, or a basket or index of issuers (the “reference asset”).
The buyer of protection pays a periodic fee to the seller of protection based on the notional amount of the swap contract. The seller of protection agrees to compensate the buyer of protection for future potential losses as a result of a credit event on the reference asset. The contract effectively transfers the credit event risk of the reference asset from the buyer of protection to the seller of protection.
The ongoing value of the contract will fluctuate throughout the term of the contract based primarily on the credit risk of the reference asset. If the credit quality of the reference asset improves relative to the credit quality at contract initiation, the buyer of protection may have an unrealized loss greater than the anticipated periodic fee owed. This unrealized loss would be the result of current credit protection being cheaper than the cost of credit protection at contract initiation. If the buyer elects to terminate the contract prior to its maturity, and there has been no credit event, this unrealized loss will become realized. If the contract is held to maturity, and there has been no credit event, the realized loss will be equal to the periodic fee paid over the life of the contract.
If there is a credit event, the buyer of protection can exercise its rights under the contract and receive a payment from the seller of protection equal to the notional amount of the swap less the market value of specified debt securities issued by the reference asset. Upon exercise of the contract the difference between such value and the notional amount is recorded as realized gain (loss) and is included on the Statement of Operations.
The Fund has sold credit protection through credit default swaps to increase exposure to the credit risk of individual issuers and/or indexes of issuers that are either unavailable or considered to be less attractive in the bond market.
The Fund has purchased credit protection through credit default swaps to decrease exposure to the credit risk of individual issuers and/or indexes of issuers.
For the year ended December 31, 2013, the Fund had ending monthly average notional amounts of $646,154 on credit default swaps to buy protection.
Additional associated risks to the Fund include counterparty credit risk and liquidity risk.
As of December 31, 2013, the Fund had no such credit default swap agreements outstanding.
Counterparty Credit Risk. Derivative positions are subject to the risk that the counterparty will not fulfill its obligation to the Fund. The Fund intends to enter into derivative transactions with counterparties that the Manager believes to be creditworthy at the time of the transaction.
28 OPPENHEIMER CAPITAL INCOME FUND/VA
6. Risk Exposures and the Use of Derivative Instruments (Continued)
The Fund’s risk of loss from counterparty credit risk on OTC derivatives is generally limited to the aggregate unrealized gain netted against any collateral held by the Fund. For OTC options purchased, the Fund bears the risk of loss of the amount of the premiums paid plus the positive change in market values net of any collateral held by the Fund should the counterparty fail to perform under the contracts. Options written by the Fund do not typically give rise to counterparty credit risk, as options written generally obligate the Fund and not the counterparty to perform.
To reduce counterparty risk with respect to OTC transactions, the Fund has entered into master netting arrangements, established within the Fund’s International Swap and Derivatives Association, Inc. (“ISDA”) master agreements, which allow the Fund to make (or to have an entitlement to receive) a single net payment in the event of default (close-out netting) for outstanding payables and receivables with respect to certain OTC positions in swaps, options, swaptions, and forward currency exchange contracts for each individual counterparty. In addition, the Fund may require that certain counterparties post cash and/or securities in collateral accounts to cover their net payment obligations for those derivative contracts subject to ISDA master agreements. If the counterparty fails to perform under these contracts and agreements, the cash and/or securities will be made available to the Fund.
ISDA master agreements include credit related contingent features which allow counterparties to OTC derivatives to terminate derivative contracts prior to maturity in the event that, for example, the Fund’s net assets decline by a stated percentage or the Fund fails to meet the terms of its ISDA master agreements, which would cause the Fund to accelerate payment of any net liability owed to the counterparty.
For financial reporting purposes, the Fund does not offset derivative assets and derivative liabilities that are subject to netting arrangements in the Statement of Assets and Liabilities. Bankruptcy or insolvency laws of a particular jurisdiction may impose restrictions on or prohibitions against the right of offset in bankruptcy, insolvency or other events.
The Fund’s risk of loss from counterparty credit risk on exchange-traded derivatives cleared through a clearinghouse and for cleared swaps is generally considered lower than as compared to OTC derivatives. However, counterparty credit risk exists with respect to initial and variation margin deposited/paid by the Fund that is held in futures commission merchant, broker and/or clearinghouse accounts for such exchange-traded derivatives and for cleared swaps.
With respect to cleared swaps, such transactions will be submitted for clearing, and if cleared, will be held in accounts at futures commission merchants or brokers that are members of clearinghouses. While brokers, futures commission merchants and clearinghouses are required to segregate customer margin from their own assets, in the event that a broker, futures commission merchant or clearinghouse becomes insolvent or goes into bankruptcy and at that time there is a shortfall in the aggregate amount of margin held by the broker, futures commission merchant or clearinghouse for all its customers, U.S. bankruptcy laws will typically allocate that shortfall on a pro-rata basis across all the broker’s, futures commission merchant’s or clearinghouse’s customers, potentially resulting in losses to the Fund.
There is the risk that a broker, futures commission merchant or clearinghouse will decline to clear a transaction on the Fund’s behalf, and the Fund may be required to pay a termination fee to the executing broker with whom the Fund initially enters into the transaction. Clearinghouses may also be permitted to terminate cleared swaps at any time. The Fund is also subject to the risk that the broker or futures commission merchant will improperly use the Fund’s assets deposited/paid as initial or variation margin to satisfy payment obligations of another customer. In the event of a default by another customer of the broker or futures commission merchant, the Fund might not receive its variation margin payments from the clearinghouse, due to the manner in which variation margin payments are aggregated for all customers of the broker/futures commission merchant.
Collateral and margin requirements differ by type of derivative. Margin requirements are established by the broker, futures commission merchant or clearinghouse for exchange-traded and cleared derivatives, including cleared swaps. Brokers, futures commission merchants and clearinghouses can ask for margin in excess of the regulatory minimum, or increase the margin amount, in certain circumstances.
Collateral terms are contract specific for OTC derivatives. For derivatives traded under an ISDA master agreement, the collateral requirements are typically calculated by netting the mark to market amount for each transaction under such agreement and comparing that amount to the value of any collateral currently pledged by the Fund or the counterparty.
For financial reporting purposes, cash collateral that has been pledged to cover obligations of the Fund, if any, is reported separately on the Statement of Assets and Liabilities as cash pledged as collateral. Non-cash collateral pledged by the Fund, if any, is noted in the Statement of Investments. Generally, the amount of collateral due from or to a party must exceed a minimum transfer amount threshold (e.g. $250,000) before a transfer has to be made. To the extent amounts due to the Fund from its counterparties are not fully collateralized, contractually or otherwise, the Fund bears the risk of loss from counterparty nonperformance.
The following table presents the valuations of derivative instruments by risk exposure as reported within the Statement of Assets and Liabilities as of December 31, 2013:
| | | | | | | | | | |
| | | Asset Derivatives | | | | Liability Derivatives |
| Derivatives Not Accounted for as Hedging Instruments | | Statement of Assets and
Liabilities Location | | Value | | | | Statement of Assets and
Liabilities Location | | Value |
| Interest rate contracts | | Variation margin receivable | | $8,156 * | | | | Variation margin payable | | $53,719* |
*Includes only the current day’s variation margin. Prior variation margin movements have been reflected in cash on the Statement of Assets and Liabilities upon receipt or payment.
29 OPPENHEIMER CAPITAL INCOME FUND/VA
NOTESTO FINANCIAL STATEMENTS Continued
6. Risk Exposures and the Use of Derivative Instruments (Continued)
The effect of derivative instruments on the Statement of Operations is as follows:
| | | | | | | | | | | | |
| Amount of Realized Gain or (Loss) Recognized on Derivatives | |
| Derivatives Not Accounted for as | | Closing and expiration | | | | | | | |
| Hedging Instruments | | of futures contracts | | | Swap contracts | | | Total | |
Credit contracts | | $ | — | | | $ | (129,384) | | | $ | (129,384) | |
Interest rate contracts | | | (1,863,466) | | | | — | | | | (1,863,466) | |
| | | | |
Total | | $ | (1,863,466) | | | $ | (129,384) | | | $ | (1,992,850) | |
| | | | |
|
| Amount of Change in Unrealized Gain or (Loss) Recognized on Derivatives | |
| Derivatives Not Accounted for as | | | | | | | | | |
| Hedging Instruments | | Futures contracts | | | | | | Total | |
Interest rate contracts | | $ | (56,087) | | | | | | | $ | (56,087) | |
7. Restricted Securities
As of December 31, 2013, investments in securities included issues that are restricted. A restricted security may have a contractual restriction on its resale and is valued under methods approved by the Board of Trustees as reflecting fair value. Securities that are restricted are marked with an applicable footnote on the Statement of Investments. Restricted securities are reported on a schedule following the Statement of Investments.
8. Acquisition of Total Return Portfolio
On April 26, 2012, the Fund acquired all of the net assets of Total Return Portfolio at fair market value, pursuant to an Agreement and Plan of Reorganization approved by the Total Return Portfolio shareholders on April 20, 2012. The purpose of this acquisition is to combine two funds with similar investment objectives, strategies and risks to allow shareholders to benefit from greater asset growth potential, as well as lowered total expenses. The transaction qualified as a tax-free reorganization, (the “merger”) for federal income tax purposes allowing the Fund to use the original cost basis of the investments received to calculate subsequent gains and losses for tax reporting purposes.
Details of the merger are shown in the following table:
| | | | | | | | |
| | | Exchange Ratio to One Share of the Total Return Portfolio | | Shares of Beneficial Interest Issued by the Fund | | Value of Issued Shares of Beneficial Interest | | Combined Net Assets on April 26, 20121 |
| Total Return Portfolio fund shares merged into the Non-Service Shares | | 0.1049625104 | | 8,473,818 | | $101,940,025 | | $230,906,772 |
1. The net assets acquired included net unrealized appreciation of $6,091,953 and an unused capital loss carryforward of $46,084,065, potential utilization subject to tax limitations.
9. Pending Litigation
Since 2009, seven class action lawsuits have been pending in the U.S. District Court for the District of Colorado against OppenheimerFunds, Inc. (“OFI”), OppenheimerFunds Distributor, Inc., the Fund’s principal underwriter and distributor (the “Distributor”), and certain funds (but not including the Fund) advised by OFI Global Asset Management, Inc. and distributed by the Distributor (the “Defendant Funds”). The lawsuits also name as defendants certain officers and current and former trustees of the respective Defendant Funds. The lawsuits raise claims under federal securities law and allege, among other things, that the disclosure documents of the respective Defendant Funds contained misrepresentations and omissions and that the respective Defendant Funds’ investment policies were not followed. The plaintiffs in these actions seek unspecified damages, equitable relief and awards of attorneys’ fees and litigation expenses. The Defendant Funds’ Boards of Trustees have also engaged counsel to represent the Funds and the present and former Independent Trustees named in those suits. On August 26, 2013, the parties in six of these lawsuits executed a memorandum of understanding setting forth the terms of proposed settlements of those actions. The proposed settlements are subject to a variety of contingencies, including the execution of settlement agreements, which will require preliminary and final approval by the court. The proposed settlements do not resolve a seventh outstanding lawsuit relating to Oppenheimer California Municipal Fund.
Other class action and individual lawsuits have been filed since 2008 in various state and federal courts against OFI and certain of its affiliates by investors seeking to recover investments they allegedly lost as a result of the “Ponzi” scheme run by Bernard L. Madoff and his firm, Bernard L. Madoff Investment Securities, LLC (“BLMIS”). Plaintiffs in these suits allege that they suffered losses as a result of their investments in several funds managed by an affiliate of OFI and assert a variety of claims, including breach of fiduciary duty, fraud, negligent misrepresentation, unjust enrichment, and violation of federal and state securities laws and regulations, among others. They seek unspecified damages, equitable relief and awards of attorneys’ fees and litigation expenses. Neither the Distributor, nor any of the Oppenheimer mutual funds, their independent trustees or directors are named as defendants in these lawsuits. None of the Oppenheimer mutual funds invested in any funds or accounts managed by Madoff or BLMIS. On February 28, 2011, a stipulation of partial settlement of three groups of consolidated putative class action lawsuits relating to these matters was filed in the U.S. District Court for the Southern District of New York. On August 19, 2011, the court entered an order and final judgment approving the settlement as fair, reasonable and adequate. In September 2011, certain parties filed notices of appeal from the court’s order approving the settlement. The settlement does not resolve other outstanding lawsuits against OFI and its affiliates relating to BLMIS.
30 OPPENHEIMER CAPITAL INCOME FUND/VA
9. Pending Litigation (Continued)
On April 16, 2010, a lawsuit was filed in New York state court against (i) OFI, (ii) an affiliate of OFI and (iii) AAArdvark IV Funding Limited (“AAArdvark IV”), an entity advised by OFI’s affiliate, in connection with investments made by the plaintiffs in AAArdvark IV. Plaintiffs allege breach of contract and common law fraud claims against the defendants and seek compensatory damages, costs and disbursements, including attorney fees. On April 11, 2013, the court granted defendants’ motion for summary judgment, dismissing plaintiffs’ fraud claim with prejudice and dismissing their contract claim without prejudice, and granted plaintiffs leave to replead their contract claim to assert a cause of action for specific performance within 30 days. On May 9, 2013, plaintiffs filed a notice of appeal from the court’s dismissal order. On January 7, 2014, the appellate court affirmed the trial court’s dismissal order. On July 15, 2011, a lawsuit was filed in New York state court against OFI, an affiliate of OFI and AAArdvark Funding Limited (“AAArdvark I”), an entity advised by OFI’s affiliate, in connection with investments made by the plaintiffs in AAArdvark I. The complaint alleges breach of contract and common law fraud claims against the defendants and seeks compensatory damages, costs and disbursements, including attorney fees. On November 9, 2011, a lawsuit was filed in New York state court against OFI, an affiliate of OFI and AAArdvark XS Funding Limited (“AAArdvark XS”), an entity advised by OFI’s affiliate, in connection with investments made by the plaintiffs in AAArdvark XS. The complaint alleged breach of contract against the defendants and sought compensatory damages, costs and disbursements, including attorney fees. On November 8, 2013, the parties filed a stipulation of discontinuance dismissing the lawsuit with prejudice.
OFI believes the lawsuits and appeals described above are without legal merit and, with the exception of actions it has settled, is defending against them vigorously. While it is premature to render any opinion as to the outcome in these lawsuits, or whether any costs that the Defendant Funds may bear in defending the suits might not be reimbursed by insurance, OFI believes that these suits should not impair the ability of OFI or the Distributor to perform their respective duties to the Fund, and that the outcome of all of the suits together should not have any material effect on the operations of any of the Oppenheimer mutual funds.
31 OPPENHEIMER CAPITAL INCOME FUND/VA
| | |
REPORT OF INDEPENDENT REGISTERED PUBLIC ACCOUNTING FIRM |
The Board of Trustees and Shareholders of Oppenheimer Variable Account Funds:
We have audited the accompanying statement of assets and liabilities of Oppenheimer Capital Income Fund/VA formerly, Oppenheimer Balanced Fund/VA (a separate series of Oppenheimer Variable Account Funds), including the statement of investments, as of December 31, 2013, and the related statement of operations for the year then ended, the statements of changes in net assets for each of the years in the two-year period then ended, and the financial highlights for each of the years in the five-year period then ended. These financial statements and financial highlights are the responsibility of the Fund’s management. Our responsibility is to express an opinion on these financial statements and financial highlights based on our audits.
We conducted our audits in accordance with the standards of the Public Company Accounting Oversight Board (United States). Those standards require that we plan and perform the audit to obtain reasonable assurance about whether the financial statements and financial highlights are free of material misstatement. An audit includes examining, on a test basis, evidence supporting the amounts and disclosures in the financial statements. Our procedures included confirmation of securities owned as of December 31, 2013, by correspondence with the custodian, transfer agent and brokers, or by other appropriate auditing procedures where replies from brokers were not received. An audit also includes assessing the accounting principles used and significant estimates made by management, as well as evaluating the overall financial statement presentation. We believe that our audits provide a reasonable basis for our opinion.
In our opinion, the financial statements and financial highlights referred to above present fairly, in all material respects, the financial position of Oppenheimer Capital Income Fund/VA as of December 31, 2013, the results of its operations for the year then ended, the changes in its net assets for each of the years in the two-year period then ended, and the financial highlights for each of the years in the five-year period then ended, in conformity with U.S. generally accepted accounting principles.
KPMG LLP
Denver, Colorado
February 14, 2014
32 OPPENHEIMER CAPITAL INCOME FUND/VA
| | |
FEDERAL INCOME TAX INFORMATION Unaudited |
In early 2014, if applicable, shareholders of record received information regarding all dividends and distributions paid to them by the Fund during calendar year 2013.
Dividends, if any, paid by the Fund during the fiscal year ended December 31, 2013 which are not designated as capital gain distributions should be multiplied by the maximum amount allowable but not less than 29.73% to arrive at the amount eligible for the corporate dividend-received deduction.
The foregoing information is presented to assist shareholders in reporting distributions received from the Fund to the Internal Revenue Service. Because of the complexity of the federal regulations which may affect your individual tax return and the many variations in state and local tax regulations, we recommend that you consult your tax advisor for specific guidance.
33 OPPENHEIMER CAPITAL INCOME FUND/VA
| | |
BOARD APPROVAL OF THE FUND’S INVESTMENT ADVISORY AND SUB-ADIVSORY AGREEMENTS Unaudited |
The Fund has entered into an investment advisory agreement with OFI Global Asset Management, Inc. (“OFI Global” or the “Adviser”), a wholly-owned subsidiary of OppenheimerFunds, Inc. (“OFI” or the “Sub-Adviser”) (“OFI Global” and “OFI” together the “Managers”) and OFI Global has entered into a sub-advisory agreement with OFI whereby OFI provides investment sub-advisory services to the Fund (collectively, the “Agreements”). Each year, the Board of Trustees (the “Board”), including a majority of the independent Trustees, is required to determine whether to renew the Agreements. The Investment Company Act of 1940, as amended, requires that the Board request and evaluate, and that the Managers provide, such information as may be reasonably necessary to evaluate the terms of the Agreements. The Board employs an independent consultant to prepare a report that provides information, including comparative information that the Board requests for that purpose. In addition to in-person meetings focused on this evaluation, the Board receives information throughout the year regarding Fund services, fees, expenses and performance.
The Adviser, Sub-Adviser and the independent consultant provided information to the Board on the following factors: (i) the nature, quality and extent of the Managers’ services, (ii) the investment performance of the Fund and the Managers, (iii) the fees and expenses of the Fund, including comparative expense information, (iv) the profitability of the Managers and their affiliates, including an analysis of the cost of providing services, (v) whether economies of scale are realized as the Fund grows and whether fee levels reflect these economies of scale for Fund investors and (vi) other benefits to the Managers from their relationship with the Fund. The Board was aware that there are alternatives to retaining the Managers.
Outlined below is a summary of the principal information considered by the Board as well as the Board’s conclusions.
Nature, Quality and Extent of Services. The Board considered information about the nature, quality and extent of the services provided to the Fund and information regarding the Managers’ key personnel who provide such services. The Sub-Adviser’s duties include providing the Fund with the services of the portfolio managers and the Sub-Adviser’s investment team, who provide research, analysis and other advisory services in regard to the Fund’s investments; securities trading services; oversight of third-party service providers; monitoring compliance with applicable Fund policies and procedures and adherence to the Fund’s investment restrictions; and risk management. The Managers are responsible for providing certain administrative services to the Fund as well. Those services include providing and supervising all administrative and clerical personnel who are necessary in order to provide effective corporate administration for the Fund; compiling and maintaining records with respect to the Fund’s operations; preparing and filing reports required by the Securities and Exchange Commission; preparing periodic reports regarding the operations of the Fund for its shareholders; preparing proxy materials for shareholder meetings; and preparing the registration statements required by Federal and state securities laws for the sale of the Fund’s shares. The Managers also provide the Fund with office space, facilities and equipment.
The Board also considered the quality of the services provided and the quality of the Managers’ resources that are available to the Fund. The Board took account of the fact that the Sub-Adviser has had over fifty years of experience as an investment adviser and that its assets under management rank it among the top mutual fund managers in the United States. The Board evaluated the Sub-Adviser’s advisory, administrative, accounting, legal, compliance services and risk management, and information the Board has received regarding the experience and professional qualifications of the Managers’ key personnel and the size and functions of its staff. In its evaluation of the quality of the portfolio management services provided, the Board considered the experience of Krishna Memani and Magnus Krantz, the portfolio managers for the Fund, and the Sub-Adviser’s investment team and analysts. The Board members also considered the totality of their experiences with the Managers as directors or trustees of the Fund and other funds advised by the Managers. The Board considered information regarding the quality of services provided by affiliates of the Managers, which its members have become knowledgeable about in connection with the renewal of the Fund’s service agreements. The Board concluded, in light of the Managers’ experience, reputation, personnel, operations and resources that the Fund benefits from the services provided under the Agreement.
Investment Performance of the Fund, the Adviser and the Sub-Adviser. Throughout the year, the Manager provided information on the investment performance of the Fund, including comparative performance information. The Board also reviewed information, prepared by the Manager and by the independent consultant, comparing the Fund’s historical performance to relevant market indices and to the performance of other moderate allocation funds underlying variable insurance products. The Board considered that the Fund outperformed its performance category median during the three-year period and slightly underperformed during the one-year period. The Board also noted that the Fund underperformed its performance category median during the five- and ten-year periods. The Board noted the appointment on April 1, 2009 of a new portfolio manager for the Fund and of the head of the Investment Grade Fixed Income Team to oversee the Fund’s investments.
Costs of Services by the Adviser. The Board reviewed the fees paid to the Manager and the other expenses borne by the Fund. The independent consultant provided comparative data in regard to the fees and expenses of the Fund and other moderate allocation funds underlying variable insurance products. In reviewing the fees and expenses charged to the VA funds, the Board considered the Manager’s assertion that, because there is much greater disparity in the fees and services that may be provided by a manager to a VA fund as opposed to a retail fund, when comparing the expenses of the various VA funds to those of retail funds, it is most appropriate to focus on total expenses (rather than on the management fees). Accordingly, while the Board reviewed and considered all expenses, it focused on total expenses. The Board considered that the Fund’s contractual management fee was higher than its respective peer group median and category median. Within the total asset range of $250 million to $500 million, the Fund’s effective rate was higher than its peer group median and category median. The Board considered that the Fund’s total expenses after waivers were lower than its peer group median and category median. The Board noted that the Manager has contractually agreed to waive a portion of the management fee so that total annual fund operating expenses will not exceed 0.67% of average annual net assets for Non-Service Shares and 0.92% of average annual net assets for Service Shares. This contractual expense limitation may not be amended or withdrawn until one year after the date of the Fund’s prospectus.
Economies of Scale and Profits Realized by the Adviser and Sub-Adviser. The Board considered information regarding the Managers’ costs in serving as the Fund’s investment adviser and sub-adviser, including the costs associated with the personnel and systems necessary to manage the Fund, and information regarding the Managers’ profitability from their relationship with the Fund. The Board reviewed whether the Managers may realize economies of scale in managing and supporting the Fund. The Board noted that the Fund currently has management fee breakpoints, which are intended to share with Fund shareholders economies of scale that may exist as the Fund’s assets grow.
34 OPPENHEIMER CAPITAL INCOME FUND/VA
Other Benefits to the Managers. In addition to considering the profits realized by the Managers, the Board considered information that was provided regarding the direct and indirect benefits the Managers receive as a result of their relationship with the Fund, including compensation paid to the Managers’ affiliates and research provided to the Adviser in connection with permissible brokerage arrangements (soft dollar arrangements). The Board also considered that the Managers must be able to pay and retain experienced professional personnel at competitive rates to provide quality services to the Fund.
Conclusions. These factors were also considered by the independent Trustees meeting separately from the full Board, assisted by experienced counsel to the Fund and to the independent Trustees. Fund counsel and the independent Trustees’ counsel are independent of the Managers within the meaning and intent of the Securities and Exchange Commission Rules.
Based on its review of the information it received and its evaluations described above, the Board, including a majority of the independent Trustees, decided to continue the Agreements through August 31, 2014. In arriving at its decision, the Board did not identify any factor or factors as being more important than others, but considered all of the above information, and considered the terms and conditions of the Agreements, including the management fees, in light of all the surrounding circumstances.
35 OPPENHEIMER CAPITAL INCOME FUND/VA
| | |
PORTFOLIO PROXY VOTING POLICIES AND PROCEDURES; UPDATES TO STATEMENTS OF INVESTMENTS Unaudited |
The Fund has adopted Portfolio Proxy Voting Policies and Procedures under which the Fund votes proxies relating to securities (“portfolio proxies”) held by the Fund. A description of the Fund’s Portfolio Proxy Voting Policies and Procedures is available (i) without charge, upon request, by calling the Fund toll-free at 1.800.CALL OPP (225.5677), (ii) on the Fund’s website at oppenheimerfunds.com, and (iii) on the SEC’s website at www.sec.gov. In addition, the Fund is required to file Form N-PX, with its complete proxy voting record for the 12 months ended June 30th, no later than August 31st of each year. The Fund’s voting record is available (i) without charge, upon request, by calling the Fund toll-free at 1.800.CALL OPP (225.5677), and (ii) in the Form N-PX filing on the SEC’s website at www.sec.gov.
The Fund files its complete schedule of portfolio holdings with the SEC for the first quarter and the third quarter of each fiscal year on Form N-Q. The Fund’s Form N-Q filings are available on the SEC’s website at www.sec.gov. Those forms may be reviewed and copied at the SEC’s Public Reference Room in Washington, D.C. Information on the operation of the Public Reference Room may be obtained by calling 1-800-SEC-0330.
36 OPPENHEIMER CAPITAL INCOME FUND/VA
TRUSTEES AND OFFICERS Unaudited
| | |
Name, Position(s) Held with the Fund, Length of
Service, Year of Birth | | Principal Occupation(s) During the Past 5 Years; Other Trusteeships/Directorships
Held; Number of Portfolios in the Fund Complex Currently Overseen |
| |
| INDEPENDENT TRUSTEES | | The address of each Trustee in the chart below is 6803 S. Tucson Way, Centennial, Colorado 80112-3924. Each Trustee serves for an indefinite term, or until his or her resignation, retirement, death or removal. |
| |
Sam Freedman, Chairman of the Board of Trustees (since 2013) and Trustee (since 1996) Year of Birth: 1940 | | Director of Colorado UpLIFT (charitable organization) (since September 1984). Mr. Freedman held several positions with the Sub-Adviser and with subsidiary or affiliated companies of the Sub-Adviser (until October 1994). Oversees 39 portfolios in the OppenheimerFunds complex. Mr. Freedman has served on the Boards of certain Oppenheimer funds since 1996, during which time he has become familiar with the Fund’s (and other Oppenheimer funds’) financial, accounting, regulatory and investment matters and has contributed to the Boards’ deliberations. |
| |
Edward L. Cameron, Trustee (since 1999) Year of Birth: 1938 | | Member of The Life Guard of Mount Vernon (George Washington historical site) (June 2000-June 2006); Partner of PricewaterhouseCoopers LLP (accounting firm) (July 1974-June 1999); Chairman of Price Waterhouse LLP Global Investment Management Industry Services Group (accounting firm) (July 1994-June 1998). Oversees 39 portfolios in the OppenheimerFunds complex. Mr. Cameron has served on the Boards of certain Oppenheimer funds since 1999, during which time he has become familiar with the Fund’s (and other Oppenheimer funds’) financial, accounting, regulatory and investment matters and has contributed to the Boards’ deliberations. |
| |
Jon S. Fossel, Trustee (since 1990) Year of Birth: 1942 | | Chairman of the Board (2006-December 2011) and Director (June 2002-December 2011) of UNUMProvident (insurance company); Director of Northwestern Energy Corp. (public utility corporation) (November 2004-December 2009); Director of P.R. Pharmaceuticals (October 1999-October 2003); Director of Rocky Mountain Elk Foundation (non-profit organization) (February 1998-February 2003 and February 2005-February 2007); Chairman and Director (until October 1996) and President and Chief Executive Officer (until October 1995) of the Sub-Adviser; President, Chief Executive Officer and Director of the following: Oppenheimer Acquisition Corp. (“OAC”) (parent holding company of the Sub-Adviser), Shareholders Services, Inc. and Shareholder Financial Services, Inc. (until October 1995). Oversees 39 portfolios in the OppenheimerFunds complex. Mr. Fossel has served on the Boards of certain Oppenheimer funds since 1990, during which time he has become familiar with the Fund’s (and other Oppenheimer funds’) financial, accounting, regulatory and investment matters and has contributed to the Boards’ deliberations. |
| |
Richard F. Grabish, Trustee (since 2012) Year of Birth: 1948 | | Formerly Senior Vice President and Assistant Director of Sales and Marketing (March 1997-December 2007), Director (March 1987-December 2007) and Manager of Private Client Services (June 1985-June 2005) of A.G. Edwards & Sons, Inc. (broker/dealer and investment firm); Chairman and Chief Executive Officer of A.G. Edwards Trust Company, FSB (March 2001-December 2007); President and Vice Chairman of A.G. Edwards Trust Company, FSB (investment adviser) (April 1987-March 2001); President of A.G. Edwards Trust Company, FSB (investment adviser) (June 2005-December 2007). Oversees 39 portfolios in the OppenheimerFunds complex. Mr. Grabish has served on the Boards of certain Oppenheimer funds since 2001, during which time he has become familiar with the Fund’s (and other Oppenheimer funds’) financial, accounting, regulatory and investment matters and has contributed to the Boards’ deliberations. |
| |
Beverly L. Hamilton, Trustee (since 2002) Year of Birth: 1946 | | Trustee of Monterey Institute for International Studies (educational organization) (since February 2000); Board Member of Middlebury College (educational organization) (December 2005-June 2011); Chairman (since 2010) of American Funds’ Emerging Markets Growth Fund, Inc. (mutual fund); Director of The California Endowment (philanthropic organization) (April 2002-April 2008); Director (February 2002-2005) and Chairman of Trustees (2006-2007) of the Community Hospital of Monterey Peninsula; Director (October 1991-2005); Vice Chairman (2006-2009) of American Funds’ Emerging Markets Growth Fund, Inc. (mutual fund); President of ARCO Investment Management Company (February 1991-April 2000); Member of the investment committees of The Rockefeller Foundation (2001-2006) and The University of Michigan (since 2000); Advisor at Credit Suisse First Boston’s Sprout venture capital unit (venture capital fund) (1994-January 2005); Trustee of MassMutual Institutional Funds (investment company) (1996-June 2004); Trustee of MML Series Investment Fund (investment company) (April 1989-June 2004); Member of the investment committee of Hartford Hospital (2000-2003); and Advisor to Unilever (Holland) pension fund (2000-2003). Oversees 39 portfolios in the OppenheimerFunds complex. Ms. Hamilton has served on the Boards of certain Oppenheimer funds since 2002, during which time she has become familiar with the Fund’s (and other Oppenheimer funds’) financial, accounting, regulatory and investment matters and has contributed to the Boards’ deliberations. |
| |
Victoria J. Herget, Trustee (since 2012) Year of Birth:1951 | | Independent Director of the First American Funds (mutual fund family) (2003-2011); former Managing Director (1993-2001), Principal (1985-1993), Vice President (1978-1985) and Assistant Vice President (1973-1978) of Zurich Scudder Investments (and its predecessor firms); Board Chair (2008-Present) and Director (2004-Present), United Educators (insurance company); Trustee (1992-2007), Chair of the Board of Trustees (1999-2007), Investment Committee Chair (1994-1999) and Investment Committee member (2007-2010) of Wellesley College; Trustee (since 2000) and Chair (since 2010), Newberry Library; Trustee, Mather LifeWays (since 2001); Trustee, BoardSource (2006-2009) and Chicago City Day School (1994-2005). Oversees 39 portfolios in the OppenheimerFunds complex. Ms. Herget has served on the Boards of certain Oppenheimer funds since 2012, during which time she has become familiar with the Fund’s (and other Oppenheimer funds’) financial, accounting, regulatory and investment matters and has contributed to the Boards’ deliberations. |
| |
Robert J. Malone, Trustee (since 2002) Year of Birth: 1944 | | Chairman of the Board (since 2012) and Director (since August 2005) of Jones International University (educational organization) (since August 2005); Chairman, Chief Executive Officer and Director of Steele Street Bank Trust (commercial banking) (since August 2003); Trustee of the Gallagher Family Foundation (non-profit organization) (since 2000); Board of Directors of Opera Colorado Foundation (non-profit organization) (2008-2012); Director of Colorado UpLIFT (charitable organization) (1986-2010); Director of Jones Knowledge, Inc. (2006-2010); Former Chairman of U.S. Bank-Colorado (subsidiary |
37 OPPENHEIMER CAPITAL INCOME FUND/VA
TRUSTEES AND OFFICERS Unaudited / Continued
| | |
Robert J. Malone, Continued | | of U.S. Bancorp and formerly Colorado National Bank) (July 1996-April 1999); Director of Commercial Assets, Inc. (real estate investment trust) (1993-2000); Director of U.S. Exploration, Inc. (oil and gas exploration) (1997-February 2004); Chairman of the Board (1991-1994) and Trustee (1985-1994) of Regis University; and Chairman of the Board (1990-1991 and Trustee (1984-1999) of Young Presidents Organization. Oversees 39 portfolios in the OppenheimerFunds complex. Mr. Malone has served on the Boards of certain Oppenheimer funds since 2002, during which time he has become familiar with the Fund’s (and other Oppenheimer funds’) financial, accounting, regulatory and investment matters and has contributed to the Boards’ deliberations. |
| |
F. William Marshall, Jr., Trustee (since 2000) Year of Birth: 1942 | | Trustee Emeritus of Worcester Polytech Institute (WPI) (private university) (since 2009); Trustee of MassMutual Select Funds (formerly MassMutual Institutional Funds) (investment company) (since 1996), MML Series Investment Fund (investment company) (since 1996) and Mass Mutual Premier Funds (investment company) (since January 2012); President and Treasurer of the SIS Fund (private charitable fund) (January 1999 – March 2011); Former Trustee of WPI (1985-2008); Former Chairman of the Board (2004-2006) and Former Chairman of the Investment Committee of WPI (1994-2008); Chairman of SIS & Family Bank, F.S.B. (formerly SIS Bank) (commercial bank) (January 1999-July 1999); Executive Vice President of Peoples Heritage Financial Group, Inc. (commercial bank) (January 1999-July 1999); and Former President and Chief Executive Officer of SIS Bancorp. (1993-1999). Oversees 43 portfolios in the OppenheimerFunds complex. Mr. Marshall has served on the Boards of certain Oppenheimer funds since 2000, during which time he has become familiar with the Fund’s (and other Oppenheimer funds’) financial, accounting, regulatory and investment matters and has contributed to the Boards’ deliberations. |
| |
Karen L. Stuckey, Trustee (since 2012) Year of Birth: 1953 | | Partner (1990-2012) of PricewaterhouseCoopers LLP (held various positions 1975-1990); Emeritus Trustee (since 2006), Trustee (1992-2006) and member of Executive, Nominating and Audit Committees and Chair of Finance Committee of Lehigh University; and member, Women’s Investment Management Forum since inception. Oversees 39 portfolios in the OppenheimerFunds complex. Ms. Stuckey has served on the Boards of certain Oppenheimer funds since 2012, during which time she has become familiar with the Fund’s (and other Oppenheimer funds’) financial, accounting, regulatory and investment matters and has contributed to the Boards’ deliberations. |
| |
James D. Vaughn, Trustee (since 2012) Year of Birth: 1945 | | Retired; former managing partner (1994-2001) of Denver office of Deloitte & Touche LLP, (held various positions 1969-1993); Trustee and Chairman of the Audit Committee of Schroder Funds (2003-2012); Board member and Chairman of Audit Committee of AMG National Trust Bank (since 2005); Trustee and Investment Committee member, University of South Dakota Foundation (since 1996); Board member, Audit Committee Member and past Board Chair, Junior Achievement (since 1993); former Board member, Mile High United Way, Boys and Girls Clubs, Boy Scouts, Colorado Business Committee for the Arts, Economic Club of Colorado and Metro Denver Network. Oversees 39 portfolios in the OppenheimerFunds complex. Mr. Vaughn has served on the Boards of certain Oppenheimer funds since 2012, during which time he has become familiar with the Fund’s (and other Oppenheimer funds’) financial, accounting, regulatory and investment matters and has contributed to the Boards’ deliberations. |
|
| |
| INTERESTED TRUSTEE AND OFFICER | | Mr. Glavin is an “Interested Trustee” because he is affiliated with the Manager and the Sub-Adviser by virtue of his positions as an officer and director of the Manager and a director of the Sub-Adviser, and as a shareholder of the Sub-Adviser’s parent company. Both as a Trustee and as an officer, he serves for an indefinite term, or until his resignation, retirement, death or removal. Mr. Glavin’s address is Two World Financial Center, 225 Liberty Street, 11th Floor, New York, New York 10281-1008. |
| |
William F. Glavin, Jr., Trustee, President and Principal Executive Officer (since 2009) Year of Birth: 1958 | | Director, Chairman and Chief Executive Officer of the Manager (since January 2013); President of the Manager (January 2013-May 2013); Chairman of the Sub-Adviser (December 2009-December 2012); Chief Executive Officer (January 2009-December 2012) and Director of the Sub-Adviser (since January 2009); President of the Sub-Adviser (May 2009-December 2012); Management Director (since June 2009), President (since December 2009) and Chief Executive Officer (since January 2011) of Oppenheimer Acquisition Corp. (“OAC”) (the Sub-Adviser’s parent holding company); Director of Oppenheimer Real Asset Management, Inc. (since March 2010); Executive Vice President (March 2006-February 2009) and Chief Operating Officer (July 2007-February 2009) of Massachusetts Mutual Life Insurance Company (OAC’s parent company); Director (May 2004-March 2006) and Chief Operating Officer and Chief Compliance Officer (May 2004-January 2005), President (January 2005-March 2006) and Chief Executive Officer (June 2005-March 2006) of Babson Capital Management LLC; Director (March 2005-March 2006), President (May 2003-March 2006) and Chief Compliance Officer (July 2005-March 2006) of Babson Capital Securities, Inc. (a broker-dealer); President (May 2003-March 2006) of Babson Investment Company, Inc.; Director (May 2004-August 2006) of Babson Capital Europe Limited; Director (May 2004-October 2006) of Babson Capital Guernsey Limited; Director (May 2004-March 2006) of Babson Capital Management LLC; Non-Executive Director (March 2005-March 2007) of Baring Asset Management Limited; Director (February 2005-June 2006) Baring Pension Trustees Limited; Director and Treasurer (December 2003-November 2006) of Charter Oak Capital Management, Inc.; Director (May 2006-September 2006) of C.M. Benefit Insurance Company; Director (May 2008-June 2009) and Executive Vice President (June 2007-July 2009) of C.M. Life Insurance Company; President (March 2006-May 2007) of MassMutual Assignment Company; Director (January 2005-December 2006), Deputy Chairman (March 2005-December 2006) and President (February 2005-March 2005) of MassMutual Holdings (Bermuda) Limited; Director (May 2008-June 2009) and Executive Vice President (June 2007-July 2009) of MML Bay State Life Insurance Company; Chief Executive Officer and President (April 2007-January 2009) of MML Distributors, LLC; and Chairman (March 2006-December 2008) and Chief Executive Officer (May 2007-December 2008) of MML Investors Services, Inc. An officer of 90 portfolios in the OppenheimerFunds complex. |
38 OPPENHEIMER CAPITAL INCOME FUND/VA
| | |
|
| |
| OTHER OFFICERS OF THE FUND | | The addresses of the Officers in the chart below are as follows: for Messrs. Memani, Krantz, Gabinet and Ms. Nasta, Two World Financial Center, 225 Liberty Street, New York, New York 10281-1008, for Messrs. Vandehey and Wixted. Each Officer serves for an indefinite term or until his or her resignation, retirement, death or removal. |
| |
Krishna Memani, Vice President (since 2009) Year of Birth: 1960 | | President of the Sub-Adviser (since January 2013); Executive Vice President of the Manager (since January 2014) and Chief Investment Officer of the OppenheimerFunds advisory entities (since January 2014). Chief Investment Officer, Fixed Income of the Sub-Adviser (January 2013-December 2013); Head of the Investment Grade Fixed Income Team of the Sub-Adviser (March 2009-January 2014); Director of Fixed Income of the Sub-Adviser (October 2010-December 2012); Senior Vice President of the Sub-Adviser (March 2009-December 2012) and Senior Vice President of OFI Global Institutional, Inc. (April 2009-December 2012). Managing Director and Head of the U.S. and European Credit Analyst Team at Deutsche Bank Securities (June 2006-January 2009). Chief Credit Strategist at Credit Suisse Securities (August 2002-March 2006). Managing Director and Senior Portfolio Manager at Putnam Investments (September 1998-June 2002). A portfolio manager and an officer of other portfolios in the OppenheimerFunds complex. |
| |
Magnus Krantz, Vice President (since 2013) Year of Birth: 1967 | | Vice President of the Sub-Adviser (since May 2009) and a portfolio manager of the Sub-Adviser (since November 2012); sector manager for technology for the Sub-Adviser’s Main Street Investment Team (since May 2009). Prior to joining the Sub-Adviser, Mr. Krantz was a sector manager at RS Investment and Guardian Life Insurance Company. Mr. Krantz joined Guardian Life Insurance Company in December 2005 and transitioned to RS Investments in October 2006 in connection with Guardian Life Insurance Company’s acquisition of an interest in RS Investments. Portfolio manager and analyst at Citigroup Asset Management (1998-2005) and as a consultant at Price Waterhouse (1997-1998). He also served as product development engineer at Newbridge Networks (1993-1996) and as a software engineer at Mitel Corporation (1990-1993). A portfolio manager and officer of other portfolios in the OppenheimerFunds complex. |
| |
Arthur S. Gabinet, Secretary and Chief Legal Officer (since 2011) Year of Birth: 1958 | | Executive Vice President, Secretary and General Counsel of the Manager (since January 2013); General Counsel OFI SteelPath, Inc. (since January 2013); Executive Vice President (May 2010-December 2012) and General Counsel (since January 2011) of the Sub-Adviser; General Counsel of the Distributor (since January 2011); General Counsel of Centennial Asset Management Corporation (January 2011-December 2012); Executive Vice President (January 2011-December 2012) and General Counsel of HarbourView Asset Management Corporation (since January 2011); Assistant Secretary (since January 2011) and Director (since January 2011) of OppenheimerFunds International Ltd. and OppenheimerFunds plc; Director of Oppenheimer Real Asset Management, Inc. (January 2011-December 2012) and General Counsel (since January 2011); Executive Vice President (January 2011-December 2011) and General Counsel of Shareholder Financial Services, Inc. and Shareholder Services, Inc. (since January 2011); Executive Vice President (January 2011-December 2012) and General Counsel of OFI Private Investments Inc. (since January 2011); Vice President of OppenheimerFunds Legacy Program (January 2011-December 2011); Executive Vice President (January 2011-December 2012) and General Counsel of OFI Institutional Asset Management, Inc. (since January 2011); General Counsel, Asset Management of the Sub-Adviser (May 2010-December 2010); Principal, The Vanguard Group (November 2005-April 2010); District Administrator, U.S. Securities and Exchange Commission (January 2003-October 2005). An officer of 90 portfolios in the OppenheimerFunds complex. |
| |
Christina M. Nasta, Vice President and Chief Business Officer (since 2011) Year of Birth: 1973 | | Senior Vice President of OppenheimerFunds Distributor, Inc. (since January 2013); Senior Vice President of the Sub-Adviser (July 2010-December 2012); Vice President of the Sub-Adviser (January 2003-July 2010); Vice President of OppenheimerFunds Distributor, Inc. (January 2003-July 2010). An officer of 90 portfolios in the OppenheimerFunds complex. |
| |
Mark S. Vandehey, Vice President and Chief Compliance Officer (since 2004) Year of Birth: 1950 | | Senior Vice President and Chief Compliance Officer of the Manager (since January 2013); Chief Compliance Officer of OFI SteelPath, Inc. (since January 2013); Senior Vice President of the Sub-Adviser (March 2004-December 2012); Chief Compliance Officer of the Sub-Adviser, OppenheimerFunds Distributor, Inc., OFI Trust Company, OFI Institutional Asset Management, Inc., Oppenheimer Real Asset Management, Inc., OFI Private Investments, Inc., Harborview Asset Management Corporation, Trinity Investment Management Corporation, and Shareholder Services, Inc. (since March 2004); Vice President of OppenheimerFunds Distributor, Inc., Centennial Asset Management Corporation and Shareholder Services, Inc. (June 1983-December 2012). An officer of 90 portfolios in the OppenheimerFunds complex. |
| |
Brian W. Wixted, Treasurer and Principal Financial & Accounting Officer (since 1999) Year of Birth: 1959 | | Senior Vice President of the Manager (since January 2013); Treasurer of the Sub-Adviser, HarbourView Asset Management Corporation, Shareholder Financial Services, Inc., Shareholder Services, Inc., and Oppenheimer Real Asset Management, Inc. (March 1999-June 2008), OFI Private Investments, Inc. (March 2000-June 2008), OppenheimerFunds International Ltd. and OppenheimerFunds plc (since May 2000), OFI Institutional Asset Management, Inc. (November 2000-June 2008), and OppenheimerFunds Legacy Program (charitable trust program established by the Sub-Adviser) (June 2003-December 2011); Treasurer and Chief Financial Officer of OFI Trust Company (since May 2000); Assistant Treasurer of Oppenheimer Acquisition Corporation (March 1999-June 2008). An officer of 90 portfolios in the OppenheimerFunds complex. |
The Fund’s Statement of Additional Information contains additional information about the Fund’s Trustees and Officers and is available without charge, upon request, by calling 1.800.988.8287.
39 OPPENHEIMER CAPITAL INCOME FUND/VA
OPPENHEIMER CAPITAL INCOME FUND/VA
A Series of Oppenheimer Variable Account Funds
| | |
| Manager | | OFI Global Asset Management, Inc. |
| |
| Sub-Adviser | | OppenheimerFunds, Inc. |
| |
| Distributor | | OppenheimerFunds Distributor, Inc. |
| |
Transfer and Shareholder Servicing Agent | | OFI Global Asset Management, Inc. |
| |
| Sub-Transfer Agent | | Shareholder Services, Inc. DBA OppenheimerFunds Services |
| |
Independent Registered Public Accounting Firm | | KPMG LLP |
| |
| Counsel | | K&L Gates LLP |
| |
| | Before investing, investors should carefully consider a fund’s investment objectives, risks, charges and expenses. Fund prospectuses and summary prospectuses contain this and other information about the funds, and may be obtained by asking your financial advisor, or calling us at 1.800.988.8287. Read prospectuses and summary prospectuses carefully before investing. |
| |
| | © 2014 OppenheimerFunds, Inc. All rights reserved. Oppenheimer funds are distributed by OppenheimerFunds Distributor, Inc. |

| | | | | | |
| December 31, 2013 | | | | |
| | | Oppenheimer Capital Appreciation Fund/VA A Series of Oppenheimer Variable Account Funds | | | Annual Report | |
| | |
| | ANNUAL REPORT Listing of Top Holdings Fund Performance Discussion Financial Statements | | | | |

Portfolio Manager: Michael Kotlarz
Average Annual Total Returns
For the Periods Ended 12/31/13
| | | | | | | | | | | | |
| | | 1-Year | | | 5-Year | | | 10-Year | |
Non-Service Shares | | | 29.74 | % | | | 18.27% | | | | 5.73% | |
Service Shares | | | 29.43 | % | | | 17.98% | | | | 5.46% | |
Performance data quoted represents past performance, which does not guarantee future results. The investment return and principal value of an investment in the Fund will fluctuate so that an investor’s shares, when redeemed, may be worth more or less than their original cost. Current performance may be lower or higher than the performance quoted. For performance data current to the most recent month end, call us at 1.800.988.8287. The Fund’s total returns should not be expected to be the same as the returns of other funds, whether or not both funds have the same portfolio managers and/or similar names. The Fund’s total returns include changes in share price and reinvested distributions but do not include the charges associated with the separate account products that offer this Fund. Such performance would have been lower if such charges were taken into account.
| | | | |
TOP TEN COMMON STOCK HOLDINGS | | | | |
Apple, Inc. | | | 6.5% | |
Google, Inc., Cl. A | | | 4.3 | |
Biogen Idec, Inc. | | | 3.4 | |
Facebook, Inc., Cl. A | | | 3.2 | |
Gilead Sciences, Inc. | | | 3.1 | |
Walt Disney Co. (The) | | | 3.0 | |
MasterCard, Inc., Cl. A | | | 2.5 | |
Celgene Corp. | | | 2.2 | |
Amazon.com, Inc. | | | 2.2 | |
Twenty-First Century Fox, Inc., Cl. B | | | 2.2 | |
Portfolio holdings and allocations are subject to change. Percentages are as of December 31, 2013, and are based on net assets. For more current Fund holdings, please visit oppenheimerfunds.com.
SECTOR ALLOCATION
Portfolio holdings and allocations are subject to change. Percentages are as of December 31, 2013, and are based on the total market value of common stocks.
2 OPPENHEIMER CAPITAL APPRECIATION FUND/VA
Fund Performance Discussion
The Fund’s Non-Service shares produced a total return of 29.74% during the one-year reporting period ended December 31, 2013, underperforming the Russell 1000 Growth Index (the “Index”), which returned 33.48%. The Fund’s underperformance stemmed primarily from weaker relative stock selection in the information technology, energy and consumer discretionary sectors. The Fund outperformed the Index in financials and industrials due to stronger relative stock selection. In addition, an overweight position in health care and not holding any investments in telecommunication services benefited relative performance this period. The Fund also underperformed the S&P 500 Index, which returned 32.39%.
MARKET OVERVIEW
Equities in the U.S. and developed markets throughout the world delivered strong performance in 2013. Accommodative monetary policies on the part of central banks in the U.S., Europe and Japan, combined with supportive equity valuations relative to bonds, were instrumental in this performance. Signs that the U.S. economy was on the mend, demonstrated by rising house prices, also helped sentiment toward stocks. While equities performed well for the year, numerous concerns remained. Namely, in late May, remarks by Federal Reserve (“Fed”) chairman Ben Bernanke were widely interpreted as a signal that U.S. monetary policymakers would begin to back away from their quantitative easing program sooner than expected, sparking heightened volatility in financial markets throughout the world. Additionally, fears began to creep into the market about a possible slowdown in the world’s emerging economies. However, market conditions generally stabilized over the summer of 2013. While the Fed unexpectedly refrained from reducing its monthly bond purchases in September, in December, the Central Bank announced that it would reduce its monthly bond purchases by $10 billion, from $85 billion to $75 billion, starting in January 2014. The Fed also announced that it would continue to hold short-term interest rates at very low levels until unemployment in the United States subsided below 6.5%. This was lower than its earlier 7% target.
TOP INDIVIDUAL CONTRIBUTORS
During the reporting period, the top performing stock holding for the Fund was Google, Inc. Google, the leading internet search engine, benefited from momentum in its continued campaign to enhance price utilization for its mobile searches. While the company has struggled with declining mobile premiums, it staved off a dent in revenue by selling more ads at a faster rate. The volume of clicks on advertisements climbed at the fastest pace in 2013, compensating for a drop in average-ad prices.
Also contributing positively to performance were health care stocks Biogen Idec, Inc. and Vertex Pharmaceuticals, Inc., and consumer discretionary holding The Walt Disney Co. Biogen Idec is a global biotechnology company that benefited from strong sales of its multiple-sclerosis treatment Tecfidera. Vertex Pharmaceuticals, a developer of small molecule pharmaceuticals for multiple diseases, released data on a compound that it was developing that showed robust benefits for cystic fibrosis patients. This positive data also boosted optimism around the entire platform of cystic fibrosis drugs that Vertex is developing. Walt Disney produces movies, television programs, musical recordings, books, magazines, and merchandise for entertainment and education. It also operates distribution channels such as television networks, theme parks, hotels, cruise lines, retail stores and classrooms. The company’s major investments in a new cruise ship and multiple amusement park upgrades in 2012 started to pay off in 2013.
TOP INDIVIDUAL DETRACTORS
Detractors from performance this period included information technology stocks Teradata Corp., Cognizant Technology Solutions Corp. and VMware, Inc. Teradata, a provider of analytic data solutions through its database management service, warned third quarter results would miss analysts’ expectations and cut its full-year outlook, saying sales were weak outside the U.S. and Europe. Management noted that international macro challenges were delaying some opportunities. Cognizant Technology Solutions is a multinational information technology, consulting and business process outsourcing company that experienced declines in April. VMware, a provider for server virtualization software, suffered from concerns that the company was losing market share in its core server virtualization market. We exited all three stocks during the reporting period.
STRATEGY & OUTLOOK
The Fund continues to operate with the philosophy that long-term market outperformance can be achieved by investing in a managed portfolio of high quality growth stocks. We combine strategic top-down sector analysis with bottom up fundamental research, focusing on high quality companies with historically consistent growth and capital discipline.
Uncertainty about the Eurozone crisis, questions regarding the collateral impact of the reduction of the Federal Reserve’s “Quantitative Easing” program, and the risk of deceleration in China continues to weigh on the global economy. The U.S. economy remains resilient, but continues to grow at a below normal expansionary pace and with subpar labor participation. The U.S. economy has been supported by strong productivity gains, low structural energy costs and a relatively attractive currency. Looking forward, we expect the U.S. economy to retain many of these issues and for the markets to reward those companies
3 OPPENHEIMER CAPITAL APPRECIATION FUND/VA
demonstrating consistent quality, growth, and innovation. We expect that companies with capital discipline, strong management, and sustainable competitive advantages have the greatest prospects for outperformance over time.
Investors should consider the Fund’s investment objective, risks, charges and expenses carefully before investing. The Fund’s prospectus and summary prospectus contain this and other information about the Fund, and may be obtained by asking your financial advisor or calling us at 1.800.988.8287. Read prospectuses and summary prospectuses carefully before investing.
Total returns include changes in share price and reinvestment of dividends and capital gains distributions in a hypothetical investment for the periods shown.
The Fund’s investment strategy and focus can change over time. The mention of specific fund holdings does not constitute a recommendation by OppenheimerFunds, Inc. or its affiliates.
Shares of Oppenheimer funds are not deposits or obligations of any bank, are not guaranteed by any bank, are not insured by the FDIC or any other agency, and involve investment risks, including the possible loss of the principal amount invested.
Comparing the Fund’s Performance to the Market. The graphs that follow show the performance of a hypothetical $10,000 investment in each share class of the Fund held until December 31, 2013. Performance is measured over a ten-fiscal-year period for both Classes. Performance information does not reflect charges that apply to separate accounts investing in the Fund. If these charges were taken into account, performance would be lower. The graphs assume that all dividends and capital gains distributions were reinvested in additional shares.
The Fund’s performance is compared to the performance of the S&P 500 Index and the Russell 1000 Growth Index. The S&P 500 Index is a capitalization-weighted index of 500 stocks intended to be a representative sample of leading companies in leading industries within the U.S. economy. The Russell 1000 Growth Index measures the performance of the large-cap growth segment of the U.S. equity universe. It includes those Russell 1000 companies with higher price-to-book ratios and higher forecasted growth values. Indices are unmanaged and cannot be purchased directly by investors. Index performance includes reinvestment of income, but does not reflect transaction costs, fees, expenses or taxes. Index performance is shown for illustrative purposes only as a benchmark for the Fund’s performance, and does not predict or depict performance of the Fund. The Fund’s performance reflects the effects of the Fund’s business and operating expenses.
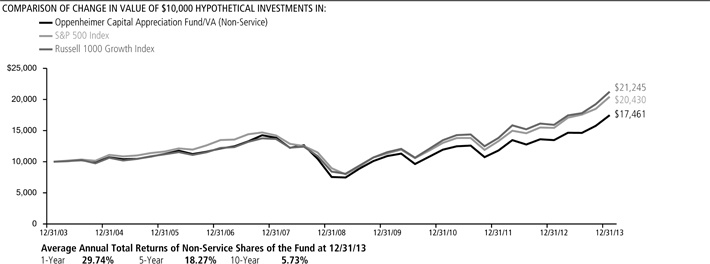
4 OPPENHEIMER CAPITAL APPRECIATION FUND/VA
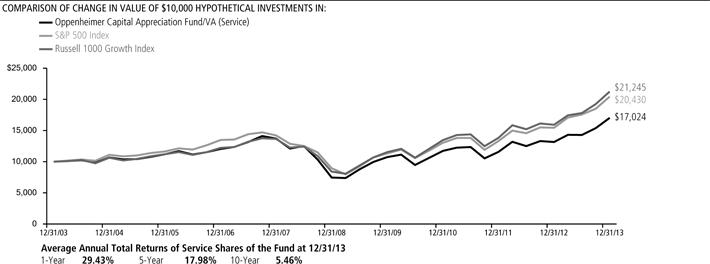
Performance data quoted represents past performance, which does not guarantee future results. The investment return and principal value of an investment in the Fund will fluctuate so that an investor’s shares, when redeemed, may be worth more or less than their original cost. Current performance may be lower or higher than the performance quoted. For performance data current to the most recent month end, call us at 1.800. 988.8287. The Fund’s total returns should not be expected to be the same as the returns of other funds, whether or not both funds have the same portfolio managers and/or similar names. The Fund’s total returns include changes in share price and reinvested distributions but do not include the charges associated with the separate account products that offer this Fund. Such performance would have been lower if such charges were taken into account.
5 OPPENHEIMER CAPITAL APPRECIATION FUND/VA
Fund Expenses
Fund Expenses. As a shareholder of the Fund, you incur two types of costs: (1) transaction costs and (2) ongoing costs, including management fees; distribution and service fees; and other Fund expenses. These examples are intended to help you understand your ongoing costs (in dollars) of investing in the Fund and to compare these costs with the ongoing costs of investing in other mutual funds.
The examples are based on an investment of $1,000.00 invested at the beginning of the period and held for the entire 6-month period ended December 31, 2013.
Actual Expenses. The first section of the table provides information about actual account values and actual expenses. You may use the information in this section for the class of shares you hold, together with the amount you invested, to estimate the expense that you paid over the period. Simply divide your account value by $1,000.00 (for example, an $8,600.00 account value divided by $1,000.00 = 8.60), then multiply the result by the number in the first section under the heading entitled “Expenses Paid During Period” to estimate the expenses you paid on your account during this period.
Hypothetical Example for Comparison Purposes.
The second section of the table provides information about hypothetical account values and hypothetical expenses based on the Fund’s actual expense ratio for each class of shares, and an assumed rate of return of 5% per year for each class before expenses, which is not the actual return. The hypothetical account values and expenses may not be used to estimate the actual ending account balance or expenses you paid for the period. You may use this information to compare the ongoing costs of investing in the Fund and other funds. To do so, compare this 5% hypothetical example for the class of shares you hold with the 5% hypothetical examples that appear in the shareholder reports of the other funds.
Please note that the expenses shown in the table are meant to highlight your ongoing costs only and do not reflect any charges associated with the separate accounts that offer this Fund. Therefore, the “hypothetical” lines of the table are useful in comparing ongoing costs only, and will not help you determine the relative total costs of owning different funds. In addition, if these separate account charges were included your costs would have been higher.
| | | | | | | | | | | | | | |
| Actual | | Beginning
Account Value
July 1, 2013 | | | Ending Account Value
December 31, 2013 | | | Expenses Paid During
6 Months Ended
December 31, 2013 | | | |
Non-Service shares | | $ | 1,000.00 | | | $ | 1,193.70 | | | $ | 4.49 | | | |
Service shares | | | 1,000.00 | | | | 1,192.00 | | | | 5.93 | | | |
| | | | |
Hypothetical | | | | | | | | | | | | | | |
(5% return before expenses) | | | | | | | | | | | | | | |
Non-Service shares | | | 1,000.00 | | | | 1,021.12 | | | | 4.13 | | | |
Service shares | | | 1,000.00 | | | | 1,019.81 | | | | 5.46 | | | |
Expenses are equal to the Fund’s annualized expense ratio for that class, multiplied by the average account value over the period, multiplied by 184/365 (to reflect the one-half year period). Those annualized expense ratios, excluding indirect expenses from affiliated funds, based on the 6-month period ended December 31, 2013 are as follows:
| | | | | | |
| Class | | Expense Ratios | | | |
Non-Service shares | | | 0.81% | | | |
Service shares | | | 1.07 | | | |
The expense ratios reflect contractual waivers and/or reimbursements of expenses by the Fund’s Manager. Some of these undertakings may be modified or terminated at any time, unless approved by the Board of Trustees. The “Financial Highlights” tables in the Fund’s financial statements, included in this report, also show the gross expense ratios, without such waivers or reimbursements and reduction to custodian expenses, if applicable.
6 OPPENHEIMER CAPITAL APPRECIATION FUND/VA
STATEMENTOF INVESTMENTS December 31, 2013
| | | | | | | | | | |
| | | Shares | | | Value | | | |
Common Stocks—100.4% | | | | | | | | | | |
Consumer Discretionary—18.5% | | | | | | | | | | |
Hotels, Restaurants & Leisure—0.5% | | | |
Chipotle Mexican Grill, Inc.1 | | | 9,790 | | | $ | 5,215,916 | | | |
Internet & Catalog Retail—4.4% | | | | | | | | | | |
Amazon.com, Inc.1 | | | 54,694 | | | | 21,811,420 | | | |
Priceline.com, Inc.1 | | | 8,960 | | | | 10,415,104 | | | |
TripAdvisor, Inc.1 | | | 131,010 | | | | 10,851,558 | | | |
| | | | | | | | 43,078,082 | | | |
Media—6.4% | | | | | | | | | | |
Time Warner, Inc. | | | 176,280 | | | | 12,290,242 | | | |
Twenty-First Century Fox, Inc., Cl. B | | | 627,140 | | | | 21,699,044 | | | |
Walt Disney Co. (The) | | | 382,930 | | | | 29,255,852 | | | |
| | | | | | | | 63,245,138 | | | |
Specialty Retail—4.6% | | | | | | | | | | |
Home Depot, Inc. (The) | | | 176,600 | | | | 14,541,244 | | | |
O’Reilly Automotive, Inc.1 | | | 39,740 | | | | 5,114,935 | | | |
Tiffany & Co. | | | 117,030 | | | | 10,858,043 | | | |
TJX Cos., Inc. (The) | | | 226,050 | | | | 14,406,167 | | | |
| | | | | | | | 44,920,389 | | | |
Textiles, Apparel & Luxury Goods—2.6% | | | |
Nike, Inc., Cl. B | | | 224,170 | | | | 17,628,729 | | | |
VF Corp. | | | 125,480 | | | | 7,822,423 | | | |
| | | | | | | | 25,451,152 | | | |
Consumer Staples—7.6% | | | | | | | | | | |
Beverages—2.6% | | | | | | | | | | |
Brown-Forman Corp., Cl. B | | | 143,115 | | | | 10,815,201 | | | |
SABMiller plc | | | 292,440 | | | | 15,060,158 | | | |
| | | | | | | | 25,875,359 | | | |
Food & Staples Retailing—3.1% | | | | | | | | | | |
Costco Wholesale Corp. | | | 95,590 | | | | 11,376,166 | | | |
CVS Caremark Corp. | | | 261,620 | | | | 18,724,143 | | | |
| | | | | | | | 30,100,309 | | | |
Food Products—1.9% | | | | | | | | | | |
Flowers Foods, Inc. | | | 119,250 | | | | 2,560,297 | | | |
Hershey Co. (The) | | | 48,420 | | | | 4,707,877 | | | |
J.M. Smucker Co. (The) | | | 105,370 | | | | 10,918,439 | | | |
| | | | | | | | 18,186,613 | | | |
Energy—5.7% | | | | | | | | | | |
Energy Equipment & Services—2.8% | | | |
Ensco plc, Cl. A | | | 40,440 | | | | 2,312,359 | | | |
Halliburton Co. | | | 255,860 | | | | 12,984,895 | | | |
Noble Corp. plc | | | 63,210 | | | | 2,368,479 | | | |
Oceaneering International, Inc. | | | 136,360 | | | | 10,756,077 | | | |
| | | | | | | | 28,421,810 | | | |
Oil, Gas & Consumable Fuels—2.9% | | | |
Antero Resources Corp.1 | | | 98,110 | | | | 6,224,098 | | | |
EOG Resources, Inc. | | | 40,630 | | | | 6,819,339 | | | |
Noble Energy, Inc. | | | 91,430 | | | | 6,227,297 | | | |
Pioneer Natural Resources Co. | | | 52,490 | | | | 9,661,834 | | | |
| | | | | | | | 28,932,568 | | | |
Financials—7.8% | | | | | | | | | | |
Capital Markets—6.0% | | | | | | | | | | |
Ameriprise Financial, Inc. | | | 127,280 | | | | 14,643,564 | | | |
Charles Schwab Corp. (The) | | | 497,880 | | | | 12,944,880 | | | |
Goldman Sachs Group, Inc. (The) | | | 67,980 | | | | 12,050,135 | | | |
Invesco Ltd. | | | 296,230 | | | | 10,782,772 | | | |
Northern Trust Corp. | | | 139,230 | | | | 8,616,945 | | | |
| | | | | | | | 59,038,296 | | | |
Insurance—1.6% | | | | | | | | | | |
Aon plc | | | 186,040 | | | | 15,606,896 | | | |
Real Estate Investment Trusts (REITs)—0.2% | | | |
American Tower Corp., Cl. A | | | 24,790 | | | | 1,978,738 | | | |
Health Care—20.5% | | | | | | | | | | |
Biotechnology—11.1% | | | | | | | | | | |
Amgen, Inc. | | | 98,950 | | | | 11,296,132 | | | |
Biogen Idec, Inc.1 | | | 121,250 | | | | 33,919,687 | | | |
Celgene Corp.1 | | | 131,337 | | | | 22,190,700 | | | |
Gilead Sciences, Inc.1 | | | 408,750 | | | | 30,717,563 | | | |
| | | | | | | | |
| | | Shares | | | Value | |
Biotechnology (Continued) | | | | | | | | |
Vertex Pharmaceuticals, Inc.1 | | | 172,710 | | | $ | 12,832,353 | |
| | | | | | | | 110,956,435 | |
Health Care Equipment & Supplies—1.7% | |
Becton Dickinson & Co. | | | 54,060 | | | | 5,973,089 | |
Medtronic, Inc. | | | 197,640 | | | | 11,342,560 | |
| | | | | | | | 17,315,649 | |
Health Care Providers & Services—1.6% | |
UnitedHealth Group, Inc. | | | 209,130 | | | | 15,747,489 | |
Health Care Technology—0.8% | | | | | | | | |
Cerner Corp.1 | | | 143,620 | | | | 8,005,379 | |
Life Sciences Tools & Services—0.6% | |
Thermo Fisher Scientific, Inc. | | | 49,590 | | | | 5,521,847 | |
Pharmaceuticals—4.7% | | | | | | | | |
Allergan, Inc. | | | 31,510 | | | | 3,500,131 | |
Bristol-Myers Squibb Co. | | | 336,870 | | | | 17,904,640 | |
Pfizer, Inc. | | | 499,390 | | | | 15,296,316 | |
Roche Holding AG | | | 35,119 | | | | 9,844,452 | |
| | | | | | | | 46,545,539 | |
Industrials—9.2% | | | | | | | | |
Aerospace & Defense—3.4% | | | | | | | | |
B/E Aerospace, Inc.1 | | | 141,170 | | | | 12,286,025 | |
Honeywell International, Inc. | | | 45,070 | | | | 4,118,046 | |
Precision Castparts Corp. | | | 66,430 | | | | 17,889,599 | |
| | | | | | | | 34,293,670 | |
Airlines—0.4% | | | | | | | | |
Copa Holdings SA, Cl. A | | | 25,380 | | | | 4,063,592 | |
Building Products—0.9% | | | | | | | | |
Allegion plc1 | | | 75,379 | | | | 3,330,998 | |
Fortune Brands Home & Security, Inc. | | | 135,040 | | | | 6,171,328 | |
| | | | | | | | 9,502,326 | |
Electrical Equipment—0.7% | | | | | | | | |
AMETEK, Inc. | | | 134,510 | | | | 7,084,642 | |
Machinery—2.6% | | | | | | | | |
Ingersoll-Rand plc | | | 226,150 | | | | 13,930,840 | |
Parker Hannifin Corp. | | | 93,290 | | | | 12,000,826 | |
| | | | | | | | 25,931,666 | |
Trading Companies & Distributors—1.2% | |
United Rentals, Inc.1 | | | 154,020 | | | | 12,005,859 | |
Information Technology—28.8% | | | | | | | | |
Communications Equipment—1.3% | |
Cisco Systems, Inc. | | | 582,570 | | | | 13,078,696 | |
Computers & Peripherals—9.8% | | | | | | | | |
Apple, Inc. | | | 114,510 | | | | 64,252,706 | |
EMC Corp. | | | 827,620 | | | | 20,814,643 | |
Western Digital Corp. | | | 136,230 | | | | 11,429,697 | |
| | | | | | | | 96,497,046 | |
Internet Software & Services—9.5% | |
Facebook, Inc., Cl. A1 | | | 584,090 | | | | 31,926,359 | |
Google, Inc., Cl. A1 | | | 37,800 | | | | 42,362,838 | |
LinkedIn Corp., Cl. A1 | | | 90,680 | | | | 19,662,144 | |
| | | | | | | | 93,951,341 | |
IT Services—4.8% | | | | | | | | |
FleetCor Technologies, Inc.1 | | | 45,020 | | | | 5,274,993 | |
MasterCard, Inc., Cl. A | | | 29,250 | | | | 24,437,205 | |
Visa, Inc., Cl. A | | | 79,237 | | | | 17,644,495 | |
| | | | | | | | 47,356,693 | |
Semiconductors & Semiconductor Equipment—0.8% | |
Xilinx, Inc. | | | 177,420 | | | | 8,147,126 | |
Software—2.6% | | | | | | | | |
Autodesk, Inc.1 | | | 382,790 | | | | 19,265,821 | |
Salesforce.com, Inc.1 | | | 123,120 | | | | 6,794,993 | |
| | | | | | | | 26,060,814 | |
Materials—2.3% | | | | | | | | |
Chemicals—2.3% | | | | | | | | |
Ecolab, Inc. | | | 48,600 | | | | 5,067,522 | |
PPG Industries, Inc. | | | 95,100 | | | | 18,036,666 | |
| | | | | | | 23,104,188 | |
Total Common Stocks (Cost $680,044,329) | | | | 995,221,263 | |
7 OPPENHEIMER CAPITAL APPRECIATION FUND/VA
STATEMENTOF INVESTMENTS Continued
| | | | | | |
| | | Shares | | | Value |
Investment Company—0.4% | | | |
| Oppenheimer Institutional Money Market Fund, Cl. E, 0.09%2,3 | | | | | | |
(Cost $3,644,176) | | | 3,644,176 | | | $ 3,644,176 |
| Total Investments, at Value (Cost $683,688,505) | | | 100.8% | | | 998,865,439 |
| Liabilities in Excess of Other Assets | | | (0.8) | | | (7,744,230) |
| | | |
Net Assets | | | 100.0% | | | $ 991,121,209 |
| | | |
Footnotes to Statement of Investments
1. Non-income producing security.
2. Is or was an affiliate, as defined in the Investment Company Act of 1940, at or during the period ended December 31, 2013, by virtue of the Fund owning at least 5% of the voting securities of the issuer or as a result of the Fund and the issuer having the same investment adviser. Transactions during the period in which the issuer was an affiliate are as follows:
| | | | | | | | | | | | | | | | |
| | | Shares
December 31, 2012 | | | Gross Additions | | | Gross
Reductions | | | Shares
December 31, 2013 | |
Oppenheimer Institutional Money Market Fund, Cl. E | | | 11,345,499 | | | | 187,682,000 | | | | 195,383,323 | | | | 3,644,176 | |
| | | | |
| | | Value | | | Income | | | | | | | |
Oppenheimer Institutional Money Market Fund, Cl. E | | | $ 3,664,176 | | | | $ 9,263 | | | | | | | | | |
3. Rate shown is the 7-day yield as of December 31, 2013.
See accompanying Notes to Financial Statements.
8 OPPENHEIMER CAPITAL APPRECIATION FUND/VA
| | |
| STATEMENTOF ASSETS AND LIABILITIES December 31, 2013 |
| | |
Assets | | |
Investments, at value—see accompanying statement of investments: | | |
Unaffiliated companies (cost $680,044,329) | | $ 995,221,263 |
Affiliated companies (cost $3,644,176) | | 3,644,176 |
| | |
| | | 998,865,439 |
Receivables and other assets: | | |
Dividends | | 1,113,068 |
Shares of beneficial interest sold | | 42,318 |
Other | | 61,473 |
| | |
Total assets | | 1,000,082,298 |
|
|
Liabilities | | |
Payables and other liabilities: | | |
Shares of beneficial interest redeemed | | 8,664,624 |
Transfer and shareholder servicing agent fees | | 83,278 |
Distribution and service plan fees | | 78,664 |
Trustees’ compensation | | 59,634 |
Shareholder communications | | 42,775 |
Other | | 32,114 |
| | |
Total liabilities | | 8,961,089 |
|
| |
Net Assets | | $ 991,121,209 |
| | |
|
|
Composition of Net Assets | | |
Par value of shares of beneficial interest | | $ 17,179 |
Additional paid-in capital | | 650,565,501 |
Accumulated net investment income | | 1,964,801 |
Accumulated net realized gain on investments and foreign currency transactions | | 23,381,464 |
Net unrealized appreciation on investments and translation of assets and liabilities denominated in foreign currencies | | 315,192,264 |
| | |
Net Assets | | $ 991,121,209 |
| | |
| | | |
Net Asset Value Per Share | | |
Non-Service Shares: | | |
| Net asset value, redemption price (excludes applicable contingent deferred sales charge) and offering price per share (based on net assets of $626,906,811 and 10,830,884 shares of beneficial interest outstanding) | | $57.88 |
| |
Service Shares: | | |
| Net asset value, redemption price (excludes applicable contingent deferred sales charge) and offering price per share (based on net assets of $364,214,398 and 6,348,319 shares of beneficial interest outstanding) | | $57.37 |
See accompanying Notes to Financial Statements.
9 OPPENHEIMER CAPITAL APPRECIATION FUND/VA
| | |
| STATEMENT OF OPERATIONS For the Year Ended December 31, 2013 |
| | |
Investment Income | | |
Dividends: | | |
Unaffiliated companies (net of foreign withholding taxes of $172,752) | | $ 12,032,149 |
Affiliated companies | | 9,263 |
Interest | | 35 |
| | |
Total investment income | | 12,041,447 |
|
| |
Expenses | | |
Management fees | | 6,617,072 |
Distribution and service plan fees - Service shares | | 923,701 |
Transfer and shareholder servicing agent fees: | | |
Non-Service shares | | 595,558 |
Service shares | | 367,287 |
Shareholder communications: | | |
Non-Service shares | | 56,956 |
Service shares | | 34,965 |
Custodian fees and expenses | | 19,908 |
Trustees’ compensation | | 49,184 |
Other | | 72,125 |
| | |
Total expenses | | 8,736,756 |
Less waivers and reimbursements of expenses | | (70,336) |
| | |
Net expenses | | 8,666,420 |
|
| |
Net Investment Income | | 3,375,027 |
|
| |
Realized and Unrealized Gain (Loss) | | |
Net realized gain on: | | |
Investments from unaffiliated companies | | 226,951,848 |
Foreign currency transactions | | 5,200 |
| | |
Net realized gain | | 226,957,048 |
Net change in unrealized appreciation/depreciation on: | | |
Investments | | 22,263,947 |
Translation of assets and liabilities denominated in foreign currencies | | (2,617,566) |
| | |
Net change in unrealized appreciation/depreciation | | 19,646,381 |
|
| |
Net Increase in Net Assets Resulting from Operations | | $ 249,978,456 |
| | |
See accompanying Notes to Financial Statements.
10 OPPENHEIMER CAPITAL APPRECIATION FUND/VA
| | |
| STATEMENTS OF CHANGES IN NET ASSETS |
| | | | | | | | |
| | | Year Ended
December 31, 2013 | | | | | Year Ended
December 31, 2012 |
Operations | | | | | | | | |
Net investment income | | $ | 3,375,027 | | | | | $ 8,440,486 |
Net realized gain | | | 226,957,048 | | | | | 98,112,908 |
Net change in unrealized appreciation/depreciation | | | 19,646,381 | | | | | 28,160,875 |
| | | | | | | | |
Net increase in net assets resulting from operations | | | 249,978,456 | | | | | 134,714,269 |
|
|
Dividends and/or Distributions to Shareholders | | | | | | | | |
Dividends from net investment income: | | | | | | | | |
Non-Service shares | | | (5,856,634) | | | | | (3,878,051) |
Service shares | | | (2,798,285) | | | | | (1,503,957) |
| | | |
| | | (8,654,919) | | | | | (5,382,008) |
|
|
Beneficial Interest Transactions | | | | | | | | |
Net decrease in net assets resulting from beneficial interest transactions: | | | | | | | | |
Non-Service shares | | | (96,658,801) | | | | | (144,652,286) |
Service shares | | | (93,891,544) | | | | | (57,530,166) |
| | | | | | | | |
| | | (190,550,345) | | | | | (202,182,452) |
|
|
Net Assets | | | | | | | | |
Total increase (decrease) | | | 50,773,192 | | | | | (72,850,191) |
Beginning of period | | | 940,348,017 | | | | | 1,013,198,208 |
| | | | | | | | |
| | | |
End of period (including accumulated net investment income of $ 1,964,801 and $ 7,239,493, respectively) | | $ | 991,121,209 | | | | | $ 940,348,017 |
| | | |
See accompanying Notes to Financial Statements.
11 OPPENHEIMER CAPITAL APPRECIATION FUND/VA
| | | | | | | | | | | | | | | | | | |
Non-Service Shares | |
| Year Ended
December
31, 2013 |
| |
| Year Ended
December
31, 2012 |
| |
| Year Ended
December
30, 20111 |
| |
| Year Ended
December
31, 2010 |
| | Year Ended December 31, 2009 |
Per Share Operating Data | | | | | | | | | | | | | | | | | | |
Net asset value, beginning of period | | $ | 45.06 | | | $ | 39.75 | | | $ | 40.35 | | | $ | 36.94 | | | $ 25.67 |
Income (loss) from investment operations: | | | | | | | | | | | | | | | | | | |
Net investment income2 | | | 0.23 | | | | 0.42 | | | | 0.23 | | | | 0.11 | | | 0.09 |
Net realized and unrealized gain (loss) | | | 13.09 | | | | 5.18 | | | | (0.69) | | | | 3.36 | | | 11.27 |
| | | |
Total from investment operations | | | 13.32 | | | | 5.60 | | | | (0.46) | | | | 3.47 | | | 11.36 |
Dividends and/or distributions to shareholders: | | | | | | | | | | | | | | | | | | |
Dividends from net investment income | | | (0.50) | | | | (0.29) | | | | (0.14) | | | | (0.06) | | | (0.09) |
Net asset value, end of period | | $ | 57.88 | | | $ | 45.06 | | | $ | 39.75 | | | $ | 40.35 | | | $ 36.94 |
| | | |
| | | | | | | | | | | | | | | | | | | |
Total Return, at Net Asset Value3 | | | 29.74% | | | | 14.12% | | | | (1.15)% | | | | 9.42% | | | 44.52% |
| | | | | | | | | | | | | | | | | | | |
Ratios/Supplemental Data | | | | | | | | | | | | | | | | | | |
Net assets, end of period (in thousands) | | $ | 626,907 | | | $ | 573,684 | | | $ | 637,868 | | | $ | 771,086 | | | $ 1,074,190 |
Average net assets (in thousands) | | $ | 595,912 | | | $ | 600,121 | | | $ | 713,770 | | | $ | 976,242 | | | $ 927,670 |
Ratios to average net assets:4 | | | | | | | | | | | | | | | | | | |
Net investment income | | | 0.44% | | | | 0.95% | | | | 0.57% | | | | 0.31% | | | 0.29% |
Total expenses5 | | | 0.81% | | | | 0.81% | | | | 0.80% | | | | 0.79% | | | 0.78% |
Expenses after payments, waivers and/or reimbursements and reduction to custodian expenses | | | 0.80% | | | | 0.80% | | | | 0.80% | | | | 0.79% | | | 0.78% |
Portfolio turnover rate | | | 77% | | | | 28% | | | | 27% | | | | 58% | | | 46% |
1. December 30, 2011 represents the last business day of the Fund’s 2011 fiscal year.
2. Per share amounts calculated based on the average shares outstanding during the period.
3. Assumes an initial investment on the business day before the first day of the fiscal period, with all dividends and distributions reinvested in additional shares on the reinvestment date, and redemption at the net asset value calculated on the last business day of the fiscal period. Total returns are not annualized for periods less than one full year. Total return information does not reflect expenses that apply at the separate account level or to related insurance products. Inclusion of these charges would reduce the total return figures for all periods shown. Returns do not reflect the deduction of taxes that a shareholder would pay on fund distributions or the redemption of fund shares.
4. Annualized for periods less than one full year.
5. Total expenses including indirect expenses from affiliated fund were as follows:
| | | | |
Year Ended December 31, 2013 | | | 0.81 | % |
Year Ended December 31, 2012 | | | 0.81 | % |
Year Ended December 30, 2011 | | | 0.80 | % |
Year Ended December 31, 2010
| | | 0.79 | % |
Year Ended December 31, 2009 | | | 0.78 | % |
See accompanying Notes to Financial Statements.
12 OPPENHEIMER CAPITAL APPRECIATION FUND/VA
| | | | | | | | | | | | | | | | | | |
Service Shares | |
| Year Ende
Decembe 31, 201 | d
r 3 | |
| Year Ende
Decembe 31, 201 | d
r 2 | |
| Year Ende
Decembe 30, 2011 | d
r 1 | |
| Year Ende
Decembe 31, 201 | d
r 0 | | Year Ended December 31, 2009 |
Per Share Operating Data | | | | | | | | | | | | | | | | | | |
Net asset value, beginning of period | | $ | 44.66 | | | $ | 39.40 | | | $ | 39.99 | | | $ | 36.64 | | | $ 25.42 |
Income (loss) from investment operations: | | | | | | | | | | | | | | | | | | |
Net investment income2 | | | 0.10 | | | | 0.31 | | | | 0.13 | | | | 0.02 | | | 0.01 |
Net realized and unrealized gain (loss) | | | 12.98 | | | | 5.12 | | | | (0.68) | | | | 3.33 | | | 11.21 |
| | | |
Total from investment operations | | | 13.08 | | | | 5.43 | | | | (0.55) | | | | 3.35 | | | 11.22 |
Dividends and/or distributions to shareholders: | | | | | | | | | | | | | | | | | | |
Dividends from net investment income | | | (0.37) | | | | (0.17) | | | | (0.04) | | | | 0.00 | | | 0.003 |
Net asset value, end of period | | $ | 57.37 | | | $ | 44.66 | | | $ | 39.40 | | | $ | 39.99 | | | $ 36.64 |
| | | |
| | | | | | | | | | | | | | | | | | | |
Total Return, at Net Asset Value4 | | | 29.43% | | | | 13.81% | | | | (1.37)% | | | | 9.15% | | | 44.15% |
| | | | | | | | | | | | | | | | | | | |
Ratios/Supplemental Data | | | | | | | | | | | | | | | | | | |
Net assets, end of period (in thousands) | | $ | 364,214 | | | $ | 366,664 | | | $ | 375,330 | | | $ | 423,989 | | | $ 444,170 |
Average net assets (in thousands) | | $ | 367,615 | | | $ | 382,196 | | | $ | 407,413 | | | $ | 427,640 | | | $ 368,634 |
Ratios to average net assets:5 | | | | | | | | | | | | | | | | | | |
Net investment income | | | 0.20% | | | | 0.71% | | | | 0.32% | | | | 0.06% | | | 0.03% |
Total expenses6 | | | 1.06% | | | | 1.06% | | | | 1.05% | | | | 1.04% | | | 1.04% |
Expenses after payments, waivers and/or reimbursements and reduction to custodian expenses | | | 1.05% | | | | 1.05% | | | | 1.05% | | | | 1.04% | | | 1.03% |
Portfolio turnover rate | | | 77% | | | | 28% | | | | 27% | | | | 58% | | | 46% |
1. December 30, 2011 represents the last business day of the Fund’s 2011 fiscal year.
2. Per share amounts calculated based on the average shares outstanding during the period.
3. Less than $0.005 per share.
4. Assumes an initial investment on the business day before the first day of the fiscal period, with all dividends and distributions reinvested in additional shares on the reinvestment date, and redemption at the net asset value calculated on the last business day of the fiscal period. Total returns are not annualized for periods less than one full year. Total return information does not reflect expenses that apply at the separate account level or to related insurance products. Inclusion of these charges would reduce the total return figures for all periods shown. Returns do not reflect the deduction of taxes that a shareholder would pay on fund distributions or the redemption of fund shares.
5. Annualized for periods less than one full year.
6. Total expenses including indirect expenses from affiliated fund were as follows:
| | | | |
Year Ended December 31, 2013 | | | 1.06% | |
Year Ended December 31, 2012 | | | 1.06% | |
Year Ended December 30, 2011 | | | 1.05% | |
Year Ended December 31, 2010 | | | 1.04% | |
Year Ended December 31, 2009 | | | 1.04% | |
See accompanying Notes to Financial Statements.
13 OPPENHEIMER CAPITAL APPRECIATION FUND/VA
| | |
| NOTES TO FINANCIAL STATEMENTS December 31, 2013 |
1. Significant Accounting Policies
Oppenheimer Capital Appreciation Fund/VA (the “Fund”) is a separate series of Oppenheimer Variable Account Funds, a diversified open-end management investment company registered under the Investment Company Act of 1940, as amended. The Fund’s investment objective is to seek capital appreciation. The Fund’s investment adviser is OFI Global Asset Management, Inc. (“OFI Global” or the “Manager”), a wholly-owned subsidiary of OppenheimerFunds, Inc. (“OFI” or the “Sub-Adviser”). The Manager has entered into a sub-advisory agreement with OFI. Shares of the Fund are sold only to separate accounts of life insurance companies.
The Fund offers two classes of shares. Both classes are sold at their offering price, which is the net asset value per share, to separate investment accounts of participating insurance companies as an underlying investment for variable life insurance policies, variable annuity contracts or other investment products. The class of shares designated as Service shares is subject to a distribution and service plan. Both classes of shares have identical rights and voting privileges with respect to the Fund in general and exclusive voting rights on matters that affect that class alone. Earnings, net assets and net asset value per share may differ due to each class having its own expenses, such as transfer and shareholder servicing agent fees and shareholder communications, directly attributable to that class.
The following is a summary of significant accounting policies consistently followed by the Fund.
Investment in Oppenheimer Institutional Money Market Fund. The Fund is permitted to invest daily available cash balances in an affiliated money market fund. The Fund may invest the available cash in Class E shares of Oppenheimer Institutional Money Market Fund (“IMMF”) to seek current income while preserving liquidity. IMMF is a registered open-end management investment company, regulated as a money market fund under the Investment Company Act of 1940, as amended. The Manager is the investment adviser of IMMF, and the Sub-Adviser provides investment and related advisory services to IMMF. When applicable, the Fund’s investment in IMMF is included in the Statement of Investments. Shares of IMMF are valued at their net asset value per share. As a shareholder, the Fund is subject to its proportional share of IMMF’s Class E expenses, including its management fee. The Manager will waive fees and/or reimburse Fund expenses in an amount equal to the indirect management fees incurred through the Fund’s investment in IMMF.
Foreign Currency Translation. The Fund’s accounting records are maintained in U.S. dollars. The values of securities denominated in foreign currencies and amounts related to the purchase and sale of foreign securities and foreign investment income are translated into U.S. dollars as of the close of the New York Stock Exchange (the “Exchange”), normally 4:00 P.M. Eastern time, on each day the Exchange is open for trading. Foreign exchange rates may be valued primarily using a reliable bank, dealer or service authorized by the Board of Trustees.
Reported net realized gains and losses from foreign currency transactions arise from sales of portfolio securities, sales and maturities of short-term securities, sales of foreign currencies, exchange rate fluctuations between the trade and settlement dates on securities transactions, and the difference between the amounts of dividends, interest, and foreign withholding taxes recorded on the Fund’s books and the U.S. dollar equivalent of the amounts actually received or paid. Net unrealized appreciation and depreciation on the translation of assets and liabilities denominated in foreign currencies arise from changes in the values of assets and liabilities, including investments in securities at fiscal period end, resulting from changes in exchange rates.
The effect of changes in foreign currency exchange rates on investments is separately identified from the fluctuations arising from changes in market values of securities held and reported with all other foreign currency gains and losses in the Fund’s Statement of Operations.
Allocation of Income, Expenses, Gains and Losses. Income, expenses (other than those attributable to a specific class), gains and losses are allocated on a daily basis to each class of shares based upon the relative proportion of net assets represented by such class. Operating expenses directly attributable to a specific class are charged against the operations of that class.
Federal Taxes. The Fund intends to comply with provisions of the Internal Revenue Code applicable to regulated investment companies and to distribute substantially all of its investment company taxable income, including any net realized gain on investments not offset by capital loss carryforwards, if any, to shareholders. Therefore, no federal income or excise tax provision is required. The Fund files income tax returns in U.S. federal and applicable state jurisdictions. The statute of limitations on the Fund’s tax return filings generally remain open for the three preceding fiscal reporting period ends.
The tax components of capital shown in the following table represent distribution requirements the Fund must satisfy under the income tax regulations, losses the Fund may be able to offset against income and gains realized in future years and unrealized appreciation or depreciation of securities and other investments for federal income tax purposes.
| | | | | | | | | | |
Undistributed Net Investment Income | | Undistributed
Long-Term
Gain | | | Accumulated
Loss
Carryforward1,2 | | | Net Unrealized
Appreciation
Based on cost of
Securities and
Other Investments
for Federal Income
Tax Purposes |
$3,370,986 | | | $23,352,798 | | | | $— | | | $315,081,293 |
1. During the fiscal year ended December 31, 2013, the Fund utilized $197,794,392 of capital loss carryforward to offset capital gains realized in that fiscal year.
2. During the fiscal year ended December 31, 2012, the Fund utilized $92,201,391 of capital loss carryforward to offset capital gains realized in that fiscal year.
14 OPPENHEIMER CAPITAL APPRECIATION FUND/VA
1. Significant Accounting Policies (Continued)
Net investment income (loss) and net realized gain (loss) may differ for financial statement and tax purposes. The character of dividends and distributions made during the fiscal year from net investment income or net realized gains may differ from their ultimate characterization for federal income tax purposes. Also, due to timing of dividends and distributions, the fiscal year in which amounts are distributed may differ from the fiscal year in which the income or net realized gain was recorded by the Fund.
Accordingly, the following amounts have been reclassified for December 31, 2013. Net assets of the Fund were unaffected by the reclassifications.
| | | | | | |
Increase to Paid-in Capital | | Increase to Accumulated
Net Investment
Income | | | Reduction to Accumulated Net Realized Gain on Investments3 |
$2,895,618 | | | $5,200 | | | $2,900,818 |
3. $2,895,618, all of which was long-term capital gain, was distributed in connection with Fund share redemptions.
The tax character of distributions paid during the years ended December 31, 2013 and December 31, 2012 was as follows:
| | | | | | |
| | | Year Ended
December 31, 2013 | | | Year Ended
December 31, 2012 |
Distributions paid from: | | | | | | |
Ordinary income | | $ | 8,654,919 | | | $ 5,382,008 |
The aggregate cost of securities and other investments and the composition of unrealized appreciation and depreciation of securities and other investments for federal income tax purposes as of December 31, 2013 are noted in the following table. The primary difference between book and tax appreciation or depreciation of securities and other investments, if applicable, is attributable to the tax deferral of losses or tax realization of financial statement unrealized gain or loss.
| | | | |
Federal tax cost of securities | | $ | 683,799,476 | |
| | | | |
| |
Gross unrealized appreciation | | $ | 318,121,272 | |
Gross unrealized depreciation | | | (3,039,979) | |
| | | | |
Net unrealized appreciation | | $ | 315,081,293 | |
| | | | |
Trustees’ Compensation. The Board of Trustees has adopted a compensation deferral plan for independent trustees that enables trustees to elect to defer receipt of all or a portion of the annual compensation they are entitled to receive from the Fund. For purposes of determining the amount owed to the Trustee under the plan, deferred amounts are treated as though equal dollar amounts had been invested in shares of the Fund or in other Oppenheimer funds selected by the Trustee. The Fund purchases shares of the funds selected for deferral by the Trustee in amounts equal to his or her deemed investment, resulting in a Fund asset equal to the deferred compensation liability. Such assets are included as a component of “Other” within the asset section of the Statement of Assets and Liabilities. Deferral of trustees’ fees under the plan will not affect the net assets of the Fund, and will not materially affect the Fund’s assets, liabilities or net investment income per share. Amounts will be deferred until distributed in accordance with the compensation deferral plan.
Dividends and Distributions to Shareholders. Dividends and distributions to shareholders, which are determined in accordance with income tax regulations and may differ from U.S. generally accepted accounting principles, are recorded on the ex-dividend date. Income and capital gain distributions, if any, are declared and paid annually or at other times as deemed necessary by the Manager.
Investment Income. Dividend income is recorded on the ex-dividend date or upon ex-dividend notification in the case of certain foreign dividends where the ex-dividend date may have passed. Non-cash dividends included in dividend income, if any, are recorded at the fair market value of the securities received. Interest income is recognized on an accrual basis. Discount and premium, which are included in interest income on the Statement of Operations, are amortized or accreted daily.
Custodian Fees. “Custodian fees and expenses” in the Statement of Operations may include interest expense incurred by the Fund on any cash overdrafts of its custodian account during the period. Such cash overdrafts may result from the effects of failed trades in portfolio securities and from cash outflows resulting from unanticipated shareholder redemption activity. The Fund pays interest to its custodian on such cash overdrafts, to the extent they are not offset by positive cash balances maintained by the Fund, at a rate equal to the Federal Funds Rate plus 0.50%. The “Reduction to custodian expenses” line item, if applicable, represents earnings on cash balances maintained by the Fund during the period. Such interest expense and other custodian fees may be paid with these earnings.
Security Transactions. Security transactions are recorded on the trade date. Realized gains and losses on securities sold are determined on the basis of identified cost.
Indemnifications. The Fund’s organizational documents provide current and former trustees and officers with a limited indemnification against liabilities arising in connection with the performance of their duties to the Fund. In the normal course of business, the Fund may also enter into contracts
15 OPPENHEIMER CAPITAL APPRECIATION FUND/VA
| | |
| NOTES TO FINANCIAL STATEMENTS Continued |
1. Significant Accounting Policies (Continued)
that provide general indemnifications. The Fund’s maximum exposure under these arrangements is unknown as this would be dependent on future claims that may be made against the Fund. The risk of material loss from such claims is considered remote.
Other. The preparation of financial statements in conformity with accounting principles generally accepted in the United States of America requires management to make estimates and assumptions that affect the reported amounts of assets and liabilities and disclosure of contingent assets and liabilities at the date of the financial statements and the reported amounts of increases and decreases in net assets from operations during the reporting period. Actual results could differ from those estimates.
2. Securities Valuation
The Fund calculates the net asset value of its shares as of the close of the New York Stock Exchange (the “Exchange”), normally 4:00 P.M. Eastern time, on each day the Exchange is open for trading.
The Fund’s Board has adopted procedures for the valuation of the Fund’s securities and has delegated the day-to-day responsibility for valuation determinations under those procedures to the Manager. The Manager has established a Valuation Committee which is responsible for determining a “fair valuation” for any security for which market quotations are not “readily available.” The Valuation Committee’s fair valuation determinations are subject to review, approval and ratification by the Fund’s Board at its next regularly scheduled meeting covering the calendar quarter in which the fair valuation was determined.
Valuation Methods and Inputs
Securities are valued using unadjusted quoted market prices, when available, as supplied primarily by third party pricing services or dealers.
The following methodologies are used to determine the market value or the fair value of the types of securities described below:
Securities traded on a registered U.S. securities exchange (including exchange-traded derivatives other than futures and futures options) are valued based on the last sale price of the security reported on the principal exchange on which it is traded, prior to the time when the Fund’s assets are valued. In the absence of a sale, the security is valued at the last sale price on the prior trading day, if it is within the spread of the current day’s closing “bid” and “asked” prices, and if not, at the current day’s closing bid price. A security of a foreign issuer traded on a foreign exchange, but not listed on a registered U.S. securities exchange, is valued based on the last sale price on the principal exchange on which the security is traded, as identified by the third party pricing service used by the Manager, prior to the time when the Fund’s assets are valued. If the last sale price is unavailable, the security is valued at the most recent official closing price on the principal exchange on which it is traded. If the last sales price or official closing price for a foreign security is not available, the security is valued at the mean between the bid and asked price per the exchange or, if not available from the exchange, obtained from two dealers. If bid and asked prices are not available from either the exchange or two dealers, the security is valued by using one of the following methodologies (listed in order of priority); (1) using a bid from the exchange, (2) the mean between the bid and asked price as provided by a single dealer, or (3) a bid from a single dealer.
Shares of a registered investment company that are not traded on an exchange are valued at that investment company’s net asset value per share.
Corporate and government debt securities (of U.S. or foreign issuers) and municipal debt securities, event-linked bonds, loans, mortgage-backed securities, collateralized mortgage obligations, and asset-backed securities are valued at the mean between the “bid” and “asked” prices utilizing evaluated prices obtained from third party pricing services or broker-dealers who may use matrix pricing methods to determine the evaluated prices.
Short-term money market type debt securities with a remaining maturity of sixty days or less are valued at cost adjusted by the amortization of discount or premium to maturity (amortized cost), which approximates market value. Short-term debt securities with a remaining maturity in excess of sixty days are valued at the mean between the “bid” and “asked” prices utilizing evaluated prices obtained from third party pricing services or broker-dealers.
A description of the standard inputs that may generally be considered by the third party pricing vendors in determining their evaluated prices is provided below.
| | | | |
| Security Type | | | | Standard inputs generally considered by third-party pricing vendors |
Corporate debt, government debt, municipal, mortgage- backed and asset-backed securities | | | | Reported trade data, broker-dealer price quotations, benchmark yields, issuer spreads on comparable securities, the credit quality, yield, maturity, and other appropriate factors. |
| Loans | | | | Information obtained from market participants regarding reported trade data and broker-dealer price quotations. |
| Event-linked bonds | | | | Information obtained from market participants regarding reported trade data and broker-dealer price quotations. |
If a market value or price cannot be determined for a security using the methodologies described above, or if, in the “good faith” opinion of the Manager, the market value or price obtained does not constitute a “readily available market quotation,” or a significant event has occurred that would materially affect the value of the security the security is fair valued either (i) by a standardized fair valuation methodology applicable to the security type or the significant event as previously approved by the Valuation Committee and the Fund’s Board or (ii) as determined in good faith by the Manager’s Valuation Committee. The Valuation Committee considers all relevant facts that are reasonably available, through either public information or information available to the Manager, when determining the fair value of a security. Fair value determinations by the Manager are subject to review, approval and ratification by the Fund’s Board at its next regularly scheduled meeting covering the calendar quarter in which the fair valuation was determined. Those fair valuation standardized methodologies include, but are not limited to, valuing securities at the last sale price or initially at cost and subsequently adjusting the value based on: changes in company specific fundamentals, changes in an appropriate securities index, or changes in the
16 OPPENHEIMER CAPITAL APPRECIATION FUND/VA
value of similar securities which may be further adjusted for any discounts related to security-specific resale restrictions. When possible, such methodologies use observable market inputs such as unadjusted quoted prices of similar securities, observable interest rates, currency rates and yield curves. The methodologies used for valuing securities are not necessarily an indication of the risks associated with investing in those securities nor can it be assured that the Fund can obtain the fair value assigned to a security if it were to sell the security.
To assess the continuing appropriateness of security valuations, the Manager, or its third party service provider who is subject to oversight by the Manager, regularly compares prior day prices, prices on comparable securities, and sale prices to the current day prices and challenges those prices exceeding certain tolerance levels with the third party pricing service or broker source. For those securities valued by fair valuations, whether through a standardized fair valuation methodology or a fair valuation determination, the Valuation Committee reviews and affirms the reasonableness of the valuations based on such methodologies and fair valuation determinations on a regular basis after considering all relevant information that is reasonably available.
Classifications
Each investment asset or liability of the Fund is assigned a level at measurement date based on the significance and source of the inputs to its valuation. Various data inputs are used in determining the value of each of the Fund’s investments as of the reporting period end. These data inputs are categorized in the following hierarchy under applicable financial accounting standards:
1) Level 1-unadjusted quoted prices in active markets for identical assets or liabilities (including securities actively traded on a securities exchange)
2) Level 2-inputs other than unadjusted quoted prices that are observable for the asset or liability (such as unadjusted quoted prices for similar assets and market corroborated inputs such as interest rates, prepayment speeds, credit risks, etc.)
3) Level 3-significant unobservable inputs (including the Manager’s own judgments about assumptions that market participants would use in pricing the asset or liability).
The inputs used for valuing securities are not necessarily an indication of the risks associated with investing in those securities.
The table below categorizes amounts that are included in the Fund’s Statement of Assets and Liabilities as of December 31, 2013 based on valuation input level:
| | | | | | | | | | | | | | | | |
| | | Level 1— Unadjusted Quoted Prices | | | Level 2— Other Significant Observable Inputs | | | Level 3—
Significant
Unobservable
Inputs | | | Value | |
| |
Assets Table | | | | | | | | | | | | | | | | |
Investments, at Value: | | | | | | | | | | | | | | | | |
Common Stocks | | | | | | | | | | | | | | | | |
Consumer Discretionary | | $ | 181,910,677 | | | $ | — | | | $ | — | | | $ | 181,910,677 | |
Consumer Staples | | | 59,102,123 | | | | 15,060,158 | | | | — | | | | 74,162,281 | |
Energy | | | 57,354,378 | | | | — | | | | — | | | | 57,354,378 | |
Financials | | | 76,623,930 | | | | — | | | | — | | | | 76,623,930 | |
Health Care | | | 194,247,886 | | | | 9,844,452 | | | | — | | | | 204,092,338 | |
Industrials | | | 92,881,755 | | | | — | | | | — | | | | 92,881,755 | |
Information Technology | | | 285,091,716 | | | | — | | | | — | | | | 285,091,716 | |
Materials | | | 23,104,188 | | | | — | | | | — | | | | 23,104,188 | |
Investment Company | | | 3,644,176 | | | | — | | | | — | | | | 3,644,176 | |
| | | | |
Total Assets | | $ | 973,960,829 | | | $ | 24,904,610 | | | $ | — | | | $ | 998,865,439 | |
| | | | |
Currency contracts and forwards, if any, are reported at their unrealized appreciation/ depreciation at measurement date, which represents the change in the contract’s value from trade date. Futures, if any, are reported at their variation margin at measurement date, which represents the amount due to/from the Fund at that date. All additional assets and liabilities included in the above table are reported at their market value at measurement date.
3. Shares of Beneficial Interest
The Fund has authorized an unlimited number of $0.001 par value shares of beneficial interest of each class. Transactions in shares of beneficial interest were as follows:
| | | | | | | | | | | | | | | | |
| | | Year Ended December 31, 2013 | | | Year Ended December 31, 2012 | |
| | | Shares | | | Amount | | | Shares | | | Amount | |
| |
Non-Service Shares | | | | | | | | | | | | | | | | |
Sold | | | 300,888 | | | $ | 15,140,401 | | | | 816,576 | | | $ | 35,841,126 | |
Dividends and/or distributions reinvested | | | 117,415 | | | | 5,856,634 | | | | 89,832 | | | | 3,878,051 | |
Redeemed | | | (2,319,735 | ) | | | (117,655,836 | ) | | | (4,220,005 | ) | | | (184,371,463) | |
| | | | |
Net decrease | | | (1,901,432 | ) | | $ | (96,658,801 | ) | | | (3,313,597 | ) | | $ | (144,652,286) | |
| | | | |
17 OPPENHEIMER CAPITAL APPRECIATION FUND/VA
| | |
| NOTES TO FINANCIAL STATEMENTS Continued |
3. Shares of Beneficial Interest (Continued)
| | | | | | | | | | | | | | | | |
| | | Year Ended December 31, 2013 | | | Year Ended December 31, 2012 | |
| | | Shares | | | Amount | | | Shares | | | Amount | |
| |
Service Shares | | | | | | | | | | | | | | | | |
Sold | | | 192,139 | | | $ | 9,432,352 | | | | 333,716 | | | $ | 14,458,725 | |
Dividends and/or distributions reinvested | | | 56,519 | | | | 2,798,285 | | | | 35,098 | | | | 1,503,957 | |
Redeemed | | | (2,109,967) | | | | (106,122,181) | | | | (1,685,918) | | | | (73,492,848) | |
| | | | |
Net decrease | | | (1,861,309) | | | $ | (93,891,544) | | | | (1,317,104) | | | $ | (57,530,166) | |
| | | | |
4. Purchases and Sales of Securities
The aggregate cost of purchases and proceeds from sales of securities, other than short-term obligations and investments in IMMF, for the year ended December 31, 2013 were as follows:
| | | | | | | | |
| | | Purchases | | | Sales | |
| |
Investment securities | | $ | 732,076,816 | | | $ | 906,989,473 | |
5. Fees and Other Transactions with Affiliates
Management Fees. Under the investment advisory agreement, the Fund pays the Manager a management fee based on the daily net assets of the Fund at an annual rate as shown in the following table:
| | | | | | | | | | | | |
| Fee Schedule Through October 31, 2013 | | | | | | | Fee Schedule Effective November 1, 2013 | | | |
| | | | | | |
Up to $200 million | | | 0.75% | | | | | Up to $200 million | | | 0.75% | |
Next $200 million | | | 0.72 | | | | | Next $200 million | | | 0.72 | |
Next $200 million | | | 0.69 | | | | | Next $200 million | | | 0.69�� | |
Next $200 million | | | 0.66 | | | | | Next $200 million | | | 0.66 | |
Over $800 million | | | 0.60 | | | | | Over $200 million | | | 0.60 | |
| | | | | | | | Over $1 billion | | | 0.58 | |
Sub-Adviser Fees. The Manager has retained the Sub-Adviser to provide the day-to-day portfolio management of the Fund. Under the Sub-Advisory Agreement, the Manager pays the Sub-Adviser an annual fee in monthly installments, equal to a percentage of the investment management fee collected by the Manager from the Fund, which shall be calculated after any investment management fee waivers. The fee paid to the Sub-Adviser is paid by the Manager, not by the Fund.
Transfer Agent Fees. OFI Global (the “Transfer Agent”) serves as the transfer and shareholder servicing agent for the Fund. Fees incurred by the Fund with respect to these services are detailed in the Statement of Operations.
Sub-Transfer Agent Fees. The Transfer Agent has retained Shareholder Services, Inc., a wholly-owned subsidiary of OFI (the “Sub-Transfer Agent”), to provide the day-to-day transfer agent and shareholder servicing of the Fund. Under the Sub-Transfer Agency Agreement, the Transfer Agent pays the Sub-Transfer Agent an annual fee in monthly installments, equal to a percentage of the transfer agent fee collected by the Transfer Agent from the Fund, which shall be calculated after any applicable fee waivers. The fee paid to the Sub-Transfer Agent is paid by the Transfer Agent, not by the Fund.
Distribution and Service Plan for Service Shares. The Fund has adopted a Distribution and Service Plan (the “Plan”) in accordance with Rule 12b-1 under the Investment Company Act of 1940 for Service shares to pay OppenheimerFunds Distributor, Inc. (the “Distributor”), for distribution related services, personal service and account maintenance for the Fund’s Service shares. Under the Plan, payments are made periodically at an annual rate of 0.25% of the daily net assets of Service shares of the Fund. The Distributor currently uses all of those fees to compensate sponsors of the insurance product that offers Fund shares, for providing personal service and maintenance of accounts of their variable contract owners that hold Service shares. These fees are paid out of the Fund’s assets on an on-going basis and increase operating expenses of the Service shares, which results in lower performance compared to the Fund’s shares that are not subject to a service fee. Fees incurred by the Fund under the Plan are detailed in the Statement of Operations.
Waivers and Reimbursements of Expenses. The Manager has contractually agreed to limit the Fund’s expenses after payments, waivers and/or reimbursements and reduction to custodian expenses, excluding expenses incurred directly or indirectly by the Fund as a result of investments in other investment companies, wholly-owned subsidiaries and pooled investment vehicles; so that those expenses, as percentages of daily net assets, will not exceed the annual rate of 0.80% for Non-Service shares and 1.05% for Service shares. During the year ended December 31, 2013, the Manager waived fees and/or reimbursed the Fund $ 39,301 and $ 23,164 for Non-Service and Service shares, respectively.
The Manager will waive fees and/or reimburse Fund expenses in an amount equal to the indirect management fees incurred through the Fund’s investment in IMMF. During the year ended December 31, 2013, the Manager waived fees and/or reimbursed the Fund $7,871 for IMMF management fees.
Some of these undertakings may be modified or terminated at any time; some may not be modified or terminated until after one year from the date of the current prospectus, as indicated therein.
18 OPPENHEIMER CAPITAL APPRECIATION FUND/VA
6. Pending Litigation
Since 2009, seven class action lawsuits have been pending in the U.S. District Court for the District of Colorado against OppenheimerFunds, Inc. (“OFI”), OppenheimerFunds Distributor, Inc., the Fund’s principal underwriter and distributor (the “Distributor”), and certain funds (but not including the Fund) advised by OFI Global Asset Management, Inc. and distributed by the Distributor (the “Defendant Funds”). The lawsuits also name as defendants certain officers and current and former trustees of the respective Defendant Funds. The lawsuits raise claims under federal securities law and allege, among other things, that the disclosure documents of the respective Defendant Funds contained misrepresentations and omissions and that the respective Defendant Funds’ investment policies were not followed. The plaintiffs in these actions seek unspecified damages, equitable relief and awards of attorneys’ fees and litigation expenses. The Defendant Funds’ Boards of Trustees have also engaged counsel to represent the Funds and the present and former Independent Trustees named in those suits. On August 26, 2013, the parties in six of these lawsuits executed a memorandum of understanding setting forth the terms of proposed settlements of those actions. The proposed settlements are subject to a variety of contingencies, including the execution of settlement agreements, which will require preliminary and final approval by the court. The proposed settlements do not resolve a seventh outstanding lawsuit relating to Oppenheimer California Municipal Fund.
Other class action and individual lawsuits have been filed since 2008 in various state and federal courts against OFI and certain of its affiliates by investors seeking to recover investments they allegedly lost as a result of the “Ponzi” scheme run by Bernard L. Madoff and his firm, Bernard L. Madoff Investment Securities, LLC (“BLMIS”). Plaintiffs in these suits allege that they suffered losses as a result of their investments in several funds managed by an affiliate of OFI and assert a variety of claims, including breach of fiduciary duty, fraud, negligent misrepresentation, unjust enrichment, and violation of federal and state securities laws and regulations, among others. They seek unspecified damages, equitable relief and awards of attorneys’ fees and litigation expenses. Neither the Distributor, nor any of the Oppenheimer mutual funds, their independent trustees or directors are named as defendants in these lawsuits. None of the Oppenheimer mutual funds invested in any funds or accounts managed by Madoff or BLMIS. On February 28, 2011, a stipulation of partial settlement of three groups of consolidated putative class action lawsuits relating to these matters was filed in the U.S. District Court for the Southern District of New York. On August 19, 2011, the court entered an order and final judgment approving the settlement as fair, reasonable and adequate. In September 2011, certain parties filed notices of appeal from the court’s order approving the settlement. The settlement does not resolve other outstanding lawsuits against OFI and its affiliates relating to BLMIS.
On April 16, 2010, a lawsuit was filed in New York state court against (i) OFI, (ii) an affiliate of OFI and (iii) AAArdvark IV Funding Limited (“AAArdvark IV”), an entity advised by OFI’s affiliate, in connection with investments made by the plaintiffs in AAArdvark IV. Plaintiffs allege breach of contract and common law fraud claims against the defendants and seek compensatory damages, costs and disbursements, including attorney fees. On April 11, 2013, the court granted defendants’ motion for summary judgment, dismissing plaintiffs’ fraud claim with prejudice and dismissing their contract claim without prejudice, and granted plaintiffs leave to replead their contract claim to assert a cause of action for specific performance within 30 days. On May 9, 2013, plaintiffs filed a notice of appeal from the court’s dismissal order. On January 7, 2014, the appellate court affirmed the trial court’s dismissal order. On July 15, 2011, a lawsuit was filed in New York state court against OFI, an affiliate of OFI and AAArdvark Funding Limited (“AAArdvark I”), an entity advised by OFI’s affiliate, in connection with investments made by the plaintiffs in AAArdvark I. The complaint alleges breach of contract and common law fraud claims against the defendants and seeks compensatory damages, costs and disbursements, including attorney fees. On November 9, 2011, a lawsuit was filed in New York state court against OFI, an affiliate of OFI and AAArdvark XS Funding Limited (“AAArdvark XS”), an entity advised by OFI’s affiliate, in connection with investments made by the plaintiffs in AAArdvark XS. The complaint alleged breach of contract against the defendants and sought compensatory damages, costs and disbursements, including attorney fees. On November 8, 2013, the parties filed a stipulation of discontinuance dismissing the lawsuit with prejudice.
OFI believes the lawsuits and appeals described above are without legal merit and, with the exception of actions it has settled, is defending against them vigorously. While it is premature to render any opinion as to the outcome in these lawsuits, or whether any costs that the Defendant Funds may bear in defending the suits might not be reimbursed by insurance, OFI believes that these suits should not impair the ability of OFI or the Distributor to perform their respective duties to the Fund, and that the outcome of all of the suits together should not have any material effect on the operations of any of the Oppenheimer mutual funds.
19 OPPENHEIMER CAPITAL APPRECIATION FUND/VA
| | |
| REPORT OF INDEPENDENT REGISTERED PUBLIC ACCOUNTING FIRM |
The Board of Trustees and Shareholders of Oppenheimer Variable Account Funds:
We have audited the accompanying statement of assets and liabilities of Oppenheimer Capital Appreciation Fund/VA (a separate series of Oppenheimer Variable Account Funds), including the statement of investments, as of December 31, 2013, and the related statement of operations for the year then ended, the statements of changes in net assets for each of the years in the two-year period then ended, and the financial highlights for each of the years in the five-year period then ended. These financial statements and financial highlights are the responsibility of the Fund’s management. Our responsibility is to express an opinion on these financial statements and financial highlights based on our audits.
We conducted our audits in accordance with the standards of the Public Company Accounting Oversight Board (United States). Those standards require that we plan and perform the audit to obtain reasonable assurance about whether the financial statements and financial highlights are free of material misstatement. An audit includes examining, on a test basis, evidence supporting the amounts and disclosures in the financial statements. Our procedures included confirmation of securities owned as of December 31, 2013, by correspondence with the custodian and transfer agent. An audit also includes assessing the accounting principles used and significant estimates made by management, as well as evaluating the overall financial statement presentation. We believe that our audits provide a reasonable basis for our opinion.
In our opinion, the financial statements and financial highlights referred to above present fairly, in all material respects, the financial position of Oppenheimer Capital Appreciation Fund/VA as of December 31, 2013, the results of its operations for the year then ended, the changes in its net assets for each of the years in the two-year period then ended, and the financial highlights for each of the years in the five-year period then ended, in conformity with U.S. generally accepted accounting principles.
KPMG LLP
Denver, Colorado
February 14, 2014
20 OPPENHEIMER CAPITAL APPRECIATION FUND/VA
| | |
| FEDERAL INCOME TAX INFORMATION Unaudited |
In early 2014, if applicable, shareholders of record received information regarding all dividends and distributions paid to them by the Fund during calendar year 2013
Dividends, if any, paid by the Fund during the fiscal year ended December 31, 2013 which are not designated as capital gain distributions should be multiplied by the maximum amount allowable but not less than 100% to arrive at the amount eligible for the corporate dividend-received deduction.
The foregoing information is presented to assist shareholders in reporting distributions received from the Fund to the Internal Revenue Service. Because of the complexity of the federal regulations which may affect your individual tax return and the many variations in state and local tax regulations, we recommend that you consult your tax advisor for specific guidance.
21 OPPENHEIMER CAPITAL APPRECIATION FUND/VA
| | |
| BOARD APPROVAL OF THE FUND’S INVESTMENT ADVISORY AND SUB-ADIVSORY AGREEMENTS Unaudited |
The Fund has entered into an investment advisory agreement with OFI Global Asset Management, Inc. (“OFI Global” or the “Adviser”), a wholly-owned subsidiary of OppenheimerFunds, Inc. (“OFI” or the “Sub-Adviser”) (“OFI Global” and “OFI” together the “Managers”) and OFI Global has entered into a sub-advisory agreement with OFI whereby OFI provides investment sub-advisory services to the Fund (collectively, the “Agreements”). Each year, the Board of Trustees (the “Board”), including a majority of the independent Trustees, is required to determine whether to renew the Agreements. The Investment Company Act of 1940, as amended, requires that the Board request and evaluate, and that the Managers provide, such information as may be reasonably necessary to evaluate the terms of the Agreements. The Board employs an independent consultant to prepare a report that provides information, including comparative information that the Board requests for that purpose. In addition to in-person meetings focused on this evaluation, the Board receives information throughout the year regarding Fund services, fees, expenses and performance.
The Adviser, Sub-Adviser and the independent consultant provided information to the Board on the following factors: (i) the nature, quality and extent of the Managers’ services, (ii) the investment performance of the Fund and the Managers, (iii) the fees and expenses of the Fund, including comparative expense information, (iv) the profitability of the Managers and their affiliates, including an analysis of the cost of providing services, (v) whether economies of scale are realized as the Fund grows and whether fee levels reflect these economies of scale for Fund investors and (vi) other benefits to the Managers from their relationship with the Fund. The Board was aware that there are alternatives to retaining the Managers.
Outlined below is a summary of the principal information considered by the Board as well as the Board’s conclusions.
Nature, Quality and Extent of Services. The Board considered information about the nature, quality and extent of the services provided to the Fund and information regarding the Managers’ key personnel who provide such services. The Sub-Adviser’s duties include providing the Fund with the services of the portfolio manager and the Sub-Adviser’s investment team, who provide research, analysis and other advisory services in regard to the Fund’s investments; securities trading services; oversight of third-party service providers; monitoring compliance with applicable Fund policies and procedures and adherence to the Fund’s investment restrictions; and risk management. The Managers are responsible for providing certain administrative services to the Fund as well. Those services include providing and supervising all administrative and clerical personnel who are necessary in order to provide effective corporate administration for the Fund; compiling and maintaining records with respect to the Fund’s operations; preparing and filing reports required by the Securities and Exchange Commission; preparing periodic reports regarding the operations of the Fund for its shareholders; preparing proxy materials for shareholder meetings; and preparing the registration statements required by Federal and state securities laws for the sale of the Fund’s shares. The Managers also provide the Fund with office space, facilities and equipment.
The Board also considered the quality of the services provided and the quality of the Managers’ resources that are available to the Fund. The Board took account of the fact that the Sub-Adviser has had over fifty years of experience as an investment adviser and that its assets under management rank it among the top mutual fund managers in the United States. The Board evaluated the Sub-Adviser’s advisory, administrative, accounting, legal, compliance services and risk management, and information the Board has received regarding the experience and professional qualifications of the Managers’ key personnel and the size and functions of its staff. In its evaluation of the quality of the portfolio management services provided, the Board considered the experience of Michael Kotlarz, the portfolio manager for the Fund, and the Sub-Adviser’s investment team and analysts. The Board members also considered the totality of their experiences with the Managers as directors or trustees of the Fund and other funds advised by the Managers. The Board considered information regarding the quality of services provided by affiliates of the Managers, which its members have become knowledgeable about in connection with the renewal of the Fund’s service agreements. The Board concluded, in light of the Managers’ experience, reputation, personnel, operations and resources that the Fund benefits from the services provided under the Agreement.
Investment Performance of the Fund, the Adviser and the Sub-Adviser. Throughout the year, the Manager provided information on the investment performance of the Fund, including comparative performance information. The Board also reviewed information, prepared by the Manager and by the independent consultant, comparing the Fund’s historical performance to relevant market indices and to the performance of other large growth funds underlying variable insurance products. The Board noted that the Fund underperformed its category median during the one-, three-, five- and ten-year periods. The Board considered the Fund’s improved performance over the one- and three-year periods but noted that in 2012, a number of holdings with international exposure in the portfolio, particularly in the consumer discretionary sector, came under selling pressure due mostly to concerns about a weakening global economy. The Board further noted that the Fund is positioned more towards high quality growth names than other funds in its performance category, which detracted from relative performance.
Costs of Services by the Adviser. The Board reviewed the fees paid to the Manager and the other expenses borne by the Fund. The independent consultant provided comparative data in regard to the fees and expenses of the Fund and other large growth funds underlying variable insurance products. In reviewing the fees and expenses charged to the VA funds, the Board considered the Manager’s assertion that, because there is much greater disparity in the fees and services that may be provided by a manager to a VA fund as opposed to a retail fund, when comparing the expenses of the various VA funds to those of retail funds, it is most appropriate to focus on total expenses (rather than on the management fees). Accordingly, while the Board reviewed and considered all expenses, it focused on total expenses. The Board considered that the Fund’s total expenses were higher than its peer group median and equal to its category median and its contractual management fees were lower than its peer group median and category median. Within the total asset range of $500 million to $1 billion, the Fund’s effective rate was higher than its peer group median and category median. The Manager has contractually agreed to limit the Fund’s total annual operating expenses so that those expenses, as percentages of daily net assets, will not exceed the annual rate of 0.80% for Non-Service Shares and 1.05% for Service Shares. This waiver and/or reimbursement may not be amended or withdrawn for one year from the date of the Fund’s prospectus.
Economies of Scale and Profits Realized by the Adviser and Sub-Adviser. The Board considered information regarding the Manager’s costs in serving as the Fund’s investment adviser, including the costs associated with the personnel and systems necessary to manage the Fund, and information regarding the Manager’s profitability from its relationship with the Fund. The Board reviewed whether the Manager may realize economies of scale in managing and supporting the Fund. The Board noted that the Fund currently has management fee breakpoints, which are intended to share with Fund shareholders economies of scale that may exist as the Fund’s assets grow. Based on the Board’s evaluation, the Managers agreed to a revised
22 OPPENHEIMER CAPITAL APPRECIATION FUND/VA
| | |
| BOARD APPROVAL OF THE FUND’S INVESTMENT ADVISORY AND SUB-ADIVSORY AGREEMENTS Unaudited /Continued |
breakpoint schedule as negotiated by the Board that, effective November 2013, includes an additional fee breakpoint of 0.58% for assets in excess of $1 billion.
Other Benefits to the Managers. In addition to considering the profits realized by the Managers, the Board considered information that was provided regarding the direct and indirect benefits the Managers receive as a result of their relationship with the Fund, including compensation paid to the Managers’ affiliates and research provided to the Adviser in connection with permissible brokerage arrangements (soft dollar arrangements). The Board also considered that the Managers must be able to pay and retain experienced professional personnel at competitive rates to provide quality services to the Fund.
Conclusions. These factors were also considered by the independent Trustees meeting separately from the full Board, assisted by experienced counsel to the Fund and to the independent Trustees. Fund counsel and the independent Trustees’ counsel are independent of the Managers within the meaning and intent of the Securities and Exchange Commission Rules.
Based on its review of the information it received and its evaluations described above, the Board, including a majority of the independent Trustees, decided to continue the Agreements through August 31, 2014. In arriving at its decision, the Board did not identify any factor or factors as being more important than others, but considered all of the above information, and considered the terms and conditions of the Agreements, including the management fees, in light of all the surrounding circumstances.
23 OPPENHEIMER CAPITAL APPRECIATION FUND/VA
| | |
| PORTFOLIO PROXY VOTING POLICIES AND PROCEDURES; UPDATES TO STATEMENTS OF INVESTMENTS Unaudited |
The Fund has adopted Portfolio Proxy Voting Policies and Procedures under which the Fund votes proxies relating to securities (“portfolio proxies”) held by the Fund. A description of the Fund’s Portfolio Proxy Voting Policies and Procedures is available (i) without charge, upon request, by calling the Fund toll-free at 1.800.CALL OPP (225.5677), (ii) on the Fund’s website at oppenheimerfunds.com, and (iii) on the SEC’s website at www.sec.gov. In addition, the Fund is required to file Form N-PX, with its complete proxy voting record for the 12 months ended June 30th, no later than August 31st of each year. The Fund’s voting record is available (i) without charge, upon request, by calling the Fund toll-free at 1.800.CALL OPP (225.5677), and (ii) in the Form N-PX filing on the SEC’s website at www.sec.gov.
The Fund files its complete schedule of portfolio holdings with the SEC for the first quarter and the third quarter of each fiscal year on Form N-Q. The Fund’s Form N-Q filings are available on the SEC’s website at www.sec.gov. Those forms may be reviewed and copied at the SEC’s Public Reference Room in Washington, D.C. Information on the operation of the Public Reference Room may be obtained by calling 1-800-SEC-0330.
24 OPPENHEIMER CAPITAL APPRECIATION FUND/VA
| | |
| TRUSTEES AND OFFICERS Unaudited |
| | |
Name, Position(s) Held with the Fund, Length
of Service, Year of Birth | | Principal Occupation(s) During the Past 5 Years; Other Trusteeships/Directorships Held;
Number of Portfolios in the Fund Complex Currently Overseen |
| |
| INDEPENDENT TRUSTEES | | The address of each Trustee in the chart below is 6803 S. Tucson Way, Centennial, Colorado 80112-3924. Each Trustee serves for an indefinite term, or until his or her resignation, retirement, death or removal. |
| |
Sam Freedman, Chairman of the Board of Trustees (since 2013) and Trustee (since 1996) Year of Birth: 1940 | | Director of Colorado UpLIFT (charitable organization) (since September 1984). Mr. Freedman held several positions with the Sub-Adviser and with subsidiary or affiliated companies of the Sub-Adviser (until October 1994). Oversees 39 portfolios in the OppenheimerFunds complex. Mr. Freedman has served on the Boards of certain Oppenheimer funds since 1996, during which time he has become familiar with the Fund’s (and other Oppenheimer funds’) financial, accounting, regulatory and investment matters and has contributed to the Boards’ deliberations. |
| |
Edward L. Cameron, Trustee (since 1999) Year of Birth: 1938 | | Member of The Life Guard of Mount Vernon (George Washington historical site) (June 2000-June 2006); Partner of PricewaterhouseCoopers LLP (accounting firm) (July 1974-June 1999); Chairman of Price Waterhouse LLP Global Investment Management Industry Services Group (accounting firm) (July 1994-June 1998). Oversees 39 portfolios in the OppenheimerFunds complex. Mr. Cameron has served on the Boards of certain Oppenheimer funds since 1999, during which time he has become familiar with the Fund’s (and other Oppenheimer funds’) financial, accounting, regulatory and investment matters and has contributed to the Boards’ deliberations. |
| |
Jon S. Fossel, Trustee (since 1990) Year of Birth: 1942 | | Chairman of the Board (2006-December 2011) and Director (June 2002-December 2011) of UNUMProvident (insurance company); Director of Northwestern Energy Corp. (public utility corporation) (November 2004-December 2009); Director of P.R. Pharmaceuticals (October 1999-October 2003); Director of Rocky Mountain Elk Foundation (non-profit organization) (February 1998-February 2003 and February 2005-February 2007); Chairman and Director (until October 1996) and President and Chief Executive Officer (until October 1995) of the Sub-Adviser; President, Chief Executive Officer and Director of the following: Oppenheimer Acquisition Corp. (“OAC”) (parent holding company of the Sub-Adviser), Shareholders Services, Inc. and Shareholder Financial Services, Inc. (until October 1995). Oversees 39 portfolios in the OppenheimerFunds complex. Mr. Fossel has served on the Boards of certain Oppenheimer funds since 1990, during which time he has become familiar with the Fund’s (and other Oppenheimer funds’) financial, accounting, regulatory and investment matters and has contributed to the Boards’ deliberations. |
| |
Richard F. Grabish, Trustee (since 2012) Year of Birth: 1948 | | Formerly Senior Vice President and Assistant Director of Sales and Marketing (March 1997-December 2007), Director (March 1987-December 2007) and Manager of Private Client Services (June 1985-June 2005) of A.G. Edwards & Sons, Inc. (broker/dealer and investment firm); Chairman and Chief Executive Officer of A.G. Edwards Trust Company, FSB (March 2001-December 2007); President and Vice Chairman of A.G. Edwards Trust Company, FSB (investment adviser) (April 1987-March 2001); President of A.G. Edwards Trust Company, FSB (investment adviser) (June 2005-December 2007). Oversees 39 portfolios in the OppenheimerFunds complex. Mr. Grabish has served on the Boards of certain Oppenheimer funds since 2001, during which time he has become familiar with the Fund’s (and other Oppenheimer funds’) financial, accounting, regulatory and investment matters and has contributed to the Boards’ deliberations. |
| |
Beverly L. Hamilton, Trustee (since 2002) Year of Birth: 1946 | | Trustee of Monterey Institute for International Studies (educational organization) (since February 2000); Board Member of Middlebury College (educational organization) (December 2005-June 2011); Chairman (since 2010) of American Funds’ Emerging Markets Growth Fund, Inc. (mutual fund); Director of The California Endowment (philanthropic organization) (April 2002-April 2008); Director (February 2002-2005) and Chairman of Trustees (2006-2007) of the Community Hospital of Monterey Peninsula; Director (October 1991-2005); Vice Chairman (2006-2009) of American Funds’ Emerging Markets Growth Fund, Inc. (mutual fund); President of ARCO Investment Management Company (February 1991-April 2000); Member of the investment committees of The Rockefeller Foundation (2001-2006) and The University of Michigan (since 2000); Advisor at Credit Suisse First Boston’s Sprout venture capital unit (venture capital fund) (1994-January 2005); Trustee of MassMutual Institutional Funds (investment company) (1996-June 2004); Trustee of MML Series Investment Fund (investment company) (April 1989-June 2004); Member of the investment committee of Hartford Hospital (2000-2003); and Advisor to Unilever (Holland) pension fund (2000-2003). Oversees 39 portfolios in the OppenheimerFunds complex. Ms. Hamilton has served on the Boards of certain Oppenheimer funds since 2002, during which time she has become familiar with the Fund’s (and other Oppenheimer funds’) financial, accounting, regulatory and investment matters and has contributed to the Boards’ deliberations. |
| |
Victoria J. Herget, Trustee (since 2012) Year of Birth: 1951 | | Independent Director of the First American Funds (mutual fund family) (2003-2011); former Managing Director (1993-2001), Principal (1985-1993), Vice President (1978-1985) and Assistant Vice President (1973-1978) of Zurich Scudder Investments (and its predecessor firms); Board Chair (2008-Present) and Director (2004-Present), United Educators (insurance company); Trustee (1992-2007), Chair of the Board of Trustees (1999-2007), Investment Committee Chair (1994-1999) and Investment Committee member (2007-2010) of Wellesley College; Trustee (since 2000) and Chair (since 2010), Newberry Library; Trustee, Mather LifeWays (since 2001); Trustee, BoardSource (2006-2009) and Chicago City Day School (1994-2005). Oversees 39 portfolios in the OppenheimerFunds complex. Ms. Herget has served on the Boards of certain Oppenheimer funds since 2012, during which time she has become familiar with the Fund’s (and other Oppenheimer funds’) financial, accounting, regulatory and investment matters and has contributed to the Boards’ deliberations. |
25 OPPENHEIMER CAPITAL APPRECIATION FUND/VA
| | |
| TRUSTEES AND OFFICERS Unaudited / Continued |
| | |
Robert J. Malone, Trustee (since 2002) Year of Birth: 1944 | | Chairman of the Board (since 2012) and Director (since August 2005) of Jones International
University (educational organization) (since August 2005); Chairman, Chief Executive Officer and
Director of Steele Street Bank Trust (commercial banking) (since August 2003); Trustee of the
Gallagher Family Foundation (non-profit organization) (since 2000); Board of Directors of Opera
Colorado Foundation (non-profit organization) (2008-2012); Director of Colorado UpLIFT
(charitable organization) (1986-2010); Director of Jones Knowledge, Inc. (2006-2010); Former
Chairman of U.S. Bank-Colorado (subsidiary of U.S. Bancorp and formerly Colorado National
Bank) (July 1996-April 1999); Director of Commercial Assets, Inc. (real estate investment trust)
(1993-2000); Director of U.S. Exploration, Inc. (oil and gas exploration) (1997-February 2004);
Chairman of the Board (1991-1994) and Trustee (1985-1994) of Regis University; and Chairman
of the Board (1990-1991 and Trustee (1984-1999) of Young Presidents Organization. Oversees
39 portfolios in the OppenheimerFunds complex. Mr. Malone has served on the Boards of certain
Oppenheimer funds since 2002, during which time he has become familiar with the Fund’s (and
other Oppenheimer funds’) financial, accounting, regulatory and investment matters and has
contributed to the Boards’ deliberations. |
| |
F. William Marshall, Jr., Trustee (since 2000) Year of Birth: 1942 | | Trustee Emeritus of Worcester Polytech Institute (WPI) (private university) (since 2009); Trustee of
MassMutual Select Funds (formerly MassMutual Institutional Funds) (investment company) (since
1996), MML Series Investment Fund (investment company) (since 1996) and Mass Mutual
Premier Funds (investment company) (since January 2012); President and Treasurer of the SIS
Fund (private charitable fund) (January 1999 – March 2011); Former Trustee of WPI (1985-2008);
Former Chairman of the Board (2004-2006) and Former Chairman of the Investment Committee of
WPI (1994-2008); Chairman of SIS & Family Bank, F.S.B. (formerly SIS Bank) (commercial bank)
(January 1999-July 1999); Executive Vice President of Peoples Heritage Financial Group, Inc.
(commercial bank) (January 1999-July 1999); and Former President and Chief Executive Officer
of SIS Bancorp. (1993-1999). Oversees 43 portfolios in the OppenheimerFunds complex. Mr.
Marshall has served on the Boards of certain Oppenheimer funds since 2000, during which time
he has become familiar with the Fund’s (and other Oppenheimer funds’) financial, accounting,
regulatory and investment matters and has contributed to the Boards’ deliberations. |
| |
Karen L. Stuckey, Trustee (since 2012) Year of Birth: 1953 | | Partner (1990-2012) of PricewaterhouseCoopers LLP (held various positions 1975-1990);
Emeritus Trustee (since 2006), Trustee (1992-2006) and member of Executive, Nominating and
Audit Committees and Chair of Finance Committee of Lehigh University; and member, Women’s
Investment Management Forum since inception. Oversees 39 portfolios in the OppenheimerFunds
complex. Ms. Stuckey has served on the Boards of certain Oppenheimer funds since 2012, during
which time she has become familiar with the Fund’s (and other Oppenheimer funds’) financial,
accounting, regulatory and investment matters and has contributed to the Boards’ deliberations. |
| |
James D. Vaughn, Trustee (since 2012) Year of Birth: 1945 | | Retired; former managing partner (1994-2001) of Denver office of Deloitte & Touche LLP, (held
various positions 1969-1993); Trustee and Chairman of the Audit Committee of Schroder Funds
(2003-2012); Board member and Chairman of Audit Committee of AMG National Trust Bank
(since 2005); Trustee and Investment Committee member, University of South Dakota Foundation
(since 1996); Board member, Audit Committee Member and past Board Chair, Junior
Achievement (since 1993); former Board member, Mile High United Way, Boys and Girls Clubs,
Boy Scouts, Colorado Business Committee for the Arts, Economic Club of Colorado and Metro
Denver Network. Oversees 39 portfolios in the OppenheimerFunds complex. Mr. Vaughn has
served on the Boards of certain Oppenheimer funds since 2012, during which time he has become
familiar with the Fund’s (and other Oppenheimer funds’) financial, accounting, regulatory and
investment matters and has contributed to the Boards’ deliberations. |
| |
| INTERESTED TRUSTEE AND OFFICER | | Mr. Glavin is an “Interested Trustee” because he is affiliated with the Manager and the Sub-
Adviser by virtue of his positions as an officer and director of the Manager and a director of the
Sub-Adviser, and as a shareholder of the Sub-Adviser’s parent company. Both as a Trustee and
as an officer, he serves for an indefinite term, or until his resignation, retirement, death or removal.
Mr. Glavin’s address is Two World Financial Center, 225 Liberty Street, 11th Floor, New York,
New York 10281-1008. |
| |
William F. Glavin, Jr., Trustee, President and Principal Executive Officer
(since 2009) Year of Birth: 1958 | | Director, Chairman and Chief Executive Officer of the Manager (since January 2013); President of
the Manager (January 2013-May 2013); Chairman of the Sub-Adviser (December 2009-December
2012); Chief Executive Officer (January 2009-December 2012) and Director of the Sub-Adviser
(since January 2009); President of the Sub-Adviser (May 2009-December 2012); Management
Director (since June 2009), President (since December 2009) and Chief Executive Officer (since
January 2011) of Oppenheimer Acquisition Corp. (“OAC”) (the Sub-Adviser’s parent holding
company); Director of Oppenheimer Real Asset Management, Inc. (since March 2010); Executive
Vice President (March 2006-February 2009) and Chief Operating Officer (July 2007-February
2009) of Massachusetts Mutual Life Insurance Company (OAC’s parent company); Director (May
2004-March 2006) and Chief Operating Officer and Chief Compliance Officer (May 2004-January
2005), President (January 2005-March 2006) and Chief Executive Officer (June 2005-March
2006) of Babson Capital Management LLC; Director (March 2005-March 2006), President (May
2003-March 2006) and Chief Compliance Officer (July 2005-March 2006) of Babson Capital
Securities, Inc. (a broker-dealer); President (May 2003-March 2006) of Babson Investment
Company, Inc.; Director (May 2004-August 2006) of Babson Capital Europe Limited; Director (May
2004-October 2006) of Babson Capital Guernsey Limited; Director (May 2004-March 2006) of
Babson Capital Management LLC; Non-Executive Director (March 2005-March 2007) of Baring
Asset Management Limited; Director (February 2005-June 2006) Baring Pension Trustees
Limited; Director and Treasurer (December 2003-November 2006) of Charter Oak Capital
Management, Inc.; Director (May 2006-September 2006) of C.M. Benefit Insurance Company;
Director (May 2008-June 2009) and Executive Vice President (June 2007-July 2009) of C.M. Life
Insurance Company; President (March 2006-May 2007) of MassMutual Assignment Company;
Director (January 2005-December 2006), Deputy Chairman (March 2005-December 2006) and
President (February 2005-March 2005) of MassMutual Holdings (Bermuda) Limited; Director (May
2008-June 2009) and Executive Vice President (June 2007-July 2009) of MML Bay State Life
Insurance Company; Chief Executive Officer and President (April 2007-January 2009) of MML
Distributors, LLC; and Chairman (March 2006-December 2008) and Chief Executive Officer (May
2007-December 2008) of MML Investors Services, Inc. An officer of 90 portfolios in the
OppenheimerFunds complex. |
26 OPPENHEIMER CAPITAL APPRECIATION FUND/VA
| | |
OTHER OFFICERS OF THE FUND | | The addresses of the Officers in the chart below are as follows: for Messrs. Kotlarz, Gabinet and
Ms. Nasta, Two World Financial Center, 225 Liberty Street, New York, New York 10281-1008, for
Messrs. Vandehey and Wixted, 6803 S. Tucson Way, Centennial, Colorado 80112-3924. Each
Officer serves for an indefinite term or until his or her resignation, retirement, death or removal. |
| |
Michael Kotlarz, Vice President (since 2012) Year of Birth: 1972 | | Vice President of the Sub-Adviser (since March 2008). Senior Research Analyst of the Sub-
Adviser (March 2008-May 2013). Managing Director of Equity Research at Ark Asset Management
(March 2000-March 2008). A portfolio manager and officer of other portfolios in the
OppenheimerFunds complex. |
| |
Arthur S. Gabinet, Secretary and Chief Legal Officer (since 2011) Year of Birth: 1958 | | Executive Vice President, Secretary and General Counsel of the Manager (since January 2013);
General Counsel OFI SteelPath, Inc. (since January 2013); Executive Vice President (May 2010-
December 2012) and General Counsel (since January 2011) of the Sub-Adviser; General Counsel
of the Distributor (since January 2011); General Counsel of Centennial Asset Management
Corporation (January 2011-December 2012); Executive Vice President (January 2011-December
2012) and General Counsel of HarbourView Asset Management Corporation (since January
2011); Assistant Secretary (since January 2011) and Director (since January 2011) of
OppenheimerFunds International Ltd. and OppenheimerFunds plc; Director of Oppenheimer Real
Asset Management, Inc. (January 2011-December 2012) and General Counsel (since January
2011); Executive Vice President (January 2011-December 2011) and General Counsel of
Shareholder Financial Services, Inc. and Shareholder Services, Inc. (since January 2011);
Executive Vice President (January 2011-December 2012) and General Counsel of OFI Private
Investments Inc. (since January 2011); Vice President of OppenheimerFunds Legacy Program
(January 2011-December 2011); Executive Vice President (January 2011-December 2012) and
General Counsel of OFI Institutional Asset Management, Inc. (since January 2011); General
Counsel, Asset Management of the Sub-Adviser (May 2010-December 2010); Principal, The
Vanguard Group (November 2005-April 2010); District Administrator, U.S. Securities and
Exchange Commission (January 2003-October 2005). An officer of 90 portfolios in the
OppenheimerFunds complex. |
| |
Christina M. Nasta, Vice President and Chief Business Officer
(since 2011) Year of Birth: 1973 | | Senior Vice President of OppenheimerFunds Distributor, Inc. (since January 2013); Senior Vice
President of the Sub-Adviser (July 2010-December 2012); Vice President of the Sub-Adviser
(January 2003-July 2010); Vice President of OppenheimerFunds Distributor, Inc. (January 2003-
July 2010). An officer of 90 portfolios in the OppenheimerFunds complex. |
| |
Mark S. Vandehey, Vice President and Chief Compliance Officer
(since 2004) Year of Birth: 1950 | | Senior Vice President and Chief Compliance Officer of the Manager (since January 2013); Chief
Compliance Officer of OFI SteelPath, Inc. (since January 2013); Senior Vice President of the Sub-
Adviser (March 2004-December 2012); Chief Compliance Officer of the Sub-Adviser,
OppenheimerFunds Distributor, Inc., OFI Trust Company, OFI Institutional Asset Management,
Inc., Oppenheimer Real Asset Management, Inc., OFI Private Investments, Inc., Harborview Asset
Management Corporation, Trinity Investment Management Corporation, and Shareholder
Services, Inc. (since March 2004); Vice President of OppenheimerFunds Distributor, Inc.,
Centennial Asset Management Corporation and Shareholder Services, Inc. (June 1983-December
2012). An officer of 90 portfolios in the OppenheimerFunds complex. |
| |
Brian W. Wixted, Treasurer and Principal Financial & Accounting
Officer (since 1999) Year of Birth: 1959 | | Senior Vice President of the Manager (since January 2013); Treasurer of the Sub-Adviser,
HarbourView Asset Management Corporation, Shareholder Financial Services, Inc., Shareholder
Services, Inc., and Oppenheimer Real Asset Management, Inc. (March 1999-June 2008), OFI
Private Investments, Inc. (March 2000-June 2008), OppenheimerFunds International Ltd. and
OppenheimerFunds plc (since May 2000), OFI Institutional Asset Management, Inc. (November
2000-June 2008), and OppenheimerFunds Legacy Program (charitable trust program established
by the Sub-Adviser) (June 2003-December 2011); Treasurer and Chief Financial Officer of OFI
Trust Company (since May 2000); Assistant Treasurer of Oppenheimer Acquisition Corporation
(March 1999-June 2008). An officer of 90 portfolios in the OppenheimerFunds complex. |
The Fund’s Statement of Additional Information contains additional information about the Fund’s Trustees and Officers and is available without charge, upon request, by calling 1.800.988.8287.
27 OPPENHEIMER CAPITAL APPRECIATION FUND/VA
OPPENHEIMER CAPITAL APPRECIATION FUND/VA
A Series of Oppenheimer Variable Account Funds
| | |
| Manager | | OFI Global Asset Management, Inc. |
| |
| Sub-Adviser | | OppenheimerFunds, Inc. |
| |
| Distributor | | OppenheimerFunds Distributor, Inc. |
| |
| Transfer and | | OFI Global Asset Management, Inc. |
| Shareholder | | |
| Servicing Agent | | |
| |
| Sub-Transfer Agent | | Shareholder Services, Inc. OppenheimerFunds Services |
| |
Independent Registered Public Accounting Firm | | KPMG LLP |
| |
| Counsel | | K&L Gates LLP |
| |
| | Before investing, investors should carefully consider a fund’s investment objectives, risks, charges and expenses. Fund prospectuses and summary prospectuses contain this and other information about the funds, and may be obtained by asking your financial advisor, or calling us at 1.800.988.8287. Read prospectuses and summary prospectuses carefully before investing. |
| |
| | © 2014 OppenheimerFunds, Inc. All rights reserved. Oppenheimer funds are distributed by OppenheimerFunds, Inc. |
| |
| |  |
| | | | | | |
| December 31, 2013 | | |
| | | | | | |
| | | | | | |
| | | | Oppenheimer Core Bond Fund/VA A Series of Oppenheimer Variable Account Funds | | Annual Report |
| | | | | | |
| | | | | | |
| | | | ANNUAL REPORT Listing of Top Holdings Fund Performance Discussion Financial Statements | | |

Portfolio Managers: Krishna Memani and
Peter A. Strzalkowski, CFA
Average Annual Total Returns
For the Periods Ended 12/31/13
| | | | | | | | |
| | | 1-Year | | 5-Year | | 10-Year | | |
Non-Service Shares | | -0.10% | | 7.82% | | 0.55% | | |
Service Shares | | -0.38% | | 7.53% | | 0.30% | | |
Performance data quoted represents past performance, which does not guarantee future results. The investment return and principal value of an investment in the Fund will fluctuate so that an investor’s shares, when redeemed, may be worth more or less than their original cost. Current performance may be lower or higher than the performance quoted. For performance data current to the most recent month end, call us at 1.800.988.8287. The Fund’s total returns should not be expected to be the same as the returns of other funds, whether or not both funds have the same portfolio managers and/or similar names. The Fund’s total returns include changes in share price and reinvested distributions but do not include the charges associated with the separate account products that offer this Fund. Such performance would have been lower if such charges were taken into account.
CORPORATE BONDS & NOTES—TOP TEN INDUSTRIES
| | |
|
Oil, Gas & Consumable Fuels | | 4.9% |
|
Commercial Banks | | 4.4 |
|
Insurance | | 4.0 |
|
Capital Markets | | 2.4 |
|
Diversified Financial Services | | 2.4 |
|
Diversified Telecommunication Services | | 1.9 |
|
Metals & Mining | | 1.7 |
|
Real Estate Investment Trusts (REITs) | | 1.5 |
|
Automobiles | | 1.4 |
|
Media | | 1.3 |
|
Portfolio holdings and allocations are subject to change. Percentages are as of December 31, 2013, and are based on net assets.
| | | | |
| CREDIT RATING BREAKDOWN | | NRSRO ONLY
TOTAL | |
| |
AAA | | | 41.8% | |
| |
AA | | | 5.0 | |
| |
A | | | 13.7 | |
| |
BBB | | | 28.6 | |
| |
BB | | | 6.4 | |
| |
B | | | 0.3 | |
| |
CCC | | | 2.1 | |
| |
CC | | | 0.1 | |
| |
D | | | 2.0 | |
| |
Total | | | 100.0% | |
The percentages above are based on the market value of the Fund’s securities as of December 31, 2013, and are subject to change. Except for securities labeled “Unrated” and except for certain securities issued or guaranteed by a foreign sovereign, all securities have been rated by at least one Nationally Recognized Statistical Rating Organization (“NRSRO”), such as Standard & Poor’s (“S&P”). For securities rated only by an NRSRO other than S&P, OppenheimerFunds, Inc. (the “Sub-Adviser”) converts that rating to the equivalent S&P rating. If two or more NRSROs have assigned a rating to a security, the highest S&P equivalent rating is used. Unrated securities issued or guaranteed by a foreign sovereign are assigned a credit rating equal to the highest NRSRO rating assigned to that foreign sovereign. For securities not rated by an NRSRO, the Sub-Adviser uses its own credit analysis to assign ratings in categories similar to those of S&P. The use of similar categories is not an indication that the sub-adviser’s credit analysis process is consistent or comparable with any NRSRO’s process were that NRSRO to rate the same security. Fund assets invested in Oppenheimer Institutional Money Market Fund are assigned that fund’s S&P rating, which is currently AAA. For the purposes of this table, “investment-grade” securities are securities rated within the NRSROs’ four highest rating categories (AAA, AA, A and BBB). Unrated securities do not necessarily indicate low credit quality, and may or may not be the equivalent of investment-grade. Please consult the Fund’s prospectus and Statement of Additional Information for further information.
2 OPPENHEIMER CORE BOND FUND/VA
Fund Performance Discussion
In what was a volatile period for fixed-income markets, the Fund’s Non-Service shares produced a total return of -0.10% during the one-year reporting period ended December 31, 2013. On a relative basis, the Fund outperformed the Barclays U.S. Aggregate Bond Index, the Barclays Credit Index and the Citigroup Broad Investment Grade Bond Index, which returned -2.02%, -2.01% and -2.04%, respectively.
MARKET OVERVIEW
Accommodative monetary policies on the part of central banks in the U.S., Europe and Japan, combined with an improving economic outlook, resulted in a rally among risk equities and higher-yielding bonds over the first four months of 2013. At the same time, yields of U.S. government securities remained near historical lows due to the Federal Reserve’s (the “Fed’s”) massive bond buying program. These developments drove financial markets higher through the early spring of 2013. At that time, economic data appeared to confirm that the United States, Europe and Japan had engineered a sustained economic rebound, but investors responded negatively to disappointing economic data from China, India, Brazil, and other emerging markets. The ensuing “flight to quality” toward traditional safe havens produced sharp dislocations in emerging equity, fixed-income and currency markets. In late May, relatively hawkish remarks by Fed chairman Ben Bernanke were widely interpreted as a signal that U.S. monetary policymakers would begin to back away from their quantitative easing program sooner than expected, sparking heightened volatility in financial markets throughout the world. However, market conditions generally stabilized over the summer of 2013. In October, the U.S. Congress managed to reach a bipartisan agreement to raise the national debt ceiling, and did so well ahead of the potential default deadline. While the Fed unexpectedly refrained from reducing its monthly bond purchases in September, in December the Central Bank announced that it would reduce its monthly bond purchases by $10 billion, from $85 billion to $75 billion, starting in January 2014. The Fed also announced that it would continue to hold short-term interest rates at very low levels until unemployment in the United States subsided below 6.5%. This was lower than its earlier 7% target.
FUND REVIEW
During the reporting period, we remained significantly underweight government bonds and favored corporate bonds, mortgage-backed securities and structured products. This positioning benefited the Fund’s relative performance during the period, as higher-yielding fixed income sectors outperformed the performance of U.S. Treasuries. Our exposure to corporate bonds produced positive results this period and was a primary outperformer to relative performance. Within the corporate bond allocation, an overweight to the financial sector was beneficial to performance as a review of the sector by Moody’s in November resulted in a positive outcome for many banks that were at risk of losing their investment grade rating. The Fund also benefited from a modest allocation to high yield bonds which saw significant spread compression throughout the year.
The Fund’s investments in non-agency mortgage-backed securities (“MBS”), commercial mortgage-backed securities (“CMBS”) and asset backed securities (“ABS”) also benefited performance for the one-year period. However, our allocation to agency MBS produced slight negative results. Before the Fed’s comments on tapering in May, we started reducing our position in agency MBS since we felt they were vulnerable to policy changes. This decision helped limit their negative impact on the Fund when interest rates rose and volatility in the mortgage market increased over the second half of the reporting period.
OUTLOOK
As the markets have successfully digested the first round of tapering by the Fed and the government shutdown is firmly behind us, we believe there is increasingly reason for optimism. By historical standards, central banks around the globe are executing exceedingly loose monetary policy, which provides plenty of liquidity to the markets. While U.S. growth continues to be a bright spot, we are beginning to see signs that growth within Europe may be turning the corner. And while it may be clear that China’s growth trajectory is slowing, we believe policymakers have the situation in hand and the probability of a hard landing is still quite low.
In such an environment, we remain constructive on credit spreads as the markets become less concerned about potentially negative global macroeconomic events, and instead focus on the fundamental strength of corporate balance sheets. In a “yield-starved” domestic fixed income market dominated by U.S. Treasuries hovering at near historic lows, the case for corporate bonds, mortgage-backed securities and structured products remains compelling. Generally, our preference is to maintain a carry, or yield advantage, in the context of this environment. Given current conditions, the additional carry of the Fund may potentially help returns even if spreads remain at their current levels.
The Fund’s investment strategy and focus can change over time. The mention of specific fund holdings does not constitute a recommendation by OppenheimerFunds, Inc. and its affiliates.
Shares of Oppenheimer funds are not deposits or obligations of any bank, are not guaranteed by any bank, are not insured by the FDIC or any other agency, and involve investment risks, including the possible loss of the principal amount invested.
3 OPPENHEIMER CORE BOND FUND/VA
Comparing the Fund’s Performance to the Market. The graphs that follow show the performance of a hypothetical $10,000 investment in each share class of the Fund held until December 31, 2013. Performance is measured over a ten-fiscal-year period for both Classes. Performance information does not reflect charges that apply to separate accounts investing in the Fund. If these charges were taken into account, performance would be lower. The graphs assume that all dividends and capital gains distributions were reinvested in additional shares.
The Fund’s performance is compared to the performance of the Citigroup Broad Investment Grade (“BIG”) Bond Index, the Barclays U.S. Aggregate Bond Index and the Barclays Credit Index. The Citigroup BIG Bond Index is an index of institutionally traded U.S. Treasury Bonds, government-sponsored bonds, mortgage-backed securities and corporate securities. The Barclays U.S. Aggregate Bond Index is an index of U.S. corporate and government bonds. The Barclays Credit Index is an index of non-convertible U.S. investment grade corporate bonds. Indices are unmanaged and cannot be purchased directly by investors. Index performance includes reinvestment of income, but does not reflect transaction costs, fees, expenses or taxes. Index performance is shown for illustrative purposes only as a benchmark for the Fund’s performance, and does not predict or depict performance of the Fund. The Fund’s performance reflects the effects of the Fund’s business and operating expenses.
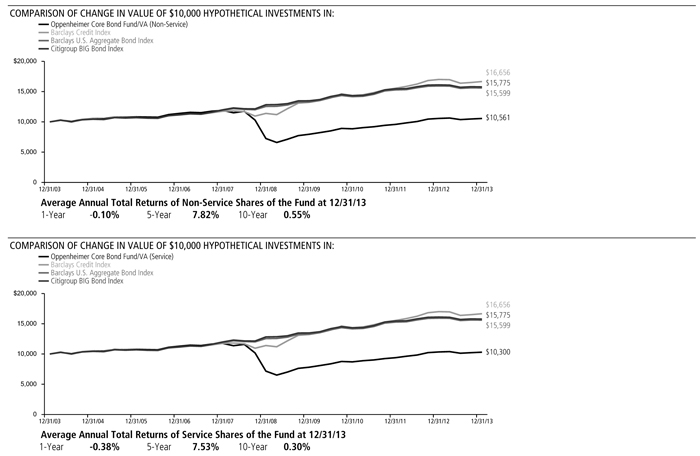
Performance data quoted represents past performance, which does not guarantee future results. The investment return and principal value of an investment in the Fund will fluctuate so that an investor’s shares, when redeemed, may be worth more or less than their original cost. Current performance may be lower or higher than the performance quoted. For performance data current to the most recent month end, call us at 1.800.988.8287. The Fund’s total returns should not be expected to be the same as the returns of other funds, whether or not both funds have the same portfolio managers and/or similar names. The Fund’s total returns include changes in share price and reinvested distributions but do not include the charges associated with the separate account products that offer this Fund. Such performance would have been lower if such charges were taken into account.
4 OPPENHEIMER CORE BOND FUND/VA
Fund Expenses
Fund Expenses. As a shareholder of the Fund, you incur two types of costs: (1) transaction costs and (2) ongoing costs, including management fees; distribution and service fees; and other Fund expenses. These examples are intended to help you understand your ongoing costs (in dollars) of investing in the Fund and to compare these costs with the ongoing costs of investing in other mutual funds.
The examples are based on an investment of $1,000.00 invested at the beginning of the period and held for the entire 6-month period ended December 31, 2013.
Actual Expenses. The first section of the table provides information about actual account values and actual expenses. You may use the information in this section for the class of shares you hold, together with the amount you invested, to estimate the expense that you paid over the period. Simply divide your account value by $1,000.00 (for example, an $8,600.00 account value divided by $1,000.00 = 8.60), then multiply the result by the number in the first section under the heading entitled “Expenses Paid During Period” to estimate the expenses you paid on your account during this period.
Hypothetical Example for Comparison Purposes.
The second section of the table provides information about hypothetical account values and hypothetical expenses based on the Fund’s actual expense ratio for each class of shares, and an assumed rate of return of 5% per year for each class before expenses, which is not the actual return. The hypothetical account values and expenses may not be used to estimate the actual ending account balance or expenses you paid for the period. You may use this information to compare the ongoing costs of investing in the Fund and other funds. To do so, compare this 5% hypothetical example for the class of shares you hold with the 5% hypothetical examples that appear in the shareholder reports of the other funds.
Please note that the expenses shown in the table are meant to highlight your ongoing costs only and do not reflect any charges associated with the separate accounts that offer this Fund. Therefore, the “hypothetical” lines of the table are useful in comparing ongoing costs only, and will not help you determine the relative total costs of owning different funds. In addition, if these separate account charges were included your costs would have been higher.
| | | | | | | | | | | | | | |
| Actual | | Beginning Account Value July 1, 2013 | | | Ending Account Value December 31, 2013 | | | Expenses Paid During 6 Months Ended December 31, 2013 | | | |
Non-Service shares | | $ | 1,000.00 | | | $ | 1,018.20 | | | $ | 3.82 | | | |
|
Service shares | | | 1,000.00 | | | | 1,017.10 | | | | 5.10 | | | |
|
| | | | |
Hypothetical (5% return before expenses) | | | | | | | | | | | |
Non-Service shares | | | 1,000.00 | | | | 1,021.42 | | | | 3.83 | | | |
|
Service shares | | | 1,000.00 | | | | 1,020.16 | | | | 5.10 | | | |
|
Expenses are equal to the Fund’s annualized expense ratio for that class, multiplied by the average account value over the period, multiplied by 184/365 (to reflect the one-half year period). Those annualized expense ratios, excluding indirect expenses from affiliated funds, based on the 6-month period ended December 31, 2013 are as follows:
| | | | |
| Class | | Expense Ratios | |
Non-Service shares | | | 0.75% | |
Service shares | | | 1.00 | |
The expense ratios reflect contractual waivers and/or reimbursements of expenses by the Fund’s Manager. Some of these undertakings may be modified or terminated at any time, unless approved by the Board of Trustees. The “Financial Highlights” tables in the Fund’s financial statements, included in this report, also show the gross expense ratios, without such waivers or reimbursements and reduction to custodian expenses, if applicable.
5 OPPENHEIMER CORE BOND FUND/VA
STATEMENTOF INVESTMENTS December 31, 2013
| | | | | | | | | | |
| | | Principal
Amount | | | Value | | | |
Asset-Backed Securities—15.1% | | | |
Auto Loan—15.0% | | | | | | | | | | |
American Credit Acceptance Receivables Trust: | | | | | | | | | | |
Series 2012-2, Cl. A, 1.89%, 7/15/161 | | $ | 169,190 | | | $ | 169,758 | | | |
Series 2012-3, Cl. A, 1.64%, 11/15/161 | | | 85,597 | | | | 85,774 | | | |
Series 2012-3, Cl. C, 2.78%, 9/17/181 | | | 90,000 | | | | 90,672 | | | |
Series 2013-2, Cl. B, 2.84%, 5/15/191 | | | 381,000 | | | | 382,009 | | | |
AmeriCredit Automobile Receivables Trust: | | | | | | | | | | |
Series 2011-1, Cl. D, 4.26%, 2/8/17 | | | 120,000 | | | | 124,802 | | | |
Series 2011-2, Cl. D, 4.00%, 5/8/17 | | | 525,000 | | | | 543,320 | | | |
Series 2011-4, Cl. D, 4.08%, 9/8/17 | | | 650,000 | | | | 679,274 | | | |
Series 2011-5, Cl. D, 5.05%, 12/8/17 | | | 435,000 | | | | 465,111 | | | |
Series 2012-1, Cl. D, 4.72%, 3/8/18 | | | 155,000 | | | | 164,524 | | | |
Series 2012-2, Cl. B, 1.78%, 3/8/17 | | | 345,000 | | | | 348,582 | | | |
Series 2012-2, Cl. D, 3.38%, 4/9/18 | | | 695,000 | | | | 720,298 | | | |
Series 2012-4, Cl. D, 2.68%, 10/9/18 | | | 75,000 | | | | 75,697 | | | |
Series 2012-5, Cl. C, 1.69%, 11/8/18 | | | 255,000 | | | | 254,755 | | | |
Series 2012-5, Cl. D, 2.35%, 12/10/18 | | | 365,000 | | | | 365,071 | | | |
Series 2013-1, Cl. C, 1.57%, 1/8/19 | | | 420,000 | | | | 415,876 | | | |
Series 2013-1, Cl. D, 2.09%, 2/8/19 | | | 295,000 | | | | 293,185 | | | |
Series 2013-2, Cl. D, 2.42%, 5/8/19 | | | 445,000 | | | | 442,013 | | | |
Series 2013-3, Cl. D, 3.00%, 7/8/19 | | | 290,000 | | | | 291,719 | | | |
Series 2013-4, Cl. D, 3.31%, 10/8/19 | | | 30,000 | | | | 30,449 | | | |
Series 2013-5, Cl. D, 2.86%, 12/8/19 | | | 135,000 | | | | 134,686 | | | |
California Republic Auto Receivables Trust, Series 2013-2, Cl. C, 3.32%, 8/17/20 | | | 230,000 | | | | 227,968 | | | |
Capital Auto Receivables Asset Trust: | | | | | | | | | | |
Series 2013-1, Cl. D, 2.19%, 9/20/21 | | | 195,000 | | | | 191,283 | | | |
Series 2013-4, Cl. D, 3.22%, 5/20/19 | | | 105,000 | | | | 104,122 | | | |
Carfinance Capital Auto Trust: | | | | | | | | | | |
Series 2013-1A, Cl. A, 1.65%, 7/17/171 | | | 109,953 | | | | 109,734 | | | |
Series 2013-2A, Cl. B, 3.15%, 8/15/191 | | | 530,000 | | | | 529,515 | | | |
Centre Point Funding LLC, Series 2010-1A, Cl. 1, 5.43%, 7/20/161 | | | 55,031 | | | | 56,951 | | | |
CPS Auto Receivables Trust: | | | | | | | | | | |
Series 2012-B, Cl. A, 2.52%, 9/16/191 | | | 339,756 | | | | 341,710 | | | |
Series 2012-C, Cl. A, 1.82%, 12/16/191 | | | 112,500 | | | | 112,033 | | | |
Credit Acceptance Auto Loan Trust: | | | | | | | | | | |
Series 2012-1A, Cl. A, 2.20%, 9/16/191 | | | 260,000 | | | | 261,867 | | | |
Series 2012-2A, Cl. A, 1.52%, 3/16/201 | | | 155,000 | | | | 155,485 | | | |
Series 2012-2A, Cl. B, 2.21%, 9/15/201 | | | 80,000 | | | | 80,448 | | | |
Series 2013-1A, Cl. B, 1.83%, 4/15/211 | | | 235,000 | | | | 233,536 | | | |
Series 2013-2A, Cl. B, 2.26%, 10/15/212 | | | 260,000 | | | | 259,419 | | | |
DT Auto Owner Trust: | | | | | | | | | | |
Series 2011-3A, Cl. C, 4.03%, 2/15/171 | | | 160,395 | | | | 160,592 | | | |
Series 2012-1A, Cl. D, 4.94%, 7/16/181 | | | 25,000 | | | | 25,794 | | | �� |
Series 2012-2A, Cl. D, 4.35%, 3/15/191 | | | 130,000 | | | | 134,082 | | | |
Series 2013-1A, Cl. D, 3.74%, 5/15/201 | | | 175,000 | | | | 175,402 | | | |
Series 2013-2A, Cl. D, 4.18%, 6/15/201 | | | 425,000 | | | | 426,944 | | | |
Exeter Automobile Receivables Trust: | | | | | | | | | | |
Series 2012-2A, Cl. B, 2.22%, 12/15/171 | | | 205,000 | | | | 204,488 | | | |
Series 2012-2A, Cl. C, 3.06%, 7/16/181 | | | 35,000 | | | | 34,801 | | | |
Series 2013-2A, Cl. B, 3.09%, 7/16/181 | | | 400,000 | | | | 402,574 | | | |
Series 2013-2A, Cl. C, 4.35%, 1/15/191 | | | 405,000 | | | | 408,085 | | | |
First Investors Auto Owner Trust: | | | | | | | | | | |
Series 2012-1A, Cl. D, 5.65%, 4/15/181 | | | 155,000 | | | | 163,006 | | | |
Series 2013-3A, Cl. B, 2.32%, 10/15/191 | | | 385,000 | | | | 382,975 | | | |
Series 2013-3A, Cl. C, 2.91%, 1/15/201 | | | 165,000 | | | | 163,949 | | | |
Series 2013-3A, Cl. D, 3.67%, 5/15/201 | | | 125,000 | | | | 124,153 | | | |
Ford Credit Auto Owner Trust, Series 2013-A, Cl. D, 1.86%, 8/15/19 | | | 280,000 | | | | 277,470 | | | |
Ford Credit Floorplan Master Owner Trust A: | | | | | | | | | | |
Series 2012-1, Cl. C, 1.667%, 1/15/163 | | | 200,000 | | | | 200,086 | | | |
Series 2012-2, Cl. C, 2.86%, 1/15/19 | | | 295,000 | | | | 302,824 | | | |
Navistar Financial Dealer Note Master Trust, Series 2013-2, Cl. D, 2.415%, 9/25/181,3 | | | 385,000 | | | | 385,851 | | | |
Prestige Auto Receivables Trust, Series 2011-1A, Cl. D, 5.18%, 7/16/181 | | | 180,000 | | | | 185,469 | | | |
Santander Drive Auto Receivables Trust: | | | | | | | | | | |
Series 2011-1, Cl. D, 4.01%, 2/15/17 | | | 465,000 | | | | 483,522 | | | |
Series 2011-S2A, Cl. D, 3.35%, 6/15/172 | | | 1,325 | | | | 1,328 | | | |
Series 2012-2, Cl. C, 3.20%, 2/15/18 | | | 295,000 | | | | 303,286 | | | |
| | | | | | | | | | |
| | | Principal
Amount | | | Value | | | |
Auto Loan (Continued) | | | | | | | | | | |
Series 2012-2, Cl. D, 3.87%, 2/15/18 | | $ | 545,000 | | | $ | 572,337 | | | |
Series 2012-3, Cl. C, 3.01%, 4/16/18 | | | 190,000 | | | | 195,607 | | | |
Series 2012-4, Cl. D, 3.50%, 7/15/16 | | | 680,000 | | | | 709,823 | | | |
Series 2012-5, Cl. C, 2.70%, 8/15/18 | | | 670,000 | | | | 688,594 | | | |
Series 2012-5, Cl. D, 3.30%, 9/17/18 | | | 835,000 | | | | 860,284 | | | |
Series 2012-6, Cl. B, 1.33%, 5/15/17 | | | 560,000 | | | | 561,749 | | | |
Series 2012-6, Cl. D, 2.52%, 9/17/18 | | | 880,000 | | | | 883,292 | | | |
Series 2012-AA, Cl. D, 2.46%, 12/17/181 | | | 480,000 | | | | 479,372 | | | |
Series 2013-1, Cl. C, 1.76%, 1/15/19 | | | 455,000 | | | | 451,673 | | | |
Series 2013-1, Cl. D, 2.27%, 1/15/19 | | | 240,000 | | | | 237,492 | | | |
Series 2013-2, Cl. D, 2.57%, 3/15/19 | | | 325,000 | | | | 323,717 | | | |
Series 2013-3, Cl. C, 1.81%, 4/15/19 | | | 100,000 | | | | 99,408 | | | |
Series 2013-3, Cl. D, 2.42%, 4/15/19 | | | 215,000 | | | | 212,775 | | | |
Series 2013-4, Cl. D, 3.92%, 1/15/20 | | | 110,000 | | | | 114,167 | | | |
Series 2013-5, Cl. C, 2.25%, 6/17/19 | | | 35,000 | | | | 34,910 | | | |
Series 2013-5, Cl. D, 2.73%, 10/15/19 | | | 330,000 | | | | 327,285 | | | |
Series 2013-A, Cl. C, 3.12%, 8/15/171 | | | 780,000 | | | | 800,624 | | | |
SNAAC Auto Receivables Trust: | | | | | | | | | | |
Series 2012-1A, Cl. A, 1.78%, 6/15/161 | | | 35,331 | | | | 35,378 | | | |
Series 2012-1A, Cl. C, 4.38%, 6/15/171 | | | 165,000 | | | | 168,794 | | | |
Series 2013-1A, Cl. B, 2.09%, 7/16/181 | | | 130,000 | | | | 129,701 | | | |
Series 2013-1A, Cl. C, 3.07%, 8/15/181 | | | 145,000 | | | | 144,182 | | | |
United Auto Credit Securitization Trust: | | | | | | | | | | |
Series 2012-1, Cl. A2, 1.10%, 3/16/151 | | | 39,643 | | | | 39,641 | | | |
Series 2012-1, Cl. B, 1.87%, 9/15/151 | | | 265,000 | | | | 264,983 | | | |
Series 2012-1, Cl. C, 2.52%, 3/15/161 | | | 190,000 | | | | 189,949 | | | |
Series 2012-1, Cl. D, 3.12%, 3/15/181 | | | 135,000 | | | | 134,963 | | | |
Series 2013-1, Cl. B, 1.74%, 4/15/161 | | | 230,000 | | | | 229,768 | | | |
Series 2013-1, Cl. C, 2.22%, 12/15/171 | | | 145,000 | | | | 144,795 | | | |
Series 2013-1, Cl. D, 2.90%, 12/15/171 | | | 30,000 | | | | 29,941 | | | |
| | | | | | | | 22,753,531 | | | |
Equipment—0.1% | | | | | | | | | | |
FRS I LLC, Series 2013-1A, Cl. A1, 1.80%, 4/15/431 | | | 102,971 | | | | 102,236 | | | |
Total Asset-Backed Securities (Cost $22,709,473) | | | | | | | 22,855,767 | | | |
| | | | | | | | | | |
Mortgage-Backed Obligations—44.1% | | | | | | | |
Government Agency—31.0% | | | | | | | | | | |
FHLMC/FNMA/FHLB/Sponsored—30.8% | | | |
Federal Home Loan Mortgage Corp. Gold Pool: | | | |
5.00%, 12/1/34 | | | 7,979 | | | | 8,654 | | | |
5.50%, 9/1/39 | | | 737,421 | | | | 813,988 | | | |
6.00%, 5/1/18-10/1/29 | | | 1,250,666 | | | | 1,380,581 | | | |
6.50%, 4/1/18-4/1/34 | | | 326,828 | | | | 363,164 | | | |
7.00%, 8/1/16-10/1/37 | | | 359,007 | | | | 409,710 | | | |
8.00%, 4/1/16 | | | 58,985 | | | | 61,376 | | | |
9.00%, 8/1/22-5/1/25 | | | 34,804 | | | | 38,695 | | | |
Federal Home Loan Mortgage Corp. Non Gold Pool, 10.50%, 10/1/20 | | | 1,935 | | | | 2,217 | | | |
Federal Home Loan Mortgage Corp., Interest-Only Stripped Mtg.-Backed Security: | | | | | | | | | | |
Series 205, Cl. IO, 13.811%, 9/1/294 | | | 11,853 | | | | 2,356 | | | |
Series 206, Cl. IO, 0.00%, 12/1/294,5 | | | 168,644 | | | | 46,394 | | | |
Series 243, Cl. 6, 0.00%, 12/15/324,5 | | | 149,038 | | | | 22,948 | | | |
Federal Home Loan Mortgage Corp., Principal-Only Stripped Mtg.-Backed Security, Series 176, Cl. PO, 3.906%, 6/1/266 | | | 64,394 | | | | 60,876 | | | |
Federal Home Loan Mortgage Corp., Real Estate Mtg. Investment Conduit Multiclass Pass-Through Certificates: | | | | | | | | | | |
Series 151, Cl. F, 9.00%, 5/15/21 | | | 8,332 | | | | 9,272 | | | |
Series 1674, Cl. Z, 6.75%, 2/15/24 | | | 27,171 | | | | 30,545 | | | |
Series 2034, Cl. Z, 6.50%, 2/15/28 | | | 3,407 | | | | 3,826 | | | |
Series 2042, Cl. N, 6.50%, 3/15/28 | | | 8,283 | | | | 9,346 | | | |
Series 2043, Cl. ZP, 6.50%, 4/15/28 | | | 404,895 | | | | 459,224 | | | |
Series 2046, Cl. G, 6.50%, 4/15/28 | | | 25,553 | | | | 28,708 | | | |
Series 2053, Cl. Z, 6.50%, 4/15/28 | | | 4,163 | | | | 4,677 | | | |
Series 2066, Cl. Z, 6.50%, 6/15/28 | | | 454,576 | | | | 506,921 | | | |
Series 2195, Cl. LH, 6.50%, 10/15/29 | | | 335,582 | | | | 377,736 | | | |
Series 2220, Cl. PD, 8.00%, 3/15/30 | | | 2,012 | | | | 2,346 | | | |
Series 2326, Cl. ZP, 6.50%, 6/15/31 | | | 90,202 | | | | 102,032 | | | |
6 OPPENHEIMER CORE BOND FUND/VA
| | | | | | |
| | | Principal
Amount | | Value | | |
FHLMC/FNMA/FHLB/Sponsored (Continued) | | |
Federal Home Loan Mortgage Corp., Real Estate Mtg. Investment Conduit Multiclass Pass-Through Certificates: Continued | | | | | | |
Series 2461, Cl. PZ, 6.50%, 6/1/32 | | $ 414,708 | | $ 468,243 | | |
Series 2470, Cl. LF, 1.167%, 2/15/323 | | 3,239 | | 3,306 | | |
Series 2500, Cl. FD, 0.667%, 3/15/323 | | 96,401 | | 96,986 | | |
Series 2526, Cl. FE, 0.567%, 6/15/293 | | 123,434 | | 123,685 | | |
Series 2538, Cl. F, 0.767%, 12/15/323 | | 362,111 | | 364,765 | | |
Series 2551, Cl. FD, 0.567%, 1/15/333 | | 78,051 | | 78,226 | | |
Series 2707, Cl. QE, 4.50%, 11/15/18 | | 37,654 | | 40,048 | | |
Series 2936, Cl. PE, 5.00%, 2/15/35 | | 69,000 | | 74,308 | | |
Series 3025, Cl. SJ, 24.139%, 8/15/353 | | 35,432 | | 54,418 | | |
Series 3030, Cl. FL, 0.567%, 9/15/353 | | 5,286 | | 5,285 | | |
Series 3815, Cl. BD, 3.00%, 10/15/20 | | 13,697 | | 14,166 | | |
Series 3822, Cl. JA, 5.00%, 6/1/40 | | 19,173 | | 20,187 | | |
Series 3840, Cl. CA, 2.00%, 9/15/18 | | 10,002 | | 10,209 | | |
Series 3848, Cl. WL, 4.00%, 4/1/40 | | 37,201 | | 38,530 | | |
Series 4221, Cl. HJ, 1.50%, 7/15/23 | | 104,995 | | 104,499 | | |
Federal Home Loan Mortgage Corp., Real Estate Mtg. Investment Conduit Multiclass Pass-Through Certificates, Interest-Only Stripped Mtg.-Backed Security: | | | | | | |
Series 2074, Cl. S, 52.263%, 7/17/284 | | 2,557 | | 472 | | |
Series 2079, Cl. S, 44.56%, 7/17/284 | | 4,790 | | 900 | | |
Series 2130, Cl. SC, 53.333%, 3/15/294 | | 188,825 | | 35,063 | | |
Series 2526, Cl. SE, 32.499%, 6/15/294 | | 5,574 | | 1,047 | | |
Series 2796, Cl. SD, 53.999%, 7/15/264 | | 282,728 | | 47,815 | | |
Series 2802, Cl. AS, 0% , 4/15/334,7 | | 21,672 | | 291 | | |
Series 2920, Cl. S, 55.589%, 1/15/354 | | 1,032,400 | | 165,351 | | |
Series 2922, Cl. SE, 7.457%, 2/15/354 | | 125,661 | | 20,286 | | |
Series 3004, Cl. SB, 0.63%, 7/15/354 | | 54,968 | | 7,489 | | |
Series 3201, Cl. SG, 5.859%, 8/15/364 | | 303,872 | | 53,385 | | |
Series 3397, Cl. GS, 14.135%, 12/15/374 | | 26,584 | | 4,752 | | |
Series 3424, Cl. EI, 2.161%, 4/15/384 | | 43,877 | | 5,043 | | |
Series 3450, Cl. BI, 12.904%, 5/15/384 | | 674,321 | | 101,711 | | |
Series 3606, Cl. SN, 4.872%, 12/15/394 | | 182,180 | | 30,415 | | |
Federal National Mortgage Assn.: | | | | | | |
2.50%, 1/1/298 | | 2,615,000 | | 2,588,850 | | |
3.00%, 1/1/298 | | 1,565,000 | | 1,597,584 | | |
3.50%, 1/1/29-1/1/448 | | 8,810,000 | | 8,798,919 | | |
4.00%, 1/1/29-1/1/448 | | 10,570,000 | | 10,907,531 | | |
4.50%, 1/1/29-1/1/448 | | 5,915,000 | | 6,269,830 | | |
5.00%, 1/1/448 | | 795,000 | | 863,507 | | |
6.00%, 1/1/448 | | 160,000 | | 177,488 | | |
Federal National Mortgage Assn. Pool: | | | | | | |
2.563%, 10/1/363 | | 124,181 | | 131,789 | | |
3.50%, 2/1/22 | | 99,738 | | 104,881 | | |
5.00%, 2/1/22-7/1/22 | | 5,762 | | 6,186 | | |
5.50%, 2/1/35-5/1/36 | | 317,845 | | 350,280 | | |
6.50%, 5/1/17-1/1/34 | | 466,720 | | 495,828 | | |
7.00%, 11/1/17-7/1/35 | | 213,483 | | 232,307 | | |
7.50%, 1/1/33 | | 7,457 | | 8,661 | | |
8.50%, 7/1/32 | | 15,353 | | 17,825 | | |
Federal National Mortgage Assn., Interest-Only Stripped Mtg.-Backed Security: | | | | | | |
Series 221, Cl. 2, 42.883%, 5/1/234 | | 4,411 | | 1,013 | | |
Series 222, Cl. 2, 24.266%, 6/1/234 | | 463,960 | | 100,316 | | |
Series 252, Cl. 2, 41.187%, 11/1/234 | | 438,927 | | 103,104 | | |
Series 294, Cl. 2, 15.238%, 2/1/284 | | 48,263 | | 11,599 | | |
Series 301, Cl. 2, 0.00%, 4/1/294,5 | | 4,383 | | 1,028 | | |
Series 303, Cl. IO, 9.30%, 11/1/294 | | 82,732 | | 22,150 | | |
Series 320, Cl. 2, 9.935%, 4/1/324 | | 322,537 | | 81,167 | | |
Series 321, Cl. 2, 0.00%, 4/1/324,5 | | 918,009 | | 171,944 | | |
Series 324, Cl. 2, 0.00%, 7/1/324,5 | | 9,283 | | 2,263 | | |
Series 331, Cl. 5, 0.00%, 2/1/334,5 | | 13,495 | | 2,703 | | |
Series 331, Cl. 9, 0.00%, 2/1/334,5 | | 272,674 | | 60,447 | | |
Series 334, Cl. 12, 0.00%, 3/1/334,5 | | 22,932 | | 4,444 | | |
Series 334, Cl. 17, 6.551%, 2/1/334 | | 189,738 | | 43,549 | | |
Series 339, Cl. 12, 0.00%, 6/25/334,5 | | 331,323 | | 66,517 | | |
Series 339, Cl. 7, 0.00%, 8/1/334,5 | | 691,260 | | 134,721 | | |
Series 343, Cl. 13, 0.00%, 9/1/334,5 | | 311,274 | | 59,037 | | |
| | | | | | |
| | | Principal
Amount | | Value | | |
FHLMC/FNMA/FHLB/Sponsored (Continued) | | |
Federal National Mortgage Assn., Interest-Only Stripped Mtg.-Backed Security: Continued | | | | | | |
Series 343, Cl. 18, 0.00%, 5/1/344,5 | | $ 83,098 | | $ 17,672 | | |
Series 345, Cl. 9, 0.00%, 1/1/344,5 | | 215,725 | | 43,383 | | |
Series 351, Cl. 10, 0.00%, 4/1/344,5 | | 111,526 | | 20,919 | | |
Series 351, Cl. 8, 0.00%, 4/1/344,5 | | 182,007 | | 34,368 | | |
Series 356, Cl. 10, 0.00%, 6/1/354,5 | | 134,448 | | 25,391 | | |
Series 356, Cl. 12, 0.00%, 2/1/354,5 | | 66,001 | | 12,419 | | |
Series 362, Cl. 13, 0.00%, 8/1/354,5 | | 252,195 | | 47,874 | | |
Series 364, Cl. 15, 0.00%, 9/1/354,5 | | 13,189 | | 2,372 | | |
Series 364, Cl. 16, 0.00%, 9/1/354,5 | | 266,835 | | 50,225 | | |
Series 365, Cl. 16, 0.00%, 3/1/364,5 | | 415,449 | | 65,816 | | |
Federal National Mortgage Assn., Real Estate Mtg. Investment Conduit Multiclass Pass-Through Certificates: | | | | | | |
Series 1989-17, Cl. E, 10.40%, 4/25/19 | | 47 | | 47 | | |
Series 1993-87, Cl. Z, 6.50%, 6/25/23 | | 324,505 | | 365,413 | | |
Series 1998-58, Cl. PC, 6.50%, 10/25/28 | | 237,954 | | 268,355 | | |
Series 1998-61, Cl. PL, 6.00%, 11/25/28 | | 116,975 | | 130,080 | | |
Series 1999-54, Cl. LH, 6.50%, 11/25/29 | | 200,955 | | 223,842 | | |
Series 2001-44, Cl. QC, 6.00%, 9/25/16 | | 7,908 | | 8,302 | | |
Series 2001-51, Cl. OD, 6.50%, 10/25/31 | | 15,989 | | 17,768 | | |
Series 2001-74, Cl. QE, 6.00%, 12/25/31 | | 302,144 | | 336,658 | | |
Series 2002-12, Cl. PG, 6.00%, 3/25/17 | | 4,227 | | 4,467 | | |
Series 2003-28, Cl. KG, 5.50%, 4/25/23 | | 2,543,122 | | 2,795,588 | | |
Series 2003-84, Cl. GE, 4.50%, 9/25/18 | | 19,807 | | 21,009 | | |
Series 2004-101, Cl. BG, 5.00%, 1/25/20 | | 532,062 | | 558,458 | | |
Series 2004-25, Cl. PC, 5.50%, 1/25/34 | | 14,000 | | 15,018 | | |
Series 2005-73, Cl. DF, 0.415%, 8/25/353 | | 18,717 | | 18,716 | | |
Series 2006-11, Cl. PS, 23.963%, 3/25/363 | | 168,184 | | 258,774 | | |
Series 2006-46, Cl. SW, 23.596%, 6/25/363 | | 133,003 | | 205,144 | | |
Series 2006-50, Cl. KS, 23.597%, 6/25/363 | | 188,628 | | 292,063 | | |
Series 2007-109, Cl. NF, 0.715%, 12/25/373 | | 95,299 | | 96,195 | | |
Series 2008-14, Cl. BA, 4.25%, 3/25/23 | | 64,826 | | 68,542 | | |
Series 2009-36, Cl. FA, 1.105%, 6/25/373 | | 190,162 | | 192,022 | | |
Series 2009-70, Cl. NT, 4.00%, 8/25/19 | | 9,093 | | 9,557 | | |
Series 2009-70, Cl. TL, 4.00%, 8/25/19 | | 202,078 | | 212,384 | | |
Series 2010-43, Cl. KG, 3.00%, 1/25/21 | | 112,370 | | 116,964 | | |
Series 2011-38, Cl. AH, 2.75%, 5/25/20 | | 11,926 | | 12,327 | | |
Series 2011-82, Cl. AD, 4.00%, 8/25/26 | | 219,244 | | 231,209 | | |
Federal National Mortgage Assn., Real Estate Mtg. Investment Conduit Multiclass Pass-Through Certificates, Interest-Only Stripped Mtg.-Backed Security: | | | | | | |
Series 2001-61, Cl. SH, 28.365%, 11/18/314 | | 11,500 | | 2,060 | | |
Series 2001-63, Cl. SD, 29.617%, 12/18/314 | | 4,143 | | 729 | | |
Series 2001-65, Cl. S, 26.20%, 11/25/314 | | 288,545 | | 53,893 | | |
Series 2001-68, Cl. SC, 18.307%, 11/25/314 | | 2,608 | | 486 | | |
Series 2001-81, Cl. S, 25.372%, 1/25/324 | | 84,739 | | 16,573 | | |
Series 2002-28, Cl. SA, 35.214%, 4/25/324 | | 2,673 | | 491 | | |
Series 2002-38, Cl. SO, 47.412%, 4/25/324 | | 7,160 | | 1,479 | | |
Series 2002-39, Cl. SD, 39.676%, 3/18/324 | | 4,734 | | 966 | | |
Series 2002-47, Cl. NS, 31.622%, 4/25/324 | | 265,971 | | 50,341 | | |
Series 2002-48, Cl. S, 30.609%, 7/25/324 | | 4,259 | | 805 | | |
Series 2002-51, Cl. S, 31.837%, 8/25/324 | | 244,162 | | 46,205 | | |
Series 2002-52, Cl. SD, 36.544%, 9/25/324 | | 333,226 | | 63,251 | | |
Series 2002-52, Cl. SL, 33.406%, 9/25/324 | | 2,763 | | 523 | | |
Series 2002-53, Cl. SK, 33.717%, 4/25/324 | | 16,496 | | 3,178 | | |
Series 2002-56, Cl. SN, 32.339%, 7/25/324 | | 5,806 | | 1,099 | | |
Series 2002-60, Cl. SM, 27.599%, 8/25/324 | | 38,911 | | 7,680 | | |
Series 2002-7, Cl. SK, 24.653%, 1/25/324 | | 17,975 | | 3,840 | | |
Series 2002-77, Cl. BS, 24.102%, 12/18/324 | | 24,317 | | 4,916 | | |
Series 2002-77, Cl. IS, 44.232%, 12/18/324 | | 12,199 | | 2,526 | | |
Series 2002-77, Cl. SH, 34.311%, 12/18/324 | | 123,398 | | 23,568 | | |
Series 2002-84, Cl. SA, 32.039%, 12/25/324 | | 287,342 | | 52,320 | | |
Series 2002-9, Cl. MS, 26.079%, 3/25/324 | | 4,493 | | 788 | | |
Series 2002-90, Cl. SN, 28.674%, 8/25/324 | | 20,018 | | 3,949 | | |
Series 2002-90, Cl. SY, 34.259%, 9/25/324 | | 14,381 | | 2,835 | | |
Series 2003-26, Cl. DI, 9.623%, 4/25/334 | | 12,083 | | 2,896 | | |
Series 2003-33, Cl. SP, 26.803%, 5/25/334 | | 293,575 | | 64,122 | | |
Series 2003-4, Cl. S, 28.573%, 2/25/334 | | 194,700 | | 36,479 | | |
7 OPPENHEIMER CORE BOND FUND/VA
STATEMENTOF INVESTMENTS Continued
| | | | | | |
| | | Principal
Amount | | Value | | |
FHLMC/FNMA/FHLB/Sponsored (Continued) | | |
Federal National Mortgage Assn., Real Estate Mtg. Investment Conduit Multiclass Pass-Through Certificates, Interest-Only Stripped Mtg.-Backed Security: Continued | | | | | | |
Series 2004-54, Cl. DS, 41.663%, 11/25/304 | | $ 229,622 | | $ 45,291 | | |
Series 2005-12, Cl. SC, 11.374%, 3/25/354 | | 63,146 | | 13,843 | | |
Series 2005-14, Cl. SE, 37.158%, 3/25/354 | | 187,182 | | 28,685 | | |
Series 2005-40, Cl. SA, 49.931%, 5/25/354 | | 543,905 | | 102,485 | | |
Series 2005-40, Cl. SB, 55.966%, 5/25/354 | | 24,746 | | 5,219 | | |
Series 2005-52, Cl. JH, 4.222%, 5/25/354 | | 132,527 | | 24,091 | | |
Series 2005-93, Cl. SI, 11.09%, 10/25/354 | | 448,605 | | 73,995 | | |
Series 2008-55, Cl. SA, 16.576%, 7/25/384 | | 48,244 | | 6,772 | | |
Series 2009-8, Cl. BS, 0.00%, 2/25/244,5 | | 238,848 | | 20,838 | | |
Series 2012-40, Cl. PI, 2.618%, 4/25/414 | | 219,671 | | 42,266 | | |
Federal National Mortgage Assn., Real Estate Mtg. Investment Conduit Multiclass Pass-Through Certificates, Principal-Only Stripped Mtg.-Backed Security, Series 1993-184, Cl. M, 4.464%, 9/25/236 | | 145,358 | | 134,610 | | |
| | | | | 47,859,375 | | |
GNMA/Guaranteed—0.2% | | | | | | |
Government National Mortgage Assn. I Pool: | | | | | | |
7.00%, 12/15/23-3/15/26 | | 14,492 | | 16,197 | | |
8.50%, 8/15/17-12/15/17 | | 43,900 | | 46,513 | | |
Government National Mortgage Assn., Interest-Only Stripped Mtg.-Backed Security: | | | | | | |
Series 2002-15, Cl. SM, 62.49%, 2/16/324 | | 386,608 | | 70,676 | | |
Series 2007-17, Cl. AI, 14.368%, 4/16/374 | | 117,489 | | 19,529 | | |
Series 2011-52, Cl. HS, 8.534%, 4/16/414 | | 785,114 | | 134,419 | | |
Government National Mortgage Assn., Real Estate Mtg. Investment Conduit Multiclass Pass-Through Certificates: | | | | | | |
Series 1999-32, Cl. ZB, 8.00%, 9/1/29 | | 54,111 | | 64,696 | | |
Series 2000-7, Cl. Z, 8.00%, 1/16/30 | | 21,111 | | 24,746 | | |
| | | | | 376,776 | | |
Non-Agency—13.1% | | | | | | |
Commercial—9.7% | | | | | | |
Asset Securitization Corp., Interest-Only Stripped Mtg.-Backed Security, Series 1997-D4, Cl. PS1, 4.732%, 4/14/294 | | 1,817,593 | | 79,963 | | |
Banc of America Commercial Mortgage Trust: | | | | | | |
Series 2006-5, Cl. AM, 5.448%, 9/10/47 | | 425,000 | | 455,661 | | |
Series 2006-6, Cl. AM, 5.39%, 10/10/45 | | 645,000 | | 700,211 | | |
Bear Stearns Adjustable Rate Mortgage Trust, Series 2005-9, Cl. A1, 2.43%, 10/25/353 | | 67,327 | | 66,713 | | |
Capital Lease Funding Securitization LP, Interest-Only Commercial Mtg. Pass-Through Certificates, Series 1997-CTL1, Cl. IO, 0%, 6/22/242,4,5 | | 1,790,690 | | 82,693 | | |
CD Commercial Mortgage Trust: | | | | | | |
Series 2006-CD2, Cl. AM, 5.351%, 1/15/463 | | 395,000 | | 424,633 | | |
Series 2007-CD4, Cl. A2B, 5.205%, 12/11/49 | | 13,136 | | 13,140 | | |
Citigroup Commercial Mortgage Trust: | | | | | | |
Series 2008-C7, Cl. AM, 6.132%, 12/1/493 | | 410,000 | | 455,529 | | |
Series 20113-GCJ11, 4.607%, 4/10/461 | | 160,000 | | 138,461 | | |
COMM Mortgage Trust: | | | | | | |
Series 2006-C7, Cl. AM, 5.777%, 6/10/463 | | 695,000 | | 748,185 | | |
Series 2012-CR4, Cl. D, 4.577%, 10/15/451,3 | | 50,000 | | 44,611 | | |
Series 2012-CR5, Cl. E, 4.335%, 12/10/451,3 | | 75,000 | | 65,555 | | |
Series 2013-CR7, Cl. D, 4.36%, 3/10/461,3 | | 175,000 | | 146,248 | | |
COMM Mortgage Trust, Interest-Only Stripped Mtg.-Backed Security: | | | | | | |
Series 2010-C1, Cl. XPA, 0%, 7/10/461,4,5 | | 3,943,195 | | 157,150 | | |
Series 2012-CR5, Cl. XA, 0.954%, 12/10/454 | | 2,797,378 | | 294,460 | | |
Countrywide Alternative Loan Trust, Series 2006-J2, Cl. A7, 6%, 4/25/36 | | 9,620 | | 8,711 | | |
Countrywide Home Loans: | | | | | | |
Series 2005-17, Cl. 1A8, 5.50%, 9/25/35 | | 41,451 | | 41,341 | | |
Series 2007-J3, Cl. A9, 6.00%, 7/1/37 | | 166,405 | | 145,058 | | |
Credit Suisse Commercial Mortgage Trust: | | | | | | |
Series 2006-6, Cl. 1A4, 6.00%, 7/25/36 | | 300,923 | | 233,992 | | |
Series 2006-C1, Cl. AJ, 5.465%, 2/15/393 | | 275,000 | | 292,508 | | |
| | | | | | |
| | | Principal
Amount | | Value | | |
Commercial (Continued) | | | | | | |
Credit Suisse First Boston Commercial Trust, Series 2005-C6, Cl. AJ, 5.23%, 12/15/403 | | $ 410,000 | | $ 433,426 | | |
DBUBS Mortgage Trust, Series 2011-LC1A, Cl. E, 5.557%, 11/10/461,3 | | 75,000 | | 76,763 | | |
First Horizon Alternative Mortgage Securities Trust: | | | | | | |
Series 2004-FA2, Cl. 3A1, 6.00%, 1/25/35 | | 291,179 | | 290,185 | | |
Series 2005-FA8, Cl. 1A6, 0.815%, 11/25/353 | | 294,488 | | 223,566 | | |
Series 2005-FA9, Cl. A4A, 5.50%, 12/25/35 | | 17,630 | | 15,591 | | |
Series 2007-FA2, Cl. 1A1, 5.50%, 4/1/37 | | 232,785 | | 173,487 | | |
Series 2007-FA4, Cl. 1A6, 6.25%, 8/25/373 | | 344,642 | | 288,839 | | |
FREMF Mortgage Trust: | | | | | | |
Series 2013-K25, Cl. C, 3.618%, 11/25/451,3 | | 90,000 | | 75,312 | | |
Series 2013-K26, Cl. C, 3.60%, 12/25/451,3 | | 60,000 | | 50,203 | | |
Series 2013-K27, Cl. C, 3.497%, 1/25/461,3 | | 95,000 | | 78,647 | | |
Series 2013-K28, Cl. C, 3.494%, 6/25/461,3 | | 95,000 | | 77,446 | | |
Series 2013-K712, Cl. C, 3.367%, 5/25/451,3 | | 160,000 | | 144,360 | | |
GCCFC Commercial Mortgage Trust, Series 2007-GG11, Cl. AM, 5.867%, 12/1/493 | | 475,000 | | 521,690 | | |
GE Capital Commercial Mortgage Corp., Series 2005-C4, Cl. AJ, 5.311%, 11/10/453 | | 380,000 | | 370,321 | | |
GS Mortgage Securities Trust: | | | | | | |
Series 2006-GG6, Cl. AM, 5.622%, 4/10/383 | | 165,000 | | 178,717 | | |
Series 2011-GC3, Cl. A1, 2.331%, 3/10/441 | | 142,341 | | 143,944 | | |
GSR Mortgage Loan Trust, Series 2005-AR4, Cl. 6A1, 5.221%, 7/25/353 | | 205,188 | | 203,418 | | |
JP Morgan Chase Commercial Mortgage Securities Trust: | | | | | | |
Series 2006-CB16, Cl. AJ, 5.623%, 5/12/45 | | 415,000 | | 406,399 | | |
Series 2006-LDP8, Cl. AJ, 5.48%, 5/15/453 | | 60,000 | | 62,643 | | |
Series 2011-C3, Cl. A1, 1.875%, 2/15/461 | | 147,620 | | 148,273 | | |
JP Morgan Mortgage Trust, Series 2007-S3, Cl. 1A90, 7%, 8/25/37 | | 463,794 | | 424,888 | | |
JPMorgan Resecuritization Trust, Series 2009-5, Cl. 1A2, 2.612%, 7/26/361,3 | | 409,869 | | 318,034 | | |
LB Commercial Conduit Mortgage Trust, Interest-Only Stripped Mtg.-Backed Security, Series 1998-C1, Cl. IO, 0%, 2/18/304,5 | | 798,209 | | 22,080 | | |
Lehman Structured Securities Corp., Series 2002-GE1, Cl. A, 2.514%, 7/26/242,3 | | 84,367 | | 73,738 | | |
Merrill Lynch Mortgage Trust, Series 2006-C2, Cl. AM, 5.782%, 8/12/433 | | 690,000 | | 758,231 | | |
Morgan Stanley Bank of America Merrill Lynch Trust: | | | | | | |
Series 2012-C6, Cl. E, 4.664%, 11/15/451,3 | | 145,000 | | 130,213 | | |
Series 2013-C7, Cl. D, 4.304%, 2/15/461,3 | | 175,000 | | 151,561 | | |
Series 2013-C8, Cl. D, 4.172%, 12/15/481,3 | | 130,000 | | 110,543 | | |
Morgan Stanley Capital I Trust: | | | | | | |
Series 2007-IQ13, Cl. AM, 5.406%, 3/15/44 | | 415,000 | | 451,949 | | |
Series 2007-IQ15, Cl. AM, 5.91%, 6/1/493 | | 490,000 | | 528,686 | | |
Morgan Stanley Reremic Trust, Series 2012-R3, Cl. 1B, 2.065%, 11/26/362,3 | | 474,712 | | 262,879 | | |
Salomon Brothers Mortgage Securities VII, Inc., Interest-Only Stripped Mtg.-Backed Security, Series 1999-C1, Cl. X, 6.791%, 5/18/324 | | 5,928,938 | | 2,330 | | |
Structured Adjustable Rate Mortgage Loan Trust: | | | | | | |
Series 2006-4, Cl. 6A, 5.09%, 5/25/363 | | 264,429 | | 223,139 | | |
Series 2007-6, Cl. 3A1, 4.701%, 7/25/373 | | 450,210 | | 354,973 | | |
UBS-Barclays Commercial Mortgage Trust, Series 2012-C2, Cl. E, 4.891%, 5/1/631,3 | | 65,000 | | 57,557 | | |
WaMu Mortgage Pass-Through Certificates Trust, Series 2005-AR14, Cl. 1A4, 2.381%, 12/25/353 | | 269,827 | | 249,217 | | |
Wells Fargo Mortgage-Backed Securities Trust: | | | | | | |
Series 2005-AR15, Cl. 1A6, 2.607%, 9/25/353 | | 91,427 | | 85,867 | | |
Series 2007-16, Cl. 1A1, 6.00%, 12/28/37 | | 285,278 | | 298,625 | | |
Series 2007-AR3, Cl. A4, 5.646%, 4/25/373 | | 104,115 | | 99,692 | | |
Series 2007-AR8, Cl. A1, 5.917%, 11/25/373 | | 282,499 | | 254,294 | | |
WF-RBS Commercial Mortgage Trust: | | | | | | |
Series 2012-C10, Cl. D, 4.46%, 12/15/451,3 | | 75,000 | | 65,008 | | |
Series 2012-C7, Cl. E, 4.848%, 6/15/451,3 | | 120,000 | | 109,296 | | |
Series 2012-C8, Cl. E, 4.878%, 8/15/451,3 | | 145,000 | | 133,189 | | |
8 OPPENHEIMER CORE BOND FUND/VA
| | | | | | |
| | | Principal
Amount | | Value | | |
Commercial (Continued) | | |
WF-RBS Commercial Mortgage Trust: Continued | | | | | | |
Series 2013-C11, Cl. D, 4.184%, 3/15/451,3 | | $ 74,000 | | $ 63,161 | | |
| | | | | 13,787,203 | | |
Multi-Family—0.6% | | | | | | |
Citigroup Mortgage Loan Trust, Inc., Series 2006-AR3, Cl. 1A2A, 5.432%, 6/25/363 | | 276,168 | | 253,874 | | |
Countrywide Alternative Loan Trust: | | | | | | |
Series 2005-86CB, Cl. A8, 5.50%, 2/25/36 | | 78,296 | | 69,564 | | |
Series 2005-J14, Cl. A7, 5.50%, 12/25/35 | | 73,487 | | 63,646 | | |
Series 2006-24CB, Cl. A12, 5.75%, 6/25/36 | | 98,960 | | 83,882 | | |
JP Morgan Mortgage Trust, Series 2007-A3, Cl. 3A2M, 4.713%, 5/1/373 | | 104,710 | | 101,215 | | |
Wells Fargo Mortgage-Backed Securities Trust, Series 2006-AR2, Cl. 2A3, 2.628%, 3/25/363 | | 188,967 | | 187,152 | | |
| | | | | 759,333 | | |
Other—0.0% | | | | | | |
Salomon Brothers Mortgage Securities VI, Inc., Interest-Only Stripped Mtg.-Backed Security, Series 1987-3, Cl. B, 23.922%, 10/23/174 | | 9 | | — | | |
Salomon Brothers Mortgage Securities VI, Inc., Principal-Only Stripped Mtg.-Backed Security, Series 1987-3, Cl. A, 30.745%, 10/23/176 | | 14 | | 14 | | |
| | | | | 14 | | |
Residential—2.8% | | | | | | |
Banc of America Commercial Mortgage Trust, Series 2007-4, Cl. AM, 5.813%, 2/1/513 | | 470,000 | | 519,430 | | |
Banc of America Funding Trust: | | | | | | |
Series 2007-1, Cl. 1A3, 6.00%, 1/25/37 | | 267,802 | | 236,218 | | |
Series 2007-C, Cl. 1A4, 5.359%, 5/20/363 | | 111,043 | | 106,811 | | |
Banc of America Mortgage Securities Trust, Series 2007-1, Cl. 1A24, 6%, 3/25/37 | | 194,250 | | 180,865 | | |
Carrington Mortgage Loan Trust, Series 2006-FRE1, Cl. A2, 0.275%, 7/25/363 | | 225,086 | | 219,353 | | |
CD Commercial Mortgage Trust, Series 2007-CD4, Cl. AMFX, 5.366%, 12/11/493 | | 100,000 | | 103,618 | | |
Countrywide Asset-Backed Certificates: | | | | | | |
Series 2005-16, Cl. 2AF2, 5.021%, 5/25/363 | | 216,302 | | 224,198 | | |
Series 2006-25, Cl. 2A2, 0.285%, 6/25/473 | | 247 | | 247 | | |
Countrywide Home Loans: | | | | | | |
Series 2005-26, Cl. 1A8, 5.50%, 11/1/35 | | 207,386 | | 194,872 | | |
Series 2005-29, Cl. A1, 5.75%, 12/25/35 | | 230,796 | | 210,367 | | |
Series 2005-30, Cl. A5, 5.50%, 1/25/36 | | 155,675 | | 151,667 | | |
Series 2005-J4, Cl. A7, 5.50%, 11/1/35 | | 27,187 | | 27,833 | | |
Series 2006-17, Cl. A2, 6.00%, 12/25/36 | | 350,708 | | 312,142 | | |
GSR Mortgage Loan Trust, Series 2006-5F, Cl. 2A1, 6%, 6/25/36 | | 150,167 | | 146,700 | | |
MASTR Asset Backed Securities Trust, Series 2006-WMC3, Cl. A3, 0.265%, 8/25/363 | | 57,736 | | 29,650 | | |
MLCC Mortgage Investors, Inc., Series 2006-3, Cl. 2A1, 2.333%, 10/25/363 | | 34,821 | | 33,338 | | |
NC Finance Trust, Series 1999-I, Cl. D, 3.405%, 1/25/292,9 | | 3,370,016 | | 202,201 | | |
RALI Trust: | | | | | | |
Series 2003-QS1, Cl. A2, 5.75%, 1/1/33 | | 85,893 | | 87,674 | | |
Series 2006-QS13, Cl. 1A8, 6.00%, 9/1/36 | | 1,427 | | 1,085 | | |
Series 2007-QS6, Cl. A28, 5.75%, 4/25/37 | | 17,446 | | 13,758 | | |
Residential Asset Securitization Trust, Series 2005-A15, Cl. 1A4, 5.75%, 2/1/36 | | 109,030 | | 98,783 | | |
WaMu Mortgage Pass-Through Certificates Trust, Series 2006-AR18, Cl. 3A1, 4.202%, 1/1/373 | | 170,301 | | 152,870 | | |
Wells Fargo Alternative Loan Trust, Series 2007-PA5, Cl. 1A1, 6.25%, 11/25/37 | | 331,038 | | 300,271 | | |
Wells Fargo Mortgage-Backed Securities Trust: | | | | | | |
Series 2005-9, Cl. 2A6, 5.25%, 10/25/35 | | 321,435 | | 331,556 | | |
Series 2006-AR14, Cl. 1A2, 5.584%, 10/1/363 | | 249,480 | | 239,218 | | |
| | | | 4,124,725 | | |
Total Mortgage-Backed Obligations
(Cost $70,681,534) | | | | 66,907,426 | | |
| | | | | | |
| | | Principal Amount | | Value | | |
U.S. Government Obligations—2.2% | | |
Federal Home Loan Mortgage Corp. Nts.: | | | | | | |
0.875%, 10/14/16-3/7/18 | | $ 1,250,000 | | $ 1,231,462 | | |
1.375%, 5/1/20 | | 694,000 | | 651,091 | | |
2.375%, 1/13/2210 | | 894,000 | | 854,909 | | |
Federal National Mortgage Assn. Nts.: | | | | | | |
1.625%, 11/27/18 | | 347,000 | | 344,347 | | |
1.875%, 9/18/18 | | 305,000 | | 307,215 | | |
Total U.S. Government Obligations
(Cost $3,474,139) | | | | 3,389,024 | | |
| | | | | | | |
Corporate Bonds and Notes—43.3% | | |
Consumer Discretionary—5.8% | | | | | | |
Auto Components—0.5% | | | | | | |
Dana Holding Corp., 6.75% Sr. Unsec. Nts., 2/15/21 | | 395,000 | | 426,600 | | |
TRW Automotive, Inc., 4.50% Sr. Unsec. Nts., 3/1/211 | | 245,000 | | 248,675 | | |
| | | | | 675,275 | | |
Automobiles—1.4% | | | | | | |
Daimler Finance North America LLC: | | | | | | |
1.30% Sr. Unsec. Nts., 7/31/151 | | 406,000 | | 408,541 | | |
8.50% Sr. Unsec. Unsub. Nts., 1/18/31 | | 237,000 | | 344,164 | | |
Ford Motor Credit Co. LLC, 5.875% Sr. Unsec. Unsub. Nts., 8/2/21 | | 936,000 | | 1,061,446 | | |
General Motors Co., 6.25% Sr. Unsec. Nts., 10/2/431 | | 363,000 | | 378,881 | | |
| | | | | 2,193,032 | | |
Hotels, Restaurants & Leisure—0.6% | | | | | | |
Brinker International, Inc., 2.60% Sr. Unsec. Nts., 5/15/18 | | 134,000 | | 131,967 | | |
Carnival Corp., 1.20% Sr. Unsec. Nts., 2/5/16 | | 386,000 | | 385,109 | | |
Starwood Hotels & Resorts Worldwide, Inc.,: 7.15% Sr. Unsec. Unsub. Nts., 12/1/19 | | 261,000 | | 311,881 | | |
7.375% Sr. Unsec. Unsub. Nts., 11/15/15 | | 148,000 | | 164,208 | | |
| | | | | 993,165 | | |
Household Durables—0.6% | | | | | | |
Jarden Corp., 6.125% Sr. Unsec. Nts., 11/15/22 | | 446,000 | | 479,450 | | |
Toll Brothers Finance Corp., 4% Sr. Unsec. Nts., 12/31/18 | | 385,000 | | 392,700 | | |
| | | | | 872,150 | | |
Media—1.3% | | | | | | |
Comcast Cable Communications Holdings, Inc., 9.455% Sr. Unsec. Nts., 11/15/22 | | 292,000 | | 404,560 | | |
Comcast Corp., 4.65% Sr. Unsec. Unsub. Nts., 7/15/42 | | 258,000 | | 240,153 | | |
Historic TW, Inc.: | | | | | | |
8.05% Sr. Unsec. Nts., 1/15/16 | | 64,000 | | 72,444 | | |
9.15% Debs., 2/1/23 | | 61,000 | | 80,915 | | |
Interpublic Group of Cos., Inc. (The), 6.25% Sr. Unsec. Nts., 11/15/14 | | 297,000 | | 309,994 | | |
Lamar Media Corp., 5% Sr. Unsec. Sub. Nts., 5/1/23 | | 453,000 | | 432,615 | | |
News America, Inc., 6.15% Sr. Unsec. Nts., 2/15/41 | | 162,000 | | 180,592 | | |
Time Warner, Inc., 5.35% Sr. Unsec. Nts., 12/15/43 | | 109,000 | | 110,413 | | |
WPP Finance 2010, 5.625% Sr. Unsec. Nts., 11/15/43 | | 126,000 | | 124,760 | | |
| | | | 1,956,446 | | |
Multiline Retail—0.7% | | | | | | |
Dollar General Corp., 4.125% Sr. Unsec. Nts., 7/15/17 | | 469,000 | | 498,168 | | |
Macy’s Retail Holdings, Inc., 5.75% Sr. Unsec. Nts., 7/15/14 | | 650,000 | | 667,481 | | |
| | | | 1,165,649 | | |
9 OPPENHEIMER CORE BOND FUND/VA
STATEMENTOF INVESTMENTS Continued
| | | | | | |
| | | Principal Amount | | Value | | |
Specialty Retail—0.5% | | |
Home Depot, Inc. (The), 4.875% Sr. Unsec. Nts., 2/15/44 | | $ 142,000 | | $ 143,820 | | |
L Brands, Inc., 8.50% Sr. Unsec. Nts., 6/15/19 | | 112,000 | | 134,960 | | |
Rent-A-Center, Inc., 4.75% Sr. Unsec. Nts., 5/1/21 | | 420,000 | | 396,375 | | |
| | | | 675,155 | | |
Textiles, Apparel & Luxury Goods—0.2% | | |
PVH Corp., 4.50% Sr. Unsec. Unsub. Nts., 12/15/22 | | 405,000 | | 385,762 | | |
Consumer Staples—2.4% | | |
Beverages—1.0% | | |
Anheuser-Busch InBev Worldwide, Inc., 8.20% Sr. Unsec. Unsub. Nts., 1/15/39 | | 324,000 | | 473,965 | | |
Constellation Brands, Inc., 3.75% Sr. Unsec. Nts., 5/1/21 | | 423,000 | | 398,677 | | |
Foster’s Finance Corp., 4.875% Sr. Unsec. Nts., 10/1/141 | | 433,000 | | 446,366 | | |
SABMiller Holdings, Inc., 4.95% Sr. Unsec. Unsub. Nts., 1/15/421 | | 206,000 | | 204,657 | | |
| | | | 1,523,665 | | |
Food & Staples Retailing—0.4% | | |
Delhaize Group SA, 5.70% Sr. Unsec. Nts., 10/1/40 | | 215,000 | | 203,886 | | |
Safeway, Inc., 5.625% Sr. Unsec. Nts., 8/15/14 | | 86,000 | | 88,217 | | |
Wal-Mart Stores, Inc., 4% Sr. Unsec. Unsub. Nts., 4/11/43 | | 318,000 | | 283,087 | | |
| | | | 575,190 | | |
Food Products—0.4% | | |
Bunge Ltd. Finance Corp.: | | | | | | |
5.10% Sr. Unsec. Unsub. Nts., 7/15/15 | | 332,000 | | 351,566 | | |
5.35% Sr. Unsec. Unsub. Nts., 4/15/14 | | 61,000 | | 61,780 | | |
8.50% Sr. Unsec. Nts., 6/15/19 | | 289,000 | | 355,246 | | |
| | | | 768,592 | | |
Personal Products—0.3% | | |
Avon Products, Inc., 5% Sr. Unsec. Nts., 3/15/23 | | 420,000 | | 408,466 | | |
Tobacco—0.3% | | |
Altria Group, Inc., 10.20% Sr. Unsec. Nts., 2/6/39 | | 227,000 | | 354,234 | | |
Lorillard Tobacco Co., 3.75% Sr. Unsec. Nts., 5/20/23 | | 227,000 | | 206,725 | | |
| | | | 560,959 | | |
Energy—5.9% | | |
Energy Equipment & Services—1.0% | | |
Ensco plc, 4.70% Sr. Unsec. Nts., 3/15/21 | | 471,000 | | 498,332 | | |
Noble Holding International Ltd., 7.375% Sr. Unsec. Nts., 3/15/14 | | 403,000 | | 408,316 | | |
Rowan Cos., Inc., 4.875% Sr. Unsec. Unsub. Nts., 6/1/22 | | 318,000 | | 322,788 | | |
Weatherford International Ltd., 5.95% Sr. Unsec. Nts., 4/15/42 | | 244,000 | | 244,529 | | |
| | | | 1,473,965 | | |
Oil, Gas & Consumable Fuels—4.9% | | |
Anadarko Petroleum Corp.: | | | | | | |
6.20% Sr. Unsec. Nts., 3/15/40 | | 163,000 | | 180,338 | | |
7.625% Sr. Unsec. Nts., 3/15/14 | | 316,000 | | 320,217 | | |
Canadian Oil Sands Ltd., 6% Sr. Unsec. Nts., 4/1/421 | | 182,000 | | 186,156 | | |
Cimarex Energy Co., 5.875% Sr. Unsec. Unsub. Nts., 5/1/22 | | 388,000 | | 413,220 | | |
CNOOC Finance 2013 Ltd., 4.25% Sr. Unsec. Unsub. Nts., 5/9/43 | | 147,000 | | 123,886 | | |
Continental Resources, Inc., 4.50% Sr. Unsec. Nts., 4/15/23 | | 428,000 | | 434,420 | | |
Copano Energy LLC/Copano Energy Finance Corp., 7.125% Sr. Unsec. Unsub. Nts., 4/1/21 | | 460,000 | | 530,133 | | |
| | | | | | |
| | | Principal Amount | | Value | | |
Oil, Gas & Consumable Fuels (Continued) | | |
DCP Midstream LLC, 5.375% Sr. Unsec. Nts., 10/15/151 | | $ 290,000 | | $ 308,588 | | |
DCP Midstream Operating LP: | | | | | | |
2.50% Sr. Unsec. Unsub. Nts., 12/1/17 | | 415,000 | | 413,420 | | |
3.875% Sr. Unsec. Nts., 3/15/23 | | 214,000 | | 197,132 | | |
Enbridge Energy Partners LP, 5.35% Sr. Unsec. Nts., 12/15/14 | | 326,000 | | 340,164 | | |
EnCana Holdings Finance Corp., 5.80% Sr. Unsec. Unsub. Nts., 5/1/14 | | 219,000 | | 222,800 | | |
Energy Transfer Partners LP, 8.50% Sr. Unsec. Nts., 4/15/14 | | 324,000 | | 330,840 | | |
Origin Energy Finance Ltd., 3.50% Sr. Unsec. Nts., 10/9/181 | | 354,000 | | 355,957 | | |
Range Resources Corp., 5.75% Sr. Unsec. Sub. Nts., 6/1/21 | | 398,000 | | 423,870 | | |
Ras Laffan Liquefied Natural Gas Co. Ltd. III, 5.50% Sr. Sec. Nts., 9/30/141 | | 420,000 | | 434,700 | | |
Rockies Express Pipeline LLC, 3.90% Sr. Unsec. Unsub. Nts., 4/15/151 | | 471,000 | | 472,177 | | |
Southwestern Energy Co., 4.10% Sr. Unsec. Nts., 3/15/22 | | 232,000 | | 230,055 | | |
Spectra Energy Partners LP: | | | | | | |
4.60% Sr. Unsec. Nts., 6/15/21 | | 238,000 | | 246,786 | | |
4.75% Sr. Unsec. Nts., 3/15/24 | | 194,000 | | 197,834 | | |
Talisman Energy, Inc., 3.75% Sr. Unsec. Nts., 2/1/21 | | 258,000 | | 250,168 | | |
Whiting Petroleum Corp., 5.75% Sr. Unsec. Nts., 3/15/21 | | 395,000 | | 409,812 | | |
Williams Cos., Inc. (The), 3.70% Sr. Unsec. Unsub. Nts., 1/15/23 | | 101,000 | | 88,183 | | |
Woodside Finance Ltd., 4.60% Sr. Unsec. Unsub. Nts., 5/10/211 | | 354,000 | | 370,816 | | |
| | | | 7,481,672 | | |
Financials—15.2% | | |
Capital Markets—2.4% | | |
Blackstone Holdings Finance Co. LLC, 6.625% Sr. Unsec. Nts., 8/15/191 | | 575,000 | | 671,856 | | |
Carlyle Holdings II Finance LLC, 5.625% Sr. Sec. Nts., 3/30/431 | | 209,000 | | 206,224 | | |
Deutsche Bank AG, 4.296% Jr. Sub. Nts., 5/24/283 | | 423,000 | | 383,086 | | |
Goldman Sachs Capital I, 6.345% Sub. Nts., 2/15/34 | | 477,000 | | 481,380 | | |
Goldman Sachs Group, Inc. (The), 2.90% Sr. Unsec. Nts., 7/19/18 | | 700,000 | | 712,778 | | |
Lazard Group LLC, 4.25% Sr. Unsec. Nts., 11/14/20 | | 250,000 | | 249,537 | | |
Morgan Stanley, 5% Sub. Nts., 11/24/25 | | 387,000 | | 388,312 | | |
Northern Trust Corp., 3.95% Sub. Nts., 10/30/25 | | 151,000 | | 147,210 | | |
Raymond James Financial, Inc., 5.625% Sr. Unsec. Unsub. Nts., 4/1/24 | | 417,000 | | 437,616 | | |
| | | | 3,677,999 | | |
Commercial Banks—4.4% | | |
Amsouth Bank NA, 5.20% Sub. Nts., 4/1/15 | | 419,000 | | 439,036 | | |
Barclays Bank plc, 5.14% Sub. Nts., 10/14/20 | | 399,000 | | 424,993 | | |
BPCE SA, 5.70% Sub. Nts., 10/22/231 | | 390,000 | | 402,589 | | |
Commerzbank AG, 8.125% Sub. Nts., 9/19/231 | | 388,000 | | 429,710 | | |
Credit Agricole SA, 6.637% Jr. Sub. Perpetual Bonds1,3,11 | | 627,000 | | 630,109 | | |
HSBC Finance Capital Trust IX, 5.911% Unsec. Sub. Nts., 11/30/353 | | 890,000 | | 921,150 | | |
Lloyds TSB Bank plc, 6.50% Unsec. Sub. Nts., 9/14/201 | | 576,000 | | 654,923 | | |
PNC Financial Services Group, Inc. (The), 4.85% Jr. Sub. Perpetual Bonds, Series R3,11 | | 441,000 | | 396,018 | | |
10 OPPENHEIMER CORE BOND FUND/VA
| | | | | | | | | | |
| | | Principal Amount | | | Value | | | |
Commercial Banks (Continued) | | | | | | | | | | |
Rabobank Capital Funding Trust III, 5.254% Jr. Sub. Perpetual Bonds1,3,11 | | $ | 667,000 | | | $ | 698,682 | | | |
Royal Bank of Scotland Group plc, 7.64% Jr. Sub. Perpetual Bonds, Series U3,11 | | | 400,000 | | | | 394,000 | | | |
Santander Holdings USA, Inc., 3.45% Sr. Unsec. Nts., 8/27/18 | | | 142,000 | | | | 145,728 | | | |
Santander UK plc, 5% Sub. Nts., 11/7/231 | | | 310,000 | | | | 311,260 | | | |
Societe Generale SA, 5.922% Jr. Sub. Perpetual Bonds1,3,11 | | | 370,000 | | | | 388,368 | | | |
SunTrust Banks, Inc., 3.60% Sr. Unsec. Nts., 4/15/16 | | | 174,000 | | | | 183,367 | | | |
Wells Fargo & Co., 7.98% Jr. Sub. Perpetual Bonds, Series K3,11 | | | 273,000 | | | | 305,760 | | | |
| | | | | | | | 6,725,693 | | | |
Consumer Finance—0.5% | | | | | | | | | | |
Ally Financial, Inc., 4.75% Sr. Unsec. Nts., 9/10/18 | | | 389,000 | | | | 408,450 | | | |
Discover Financial Services, 3.85% Sr. Unsec. Unsub. Nts., 11/21/22 | | | 481,000 | | | | 456,221 | | | |
| | | | | | | | 864,671 | | | |
Diversified Financial Services—2.4% | | | |
ABN AMRO Bank NV, 2.50% Sr. Unsec. Nts., 10/30/181 | | | 629,000 | | | | 627,956 | | | |
Citigroup, Inc., 6.675% Sub. Nts., 9/13/43 | | | 344,000 | | | | 395,902 | | | |
ING Bank NV, 5.80% Sub. Nts., 9/25/231 | | | 313,000 | | | | 327,380 | | | |
ING US, Inc., 5.65% Jr. Sub. Nts., 5/15/533 | | | 420,000 | | | | 408,555 | | | |
Leucadia National Corp., 5.50% Sr. Unsec. Nts., 10/18/23 | | | 548,000 | | | | 547,864 | | | |
Macquarie Bank Ltd., 6.625% Unsec. Sub. Nts., 4/7/211 | | | 672,000 | | | | 743,385 | | | |
Merrill Lynch & Co., Inc., 7.75% Jr. Sub. Nts., 5/14/38 | | | 354,000 | | | | 457,126 | | | |
| | | | 3,508,168 | | | |
Insurance—4.0% | | | | | | | | | | |
Aon plc, 4% Sr. Unsec. Nts., 11/27/23 | | | 618,000 | | | | 606,514 | | | |
Arch Capital Group US, Inc., 5.144% Sr. Unsec. Nts., 11/1/43 | | | 347,000 | | | | 347,045 | | | |
CNA Financial Corp.: | | | | | | | | | | |
5.75% Sr. Unsec. Unsub. Nts., 8/15/21 | | | 368,000 | | | | 412,439 | | | |
5.875% Sr. Unsec. Unsub. Nts., 8/15/20 | | | 260,000 | | | | 296,630 | | | |
Five Corners Funding Trust, 4.419% Unsec. Nts., 11/15/231 | | | 310,000 | | | | 305,682 | | | |
Genworth Holdings, Inc., 4.80% Sr. Unsec. Nts., 2/15/24 | | | 608,000 | | | | 600,770 | | | |
Gulf South Pipeline Co. LP, 5.05% Sr. Unsec. Nts., 2/1/151 | | | 425,000 | | | | 443,127 | | | |
Liberty Mutual Group, Inc., 4.25% Sr. Unsec. Nts., 6/15/231 | | | 332,000 | | | | 320,666 | | | |
Lincoln National Corp., 6.05% Jr. Unsec. Sub. Nts., 4/20/673 | | | 688,000 | | | | 686,280 | | | |
Marsh & McLennan Cos., Inc., 5.375% Sr. Unsec. Nts., 7/15/14 | | | 101,000 | | | | 103,446 | | | |
Prudential Financial, Inc., 5.20% Jr. Sub. Nts., 3/15/443 | | | 300,000 | | | | 291,750 | | | |
QBE Insurance Group Ltd., 2.40% Sr. Unsec. Nts., 5/1/181 | | | 511,000 | | | | 491,186 | | | |
Swiss Re Capital I LP, 6.854% Jr. Sub. Perpetual Bonds1,3 | | | 663,000 | | | | 704,106 | | | |
ZFS Finance USA Trust V, 6.50% Jr. Sub. Nts., 5/9/371,3 | | | 365,000 | | | | 390,550 | | | |
| | | | 6,000,191 | | | |
Real Estate Investment Trusts (REITs)—1.5% | | | | | | | |
American Tower Corp.: | | | | | | | | | | |
5.05% Sr. Unsec. Unsub. Nts., 9/1/20 | | | 149,000 | | | | 157,603 | | | |
7.00% Sr. Unsec. Nts., 10/15/17 | | | 413,000 | | | | 476,237 | | | |
Corrections Corp. of America, 4.125% Sr. Unsec. Nts., 4/1/20 | | | 165,000 | | | | 162,525 | | | |
Hospitality Properties Trust, 5.125% Sr. Unsec. Nts., 2/15/15 | | | 411,000 | | | | 420,467 | | | |
| | | | | | | | |
| | | Principal Amount | | Value | | | | |
Real Estate Investment Trusts (REITs) (Continued) | | | | |
Host Hotels & Resorts LP, 3.75% Sr. Unsec. Nts., 10/15/23 | | $ 297,000 | | $ 275,472 | | | | |
National Retail Properties, Inc., 6.25% Sr. Unsec. Nts., 6/15/14 | | 332,000 | | 339,790 | | | | |
ProLogis LP, 5.625% Sr. Unsec. Nts., 11/15/16 | | 339,000 | | 377,457 | | | | |
| | | | | 2,209,551 | | | | |
Health Care—1.9% | | | | | | | | |
Biotechnology—0.5% | | | | | | | | |
Celgene Corp., 3.25% Sr. Unsec. Nts., 8/15/22 | | 504,000 | | 477,323 | | | | |
Gilead Sciences, Inc., 5.65% Sr. Unsec. Unsub. Nts., 12/1/41 | | 232,000 | | 258,330 | | | | |
| | | | | 735,653 | | | | |
Health Care Equipment & Supplies—0.5% | | | | |
Boston Scientific Corp., 4.125% Sr. Unsec. Nts., 10/1/23 | | 394,000 | | 390,952 | | | | |
DENTSPLY International, Inc., 2.75% Sr. Unsec. Nts., 8/15/16 | | 352,000 | | 362,401 | | | | |
| | | | | 753,353 | | | | |
Health Care Providers & Services—0.1% | | | | |
Fresenius Medical Care US Finance II, Inc., 5.875% Sr. Unsec. Nts., 1/31/221 | | 150,000 | | 159,000 | | | | |
Life Sciences Tools & Services—0.3% | | | | | | | | |
Thermo Fisher Scientific, Inc.: | | | | | | | | |
4.15% Sr. Unsec. Nts., 2/1/24 | | 326,000 | | 323,020 | | | | |
5.30% Sr. Unsec. Nts., 2/1/44 | | 140,000 | | 141,598 | | | | |
| | | | | 464,618 | | | | |
Pharmaceuticals—0.5% | | | | | | | | |
Hospira, Inc., 5.20% Sr. Unsec. Nts., 8/12/20 | | 373,000 | | 387,089 | | | | |
Mallinckrodt International Finance SA, 3.50% Sr. Unsec. Unsub. Nts., 4/15/181 | | 187,000 | | 183,542 | | | | |
Zoetis, Inc., 1.875% Sr. Unsec. Nts., 2/1/18 | | 151,000 | | 149,838 | | | | |
| | | | | 720,469 | | | | |
Industrials—2.8% | | | | | | | | |
Aerospace & Defense—0.5% | | | | | | | | |
B/E Aerospace, Inc., 5.25% Sr. Unsec. Nts., 4/1/22 | | 382,000 | | 389,640 | | | | |
Huntington Ingalls Industries, Inc., 7.125% Sr. Unsec. Unsub. Nts., 3/15/21 | | 405,000 | | 446,512 | | | | |
| | | | | 836,152 | | | | |
Building Products—0.3% | | | | | | | | |
Owens Corning, 4.20% Sr. Unsec. Nts., 12/15/22 | | 422,000 | | 403,113 | | | | |
Commercial Services & Supplies—0.3% | | | | |
Clean Harbors, Inc., 5.25% Sr. Unsec. Unsub. Nts., 8/1/20 | | 395,000 | | 408,825 | | | | |
Industrial Conglomerates—0.3% | | | | | | | | |
General Electric Capital Corp., 5.25% Jr. Sub. Perpetual Bonds3,11 | | 440,000 | | 414,700 | | | | |
Machinery—0.3% | | | | | | | | |
Crane Co., 4.45% Sr. Unsec. Nts., 12/15/23 | | 193,000 | | 190,836 | | | | |
Ingersoll-Rand Global Holding Co. Ltd., 4.25% Sr. Unsec. Nts., 6/15/231 | | 340,000 | | 332,196 | | | | |
| | 523,032 | | | | |
Professional Services—0.3% | | | | | | | | |
Nielsen Finance LLC/Nielsen Finance Co., 4.50% Sr. Unsec. Nts., 10/1/20 | | 400,000 | | 391,000 | | | | |
Road & Rail—0.5% | | | | | | | | |
Kansas City Southern Railway Co., 4.30% Sr. Unsec. Nts., 5/15/431 | | 170,000 | | 148,391 | | | | |
Penske Truck Leasing Co. LP/PTL Finance Corp.: | | | | | | | | |
2.50% Sr. Unsec. Nts., 7/11/141 | | 442,000 | | 445,655 | | | | |
4.25% Sr. Unsec. Nts., 1/17/231 | | 230,000 | | 224,076 | | | | |
| | | | 818,122 | | | | |
11 OPPENHEIMER CORE BOND FUND/VA
STATEMENTOF INVESTMENTS Continued
| | | | | | |
| | | Principal
Amount | | Value | | |
Trading Companies & Distributors—0.3% | | | | |
International Lease Finance Corp., 5.875% Sr. Unsec. Unsub. Nts., 4/1/19 | | $ 376,000 | | $ 402,320 | | |
Information Technology—1.7% | | | | | | |
Computers & Peripherals—0.5% | | | | | | |
Hewlett-Packard Co.: | | | | | | |
2.65% Sr. Unsec. Unsub. Nts., 6/1/16 | | 367,000 | | 378,348 | | |
4.75% Sr. Unsec. Nts., 6/2/14 | | 154,000 | | 156,482 | | |
Seagate HDD Cayman, 3.75% Sr. Unsec. Nts., 11/15/181 | | 340,000 | | 344,675 | | |
| | | 879,505 | | |
Electronic Equipment, Instruments, & Components—0.8% | | | | |
Amphenol Corp., 4.75% Sr. Unsec. Nts., 11/15/14 | | 124,000 | | 128,156 | | |
Arrow Electronics, Inc., 5.125% Sr. Unsec. Unsub. Nts., 3/1/21 | | 527,000 | | 539,445 | | |
Avnet, Inc., 4.875% Sr. Unsec. Unsub. Nts., 12/1/22 | | 500,000 | | 502,265 | | |
| | | | | 1,169,866 | | |
IT Services—0.1% | | | | | | |
Fidelity National Information Services, Inc., 3.50% Sr. Unsec. Nts., 4/15/23 | | 207,000 | | 188,749 | | |
Office Electronics—0.3% | | | | | | |
Xerox Corp., 4.25% Sr. Unsec. Nts., 2/15/15 | | 391,000 | | 405,746 | | |
Materials—3.7% | | | | | | |
Chemicals—0.6% | | | | | | |
LYB International Finance BV, 5.25% Sr. Unsec. Nts., 7/15/43 | | 123,000 | | 123,674 | | |
Rockwood Specialties Group, Inc., 4.625% Sr. Unsec. Nts., 10/15/20 | | 380,000 | | 389,975 | | |
RPM International, Inc., 3.45% Sr. Unsec. Unsub. Nts., 11/15/22 | | 227,000 | | 207,362 | | |
Sherwin-Williams Co. (The), 4% Sr. Unsec. Unsub. Nts., 12/15/42 | | 236,000 | | 202,562 | | |
| | | 923,573 | | |
Construction Materials—0.3% | | | | | | |
CRH America, Inc., 4.125% Sr. Unsec. Nts., 1/15/16 | | 365,000 | | 385,305 | | |
Containers & Packaging—0.8% | | | | | | |
Crown Americas LLC/Crown Americas Capital Corp. III, 6.25% Sr. Unsec. Nts., 2/1/21 | | 421,000 | | 458,890 | | |
Packaging Corp. of America, 4.50% Sr. Unsec. Nts., 11/1/23 | | 300,000 | | 300,894 | | |
Rock Tenn Co., 3.50% Sr. Unsec. Unsub. Nts., 3/1/20 | | 432,000 | | 425,034 | | |
| | | | | 1,184,818 | | |
Metals & Mining—1.7% | | | | | | |
Allegheny Technologies, Inc., 5.95% Sr. Unsec. Unsub. Nts., 1/15/21 | | 238,000 | | 246,961 | | |
Barrick Gold Corp., 3.85% Sr. Unsec. Nts., 4/1/22 | | 190,000 | | 171,172 | | |
Carpenter Technology Corp., 4.45% Sr. Unsec. Unsub. Nts., 3/1/23 | | 145,000 | | 139,174 | | |
Cliffs Natural Resources, Inc., 3.95% Sr. Unsec. Unsub. Nts., 1/15/18 | | 392,000 | | 396,036 | | |
Freeport-McMoRan Copper & Gold, Inc.: | | | | | | |
1.40% Sr. Unsec. Nts., 2/13/15 | | 403,000 | | 405,361 | | |
3.875% Sr. Unsec. Nts., 3/15/23 | | 425,000 | | 402,036 | | |
Glencore Canada Corp.: | | | | | | |
5.375% Sr. Unsec. Unsub. Nts., 6/1/15 | | 245,000 | | 256,939 | | |
6.00% Sr. Unsec. Unsub. Nts., 10/15/15 | | 463,000 | | 501,580 | | |
| | | 2,519,259 | | |
Paper & Forest Products—0.3% | | | | | | |
Georgia-Pacific LLC, 3.734% Sr. Unsec. Nts., 7/15/231 | | 306,000 | | 294,624 | | |
International Paper Co., 6% Sr. Unsec. Unsub. Nts., 11/15/41 | | 143,000 | | 155,325 | | |
| | 449,949 | | |
| | | | | | |
| | | Principal
Amount | | Value | | |
Telecommunication Services—2.4% | | | | | | |
Diversified Telecommunication Services—1.9% | | | | | | |
British Telecommunications plc, 9.625% Sr. Unsec. Nts., 12/15/30 | | $ 264,000 | | $ 394,013 | | |
Frontier Communications Corp., 8.50% Sr. Unsec. Nts., 4/15/20 | | 344,000 | | 387,000 | | |
Koninklijke KPN NV, 7% Sr. Sub. Nts., 3/28/731,3 | | 382,000 | | 387,312 | | |
MetroPCS Wireless, Inc., 6.25% Sr. Unsec. Unsub. Nts., 4/1/211 | | 426,000 | | 443,572 | | |
Telecom Italia Capital SA, 7.721% Sr. Unsec. Unsub. Nts., 6/4/38 | | 230,000 | | 231,150 | | |
Telefonica Emisiones SAU, 7.045% Sr. Unsec. Unsub. Nts., 6/20/36 | | 283,000 | | 312,521 | | |
Verizon Communications, Inc.: | | | | | | |
6.40% Sr. Unsec. Nts., 2/15/38 | | 195,000 | | 219,023 | | |
6.55% Sr. Unsec. Nts., 9/15/43 | | 468,000 | | 547,662 | | |
| | | 2,922,253 | | |
Wireless Telecommunication Services—0.5% | | | | |
America Movil SAB de CV, 4.375% Sr. Unsec. Unsub. Nts., 7/16/42 | | 334,000 | | 278,191 | | |
CC Holdings GS V LLC/Crown Castle GS III Corp., 3.849% Sr. Sec. Nts., 4/15/23 | | 227,000 | | 212,568 | | |
Vodafone Group plc: | | | | | | |
4.375% Sr. Unsec. Unsub. Nts., 2/19/43 | | 119,000 | | 102,856 | | |
6.25% Sr. Unsec. Nts., 11/30/32 | | 125,000 | | 136,807 | | |
| | | 730,422 | | |
Utilities—1.5% | | | | | | |
Electric Utilities—1.2% | | | | | | |
Edison International, 3.75% Sr. Unsec. Unsub. Nts., 9/15/17 | | 438,000 | | 459,237 | | |
Exelon Generation Co. LLC, 4.25% Sr. Unsec. Unsub. Nts., 6/15/22 | | 230,000 | | 220,500 | | |
ITC Holdings Corp., 5.30% Sr. Unsec. Nts., 7/1/43 | | 179,000 | | 176,028 | | |
Jersey Central Power & Light Co., 4.70% Sr. Unsec. Nts., 4/1/241 | | 198,000 | | 196,050 | | |
PPL Capital Funding, Inc., 3.50% Sr. Unsec. Unsub. Nts., 12/1/22 | | 329,000 | | 310,815 | | |
PPL WEM Holdings plc, 5.375% Sr. Unsec. Unsub. Nts., 5/1/211 | | 429,000 | | 456,276 | | |
| | | 1,818,906 | | |
Energy Traders—0.2% | | | | | | |
Dayton Power & Light Co., 1.875% Sr. Sec. Nts., 9/15/161 | | 272,000 | | 274,383 | | |
Multi-Utilities—0.1% | | | | | | |
CMS Energy Corp., 5.05% Sr. Unsec. Unsub. Nts., 3/15/22 | | 155,000 | | 167,520 | | |
Total Corporate Bonds and Notes (Cost $64,673,219) | | | | 65,746,027 | | |
12 OPPENHEIMER CORE BOND FUND/VA
| | | | | | |
| | | Shares | | Value | | |
| | |
Investment Company—14.8% | | | | | | |
Oppenheimer Institutional Money Market Fund, Cl. E, 0.09%12,13 | | | | |
(Cost $22,407,494) | | 22,407,494 | | $ 22,407,494 | | |
Total Investments, at Value
(Cost $183,945,859) | | 119.5% | | 181,305,738 | | |
Liabilities in Excess of Other Assets | | (19.5) | | (29,574,760) | | |
| | | | |
Net Assets | | 100.0% | | $ 151,730,978 | | |
| | | | |
Footnotes to Statement of Investments
1. Represents securities sold under Rule 144A, which are exempt from registration under the Securities Act of 1933, as amended. These securities have been determined to be liquid under guidelines established by the Board of Trustees. These securities amount to $27,820,544 or 18.34% of the Fund’s net assets as of December 31, 2013.
2. Restricted security. The aggregate value of restricted securities as of December 31, 2013 was $882,258, which represents 0.58% of the Fund’s net assets. See Note 7 of the accompanying Notes. Information concerning restricted securities is as follows:
| | | | | | | | | | | | | | | | |
| Security | | Acquisition
Dates | | | Cost | | | Value | | | Unrealized
Appreciation/
(Depreciation) | |
| |
Capital Lease Funding Securitization LP, Interest-Only Commercial Mtg. Pass-Through Certificates, Series 1997-CTL1, Cl. IO, 0%, 6/22/24 | | | 4/21/97 | | | $ | 382,892 | | | $ | 82,693 | | | $ | (300,199) | |
Credit Acceptance Auto Loan Trust, Series 2013-2A, Cl. B, 2.26%, 10/15/21 | | | 10/22/13 | | | | 259,927 | | | | 259,419 | | | | (508) | |
Lehman Structured Securities Corp., Series 2002-GE1, Cl. A, 2.514%, 7/26/24 | | | 1/28/02 | | | | 82,654 | | | | 73,738 | | | | (8,916) | |
Morgan Stanley Reremic Trust, Series 2012-R3, Cl. 1B, 2.065%, 11/26/36 | | | 10/24/12 | | | | 239,567 | | | | 262,879 | | | | 22,103 | |
NC Finance Trust, Series 1999-I, Cl. D, 3.405%, 1/25/29 | | | 8/10/10 | | | | 3,281,116 | | | | 202,201 | | | | (3,078,915) | |
Santander Drive Auto Receivables Trust, Series 2011-S2A, Cl. D, 3.35%, 6/15/17 | | | 5/19/11-4/9/13 | | | | 1,324 | | | | 1,328 | | | | 4 | |
| | | | | | | | |
| | | | | | $ | 4,247,480 | | | $ | 882,258 | | | $ | (3,366,431) | |
| | | | | | | | |
3. Represents the current interest rate for a variable or increasing rate security.
4. Interest-Only Strips represent the right to receive the monthly interest payments on an underlying pool of mortgage loans. These securities typically decline in price as interest rates decline. Most other fixed income securities increase in price when interest rates decline. The principal amount of the underlying pool represents the notional amount on which current interest is calculated. The price of these securities is typically more sensitive to changes in prepayment rates than traditional mortgage-backed securities (for example, GNMA pass-throughs). Interest rates disclosed represent current yields based upon the current cost basis and estimated timing and amount of future cash flows. These securities amount to $3,406,942 or 2.25% of the Fund’s net assets as of December 31, 2013.
5. Interest rate is less than 0.0005%.
6. Principal-Only Strips represent the right to receive the monthly principal payments on an underlying pool of mortgage loans. The value of these securities generally increases as interest rates decline and prepayment rates rise. The price of these securities is typically more volatile than that of coupon-bearing bonds of the same maturity. Interest rates disclosed represent current yields based upon the current cost basis and estimated timing of future cash flows. These securities amount to $195,500 or 0.13% of the Fund’s net assets as of December 31, 2013.
7. The current amortization rate of the security’s cost basis exceeds the future interest payments currently estimated to be received. Both the amortization rate and interest payments are contingent on future mortgage pre-payment speeds and are therefore subject to change.
8. All or a portion of the security position is when-issued or delayed delivery to be delivered and settled after December 31, 2013. See Note 1 of the accompanying Notes.
9. This security is not accruing income because the issuer has missed an interest payment on it and/or is not anticipated to make future interest and or principal payments. The rate shown is the original contractual interest rate. See Note 1 of the accompanying Notes.
10. All or a portion of the security position is held in accounts at a futures clearing merchant and pledged to cover margin requirements on open futures contracts and written options on futures, if applicable. The aggregate market value of such securities is $264,888. See Note 6 of the accompanying Notes.
11. This bond has no contractual maturity date, is not redeemable and contractually pays an indefinite stream of interest. Rate reported represents the current interest rate for this variable rate security.
12. Is or was an affiliate, as defined in the Investment Company Act of 1940, at or during the period ended December 31, 2013, by virtue of the Fund owning at least 5% of the voting securities of the issuer or as a result of the Fund and the issuer having the same investment adviser. Transactions during the period in which the issuer was an affiliate are as follows:
| | | | | | | | | | | | | | | | |
| | | Shares December 31, 2012 | | | Gross Additions | | | Gross Reductions | | | Shares December 31, 2013 | |
| |
Oppenheimer Institutional Money Market Fund, Cl. E | | | 28,238,653 | | | | 54,739,427 | | | | 60,570,586 | | | | 22,407,494 | |
| | | | |
| | | | | | | | | Value | | | Income | |
| |
Oppenheimer Institutional Money Market Fund, Cl. E | | | | | | | | | | $ | 22,407,494 | | | $ | 27,128 | |
13. Rate shown is the 7-day yield as of December 31, 2013.
| | | | | | | | | | | | | | | | | | | | |
| |
Futures Contracts as of December 31, 2013: | |
| Description | | Exchange | | | Buy/Sell | | | Expiration Date | | | Number of Contracts | | | Unrealized
Appreciation
(Depreciation) | |
| |
U.S. Treasury Long Bonds | | | CBT | | | | Sell | | | | 3/20/14 | | | | 25 | | | $ | 48,219 | |
U.S. Treasury Nts., 2 yr. | | | CBT | | | | Sell | | | | 3/31/14 | | | | 32 | | | | 13,782 | |
U.S. Treasury Nts., 5 yr. | | | CBT | | | | Sell | | | | 3/31/14 | | | | 97 | | | | 151,109 | |
U.S. Treasury Nts., 10 yr. | | | CBT | | | | Buy | | | | 3/20/14 | | | | 47 | | | | (62,216) | |
U.S. Treasury Ultra Bonds | | | CBT | | | | Buy | | | | 3/20/14 | | | | 54 | | | | (143,276) | |
| | | | | | | | | | | | | | | | | | | | |
| | | | | | | | | | | | | | | | | | $ | 7,618 | |
| | | | | | | | | | | | | | | | | | | | |
See accompanying Notes to Financial Statements.
13 OPPENHEIMER CORE BOND FUND/VA
STATEMENTOF ASSETS AND LIABILITIES December 31, 2013
| | | | |
| |
Assets | | | | |
Investments, at value—see accompanying statement of investments: | | | | |
Unaffiliated companies (cost $161,538,365) | | $ | 158,898,244 | |
Affiliated companies (cost $22,407,494) | | | 22,407,494 | |
| | | | |
| | | 181,305,738 | |
| |
Receivables and other assets: | | | | |
Investments sold (including $6,368,779 sold on a when-issued or delayed delivery basis) | | | 7,044,019 | |
Interest, dividends and principal paydowns | | | 1,015,860 | |
Shares of beneficial interest sold | | | 776,806 | |
Variation margin receivable | | | 20,813 | |
Other | | | 26,746 | |
| | | | |
| Total assets | | | 190,189,982 | |
|
| |
Liabilities | | | | |
Payables and other liabilities: | | | | |
Investments purchased (including $37,714,448 purchased on a when-issued or delayed delivery basis) | | | 38,259,441 | |
Variation margin payable | | | 51,953 | |
Shares of beneficial interest redeemed | | | 48,882 | |
Trustees’ compensation | | | 24,644 | |
Transfer and shareholder servicing agent fees | | | 12,900 | |
Shareholder communications | | | 12,523 | |
Distribution and service plan fees | | | 11,970 | |
Other | | | 36,691 | |
| | | | |
Total liabilities | | | 38,459,004 | |
|
| |
Net Assets | | $ | 151,730,978 | |
| | | | |
|
| |
Composition of Net Assets | | | | |
Par value of shares of beneficial interest | | $ | 19,461 | |
| |
Additional paid-in capital | | | 231,208,517 | |
| |
Accumulated net investment income | | | 7,270,382 | |
| |
Accumulated net realized loss on investments | | | (84,134,879) | |
| |
Net unrealized depreciation on investments | | | (2,632,503) | |
| | | | |
| Net Assets | | $ | 151,730,978 | |
| | | | |
|
| |
| | | | |
Net Asset Value Per Share | | | | |
Non-Service Shares: | | | | |
Net asset value, redemption price (excludes applicable contingent deferred sales charge) and offering price per share (based on net assets of $96,785,221 and 12,359,959 shares of beneficial interest outstanding) | | $ | 7.83 | |
| |
Service Shares: | | | | |
Net asset value, redemption price (excludes applicable contingent deferred sales charge) and offering price per share (based on net assets of $54,945,757 and 7,101,312 shares of beneficial interest outstanding) | | $ | 7.74 | |
See accompanying Notes to Financial Statements.
14 OPPENHEIMER CORE BOND FUND/VA
STATEMENTOF OPERATIONS For the Ended December 31, 2013
| | | | |
| |
| Investment Income | | | | |
Interest: | | | | |
Unaffiliated companies (net of foreign withholding taxes of $1,509) | | $ | 7,705,033 | |
| |
Fee income on when-issued securities | | | 922,830 | |
| |
Dividends from affiliated companies | | | 27,128 | |
| | | | |
Total investment income | | | 8,654,991 | |
|
| |
Expenses | | | | |
Management fees | | | 990,310 | |
| |
Distribution and service plan fees: | | | | |
Service shares | | | 149,169 | |
| |
Transfer and shareholder servicing agent fees: | | | | |
Non-Service shares | | | 105,362 | |
Service shares | | | 59,722 | |
| |
Shareholder communications: | | | | |
Non-Service shares | | | 29,346 | |
Service shares | | | 16,585 | |
| |
Custodian fees and expenses | | | 29,705 | |
| |
Trustees’ compensation | | | 18,627 | |
| |
Other | | | 58,981 | |
| | | | |
Total expenses | | | 1,457,807 | |
Less waivers and reimbursements of expenses | | | (70,496) | |
| | | | |
Net expenses | | | 1,387,311 | |
|
| |
Net Investment Income | | | 7,267,680 | |
|
| |
| Realized and Unrealized Gain (Loss) | | | | |
Net realized gain (loss) on: | | | | |
Investments from unaffiliated companies | | | 982,144 | |
Closing and expiration of futures contracts | | | (743,123) | |
Swap contracts | | | (113,981) | |
| | | | |
Net realized gain | | | 125,040 | |
| |
Net change in unrealized appreciation/depreciation on: | | | | |
Investments | | | (7,882,295) | |
Futures contracts | | | 53,122 | |
| | | | |
Net change in unrealized appreciation/depreciation | | | (7,829,173) | |
|
| |
Net Decrease in Net Assets Resulting from Operations | | $ | (436,453) | |
| | | | |
See accompanying Notes to Financial Statements.
15 OPPENHEIMER CORE BOND FUND/VA
STATEMENTSOF CHANGES IN NET ASSETS
| | | | | | | | |
| | | Year Ended
December 31, 2013 | | | Year Ended
December 31, 2012 | |
| |
Operations | | | | | | | | |
Net investment income | | $ | 7,267,680 | | | $ | 7,917,484 | |
| |
Net realized gain | | | 125,040 | | | | 6,322,735 | |
| |
Net change in unrealized appreciation/depreciation | | | (7,829,173) | | | | 3,953,898 | |
| | | | | | | | |
Net increase (decrease) in net assets resulting from operations | | | (436,453) | | | | 18,194,117 | |
|
| |
Dividends and/or Distributions to Shareholders | | | | | | | | |
Dividends from net investment income: | | | | | | | | |
Non-Service shares | | | (5,333,237) | | | | (5,870,393) | |
Service shares | | | (3,004,980) | | | | (3,356,788) | |
| | | | |
| | | (8,338,217) | | | | (9,227,181) | |
|
| |
Beneficial Interest Transactions | | | | | | | | |
| Net decrease in net assets resulting from beneficial interest transactions: | | | | | | | | |
Non-Service shares | | | (14,737,860) | | | | (11,196,132) | |
Service shares | | | (6,439,915) | | | | (652,679) | |
| | | | | | | | |
| | | (21,177,775) | | | | (11,848,811) | |
|
| |
Net Assets | | | | | | | | |
Total decrease | | | (29,952,445) | | | | (2,881,875) | |
| |
Beginning of period | | | 181,683,423 | | | | 184,565,298 | |
| | | | | | | | |
End of period (including accumulated net investment income of $7,270,382 and $7,838,245, respectively) | | $ | 151,730,978 | | | $ | 181,683,423 | |
| | | | |
See accompanying Notes to Financial Statements.
16 OPPENHEIMER CORE BOND FUND/VA
FINANCIAL HIGHLIGHTS
| | | | | | | | | | | | | | | | | | | | |
| Non-Service Shares | | Year Ended December 31,
2013 | | | Year Ended December 31,
2012 | | | Year Ended December 30,
20111 | | | Year Ended December 31,
2010 | | | Year Ended December 31,
2009 | |
| |
Per Share Operating Data | | | | | | | | | | | | | | | | | | | | |
Net asset value, beginning of period | | $ | 8.26 | | | $ | 7.88 | | | $ | 7.73 | | | $ | 7.07 | | | $ | 6.45 | |
| |
Income (loss) from investment operations: | | | | | | | | | | | | | | | | | | | | |
Net investment income2 | | | 0.36 | | | | 0.35 | | | | 0.36 | | | | 0.40 | | | | 0.48 | |
Net realized and unrealized gain (loss) | | | (0.37) | | | | 0.44 | | | | 0.25 | | | | 0.40 | | | | 0.14 | |
| | | | |
Total from investment operations | | | (0.01) | | | | 0.79 | | | | 0.61 | | | | 0.80 | | | | 0.62 | |
| |
Dividends and/or distributions to shareholders: | | | | | | | | | | | | | | | | | | | | |
Dividends from net investment income | | | (0.42) | | | | (0.41) | | | | (0.46) | | | | (0.14) | | | | 0.00 | |
| |
Net asset value, end of period | | $ | 7.83 | | | $ | 8.26 | | | $ | 7.88 | | | $ | 7.73 | | | $ | 7.07 | |
| | | | |
|
| |
Total Return, at Net Asset Value3 | | | (0.10)% | | | | 10.29% | | | | 8.27% | | | | 11.42% | | | | 9.61% | |
| |
Ratios/Supplemental Data | | | | | | | | | | | | | | | | | | | | |
Net assets, end of period (in thousands) | | $ | 96,785 | | | $ | 116,989 | | | $ | 122,271 | | | $ | 132,557 | | | $ | 137,597 | |
| |
Average net assets (in thousands) | | $ | 105,012 | | | $ | 119,547 | | | $ | 127,341 | | | $ | 136,333 | | | $ | 137,631 | |
| |
Ratios to average net assets:4 | | | | | | | | | | | | | | | | | | | | |
Net investment income | | | 4.51% | | | | 4.34% | | | | 4.71% | | | | 5.32% | | | | 7.40% | |
Total expenses5 | | | 0.80% | | | | 0.77% | | | | 0.77% | | | | 0.79% | | | | 0.75% | |
Expenses after payments, waivers and/or reimbursements and reduction to custodian expenses | | | 0.75% | | | | 0.75% | | | | 0.75% | | | | 0.70% | | | | 0.61% | |
| |
Portfolio turnover rate6 | | | 115% | | | | 140% | | | | 99% | | | | 98% | | | | 143% | |
1. December 30, 2011 represents the last business day of the Fund’s 2011 reporting period. See Note 1 of the accompanying Notes.
2. Per share amounts calculated based on the average shares outstanding during the period.
3. Assumes an initial investment on the business day before the first day of the fiscal period, with all dividends and distributions reinvested in additional shares on the reinvestment date, and redemption at the net asset value calculated on the last business day of the fiscal period. Total returns are not annualized for periods less than one full year. Total return information does not reflect expenses that apply at the separate account level or to related insurance products. Inclusion of these charges would reduce the total return figures for all periods shown. Returns do not reflect the deduction of taxes that a shareholder would pay on fund distributions or the redemption of fund shares.
4. Annualized for periods less than one full year.
5. Total expenses including indirect expenses from affiliated fund were as follows:
| | | | |
Year Ended December 31, 2013 | | | 0.81 | % |
Year Ended December 31, 2012 | | | 0.79 | % |
Year Ended December 30, 2011 | | | 0.79 | % |
Year Ended December 31, 2010 | | | 0.80 | % |
Year Ended December 31, 2009 | | | 0.76 | % |
6. The portfolio turnover rate excludes purchase and sale transactions of To Be Announced (TBA) mortgage-related
securities as follows:
| | | | | | | | |
| | | Purchase Transactions | | | Sale Transactions | |
Year Ended December 31, 2013 | | | $776,927,298 | | | | $806,883,121 | |
Year Ended December 31, 2012 | | | $930,202,858 | | | | $942,406,652 | |
Year Ended December 30, 2011 | | | $911,850,847 | | | | $909,531,196 | |
Year Ended December 31, 2010 | | | $775,240,942 | | | | $766,486,357 | |
Year Ended December 31, 2009 | | | $977,840,247 | | | | $1,009,549,121 | |
See accompanying Notes to Financial Statements.
17 OPPENHEIMER CORE BOND FUND/VA
| | | | | | | | | | | | | | | | | | | | |
| Service Shares | | Year Ended
December 31,
2013 | | | Year Ended
December 31,
2012 | | | Year Ended
December 30,
20111 | | | Year Ended
December 31,
2010 | | | Year Ended
December 31,
2009 | |
| |
Per Share Operating Data | | | | | | | | | | | | | | | | | | | | |
Net asset value, beginning of period | | $ | 8.17 | | | $ | 7.79 | | | $ | 7.65 | | | $ | 6.99 | | | $ | 6.41 | |
| |
Income (loss) from investment operations: | | | | | | | | | | | | | | | | | | | | |
Net investment income2 | | | 0.34 | | | | 0.33 | | | | 0.34 | | | | 0.37 | | | | 0.46 | |
Net realized and unrealized gain (loss) | | | (0.37) | | | | 0.44 | | | | 0.24 | | | | 0.41 | | | | 0.12 | |
| | | | |
Total from investment operations | | | (0.03) | | | | 0.77 | | | | 0.58 | | | | 0.78 | | | | 0.58 | |
| |
Dividends and/or distributions to shareholders: | | | | | | | | | | | | | | | | | | | | |
Dividends from net investment income | | | (0.40) | | | | (0.39) | | | | (0.44) | | | | (0.12) | | | | 0.00 | |
| |
Net asset value, end of period | | $ | 7.74 | | | $ | 8.17 | | | $ | 7.79 | | | $ | 7.65 | | | $ | 6.99 | |
| | | | |
|
| |
Total Return, at Net Asset Value3 | | | (0.38)% | | | | 10.17% | | | | 7.93% | | | | 11.28% | | | | 9.05% | |
| |
Ratios/Supplemental Data | | | | | | | | | | | | | | | | | | | | |
Net assets, end of period (in thousands) | | $ | 54,946 | | | $ | 64,694 | | | $ | 62,294 | | | $ | 56,562 | | | $ | 56,717 | |
| |
Average net assets (in thousands) | | $ | 59,523 | | | $ | 67,116 | | | $ | 58,629 | | | $ | 57,313 | | | $ | 52,648 | |
| |
Ratios to average net assets:4 | | | | | | | | | | | | | | | | | | | | |
Net investment income | | | 4.26% | | | | 4.07% | | | | 4.42% | | | | 5.06% | | | | 7.16% | |
Total expenses5 | | | 1.05% | | | | 1.02% | | | | 1.02% | | | | 1.04% | | | | 1.01% | |
Expenses after payments, waivers and/or reimbursements and reduction to custodian expenses | | | 1.00% | | | | 1.00% | | | | 1.00% | | | | 0.95% | | | | 0.86% | |
| |
Portfolio turnover rate6 | | | 115 % | | | | 140 % | | | | 99 % | | | | 98 % | | | | 143 % | |
1. December 30, 2011 represents the last business day of the Fund’s 2011 reporting period. See Note 1 of the accompanying Notes.
2. Per share amounts calculated based on the average shares outstanding during the period.
3. Assumes an initial investment on the business day before the first day of the fiscal period, with all dividends and distributions reinvested in additional shares on the reinvestment date, and redemption at the net asset value calculated on the last business day of the fiscal period. Total returns are not annualized for periods less than one full year. Total return information does not reflect expenses that apply at the separate account level or to related insurance products. Inclusion of these charges would reduce the total return figures for all periods shown. Returns do not reflect the deduction of taxes that a shareholder would pay on fund distributions or the redemption of fund shares.
4. Annualized for periods less than one full year.
5. Total expenses including indirect expenses from affiliated fund were as follows:
| | | | |
Year Ended December 31, 2013 | | | 1.06 | % |
Year Ended December 31, 2012 | | | 1.04 | % |
Year Ended December 30, 2011 | | | 1.04 | % |
Year Ended December 31, 2010 | | | 1.05 | % |
Year Ended December 31, 2009 | | | 1.02 | % |
6. The portfolio turnover rate excludes purchase and sale transactions of To Be Announced (TBA) mortgage-related
securities as follows:
| | | | | | | | |
| | | Purchase Transactions | | | Sale Transactions | |
Year Ended December 31, 2013 | | | $776,927,298 | | | | $806,883,121 | |
Year Ended December 31, 2012 | | | $930,202,858 | | | | $942,406,652 | |
Year Ended December 30, 2011 | | | $911,850,847 | | | | $909,531,196 | |
Year Ended December 31, 2010 | | | $775,240,942 | | | | $766,486,357 | |
Year Ended December 31, 2009 | | | $977,840,247 | | | | $1,009,549,121 | |
See accompanying Notes to Financial Statements.
18 OPPENHEIMER CORE BOND FUND/VA
NOTESTO FINANCIAL STATEMENTS December 31, 2013
1. Significant Accounting Policies
Oppenheimer Core Bond Fund/VA (the “Fund”) is a separate series of Oppenheimer Variable Account Funds, a diversified open-end management investment company registered under the Investment Company Act of 1940, as amended. The Fund’s main investment objective is to seek total return. The Fund’s investment adviser is OFI Global Asset Management, Inc. (“OFI Global” or the “Manager”), a wholly-owned subsidiary of OppenheimerFunds, Inc. (“OFI” or the “Sub-Adviser”). The Manager has entered into a sub-advisory agreement with OFI. Shares of the Fund are sold only to separate accounts of life insurance companies.
The Fund offers two classes of shares. Both classes are sold at their offering price, which is the net asset value per share, to separate investment accounts of participating insurance companies as an underlying investment for variable life insurance policies, variable annuity contracts or other investment products. The class of shares designated as Service shares is subject to a distribution and service plan. Both classes of shares have identical rights and voting privileges with respect to the Fund in general and exclusive voting rights on matters that affect that class alone. Earnings, net assets and net asset value per share may differ due to each class having its own expenses, such as transfer and shareholder servicing agent fees and shareholder communications, directly attributable to that class.
The following is a summary of significant accounting policies consistently followed by the Fund.
Securities on a When-Issued or Delayed Delivery Basis. The Fund may purchase securities on a “when-issued” basis, and may purchase or sell securities on a “delayed delivery” basis. “When-issued” or “delayed delivery” refers to securities whose terms and indenture are available and for which a market exists, but which are not available for immediate delivery. Delivery and payment for securities that have been purchased by the Fund on a when-issued basis normally takes place within six months and possibly as long as two years or more after the trade date. During this period, such securities do not earn interest, are subject to market fluctuation and may increase or decrease in value prior to their delivery. The purchase of securities on a when-issued basis may increase the volatility of the Fund’s net asset value to the extent the Fund executes such transactions while remaining substantially fully invested. When the Fund engages in when-issued or delayed delivery transactions, it relies on the buyer or seller, as the case may be, to complete the transaction. Their failure to do so may cause the Fund to lose the opportunity to obtain or dispose of the security at a price and yield it considers advantageous. The Fund may also sell securities that it purchased on a when-issued basis or forward commitment prior to settlement of the original purchase.
As of December 31, 2013, the Fund had purchased securities issued on a when-issued or delayed delivery basis and sold securities issued on a delayed delivery basis as follows:
| | | | |
| | | When-Issued or Delayed Delivery Basis Transactions | |
| |
Purchased securities | | | $37,714,448 | |
Sold securities | | | 6,368,779 | |
The Fund may enter into “forward roll” transactions with respect to mortgage-related securities. In this type of transaction, the Fund sells a mortgage-related security to a buyer and simultaneously agrees to repurchase a similar security (same type, coupon and maturity) at a later date at a set price. During the period between the sale and the repurchase, the Fund will not be entitled to receive interest and principal payments on the securities that have been sold. The Fund records the incremental difference between the forward purchase and sale of each forward roll as realized gain (loss) on investments or as fee income in the case of such transactions that have an associated fee in lieu of a difference in the forward purchase and sale price.
Forward roll transactions may be deemed to entail embedded leverage since the Fund purchases mortgage-related securities with extended settlement dates rather than paying for the securities under a normal settlement cycle. This embedded leverage increases the Fund’s market value of investments relative to its net assets which can incrementally increase the volatility of the Fund’s performance. Forward roll transactions can be replicated over multiple settlement periods.
Risks of entering into forward roll transactions include the potential inability of the counterparty to meet the terms of the agreement; the potential of the Fund to receive inferior securities at redelivery as compared to the securities sold to the counterparty; and counterparty credit risk.
Credit Risk. The Fund invests in high-yield, non-investment-grade bonds, which may be subject to a greater degree of credit risk. Credit risk relates to the ability of the issuer to meet interest or principal payments or both as they become due. The Fund may acquire securities that have missed an interest payment, and is not obligated to dispose of securities whose issuers or underlying obligors subsequently miss an interest payment. Information concerning securities not accruing interest as of December 31, 2013 is as follows:
| | | | |
Cost | | $ | 3,281,116 | |
Market Value | | $ | 202,201 | |
Market value as % of Net Assets | | | 0.13 | % |
19 OPPENHEIMER CORE BOND FUND/VA
NOTESTO FINANCIAL STATEMENTS Continued
1. Significant Accounting Policies (Continued)
Investment in Oppenheimer Institutional Money Market Fund. The Fund is permitted to invest daily available cash balances in an affiliated money market fund. The Fund may invest the available cash in Class E shares of Oppenheimer Institutional Money Market Fund (“IMMF”) to seek current income while preserving liquidity. IMMF is a registered open-end management investment company, regulated as a money market fund under the Investment Company Act of 1940, as amended. The Manager is the investment adviser of IMMF, and the Sub-Adviser provides investment and related advisory services to IMMF. When applicable, the Fund’s investment in IMMF is included in the Statement of Investments. Shares of IMMF are valued at their net asset value per share. As a shareholder, the Fund is subject to its proportional share of IMMF’s Class E expenses, including its management fee. The Manager will waive fees and/or reimburse Fund expenses in an amount equal to the indirect management fees incurred through the Fund’s investment in IMMF.
Allocation of Income, Expenses, Gains and Losses. Income, expenses (other than those attributable to a specific class), gains and losses are allocated on a daily basis to each class of shares based upon the relative proportion of net assets represented by such class. Operating expenses directly attributable to a specific class are charged against the operations of that class.
Federal Taxes. The Fund intends to comply with provisions of the Internal Revenue Code applicable to regulated investment companies and to distribute substantially all of its investment company taxable income, including any net realized gain on investments not offset by capital loss carryforwards, if any, to shareholders. Therefore, no federal income or excise tax provision is required. The Fund files income tax returns in U.S. federal and applicable state jurisdictions. The statute of limitations on the Fund’s tax return filings generally remain open for the three preceding fiscal reporting period ends.
The tax components of capital shown in the following table represent distribution requirements the Fund must satisfy under the income tax regulations, losses the Fund may be able to offset against income and gains realized in future years and unrealized appreciation or depreciation of securities and other investments for federal income tax purposes.
| | | | | | | | | | | | |
Undistributed Net Investment Income | | Undistributed
Long-Term
Gain | | | Accumulated Loss
Carryforward1,2,3,4 | | | Net Unrealized
Depreciation
Based on cost of
Securities and
Other Investments
for Federal Income
Tax Purposes | |
| |
$7,966,003 | | | $— | | | | $84,067,419 | | | | $2,713,104 | |
1. As of December 31, 2013, the Fund had $83,694,939 of net capital loss carryforwards available to offset future realized capital gains, if any, and thereby reduce future taxable gain distributions. Details of the capital loss carryforwards are included in the table below. Capital loss carryovers with no expiration, if any, must be utilized prior to those with expiration dates.
| | | | |
| Expiring | | | |
| |
2016 | | $ | 8,625,089 | |
2017 | | | 75,069,850 | |
| | | | |
Total | | $ | 83,694,939 | |
| | | | |
2. As of December 31, 2013, the Fund had $372,480 of post-October losses available to offset future realized capital gains, if any.
3. During the fiscal year ended December 31, 2013, the Fund utilized $62,802 of capital loss carryforward to offset capital gains realized in that fiscal year.
4. During the fiscal year ended December 31, 2012, the Fund utilized $5,945,207 of capital loss carryforward to offset capital gains realized in that fiscal year.
Net investment income (loss) and net realized gain (loss) may differ for financial statement and tax purposes. The character of dividends and distributions made during the fiscal year from net investment income or net realized gains may differ from their ultimate characterization for federal income tax purposes. Also, due to timing of dividends and distributions, the fiscal year in which amounts are distributed may differ from the fiscal year in which the income or net realized gain was recorded by the Fund.
Accordingly, the following amounts have been reclassified for December 31, 2013. Net assets of the Fund were unaffected by the reclassifications.
| | | | |
Increase to Accumulated Net Investment Income | | Increase to Accumulated Net
Realized Loss on Investments | |
| |
$502,674 | | | $502,674 | |
The tax character of distributions paid during the years ended December 31, 2013 and December 31, 2012 was as follows:
| | | | | | | | |
| | | Year Ended | | | Year Ended | |
| | | December 31, 2013 | | | December 31, 2012 | |
| |
Distributions paid from: | | | | | | | | |
Ordinary income | | $ | 8,338,217 | | | $ | 9,227,181 | |
20 OPPENHEIMER CORE BOND FUND/VA
1. Significant Accounting Policies (Continued)
The aggregate cost of securities and other investments and the composition of unrealized appreciation and depreciation of securities and other investments for federal income tax purposes as of December 31, 2013 are noted in the following table. The primary difference between book and tax appreciation or depreciation of securities and other investments, if applicable, is attributable to the tax deferral of losses or tax realization of financial statement unrealized gain or loss.
| | | | |
Federal tax cost of securities | | $ | 184,018,876 | |
Federal tax cost of other investments | | | (8,674,422) | |
| | | | |
Total federal tax cost | | $ | 175,344,454 | |
| | | | |
Gross unrealized appreciation | | $ | 4,524,889 | |
Gross unrealized depreciation | | | (7,237,993) | |
| | | | |
Net unrealized depreciation | | $ | (2,713,104) | |
| | | | |
Trustees’ Compensation. The Board of Trustees has adopted a compensation deferral plan for independent trustees that enables trustees to elect to defer receipt of all or a portion of the annual compensation they are entitled to receive from the Fund. For purposes of determining the amount owed to the Trustee under the plan, deferred amounts are treated as though equal dollar amounts had been invested in shares of the Fund or in other Oppenheimer funds selected by the Trustee. The Fund purchases shares of the funds selected for deferral by the Trustee in amounts equal to his or her deemed investment, resulting in a Fund asset equal to the deferred compensation liability. Such assets are included as a component of “Other” within the asset section of the Statement of Assets and Liabilities. Deferral of trustees’ fees under the plan will not affect the net assets of the Fund, and will not materially affect the Fund’s assets, liabilities or net investment income per share. Amounts will be deferred until distributed in accordance with the compensation deferral plan.
Dividends and Distributions to Shareholders. Dividends and distributions to shareholders, which are determined in accordance with income tax regulations and may differ from U.S. generally accepted accounting principles, are recorded on the ex-dividend date. Income and capital gain distributions, if any, are declared and paid annually or at other times as deemed necessary by the Manager.
Investment Income. Dividend income is recorded on the ex-dividend date or upon ex-dividend notification in the case of certain foreign dividends where the ex-dividend date may have passed. Non-cash dividends included in dividend income, if any, are recorded at the fair market value of the securities received. Interest income is recognized on an accrual basis. Discount and premium, which are included in interest income on the Statement of Operations, are amortized or accreted daily.
Custodian Fees. “Custodian fees and expenses” in the Statement of Operations may include interest expense incurred by the Fund on any cash overdrafts of its custodian account during the period. Such cash overdrafts may result from the effects of failed trades in portfolio securities and from cash outflows resulting from unanticipated shareholder redemption activity. The Fund pays interest to its custodian on such cash overdrafts, to the extent they are not offset by positive cash balances maintained by the Fund, at a rate equal to the Federal Funds Rate plus 0.50%. The “Reduction to custodian expenses” line item, if applicable, represents earnings on cash balances maintained by the Fund during the period. Such interest expense and other custodian fees may be paid with these earnings.
Security Transactions. Security transactions are recorded on the trade date. Realized gains and losses on securities sold are determined on the basis of identified cost.
Indemnifications. The Fund’s organizational documents provide current and former trustees and officers with a limited indemnification against liabilities arising in connection with the performance of their duties to the Fund. In the normal course of business, the Fund may also enter into contracts that provide general indemnifications. The Fund’s maximum exposure under these arrangements is unknown as this would be dependent on future claims that may be made against the Fund. The risk of material loss from such claims is considered remote.
Other. The preparation of financial statements in conformity with accounting principles generally accepted in the United States of America requires management to make estimates and assumptions that affect the reported amounts of assets and liabilities and disclosure of contingent assets and liabilities at the date of the financial statements and the reported amounts of increases and decreases in net assets from operations during the reporting period. Actual results could differ from those estimates.
2. Securities Valuation
The Fund calculates the net asset value of its shares as of the close of the New York Stock Exchange (the “Exchange”), normally 4:00 P.M. Eastern time, on each day the Exchange is open for trading.
The Fund’s Board has adopted procedures for the valuation of the Fund’s securities and has delegated the day-to-day responsibility for valuation determinations under those procedures to the Manager. The Manager has established a Valuation Committee which is responsible for determining a “fair valuation” for any security for which market quotations are not “readily available.” The Valuation Committee’s fair valuation determinations are subject to review, approval and ratification by the Fund’s Board at its next regularly scheduled meeting covering the calendar quarter in which the fair valuation was determined.
21 OPPENHEIMER CORE BOND FUND/VA
NOTESTO FINANCIAL STATEMENTS (Continued)
2. Securities Valuation (Continued)
Valuation Methods and Inputs
Securities are valued using unadjusted quoted market prices, when available, as supplied primarily by third party pricing services or dealers.
The following methodologies are used to determine the market value or the fair value of the types of securities described below:
Securities traded on a registered U.S. securities exchange (including exchange-traded derivatives other than futures and futures options) are valued based on the last sale price of the security reported on the principal exchange on which it is traded, prior to the time when the Fund’s assets are valued. In the absence of a sale, the security is valued at the last sale price on the prior trading day, if it is within the spread of the current day’s closing “bid” and “asked” prices, and if not, at the current day’s closing bid price. A security of a foreign issuer traded on a foreign exchange, but not listed on a registered U.S. securities exchange, is valued based on the last sale price on the principal exchange on which the security is traded, as identified by the third party pricing service used by the Manager, prior to the time when the Fund’s assets are valued. If the last sale price is unavailable, the security is valued at the most recent official closing price on the principal exchange on which it is traded. If the last sales price or official closing price for a foreign security is not available, the security is valued at the mean between the bid and asked price per the exchange or, if not available from the exchange, obtained from two dealers. If bid and asked prices are not available from either the exchange or two dealers, the security is valued by using one of the following methodologies (listed in order of priority); (1) using a bid from the exchange, (2) the mean between the bid and asked price as provided by a single dealer, or (3) a bid from a single dealer.
Shares of a registered investment company that are not traded on an exchange are valued at that investment company’s net asset value per share.
Corporate and government debt securities (of U.S. or foreign issuers) and municipal debt securities, event-linked bonds, loans, mortgage-backed securities, collateralized mortgage obligations, and asset-backed securities are valued at the mean between the “bid” and “asked” prices utilizing evaluated prices obtained from third party pricing services or broker-dealers who may use matrix pricing methods to determine the evaluated prices.
Short-term money market type debt securities with a remaining maturity of sixty days or less are valued at cost adjusted by the amortization of discount or premium to maturity (amortized cost), which approximates market value. Short-term debt securities with a remaining maturity in excess of sixty days are valued at the mean between the “bid” and “asked” prices utilizing evaluated prices obtained from third party pricing services or broker-dealers.
Structured securities, swaps, swaptions, and other over-the-counter derivatives are valued utilizing evaluated prices obtained from third party pricing services or broker-dealers.
Futures contracts and futures options traded on a commodities or futures exchange will be valued at the final settlement price or official closing price on the principal exchange as reported by such principal exchange at its trading session ending at, or most recently prior to, the time when the Fund’s assets are valued.
A description of the standard inputs that may generally be considered by the third party pricing vendors in determining their evaluated prices is provided below.
| | |
| Security Type | | Standard inputs generally considered by third-party pricing vendors |
| Corporate debt, government debt, municipal, mortgage-backed and asset-backed securities | | Reported trade data, broker-dealer price quotations, benchmark yields, issuer spreads on comparable securities, the credit quality, yield, maturity, and other appropriate factors. |
| Loans | | Information obtained from market participants regarding reported trade data and broker-dealer price quotations. |
| Event-linked bonds | | Information obtained from market participants regarding reported trade data and broker-dealer price quotations. |
| Swaps | | Relevant market information, including underlying reference assets such as credit spreads, credit event probabilities, index values, individual security values, forward interest rates, variable interest rates, volatility measures, and forward currency rates. |
If a market value or price cannot be determined for a security using the methodologies described above, or if, in the “good faith” opinion of the Manager, the market value or price obtained does not constitute a “readily available market quotation,” or a significant event has occurred that would materially affect the value of the security the security is fair valued either (i) by a standardized fair valuation methodology applicable to the security type or the significant event as previously approved by the Valuation Committee and the Fund’s Board or (ii) as determined in good faith by the Manager’s Valuation Committee. The Valuation Committee considers all relevant facts that are reasonably available, through either public information or information available to the Manager, when determining the fair value of a security. Fair value determinations by the Manager are subject to review, approval and ratification by the Fund’s Board at its next regularly scheduled meeting covering the calendar quarter in which the fair valuation was determined. Those fair valuation standardized methodologies include, but are not limited to, valuing securities at the last sale price or initially at cost and subsequently adjusting the value based on: changes in company specific fundamentals, changes in an appropriate securities index, or changes in the value of similar securities which may be further adjusted for any discounts related to security-specific resale restrictions. When possible, such methodologies use observable market inputs such as unadjusted quoted prices of similar securities, observable interest rates, currency rates and yield curves. The methodologies used for valuing securities are not necessarily an indication of the risks associated with investing in those securities nor can it be assured that the Fund can obtain the fair value assigned to a security if it were to sell the security.
To assess the continuing appropriateness of security valuations, the Manager, or its third party service provider who is subject to oversight by the Manager, regularly compares prior day prices, prices on comparable securities, and sale prices to the current day prices and challenges those prices exceeding certain tolerance levels with the third party pricing service or broker source. For those securities valued by fair valuations, whether through a
22 OPPENHEIMER CORE BOND FUND/VA
2. Securities Valuation (Continued)
standardized fair valuation methodology or a fair valuation determination, the Valuation Committee reviews and affirms the reasonableness of the valuations based on such methodologies and fair valuation determinations on a regular basis after considering all relevant information that is reasonably available.
Classifications
Each investment asset or liability of the Fund is assigned a level at measurement date based on the significance and source of the inputs to its valuation. Various data inputs are used in determining the value of each of the Fund’s investments as of the reporting period end. These data inputs are categorized in the following hierarchy under applicable financial accounting standards:
1) Level 1-unadjusted quoted prices in active markets for identical assets or liabilities (including securities actively traded on a securities exchange)
2) Level 2-inputs other than unadjusted quoted prices that are observable for the asset or liability (such as unadjusted quoted prices for similar assets and market corroborated inputs such as interest rates, prepayment speeds, credit risks, etc.)
3) Level 3-significant unobservable inputs (including the Manager’s own judgments about assumptions that market participants would use in pricing the asset or liability).
The inputs used for valuing securities are not necessarily an indication of the risks associated with investing in those securities.
The table below categorizes amounts that are included in the Fund’s Statement of Assets and Liabilities as of December 31, 2013 based on valuation input level:
| | | | | | | | | | | | | | | | |
| | | Level 1—
Unadjusted
Quoted Prices | | | Level 2— Other Significant
Observable Inputs | | | Level 3—
Significant
Unobservable
Inputs | | | Value | |
| |
Assets Table | | | | | | | | | | | | | | | | |
Investments, at Value: | | | | | | | | | | | | | | | | |
Asset-Backed Securities | | $ | — | | | $ | 22,855,767 | | | $ | — | | | $ | 22,855,767 | |
Mortgage-Backed Obligations | | | — | | | | 66,631,487 | | | | 275,939 | | | | 66,907,426 | |
U.S. Government Obligations | | | — | | | | 3,389,024 | | | | — | | | | 3,389,024 | |
Corporate Bonds and Notes | | | — | | | | 65,746,027 | | | | — | | | | 65,746,027 | |
Investment Company | | | 22,407,494 | | | | — | | | | — | | | | 22,407,494 | |
| | | | |
Total Investments, at Value | | | 22,407,494 | | | | 158,622,305 | | | | 275,939 | | | | 181,305,738 | |
Other Financial Instruments: | | | | | | | | | | | | | | | | |
Variation margin receivable | | | 20,813 | | | | — | | | | — | | | | 20,813 | |
| | | | |
Total Assets | | $ | 22,428,307 | | | $ | 158,622,305 | | | $ | 275,939 | | | $ | 181,326,551 | |
| | | | |
| | | | |
Liabilities Table | | | | | | | | | | | | | | | | |
Other Financial Instruments: | | | | | | | | | | | | | | | | |
Variation margin payable | | $ | (51,953 | ) | | $ | — | | | $ | — | | | $ | (51,953) | |
| | | | |
Total Liabilities | | $ | (51,953 | ) | | $ | — | | | $ | — | | | $ | (51,953) | |
| | | | |
Currency contracts and forwards, if any, are reported at their unrealized appreciation/ depreciation at measurement date, which represents the change in the contract’s value from trade date. Futures, if any, are reported at their variation margin at measurement date, which represents the amount due to/from the Fund at that date. All additional assets and liabilities included in the above table are reported at their market value at measurement date.
3. Shares of Beneficial Interest
The Fund has authorized an unlimited number of $0.001 par value shares of beneficial interest of each class. Transactions in shares of beneficial interest were as follows:
| | | | | | | | | | | | | | | | |
| | | Year Ended December 31, 2013 | | | Year Ended December 31, 2012 | |
| | | Shares | | | Amount | | | Shares | | | Amount | |
| |
Non-Service Shares | | | | | | | | | | | | | | | | |
Sold | | | 533,702 | | | $ | 4,292,431 | | | | 1,396,350 | | | $ | 11,307,630 | |
Dividends and/or distributions reinvested | | | 682,873 | | | | 5,333,237 | | | | 749,731 | | | | 5,870,393 | |
Redeemed | | | (3,017,265) | | | | (24,363,528) | | | | (3,505,581) | | | | (28,374,155) | |
| | | | |
Net decrease | | | (1,800,690) | | | $ | (14,737,860) | | | | (1,359,500) | | | $ | (11,196,132) | |
| | | | |
| |
Service Shares | | | | | | | | | | | | | | | | |
Sold | | | 1,641,559 | | | $ | 13,196,539 | | | | 3,789,524 | | | $ | 30,414,887 | |
Dividends and/or distributions reinvested | | | 388,743 | | | | 3,004,980 | | | | 433,134 | | | | 3,356,788 | |
Redeemed | | | (2,851,850) | | | | (22,641,434) | | | | (4,293,364) | | | | (34,424,354) | |
| | | | |
Net decrease | | | (821,548) | | | $ | (6,439,915) | | | | (70,706) | | | $ | (652,679) | |
| | | | |
23 OPPENHEIMER CORE BOND FUND/VA
NOTESTO FINANCIAL STATEMENTS Continued
4. Purchases and Sales of Securities
The aggregate cost of purchases and proceeds from sales of securities, other than short-term obligations and investments in IMMF, for the year ended December 31, 2013 were as follows:
| | | | | | | | | | |
| | | Purchases | | | | | Sales | |
| |
Investment securities | | $ | 149,706,181 | | | | | $ | 164,114,293 | |
U.S. government and government agency obligations | | | 6,176,973 | | | | | | 8,844,139 | |
To Be Announced (TBA) mortgage-related securities | | | 776,927,298 | | | | | | 806,883,121 | |
5. Fees and Other Transactions with Affiliates
Management Fees. Under the investment advisory agreement, the Fund pays the Manager a management fee based on the daily net assets of the Fund at an annual rate as shown in the following table:
| | | | |
| Fee Schedule | | | |
| |
Up to $1 billion | | | 0.60% | |
Over $1 billion | | | 0.50 | |
Sub-Adviser Fees. The Manager has retained the Sub-Adviser to provide the day-to-day portfolio management of the Fund. Under the Sub-Advisory Agreement, the Manager pays the Sub-Adviser an annual fee in monthly installments, equal to a percentage of the investment management fee collected by the Manager from the Fund, which shall be calculated after any investment management fee waivers. The fee paid to the Sub-Adviser is paid by the Manager, not by the Fund.
Transfer Agent Fees. OFI Global (the “Transfer Agent”) serves as the transfer and shareholder servicing agent for the Fund. Fees incurred by the Fund with respect to these services are detailed in the Statement of Operations.
Sub-Transfer Agent Fees. The Transfer Agent has retained Shareholder Services, Inc., a wholly-owned subsidiary of OFI (the “Sub-Transfer Agent”), to provide the day-to-day transfer agent and shareholder servicing of the Fund. Under the Sub-Transfer Agency Agreement, the Transfer Agent pays the Sub-Transfer Agent an annual fee in monthly installments, equal to a percentage of the transfer agent fee collected by the Transfer Agent from the Fund, which shall be calculated after any applicable fee waivers. The fee paid to the Sub-Transfer Agent is paid by the Transfer Agent, not by the Fund.
Distribution and Service Plan for Service Shares. The Fund has adopted a Distribution and Service Plan (the “Plan”) in accordance with Rule 12b-1 under the Investment Company Act of 1940 for Service shares to pay OppenheimerFunds Distributor, Inc. (the “Distributor”), for distribution related services, personal service and account maintenance for the Fund’s Service shares. Under the Plan, payments are made periodically at an annual rate of 0.25% of the daily net assets of Service shares of the Fund. The Distributor currently uses all of those fees to compensate sponsors of the insurance product that offers Fund shares, for providing personal service and maintenance of accounts of their variable contract owners that hold Service shares. These fees are paid out of the Fund’s assets on an on-going basis and increase operating expenses of the Service shares, which results in lower performance compared to the Fund’s shares that are not subject to a service fee. Fees incurred by the Fund under the Plan are detailed in the Statement of Operations.
Waivers and Reimbursements of Expenses. The Manager has contractually agreed to limit the Fund’s expenses after payments, waivers and/or reimbursements and reduction to custodian expenses, excluding expenses incurred directly or indirectly by the Fund as a result of investments in other investment companies, wholly-owned subsidiaries and pooled investment vehicles; so that those expenses, as percentages of daily net assets, will not exceed the annual rate of 0.75% for Non-Service shares and 1.00% for Service shares. During the year ended December 31, 2013, the Manager waived fees and/or reimbursed the Fund $30,085 and $17,129 for Non-Service and Service shares, respectively.
The Manager will waive fees and/or reimburse Fund expenses in an amount equal to the indirect management fees incurred through the Fund’s investment in IMMF. During the year ended December 31, 2013, the Manager waived fees and/or reimbursed the Fund $23,282 for IMMF management fees.
Some of these undertakings may be modified or terminated at any time; some may not be modified or terminated until after one year from the date of the current prospectus, as indicated therein.
6. Risk Exposures and the Use of Derivative Instruments
The Fund’s investment objectives not only permit the Fund to purchase investment securities, they also allow the Fund to enter into various types of derivatives contracts, including, but not limited to, futures contracts, forward currency exchange contracts, credit default swaps, interest rate swaps, total return swaps, variance swaps and purchased and written options. In doing so, the Fund will employ strategies in differing combinations to permit it to increase, decrease, or change the level or types of exposure to market risk factors. These instruments may allow the Fund to pursue its objectives more quickly and efficiently than if it were to make direct purchases or sales of securities capable of effecting a similar response to market factors. Such contracts may be entered into through a bilateral over-the-counter (“OTC”) transaction, or through a securities or futures exchange and cleared through a clearinghouse.
Market Risk Factors. In accordance with its investment objectives, the Fund may use derivatives to increase or decrease its exposure to one or more of the following market risk factors:
24 OPPENHEIMER CORE BOND FUND/VA
6. Risk Exposures and the Use of Derivative Instruments (Continued)
Commodity Risk. Commodity risk relates to the change in value of commodities or commodity indexes as they relate to increases or decreases in the commodities market. Commodities are physical assets that have tangible properties. Examples of these types of assets are crude oil, heating oil, metals, livestock, and agricultural products.
Credit Risk. Credit risk relates to the ability of the issuer to meet interest and principal payments, or both, as they come due. In general, lower-grade, higher-yield bonds are subject to credit risk to a greater extent than lower-yield, higher-quality bonds.
Equity Risk. Equity risk relates to the change in value of equity securities as they relate to increases or decreases in the general market.
Foreign Exchange Rate Risk. Foreign exchange rate risk relates to the change in the U.S. dollar value of a security held that is denominated in a foreign currency. The U.S. dollar value of a foreign currency denominated security will decrease as the dollar appreciates against the currency, while the U.S. dollar value will increase as the dollar depreciates against the currency.
Interest Rate Risk. Interest rate risk refers to the fluctuations in value of fixed-income securities resulting from the inverse relationship between price and yield. For example, an increase in general interest rates will tend to reduce the market value of already issued fixed-income investments, and a decline in general interest rates will tend to increase their value. In addition, debt securities with longer maturities, which tend to have higher yields, are subject to potentially greater fluctuations in value from changes in interest rates than obligations with shorter maturities.
Volatility Risk. Volatility risk refers to the magnitude of the movement, but not the direction of the movement, in a financial instrument’s price over a defined time period. Large increases or decreases in a financial instrument’s price over a relative time period typically indicate greater volatility risk, while small increases or decreases in its price typically indicate lower volatility risk.
Derivatives may have little or no initial cash investment relative to their market value exposure and therefore can produce significant gains or losses in excess of their cost due to unanticipated changes in the market risk factors and the overall market. This use of embedded leverage allows the Fund to increase its market value exposure relative to its net assets and can substantially increase the volatility of the Fund’s performance. In instances where the Fund is using derivatives to decrease, or hedge, exposures to market risk factors for securities held by the Fund, there are also risks that those derivatives may not perform as expected resulting in losses for the combined or hedged positions. Some derivatives have the potential for unlimited loss, regardless of the size of the Fund’s initial investment.
Additional associated risks from investing in derivatives also exist and potentially could have significant effects on the valuation of the derivative and the Fund. Typically, the associated risks are not the risks that the Fund is attempting to increase or decrease exposure to, per its investment objectives, but are the additional risks from investing in derivatives. Examples of these associated risks are liquidity risk, which is the risk that the Fund will not be able to sell the derivative in the open market in a timely manner, and counterparty credit risk, which is the risk that the counterparty will not fulfill its obligation to the Fund.
The Fund’s actual exposures to these market risk factors and associated risks during the period are discussed in further detail, by derivative type, below.
Futures Contracts
A futures contract is a commitment to buy or sell a specific amount of a commodity, financial instrument or currency at a negotiated price on a stipulated future date. The Fund may buy and sell futures contracts and may also buy or write put or call options on these futures contracts. Futures contracts and options thereon are generally entered into on a regulated futures exchange and cleared through a clearinghouse associated with the exchange.
Upon entering into a futures contract, the Fund is required to deposit either cash or securities (initial margin) in an amount equal to a certain percentage of the contract value in an account registered in the futures commission merchant’s name. Subsequent payments (variation margin) are paid to or from the futures commission merchant each day equal to the daily changes in the contract value. Such payments are recorded as unrealized gains and losses. Should the Fund fail to make requested variation margin payments, the futures commission merchant can gain access to the initial margin to satisfy the Fund’s payment obligations.
Futures contracts are reported on a schedule following the Statement of Investments. Securities held by a futures commission merchant to cover initial margin requirements on open futures contracts are noted in the Statement of Investments. Cash held by a futures commission merchant to cover initial margin requirements on open futures contracts and the receivable and/or payable for the daily mark to market for the variation margin are noted in the Statement of Assets and Liabilities. The net change in unrealized appreciation and depreciation is reported in the Statement of Operations. Realized gains (losses) are reported in the Statement of Operations at the closing or expiration of futures contracts.
The Fund has purchased futures contracts on various bonds and notes to increase exposure to interest rate risk.
The Fund has sold futures contracts on various bonds and notes to decrease exposure to interest rate risk.
During the year ended December 31, 2013, the Fund had an ending monthly average market value of $9,548,821 and $31,000,638 on futures contracts purchased and sold, respectively.
Additional associated risks of entering into futures contracts (and related options) include the possibility that there may be an illiquid market where the Fund is unable to liquidate the contract or enter into an offsetting position and, if used for hedging purposes, the risk that the price of the contract will correlate imperfectly with the prices of the Fund’s securities.
Swap Contracts
The Fund may enter into swap contract agreements with a counterparty to exchange a series of cash flows based on either specified reference rates, the price or volatility of asset or non-asset references, or the occurrence of a credit event, over a specified period. Swaps can be executed in a bi-lateral
25 OPPENHEIMER CORE BOND FUND/VA
NOTESTO FINANCIAL STATEMENTS Continued
6. Risk Exposures and the Use of Derivative Instruments (Continued)
privately negotiated arrangement with a dealer in an OTC transaction (“OTC swaps”) or executed on a regulated market. Certain swaps, regardless of the venue of their execution, are required to be cleared through a clearinghouse (“cleared swaps”). Swap contracts may include interest rate, equity, debt, index, total return, credit default, currency, and volatility swaps.
Swap contracts are reported on a schedule following the Statement of Investments. Daily changes in the value of cleared swaps are reported as variation margin receivable or payable on the Statement of Assets and Liabilities. The values of OTC swap contracts are aggregated by positive and negative values and disclosed separately on the Statement of Assets and Liabilities. The unrealized appreciation (depreciation) related to the change in the valuation of the notional amount of the swap is combined with the accrued interest due to (owed by) the Fund, if any, at termination or settlement. The net change in this amount during the period is included on the Statement of Operations. The Fund also records any periodic payments received from (paid to) the counterparty, including at termination, under such contracts as realized gain (loss) on the Statement of Operations.
Swap contract agreements are exposed to the market risk factor of the specific underlying reference rate or asset. Swap contracts are typically more attractively priced compared to similar investments in related cash securities because they isolate the risk to one market risk factor and eliminate the other market risk factors. Investments in cash securities (for instance bonds) have exposure to multiple risk factors (credit and interest rate risk). Because swaps have embedded leverage, they can expose the Fund to substantial risk in the isolated market risk factor.
Credit Default Swap Contracts. A credit default swap is a contract that enables an investor to buy or sell protection against a defined-issuer credit event, such as the issuer’s failure to make timely payments of interest or principal on a debt security, bankruptcy or restructuring. The Fund may enter into credit default swaps either by buying or selling protection on a corporate issuer, sovereign issuer, or a basket or index of issuers (the “reference asset”).
The buyer of protection pays a periodic fee to the seller of protection based on the notional amount of the swap contract. The seller of protection agrees to compensate the buyer of protection for future potential losses as a result of a credit event on the reference asset. The contract effectively transfers the credit event risk of the reference asset from the buyer of protection to the seller of protection.
The ongoing value of the contract will fluctuate throughout the term of the contract based primarily on the credit risk of the reference asset. If the credit quality of the reference asset improves relative to the credit quality at contract initiation, the buyer of protection may have an unrealized loss greater than the anticipated periodic fee owed. This unrealized loss would be the result of current credit protection being cheaper than the cost of credit protection at contract initiation. If the buyer elects to terminate the contract prior to its maturity, and there has been no credit event, this unrealized loss will become realized. If the contract is held to maturity, and there has been no credit event, the realized loss will be equal to the periodic fee paid over the life of the contract.
If there is a credit event, the buyer of protection can exercise its rights under the contract and receive a payment from the seller of protection equal to the notional amount of the swap less the market value of specified debt securities issued by the reference asset. Upon exercise of the contract the difference between such value and the notional amount is recorded as realized gain (loss) and is included on the Statement of Operations.
The Fund has purchased credit protection through credit default swaps to decrease exposure to the credit risk of individual issuers and/or indexes of issuers.
For the year ended December 31, 2013, the Fund had ending monthly average notional amounts of $569,231 on credit default swaps to buy protection.
Additional associated risks to the Fund include counterparty credit risk and liquidity risk.
As of December 3, 2013, the Fund had no such credit default swap agreements outstanding.
Counterparty Credit Risk. Derivative positions are subject to the risk that the counterparty will not fulfill its obligation to the Fund. The Fund intends to enter into derivative transactions with counterparties that the Manager believes to be creditworthy at the time of the transaction.
The Fund’s risk of loss from counterparty credit risk on OTC derivatives is generally limited to the aggregate unrealized gain netted against any collateral held by the Fund. For OTC options purchased, the Fund bears the risk of loss of the amount of the premiums paid plus the positive change in market values net of any collateral held by the Fund should the counterparty fail to perform under the contracts. Options written by the Fund do not typically give rise to counterparty credit risk, as options written generally obligate the Fund and not the counterparty to perform.
To reduce counterparty risk with respect to OTC transactions, the Fund has entered into master netting arrangements, established within the Fund’s International Swap and Derivatives Association, Inc. (“ISDA”) master agreements, which allow the Fund to make (or to have an entitlement to receive) a single net payment in the event of default (close-out netting) for outstanding payables and receivables with respect to certain OTC positions in swaps, options, swaptions, and forward currency exchange contracts for each individual counterparty. In addition, the Fund may require that certain counterparties post cash and/or securities in collateral accounts to cover their net payment obligations for those derivative contracts subject to ISDA master agreements. If the counterparty fails to perform under these contracts and agreements, the cash and/or securities will be made available to the Fund.
ISDA master agreements include credit related contingent features which allow counterparties to OTC derivatives to terminate derivative contracts prior to maturity in the event that, for example, the Fund’s net assets decline by a stated percentage or the Fund fails to meet the terms of its ISDA master agreements, which would cause the Fund to accelerate payment of any net liability owed to the counterparty.
For financial reporting purposes, the Fund does not offset derivative assets and derivative liabilities that are subject to netting arrangements in the Statement of Assets and Liabilities. Bankruptcy or insolvency laws of a particular jurisdiction may impose restrictions on or prohibitions against the right of offset in bankruptcy, insolvency or other events.
The Fund’s risk of loss from counterparty credit risk on exchange-traded derivatives cleared through a clearinghouse and for cleared swaps is generally considered lower than as compared to OTC derivatives. However, counterparty credit risk exists with respect to initial and variation margin deposited/paid by the Fund that is held in futures commission merchant, broker and/or clearinghouse accounts for such exchange-traded derivatives and for cleared swaps.
26 OPPENHEIMER CORE BOND FUND/VA
6. Risk Exposures and the Use of Derivative Instruments (Continued)
With respect to cleared swaps, such transactions will be submitted for clearing, and if cleared, will be held in accounts at futures commission merchants or brokers that are members of clearinghouses. While brokers, futures commission merchants and clearinghouses are required to segregate customer margin from their own assets, in the event that a broker, futures commission merchant or clearinghouse becomes insolvent or goes into bankruptcy and at that time there is a shortfall in the aggregate amount of margin held by the broker, futures commission merchant or clearinghouse for all its customers, U.S. bankruptcy laws will typically allocate that shortfall on a pro-rata basis across all the broker’s, futures commission merchant’s or clearinghouse’s customers, potentially resulting in losses to the Fund.
There is the risk that a broker, futures commission merchant or clearinghouse will decline to clear a transaction on the Fund’s behalf, and the Fund may be required to pay a termination fee to the executing broker with whom the Fund initially enters into the transaction. Clearinghouses may also be permitted to terminate cleared swaps at any time. The Fund is also subject to the risk that the broker or futures commission merchant will improperly use the Fund’s assets deposited/paid as initial or variation margin to satisfy payment obligations of another customer. In the event of a default by another customer of the broker or futures commission merchant, the Fund might not receive its variation margin payments from the clearinghouse, due to the manner in which variation margin payments are aggregated for all customers of the broker/futures commission merchant.
Collateral and margin requirements differ by type of derivative. Margin requirements are established by the broker, futures commission merchant or clearinghouse for exchange-traded and cleared derivatives, including cleared swaps. Brokers, futures commission merchants and clearinghouses can ask for margin in excess of the regulatory minimum, or increase the margin amount, in certain circumstances.
Collateral terms are contract specific for OTC derivatives. For derivatives traded under an ISDA master agreement, the collateral requirements are typically calculated by netting the mark to market amount for each transaction under such agreement and comparing that amount to the value of any collateral currently pledged by the Fund or the counterparty.
For financial reporting purposes, cash collateral that has been pledged to cover obligations of the Fund, if any, is reported separately on the Statement of Assets and Liabilities as cash pledged as collateral. Non-cash collateral pledged by the Fund, if any, is noted in the Statement of Investments. Generally, the amount of collateral due from or to a party must exceed a minimum transfer amount threshold (e.g. $250,000) before a transfer has to be made. To the extent amounts due to the Fund from its counterparties are not fully collateralized, contractually or otherwise, the Fund bears the risk of loss from counterparty nonperformance.
The following table presents the valuations of derivative instruments by risk exposure as reported within the Statement of Assets and Liabilities as of December 31, 2013:
| | | | | | | | | | | | | | | | |
| | | Asset Derivatives | | | Liability Derivatives | |
Derivatives Not Accounted for as Hedging
Instruments | | Statement of Assets and
Liabilities Location | | | Value | | | Statement of Assets and
Liabilities Location | | | Value | |
| | | | |
Interest rate contracts | | | Variation margin receivable | | | $ | 20,813 | * | | | Variation margin payable | | | $ | 51,953* | |
*Includes only the current day’s variation margin. Prior variation margin movements have been reflected in cash on the Statement of Assets and Liabilities upon receipt or payment.
The effect of derivative instruments on the Statement of Operations is as follows:
| | | | | | | | | | | | |
| Amount of Realized Gain or (Loss) Recognized on Derivatives | |
| |
| Derivatives Not Accounted for as Hedging Instruments | | Closing and
expiration of futures
contracts | | | Swap
contracts | | | Total | |
| |
| | | |
Credit contracts | | $ | — | | | $ | (113,981) | | | $ | (113,981) | |
| | | |
Interest rate contracts | | | (743,123) | | | | — | | | | (743,123) | |
| | | | |
| | | |
Total | | $ | (743,123) | | | $ | (113,981) | | | $ | (857,104) | |
| | | | |
| | | | |
| Amount of Change in Unrealized Gain or (Loss) Recognized on Derivatives | |
| |
| Derivatives Not Accounted for as Hedging Instruments | | Futures
contracts | |
| |
| |
Interest rate contracts | | $ | 53,122 | |
7. Restricted Securities
As of December 31, 2013, investments in securities included issues that are restricted. A restricted security may have a contractual restriction on its resale and is valued under methods approved by the Board of Trustees as reflecting fair value. Securities that are restricted are marked with an applicable footnote on the Statement of Investments. Restricted securities are reported on a schedule following the Statement of Investments.
8. Pending Litigation
Since 2009, seven class action lawsuits have been pending in the U.S. District Court for the District of Colorado against OppenheimerFunds, Inc. (“OFI”), OppenheimerFunds Distributor, Inc., the Fund’s principal underwriter and distributor (the “Distributor”), and certain funds (but not including the Fund) advised by OFI Global Asset Management, Inc. and distributed by the Distributor (the “Defendant Funds”). The lawsuits also name as defendants certain officers and current and former trustees of the respective Defendant Funds. The lawsuits raise claims under federal securities law and allege, among other things, that the disclosure documents of the respective Defendant Funds contained misrepresentations and omissions and that the respective Defendant Funds’ investment policies were not followed. The plaintiffs in these actions seek unspecified damages, equitable relief and awards of attorneys’ fees and litigation expenses. The Defendant Funds’ Boards of Trustees have also engaged counsel to represent the Funds and the present and
27 OPPENHEIMER CORE BOND FUND/VA
NOTESTO FINANCIAL STATEMENTS Continued
8. Pending Litigation (Continued)
former Independent Trustees named in those suits. On August 26, 2013, the parties in six of these lawsuits executed a memorandum of understanding setting forth the terms of proposed settlements of those actions. The proposed settlements are subject to a variety of contingencies, including the execution of settlement agreements, which will require preliminary and final approval by the court. The proposed settlements do not resolve a seventh outstanding lawsuit relating to Oppenheimer California Municipal Fund.
Other class action and individual lawsuits have been filed since 2008 in various state and federal courts against OFI and certain of its affiliates by investors seeking to recover investments they allegedly lost as a result of the “Ponzi” scheme run by Bernard L. Madoff and his firm, Bernard L. Madoff Investment Securities, LLC (“BLMIS”). Plaintiffs in these suits allege that they suffered losses as a result of their investments in several funds managed by an affiliate of OFI and assert a variety of claims, including breach of fiduciary duty, fraud, negligent misrepresentation, unjust enrichment, and violation of federal and state securities laws and regulations, among others. They seek unspecified damages, equitable relief and awards of attorneys’ fees and litigation expenses. Neither the Distributor, nor any of the Oppenheimer mutual funds, their independent trustees or directors are named as defendants in these lawsuits. None of the Oppenheimer mutual funds invested in any funds or accounts managed by Madoff or BLMIS. On February 28, 2011, a stipulation of partial settlement of three groups of consolidated putative class action lawsuits relating to these matters was filed in the U.S. District Court for the Southern District of New York. On August 19, 2011, the court entered an order and final judgment approving the settlement as fair, reasonable and adequate. In September 2011, certain parties filed notices of appeal from the court’s order approving the settlement. The settlement does not resolve other outstanding lawsuits against OFI and its affiliates relating to BLMIS.
On April 16, 2010, a lawsuit was filed in New York state court against (i) OFI, (ii) an affiliate of OFI and (iii) AAArdvark IV Funding Limited (“AAArdvark IV”), an entity advised by OFI’s affiliate, in connection with investments made by the plaintiffs in AAArdvark IV. Plaintiffs allege breach of contract and common law fraud claims against the defendants and seek compensatory damages, costs and disbursements, including attorney fees. On April 11, 2013, the court granted defendants’ motion for summary judgment, dismissing plaintiffs’ fraud claim with prejudice and dismissing their contract claim without prejudice, and granted plaintiffs leave to replead their contract claim to assert a cause of action for specific performance within 30 days. On May 9, 2013, plaintiffs filed a notice of appeal from the court’s dismissal order. On January 7, 2014, the appellate court affirmed the trial court’s dismissal order. On July 15, 2011, a lawsuit was filed in New York state court against OFI, an affiliate of OFI and AAArdvark Funding Limited (“AAArdvark I”), an entity advised by OFI’s affiliate, in connection with investments made by the plaintiffs in AAArdvark I. The complaint alleges breach of contract and common law fraud claims against the defendants and seeks compensatory damages, costs and disbursements, including attorney fees. On November 9, 2011, a lawsuit was filed in New York state court against OFI, an affiliate of OFI and AAArdvark XS Funding Limited (“AAArdvark XS”), an entity advised by OFI’s affiliate, in connection with investments made by the plaintiffs in AAArdvark XS. The complaint alleged breach of contract against the defendants and sought compensatory damages, costs and disbursements, including attorney fees. On November 8, 2013, the parties filed a stipulation of discontinuance dismissing the lawsuit with prejudice.
OFI believes the lawsuits and appeals described above are without legal merit and, with the exception of actions it has settled, is defending against them vigorously. While it is premature to render any opinion as to the outcome in these lawsuits, or whether any costs that the Defendant Funds may bear in defending the suits might not be reimbursed by insurance, OFI believes that these suits should not impair the ability of OFI or the Distributor to perform their respective duties to the Fund, and that the outcome of all of the suits together should not have any material effect on the operations of any of the Oppenheimer mutual funds.
28 OPPENHEIMER CORE BOND FUND/VA
REPORTOF INDEPENDENT REGISTERED PUBLIC ACCOUNTING FIRM
The Board of Trustees and Shareholders of Oppenheimer Variable Account Funds:
We have audited the accompanying statement of assets and liabilities of Oppenheimer Core Bond Fund/VA (a separate series of Oppenheimer Variable Account Funds), including the statement of investments, as of December 31, 2013, and the related statement of operations for the year then ended, the statements of changes in net assets for each of the years in the two-year period then ended, and the financial highlights for each of the years in the five-year period then ended. These financial statements and financial highlights are the responsibility of the Fund’s management. Our responsibility is to express an opinion on these financial statements and financial highlights based on our audits.
We conducted our audits in accordance with the standards of the Public Company Accounting Oversight Board (United States). Those standards require that we plan and perform the audit to obtain reasonable assurance about whether the financial statements and financial highlights are free of material misstatement. An audit includes examining, on a test basis, evidence supporting the amounts and disclosures in the financial statements. Our procedures included confirmation of securities owned as of December 31, 2013, by correspondence with the custodian, transfer agent and brokers, or by other appropriate auditing procedures where replies from brokers were not received. An audit also includes assessing the accounting principles used and significant estimates made by management, as well as evaluating the overall financial statement presentation. We believe that our audits provide a reasonable basis for our opinion.
In our opinion, the financial statements and financial highlights referred to above present fairly, in all material respects, the financial position of Oppenheimer Core Bond Fund/VA as of December 31, 2013, the results of its operations for the year then ended, the changes in its net assets for each of the years in the two-year period then ended, and the financial highlights for each of the years in the five-year period then ended, in conformity with U.S. generally accepted accounting principles.
KPMGLLP
Denver, Colorado
February 14, 2014
29 OPPENHEIMER CORE BOND FUND/VA
FEDERAL INCOME TAX INFORMATION Unaudited
In early 2014, if applicable, shareholders of record received information regarding all dividends and distributions paid to them by the Fund during calendar year 2013.
The foregoing information is presented to assist shareholders in reporting distributions received from the Fund to the Internal Revenue Service. Because of the complexity of the federal regulations which may affect your individual tax return and the many variations in state and local tax regulations, we recommend that you consult your tax advisor for specific guidance.
30 OPPENHEIMER CORE BOND FUND/VA
BOARD APPROVAL OF THE FUND’S INVESTMENT ADVISORY AND SUB-ADVISORY AGREEMENTS Unaudited
The Fund has entered into an investment advisory agreement with OFI Global Asset Management, Inc. (“OFI Global” or the “Adviser”), a wholly-owned subsidiary of OppenheimerFunds, Inc. (“OFI” or the “Sub-Adviser”) (“OFI Global” and “OFI” together the “Managers”) and OFI Global has entered into a sub-advisory agreement with OFI whereby OFI provides investment sub-advisory services to the Fund (collectively, the “Agreements”). Each year, the Board of Trustees (the “Board”), including a majority of the independent Trustees, is required to determine whether to renew the Agreements. The Investment Company Act of 1940, as amended, requires that the Board request and evaluate, and that the Managers provide, such information as may be reasonably necessary to evaluate the terms of the Agreements. The Board employs an independent consultant to prepare a report that provides information, including comparative information that the Board requests for that purpose. In addition to in-person meetings focused on this evaluation, the Board receives information throughout the year regarding Fund services, fees, expenses and performance.
The Adviser, Sub-Adviser and the independent consultant provided information to the Board on the following factors: (i) the nature, quality and extent of the Managers’ services, (ii) the investment performance of the Fund and the Managers, (iii) the fees and expenses of the Fund, including comparative expense information, (iv) the profitability of the Managers and their affiliates, including an analysis of the cost of providing services, (v) whether economies of scale are realized as the Fund grows and whether fee levels reflect these economies of scale for Fund investors and (vi) other benefits to the Managers from their relationship with the Fund. The Board was aware that there are alternatives to retaining the Managers.
Outlined below is a summary of the principal information considered by the Board as well as the Board’s conclusions.
Nature, Quality and Extent of Services. The Board considered information about the nature, quality and extent of the services provided to the Fund and information regarding the Managers’ key personnel who provide such services. The Sub-Adviser’s duties include providing the Fund with the services of the portfolio managers and the Sub-Adviser’s investment team, who provide research, analysis and other advisory services in regard to the Fund’s investments; securities trading services; oversight of third-party service providers; monitoring compliance with applicable Fund policies and procedures and adherence to the Fund’s investment restrictions; and risk management. The Managers are responsible for providing certain administrative services to the Fund as well. Those services include providing and supervising all administrative and clerical personnel who are necessary in order to provide effective corporate administration for the Fund; compiling and maintaining records with respect to the Fund’s operations; preparing and filing reports required by the Securities and Exchange Commission; preparing periodic reports regarding the operations of the Fund for its shareholders; preparing proxy materials for shareholder meetings; and preparing the registration statements required by Federal and state securities laws for the sale of the Fund’s shares. The Managers also provide the Fund with office space, facilities and equipment.
The Board also considered the quality of the services provided and the quality of the Managers’ resources that are available to the Fund. The Board took account of the fact that the Sub-Adviser has had over fifty years of experience as an investment adviser and that its assets under management rank it among the top mutual fund managers in the United States. The Board evaluated the Sub-Adviser’s advisory, administrative, accounting, legal, compliance services and risk management, and information the Board has received regarding the experience and professional qualifications of the Managers’ key personnel and the size and functions of its staff. In its evaluation of the quality of the portfolio management services provided, the Board considered the experience of Krishna Memani and Peter Strzalkowski, the portfolio managers for the Fund, and the Sub-Adviser’s investment team and analysts. The Board members also considered the totality of their experiences with the Managers as directors or trustees of the Fund and other funds advised by the Managers. The Board considered information regarding the quality of services provided by affiliates of the Managers, which its members have become knowledgeable about in connection with the renewal of the Fund’s service agreements. The Board concluded, in light of the Managers’ experience, reputation, personnel, operations and resources that the Fund benefits from the services provided under the Agreement.
Investment Performance of the Fund, the Adviser and the Sub-Adviser. Throughout the year, the Manager provided information on the investment performance of the Fund, including comparative performance information. The Board also reviewed information, prepared by the Manager and by the independent consultant, comparing the Fund’s historical performance to relevant market indices and to the performance of other intermediate-term bond funds underlying variable insurance products. The Board considered that the Fund outperformed its performance category median during the one-year and three-year periods, although it underperformed for the five- and ten-year periods. The Board also considered the appointment of a new portfolio manager on April 1, 2009, and it considered the Manager’s assertion that the Investment Grade Fixed Income Team has been repositioning the portfolio gradually to better take advantage of changing market conditions. The Board considered the Fund’s recent improved performance in light of those changes, ranking in the first quintile of its performance category for the one- and three-year periods.
Costs of Services by the Adviser. The Board reviewed the fees paid to the Manager and the other expenses borne by the Fund. The independent consultant provided comparative data in regard to the fees and expenses of the Fund and other intermediate-term bond funds underlying variable insurance products. In reviewing the fees and expenses charged to the VA funds, the Board considered the Manager’s assertion that, because there is much greater disparity in the fees and services that may be provided by a manager to a VA fund as opposed to a retail fund, when comparing the expenses of the various VA funds to those of retail funds, it is most appropriate to focus on total expenses (rather than on the management fees). Accordingly, while the Board reviewed and considered all expenses, it focused on total expenses. The Board considered that the Fund’s total expenses were above its peer group median and category median. The Fund’s contractual management fee was higher than its peer group median and its category median. Within the total asset range of $100 million to $250 million, the Fund’s effective rate was higher than its peer group median and category median. The Board considered that the Manager has voluntarily agreed to limit the Fund’s total annual operating expenses so that those expenses, as percentages of daily net assets, will not exceed that annual rate of 0.75% for Non-Service Shares and 1.00% for Service Shares. This voluntary expense limitation may be amended or withdrawn at any time without prior notice to shareholders.
Economies of Scale and Profits Realized by the Adviser and Sub-Adviser. The Board considered information regarding the Managers’ costs in serving as the Fund’s investment adviser and sub-adviser, including the costs associated with the personnel and systems necessary to manage the Fund, and information regarding the Managers’ profitability from their relationship with the Fund. The Board reviewed whether the Managers may realize economies of scale in managing and supporting the Fund. The Board noted that the Fund currently has management fee breakpoints, which are intended to share with Fund shareholders economies of scale that may exist as the Fund’s assets grow.
31 OPPENHEIMER CORE BOND FUND/VA
BOARD APPROVAL OF THE FUND’S INVESTMENT ADVISORY AND SUB-ADVISORY AGREEMENTS Unaudited / Continued
Other Benefits to the Managers. In addition to considering the profits realized by the Managers, the Board considered information that was provided regarding the direct and indirect benefits the Managers receive as a result of their relationship with the Fund, including compensation paid to the Managers’ affiliates. The Board also considered that the Managers must be able to pay and retain experienced professional personnel at competitive rates to provide quality services to the Fund.
Conclusions. These factors were also considered by the independent Trustees meeting separately from the full Board, assisted by experienced counsel to the Fund and to the independent Trustees. Fund counsel and the independent Trustees’ counsel are independent of the Managers within the meaning and intent of the Securities and Exchange Commission Rules.
Based on its review of the information it received and its evaluations described above, the Board, including a majority of the independent Trustees, decided to continue the Agreements through August 31, 2014. In arriving at its decision, the Board did not identify any factor or factors as being more important than others, but considered all of the above information, and considered the terms and conditions of the Agreements, including the management fees, in light of all the surrounding circumstances.
32 OPPENHEIMER CORE BOND FUND/VA
PORTFOLIO PROXY VOTING POLICIES AND PROCEDURES; UPDATES TO STATEMENTS OF INVESTMENTS Unaudited
The Fund has adopted Portfolio Proxy Voting Policies and Procedures under which the Fund votes proxies relating to securities (“portfolio proxies”) held by the Fund. A description of the Fund’s Portfolio Proxy Voting Policies and Procedures is available (i) without charge, upon request, by calling the Fund toll-free at 1.800.CALL OPP (225.5677), (ii) on the Fund’s website at oppenheimerfunds.com, and (iii) on the SEC’s website at www.sec.gov. In addition, the Fund is required to file Form N-PX, with its complete proxy voting record for the 12 months ended June 30th, no later than August 31st of each year. The Fund’s voting record is available (i) without charge, upon request, by calling the Fund toll-free at 1.800.CALL OPP (225.5677), and (ii) in the Form N-PX filing on the SEC’s website at www.sec.gov.
The Fund files its complete schedule of portfolio holdings with the SEC for the first quarter and the third quarter of each fiscal year on Form N-Q. The Fund’s Form N-Q filings are available on the SEC’s website at www.sec.gov. Those forms may be reviewed and copied at the SEC’s Public Reference Room in Washington, D.C. Information on the operation of the Public Reference Room may be obtained by calling 1-800-SEC-0330.
33 OPPENHEIMER CORE BOND FUND/VA
| | |
TRUSTEES AND OFFICERS Unaudited |
| Name, Position(s) Held with the Fund, Length of Service, Year of Birth | | Principal Occupation(s) During the Past 5 Years; Other Trusteeships/Directorships Held; Number of Portfolios in the Fund Complex Currently Overseen |
| |
| INDEPENDENT TRUSTEES | | The address of each Trustee in the chart below is 6803 S. Tucson Way, Centennial, Colorado 80112-3924. Each Trustee serves for an indefinite term, or until his or her resignation, retirement, death or removal. |
| |
Sam Freedman, Chairman of the Board of Trustees (since 2013) and Trustee (since 1996) Year of Birth: 1940 | | Director of Colorado UpLIFT (charitable organization) (since September 1984). Mr. Freedman held several positions with the Sub-Adviser and with subsidiary or affiliated companies of the Sub-Adviser (until October 1994). Oversees 39 portfolios in the OppenheimerFunds complex. Mr. Freedman has served on the Boards of certain Oppenheimer funds since 1996, during which time he has become familiar with the Fund’s (and other Oppenheimer funds’) financial, accounting, regulatory and investment matters and has contributed to the Boards’ deliberations. |
| |
Edward L. Cameron, Trustee (since 1999) Year of Birth: 1938 | | Member of The Life Guard of Mount Vernon (George Washington historical site) (June 2000-June 2006); Partner of PricewaterhouseCoopers LLP (accounting firm) (July 1974-June 1999); Chairman of Price Waterhouse LLP Global Investment Management Industry Services Group (accounting firm) (July 1994-June 1998). Oversees 39 portfolios in the OppenheimerFunds complex. Mr. Cameron has served on the Boards of certain Oppenheimer funds since 1999, during which time he has become familiar with the Fund’s (and other Oppenheimer funds’) financial, accounting, regulatory and investment matters and has contributed to the Boards’ deliberations. |
| |
Jon S. Fossel, Trustee (since 1990) Year of Birth: 1942 | | Chairman of the Board (2006-December 2011) and Director (June 2002-December 2011) of UNUMProvident (insurance company); Director of Northwestern Energy Corp. (public utility corporation) (November 2004-December 2009); Director of P.R. Pharmaceuticals (October 1999-October 2003); Director of Rocky Mountain Elk Foundation (non-profit organization) (February 1998-February 2003 and February 2005-February 2007); Chairman and Director (until October 1996) and President and Chief Executive Officer (until October 1995) of the Sub-Adviser; President, Chief Executive Officer and Director of the following: Oppenheimer Acquisition Corp. (“OAC”) (parent holding company of the Sub-Adviser), Shareholders Services, Inc. and Shareholder Financial Services, Inc. (until October 1995). Oversees 39 portfolios in the OppenheimerFunds complex. Mr. Fossel has served on the Boards of certain Oppenheimer funds since 1990, during which time he has become familiar with the Fund’s (and other Oppenheimer funds’) financial, accounting, regulatory and investment matters and has contributed to the Boards’ deliberations. |
| |
Richard Grabish, Trustee (since 2012) Year of Birth: 1948 | | Formerly Senior Vice President and Assistant Director of Sales and Marketing (March 1997-December 2007), Director (March 1987-December 2007) and Manager of Private Client Services (June 1985-June 2005) of A.G. Edwards & Sons, Inc. (broker/dealer and investment firm); Chairman and Chief Executive Officer of A.G. Edwards Trust Company, FSB (March 2001-December 2007); President and Vice Chairman of A.G. Edwards Trust Company, FSB (investment adviser) (April 1987-March 2001); President of A.G. Edwards Trust Company, FSB (investment adviser) (June 2005-December 2007). Oversees 39 portfolios in the OppenheimerFunds complex. Mr. Grabish has served on the Boards of certain Oppenheimer funds since 2001, during which time he has become familiar with the Fund’s (and other Oppenheimer funds’) financial, accounting, regulatory and investment matters and has contributed to the Boards’ deliberations. |
| |
Beverly L. Hamilton, Trustee (since 2002) Year of Birth: 1946 | | Trustee of Monterey Institute for International Studies (educational organization) (since February 2000); Board Member of Middlebury College (educational organization) (December 2005-June 2011); Chairman (since 2010) of American Funds’ Emerging Markets Growth Fund, Inc. (mutual fund); Director of The California Endowment (philanthropic organization) (April 2002-April 2008); Director (February 2002-2005) and Chairman of Trustees (2006-2007) of the Community Hospital of Monterey Peninsula; Director (October 1991-2005); Vice Chairman (2006-2009) of American Funds’ Emerging Markets Growth Fund, Inc. (mutual fund); President of ARCO Investment Management Company (February 1991-April 2000); Member of the investment committees of The Rockefeller Foundation (2001-2006) and The University of Michigan (since 2000); Advisor at Credit Suisse First Boston’s Sprout venture capital unit (venture capital fund) (1994-January 2005); Trustee of MassMutual Institutional Funds (investment company) (1996-June 2004); Trustee of MML Series Investment Fund (investment company) (April 1989-June 2004); Member of the investment committee of Hartford Hospital (2000-2003); and Advisor to Unilever (Holland) pension fund (2000-2003). Oversees 39 portfolios in the OppenheimerFunds complex. Ms. Hamilton has served on the Boards of certain Oppenheimer funds since 2002, during which time she has become familiar with the Fund’s (and other Oppenheimer funds’) financial, accounting, regulatory and investment matters and has contributed to the Boards’ deliberations. |
| |
Victoria J. Herget, Trustee (since 2012) Year of Birth:1951 | | Independent Director of the First American Funds (mutual fund family) (2003-2011); former Managing Director (1993-2001), Principal (1985-1993), Vice President (1978-1985) and Assistant Vice President (1973-1978) of Zurich Scudder Investments (and its predecessor firms); Board Chair (2008-Present) and Director (2004-Present), United Educators (insurance company); Trustee (1992-2007), Chair of the Board of Trustees (1999-2007), Investment Committee Chair (1994-1999) and Investment Committee member (2007-2010) of Wellesley College; Trustee (since 2000) and Chair (since 2010), Newberry Library; Trustee, Mather LifeWays (since 2001); Trustee, BoardSource (2006-2009) and Chicago City Day School (1994-2005). Oversees 39 portfolios in the OppenheimerFunds complex. Ms. Herget has served on the Boards of certain Oppenheimer funds since 2012, during which time she has become familiar with the Fund’s (and other Oppenheimer funds’) financial, accounting, regulatory and investment matters and has contributed to the Boards’ deliberations. |
| |
Robert J. Malone, Trustee (since 2002) Year of Birth: 1944 | | Chairman of the Board (since 2012) and Director (since August 2005) of Jones International University (educational organization) (since August 2005); Chairman, Chief Executive Officer and Director of Steele Street Bank Trust (commercial banking) (since August 2003); Trustee of the Gallagher Family Foundation (non-profit organization) (since 2000); Board of Directors of Opera Colorado Foundation (non-profit organization) (2008-2012); Director of Colorado UpLIFT (charitable organization) (1986-2010); Director of Jones Knowledge, Inc. (2006-2010); Former Chairman of U.S. Bank-Colorado (subsidiary |
34 OPPENHEIMER CORE BOND FUND/VA
| | |
Robert J. Malone, Continued | | of U.S. Bancorp and formerly Colorado National Bank) (July 1996-April 1999); Director of Commercial Assets, Inc. (real estate investment trust) (1993-2000); Director of U.S. Exploration, Inc. (oil and gas exploration) (1997-February 2004); Chairman of the Board (1991-1994) and Trustee (1985-1994) of Regis University; and Chairman of the Board (1990-1991 and Trustee (1984-1999) of Young Presidents Organization. Oversees 39 portfolios in the OppenheimerFunds complex. Mr. Malone has served on the Boards of certain Oppenheimer funds since 2002, during which time he has become familiar with the Fund’s (and other Oppenheimer funds’) financial, accounting, regulatory and investment matters and has contributed to the Boards’ deliberations. |
| |
F. William Marshall, Jr., Trustee (since 2000) Year of Birth: 1942 | | Trustee Emeritus of Worcester Polytech Institute (WPI) (private university) (since 2009); Trustee of MassMutual Select Funds (formerly MassMutual Institutional Funds) (investment company) (since 1996), MML Series Investment Fund (investment company) (since 1996) and Mass Mutual Premier Funds (investment company) (since January 2012); President and Treasurer of the SIS Fund (private charitable fund) (January 1999 – March 2011); Former Trustee of WPI (1985-2008); Former Chairman of the Board (2004-2006) and Former Chairman of the Investment Committee of WPI (1994-2008); Chairman of SIS & Family Bank, F.S.B. (formerly SIS Bank) (commercial bank) (January 1999-July 1999); Executive Vice President of Peoples Heritage Financial Group, Inc. (commercial bank) (January 1999-July 1999); and Former President and Chief Executive Officer of SIS Bancorp. (1993-1999). Oversees 43 portfolios in the OppenheimerFunds complex. Mr. Marshall has served on the Boards of certain Oppenheimer funds since 2000, during which time he has become familiar with the Fund’s (and other Oppenheimer funds’) financial, accounting, regulatory and investment matters and has contributed to the Boards’ deliberations. |
| |
Karen L. Stuckey, Trustee (since 2012) Year of Birth: 1953 | | Partner (1990-2012) of PricewaterhouseCoopers LLP (held various positions 1975-1990); Emeritus Trustee (since 2006), Trustee (1992-2006) and member of Executive, Nominating and Audit Committees and Chair of Finance Committee of Lehigh University; and member, Women’s Investment Management Forum since inception. Oversees 39 portfolios in the OppenheimerFunds complex. Ms. Stuckey has served on the Boards of certain Oppenheimer funds since 2012, during which time she has become familiar with the Fund’s (and other Oppenheimer funds’) financial, accounting, regulatory and investment matters and has contributed to the Boards’ deliberations. |
| |
James D. Vaughn, Trustee (since 2012) Year of Birth: 1945 | | Retired; former managing partner (1994-2001) of Denver office of Deloitte & Touche LLP, (held various positions 1969-1993); Trustee and Chairman of the Audit Committee of Schroder Funds (2003-2012); Board member and Chairman of Audit Committee of AMG National Trust Bank (since 2005); Trustee and Investment Committee member, University of South Dakota Foundation (since 1996); Board member, Audit Committee Member and past Board Chair, Junior Achievement (since 1993); former Board member, Mile High United Way, Boys and Girls Clubs, Boy Scouts, Colorado Business Committee for the Arts, Economic Club of Colorado and Metro Denver Network. Oversees 39 portfolios in the OppenheimerFunds complex. Mr. Vaughn has served on the Boards of certain Oppenheimer funds since 2012, during which time he has become familiar with the Fund’s (and other Oppenheimer funds’) financial, accounting, regulatory and investment matters and has contributed to the Boards’ deliberations. |
|
|
| |
| INTERESTED TRUSTEE AND OFFICER | | Mr. Glavin is an “Interested Trustee” because he is affiliated with the Manager and the Sub-Adviser by virtue of his positions as an officer and director of the Manager and a director of the Sub-Adviser, and as a shareholder of the Sub-Adviser’s parent company. Both as a Trustee and as an officer, he serves for an indefinite term, or until his resignation, retirement, death or removal. Mr. Glavin’s address is Two World Financial Center, 225 Liberty Street, 11th Floor, New York, New York 10281-1008. |
| |
William F. Glavin, Jr., Trustee, President and Principal Executive Officer (since 2009) Year of Birth: 1958 | | Director, Chairman and Chief Executive Officer of the Manager (since January 2013); President of the Manager (January 2013-May 2013); Chairman of the Sub-Adviser (December 2009-December 2012); Chief Executive Officer (January 2009-December 2012) and Director of the Sub-Adviser (since January 2009); President of the Sub-Adviser (May 2009-December 2012); Management Director (since June 2009), President (since December 2009) and Chief Executive Officer (since January 2011) of Oppenheimer Acquisition Corp. (“OAC”) (the Sub-Adviser’s parent holding company); Director of Oppenheimer Real Asset Management, Inc. (since March 2010); Executive Vice President (March 2006-February 2009) and Chief Operating Officer (July 2007-February 2009) of Massachusetts Mutual Life Insurance Company (OAC’s parent company); Director (May 2004-March 2006) and Chief Operating Officer and Chief Compliance Officer (May 2004-January 2005), President (January 2005-March 2006) and Chief Executive Officer (June 2005-March 2006) of Babson Capital Management LLC; Director (March 2005-March 2006), President (May 2003-March 2006) and Chief Compliance Officer (July 2005-March 2006) of Babson Capital Securities, Inc. (a broker-dealer); President (May 2003-March 2006) of Babson Investment Company, Inc.; Director (May 2004-August 2006) of Babson Capital Europe Limited; Director (May 2004-October 2006) of Babson Capital Guernsey Limited; Director (May 2004-March 2006) of Babson Capital Management LLC; Non-Executive Director (March 2005-March 2007) of Baring Asset Management Limited; Director (February 2005-June 2006) Baring Pension Trustees Limited; Director and Treasurer (December 2003-November 2006) of Charter Oak Capital Management, Inc.; Director (May 2006-September 2006) of C.M. Benefit Insurance Company; Director (May 2008-June 2009) and Executive Vice President (June 2007-July 2009) of C.M. Life Insurance Company; President (March 2006-May 2007) of MassMutual Assignment Company; Director (January 2005-December 2006), Deputy Chairman (March 2005-December 2006) and President (February 2005-March 2005) of MassMutual Holdings (Bermuda) Limited; Director (May 2008-June 2009) and Executive Vice President (June 2007-July 2009) of MML Bay State Life Insurance Company; Chief Executive Officer and President (April 2007-January 2009) of MML Distributors, LLC; and Chairman (March 2006-December 2008) and Chief Executive Officer (May 2007-December 2008) of MML Investors Services, Inc. An officer of 90 portfolios in the OppenheimerFunds complex. |
|
|
| |
| OTHER OFFICERS OF THE FUND | | The addresses of the Officers in the chart below are as follows: for Messrs. Memani, Strzalkowski, Gabinet and Ms. Nasta, Two World Financial Center, 225 Liberty Street, New York, New York 10281-1008, for Messrs. Vandehey and Wixted. Each Officer serves for an indefinite term or until his or her resignation, retirement, death or removal. |
35 OPPENHEIMER CORE BOND FUND/VA
| | |
TRUSTEES AND OFFICERS Unaudited / Continued |
Krishna Memani, Vice President (since 2009) Year of Birth: 1960 | | President of the Sub-Adviser (since January 2013); Executive Vice President of the Manager (since January 2014) and Chief Investment Officer of the OppenheimerFunds advisory entities (since January 2014). Chief Investment Officer, Fixed Income of the Sub-Adviser (January 2013-December 2013); Head of the Investment Grade Fixed Income Team of the Sub-Adviser (March 2009-January 2014); Director of Fixed Income of the Sub-Adviser (October 2010-December 2012); Senior Vice President of the Sub-Adviser (March 2009-December 2012) and Senior Vice President of OFI Global Institutional, Inc. (April 2009-December 2012). Managing Director and Head of the U.S. and European Credit Analyst Team at Deutsche Bank Securities (June 2006-January 2009). Chief Credit Strategist at Credit Suisse Securities (August 2002-March 2006). Managing Director and Senior Portfolio Manager at Putnam Investments (September 1998-June 2002). A portfolio manager and an officer of other portfolios in the OppenheimerFunds complex. |
| |
Peter A. Strzalkowski, Vice President (since 2009) Year of Birth: 1965 | | Vice President and Senior Portfolio Manager of the Sub-Adviser (since August 2007) and co-Team Leader for the Sub-Adviser’s Investment Grade Fixed Income Team (since January 2014). A member of the Sub-Adviser’s Investment Grade Fixed Income Team (April 2009-January 2014). Managing Partner and Chief Investment Officer of Vector Capital Management, LLC, a structured products money management firm he founded, (July 2006-August 2007). Senior Portfolio Manager at Highland Capital Management, L.P. (June 2005-July 2006) and a Senior Fixed Income Portfolio Manager at Microsoft Corp. (June 2003-June 2005). Vice President and Senior Fixed Income Portfolio Manager at First Citizens Bank Trust, Capital Management Group (April 2000-June 2003) and a Vice President and Fixed Income Portfolio Manager at Centura Banks (November 1998-April 2000). A portfolio manager and officer of other portfolios in the OppenheimerFunds complex. |
| |
Arthur S. Gabinet, Secretary and Chief Legal Officer (since 2011) Year of Birth: 1958 | | Executive Vice President, Secretary and General Counsel of the Manager (since January 2013); General Counsel OFI SteelPath, Inc. (since January 2013); Executive Vice President (May 2010-December 2012) and General Counsel (since January 2011) of the Sub-Adviser; General Counsel of the Distributor (since January 2011); General Counsel of Centennial Asset Management Corporation (January 2011-December 2012); Executive Vice President (January 2011-December 2012) and General Counsel of HarbourView Asset Management Corporation (since January 2011); Assistant Secretary (since January 2011) and Director (since January 2011) of OppenheimerFunds International Ltd. and OppenheimerFunds plc; Director of Oppenheimer Real Asset Management, Inc. (January 2011-December 2012) and General Counsel (since January 2011); Executive Vice President (January 2011-December 2011) and General Counsel of Shareholder Financial Services, Inc. and Shareholder Services, Inc. (since January 2011); Executive Vice President (January 2011-December 2012) and General Counsel of OFI Private Investments Inc. (since January 2011); Vice President of OppenheimerFunds Legacy Program (January 2011-December 2011); Executive Vice President (January 2011-December 2012) and General Counsel of OFI Institutional Asset Management, Inc. (since January 2011); General Counsel, Asset Management of the Sub-Adviser (May 2010-December 2010); Principal, The Vanguard Group (November 2005-April 2010); District Administrator, U.S. Securities and Exchange Commission (January 2003-October 2005). An officer of 90 portfolios in the OppenheimerFunds complex. |
| |
Christina M. Nasta, Vice President and Chief Business Officer (since 2011) Year of Birth: 1973 | | Senior Vice President of OppenheimerFunds Distributor, Inc. (since January 2013); Senior Vice President of the Sub-Adviser (July 2010-December 2012); Vice President of the Sub-Adviser (January 2003-July 2010); Vice President of OppenheimerFunds Distributor, Inc. (January 2003-July 2010). An officer of 90 portfolios in the OppenheimerFunds complex. |
| |
Mark S. Vandehey, Vice President and Chief Compliance Officer (since 2004) Year of Birth: 1950 | | Senior Vice President and Chief Compliance Officer of the Manager (since January 2013); Chief Compliance Officer of OFI SteelPath, Inc. (since January 2013); Senior Vice President of the Sub-Adviser (March 2004-December 2012); Chief Compliance Officer of the Sub-Adviser, OppenheimerFunds Distributor, Inc., OFI Trust Company, OFI Institutional Asset Management, Inc., Oppenheimer Real Asset Management, Inc., OFI Private Investments, Inc., Harborview Asset Management Corporation, Trinity Investment Management Corporation, and Shareholder Services, Inc. (since March 2004); Vice President of OppenheimerFunds Distributor, Inc., Centennial Asset Management Corporation and Shareholder Services, Inc. (June 1983-December 2012). An officer of 90 portfolios in the OppenheimerFunds complex. |
| |
Brian W. Wixted, Treasurer and Principal Financial & Accounting Officer (since 1999) Year of Birth: 1959 | | Senior Vice President of the Manager (since January 2013); Treasurer of the Sub-Adviser, HarbourView Asset Management Corporation, Shareholder Financial Services, Inc., Shareholder Services, Inc., and Oppenheimer Real Asset Management, Inc. (March 1999-June 2008), OFI Private Investments, Inc. (March 2000-June 2008), OppenheimerFunds International Ltd. and OppenheimerFunds plc (since May 2000), OFI Institutional Asset Management, Inc. (November 2000-June 2008), and OppenheimerFunds Legacy Program (charitable trust program established by the Sub-Adviser) (June 2003-December 2011); Treasurer and Chief Financial Officer of OFI Trust Company (since May 2000); Assistant Treasurer of Oppenheimer Acquisition Corporation (March 1999-June 2008). An officer of 90 portfolios in the OppenheimerFunds complex. |
The Fund’s Statement of Additional Information contains additional information about the Fund’s Trustees and Officers and is available without charge, upon request, by calling 1.800.988.8287.
36 OPPENHEIMER CORE BOND FUND/VA
|
OPPENHEIMER CORE BOND FUND/VA |
A Series of Oppenheimer Variable Account Funds
| | |
| Manager | | OFI Global Asset Management, Inc. |
| |
| Sub-Adviser | | OppenheimerFunds, Inc. |
| |
| Distributor | | OppenheimerFunds Distributor, Inc. |
| |
Transfer and Shareholder Servicing Agent | | OFI Global Asset Management, Inc. |
| |
| Sub-Transfer Agent | | Shareholder Services, Inc. DBA OppenheimerFunds Services |
| |
Independent Registered Public Accounting Firm | | KPMG LLP |
| |
| Counsel | | K&L Gates LLP |
| |
| | Before investing, investors should carefully consider a fund’s investment objectives, risks, charges and expenses. Fund prospectuses and summary prospectuses contain this and other information about the funds, and may be obtained by asking your financial advisor, or calling us at 1.800.988.8287. Read prospectuses and summary prospectuses carefully before investing. |
© 2014 OppenheimerFunds, Inc. All rights reserved. Oppenheimer funds are distributed by OppenheimerFunds Distributor, Inc.

December 31, 2013
| | | | |
| | | Oppenheimer Global Fund/VA* A Series of Oppenheimer Variable Account Funds | | Annual Report |
| | |
| | ANNUAL REPORT Listing of Top Holdings Fund Performance Discussion Financial Statements *Prior to 4/30/13, the Fund’s name was Oppenheimer Global Securities Fund/VA |

Portfolio Manager: Rajeev Bhaman, CFA
Average Annual Total Returns
For the Periods Ended 12/31/13
| | | | | | |
| | | 1-Year | | 5-Year | | 10-Year |
Non-Service Shares | | 27.31% | | 18.07% | | 8.87% |
Service Shares | | 26.99% | | 17.77% | | 8.60% |
Class 3 Shares | | 27.34% | | 18.07% | | 8.87% |
| | | |
| | | 1-Year | | 5-Year | | Since
Inception
(5/3/04) |
Class 4 Shares | | 27.01% | | 17.78% | | 8.68% |
Performance data quoted represents past performance, which does not guarantee future results. The investment return and principal value of an investment in the Fund will fluctuate so that an investor’s shares, when redeemed, may be worth more or less than their original cost. Current performance may be lower or higher than the performance quoted. For performance data current to the most recent month end, call us at 1.800.988.8287. The Fund’s total returns should not be expected to be the same as the returns of other funds, whether or not both funds have the same portfolio managers and/or similar names. The Fund’s total returns include changes in share price and reinvested distributions but do not include the charges associated with the separate account products that offer this Fund. Such performance would have been lower if such charges were taken into account.
TOP TEN COMMON STOCK HOLDINGS
| | |
Telefonaktiebolaget LM Ericsson, Cl. B | | 2.8% |
Google, Inc., Cl. A | | 2.8 |
Airbus Group NV | | 2.5 |
SAP AG | | 2.2 |
Walt Disney Co. (The) | | 2.2 |
WellPoint, Inc. | | 2.2 |
McGraw Hill Financial, Inc. | | 2.1 |
UBS AG | | 2.0 |
eBay, Inc. | | 2.0 |
Bayerische Motoren Werke (BMW) AG, Preference | | 2.0 |
Portfolio holdings and allocations are subject to change. Percentages are as of December 31, 2013, and are based on net assets. For more current Fund holdings, please visit oppenheimerfunds.com.
REGIONAL ALLOCATION
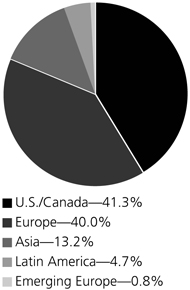
Portfolio holdings and allocations are subject to change. Percentages are as of December 31, 2013, and are based on the total market value of investments.
2 OPPENHEIMER GLOBAL FUND/VA
Fund Performance Discussion
The Fund’s Non-Service shares produced a total return of 27.31% during the one-year reporting period ended December 31, 2013, outperforming the MSCI All Country World Index (the “Index’), which returned 22.80% over the same period. Every sector made a positive contribution to the Fund’s absolute performance; meaningful contributions came from holdings in the information technology, health care, industrials and consumer discretionary sectors. The Fund also outperformed the MSCI World Index, which returned 26.68%. The Fund changed its benchmark from the MSCI World Index to the MSCI All Country World Index, which it believes is a more appropriate measure of the Fund’s opportunity set.
MARKET OVERVIEW
Global equities, especially those in the developed markets, delivered strong performance in 2013. Accommodative monetary policies on the part of central banks in the U.S., Europe and Japan, combined with supportive equity valuations relative to bonds, have been instrumental in this performance. Signs that the world’s largest economy, the U.S., was on the mend, demonstrated by rising house prices, also helped sentiment towards stocks. Mid-year, comments from the Federal Reserve (the “Fed”) suggesting that the aggressive quantitative easing (“QE”) policy would be “tapered” in the foreseeable future, led to significant sell-offs in both stocks and bonds. However, market conditions generally stabilized over the summer of 2013. While the Fed refrained from reducing its monthly bond purchases in September, in December, the Central Bank announced that it would reduce its monthly bond purchases by $10 billion, from $85 billion to $75 billion, starting in January 2014. The Fed also announced that it would continue to hold short-term interest rates at very low levels until unemployment in the United States subsided below 6.5%. This was lower than its earlier 7% target. Emerging markets equities had mixed results, with inflation concerns in a variety of markets, slower-than-expected growth and policy orientations toward a more redistributive stance hurting performance. A further recognition that emerging markets have greater structural volatility than the developed world was evidenced in a reduction in price-earnings ratios.
Many concerns still abound, as they always do. Worries around Europe, the fragility of the recovery in the U.S., the potential success or lack thereof of Prime Minister Shinzo Abe’s stimulus policies in Japan (commonly referred to as Abenomics), and a permanent slowdown in China’s growth are all top of mind currently. Our focus remains on the long term. While temporary perturbations in currency markets or asset markets may lead others to reconsider their investment stances, we remain solidly concentrated on the characteristics and trends that we believe allow our companies to thrive in a myriad of environments. As long as the economics of their businesses are robust and the price we are paying for them undervalues current earnings and significantly discounts future prospects, we are undisturbed.
TOP INDIVIDUAL CONTRIBUTORS
The top contributors to performance this period were Airbus Group NV, Google, Inc., The Walt Disney Co. and WellPoint, Inc. Airbus Group was formerly known as EADS, European Aeronautic Defence & Space Co. In July, the company changed its name to Airbus, which is also its main and by far most profitable product. The market for larger airplanes above 150 seats is a duopoly comprising Boeing and Airbus. Persistently high fuel prices combined with the increase in travel demand from the emerging markets makes for a good environment for growth in new, more fuel efficient, aircraft sales. Airbus has been very successful in driving orders for its new-engined A-320/1 NEO aircraft and its larger A-350 aircraft. In addition, management moved to meaningfully reduce exposure to the defense sector, announcing that it will be closing defense equipment production facilities and retiring and reassigning staff to the more profitable civilian business. The market reacted favorably to this strategy.
Google is the world’s most prevalent Internet search engine. When the company announced third-quarter earnings, investors reacted very positively, sending the stock higher. Revenue growth was strong, volumes increased and margins widened. Google continues to benefit from its market dominance in search and continues to explore new applications.
Walt Disney produces movies, television programs, musical recordings, books, magazines, and merchandise for entertainment and education. It also operates distribution channels such as television networks, theme parks, hotels, cruise lines, retail stores and classrooms. In our opinion, this company has no peer. It has unique, iconic intellectual property assets, many channels through which to monetize them and high optionality potential to create more of both. The company’s major investments in a new cruise ship and multiple amusement park upgrades in 2012 have started to pay off in 2013. In addition, the stock performed well as investors focused on the value of content in the broadcast and internet segments of the consumer discretionary sector.
WellPoint is a North American health insurance company. The early concern that the Patient Protection and Affordable Care Act (also known as “Obamacare”) would supplant the private insurance market has not come to pass. Moreover, in a consolidating industry, WellPoint’s scale and cost advantage we believe should enable it to be one of the few survivors. Buying power is ever more important given the passing of Obamacare. And, with baby boomers entering the age of 65 and over, we believe WellPoint’s revenues should increase, as that demographic has higher premiums.
3 OPPENHEIMER GLOBAL FUND/VA
TOP INDIVIDUAL DETRACTORS
The most significant detractors from performance this period were Fusion-io, Inc., DLF Ltd. and Technip SA. Fusion-io produces flash-enabled server accelerator cards, which allow servers to better process information in real-time. The company also has a unique software portfolio that may obviate the traditional disk array model for storage. The stock experienced volatility due partly to a management transition. We believe that the data storage market will increasingly move toward solid state technology and that Fusion-io’s intellectual property in the area is a competitive advantage. DLF is the largest and highest-quality real estate developer in the National Capital Region (NCR) of India. Tightening monetary policy and the weaker Indian Rupee have served to hurt near-term real estate demand. Over the longer term, demand for housing outstrips supply by a long way, given the various restrictions and hurdles to property development in the area. DLF’s assets are unmatched in location and quality and they are a preferred developer at the high end in the Delhi area. We believe that this makes for an attractive business that is now available at an even better price.
Technip is a niche supplier of critical parts and services to the oil and gas industry. It is one of the three world leaders in underwater construction of oil and gas production facilities. It is also the world’s largest manufacturer of flexible pipe and the world leader in the liquefaction of natural gas. During the reporting period, Technip reduced margin guidance for its subsea segment for 2014. In addition, one of its two major competitors in the subsea construction field announced disappointing earnings on the back of customer disputes. Both announcements affected Technip’s share price negatively. In our opinion, Technip is the best-in-class supplier of critical niche services to key areas of the oil and gas industry and we believe it is poised to benefit from the world’s continuing demand for energy.
STRATEGY & OUTLOOK
Regardless of whether we are in a fast or a slow growth world, we believe the companies in the Fund have the potential to grow above the general rate of the economies in which they operate by virtue of the secular currents driving them and their advantages globally. We have a long-term investment horizon and build the portfolio from the bottom up, focusing on businesses advantaged by long-term trends. We invest in companies that we believe are capable of producing solid and sustainable growth through the business cycle, that have made strong returns on invested capital, and that demonstrate good cash flow generation characteristics. We are patient investors and we aim to wait for those companies to be out of favor so they are reasonably priced when we buy.
As we enter 2014, most developed market equity valuations look reasonable to us, despite their recent strong performance, and emerging market valuations are becoming more so. There is still a significant amount of money sitting in bank accounts throughout the world. Developed equity markets may continue to benefit from the net inflows that began last year. Emerging equity markets may resume their recovery that began in the middle of last year. Alternatively, profit taking and risk aversion could affect markets negatively.
We simply cannot predict investor sentiment and market movements. That is why we focus on bottom-up, long-term stock selection. Our experience leads us to believe that longer-term outperformers will continue to be high quality companies within industries that are being driven by secular growth trends and that have the franchise strength, dominant market position and financial flexibility to profit from those growth opportunities. These companies also tend to have management commitment to apply those profits to the benefit of shareholders.
Investors should consider the Fund’s investment objective, risks, charges and expenses carefully before investing. The Fund’s prospectus and summary prospectus contain this and other information about the Fund, and may be obtained by asking your financial advisor or calling us at 1.800.988.8287. Read prospectuses and summary prospectuses carefully before investing.
Total returns include changes in share price and reinvestment of dividends and capital gains distributions in a hypothetical investment for the periods shown.
The Fund’s investment strategy and focus can change over time. The mention of specific fund holdings does not constitute a recommendation by OppenheimerFunds, Inc. or its affiliates.
Shares of Oppenheimer funds are not deposits or obligations of any bank, are not guaranteed by any bank, are not insured by the FDIC or any other agency, and involve investment risks, including the possible loss of the principal amount invested.
Comparing the Fund’s Performance to the Market. The graphs that follow show the performance of a hypothetical $10,000 investment in each share class of the Fund held until December 31, 2013. In the case of Non-Service shares, Service shares and Class 3 shares, performance is measured over a ten-fiscal-year period. In the case of Class 4 shares, performance is measured from inception of the class on May 3, 2004. Performance information does not reflect charges that apply to separate accounts investing in the Fund. If these charges were taken into account, performance would be lower. The graphs assume that all dividends and capital gains distributions were reinvested in additional shares.
4 OPPENHEIMER GLOBAL FUND/VA
The Fund’s performance is compared to the performance of the MSCI All Country World Index, a free float-adjusted market capitalization weighted index that is designed to measure the equity market performance of developed and emerging markets and the MSCI World Index, an index of issuers listed on the stock exchanges of foreign countries and the United States. It is widely recognized as a measure of global stock market performance. The Fund has changed its benchmark from the MSCI World Index to the MSCI All Country World Index, which it believes is a more appropriate measure of the Fund’s performance. Indices are unmanaged and cannot be purchased directly by investors. Index performance includes reinvestment of income, but does not reflect transaction costs, fees, expenses or taxes. Index performance is shown for illustrative purposes only as a benchmark for the Fund’s performance, and does not predict or depict performance of the Fund. The Fund’s performance reflects the effects of the Fund’s business and operating expenses.


5 OPPENHEIMER GLOBAL FUND/VA
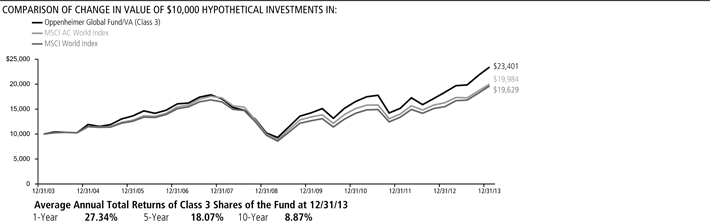
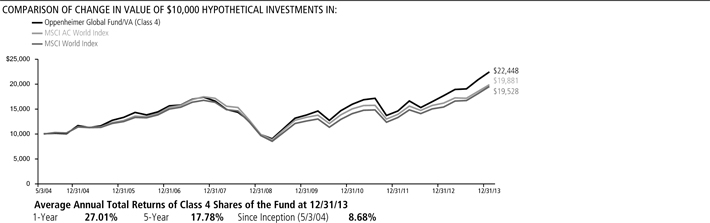
Performance data quoted represents past performance, which does not guarantee future results. The investment return and principal value of an investment in the Fund will fluctuate so that an investor’s shares, when redeemed, may be worth more or less than their original cost. Current performance may be lower or higher than the performance quoted. For performance data current to the most recent month end, call us at 1.800.988.8287. The Fund’s total returns should not be expected to be the same as the returns of other funds, whether or not both funds have the same portfolio managers and/or similar names. The Fund’s total returns include changes in share price and reinvested distributions but do not include the charges associated with the separate account products that offer this Fund. Such performance would have been lower if such charges were taken into account.
6 OPPENHEIMER GLOBAL FUND/VA
Fund Expenses
Fund Expenses. As a shareholder of the Fund, you incur two types of costs: (1) transaction costs and (2) ongoing costs, including management fees; distribution and service fees; and other Fund expenses. These examples are intended to help you understand your ongoing costs (in dollars) of investing in the Fund and to compare these costs with the ongoing costs of investing in other mutual funds.
The examples are based on an investment of $1,000.00 invested at the beginning of the period and held for the entire 6-month period ended December 31, 2013.
Actual Expenses. The first section of the table provides information about actual account values and actual expenses. You may use the information in this section for the class of shares you hold, together with the amount you invested, to estimate the expense that you paid over the period. Simply divide your account value by $1,000.00 (for example, an $8,600.00 account value divided by $1,000.00 = 8.60), then multiply the result by the number in the first section under the heading entitled “Expenses Paid During Period” to estimate the expenses you paid on your account during this period.
Hypothetical Example for Comparison Purposes.
The second section of the table provides information about hypothetical account values and hypothetical expenses based on the Fund’s actual expense ratio for each class of shares, and an assumed rate of return of 5% per year for each class before expenses, which is not the actual return. The hypothetical account values and expenses may not be used to estimate the actual ending account balance or expenses you paid for the period. You may use this information to compare the ongoing costs of investing in the Fund and other funds. To do so, compare this 5% hypothetical example for the class of shares you hold with the 5% hypothetical examples that appear in the shareholder reports of the other funds.
Please note that the expenses shown in the table are meant to highlight your ongoing costs only and do not reflect any charges associated with the separate accounts that offer this Fund. Therefore, the “hypothetical” lines of the table are useful in comparing ongoing costs only, and will not help you determine the relative total costs of owning different funds. In addition, if these separate account charges were included your costs would have been higher.
| | | | | | | | | | | | |
| Actual | | Beginning
Account
Value
July 1, 2013 | | | Ending
Account
Value
December 31, 2013 | | | Expenses
Paid During
6 Months Ended
December 31, 2013 | |
Non-Service shares | | | $ 1,000.00 | | | | $ 1,179.20 | | | | $ 4.24 | |
Service shares | | | 1,000.00 | | | | 1,177.50 | | | | 5.67 | |
Class 3 shares | | | 1,000.00 | | | | 1,179.10 | | | | 4.24 | |
Class 4 shares | | | 1,000.00 | | | | 1,178.00 | | | | 5.67 | |
| | | |
Hypothetical (5% return before expenses) | | | | | | | | | |
Non-Service shares | | | 1,000.00 | | | | 1,021.32 | | | | 3.93 | |
Service shares | | | 1,000.00 | | | | 1,020.01 | | | | 5.26 | |
Class 3 shares | | | 1,000.00 | | | | 1,021.32 | | | | 3.93 | |
Class 4 shares | | | 1,000.00 | | | | 1,020.01 | | | | 5.26 | |
Expenses are equal to the Fund’s annualized expense ratio for that class, multiplied by the average account value over the period, multiplied by 184/365 (to reflect the one-half year period). Those annualized expense ratios, excluding indirect expenses from affiliated funds, based on the 6-month period ended December 31, 2013 are as follows:
| | | | | | | | | | |
| Class | | Expense Ratios | | |
Non-Service shares | | | | 0.77 | % | | |
Service shares | | | | 1.03 | | | |
Class 3 shares | | | | 0.77 | | | |
Class 4 shares | | | | 1.03 | | | |
The expense ratios reflect contractual waivers and/or reimbursements of expenses by the Fund’s Manager. Some of these undertakings may be modified or terminated at any time, unless approved by the Board of Trustees. The “Financial Highlights” tables in the Fund’s financial statements, included in this report, also show the gross expense ratios, without such waivers or reimbursements and reduction to custodian expenses, if applicable.
7 OPPENHEIMER GLOBAL FUND/VA
STATEMENTOF INVESTMENTS December 31, 2013
| | | | | | | | | | |
| | | Shares | | | Value | | | |
| | | |
Common Stocks—99.7% | | | | | | | |
| | | |
Consumer Discretionary—15.0% | | | | | | | |
| | | |
Automobiles—2.0% | | | | | | | |
| | | |
| Bayerische Motoren Werke (BMW) AG, Preference | | | 663,467 | | | | $ 56,682,723 | | | |
| | | |
Hotels, Restaurants & Leisure—1.7% | | | | | | | |
| | | |
| Gtech SpA | | | 414,908 | | | | 12,655,956 | | | |
| | | |
| McDonald’s Corp. | | | 389,510 | | | | 37,794,155 | | | |
| | | | | | | | | | |
| | | | | | | 50,450,111 | | | |
| | | |
Media—3.6% | | | | | | | |
| | | |
| Grupo Televisa SAB, Sponsored ADR | | | 803,715 | | | | 24,320,416 | | | |
| | | |
| Walt Disney Co. (The) | | | 823,230 | | | | 62,894,772 | | | |
| | | |
| Zee Entertainment Enterprises Ltd. | | | 3,842,836 | | | | 17,246,859 | | | |
| | | | | | | | | | |
| | | | | | | 104,462,047 | | | |
| | | |
Specialty Retail—3.2% | | | | | | | |
| | | |
| Industria de Diseno Textil SA (Inditex) | | | 323,281 | | | | 53,493,331 | | | |
| | | |
| Tiffany & Co. | | | 442,870 | | | | 41,089,479 | | | |
| | | | | | | | | | |
| | | | | | | 94,582,810 | | | |
| | | |
Textiles, Apparel & Luxury Goods—4.5% | | | | | | | |
| | | |
| Brunello Cucinelli SpA | | | 86,334 | | | | 3,077,865 | | | |
| | | |
| Kering | | | 228,080 | | | | 48,234,957 | | | |
| | | |
| LVMH Moet Hennessy Louis Vuitton SA | | | 290,610 | | | | 53,199,364 | | | |
| | | |
| Tod’s SpA | | | 154,180 | | | | 25,740,148 | | | |
| | | | | | | | | | |
| | | | | | | 130,252,334 | | | |
| | | |
Consumer Staples—6.1% | | | | | | | |
| | | |
Beverages—1.7% | | | | | | | |
| | | |
| AMBEV SA, ADR | | | 2,761,375 | | | | 20,296,106 | | | |
| | | |
| Fomento Economico Mexicano SAB de CV, Sponsored ADR | | | 303,335 | | | | 29,687,396 | | | |
| | | | | | | | | | |
| | | | | | | 49,983,502 | | | |
| | | |
Food Products—2.6% | | | | | | | |
| | | |
| Nestle SA | | | 424,630 | | | | 31,171,216 | | | |
| | | |
| Unilever plc | | | 1,069,673 | | | | 43,876,137 | | | |
| | | | | | | | | | |
| | | | | | | 75,047,353 | | | |
| | | |
Household Products—1.8% | | | | | | | |
| | | |
| Colgate-Palmolive Co. | | | 804,540 | | | | 52,464,053 | | | |
| | | |
Energy—3.1% | | | | | | | |
| | | |
Energy Equipment & Services—2.3% | | | | | | | |
| | | |
| Technip SA | | | 453,350 | | | | 43,666,388 | | | |
| | | |
| Transocean Ltd. | | | 444,282 | | | | 21,956,416 | | | |
| | | | | | | | | | |
| | | | | | | 65,622,804 | | | |
| | | |
Oil, Gas & Consumable Fuels—0.8% | | | | | | | |
| | | |
| Repsol SA | | | 920,443 | | | | 23,256,105 | | | |
| | | |
Financials—21.1% | | | | | | | |
| | | |
Capital Markets—5.6% | | | | | | | |
| | | |
| Credit Suisse Group AG1 | | | 913,618 | | | | 28,049,766 | | | |
| | | |
| Deutsche Bank AG | | | 917,541 | | | | 43,779,234 | | | |
| | | |
| Goldman Sachs Group, Inc. (The) | | | 177,900 | | | | 31,534,554 | | | |
| | | |
| UBS AG1 | | | 3,059,714 | | | | 58,288,534 | | | |
| | | | | | | | | | |
| | | | | | | 161,652,088 | | | |
| | | |
Commercial Banks—5.1% | | | | | | | |
| | | |
| Banco Bilbao Vizcaya Argentaria SA | | | 3,135,476 | | | | 38,849,777 | | | |
| | | |
| ICICI Bank Ltd., Sponsored ADR | | | 932,300 | | | | 34,653,591 | | | |
| | | |
| Itau Unibanco Holding SA, Preference, ADR | | | 1,676,149 | | | | 22,745,342 | | | |
| | | |
| Societe Generale | | | 382,679 | | | | 22,347,496 | | | |
| | | |
| Sumitomo Mitsui Financial Group, Inc. | | | 580,900 | | | | 29,998,558 | | | |
| | | | | | | | | | |
| | | | | | | 148,594,764 | | | |
| | | |
Diversified Financial Services—4.4% | | | | | | | |
| | | |
| BM&FBovespa SA | | | 3,861,000 | | | | 18,121,874 | | | |
| | | |
| Citigroup, Inc. | | | 643,020 | | | | 33,507,772 | | | |
| | | |
| McGraw Hill Financial, Inc. | | | 767,010 | | | | 59,980,182 | | | |
| | | |
| Moscow Exchange (The) | | | 7,137,746 | | | | 14,105,785 | | | |
| | | | | | | | | | |
| | | | | | | 125,715,613 | | | |
| | | |
Insurance—5.3% | | | | | | | |
| | | |
| Allianz SE | | | 281,142 | | | | 50,429,453 | | | |
| | | |
| Dai-ichi Life Insurance Co. Ltd. (The) | | | 2,017,000 | | | | 33,806,074 | | | |
| | | |
| Fidelity National Financial, Inc., Cl. A | | | 639,750 | | | | 20,759,888 | | | |
| | | |
| Prudential plc | | | 2,249,677 | | | | 50,350,081 | | | |
| | | | | | | | | | |
| | | | | | | 155,345,496 | | | |
| | | |
Real Estate Management & Development—0.7% | | | |
| | | |
| DLF Ltd. | | | 7,721,050 | | | | 20,978,393 | | | |
| | | | | | | | |
| | | Shares | | | Value | |
| |
Health Care—13.8% | | | | | |
| |
Biotechnology—4.1% | | | | | |
| |
| Biogen Idec, Inc.1 | | | 56,830 | | | | $ 15,898,192 | |
| |
| Celldex Therapeutics, Inc.1 | | | 436,470 | | | | 10,566,939 | |
| |
| Gilead Sciences, Inc.1 | | | 486,290 | | | | 36,544,694 | |
| |
| Medivation, Inc.1 | | | 136,310 | | | | 8,699,304 | |
| |
| Theravance, Inc.1 | | | 564,840 | | | | 20,136,546 | |
| |
| Vertex Pharmaceuticals, Inc.1 | | | 355,380 | | | | 26,404,734 | |
| | | | | | | | |
| | | | | | | 118,250,409 | |
| |
Health Care Equipment & Supplies—1.6% | | | | | |
| |
| St. Jude Medical, Inc. | | | 273,690 | | | | 16,955,096 | |
| |
| Zimmer Holdings, Inc. | | | 314,890 | | | | 29,344,599 | |
| | | | | | | | |
| | | | | | | 46,299,695 | |
| |
Health Care Providers & Services—3.8% | | | | | |
| |
| Aetna, Inc. | | | 672,010 | | | | 46,093,166 | |
| |
| WellPoint, Inc. | | | 677,725 | | | | 62,615,013 | |
| | | | | | | | |
| | | | | | | 108,708,179 | |
| |
Pharmaceuticals—4.3% | | | | | |
| |
| Allergan, Inc. | | | 193,640 | | | | 21,509,531 | |
| |
| Bayer AG | | | 321,490 | | | | 45,102,934 | |
| |
| Roche Holding AG | | | 119,563 | | | | 33,515,537 | |
| |
| Shire plc | | | 503,540 | | | | 23,727,668 | |
| | | | | | | | |
| | | | | | | 123,855,670 | |
| |
Industrials—12.7% | | | | | |
| |
Aerospace & Defense—3.3% | | | | | |
| |
| Airbus Group NV | | | 955,120 | | | | 73,618,683 | |
| |
| Embraer SA, ADR | | | 765,743 | | | | 24,641,610 | |
| | | | | | | | |
| | | | | | | 98,260,293 | |
| |
Air Freight & Couriers—1.1% | | | | | |
| |
| United Parcel Service, Inc., Cl. B | | | 318,520 | | | | 33,470,082 | |
| |
Building Products—1.7% | | | | | |
| |
| Assa Abloy AB, Cl. B | | | 952,026 | | | | 50,473,673 | |
| |
Construction & Engineering—0.4% | | | | | |
| |
| FLSmidth & Co. AS | | | 235,833 | | | | 12,930,686 | |
| |
Electrical Equipment—2.6% | | | | | |
| |
| Emerson Electric Co. | | | 406,680 | | | | 28,540,802 | |
| |
| Nidec Corp. | | | 284,700 | | | | 27,919,823 | |
| |
| Prysmian SpA | | | 654,711 | | | | 16,881,004 | |
| | | | | | | | |
| | | | | | | 73,341,629 | |
| |
Industrial Conglomerates—2.9% | | | | | |
| |
| 3M Co. | | | 291,030 | | | | 40,816,958 | |
| |
| Siemens AG | | | 318,330 | | | | 43,494,687 | |
| | | | | | | | |
| | | | | | | 84,311,645 | |
| |
Machinery—0.7% | | | | | |
| |
| FANUC Corp. | | | 109,800 | | | | 20,134,749 | |
| |
Information Technology—24.8% | | | | | |
| |
Communications Equipment—3.6% | | | | | |
| |
| Juniper Networks, Inc.1 | | | 1,060,920 | | | | 23,944,964 | |
| |
| Telefonaktiebolaget LM Ericsson, Cl. B | | | 6,597,591 | | | | 80,791,957 | |
| | | | | | | | |
| | | | | | | 104,736,921 | |
| |
Computers & Peripherals—0.3% | | | | | |
| |
| Fusion-io, Inc.1 | | | 1,040,580 | | | | 9,271,568 | |
| |
Electronic Equipment, Instruments, & Components—3.8% | |
| |
| Keyence Corp. | | | 102,311 | | | | 43,814,941 | |
| |
| Kyocera Corp. | | | 406,600 | | | | 20,338,019 | |
| |
| Murata Manufacturing Co. Ltd. | | | 516,200 | | | | 45,888,130 | |
| | | | | | | | |
| | | | | | | 110,041,090 | |
| |
Internet Software & Services—6.0% | |
| |
| eBay, Inc.1 | | | 1,043,090 | | | | 57,255,210 | |
| |
| Facebook, Inc., Cl. A1 | | | 625,640 | | | | 34,197,482 | |
| |
| Google, Inc., Cl. A1 | | | 71,350 | | | | 79,962,659 | |
| | | | | | | | |
| | | | | | | 171,415,351 | |
| |
IT Services—0.5% | | | | | |
| |
| Infosys Ltd. | | | 278,424 | | | | 15,693,047 | |
| |
Semiconductors & Semiconductor Equipment—3.8% | |
| |
| Altera Corp. | | | 1,387,160 | | | | 45,124,315 | |
| |
| Maxim Integrated Products, Inc. | | | 1,337,755 | | | | 37,336,742 | |
| |
| Taiwan Semiconductor Manufacturing Co. Ltd. | | | 7,275,184 | | | | 25,634,384 | |
| | | | | | | | |
| | | | | | | 108,095,441 | |
8 OPPENHEIMER GLOBAL FUND/VA
| | | | | | | | | | |
| | | Shares | | | Value | | | |
| | | |
Software—6.8% | | | | | | | |
| | | |
| Adobe Systems, Inc.1 | | | 833,573 | | | | $ 49,914,351 | | | |
| | | |
| Intuit, Inc. | | | 605,560 | | | | 46,216,339 | | | |
| | | |
| Microsoft Corp. | | | 1,041,100 | | | | 38,968,373 | | | |
| | | |
| SAP AG | | | 740,999 | | | | 63,533,326 | | | |
| | | | | | | | | | |
| | | | | | | 198,632,389 | | | |
| | | |
Materials—1.3% | | | | | | | |
| | | |
Chemicals—1.0% | | | | | | | |
| | | |
| Linde AG | | | 135,996 | | | | 28,482,632 | | | |
| | | |
Metals & Mining—0.3% | | | | | | | |
| | | |
| Alrosa AO | | | 8,242,506 | | | | 8,791,399 | | | |
| | | |
Telecommunication Services—1.6% | | | |
| | | |
| Wireless Telecommunication Services—1.6% | | | |
| | | |
| KDDI Corp. | | | 743,400 | | | | 45,848,871 | | | |
| | | |
Utilities—0.2% | | | | | | | |
| | | |
Electric Utilities—0.2% | | | | | | | |
| | | |
Fortum OYJ | | | 254,767 | | | | 5,832,472 | | | |
| | | | | | | | | | |
| Total Common Stocks (Cost $1,560,592,108) | | | | | | | 2,891,968,087 | | | |
| | | | | | | | |
| | | Units | | | Value | |
| |
Rights, Warrants and Certificates—0.0% | |
| |
| Repsol SA Rts., Strike Price 0.0001EUR, Exp. 1/9/141 (Cost $–) | | | 920,443 | | | $ | 628,062 | |
| | |
| | | Shares | | | | |
| |
Investment Company—0.3% | | | | | |
| |
| Oppenheimer Institutional Money Market Fund, Cl. E, 0.09%2,3 (Cost $9,026,377) | | | 9,026,377 | | | | 9,026,377 | |
| |
| Total Investments, at Value (Cost $1,569,618,485) | | | 100.0% | | | | 2,901,622,526 | |
| | | | |
| Liabilities in Excess of Other Assets | | | 0.0 | | | | (103,470) | |
| | | | |
Net Assets | | | 100.0% | | | $ | 2,901,519,056 | |
| | | | |
Footnotes to Statement of Investments
Strike price is reported in U.S. Dollars, except for those denoted in the following currency:
EUR European Dollar
1. Non-income producing security.
2. Is or was an affiliate, as defined in the Investment Company Act of 1940, at or during the period ended December 31, 2013, by virtue of the Fund owning at least 5% of the voting securities of the issuer or as a result of the Fund and the issuer having the same investment adviser. Transactions during the period in which the issuer was an affiliate are as follows:
| | | | | | | | | | | | | | | | |
| | | Shares
December 31, 2012 | | | Gross
Additions | | | Gross Reductions | | | Shares
December 31, 2013 | |
| |
| Oppenheimer Institutional Money Market Fund, Cl. E | | | 30,612,139 | | | | 303,791,242 | | | | 325,377,004 | | | | 9,026,377 | |
| | | | |
| | | | | | | | | Value | | | Income | |
| |
| Oppenheimer Institutional Money Market Fund, Cl. E | | | | | | | | | | | $ 9,026,377 | | | | $ 14,612 | |
3. Rate shown is the 7-day yield as of December 31, 2013.
Distribution of investments representing geographic holdings, as a percentage of total investments at value, is as follows:
| | | | | | | | |
| Geographic Holdings | | Value | | | Percent | |
| |
United States | | $ | 1,190,795,307 | | | | 41.3% | |
Germany | | | 331,504,989 | | | | 11.4 | |
Japan | | | 267,749,165 | | | | 9.3 | |
France | | | 167,448,205 | | | | 5.8 | |
Switzerland | | | 151,025,053 | | | | 5.3 | |
Sweden | | | 131,265,630 | | | | 4.5 | |
Spain | | | 116,227,275 | | | | 3.9 | |
United Kingdom | | | 94,226,218 | | | | 3.2 | |
India | | | 88,571,890 | | | | 3.0 | |
Brazil | | | 85,804,932 | | | | 2.9 | |
Netherlands | | | 73,618,683 | | | | 2.5 | |
Italy | | | 58,354,973 | | | | 2.0 | |
Mexico | | | 54,007,812 | | | | 1.8 | |
Taiwan | | | 25,634,384 | | | | 0.9 | |
Ireland | | | 23,727,668 | | | | 0.8 | |
Russia | | | 22,897,184 | | | | 0.8 | |
Denmark | | | 12,930,686 | | | | 0.4 | |
Finland | | | 5,832,472 | | | | 0.2 | |
| | | | |
Total | | $ | 2,901,622,526 | | | | 100.0% | |
| | | | |
See accompanying Notes to Financial Statements.
9 OPPENHEIMER GLOBAL FUND/VA
STATEMENTOF ASSETS AND LIABILITIES December 31, 2013
| | | | |
| |
Assets | | | | |
Investments, at value—see accompanying statement of investments: | | | | |
Unaffiliated companies (cost $1,560,592,108) | | $ | 2,892,596,149 | |
Affiliated companies (cost $9,026,377) | | | 9,026,377 | |
| | | | |
| | | 2,901,622,526 | |
| |
Receivables and other assets: | | | | |
Dividends | | | 3,284,998 | |
Shares of beneficial interest sold | | | 1,024,468 | |
Other | | | 82,565 | |
| | | | |
Total assets | | | 2,906,014,557 | |
| |
Liabilities | | | | |
Payables and other liabilities: | | | | |
Shares of beneficial interest redeemed | | | 3,717,703 | |
Distribution and service plan fees | | | 280,681 | |
Transfer and shareholder servicing agent fees | | | 240,186 | |
Trustees’ compensation | | | 81,254 | |
Shareholder communications | | | 78,458 | |
Other | | | 97,219 | |
| | | | |
Total liabilities | | | 4,495,501 | |
| |
Net Assets | | $ | 2,901,519,056 | |
| | | | |
| | | | |
| |
Composition of Net Assets | | | | |
Par value of shares of beneficial interest | | $ | 71,279 | |
| |
Additional paid-in capital | | | 1,439,864,710 | |
| |
Accumulated net investment income | | | 27,585,632 | |
| |
Accumulated net realized gain on investments and foreign currency transactions | | | 101,909,401 | |
| |
Net unrealized appreciation on investments and translation of assets and liabilities denominated in foreign currencies | | | 1,332,088,034 | |
| | | | |
Net Assets | | $ | 2,901,519,056 | |
| | | | |
| |
Net Asset Value Per Share | | | | |
Non-Service Shares: | | | | |
Net asset value, redemption price (excludes applicable contingent deferred sales charge) and offering price per share (based on net assets of $1,397,025,996 and 34,190,165 shares of beneficial interest outstanding) | | | $40.86 | |
| |
Service Shares: | | | | |
Net asset value, redemption price (excludes applicable contingent deferred sales charge) and offering price per share (based on net assets of $1,216,285,104 and 30,050,867 shares of beneficial interest outstanding) | | | $40.47 | |
| |
Class 3 Shares: | | | | |
Net asset value, redemption price (excludes applicable contingent deferred sales charge) and offering price per share (based on net assets of $192,063,097 and 4,667,230 shares of beneficial interest outstanding) | | | $41.15 | |
| |
Class 4 Shares: | | | | |
Net asset value, redemption price (excludes applicable contingent deferred sales charge) and offering price per share (based on net assets of $96,144,859 and 2,370,712 shares of beneficial interest outstanding) | | | $40.56 | |
See accompanying Notes to Financial Statements.
10 OPPENHEIMER GLOBAL FUND/VA
STATEMENTOF OPERATIONS For the Year Ended December 31, 2013
| | | | |
| |
Investment Income | | | | |
| |
Dividends: | | | | |
Unaffiliated companies (net of foreign withholding taxes of $4,601,492) | | $ | 52,525,112 | |
Affiliated companies | | | 14,612 | |
| |
Interest | | | 175 | |
| | | | |
Total investment income | | | 52,539,899 | |
|
| |
Expenses | | | | |
Management fees | | | 17,440,275 | |
| |
Distribution and service plan fees: | | | | |
Service shares | | | 2,950,352 | |
Class 4 shares | | | 208,044 | |
| |
Transfer and shareholder servicing agent fees: | | | | |
Non-Service shares | | | 1,333,132 | |
Service shares | | | 1,173,386 | |
Class 3 shares | | | 177,410 | |
Class 4 shares | | | 82,785 | |
| |
Shareholder communications: | | | | |
Non-Service shares | | | 148,453 | |
Service shares | | | 130,036 | |
Class 3 shares | | | 20,006 | |
Class 4 shares | | | 9,562 | |
| |
Custodian fees and expenses | | | 268,916 | |
| |
Trustees’ compensation | | | 65,465 | |
| |
Other | | | 387,143 | |
| | | | |
Total expenses | | | 24,394,965 | |
Less waivers and reimbursements of expenses | | | (12,585) | |
| | | | |
Net expenses | | | 24,382,380 | |
|
| |
Net Investment Income | | | 28,157,519 | |
|
| |
Realized and Unrealized Gain (Loss) | | | | |
Net realized gain (loss) on: | | | | |
Investments from unaffiliated companies (net of foreign capital gains tax of $142,074) | | | 152,998,525 | |
Foreign currency transactions | | | (262,824) | |
| | | | |
Net realized gain | | | 152,735,701 | |
| |
Net change in unrealized appreciation/depreciation on: | | | | |
Investments (net of foreign capital gains tax of $57,402) | | | 498,480,953 | |
Translation of assets and liabilities denominated in foreign currencies | | | (15,009,861) | |
| | | | |
Net change in unrealized appreciation/depreciation | | | 483,471,092 | |
|
| | |
Net Increase in Net Assets Resulting from Operations | | $ | 664,364,312 | |
| | | | |
See accompanying Notes to Financial Statements.
11 OPPENHEIMER GLOBAL FUND/VA
STATEMENTSOF CHANGES IN NET ASSETS
| | | | | | | | |
| | | Year Ended December 31, 2013 | | | Year Ended December 31, 2012 | |
| |
Operations | | | | | | | | |
Net investment income | | $ | 28,157,519 | | | $ | 34,224,709 | |
| |
Net realized gain | | | 152,735,701 | | | | 20,787,143 | |
| |
Net change in unrealized appreciation/depreciation | | | 483,471,092 | | | | 427,241,919 | |
| | | | |
Net increase in net assets resulting from operations | | | 664,364,312 | | | | 482,253,771 | |
|
| |
Dividends and/or Distributions to Shareholders | | | | | | | | |
Dividends from net investment income: | | | | | | | | |
Non-Service shares | | | (18,448,869) | | | | (25,848,197) | |
Service shares | | | (13,851,660) | | | | (20,625,132) | |
Class 3 shares | | | (2,430,857) | | | | (3,444,499) | |
Class 4 shares | | | (953,729) | | | | (1,338,372) | |
| | | | |
| | | (35,685,115) | | | | (51,256,200) | |
|
| |
Beneficial Interest Transactions | | | | | | | | |
Net increase (decrease) in net assets resulting from beneficial interest transactions: | | | | | | | | |
Non-Service shares | | | (158,236,204) | | | | (120,462,188) | |
Service shares | | | (180,268,543) | | | | (57,616,385) | |
Class 3 shares | | | (12,837,160) | | | | (21,486,893) | |
Class 4 shares | | | 1,813,300 | | | | (4,855,491) | |
| | | | |
| | | (349,528,607) | | | | (204,420,957) | |
|
| |
Net Assets | | | | | | | | |
Total increase | | | 279,150,590 | | | | 226,576,614 | |
| |
Beginning of period | | | 2,622,368,466 | | | | 2,395,791,852 | |
| | | | |
| | |
End of period (including accumulated net investment income of $27,585,632 and $35,518,126, respectively) | | $ | 2,901,519,056 | | | $ | 2,622,368,466 | |
| | | | |
See accompanying Notes to Financial Statements.
12 OPPENHEIMER GLOBAL FUND/VA
FINANCIAL HIGHLIGHTS
| | | | | | | | | | | | | | | | | | | | |
| Non-Service Shares | | Year Ended December 31, 2013 | | | Year Ended December 31, 2012 | | | Year Ended December 30, 20111 | | | Year Ended December 31, 2010 | | | Year Ended December 31, 2009 | |
| |
Per Share Operating Data | | | | | | | | | | | | | | | | | | | | |
Net asset value, beginning of period | | $ | 32.55 | | | $ | 27.46 | | | $ | 30.30 | | | $ | 26.50 | | | $ | 20.21 | |
| |
Income (loss) from investment operations: | | | | | | | | | | | | | | | | | | | | |
Net investment income2 | | | 0.41 | | | | 0.44 | | | | 0.65 | | | | 0.33 | | | | 0.33 | |
Net realized and unrealized gain (loss) | | | 8.40 | | | | 5.29 | | | | (3.11) | | | | 3.85 | | | | 6.94 | |
| | | | |
Total from investment operations | | | 8.81 | | | | 5.73 | | | | (2.46) | | | | 4.18 | | | | 7.27 | |
| |
Dividends and/or distributions to shareholders: | | | | | | | | | | | | | | | | | | | | |
Dividends from net investment income | | | (0.50) | | | | (0.64) | | | | (0.38) | | | | (0.38) | | | | (0.50) | |
Distributions from net realized gain | | | 0.00 | | | | 0.00 | | | | 0.00 | | | | 0.00 | | | | (0.48) | |
| | | | |
Total dividends and/or distributions to shareholders | | | (0.50) | | | | (0.64) | | | | (0.38) | | | | (0.38) | | | | (0.98) | |
| |
Net asset value, end of period | | $ | 40.86 | | | $ | 32.55 | | | $ | 27.46 | | | $ | 30.30 | | | $ | 26.50 | |
| | | | |
| | | | | | | | | | | | | | | | | | | | |
| |
Total Return, at Net Asset Value3 | | | 27 .31% | | | | 21.27% | | | | (8 .29)% | | | | 15 .96% | | | | 39 .77% | |
|
| |
Ratios/Supplemental Data | | | | | | | | | | | | | | | | | | | | |
Net assets, end of period (in thousands) | | $ | 1,397,026 | | | $ | 1,252,127 | | | $ | 1,165,141 | | | $ | 1,410,764 | | | $ | 1,364,597 | |
| |
Average net assets (in thousands) | | $ | 1,333,848 | | | $ | 1,206,244 | | | $ | 1,335,403 | | | $ | 1,336,110 | | | $ | 1,206,240 | |
| |
Ratios to average net assets:4 | | | | | | | | | | | | | | | | | | | | |
Net investment income | | | 1.13% | | | | 1.48% | | | | 2.17% | | | | 1.22% | | | | 1.51% | |
Total expenses5 | | | 0.77% | | | | 0.76% | | | | 0.76% | | | | 0.76% | | | | 0.75% | |
Expenses after payments, waivers and/or reimbursements and reduction to custodian expenses | | | 0.77% | | | | 0.76% | | | | 0.76% | | | | 0.76% | | | | 0.75% | |
| |
Portfolio turnover rate | | | 11% | | | | 14% | | | | 13% | | | | 15% | | | | 11% | |
1. December 30, 2011 represents the last business day of the Fund’s reporting period.
2. Per share amounts calculated based on the average shares outstanding during the period.
3. Assumes an initial investment on the business day before the first day of the fiscal period, with all dividends and distributions reinvested in additional shares on the reinvestment date, and redemption at the net asset value calculated on the last business day of the fiscal period. Total returns are not annualized for periods less than one full year. Total return information does not reflect expenses that apply at the separate account level or to related insurance products. Inclusion of these charges would reduce the total return figures for all periods shown. Returns do not reflect the deduction of taxes that a shareholder would pay on fund distributions or the redemption of fund shares.
4. Annualized for periods less than one full year.
5. Total expenses including indirect expenses from affiliated fund were as follows:
| | | | |
Year Ended December 31, 2013 | | | 0.77 | % |
Year Ended December 31, 2012 | | | 0.76 | % |
Year Ended December 30, 2011 | | | 0.76 | % |
Year Ended December 31, 2010 | | | 0.76 | % |
Year Ended December 31, 2009 | | | 0.75 | % |
See accompanying Notes to Financial Statements.
13 OPPENHEIMER GLOBAL FUND/VA
FINANCIAL HIGHLIGHTS Continued
| | | | | | | | | | | | | | | | | | | | |
| Service Shares | | Year Ended
December 31,
2013 | | | Year Ended
December 31,
2012 | | | Year Ended
December 30,
20111 | | | Year Ended
December 31,
2010 | | | Year Ended
December 31,
2009 | |
| |
Per Share Operating Data | | | | | | | | | | | | | | | | | | | | |
Net asset value, beginning of period | | $ | 32.25 | | | $ | 27.21 | | | $ | 30.04 | | | $ | 26.28 | | | $ | 20.02 | |
| |
Income (loss) from investment operations: | | | | | | | | | | | | | | | | | | | | |
Net investment income2 | | | 0.32 | | | | 0.36 | | | | 0.56 | | | | 0.26 | | | | 0.27 | |
Net realized and unrealized gain (loss) | | | 8.32 | | | | 5.25 | | | | (3.08) | | | | 3.82 | | | | 6.90 | |
| | | | |
Total from investment operations | | | 8.64 | | | | 5.61 | | | | (2.52) | | | | 4.08 | | | | 7.17 | |
| |
Dividends and/or distributions to shareholders: | | | | | | | | | | | | | | | | | | | | |
Dividends from net investment income | | | (0.42) | | | | (0.57) | | | | (0.31) | | | | (0.32) | | | | (0.43) | |
Distributions from net realized gain | | | 0.00 | | | | 0.00 | | | | 0.00 | | | | 0.00 | | | | (0.48) | |
| | | | |
Total dividends and/or distributions to shareholders | | | (0.42) | | | | (0.57) | | | | (0.31) | | | | (0.32) | | | | (0.91) | |
| |
Net asset value, end of period | | $ | 40.47 | | | $ | 32.25 | | | $ | 27.21 | | | $ | 30.04 | | | $ | 26.28 | |
| | | | |
| |
Total Return, at Net Asset Value3 | | | 26.99% | | | | 20.95% | | | | (8.53)% | | | | 15.70% | | | | 39.36% | |
| |
Ratios/Supplemental Data | | | | | | | | | | | | | | | | | | | | |
Net assets, end of period (in thousands) | | $ | 1,216,285 | | | $ | 1,130,388 | | | $ | 1,003,839 | | | $ | 1,101,584 | | | $ | 980,485 | |
| |
Average net assets (in thousands) | | $ | 1,174,119 | | | $ | 1,069,295 | | | $ | 1,091,128 | | | $ | 997,627 | | | $ | 830,887 | |
| |
Ratios to average net assets:4 | | | | | | | | | | | | | | | | | | | | |
Net investment income | | | 0.89% | | | | 1.23% | | | | 1.90% | | | | 0.96% | | | | 1.23% | |
Total expenses5 | | | 1.02% | | | | 1.01% | | | | 1.01% | | | | 1.01% | | | | 1.00% | |
Expenses after payments, waivers and/or reimbursements and reduction to custodian expenses | | | 1.02% | | | | 1.01% | | | | 1.01% | | | | 1.01% | | | | 1.00% | |
| |
Portfolio turnover rate | | | 11% | | | | 14% | | | | 13% | | | | 15% | | | | 11% | |
1. December 30, 2011 represents the last business day of the Fund’s reporting period.
2. Per share amounts calculated based on the average shares outstanding during the period.
3. Assumes an initial investment on the business day before the first day of the fiscal period, with all dividends and distributions reinvested in additional shares on the reinvestment date, and redemption at the net asset value calculated on the last business day of the fiscal period. Total returns are not annualized for periods less than one full year. Total return information does not reflect expenses that apply at the separate account level or to related insurance products. Inclusion of these charges would reduce the total return figures for all periods shown. Returns do not reflect the deduction of taxes that a shareholder would pay on fund distributions or the redemption of fund shares.
4. Annualized for periods less than one full year.
5. Total expenses including indirect expenses from affiliated fund were as follows:
| | | | |
Year Ended December 31, 2013 | | | 1.03 | % |
Year Ended December 31, 2012 | | | 1.01 | % |
Year Ended December 30, 2011 | | | 1.01 | % |
Year Ended December 31, 2010 | | | 1.01 | % |
Year Ended December 31, 2009 | | | 1.00 | % |
See accompanying Notes to Financial Statements.
14 OPPENHEIMER GLOBAL FUND/VA
| | | | | | | | | | | | | | | | | | | | |
| Class 3 Shares | | Year Ended
December 31,
2013 | | | Year Ended
December 31,
2012 | | | Year Ended
December 30,
20111 | | | Year Ended
December 31,
2010 | | | Year Ended
December 31,
2009 | |
| |
Per Share Operating Data | |
Net asset value, beginning of period | | $ | 32.77 | | | $ | 27.65 | | | $ | 30.50 | | | $ | 26.67 | | | $ | 20.34 | |
| |
Income (loss) from investment operations: | | | | | | | | | | | | | | | | | | | | |
Net investment income2 | | | 0.41 | | | | 0.44 | | | | 0.66 | | | | 0.33 | | | | 0.33 | |
Net realized and unrealized gain (loss) | | | 8.47 | | | | 5.32 | | | | (3.13) | | | | 3.88 | | | | 6.98 | |
| | | | |
Total from investment operations | | | 8.88 | | | | 5.76 | | | | (2.47) | | | | 4.21 | | | | 7.31 | |
| |
Dividends and/or distributions to shareholders: | | | | | | | | | | | | | | | | | | | | |
Dividends from net investment income | | | (0.50) | | | | (0.64) | | | | (0.38) | | | | (0.38) | | | | (0.50) | |
Distributions from net realized gain | | | 0.00 | | | | 0.00 | | | | 0.00 | | | | 0.00 | | | | (0.48) | |
| | | | |
Total dividends and/or distributions to shareholders | | | (0.50) | | | | (0.64) | | | | (0.38) | | | | (0.38) | | | | (0.98) | |
| |
Net asset value, end of period | | $ | 41.15 | | | $ | 32.77 | | | $ | 27.65 | | | $ | 30.50 | | | $ | 26.67 | |
| | | | |
| |
Total Return, at Net Asset Value3 | | | 27.34% | | | | 21.23% | | | | (8.27)% | | | | 15.97% | | | | 39.70% | |
| |
Ratios/Supplemental Data | | | | | | | | | | | | | | | | | | | | |
Net assets, end of period (in thousands) | | $ | 192,063 | | | $ | 164,477 | | | $ | 158,343 | | | $ | 202,621 | | | $ | 206,356 | |
| |
Average net assets (in thousands) | | $ | 177,483 | | | $ | 160,752 | | | $ | 187,804 | | | $ | 196,495 | | | $ | 182,553 | |
| |
Ratios to average net assets:4 | | | | |
Net investment income | | | 1.12% | | | | 1.49% | | | | 2.17% | | | | 1.22% | | | | 1.49% | |
Total expenses5 | | | 0.77% | | | | 0.76% | | | | 0.76% | | | | 0.76% | | | | 0.75% | |
Expenses after payments, waivers and/or reimbursements and reduction to custodian expenses | | | 0.77% | | | | 0.76% | | | | 0.76% | | | | 0.76% | | | | 0.75% | |
| |
Portfolio turnover rate | | | 11% | | | | 14% | | | | 13% | | | | 15% | | | | 11% | |
1. December 30, 2011 represents the last business day of the Fund’s reporting period.
2. Per share amounts calculated based on the average shares outstanding during the period.
3. Assumes an initial investment on the business day before the first day of the fiscal period, with all dividends and distributions reinvested in additional shares on the reinvestment date, and redemption at the net asset value calculated on the last business day of the fiscal period. Total returns are not annualized for periods less than one full year. Total return information does not reflect expenses that apply at the separate account level or to related insurance products. Inclusion of these charges would reduce the total return figures for all periods shown. Returns do not reflect the deduction of taxes that a shareholder would pay on fund distributions or the redemption of fund shares.
4. Annualized for periods less than one full year.
5. Total expenses including indirect expenses from affiliated fund were as follows:
| | | | |
Year Ended December 31, 2013 | | | 0.77 | % |
Year Ended December 31, 2012 | | | 0.76 | % |
Year Ended December 30, 2011 | | | 0.76 | % |
Year Ended December 31, 2010 | | | 0.76 | % |
Year Ended December 31, 2009 | | | 0.75 | % |
See accompanying Notes to Financial Statements.
15 OPPENHEIMER GLOBAL FUND/VA
FINANCIAL HIGHLIGHTS Continued
| | | | | | | | | | | | | | | | | | | | |
| | | Year Ended | | | Year Ended | | | Year Ended | | | Year Ended | | | Year Ended | |
| | | December 31, | | | December 31, | | | December 30, | | | December 31, | | | December 31, | |
| Class 4 Shares | | 2013 | | | 2012 | | | 20111 | | | 2010 | | | 2009 | |
| |
Per Share Operating Data | | | | | | | | | | | | | | | | | | | | |
Net asset value, beginning of period | | $ | 32.32 | | | $ | 27.26 | | | $ | 30.08 | | | $ | 26.32 | | | $ | 20.03 | |
| |
Income (loss) from investment operations: | | | | | | | | | | | | | | | | | | | | |
Net investment income2 | | | 0.31 | | | | 0.37 | | | | 0.57 | | | | 0.26 | | | | 0.27 | |
Net realized and unrealized gain (loss) | | | 8.36 | | | | 5.25 | | | | (3.08) | | | | 3.82 | | | | 6.92 | |
| | | | |
Total from investment operations | | | 8.67 | | | | 5.62 | | | | (2.51) | | | | 4.08 | | | | 7.19 | |
| |
Dividends and/or distributions to shareholders: | | | | | | | | | | | | | | | | | | | | |
Dividends from net investment income | | | (0.43) | | | | (0.56) | | | | (0.31) | | | | (0.32) | | | | (0.42) | |
Distributions from net realized gain | | | 0.00 | | | | 0.00 | | | | 0.00 | | | | 0.00 | | | | (0.48) | |
| | | | |
Total dividends and/or distributions to shareholders | | | (0.43) | | | | (0.56) | | | | (0.31) | | | | (0.32) | | | | (0.90) | |
| |
Net asset value, end of period | | $ | 40.56 | | | $ | 32.32 | | | $ | 27.26 | | | $ | 30.08 | | | $ | 26.32 | |
| | | | |
| |
Total Return, at Net Asset Value3 | | | 27.01% | | | | 20.95% | | | | (8.49)% | | | | 15.67% | | | | 39.38% | |
| |
Ratios/Supplemental Data | | | | | | | | | | | | | | | | | | | | |
Net assets, end of period (in thousands) | | $ | 96,145 | | | $ | 75,376 | | | $ | 68,469 | | | $ | 81,866 | | | $ | 78,043 | |
| |
Average net assets (in thousands) | | $ | 82,796 | | | $ | 69,764 | | | $ | 78,655 | | | $ | 76,519 | | | $ | 66,965 | |
| |
Ratios to average net assets:4 | | | | | | | | | | | | | | | | | | | | |
Net investment income | | | 0.85% | | | | 1.25% | | | | 1.93% | | | | 0.97% | | | | 1.22% | |
Total expenses5 | | | 1.02% | | | | 1.01% | | | | 1.01% | | | | 1.01% | | | | 1.00% | |
Expenses after payments, waivers and/or reimbursements and reduction to custodian expenses | | | 1.02% | | | | 1.01% | | | | 1.01% | | | | 1.01% | | | | 1.00% | |
| |
Portfolio turnover rate | | | 11% | | | | 14% | | | | 13% | | | | 15% | | | | 11% | |
1. December 30, 2011 represents the last business day of the Fund’s reporting period.
2. Per share amounts calculated based on the average shares outstanding during the period.
3. Assumes an initial investment on the business day before the first day of the fiscal period, with all dividends and distributions reinvested in additional shares on the reinvestment date, and redemption at the net asset value calculated on the last business day of the fiscal period. Total returns are not annualized for periods less than one full year. Total return information does not reflect expenses that apply at the separate account level or to related insurance products. Inclusion of these charges would reduce the total return figures for all periods shown. Returns do not reflect the deduction of taxes that a shareholder would pay on fund distributions or the redemption of fund shares.
4. Annualized for periods less than one full year.
5. Total expenses including indirect expenses from affiliated fund were as follows:
| | | | |
Year Ended December 31, 2013 | | | 1.03 | % |
Year Ended December 31, 2012 | | | 1.01 | % |
Year Ended December 30, 2011 | | | 1.01 | % |
Year Ended December 31, 2010 | | | 1.01 | % |
Year Ended December 31, 2009 | | | 1.00 | % |
See accompanying Notes to Financial Statements.
16 OPPENHEIMER GLOBAL FUND/VA
|
| NOTESTO FINANCIAL STATEMENTS December 31, 2013 |
1. Significant Accounting Policies
Oppenheimer Global Fund/VA (the “Fund”), formerly Oppenheimer Global Securities Fund/VA, a separate series of Oppenheimer Variable Account Funds, is a diversified open-end management investment company registered under the Investment Company Act of 1940, as amended. The Fund’s investment objective is to seek capital appreciation. The Fund’s investment adviser is OFI Global Asset Management, Inc. (“OFI Global” or the “Manager”), a wholly-owned subsidiary of OppenheimerFunds, Inc. (“OFI” or the “Sub-Adviser”). The Manager has entered into a sub-advisory agreement with OFI. Shares of the Fund are sold only to separate accounts of life insurance companies.
The Fund offers Non-Service, Service, Class 3 and Class 4 shares. All classes are sold at their offering price, which is the net asset value per share, to separate investment accounts of participating insurance companies as an underlying investment for variable life insurance policies, variable annuity contracts or other investment products. The classes of shares being designated as Service shares and Class 4 shares are subject to a distribution and service plan. All classes of shares have identical rights and voting privileges with respect to the Fund in general and exclusive voting rights on matters that affect that class alone. Earnings, net assets and net asset value per share may differ due to each class having its own expenses, such as transfer and shareholder servicing agent fees and shareholder communications, directly attributable to that class. The Fund assesses a 1% fee on the proceeds of Class 3 and Class 4 shares that are redeemed (either by selling or exchanging to another Oppenheimer fund or other investment option offered through your variable life insurance or variable annuity contract) within 60 days of their purchase. The fee, which is retained by the Fund, is accounted for as an addition to paid-in capital.
The following is a summary of significant accounting policies consistently followed by the Fund.
Investment in Oppenheimer Institutional Money Market Fund. The Fund is permitted to invest daily available cash balances in an affiliated money market fund. The Fund may invest the available cash in Class E shares of Oppenheimer Institutional Money Market Fund (“IMMF”) to seek current income while preserving liquidity. IMMF is a registered open-end management investment company, regulated as a money market fund under the Investment Company Act of 1940, as amended. The Manager is the investment adviser of IMMF, and the Sub-Adviser provides investment and related advisory services to IMMF. When applicable, the Fund’s investment in IMMF is included in the Statement of Investments. Shares of IMMF are valued at their net asset value per share. As a shareholder, the Fund is subject to its proportional share of IMMF’s Class E expenses, including its management fee. The Manager will waive fees and/or reimburse Fund expenses in an amount equal to the indirect management fees incurred through the Fund’s investment in IMMF.
Foreign Currency Translation. The Fund’s accounting records are maintained in U.S. dollars. The values of securities denominated in foreign currencies and amounts related to the purchase and sale of foreign securities and foreign investment income are translated into U.S. dollars as of the close of the New York Stock Exchange (the “Exchange”), normally 4:00 P.M. Eastern time, on each day the Exchange is open for trading. Foreign exchange rates may be valued primarily using a reliable bank, dealer or service authorized by the Board of Trustees.
Reported net realized gains and losses from foreign currency transactions arise from sales of portfolio securities, sales and maturities of short-term securities, sales of foreign currencies, exchange rate fluctuations between the trade and settlement dates on securities transactions, and the difference between the amounts of dividends, interest, and foreign withholding taxes recorded on the Fund’s books and the U.S. dollar equivalent of the amounts actually received or paid. Net unrealized appreciation and depreciation on the translation of assets and liabilities denominated in foreign currencies arise from changes in the values of assets and liabilities, including investments in securities at fiscal period end, resulting from changes in exchange rates.
The effect of changes in foreign currency exchange rates on investments is separately identified from the fluctuations arising from changes in market values of securities held and reported with all other foreign currency gains and losses in the Fund’s Statement of Operations.
Allocation of Income, Expenses, Gains and Losses. Income, expenses (other than those attributable to a specific class), gains and losses are allocated on a daily basis to each class of shares based upon the relative proportion of net assets represented by such class. Operating expenses directly attributable to a specific class are charged against the operations of that class.
Federal Taxes. The Fund intends to comply with provisions of the Internal Revenue Code applicable to regulated investment companies and to distribute substantially all of its investment company taxable income, including any net realized gain on investments not offset by capital loss carryforwards, if any, to shareholders. Therefore, no federal income or excise tax provision is required. The Fund files income tax returns in U.S. federal and applicable state jurisdictions. The statute of limitations on the Fund’s tax return filings generally remain open for the three preceding fiscal reporting period ends.
The tax components of capital shown in the following table represent distribution requirements the Fund must satisfy under the income tax regulations, losses the Fund may be able to offset against income and gains realized in future years and unrealized appreciation or depreciation of securities and other investments for federal income tax purposes.
| | | | | | | | | | | | | | | | |
Undistributed Net Investment Income | | Undistributed
Long-Term
Gain | | | | | | | Accumulated
Loss
Carryforward1,2 | | | Net Unrealized
Appreciation
Based on cost of
Securities and
Other Investments
for Federal Income
Tax Purposes | |
| |
$27,739,869 | | | $126,059,475 | | | | | | | | $— | | | | $1,307,937,804 | |
17 OPPENHEIMER GLOBAL FUND/VA
NOTESTO FINANCIAL STATEMENTS Continued
1. Significant Accounting Policies (Continued)
1. During the fiscal year ended December 31, 2013, the Fund utilized $9,934,353 of capital loss carryforward to offset capital gains realized in that fiscal year.
2. During the fiscal year ended December 31, 2012, the Fund utilized $9,221,730 of capital loss carryforward to offset capital gains realized in that fiscal year.
Net investment income (loss) and net realized gain (loss) may differ for financial statement and tax purposes. The character of dividends and distributions made during the fiscal year from net investment income or net realized gains may differ from their ultimate characterization for federal income tax purposes. Also, due to timing of dividends and distributions, the fiscal year in which amounts are distributed may differ from the fiscal year in which the income or net realized gain was recorded by the Fund.
Accordingly, the following amounts have been reclassified for December 31, 2013. Net assets of the Fund were unaffected by the reclassifications.
| | | | | | | | |
Increase to Paid-in Capital | | Reduction
to Accumulated
Net Investment
Income | | | Reduction
to Accumulated Net
Realized Gain on Investments3 | |
| |
$13,166,329 | | | $404,898 | | | | $12,761,431 | |
3. $13,166,329, all of which was long-term capital gain, was distributed in connection with Fund share redemptions.
The tax character of distributions paid during the years ended December 31, 2013 and December 31, 2012 was as follows:
| | | | | | | | |
| | | Year Ended
December 31, 2013 | | | Year Ended
December 31, 2012 | |
| |
Distributions paid from: | | | | | | | | |
Ordinary income | | | $ 35,685,115 | | | | $ 51,256,200 | |
The aggregate cost of securities and other investments and the composition of unrealized appreciation and depreciation of securities and other investments for federal income tax purposes as of December 31, 2013 are noted in the following table. The primary difference between book and tax appreciation or depreciation of securities and other investments, if applicable, is attributable to the tax deferral of losses or tax realization of financial statement unrealized gain or loss.
| | | | |
Federal tax cost of securities | | $ | 1,593,768,715 | |
| | | | |
| |
Gross unrealized appreciation | | $ | 1,341,549,138 | |
Gross unrealized depreciation | | | (33,611,334) | |
| | | | |
Net unrealized appreciation | | $ | 1,307,937,804 | |
| | | | |
Certain foreign countries impose a tax on capital gains which is accrued by the Fund based on unrealized appreciation, if any, on affected securities. The tax is paid when the gain is realized.
Trustees’ Compensation. The Board of Trustees has adopted a compensation deferral plan for independent trustees that enables trustees to elect to defer receipt of all or a portion of the annual compensation they are entitled to receive from the Fund. For purposes of determining the amount owed to the Trustee under the plan, deferred amounts are treated as though equal dollar amounts had been invested in shares of the Fund or in other Oppenheimer funds selected by the Trustee. The Fund purchases shares of the funds selected for deferral by the Trustee in amounts equal to his or her deemed investment, resulting in a Fund asset equal to the deferred compensation liability. Such assets are included as a component of “Other” within the asset section of the Statement of Assets and Liabilities. Deferral of trustees’ fees under the plan will not affect the net assets of the Fund, and will not materially affect the Fund’s assets, liabilities or net investment income per share. Amounts will be deferred until distributed in accordance with the compensation deferral plan.
Dividends and Distributions to Shareholders. Dividends and distributions to shareholders, which are determined in accordance with income tax regulations and may differ from U.S. generally accepted accounting principles, are recorded on the ex-dividend date. Income and capital gain distributions, if any, are declared and paid annually or at other times as deemed necessary by the Manager.
Investment Income. Dividend income is recorded on the ex-dividend date or upon ex-dividend notification in the case of certain foreign dividends where the ex-dividend date may have passed. Non-cash dividends included in dividend income, if any, are recorded at the fair market value of the securities received. Interest income is recognized on an accrual basis. Discount and premium, which are included in interest income on the Statement of Operations, are amortized or accreted daily.
Custodian Fees. “Custodian fees and expenses” in the Statement of Operations may include interest expense incurred by the Fund on any cash overdrafts of its custodian account during the period. Such cash overdrafts may result from the effects of failed trades in portfolio securities and from cash outflows resulting from unanticipated shareholder redemption activity. The Fund pays interest to its custodian on such cash overdrafts, to the extent they are not offset by positive cash balances maintained by the Fund, at a rate equal to the Federal Funds Rate plus 0.50%. The “Reduction to custodian expenses” line item, if applicable, represents earnings on cash balances maintained by the Fund during the period. Such interest expense and other custodian fees may be paid with these earnings.
18 OPPENHEIMER GLOBAL FUND/VA
1. Significant Accounting Policies (Continued)
Security Transactions. Security transactions are recorded on the trade date. Realized gains and losses on securities sold are determined on the basis of identified cost.
Indemnifications. The Fund’s organizational documents provide current and former trustees and officers with a limited indemnification against liabilities arising in connection with the performance of their duties to the Fund. In the normal course of business, the Fund may also enter into contracts that provide general indemnifications. The Fund’s maximum exposure under these arrangements is unknown as this would be dependent on future claims that may be made against the Fund. The risk of material loss from such claims is considered remote.
Other. The preparation of financial statements in conformity with accounting principles generally accepted in the United States of America requires management to make estimates and assumptions that affect the reported amounts of assets and liabilities and disclosure of contingent assets and liabilities at the date of the financial statements and the reported amounts of increases and decreases in net assets from operations during the reporting period. Actual results could differ from those estimates.
2. Securities Valuation
The Fund calculates the net asset value of its shares as of the close of the New York Stock Exchange (the “Exchange”), normally 4:00 P.M. Eastern time, on each day the Exchange is open for trading.
The Fund’s Board has adopted procedures for the valuation of the Fund’s securities and has delegated the day-to-day responsibility for valuation determinations under those procedures to the Manager. The Manager has established a Valuation Committee which is responsible for determining a “fair valuation” for any security for which market quotations are not “readily available.” The Valuation Committee’s fair valuation determinations are subject to review, approval and ratification by the Fund’s Board at its next regularly scheduled meeting covering the calendar quarter in which the fair valuation was determined.
Valuation Methods and Inputs
Securities are valued using unadjusted quoted market prices, when available, as supplied primarily by third party pricing services or dealers.
The following methodologies are used to determine the market value or the fair value of the types of securities described below:
Securities traded on a registered U.S. securities exchange (including exchange-traded derivatives other than futures and futures options) are valued based on the last sale price of the security reported on the principal exchange on which it is traded, prior to the time when the Fund’s assets are valued. In the absence of a sale, the security is valued at the last sale price on the prior trading day, if it is within the spread of the current day’s closing “bid” and “asked” prices, and if not, at the current day’s closing bid price. A security of a foreign issuer traded on a foreign exchange, but not listed on a registered U.S. securities exchange, is valued based on the last sale price on the principal exchange on which the security is traded, as identified by the third party pricing service used by the Manager, prior to the time when the Fund’s assets are valued. If the last sale price is unavailable, the security is valued at the most recent official closing price on the principal exchange on which it is traded. If the last sales price or official closing price for a foreign security is not available, the security is valued at the mean between the bid and asked price per the exchange or, if not available from the exchange, obtained from two dealers. If bid and asked prices are not available from either the exchange or two dealers, the security is valued by using one of the following methodologies (listed in order of priority); (1) using a bid from the exchange, (2) the mean between the bid and asked price as provided by a single dealer, or (3) a bid from a single dealer.
Shares of a registered investment company that are not traded on an exchange are valued at that investment company’s net asset value per share.
Corporate and government debt securities (of U.S. or foreign issuers) and municipal debt securities, event-linked bonds, loans, mortgage-backed securities, collateralized mortgage obligations, and asset-backed securities are valued at the mean between the “bid” and “asked” prices utilizing evaluated prices obtained from third party pricing services or broker-dealers who may use matrix pricing methods to determine the evaluated prices.
Short-term money market type debt securities with a remaining maturity of sixty days or less are valued at cost adjusted by the amortization of discount or premium to maturity (amortized cost), which approximates market value. Short-term debt securities with a remaining maturity in excess of sixty days are valued at the mean between the “bid” and “asked” prices utilizing evaluated prices obtained from third party pricing services or broker-dealers.
A description of the standard inputs that may generally be considered by the third party pricing vendors in determining their evaluated prices is provided below.
| | |
| Security Type | | Standard inputs generally considered by third-party pricing vendors |
| Corporate debt, government debt, municipal, mortgage-backed and asset-backed securities | | Reported trade data, broker-dealer price quotations, benchmark yields, issuer spreads on comparable securities, the credit quality, yield, maturity, and other appropriate factors. |
| Loans | | Information obtained from market participants regarding reported trade data and broker-dealer price quotations. |
| Event-linked bonds | | Information obtained from market participants regarding reported trade data and broker-dealer price quotations. |
If a market value or price cannot be determined for a security using the methodologies described above, or if, in the “good faith” opinion of the Manager, the market value or price obtained does not constitute a “readily available market quotation,” or a significant event has occurred that would
19 OPPENHEIMER GLOBAL FUND/VA
NOTESTO FINANCIAL STATEMENTS Continued
2. Securities Valuation (Continued)
materially affect the value of the security the security is fair valued either (i) by a standardized fair valuation methodology applicable to the security type or the significant event as previously approved by the Valuation Committee and the Fund’s Board or (ii) as determined in good faith by the Manager’s Valuation Committee. The Valuation Committee considers all relevant facts that are reasonably available, through either public information or information available to the Manager, when determining the fair value of a security. Fair value determinations by the Manager are subject to review, approval and ratification by the Fund’s Board at its next regularly scheduled meeting covering the calendar quarter in which the fair valuation was determined. Those fair valuation standardized methodologies include, but are not limited to, valuing securities at the last sale price or initially at cost and subsequently adjusting the value based on: changes in company specific fundamentals, changes in an appropriate securities index, or changes in the value of similar securities which may be further adjusted for any discounts related to security-specific resale restrictions. When possible, such methodologies use observable market inputs such as unadjusted quoted prices of similar securities, observable interest rates, currency rates and yield curves. The methodologies used for valuing securities are not necessarily an indication of the risks associated with investing in those securities nor can it be assured that the Fund can obtain the fair value assigned to a security if it were to sell the security.
To assess the continuing appropriateness of security valuations, the Manager, or its third party service provider who is subject to oversight by the Manager, regularly compares prior day prices, prices on comparable securities, and sale prices to the current day prices and challenges those prices exceeding certain tolerance levels with the third party pricing service or broker source. For those securities valued by fair valuations, whether through a standardized fair valuation methodology or a fair valuation determination, the Valuation Committee reviews and affirms the reasonableness of the valuations based on such methodologies and fair valuation determinations on a regular basis after considering all relevant information that is reasonably available.
Classifications
Each investment asset or liability of the Fund is assigned a level at measurement date based on the significance and source of the inputs to its valuation. Various data inputs are used in determining the value of each of the Fund’s investments as of the reporting period end. These data inputs are categorized in the following hierarchy under applicable financial accounting standards:
1) Level 1-unadjusted quoted prices in active markets for identical assets or liabilities (including securities actively traded on a securities exchange)
2) Level 2-inputs other than unadjusted quoted prices that are observable for the asset or liability (such as unadjusted quoted prices for similar assets and market corroborated inputs such as interest rates, prepayment speeds, credit risks, etc.)
3) Level 3-significant unobservable inputs (including the Manager’s own judgments about assumptions that market participants would use in pricing the asset or liability).
The inputs used for valuing securities are not necessarily an indication of the risks associated with investing in those securities.
The table below categorizes amounts that are included in the Fund’s Statement of Assets and Liabilities as of December 31, 2013 based on valuation input level:
| | | | | | | | | | | | | | | | |
| | | Level 1— Unadjusted Quoted Prices | | | Level 2— Other Significant
Observable Inputs | | | Level 3— Significant Unobservable Inputs | | | Value | |
| |
Assets Table | | | | | | | | | | | | | | | | |
Investments, at Value: | | | | | | | | | | | | | | | | |
Common Stocks | | | | | | | | | | | | | | | | |
Consumer Discretionary | | $ | 166,098,822 | | | $ | 270,331,203 | | | $ | — | | | $ | 436,430,025 | |
Consumer Staples | | | 102,447,555 | | | | 75,047,353 | | | | — | | | | 177,494,908 | |
Energy | | | 21,956,416 | | | | 66,922,493 | | | | — | | | | 88,878,909 | |
Financials | | | 203,181,329 | | | | 409,105,025 | | | | — | | | | 612,286,354 | |
Health Care | | | 294,767,814 | | | | 102,346,139 | | | | — | | | | 397,113,953 | |
Industrials | | | 127,469,452 | | | | 245,453,305 | | | | — | | | | 372,922,757 | |
Information Technology | | | 422,192,003 | | | | 295,693,804 | | | | — | | | | 717,885,807 | |
Materials | | | — | | | | 37,274,031 | | | | — | | | | 37,274,031 | |
Telecommunication Services | | | — | | | | 45,848,871 | | | | — | | | | 45,848,871 | |
Utilities | | | — | | | | 5,832,472 | | | | — | | | | 5,832,472 | |
Rights, Warrants and Certificates | | | — | | | | 628,062 | | | | — | | | | 628,062 | |
Investment Company | | | 9,026,377 | | | | — | | | | — | | | | 9,026,377 | |
| | | | |
Total Assets | | $ | 1,347,139,768 | | | $ | 1,554,482,758 | | | $ | — | | | $ | 2,901,622,526 | |
| | | | |
Currency contracts and forwards, if any, are reported at their unrealized appreciation/ depreciation at measurement date, which represents the change in the contract’s value from trade date. Futures, if any, are reported at their variation margin at measurement date, which represents the amount due to/from the Fund at that date. All additional assets and liabilities included in the above table are reported at their market value at measurement date.
The table below shows the transfers between Level 1 and Level 2. The Fund’s policy is to recognize transfers in and transfers out as of the beginning of the reporting period.
20 OPPENHEIMER GLOBAL FUND/VA
2. Securities Valuation (Continued)
| | | | | | | | |
| | | Transfers out of Level 1* | | | Transfers into Level 2* | |
| |
Assets Table | | | | | | | | |
Investments, at Value: | | | | | | | | |
Commons Stocks | | | | | | | | |
Consumer Discretionary | | $ | (56,375,412) | | | $ | 56,375,412 | |
Consumer Staples | | | (29,739,726) | | | | 29,739,726 | |
Financials | | | (79,568,248) | | | | 79,568,248 | |
Health Care | | | (43,061,629) | | | | 43,061,629 | |
Industrials | | | (57,122,804) | | | | 57,122,804 | |
Information Technology | | | (121,877,094) | | | | 121,877,094 | |
Materials | | | (25,410,199) | | | | 25,410,199 | |
| | | | |
Total Assets | | $ | (413,155,112) | | | $ | 413,155,112 | |
| | | | |
*Transferred from Level 1 to Level 2 due to the absence of a readily available unadjusted quoted market price.
3. Shares of Beneficial Interest
The Fund has authorized an unlimited number of $0.001 par value shares of beneficial interest of each class. Transactions in shares of beneficial interest were as follows:
| | | | | | | | | | | | | | | | | | | | | | |
| | | Year Ended December 31, 2013 | | | | | | | Year Ended December 31, 2012 | | | |
| | | Shares | | | Amount | | | | | | | Shares | | | Amount | | | |
|
Non-Service Shares | | | | | | | | | | | | | | | | | | | | | | |
Sold | | | 2,054,395 | | | $ | 74,312,252 | | | | | | | | 2,022,136 | | | $ | 59,619,398 | | | |
Dividends and/or distributions reinvested | | | 517,530 | | | | 18,448,869 | | | | | | | | 923,150 | | | | 25,848,197 | | | |
Redeemed | | | (6,851,884 | ) | | | (250,997,325) | | | | | | | | (6,899,218 | ) | | | (205,929,783 | ) | | |
| | | |
Net decrease | | | (4,279,959 | ) | | $ | (158,236,204) | | | | | | | | (3,953,932 | ) | | $ | (120,462,188 | ) | | |
| | | |
| | | |
|
Service Shares | | | | | | | | | | | | | | | | | | | | | | |
Sold | | | 1,803,731 | | | $ | 65,522,799 | | | | | | | | 3,066,046 | | | $ | 88,602,553 | | | |
Dividends and/or distributions reinvested | | | 391,733 | | | | 13,851,660 | | | | | | | | 742,178 | | | | 20,625,132 | | | |
Redeemed | | | (7,192,815 | ) | | | (259,643,002) | | | | | | | | (5,645,732 | ) | | | (166,844,070 | ) | | |
| | | |
Net decrease | | | (4,997,351 | ) | | $ | (180,268,543) | | | | | | | | (1,837,508 | ) | | $ | (57,616,385 | ) | | |
| | | |
| | | |
|
Class 3 Shares | | | | | | | | | | | | | | | | | | | | | | |
Sold | | | 274,924 | | | $ | 9,972,302 | | | | | | | | 174,260 | | | $ | 5,155,447 | | | |
Dividends and/or distributions reinvested | | | 67,712 | | | | 2,430,857 | | | | | | | | 122,145 | | | | 3,444,499 | | | |
Redeemed | | | (693,858 | ) | | | (25,240,319) | 1 | | | | | | | (1,004,527 | ) | | | (30,086,839 | )2 | | |
| | | |
Net decrease | | | (351,222 | ) | | $ | (12,837,160) | | | | | | | | (708,122 | ) | | $ | (21,486,893 | ) | | |
| | | |
| | | |
|
Class 4 Shares | | | | | | | | | | | | | | | | | | | | | | |
Sold | | | 301,288 | | | $ | 11,069,712 | | | | | | | | 242,463 | | | $ | 7,528,786 | | | |
Dividends and/or distributions reinvested | | | 26,919 | | | | 953,729 | | | | | | | | 48,074 | | | | 1,338,372 | | | |
Redeemed | | | (289,896 | ) | | | (10,210,141) | 1 | | | | | | | (469,722 | ) | | | (13,722,649 | )2 | | |
| | | |
Net increase (decrease) | | | 38,311 | | | $ | 1,813,300 | | | | | | | | (179,185 | ) | | $ | (4,855,491 | ) | | |
| | | |
1. Net of redemption fees of $11,326 and $4,748 for Class 3 and Class 4, respectively.
2. Net of redemption fees of $7,643 and $1,566 for Class 3 and Class 4, respectively.
4. Purchases and Sales of Securities
The aggregate cost of purchases and proceeds from sales of securities, other than short-term obligations and investments in IMMF, for the year ended December 31, 2013 were as follows:
| | | | |
| | | Purchases | | Sales |
|
Investment securities | | $300,155,456 | | $644,137,886 |
5. Fees and Other Transactions with Affiliates
Management Fees. Under the investment advisory agreement, the Fund pays the Manager a management fee based on the daily net assets of the Fund at an annual rate as shown in the following table:
21 OPPENHEIMER GLOBAL FUND/VA
NOTESTO FINANCIAL STATEMENTS Continued
5. Fees and Other Transactions with Affiliates (Continued)
| | | | | | |
Fee Schedule Through October 31, 2013 | | | |
Up to $200 million | | | 0.75% | | | |
Next $200 million | | | 0.72 | | | |
Next $200 million | | | 0.69 | | | |
Next $200 million | | | 0.66 | | | |
Over $800 million | | | 0.60 | | | |
| | | | | | |
Fee Schedule Effective November 1, 2013 | | | |
Up to $200 million | | | 0.75% | | | |
Next $200 million | | | 0.72 | | | |
Next $200 million | | | 0.69 | | | |
Next $200 million | | | 0.66 | | | |
Next $4.2 billion | | | 0.60 | | | |
Over $5 billion | | | 0.58 | | | |
Sub-Adviser Fees. The Manager has retained the Sub-Adviser to provide the day-to-day portfolio management of the Fund. Under the Sub-Advisory Agreement, the Manager pays the Sub-Adviser an annual fee in monthly installments, equal to a percentage of the investment management fee collected by the Manager from the Fund, which shall be calculated after any investment management fee waivers. The fee paid to the Sub-Adviser is paid by the Manager, not by the Fund.
Transfer Agent Fees. OFI Global (the “Transfer Agent”) serves as the transfer and shareholder servicing agent for the Fund. Fees incurred by the Fund with respect to these services are detailed in the Statement of Operations.
Sub-Transfer Agent Fees. The Transfer Agent has retained Shareholder Services, Inc., a wholly-owned subsidiary of OFI (the “Sub-Transfer Agent”), to provide the day-to-day transfer agent and shareholder servicing of the Fund. Under the Sub-Transfer Agency Agreement, the Transfer Agent pays the Sub-Transfer Agent an annual fee in monthly installments, equal to a percentage of the transfer agent fee collected by the Transfer Agent from the Fund, which shall be calculated after any applicable fee waivers. The fee paid to the Sub-Transfer Agent is paid by the Transfer Agent, not by the Fund.
Distribution and Service Plan for Service Shares and Class 4 Shares. The Fund has adopted a Distribution and Service Plan (the “Plan”) in accordance with Rule 12b-1 under the Investment Company Act of 1940 for Service shares and Class 4 shares to pay OppenheimerFunds Distributor, Inc. (the “Distributor”), for distribution related services, personal service and account maintenance for the Fund’s Service shares and Class 4 shares. Under the Plan, payments are made periodically at an annual rate of 0.25% of the daily net assets of Service shares and Class 4 shares of the Fund. The Distributor currently uses all of those fees to compensate sponsors of the insurance product that offers Fund shares, for providing personal service and maintenance of accounts of their variable contract owners that hold Service shares and Class 4 shares. These fees are paid out of the Fund’s assets on an on-going basis and increase operating expenses of the Service shares and Class 4 shares, which results in lower performance compared to the Fund’s shares that are not subject to a service fee. Fees incurred by the Fund under the Plan are detailed in the Statement of Operations.
Waivers and Reimbursements of Expenses. The Manager has contractually agreed to limit the Fund’s expenses after payments, waivers and/or reimbursements and reduction to custodian expenses, excluding expenses incurred directly or indirectly by the Fund as a result of investments in other investment companies, wholly-owned subsidiaries and pooled investment vehicles; so that those expenses, as percentages of daily net assets, will not exceed the annual rate of 1.00% for Non-Service and Class 3 shares and 1.25% for Service and Class 4 shares.
The Manager will waive fees and/or reimburse Fund expenses in an amount equal to the indirect management fees incurred through the Fund’s investment in IMMF. During the year ended December 31, 2013, the Manager waived fees and/or reimbursed the Fund $12,585 for IMMF management fees.
Some of these undertakings may be modified or terminated at any time; some may not be modified or terminated until after one year from the date of the current prospectus, as indicated therein.
6. Pending Litigation
Since 2009, seven class action lawsuits have been pending in the U.S. District Court for the District of Colorado against OppenheimerFunds, Inc. (“OFI”), OppenheimerFunds Distributor, Inc., the Fund’s principal underwriter and distributor (the “Distributor”), and certain funds (but not including the Fund) advised by OFI Global Asset Management, Inc. and distributed by the Distributor (the “Defendant Funds”). The lawsuits also name as defendants certain officers and current and former trustees of the respective Defendant Funds. The lawsuits raise claims under federal securities law and allege, among other things, that the disclosure documents of the respective Defendant Funds contained misrepresentations and omissions and that the respective Defendant Funds’ investment policies were not followed. The plaintiffs in these actions seek unspecified damages, equitable relief and awards of attorneys’ fees and litigation expenses. The Defendant Funds’ Boards of Trustees have also engaged counsel to represent the Funds and the present and former Independent Trustees named in those suits. On August 26, 2013, the parties in six of these lawsuits executed a memorandum of understanding setting forth the terms of proposed settlements of those actions. The proposed settlements are subject to a variety of contingencies, including the execution of settlement agreements, which will require preliminary and final approval by the court. The proposed settlements do not resolve a seventh outstanding lawsuit relating to Oppenheimer California Municipal Fund.
Other class action and individual lawsuits have been filed since 2008 in various state and federal courts against OFI and certain of its affiliates by investors seeking to recover investments they allegedly lost as a result of the “Ponzi” scheme run by Bernard L. Madoff and his firm, Bernard L. Madoff Investment Securities, LLC (“BLMIS”). Plaintiffs in these suits allege that they suffered losses as a result of their investments in several funds managed by an affiliate of OFI and assert a variety of claims, including breach of fiduciary duty, fraud, negligent misrepresentation, unjust enrichment, and violation of federal and state securities laws and regulations, among others. They seek unspecified damages, equitable relief and awards of attorneys’ fees and litigation expenses. Neither the Distributor, nor any of the Oppenheimer mutual funds, their independent trustees or directors are named as defendants
22 OPPENHEIMER GLOBAL FUND/VA
6. Pending Litigation (Continued)
in these lawsuits. None of the Oppenheimer mutual funds invested in any funds or accounts managed by Madoff or BLMIS. On February 28, 2011, a stipulation of partial settlement of three groups of consolidated putative class action lawsuits relating to these matters was filed in the U.S. District Court for the Southern District of New York. On August 19, 2011, the court entered an order and final judgment approving the settlement as fair, reasonable and adequate. In September 2011, certain parties filed notices of appeal from the court’s order approving the settlement. The settlement does not resolve other outstanding lawsuits against OFI and its affiliates relating to BLMIS.
On April 16, 2010, a lawsuit was filed in New York state court against (i) OFI, (ii) an affiliate of OFI and (iii) AAArdvark IV Funding Limited (“AAArdvark IV”), an entity advised by OFI’s affiliate, in connection with investments made by the plaintiffs in AAArdvark IV. Plaintiffs allege breach of contract and common law fraud claims against the defendants and seek compensatory damages, costs and disbursements, including attorney fees. On April 11, 2013, the court granted defendants’ motion for summary judgment, dismissing plaintiffs’ fraud claim with prejudice and dismissing their contract claim without prejudice, and granted plaintiffs leave to replead their contract claim to assert a cause of action for specific performance within 30 days. On May 9, 2013, plaintiffs filed a notice of appeal from the court’s dismissal order. On January 7, 2014, the appellate court dismissed the trial court’s dismissal order. On July 15, 2011, a lawsuit was filed in New York state court against OFI, an affiliate of OFI and AAArdvark Funding Limited (“AAArdvark I”), an entity advised by OFI’s affiliate, in connection with investments made by the plaintiffs in AAArdvark I. The complaint alleges breach of contract and common law fraud claims against the defendants and seeks compensatory damages, costs and disbursements, including attorney fees. On November 9, 2011, a lawsuit was filed in New York state court against OFI, an affiliate of OFI and AAArdvark XS Funding Limited (“AAArdvark XS”), an entity advised by OFI’s affiliate, in connection with investments made by the plaintiffs in AAArdvark XS. The complaint alleged breach of contract against the defendants and sought compensatory damages, costs and disbursements, including attorney fees. On November 8, 2013, the parties filed a stipulation of discontinuance dismissing the lawsuit with prejudice.
OFI believes the lawsuits and appeals described above are without legal merit and, with the exception of actions it has settled, is defending against them vigorously. While it is premature to render any opinion as to the outcome in these lawsuits, or whether any costs that the Defendant Funds may bear in defending the suits might not be reimbursed by insurance, OFI believes that these suits should not impair the ability of OFI or the Distributor to perform their respective duties to the Fund, and that the outcome of all of the suits together should not have any material effect on the operations of any of the Oppenheimer mutual funds.
23 OPPENHEIMER GLOBAL FUND/VA
REPORTOF INDEPENDENT REGISTERED PUBLIC ACCOUNTING FIRM
The Board of Trustees and Shareholders of Oppenheimer Variable Account Funds:
We have audited the accompanying statement of assets and liabilities of Oppenheimer Global Fund/VA, formerly, Oppenheimer Global Securities Fund/VA (a separate series of Oppenheimer Variable Account Funds), including the statement of investments, as of December 31, 2013, and the related statement of operations for the year then ended, the statements of changes in net assets for each of the years in the two-year period then ended, and the financial highlights for each of the years in the five-year period then ended. These financial statements and financial highlights are the responsibility of the Fund’s management. Our responsibility is to express an opinion on these financial statements and financial highlights based on our audits.
We conducted our audits in accordance with the standards of the Public Company Accounting Oversight Board (United States). Those standards require that we plan and perform the audit to obtain reasonable assurance about whether the financial statements and financial highlights are free of material misstatement. An audit includes examining, on a test basis, evidence supporting the amounts and disclosures in the financial statements. Our procedures included confirmation of securities owned as of December 31, 2013, by correspondence with the custodian and transfer agent. An audit also includes assessing the accounting principles used and significant estimates made by management, as well as evaluating the overall financial statement presentation. We believe that our audits provide a reasonable basis for our opinion.
In our opinion, the financial statements and financial highlights referred to above present fairly, in all material respects, the financial position of Oppenheimer Global Fund/VA as of December 31, 2013, the results of its operations for the year then ended, the changes in its net assets for each of the years in the two-year period then ended, and the financial highlights for each of the years in the five-year period then ended, in conformity with U.S. generally accepted accounting principles.
KPMGLLP
Denver, Colorado
February 14, 2014
24 OPPENHEIMER GLOBAL FUND/VA
FEDERAL INCOME TAX INFORMATION Unaudited
In early 2014, if applicable, shareholders of record received information regarding all dividends and distributions paid to them by the Fund during calendar year 2013.
Dividends, if any, paid by the Fund during the fiscal year ended December 31, 2013 which are not designated as capital gain distributions should be multiplied by the maximum amount allowable but not less than 43.38% to arrive at the amount eligible for the corporate dividend-received deduction.
The Fund has elected the application of Section 853 of the Internal Revenue Code to permit shareholders to take a federal income tax credit or deduction, at their option, on a per share basis. The maximum amount allowable but not less than $4,558,675 of foreign income taxes were paid by the Fund during the fiscal year ended December 31, 2013. A separate notice will be mailed to each shareholder, which will reflect the proportionate share of such foreign taxes which must be treated by shareholders as gross income for federal income tax purposes.
Gross income of the maximum amount allowable but not less than $27,253,326 was derived from sources within foreign countries or possessions of the United States.
The foregoing information is presented to assist shareholders in reporting distributions received from the Fund to the Internal Revenue Service. Because of the complexity of the federal regulations which may affect your individual tax return and the many variations in state and local tax regulations, we recommend that you consult your tax advisor for specific guidance.
25 OPPENHEIMER GLOBAL FUND/VA
BOARD APPROVAL OF THE FUND’S INVESTMENT ADVISORY AND SUB-ADVISORY AGREEMENTS Unaudited
The Fund has entered into an investment advisory agreement with OFI Global Asset Management, Inc. (“OFI Global” or the “Adviser”), a wholly-owned subsidiary of OppenheimerFunds, Inc. (“OFI” or the “Sub-Adviser”) (“OFI Global” and “OFI” together the “Managers”) and OFI Global has entered into a sub-advisory agreement with OFI whereby OFI provides investment sub-advisory services to the Fund (collectively, the “Agreements”). Each year, the Board of Trustees (the “Board”), including a majority of the independent Trustees, is required to determine whether to renew the Agreements. The Investment Company Act of 1940, as amended, requires that the Board request and evaluate, and that the Managers provide, such information as may be reasonably necessary to evaluate the terms of the Agreements. The Board employs an independent consultant to prepare a report that provides information, including comparative information that the Board requests for that purpose. In addition to in-person meetings focused on this evaluation, the Board receives information throughout the year regarding Fund services, fees, expenses and performance.
The Adviser, Sub-Adviser and the independent consultant provided information to the Board on the following factors: (i) the nature, quality and extent of the Managers’ services, (ii) the investment performance of the Fund and the Managers, (iii) the fees and expenses of the Fund, including comparative expense information, (iv) the profitability of the Managers and their affiliates, including an analysis of the cost of providing services, (v) whether economies of scale are realized as the Fund grows and whether fee levels reflect these economies of scale for Fund investors and (vi) other benefits to the Managers from their relationship with the Fund. The Board was aware that there are alternatives to retaining the Managers. Outlined below is a summary of the principal information considered by the Board as well as the Board’s conclusions.
Nature, Quality and Extent of Services. The Board considered information about the nature, quality and extent of the services provided to the Fund and information regarding the Managers’ key personnel who provide such services. The Sub-Adviser’s duties include providing the Fund with the services of the portfolio manager and the Sub-Adviser’s investment team, who provide research, analysis and other advisory services in regard to the Fund’s investments; securities trading services; oversight of third-party service providers; monitoring compliance with applicable Fund policies and procedures and adherence to the Fund’s investment restrictions; and risk management. The Managers are responsible for providing certain administrative services to the Fund as well. Those services include providing and supervising all administrative and clerical personnel who are necessary in order to provide effective corporate administration for the Fund; compiling and maintaining records with respect to the Fund’s operations; preparing and filing reports required by the Securities and Exchange Commission; preparing periodic reports regarding the operations of the Fund for its shareholders; preparing proxy materials for shareholder meetings; and preparing the registration statements required by Federal and state securities laws for the sale of the Fund’s shares. The Managers also provide the Fund with office space, facilities and equipment.
The Board also considered the quality of the services provided and the quality of the Managers’ resources that are available to the Fund. The Board took account of the fact that the Sub-Adviser has had over fifty years of experience as an investment adviser and that its assets under management rank it among the top mutual fund managers in the United States. The Board evaluated the Sub-Adviser’s advisory, administrative, accounting, legal, compliance services and risk management, and information the Board has received regarding the experience and professional qualifications of the Managers’ key personnel and the size and functions of its staff. In its evaluation of the quality of the portfolio management services provided, the Board considered the experience of Rajeev Bhaman, the portfolio manager for the Fund, and the Sub-Adviser’s investment team and analysts. The Board members also considered the totality of their experiences with the Managers as directors or trustees of the Fund and other funds advised by the Managers. The Board considered information regarding the quality of services provided by affiliates of the Managers, which its members have become knowledgeable about in connection with the renewal of the Fund’s service agreements. The Board concluded, in light of the Managers’ experience, reputation, personnel, operations and resources that the Fund benefits from the services provided under the Agreement.
Investment Performance of the Fund, the Adviser and the Sub-Adviser. Throughout the year, the Manager provided information on the investment performance of the Fund, including comparative performance information. The Board also reviewed information, prepared by the Manager and by the independent consultant, comparing the Fund’s historical performance to relevant market indices and to the performance of other world stock funds underlying variable insurance products. The Board considered that the Fund outperformed its performance category median during the one-, three-, five- and ten-year periods. The Board also considered that the Fund ranked in the second quintile of its performance category for the one-, three-, five- and ten-year periods.
Costs of Services by the Adviser. The Board reviewed the fees paid to the Manager and the other expenses borne by the Fund. The independent consultant provided comparative data in regard to the fees and expenses of the Fund and other world stock funds underlying variable insurance products. In reviewing the fees and expenses charged to the VA funds, the Board considered the Manager’s assertion that, because there is much greater disparity in the fees and services that may be provided by a manager to a VA fund as opposed to a retail fund, when comparing the expenses of the various VA funds to those of retail funds, it is most appropriate to focus on total expenses (rather than on the management fees). Accordingly, while the Board reviewed and considered all expenses, it focused on total expenses. The Board considered that the Fund’s total expenses were lower than its peer group median and its category median. The Board also considered that the Fund’s contractual management fee was lower than its respective peer group median and category median. Within the total asset range of $2 billion to $5 billion, the Fund’s effective rate was lower than its peer group median and category median. The Manager has voluntarily agreed to limit the Fund’s total annual operating expenses so that those expenses, as percentages of daily net assets, will not exceed the annual rate of 1.00% for Non-Service and Class 3 shares and 1.25% for Service and Class 4 shares. This voluntary expense limitation may be amended or withdrawn at any time without prior notice to shareholders.
Economies of Scale and Profits Realized by the Adviser and Sub-Adviser. The Board considered information regarding the Manager’s costs in serving as the Fund’s investment adviser, including the costs associated with the personnel and systems necessary to manage the Fund, and information regarding the Manager’s profitability from its relationship with the Fund. The Board reviewed whether the Manager may realize economies of scale in managing and supporting the Fund. The Board noted that the Fund currently has management fee breakpoints, which are intended to share with Fund shareholders economies of scale that may exist as the Fund’s assets grow. Based on the Board’s evaluation, the Managers agreed to a revised breakpoint schedule as negotiated by the Board that, effective November 1, 2013, includes an additional fee breakpoint of 0.58% for assets in excess of $5 billion.
26 OPPENHEIMER GLOBAL FUND/VA
Other Benefits to the Managers. In addition to considering the profits realized by the Managers, the Board considered information that was provided regarding the direct and indirect benefits the Managers receive as a result of their relationship with the Fund, including compensation paid to the Managers’ affiliates and research provided to the Adviser in connection with permissible brokerage arrangements (soft dollar arrangements). The Board also considered that the Managers must be able to pay and retain experienced professional personnel at competitive rates to provide quality services to the Fund.
Conclusions. These factors were also considered by the independent Trustees meeting separately from the full Board, assisted by experienced counsel to the Fund and to the independent Trustees. Fund counsel and the independent Trustees’ counsel are independent of the Managers within the meaning and intent of the Securities and Exchange Commission Rules.
Based on its review of the information it received and its evaluations described above, the Board, including a majority of the independent Trustees, decided to continue the Agreements through August 31, 2014. In arriving at its decision, the Board did not identify any factor or factors as being more important than others, but considered all of the above information, and considered the terms and conditions of the Agreements, including the management fees, in light of all the surrounding circumstances.
27 OPPENHEIMER GLOBAL FUND/VA
PORTFOLIO PROXY VOTING POLICIES AND PROCEDURES; UPDATES TO STATEMENTS OF INVESTMENTS Unaudited
The Fund has adopted Portfolio Proxy Voting Policies and Procedures under which the Fund votes proxies relating to securities (“portfolio proxies”) held by the Fund. A description of the Fund’s Portfolio Proxy Voting Policies and Procedures is available (i) without charge, upon request, by calling the Fund toll-free at 1.800.CALL OPP (225.5677), (ii) on the Fund’s website at oppenheimerfunds.com, and (iii) on the SEC’s website at www.sec.gov. In addition, the Fund is required to file Form N-PX, with its complete proxy voting record for the 12 months ended June 30th, no later than August 31st of each year. The Fund’s voting record is available (i) without charge, upon request, by calling the Fund toll-free at 1.800.CALL OPP (225.5677), and (ii) in the Form N-PX filing on the SEC’s website at www.sec.gov.
The Fund files its complete schedule of portfolio holdings with the SEC for the first quarter and the third quarter of each fiscal year on Form N-Q. The Fund’s Form N-Q filings are available on the SEC’s website at www.sec.gov. Those forms may be reviewed and copied at the SEC’s Public Reference Room in Washington, D.C. Information on the operation of the Public Reference Room may be obtained by calling 1-800-SEC-0330.
28 OPPENHEIMER GLOBAL FUND/VA
TRUSTEES AND OFFICERS Unaudited
| | |
Name, Position(s) Held with the Fund, Length of
Service, Year of Birth | | Principal Occupation(s) During the Past 5 Years; Other Trusteeships/Directorships Held;
Number of Portfolios in the Fund Complex Currently Overseen |
| |
| INDEPENDENT TRUSTEES | | The address of each Trustee in the chart below is 6803 S. Tucson Way, Centennial, Colorado 80112-3924. Each Trustee serves for an indefinite term, or until his or her resignation, retirement, death or removal. |
| |
Sam Freedman, Chairman of the Board of Trustees (since 2013) and Trustee (since 1996) Year of Birth: 1940 | | Director of Colorado UpLIFT (charitable organization) (since September 1984). Mr. Freedman held several positions with the Sub-Adviser and with subsidiary or affiliated companies of the Sub-Adviser (until October 1994). Oversees 39 portfolios in the OppenheimerFunds complex. Mr. Freedman has served on the Boards of certain Oppenheimer funds since 1996, during which time he has become familiar with the Fund’s (and other Oppenheimer funds’) financial, accounting, regulatory and investment matters and has contributed to the Boards’ deliberations. |
| |
Edward L. Cameron, Trustee (since 1999) Year of Birth: 1938 | | Member of The Life Guard of Mount Vernon (George Washington historical site) (June 2000-June 2006); Partner of PricewaterhouseCoopers LLP (accounting firm) (July 1974-June 1999); Chairman of Price Waterhouse LLP Global Investment Management Industry Services Group (accounting firm) (July 1994-June 1998). Oversees 39 portfolios in the OppenheimerFunds complex. Mr. Cameron has served on the Boards of certain Oppenheimer funds since 1999, during which time he has become familiar with the Fund’s (and other Oppenheimer funds’) financial, accounting, regulatory and investment matters and has contributed to the Boards’ deliberations. |
| |
Jon S. Fossel, Trustee (since 1990) Year of Birth: 1942 | | Chairman of the Board (2006-December 2011) and Director (June 2002-December 2011) of UNUMProvident (insurance company); Director of Northwestern Energy Corp. (public utility corporation) (November 2004-December 2009); Director of P.R. Pharmaceuticals (October 1999-October 2003); Director of Rocky Mountain Elk Foundation (non-profit organization) (February 1998-February 2003 and February 2005-February 2007); Chairman and Director (until October 1996) and President and Chief Executive Officer (until October 1995) of the Sub-Adviser; President, Chief Executive Officer and Director of the following: Oppenheimer Acquisition Corp. (“OAC”) (parent holding company of the Sub-Adviser), Shareholders Services, Inc. and Shareholder Financial Services, Inc. (until October 1995). Oversees 39 portfolios in the OppenheimerFunds complex. Mr. Fossel has served on the Boards of certain Oppenheimer funds since 1990, during which time he has become familiar with the Fund’s (and other Oppenheimer funds’) financial, accounting, regulatory and investment matters and has contributed to the Boards’ deliberations. |
| |
Richard F. Grabish, Trustee (since 2008) Year of Birth: 1948 | | Formerly Senior Vice President and Assistant Director of Sales and Marketing (March 1997-December 2007), Director (March 1987-December 2007) and Manager of Private Client Services (June 1985-June 2005) of A.G. Edwards & Sons, Inc. (broker/dealer and investment firm); Chairman and Chief Executive Officer of A.G. Edwards Trust Company, FSB (March 2001-December 2007); President and Vice Chairman of A.G. Edwards Trust Company, FSB (investment adviser) (April 1987-March 2001); President of A.G. Edwards Trust Company, FSB (investment adviser) (June 2005-December 2007). Oversees 39 portfolios in the OppenheimerFunds complex. Mr. Grabish has served on the Boards of certain Oppenheimer funds since 2001, during which time he has become familiar with the Fund’s (and other Oppenheimer funds’) financial, accounting, regulatory and investment matters and has contributed to the Boards’ deliberations. |
| |
Beverly L. Hamilton, Trustee (since 2002) Year of Birth: 1946 | | Trustee of Monterey Institute for International Studies (educational organization) (since February 2000); Board Member of Middlebury College (educational organization) (December 2005-June 2011); Chairman (since 2010) of American Funds’ Emerging Markets Growth Fund, Inc. (mutual fund); Director of The California Endowment (philanthropic organization) (April 2002-April 2008); Director (February 2002-2005) and Chairman of Trustees (2006-2007) of the Community Hospital of Monterey Peninsula; Director (October 1991-2005); Vice Chairman (2006-2009) of American Funds’ Emerging Markets Growth Fund, Inc. (mutual fund); President of ARCO Investment Management Company (February 1991-April 2000); Member of the investment committees of The Rockefeller Foundation (2001-2006) and The University of Michigan (since 2000); Advisor at Credit Suisse First Boston’s Sprout venture capital unit (venture capital fund) (1994-January 2005); Trustee of MassMutual Institutional Funds (investment company) (1996-June 2004); Trustee of MML Series Investment Fund (investment company) (April 1989-June 2004); Member of the investment committee of Hartford Hospital (2000-2003); and Advisor to Unilever (Holland) pension fund (2000-2003). Oversees 39 portfolios in the OppenheimerFunds complex. Ms. Hamilton has served on the Boards of certain Oppenheimer funds since 2002, during which time she has become familiar with the Fund’s (and other Oppenheimer funds’) financial, accounting, regulatory and investment matters and has contributed to the Boards’ deliberations. |
| |
Victoria J. Herget, Trustee (since 2012) Year of Birth: 1951 | | Independent Director of the First American Funds (mutual fund family) (2003-2011); former Managing Director (1993-2001), Principal (1985-1993), Vice President (1978-1985) and Assistant Vice President (1973-1978) of Zurich Scudder Investments (and its predecessor firms); Board Chair (2008-Present) and Director (2004-Present), United Educators (insurance company); Trustee (1992-2007), Chair of the Board of Trustees (1999-2007), Investment Committee Chair (1994-1999) and Investment Committee member (2007-2010) of Wellesley College; Trustee (since 2000) and Chair (since 2010), Newberry Library; Trustee, Mather LifeWays (since 2001); Trustee, BoardSource (2006-2009) and Chicago City Day School (1994-2005). Oversees 39 portfolios in the OppenheimerFunds complex. Ms. Herget has served on the Boards of certain Oppenheimer funds since 2012, during which time she has become familiar with the Fund’s (and other Oppenheimer funds’) financial, accounting, regulatory and investment matters and has contributed to the Boards’ deliberations. |
29 OPPENHEIMER GLOBAL FUND/VA
TRUSTEES AND OFFICERS Unaudited / Continued
| | |
Robert J. Malone, Trustee (since 2002) Year of Birth: 1944 Continued | | Chairman of the Board (since 2012) and Director (since August 2005) of Jones International University (educational organization) (since August 2005); Chairman, Chief Executive Officer and Director of Steele Street Bank Trust (commercial banking) (since August 2003); Trustee of the Gallagher Family Foundation (non-profit organization) (since 2000); Board of Directors of Opera Colorado Foundation (non-profit organization) (2008-2012); Director of Colorado UpLIFT (charitable organization) (1986-2010); Director of Jones Knowledge, Inc. (2006-2010); Former Chairman of U.S. Bank-Colorado (subsidiary of U.S. Bancorp and formerly Colorado National Bank) (July 1996-April 1999); Director of Commercial Assets, Inc. (real estate investment trust) (1993-2000); Director of U.S. Exploration, Inc. (oil and gas exploration) (1997-February 2004); Chairman of the Board (1991-1994) and Trustee (1985-1994) of Regis University; and Chairman of the Board (1990-1991 and Trustee (1984-1999) of Young Presidents Organization. Oversees 39 portfolios in the OppenheimerFunds complex. Mr. Malone has served on the Boards of certain Oppenheimer funds since 2002, during which time he has become familiar with the Fund’s (and other Oppenheimer funds’) financial, accounting, regulatory and investment matters and has contributed to the Boards’ deliberations. |
| |
F. William Marshall, Jr., Trustee (since 2000) Year of Birth: 1942 | | Trustee Emeritus of Worcester Polytech Institute (WPI) (private university) (since 2009); Trustee of MassMutual Select Funds (formerly MassMutual Institutional Funds) (investment company) (since 1996), MML Series Investment Fund (investment company) (since 1996) and Mass Mutual Premier Funds (investment company) (since January 2012); President and Treasurer of the SIS Fund (private charitable fund) (January 1999 – March 2011); Former Trustee of WPI (1985-2008); Former Chairman of the Board (2004-2006) and Former Chairman of the Investment Committee of WPI (1994-2008); Chairman of SIS & Family Bank, F.S.B. (formerly SIS Bank) (commercial bank) (January 1999-July 1999); Executive Vice President of Peoples Heritage Financial Group, Inc. (commercial bank) (January 1999-July 1999); and Former President and Chief Executive Officer of SIS Bancorp. (1993-1999). Oversees 43 portfolios in the OppenheimerFunds complex. Mr. Marshall has served on the Boards of certain Oppenheimer funds since 2000, during which time he has become familiar with the Fund’s (and other Oppenheimer funds’) financial, accounting, regulatory and investment matters and has contributed to the Boards’ deliberations. |
| |
Karen L. Stuckey, Trustee (since 2012) Year of Birth: 1953 | | Partner (1990-2012) of PricewaterhouseCoopers LLP (held various positions 1975-1990); Emeritus Trustee (since 2006), Trustee (1992-2006) and member of Executive, Nominating and Audit Committees and Chair of Finance Committee of Lehigh University; and member, Women’s Investment Management Forum since inception. Oversees 39 portfolios in the OppenheimerFunds complex. Ms. Stuckey has served on the Boards of certain Oppenheimer funds since 2012, during which time she has become familiar with the Fund’s (and other Oppenheimer funds’) financial, accounting, regulatory and investment matters and has contributed to the Boards’ deliberations. |
| |
James D. Vaughn, Trustee (since 2012) Year of Birth: 1945 | | Retired; former managing partner (1994-2001) of Denver office of Deloitte & Touche LLP, (held various positions 1969-1993); Trustee and Chairman of the Audit Committee of Schroder Funds (2003-2012); Board member and Chairman of Audit Committee of AMG National Trust Bank (since 2005); Trustee and Investment Committee member, University of South Dakota Foundation (since 1996); Board member, Audit Committee Member and past Board Chair, Junior Achievement (since 1993); former Board member, Mile High United Way, Boys and Girls Clubs, Boy Scouts, Colorado Business Committee for the Arts, Economic Club of Colorado and Metro Denver Network. Oversees 39 portfolios in the OppenheimerFunds complex. Mr. Vaughn has served on the Boards of certain Oppenheimer funds since 2012, during which time he has become familiar with the Fund’s (and other Oppenheimer funds’) financial, accounting, regulatory and investment matters and has contributed to the Boards’ deliberations. |
| | |
| INTERESTED TRUSTEE AND OFFICER | | Mr. Glavin is an “Interested Trustee” because he is affiliated with the Manager and the Sub-Adviser by virtue of his positions as an officer and director of the Manager and a director of the Sub-Adviser, and as a shareholder of the Sub-Adviser’s parent company. Both as a Trustee and as an officer, he serves for an indefinite term, or until his resignation, retirement, death or removal. Mr. Glavin’s address is Two World Financial Center, 225 Liberty Street, 11th Floor, New York, New York 10281-1008. |
| |
William F. Glavin, Jr., Trustee, President and Principal Executive Officer (since 2009) Year of Birth: 1958 | | Director, Chairman and Chief Executive Officer of the Manager (since January 2013); President of the Manager (January 2013-May 2013); Chairman of the Sub-Adviser (December 2009-December 2012); Chief Executive Officer (January 2009-December 2012) and Director of the Sub-Adviser (since January 2009); President of the Sub-Adviser (May 2009-December 2012); Management Director (since June 2009), President (since December 2009) and Chief Executive Officer (since January 2011) of Oppenheimer Acquisition Corp. (“OAC”) (the Sub-Adviser’s parent holding company); Director of Oppenheimer Real Asset Management, Inc. (since March 2010); Executive Vice President (March 2006-February 2009) and Chief Operating Officer (July 2007-February 2009) of Massachusetts Mutual Life Insurance Company (OAC’s parent company); Director (May 2004-March 2006) and Chief Operating Officer and Chief Compliance Officer (May 2004-January 2005), President (January 2005-March 2006) and Chief Executive Officer (June 2005-March 2006) of Babson Capital Management LLC; Director (March 2005-March 2006), President (May 2003-March 2006) and Chief Compliance Officer (July 2005-March 2006) of Babson Capital Securities, Inc. (a broker-dealer); President (May 2003-March 2006) of Babson Investment Company, Inc.; Director (May 2004-August 2006) of Babson Capital Europe Limited; Director (May 2004-October 2006) of Babson Capital Guernsey Limited; Director (May 2004-March 2006) of Babson Capital Management LLC; Non-Executive Director (March 2005-March 2007) of Baring Asset Management Limited; Director (February 2005-June 2006) Baring Pension Trustees Limited; Director and Treasurer (December 2003-November 2006) of Charter Oak Capital Management, Inc.; Director (May 2006-September 2006) of C.M. Benefit Insurance Company; Director (May 2008-June 2009) and Executive Vice President (June 2007-July 2009) of C.M. Life Insurance Company; President (March 2006-May 2007) of MassMutual Assignment Company; Director (January 2005-December 2006), Deputy Chairman (March 2005-December 2006) and President (February 2005-March 2005) of MassMutual Holdings (Bermuda) Limited; Director (May 2008-June 2009) and Executive Vice President (June 2007-July 2009) of MML Bay State Life Insurance Company; Chief Executive Officer and President (April 2007-January 2009) of MML Distributors, LLC; and Chairman (March 2006-December 2008) and Chief Executive Officer (May 2007-December 2008) of MML Investors Services, Inc. An officer of 90 portfolios in the OppenheimerFunds complex. |
30 OPPENHEIMER GLOBAL FUND/VA
| | |
| OTHER OFFICERS OF THE FUND | | The addresses of the Officers in the chart below are as follows: for Messrs. Bhaman, Gabinet and Ms. Nasta, Two World Financial Center, 225 Liberty Street, New York, New York 10281-1008, for Messrs. Vandehey and Wixted, 6803 S. Tucson Way, Centennial, Colorado 80112-3924. Each Officer serves for an indefinite term or until his or her resignation, retirement, death or removal. |
| |
Rajeev Bhaman, Vice President (since 2004) Year of Birth: 1963 | | Director of Global Equities of the Sub-Adviser (since January 2013); Senior Vice President of the Sub-Adviser (since May 2006); Vice President of the Sub-Adviser (January 1997-May 2006). An officer of other portfolios in the OppenheimerFunds complex. |
| |
Arthur S. Gabinet, Secretary and Chief Legal Officer (since 2011) Year of Birth: 1958 | | Executive Vice President, Secretary and General Counsel of the Manager (since January 2013); General Counsel OFI SteelPath, Inc. (since January 2013); Executive Vice President (May 2010-December 2012) and General Counsel (since January 2011) of the Sub-Adviser; General Counsel of the Distributor (since January 2011); General Counsel of Centennial Asset Management Corporation (January 2011-December 2012); Executive Vice President (January 2011-December 2012) and General Counsel of HarbourView Asset Management Corporation (since January 2011); Assistant Secretary (since January 2011) and Director (since January 2011) of OppenheimerFunds International Ltd. and OppenheimerFunds plc; Director of Oppenheimer Real Asset Management, Inc. (January 2011-December 2012) and General Counsel (since January 2011); Executive Vice President (January 2011-December 2011) and General Counsel of Shareholder Financial Services, Inc. and Shareholder Services, Inc. (since January 2011); Executive Vice President (January 2011-December 2012) and General Counsel of OFI Private Investments Inc. (since January 2011); Vice President of OppenheimerFunds Legacy Program (January 2011-December 2011); Executive Vice President (January 2011-December 2012) and General Counsel of OFI Institutional Asset Management, Inc. (since January 2011); General Counsel, Asset Management of the Sub-Adviser (May 2010-December 2010); Principal, The Vanguard Group (November 2005-April 2010); District Administrator, U.S. Securities and Exchange Commission (January 2003-October 2005). An officer of 90 portfolios in the OppenheimerFunds complex. |
| |
Christina M. Nasta, Vice President and Chief Business Officer (since 2011) Year of Birth: 1973 | | Senior Vice President of OppenheimerFunds Distributor, Inc. (since January 2013); Senior Vice President of the Sub-Adviser (July 2010-December 2012); Vice President of the Sub-Adviser (January 2003-July 2010); Vice President of OppenheimerFunds Distributor, Inc. (January 2003-July 2010). An officer of 90 portfolios in the OppenheimerFunds complex. |
| |
Mark S. Vandehey, Vice President and Chief Compliance Officer (since 2004) Year of Birth: 1950 | | Senior Vice President and Chief Compliance Officer of the Manager (since January 2013); Chief Compliance Officer of OFI SteelPath, Inc. (since January 2013); Senior Vice President of the Sub-Adviser (March 2004-December 2012); Chief Compliance Officer of the Sub-Adviser, OppenheimerFunds Distributor, Inc., OFI Trust Company, OFI Institutional Asset Management, Inc., Oppenheimer Real Asset Management, Inc., OFI Private Investments, Inc., Harborview Asset Management Corporation, Trinity Investment Management Corporation, and Shareholder Services, Inc. (since March 2004); Vice President of OppenheimerFunds Distributor, Inc., Centennial Asset Management Corporation and Shareholder Services, Inc. (June 1983-December 2012). An officer of 90 portfolios in the OppenheimerFunds complex. |
| |
Brian W. Wixted, Treasurer and Principal Financial & Accounting Officer (since 1999) Year of Birth: 1959 | | Senior Vice President of the Manager (since January 2013); Treasurer of the Sub-Adviser, HarbourView Asset Management Corporation, Shareholder Financial Services, Inc., Shareholder Services, Inc., and Oppenheimer Real Asset Management, Inc. (March 1999-June 2008), OFI Private Investments, Inc. (March 2000-June 2008), OppenheimerFunds International Ltd. and OppenheimerFunds plc (since May 2000), OFI Institutional Asset Management, Inc. (November 2000-June 2008), and OppenheimerFunds Legacy Program (charitable trust program established by the Sub-Adviser) (June 2003-December 2011); Treasurer and Chief Financial Officer of OFI Trust Company (since May 2000); Assistant Treasurer of Oppenheimer Acquisition Corporation (March 1999-June 2008). An officer of 90 portfolios in the OppenheimerFunds complex. |
The Fund’s Statement of Additional Information contains additional information about the Fund’s Trustees and Officers and is available without charge, upon request, by calling 1.800.988.8287.
31 OPPENHEIMER GLOBAL FUND/VA
OPPENHEIMER GLOBAL FUND/VA
A Series of Oppenheimer Variable Account Funds
| | |
| Manager | | OFI Global Asset Management, Inc. |
| |
| Sub-Adviser | | OppenheimerFunds, Inc. |
| |
| Distributor | | OppenheimerFunds Distributor, Inc. |
| |
| Transfer and | | OFI Global Asset Management, Inc. |
| Shareholder | | |
| Servicing Agent | | |
| |
| Sub-Transfer Agent | | Shareholder Services, Inc. |
| | DBA OppenheimerFunds Services |
| |
| Independent | | KPMGLLP |
| Registered | | |
| Public | | |
| Accounting | | |
| Firm | | |
| |
| Counsel | | K&L Gates LLP |
| |
| | Before investing, investors should carefully consider a fund’s investment objectives, risks, charges and expenses. Fund prospectuses and summary prospectuses contain this and other information about the funds, and may be obtained by asking your financial advisor, or calling us at 1.800.988.8287. Read prospectuses and summary prospectuses carefully before investing. |
| |
| | © 2014 OppenheimerFunds, Inc. All rights reserved. Oppenheimer funds are distributed by OppenheimerFunds Distributor, Inc. |

| | | | |
| December 31, 2013 | | |
| | | Oppenheimer Main Street Fund®/VA A Series of Oppenheimer Variable Account Funds | | Annual Report |
| | |
| | ANNUAL REPORT Listing of Top Holdings Fund Performance Discussion Financial Statements | | |

Portfolio Managers: Manind (“Mani”) Govil, CFA and
Benjamin Ram
| | | | | | | | | | | | |
Average Annual Total Returns For the Periods Ended 12/31/13 | |
| | | 1-Year | | | 5-Year | | | 10-Year | |
Non-Service Shares | | | 31.77 | % | | | 18.06 | % | | | 7.00 | % |
Service Shares | | | 31.44 | % | | | 17.76 | % | | | 6.73 | % |
Performance data quoted represents past performance, which does not guarantee future results. The investment return and principal value of an investment in the Fund will fluctuate so that an investor’s shares, when redeemed, may be worth more or less than their original cost. Current performance may be lower or higher than the performance quoted. For performance data current to the most recent month end, call us at 1.800.988.8287. The Fund’s total returns should not be expected to be the same as the returns of other funds, whether or not both funds have the same portfolio managers and/or similar names. The Fund’s total returns include changes in share price and reinvested distributions but do not include the charges associated with the separate account products that offer this Fund. Such performance would have been lower if such charges were taken into account.
TOP TEN COMMON STOCK HOLDINGS
| | | | |
Apple, Inc. | | | 4.6 | % |
JPMorgan Chase & Co. | | | 4.5 | |
Chevron Corp. | | | 3.8 | |
Google, Inc., Cl. A | | | 3.7 | |
Express Scripts Holding Co. | | | 3.4 | |
National Oilwell Varco, Inc. | | | 3.4 | |
Discover Financial Services | | | 3.3 | |
Philip Morris International, Inc. | | | 3.3 | |
AutoZone, Inc. | | | 3.2 | |
McGraw Hill Financial, Inc. | | | 2.9 | |
Portfolio holdings and allocations are subject to change. Percentages are as of December 31, 2013, and are based on net assets. For more current Fund holdings, please visit oppenheimerfunds.com.
SECTOR ALLOCATION
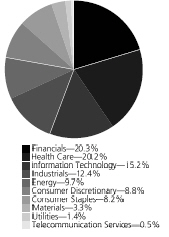
Portfolio holdings and allocations are subject to change. Percentages are as of December 31, 2013, and are based on the total market value of common stocks.
2 OPPENHEIMER MAIN STREET FUND/VA
| | |
Fund Performance Discussion |
The Fund’s Non-Service shares produced a total return of 31.77% during the one-year reporting period ended December 31, 2013, underperforming the S&P 500 Index, which returned 32.39% during the same period. The Fund outperformed the Index largely in the financials sector, where stronger relative stock selection benefited. Stronger relative stock selection in the industrials sector and an overweight position in the health care sector also benefited the Fund this period. Underperforming sectors for the Fund relative to the Index included consumer discretionary and information technology. The Fund underperformed in consumer discretionary due to less favorable stock selection and an underweight position, and in information technology, where weaker stock selection and an overweight position detracted.
MARKET OVERVIEW
Equities in the U.S. and developed markets throughout the world delivered strong performance in 2013. Accommodative monetary policies on the part of central banks in the U.S., Europe and Japan, combined with supportive equity valuations relative to bonds, were instrumental in this performance. Signs that the U.S. economy was on the mend, demonstrated by rising house prices, also helped sentiment toward stocks. While equities performed well for the year, numerous concerns remained. Namely, in late May, relatively hawkish remarks by Fed chairman Ben Bernanke were widely interpreted as a signal that U.S. monetary policymakers would begin to back away from their quantitative easing program sooner than expected, sparking heightened volatility in financial markets throughout the world. Additionally, fears began to creep into the market about a possible slowdown in the world’s emerging economies. However, market conditions generally stabilized over the summer of 2013. While the Fed unexpectedly refrained from reducing its monthly bond purchases in September, in December, the Central Bank announced that it would reduce its monthly bond purchases by $10 billion, from $85 billion to $75 billion, starting in January 2014. The Fed also announced that it would continue to hold short-term interest rates at very low levels until unemployment in the United States subsided below 6.5%. This was lower than its earlier 7% target.
TOP INDIVIDUAL CONTRIBUTORS
Top contributors to performance this period included Actavis plc, financial stocks JPMorgan Chase & Co. and Citigroup, Inc., Towers Watson & Co. and Facebook, Inc. Actavis is a branded and generic drug company whose shares spiked when management announced it was combining operations with Warner Chilcott – a leading specialty pharmaceutical company based in Ireland. The merged entity is expected to benefit from revenue synergies, with complementary product lines, and cost rationalization – both of which we believe have the potential to contribute to rising profits. The merger would also allow the company to reincorporate in Ireland, which could result in a significantly lower tax rate that would provide the potential not only to boost profits, but also cash generation.
The financials sector was the strongest performing sector for the Fund on both an absolute basis and relative to the Index. The ongoing, albeit modest, improvement in the economy – largely driven by the continued health of the housing sector – has led to lower foreclosures, increased credit quality, and rising demand for mortgages. As a result, stocks of many banks have benefited, including JPMorgan Chase and Citigroup. JPMorgan Chase also benefited from improved investor sentiment. During the period, management announced several litigation and regulatory settlements that largely address the overhang of “headline” risk that has plagued the stock. Although the total settlement sum is large in absolute terms, it is less than the dollar amount currently reserved for on JPMorgan’s balance sheet.
Towers Watson is a human resources consulting firm providing services related to employee benefits, talent management, rewards and risks and capital management. The company released strong financial results this reporting period. Over the second half of the period, social media giant Facebook reported strong quarterly results and answered concerns over its ability to deliver advertising via mobile devices as its mobile business grew. We exited our position in Facebook by period end as it had reached our estimate of fair value.
TOP INDIVIDUAL DETRACTORS
Top detractors from performance this period included America Movil SAB de CV, International Business Machines Corp. (“IBM”) and Apple, Inc. America Movil is a mobile carrier in Latin America. The Mexican government announced a reform proposal designed to create more competition, increase access to services, and reduce prices in the Mexican telecom sector. IBM reported disappointing revenues and earnings over the second quarter of 2013, due in part to delayed signings of new software and hardware bookings. A stronger dollar also negatively impacted top line growth. We exited our position. Apple hurt performance due in part to investor fears regarding the vitality of the high end smartphone market. However, Apple performed better over the closing months as a slightly better than consensus earnings outcome, a successful roll-out of the new iPad, and continued growth of iPhone 5S sales all contributed favorably to the stock. Additionally, the long awaited deal to sell iPhones through China Mobile – the world’s largest mobile operator – was finally announced.
3 OPPENHEIMER MAIN STREET FUND/VA
STRATEGY & OUTLOOK
Despite the high absolute dollar value of most market indices, stocks, generally, do not appear overvalued. While there may be pockets of overvaluation – specifically, high expectation stocks that have outperformed may be poised to take a breather – we believe there are still opportunities to identify attractively valued names. In particular, returns of higher-quality stocks (as measured by S&P Quality Ratings) have lagged since the market’s inflection in March 2009. Some of the factors that have aided higher returns of lower-quality stocks – namely, the Fed’s easy money policies – are nearing an end. This may favor higher quality stocks as investors once again focus on the importance of fundamentals. The “wild card” for 2014 remains just how far interest rates rise. Expectations are for rates to increase, but if they rise faster or farther than expectations, stocks could be in for a volatile ride.
Our approach remains consistent. We aim to construct an “all weather” portfolio by targeting companies we believe have: 1) sustainable competitive advantages; 2) skilled management with a proven track record of executing effectively; and 3) financial resources to generate improving profitability, gain market share, and/or return significant capital to shareholders. During times of volatile or slow economic growth such companies frequently widen their lead over weaker competitors. We seek to invest in companies, characterized by these qualities, at compelling valuations and believe this disciplined approach is essential in seeking to generate superior long-term performance.
Investors should consider the Fund’s investment objective, risks, charges and expenses carefully before investing. The Fund’s prospectus and summary prospectus contain this and other information about the Fund, and may be obtained by asking your financial advisor or calling us at 1.800.988.8287. Read prospectuses and summary prospectuses carefully before investing.
Total returns include changes in share price and reinvestment of dividends and capital gains distributions in a hypothetical investment for the periods shown.
The Fund’s investment strategy and focus can change over time. The mention of specific fund holdings does not constitute a recommendation by OppenheimerFunds, Inc. or its affiliates.
Shares of Oppenheimer funds are not deposits or obligations of any bank, are not guaranteed by any bank, are not insured by the FDIC or any other agency, and involve investment risks, including the possible loss of the principal amount invested.
Comparing the Fund’s Performance to the Market. The graphs that follow show the performance of a hypothetical $10,000 investment in each share class of the Fund held until December 31, 2013. Performance is measured over a ten-fiscal-year period for both Classes. Performance information does not reflect charges that apply to separate accounts investing in the Fund. If these charges were taken into account, performance would be lower. The graphs assume that all dividends and capital gains distributions were reinvested in additional shares.
The Fund’s performance is compared to the performance of the S&P 500 Index, an index of large-capitalization equity securities that is a measure of the general domestic stock market. The Index is unmanaged and cannot be purchased directly by investors. Index performance includes reinvestment of income, but does not reflect transaction costs, fees, expenses or taxes. Index performance is shown for illustrative purposes only as a benchmark for the Fund’s performance, and does not predict or depict performance of the Fund. The Fund’s performance reflects the effects of the Fund’s business and operating expenses.
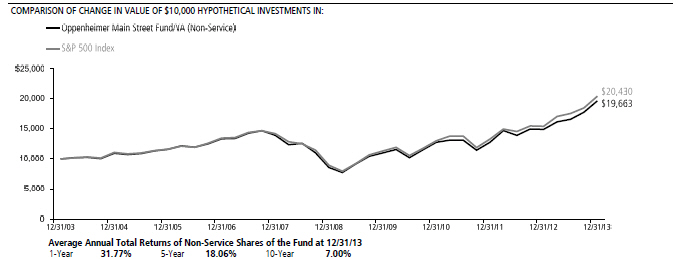
4 OPPENHEIMER MAIN STREET FUND/VA
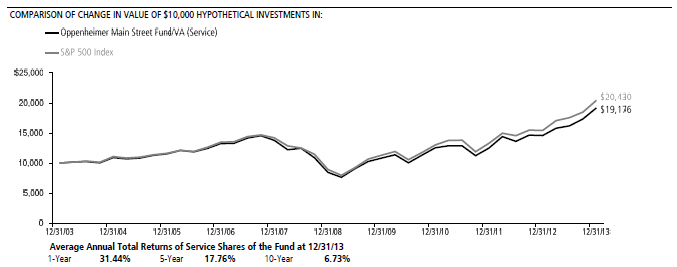
The performance data quoted represents past performance, which does not guarantee future results. The investment return and principal value of an investment in the Fund will fluctuate so that an investor’s shares, when redeemed, may be worth more or less than their original cost. Current performance may be lower or higher than the performance quoted. For performance data current to the most recent month end, call us at 1.800.988.8287. The Fund’s total returns should not be expected to be the same as the returns of other funds, whether or not both funds have the same portfolio managers and/or similar names. The Fund’s total returns include changes in share price and reinvested distributions but do not include the charges associated with the separate account products that offer this Fund. Such performance would have been lower if such charges were taken into account.
5 OPPENHEIMER MAIN STREET FUND/VA
Fund Expenses. As a shareholder of the Fund, you incur two types of costs: (1) transaction costs and (2) ongoing costs, including management fees; distribution and service fees; and other Fund expenses. These examples are intended to help you understand your ongoing costs (in dollars) of investing in the Fund and to compare these costs with the ongoing costs of investing in other mutual funds.
The examples are based on an investment of $1,000.00 invested at the beginning of the period and held for the entire 6-month period ended December 31, 2013.
Actual Expenses. The first section of the table provides information about actual account values and actual expenses. You may use the information in this section for the class of shares you hold, together with the amount you invested, to estimate the expense that you paid over the period. Simply divide your account value by $1,000.00 (for example, an $8,600.00 account value divided by $1,000.00 = 8.60), then multiply the result by the number in the first section under the heading entitled “Expenses Paid During Period” to estimate the expenses you paid on your account during this period.
Hypothetical Example for Comparison Purposes.
The second section of the table provides information about hypothetical account values and hypothetical expenses based on the Fund’s actual expense ratio for each class of shares, and an assumed rate of return of 5% per year for each class before expenses, which is not the actual return. The hypothetical account values and expenses may not be used to estimate the actual ending account balance or expenses you paid for the period. You may use this information to compare the ongoing costs of investing in the Fund and other funds. To do so, compare this 5% hypothetical example for the class of shares you hold with the 5% hypothetical examples that appear in the shareholder reports of the other funds.
Please note that the expenses shown in the table are meant to highlight your ongoing costs only and do not reflect any charges associated with the separate accounts that offer this Fund. Therefore, the “hypothetical” lines of the table are useful in comparing ongoing costs only, and will not help you determine the relative total costs of owning different funds. In addition, if these separate account charges were included your costs would have been higher.
| | | | | | | | | | | | | | |
| Actual | | Beginning
Account
Value
July 1, 2013 | | | Ending Account Value
December 31, 2013 | | | Expenses Paid During 6 Months Ended
December 31, 2013 | | | |
Non-Service shares | | $ | 1,000.00 | | | $ | 1,184.70 | | | $ | 4.30 | | | |
Service shares | | | 1,000.00 | | | | 1,183.30 | | | | 5.74 | | | |
| | | | |
Hypothetical | | | | | | | | | | | | | | |
(5% return before expenses) | | | | | | | | | | | | | | |
Non-Service shares | | | 1,000.00 | | | | 1,021.27 | | | | 3.98 | | | |
Service shares | | | 1,000.00 | | | | 1,019.96 | | | | 5.31 | | | |
Expenses are equal to the Fund’s annualized expense ratio for that class, multiplied by the average account value over the period, multiplied by 184/365 (to reflect the one-half year period). Those annualized expense ratios, excluding indirect expenses from affiliated funds, based on the 6-month period ended December 31, 2013 are as follows:
| | | | |
| Class | | Expense Ratios | | |
Non-Service shares | | 0.78% | | |
Service shares | | 1.04 | | |
The expense ratios reflect contractual waivers and/or reimbursements of expenses by the Fund’s Manager. Some of these undertakings may be modified or terminated at any time, unless approved by the Board of Trustees. The “Financial Highlights” tables in the Fund’s financial statements, included in this report, also show the gross expense ratios, without such waivers or reimbursements and reduction to custodian expenses, if applicable.
6 OPPENHEIMER MAIN STREET FUND/VA
STATEMENT OF INVESTMENTS December 31, 2013
| | | | | | | | |
| | | Shares | | | Value | |
Common Stocks—98.5% | | | | | | | | |
Consumer Discretionary—8.7% | | | | | | | | |
Auto Components—0.7% | | | | | | | | |
Delphi Automotive plc | | | 174,000 | | | $ | 10,462,620 | |
Media—2.9% | | | | | | | | |
Comcast Corp., Cl. A | | | 142,770 | | | | 7,419,043 | |
Time Warner, Inc. | | | 399,970 | | | | 27,885,908 | |
Twenty-First Century Fox, Inc., Cl. A | | | 229,410 | | | | 8,070,644 | |
| | | | | | | | 43,375,595 | |
Specialty Retail—4.4% | | | | | | | | |
AutoZone, Inc.1 | | | 98,410 | | | | 47,034,076 | |
TJX Cos., Inc. (The) | | | 268,770 | | | | 17,128,712 | |
| | | | | | | | 64,162,788 | |
Textiles, Apparel & Luxury Goods—0.7% | | | | | |
PVH Corp. | | | 75,610 | | | | 10,284,472 | |
Consumer Staples—8.2% | | | | | | | | |
Food Products—3.0% | | | | | | | | |
Kraft Foods Group, Inc. | | | 98,759 | | | | 5,325,085 | |
Mondelez International, Inc., Cl. A | | | 1,083,250 | | | | 38,238,725 | |
| | | | | | | | 43,563,810 | |
Household Products—1.9% | | | | | | | | |
Henkel AG & Co. KGaA | | | 201,012 | | | | 20,956,910 | |
Henkel AG & Co. KGaA, Preference | | | 58,285 | | | | 6,761,702 | |
| | | | | | | | 27,718,612 | |
Tobacco—3.3% | | | | | | | | |
Philip Morris International, Inc. | | | 555,349 | | | | 48,387,558 | |
Energy—9.7% | | | | | | | | |
Energy Equipment & Services—3.4% | | | | | | | | |
National Oilwell Varco, Inc. | | | 621,180 | | | | 49,402,445 | |
Oil, Gas & Consumable Fuels—6.3% | | | | | | | | |
Chevron Corp. | | | 445,110 | | | | 55,598,690 | |
Kinder Morgan, Inc. | | | 216,710 | | | | 7,801,560 | |
Noble Energy, Inc. | | | 428,790 | | | | 29,204,887 | |
| | | | | | | | 92,605,137 | |
Financials—19.9% | | | | | | | | |
Commercial Banks—2.4% | | | | | | | | |
CIT Group, Inc. | | | 689,390 | | | | 35,937,901 | |
Consumer Finance—3.3% | | | | | | | | |
Discover Financial Services | | | 870,183 | | | | 48,686,739 | |
Diversified Financial Services—9.5% | | | | | | | | |
Citigroup, Inc. | | | 344,358 | | | | 17,944,495 | |
CME Group, Inc. | | | 169,260 | | | | 13,280,140 | |
JPMorgan Chase & Co. | | | 1,147,250 | | | | 67,091,180 | |
McGraw Hill Financial, Inc. | | | 538,411 | | | | 42,103,740 | |
| | | | | | | | 140,419,555 | |
Insurance—4.2% | | | | | | | | |
American International Group, Inc. | | | 526,810 | | | | 26,893,650 | |
Lincoln National Corp. | | | 208,080 | | | | 10,741,090 | |
Marsh & McLennan Cos., Inc. | | | 509,810 | | | | 24,654,412 | |
| | | | | | | | 62,289,152 | |
Real Estate Investment Trusts (REITs)—0.5% | |
Digital Realty Trust, Inc. | | | 152,390 | | | | 7,485,397 | |
Health Care—19.8% | | | | | | | | |
Biotechnology—0.9% | | | | | | | | |
Gilead Sciences, Inc.1 | | | 180,830 | | | | 13,589,375 | |
Health Care Equipment & Supplies—4.1% | |
Covidien plc | | | 572,060 | | | | 38,957,286 | |
Intuitive Surgical, Inc.1 | | | 54,310 | | | | 20,859,385 | |
| | | | | | | | 59,816,671 | |
Health Care Providers & Services—5.2% | |
Express Scripts Holding Co.1 | | | 709,267 | | | | 49,818,914 | |
UnitedHealth Group, Inc. | | | 364,690 | | | | 27,461,157 | |
| | | | | | | | 77,280,071 | |
Pharmaceuticals—9.6% | | | | | | | | |
AbbVie, Inc. | | | 305,510 | | | | 16,133,983 | |
Actavis plc1 | | | 159,370 | | | | 26,774,160 | |
Allergan, Inc. | | | 308,820 | | | | 34,303,726 | |
Pfizer, Inc. | | | 699,719 | | | | 21,432,393 | |
Sanofi | | | 138,620 | | | | 14,755,545 | |
| | | | | | | | |
| | | Shares | | | Value | |
Pharmaceuticals Continued | | | | | | | | |
Zoetis, Inc. | | | 874,580 | | | $ | 28,590,020 | |
| | | | | | | | 141,989,827 | |
Industrials—12.0% | | | | | | | | |
Aerospace & Defense—0.2% | | | | | | | | |
L-3 Communications Holdings, Inc. | | | 27,800 | | | | 2,970,708 | |
Commercial Services & Supplies—2.8% | |
Tyco International Ltd. | | | 1,008,335 | | | | 41,382,068 | |
Industrial Conglomerates—2.0% | | | | | | | | |
General Electric Co. | | | 1,063,280 | | | | 29,803,739 | |
Machinery—1.4% | | | | | | | | |
Deere & Co. | | | 228,590 | | | | 20,877,125 | |
Professional Services—1.6% | | | | | | | | |
Towers Watson & Co., Cl. A | | | 181,740 | | | | 23,191,841 | |
Road & Rail—4.0% | | | | | | | | |
Canadian National Railway Co. | | | 724,850 | | | | 41,330,947 | |
CSX Corp. | | | 632,590 | | | | 18,199,614 | |
| | | | | | | | 59,530,561 | |
Information Technology—14.9% | | | | | | | | |
Computers & Peripherals—6.3% | | | | | | | | |
Apple, Inc. | | | 119,902 | | | | 67,278,211 | |
Western Digital Corp. | | | 312,780 | | | | 26,242,242 | |
| | | | | | | | 93,520,453 | |
Electronic Equipment, Instruments, & Components—1.3% | |
Avnet, Inc. | | | 239,850 | | | | 10,579,784 | |
Corning, Inc. | | | 476,120 | | | | 8,484,458 | |
| | | | | | | | 19,064,242 | |
Internet Software & Services—6.4% | |
eBay, Inc.1 | | | 728,545 | | | | 39,989,835 | |
Google, Inc., Cl. A1 | | | 48,380 | | | | 54,219,950 | |
| | | | | | | | 94,209,785 | |
IT Services—0.9% | | | | | | | | |
Amdocs Ltd. | | | 332,490 | | | | 13,711,888 | |
Materials—3.4% | | | | | | | | |
Chemicals—0.9% | | | | | | | | |
Air Products & Chemicals, Inc. | | | 83,160 | | | | 9,295,625 | |
PPG Industries, Inc. | | | 17,290 | | | | 3,279,221 | |
| | | | | | | | 12,574,846 | |
Construction Materials—2.5% | | | | | | | | |
Vulcan Materials Co. | | | 619,220 | | | | 36,794,052 | |
Telecommunication Services—0.5% | |
Wireless Telecommunication Services—0.5% | | | | | | | | |
America Movil SAB de CV, Series L, ADR | | | 330,836 | | | | 7,731,637 | |
Utilities—1.4% | | | | | | | | |
Electric Utilities—1.4% | | | | | | | | |
Exelon Corp. | | | 536,740 | | | | 14,701,308 | |
ITC Holdings Corp. | | | 59,980 | | | | 5,747,285 | |
| | | | | | | 20,448,593 | |
Total Common Stocks (Cost $968,162,807) | | | | | | | 1,453,269,263 | |
Investment Company—1.9% | | | | | | | | |
Oppenheimer Institutional Money Market Fund, Cl. E, 0.09%2,3
Cost $28,023,569) | | | 28,023,569 | | | | 28,023,569 | |
Total Investments, at Value (Cost $996,186,376) | | | 100.4 | % | | | 1,481,292,832 | |
| Liabilities in Excess of Other Assets | | | (0.4 | ) | | | (5,250,324 | ) |
Net Assets | | | 100.0 | % | | $ | 1,476,042,508 | |
7 OPPENHEIMER MAIN STREET FUND/VA
| | |
STATEMENT OF INVESTMENTS Continued |
Footnotes to Statement of Investments
1. Non-income producing security.
2. Is or was an affiliate, as defined in the Investment Company Act of 1940, at or during the period ended December 31, 2013, by virtue of the Fund owning at least 5% of the voting securities of the issuer or as a result of the Fund and the issuer having the same investment adviser. Transactions during the period in which the issuer was an affiliate are as follows:
| | | | | | | | | | | | | | | | |
| | | Shares
December 31, 2012 | | | Gross
Additions | | | Gross
Reductions | | | Shares
December 31, 2013 | |
Oppenheimer Institutional Money Market Fund, Cl. E | | | 24,937,150 | | | | 362,777,118 | | | | 359,690,699 | | | | 28,023,569 | |
| | | | |
| | | | | | | | | Value | | | Income | |
Oppenheimer Institutional Money Market Fund, Cl. E | | | | | | | | | | $ | 28,023,569 | | | $ | 16,571 | |
3. Rate shown is the 7-day yield as of December 31, 2013.
See accompanying Notes to Financial Statements.
8 OPPENHEIMER MAIN STREET FUND/VA
| | |
STATEMENT OF ASSETS AND LIABILITIES December 31, 2013 |
| | | | |
Assets | | | | |
Investments, at value—see accompanying statement of investments: | | | | |
Unaffiliated companies (cost $968,162,807) | | $ | 1,453,269,263 | |
Affiliated companies (cost $28,023,569) | | | 28,023,569 | |
| | | | 1,481,292,832 | |
Cash | | | 1,369 | |
Receivables and other assets: | | | | |
Investments sold | | | 10,345,575 | |
Dividends | | | 1,570,136 | |
Other | | | 75,124 | |
Total assets | | | 1,493,285,036 | |
Liabilities | | | | |
Payables and other liabilities: | | | | |
Investments purchased | | | 14,942,724 | |
Shares of beneficial interest redeemed | | | 1,828,535 | |
Distribution and service plan fees | | | 198,336 | |
Transfer and shareholder servicing agent fees | | | 123,445 | |
Trustees’ compensation | | | 73,552 | |
Shareholder communications | | | 46,164 | |
Other | | | 29,772 | |
Total liabilities | | | 17,242,528 | |
Net Assets | | $ | 1,476,042,508 | |
| | | | | |
Composition of Net Assets | | | | |
Par value of shares of beneficial interest | | $ | 47,484 | |
Additional paid-in capital | | | 961,546,555 | |
Accumulated net investment income | | | 9,456,107 | |
Accumulated net realized gain on investments and foreign currency transactions | | | 19,885,906 | |
Net unrealized appreciation on investments and translation of assets and liabilities denominated in foreign currencies | | | 485,106,456 | |
Net Assets | | $ | 1,476,042,508 | |
| | | | | |
Net Asset Value Per Share | | | | |
Non-Service Shares: | | | | |
Net asset value, redemption price (excludes applicable contingent deferred sales charge) and offering price per share (based on net assets of $561,015,363 and 17,958,266 shares of beneficial interest outstanding) | | | $31.24 | |
Service Shares: | | | | |
Net asset value, redemption price (excludes applicable contingent deferred sales charge) and offering price per share (based on net assets of $915,027,145 and 29,525,579 shares of beneficial interest outstanding) | | | $30.99 | |
See accompanying Notes to Financial Statements.
9 OPPENHEIMER MAIN STREET FUND/VA
| | |
STATEMENT OF OPERATIONS December 31, 2013 |
| | | | |
Investment Income | | | | |
Dividends: | | | | |
Unaffiliated companies (net of foreign withholding taxes of $206,609) | | $ | 23,311,652 | |
Affiliated companies | | | 16,571 | |
Interest | | | 269 | |
Total investment income | | | 23,328,492 | |
Expenses | | | | |
Management fees | | | 9,297,817 | |
Distribution and service plan fees—Service shares | | | 2,249,147 | |
Transfer and shareholder servicing agent fees: | | | | |
Non-Service shares | | | 517,606 | |
Service shares | | | 894,579 | |
Shareholder communications: | | | | |
Non-Service shares | | | 58,851 | |
Service shares | | | 99,426 | |
Trustees’ compensation | | | 66,804 | |
Custodian fees and expenses | | | 9,321 | |
Other | | | 153,494 | |
Total expenses | | | 13,347,045 | |
Less waivers and reimbursements of expenses | | | (14,989 | ) |
Net expenses | | | 13,332,056 | |
Net Investment Income | | | 9,996,436 | |
Realized and Unrealized Gain | | | | |
Net realized gain on: | | | | |
Investments from unaffiliated companies | | | 233,259,058 | |
Foreign currency transactions | | | 11,923 | |
Net realized gain | | | 233,270,981 | |
Net change in unrealized appreciation/depreciation on: | | | | |
Investments | | | 143,111,174 | |
Translation of assets and liabilities denominated in foreign currencies | | | 1,362,843 | |
Net change in unrealized appreciation/depreciation | | | 144,474,017 | |
Net Increase in Net Assets Resulting from Operations | | $ | 387,741,434 | |
See accompanying Notes to Financial Statements.
10 OPPENHEIMER MAIN STREET FUND/VA
| | |
STATEMENTS OF CHANGES IN NET ASSETS |
| | | | | | | | |
| | | Year Ended
December 31, 2013 | | | Year Ended
December 31, 2012 | |
Operations | | | | | | | | |
Net investment income | | $ | 9,996,436 | | | $ | 13,024,596 | |
Net realized gain | | | 233,270,981 | | | | 176,687,379 | |
Net change in unrealized appreciation/depreciation | | | 144,474,017 | | | | 22,837,127 | |
Net increase in net assets resulting from operations | | | 387,741,434 | | | | 212,549,102 | |
Dividends and/or Distributions to Shareholders | | | | | | | | |
Dividends from net investment income: | | | | | | | | |
Non-Service shares | | | (5,738,189 | ) | | | (4,702,221 | ) |
Service shares | | | (7,658,030 | ) | | | (5,916,709 | ) |
| | | (13,396,219 | ) | | | (10,618,930 | ) |
Beneficial Interest Transactions | | | | | | | | |
Net increase (decrease) in net assets resulting from beneficial interest transactions: | | | | | | | | |
Non-Service shares | | | (57,546,662 | ) | | | 27,414,824 | |
Service shares | | | (191,217,253 | ) | | | (274,928,927 | ) |
| | | (248,763,915 | ) | | | (247,514,103 | ) |
Net Assets | | | | | | | | |
Total increase (decrease) | | | 125,581,300 | | | | (45,583,931 | ) |
Beginning of period | | | 1,350,461,208 | | | | 1,396,045,139 | |
End of period (including accumulated net investment income of $9,456,107 and $12,733,895, respectively) | | $ | 1,476,042,508 | | | $ | 1,350,461,208 | |
See accompanying Notes to Financial Statements.
11 OPPENHEIMER MAIN STREET FUND/VA
| | | | | | | | | | | | | | | | | | | | |
Non-Service Shares | |
| Year Ended
December 31,
2013 |
| |
| Year Ended
December 31,
2012 |
| |
| Year Ended
December 30,
2011 |
1 | |
| Year Ended
December 31,
2010 |
| |
| Year Ended
December 31,
2009 |
|
Per Share Operating Data | | | | | | | | | | | | | | | | | | | | |
Net asset value, beginning of period | | $ | 23.97 | | | $ | 20.71 | | | $ | 20.88 | | | $ | 18.18 | | | $ | 14.56 | |
Income (loss) from investment operations: | | | | | | | | | | | | | | | | | | | | |
Net investment income2 | | | 0.24 | | | | 0.26 | | | | 0.16 | | | | 0.17 | | | | 0.21 | |
Net realized and unrealized gain (loss) | | | 7.33 | | | | 3.22 | | | | (0.16 | ) | | | 2.73 | | | | 3.71 | |
Total from investment operations | | | 7.57 | | | | 3.48 | | | | 0.00 | | | | 2.90 | | | | 3.92 | |
Dividends and/or distributions to shareholders: | | | | | | | | | | | | | | | | | | | | |
Dividends from net investment income | | | (0.30 | ) | | | (0.22 | ) | | | (0.17 | ) | | | (0.20 | ) | | | (0.30 | ) |
Net asset value, end of period | | $ | 31.24 | | | $ | 23.97 | | | $ | 20.71 | | | $ | 20.88 | | | $ | 18.18 | |
| | | | | | | | | | | | | | | | | | | | | |
Total Return, at Net Asset Value3 | | | 31.77 | % | | | 16.87 | % | | | (0.01 | )% | | | 16.11 | % | | | 28.29 | % |
Ratios/Supplemental Data | | | | | | | | | | | | | | | | | | | | |
Net assets, end of period (in thousands) | | $ | 561,016 | | | $ | 481,089 | | | $ | 392,861 | | | $ | 469,720 | | | $ | 474,637 | |
Average net assets (in thousands) | | $ | 517,750 | | | $ | 466,231 | | | $ | 426,354 | | | $ | 454,937 | | | $ | 430,517 | |
Ratios to average net assets:4 | | | | | | | | | | | | | | | | | | | | |
Net investment income | | | 0.87 | % | | | 1.12 | % | | | 0.79 | % | | | 0.93 | % | | | 1.35 | % |
Total expenses5 | | | 0.78 | % | | | 0.78 | % | | | 0.78 | % | | | 0.78 | % | | | 0.78 | % |
Expenses after payments, waivers and/or reimbursements and reduction to custodian expenses | | | 0.78 | % | | | 0.78 | % | | | 0.78 | % | | | 0.78 | % | | | 0.78 | % |
Portfolio turnover rate | | | 49 | % | | | 37 | % | | | 38 | % | | | 45 | % | | | 128 | % |
1. December 30, 2011 represents the last business day of the Fund’s reporting period.
2. Per share amounts calculated based on the average shares outstanding during the period.
3. Assumes an initial investment on the business day before the first day of the fiscal period, with all dividends and distributions reinvested in additional shares on the reinvestment date, and redemption at the net asset value calculated on the last business day of the fiscal period. Total returns are not annualized for periods less than one full year. Total return information does not reflect expenses that apply at the separate account level or to related insurance products. Inclusion of these charges would reduce the total return figures for all periods shown. Returns do not reflect the deduction of taxes that a shareholder would pay on fund distributions or the redemption of fund shares.
4. Annualized for periods less than one full year.
5. Total expenses including indirect expenses from affiliated fund were as follows:
| | | | |
Year Ended December 31, 2013 | | | 0.78 | % |
Year Ended December 31, 2012 | | | 0.78 | % |
Year Ended December 30, 2011 | | | 0.78 | % |
Year Ended December 31, 2010 | | | 0.78 | % |
Year Ended December 31, 2009 | | | 0.78 | % |
See accompanying Notes to Financial Statements.
12 OPPENHEIMER MAIN STREET FUND/VA
| | | | | | | | | | | | | | | | | | | | |
Service Shares | |
| Year Ended
December 31,
2013 |
| |
| Year Ended
December 31,
2012 |
| |
| Year Ended
December 30,
2011 |
1 | |
| Year Ended
December 31,
2010 |
| |
| Year Ended
December 31,
2009 |
|
Per Share Operating Data | | | | | | | | | | | | | | | | | | | | |
Net asset value, beginning of period | | $ | 23.78 | | | $ | 20.53 | | | $ | 20.71 | | | $ | 18.04 | | | $ | 14.42 | |
Income (loss) from investment operations: | | | | | | | | | | | | | | | | | | | | |
Net investment income2 | | | 0.17 | | | | 0.20 | | | | 0.11 | | | | 0.13 | | | | 0.17 | |
Net realized and unrealized gain (loss) | | | 7.27 | | | | 3.20 | | | | (0.17 | ) | | | 2.70 | | | | 3.70 | |
Total from investment operations | | | 7.44 | | | | 3.40 | | | | (0.06 | ) | | | 2.83 | | | | 3.87 | |
Dividends and/or distributions to shareholders: | | | | | | | | | | | | | | | | | | | | |
Dividends from net investment income | | | (0.23 | ) | | | (0.15 | ) | | | (0.12 | ) | | | (0.16 | ) | | | (0.25 | ) |
Net asset value, end of period | | $ | 30.99 | | | $ | 23.78 | | | $ | 20.53 | | | $ | 20.71 | | | $ | 18.04 | |
| | | | | | | | | | | | | | | | | | | | | |
Total Return, at Net Asset Value3 | | | 31.44 | % | | | 16.61 | % | | | (0.32 | )% | | | 15.83 | % | | | 27.99 | % |
Ratios/Supplemental Data | | | | | | | | | | | | | | | | | | | | |
Net assets, end of period (in thousands) | | $ | 915,027 | | | $ | 869,372 | | | $ | 1,003,184 | | | $ | 1,185,456 | | | $ | 1,154,210 | |
Average net assets (in thousands) | | $ | 895,073 | | | $ | 913,871 | | | $ | 1,094,254 | | | $ | 1,193,630 | | | $ | 1,029,909 | |
Ratios to average net assets:4 | | | | | | | | | | | | | | | | | | | | |
Net investment income | | | 0.62 | % | | | 0.85 | % | | | 0.54 | % | | | 0.68 | % | | | 1.10 | % |
Total expenses5 | | | 1.04 | % | | | 1.03 | % | | | 1.03 | % | | | 1.03 | % | | | 1.03 | % |
Expenses after payments, waivers and/or reimbursements and reduction to custodian expenses | | | 1.04 | % | | | 1.03 | % | | | 1.03 | % | | | 1.03 | % | | | 1.03 | % |
Portfolio turnover rate | | | 49 | % | | | 37 | % | | | 38 | % | | | 45 | % | | | 128 | % |
1. December 30, 2011 represents the last business day of the Fund’s reporting period.
2. Per share amounts calculated based on the average shares outstanding during the period.
3. Assumes an initial investment on the business day before the first day of the fiscal period, with all dividends and distributions reinvested in additional shares on the reinvestment date, and redemption at the net asset value calculated on the last business day of the fiscal period. Total returns are not annualized for periods less than one full year. Total return information does not reflect expenses that apply at the separate account level or to related insurance products. Inclusion of these charges would reduce the total return figures for all periods shown. Returns do not reflect the deduction of taxes that a shareholder would pay on fund distributions or the redemption of fund shares.
4. Annualized for periods less than one full year.
5. Total expenses including indirect expenses from affiliated fund were as follows:
| | | | |
Year Ended December 31, 2013 | | | 1.04 | % |
Year Ended December 31, 2012 | | | 1.03 | % |
Year Ended December 30, 2011 | | | 1.03 | % |
Year Ended December 31, 2010 | | | 1.03 | % |
Year Ended December 31, 2009 | | | 1.03 | % |
See accompanying Notes to Financial Statements.
13 OPPENHEIMER MAIN STREET FUND/VA
| | |
NOTES TO FINANCIAL STATEMENTS December 31, 2013 |
1. Significant Accounting Policies
Oppenheimer Main Street Fund/VA (the “Fund”) is a separate series of Oppenheimer Variable Account Funds, a diversified open-end management investment company registered under the Investment Company Act of 1940, as amended. The Fund’s investment objective is to seek capital appreciation. The Fund’s investment adviser is OFI Global Asset Management, Inc. (“OFI Global” or the “Manager”), a wholly-owned subsidiary of OppenheimerFunds, Inc. (“OFI” or the “Sub-Adviser”). The Manager has entered into a sub-advisory agreement with OFI. Shares of the Fund are sold only to separate accounts of life insurance companies.
The Fund offers two classes of shares. Both classes are sold at their offering price, which is the net asset value per share, to separate investment accounts of participating insurance companies as an underlying investment for variable life insurance policies, variable annuity contracts or other investment products. The class of shares designated as Service shares is subject to a distribution and service plan. Both classes of shares have identical rights and voting privileges with respect to the Fund in general and exclusive voting rights on matters that affect that class alone. Earnings, net assets and net asset value per share may differ due to each class having its own expenses, such as transfer and shareholder servicing agent fees and shareholder communications, directly attributable to that class.
The following is a summary of significant accounting policies consistently followed by the Fund.
Investment in Oppenheimer Institutional Money Market Fund. The Fund is permitted to invest daily available cash balances in an affiliated money market fund. The Fund may invest the available cash in Class E shares of Oppenheimer Institutional Money Market Fund (“IMMF”) to seek current income while preserving liquidity. IMMF is a registered open-end management investment company, regulated as a money market fund under the Investment Company Act of 1940, as amended. The Manager is the investment adviser of IMMF, and the Sub-Adviser provides investment and related advisory services to IMMF. When applicable, the Fund’s investment in IMMF is included in the Statement of Investments. Shares of IMMF are valued at their net asset value per share. As a shareholder, the Fund is subject to its proportional share of IMMF’s Class E expenses, including its management fee. The Manager will waive fees and/or reimburse Fund expenses in an amount equal to the indirect management fees incurred through the Fund’s investment in IMMF.
Foreign Currency Translation. The Fund’s accounting records are maintained in U.S. dollars. The values of securities denominated in foreign currencies and amounts related to the purchase and sale of foreign securities and foreign investment income are translated into U.S. dollars as of the close of the New York Stock Exchange (the “Exchange”), normally 4:00 P.M. Eastern time, on each day the Exchange is open for trading. Foreign exchange rates may be valued primarily using a reliable bank, dealer or service authorized by the Board of Trustees.
Reported net realized gains and losses from foreign currency transactions arise from sales of portfolio securities, sales and maturities of short-term securities, sales of foreign currencies, exchange rate fluctuations between the trade and settlement dates on securities transactions, and the difference between the amounts of dividends, interest, and foreign withholding taxes recorded on the Fund’s books and the U.S. dollar equivalent of the amounts actually received or paid. Net unrealized appreciation and depreciation on the translation of assets and liabilities denominated in foreign currencies arise from changes in the values of assets and liabilities, including investments in securities at fiscal period end, resulting from changes in exchange rates.
The effect of changes in foreign currency exchange rates on investments is separately identified from the fluctuations arising from changes in market values of securities held and reported with all other foreign currency gains and losses in the Fund’s Statement of Operations.
Allocation of Income, Expenses, Gains and Losses. Income, expenses (other than those attributable to a specific class), gains and losses are allocated on a daily basis to each class of shares based upon the relative proportion of net assets represented by such class. Operating expenses directly attributable to a specific class are charged against the operations of that class.
Federal Taxes. The Fund intends to comply with provisions of the Internal Revenue Code applicable to regulated investment companies and to distribute substantially all of its investment company taxable income, including any net realized gain on investments not offset by capital loss carryforwards, if any, to shareholders. Therefore, no federal income or excise tax provision is required. The Fund files income tax returns in U.S. federal and applicable state jurisdictions. The statute of limitations on the Fund’s tax return filings generally remain open for the three preceding fiscal reporting period ends.
The tax components of capital shown in the following table represent distribution requirements the Fund must satisfy under the income tax regulations, losses the Fund may be able to offset against income and gains realized in future years and unrealized appreciation or depreciation of securities and other investments for federal income tax purposes.
| | | | | | | | | | | | |
Undistributed
Net Investment
Income | |
| Undistributed
Long-Term
Gain |
| |
| Accumulated
Loss
Carryforward |
1,2,3 | |
| Net Unrealized
Appreciation
Based on cost of
Securities and
Other Investments
for Federal Income
Tax Purposes |
|
| $9,546,156 | | $ | 28,523,847 | | | $ | 7,541,964 | | | $ | 484,010,477 | |
1. As of December 31, 2013, the Fund had $7,541,964 of net capital loss carryforwards available to offset future realized capital gains, if any, and thereby reduce future taxable gain distributions. Details of the capital loss carryforwards are included in the table below. Capital loss carryovers with no expiration, if any, must be utilized prior to those with expiration dates.
14 OPPENHEIMER MAIN STREET FUND/VA
1. Significant Accounting Policies (Continued)
| | | | |
Expiring | | | | |
2015 | | $ | 5,027,976 | |
2016 | | | 2,513,988 | |
Total | | $ | 7,541,964 | |
Of these losses, $7,541,964 are subject to loss limitation rules resulting from merger activity. These limitations generally reduce the utilization of these losses to a maximum of $2,513,988 per year.
2. During the fiscal year ended December 31, 2013, the Fund utilized $198,916,700 of capital loss carryforward to offset capital gains realized in that fiscal year.
3. During the fiscal year ended December 31, 2012, the Fund utilized $171,760,057 of capital loss carryforward to offset capital gains realized in that fiscal year.
Net investment income (loss) and net realized gain (loss) may differ for financial statement and tax purposes. The character of dividends and distributions made during the fiscal year from net investment income or net realized gains may differ from their ultimate characterization for federal income tax purposes. Also, due to timing of dividends and distributions, the fiscal year in which amounts are distributed may differ from the fiscal year in which the income or net realized gain was recorded by the Fund.
Accordingly, the following amounts have been reclassified for December 31, 2013. Net assets of the Fund were unaffected by the reclassifications.
| | | | | | | | |
Increase to Paid-in Capital | |
| Increase
to Accumulated
Net Investment
Income |
| |
| Reduction
to Accumulated Net
Realized Gain on Investments |
4 |
$3,223,475 | | $ | 121,995 | | | $ | 3,345,470 | |
4. $3,236,611, all of which was long-term capital gain, was distributed in connection with Fund share redemptions.
The tax character of distributions paid during the years ended December 31, 2013 and December 31, 2012 was as follows:
| | | | | | | | |
| | |
| Year Ended
December 31, 2013 |
| |
| Year Ended
December 31, 2012 |
|
Distributions paid from: | | | | | | | | |
Ordinary income | | $ | 13,396,219 | | | $ | 10,618,930 | |
The aggregate cost of securities and other investments and the composition of unrealized appreciation and depreciation of securities and other investments for federal income tax purposes as of December 31, 2013 are noted in the following table. The primary difference between book and tax appreciation or depreciation of securities and other investments, if applicable, is attributable to the tax deferral of losses or tax realization of financial statement unrealized gain or loss.
| | | | |
Federal tax cost of securities | | $ | 997,282,355 | |
| | | | |
Gross unrealized appreciation | | $ | 485,001,661 | |
Gross unrealized depreciation | | | (991,184 | ) |
| | | | |
Net unrealized depreciation | | $ | (484,010,477 | ) |
| | | | |
Trustees’ Compensation. The Board of Trustees has adopted a compensation deferral plan for independent trustees that enables trustees to elect to defer receipt of all or a portion of the annual compensation they are entitled to receive from the Fund. For purposes of determining the amount owed to the Trustee under the plan, deferred amounts are treated as though equal dollar amounts had been invested in shares of the Fund or in other Oppenheimer funds selected by the Trustee. The Fund purchases shares of the funds selected for deferral by the Trustee in amounts equal to his or her deemed investment, resulting in a Fund asset equal to the deferred compensation liability. Such assets are included as a component of “Other” within the asset section of the Statement of Assets and Liabilities. Deferral of trustees’ fees under the plan will not affect the net assets of the Fund, and will not materially affect the Fund’s assets, liabilities or net investment income per share. Amounts will be deferred until distributed in accordance with the compensation deferral plan.
Dividends and Distributions to Shareholders. Dividends and distributions to shareholders, which are determined in accordance with income tax regulations and may differ from U.S. generally accepted accounting principles, are recorded on the ex-dividend date. Income and capital gain distributions, if any, are declared and paid annually or at other times as deemed necessary by the Manager.
Investment Income. Dividend income is recorded on the ex-dividend date or upon ex-dividend notification in the case of certain foreign dividends where the ex-dividend date may have passed. Non-cash dividends included in dividend income, if any, are recorded at the fair market value of the securities received. Interest income is recognized on an accrual basis. Discount and premium, which are included in interest income on the Statement of Operations, are amortized or accreted daily.
Custodian Fees. “Custodian fees and expenses” in the Statement of Operations may include interest expense incurred by the Fund on any cash overdrafts of its custodian account during the period. Such cash overdrafts may result from the effects of failed trades in portfolio securities and from
15 OPPENHEIMER MAIN STREET FUND/VA
| | |
NOTES TO FINANCIAL STATEMENTS Continued |
1. Significant Accounting Policies (Continued)
cash outflows resulting from unanticipated shareholder redemption activity. The Fund pays interest to its custodian on such cash overdrafts, to the extent they are not offset by positive cash balances maintained by the Fund, at a rate equal to the Federal Funds Rate plus 0.50%. The “Reduction to custodian expenses” line item, if applicable, represents earnings on cash balances maintained by the Fund during the period. Such interest expense and other custodian fees may be paid with these earnings.
Security Transactions. Security transactions are recorded on the trade date. Realized gains and losses on securities sold are determined on the basis of identified cost.
Indemnifications. The Fund’s organizational documents provide current and former trustees and officers with a limited indemnification against liabilities arising in connection with the performance of their duties to the Fund. In the normal course of business, the Fund may also enter into contracts that provide general indemnifications. The Fund’s maximum exposure under these arrangements is unknown as this would be dependent on future claims that may be made against the Fund. The risk of material loss from such claims is considered remote.
Other. The preparation of financial statements in conformity with accounting principles generally accepted in the United States of America requires management to make estimates and assumptions that affect the reported amounts of assets and liabilities and disclosure of contingent assets and liabilities at the date of the financial statements and the reported amounts of increases and decreases in net assets from operations during the reporting period. Actual results could differ from those estimates.
2. Securities Valuation
The Fund calculates the net asset value of its shares as of the close of the New York Stock Exchange (the “Exchange”), normally 4:00 P.M. Eastern time, on each day the Exchange is open for trading.
The Fund’s Board has adopted procedures for the valuation of the Fund’s securities and has delegated the day-to-day responsibility for valuation determinations under those procedures to the Manager. The Manager has established a Valuation Committee which is responsible for determining a “fair valuation” for any security for which market quotations are not “readily available.” The Valuation Committee’s fair valuation determinations are subject to review, approval and ratification by the Fund’s Board at its next regularly scheduled meeting covering the calendar quarter in which the fair valuation was determined.
Valuation Methods and Inputs
Securities are valued using unadjusted quoted market prices, when available, as supplied primarily by third party pricing services or dealers.
The following methodologies are used to determine the market value or the fair value of the types of securities described below:
Securities traded on a registered U.S. securities exchange (including exchange-traded derivatives other than futures and futures options) are valued based on the last sale price of the security reported on the principal exchange on which it is traded, prior to the time when the Fund’s assets are valued. In the absence of a sale, the security is valued at the last sale price on the prior trading day, if it is within the spread of the current day’s closing “bid” and “asked” prices, and if not, at the current day’s closing bid price. A security of a foreign issuer traded on a foreign exchange, but not listed on a registered U.S. securities exchange, is valued based on the last sale price on the principal exchange on which the security is traded, as identified by the third party pricing service used by the Manager, prior to the time when the Fund’s assets are valued. If the last sale price is unavailable, the security is valued at the most recent official closing price on the principal exchange on which it is traded. If the last sales price or official closing price for a foreign security is not available, the security is valued at the mean between the bid and asked price per the exchange or, if not available from the exchange, obtained from two dealers. If bid and asked prices are not available from either the exchange or two dealers, the security is valued by using one of the following methodologies (listed in order of priority); (1) using a bid from the exchange, (2) the mean between the bid and asked price as provided by a single dealer, or (3) a bid from a single dealer.
Shares of a registered investment company that are not traded on an exchange are valued at that investment company’s net asset value per share.
Corporate and government debt securities (of U.S. or foreign issuers) and municipal debt securities, event-linked bonds, loans, mortgage-backed securities, collateralized mortgage obligations, and asset-backed securities are valued at the mean between the “bid” and “asked” prices utilizing evaluated prices obtained from third party pricing services or broker-dealers who may use matrix pricing methods to determine the evaluated prices.
Short-term money market type debt securities with a remaining maturity of sixty days or less are valued at cost adjusted by the amortization of discount or premium to maturity (amortized cost), which approximates market value. Short-term debt securities with a remaining maturity in excess of sixty days are valued at the mean between the “bid” and “asked” prices utilizing evaluated prices obtained from third party pricing services or broker-dealers.
A description of the standard inputs that may generally be considered by the third party pricing vendors in determining their evaluated prices is provided below.
| | |
| Security Type | | Standard inputs generally considered by third-party pricing vendors |
| Corporate debt, government debt, municipal, mortgage-backed and asset-backed securities | | Reported trade data, broker-dealer price quotations, benchmark yields, issuer spreads on comparable securities, the credit quality, yield, maturity, and other appropriate factors. |
| Loans | | Information obtained from market participants regarding reported trade data and broker-dealer price quotations. |
| Event-linked bonds | | Information obtained from market participants regarding reported trade data and broker-dealer price quotations. |
16 OPPENHEIMER MAIN STREET FUND/VA
2. Securities Valuation (Continued)
If a market value or price cannot be determined for a security using the methodologies described above, or if, in the “good faith” opinion of the Manager, the market value or price obtained does not constitute a “readily available market quotation,” or a significant event has occurred that would materially affect the value of the security the security is fair valued either (i) by a standardized fair valuation methodology applicable to the security type or the significant event as previously approved by the Valuation Committee and the Fund’s Board or (ii) as determined in good faith by the Manager’s Valuation Committee. The Valuation Committee considers all relevant facts that are reasonably available, through either public information or information available to the Manager, when determining the fair value of a security. Fair value determinations by the Manager are subject to review, approval and ratification by the Fund’s Board at its next regularly scheduled meeting covering the calendar quarter in which the fair valuation was determined. Those fair valuation standardized methodologies include, but are not limited to, valuing securities at the last sale price or initially at cost and subsequently adjusting the value based on: changes in company specific fundamentals, changes in an appropriate securities index, or changes in the value of similar securities which may be further adjusted for any discounts related to security-specific resale restrictions. When possible, such methodologies use observable market inputs such as unadjusted quoted prices of similar securities, observable interest rates, currency rates and yield curves. The methodologies used for valuing securities are not necessarily an indication of the risks associated with investing in those securities nor can it be assured that the Fund can obtain the fair value assigned to a security if it were to sell the security.
To assess the continuing appropriateness of security valuations, the Manager, or its third party service provider who is subject to oversight by the Manager, regularly compares prior day prices, prices on comparable securities, and sale prices to the current day prices and challenges those prices exceeding certain tolerance levels with the third party pricing service or broker source. For those securities valued by fair valuations, whether through a standardized fair valuation methodology or a fair valuation determination, the Valuation Committee reviews and affirms the reasonableness of the valuations based on such methodologies and fair valuation determinations on a regular basis after considering all relevant information that is reasonably available.
Classifications
Each investment asset or liability of the Fund is assigned a level at measurement date based on the significance and source of the inputs to its valuation. Various data inputs are used in determining the value of each of the Fund’s investments as of the reporting period end. These data inputs are categorized in the following hierarchy under applicable financial accounting standards:
1) Level 1-unadjusted quoted prices in active markets for identical assets or liabilities (including securities actively traded on a securities exchange)
2) Level 2-inputs other than unadjusted quoted prices that are observable for the asset or liability (such as unadjusted quoted prices for similar assets and market corroborated inputs such as interest rates, prepayment speeds, credit risks, etc.)
3) Level 3-significant unobservable inputs (including the Manager’s own judgments about assumptions that market participants would use in pricing the asset or liability).
The inputs used for valuing securities are not necessarily an indication of the risks associated with investing in those securities.
The table below categorizes amounts that are included in the Fund’s Statement of Assets and Liabilities as of December 31, 2013 based on valuation input level:
| | | | | | | | | | | | | | | | |
| | | Level 1—
Unadjusted
Quoted Prices | | | Level 2—
Other Significant
Observable Inputs | | | Level 3—
Significant
Unobservable
Inputs | | | Value | |
Assets Table | | | | | | | | | | | | | | | | |
Investments, at Value: | | | | | | | | | | | | | | | | |
Common Stocks | | | | | | | | | | | | | | | | |
Consumer Discretionary | | $ | 128,285,475 | | | $ | — | | | $ | — | | | $ | 128,285,475 | |
Consumer Staples | | | 91,951,368 | | | | 27,718,612 | | | | — | | | | 119,669,980 | |
Energy | | | 142,007,582 | | | | — | | | | — | | | | 142,007,582 | |
Financials | | | 294,818,744 | | | | — | | | | — | | | | 294,818,744 | |
Health Care | | | 277,920,399 | | | | 14,755,545 | | | | — | | | | 292,675,944 | |
Industrials | | | 177,756,042 | | | | — | | | | — | | | �� | 177,756,042 | |
Information Technology | | | 220,506,368 | | | | — | | | | — | | | | 220,506,368 | |
Materials | | | 49,368,898 | | | | — | | | | — | | | | 49,368,898 | |
Telecommunication Services | | | 7,731,637 | | | | — | | | | — | | | | 7,731,637 | |
Utilities | | | 20,448,593 | | | | — | | | | — | | | | 20,448,593 | |
Investment Company | | | 28,023,569 | | | | — | | | | — | | | | 28,023,569 | |
Total Assets | | $ | 1,438,818,675 | | | $ | 42,474,157 | | | $ | — | | | $ | 1,481,292,832 | |
Currency contracts and forwards, if any, are reported at their unrealized appreciation/ depreciation at measurement date, which represents the change in the contract’s value from trade date. Futures, if any, are reported at their variation margin at measurement date, which represents the amount due to/from the Fund at that date. All additional assets and liabilities included in the above table are reported at their market value at measurement date.
The table below shows the transfers between Level 1 and Level 2. The Fund’s policy is to recognize transfers in and transfers out as of the beginning of the reporting period.
17 OPPENHEIMER MAIN STREET FUND/VA
| | |
NOTES TO FINANCIAL STATEMENTS Continued |
2. Securities Valuation (Continued)
| | | | | | | | |
| | | Transfers out of Level 1* | | | Transfers into Level 2* | |
Assets Table | | | | | | | | |
Investments, at Value: | | | | | | | | |
Commons Stocks | | | | | | | | |
Consumer Staples | | $ | (5,364,390 | ) | | $ | 5,364,390 | |
Total Assets | | $ | (5,364,390 | ) | | $ | 5,364,390 | |
| * | Transferred from Level 1 to Level 2 due to the absence of a readily available unadjusted quoted market price. |
3. Shares of Beneficial Interest
The Fund has authorized an unlimited number of $0.001 par value shares of beneficial interest of each class. Transactions in shares of beneficial interest were as follows:
| | | | | | | | | | | | | | | | |
| | | Year Ended December 31, 2013 | | | Year Ended December 31, 2012 | |
| | | Shares | | | Amount | | | Shares | | | Amount | |
Non-Service Shares | | | | | | | | | | | | | | | | |
Sold | | | 1,001,432 | | | $ | 27,082,174 | | | | 1,232,469 | | | $ | 28,052,495 | |
Dividends and/or distributions reinvested | | | 211,118 | | | | 5,738,189 | | | | 209,174 | | | | 4,702,221 | |
Acquisition—Note 6 | | | — | | | | — | | | | 3,253,848 | | | | 77,116,190 | |
Redeemed | | | (3,327,965 | ) | | | (90,367,025 | ) | | | (3,592,251 | ) | | | (82,456,082 | ) |
Net increase (decrease) | | | (2,115,415 | ) | | $ | (57,546,662 | ) | | | 1,103,240 | | | $ | 27,414,824 | |
| | | | | | | | | | | | | | | | | |
Service Shares | | | | | | | | | | | | | | | | |
Sold | | | 590,719 | | | $ | 15,489,645 | | | | 1,461,740 | | | $ | 33,302,188 | |
Dividends and/or distributions reinvested | | | 283,631 | | | | 7,658,030 | | | | 264,967 | | | | 5,916,709 | |
Redeemed | | | (7,913,253 | ) | | | (214,364,928 | ) | | | (14,016,400 | ) | | | (314,147,824 | ) |
Net decrease | | | (7,038,903 | ) | | $ | (191,217,253 | ) | | | (12,289,693 | ) | | $ | (274,928,927 | ) |
4. Purchases and Sales of Securities
The aggregate cost of purchases and proceeds from sales of securities, other than short-term obligations and investments in IMMF, for the year ended December 31, 2013 were as follows:
| | | | | | | | | | |
| | | Purchases | | | | | Sales | |
Investment securities | | $ | 680,605,432 | | | | | $ | 936,163,909 | |
5. Fees and Other Transactions with Affiliates
Management Fees. Under the investment advisory agreement, the Fund pays the Manager a management fee based on the daily net assets of the Fund at an annual rate as shown in the following table:
| | | | |
Fee Schedule Through October 31, 2013 | |
Up to $200 million | | | 0.75% | |
Next $200 million | | | 0.72 | |
Next $200 million | | | 0.69 | |
Next $200 million | | | 0.66 | |
Over $800 million | | | 0.60 | |
| | | | |
Fee Schedule Effective November 1, 2013 | |
Up to $200 million | | | 0.75% | |
Next $200 million | | | 0.72 | |
Next $200 million | | | 0.69 | |
Next $200 million | | | 0.66 | |
Next $200 million | | | 0.60 | |
Over $1 billion | | | 0.58 | |
Sub-Adviser Fees. The Manager has retained the Sub-Adviser to provide the day-to-day portfolio management of the Fund. Under the Sub-Advisory Agreement, the Manager pays the Sub-Adviser an annual fee in monthly installments, equal to a percentage of the investment management fee collected by the Manager from the Fund, which shall be calculated after any investment management fee waivers. The fee paid to the Sub-Adviser is paid by the Manager, not by the Fund.
Transfer Agent Fees. OFI Global (the “Transfer Agent”) serves as the transfer and shareholder servicing agent for the Fund. Fees incurred by the Fund with respect to these services are detailed in the Statement of Operations.
Sub-Transfer Agent Fees. The Transfer Agent has retained Shareholder Services, Inc., a wholly-owned subsidiary of OFI (the “Sub-Transfer Agent”), to provide the day-to-day transfer agent and shareholder servicing of the Fund. Under the Sub-Transfer Agency Agreement, the Transfer Agent pays the Sub-Transfer Agent an annual fee in monthly installments, equal to a percentage of the transfer agent fee collected by the Transfer Agent from the Fund, which shall be calculated after any applicable fee waivers. The fee paid to the Sub-Transfer Agent is paid by the Transfer Agent, not by the Fund.
18 OPPENHEIMER MAIN STREET FUND/VA
5. Fees and Other Transactions with Affiliates (Continued)
Distribution and Service Plan for Service Shares. The Fund has adopted a Distribution and Service Plan (the “Plan”) in accordance with Rule 12b-1 under the Investment Company Act of 1940 for Service shares to pay OppenheimerFunds Distributor, Inc. (the “Distributor”), for distribution related services, personal service and account maintenance for the Fund’s Service shares. Under the Plan, payments are made periodically at an annual rate of 0.25% of the daily net assets of Service shares of the Fund. The Distributor currently uses all of those fees to compensate sponsors of the insurance product that offers Fund shares, for providing personal service and maintenance of accounts of their variable contract owners that hold Service shares. These fees are paid out of the Fund’s assets on an on-going basis and increase operating expenses of the Service shares, which results in lower performance compared to the Fund’s shares that are not subject to a service fee. Fees incurred by the Fund under the Plan are detailed in the Statement of Operations.
Waivers and Reimbursements of Expenses. The Manager has contractually agreed to limit the Fund’s expenses after payments, waivers and/or reimbursements and reduction to custodian expenses, excluding expenses incurred directly or indirectly by the Fund as a result of investments in other investment companies, wholly-owned subsidiaries and pooled investment vehicles; so that those expenses, as percentages of daily net assets, will not exceed the annual rate of 0.80% for Non-Service shares and 1.05% for Service shares. During the year ended December 31, 2013, the Manager waived fees and/or reimbursed the Fund $197 for Non-Service shares.
The Manager will waive fees and/or reimburse Fund expenses in an amount equal to the indirect management fees incurred through the Fund’s investment in IMMF. During the year ended December 31, 2013, the Manager waived fees and/or reimbursed the Fund $14,792 for IMMF management fees.
Some of these undertakings may be modified or terminated at any time; some may not be modified or terminated until after one year from the date of the current prospectus, as indicated therein.
6. Acquisition of Growth Portfolio
On April 26, 2012, the Fund acquired all of the net assets of Growth Portfolio, pursuant to an Agreement and Plan of Reorganization approved by the Growth Portfolio shareholders on April 20, 2012. The purpose of this acquisition is to combine two funds with similar investment objectives, strategies and risks to allow shareholders to benefit from greater asset growth potential, as well as lowered total expenses. The transaction qualified as a tax-free reorganization, (the “merger”) for federal income tax purposes allowing the Fund to use the original cost basis of the investments received to calculate subsequent gains and losses for tax reporting purposes. Details of the merger are shown in the following table:
| | | | | | | | | | | | | | | | |
| | |
| Exchange Ratio to One Share
of the Growth Portfolio |
| |
| Shares of Beneficial Interest
Issued by the Fund |
| |
| Value of Issued Shares of
Beneficial Interest |
| |
| Combined Net Assets on
April 26, 2012 |
1 |
Non-Service Shares | | | 0.0953467932 | | | | 3,253,848 | | | | $77,116,190 | | | | $517,094,352 | |
1. The net assets acquired included net unrealized appreciation of $18,020,315 and an unused capital loss carryforward of $35,875,587, potential utilization subject to tax limitations.
7. Pending Litigation
Since 2009, seven class action lawsuits have been pending in the U.S. District Court for the District of Colorado against OppenheimerFunds, Inc. (“OFI”), OppenheimerFunds Distributor, Inc., the Fund’s principal underwriter and distributor (the “Distributor”), and certain funds (but not including the Fund) advised by OFI Global Asset Management, Inc. and distributed by the Distributor (the “Defendant Funds”). The lawsuits also name as defendants certain officers and current and former trustees of the respective Defendant Funds. The lawsuits raise claims under federal securities law and allege, among other things, that the disclosure documents of the respective Defendant Funds contained misrepresentations and omissions and that the respective Defendant Funds’ investment policies were not followed. The plaintiffs in these actions seek unspecified damages, equitable relief and awards of attorneys’ fees and litigation expenses. The Defendant Funds’ Boards of Trustees have also engaged counsel to represent the Funds and the present and former Independent Trustees named in those suits. On August 26, 2013, the parties in six of these lawsuits executed a memorandum of understanding setting forth the terms of proposed settlements of those actions. The proposed settlements are subject to a variety of contingencies, including the execution of settlement agreements, which will require preliminary and final approval by the court. The proposed settlements do not resolve a seventh outstanding lawsuit relating to Oppenheimer California Municipal Fund.
Other class action and individual lawsuits have been filed since 2008 in various state and federal courts against OFI and certain of its affiliates by investors seeking to recover investments they allegedly lost as a result of the “Ponzi” scheme run by Bernard L. Madoff and his firm, Bernard L. Madoff Investment Securities, LLC (“BLMIS”). Plaintiffs in these suits allege that they suffered losses as a result of their investments in several funds managed by an affiliate of OFI and assert a variety of claims, including breach of fiduciary duty, fraud, negligent misrepresentation, unjust enrichment, and violation of federal and state securities laws and regulations, among others. They seek unspecified damages, equitable relief and awards of attorneys’ fees and litigation expenses. Neither the Distributor, nor any of the Oppenheimer mutual funds, their independent trustees or directors are named as defendants in these lawsuits. None of the Oppenheimer mutual funds invested in any funds or accounts managed by Madoff or BLMIS. On February 28, 2011, a stipulation of partial settlement of three groups of consolidated putative class action lawsuits relating to these matters was filed in the U.S. District Court for the Southern District of New York. On August 19, 2011, the court entered an order and final judgment approving the settlement as fair, reasonable and adequate. In September 2011, certain parties filed notices of appeal from the court’s order approving the settlement. The settlement does not resolve other outstanding lawsuits against OFI and its affiliates relating to BLMIS.
On April 16, 2010, a lawsuit was filed in New York state court against (i) OFI, (ii) an affiliate of OFI and (iii) AAArdvark IV Funding Limited (“AAArdvark IV”), an entity advised by OFI’s affiliate, in connection with investments made by the plaintiffs in AAArdvark IV. Plaintiffs allege breach of contract and common law fraud claims against the defendants and seek compensatory damages, costs and disbursements, including attorney fees. On
19 OPPENHEIMER MAIN STREET FUND/VA
| | |
NOTES TO FINANCIAL STATEMENTS Continued |
7. Pending Litigation (Continued)
April 11, 2013, the court granted defendants’ motion for summary judgment, dismissing plaintiffs’ fraud claim with prejudice and dismissing their contract claim without prejudice, and granted plaintiffs leave to replead their contract claim to assert a cause of action for specific performance within 30 days. On May 9, 2013, plaintiffs filed a notice of appeal from the court’s dismissal order. On January 7, 2014, the appellate court affirmed the trial court’s dismissal order. On July 15, 2011, a lawsuit was filed in New York state court against OFI, an affiliate of OFI and AAArdvark Funding Limited (“AAArdvark I”), an entity advised by OFI’s affiliate, in connection with investments made by the plaintiffs in AAArdvark I. The complaint alleges breach of contract and common law fraud claims against the defendants and seeks compensatory damages, costs and disbursements, including attorney fees. On November 9, 2011, a lawsuit was filed in New York state court against OFI, an affiliate of OFI and AAArdvark XS Funding Limited (“AAArdvark XS”), an entity advised by OFI’s affiliate, in connection with investments made by the plaintiffs in AAArdvark XS. The complaint alleged breach of contract against the defendants and sought compensatory damages, costs and disbursements, including attorney fees. On November 8, 2013, the parties filed a stipulation of discontinuance dismissing the lawsuit with prejudice.
OFI believes the lawsuits and appeals described above are without legal merit and, with the exception of actions it has settled, is defending against them vigorously. While it is premature to render any opinion as to the outcome in these lawsuits, or whether any costs that the Defendant Funds may bear in defending the suits might not be reimbursed by insurance, OFI believes that these suits should not impair the ability of OFI or the Distributor to perform their respective duties to the Fund, and that the outcome of all of the suits together should not have any material effect on the operations of any of the Oppenheimer mutual funds.
20 OPPENHEIMER MAIN STREET FUND/VA
| | |
REPORT OF INDEPENDENT REGISTERED PUBLIC ACCOUNTING FIRM |
The Board of Trustees and Shareholders of Oppenheimer Variable Account Funds:
We have audited the accompanying statement of assets and liabilities of Oppenheimer Main Street Fund/VA (a separate series of Oppenheimer Variable Account Funds), including the statement of investments, as of December 31, 2013, and the related statement of operations for the year then ended, the statements of changes in net assets for each of the years in the two-year period then ended, and the financial highlights for each of the years in the five-year period then ended. These financial statements and financial highlights are the responsibility of the Fund’s management. Our responsibility is to express an opinion on these financial statements and financial highlights based on our audits.
We conducted our audits in accordance with the standards of the Public Company Accounting Oversight Board (United States). Those standards require that we plan and perform the audit to obtain reasonable assurance about whether the financial statements and financial highlights are free of material misstatement. An audit includes examining, on a test basis, evidence supporting the amounts and disclosures in the financial statements. Our procedures included confirmation of securities owned as of December 31, 2013, by correspondence with the custodian, transfer agent and brokers, or by other appropriate auditing procedures where replies from brokers were not received. An audit also includes assessing the accounting principles used and significant estimates made by management, as well as evaluating the overall financial statement presentation. We believe that our audits provide a reasonable basis for our opinion.
In our opinion, the financial statements and financial highlights referred to above present fairly, in all material respects, the financial position of Oppenheimer Main Street Fund/VA as of December 31, 2013, the results of its operations for the year then ended, the changes in its net assets for each of the years in the two-year period then ended, and the financial highlights for each of the years in the five-year period then ended, in conformity with U.S. generally accepted accounting principles.
KPMG LLP
Denver, Colorado
February 14, 2014
21 OPPENHEIMER MAIN STREET FUND/VA
| | |
FEDERAL INCOME TAX INFORMATION Unaudited |
In early 2014, if applicable, shareholders of record received information regarding all dividends and distributions paid to them by the Fund during calendar year 2013.
Dividends, if any, paid by the Fund during the fiscal year ended December 31, 2013 which are not designated as capital gain distributions should be multiplied by the maximum amount allowable but not less than 100% to arrive at the amount eligible for the corporate dividend-received deduction.
The foregoing information is presented to assist shareholders in reporting distributions received from the Fund to the Internal Revenue Service. Because of the complexity of the federal regulations which may affect your individual tax return and the many variations in state and local tax regulations, we recommend that you consult your tax advisor for specific guidance.
22 OPPENHEIMER MAIN STREET FUND/VA
| | |
| BOARD APPROVAL OF THE FUND’S INVESTMENT ADVISORY AND SUB-ADVISORY AGREEMENTS Unaudited |
The Fund has entered into an investment advisory agreement with OFI Global Asset Management, Inc. (“OFI Global” or the “Adviser”), a wholly-owned subsidiary of OppenheimerFunds, Inc. (“OFI” or the “Sub-Adviser”) (“OFI Global” and “OFI” together the “Managers”) and OFI Global has entered into a sub-advisory agreement with OFI whereby OFI provides investment sub-advisory services to the Fund (collectively, the “Agreements”). Each year, the Board of Trustees (the “Board”), including a majority of the independent Trustees, is required to determine whether to renew the Agreements. The Investment Company Act of 1940, as amended, requires that the Board request and evaluate, and that the Managers provide, such information as may be reasonably necessary to evaluate the terms of the Agreements. The Board employs an independent consultant to prepare a report that provides information, including comparative information that the Board requests for that purpose. In addition to in-person meetings focused on this evaluation, the Board receives information throughout the year regarding Fund services, fees, expenses and performance.
The Adviser, Sub-Adviser and the independent consultant provided information to the Board on the following factors: (i) the nature, quality and extent of the Managers’ services, (ii) the investment performance of the Fund and the Managers, (iii) the fees and expenses of the Fund, including comparative expense information, (iv) the profitability of the Managers and their affiliates, including an analysis of the cost of providing services, (v) whether economies of scale are realized as the Fund grows and whether fee levels reflect these economies of scale for Fund investors and (vi) other benefits to the Managers from their relationship with the Fund. The Board was aware that there are alternatives to retaining the Managers.
Outlined below is a summary of the principal information considered by the Board as well as the Board’s conclusions.
Nature, Quality and Extent of Services. The Board considered information about the nature, quality and extent of the services provided to the Fund and information regarding the Managers’ key personnel who provide such services. The Sub-Adviser’s duties include providing the Fund with the services of the portfolio managers and the Sub-Adviser’s investment team, who provide research, analysis and other advisory services in regard to the Fund’s investments; securities trading services; oversight of third-party service providers; monitoring compliance with applicable Fund policies and procedures and adherence to the Fund’s investment restrictions; and risk management. The Managers are responsible for providing certain administrative services to the Fund as well. Those services include providing and supervising all administrative and clerical personnel who are necessary in order to provide effective corporate administration for the Fund; compiling and maintaining records with respect to the Fund’s operations; preparing and filing reports required by the Securities and Exchange Commission; preparing periodic reports regarding the operations of the Fund for its shareholders; preparing proxy materials for shareholder meetings; and preparing the registration statements required by Federal and state securities laws for the sale of the Fund’s shares. The Managers also provide the Fund with office space, facilities and equipment.
The Board also considered the quality of the services provided and the quality of the Managers’ resources that are available to the Fund. The Board took account of the fact that the Sub-Adviser has had over fifty years of experience as an investment adviser and that its assets under management rank it among the top mutual fund managers in the United States. The Board evaluated the Sub-Adviser’s advisory, administrative, accounting, legal, compliance services and risk management, and information the Board has received regarding the experience and professional qualifications of the Managers’ key personnel and the size and functions of its staff. In its evaluation of the quality of the portfolio management services provided, the Board considered the experience of Manind Govil and Benjamin Ram, the portfolio managers for the Fund, and the Sub-Adviser’s investment team and analysts. The Board members also considered the totality of their experiences with the Managers as directors or trustees of the Fund and other funds advised by the Managers. The Board considered information regarding the quality of services provided by affiliates of the Managers, which its members have become knowledgeable about in connection with the renewal of the Fund’s service agreements. The Board concluded, in light of the Managers’ experience, reputation, personnel, operations and resources that the Fund benefits from the services provided under the Agreement.
Investment Performance of the Fund, the Adviser and the Sub-Adviser. Throughout the year, the Manager provided information on the investment performance of the Fund, including comparative performance information. The Board also reviewed information, prepared by the Manager and by the independent consultant, comparing the Fund’s historical performance to relevant market indices and to the performance of other large blend funds underlying variable insurance products. The Board considered that the Fund outperformed its performance category median during the one-, three- and five-year periods but underperformed for the ten-year period.
Costs of Services by the Adviser. The Board reviewed the fees paid to the Manager and the other expenses borne by the Fund. The independent consultant provided comparative data in regard to the fees and expenses of the Fund and other large blend funds underlying variable insurance products. In reviewing the fees and expenses charged to the VA funds, the Board considered the Manager’s assertion that, because there is much greater disparity in the fees and services that may be provided by a manager to a VA fund as opposed to a retail fund, when comparing the expenses of the various VA funds to those of retail funds, it is most appropriate to focus on total expenses (rather than on the management fees). Accordingly, while the Board reviewed and considered all expenses, it focused on total expenses. The Board considered that the Fund’s contractual management fee was higher than its peer group median but lower than its category median. Its total expenses were higher than its respective peer group median and category median. Within the total asset range of $1 billion to $2 billion, the Fund’s effective rate was higher than its peer group median and category median. The Board noted that the Manager has voluntarily agreed to limit the Fund’s total annual operating expenses so that those expenses, as percentages of daily net assets, will not exceed the annual rate of 0.80% for Non-Service Shares and 1.05% for Service Shares. This voluntary expense limitation may be amended or withdrawn at any time without prior notice to shareholders.
Economies of Scale and Profits Realized by the Adviser and Sub-Adviser. The Board considered information regarding the Manager’s costs in serving as the Fund’s investment adviser, including the costs associated with the personnel and systems necessary to manage the Fund, and information regarding the Manager’s profitability from its relationship with the Fund. The Board reviewed whether the Manager may realize economies of scale in managing and supporting the Fund. The Board noted that the Fund currently has management fee breakpoints, which are intended to share with Fund shareholders economies of scale that may exist as the Fund’s assets grow. Based on the Board’s evaluation, the Managers agreed to a revised breakpoint schedule as negotiated by the Board that, effective November 1, 2013, includes an additional fee breakpoint of 0.58% for assets in excess of $1 billion.
23 OPPENHEIMER MAIN STREET FUND/VA
| | |
| BOARD APPROVAL OF THE FUND’S INVESTMENT ADVISORY AND SUB-ADVISORY AGREEMENTS Unaudited/Continued |
Other Benefits to the Managers. In addition to considering the profits realized by the Managers, the Board considered information that was provided regarding the direct and indirect benefits the Managers receive as a result of their relationship with the Fund, including compensation paid to the Managers’ affiliates and research provided to the Adviser in connection with permissible brokerage arrangements (soft dollar arrangements). The Board also considered that the Managers must be able to pay and retain experienced professional personnel at competitive rates to provide quality services to the Fund.
Conclusions. These factors were also considered by the independent Trustees meeting separately from the full Board, assisted by experienced counsel to the Fund and to the independent Trustees. Fund counsel and the independent Trustees’ counsel are independent of the Managers within the meaning and intent of the Securities and Exchange Commission Rules.
Based on its review of the information it received and its evaluations described above, the Board, including a majority of the independent Trustees, decided to continue the Agreements through August 31, 2014. In arriving at its decision, the Board did not identify any factor or factors as being more important than others, but considered all of the above information, and considered the terms and conditions of the Agreements, including the management fees, in light of all the surrounding circumstances.
24 OPPENHEIMER MAIN STREET FUND/VA
| | |
| PORTFOLIO PROXY VOTING POLICIES AND PROCEDURES; UPDATES TO STATEMENTS OF INVESTMENTS Unaudited |
The Fund has adopted Portfolio Proxy Voting Policies and Procedures under which the Fund votes proxies relating to securities (“portfolio proxies”) held by the Fund. A description of the Fund’s Portfolio Proxy Voting Policies and Procedures is available (i) without charge, upon request, by calling the Fund toll-free at 1.800.CALL OPP (225.5677), (ii) on the Fund’s website at oppenheimerfunds.com, and (iii) on the SEC’s website at www.sec.gov. In addition, the Fund is required to file Form N-PX, with its complete proxy voting record for the 12 months ended June 30th, no later than August 31st of each year. The Fund’s voting record is available (i) without charge, upon request, by calling the Fund toll-free at 1.800.CALL OPP (225.5677), and (ii) in the Form N-PX filing on the SEC’s website at www.sec.gov.
The Fund files its complete schedule of portfolio holdings with the SEC for the first quarter and the third quarter of each fiscal year on Form N-Q. The Fund’s Form N-Q filings are available on the SEC’s website at www.sec.gov. Those forms may be reviewed and copied at the SEC’s Public Reference Room in Washington, D.C. Information on the operation of the Public Reference Room may be obtained by calling 1-800-SEC-0330.
25 OPPENHEIMER MAIN STREET FUND/VA
| | |
TRUSTEES AND OFFICERS Unaudited |
| | |
| Name, Position(s) Held with the Fund, Length of Service, Year of Birth | | Principal Occupation(s) During the Past 5 Years; Other Trusteeships/Directorships Held; Number of Portfolios in the Fund Complex Currently Overseen |
| |
INDEPENDENT TRUSTEES | | The address of each Trustee in the chart below is 6803 S. Tucson Way, Centennial, Colorado 80112-3924. Each Trustee serves for an indefinite term, or until his or her resignation, retirement, death or removal. |
| |
Sam Freedman, Chairman of the Board of Trustees (since 2013) and Trustee (since 1996) Year of Birth: 1940 | | Director of Colorado UpLIFT (charitable organization) (since September 1984). Mr. Freedman held several positions with the Sub-Adviser and with subsidiary or affiliated companies of the Sub-Adviser (until October 1994). Oversees 39 portfolios in the OppenheimerFunds complex. Mr. Freedman has served on the Boards of certain Oppenheimer funds since 1996, during which time he has become familiar with the Fund’s (and other Oppenheimer funds’) financial, accounting, regulatory and investment matters and has contributed to the Boards’ deliberations. |
| |
Edward L. Cameron, Trustee (since 1999) Year of Birth: 1938 | | Member of The Life Guard of Mount Vernon (George Washington historical site) (June 2000-June 2006); Partner of PricewaterhouseCoopers LLP (accounting firm) (July 1974-June 1999); Chairman of Price Waterhouse LLP Global Investment Management Industry Services Group (accounting firm) (July 1994-June 1998). Oversees 39 portfolios in the OppenheimerFunds complex. Mr. Cameron has served on the Boards of certain Oppenheimer funds since 1999, during which time he has become familiar with the Fund’s (and other Oppenheimer funds’) financial, accounting, regulatory and investment matters and has contributed to the Boards’ deliberations. |
| |
Jon S. Fossel, Trustee (since 1995) Year of Birth: 1942 | | Chairman of the Board (2006-December 2011) and Director (June 2002-December 2011) of UNUMProvident (insurance company); Director of Northwestern Energy Corp. (public utility corporation) (November 2004-December 2009); Director of P.R. Pharmaceuticals (October 1999-October 2003); Director of Rocky Mountain Elk Foundation (non-profit organization) (February 1998-February 2003 and February 2005-February 2007); Chairman and Director (until October 1996) and President and Chief Executive Officer (until October 1995) of the Sub-Adviser; President, Chief Executive Officer and Director of the following: Oppenheimer Acquisition Corp. (“OAC”) (parent holding company of the Sub-Adviser), Shareholders Services, Inc. and Shareholder Financial Services, Inc. (until October 1995). Oversees 39 portfolios in the OppenheimerFunds complex. Mr. Fossel has served on the Boards of certain Oppenheimer funds since 1990, during which time he has become familiar with the Fund’s (and other Oppenheimer funds’) financial, accounting, regulatory and investment matters and has contributed to the Boards’ deliberations. |
| |
Richard F. Grabish, Trustee (since 2012) Year of Birth: 1948 | | Formerly Senior Vice President and Assistant Director of Sales and Marketing (March 1997-December 2007), Director (March 1987-December 2007) and Manager of Private Client Services (June 1985-June 2005) of A.G. Edwards & Sons, Inc. (broker/dealer and investment firm); Chairman and Chief Executive Officer of A.G. Edwards Trust Company, FSB (March 2001-December 2007); President and Vice Chairman of A.G. Edwards Trust Company, FSB (investment adviser) (April 1987-March 2001); President of A.G. Edwards Trust Company, FSB (investment adviser) (June 2005-December 2007). Oversees 39 portfolios in the OppenheimerFunds complex. Mr. Grabish has served on the Boards of certain Oppenheimer funds since 2001, during which time he has become familiar with the Fund’s (and other Oppenheimer funds’) financial, accounting, regulatory and investment matters and has contributed to the Boards’ deliberations. |
| |
Beverly L. Hamilton, Trustee (since 2002) Year of Birth: 1946 | | Trustee of Monterey Institute for International Studies (educational organization) (since February 2000); Board Member of Middlebury College (educational organization) (December 2005-June 2011); Chairman (since 2010) of American Funds’ Emerging Markets Growth Fund, Inc. (mutual fund); Director of The California Endowment (philanthropic organization) (April 2002-April 2008); Director (February 2002-2005) and Chairman of Trustees (2006-2007) of the Community Hospital of Monterey Peninsula; Director (October 1991-2005); Vice Chairman (2006-2009) of American Funds’ Emerging Markets Growth Fund, Inc. (mutual fund); President of ARCO Investment Management Company (February 1991-April 2000); Member of the investment committees of The Rockefeller Foundation (2001-2006) and The University of Michigan (since 2000); Advisor at Credit Suisse First Boston’s Sprout venture capital unit (venture capital fund) (1994-January 2005); Trustee of MassMutual Institutional Funds (investment company) (1996-June 2004); Trustee of MML Series Investment Fund (investment company) (April 1989-June 2004); Member of the investment committee of Hartford Hospital (2000-2003); and Advisor to Unilever (Holland) pension fund (2000-2003). Oversees 39 portfolios in the OppenheimerFunds complex. Ms. Hamilton has served on the Boards of certain Oppenheimer funds since 2002, during which time she has become familiar with the Fund’s (and other Oppenheimer funds’) financial, accounting, regulatory and investment matters and has contributed to the Boards’ deliberations. |
| |
Victoria J. Herget, Trustee (since 2012) Year of Birth:1951 | | Independent Director of the First American Funds (mutual fund family) (2003-2011); former Managing Director (1993-2001), Principal (1985-1993), Vice President (1978-1985) and Assistant Vice President (1973-1978) of Zurich Scudder Investments (and its predecessor firms); Board Chair (2008-Present) and Director (2004-Present), United Educators (insurance company); Trustee (1992-2007), Chair of the Board of Trustees (1999-2007), Investment Committee Chair (1994-1999) and Investment Committee member (2007-2010) of Wellesley College; Trustee (since 2000) and Chair (since 2010), Newberry Library; Trustee, Mather LifeWays (since 2001); Trustee, BoardSource (2006-2009) and Chicago City Day School (1994-2005). Oversees 39 portfolios in the OppenheimerFunds complex. Ms. Herget has served on the Boards of certain Oppenheimer funds since 2012, during which time she has become familiar with the Fund’s (and other Oppenheimer funds’) financial, accounting, regulatory and investment matters and has contributed to the Boards’ deliberations. |
| |
Robert J. Malone, Trustee (since 2002) Year of Birth: 1944 | | Chairman of the Board (since 2012) and Director (since August 2005) of Jones International University (educational organization) (since August 2005); Chairman, Chief Executive Officer and Director of Steele Street Bank Trust (commercial banking) (since August 2003); Trustee of the Gallagher Family Foundation (non-profit organization) (since 2000); Board of Directors of Opera Colorado Foundation (non-profit organization) (2008-2012); Director of Colorado UpLIFT (charitable organization) (1986-2010); Director of Jones Knowledge, Inc. (2006-2010); Former Chairman of U.S. Bank-Colorado (subsidiary of U.S. Bancorp and formerly Colorado National Bank) (July 1996-April 1999); Director of Commercial Assets, Inc. (real estate investment trust) (1993-2000); Director of U.S. Exploration, Inc. (oil and gas exploration) (1997-February 2004); Chairman of the Board (1991-1994) and Trustee (1985-1994) of Regis University; and Chairman of the Board (1990-1991 and Trustee (1984-1999) of Young Presidents Organization. Oversees 39 portfolios in the OppenheimerFunds complex. Mr. Malone has served on the Boards of certain Oppenheimer funds since 2002, during which time he has become familiar with the Fund’s (and other Oppenheimer funds’) financial, accounting, regulatory and investment matters and has contributed to the Boards’ deliberations. |
26 OPPENHEIMER MAIN STREET FUND/VA
| | |
F. William Marshall, Jr., Trustee (since 2000) Year of Birth: 1942 | | Trustee Emeritus of Worcester Polytech Institute (WPI) (private university) (since 2009); Trustee of MassMutual Select Funds (formerly MassMutual Institutional Funds) (investment company) (since 1996), MML Series Investment Fund (investment company) (since 1996) and Mass Mutual Premier Funds (investment company) (since January 2012); President and Treasurer of the SIS Fund (private charitable fund) (January 1999 – March 2011); Former Trustee of WPI (1985-2008); Former Chairman of the Board (2004-2006) and Former Chairman of the Investment Committee of WPI (1994-2008); Chairman of SIS & Family Bank, F.S.B. (formerly SIS Bank) (commercial bank) (January 1999-July 1999); Executive Vice President of Peoples Heritage Financial Group, Inc. (commercial bank) (January 1999-July 1999); and Former President and Chief Executive Officer of SIS Bancorp. (1993-1999). Oversees 43 portfolios in the OppenheimerFunds complex. Mr. Marshall has served on the Boards of certain Oppenheimer funds since 2000, during which time he has become familiar with the Fund’s (and other Oppenheimer funds’) financial, accounting, regulatory and investment matters and has contributed to the Boards’ deliberations. |
| |
Karen L. Stuckey, Trustee (since 2012) Year of Birth: 1953 | | Partner (1990-2012) of PricewaterhouseCoopers LLP (held various positions 1975-1990); Emeritus Trustee (since 2006), Trustee (1992-2006) and member of Executive, Nominating and Audit Committees and Chair of Finance Committee of Lehigh University; and member, Women’s Investment Management Forum since inception. Oversees 39 portfolios in the OppenheimerFunds complex. Ms. Stuckey has served on the Boards of certain Oppenheimer funds since 2012, during which time she has become familiar with the Fund’s (and other Oppenheimer funds’) financial, accounting, regulatory and investment matters and has contributed to the Boards’ deliberations. |
| |
James D. Vaughn, Trustee (since 2012) Year of Birth:1945 | | Retired; former managing partner (1994-2001) of Denver office of Deloitte & Touche LLP, (held various positions 1969-1993); Trustee and Chairman of the Audit Committee of Schroder Funds (2003-2012); Board member and Chairman of Audit Committee of AMG National Trust Bank (since 2005); Trustee and Investment Committee member, University of South Dakota Foundation (since 1996); Board member, Audit Committee Member and past Board Chair, Junior Achievement (since 1993); former Board member, Mile High United Way, Boys and Girls Clubs, Boy Scouts, Colorado Business Committee for the Arts, Economic Club of Colorado and Metro Denver Network. Oversees 39 portfolios in the OppenheimerFunds complex. Mr. Vaughn has served on the Boards of certain Oppenheimer funds since 2012, during which time he has become familiar with the Fund’s (and other Oppenheimer funds’) financial, accounting, regulatory and investment matters and has contributed to the Boards’ deliberations. |
| | | |
| |
| INTERESTED TRUSTEE AND OFFICER | | Mr. Glavin is an “Interested Trustee” because he is affiliated with the Manager and the Sub-Adviser by virtue of his positions as an officer and director of the Manager and a director of the Sub-Adviser, and as a shareholder of the Sub-Adviser’s parent company. Both as a Trustee and as an officer, he serves for an indefinite term, or until his resignation, retirement, death or removal. Mr. Glavin’s address is Two World Financial Center, 225 Liberty Street, 11th Floor, New York, New York 10281-1008. |
| |
William F. Glavin, Jr., Trustee, President and Principal Executive Officer (since 2009) Year of Birth: 1958 | | Director, Chairman and Chief Executive Officer of the Manager (since January 2013); President of the Manager (January 2013-May 2013); Chairman of the Sub-Adviser (December 2009-December 2012); Chief Executive Officer (January 2009-December 2012) and Director of the Sub-Adviser (since January 2009); President of the Sub-Adviser (May 2009-December 2012); Management Director (since June 2009), President (since December 2009) and Chief Executive Officer (since January 2011) of Oppenheimer Acquisition Corp. (“OAC”) (the Sub-Adviser’s parent holding company); Director of Oppenheimer Real Asset Management, Inc. (since March 2010); Executive Vice President (March 2006-February 2009) and Chief Operating Officer (July 2007-February 2009) of Massachusetts Mutual Life Insurance Company (OAC’s parent company); Director (May 2004-March 2006) and Chief Operating Officer and Chief Compliance Officer (May 2004-January 2005), President (January 2005-March 2006) and Chief Executive Officer (June 2005-March 2006) of Babson Capital Management LLC; Director (March 2005-March 2006), President (May 2003-March 2006) and Chief Compliance Officer (July 2005-March 2006) of Babson Capital Securities, Inc. (a broker-dealer); President (May 2003-March 2006) of Babson Investment Company, Inc.; Director (May 2004-August 2006) of Babson Capital Europe Limited; Director (May 2004-October 2006) of Babson Capital Guernsey Limited; Director (May 2004-March 2006) of Babson Capital Management LLC; Non-Executive Director (March 2005-March 2007) of Baring Asset Management Limited; Director (February 2005-June 2006) Baring Pension Trustees Limited; Director and Treasurer (December 2003-November 2006) of Charter Oak Capital Management, Inc.; Director (May 2006-September 2006) of C.M. Benefit Insurance Company; Director (May 2008-June 2009) and Executive Vice President (June 2007-July 2009) of C.M. Life Insurance Company; President (March 2006-May 2007) of MassMutual Assignment Company; Director (January 2005-December 2006), Deputy Chairman (March 2005-December 2006) and President (February 2005-March 2005) of MassMutual Holdings (Bermuda) Limited; Director (May 2008-June 2009) and Executive Vice President (June 2007-July 2009) of MML Bay State Life Insurance Company; Chief Executive Officer and President (April 2007-January 2009) of MML Distributors, LLC; and Chairman (March 2006-December 2008) and Chief Executive Officer (May 2007-December 2008) of MML Investors Services, Inc. An officer of 90 portfolios in the OppenheimerFunds complex. |
| |
OTHER OFFICERS OF THE FUND | | The addresses of the Officers in the chart below are as follows: for Messrs. Govil, Ram, Gabinet and Ms. Nasta, Two World Financial Center, 225 Liberty Street, New York, New York 10281-1008, for Messrs. Vandehey and Wixted, 6803 S. Tucson Way, Centennial, Colorado 80112-3924. Each Officer serves for an indefinite term or until his or her resignation, retirement, death or removal. |
27 OPPENHEIMER MAIN STREET FUND/VA
| | |
TRUSTEES AND OFFICERS Unaudited/Continued |
| | |
Manind Govil, Vice President (since 2009) Year of Birth: 1969 | | Senior Vice President, the Main Street Team Leader and a portfolio manager of the Sub-Adviser (since May 2009). Portfolio manager with RS Investment Management Co. LLC (October 2006-March 2009). Head of equity investments at The Guardian Life Insurance Company of America (August 2005-October 2006) when Guardian Life Insurance acquired an interest in RS Investment Management Co. LLC. Lead portfolio manager—large cap blend/core equity, co-head of equities and head of equity research (2001-July 2005), and was lead portfolio manager—core equity (April 1996-July 2005), at Mercantile Capital Advisers, Inc. A portfolio manager and officer of other portfolios in the OppenheimerFunds complex. |
| |
Benjamin Ram, Vice President (since 2009) Year of Birth: 1972 | | Vice President of the Sub-Adviser (since May 2009); Senior Portfolio Manager of the Sub-Adviser (since January 2011) and Portfolio Manager of the Sub-Adviser (May 2009-December 2010). Sector manager for financial investments and a co portfolio manager for mid-cap portfolios with the RS Core Equity Team of RS Investment Management Co. LLC (October 2006-May 2009). Portfolio Manager of Mid Cap Strategies, Sector Manager Financials at The Guardian Life Insurance Company of America (January 2006-October 2006) when Guardian Life Insurance acquired an interest in RS Investment Management Co. LLC. Financial analyst (2003-2005), and co-portfolio manager (2005-2006) at Mercantile Capital Advisers, Inc.; bank analyst at Legg Mason Securities (2000-2003) and a senior financial analyst at the CitiFinancial division of Citigroup, Inc. (1997-2000). A portfolio manager and officer of other portfolios in the OppenheimerFunds complex. |
| |
Arthur S. Gabinet, Secretary and Chief Legal Officer (since 2011) Year of Birth: 1958 | | Executive Vice President, Secretary and General Counsel of the Manager (since January 2013); General Counsel OFI SteelPath, Inc. (since January 2013); Executive Vice President (May 2010-December 2012) and General Counsel (since January 2011) of the Sub-Adviser; General Counsel of the Distributor (since January 2011); General Counsel of Centennial Asset Management Corporation (January 2011-December 2012); Executive Vice President (January 2011-December 2012) and General Counsel of HarbourView Asset Management Corporation (since January 2011); Assistant Secretary (since January 2011) and Director (since January 2011) of OppenheimerFunds International Ltd. and OppenheimerFunds plc; Director of Oppenheimer Real Asset Management, Inc. (January 2011-December 2012) and General Counsel (since January 2011); Executive Vice President (January 2011-December 2011) and General Counsel of Shareholder Financial Services, Inc. and Shareholder Services, Inc. (since January 2011); Executive Vice President (January 2011-December 2012) and General Counsel of OFI Private Investments Inc. (since January 2011); Vice President of OppenheimerFunds Legacy Program (January 2011-December 2011); Executive Vice President (January 2011-December 2012) and General Counsel of OFI Institutional Asset Management, Inc. (since January 2011); General Counsel, Asset Management of the Sub-Adviser (May 2010-December 2010); Principal, The Vanguard Group (November 2005-April 2010); District Administrator, U.S. Securities and Exchange Commission (January 2003-October 2005). An officer of 90 portfolios in the OppenheimerFunds complex. |
| |
Christina M. Nasta, Vice President and Chief Business Officer (since 2011) Year of Birth: 1973 | | Senior Vice President of OppenheimerFunds Distributor, Inc. (since January 2013); Senior Vice President of the Sub-Adviser (July 2010-December 2012); Vice President of the Sub-Adviser (January 2003-July 2010); Vice President of OppenheimerFunds Distributor, Inc. (January 2003-July 2010). An officer of 90 portfolios in the OppenheimerFunds complex. |
| |
Mark S. Vandehey, Vice President and Chief Compliance Officer (since 2004) Year of Birth: 1950 | | Senior Vice President and Chief Compliance Officer of the Manager (since January 2013); Chief Compliance Officer of OFI SteelPath, Inc. (since January 2013); Senior Vice President of the Sub-Adviser (March 2004-December 2012); Chief Compliance Officer of the Sub-Adviser, OppenheimerFunds Distributor, Inc., OFI Trust Company, OFI Institutional Asset Management, Inc., Oppenheimer Real Asset Management, Inc., OFI Private Investments, Inc., Harborview Asset Management Corporation, Trinity Investment Management Corporation, and Shareholder Services, Inc. (since March 2004); Vice President of OppenheimerFunds Distributor, Inc., Centennial Asset Management Corporation and Shareholder Services, Inc. (June 1983-December 2012). An officer of 90 portfolios in the OppenheimerFunds complex. |
| |
Brian W. Wixted, Treasurer and Principal Financial & Accounting Officer (since 1999) Year of Birth: 1959 | | Senior Vice President of the Manager (since January 2013); Treasurer of the Sub-Adviser, HarbourView Asset Management Corporation, Shareholder Financial Services, Inc., Shareholder Services, Inc., and Oppenheimer Real Asset Management, Inc. (March 1999-June 2008), OFI Private Investments, Inc. (March 2000-June 2008), OppenheimerFunds International Ltd. and OppenheimerFunds plc (since May 2000), OFI Institutional Asset Management, Inc. (November 2000-June 2008), and OppenheimerFunds Legacy Program (charitable trust program established by the Sub-Adviser) (June 2003-December 2011); Treasurer and Chief Financial Officer of OFI Trust Company (since May 2000); Assistant Treasurer of Oppenheimer Acquisition Corporation (March 1999-June 2008). An officer of 90 portfolios in the OppenheimerFunds complex. |
The Fund’s Statement of Additional Information contains additional information about the Fund’s Trustees and Officers and is available without charge, upon request, by calling 1.800.988.8287.
28 OPPENHEIMER MAIN STREET FUND/VA
| | |
| OPPENHEIMER MAIN STREET FUND/VA |
A Series of Oppenheimer Variable Account Funds
| | |
| Manager | | OFI Global Asset Management, Inc. |
| |
| Sub-Adviser | | OppenheimerFunds, Inc. |
| |
| Distributor | | OppenheimerFunds Distributor, Inc. |
| |
Transfer and Shareholder Servicing Agent | | OFI Global Asset Management, Inc. |
| |
| Sub-Transfer Agent | | Shareholder Services, Inc. DBA OppenheimerFunds Services |
| |
Independent Registered Public Accounting Firm | | KPMG LLP |
| |
| Counsel | | K&L Gates LLP |
| |
| | Before investing, investors should carefully consider a fund’s investment objectives, risks, charges and expenses. Fund prospectuses and summary prospectuses contain this and other information about the funds, and may be obtained by asking your financial advisor, or calling us at 1.800.988.8287. Read prospectuses and summary prospectuses carefully before investing. |
© 2014 OppenheimerFunds, Inc. All rights reserved. Oppenheimer funds are distributed by OppenheimerFunds Distributor, Inc.

December 31, 2013

ANNUAL REPORT
Listing of Top Holdings
Fund Performance Discussion
Financial Statements
*Prior to 4/30/13, the Fund’s name was Oppenheimer Main Street Small- & Mid-Cap Fund®/VA

Portfolio Manager: Matthew P. Ziehl, CFA, Raymond Anello, CFA, Raman Vardharaj, CFA, Joy Budzinski, Kristin Ketner Pak, Magnus Krantz and Adam Weiner
Average Annual Total Returns
For the Periods Ended 12/31/13
| | | | | | |
| | 1-Year | | 5-Year | | 10-Year |
| Non-Service Shares | | 41.01% | | 22.47% | | 9.83% |
Service Shares | | 40.62% | | 22.16% | | 9.57% |
The performance data quoted represents past performance, which does not guarantee future results. The investment return and principal value of an investment in the Fund will fluctuate so that an investor’s shares, when redeemed, may be worth more or less than their original cost. Current performance may be lower or higher than the performance quoted. For performance data current to the most recent month end, call us at 1.800.988.8287. The Fund’s total returns should not be expected to be the same as the returns of other funds, whether or not both funds have the same portfolio managers and/or similar names. The Fund’s total returns include changes in share price and reinvested distributions but do not include the charges associated with the separate account products that offer this Fund. Such performance would have been lower if such charges were taken into account.
TOP TEN COMMON STOCK HOLDINGS
| | | | | | |
LaSalle Hotel Properties | | | 2.4 | % | | |
Robert Half International, Inc. | | | 2.3 | | | |
WellCare Health Plans, Inc. | | | 2.2 | | | |
Dana Holding Corp. | | | 2.2 | | | |
KAR Auction Services, Inc. | | | 2.1 | | | |
Finisar Corp. | | | 2.0 | | | |
Korn/Ferry International | | | 1.9 | | | |
Home Loan Servicing Solutions Ltd. | | | 1.9 | | | |
EPL Oil & Gas, Inc. | | | 1.8 | | | |
P.H. Glatfelter Co. | | | 1.6 | | | |
Portfolio holdings and allocations are subject to change. Percentages are as of December 31, 2013, and are based on net assets. For more current Fund holdings, please visit oppenheimerfunds.com.
SECTOR ALLOCATION
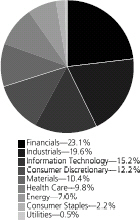
Portfolio holdings and allocations are subject to change. Percentages are as of December 31, 2013, and are based on the total market value of common stocks.
2 OPPENHEIMER MAIN STREET SMALL CAP FUND/VA
Fund Performance Discussion
The Fund’s Non-Service shares produced a total return of 41.01% during the one-year reporting period ended December 31, 2013, outperforming the Russell 2000 Index (the “Index”), which returned 38.82% during the same period. The Fund outperformed the Index in eight out of ten sectors, led by stronger relative stock selection in the financials, energy, health care and consumer staples sectors. The Fund underperformed the Index in the information technology and consumer discretionary sectors due primarily to less favorable stock selection.
MARKET OVERVIEW
Equities in the U.S. and developed markets throughout the world delivered strong performance in 2013. Accommodative monetary policies on the part of central banks in the U.S., Europe and Japan, combined with supportive equity valuations relative to bonds, were instrumental in this performance. Signs that the U.S. economy was on the mend, demonstrated by rising house prices, also helped sentiment toward stocks. While equities performed well for the year, numerous concerns remained. Namely, in late May, relatively hawkish remarks by Fed chairman Ben Bernanke were widely interpreted as a signal that U.S. monetary policymakers would begin to back away from their quantitative easing program sooner than expected, sparking heightened volatility in financial markets throughout the world. Additionally, fears began to creep into the market about a possible slowdown in the world’s emerging economies. However, market conditions generally stabilized over the summer of 2013. While the Fed unexpectedly refrained from reducing its monthly bond purchases in September, in December, the Central Bank announced that it would reduce its monthly bond purchases by $10 billion, from $85 billion to $75 billion, starting in January 2014. The Fed also announced that it would continue to hold short-term interest rates at very low levels until unemployment in the United States subsided below 6.5%. This was lower than its earlier 7% target.
TOP INDIVIDUAL CONTRIBUTORS
During the period, top contributors to performance included financial stocks Financial Engines, Inc., CapitalSource, Inc., consumer staples stock Nu Skin Enterprises, Inc. and health care stock Santarus, Inc. Financial Engines is a provider of investment advice and portfolio management to defined contribution plans. The company reported strong results as new products such as the Income+ program, which has been well received by customers aged 60 and over, regulatory tailwinds, and favorable demographic trends have all worked in the company’s favor. CapitalSource is a commercial lender to small and middle market businesses. PacWest Bancorp. announced plans to acquire the company in July 2013 and shares rallied. Nu Skin Enterprises is a direct seller of personal care products and nutritional supplements. The company announced strong earnings growth driven by recruitment gains and a successful roll-out of its new weight management system. We lowered exposure towards the end of the year as strong price appreciation drove the stock close to our estimate of fair valuation. Shortly after the close of the year, we fully exited the position due to the announcement of an investigation into Nu Skin’s business practices in China which could negatively impact the firm’s growth trajectory and financial results. Santarus is a biopharmaceutical company that announced it was being acquired by Salix Pharmaceuticals in November 2013. The announcement benefited shares of Santarus.
TOP INDIVIDUAL DETRACTORS
Detractors from performance this period included information technology stocks Aruba Networks, Inc. and Fortinet, Inc., and financials stock Hatteras Financial Corp. Over the first half of the period, fundamentals of many technology companies suffered from the macroeconomic headwinds that impacted enterprise spending. Networking company Aruba Networks’ earnings growth may have also been hurt due to discounting by competitor Cisco Systems. Lackluster enterprise spending, particularly by service providers, resulted in a billings miss for Fortinet, a provider of network security solutions.
Hatteras Financial, a REIT focused on investing in mortgage-backed securities guaranteed by the U.S. Government and government sponsored agencies, reported disappointing earnings during the third quarter. The firm’s book value decreased as its investment portfolio fell in value to a greater extent than expected, driven by the increase in interest rates following the Fed’s remarks about the potential tapering of its quantitative easing program. We exited our positions in Aruba Networks and Hatteras Financial during the period.
STRATEGY & OUTLOOK
Despite the high absolute dollar value of most market indices, stocks, generally, do not appear overvalued. While there may be pockets of overvaluation – specifically, high expectation stocks which have outperformed may be poised to take a breather – we believe there are still opportunities to identify attractively valued names. In particular, returns of higher-quality stocks (as measured by S&P Quality Ratings) have lagged since the market’s inflection in March 2009. Some of the factors that have aided higher returns of lower-quality stocks – namely, the Fed’s easy money policies – are nearing an end. This may favor higher quality stocks as investors once again focus on the importance of fundamentals. Additionally, we believe smaller cap stocks should benefit from increasingly robust IPO and mergers & acquisitions activity — leading to greater access to capital for growth. The “wild card” for 2014 remains just how far interest rates rise. Expectations are for rates to increase, but if they rise faster or farther than expectations, stocks could be in for a volatile ride.
3 OPPENHEIMER MAIN STREET SMALL CAP FUND/VA
Given this backdrop, our approach remains consistent. We aim to construct an “all weather” portfolio by targeting companies we believe have: 1) sustainable competitive advantages; 2) skilled management with a proven track record of executing effectively; and 3) financial resources to generate improving profitability, gain market share, and/or return significant cash to shareholders. During times of volatility or slow economic growth, such companies frequently widen their lead over weaker competitors. We seek to invest in companies, characterized by these qualities, at compelling valuations and believe this disciplined approach is essential in seeking to generate superior long-term performance.
Investors should consider the Fund’s investment objective, risks, charges and expenses carefully before investing. The Fund’s prospectus and summary prospectus contain this and other information about the Fund, and may be obtained by asking your financial advisor or calling us at 1.800.988.8287. Read prospectuses and summary prospectuses carefully before investing.
Total returns include changes in share price and reinvestment of dividends and capital gains distributions in a hypothetical investment for the periods shown.
The Fund’s investment strategy and focus can change over time. The mention of specific fund holdings does not constitute a recommendation by OppenheimerFunds, Inc. or its affiliates.
Shares of Oppenheimer funds are not deposits or obligations of any bank, are not guaranteed by any bank, are not insured by the FDIC or any other agency, and involve investment risks, including the possible loss of the principal amount invested.
Comparing the Fund’s Performance to the Market. The graphs that follow show the performance of a hypothetical $10,000 investment in each share class of the Fund held until December 31, 2013. Performance is measured over a ten-fiscal-year period for both Classes. Performance information does not reflect charges that apply to separate accounts investing in the Fund. If these charges were taken into account, performance would be lower. The graphs assume that all dividends and capital gains distributions were reinvested in additional shares.
The Fund’s performance is compared to the performance of the Russell 2000 Index and the Russell 2500 Index. The Russell 2000 Index is an index of equity securities of small capitalization companies that is a measure of the small company market. The Russell 2500 Index is a broad-based index featuring 2,500 stocks of companies with small- and mid-cap market capitalizations. The Fund has changed its benchmark from the Russell 2500 Index to the Russell 2000 Index, which it believes is a more appropriate measure of the Fund’s performance. Indices are unmanaged and cannot be purchased directly by investors. Index performance includes reinvestment of income, but does not reflect transaction costs, fees, expenses or taxes. Index performance is shown for illustrative purposes only as a benchmark for the Fund’s performance, and does not predict or depict performance of the Fund. The Fund’s performance reflects the effects of the Fund’s business and operating expenses.
COMPARISON OF CHANGE IN VALUE OF $10,000 HYPOTHETICAL INVESTMENTS IN:
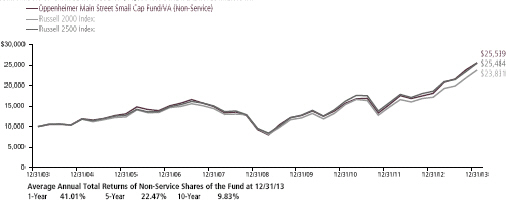
4 OPPENHEIMER MAIN STREET SMALL CAP FUND/VA
COMPARISON OF CHANGE IN VALUE OF $10,000 HYPOTHETICAL INVESTMENTS IN:
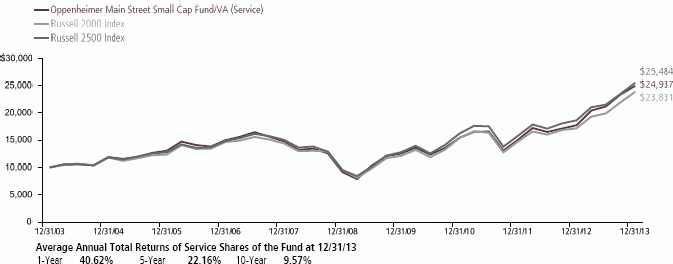
The performance data quoted represents past performance, which does not guarantee future results. The investment return and principal value of an investment in the Fund will fluctuate so that an investor’s shares, when redeemed, may be worth more or less than their original cost. Current performance may be lower or higher than the performance quoted. For performance data current to the most recent month end, call us at 1.800.988.8287. The Fund’s total returns should not be expected to be the same as the returns of other funds, whether or not both funds have the same portfolio managers and/or similar names. The Fund’s total returns include changes in share price and reinvested distributions but do not include the charges associated with the separate account products that offer this Fund. Such performance would have been lower if such charges were taken into account.
5 OPPENHEIMER MAIN STREET SMALL CAP FUND/VA
Fund Expenses
Fund Expenses. As a shareholder of the Fund, you incur two types of costs: (1) transaction costs and (2) ongoing costs, including management fees; distribution and service fees; and other Fund expenses. These examples are intended to help you understand your ongoing costs (in dollars) of investing in the Fund and to compare these costs with the ongoing costs of investing in other mutual funds.
The examples are based on an investment of $1,000.00 invested at the beginning of the period and held for the entire 6-month period ended December 31, 2013.
Actual Expenses. The first section of the table provides information about actual account values and actual expenses. You may use the information in this section for the class of shares you hold, together with the amount you invested, to estimate the expense that you paid over the period. Simply divide your account value by $1,000.00 (for example, an $8,600.00 account value divided by $1,000.00 = 8.60), then multiply the result by the number in the first section under the heading entitled “Expenses Paid During Period” to estimate the expenses you paid on your account during this period.
Hypothetical Example for Comparison Purposes.
The second section of the table provides information about hypothetical account values and hypothetical expenses based on the Fund’s actual expense ratio for each class of shares, and an assumed rate of return of 5% per year for each class before expenses, which is not the actual return. The hypothetical account values and expenses may not be used to estimate the actual ending account balance or expenses you paid for the period. You may use this information to compare the ongoing costs of investing in the Fund and other funds. To do so, compare this 5% hypothetical example for the class of shares you hold with the 5% hypothetical examples that appear in the shareholder reports of the other funds.
Please note that the expenses shown in the table are meant to highlight your ongoing costs only and do not reflect any charges associated with the separate accounts that offer this Fund. Therefore, the “hypothetical” lines of the table are useful in comparing ongoing costs only, and will not help you determine the relative total costs of owning different funds. In addition, if these separate account charges were included your costs would have been higher.
| | | | | | | | | | | | |
| Actual | | Beginning
Account
Value
July 1, 2013 | | | Ending Account Value
December 31, 2013 | | | Expenses Paid During
6 Months Ended
December 31, 2013 | |
Non-Service shares | | $ | 1,000.00 | | | $ | 1,180.00 | | | $ | 4.40 | |
Service shares | | | 1,000.00 | | | | 1,178.50 | | | | 5.78 | |
| | | |
Hypothetical | | | | | | | | | | | | |
(5% return before expenses) | | | | | | | | | | | | |
Non-Service shares | | | 1,000.00 | | | | 1,021.17 | | | | 4.08 | |
Service shares | | | 1,000.00 | | | | 1,019.91 | | | | 5.36 | |
Expenses are equal to the Fund’s annualized expense ratio for that class, multiplied by the average account value over the period, multiplied by 184/365 (to reflect the one-half year period). Those annualized expense ratios, excluding indirect expenses from affiliated funds, based on the 6-month period ended December 31, 2013 are as follows:
| | | | |
| Class | | Expense Ratios | | |
Non-Service shares | | 0.80% | | |
Service shares | | 1.05 | | |
The expense ratios reflect contractual waivers and/or reimbursements of expenses by the Fund’s Manager. Some of these undertakings may be modified or terminated at any time, unless approved by the Board of Trustees. The “Financial Highlights” tables in the Fund’s financial statements, included in this report, also show the gross expense ratios, without such waivers or reimbursements and reduction to custodian expenses, if applicable.
6 OPPENHEIMER MAIN STREET SMALL CAP FUND/VA
| | |
STATEMENT OF INVESTMENTS December 31, 2013 |
| | | | | | | | |
| | | Shares | | | Value | |
Common Stocks—95.6% | | | | | | | | |
Consumer Discretionary—11.7% | | | | | | | | |
Auto Components—2.2% | | | | | | | | |
Dana Holding Corp. | | | 1,283,429 | | | $ | 25,180,877 | |
Distributors—0.5% | | | | | | | | |
Pool Corp. | | | 103,329 | | | | 6,007,548 | |
Diversified Consumer Services—1.2% | | | | | |
LifeLock, Inc.1 | | | 808,140 | | | | 13,261,577 | |
Hotels, Restaurants & Leisure—3.1% | | | | | | | | |
Brinker International, Inc. | | | 254,900 | | | | 11,812,066 | |
Dunkin’ Brands Group, Inc. | | | 196,273 | | | | 9,460,359 | |
Texas Roadhouse, Inc., Cl. A | | | 471,920 | | | | 13,119,376 | |
| | | | | | | | |
| | | | | | | | 34,391,801 | |
Household Durables—0.6% | | | | | | | | |
Toll Brothers, Inc.1 | | | 170,560 | | | | 6,310,720 | |
Specialty Retail—4.1% | | | | | | | | |
Mattress Firm Holding Corp.1 | | | 314,840 | | | | 13,550,714 | |
Monro Muffler Brake, Inc. | | | 117,409 | | | | 6,617,171 | |
Pier 1 Imports, Inc. | | | 630,980 | | | | 14,563,018 | |
Signet Jewelers Ltd. | | | 146,130 | | | | 11,500,431 | |
| | | | | | | | |
| | | | | | | | 46,231,334 | |
Consumer Staples—2.0% | | | | | | | | |
Food Products—1.3% | | | | | | | | |
Flowers Foods, Inc. | | | 697,640 | | | | 14,978,331 | |
Personal Products—0.7% | | | | | | | | |
Nu Skin Enterprises, Inc., Cl. A | | | 61,350 | | | | 8,479,797 | |
Energy—6.7% | | | | | | | | |
Oil, Gas & Consumable Fuels—6.7% | | | | | | | | |
EPL Oil & Gas, Inc.1 | | | 705,977 | | | | 20,120,344 | |
Phillips 66 Partners LP | | | 376,900 | | | | 14,295,817 | |
Renewable Energy Group, Inc.1 | | | 890,848 | | | | 10,209,118 | |
Valero Energy Partners LP1 | | | 395,900 | | | | 13,638,755 | |
Western Refining, Inc. | | | 398,931 | | | | 16,918,664 | |
| | | | | | | | |
| | | | | | | | 75,182,698 | |
Financials—22.1% | | | | | | | | |
Capital Markets—1.8% | | | | | | | | |
Financial Engines, Inc. | | | 158,513 | | | | 11,013,483 | |
WisdomTree Investments, Inc.1 | | | 546,250 | | | | 9,674,088 | |
| | | | | | | | |
| | | | | | | | 20,687,571 | |
Commercial Banks—6.2% | | | | | | | | |
BankUnited, Inc. | | | 417,895 | | | | 13,757,103 | |
CapitalSource, Inc. | | | 1,059,209 | | | | 15,220,833 | |
First Niagara Financial Group, Inc. | | | 1,620,490 | | | | 17,209,604 | |
FirstMerit Corp. | | | 503,316 | | | | 11,188,715 | |
Webster Financial Corp. | | | 393,370 | | | | 12,265,277 | |
| | | | | | | | |
| | | | | | | | 69,641,532 | |
Insurance—0.9% | | | | | | | | |
AmTrust Financial Services, Inc. | | | 309,247 | | | | 10,109,284 | |
Real Estate Investment Trusts (REITs)—9.7% | | | | | | | | |
Apollo Commercial Real Estate Finance, Inc. | | | 768,931 | | | | 12,495,129 | |
Ares Commercial Real Estate Corp. | | | 315,119 | | | | 4,128,059 | |
Chatham Lodging Trust | | | 609,010 | | | | 12,454,255 | |
LaSalle Hotel Properties | | | 879,756 | | | | 27,149,270 | |
Mid-America Apartment
Communities, Inc. | | | 254,545 | | | | 15,461,063 | |
Redwood Trust, Inc. | | | 874,730 | | | | 16,943,520 | |
STAG Industrial, Inc. | | | 245,300 | | | | 5,001,667 | |
Starwood Property Trust, Inc. | | | 546,562 | | | | 15,139,767 | |
| | | | | | | | |
| | | | | | | | 108,772,730 | |
Thrifts & Mortgage Finance—3.5% | | | | | | | | |
Flagstar Bancorp, Inc.1 | | | 483,070 | | | | 9,477,834 | |
Oritani Financial Corp. | | | 528,180 | | | | 8,477,289 | |
Home Loan Servicing Solutions Ltd. | | | 923,820 | | | | 21,220,145 | |
| | | | | | | | |
| | | | | | | | 39,175,268 | |
Health Care—9.4% | | | | | | | | |
Biotechnology—1.4% | | | | | | | | |
Celldex Therapeutics, Inc.1 | | | 212,970 | | | | 5,156,004 | |
Keryx Biopharmaceuticals, Inc.1 | | | 521,710 | | | | 6,756,144 | |
Medivation, Inc.1 | | | 62,702 | | | | 4,001,642 | |
| | | | | | | | |
| | | | | | | 15,913,790 | |
| | | | | | | | |
| | | Shares | | | Value | |
Health Care Equipment & Supplies—2.7% | | | | | |
DexCom, Inc.1 | | | 303,610 | | | $ | 10,750,830 | |
Greatbatch, Inc.1 | | | 203,031 | | | | 8,982,092 | |
Spectranetics Corp.1 | | | 418,730 | | | | 10,468,250 | |
| | | | | | | | |
| | | | | | | | 30,201,172 | |
Health Care Providers & Services—4.4% | | | | | |
HealthSouth Corp. | | | 297,340 | | | | 9,907,369 | |
Team Health Holdings, Inc.1 | | | 312,800 | | | | 14,248,040 | |
WellCare Health Plans, Inc.1 | | | 358,931 | | | | 25,275,921 | |
| | | | | | | | |
| | | | | | | | 49,431,330 | |
Pharmaceuticals—0.9% | | | | | | | | |
AcelRx Pharmaceuticals, Inc.1 | | | 235,550 | | | | 2,664,070 | |
Aratana Therapeutics, Inc.1 | | | 59,370 | | | | 1,133,967 | |
Questcor Pharmaceuticals, Inc. | | | 116,050 | | | | 6,318,923 | |
| | | | | | | | |
| | | | | | | | 10,116,960 | |
Industrials—18.9% | | | | | | | | |
Aerospace & Defense—0.5% | | | | | | | | |
Orbital Sciences Corp.1 | | | 239,150 | | | | 5,572,195 | |
Air Freight & Couriers—0.8% | | | | | | | | |
Hub Group, Inc., Cl. A1 | | | 229,688 | | | | 9,159,958 | |
Airlines—0.8% | | | | | | | | |
Spirit Airlines, Inc.1 | | | 195,130 | | | | 8,860,853 | |
Commercial Services & Supplies—5.5% | | | | | |
ACCO Brands Corp.1 | | | 1,604,887 | | | | 10,784,841 | |
KAR Auction Services, Inc. | | | 795,780 | | | | 23,515,299 | |
Mobile Mini, Inc.1 | | | 209,350 | | | | 8,621,033 | |
Waste Connections, Inc. | | | 425,210 | | | | 18,551,912 | |
| | | | | | | | |
| | | | | | | | 61,473,085 | |
Construction & Engineering—1.7% | | | | | | | | |
AECOM Technology Corp.1 | | | 274,593 | | | | 8,081,272 | |
KBR, Inc. | | | 332,691 | | | | 10,609,516 | |
| | | | | | | | |
| | | | | | | | 18,690,788 | |
Electrical Equipment—0.7% | | | | | | | | |
General Cable Corp. | | | 259,220 | | | | 7,623,660 | |
Machinery—2.1% | | | | | | | | |
Greenbrier Cos., Inc. (The)1 | | | 381,689 | | | | 12,534,667 | |
Wabtec Corp. | | | 151,288 | | | | 11,236,160 | |
| | | | | | | | |
| | | | | | | | 23,770,827 | |
Professional Services—4.2% | | | | | | | | |
Korn/Ferry International1 | | | 823,461 | | | | 21,508,801 | |
Robert Half International, Inc. | | | 605,445 | | | | 25,422,636 | |
| | | | | | | | |
| | | | | | | | 46,931,437 | |
Road & Rail—1.8% | | | | | | | | |
Old Dominion Freight Line, Inc.1 | | | 214,401 | | | | 11,367,541 | |
Swift Transportation Co., Cl. A1 | | | 403,854 | | | | 8,969,597 | |
| | | | | | | | |
| | | | | | | | 20,337,138 | |
Transportation Infrastructure—0.8% | | | | | | | | |
Wesco Aircraft Holdings, Inc.1 | | | 412,170 | | | | 9,034,766 | |
Information Technology—14.4% | | | | | | | | |
Communications Equipment—2.0% | | | | | | | | |
Finisar Corp.1 | | | 919,591 | | | | 21,996,617 | |
Internet Software & Services—2.3% | | | | | | | | |
j2 Global, Inc. | | | 186,603 | | | | 9,332,016 | |
Responsys, Inc.1 | | | 170,000 | | | | 4,659,700 | |
Web.com Group, Inc.1 | | | 380,690 | | | | 12,102,135 | |
| | | | | | | | |
| | | | | | | | 26,093,851 | |
IT Services—1.0% | | | | | | | | |
MAXIMUS, Inc. | | | 259,410 | | | | 11,411,446 | |
Semiconductors & Semiconductor Equipment—3.2% | | | | | | | | |
Cavium, Inc.1 | | | 359,990 | | | | 12,423,255 | |
Semtech Corp.1 | | | 423,998 | | | | 10,718,670 | |
Skyworks Solutions, Inc.1 | | | 464,199 | | | | 13,257,523 | |
| | | | | | | | |
| | | | | | | | 36,399,448 | |
Software—5.9% | | | | | | | | |
Fortinet, Inc.1 | | | 702,761 | | | | 13,443,818 | |
Guidewire Software, Inc.1 | | | 364,020 | | | | 17,862,461 | |
Imperva, Inc.1 | | | 67,530 | | | | 3,250,219 | |
7 OPPENHEIMER MAIN STREET SMALL CAP FUND/VA
| | |
STATEMENT OF INVESTMENTS Continued |
| | | | | | | | |
| | | Shares | | | Value | |
Software Continued | | | | | | | | |
Infoblox, Inc.1 | | | 426,250 | | | $ | 14,074,775 | |
Proofpoint, Inc.1 | | | 93,350 | | | | 3,096,419 | |
Splunk, Inc.1 | | | 80,050 | | | | 5,497,033 | |
TIBCO Software, Inc.1 | | | 251,966 | | | | 5,664,196 | |
FleetMatics Group plc1 | | | 73,290 | | | | 3,169,793 | |
| | | | | | | | |
| | | | | | | | 66,058,714 | |
Materials—9.9% | | | | | | | | |
Chemicals—4.2% | | | | | | | | |
Cytec Industries, Inc. | | | 138,658 | | | | 12,917,379 | |
W.R. Grace & Co.1 | | | 101,970 | | | | 10,081,774 | |
Intrepid Potash, Inc.1 | | | 352,700 | | | | 5,586,768 | |
A. Schulman, Inc. | | | 351,048 | | | | 12,377,953 | |
Tronox Ltd., Cl. A | | | 260,820 | | | | 6,017,117 | |
| | | | | | | | |
| | | | | | | | 46,980,991 | |
Containers & Packaging—1.1% | | | | | | | | |
Packaging Corp. of America | | | 193,590 | | | | 12,250,375 | |
Metals & Mining—1.8% | | | | | | | | |
Century Aluminum Co.1 | | | 770,450 | | | | 8,058,907 | |
Kaiser Aluminum Corp. | | | 181,400 | | | | 12,741,536 | |
| | | | | | | | |
| | | | | | | 20,800,443 | |
| | | | | | | | |
| | | Shares | | | Value | |
Paper & Forest Products—2.8% | | | | | | | | |
Boise Cascade Co.1 | | | 443,880 | | | $ | 13,085,583 | |
P.H. Glatfelter Co. | | | 674,161 | | | | 18,633,810 | |
| | | | | | | | |
| | | | | | | | 31,719,393 | |
Utilities—0.5% | | | | | | | | |
Water Utilities—0.5% | | | | | | | | |
Aqua America, Inc. | | | 245,373 | | | | 5,788,348 | |
| | | | | | | | |
Total Common Stocks (Cost $769,503,447) | | | | | | | 1,075,028,653 | |
Investment Company—3.0% | |
| Oppenheimer Institutional Money Market Fund, Cl. E, 0.09%2,3 (Cost $33,794,445) | | | 33,794,445 | | | | 33,794,445 | |
Total Investments, at Value | | | | | | | | |
(Cost $803,297,892) | | | 98.6 | % | | | 1,108,823,098 | |
| Assets in Excess of Other Liabilities | | | 1.4 | | | | 16,036,818 | |
| | | | |
Net Assets | | | 100.0 | % | | $ | 1,124,859,916 | |
| | | | |
Footnotes to Statement of Investments
1. Non-income producing security.
2. Is or was an affiliate, as defined in the Investment Company Act of 1940, at or during the period ended December 31, 2013, by virtue of the Fund owning at least 5% of the voting securities of the issuer or as a result of the Fund and the issuer having the same investment adviser. Transactions during the period in which the issuer was an affiliate are as follows:
| | | | | | | | | | | | | | | | |
| | | Shares
December 31, 2012 | | | Gross
Additions | | | Gross
Reductions | | | Shares
December 31, 2013 | |
Oppenheimer Institutional Money Market Fund, Cl. E | | | 13,103,742 | | | | 393,564,389 | | | | 372,873,686 | | | | 33,794,445 | |
| | | | | | | | |
| | | | Value | | Income | |
Oppenheimer Institutional Money Market Fund, Cl. E | | | | $33,794,445 | | $ | 28,727 | |
3. Rate shown is the 7-day yield as of December 31, 2013.
See accompanying Notes to Financial Statements.
8 OPPENHEIMER MAIN STREET SMALL CAP FUND/VA
| | |
STATEMENT OF ASSETS AND LIABILITIES December 31, 2013 |
| | | | |
Assets | | | | |
Investments, at value—see accompanying statement of investments: | | | | |
Unaffiliated companies (cost $769,503,447) | | $ | 1,075,028,653 | |
Affiliated companies (cost $33,794,445) | | | 33,794,445 | |
| | | | |
| | | | 1,108,823,098 | |
Receivables and other assets: | | | | |
Investments sold | | | 20,179,199 | |
Dividends | | | 1,601,461 | |
Shares of beneficial interest sold | | | 351,010 | |
Other | | | 37,377 | |
| | | | |
Total assets | | | 1,130,992,145 | |
|
| |
Liabilities | | | | |
Bank overdraft | | | 156,085 | |
Payables and other liabilities: | | | | |
Investments purchased | | | 4,477,016 | |
Shares of beneficial interest redeemed | | | 1,070,388 | |
Distribution and service plan fees | | | 211,835 | |
Transfer and shareholder servicing agent fees | | | 93,183 | |
Shareholder communications | | | 62,707 | |
Trustees’ compensation | | | 31,982 | |
Other | | | 29,033 | |
| | | | |
Total liabilities | | | 6,132,229 | |
|
| |
Net Assets | | $ | 1,124,859,916 | |
| | | | |
|
| |
Composition of Net Assets | | | | |
Par value of shares of beneficial interest | | $ | 40,816 | |
Additional paid-in capital | | | 660,869,813 | |
Accumulated net investment income | | | 3,488,652 | |
Accumulated net realized gain on investments | | | 154,935,429 | |
Net unrealized appreciation on investments | | | 305,525,206 | |
| | | | |
Net Assets | | $ | 1,124,859,916 | |
| | | | |
|
| |
Net Asset Value Per Share | | | | |
Non-Service Shares: | | | | |
| Net asset value, redemption price (excludes applicable contingent deferred sales charge) and offering price per share (based on net assets of $134,692,149 and 4,845,662 shares of beneficial interest outstanding) | | | $27.80 | |
Service Shares: | | | | |
Net asset value, redemption price (excludes applicable contingent deferred sales charge) and offering price per share (based on net assets of $990,167,767 and 35,970,155 shares of beneficial interest outstanding) | | | $27.53 | |
See accompanying Notes to Financial Statements.
9 OPPENHEIMER MAIN STREET SMALL CAP FUND/VA
| | |
STATEMENT OF OPERATIONS For the Year Ended December 31, 2013 |
| | | | |
Investment Income | | | | |
Dividends: | | | | |
Unaffiliated companies | | $ | 15,534,668 | |
Affiliated companies | | | 28,727 | |
Interest: | | | 38 | |
| | | | |
Total investment income | | | 15,563,433 | |
|
| |
Expenses | | | | |
Management fees | | | 7,123,713 | |
Distribution and service plan fees - Service shares | | | 2,336,909 | |
Transfer and shareholder servicing agent fees: | | | | |
Non-Service shares | | | 113,511 | |
Service shares | | | 934,317 | |
Shareholder communications: | | | | |
Non-Service shares | | | 21,332 | |
Service shares | | | 166,964 | |
Custodian fees and expenses | | | 6,360 | |
Trustees’ compensation | | | 50,953 | |
Other | | | 87,182 | |
| | | | |
Total expenses | | | 10,841,241 | |
Less waivers and reimbursements of expenses | | | (70,452 | ) |
| | | | |
Net expenses | | | 10,770,789 | |
|
| |
Net Investment Income | | | 4,792,644 | |
|
| |
Realized and Unrealized Gain | | | | |
Net realized gain on investments from unaffiliated companies | | | 175,049,148 | |
Net change in unrealized appreciation/depreciation on investments | | | 173,986,568 | |
|
| |
Net Increase in Net Assets Resulting from Operations | | $ | 353,828,360 | |
| | | | |
See accompanying Notes to Financial Statements.
10 OPPENHEIMER MAIN STREET SMALL CAP FUND/VA
| | |
STATEMENTS OF CHANGES IN NET ASSETS |
| | | | | | | | |
| | | Year Ended
December 31, 2013 | | | Year Ended
December 31, 2012 | |
Operations | | | | | | | | |
Net investment income | | $ | 4,792,644 | | | $ | 7,763,392 | |
Net realized gain | | | 175,049,148 | | | | 96,274,108 | |
Net change in unrealized appreciation/depreciation | | | 173,986,568 | | | | 44,253,351 | |
| | | | | | | | |
Net increase in net assets resulting from operations | | | 353,828,360 | | | | 148,290,851 | |
|
| |
Dividends and/or Distributions to Shareholders | | | | | | | | |
Dividends from net investment income: | | | | | | | | |
Non-Service shares | | | (978,410) | | | | (465,213 | ) |
Service shares | | | (6,606,031) | | | | (2,756,105 | ) |
| | | | | | | | |
| | | (7,584,441) | | | | (3,221,318 | ) |
|
| | |
Distributions from net realized gain: | | | | | | | | |
Non-Service shares | | | (1,288,110) | | | | — | |
Service shares | | | (11,405,204) | | | | — | |
| | | | | | | | |
| | | (12,693,314) | | | | — | |
|
| |
Beneficial Interest Transactions | | | | | | | | |
Net increase (decrease) in net assets resulting from beneficial interest transactions: | | | | | | | | |
Non-Service shares | | | 11,660,720 | | | | (5,485,155 | ) |
Service shares | | | (157,538,740) | | | | (72,871,133 | ) |
| | | | | | | | |
| | | (145,878,020) | | | | (78,356,288 | ) |
|
| |
Net Assets | | | | | | | | |
| | |
Total increase | | | 187,672,585 | | | | 66,713,245 | |
Beginning of period | | | 937,187,331 | | | | 870,474,086 | |
| | | | | | | | |
| | |
End of period (including accumulated net investment income of $3,488,652 and $7,663,759, respectively) | | $ | 1,124,859,916 | | | $ | 937,187,331 | |
| | | | |
See accompanying Notes to Financial Statements.
11 OPPENHEIMER MAIN STREET SMALL CAP FUND/VA
| | | | | | | | | | | | | | | | | | |
Non-Service Shares | |
| Year Ended
December
31, 2013 |
| |
| Year Ended
December
31, 2012 |
| |
| Year Ended
December
30, 2011 |
1 | |
| Year Ended
December
31, 2010 |
| | Year Ended December 31, 2009 |
Per Share Operating Data | | | | | | | | | | | | | | | | | | |
Net asset value, beginning of period | | $ | 20 .14 | | | $ | 17 .17 | | | $ | 17 .66 | | | $ | 14 .40 | | | $ 10 .65 |
Income (loss) from investment operations: | | | | | | | | | | | | | | | | | | |
Net investment income2 | | | 0 .16 | | | | 0 .21 | | | | 0 .10 | | | | 0 .10 | | | 0 .08 |
Net realized and unrealized gain (loss) | | | 8 .01 | | | | 2 .87 | | | | (0 .48 | ) | | | 3 .25 | | | 3 .78 |
| | | |
Total from investment operations | | | 8 .17 | | | | 3 .08 | | | | (0 .38 | ) | | | 3 .35 | | | 3 .86 |
Dividends and/or distributions to shareholders: | | | | | | | | | | | | | | | | | | |
Dividends from net investment income | | | (0 .22 | ) | | | (0 .11 | ) | | | (0 .11 | ) | | | (0 .09 | ) | | (0 .11) |
Distributions from net realized gain | | | (0 .29 | ) | | | 0 .00 | | | | 0 .00 | | | | 0 .00 | | | 0 .00 |
| | | |
Total dividends and/or distributions to shareholders | | | (0 .51 | ) | | | (0 .11 | ) | | | (0 .11 | ) | | | (0 .09 | ) | | (0 .11) |
Net asset value, end of period | | $ | 27 .80 | | | $ | 20 .14 | | | $ | 17 .17 | | | $ | 17 .66 | | | $ 14 .40 |
| | | |
| | | | | | | | | | | | | | | | | | |
Total Return, at Net Asset Value3 | | | 41 .01 | % | | | 17.99 | % | | | (2.21 | )% | | | 23.41 | % | | 37.20% |
Ratios/Supplemental Data | | | | | | | | | | | | | | | | | | |
Net assets, end of period (in thousands) | | $ | 134,692 | | | $ | 87,267 | | | $ | 79,722 | | | $ | 95,576 | | | $ 81,814 |
Average net assets (in thousands) | | $ | 113,522 | | | $ | 83,790 | | | $ | 86,796 | | | $ | 88,063 | | | $ 69,585 |
Ratios to average net assets:4 | | | | | | | | | | | | | | | | | | |
Net investment income | | | 0 .67 | % | | | 1 .09 | % | | | 0 .58 | % | | | 0 .68 | % | | 0 .71% |
Total expenses5 | | | 0 .81 | % | | | 0 .83 | % | | | 0 .83 | % | | | 0 .85 | % | | 0 .91% |
Expenses after payments, waivers and/or reimbursements and reduction to custodian expenses | | | 0 .80 | % | | | 0 .80 | % | | | 0 .80 | % | | | 0 .80 | % | | 0 .82% |
Portfolio turnover rate | | | 60 | % | | | 92 | % | | | 108 | % | | | 73 | % | | 140% |
1. December 30, 2011 represents the last business day of the Fund’s reporting period.
2. Per share amounts calculated based on the average shares outstanding during the period.
3. Assumes an initial investment on the business day before the first day of the fiscal period, with all dividends and distributions reinvested in additional shares on the reinvestment date, and redemption at the net asset value calculated on the last business day of the fiscal period. Total returns are not annualized for periods less than one full year. Total return information does not reflect expenses that apply at the separate account level or to related insurance products. Inclusion of these charges would reduce the total return figures for all periods shown. Returns do not reflect the deduction of taxes that a shareholder would pay on fund distributions or the redemption of fund shares.
4. Annualized for periods less than one full year.
5. Total expenses including indirect expenses from affiliated fund were as follows:
| | | | |
Year Ended December 31, 2013 | | | 0.81 | % |
Year Ended December 31, 2012 | | | 0.83 | % |
Year Ended December 30, 2011 | | | 0.83 | % |
Year Ended December 31, 2010 | | | 0.85 | % |
Year Ended December 31, 2009 | | | 0.91 | % |
See accompanying Notes to Financial Statements.
12 OPPENHEIMER MAIN STREET SMALL CAP FUND/VA
| | | | | | | | | | | | | | | | | | |
Service Shares | |
| Year Ended
December
31, 2013 |
| |
| Year Ended
December
31, 2012 |
| |
| Year Ended
December
30, 2011 |
1 | |
| Year Ended
December
31, 2010 |
| | Year Ended December 31, 2009 |
Per Share Operating Data | | | | | | | | | | | | | | | | | | |
Net asset value, beginning of period | | $ | 19 .96 | | | $ | 17 .02 | | | $ | 17 .50 | | | $ | 14 .28 | | | $ 10 .54 |
Income (loss) from investment operations: | | | | | | | | | | | | | | | | | | |
Net investment income2 | | | 0 .10 | | | | 0 .15 | | | | 0 .06 | | | | 0 .07 | | | 0 .05 |
Net realized and unrealized gain (loss) | | | 7 .93 | | | | 2 .85 | | | | (0 .47 | ) | | | 3 .21 | | | 3 .76 |
| | | |
Total from investment operations | | | 8 .03 | | | | 3 .00 | | | | (0 .41 | ) | | | 3 .28 | | | 3 .81 |
Dividends and/or distributions to shareholders: | | | | | | | | | | | | | | | | | | |
Dividends from net investment income | | | (0 .17 | ) | | | (0 .06 | ) | | | (0 .07 | ) | | | (0 .06 | ) | | (0 .07) |
Distributions from net realized gain | | | (0 .29 | ) | | | 0 .00 | | | | 0 .00 | | | | 0 .00 | | | 0 .00 |
| | | |
Total dividends and/or distributions to shareholders | | | (0 .46 | ) | | | (0 .06 | ) | | | (0 .07 | ) | | | (0 .06 | ) | | (0 .07) |
Net asset value, end of period | | $ | 27 .53 | | | $ | 19 .96 | | | $ | 17 .02 | | | $ | 17 .50 | | | $ 14 .28 |
| | | |
| | | |
Total Return, at Net Asset Value3 | | | 40 .62 | % | | | 17 .67 | % | | | (2 .38 | )% | | | 23 .06 | % | | 36 .88% |
Ratios/Supplemental Data | | | | | | | | | | | | | | | | | | |
Net assets, end of period (in thousands) | | $ | 990,168 | | | $ | 849,920 | | | $ | 790,752 | | | $ | 859,710 | | | $ 662,347 |
Average net assets (in thousands) | | $ | 935,083 | | | $ | 836,487 | | | $ | 823,201 | | | $ | 730,069 | | | $ 612,651 |
Ratios to average net assets:4 | | | | | | | | | | | | | | | | | | |
Net investment income | | | 0 .43 | % | | | 0 .82 | % | | | 0 .34 | % | | | 0 .45 | % | | 0 .47% |
Total expenses5 | | | 1 .06 | % | | | 1 .08 | % | | | 1 .08 | % | | | 1 .10 | % | | 1 .15% |
Expenses after payments, waivers and/or reimbursements and reduction to custodian expenses | | | 1 .05 | % | | | 1 .05 | % | | | 1 .05 | % | | | 1 .05 | % | | 1 .07% |
Portfolio turnover rate | | | 60 | % | | | 92 | % | | | 108 | % | | | 73 | % | | 140% |
1. December 30, 2011 represents the last business day of the Fund’s reporting period.
2. Per share amounts calculated based on the average shares outstanding during the period.
3. Assumes an initial investment on the business day before the first day of the fiscal period, with all dividends and distributions reinvested in additional shares on the reinvestment date, and redemption at the net asset value calculated on the last business day of the fiscal period. Total returns are not annualized for periods less than one full year. Total return information does not reflect expenses that apply at the separate account level or to related insurance products. Inclusion of these charges would reduce the total return figures for all periods shown. Returns do not reflect the deduction of taxes that a shareholder would pay on fund distributions or the redemption of fund shares.
4. Annualized for periods less than one full year.
5. Total expenses including indirect expenses from affiliated fund were as follows:
| | | | |
Year Ended December 31, 2013 | | | 1.06 | % |
Year Ended December 31, 2012 | | | 1.08 | % |
Year Ended December 30, 2011 | | | 1.08 | % |
Year Ended December 31, 2010 | | | 1.10 | % |
Year Ended December 31, 2009 | | | 1.15 | % |
See accompanying Notes to Financial Statements.
13 OPPENHEIMER MAIN STREET SMALL CAP FUND/VA
| | |
NOTES TO FINANCIAL STATEMENTS December 31, 2013 |
1. Significant Accounting Policies
Oppenheimer Main Street Small Cap Fund/VA (the “Fund”), formerly Oppenheimer Main Street Small- & Mid-Cap Fund/VA, is a separate series of Oppenheimer Variable Account Funds, a diversified open-end management investment company registered under the Investment Company Act of 1940, as amended. The Fund’s investment objective is to seek capital appreciation. The Fund’s investment adviser is OFI Global Asset Management, Inc. (“OFI Global” or the “Manager”), a wholly-owned subsidiary of OppenheimerFunds, Inc. (“OFI” or the “Sub-Adviser”). The Manager has entered into a sub-advisory agreement with OFI. Shares of the Fund are sold only to separate accounts of life insurance companies.
The Fund offers two classes of shares. Both classes are sold at their offering price, which is the net asset value per share, to separate investment accounts of participating insurance companies as an underlying investment for variable life insurance policies, variable annuity contracts or other investment products. The class of shares designated as Service shares is subject to a distribution and service plan. Both classes of shares have identical rights and voting privileges with respect to the Fund in general and exclusive voting rights on matters that affect that class alone. Earnings, net assets and net asset value per share may differ due to each class having its own expenses, such as transfer and shareholder servicing agent fees and shareholder communications, directly attributable to that class.
The following is a summary of significant accounting policies consistently followed by the Fund.
Investment in Oppenheimer Institutional Money Market Fund. The Fund is permitted to invest daily available cash balances in an affiliated money market fund. The Fund may invest the available cash in Class E shares of Oppenheimer Institutional Money Market Fund (“IMMF”) to seek current income while preserving liquidity. IMMF is a registered open-end management investment company, regulated as a money market fund under the Investment Company Act of 1940, as amended. The Manager is the investment adviser of IMMF, and the Sub-Adviser provides investment and related advisory services to IMMF. When applicable, the Fund’s investment in IMMF is included in the Statement of Investments. Shares of IMMF are valued at their net asset value per share. As a shareholder, the Fund is subject to its proportional share of IMMF’s Class E expenses, including its management fee. The Manager will waive fees and/or reimburse Fund expenses in an amount equal to the indirect management fees incurred through the Fund’s investment in IMMF.
Allocation of Income, Expenses, Gains and Losses. Income, expenses (other than those attributable to a specific class), gains and losses are allocated on a daily basis to each class of shares based upon the relative proportion of net assets represented by such class. Operating expenses directly attributable to a specific class are charged against the operations of that class.
Federal Taxes. The Fund intends to comply with provisions of the Internal Revenue Code applicable to regulated investment companies and to distribute substantially all of its investment company taxable income, including any net realized gain on investments not offset by capital loss carryforwards, if any, to shareholders. Therefore, no federal income or excise tax provision is required. The Fund files income tax returns in U.S. federal and applicable state jurisdictions. The statute of limitations on the Fund’s tax return filings generally remain open for the three preceding fiscal reporting period ends.
The tax components of capital shown in the following table represent distribution requirements the Fund must satisfy under the income tax regulations, losses the Fund may be able to offset against income and gains realized in future years and unrealized appreciation or depreciation of securities and other investments for federal income tax purposes.
| | | | | | | | | | | | |
Undistributed Net Investment Income | | Undistributed
Long-Term
Gain | | | Accumulated
Loss
Carryforward1,2 | | | Net Unrealized
Appreciation Based on cost of Securities and Other Investments
for Federal Income
Tax Purposes | |
$80,727,808 | | $ | 81,837,229 | | | | $ | | | $ | 301,833,225 | |
1. During the fiscal year ended December 31, 2013, the Fund did not utilize any capital loss carryforward.
2. During the fiscal year ended December 31, 2012, the Fund utilized $81,263,761 of capital loss carryforward to offset capital gains realized in that fiscal year.
Net investment income (loss) and net realized gain (loss) may differ for financial statement and tax purposes. The character of dividends and distributions made during the fiscal year from net investment income or net realized gains may differ from their ultimate characterization for federal income tax purposes. Also, due to timing of dividends and distributions, the fiscal year in which amounts are distributed may differ from the fiscal year in which the income or net realized gain was recorded by the Fund
Accordingly, the following amounts have been reclassified for December 31, 2013. Net assets of the Fund were unaffected by the reclassifications.
| | | | | | | | |
Increase to Paid-in Capital | | Reduction to Accumulated
Net Investment
Income | | | Reduction to Accumulated Net Realized Gain
on Investments3 | |
$19,422,422 | | | $1,383,310 | | | | $18,039,112 | |
3. $19,477,223, including $11,489,466 of long-term capital gain, was distributed in connection with Fund share redemptions.
14 OPPENHEIMER MAIN STREET SMALL CAP FUND/VA
1. Significant Accounting Policies (Continued)
The tax character of distributions paid during the years ended December 31, 2013 and December 31, 2012 was as follows:
| | | | | | | | |
| | | Year Ended
December 31, 2013 | | | Year Ended
December 31, 2012 | |
Distributions paid from: | | | | | | | | |
Ordinary income | | $ | 7,584,441 | | | $ | 3,221,318 | |
Long-term capital gain | | | 12,693,314 | | | | — | |
| | | | | | | | |
Total | | $ | 20,277,755 | | | $ | 3,221,318 | |
| | | | | | | | |
The aggregate cost of securities and other investments and the composition of unrealized appreciation and depreciation of securities and other investments for federal income tax purposes as of December 31, 2013 are noted in the following table. The primary difference between book and tax appreciation or depreciation of securities and other investments, if applicable, is attributable to the tax deferral of losses or tax realization of financial statement unrealized gain or loss.
| | | | |
Federal tax cost of securities | | $ | 806,989,873 | |
| | | | |
Gross unrealized appreciation | | $ | 310,010,159 | |
Gross unrealized depreciation | | | (8,176,934 | ) |
| | | | |
Net unrealized appreciation | | $ | 301,833,225 | |
| | | | |
Trustees’ Compensation. The Board of Trustees has adopted a compensation deferral plan for independent trustees that enables trustees to elect to defer receipt of all or a portion of the annual compensation they are entitled to receive from the Fund. For purposes of determining the amount owed to the Trustee under the plan, deferred amounts are treated as though equal dollar amounts had been invested in shares of the Fund or in other Oppenheimer funds selected by the Trustee. The Fund purchases shares of the funds selected for deferral by the Trustee in amounts equal to his or her deemed investment, resulting in a Fund asset equal to the deferred compensation liability. Such assets are included as a component of “Other” within the asset section of the Statement of Assets and Liabilities. Deferral of trustees’ fees under the plan will not affect the net assets of the Fund, and will not materially affect the Fund’s assets, liabilities or net investment income per share. Amounts will be deferred until distributed in accordance with the compensation deferral plan.
Dividends and Distributions to Shareholders. Dividends and distributions to shareholders, which are determined in accordance with income tax regulations and may differ from U.S. generally accepted accounting principles, are recorded on the ex-dividend date. Income and capital gain distributions, if any, are declared and paid annually or at other times as deemed necessary by the Manager.
Investment Income. Dividend income is recorded on the ex-dividend date or upon ex-dividend notification in the case of certain foreign dividends where the ex-dividend date may have passed. Non-cash dividends included in dividend income, if any, are recorded at the fair market value of the securities received. Interest income is recognized on an accrual basis. Discount and premium, which are included in interest income on the Statement of Operations, are amortized or accreted daily.
Custodian Fees. “Custodian fees and expenses” in the Statement of Operations may include interest expense incurred by the Fund on any cash overdrafts of its custodian account during the period. Such cash overdrafts may result from the effects of failed trades in portfolio securities and from cash outflows resulting from unanticipated shareholder redemption activity. The Fund pays interest to its custodian on such cash overdrafts, to the extent they are not offset by positive cash balances maintained by the Fund, at a rate equal to the Federal Funds Rate plus 0.50%. The “Reduction to custodian expenses” line item, if applicable, represents earnings on cash balances maintained by the Fund during the period. Such interest expense and other custodian fees may be paid with these earnings.
Security Transactions. Security transactions are recorded on the trade date. Realized gains and losses on securities sold are determined on the basis of identified cost.
Indemnifications. The Fund’s organizational documents provide current and former trustees and officers with a limited indemnification against liabilities arising in connection with the performance of their duties to the Fund. In the normal course of business, the Fund may also enter into contracts that provide general indemnifications. The Fund’s maximum exposure under these arrangements is unknown as this would be dependent on future claims that may be made against the Fund. The risk of material loss from such claims is considered remote.
Other. The preparation of financial statements in conformity with accounting principles generally accepted in the United States of America requires management to make estimates and assumptions that affect the reported amounts of assets and liabilities and disclosure of contingent assets and liabilities at the date of the financial statements and the reported amounts of increases and decreases in net assets from operations during the reporting period. Actual results could differ from those estimates.
2. Securities Valuation
The Fund calculates the net asset value of its shares as of the close of the New York Stock Exchange (the “Exchange”), normally 4:00 P.M. Eastern time, on each day the Exchange is open for trading.
15 OPPENHEIMER MAIN STREET SMALL CAP FUND/VA
| | |
NOTES TO FINANCIAL STATEMENTS Continued |
2. Securities Valuation (Continued)
The Fund’s Board has adopted procedures for the valuation of the Fund’s securities and has delegated the day-to-day responsibility for valuation determinations under those procedures to the Manager. The Manager has established a Valuation Committee which is responsible for determining a “fair valuation” for any security for which market quotations are not “readily available.” The Valuation Committee’s fair valuation determinations are subject to review, approval and ratification by the Fund’s Board at its next regularly scheduled meeting covering the calendar quarter in which the fair valuation was determined.
Valuation Methods and Inputs
Securities are valued using unadjusted quoted market prices, when available, as supplied primarily by third party pricing services or dealers.
The following methodologies are used to determine the market value or the fair value of the types of securities described below:
Securities traded on a registered U.S. securities exchange (including exchange-traded derivatives other than futures and futures options) are valued based on the last sale price of the security reported on the principal exchange on which it is traded, prior to the time when the Fund’s assets are valued. In the absence of a sale, the security is valued at the last sale price on the prior trading day, if it is within the spread of the current day’s closing “bid” and “asked” prices, and if not, at the current day’s closing bid price. A security of a foreign issuer traded on a foreign exchange, but not listed on a registered U.S. securities exchange, is valued based on the last sale price on the principal exchange on which the security is traded, as identified by the third party pricing service used by the Manager, prior to the time when the Fund’s assets are valued. If the last sale price is unavailable, the security is valued at the most recent official closing price on the principal exchange on which it is traded. If the last sales price or official closing price for a foreign security is not available, the security is valued at the mean between the bid and asked price per the exchange or, if not available from the exchange, obtained from two dealers. If bid and asked prices are not available from either the exchange or two dealers, the security is valued by using one of the following methodologies (listed in order of priority); (1) using a bid from the exchange, (2) the mean between the bid and asked price as provided by a single dealer, or (3) a bid from a single dealer.
Shares of a registered investment company that are not traded on an exchange are valued at that investment company’s net asset value per share.
Corporate and government debt securities (of U.S. or foreign issuers) and municipal debt securities, event-linked bonds, loans, mortgage-backed securities, collateralized mortgage obligations, and asset-backed securities are valued at the mean between the “bid” and “asked” prices utilizing evaluated prices obtained from third party pricing services or broker-dealers who may use matrix pricing methods to determine the evaluated prices.
Short-term money market type debt securities with a remaining maturity of sixty days or less are valued at cost adjusted by the amortization of discount or premium to maturity (amortized cost), which approximates market value. Short-term debt securities with a remaining maturity in excess of sixty days are valued at the mean between the “bid” and “asked” prices utilizing evaluated prices obtained from third party pricing services or broker-dealers.
A description of the standard inputs that may generally be considered by the third party pricing vendors in determining their evaluated prices is provided below.
| | |
| Security Type | | Standard inputs generally considered by third-party pricing vendors |
| Corporate debt, government debt, municipal, mortgage-backed and asset-backed securities | | Reported trade data, broker-dealer price quotations, benchmark yields, issuer spreads on comparable securities, the credit quality, yield, maturity, and other appropriate factors. |
Loans | | Information obtained from market participants regarding reported trade data and broker-dealer price quotations. |
Event-linked bonds | | Information obtained from market participants regarding reported trade data and broker-dealer price quotations. |
If a market value or price cannot be determined for a security using the methodologies described above, or if, in the “good faith” opinion of the Manager, the market value or price obtained does not constitute a “readily available market quotation,” or a significant event has occurred that would materially affect the value of the security the security is fair valued either (i) by a standardized fair valuation methodology applicable to the security type or the significant event as previously approved by the Valuation Committee and the Fund’s Board or (ii) as determined in good faith by the Manager’s Valuation Committee. The Valuation Committee considers all relevant facts that are reasonably available, through either public information or information available to the Manager, when determining the fair value of a security. Fair value determinations by the Manager are subject to review, approval and ratification by the Fund’s Board at its next regularly scheduled meeting covering the calendar quarter in which the fair valuation was determined. Those fair valuation standardized methodologies include, but are not limited to, valuing securities at the last sale price or initially at cost and subsequently adjusting the value based on: changes in company specific fundamentals, changes in an appropriate securities index, or changes in the value of similar securities which may be further adjusted for any discounts related to security-specific resale restrictions. When possible, such methodologies use observable market inputs such as unadjusted quoted prices of similar securities, observable interest rates, currency rates and yield curves. The methodologies used for valuing securities are not necessarily an indication of the risks associated with investing in those securities nor can it be assured that the Fund can obtain the fair value assigned to a security if it were to sell the security.
To assess the continuing appropriateness of security valuations, the Manager, or its third party service provider who is subject to oversight by the Manager, regularly compares prior day prices, prices on comparable securities, and sale prices to the current day prices and challenges those prices exceeding certain tolerance levels with the third party pricing service or broker source. For those securities valued by fair valuations, whether through a
16 OPPENHEIMER MAIN STREET SMALL CAP FUND/VA
2. Securities Valuation (Continued)
standardized fair valuation methodology or a fair valuation determination, the Valuation Committee reviews and affirms the reasonableness of the valuations based on such methodologies and fair valuation determinations on a regular basis after considering all relevant information that is reasonably available.
Classifications
Each investment asset or liability of the Fund is assigned a level at measurement date based on the significance and source of the inputs to its valuation. Various data inputs are used in determining the value of each of the Fund’s investments as of the reporting period end. These data inputs are categorized in the following hierarchy under applicable financial accounting standards:
1) Level 1-unadjusted quoted prices in active markets for identical assets or liabilities (including securities actively traded on a securities exchange)
2) Level 2-inputs other than unadjusted quoted prices that are observable for the asset or liability (such as unadjusted quoted prices for similar assets and market corroborated inputs such as interest rates, prepayment speeds, credit risks, etc.)
3) Level 3-significant unobservable inputs (including the Manager’s own judgments about assumptions that market participants would use in pricing the asset or liability).
The inputs used for valuing securities are not necessarily an indication of the risks associated with investing in those securities.
The table below categorizes amounts that are included in the Fund’s Statement of Assets and Liabilities as of December 31, 2013 based on valuation input level:
| | | | | | | | | | | | | | | | |
| | | Level 1— Unadjusted Quoted Prices | | | Level 2—
Other Significant Observable Inputs | | | Level 3— Significant Unobservable Inputs | | | Value | |
Assets Table | | | | | | | | | | | | | | | | |
Investments, at Value: | | | | | | | | | | | | | | | | |
Common Stocks | | | | | | | | | | | | | | | | |
Consumer Discretionary | | $ | 131,383,857 | | | $ | — | | | $ | — | | | $ | 131,383,857 | |
Consumer Staples | | | 23,458,128 | | | | — | | | | — | | | | 23,458,128 | |
Energy | | | 75,182,698 | | | | — | | | | — | | | | 75,182,698 | |
Financials | | | 248,386,385 | | | | — | | | | — | | | | 248,386,385 | |
Health Care | | | 105,663,252 | | | | — | | | | — | | | | 105,663,252 | |
Industrials | | | 211,454,707 | | | | — | | | | — | | | | 211,454,707 | |
Information Technology | | | 161,960,076 | | | | — | | | | — | | | | 161,960,076 | |
Materials | | | 111,751,202 | | | | — | | | | — | | | | 111,751,202 | |
Utilities | | | 5,788,348 | | | | — | | | | — | | | | 5,788,348 | |
Investment Company | | | 33,794,445 | | | | — | | | | — | | | | 33,794,445 | |
| | | | |
Total Assets | | $ | 1,108,823,098 | | | $ | — | | | $ | — | | | $ | 1,108,823,098 | |
| | | | |
Currency contracts and forwards, if any, are reported at their unrealized appreciation/ depreciation at measurement date, which represents the change in the contract’s value from trade date. Futures, if any, are reported at their variation margin at measurement date, which represents the amount due to/from the Fund at that date. All additional assets and liabilities included in the above table are reported at their market value at measurement date.
3. Shares of Beneficial Interest
The Fund has authorized an unlimited number of $0.001 par value shares of beneficial interest of each class. Transactions in shares of beneficial interest were as follows:
| | | | | | | | | | | | | | | | |
| | | Year Ended December 31, 2013 | | | Year Ended December 31, 2012 | |
| | | Shares | | | Amount | | | Shares | | | Amount | |
Non-Service Shares | | | | | | | | | | | | | | | | |
Sold | | | 2,050,901 | | | $ | 49,473,567 | | | | 1,076,459 | | | $ | 20,632,430 | |
Dividends and/or distributions reinvested | | | 95,274 | | | | 2,266,520 | | | | 25,160 | | | | 465,213 | |
Redeemed | | | (1,633,467 | ) | | | (40,079,367 | ) | | | (1,410,970 | ) | | | (26,582,798 | ) |
| | | | |
Net increase (decrease) | | | 512,708 | | | $ | 11,660,720 | | | | (309,351 | ) | | $ | (5,485,155 | ) |
| | | | |
|
| | |
Service Shares | | | | | | | | | | | | | | | | |
Sold | | | 3,333,649 | | | $ | 79,750,169 | | | | 4,633,662 | | | $ | 87,048,768 | |
Dividends and/or distributions reinvested | | | 763,535 | | | | 18,011,235 | | | | 150,278 | | | | 2,756,105 | |
Redeemed | | | (10,718,072 | ) | | | (255,300,144 | ) | | | (8,665,817 | ) | | | (162,676,006 | ) |
| | | | |
Net decrease | | | (6,620,888 | ) | | $ | (157,538,740 | ) | | | (3,881,877 | ) | | $ | (72,871,133 | ) |
| | | | |
4. Purchases and Sales of Securities
The aggregate cost of purchases and proceeds from sales of securities, other than short-term obligations and investments in IMMF, for the year ended December 31, 2013 were as follows:
| | | | | | | | |
| | | Purchases | | | Sales | |
Investment securities | | $ | 608,523,248 | | | $ | 776,401,792 | |
17 OPPENHEIMER MAIN STREET SMALL CAP FUND/VA
| | |
NOTES TO FINANCIAL STATEMENTS Continued |
5. Fees and Other Transactions with Affiliates
Management Fees. Under the investment advisory agreement, the Fund pays the Manager a management fee based on the daily net assets of the Fund at an annual rate as shown in the following table:
| | | | |
| Fee Schedule Through October 31, 2013 | |
Up to $200 million | | | 0.75 | % |
Next $200 million | | | 0.72 | |
Next $200 million | | | 0.69 | |
Next $200 million | | | 0.66 | |
Over $800 million | | | 0.60 | |
| | | | |
| Fee Schedule Effective November 1, 2013 | |
Up to $200 million | | | 0.75 | % |
Next $200 million | | | 0.72 | |
Next $200 million | | | 0.69 | |
Next $200 million | | | 0.66 | |
Over $20 million | | | 0.60 | |
Over $1 billion | | | 0.58 | |
Sub-Adviser Fees. The Manager has retained the Sub-Adviser to provide the day-to-day portfolio management of the Fund. Under the Sub-Advisory Agreement, the Manager pays the Sub-Adviser an annual fee in monthly installments, equal to a percentage of the investment management fee collected by the Manager from the Fund, which shall be calculated after any investment management fee waivers. The fee paid to the Sub-Adviser is paid by the Manager, not by the Fund.
Transfer Agent Fees. OFI Global (the “Transfer Agent”) serves as the transfer and shareholder servicing agent for the Fund. Fees incurred by the Fund with respect to these services are detailed in the Statement of Operations.
Sub-Transfer Agent Fees. The Transfer Agent has retained Shareholder Services, Inc., a wholly-owned subsidiary of OFI (the “Sub-Transfer Agent”), to provide the day-to-day transfer agent and shareholder servicing of the Fund. Under the Sub-Transfer Agency Agreement, the Transfer Agent pays the Sub-Transfer Agent an annual fee in monthly installments, equal to a percentage of the transfer agent fee collected by the Transfer Agent from the Fund, which shall be calculated after any applicable fee waivers. The fee paid to the Sub-Transfer Agent is paid by the Transfer Agent, not by the Fund.
Distribution and Service Plan for Service Shares. The Fund has adopted a Distribution and Service Plan (the “Plan”) in accordance with Rule 12b-1 under the Investment Company Act of 1940 for Service shares to pay OppenheimerFunds Distributor, Inc. (the “Distributor”), for distribution related services, personal service and account maintenance for the Fund’s Service shares. Under the Plan, payments are made periodically at an annual rate of 0.25% of the daily net assets of Service shares of the Fund. The Distributor currently uses all of those fees to compensate sponsors of the insurance product that offers Fund shares, for providing personal service and maintenance of accounts of their variable contract owners that hold Service shares. These fees are paid out of the Fund’s assets on an on-going basis and increase operating expenses of the Service shares, which results in lower performance compared to the Fund’s shares that are not subject to a service fee. Fees incurred by the Fund under the Plan are detailed in the Statement of Operations.
Waivers and Reimbursements of Expenses. The Manager has contractually agreed to limit the Fund’s expenses after payments, waivers and/or reimbursements and reduction to custodian expenses, excluding expenses incurred directly or indirectly by the Fund as a result of investments in other investment companies, wholly-owned subsidiaries and pooled investment vehicles; so that those expenses, as percentages of daily net assets, will not exceed the annual rate of 0.80% for Non-Service shares and 1.05% for Service shares. During the year ended December 31, 2013, the Manager waived fees and/or reimbursed the Fund $7,972 for Non-Service shares and $38,076 for Service shares, respectively.
The Manager will waive fees and/or reimburse Fund expenses in an amount equal to the indirect management fees incurred through the Fund’s investment in IMMF. During the year ended December 31, 2013, the Manager waived fees and/or reimbursed the Fund $24,404 for IMMF management fees.
Some of these undertakings may be modified or terminated at any time; some may not be modified or terminated until after one year from the date of the current prospectus, as indicated therein.
6. Pending Litigation
Since 2009, seven class action lawsuits have been pending in the U.S. District Court for the District of Colorado against OppenheimerFunds, Inc. (“OFI”), OppenheimerFunds Distributor, Inc., the Fund’s principal underwriter and distributor (the “Distributor”), and certain funds (but not including the Fund) advised by OFI Global Asset Management, Inc. and distributed by the Distributor (the “Defendant Funds”). The lawsuits also name as defendants certain officers and current and former trustees of the respective Defendant Funds. The lawsuits raise claims under federal securities law and allege, among other things, that the disclosure documents of the respective Defendant Funds contained misrepresentations and omissions and that the respective Defendant Funds’ investment policies were not followed. The plaintiffs in these actions seek unspecified damages, equitable relief and awards of attorneys’ fees and litigation expenses. The Defendant Funds’ Boards of Trustees have also engaged counsel to represent the Funds and the present and former Independent Trustees named in those suits. On August 26, 2013, the parties in six of these lawsuits executed a memorandum of understanding setting forth the terms of proposed settlements of those actions. The proposed settlements are subject to a variety of contingencies, including the execution of settlement agreements, which will require preliminary and final approval by the court. The proposed settlements do not resolve a seventh outstanding lawsuit relating to Oppenheimer California Municipal Fund.
18 OPPENHEIMER DISCOVERY MID CAP GROWTH FUND/VA
6. Pending Litigation (Continued)
Other class action and individual lawsuits have been filed since 2008 in various state and federal courts against OFI and certain of its affiliates by investors seeking to recover investments they allegedly lost as a result of the “Ponzi” scheme run by Bernard L. Madoff and his firm, Bernard L. Madoff Investment Securities, LLC (“BLMIS”). Plaintiffs in these suits allege that they suffered losses as a result of their investments in several funds managed by an affiliate of OFI and assert a variety of claims, including breach of fiduciary duty, fraud, negligent misrepresentation, unjust enrichment, and violation of federal and state securities laws and regulations, among others. They seek unspecified damages, equitable relief and awards of attorneys’ fees and litigation expenses. Neither the Distributor, nor any of the Oppenheimer mutual funds, their independent trustees or directors are named as defendants in these lawsuits. None of the Oppenheimer mutual funds invested in any funds or accounts managed by Madoff or BLMIS. On February 28, 2011, a stipulation of partial settlement of three groups of consolidated putative class action lawsuits relating to these matters was filed in the U.S. District Court for the Southern District of New York. On August 19, 2011, the court entered an order and final judgment approving the settlement as fair, reasonable and adequate. In September 2011, certain parties filed notices of appeal from the court’s order approving the settlement. The settlement does not resolve other outstanding lawsuits against OFI and its affiliates relating to BLMIS.
On April 16, 2010, a lawsuit was filed in New York state court against (i) OFI, (ii) an affiliate of OFI and (iii) AAArdvark IV Funding Limited (“AAArdvark IV”), an entity advised by OFI’s affiliate, in connection with investments made by the plaintiffs in AAArdvark IV. Plaintiffs allege breach of contract and common law fraud claims against the defendants and seek compensatory damages, costs and disbursements, including attorney fees. On April 11, 2013, the court granted defendants’ motion for summary judgment, dismissing plaintiffs’ fraud claim with prejudice and dismissing their contract claim without prejudice, and granted plaintiffs leave to replead their contract claim to assert a cause of action for specific performance within 30 days. On May 9, 2013, plaintiffs filed a notice of appeal from the court’s dismissal order. On January 7, 2014, the appellate court affirmed the trial court’s dismissal order. On July 15, 2011, a lawsuit was filed in New York state court against OFI, an affiliate of OFI and AAArdvark Funding Limited (“AAArdvark I”), an entity advised by OFI’s affiliate, in connection with investments made by the plaintiffs in AAArdvark I. The complaint alleges breach of contract and common law fraud claims against the defendants and seeks compensatory damages, costs and disbursements, including attorney fees. On November 9, 2011, a lawsuit was filed in New York state court against OFI, an affiliate of OFI and AAArdvark XS Funding Limited (“AAArdvark XS”), an entity advised by OFI’s affiliate, in connection with investments made by the plaintiffs in AAArdvark XS. The complaint alleged breach of contract against the defendants and sought compensatory damages, costs and disbursements, including attorney fees. On November 8, 2013, the parties filed a stipulation of discontinuance dismissing the lawsuit with prejudice.
OFI believes the lawsuits and appeals described above are without legal merit and, with the exception of actions it has settled, is defending against them vigorously. While it is premature to render any opinion as to the outcome in these lawsuits, or whether any costs that the Defendant Funds may bear in defending the suits might not be reimbursed by insurance, OFI believes that these suits should not impair the ability of OFI or the Distributor to perform their respective duties to the Fund, and that the outcome of all of the suits together should not have any material effect on the operations of any of the Oppenheimer mutual funds.
19 OPPENHEIMER MAIN STREET SMALL CAP FUND/VA
| | |
REPORT OF INDEPENDENT REGISTERED PUBLIC ACCOUNTING FIRM |
The Board of Trustees and Shareholders of Oppenheimer Variable Account Funds:
We have audited the accompanying statement of assets and liabilities of Oppenheimer Main Street Small Cap Fund/VA, formerly, Oppenheimer Main Street Small & Mid-Cap Fund/VA (a separate series of Oppenheimer Variable Account Funds), including the statement of investments, as of December 31, 2013, and the related statement of operations for the year then ended, the statements of changes in net assets for each of the years in the two-year period then ended, and the financial highlights for each of the years in the five-year period then ended. These financial statements and financial highlights are the responsibility of the Fund’s management. Our responsibility is to express an opinion on these financial statements and financial highlights based on our audits.
We conducted our audits in accordance with the standards of the Public Company Accounting Oversight Board (United States). Those standards require that we plan and perform the audit to obtain reasonable assurance about whether the financial statements and financial highlights are free of material misstatement. An audit includes examining, on a test basis, evidence supporting the amounts and disclosures in the financial statements. Our procedures included confirmation of securities owned as of December 31, 2013, by correspondence with the custodian, transfer agent and brokers, or by other appropriate auditing procedures where replies from brokers were not received. An audit also includes assessing the accounting principles used and significant estimates made by management, as well as evaluating the overall financial statement presentation. We believe that our audits provide a reasonable basis for our opinion.
In our opinion, the financial statements and financial highlights referred to above present fairly, in all material respects, the financial position of Oppenheimer Main Street Small Cap Fund/VA as of December 31, 2013, the results of its operations for the year then ended, the changes in its net assets for each of the years in the two-year period then ended, and the financial highlights for each of the years in the five-year period then ended, in conformity with U.S. generally accepted accounting principles.
KPMG LLP
Denver, Colorado
February 14, 2014
20 OPPENHEIMER MAIN STREET SMALL CAP FUND/VA
| | |
FEDERAL INCOME TAX INFORMATION Unaudited |
In early 2014, if applicable, shareholders of record received information regarding all dividends and distributions paid to them by the Fund during calendar year 2013.
Capital gain distributions of $0.29198 per share were paid to Non-Service and Service shareholders, respectively, on June 19, 2013. Whether received in stock or in cash, the capital gain distribution should be treated by shareholders as a gain from the sale of the capital assets held for more than one year (long-term capital gains).
Dividends, if any, paid by the Fund during the fiscal year ended December 31, 2013 which are not designated as capital gain distributions should be multiplied by the maximum amount allowable but not less than 8.97% to arrive at the amount eligible for the corporate dividend-received deduction.
The foregoing information is presented to assist shareholders in reporting distributions received from the Fund to the Internal Revenue Service. Because of the complexity of the federal regulations which may affect your individual tax return and the many variations in state and local tax regulations, we recommend that you consult your tax advisor for specific guidance.
21 OPPENHEIMER MAIN STREET SMALL CAP FUND/VA
| | |
| BOARD APPROVAL OF THE FUND’S INVESTMENT ADVISORY AND SUB-ADIVSORY AGREEMENTS Unaudited |
The Fund has entered into an investment advisory agreement with OFI Global Asset Management, Inc. (“OFI Global” or the “Adviser”), a wholly-owned subsidiary of OppenheimerFunds, Inc. (“OFI” or the “Sub-Adviser”) (“OFI Global” and “OFI” together the “Managers”) and OFI Global has entered into a sub-advisory agreement with OFI whereby OFI provides investment sub-advisory services to the Fund (collectively, the “Agreements”). Each year, the Board of Trustees (the “Board”), including a majority of the independent Trustees, is required to determine whether to renew the Agreements. The Investment Company Act of 1940, as amended, requires that the Board request and evaluate, and that the Managers provide, such information as may be reasonably necessary to evaluate the terms of the Agreements. The Board employs an independent consultant to prepare a report that provides information, including comparative information that the Board requests for that purpose. In addition to in-person meetings focused on this evaluation, the Board receives information throughout the year regarding Fund services, fees, expenses and performance.
The Adviser, Sub-Adviser and the independent consultant provided information to the Board on the following factors: (i) the nature, quality and extent of the Managers’ services, (ii) the investment performance of the Fund and the Managers, (iii) the fees and expenses of the Fund, including comparative expense information, (iv) the profitability of the Managers and their affiliates, including an analysis of the cost of providing services, (v) whether economies of scale are realized as the Fund grows and whether fee levels reflect these economies of scale for Fund investors and (vi) other benefits to the Managers from their relationship with the Fund. The Board was aware that there are alternatives to retaining the Managers.
Outlined below is a summary of the principal information considered by the Board as well as the Board’s conclusions.
Nature, Quality and Extent of Services. The Board considered information about the nature, quality and extent of the services provided to the Fund and information regarding the Managers’ key personnel who provide such services. The Sub-Adviser’s duties include providing the Fund with the services of the portfolio managers and the Sub-Adviser’s investment team, who provide research, analysis and other advisory services in regard to the Fund’s investments; securities trading services; oversight of third-party service providers; monitoring compliance with applicable Fund policies and procedures and adherence to the Fund’s investment restrictions; and risk management. The Managers are responsible for providing certain administrative services to the Fund as well. Those services include providing and supervising all administrative and clerical personnel who are necessary in order to provide effective corporate administration for the Fund; compiling and maintaining records with respect to the Fund’s operations; preparing and filing reports required by the Securities and Exchange Commission; preparing periodic reports regarding the operations of the Fund for its shareholders; preparing proxy materials for shareholder meetings; and preparing the registration statements required by Federal and state securities laws for the sale of the Fund’s shares. The Managers also provide the Fund with office space, facilities and equipment.
The Board also considered the quality of the services provided and the quality of the Managers’ resources that are available to the Fund. The Board took account of the fact that the Sub-Adviser has had over fifty years of experience as an investment adviser and that its assets under management rank it among the top mutual fund managers in the United States. The Board evaluated the Sub-Adviser’s advisory, administrative, accounting, legal, compliance services and risk management, and information the Board has received regarding the experience and professional qualifications of the Managers’ key personnel and the size and functions of its staff. In its evaluation of the quality of the portfolio management services provided, the Board considered the experience of Matthew Ziehl, Raymond Anello, Raman Vardharaj, Joy Budzinski, Kristin Ketner Pak, Magnus Krantz and Adam Weiner, the portfolio managers for the Fund, and the Sub-Adviser’s investment team and analysts. The Board members also considered the totality of their experiences with the Managers as directors or trustees of the Fund and other funds advised by the Managers. The Board considered information regarding the quality of services provided by affiliates of the Managers, which its members have become knowledgeable about in connection with the renewal of the Fund’s service agreements. The Board concluded, in light of the Managers’ experience, reputation, personnel, operations and resources that the Fund benefits from the services provided under the Agreement.
Investment Performance of the Manager and the Fund. Throughout the year, the Manager provided information on the investment performance of the Fund, including comparative performance information. The Board also reviewed information, prepared by the Manager and by the independent consultant, comparing the Fund’s historical performance to relevant market indices and to the performance of other small blend funds underlying variable insurance products. The Board noted that the Fund outperformed its performance category median for the one-, three-, five- and ten-year periods.
Costs of Services by the Manager. The Board reviewed the fees paid to the Manager and the other expenses borne by the Fund. The independent consultant provided comparative data in regard to the fees and expenses of the Fund and other small blend funds underlying variable insurance products. In reviewing the fees and expenses charged to the VA funds, the Board considered the Manager’s assertion that, because there is much greater disparity in the fees and services that may be provided by a manager to a VA fund as opposed to a retail fund, when comparing the expenses of the various VA funds to those of retail funds, it is most appropriate to focus on total expenses (rather than on the management fees). Accordingly, while the Board reviewed and considered all expenses, it focused on total expenses. The Board considered that the Fund’s contractual management fee and its total expenses were lower than its respective peer group median and category median. Within the total asset range of $500 million to $1 billion, the Fund’s effective rate was lower than its peer group median and category median. The Board also considered that the Manager has contractually agreed to limit the Fund’s total annual operating expenses so that those expenses, as percentages of daily net assets, will not exceed the annual rate of 0.80% for Non-Service Shares and 1.05% for Service Shares. This contractual expense limitation may not be amended or withdrawn until one year after the date of the Fund’s prospectus, unless approved by the Board.
22 OPPENHEIMER MAIN STREET SMALL CAP FUND/VA
Economies of Scale and Profits Realized by the Manager. The Board considered information regarding the Manager’s costs in serving as the Fund’s investment adviser, including the costs associated with the personnel and systems necessary to manage the Fund, and information regarding the Manager’s profitability from its relationship with the Fund. The Board reviewed whether the Manager may realize economies of scale in managing and supporting the Fund. The Board noted that the Fund currently has management fee breakpoints, which are intended to share with Fund shareholders economies of scale that may exist as the Fund’s assets grow. Based on the Board’s evaluation, the Managers agreed to a revised breakpoint schedule as negotiated by the Board that, effective November 2013, includes an additional fee breakpoint of 0.58% for assets in excess of $1 billion.
Other Benefits to the Managers. In addition to considering the profits realized by the Managers, the Board considered information that was provided regarding the direct and indirect benefits the Managers receive as a result of their relationship with the Fund, including compensation paid to the Managers’ affiliates and research provided to the Adviser in connection with permissible brokerage arrangements (soft dollar arrangements). The Board also considered that the Managers must be able to pay and retain experienced professional personnel at competitive rates to provide quality services to the Fund.
Conclusions. These factors were also considered by the independent Trustees meeting separately from the full Board, assisted by experienced counsel to the Fund and to the independent Trustees. Fund counsel and the independent Trustees’ counsel are independent of the Managers within the meaning and intent of the Securities and Exchange Commission Rules.
Based on its review of the information it received and its evaluations described above, the Board, including a majority of the independent Trustees, decided to continue the Agreements through August 31, 2014. In arriving at its decision, the Board did not identify any factor or factors as being more important than others, but considered all of the above information, and considered the terms and conditions of the Agreements, including the management fees, in light of all the surrounding circumstances.
23 OPPENHEIMER MAIN STREET SMALL CAP FUND/VA
| | |
| PORTFOLIO PROXY VOTING POLICIES AND PROCEDURES; UPDATES TO STATEMENTS OF INVESTMENTS Unaudited |
The Fund has adopted Portfolio Proxy Voting Policies and Procedures under which the Fund votes proxies relating to securities (“portfolio proxies”) held by the Fund. A description of the Fund’s Portfolio Proxy Voting Policies and Procedures is available (i) without charge, upon request, by calling the Fund toll-free at 1.800.CALL OPP (225.5677), (ii) on the Fund’s website at oppenheimerfunds.com, and (iii) on the SEC’s website at www.sec.gov. In addition, the Fund is required to file Form N-PX, with its complete proxy voting record for the 12 months ended June 30th, no later than August 31st of each year. The Fund’s voting record is available (i) without charge, upon request, by calling the Fund toll-free at 1.800.CALL OPP (225.5677), and (ii) in the Form N-PX filing on the SEC’s website at www.sec.gov.
The Fund files its complete schedule of portfolio holdings with the SEC for the first quarter and the third quarter of each fiscal year on Form N-Q. The Fund’s Form N-Q filings are available on the SEC’s website at www.sec.gov. Those forms may be reviewed and copied at the SEC’s Public Reference Room in Washington, D.C. Information on the operation of the Public Reference Room may be obtained by calling 1-800-SEC-0330.
24 OPPENHEIMER MAIN STREET SMALL CAP FUND/VA
| | |
TRUSTEES AND OFFICERS Unaudited |
| | |
Name, Position(s) Held with the Fund, Length of Service, Year of Birth | | Principal Occupation(s) During the Past 5 Years; Other Trusteeships/Directorships Held; Number of Portfolios in the Fund Complex Currently Overseen |
| |
INDEPENDENT TRUSTEES | | The address of each Trustee in the chart below is 6803 S. Tucson Way, Centennial, Colorado 80112-3924. Each Trustee serves for an indefinite term, or until his or her resignation, retirement, death or removal. |
| |
Sam Freedman, Chairman of the Board of Trustees (since 2013) and Trustee (since 1998) Year of Birth: 1940 | | Director of Colorado UpLIFT (charitable organization) (since September 1984). Mr. Freedman held several positions with the Sub-Adviser and with subsidiary or affiliated companies of the Sub-Adviser (until October 1994). Oversees 39 portfolios in the OppenheimerFunds complex. Mr. Freedman has served on the Boards of certain Oppenheimer funds since 1996, during which time he has become familiar with the Fund’s (and other Oppenheimer funds’) financial, accounting, regulatory and investment matters and has contributed to the Boards’ deliberations. |
| |
Edward L. Cameron, Trustee (since 1999) Year of Birth: 1938 | | Member of The Life Guard of Mount Vernon (George Washington historical site) (June 2000-June 2006); Partner of PricewaterhouseCoopers LLP (accounting firm) (July 1974-June 1999); Chairman of Price Waterhouse LLP Global Investment Management Industry Services Group (accounting firm) (July 1994-June 1998). Oversees 39 portfolios in the OppenheimerFunds complex. Mr. Cameron has served on the Boards of certain Oppenheimer funds since 1999, during which time he has become familiar with the Fund’s (and other Oppenheimer funds’) financial, accounting, regulatory and investment matters and has contributed to the Boards’ deliberations. |
| |
Jon S. Fossel, Trustee (since 1998) Year of Birth: 1942 | | Chairman of the Board (2006-December 2011) and Director (June 2002-December 2011) of UNUMProvident (insurance company); Director of Northwestern Energy Corp. (public utility corporation) (November 2004-December 2009); Director of P.R. Pharmaceuticals (October 1999-October 2003); Director of Rocky Mountain Elk Foundation (non-profit organization) (February 1998-February 2003 and February 2005-February 2007); Chairman and Director (until October 1996) and President and Chief Executive Officer (until October 1995) of the Sub-Adviser; President, Chief Executive Officer and Director of the following: Oppenheimer Acquisition Corp. (“OAC”) (parent holding company of the Sub-Adviser), Shareholders Services, Inc. and Shareholder Financial Services, Inc. (until October 1995). Oversees 39 portfolios in the OppenheimerFunds complex. Mr. Fossel has served on the Boards of certain Oppenheimer funds since 1990, during which time he has become familiar with the Fund’s (and other Oppenheimer funds’) financial, accounting, regulatory and investment matters and has contributed to the Boards’ deliberations. |
| |
Richard F. Grabish, Trustee (since 2012) Year of Birth: 1948 | | Formerly Senior Vice President and Assistant Director of Sales and Marketing (March 1997-December 2007), Director (March 1987-December 2007) and Manager of Private Client Services (June 1985-June 2005) of A.G. Edwards & Sons, Inc. (broker/dealer and investment firm); Chairman and Chief Executive Officer of A.G. Edwards Trust Company, FSB (March 2001-December 2007); President and Vice Chairman of A.G. Edwards Trust Company, FSB (investment adviser) (April 1987-March 2001); President of A.G. Edwards Trust Company, FSB (investment adviser) (June 2005-December 2007). Oversees 39 portfolios in the OppenheimerFunds complex. Mr. Grabish has served on the Boards of certain Oppenheimer funds since 2001, during which time he has become familiar with the Fund’s (and other Oppenheimer funds’) financial, accounting, regulatory and investment matters and has contributed to the Boards’ deliberations. |
| |
Beverly L. Hamilton, Trustee (since 2002) Year of Birth: 1946 | | Trustee of Monterey Institute for International Studies (educational organization) (since February 2000); Board Member of Middlebury College (educational organization) (December 2005-June 2011); Chairman (since 2010) of American Funds’ Emerging Markets Growth Fund, Inc. (mutual fund); Director of The California Endowment (philanthropic organization) (April 2002-April 2008); Director (February 2002-2005) and Chairman of Trustees (2006-2007) of the Community Hospital of Monterey Peninsula; Director (October 1991-2005); Vice Chairman (2006-2009) of American Funds’ Emerging Markets Growth Fund, Inc. (mutual fund); President of ARCO Investment Management Company (February 1991-April 2000); Member of the investment committees of The Rockefeller Foundation (2001-2006) and The University of Michigan (since 2000); Advisor at Credit Suisse First Boston’s Sprout venture capital unit (venture capital fund) (1994-January 2005); Trustee of MassMutual Institutional Funds (investment company) (1996-June 2004); Trustee of MML Series Investment Fund (investment company) (April 1989-June 2004); Member of the investment committee of Hartford Hospital (2000-2003); and Advisor to Unilever (Holland) pension fund (2000-2003). Oversees 39 portfolios in the OppenheimerFunds complex. Ms. Hamilton has served on the Boards of certain Oppenheimer funds since 2002, during which time she has become familiar with the Fund’s (and other Oppenheimer funds’) financial, accounting, regulatory and investment matters and has contributed to the Boards’ deliberations. |
| |
Victoria J. Herget, Trustee (since 2012) Year of Birth:1951 | | Independent Director of the First American Funds (mutual fund family) (2003-2011); former Managing Director (1993-2001), Principal (1985-1993), Vice President (1978-1985) and Assistant Vice President (1973-1978) of Zurich Scudder Investments (and its predecessor firms); Board Chair (2008-Present) and Director (2004-Present), United Educators (insurance company); Trustee (1992-2007), Chair of the Board of Trustees (1999-2007), Investment Committee Chair (1994-1999) and Investment Committee member (2007-2010) of Wellesley College; Trustee (since 2000) and Chair (since 2010), Newberry Library; Trustee, Mather LifeWays (since 2001); Trustee, BoardSource (2006-2009) and Chicago City Day School (1994-2005). Oversees 39 portfolios in the OppenheimerFunds complex. Ms. Herget has served on the Boards of certain Oppenheimer funds since 2012, during which time she has become familiar with the Fund’s (and other Oppenheimer funds’) financial, accounting, regulatory and investment matters and has contributed to the Boards’ deliberations. |
25 OPPENHEIMER MAIN STREET SMALL CAP FUND/VA
| | |
TRUSTEES AND OFFICERS Unaudited / Continued |
| | |
Robert J. Malone, Trustee (since 2002) Year of Birth: 1944 | | Chairman of the Board (since 2012) and Director (since August 2005) of Jones International University (educational organization) (since August 2005); Chairman, Chief Executive Officer and Director of Steele Street Bank Trust (commercial banking) (since August 2003); Trustee of the Gallagher Family Foundation (non-profit organization) (since 2000); Board of Directors of Opera Colorado Foundation (non-profit organization) (2008-2012); Director of Colorado UpLIFT (charitable organization) (1986-2010); Director of Jones Knowledge, Inc. (2006-2010); Former Chairman of U.S. Bank-Colorado (subsidiary of U.S. Bancorp and formerly Colorado National Bank) (July 1996-April 1999); Director of Commercial Assets, Inc. (real estate investment trust) (1993-2000); Director of U.S. Exploration, Inc. (oil and gas exploration) (1997-February 2004); Chairman of the Board (1991-1994) and Trustee (1985-1994) of Regis University; and Chairman of the Board (1990-1991 and Trustee (1984-1999) of Young Presidents Organization. Oversees 39 portfolios in the OppenheimerFunds complex. Mr. Malone has served on the Boards of certain Oppenheimer funds since 2002, during which time he has become familiar with the Fund’s (and other Oppenheimer funds’) financial, accounting, regulatory and investment matters and has contributed to the Boards’ deliberations. |
| |
F. William Marshall, Jr., Trustee (since 2000) Year of Birth: 1942 | | Trustee Emeritus of Worcester Polytech Institute (WPI) (private university) (since 2009); Trustee of MassMutual Select Funds (formerly MassMutual Institutional Funds) (investment company) (since 1996), MML Series Investment Fund (investment company) (since 1996) and Mass Mutual Premier Funds (investment company) (since January 2012); President and Treasurer of the SIS Fund (private charitable fund) (January 1999 – March 2011); Former Trustee of WPI (1985-2008); Former Chairman of the Board (2004-2006) and Former Chairman of the Investment Committee of WPI (1994-2008); Chairman of SIS & Family Bank, F.S.B. (formerly SIS Bank) (commercial bank) (January 1999-July 1999); Executive Vice President of Peoples Heritage Financial Group, Inc. (commercial bank) (January 1999-July 1999); and Former President and Chief Executive Officer of SIS Bancorp. (1993-1999). Oversees 43 portfolios in the OppenheimerFunds complex. Mr. Marshall has served on the Boards of certain Oppenheimer funds since 2000, during which time he has become familiar with the Fund’s (and other Oppenheimer funds’) financial, accounting, regulatory and investment matters and has contributed to the Boards’ deliberations. |
| |
Karen L. Stuckey, Trustee (since 2012) Year of Birth: 1953 | | Partner (1990-2012) of PricewaterhouseCoopers LLP (held various positions 1975-1990); Emeritus Trustee (since 2006), Trustee (1992-2006) and member of Executive, Nominating and Audit Committees and Chair of Finance Committee of Lehigh University; and member, Women’s Investment Management Forum since inception. Oversees 39 portfolios in the OppenheimerFunds complex. Ms. Stuckey has served on the Boards of certain Oppenheimer funds since 2012, during which time she has become familiar with the Fund’s (and other Oppenheimer funds’) financial, accounting, regulatory and investment matters and has contributed to the Boards’ deliberations. |
| |
James D. Vaughn, Trustee (since 2012) Year of Birth:1945 | | Retired; former managing partner (1994-2001) of Denver office of Deloitte & Touche LLP, (held various positions 1969-1993); Trustee and Chairman of the Audit Committee of Schroder Funds (2003-2012); Board member and Chairman of Audit Committee of AMG National Trust Bank (since 2005); Trustee and Investment Committee member, University of South Dakota Foundation (since 1996); Board member, Audit Committee Member and past Board Chair, Junior Achievement (since 1993); former Board member, Mile High United Way, Boys and Girls Clubs, Boy Scouts, Colorado Business Committee for the Arts, Economic Club of Colorado and Metro Denver Network. Oversees 39 portfolios in the OppenheimerFunds complex. Mr. Vaughn has served on the Boards of certain Oppenheimer funds since 2012, during which time he has become familiar with the Fund’s (and other Oppenheimer funds’) financial, accounting, regulatory and investment matters and has contributed to the Boards’ deliberations. |
| | |
INTERESTED TRUSTEE AND OFFICER | | Mr. Glavin is an “Interested Trustee” because he is affiliated with the Manager and the Sub-Adviser by virtue of his positions as an officer and director of the Manager and a director of the Sub-Adviser, and as a shareholder of the Sub-Adviser’s parent company. Both as a Trustee and as an officer, he serves for an indefinite term, or until his resignation, retirement, death or removal. Mr. Glavin’s address is Two World Financial Center, 225 Liberty Street, 11th Floor, New York, New York 10281-1008. |
| |
William F. Glavin, Jr., Trustee, President and Principal Executive Officer (since 2009) Year of Birth: 1958 | | Director, Chairman and Chief Executive Officer of the Manager (since January 2013); President of the Manager (January 2013-May 2013); Chairman of the Sub-Adviser (December 2009-December 2012); Chief Executive Officer (January 2009-December 2012) and Director of the Sub-Adviser (since January 2009); President of the Sub-Adviser (May 2009-December 2012); Management Director (since June 2009), President (since December 2009) and Chief Executive Officer (since January 2011) of Oppenheimer Acquisition Corp. (“OAC”) (the Sub-Adviser’s parent holding company); Director of Oppenheimer Real Asset Management, Inc. (since March 2010); Executive Vice President (March 2006-February 2009) and Chief Operating Officer (July 2007-February 2009) of Massachusetts Mutual Life Insurance Company (OAC’s parent company); Director (May 2004-March 2006) and Chief Operating Officer and Chief Compliance Officer (May 2004-January 2005), President (January 2005-March 2006) and Chief Executive Officer (June 2005-March 2006) of Babson Capital Management LLC; Director (March 2005-March 2006), President (May 2003-March 2006) and Chief Compliance Officer (July 2005-March 2006) of Babson Capital Securities, Inc. (a broker-dealer); President (May 2003-March 2006) of Babson Investment Company, Inc.; Director (May 2004-August 2006) of Babson Capital Europe Limited; Director (May 2004-October 2006) of Babson Capital Guernsey Limited; Director (May 2004-March 2006) of Babson Capital Management LLC; Non-Executive Director (March 2005-March 2007) of Baring Asset Management Limited; Director (February 2005-June 2006) Baring Pension Trustees Limited; Director and Treasurer (December 2003-November 2006) of Charter Oak Capital Management, Inc.; Director (May 2006-September 2006) of C.M. Benefit Insurance Company; Director (May 2008-June 2009) and Executive Vice President (June 2007-July 2009) of C.M. Life Insurance Company; President (March 2006-May 2007) of MassMutual Assignment Company; Director (January 2005-December 2006), Deputy Chairman (March 2005-December 2006) and President (February 2005-March 2005) of MassMutual Holdings (Bermuda) Limited; Director (May 2008-June 2009) and Executive Vice President (June 2007-July 2009) of MML Bay State Life Insurance Company; Chief Executive Officer and President (April 2007-January 2009) of MML Distributors, LLC; and Chairman (March 2006-December 2008) and Chief Executive Officer (May 2007-December 2008) of MML Investors Services, Inc. An officer of 90 portfolios in the OppenheimerFunds complex. |
26 OPPENHEIMER MAIN STREET SMALL CAP FUND/VA
| | |
| | |
OTHER OFFICERS OF THE FUND | | The addresses of the Officers in the chart below are as follows: for Messrs. Ziehl, Vardharaj, Anello, Krantz, Weiner, Gabinet and Mss. Budzinski, Ketner Pak and Nasta, Two World Financial Center, 225 Liberty Street, New York, New York 10281-1008, for Messrs. Vandehey and Wixted, 6803 S. Tucson Way, Centennial, Colorado 80112-3924. Each Officer serves for an indefinite term or until his or her resignation, retirement, death or removal. |
| |
Matthew P. Ziehl, Vice President (since 2009) Year of Birth: 1967 | | Vice President and Senior Portfolio Manager of the Sub-Adviser (since May 2009). Portfolio manager with RS Investment Management Co. LLC (October 2006-May 2009); Managing Director at The Guardian Life Insurance Company (December 2001-October 2006) when Guardian Life Insurance acquired an interest in RS Investment Management Co. LLC. Team leader and co portfolio manager with Salomon Brothers Asset Management, Inc. for small growth portfolios (January 2001-December 2001). A portfolio manager and officer of other portfolios in the OppenheimerFunds complex. |
| |
Raman Vardharaj, Vice President (since 2009) Year of Birth: 1971 | | Vice President and portfolio manager of the Sub-Adviser (since May 2009). Sector manager and a senior quantitative analyst creating stock selection models, monitoring portfolio risks and analyzing portfolio performance across the RS Core Equity Team of RS Investment Management Co. LLC (October 2006-May 2009). Quantitative analyst at The Guardian Life Insurance Company of America (1998-October 2006) when Guardian Life Insurance acquired an interest in RS Investment Management Co. LLC. A portfolio manager and officer of other portfolios in the OppenheimerFunds complex. |
| |
Raymond Anello, Vice President (since 2011) Year of Birth: 1964 | | Vice President of the Sub-Adviser (since May 2009) and a portfolio manager of the Sub-Adviser (since April 2011). Sector manager for energy and utilities for the Sub-Adviser’s Main Street Investment Team (since May 2009). Portfolio Manager of the RS All Cap Dividend product (from its inception in July 2007-April 2009) and served as a sector manager for energy and utilities for various other RS Investments products. Guardian Life Insurance Company (October 1999) and transitioned to RS Investments (October 2006) in connection with Guardian Life Insurance Company’s acquisition of an interest in RS Investments. Mr. Anello served as an equity portfolio manager/analyst and high yield analyst at Orion Capital (1995-1998) and an assistant portfolio manager at the Garrison Bradford portfolio management firm (1988-1995). A portfolio manager and officer of other portfolios in the OppenheimerFunds complex. |
| |
Joy Budzinski, Vice President (since 2012) Year of Birth: 1968 | | Vice President of the Sub-Adviser (since May 2009) and a portfolio manager of the Sub-Adviser (since November 2012). Sector manager for healthcare for the Sub-Adviser’s Main Street Investment Team (since May 2009). Healthcare sector manager at RS Investment and Guardian Life Insurance Company. Guardian Life Insurance Company (August 2006) and transitioned to RS Investments (October 2006) in connection with Guardian Life Insurance Company’s acquisition of an interest in RS Investments. Senior equity analyst at Bank of New York BNY Asset Management (2001 -2006); portfolio manager and analyst at Alliance of America (1999-2001); portfolio manager and analyst at JP Morgan Chase (1993-1997); analyst at Prudential Investments (1997-1998). A portfolio manager and officer of other portfolios in the OppenheimerFunds complex. |
| |
Kristin Ketner Pak, Vice President (since 2012) Year of Birth: 1965 | | Vice President of the Sub-Adviser (since June 2009) and a portfolio manager of the Sub-Adviser (since November 2012). Sector manager for consumer discretionary and consumer staples for the Sub-Adviser’s Main Street Investment Team (since May 2009). Sector manager at RS Investment and Guardian Life Insurance Company. Guardian Life Insurance Company in February 2006 and transitioned to RS Investments in October 2006 in connection with Guardian Life Insurance Company’s acquisition of an interest in RS Investments. Portfolio Manager at Solstice Equity Management (2002-2005); retail analyst at Goldman Sachs (1999-2001); Director of Strategy and Integration at Staples (1997-1999); investment banker at Merrill Lynch (1987-1992 and 1995-1997) and Montgomery Securities (1994-1995). A portfolio manager and officer of other portfolios in the OppenheimerFunds complex. |
| |
Magnus Krantz, Vice President (since 2012) Year of Birth: 1967 | | Vice President of the Sub-Adviser (since May 2009) and a portfolio manager of the Sub-Adviser (since November 2012); sector manager for technology for the Sub-Adviser’s Main Street Investment Team (since May 2009). Prior to joining the Sub-Adviser, Mr. Krantz was a sector manager at RS Investment and Guardian Life Insurance Company. Mr. Krantz joined Guardian Life Insurance Company in December 2005 and transitioned to RS Investments in October 2006 in connection with Guardian Life Insurance Company’s acquisition of an interest in RS Investments. Portfolio manager and analyst at Citigroup Asset Management (1998-2005) and as a consultant at Price Waterhouse (1997-1998). He also served as product development engineer at Newbridge Networks (1993-1996) and as a software engineer at Mitel Corporation (1990-1993). A portfolio manager and officer of other portfolios in the OppenheimerFunds complex. |
| |
Adam Weiner, Vice President (since 2012) Year of Birth: 1969 | | Vice President of the Sub-Adviser (since May 2009) and a portfolio manager of the Sub-Adviser (since November 2012). Sector manager for industrials and materials for the Sub-Adviser’s Main Street Investment Team (since May 2009). Sector manager at RS Investment for industrials and materials (January 2007-April 2009). Director and senior equity analyst at Credit Suisse Asset Management (CSAM) (September 2004-December 2006). Equity analyst at Credit Suisse First Boston 2004-2006 (buy-side) and 1999-2004 (sell-side) and Morgan Stanley (1996-1999); internal auditor at Dun and Bradstreet (1992-1996). Budget analyst, Information Resources Division of the Executive Office of the President (1990-1992). A portfolio manager and officer of other portfolios in the OppenheimerFunds complex. |
| |
Arthur S. Gabinet, Secretary and Chief Legal Officer (since 2011) Year of Birth: 1958 | | Executive Vice President, Secretary and General Counsel of the Manager (since January 2013); General Counsel OFI SteelPath, Inc. (since January 2013); Executive Vice President (May 2010-December 2012) and General Counsel (since January 2011) of the Sub-Adviser; General Counsel of the Distributor (since January 2011); General Counsel of Centennial Asset Management Corporation (January 2011-December 2012); Executive Vice President (January 2011-December 2012) and General Counsel of HarbourView Asset Management Corporation (since January 2011); Assistant Secretary (since January 2011) and Director (since January 2011) of OppenheimerFunds International Ltd. and OppenheimerFunds plc; Director of Oppenheimer Real Asset Management, Inc. (January 2011-December 2012) and General Counsel (since January 2011); Executive Vice President (January 2011-December 2011) and General Counsel of Shareholder Financial Services, Inc. and Shareholder Services, Inc. (since January 2011); Executive Vice President (January 2011-December 2012) and General Counsel of OFI Private Investments Inc. (since January 2011); Vice President of OppenheimerFunds Legacy Program (January 2011-December 2011); Executive Vice President (January 2011-December 2012) and General Counsel of OFI Institutional Asset Management, Inc. (since January 2011); General |
27 OPPENHEIMER MAIN STREET SMALL CAP FUND/VA
| | |
TRUSTEES AND OFFICERS Unaudited / Continued |
| | |
Arthur S. Gabinet, Continued | | Counsel, Asset Management of the Sub-Adviser (May 2010-December 2010); Principal, The Vanguard Group (November 2005-April 2010); District Administrator, U.S. Securities and Exchange Commission (January 2003-October 2005). An officer of 90 portfolios in the OppenheimerFunds complex. |
| |
Christina M. Nasta, Vice President and Chief Business Officer (since 2011) Year of Birth: 1973 | | Senior Vice President of OppenheimerFunds Distributor, Inc. (since January 2013); Senior Vice President of the Sub-Adviser (July 2010-December 2012); Vice President of the Sub-Adviser (January 2003-July 2010); Vice President of OppenheimerFunds Distributor, Inc. (January 2003-July 2010). An officer of 90 portfolios in the OppenheimerFunds complex. |
| |
Mark S. Vandehey, Vice President and Chief Compliance Officer (since 2004) Year of Birth: 1950 | | Senior Vice President and Chief Compliance Officer of the Manager (since January 2013); Chief Compliance Officer of OFI SteelPath, Inc. (since January 2013); Senior Vice President of the Sub-Adviser (March 2004-December 2012); Chief Compliance Officer of the Sub-Adviser, OppenheimerFunds Distributor, Inc., OFI Trust Company, OFI Institutional Asset Management, Inc., Oppenheimer Real Asset Management, Inc., OFI Private Investments, Inc., Harborview Asset Management Corporation, Trinity Investment Management Corporation, and Shareholder Services, Inc. (since March 2004); Vice President of OppenheimerFunds Distributor, Inc., Centennial Asset Management Corporation and Shareholder Services, Inc. (June 1983-December 2012). An officer of 90 portfolios in the OppenheimerFunds complex. |
| |
Brian W. Wixted, Treasurer and Principal Financial & Accounting Officer (since 1999) Year of Birth: 1959 | | Senior Vice President of the Manager (since January 2013); Treasurer of the Sub-Adviser, HarbourView Asset Management Corporation, Shareholder Financial Services, Inc., Shareholder Services, Inc., and Oppenheimer Real Asset Management, Inc. (March 1999-June 2008), OFI Private Investments, Inc. (March 2000-June 2008), OppenheimerFunds International Ltd. and OppenheimerFunds plc (since May 2000), OFI Institutional Asset Management, Inc. (November 2000-June 2008), and OppenheimerFunds Legacy Program (charitable trust program established by the Sub-Adviser) (June 2003-December 2011); Treasurer and Chief Financial Officer of OFI Trust Company (since May 2000); Assistant Treasurer of Oppenheimer Acquisition Corporation (March 1999-June 2008). An officer of 90 portfolios in the OppenheimerFunds complex. |
The Fund’s Statement of Additional Information contains additional information about the Fund’s Trustees and Officers and is available without charge, upon request, by calling 1.800.988.8287.
28 OPPENHEIMER MAIN STREET SMALL CAP FUND/VA
OPPENHEIMER MAIN STREET SMALL CAP FUND/VA
A Series of Oppenheimer Variable Account Funds
| | |
| |
| Manager | | OFI Global Asset Management, Inc. |
| |
| Sub-Adviser | | OppenheimerFunds, Inc. |
| |
| Distributor | | OppenheimerFunds Distributor, Inc. |
| |
Transfer and Shareholder Servicing Agent | | OFI Global Asset Management, Inc. |
| |
| Sub-Transfer Agent | | Shareholder Services, Inc. |
| | DBA OppenheimerFunds Services |
| |
| Independent | | KPMG LLP |
| Registered | | |
| Public | | |
| Accounting | | |
| Firm | | |
| |
| Counsel | | K&L Gates LLP |
| |
| | Before investing, investors should carefully consider a fund’s investment objectives, risks, charges and expenses. Fund prospectuses and summary prospectuses contain this and other information about the funds, and may be obtained by asking your financial advisor, or calling us at 1.800.988.8287. Read prospectuses and summary prospectuses carefully before investing. |
| |
| | © 2014 OppenheimerFunds, Inc. All rights reserved. Oppenheimer funds are distributed by OppenheimerFunds Distributor, Inc. |
| | | | |
| December 31, 2013 | | |
| | | Oppenheimer Money Fund/VA A Series of Oppenheimer Variable Account Funds | | Annual Report |
| | |
| | ANNUAL REPORT Listing of Top Holdings Fund Performance Discussion Financial Statements | | |

Portfolio Managers: Christopher Proctor, CFA and Adam S. Wilde, CFA
Current Yield
For the 7-Day Period Ended 12/31/13
| | | | | | |
With Compounding | | | 0.01 | % | | |
Without Compounding | | | 0.01 | % | | |
| | | | | | |
For the 12-Month Period Ended 12/31/13 |
With Compounding | | | 0.01 | % | | |
Without Compounding | | | 0.01 | % | | |
The performance data quoted represents past performance, which does not guarantee future results. Yields include dividends in a hypothetical investment for the periods shown. Current performance may be lower or higher than the performance quoted. For performance data current to the most recent month end, call us at 1.800.988.8287. The yields take into account voluntary fee waivers and/or expense reimbursements, without which yields would have been lower. Some of these undertakings may be modified at any time, as indicated in the prospectus. There is no guarantee that the Fund will maintain a positive yield. The Fund’s performance should not be expected to be the same as the returns of other funds, whether or not both funds have the same portfolio managers and/or similar names. The Fund’s performance does not include the charges associated with the separate account products that offer this Fund. Such performance would have been lower if such charges were taken into account.
| | | | |
| Portfolio Allocation | | | | |
Short-Term Notes/Commercial Paper | | | 48.4 | % |
Certificates of Deposit | | | 35.9 | % |
Direct Bank Obligations | | | 15.7 | % |
Portfolio holdings and allocations are subject to change. Percentages are as of December 31, 2013, and are based on the total market value of investments.
2 OPPENHEIMER MONEY FUND/VA
| | |
Fund Performance Discussion |
Although a sustained U.S. economic recovery and expectations of a more moderately accommodative monetary policy drove longer-term interest rates higher over the reporting period, short-term rates remained relatively unchanged. As they have been since December 2008, money market yields stayed anchored by the Federal Reserve’s (the “Fed”) target for the overnight federal funds rate of between 0% and 0.25%.
MARKET OVERVIEW
Over the first half of the reporting period, the U.S. economy rebounded from earlier weakness as the unemployment rate declined, housing markets recovered, and manufacturing activity increased. These economic gains came on the heels of the launch of a new, open-ended round of quantitative easing involving monthly purchases of $85 billion of U.S. government securities. This program from the Fed was designed to add liquidity to the banking system and stimulate higher levels of economic growth.
In May 2013, Fed Chairman Ben Bernanke indicated in public remarks that U.S. monetary policymakers would begin to back away from its bond purchasing program sooner than most analysts had expected. Financial markets throughout the world reacted to these relatively hawkish comments with heightened volatility, causing stocks to lose value and longer-term interest rates to climb sharply. Indeed, investors’ revised expectations of stronger economic growth gained credence when the U.S. Department of Congress announced that U.S. GDP had expanded at a 2.5% annualized rate over the second quarter of the year, up from 1.1% in the first quarter. Moreover, June saw robust increases in home and automobile sales, expansions of the manufacturing and service sectors, and the creation of new 195,000 jobs.
Financial markets generally stabilized over the summer when investors came to recognize that the Fed’s plans to taper its quantitative easing program did not necessarily portend imminent increases in short-term interest rates. Still, labor markets continued to strengthen. In October, the U.S. Congress managed to reach a bipartisan agreement to raise the national debt ceiling, and did so well ahead of the potential default deadline. While the Fed unexpectedly refrained from reducing its monthly bond purchases in September, in December, the Central Bank announced that it would reduce its monthly bond purchases by $10 billion, from $85 billion to $75 billion, starting in January 2014. The Fed also announced that it would continue to hold short-term interest rates at very low levels until unemployment in the United States subsided below 6.5%. This was lower than its earlier 7% target. Against this backdrop, investors continued to commit new capital to global equity markets.
FUND PERFORMANCE
In spite of heightened volatility at the longer end of the bond market’s maturity range, the Fund continued to generate consistent and competitive levels of current income, albeit at levels commensurate with the Fed’s unchanged target for the federal funds rate. In addition, money market supply continues to be constrained as issuers look to lock in relatively cheap term financing further out on the yield curve. This puts additional downward pressure on money market yields.
In this environment, we maintained the Fund’s weighted average maturity in a range we considered to be in line with market averages. From a portfolio composition perspective, we continued to avoid repurchase agreements due to uncertainty surrounding potential regulatory changes. Instead, we primarily favored commercial paper issued by global banks that meet our stringent credit criteria.
STRATEGY & OUTLOOK
In light of recently positive economic data, we continue to expect the Fed to taper its quantitative easing program in the relatively near future. Nonetheless, we believe that the Fed will maintain its current target for short-term interest rates for some time to come, and money market yields could remain near current levels for much of 2014. Meanwhile, the outlook for U.S. fiscal and regulatory policies remained uncertain as of the reporting period’s end, suggesting to us that the appropriate strategy is to continue to focus on quality and liquidity. Therefore, we currently intend to maintain a roughly market-neutral weighted average maturity, and we expect to continue to focus on high-quality instruments from fundamentally strong issuers.
An investment in the Fund is not insured or guaranteed by the Federal Deposit Insurance Corporation or any other government agency. Although the Fund seeks to preserve the value of your investment at $1.00 per share, it is possible to lose money by investing in the Fund.
Investors should consider the Fund’s investment objective, risks, charges and expenses carefully before investing. The Fund’s prospectus and summary prospectus contain this and other information about the Fund, and may be obtained by asking your financial advisor or calling us at 1.800.988.8287. Read prospectuses and summary prospectuses carefully before investing.
Shares of Oppenheimer funds are not deposits or obligations of any bank, are not guaranteed by any bank, are not insured by the FDIC or any other agency, and involve investment risks, including the possible loss of the principal amount invested.
3 OPPENHEIMER MONEY FUND/VA
Fund Expenses. As a shareholder of the Fund, you incur two types of costs: (1) transaction costs and (2) ongoing costs, including management fees; and other Fund expenses. These examples are intended to help you understand your ongoing costs (in dollars) of investing in the Fund and to compare these costs with the ongoing costs of investing in other mutual funds.
The examples are based on an investment of $1,000.00 invested at the beginning of the period and held for the entire 6-month period ended December 31, 2013.
Actual Expenses. The first section of the table provides information about actual account values and actual expenses. You may use the information in this section for the class of shares you hold, together with the amount you invested, to estimate the expense that you paid over the period. Simply divide your account value by $1,000.00 (for example, an $8,600.00 account value divided by $1,000.00 = 8.60), then multiply the result by the number in the first section under the heading entitled “Expenses Paid During Period” to estimate the expenses you paid on your account during this period.
Hypothetical Example for Comparison Purposes.
The second section of the table provides information about hypothetical account values and hypothetical expenses based on the Fund’s actual expense ratio for each class of shares, and an assumed rate of return of 5% per year for each class before expenses, which is not the actual return. The hypothetical account values and expenses may not be used to estimate the actual ending account balance or expenses you paid for the period. You may use this information to compare the ongoing costs of investing in the Fund and other funds. To do so, compare this 5% hypothetical example for the class of shares you hold with the 5% hypothetical examples that appear in the shareholder reports of the other funds.
Please note that the expenses shown in the table are meant to highlight your ongoing costs only and do not reflect any charges associated with the separate accounts that offer this Fund. Therefore, the “hypothetical” lines of the table are useful in comparing ongoing costs only, and will not help you determine the relative total costs of owning different funds. In addition, if these separate account charges were included your costs would have been higher.
| | | | | | | | | | | | | | |
| Actual | | Beginning
Account
Value
July 1, 2013 | | | Ending
Account
Value
December 31, 2013 | | | Expenses
Paid During
6 Months Ended
December 31, 2013 | | | |
| | $ | 1,000.00 | | | $ | 1,000.10 | | | $ | 1.01 | | | |
| | | | |
Hypothetical | | | | | | | | | | | | | | |
(5% return before expenses) | | | | | | | | | | | | | | |
| | | 1,000 .00 | | | | 1,024 .20 | | | | 1 .02 | | | |
Expenses are equal to the Fund’s annualized expense ratio, multiplied by the average account value over the period, multiplied by 184/365 (to reflect the one-half year period). The annualized expense ratio, excluding indirect expenses from affiliated funds, based on the 6-month period ended December 31, 2013 is as follows:
The expense ratio reflects contractual waivers and/or reimbursements of expenses by the Fund’s Manager. Some of these undertakings may be modified or terminated at any time, unless approved by the Board of Trustees. The “Financial Highlights” table in the Fund’s financial statements, included in this report, also shows the gross expense ratio, without such waivers or reimbursements and reduction to custodian expenses, if applicable.
4 OPPENHEIMER MONEY FUND/VA
| | |
STATEMENT OF INVESTMENTS December 31, 2013 |
| | | | | | | | | | | | | | | | |
| | | Maturity Date* | | | Final Legal
Maturity Date** | | | Principal
Amount | | | Value | |
Certificates of Deposit—34.2% | | | | | | | | | | | | | | | | |
Yankee Certificates of Deposit—34.2% | | | | | | | | | | | | | | | | |
Bank of Montreal, Chicago: | | | | | | | | | | | | | | | | |
0.18% | | | 1/3/14 | | | | 1/3/14 | | | | 3,100,000 | | | $ | 3,100,000 | |
0.22% | | | 1/13/14 | | | | 1/13/14 | | | | 3,000,000 | | | | 3,000,000 | |
BNP Paribas, New York: | | | | | | | | | | | | | | | | |
0.45% | | | 9/19/14 | | | | 9/19/14 | | | | 3,000,000 | | | | 3,000,000 | |
0.74% | | | 1/15/14 | | | | 1/15/14 | | | | 2,250,000 | | | | 2,250,000 | |
Canadian Imperial Bank of Commerce NY, 0.03% | | | 1/3/14 | | | | 1/3/14 | | | | 8,500,000 | | | | 8,500,000 | |
DnB Bank ASA NY: | | | | | | | | | | | | | | | | |
0.185% | | | 1/13/14 | | | | 1/13/14 | | | | 3,000,000 | | | | 3,000,000 | |
0.21% | | | 1/3/14 | | | | 1/3/14 | | | | 1,000,000 | | | | 1,000,000 | |
Nordea Bank Finland plc, New York: | | | | | | | | | | | | | | | | |
0.22% | | | 7/1/14 | | | | 7/1/14 | | | | 3,700,000 | | | | 3,700,000 | |
0.22% | | | 6/24/14 | | | | 6/24/14 | | | | 2,000,000 | | | | 2,000,000 | |
Rabobank Nederland NV, New York: | | | | | | | | | | | | | | | | |
0.268%1 | | | 2/24/14 | | | | 8/26/14 | | | | 5,000,000 | | | | 5,000,000 | |
0.314%1 | | | 1/31/14 | | | | 10/31/14 | | | | 2,500,000 | | | | 2,500,000 | |
0.341%1 | | | 1/7/14 | | | | 10/7/14 | | | | 1,500,000 | | | | 1,500,000 | |
Royal Bank of Canada, New York: | | | | | | | | | | | | | | | | |
0.274%1 | | | 1/24/14 | | | | 6/24/14 | | | | 3,000,000 | | | | 3,000,000 | |
0.31%1 | | | 1/2/14 | | | | 2/3/14 | | | | 2,000,000 | | | | 2,000,000 | |
Skandinaviska Enskilda Bank, New York, 0.195% | | | 3/10/14 | | | | 3/10/14 | | | | 3,000,000 | | | | 3,000,000 | |
Sumitomo Mitsui Bank NY, 0.11% | | | 1/3/14 | | | | 1/3/14 | | | | 6,000,000 | | | | 6,000,000 | |
Toronto Dominion Bank, New York, 0.26% | | | 1/6/14 | | | | 1/6/14 | | | | 2,000,000 | | | | 2,000,000 | |
Wells Fargo Bank NA: | | | | | | | | | | | | | | | | |
0.238%1 | | | 1/6/14 | | | | 9/5/14 | | | | 2,500,000 | | | | 2,500,000 | |
0.239%1 | | | 1/6/14 | | | | 12/5/14 | | | | 3,500,000 | | | | 3,500,000 | |
Total Certificates of Deposit (Cost $60,550,000) | | | | | | | | | | | | | | | 60,550,000 | |
| | | | | | | | | | | | | | | | |
Direct Bank Obligations—15.0% | | | | | | | | | | | | | | | | |
Skandinaviska Enskilda BankenAB: | | | | | | | | | | | | | | | | |
0.195%3 | | | 3/27/14 | | | | 3/27/14 | | | | 2,200,000 | | | | 2,199,001 | |
0.195%3 | | | 4/11/14 | | | | 4/11/14 | | | | 2,000,000 | | | | 1,998,927 | |
0.20%3 | | | 4/1/14 | | | | 4/1/14 | | | | 1,100,000 | | | | 1,099,456 | |
Svenska Handelsbanken, Inc.: | | | | | | | | | | | | | | | | |
0.215%3 | | | 4/2/14 | | | | 4/2/14 | | | | 1,300,000 | | | | 1,299,301 | |
0.24%3 | | | 2/24/14 | | | | 2/24/14 | | | | 2,500,000 | | | | 2,499,117 | |
0.24%3 | | | 2/20/14 | | | | 2/20/14 | | | | 5,000,000 | | | | 4,998,367 | |
Swedbank AB: | | | | | | | | | | | | | | | | |
0.205% | | | 2/20/14 | | | | 2/20/14 | | | | 4,000,000 | | | | 3,998,884 | |
0.205% | | | 2/18/14 | | | | 2/18/14 | | | | 3,000,000 | | | | 2,999,197 | |
Westpac Banking Corp., 0.293%1,2,3 | | | 1/9/14 | | | | 1/9/14 | | | | 5,400,000 | | | | 5,400,000 | |
Total Direct Bank Obligations (Cost $26,492,250) | | | | | | | | | | | | | | | 26,492,250 | |
| | | | | | | | | | | | | | | | |
Short-Term Notes/Commercial Paper—46.0% | | | | | | | | | | | | | | | | |
Banks—9.3% | | | | | | | | | | | | | | | | |
Bank of Nova Scotia, New York: | | | | | | | | | | | | | | | | |
0.17% | | | 1/21/14 | | | | 1/21/14 | | | | 3,000,000 | | | | 2,999,731 | |
0.215% | | | 4/1/14 | | | | 4/1/14 | | | | 3,000,000 | | | | 2,998,405 | |
0.22% | | | 5/20/14 | | | | 5/20/14 | | | | 2,200,000 | | | | 2,198,145 | |
0.235% | | | 6/18/14 | | | | 6/18/14 | | | | 600,000 | | | | 599,346 | |
Bank of Tokyo-Mitsubishi UFJ NY, 0.11%2 | | | 1/7/14 | | | | 1/7/14 | | | | 7,100,000 | | | | 7,099,891 | |
HSBC USA, Inc., 0.21% | | | 5/27/14 | | | | 5/27/14 | | | | 500,000 | | | | 499,577 | |
| | | | | | | | | | | | | | | 16,395,095 | |
| | | | | | | | | | | | | | | | |
Diversified Financial Services—1.1% | | | | | | | | | | | | | | | | |
General Electric Capital Corp., 0.24% | | | 1/17/14 | | | | 1/17/14 | | | | 2,000,000 | | | | 1,999,800 | |
Leasing & Factoring—4.2% | | | | | | | | | | | | | | | | |
American Honda Finance Corp.: | | | | | | | | | | | | | | | | |
0.242%1 | | | 1/2/14 | | | | 12/5/14 | | | | 1,000,000 | | | | 1,000,000 | |
0.264%1,2 | | | 1/17/14 | | | | 7/17/14 | | | | 2,000,000 | | | | 2,000,000 | |
Toyota Motor Credit Corp.: | | | | | | | | | | | | | | | | |
0.209% | | | 1/30/14 | | | | 2/25/14 | | | | 2,500,000 | | | | 2,500,000 | |
0.25% | | | 2/28/14 | | | | 2/28/14 | | | | 1,900,000 | | | | 1,899,248 | |
| | | | | | | | | | | | | | | 7,399,248 | |
| | | | | | | | | | | | | | | | |
Municipal—1.2% | | | | | | | | | | | | | | | | |
San Antonio, TX Industrial Development Authority Revenue Bonds, Tindall Corp. | | | | | | | | | | | | | | | | |
Project, 0.22%1 | | | 1/7/14 | | | | 1/7/14 | | | | 2,100,000 | | | | 2,100,000 | |
5 OPPENHEIMER MONEY FUND/VA
| | |
| STATEMENT OF INVESTMENTS Continued |
| | | | | | | | | | | | | | | | |
| | | Maturity Date* | | | Final Legal
Maturity Date** | | | Principal Amount | | | Value | |
Personal Products—1.7% | | | | | | | | | | | | | | | | |
Reckitt Benckiser Treasury Services plc: | | | | | | | | | | | | | | | | |
0.23%3 | | | 4/7/14 | | | | 4/7/14 | | | | 800,000 | | | $ | 799,514 | |
0.23%3 | | | 6/3/14 | | | | 6/3/14 | | | | 1,000,000 | | | | 999,029 | |
0.291%3 | | | 6/25/14 | | | | 6/25/14 | | | | 1,300,000 | | | | 1,298,178 | |
| | | | | | | | | | | | | | | 3,096,721 | |
Pharmaceuticals—1.7% | | | | | | | | | | | | | | | | |
Novartis Finance Corp., 0.04% | | | 1/2/14 | | | | 1/2/14 | | | | 3,000,000 | | | | 3,000,000 | |
Receivables Finance—13.5% | | | | | | | | | | | | | | | | |
Barton Capital Corp.: | | | | | | | | | | | | | | | | |
0.06% | | | 1/2/14 | | | | 1/2/14 | | | | 1,730,000 | | | | 1,730,000 | |
0.199%3 | | | 1/30/14 | | | | 2/4/14 | | | | 2,000,000 | | | | 2,000,000 | |
0.20%3 | | | 4/4/14 | | | | 4/4/14 | | | | 1,000,000 | | | | 1,000,000 | |
Fairway Finance Corp.: | | | | | | | | | | | | | | | | |
0.17%3 | | | 3/4/14 | | | | 3/4/14 | | | | 600,000 | | | | 599,827 | |
0.17%3 | | | 2/26/14 | | | | 2/26/14 | | | | 1,000,000 | | | | 999,740 | |
Gemini Securitization Corp., 0.10% | | | 1/2/14 | | | | 1/2/14 | | | | 3,000,000 | | | | 3,000,000 | |
Jupiter Securitization Co. LLC: | | | | | | | | | | | | | | | | |
0.10%3 | | | 1/7/14 | | | | 1/7/14 | | | | 400,000 | | | | 399,995 | |
0.23%3 | | | 6/9/14 | | | | 6/9/14 | | | | 1,000,000 | | | | 998,991 | |
0.23%3 | | | 6/17/14 | | | | 6/17/14 | | | | 600,000 | | | | 599,364 | |
0.24%3 | | | 4/16/14 | | | | 4/16/14 | | | | 2,700,000 | | | | 2,698,128 | |
Mont Blanc Capital Corp., 0.13%3 | | | 1/6/14 | | | | 1/6/14 | | | | 1,000,000 | | | | 999,986 | |
Old Line Funding Corp.: | | | | | | | | | | | | | | | | |
0.22%3 | | | 6/18/14 | | | | 6/18/14 | | | | 1,000,000 | | | | 998,980 | |
0.23%3 | | | 6/12/14 | | | | 6/12/14 | | | | 3,500,000 | | | | 3,496,400 | |
Thunder Bay Funding LLC, 0.23%3 | | | 5/23/14 | | | | 5/23/14 | | | | 4,400,000 | | | | 4,396,036 | |
| | | | | | | | | | | | | | | | 23,917,447 | |
Special Purpose Financial—13.3% | | | | | | | | | | | | | | | | |
Anglesea Funding LLC, 0.16%2 | | | 1/6/14 | | | | 1/6/14 | | | | 4,100,000 | | | | 4,099,927 | |
Collateralized Commercial Paper II Co. LLC, 0.30%2 | | | 1/27/14 | | | | 1/27/14 | | | | 2,000,000 | | | | 1,999,583 | |
Concord Minutemen Cap. Corp. LLC: | | | | | | | | | | | | | | | | |
0.20% | | | 3/5/14 | | | | 3/5/14 | | | | 400,000 | | | | 399,862 | |
0.22% | | | 2/14/14 | | | | 2/14/14 | | | | 1,800,000 | | | | 1,799,527 | |
0.22% | | | 2/13/14 | | | | 2/13/14 | | | | 1,000,000 | | | | 999,743 | |
0.22% | | | 2/18/14 | | | | 2/18/14 | | | | 900,000 | | | | 899,742 | |
Crown Point Capital Co., 0.22% | | | 1/22/14 | | | | 1/22/14 | | | | 2,100,000 | | | | 2,099,743 | |
FCAR Owner Trust I, 0.20% | | | 3/4/14 | | | | 3/4/14 | | | | 4,200,000 | | | | 4,198,577 | |
Govco LLC: | | | | | | | | | | | | | | | | |
0.17%3 | | | 2/3/14 | | | | 2/3/14 | | | | 1,000,000 | | | | 999,849 | |
0.24%3 | | | 2/11/14 | | | | 2/11/14 | | | | 1,600,000 | | | | 1,599,573 | |
0.24%3 | | | 2/6/14 | | | | 2/6/14 | | | | 2,000,000 | | | | 1,999,533 | |
Ridgefield Funding Co. LLC, 0.258%1 | | | 1/3/14 | | | | 2/4/14 | | | | 2,500,000 | | | | 2,500,000 | |
| | | | | | | | | | | | | | | 23,595,659 | |
Total Short-Term Notes/Commercial Paper (Cost $81,503,970) | | | | | | | | | | | | | | | 81,503,970 | |
| | | | | | | | | | | | | | | | |
Total Investments, at Value (Cost $168,546,220) | | | | | | | | | | | 95.2 | % | | | 168,546,220 | |
Assets in Excess of Other Liabilities | | | | | | | | | | | 4.8 | % | | | 8,480,183 | |
| | | | | | | | | | | | |
Net Assets | | | | | | | | | | | 100.0 | % | | $ | 177,026,403 | |
| | | | | | | | | | | | |
Footnotes to Statement of Investments
Short-term notes and direct bank obligations are generally traded on a discount basis; the interest rate shown is the discount rate received by the Fund at the time of purchase. Other securities normally bear interest at the rates shown.
* The Maturity Date represents the date used to calculate the Fund’s weighted average maturity as determined under Rule 2a-7.
** If different from the Maturity Date, the Final Legal Maturity Date includes any maturity date extensions which may be affected at the option of the issuer or unconditional payments of principal by the issuer which may be affected at the option of the Fund, and represents the date used to calculate the Fund’s weighted average life as determined under Rule 2a-7.
1. Represents the current interest rate for a variable or increasing rate security.
2. Represents securities sold under Rule 144A, which are exempt from registration under the Securities Act of 1933, as amended. These securities have been determined to be liquid under guidelines established by the Board of Trustees. These securities amount to $20,599,401 or 11.64% of the Fund’s net assets as of December 31, 2013.
3. Security issued in an exempt transaction without registration under the Securities Act of 1933. Such securities amount to $46,377,292 or 26.20% of the Fund’s net assets, and have been determined to be liquid pursuant to guidelines adopted by the Board of Trustees.
See accompanying Notes to Financial Statements.
6 OPPENHEIMER MONEY FUND/VA
| | |
STATEMENTOF ASSETS AND LIABILITIES December 31, 2013 |
| | | | |
Assets | | | | |
Investments, at value (cost $168,546,220)—see accompanying statement of investments | | $ | 168,546,220 | |
Cash | | | 10,933,838 | |
Receivables and other assets: | | | | |
Shares of beneficial interest sold | | | 73,189 | |
Interest | | | 40,512 | |
Other | | | 20,409 | |
| | | | |
Total assets | | | 179,614,168 | |
Liabilities | | | | |
Payables and other liabilities: | | | | |
Shares of beneficial interest redeemed | | | 2,523,193 | |
Trustees’ compensation | | | 15,508 | |
Transfer and shareholder servicing agent fees | | | 15,123 | |
Shareholder communications | | | 12,001 | |
Dividends | | | 489 | |
Other | | | 21,451 | |
| | | | |
Total liabilities | | | 2,587,765 | |
Net Assets | | $ | 177,026,403 | |
| | | | |
| | | | |
Composition of Net Assets | | | | |
Par value of shares of beneficial interest | | $ | 177,022 | |
Additional paid-in capital | | | 176,849,130 | |
Accumulated net investment income | | | 251 | |
| | | | |
Net Assets—applicable to 177,021,537 shares of beneficial interest outstanding | | $ | 177,026,403 | |
| | | | |
| | | | |
Net Asset Value, Redemption Price Per Share and Offering Price Per Share | | $ | 1.00 | |
See accompanying Notes to Financial Statements.
7 OPPENHEIMER MONEY FUND/VA
| | |
STATEMENTOF OPERATIONS For the Year Ended December 31, 2013 |
| | | | |
Investment Income | | | | |
Interest | | $ | 409,469 | |
Expenses | | | | |
Management fees | | | 804,316 | |
Transfer and shareholder servicing agent fees | | | 178,742 | |
Trustees’ compensation | | | 26,140 | |
Shareholder communications | | | 20,810 | |
Custodian fees and expenses | | | 1,197 | |
Other | | | 52,556 | |
| | | | |
Total expenses | | | 1,083,761 | |
Less waivers and reimbursements of expenses | | | (692,526 | ) |
| | | | |
Net expenses | | | 391,235 | |
Net Investment Income | | | 18,234 | |
| | | | |
Realized Gain | | | 2,445 | |
| | | | |
Net Increase in Net Assets Resulting from Operations | | $ | 20,679 | |
| | | | |
See accompanying Notes to Financial Statements.
8 OPPENHEIMER MONEY FUND/VA
| | |
STATEMENTS OF CHANGES IN NET ASSETS |
| | | | | | | | |
| | | Year Ended
December 31, 2013 | | | Year Ended
December 31, 2012 | |
Operations | | | | | | | | |
Net investment income | | $ | 18,234 | | | $ | 17,102 | |
Net realized gain | | | 2,445 | | | | 6,472 | |
Net increase in net assets resulting from operations | | | 20,679 | | | | 23,574 | |
Dividends and/or Distributions to Shareholders | | | | | | | | |
Dividends from net investment income | | | (24,504 | ) | | | (17,102 | ) |
Beneficial Interest Transactions | | | | | | | | |
Net increase in net assets resulting from beneficial interest transactions: | | | 2,601,903 | | | | 10,448,459 | |
Net Assets | | | | | | | | |
Total increase | | | 2,598,078 | | | | 10,454,931 | |
Beginning of period | | | 174,428,325 | | | | 163,973,394 | |
End of period (including accumulated net investment income of $ 251 and $ 4,076, respectively) | | $ | 177,026,403 | | | $ | 174,428,325 | |
See accompanying Notes to Financial Statements.
9 OPPENHEIMER MONEY FUND/VA
FINANCIAL HIGHLIGHTS
| | | | | | | | | | | | | | | | | | | | |
| | | Year Ended
December 31, 2013 | | | Year Ended
December 31, 2012 | | | Year Ended
December 30, 20111 | | | Year Ended
December 31, 2010 | | | Year Ended
December 31, 2009 | |
Per Share Operating Data | | | | | | | | | | | | | | | | | | | | |
Net asset value, beginning of period | | $ | 1 .00 | | | $ | 1 .00 | | | $ | 1 .00 | | | $ | 1 .00 | | | $ | 1 .00 | |
Income from investment operations -net investment income and net realized gain2 | | | 0 .00 | 3 | | | 0 .00 | 3 | | | 0 .00 | 3 | | | 0 .00 | 3 | | | 0 .00 | 3 |
Dividends and/or distributions to shareholders: | | | | | | | | | | | | | | | | | | | | |
Dividends from net investment income | | | 0 .00 | 3 | | | 0 .00 | 3 | | | 0 .00 | 3 | | | 0 .00 | 3 | | | 0 .00 | 3 |
Net asset value, end of period | | $ | 1 .00 | | | $ | 1 .00 | | | $ | 1 .00 | | | $ | 1 .00 | | | $ | 1 .00 | |
| | | | | | | | | | | | | | | | | | | | |
Total Return, at Net Asset Value4 | | | 0 .01 | % | | | 0 .01 | % | | | 0 .01 | % | | | 0 .03 | % | | | 0 .32 | % |
Ratios/Supplemental Data | | | | | | | | | | | | | | | | | | | | |
Net assets, end of period (in thousands) | | $ | 177,026 | | | $ | 174,428 | | | $ | 163,973 | | | $ | 149,697 | | | $ | 180,955 | |
Average net assets (in thousands) | | $ | 178,263 | | | $ | 164,276 | | | $ | 156,127 | | | $ | 164,258 | | | $ | 218,079 | |
Ratios to average net assets:5 | | | | | | | | | | | | | | | | | | | | |
Net investment income | | | 0 .01 | % | | | 0 .01 | % | | | 0 .01 | % | | | 0 .01 | % | | | 0 .35 | % |
Total expenses | | | 0 .61 | % | | | 0 .62 | % | | | 0 .61 | % | | | 0 .61 | % | | | 0 .57 | % |
Expenses after payments, waivers and/or reimbursements and reduction to custodian expenses | | | 0 .22 | % | | | 0 .30 | % | | | 0 .29 | % | | | 0 .35 | % | | | 0 .48 | % |
1. December 30, 2011 represents the last business day of the Fund’s 2011 reporting period.
2. Per share amounts calculated based on the average shares outstanding during the period.
3. Less than $0.005 per share.
4. Assumes an initial investment on the business day before the first day of the fiscal period, with all dividends and distributions reinvested in additional shares on the reinvestment date, and redemption at the net asset value calculated on the last business day of the fiscal period. Total returns are not annualized for periods less than one full year. Total return information does not reflect expenses that apply at the separate account level or to related insurance products. Inclusion of these charges would reduce the total return figures for all periods shown. Returns do not reflect the deduction of taxes that a shareholder would pay on fund distributions or the redemption of fund shares.
5. Annualized for periods less than one full year.
See accompanying Notes to Financial Statements.
10 OPPENHEIMER MONEY FUND/VA
| | |
NOTES TO FINANCIAL STATEMENTS December 31, 2013 |
1. Significant Accounting Policies
Oppenheimer Money Fund/VA (the “Fund”), a separate series of Oppenheimer Variable Account Funds, is a diversified open-end management investment company registered under the Investment Company Act of 1940, as amended. The Fund’s investment objective is to seek income consistent with stability of principal. The Fund’s investment adviser is OFI Global Asset Management, Inc. (“OFI Global” or the “Manager”), a wholly-owned subsidiary of OppenheimerFunds Inc. (“OFI” or the “Sub-Adviser”). The Manager has entered into a sub-advisory agreement with OFI. Shares of the Fund are sold only to separate accounts of life insurance companies.
The following is a summary of significant accounting policies consistently followed by the Fund.
Federal Taxes. The Fund intends to comply with provisions of the Internal Revenue Code applicable to regulated investment companies and to distribute substantially all of its investment company taxable income to shareholders. Therefore, no federal income or excise tax provision is required. The Fund files income tax returns in U.S. federal and applicable state jurisdictions. The statute of limitations on the Fund’s tax return filings generally remain open for the three preceding fiscal reporting period ends.
The tax components of capital shown in the following table represent distribution requirements the Fund must satisfy under the income tax regulations, losses the Fund may be able to offset against income and gains realized in future years for federal income tax purposes.
| | | | | | | | |
Undistributed Net Investment Income | |
| Undistributed
Long-Term
Gain |
| |
| Accumulated
Loss
Carryforward |
|
$19,824 | | | $— | | | | $— | |
Net investment income (loss) and net realized gain (loss) may differ for financial statement and tax purposes. The character of dividends and distributions made during the fiscal year from net investment income or net realized gains may differ from their ultimate characterization for federal income tax purposes. Also, due to timing of dividends and distributions, the fiscal year in which amounts are distributed may differ from the fiscal year in which the income or net realized gain was recorded by the Fund.
Accordingly, the following amounts have been reclassified for December 31, 2013. Net assets of the Fund were unaffected by the reclassifications.
| | | | |
Reduction to Accumulated Net Investment Loss | |
| Reduction
to Accumulated Net
Realized Gain on Investments |
|
$2,445 | | | $2,445 | |
The tax character of distributions paid during the years ended December 31, 2013 and December 31, 2012:
| | | | | | | | |
| | |
| Year Ended
December 31, 2013 |
| |
| Year Ended
December 31, 2012 |
|
Distributions paid from: | | | | | | | | |
Ordinary income | | $ | 24,504 | | | $ | 17,102 | |
Trustees’ Compensation. The Board of Trustees has adopted a compensation deferral plan for independent trustees that enables trustees to elect to defer receipt of all or a portion of the annual compensation they are entitled to receive from the Fund. For purposes of determining the amount owed to the Trustee under the plan, deferred amounts are treated as though equal dollar amounts had been invested in shares of the Fund or in other Oppenheimer funds selected by the Trustee. The Fund purchases shares of the funds selected for deferral by the Trustee in amounts equal to his or her deemed investment, resulting in a Fund asset equal to the deferred compensation liability. Such assets are included as a component of “Other” within the asset section of the Statement of Assets and Liabilities. Deferral of trustees’ fees under the plan will not affect the net assets of the Fund, and will not materially affect the Fund’s assets, liabilities or net investment income per share. Amounts will be deferred until distributed in accordance with the compensation deferral plan.
Dividends and Distributions to Shareholders. Dividends and distributions to shareholders, which are determined in accordance with income tax regulations and may differ from U.S. generally accepted accounting principles, are recorded on the ex-dividend date. Income distributions, if any, are declared daily and paid monthly. Capital gain distributions, if any, are declared and paid annually but may be paid at other times to maintain the net asset value per share at $1.00.
Investment Income. Interest income is recognized on an accrual basis. Discount and premium, which are included in interest income on the Statement of Operations, are amortized or accreted daily.
Custodian Fees. “Custodian fees and expenses” in the Statement of Operations may include interest expense incurred by the Fund on any cash overdrafts of its custodian account during the period. Such cash overdrafts may result from the effects of failed trades in portfolio securities and from cash outflows resulting from unanticipated shareholder redemption activity. The Fund pays interest to its custodian on such cash overdrafts, to the extent they are not offset by positive cash balances maintained by the Fund, at a rate equal to the Federal Funds Rate plus 0.50%. The “Reduction to custodian
11 OPPENHEIMER MONEY FUND/VA
| | |
NOTESTO FINANCIAL STATEMENTS Continued |
1. Significant Accounting Policies (Continued)
expenses” line item, if applicable, represents earnings on cash balances maintained by the Fund during the period. Such interest expense and other custodian fees may be paid with these earnings.
Security Transactions. Security transactions are recorded on the trade date. Realized gains and losses on securities sold are determined on the basis of identified cost.
Indemnifications. The Fund’s organizational documents provide current and former trustees and officers with a limited indemnification against liabilities arising in connection with the performance of their duties to the Fund. In the normal course of business, the Fund may also enter into contracts that provide general indemnifications. The Fund’s maximum exposure under these arrangements is unknown as this would be dependent on future claims that may be made against the Fund. The risk of material loss from such claims is considered remote.
Other. The preparation of financial statements in conformity with accounting principles generally accepted in the United States of America requires management to make estimates and assumptions that affect the reported amounts of assets and liabilities and disclosure of contingent assets and liabilities at the date of the financial statements and the reported amounts of increases and decreases in net assets from operations during the reporting period. Actual results could differ from those estimates.
2. Securities Valuation
The Fund calculates the net asset value of its shares as of the close of the New York Stock Exchange (the “Exchange”), normally 4:00 P.M. Eastern time, on each day the Exchange is open for trading.
The Fund’s Board has adopted procedures for the valuation of the Fund’s securities and has delegated the day-to-day responsibility for valuation determinations under those procedures to the Manager. The Manager has established a Valuation Committee which is responsible for determining a “fair valuation” for any security for which market quotations are not “readily available.” The Valuation Committee’s fair valuation determinations are subject to review, approval and ratification by the Fund’s Board at its next regularly scheduled meeting covering the calendar quarter in which the fair valuation was determined.
Valuation Methods and Inputs
Securities are valued at cost adjusted by the amortization of discount or premium to maturity (amortized cost), which approximates market value. If amortized cost is determined not to approximate market value, the fair value of the portfolio securities will be determined under procedures approved by the Fund’s Board of Trustees.
If a market value or price cannot be determined for a security using the methodologies described above, or if, in the “good faith” opinion of the Manager, the market value or price obtained does not constitute a “readily available market quotation,” or a significant event has occurred that would materially affect the value of the security the security is fair valued either (i) by a standardized fair valuation methodology applicable to the security type or the significant event as previously approved by the Valuation Committee and the Fund’s Board or (ii) as determined in good faith by the Manager’s Valuation Committee. The Valuation Committee considers all relevant facts that are reasonably available, through either public information or information available to the Manager, when determining the fair value of a security. Fair value determinations by the Manager are subject to review, approval and ratification by the Fund’s Board at its next regularly scheduled meeting covering the calendar quarter in which the fair valuation was determined. Those fair valuation standardized methodologies include, but are not limited to, valuing securities at the last sale price or initially at cost and subsequently adjusting the value based on: changes in company specific fundamentals, changes in an appropriate securities index, or changes in the value of similar securities which may be further adjusted for any discounts related to security-specific resale restrictions. When possible, such methodologies use observable market inputs such as unadjusted quoted prices of similar securities, observable interest rates, currency rates and yield curves. The methodologies used for valuing securities are not necessarily an indication of the risks associated with investing in those securities nor can it be assured that the Fund can obtain the fair value assigned to a security if it were to sell the security.
To assess the continuing appropriateness of security valuations, the Manager, or its third party service provider who is subject to oversight by the Manager, regularly compares prior day prices, prices on comparable securities, and sale prices to the current day prices and challenges those prices exceeding certain tolerance levels with the third party pricing service or broker source. For those securities valued by fair valuations, whether through a standardized fair valuation methodology or a fair valuation determination, the Valuation Committee reviews and affirms the reasonableness of the valuations based on such methodologies and fair valuation determinations on a regular basis after considering all relevant information that is reasonably available.
Classifications
Each investment asset or liability of the Fund is assigned a level at measurement date based on the significance and source of the inputs to its valuation. Various data inputs are used in determining the value of each of the Fund’s investments as of the reporting period end. These data inputs are categorized in the following hierarchy under applicable financial accounting standards:
1) Level 1-unadjusted quoted prices in active markets for identical assets or liabilities (including securities actively traded on a securities exchange)
2) Level 2-inputs other than unadjusted quoted prices that are observable for the asset or liability (such as unadjusted quoted prices for similar assets and market corroborated inputs such as interest rates, prepayment speeds, credit risks, etc.)
3) Level 3-significant unobservable inputs (including the Manager’s own judgments about assumptions that market participants would use in pricing the asset or liability).
12 OPPENHEIMER MONEY FUND/VA
2. Securities Valuation (Continued)
The inputs used for valuing securities are not necessarily an indication of the risks associated with investing in those securities.
The table below categorizes amounts that are included in the Fund’s Statement of Assets and Liabilities as of December 31, 2013 based on valuation input level:
| | | | | | | | | | | | | | | | |
| | |
| Level 1—
Unadjusted
Quoted Prices |
| |
| Level 2—
Other Significant
Observable Inputs |
| |
| Level 3—
Significant
Unobservable
Inputs |
| | | Value | |
Assets Table | | | | | | | | | | | | | | | | |
Investments, at Value: | | | | | | | | | | | | | | | | |
Certificates of Deposit | | $ | — | | | $ | 60,550,000 | | | $ | — | | | $ | 60,550,000 | |
Direct Bank Obligations | | | — | | | | 26,492,250 | | | | — | | | | 26,492,250 | |
Short-Term Notes/Commercial Paper | | | — | | | | 81,503,970 | | | | — | | | | 81,503,970 | |
Total Assets | | $ | — | | | $ | 168,546,220 | | | $ | — | | | $ | 168,546,220 | |
3. Shares of Beneficial Interest
The Fund has authorized an unlimited number of $0.001 par value shares of beneficial interest of each class. Transactions in shares of beneficial interest were as follows:
| | | | | | | | | | | | | | | | |
| | | Year Ended December 31, 2013 | | | Year Ended December 31, 2012 | |
| | | Shares | | | Amount | | | Shares | | | Amount | |
Sold | | | 101,203,375 | | | $ | 101,203,375 | | | | 75,194,128 | | | $ | 75,194,128 | |
Dividends and/or distributions reinvested | | | 24,504 | | | | 24,504 | | | | 17,102 | | | | 17,102 | |
Redeemed | | | (98,625,976 | ) | | | (98,625,976 | ) | | | (64,762,771 | ) | | | (64,762,771 | ) |
Net increase | | | 2,601,903 | | | $ | 2,601,903 | | | | 10,448,459 | | | $ | 10,448,459 | |
4. Fees and Other Transactions with Affiliates
Management Fees. Under the investment advisory agreement, the Fund pays the Manager a management fee based on the daily net assets of the Fund at an annual rate as shown in the following table:
| | | | |
Fee Schedule | | | | |
Up to $500 million | | | 0.450 | % |
Next $500 million | | | 0.425 | |
Next $500 million | | | 0.400 | |
Over $1.5 billion | | | 0.375 | |
Sub-Adviser Fees. The Manager has retained the Sub-Adviser to provide the day-to-day portfolio management of the Fund. Under the Sub-Advisory Agreement, the Manager pays the Sub-Adviser an annual fee in monthly installments, equal to a percentage of the investment management fee collected by the Manager from the Fund, which shall be calculated after any investment management fee waivers. The fee paid to the Sub-Adviser is paid by the Manager, not by the Fund.
Transfer Agent Fees. OFI Global (the “Transfer Agent”) serves as the transfer and shareholder servicing agent for the Fund. Fees incurred by the Fund with respect to these services are detailed in the Statement of Operations.
Sub-Transfer Agent Fees. The Transfer Agent has retained Shareholder Services, Inc., a wholly-owned subsidiary of OFI (the “Sub-Transfer Agent”), to provide the day-to-day transfer agent and shareholder servicing of the Fund. Under the Sub-Transfer Agency Agreement, the Transfer Agent pays the Sub-Transfer Agent an annual fee in monthly installments, equal to a percentage of the transfer agent fee collected by the Transfer Agent from the Fund, which shall be calculated after any applicable fee waivers. The fee paid to the Sub-Transfer Agent is paid by the Transfer Agent, not by the Fund.
Waivers and Reimbursements of Expenses. The Manager has voluntarily undertaken to waive fees and/or reimburse expenses to the extent necessary to assist the Fund in attempting to maintain a positive yield. There is no guarantee that the Fund will maintain a positive yield. During the year ended December 31, 2013, the Manager waived fees and/or reimbursed the Fund $692,526.
The Manager has contractually agreed to limit the Fund’s expenses after payments, waivers and/or reimbursements and reduction to custodian expenses, excluding expenses incurred directly or indirectly by the Fund as a result of investments in other investment companies, wholly-owned subsidiaries and pooled investment vehicles; so that those expenses, as percentages of daily net assets, will not exceed the annual rate of 0.50%.
Effective April 30, 2013, the Manager is permitted to recapture previously waived and/or reimbursed fees in any given fiscal year if the recapture would not: 1) cause the Fund to generate a negative daily yield, and 2) exceed amounts previously waived and/or reimbursed under this arrangement during the current and prior three fiscal years. The reimbursement to the Manager of such previous waivers and reimbursements would not include any portion of distribution and/or service fees. As of December 31, 2013, the following waived and/or reimbursed amounts are eligible for recapture:
|
Expiration Date December 31, 2016 |
$486,156 |
13 OPPENHEIMER MONEY FUND/VA
| | |
NOTESTO FINANCIAL STATEMENTS Continued |
4. Fees and Other Transactions with Affiliates (Continued)
The Manager has not recaptured any previously waived and/or reimbursed amounts during the year ended December 31, 2013.
Some of these undertakings may be modified or terminated at any time; some may not be modified or terminated until after one year from the date of the current prospectus, as indicated therein.
5. Pending Litigation
Since 2009, seven class action lawsuits have been pending in the U.S. District Court for the District of Colorado against OppenheimerFunds, Inc. (“OFI”), OppenheimerFunds Distributor, Inc., the Fund’s principal underwriter and distributor (the “Distributor”), and certain funds (but not including the Fund) advised by OFI Global Asset Management, Inc. and distributed by the Distributor (the “Defendant Funds”). The lawsuits also name as defendants certain officers and current and former trustees of the respective Defendant Funds. The lawsuits raise claims under federal securities law and allege, among other things, that the disclosure documents of the respective Defendant Funds contained misrepresentations and omissions and that the respective Defendant Funds’ investment policies were not followed. The plaintiffs in these actions seek unspecified damages, equitable relief and awards of attorneys’ fees and litigation expenses. The Defendant Funds’ Boards of Trustees have also engaged counsel to represent the Funds and the present and former Independent Trustees named in those suits. On August 26, 2013, the parties in six of these lawsuits executed a memorandum of understanding setting forth the terms of proposed settlements of those actions. The proposed settlements are subject to a variety of contingencies, including the execution of settlement agreements, which will require preliminary and final approval by the court. The proposed settlements do not resolve a seventh outstanding lawsuit relating to Oppenheimer California Municipal Fund.
Other class action and individual lawsuits have been filed since 2008 in various state and federal courts against OFI and certain of its affiliates by investors seeking to recover investments they allegedly lost as a result of the “Ponzi” scheme run by Bernard L. Madoff and his firm, Bernard L. Madoff Investment Securities, LLC (“BLMIS”). Plaintiffs in these suits allege that they suffered losses as a result of their investments in several funds managed by an affiliate of OFI and assert a variety of claims, including breach of fiduciary duty, fraud, negligent misrepresentation, unjust enrichment, and violation of federal and state securities laws and regulations, among others. They seek unspecified damages, equitable relief and awards of attorneys’ fees and litigation expenses. Neither the Distributor, nor any of the Oppenheimer mutual funds, their independent trustees or directors are named as defendants in these lawsuits. None of the Oppenheimer mutual funds invested in any funds or accounts managed by Madoff or BLMIS. On February 28, 2011, a stipulation of partial settlement of three groups of consolidated putative class action lawsuits relating to these matters was filed in the U.S. District Court for the Southern District of New York. On August 19, 2011, the court entered an order and final judgment approving the settlement as fair, reasonable and adequate. In September 2011, certain parties filed notices of appeal from the court’s order approving the settlement. The settlement does not resolve other outstanding lawsuits against OFI and its affiliates relating to BLMIS.
On April 16, 2010, a lawsuit was filed in New York state court against (i) OFI, (ii) an affiliate of OFI and (iii) AAArdvark IV Funding Limited (“AAArdvark IV”), an entity advised by OFI’s affiliate, in connection with investments made by the plaintiffs in AAArdvark IV. Plaintiffs allege breach of contract and common law fraud claims against the defendants and seek compensatory damages, costs and disbursements, including attorney fees. On ``April 11, 2013, the court granted defendants’ motion for summary judgment, dismissing plaintiffs’ fraud claim with prejudice and dismissing their contract claim without prejudice, and granted plaintiffs leave to replead their contract claim to assert a cause of action for specific performance within 30 days. On May 9, 2013, plaintiffs filed a notice of appeal from the court’s dismissal order. On January 7, 2014, the appellate court affirmed the trial court’s dismissal order. On July 15, 2011, a lawsuit was filed in New York state court against OFI, an affiliate of OFI and AAArdvark Funding Limited (“AAArdvark I”), an entity advised by OFI’s affiliate, in connection with investments made by the plaintiffs in AAArdvark I. The complaint alleges breach of contract and common law fraud claims against the defendants and seeks compensatory damages, costs and disbursements, including attorney fees. On November 9, 2011, a lawsuit was filed in New York state court against OFI, an affiliate of OFI and AAArdvark XS Funding Limited (“AAArdvark XS”), an entity advised by OFI’s affiliate, in connection with investments made by the plaintiffs in AAArdvark XS. The complaint alleged breach of contract against the defendants and sought compensatory damages, costs and disbursements, including attorney fees. On November 8, 2013, the parties filed a stipulation of discontinuance dismissing the lawsuit with prejudice.
OFI believes the lawsuits and appeals described above are without legal merit and, with the exception of actions it has settled, is defending against them vigorously. While it is premature to render any opinion as to the outcome in these lawsuits, or whether any costs that the Defendant Funds may bear in defending the suits might not be reimbursed by insurance, OFI believes that these suits should not impair the ability of OFI or the Distributor to perform their respective duties to the Fund, and that the outcome of all of the suits together should not have any material effect on the operations of any of the Oppenheimer mutual funds.
14 OPPENHEIMER MONEY FUND/VA
| | |
REPORTOF INDEPENDENT REGISTERED PUBLIC ACCOUNTING FIRM |
The Board of Trustees and Shareholders of Oppenheimer Variable Account Funds:
We have audited the accompanying statement of assets and liabilities of Oppenheimer Money Fund/VA (a separate series of Oppenheimer Variable Account Funds), including the statement of investments, as of December 31, 2013, and the related statement of operations for the year then ended, the statements of changes in net assets for each of the years in the two-year period then ended, and the financial highlights for each of the years in the five-year period then ended. These financial statements and financial highlights are the responsibility of the Fund’s management. Our responsibility is to express an opinion on these financial statements and financial highlights based on our audits.
We conducted our audits in accordance with the standards of the Public Company Accounting Oversight Board (United States). Those standards require that we plan and perform the audit to obtain reasonable assurance about whether the financial statements and financial highlights are free of material misstatement. An audit includes examining, on a test basis, evidence supporting the amounts and disclosures in the financial statements. Our procedures included confirmation of securities owned as of December 31, 2013, by correspondence with the custodian. An audit also includes assessing the accounting principles used and significant estimates made by management, as well as evaluating the overall financial statement presentation. We believe that our audits provide a reasonable basis for our opinion.
In our opinion, the financial statements and financial highlights referred to above present fairly, in all material respects, the financial position of Oppenheimer Money Fund/VA as of December 31, 2013, the results of its operations for the year then ended, the changes in its net assets for each of the years in the two-year period then ended, and the financial highlights for each of the years in the five-year period then ended, in conformity with U.S. generally accepted accounting principles.
KPMG LLP
Denver, Colorado
February 14, 2014
15 OPPENHEIMER MONEY FUND/VA
| | |
FEDERAL INCOME TAX INFORMATION Unaudited |
In early 2014, if applicable, shareholders of record received information regarding all dividends and distributions paid to them by the Fund during calendar year 2013.
The foregoing information is presented to assist shareholders in reporting distributions received from the Fund to the Internal Revenue Service. Because of the complexity of the federal regulations which may affect your individual tax return and the many variations in state and local tax regulations, we recommend that you consult your tax advisor for specific guidance.
16 OPPENHEIMER MONEY FUND/VA
| | |
| BOARD APPROVAL OF THE FUND’S INVESTMENT ADVISORY AND SUB-ADIVSORY AGREEMENTS Unaudited |
The Fund has entered into an investment advisory agreement with OFI Global Asset Management, Inc. (“OFI Global” or the “Adviser”), a wholly-owned subsidiary of OppenheimerFunds, Inc. (“OFI” or the “Sub-Adviser”) (“OFI Global” and “OFI” together the “Managers”) and OFI Global has entered into a sub-advisory agreement with OFI whereby OFI provides investment sub-advisory services to the Fund (collectively, the “Agreements”). Each year, the Board of Trustees (the “Board”), including a majority of the independent Trustees, is required to determine whether to renew the Agreements. The Investment Company Act of 1940, as amended, requires that the Board request and evaluate, and that the Managers provide, such information as may be reasonably necessary to evaluate the terms of the Agreements. The Board employs an independent consultant to prepare a report that provides information, including comparative information that the Board requests for that purpose. In addition to in-person meetings focused on this evaluation, the Board receives information throughout the year regarding Fund services, fees, expenses and performance.
The Adviser, Sub-Adviser and the independent consultant provided information to the Board on the following factors: (i) the nature, quality and extent of the Managers’ services, (ii) the investment performance of the Fund and the Managers, (iii) the fees and expenses of the Fund, including comparative expense information, (iv) the profitability of the Managers and their affiliates, including an analysis of the cost of providing services, (v) whether economies of scale are realized as the Fund grows and whether fee levels reflect these economies of scale for Fund investors and (vi) other benefits to the Managers from their relationship with the Fund. The Board was aware that there are alternatives to retaining the Managers.
Outlined below is a summary of the principal information considered by the Board as well as the Board’s conclusions.
Nature, Quality and Extent of Services. The Board considered information about the nature, quality and extent of the services provided to the Fund and information regarding the Managers’ key personnel who provide such services. The Sub-Adviser’s duties include providing the Fund with the services of the portfolio managers and the Sub-Adviser’s investment team, who provide research, analysis and other advisory services in regard to the Fund’s investments; securities trading services; oversight of third-party service providers; monitoring compliance with applicable Fund policies and procedures and adherence to the Fund’s investment restrictions; and risk management. The Managers are responsible for providing certain administrative services to the Fund as well. Those services include providing and supervising all administrative and clerical personnel who are necessary in order to provide effective corporate administration for the Fund; compiling and maintaining records with respect to the Fund’s operations; preparing and filing reports required by the Securities and Exchange Commission; preparing periodic reports regarding the operations of the Fund for its shareholders; preparing proxy materials for shareholder meetings; and preparing the registration statements required by Federal and state securities laws for the sale of the Fund’s shares. The Managers also provide the Fund with office space, facilities and equipment.
The Board also considered the quality of the services provided and the quality of the Managers’ resources that are available to the Fund. The Board took account of the fact that the Sub-Adviser has had over fifty years of experience as an investment adviser and that its assets under management rank it among the top mutual fund managers in the United States. The Board evaluated the Sub-Adviser’s advisory, administrative, accounting, legal, compliance services and risk management, and information the Board has received regarding the experience and professional qualifications of the Managers’ key personnel and the size and functions of its staff. In its evaluation of the quality of the portfolio management services provided, the Board considered the experience of Christopher Proctor and Adam Wilde, the portfolio managers for the Fund, and the Sub-Adviser’s investment team and analysts. The Board members also considered the totality of their experiences with the Managers as directors or trustees of the Fund and other funds advised by the Managers. The Board considered information regarding the quality of services provided by affiliates of the Managers, which its members have become knowledgeable about in connection with the renewal of the Fund’s service agreements. The Board concluded, in light of the Managers’ experience, reputation, personnel, operations and resources that the Fund benefits from the services provided under the Agreement.
Investment Performance of the Fund, the Adviser and the Sub-Adviser. Throughout the year, the Manager provided information on the investment performance of the Fund, including comparative performance information. The Board also reviewed information, prepared by the Manager and by the independent consultant, comparing the Fund’s historical performance to relevant market indices and to the performance of other money market tax-free funds underlying variable insurance products. The Board considered that the Fund outperformed its performance category median during the one-, three-, five-, and ten-year periods.
Costs of Services by the Adviser. The Board reviewed the fees paid to the Manager and the other expenses borne by the Fund. The independent consultant provided comparative data in regard to the fees and expenses of the Fund and other money market tax-free funds underlying variable insurance products. In reviewing the fees and expenses charged to the VA funds, the Board considered the Manager’s assertion that, because there is much greater disparity in the fees and services that may be provided by a manager to a VA fund as opposed to a retail fund, when comparing the expenses of the various VA funds to those of retail funds, it is most appropriate to focus on total expenses (rather than on the management fees). Accordingly, while the Board reviewed and considered all expenses, it focused on total expenses. The Board considered that the Fund’s contractual management fee was equal to its peer group median but higher than its category median. Within the total asset range of $100 million to $250 million, the Fund’s effective rate was higher than its peer group median and category median. The Board also considered that the Fund’s total expenses, after waivers, were higher than its peer group median and category median. The Board noted that the Manager has contractually agreed to limit the Fund’s total annual operating expenses so that those expenses, as a percentage of daily net assets, will not exceed the annual rate of 0.50%. This contractual fee waiver and/or reimbursement may not be amended or withdrawn until one year after the date of the Fund’s prospectus, unless approved by the Board. The Board also considered that the Manager voluntarily agreed to waive and/or reimburse fees to the extent necessary to help to attempt to maintain a positive yield although there is no guarantee that the Fund will maintain a positive yield. This voluntary expense limitation may be amended or withdrawn at any time without prior notice to shareholders.
Economies of Scale and Profits Realized by the Adviser and Sub-Adviser. The Board considered information regarding the Managers’ costs in serving as the Fund’s investment adviser and sub-adviser, including the costs associated with the personnel and systems necessary to manage the Fund, and information regarding the Managers’ profitability from their relationship with the Fund. The Board reviewed whether the Managers may realize economies of scale in managing and supporting the Fund. The Board noted that the Fund currently has management fee breakpoints, which are intended to share with Fund shareholders economies of scale that may exist as the Fund’s assets grow.
17 OPPENHEIMER MONEY FUND/VA
| | |
| BOARD APPROVAL OF THE FUND’S INVESTMENT ADVISORY AND SUB-ADIVSORY AGREEMENTS Unaudited / Continued |
Other Benefits to the Managers. In addition to considering the profits realized by the Managers, the Board considered information that was provided regarding the direct and indirect benefits the Managers receive as a result of their relationship with the Fund, including compensation paid to the Managers’ affiliates. The Board also considered that the Managers must be able to pay and retain experienced professional personnel at competitive rates to provide quality services to the Fund.
Conclusions. These factors were also considered by the independent Trustees meeting separately from the full Board, assisted by experienced counsel to the Fund and to the independent Trustees. Fund counsel and the independent Trustees’ counsel are independent of the Managers within the meaning and intent of the Securities and Exchange Commission Rules.
Based on its review of the information it received and its evaluations described above, the Board, including a majority of the independent Trustees, decided to continue the Agreements through August 31, 2014. In arriving at its decision, the Board did not identify any factor or factors as being more important than others, but considered all of the above information, and considered the terms and conditions of the Agreements, including the management fees, in light of all the surrounding circumstances.
18 OPPENHEIMER MONEY FUND/VA
| | |
| PORTFOLIO PROXY VOTING POLICIES AND PROCEDURES; UPDATES TO STATEMENTS Unaudited |
The Fund has adopted Portfolio Proxy Voting Policies and Procedures under which the Fund votes proxies relating to securities (“portfolio proxies”) held by the Fund. A description of the Fund’s Portfolio Proxy Voting Policies and Procedures is available (i) without charge, upon request, by calling the Fund toll-free at 1.800.CALL OPP (225.5677), (ii) on the Fund’s website at oppenheimerfunds.com, and (iii) on the SEC’s website at www.sec.gov. In addition, the Fund is required to file Form N-PX, with its complete proxy voting record for the 12 months ended June 30th, no later than August 31st of each year. The Fund’s voting record is available (i) without charge, upon request, by calling the Fund toll-free at 1.800.CALL OPP (225.5677), and (ii) in the Form N-PX filing on the SEC’s website at www.sec.gov.
The Fund files its complete schedule of portfolio holdings with the SEC for the first quarter and the third quarter of each fiscal year on Form N-Q. The Fund’s Form N-Q filings are available on the SEC’s website at www.sec.gov. Those forms may be reviewed and copied at the SEC’s Public Reference Room in Washington, D.C. Information on the operation of the Public Reference Room may be obtained by calling 1-800-SEC-0330.
19 OPPENHEIMER MONEY FUND/VA
| | |
TRUSTEES AND OFFICERS Unaudited |
| | |
| Name, Position(s) Held with the Fund, Length of Service, Year of Birth | | Principal Occupation(s) During the Past 5 Years; Other Trusteeships/Directorships Held; Number of Portfolios in the Fund Complex Currently Overseen |
| |
| INDEPENDENT TRUSTEES | | The address of each Trustee in the chart below is 6803 S. Tucson Way, Centennial, Colorado 80112-3924. Each Trustee serves for an indefinite term, or until his or her resignation, retirement, death or removal. |
| |
Sam Freedman, Chairman of the Board of Trustees (since 2013) and Trustee (since 1996) Year of Birth: 1940 | | Director of Colorado UpLIFT (charitable organization) (since September 1984). Mr. Freedman held several positions with the Sub-Adviser and with subsidiary or affiliated companies of the Sub-Adviser (until October 1994). Oversees 39 portfolios in the OppenheimerFunds complex. Mr. Freedman has served on the Boards of certain Oppenheimer funds since 1996, during which time he has become familiar with the Fund’s (and other Oppenheimer funds’) financial, accounting, regulatory and investment matters and has contributed to the Boards’ deliberations. |
| |
Edward L. Cameron, Trustee (since 1999) Year of Birth: 1938 | | Member of The Life Guard of Mount Vernon (George Washington historical site) (June 2000-June 2006); Partner of PricewaterhouseCoopers LLP (accounting firm) (July 1974-June 1999); Chairman of Price Waterhouse LLP Global Investment Management Industry Services Group (accounting firm) (July 1994-June 1998). Oversees 39 portfolios in the OppenheimerFunds complex. Mr. Cameron has served on the Boards of certain Oppenheimer funds since 1999, during which time he has become familiar with the Fund’s (and other Oppenheimer funds’) financial, accounting, regulatory and investment matters and has contributed to the Boards’ deliberations. |
| |
Jon S. Fossel, Trustee (since 1990) Year of Birth: 1942 | | Chairman of the Board (2006-December 2011) and Director (June 2002-December 2011) of UNUMProvident (insurance company); Director of Northwestern Energy Corp. (public utility corporation) (November 2004-December 2009); Director of P.R. Pharmaceuticals (October 1999-October 2003); Director of Rocky Mountain Elk Foundation (non-profit organization) (February 1998-February 2003 and February 2005-February 2007); Chairman and Director (until October 1996) and President and Chief Executive Officer (until October 1995) of the Sub-Adviser; President, Chief Executive Officer and Director of the following: Oppenheimer Acquisition Corp. (“OAC”) (parent holding company of the Sub-Adviser), Shareholders Services, Inc. and Shareholder Financial Services, Inc. (until October 1995). Oversees 39 portfolios in the OppenheimerFunds complex. Mr. Fossel has served on the Boards of certain Oppenheimer funds since 1990, during which time he has become familiar with the Fund’s (and other Oppenheimer funds’) financial, accounting, regulatory and investment matters and has contributed to the Boards’ deliberations. |
| |
Richard F. Grabish, Trustee (since 2012) Year of Birth: 1948 | | Formerly Senior Vice President and Assistant Director of Sales and Marketing (March 1997-December 2007), Director (March 1987-December 2007) and Manager of Private Client Services (June 1985-June 2005) of A.G. Edwards & Sons, Inc. (broker/dealer and investment firm); Chairman and Chief Executive Officer of A.G. Edwards Trust Company, FSB (March 2001- December 2007); President and Vice Chairman of A.G. Edwards Trust Company, FSB (investment adviser) (April 1987-March 2001); President of A.G. Edwards Trust Company, FSB (investment adviser) (June 2005-December 2007). Oversees 39 portfolios in the OppenheimerFunds complex. Mr. Grabish has served on the Boards of certain Oppenheimer funds since 2001, during which time he has become familiar with the Fund’s (and other Oppenheimer funds’) financial, accounting, regulatory and investment matters and has contributed to the Boards’ deliberations. |
| |
Beverly L. Hamilton, Trustee (since 2002) Year of Birth: 1946 | | Trustee of Monterey Institute for International Studies (educational organization) (since February 2000); Board Member of Middlebury College (educational organization) (December 2005-June 2011); Chairman (since 2010) of American Funds’ Emerging Markets Growth Fund, Inc. (mutual fund); Director of The California Endowment (philanthropic organization) (April 2002-April 2008); Director (February 2002-2005) and Chairman of Trustees (2006-2007) of the Community Hospital of Monterey Peninsula; Director (October 1991-2005); Vice Chairman (2006-2009) of American Funds’ Emerging Markets Growth Fund, Inc. (mutual fund); President of ARCO Investment Management Company (February 1991-April 2000); Member of the investment committees of The Rockefeller Foundation (2001-2006) and The University of Michigan (since 2000); Advisor at Credit Suisse First Boston’s Sprout venture capital unit (venture capital fund) (1994-January 2005); Trustee of MassMutual Institutional Funds (investment company) (1996-June 2004); Trustee of MML Series Investment Fund (investment company) (April 1989-June 2004); Member of the investment committee of Hartford Hospital (2000-2003); and Advisor to Unilever (Holland) pension fund (2000-2003). Oversees 39 portfolios in the OppenheimerFunds complex. Ms. Hamilton has served on the Boards of certain Oppenheimer funds since 2002, during which time she has become familiar with the Fund’s (and other Oppenheimer funds’) financial, accounting, regulatory and investment matters and has contributed to the Boards’ deliberations. |
| |
Victoria J. Herget, Trustee (since 2012) Year of Birth:1951 | | Independent Director of the First American Funds (mutual fund family) (2003-2011); former Managing Director (1993-2001), Principal (1985-1993), Vice President (1978-1985) and Assistant Vice President (1973-1978) of Zurich Scudder Investments (and its predecessor firms); Board Chair (2008-Present) and Director (2004-Present), United Educators (insurance company); Trustee (1992-2007), Chair of the Board of Trustees (1999-2007), Investment Committee Chair (1994-1999) and Investment Committee member (2007-2010) of Wellesley College; Trustee (since 2000) and Chair (since 2010), Newberry Library; Trustee, Mather LifeWays (since 2001); Trustee, BoardSource (2006-2009) and Chicago City Day School (1994-2005). Oversees 39 portfolios in the OppenheimerFunds complex. Ms. Herget has served on the Boards of certain Oppenheimer funds since 2012, during which time she has become familiar with the Fund’s (and other Oppenheimer funds’) financial, accounting, regulatory and investment matters and has contributed to the Boards’ deliberations. |
| |
Robert J. Malone, Trustee (since 2002) Year of Birth: 1944 | | Chairman of the Board (since 2012) and Director (since August 2005) of Jones International University (educational organization) (since August 2005); Chairman, Chief Executive Officer and Director of Steele Street Bank Trust (commercial banking) (since August 2003); Trustee of the Gallagher Family Foundation (non-profit organization) (since 2000); Board of Directors of Opera Colorado Foundation (non-profit organization) (2008-2012); Director of Colorado UpLIFT (charitable organization) (1986-2010); Director of Jones Knowledge, Inc. (2006-2010); Former Chairman of U.S. Bank-Colorado |
20 OPPENHEIMER MONEY FUND/VA
| | |
Robert J. Malone, Continued | | (subsidiary of U.S. Bancorp and formerly Colorado National Bank) (July 1996-April 1999); Director of Commercial Assets, Inc. (real estate investment trust) (1993-2000); Director of U.S. Exploration, Inc. (oil and gas exploration) (1997-February 2004); Chairman of the Board (1991-1994) and Trustee (1985-1994) of Regis University; and Chairman of the Board (1990-1991 and Trustee (1984-1999) of Young Presidents Organization. Oversees 39 portfolios in the OppenheimerFunds complex. Mr. Malone has served on the Boards of certain Oppenheimer funds since 2002, during which time he has become familiar with the Fund’s (and other Oppenheimer funds’) financial, accounting, regulatory and investment matters and has contributed to the Boards’ deliberations. |
| |
F. William Marshall, Jr., Trustee (since 2000) Year of Birth: 1942 | | Trustee Emeritus of Worcester Polytech Institute (WPI) (private university) (since 2009); Trustee of MassMutual Select Funds (formerly MassMutual Institutional Funds) (investment company) (since 1996), MML Series Investment Fund (investment company) (since 1996) and Mass Mutual Premier Funds (investment company) (since January 2012); President and Treasurer of the SIS Fund (private charitable fund) (January 1999 – March 2011); Former Trustee of WPI (1985-2008); Former Chairman of the Board (2004-2006) and Former Chairman of the Investment Committee of WPI (1994-2008); Chairman of SIS & Family Bank, F.S.B. (formerly SIS Bank) (commercial bank) (January 1999-July 1999); Executive Vice President of Peoples Heritage Financial Group, Inc. (commercial bank) (January 1999-July 1999); and Former President and Chief Executive Officer of SIS Bancorp. (1993-1999). Oversees 43 portfolios in the OppenheimerFunds complex. Mr. Marshall has served on the Boards of certain Oppenheimer funds since 2000, during which time he has become familiar with the Fund’s (and other Oppenheimer funds’) financial, accounting, regulatory and investment matters and has contributed to the Boards’ deliberations. |
| |
Karen L. Stuckey, Trustee (since 2012) Year of Birth: 1953 | | Partner (1990-2012) of PricewaterhouseCoopers LLP (held various positions 1975-1990); Emeritus Trustee (since 2006), Trustee (1992-2006) and member of Executive, Nominating and Audit Committees and Chair of Finance Committee of Lehigh University; and member, Women’s Investment Management Forum since inception. Oversees 39 portfolios in the OppenheimerFunds complex. Ms. Stuckey has served on the Boards of certain Oppenheimer funds since 2012, during which time she has become familiar with the Fund’s (and other Oppenheimer funds’) financial, accounting, regulatory and investment matters and has contributed to the Boards’ deliberations. |
| |
James D. Vaughn, Trustee (since 2012) Year of Birth: 1945 | | Retired; former managing partner (1994-2001) of Denver office of Deloitte & Touche LLP, (held various positions 1969-1993); Trustee and Chairman of the Audit Committee of Schroder Funds (2003-2012); Board member and Chairman of Audit Committee of AMG National Trust Bank (since 2005); Trustee and Investment Committee member, University of South Dakota Foundation (since 1996); Board member, Audit Committee Member and past Board Chair, Junior Achievement (since 1993); former Board member, Mile High United Way, Boys and Girls Clubs, Boy Scouts, Colorado Business Committee for the Arts, Economic Club of Colorado and Metro Denver Network. Oversees 39 portfolios in the OppenheimerFunds complex. Mr. Vaughn has served on the Boards of certain Oppenheimer funds since 2012, during which time he has become familiar with the Fund’s (and other Oppenheimer funds’) financial, accounting, regulatory and investment matters and has contributed to the Boards’ deliberations. |
| |
| INTERESTED TRUSTEE AND OFFICER | | Mr. Glavin is an “Interested Trustee” because he is affiliated with the Manager and the Sub-Adviser by virtue of his positions as an officer and director of the Manager and a director of the Sub-Adviser, and as a shareholder of the Sub-Adviser’s parent company. Both as a Trustee and as an officer, he serves for an indefinite term, or until his resignation, retirement, death or removal. Mr. Glavin’s address is Two World Financial Center, 225 Liberty Street, 11th Floor, New York, New York 10281-1008. |
| |
William F. Glavin, Jr., Trustee, President and Principal Executive Officer (since 2009) Year of Birth: 1958 | | Director, Chairman and Chief Executive Officer of the Manager (since January 2013); President of the Manager (January 2013- May 2013); Chairman of the Sub-Adviser (December 2009-December 2012); Chief Executive Officer (January 2009-December 2012) and Director of the Sub-Adviser (since January 2009); President of the Sub-Adviser (May 2009-December 2012); Management Director (since June 2009), President (since December 2009) and Chief Executive Officer (since January 2011) of Oppenheimer Acquisition Corp. (“OAC”) (the Sub-Adviser’s parent holding company); Director of Oppenheimer Real Asset Management, Inc. (since March 2010); Executive Vice President (March 2006-February 2009) and Chief Operating Officer (July 2007-February 2009) of Massachusetts Mutual Life Insurance Company (OAC’s parent company); Director (May 2004-March 2006) and Chief Operating Officer and Chief Compliance Officer (May 2004-January 2005), President (January 2005-March 2006) and Chief Executive Officer (June 2005-March 2006) of Babson Capital Management LLC; Director (March 2005-March 2006), President (May 2003-March 2006) and Chief Compliance Officer (July 2005-March 2006) of Babson Capital Securities, Inc. (a broker-dealer); President (May 2003-March 2006) of Babson Investment Company, Inc.; Director (May 2004-August 2006) of Babson Capital Europe Limited; Director (May 2004-October 2006) of Babson Capital Guernsey Limited; Director (May 2004-March 2006) of Babson Capital Management LLC; Non-Executive Director (March 2005-March 2007) of Baring Asset Management Limited; Director (February 2005-June 2006) Baring Pension Trustees Limited; Director and Treasurer (December 2003-November 2006) of Charter Oak Capital Management, Inc.; Director (May 2006-September 2006) of C.M. Benefit Insurance Company; Director (May 2008-June 2009) and Executive Vice President (June 2007-July 2009) of C.M. Life Insurance Company; President (March 2006-May 2007) of MassMutual Assignment Company; Director (January 2005- December 2006), Deputy Chairman (March 2005-December 2006) and President (February 2005-March 2005) of MassMutual Holdings (Bermuda) Limited; Director (May 2008-June 2009) and Executive Vice President (June 2007-July 2009) of MML Bay State Life Insurance Company; Chief Executive Officer and President (April 2007-January 2009) of MML Distributors, LLC; and Chairman (March 2006-December 2008) and Chief Executive Officer (May 2007-December 2008) of MML Investors Services, Inc. An officer of 90 portfolios in the OppenheimerFunds complex. |
21 OPPENHEIMER MONEY FUND/VA
| | |
TRUSTEES AND OFFICERS Unaudited / Continued |
| | |
| OTHER OFFICERS OF THE FUND | | The addresses of the Officers in the chart below are as follows: for Messrs. Gabinet and Ms. Nasta, Two World Financial Center, 225 Liberty Street, 11th Floor, New York, New York 10281-1008, for Messrs. Proctor, Wilde, Vandehey and Wixted, 6803 S. Tucson Way, Centennial, Colorado 80112-3924. Each Officer serves for an indefinite term or until his or her resignation, retirement, death or removal. |
| |
Christopher Proctor, Vice President (since 2010) Year of Birth: 1968 | | Head of the Cash Strategies Team (since July 2013); Senior Vice President of the Sub-Adviser (since July 2013) and Senior Portfolio Manager of the Sub-Adviser (since January 2010). Vice President of the Sub-Adviser (August 2008-July 2013). Vice President at Calamos Asset Management (January 2007-March 2008) and Scudder-Kemper Investments (1999-2002). Managing Director and Co-Founder of Elmhurst Capital Management (June 2004-January 2007); Senior Manager of Research for Etrade Global Asset Management (2002-2004). A portfolio manager and officer of other portfolios in the OppenheimerFunds complex. |
| |
Adam S. Wilde, Vice President (since 2013) Year of Birth: 1978 | | Vice President of the Sub-Adviser (since May 2011) and a Portfolio Manager of the Sub-Adviser (since July 2013). Head of credit research for the cash strategies team of the Sub-Adviser (2011-2013), and served as an Assistant Vice President and senior research analyst of the Sub-Adviser (2008-2011). Served as an intermediate research analyst of the Sub-Adviser (2007- 2008), served in other analyst roles of the Sub-Adviser (since 2002) and joined the Sub-Adviser in 2001. A portfolio manager and officer of other portfolios in the OppenheimerFunds complex. |
| |
Arthur S. Gabinet, Secretary and Chief Legal Officer (since 2011) Year of Birth: 1958 | | Executive Vice President, Secretary and General Counsel of the Manager (since January 2013); General Counsel OFI SteelPath, Inc. (since January 2013); Executive Vice President (May 2010-December 2012) and General Counsel (since January 2011) of the Sub-Adviser; General Counsel of the Distributor (since January 2011); General Counsel of Centennial Asset Management Corporation (January 2011-December 2012); Executive Vice President (January 2011-December 2012) and General Counsel of HarbourView Asset Management Corporation (since January 2011); Assistant Secretary (since January 2011) and Director (since January 2011) of OppenheimerFunds International Ltd. and OppenheimerFunds plc; Director of Oppenheimer Real Asset Management, Inc. (January 2011-December 2012) and General Counsel (since January 2011); Executive Vice President (January 2011-December 2011) and General Counsel of Shareholder Financial Services, Inc. and Shareholder Services, Inc. (since January 2011); Executive Vice President (January 2011-December 2012) and General Counsel of OFI Private Investments Inc. (since January 2011); Vice President of OppenheimerFunds Legacy Program (January 2011-December 2011); Executive Vice President (January 2011-December 2012) and General Counsel of OFI Institutional Asset Management, Inc. (since January 2011); General Counsel, Asset Management of the Sub-Adviser (May 2010-December 2010); Principal, The Vanguard Group (November 2005-April 2010); District Administrator, U.S. Securities and Exchange Commission (January 2003-October 2005). An officer of 90 portfolios in the OppenheimerFunds complex. |
| |
Christina M. Nasta, Vice President and Chief Business Officer (since 2011) Year of Birth: 1973 | | Senior Vice President of OppenheimerFunds Distributor, Inc. (since January 2013); Senior Vice President of the Sub-Adviser (July 2010-December 2012); Vice President of the Sub-Adviser (January 2003-July 2010); Vice President of OppenheimerFunds Distributor, Inc. (January 2003-July 2010). An officer of 90 portfolios in the OppenheimerFunds complex. |
| |
Mark S. Vandehey, Vice President and Chief Compliance Officer (since 2004) Year of Birth: 1950 | | Senior Vice President and Chief Compliance Officer of the Manager (since January 2013); Chief Compliance Officer of OFI SteelPath, Inc. (since January 2013); Senior Vice President of the Sub-Adviser (March 2004-December 2012); Chief Compliance Officer of the Sub-Adviser, OppenheimerFunds Distributor, Inc., OFI Trust Company, OFI Institutional Asset Management, Inc., Oppenheimer Real Asset Management, Inc., OFI Private Investments, Inc., Harborview Asset Management Corporation, Trinity Investment Management Corporation, and Shareholder Services, Inc. (since March 2004); Vice President of OppenheimerFunds Distributor, Inc., Centennial Asset Management Corporation and Shareholder Services, Inc. (June 1983- December 2012). An officer of 90 portfolios in the OppenheimerFunds complex. |
| |
Brian W. Wixted, Treasurer and Principal Financial & Accounting Officer (since 1999) Year of Birth: 1959 | | Senior Vice President of the Manager (since January 2013); Treasurer of the Sub-Adviser, HarbourView Asset Management Corporation, Shareholder Financial Services, Inc., Shareholder Services, Inc., and Oppenheimer Real Asset Management, Inc. (March 1999-June 2008), OFI Private Investments, Inc. (March 2000-June 2008), OppenheimerFunds International Ltd. and OppenheimerFunds plc (since May 2000), OFI Institutional Asset Management, Inc. (November 2000-June 2008), and OppenheimerFunds Legacy Program (charitable trust program established by the Sub-Adviser) (June 2003-December 2011); Treasurer and Chief Financial Officer of OFI Trust Company (since May 2000); Assistant Treasurer of Oppenheimer Acquisition Corporation (March 1999-June 2008). An officer of 90 portfolios in the OppenheimerFunds complex. |
The Fund’s Statement of Additional Information contains additional information about the Fund’s Trustees and Officers and is available without charge, upon request, by calling 1.800.988.8287.
22 OPPENHEIMER MONEY FUND/VA
| | |
OPPENHEIMER MONEY FUND/VA |
A Series of Oppenheimer Variable Account Funds
| | |
| Manager | | OFI Global Asset Management, Inc. |
| |
| Sub-Adviser | | OppenheimerFunds, Inc. |
| |
| Distributor | | OppenheimerFunds Distributor, Inc. |
| |
Transfer and Shareholder Servicing Agent | | OFI Global Asset Management, Inc. |
| |
| Sub-Transfer Agent | | Shareholder Services, Inc. DBA OppenheimerFunds Services |
| |
Independent Registered Public Accounting Firm | | KPMG LLP |
| |
| Counsel | | K&L Gates LLP |
| |
| | Before investing, investors should carefully consider a fund’s investment objectives, risks, charges and expenses. Fund prospectuses and summary prospectuses contain this and other information about the funds, and may be obtained by asking your financial advisor, or calling us at 1.800.988.8287. Read prospectuses and summary prospectuses carefully before investing. |
| |
| | © 2014 OppenheimerFunds, Inc. All rights reserved. Oppenheimer funds are distributed by OppenheimerFunds Distributor, Inc. |

| | | | |
| December 31, 2013 | | |
| | | Oppenheimer Global Strategic Income Fund/VA A Series of Oppenheimer Variable Account Funds | | Annual Report |
| | |
| | ANNUAL REPORT Listing of Top Holdings Fund Performance Discussion Financial Statements | | |
| | |
| | |
| | |

Portfolio Managers: Arthur P. Steinmetz, Krishna Memani, Sara J. Zervos, Ph.D. and Jack Brown, CFA1
Average Annual Total Returns
For the Periods Ended 12/31/13
| | | | | | |
| | | 1-Year | | 5-Year | | 10-Year |
Non-Service Shares | | -0.13% | | 9.33% | | 5.83% |
Service Shares | | -0.37% | | 9.05% | | 5.58% |
Performance data quoted represents past performance, which does not guarantee future results. The investment return and principal value of an investment in the Fund will fluctuate so that an investor’s shares, when redeemed, may be worth more or less than their original cost. Current performance and expense ratios may be lower or higher than the data quoted. For performance data current to the most recent month end, call us at 1.800.988.8287. The Fund’s total returns should not be expected to be the same as the returns of other funds, whether or not both funds have the same portfolio managers and/or similar names. The Fund’s total returns include changes in share price and reinvested distributions but do not include the charges associated with the separate account products that offer this Fund. Such performance would have been lower if such charges were taken into account.
| | | | |
PORTFOLIO ALLOCATION | | | |
Corporate Bonds and Notes | | | 36.6% | |
Foreign Government Obligations | | | 23.6 | |
Mortgage-Backed Obligations | | | | |
Government Agency | | | 4.7 | |
Non-Agency | | | 14.7 | |
U.S. Government Obligations | | | 7.2 | |
Investment Companies | | | | |
iShares iBoxx $ High Yield Corporate Bond Exchange Traded Fund | | | 0.4 | |
Oppenheimer Institutional Money Market Fund | | | 1.3 | |
Oppenheimer Master Event-Linked Bond Fund, LLC | | | 2.7 | |
Oppenheimer Master Loan Fund, LLC | | | 0.6 | |
Oppenheimer Ultra-Short Duration Fund | | | 1.5 | |
Asset-Backed Securities | | | 2.9 | |
Corporate Loans | | | 2.4 | |
Structured Securities | | | 1.0 | |
Over-the-Counter Swaptions Purchased | | | 0.2 | |
Common Stocks | | | 0.1 | |
Preferred Stocks | | | 0.1 | |
Over-the-Counter Options Purchased | | | —* | |
*Represents less than 0.005%.
Portfolio holdings and allocations are subject to change. Percentages are as of December 31, 2013, and are based on the total market value of investments.
1 Jack Brown became a portfolio manager on 4/30/2013.
| | |
CREDIT RATING BREAKDOWN | | NRSRO ONLY TOTAL |
| AAA | | 15.1% |
| AA | | 1.7 |
| A | | 12.0 |
| BBB | | 25.8 |
| BB | | 14.1 |
| B | | 16.0 |
| CCC | | 7.0 |
| CC | | 0.6 |
| C | | 0.0 |
| D | | 1.4 |
| Unrated | | 6.3 |
| Total | | 100.0% |
The percentages above are based on the market value of the Fund’s securities as of December 31, 2013, and are subject to change. Except for securities labeled “Unrated,” and except for certain securities issued or guaranteed by a foreign sovereign, all securities have been rated by at least one Nationally Recognized Statistical Rating Organization (“NRSRO”), such as Standard & Poor’s (“S&P”). For securities rated only by an NRSRO other than S&P, OppenheimerFunds, Inc. (the “Sub-Adviser”) converts that rating to the equivalent S&P rating. If two or more NRSROs have assigned a rating to a security, the highest S&P equivalent rating is used. Unrated securities issued or guaranteed by a foreign sovereign are assigned a credit rating equal to the highest NRSRO rating assigned to that foreign sovereign. For securities not rated by an NRSRO, the Sub-Adviser uses its own credit analysis to assign ratings in categories similar to those of S&P. The use of similar categories is not an indication that the Sub-Adviser’s credit analysis process is consistent or comparable with any NRSRO’s process were that NRSRO to rate the same security. Fund assets invested in Oppenheimer Institutional Money Market Fund are assigned that fund’s S&P rating, which is currently AAA. For the purposes of this table, “investment-grade” securities are securities rated within the NRSROs’ four highest rating categories (AAA, AA, A and BBB). Unrated securities do not necessarily indicate low credit quality, and may or may not be the equivalent of investment-grade. Please consult the Fund’s prospectus and Statement of Additional Information for further information.
2 OPPENHEIMER GLOBAL STRATEGIC INCOME FUND/VA
Fund Performance Discussion
The Fund’s Non-Service shares produced a total return of -0.13% during the one-year reporting period ended December 31, 2013. In comparison, the Fund’s Reference Index, a customized weighted index currently comprised of the following underlying broad-based security indices: 40% Citigroup Non-U.S. World Government Bond Index, 30% JPMorgan Domestic High Yield Index, and 30% Barclays U.S. Aggregate Bond Index, returned -0.04%. Relative strength from the Fund’s investments in high yield bonds was balanced primarily by shortfalls among emerging markets bonds, as economic slowdowns in developing nations produced selling pressure in local fixed-income markets.
MARKET OVERVIEW
Accommodative monetary policies on the part of central banks in the U.S., Europe and Japan, combined with an improving economic outlook, resulted in a rally among risk equities and higher-yielding bonds over the first four months of 2013. Higher-yielding bonds generally rallied in response to an improving economic outlook. U.S. high yield bonds fared particularly well, as investors reached for higher yields in the low interest rate environment, corporate issuers continued to report strong earnings, and default rates remained low. At the same time, yields of U.S. government securities remained near historical lows due to the Fed’s massive bond buying program. In international markets, sovereign bonds from Europe gained value as it became clearer that the worst of the region’s debt and banking crises were likely behind it. The improved economic outlook also buoyed corporate bonds in emerging markets, such as Russia and China. U.S. dollar-denominated securities outperformed their local currency-denominated counterparts as governments in Japan and Europe took steps to reduce the value of the yen and euro, respectively, relative to the U.S. dollar.
These developments drove financial markets higher through the spring of 2013. At that time, economic data appeared to confirm that the United States, Europe and Japan had engineered a sustained economic rebound, but investors responded negatively to disappointing economic data from China, India, Brazil, and other emerging markets. The ensuing “flight to quality” toward traditional safe havens produced sharp dislocations in emerging market equity, fixed-income and currency markets. In late May, relatively hawkish remarks by Fed chairman Ben Bernanke were widely interpreted as a signal that U.S. monetary policymakers would begin to back away from their quantitative easing program sooner than expected, sparking heightened volatility in financial markets throughout the world. However, market conditions generally stabilized over the summer of 2013. In October, the U.S. Congress managed to reach a bipartisan agreement to raise the national debt ceiling, and did so well ahead of the potential default deadline. While the Fed unexpectedly refrained from reducing its monthly bond purchases in September, in December the Central Bank announced that it would reduce its monthly bond purchases by $10 billion, from $85 billion to $75 billion, starting in January 2014. The Fed also announced that it would continue to hold short-term interest rates at very low levels until unemployment in the United States subsided below 6.5%. This was lower than its earlier 7% target. Despite the reduction in monthly bond purchases, the markets continued to rally through the end of the year.
FUND REVIEW
The Fund generally maintained a constructive investment posture throughout the reporting period, maintaining an overweight position in credit risk through investments in international bonds and high yield securities. The Fund generally maintained underweight exposure to U.S. government securities and foreign currencies.
As it has for some time, the Fund’s international portfolio had a large allocation to emerging markets. This positioning hurt the Fund’s relative performance when interest rates in the emerging markets climbed amid selling pressure from newly risk-averse investors. Although we had reduced the Fund’s holdings of Brazilian debt securities over the reporting period’s first half, even a small position proved counterproductive over the second half when local economic and fiscal concerns intensified. Bonds from Mexico and South Africa detracted from relative results to a lesser extent.
In contrast, underweight exposure to foreign currencies contributed positively to the Fund’s results. The Fund maintained no exposure to the euro and yen over the reporting period’s second half, avoiding the brunt of their weakness. In addition, the Fund benefited from positions in non-sovereign European debt, including corporate securities, asset-backed securities, and bank loans.
In the Fund’s investment grade U.S. bond portfolio, we remained significantly underweight government bonds and favored mortgage-backed securities and structured products. This positioning was beneficial during the period. While our investments in mortgage-backed securities contributed positively to performance in 2013, we reduced our mortgage exposure during the period due to our belief there is limited potential for further price appreciation and our expectations for interest rates to rise slowly over time. We used those proceeds to add a position in senior loans.
The Fund’s high yield portfolio benefited from overweight exposure and an emphasis on securities with credit ratings toward the lower end of the market’s quality spectrum. Bonds backed by wireless telecommunications carriers and broadcasters bolstered results early in the year. The Fund also benefited from positions in senior floating-rate bank loans at times during the reporting period.
3 OPPENHEIMER GLOBAL STRATEGIC INCOME FUND/VA
STRATEGY & OUTLOOK
We believe the global economy is likely to perform better in 2014. The U.S. economy is strengthening, and as it does, we expect rates to climb slowly higher over time. We also believe the U.S. dollar has the potential to strengthen. Consequently, we have an overweight at period end to credit. While we did reduce our position in emerging markets debt, the Fund still has a large position in the asset class. The relative spreads between emerging markets and U.S. high yield bonds indicate to us that emerging markets may be a good place to generate attractive returns. We are also positive on European credit and have increased our exposure. As mentioned earlier, we also reduced our position in mortgages this period.
Additionally, we have reduced the Fund’s duration in preparation for the next phase of the interest-rate cycle. We expect rates to continue rising for several years, and as a result, we expect to be short duration for quite some time.
Investors should consider the Fund’s investment objective, risks, charges and expenses carefully before investing. The Fund’s prospectus and summary prospectus contain this and other information about the Fund, and may be obtained by asking your financial advisor or calling us at 1.800.988.8287. Read prospectuses and summary prospectuses carefully before investing.
Total returns include changes in share price and reinvestment of dividends and capital gains distributions in a hypothetical investment for the periods shown.
The Fund’s investment strategy and focus can change over time. The mention of specific fund holdings does not constitute a recommendation by OppenheimerFunds, Inc. or its affiliates.
Shares of Oppenheimer funds are not deposits or obligations of any bank, are not guaranteed by any bank, are not insured by the FDIC or any other agency, and involve investment risks, including the possible loss of the principal amount invested.
Comparing the Fund’s Performance to the Market. The graphs that follow show the performance of a hypothetical $10,000 investment in each share class of the Fund held until December 31, 2013. Performance is measured over a ten-fiscal-year period for both Classes. Performance information does not reflect charges that apply to separate accounts investing in the Fund. If these charges were taken into account, performance would be lower. The graphs assume that all dividends and capital gains distributions were reinvested in additional shares.
The Fund’s performance is compared to the performance of the Barclays U.S. Aggregate Bond Index, the Citigroup World Government Bond Index, the Citigroup Non-U.S. World Government Bond Index, JPMorgan Domestic High Yield Index and its Reference Index. The Barclays U.S. Aggregate Bond Index is an index of U.S dollar-denominated, investment-grade U.S. corporate government and mortgage-backed securities. The Citigroup World Government Bond Index is an index of debt securities of major foreign government bond markets. The Citigroup Non-U.S. World Government Bond Index is an index of fixed rate government bonds with a maturity of one year or longer and amounts outstanding of at least U.S. $25 million. The JPMorgan Domestic High Yield Index is an unmanaged index of high yield fixed income securities issued by developed countries. The Fund’s Reference Index is a customized weighted index currently comprised of the following underlying broad-based security indices: 40% Citigroup Non-U.S. World Government Bond Index, 30% JPMorgan Domestic High Yield Index, and 30% Barclays U.S. Aggregate Bond Index. The indices are unmanaged and cannot be purchased directly by investors. Index performance includes reinvestment of income, but does not reflect transaction costs, fees, expenses or taxes. Index performance is shown for illustrative purposes only as a benchmark for the Fund’s performance, and does not predict or depict performance of the Fund. The Fund’s performance reflects the effects of the Fund’s business and operating expenses.
4 OPPENHEIMER GLOBAL STRATEGIC INCOME FUND/VA
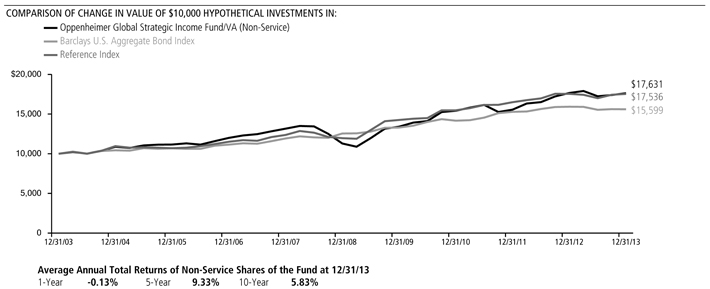
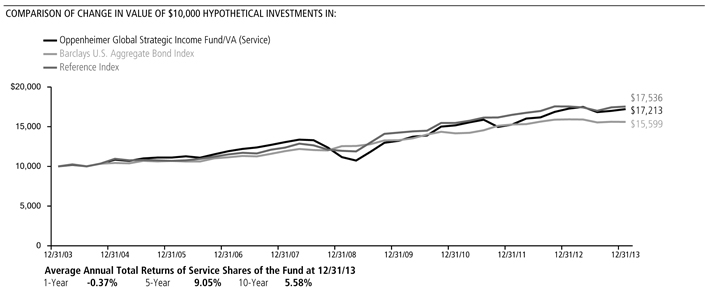
Performance data quoted represents past performance, which does not guarantee future results. The investment return and principal value of an investment in the Fund will fluctuate so that an investor’s shares, when redeemed, may be worth more or less than their original cost. Current performance may be lower or higher than the performance quoted. For performance data current to the most recent month end, call us at 1.800.988.8287. The Fund’s total returns should not be expected to be the same as the returns of other funds, whether or not both funds have the same portfolio managers and/or similar names. The Fund’s total returns include changes in share price and reinvested distributions but do not include the charges associated with the separate account products that offer this Fund. Such performance would have been lower if such charges were taken into account.
5 OPPENHEIMER GLOBAL STRATEGIC INCOME FUND/VA
Fund Expenses
Fund Expenses. As a shareholder of the Fund, you incur two types of costs: (1) transaction costs and (2) ongoing costs, including management fees; distribution and service fees; and other Fund expenses. These examples are intended to help you understand your ongoing costs (in dollars) of investing in the Fund and to compare these costs with the ongoing costs of investing in other mutual funds.
The examples are based on an investment of $1,000.00 invested at the beginning of the period and held for the entire 6-month period ended December 31, 2013.
Actual Expenses. The first section of the table provides information about actual account values and actual expenses. You may use the information in this section for the class of shares you hold, together with the amount you invested, to estimate the expense that you paid over the period. Simply divide your account value by $1,000.00 (for example, an $8,600.00 account value divided by $1,000.00 = 8.60), then multiply the result by the number in the first section under the heading entitled “Expenses Paid During Period” to estimate the expenses you paid on your account during this period.
Hypothetical Example for Comparison Purposes.
The second section of the table provides information about hypothetical account values and hypothetical expenses based on the Fund’s actual expense ratio for each class of shares, and an assumed rate of return of 5% per year for each class before expenses, which is not the actual return. The hypothetical account values and expenses may not be used to estimate the actual ending account balance or expenses you paid for the period. You may use this information to compare the ongoing costs of investing in the Fund and other funds. To do so, compare this 5% hypothetical example for the class of shares you hold with the 5% hypothetical examples that appear in the shareholder reports of the other funds.
Please note that the expenses shown in the table are meant to highlight your ongoing costs only and do not reflect any charges associated with the separate accounts that offer this Fund. Therefore, the “hypothetical” lines of the table are useful in comparing ongoing costs only, and will not help you determine the relative total costs of owning different funds. In addition, if these separate account charges were included your costs would have been higher.
| | | | | | | | | | | | |
| | | Beginning | | | Ending | | | Expenses | |
| | | Account | | | Account | | | Paid During | |
| | | Value | | | Value | | | 6 Months Ended | |
| Actual | | July 1, 2013 | | | December 31, 2013 | | | December 31, 2013 | |
Non-Service shares | | $ | 1,000.00 | | | $ | 1,022.80 | | | $ | 3.73 | |
Service shares | | | 1,000.00 | | | | 1,022.30 | | | | 5.01 | |
| | | |
| Hypothetical | | | | | | | | | |
(5% return before expenses) | | | | | | | | | | | | |
Non-Service shares | | | 1,000.00 | | | | 1,021.53 | | | | 3.73 | |
Service shares | | | 1,000.00 | | | | 1,020.27 | | | | 5.00 | |
Expenses are equal to the Fund’s annualized expense ratio for that class, multiplied by the average account value over the period, multiplied by 184/365 (to reflect the one-half year period). Those annualized expense ratios, excluding indirect expenses from affiliated funds, based on the 6-month period ended December 31, 2013 are as follows:
| | | | |
| Class | | Expense Ratios | |
Non-Service shares | | | 0.73% | |
Service shares | | | 0.98 | |
The expense ratios reflect contractual waivers and/or reimbursements of expenses by the Fund’s Manager. Some of these undertakings may be modified or terminated at any time, unless approved by the Board of Trustees. The “Financial Highlights” tables in the Fund’s financial statements, included in this report, also show the gross expense ratios, without such waivers or reimbursements and reduction to custodian expenses, if applicable.
6 OPPENHEIMER GLOBAL STRATEGIC INCOME FUND/VA
CONSOLIDATED STATEMENT OF INVESTMENTS December 31, 2013
| | | | | | | | | | |
| | | Principal Amount | | | Value | | | |
Asset-Backed Securities—3.0% | | | |
| American Credit Acceptance Receivables Trust: | | | |
| Series 2012-2, Cl. D, 5.91%, 7/15/191 | | $ | 2,100,000 | | | $ | 2,139,603 | | | |
| Series 2012-3, Cl. C, 2.78%, 9/17/181 | | | 230,000 | | | | 231,717 | | | |
| Series 2013-2, Cl. C, 3.96%, 5/15/191 | | | 2,051,000 | | | | 2,056,382 | | | |
| AmeriCredit Automobile Receivables Trust: | | | |
| Series 2012-3, Cl. D, 3.03%, 7/9/18 | | | 2,625,000 | | | | 2,681,220 | | | |
| Series 2012-3, Cl. E, 4.46%, 11/8/191 | | | 360,000 | | | | 374,876 | | | |
| Series 2012-4, Cl. D, 2.68%, 10/9/18 | | | 1,190,000 | | | | 1,201,055 | | | |
| Series 2013-1, Cl. D, 2.09%, 2/8/19 | | | 425,000 | | | | 422,385 | | | |
| Series 2013-1, Cl. E, 2.64%, 7/8/201 | | | 2,385,000 | | | | 2,341,644 | | | |
| Series 2013-2, Cl. D, 2.42%, 5/8/19 | | | 675,000 | | | | 670,469 | | | |
| Series 2013-2, Cl. E, 3.41%, 10/8/201 | | | 1,055,000 | | | | 1,070,229 | | | |
| Series 2013-3, Cl. D, 3.00%, 7/8/19 | | | 440,000 | | | | 442,608 | | | |
| Series 2013-3, Cl. E, 3.74%, 12/8/201 | | | 1,995,000 | | | | 2,006,709 | | | |
| Series 2013-5, Cl. D, 2.86%, 12/8/19 | | | 220,000 | | | | 219,488 | | | |
| Axius Europe CLO SA, Series 2007-1X, Cl. E, 4.82%, 11/15/232 | | | 212,712 | | | | 275,113 | | | |
| California Republic Auto Receivables Trust, Series 2013-2, Cl. C, 3.32%, 8/17/20 | | | 365,000 | | | | 361,775 | | | |
| Capital Auto Receivables Asset Trust: | | | |
| Series 2013-1, Cl. D, 2.19%, 9/20/21 | | | 275,000 | | | | 269,758 | | | |
| Series 2013-4, Cl. D, 3.22%, 5/20/19 | | | 170,000 | | | | 168,578 | | | |
| CPS Auto Receivables Trust, Series 2012-C, Cl. A, 1.82%, 12/16/191 | | | 143,438 | | | | 142,842 | | | |
| Credit Acceptance Auto Loan Trust, Series 2012-2A, Cl. B, 2.21%, 9/15/201 | | | 100,000 | | | | 100,560 | | | |
| DT Auto Owner Trust: | | | | | | | | | | |
| Series 2012-2A, Cl. D, 4.35%, 3/15/191 | | | 605,000 | | | | 623,998 | | | |
| Series 2013-1A, Cl. D, 3.74%, 5/15/201 | | | 7,285,000 | | | | 7,301,723 | | | |
| Series 2013-2A, Cl. D, 4.18%, 6/15/201 | | | 675,000 | | | | 678,088 | | | |
| Exeter Automobile Receivables Trust: | | | |
| Series 2012-2A, Cl. B, 2.22%, 12/15/171 | | | 875,000 | | | | 872,814 | | | |
| Series 2012-2A, Cl. C, 3.06%, 7/16/181 | | | 1,100,000 | | | | 1,093,733 | | | |
| Series 2013-2A, Cl. C, 4.35%, 1/15/191 | | | 635,000 | | | | 639,838 | | | |
| First Investors Auto Owner Trust: | | | | | | | | | | |
| Series 2012-1A, Cl. D, 5.65%, 4/15/181 | | | 285,000 | | | | 299,721 | | | |
| Series 2013-3A, Cl. C, 2.91%, 1/15/201 | | | 265,000 | | | | 263,312 | | | |
| Series 2013-3A, Cl. D, 3.67%, 5/15/201 | | | 195,000 | | | | 193,678 | | | |
| Halcyon Structured Asset Management European CLO BV, Series 2006-IIX, Cl. E, 4.19%, 1/25/232 | | | 1,405,000 | | | | 1,733,967 | | | |
| Harvest CLO IA SA: | | | | | | | | | | |
| Series I-X, Cl. C, 2.137%, 3/29/172 | | | 235,000 | | | | 320,891 | | | |
| Series I-X, Cl. D, 3.237%, 3/29/172 | | | 595,000 | | | | 798,417 | | | |
| Series I-X, Cl. E, 7.837%, 3/29/172 | | | 595,000 | | | | 798,363 | | | |
| Highlander Euro CDO II Cayman Ltd., Series 2006-2CX, Cl. E, 3.894%, 12/14/222 | | | 1,418,411 | | | | 1,804,570 | | | |
| ICE EM CLO: | | | | | | | | | | |
| Series 2007-1A, Cl. B, 2.096%, 8/15/222,3 | | | 7,870,000 | | | | 7,181,375 | | | |
| Series 2007-1A, Cl. C, 3.396%, 8/15/222,3 | | | 5,270,000 | | | | 4,439,975 | | | |
| Series 2007-1A, Cl. D, 5.396%, 8/15/222,3 | | | 5,270,000 | | | | 4,584,900 | | | |
| Santander Drive Auto Receivables Trust: | | | | | | | | | | |
| Series 2012-3, Cl. D, 3.64%, 5/15/18 | | | 880,000 | | | | 923,625 | | | |
| Series 2012-5, Cl. D, 3.30%, 9/17/18 | | | 3,160,000 | | | | 3,255,685 | | | |
| Series 2012-AA, Cl. D, 2.46%, 12/17/181 | | | 825,000 | | | | 823,921 | | | |
| Series 2013-1, Cl. D, 2.27%, 1/15/19 | | | 920,000 | | | | 910,384 | | | |
| Series 2013-2, Cl. D, 2.57%, 3/15/19 | | | 1,110,000 | | | | 1,105,619 | | | |
| Series 2013-3, Cl. D, 2.42%, 4/15/19 | | | 950,000 | | | | 940,171 | | | |
| Series 2013-4, Cl. D, 3.92%, 1/15/20 | | | 1,695,000 | | | | 1,759,212 | | | |
| Series 2013-5, Cl. D, 2.73%, 10/15/19 | | | 520,000 | | | | 515,722 | | | |
| Series 2013-A, Cl. C, 3.12%, 8/15/171 | | | 1,195,000 | | | | 1,226,598 | | | |
| SLM Private Credit Student Loan Trust, Series 2005-B, Cl. B, 0.643%, 6/15/392 | | | 1,979,802 | | | | 1,669,731 | | | |
| SNAAC Auto Receivables Trust: | | | | | | | | | | |
| Series 2012-1A, Cl. C, 4.38%, 6/15/171 | | | 50,000 | | | | 51,150 | | | |
| Series 2013-1A, Cl. B, 2.09%, 7/16/181 | | | 200,000 | | | | 199,540 | | | |
| Series 2013-1A, Cl. C, 3.07%, 8/15/181 | | | 220,000 | | | | 218,758 | | | |
| Stichting Halcyon Structured Asset Management European, Series 2007-IX, Cl. E, 4.134%, 7/24/232 | | | 706,933 | | | | 896,018 | | | |
| | | | | | | | |
| | | Principal Amount | | | Value | |
Asset-Backed Securities Continued | |
Theseus European CLO SA, Series 2006-1X, Cl. E, 4.343%, 8/27/222 | | $ | 1,490,000 | | | $ | 1,947,685 | |
United Auto Credit Securitization Trust: | | | | | | | | |
Series 2012-1, Cl. B, 1.87%, 9/15/151 | | | 335,000 | | | | 334,978 | |
Series 2012-1, Cl. C, 2.52%, 3/15/161 | | | 2,665,000 | | | | 2,664,286 | |
Series 2012-1, Cl. D, 3.12%, 3/15/181 | | | 1,690,000 | | | | 1,689,538 | |
Series 2013-1, Cl. B, 1.74%, 4/15/161 | | | 360,000 | | | | 359,637 | |
Series 2013-1, Cl. C, 2.22%, 12/15/171 | | | 230,000 | | | | 229,675 | |
Series 2013-1, Cl. D, 2.90%, 12/15/171 | | | 440,000 | | | | 439,135 | |
Total Asset-Backed Securities | | | | | | | | |
(Cost $73,095,539) | | | | | | | 72,967,442 | |
Mortgage-Backed Obligations—19.6% | |
Government Agency—4.7% | | | | | | | | |
FHLMC/FNMA/FHLB/Sponsored—4.6% | |
Federal Home Loan Mortgage Corp. Gold Pool: | | | | | |
5.00%, 9/1/33 | | | 666,856 | | | | 723,338 | |
5.50%, 9/1/39 | | | 802,713 | | | | 886,060 | |
6.00%, 5/1/18-11/1/21 | | | 220,793 | | | | 240,893 | |
6.50%, 3/1/18-8/1/32 | | | 896,984 | | | | 1,000,060 | |
7.00%, 10/1/31-10/1/37 | | | 185,512 | | | | 209,265 | |
7.50%, 1/1/32 | | | 485,061 | | | | 574,644 | |
Federal Home Loan Mortgage Corp., Interest-Only Stripped Mtg.-Backed Security: | |
Series 192, Cl. IO, 15.738%, 2/1/284 | | | 12,597 | | | | 2,238 | |
Series 205, Cl. IO, 18.403%, 9/1/294 | | | 73,229 | | | | 14,555 | |
Series 243, Cl. 6, 4.659%, 12/15/324 | | | 180,975 | | | | 27,866 | |
Federal Home Loan Mortgage Corp., Mtg.- Linked Amortizing Global Debt Securities, Series 2012-1, Cl. A10, 2.06%, 1/15/22 | | | 749,730 | | | | 756,949 | |
Federal Home Loan Mortgage Corp., Real Estate Mtg. | | | | | | | | |
Investment Conduit Multiclass Pass-Through Certificates: | | | | | | | | |
Series 1360, Cl. PZ, 7.50%, 9/15/22 | | | 523,619 | | | | 592,685 | |
Series 151, Cl. F, 9.00%, 5/15/21 | | | 12,498 | | | | 13,907 | |
Series 1674, Cl. Z, 6.75%, 2/15/24 | | | 366,812 | | | | 412,352 | |
Series 1897, Cl. K, 7.00%, 9/15/26 | | | 930,563 | | | | 1,057,852 | |
Series 2043, Cl. ZP, 6.50%, 4/15/28 | | | 359,907 | | | | 408,199 | |
Series 2106, Cl. FG, 0.617%, 12/15/282 | | | 630,572 | | | | 633,258 | |
Series 2122, Cl. F, 0.617%, 2/15/292 | | | 16,582 | | | | 16,654 | |
Series 2136, Cl. SG, 70.643%, 3/15/294 | | | 931,381 | | | | 162,238 | |
Series 2148, Cl. ZA, 6.00%, 4/15/29 | | | 438,361 | | | | 487,912 | |
Series 2195, Cl. LH, 6.50%, 10/15/29 | | | 268,287 | | | | 301,988 | |
Series 2326, Cl. ZP, 6.50%, 6/15/31 | | | 34,693 | | | | 39,243 | |
Series 2344, Cl. FP, 1.117%, 8/15/312 | | | 176,823 | | | | 180,484 | |
Series 2368, Cl. PR, 6.50%, 10/15/31 | | | 139,097 | | | | 157,409 | |
Series 2399, Cl. SG, 61.962%, 12/15/264 | | | 504,772 | | | | 89,883 | |
Series 2412, Cl. GF, 1.117%, 2/15/322 | | | 288,606 | | | | 294,582 | |
Series 2437, Cl. SB, 71.52%, 4/15/324 | | | 1,640,948 | | | | 306,203 | |
Series 2449, Cl. FL, 0.717%, 1/15/322 | | | 198,691 | | | | 200,374 | |
Series 2451, Cl. FD, 1.167%, 3/15/322 | | | 107,385 | | | | 109,782 | |
Series 2453, Cl. BD, 6.00%, 5/15/17 | | | 35,661 | | | | 37,875 | |
Series 2461, Cl. PZ, 6.50%, 6/1/32 | | | 499,544 | | | | 564,031 | |
Series 2464, Cl. FI, 1.167%, 2/15/322 | | | 89,611 | | | | 91,463 | |
Series 2470, Cl. AF, 1.167%, 3/15/322 | | | 184,246 | | | | 188,359 | |
Series 2470, Cl. LF, 1.167%, 2/15/322 | | | 91,704 | | | | 93,599 | |
Series 2471, Cl. FD, 1.167%, 3/15/322 | | | 138,247 | | | | 141,117 | |
Series 2477, Cl. FZ, 0.717%, 6/15/312 | | | 381,253 | | | | 384,455 | |
Series 2500, Cl. FD, 0.667%, 3/15/322 | | | 16,191 | | | | 16,289 | |
Series 2517, Cl. GF, 1.167%, 2/15/322 | | | 79,732 | | | | 81,380 | |
Series 2526, Cl. FE, 0.567%, 6/15/292 | | | 27,275 | | | | 27,330 | |
Series 2551, Cl. FD, 0.567%, 1/15/332 | | | 12,075 | | | | 12,102 | |
Series 2668, Cl. AZ, 4.00%, 9/15/18 | | | 71,869 | | | | 75,629 | |
Series 2676, Cl. KY, 5.00%, 9/15/23 | | | 1,591,604 | | | | 1,749,327 | |
Series 2707, Cl. QE, 4.50%, 11/15/18 | | | 244,748 | | | | 260,309 | |
Series 3025, Cl. SJ, 24.139%, 8/15/352 | | | 236,832 | | | | 363,743 | |
Series 3465, Cl. HA, 4.00%, 7/15/17 | | | 33,301 | | | | 34,092 | |
Series 3617, Cl. DC, 4.00%, 7/15/27 | | | 95,205 | | | | 96,957 | |
Series 3815, Cl. BD, 3.00%, 10/15/20 | | | 42,804 | | | | 44,267 | |
Series 3822, Cl. JA, 5.00%, 6/1/40 | | | 56,045 | | | | 59,007 | |
Series 3840, Cl. CA, 2.00%, 9/15/18 | | | 31,673 | | | | 32,330 | |
Series 3848, Cl. WL, 4.00%, 4/1/40 | | | 438,445 | | | | 454,103 | |
7 OPPENHEIMER GLOBAL STRATEGIC INCOME FUND/VA
CONSOLIDATED STATEMENT OF INVESTMENTS Continued
| | | | | | | | | | |
| | | Principal Amount | | | Value | | | |
| FHLMC/FNMA/FHLB/Sponsored Continued | | | |
| Federal Home Loan Mortgage Corp., Real Estate Mtg. Investment Conduit Multiclass Pass-Through Certificates: Continued | | | |
| Series 3917, Cl. BA, 4.00%, 6/15/38 | | $ | 365,624 | | | $ | 383,475 | | | |
| Series 4221, Cl. HJ, 1.50%, 7/15/23 | | | 464,977 | | | | 462,783 | | | |
| Federal Home Loan Mortgage Corp., Real Estate Mtg. Investment Conduit Multiclass Pass-Through Certificates, Interest-Only Stripped Mtg.-Backed Security: | | | |
| Series 2074, Cl. S, 56.928%, 7/17/284 | | | 19,600 | | | | 3,617 | | | |
| Series 2079, Cl. S, 64.602%, 7/17/284 | | | 36,014 | | | | 6,764 | | | |
| Series 2526, Cl. SE, 34.325%, 6/15/294 | | | 34,243 | | | | 6,430 | | | |
| Series 2682, Cl. TQ, 99.999%, 10/15/334 | | | 342,818 | | | | 68,552 | | | |
| Series 2795, Cl. SH, 14.324%, 3/15/244 | | | 766,200 | | | | 93,991 | | | |
| Series 2802, Cl. AS, 0.00%, 4/15/334,6 | | | 28,380 | | | | 381 | | | |
| Series 2920, Cl. S, 52.588%, 1/15/354 | | | 336,450 | | | | 53,886 | | | |
| Series 2922, Cl. SE, 6.586%, 2/15/354 | | | 58,209 | | | | 9,397 | | | |
| Series 2981, Cl. BS, 99.999%, 5/15/354 | | | 619,713 | | | | 119,142 | | | |
| Series 3201, Cl. SG, 6.325%, 8/15/364 | | | 307,853 | | | | 54,084 | | | |
| Series 3397, Cl. GS, 11.573%, 12/15/374 | | | 247,132 | | | | 44,179 | | | |
| Series 3424, Cl. EI, 0.00%, 4/15/384,5 | | | 169,868 | | | | 19,524 | | | |
| Series 3450, Cl. BI, 10.902%, 5/15/384 | | | 401,202 | | | | 60,515 | | | |
| Series 3606, Cl. SN, 4.259%, 12/15/394 | | | 124,122 | | | | 20,722 | | | |
| Series 3659, Cl. IE, 0.00%, 3/15/194,5 | | | 680,581 | | | | 56,701 | | | |
| Series 3685, Cl. EI, 0.00%, 3/15/194,5 | | | 553,513 | | | | 41,067 | | | |
| Federal National Mortgage Assn.: | | | |
| 2.50%, 1/1/297 | | | 7,120,000 | | | | 7,048,800 | | | |
| 3.00%, 1/1/297 | | | 4,245,000 | | | | 4,333,382 | | | |
| 3.50%, 1/1/29-1/1/447 | | | 23,945,000 | | | | 23,915,086 | | | |
| 4.00%, 1/1/29-1/1/447 | | | 28,205,000 | | | | 29,106,886 | | | |
| 4.50%, 1/1/29-1/1/447 | | | 18,070,000 | | | | 19,162,703 | | | |
| 5.00%, 1/1/44 | | | 18,837 | | | | 20,091 | | | |
| 5.00%, 1/1/447 | | | 2,435,000 | | | | 2,644,829 | | | |
| 6.00%, 1/1/447 | | | 4,305,000 | | | | 4,775,524 | | | |
| Federal National Mortgage Assn. Pool: | | | |
| 2.563%, 10/1/362 | | | 2,875,087 | | | | 3,051,229 | | | |
| 3.50%, 2/1/22 | | | 421,472 | | | | 443,206 | | | |
| 5.00%, 2/1/18-7/1/33 | | | 2,717,933 | | | | 2,916,519 | | | |
| 5.50%, 4/1/21-5/1/36 | | | 480,522 | | | | 528,667 | | | |
| 6.00%, 10/1/16-1/1/19 | | | 168,629 | | | | 176,897 | | | |
| 6.50%, 4/1/17-1/1/34 | | | 1,196,816 | | | | 1,343,263 | | | |
| 7.00%, 11/1/17-6/1/34 | | | 1,381,986 | | | | 1,578,921 | | | |
| 7.50%, 2/1/27-3/1/33 | | | 1,605,265 | | | | 1,841,584 | | | |
| 8.50%, 7/1/32 | | | 2,249 | | | | 2,611 | | | |
| Federal National Mortgage Assn., Interest-Only Stripped Mtg.-Backed Security: | | | |
| Series 214, Cl. 2, 47.177%, 3/1/234 | | | 214,883 | | | | 48,850 | | | |
| Series 221, Cl. 2, 50.611%, 5/1/234 | | | 26,428 | | | | 6,072 | | | |
| Series 254, Cl. 2, 39.966%, 1/1/244 | | | 427,885 | | | | 101,445 | | | |
| Series 301, Cl. 2, 5.366%, 4/1/294,5 | | | 80,280 | | | | 18,827 | | | |
| Series 302, Cl. 2, 6.00%, 5/1/294 | | | 187 | | | | 37 | | | |
| Series 313, Cl. 2, 20.39%, 6/1/314 | | | 776,050 | | | | 141,040 | | | |
| Series 319, Cl. 2, 22.896%, 2/1/324,5 | | | 377,718 | | | | 72,180 | | | |
| Series 321, Cl. 2, 9.975%, 4/1/324 | | | 111,678 | | | | 20,917 | | | |
| Series 324, Cl. 2, 3.973%, 7/1/324,5 | | | 113,329 | | | | 27,622 | | | |
| Series 328, Cl. 2, 4.371%, 12/1/324 | | | 242,162 | | | | 37,646 | | | |
| Series 331, Cl. 5, 4.06%, 2/1/334,5 | | | 441,441 | | | | 88,430 | | | |
| Series 332, Cl. 2, 7.488%, 3/1/334 | | | 1,892,361 | | | | 378,677 | | | |
| Series 334, Cl. 12, 2.413%, 3/1/334,5 | | | 368,388 | | | | 71,392 | | | |
| Series 339, Cl. 15, 4.812%, 8/1/334,5 | | | 1,136,755 | | | | 242,072 | | | |
| Series 345, Cl. 9, 0.00%, 1/1/344, 6 | | | 302,040 | | | | 60,741 | | | |
| Series 351, Cl. 10, 3.358%, 4/1/344,5 | | | 218,959 | | | | 41,071 | | | |
| Series 351, Cl. 8, 3.048%, 4/1/344,5 | | | 370,893 | | | | 70,035 | | | |
| Series 356, Cl. 10, 1.943%, 6/1/354,5 | | | 274,980 | | | | 51,931 | | | |
| Series 356, Cl. 12, 1.68%, 2/1/354,5 | | | 135,302 | | | | 25,460 | | | |
| Series 362, Cl. 13, 3.604%, 8/1/354,5 | | | 174,304 | | | | 33,088 | | | |
| Federal National Mortgage Assn., Real Estate Mtg. Investment Conduit Multiclass Pass-Through Certificates: | | | |
| Series 1999-54, Cl. LH, 6.50%, 11/25/29 | | | 241,967 | | | | 269,525 | | | |
| Series 2001-51, Cl. OD, 6.50%, 10/25/31 | | | 135,909 | | | | 151,030 | | | |
| Series 2001-69, Cl. PF, 1.165%, 12/25/312 | | | 209,260 | | | | 213,589 | | | |
| Series 2001-80, Cl. ZB, 6.00%, 1/25/32 | | | 244,137 | | | | 268,461 | | | |
| Series 2002-12, Cl. PG, 6.00%, 3/25/17 | | | 114,551 | | | | 121,057 | | | |
| Series 2002-29, Cl. F, 1.165%, 4/25/322 | | | 95,527 | | | | 97,532 | | | |
| Series 2002-60, Cl. FH, 1.165%, 8/25/322 | | | 190,685 | | | | 194,739 | | | |
| | | | | | | | | | |
| | | | | | | | | | |
| | | | | | | | | | |
| | | | | | | | | | |
| | | | | | | | | | |
| | | | | | | | |
| | | Principal Amount | | | Value | |
| FHLMC/FNMA/FHLB/Sponsored Continued | |
| Federal National Mortgage Assn., Real Estate Mtg. Investment Conduit Multiclass Pass-Through Certificates: Continued | |
| Series 2002-64, Cl. FJ, 1.165%, 4/25/322 | | $ | 29,416 | | | | $ 30,033 | |
| Series 2002-68, Cl. FH, 0.665%, 10/18/322 | | | 64,805 | | | | 65,223 | |
| Series 2002-84, Cl. FB, 1.165%, 12/25/322 | | | 428,386 | | | | 437,430 | |
| Series 2002-9, Cl. PC, 6.00%, 3/25/17 | | | 114,465 | | | | 120,906 | |
| Series 2002-9, Cl. PR, 6.00%, 3/25/17 | | | 140,157 | | | | 148,044 | |
| Series 2002-90, Cl. FH, 0.665%, 9/25/322 | | | 239,682 | | | | 241,286 | |
| Series 2003-11, Cl. FA, 1.165%, 9/25/322 | | | 428,396 | | | | 437,441 | |
| Series 2003-112, Cl. AN, 4.00%, 11/25/18 | | | 153,073 | | | | 161,334 | |
| Series 2003-116, Cl. FA, 0.565%, 11/25/332 | | | 42,164 | | | | 42,245 | |
| Series 2003-119, Cl. FK, 0.665%, 5/25/182 | | | 883,787 | | | | 886,664 | |
| Series 2003-13, Cl. IO, 14.851%, 3/25/334 | | | 311,995 | | | | 73,677 | |
| Series 2003-84, Cl. GE, 4.50%, 9/25/18 | | | 66,022 | | | | 70,030 | |
| Series 2004-101, Cl. BG, 5.00%, 1/25/20 | | | 491,652 | | | | 516,043 | |
| Series 2004-25, Cl. PC, 5.50%, 1/25/34 | | | 133,000 | | | | 142,675 | |
| Series 2005-109, Cl. AH, 5.50%, 12/25/25 | | | 1,974,107 | | | | 2,183,241 | |
| Series 2005-31, Cl. PB, 5.50%, 4/25/35 | | | 560,000 | | | | 619,105 | |
| Series 2005-71, Cl. DB, 4.50%, 8/25/25 | | | 294,246 | | | | 319,496 | |
| Series 2006-11, Cl. PS, 23.963%, 3/25/362 | | | 194,823 | | | | 299,762 | |
| Series 2006-46, Cl. SW, 23.596%, 6/25/362 | | | 350,604 | | | | 540,774 | |
| Series 2006-90, Cl. SX, 99.999%, 9/25/364 | | | 928,466 | | | | 196,267 | |
| Series 2007-109, Cl. NF, 0.715%, 12/25/372 | | | 474,764 | | | | 479,224 | |
| Series 2008-14, Cl. BA, 4.25%, 3/25/23 | | | 273,710 | | | | 289,399 | |
| Series 2009-114, Cl. AC, 2.50%, 12/25/23 | | | 129,710 | | | | 132,747 | |
| Series 2009-36, Cl. FA, 1.105%, 6/25/372 | | | 129,967 | | | | 131,238 | |
| Series 2009-70, Cl. NT, 4.00%, 8/25/19 | | | 28,291 | | | | 29,734 | |
| Series 2009-70, Cl. TL, 4.00%, 8/25/19 | | | 825,487 | | | | 867,589 | |
| Series 2010-43, Cl. KG, 3.00%, 1/25/21 | | | 293,485 | | | | 305,483 | |
| Series 2011-122, Cl. EC, 1.50%, 1/25/20 | | | 384,534 | | | | 388,952 | |
| Series 2011-15, Cl. DA, 4.00%, 3/25/41 | | | 299,970 | | | | 315,394 | |
| Series 2011-3, Cl. KA, 5.00%, 4/25/40 | | | 409,294 | | | | 445,471 | |
| Series 2011-38, Cl. AH, 2.75%, 5/25/20 | | | 34,075 | | | | 35,221 | |
| Series 2011-6, Cl. BA, 2.75%, 6/25/20 | | | 411,934 | | | | 426,208 | |
| Series 2011-69, Cl. EA, 3.00%, 11/25/29 | | | 319,874 | | | | 328,257 | |
| Series 2011-82, Cl. AD, 4.00%, 8/25/26 | | | 588,066 | | | | 620,158 | |
| Series 2012-20, Cl. FD, 0.565%, 3/25/422 | | | 910,554 | | | | 909,096 | |
| Federal National Mortgage Assn., Real Estate Mtg. Investment Conduit Multiclass Pass-Through Certificates, Interest-Only Stripped Mtg.-Backed Security: | |
| Series 2001-61, Cl. SH, 25.875%, 11/18/314 | | | 105,662 | | | | 18,931 | |
| Series 2001-63, Cl. SD, 30.774%, 12/18/314 | | | 29,756 | | | | 5,236 | |
| Series 2001-68, Cl. SC, 19.993%, 11/25/314 | | | 18,692 | | | | 3,486 | |
| Series 2001-81, Cl. S, 24.231%, 1/25/324 | | | 23,053 | | | | 4,509 | |
| Series 2002-28, Cl. SA, 34.36%, 4/25/324 | | | 16,980 | | | | 3,119 | |
| Series 2002-38, Cl. SO, 47.308%, 4/25/324 | | | 100,794 | | | | 20,819 | |
| Series 2002-48, Cl. S, 30.046%, 7/25/324 | | | 25,715 | | | | 4,861 | |
| Series 2002-52, Cl. SL, 32.897%, 9/25/324 | | | 17,063 | | | | 3,228 | |
| Series 2002-56, Cl. SN, 31.498%, 7/25/324 | | | 35,336 | | | | 6,686 | |
| Series 2002-77, Cl. IS, 44.355%, 12/18/324 | | | 171,724 | | | | 35,556 | |
| Series 2002-77, Cl. SH, 36.434%, 12/18/324 | | | 35,435 | | | | 6,768 | |
| Series 2002-9, Cl. MS, 26.172%, 3/25/324 | | | 31,569 | | | | 5,539 | |
| Series 2003-26, Cl. DI, 16.06%, 4/25/334 | | | 245,059 | | | | 58,724 | |
| Series 2003-33, Cl. SP, 26.064%, 5/25/334 | | | 191,307 | | | | 41,785 | |
| Series 2003-38, Cl. SA, 10.617%, 3/25/234,5 | | | 208,016 | | | | 18,994 | |
| Series 2003-4, Cl. S, 27.936%, 2/25/334 | | | 58,192 | | | | 10,903 | |
| Series 2004-56, Cl. SE, 31.60%, 10/25/334 | | | 926,414 | | | | 150,895 | |
| Series 2005-12, Cl. SC, 10.362%, 3/25/354 | | | 29,256 | | | | 6,413 | |
| Series 2005-14, Cl. SE, 36.345%, 3/25/354 | | | 1,013,222 | | | | 155,275 | |
| Series 2005-40, Cl. SA, 49.005%, 5/25/354 | | | 885,840 | | | | 166,913 | |
| Series 2005-40, Cl. SB, 65.041%, 5/25/354 | | | 1,413,854 | | | | 298,191 | |
| Series 2005-52, Cl. JH, 5.497%, 5/25/354 | | | 492,526 | | | | 89,532 | |
| Series 2005-63, Cl. SA, 46.597%, 10/25/314 | | | 51,212 | | | | 8,663 | |
| Series 2007-88, Cl. XI, 26.054%, 6/25/374 | | | 1,311,737 | | | | 178,430 | |
| Series 2008-55, Cl. SA, 0.00%, 7/25/384,5 | | | 147,547 | | | | 20,711 | |
8 OPPENHEIMER GLOBAL STRATEGIC INCOME FUND/VA
| | | | | | | | | | |
| | | Principal Amount | | | Value | | | |
| FHLMC/FNMA/FHLB/Sponsored Continued | | | |
| Federal National Mortgage Assn., Real Estate Mtg. Investment Conduit Multiclass Pass-Through Certificates, Interest-Only Stripped Mtg.-Backed Security: Continued | | | |
| Series 2009-8, Cl. BS, 0.00%, 2/25/244,5 | | $ | 236,298 | | | $ | 20,615 | | | |
| Series 2010-95, Cl. DI, 0.00%, 11/25/204,5 | | | 881,476 | | | | 71,572 | | | |
| Series 2012-40, Cl. PI, 3.006%, 4/25/414 | | | 1,757,371 | | | | 338,131 | | | |
| | | | | | | 136,947,843 | | | |
| GNMA/Guaranteed—0.1% | | | |
| Government National Mortgage Assn. I Pool: | | | |
| 7.00%, 3/15/28-7/15/28 | | | 166,392 | | | | 185,491 | | | |
| 7.50%, 2/15/27 | | | 10,013 | | | | 10,836 | | | |
| 8.00%, 11/15/25-5/15/26 | | | 34,506 | | | | 34,860 | | | |
| Government National Mortgage Assn. II | | | |
| Pool, 1.625%, 11/20/252 | | | 4,206 | | | | 4,365 | | | |
| Government National Mortgage Assn., Interest-Only Stripped Mtg.-Backed Security: | | | |
| Series 1998-6, Cl. SA, 59.892%, 3/16/284 | | | 45,988 | | | | 9,306 | | | |
| Series 2007-17, Cl. AI, 14.032%, 4/16/374 | | | 419,189 | | | | 69,677 | | | |
| Series 2011-52, Cl. HS, 8.659%, 4/16/414 | | | 714,614 | | | | 122,348 | | | |
| Government National Mortgage Assn., Real Estate Mtg. Investment Conduit Multiclass Pass-Through Certificates: | | | |
| Series 1999-32, Cl. ZB, 8.00%, 9/1/29 | | | 683,152 | | | | 816,782 | | | |
| Series 2000-12, Cl. ZA, 8.00%, 2/16/30 | | | 1,500,651 | | | | 1,769,433 | | | |
| | | | | | | 3,023,098 | | | |
| Non-Agency—14.9% | | | | | | | | | | |
| Commercial—12.0% | | | | | | | | | | |
| Banc of America Commercial Mortgage Trust: | | | |
| Series 2006-3, Cl. AM, 5.859%, 7/10/442 | | | 4,242,000 | | | | 4,329,686 | | | |
| Series 2006-5, Cl. AM, 5.448%, 9/10/47 | | | 6,055,000 | | | | 6,491,832 | | | |
| Series 2007-5, Cl. AM, 5.772%, 2/10/512 | | | 8,090,000 | | | | 8,672,593 | | | |
| BCAP LLC Trust: | | | | | | | | | | |
| Series 2012-RR2, Cl. 6A3, 2.774%, 9/26/351,2 | | | 577,030 | | | | 583,902 | | | |
| Series 2012-RR6, 2.404%, 11/26/361 | | | 406,363 | | | | 408,524 | | | |
| Series 2013-RR2, Cl. 5A2, 2.709%, 3/26/361,2 | | | 7,586,757 | | | | 6,088,205 | | | |
| Bear Stearns Commercial Mortgage Securities Trust: | | | |
| Series 2006-PW13, Cl. AJ, 5.611%, 9/11/412 | | | 8,145,000 | | | | 8,306,768 | | | |
| Series 2007-PW17, Cl. AJ, 5.887%, 6/1/502 | | | 7,400,000 | | | | 7,206,224 | | | |
| Series 2007-T26, Cl. AJ, 5.566%, 1/12/452 | | | 6,183,000 | | | | 5,952,937 | | | |
| CHL Mortgage Pass-Through Trust, Series 2005-HYB8, Cl. 4A1, 4.437%, 12/20/352 | | | 119,456 | | | | 102,665 | | | |
| Citigroup Commercial Mortgage Trust: | | | |
| Series 2008-C7, Cl. AM, 6.132%, 12/1/492 | | | 3,005,000 | | | | 3,338,693 | | | |
| Series 20113-GCJ11, 4.607%, 4/10/461 | | | 3,125,000 | | | | 2,704,317 | | | |
| Citigroup Mortgage Loan Trust, Inc.: | | | |
| Series 2009-8, Cl. 7A2, 2.628%, 3/25/361,2 | | | 10,474,197 | | | | 9,344,456 | | | |
| Series 2012-8, Cl. 1A1, 2.66%, 10/25/351,2 | | | 984,210 | | | | 987,478 | | | |
| COMM Mortgage Trust: | | | | | | | |
| Series 2012-CR4, Cl. D, 4.577%, 10/15/451,2 | | | 70,000 | | | | 62,456 | | | |
| Series 2012-CR5, Cl. E, 4.335%, 12/10/451,2 | | | 2,970,000 | | | | 2,595,988 | | | |
| Series 2012-CR5, Cl. XA, 2.788%, 12/10/454 | | | 3,526,273 | | | | 371,186 | | | |
| Series 2013-CR11, Cl. C, 5.173%, 10/10/461,2 | | | 2,180,000 | | | | 2,173,250 | | | |
| Series 2013-CR6, Cl. D, 4.176%, 3/10/461,2 | | | 1,525,000 | | | | 1,288,675 | | | |
| Series 2013-CR7, Cl. D, 4.36%, 3/10/461,2 | | | 3,245,000 | | | | 2,711,861 | | | |
| Series 2013-CR9, Cl. D, 4.261%, 7/10/451,2 | | | 2,685,000 | | | | 2,280,042 | | | |
| Series 2013-LC13, Cl. C, 5.05%, 8/10/461,2 | | | 1,155,000 | | | | 1,167,794 | | | |
| Series 2013-LC13, Cl. D, 5.05%, 8/10/461,2 | | | 2,314,000 | | | | 2,082,762 | | | |
| COMM Mortgage Trust, Interest-Only Stripped Mtg.-Backed Security, Series 2010- C1, Cl. XPA, 0.00%, 7/10/461,4,5 | | | 4,820,380 | | | | 192,109 | | | |
| Countrywide Alternative Loan Trust, Series 2006-J2, Cl. A7, 6%, 4/25/36 | | | 490,627 | | | | 444,279 | | | |
| Countrywide Home Loans: | | | | | | | |
| Series 2005-17, Cl. 1A8, 5.50%, 9/25/35 | | | 1,937,839 | | | | 1,932,704 | | | |
| Series 2007-J3, Cl. A9, 6.00%, 7/1/37 | | | 4,723,699 | | | | 4,117,738 | | | |
| | | | | | | | |
| | | Principal Amount | | | Value | |
Commercial Continued | |
| Credit Suisse Commercial Mortgage Trust: | |
| Series 2006-C1, Cl. AJ, 5.465%, 2/15/392 | | $ | 695,000 | | | | $ 739,247 | |
| Series 2006-C4, Cl. AM, 5.509%, 9/15/39 | | | 4,315,000 | | | | 4,641,516 | |
| Credit Suisse First Boston Commercial Trust, Series 2005-C6, Cl. AJ, 5.23%, 12/15/402 | | | 600,000 | | | | 634,281 | |
| DBUBS Mortgage Trust, Series 2011-LC1A, Cl. E, 5.557%, 11/10/461,2 | | | 100,000 | | | | 102,351 | |
| Deutsche Alt-B Securities, Inc. Mortgage Loan Trust: | |
| Series 2006-AB2, Cl. A1, 5.888%, 6/25/362 | | | 100,251 | | | | 76,312 | |
| Series 2006-AB4, Cl. A1A, 6.005%, | |
| 10/25/362 | | | 492,296 | | | | 369,246 | |
| Deutsche Mortgage Securities, Inc., Series 2013-RS1, Cl. 1A2, 0.387%, 7/22/362,3 | | | 5,060,144 | | | | 3,895,780 | |
| EverBank Mortgage Loan Trust, Series 2013-1, Cl. A1, 2.25%, 3/25/431,2 | | | 1,184,798 | | | | 1,055,003 | |
| First Horizon Alternative Mortgage Securities Trust: | |
| Series 2005-FA8, Cl. 1A6, 0.815%, 11/25/352 | | | 4,231,787 | | | | 3,212,637 | |
| Series 2005-FA9, Cl. A4A, 5.50%, 12/25/35 | | | 1,625,459 | | | | 1,437,473 | |
| Series 2007-FA2, Cl. 1A1, 5.50%, 4/1/37 | | | 1,249,325 | | | | 931,082 | |
| Series 2007-FA4, Cl. 1A6, 6.25%, 8/25/372 | | | 4,952,131 | | | | 4,150,302 | |
| FREMF Mortgage Trust: | | | | | | | | |
| Series 2013-K25, Cl. C, 3.618%, 11/25/451,2 | | | 2,000,077 | | | | 1,673,675 | |
| Series 2013-K26, Cl. C, 3.60%, 12/25/451,2 | | | 1,040,000 | | | | 870,184 | |
| Series 2013-K27, Cl. C, 3.497%, 1/25/461,2 | | | 1,630,000 | | | | 1,349,422 | |
| Series 2013-K28, Cl. C, 3.494%, 6/25/461,2 | | | 1,605,000 | | | | 1,308,426 | |
| Series 2013-K712, Cl. C, 3.367%, 5/25/451,2 | | | 240,000 | | | | 216,540 | |
| Series 2013-K713, Cl. C, 3.165%, 4/25/461,2 | | | 740,000 | | | | 654,769 | |
| GCCFC Commercial Mortgage Trust: | |
| Series 2006-GG7, Cl. AJ, 5.82%, 7/10/382 | | | 4,659,688 | | | | 4,797,978 | |
| Series 2007-GG9, Cl. AM, 5.475%, 3/10/39 | | | 6,035,000 | | | | 6,437,685 | |
| GE Capital Commercial Mortgage Corp., Series 2005-C4, Cl. AJ, 5.311%, 11/10/452 | | | 6,510,000 | | | | 6,344,177 | |
| GSR Mortgage Loan Trust, Series 2005- AR4, Cl. 6A1, 5.221%, 7/25/352 | | | 43,064 | | | | 42,693 | |
| IM Pastor 4 Fondo de Titulizacion de Activos, Series 4, Cl. A, 0.433%, 3/22/442 | | | 209,762 | | | | 227,112 | |
| JP Morgan Chase Commercial Mortgage Securities Trust: | |
| Series 2006-CB16, Cl. AJ, 5.623%, 5/12/45 | | | 2,695,000 | | | | 2,639,146 | |
| Series 2006-LDP7, Cl. AJ, 5.863%, 4/15/452 | | | 1,075,000 | | | | 1,082,463 | |
| Series 2006-LDP8, Cl. AJ, 5.48%, 5/15/452 | | | 8,870,000 | | | | 9,260,706 | |
| Series 2007-CB18, Cl. AJ, 5.502%, 6/12/472 | | | 8,281,000 | | | | 7,835,337 | |
| Series 2007-CB19, Cl. AM, 5.706%, 2/12/492 | | | 5,850,000 | | | | 6,296,528 | |
| Series 2013-C10, Cl. C, 4.161%, 12/15/472 | | | 3,025,000 | | | | 2,870,905 | |
| Series 2013-C10, Cl. D, 4.161%, 12/15/472 | | | 3,420,000 | | | | 2,909,762 | |
| JPMBB Commercial Mortgage Securities Trust, Series 2013-C14, Cl. D, 4.561%, 8/15/461,2 | | | 2,500,000 | | | | 2,183,166 | |
| JPMorgan Re-Securitization Trust, Series 2009-5, Cl. 1A2, 2.612%, 7/26/361,2 | | | 5,201,231 | | | | 4,025,847 | |
| Merrill Lynch Mortgage Trust, Series 2006- C1, Cl. AJ, 5.676%, 5/12/392 | | | 6,860,000 | | | | 6,915,154 | |
| ML-CFC Commercial Mortgage Trust, Series 2006-3, Cl. AJ, 5.485%, 7/12/462 | | | 5,820,000 | | | | 5,707,229 | |
| Morgan Stanley Bank of America Merrill Lynch Trust: | |
| Series 2012-C6, Cl. E, 4.664%, 11/15/451,2 | | | 2,290,000 | | | | 2,056,474 | |
| Series 2013-C12, Cl. C, 4.771%, 10/15/462 | | | 2,195,000 | | | | 2,148,724 | |
| Series 2013-C12, Cl. D, 4.771%, 10/15/461,2 | | | 2,370,000 | | | | 2,087,360 | |
| Series 2013-C7, Cl. D, 4.304%, 2/15/461,2 | | | 4,250,000 | | | | 3,680,759 | |
| Series 2013-C8, Cl. D, 4.172%, 12/15/481,2 | | | 2,020,000 | | | | 1,717,668 | |
| Morgan Stanley Capital I Trust: | | | | | | | | |
| Series 2006-HQ10, Cl. AJ, 5.389%, 11/12/412 | | | 3,975,000 | | | | 4,020,571 | |
9 OPPENHEIMER GLOBAL STRATEGIC INCOME FUND/VA
CONSOLIDATED STATEMENT OF INVESTMENTS Continued
| | | | | | | | | | |
| | | Principal Amount | | | Value | | | |
| | | |
| Commercial Continued | | | | | | | | | | |
| | | |
| Morgan Stanley Capital I Trust: Continued | | | |
| Series 2006-HQ10, Cl. AM, 5.36%, 11/12/41 | | $ | 8,500,000 | | | $ | 9,334,985 | | | |
| Series 2007-HQ11, Cl. AJ, 5.508%, 2/12/442 | | | 2,115,000 | | | | 2,242,874 | | | |
| Series 2007-IQ13, Cl. AM, 5.406%, 3/15/44 | | | 765,000 | | | | 833,111 | | | |
| Series 2007-IQ15, Cl. AM, 5.91%, 6/1/492 | | | 5,875,000 | | | | 6,338,831 | | | |
| | | |
| Morgan Stanley Re-Remic Trust, Re- Securitization Real Estate Mtg. Investment Conduit Multiclass Pass-Through Certificates, Series 2012-R3, Cl. 1A, 2.065%, 11/26/361,2 | | | 39,696 | | | | 39,539 | | | |
| | | |
| RALI Trust, Series 2005-QA4, Cl. A32, 3.176%, 4/25/352 | | | 82,157 | | | | 11,000 | | | |
| | | |
| Residential Asset Securitization Trust, Series 2006-A12, Cl. A1, 6.25%, 11/1/36 | | | 549,509 | | | | 416,444 | | | |
| | | |
| Sequoia Mortgage Trust, Series 2012-2, Cl. A2, 3.50%, 4/25/422 | | | 219,303 | | | | 220,867 | | | |
| | | |
| STARM Mortgage Loan Trust, Series 2007- 1, Cl. 2A1, 4.422%, 2/25/372 | | | 6,123,086 | | | | 5,125,415 | | | |
| | | |
| Structured Adjustable Rate Mortgage Loan Trust: | | | |
| Series 2004-10, Cl. 2A, 2.394%, 8/25/342 | | | 6,870,756 | | | | 6,686,946 | | | |
| Series 2006-4, Cl. 6A, 5.09%, 5/25/362 | | | 1,774,379 | | | | 1,497,310 | | | |
| Series 2007-6, Cl. 3A1, 4.701%, 7/25/372 | | | 5,320,660 | | | | 4,195,133 | | | |
| | | |
| UBS-Barclays Commercial Mortgage Trust: | | | |
| Series 2012-C2, Cl. E, 4.891%, 5/1/631,2 | | | 3,450,000 | | | | 3,054,954 | | | |
| Series 2013-C5, Cl. D, 4.095%, 3/10/461,2 | | | 4,200,000 | | | | 3,496,565 | | | |
| | | |
| Wachovia Bank Commercial Mortgage Trust: | | | |
| Series 2006-C25, Cl. AJ, 5.724%, 5/15/432 | | | 5,315,000 | | | | 5,542,843 | | | |
| Series 2007-C30, Cl. AM, 5.383%, 12/15/43 | | | 5,900,000 | | | | 6,361,333 | | | |
| | | |
| Washington Mutual Mortgage Pass-Through Certificates Trust, Series 2007- OA3, Cl. 5A, 2.213%, 4/25/472 | | | 582,995 | | | | 412,473 | | | |
| | | |
| Wells Fargo Mortgage Backed Securities Trust: | | | |
| Series 2004-W, Cl. B2, 2.615%, 11/25/342 | | | 133,822 | | | | 4,783 | | | |
| Series 2006-8, Cl. A15, 6.00%, 7/25/36 | | | 2,979,983 | | | | 2,890,089 | | | |
| | | |
| Wells Fargo Mortgage-Backed Securities Trust: | | | |
| Series 2005-AR1, Cl. 1A1, 2.61%, 2/25/352 | | | 2,725,130 | | | | 2,724,942 | | | |
| Series 2005-AR15, Cl. 1A6, 2.607%, 9/25/352 | | | 5,519,162 | | | | 5,183,514 | | | |
| Series 2006-AR7, Cl. 2A4, 2.616%, 5/1/362 | | | 2,163,453 | | | | 2,019,293 | | | |
| Series 2007-AR3, Cl. A4, 5.646%, 4/25/372 | | | 1,390,150 | | | | 1,331,095 | | | |
| | | |
| WF-RBS Commercial Mortgage Trust: | | | |
| Series 2012-C10, Cl. D, 4.46%, 12/15/451,2 | | | 105,000 | | | | 91,011 | | | |
| Series 2012-C7, Cl. E, 4.848%, 6/15/451,2 | | | 2,040,000 | | | | 1,858,032 | | | |
| Series 2012-C8, Cl. E, 4.878%, 8/15/451,2 | | | 2,275,000 | | | | 2,089,684 | | | |
| Series 2013-C11, Cl. D, 4.184%, 3/15/451,2 | | | 1,168,000 | | | | 996,923 | | | |
| Series 2013-C15, Cl. D, 4.486%, 8/15/461,2 | | | 3,150,000 | | | | 2,692,833 | | | |
| | | |
| WF-RBS Commercial Mortgage Trust, Interest-Only Commercial Mtg. Pass-Through Certificates, Series 2011-C3, Cl. XA, 1.418%, 3/15/441,4 | | | 5,899,396 | | | | 399,150 | | | |
| | | | | | | | | | |
| | | | | | | 276,636,786 | | | |
| | | |
| Multi-Family—0.8% | | | | | | | | | | |
| | | |
| Banc of America Commercial Mortgage Trust, Series 2006-2, Cl. AJ, 5.769%, 5/10/452 | | | 4,295,000 | | | | 4,491,915 | | | |
| | | |
| Citigroup Mortgage Loan Trust, Inc., Series 2006-AR3, Cl. 1A2A, 5.432%, 6/25/362 | | | 4,054,516 | | | | 3,727,203 | | | |
| | | |
| Countrywide Alternative Loan Trust, Series 2006-24CB, Cl. A12, 5.75%, 6/25/36 | | | 1,576,976 | | | | 1,336,696 | | | |
| | | |
| JP Morgan Mortgage Trust, Series 2007-A3, Cl. 3A2M, 4.713%, 5/1/372 | | | 3,169,868 | | | | 3,064,042 | | | |
| | | |
| Wells Fargo Mortgage-Backed Securities Trust: | | | |
| Series 2005-AR15, Cl. 1A2, 2.607%, 9/25/352 | | | 294,330 | | | | 286,953 | | | |
| | | | | | | | |
| | | Principal Amount | | | Value | |
| |
| Multi-Family Continued | | | | | | | | |
| |
| Wells Fargo Mortgage-Backed Securities Trust: Continued | |
| Series 2006-AR2, Cl. 2A3, 2.628%, 3/25/362 | | $ | 4,482,615 | | | $ | 4,439,575 | |
| | | | | | | | |
| | | | | | | 17,346,384 | |
| |
| Residential—2.1% | | | | | | | | |
| |
| Argent Securities, Inc., Series 2004-W8, Cl. A2, 1.125%, 5/25/342 | | | $826,621 | | | | 799,524 | |
| |
| Banc of America Commercial Mortgage Trust, Series 2007-4, Cl. AM, 5.813%, 2/1/512 | | | 3,560,000 | | | | 3,934,403 | |
| |
| Banc of America Funding Trust: | |
| Series 2007-1, Cl. 1A3, 6.00%, 1/25/37 | | | 1,622,755 | | | | 1,431,369 | |
| Series 2007-C, Cl. 1A4, 5.359%, 5/20/362 | | | 1,450,729 | | | | 1,395,440 | |
| |
| Bear Stearns Adjustable Rate Mortgage Trust, Series 2004-2, Cl. 12A2, 2.728%, 5/1/342 | | | 1,923,457 | | | | 1,889,518 | |
| |
| CD Commercial Mortgage Trust, Series 2007-CD4, Cl. AMFX, 5.366%, 12/11/492 | | | 8,565,000 | | | | 8,874,877 | |
| |
| Citigroup Mortgage Loan Trust, Inc.: | |
| Series 2005-2, Cl. 1A3, 2.68%, 5/25/352 | | | 1,846,501 | | | | 1,808,408 | |
| Series 2005-3, Cl. 2A4, 2.723%, 8/25/352 | | | 3,490,630 | | | | 3,013,360 | |
| |
| Countrywide Asset-Backed Certificates: | |
| Series 2005-16, Cl. 2AF2, 5.021%, 5/25/362 | | | 472,774 | | | | 490,033 | |
| Series 2006-25, Cl. 2A2, 0.285%, 6/25/472 | | | 32,807 | | | | 32,850 | |
| |
| Countrywide Home Loans: | | | | | | | | |
| Series 2005-29, Cl. A1, 5.75%, 12/25/35 | | | 4,006,382 | | | | 3,651,757 | |
| Series 2005-J4, Cl. A7, 5.50%, 11/1/35 | | | 1,434,128 | | | | 1,468,183 | |
| Series 2006-6, Cl. A3, 6.00%, 4/25/36 | | | 346,872 | | | | 319,615 | |
| Series 2007-HY3, Cl. 1A1, 2.758%, 6/1/472 | | | 1,806,568 | | | | 1,606,680 | |
| |
| CWHEQ Revolving Home Equity Loan Trust: | |
| Series 2005-G, Cl. 2A, 0.397%, 12/15/352 | | | 126,495 | | | | 95,949 | |
| Series 2006-H, Cl. 2A1A, 0.317%, 11/15/362 | | | 57,520 | | | | 35,808 | |
| |
| GSR Mortgage Loan Trust, Series 2006-5F, Cl. 2A1, 6%, 6/25/36 | | | 417,516 | | | | 407,876 | |
| |
| Home Equity Mortgage Trust, Series 2005- 1, Cl. M6, 5.863%, 6/25/352 | | | 983,060 | | | | 1,006,222 | |
| |
| MASTR Asset Backed Securities Trust, Series 2006-WMC3, Cl. A3, 0.265%, 8/25/362 | | | 1,080,490 | | | | 554,882 | |
| |
| MLCC Mortgage Investors, Inc., Series 2006-3, Cl. 2A1, 2.333%, 10/25/362 | | | 1,303,151 | | | | 1,247,657 | |
| |
| NC Finance Trust, Series 1999-I, Cl. D, 3.405%, 1/25/293,8 | | | 66,744 | | | | 4,005 | |
| |
| RALI Trust: | | | | | | | | |
| Series 2006-QS13, Cl. 1A8, 6.00%, 9/1/36 | | | 28,543 | | | | 21,710 | |
| Series 2007-QS6, Cl. A28, 5.75%, 4/25/37 | | | 680,392 | | | | 536,568 | |
| |
| Residential Asset Securitization Trust: | |
| Series 2005-A14, Cl. A1, 5.50%, 12/25/35 | | | 2,727,934 | | | | 2,442,363 | |
| Series 2005-A15, Cl. 1A4, 5.75%, 2/1/36 | | | 2,893,962 | | | | 2,621,990 | |
| Series 2005-A6CB, Cl. A7, 6.00%, 6/1/35 | | | 3,555,511 | | | | 3,413,678 | |
| |
| Terwin Mortgage Trust, Series 2006-4SL, Cl. A1, 2.147%, 5/25/371,2 | | | 147,392 | | | | 69,526 | |
| |
| WaMu Mortgage Pass-Through Certificates Trust, Series 2005-AR12, Cl. 1A8, 2.357%, 10/25/352 | | | 1,889,794 | | | | 1,801,898 | |
| |
| Wells Fargo Mortgage-Backed Securities Trust: | |
| Series 2005-9, Cl. 2A6, 5.25%, 10/25/35 | | | 284,699 | | | | 293,664 | |
| Series 2006-AR14, Cl. 1A2, 5.584%, 10/1/362 | | | 2,270,153 | | | | 2,176,773 | |
| | | | | | | | |
| | | | | | | 47,446,586 | |
| | | | | | | | |
| Total Mortgage-Backed Obligations (Cost $468,034,825) | | | | | | | 481,400,697 | |
| | | | | | | | |
| |
U.S. Government Obligations—7.3% | |
| |
| Federal National Mortgage Assn. Nts., 1.25%, 1/30/17 | | | 703,000 | | | | 711,781 | |
| |
| U.S. Treasury Bills, 0.091%, 5/29/14 | | | 45,665,000 | | | | 45,654,999 | |
| |
| U.S. Treasury Nts.: | | | | | | | | |
| 0.25%, 7/31/15 | | | 26,000,000 | | | | 26,000,000 | |
10 OPPENHEIMER GLOBAL STRATEGIC INCOME FUND/VA
| | | | | | | | | | | | |
| | | Principal Amount | | Value | | | |
| U.S. Government Obligations Continued | | | |
| U.S. Treasury Nts.: Continued | | | |
| 0.25%, 10/31/1510,15 | | | $75,000,000 | | | | | $ | 74,898,900 | | | |
| 0.625%, 11/15/16-12/15/16 | | | 3,865,000 | | | | | | 3,852,445 | | | |
| 1.375%, 9/30/1810 | | | 16,696,000 | | | | | | 16,484,044 | | | |
| 2.00%, 9/30/20 | | | 9,509,000 | | | | | | 9,284,645 | | | |
| 2.50%, 8/15/23 | | | 735,000 | | | | | | 704,595 | | | |
| U.S. Treasury Nts., Strips, 6.16%, 2/15/16 | | | 2,116,000 | | | | | | 2,096,402 | | | |
| Total U.S. Government Obligations (Cost $179,939,410) | | | | | | | | | 179,687,811 | | | |
| Foreign Government Obligations—23.9% | | | |
| Angola—0.1% | | | |
| Republic of Angola Via Northern | | | |
| Lights III BV Sr. Unsec. Nts., 7%, | | | |
| 8/16/19 | | | 1,845,000 | | | | | | 2,001,825 | | | |
| Australia—0.3% | | | |
| Commonwealth of Australia Sr. Unsec. Bonds, 1.25%, 2/21/22 | | | 535,000 | | | AUD | | | 486,389 | | | |
| New South Wales Treasury Corp. Sr. Unsec. Nts., 6%, Series 19, 4/1/19 | | | 460,000 | | | AUD | | | 456,123 | | | |
| Queensland Treasury Corp. Sr. Unsec. Nts.: | | | | | | | | | | | | �� |
| Series 19, 6.25%, 6/14/19 | | | 580,000 | | | AUD | | | 581,561 | | | |
| Series 21, 6.00%, 6/14/21 | | | 3,425,000 | | | AUD | | | 3,404,035 | | | |
| Series 22, 6.00%, 7/21/22 | | | 195,000 | | | AUD | | | 190,812 | | | |
| Series 33, 6.50%, 3/14/33 | | | 3,300,000 | | | AUD | | | 3,307,174 | | | |
| Victoria Treasury Corp. Sr. Unsec. Nts.: | | | | | | | | | | | | |
| 5.50%, 11/17/26 | | | 2,790,000 | | | AUD | | | 2,623,234 | | | |
| Series 1224, 5.50%, 12/17/24 | | | 540,000 | | | AUD | | | 513,376 | | | |
| Western Australia Treasury Corp. Unsec. Nts., 7%, Series 19, 10/15/19 | | | 220,000 | | | AUD | | | 226,533 | | | |
| | | | | | | | | 11,789,237 | | | |
| Bolivia—0.0% | | | |
| Plurinational State of Bolivia Sr. Unsec. Nts., 4.875%, 10/29/221 | | | 310,000 | | | | | | 297,600 | | | |
| Brazil—3.3% | | | |
| Brazil Minas SPE via State of Minas Gerais Sec. Bonds, 5.333%, 2/15/281 | | | 1,720,000 | | | | | | 1,603,900 | | | |
| Federative Republic of Brazil International Bonds, 4.25%, 1/7/25 | | | 1,310,000 | | | | | | 1,249,413 | | | |
| Federative Republic of Brazil Letra Tesouro Nacional Unsec. Nts.: | | | | | | | | | | | | |
| 9.61%, 7/1/149 | | | 84,165,000 | | | BRL | | | 34,002,731 | | | |
| 10.571%, 1/1/159 | | | 17,210,000 | | | BRL | | | 6,587,712 | | | |
| 9.59%, 4/1/149 | | | 39,260,000 | | | BRL | | | 16,249,521 | | | |
| 10.346%, 10/1/149 | | | 10,380,000 | | | BRL | | | 4,081,640 | | | |
| Federative Republic of Brazil Nota Do Tesouro Nacional Unsec. Nts.: | | | | | | | | | | | | |
| 9.762%, 1/1/18 | | | 12,225,000 | | | BRL | | | 4,783,611 | | | |
| 9.762%, 1/1/21 | | | 4,945,000 | | | BRL | | | 1,821,636 | | | |
| 10.00%, 1/1/23 | | | 6,595,000 | | | BRL | | | 2,361,289 | | | |
| Federative Republic of Brazil Sr. | | | |
| Unsec. Nts., 4.875%, 1/22/21 | | | 1,707,000 | | | | | | 1,809,420 | | | |
| | | | | | | | | 74,550,873 | | | |
| Canada—0.8% | | | |
| Canada Treasury Bills: 0.965%, 5/8/149 | | | 11,615,000 | | | CAD | | | 10,899,348 | | | |
| 0.993%, 9/25/149 | | | 11,615,000 | | | CAD | | | 10,858,235 | | | |
| | | | | | | | | 21,757,583 | | | |
| Colombia—0.4% | | | |
| Republic of Colombia Sr. Unsec. Bonds, 6.125%, 1/18/41 | | | 430,000 | | | | | | 463,325 | | | |
| Republic of Colombia Sr. Unsec. Nts.: 4.00%, 2/26/24 | | | 1,490,000 | | | | | | 1,440,085 | | | |
| 7.375%, 1/27/17 | | | 620,000 | | | | | | 720,130 | | | |
| 7.375%, 3/18/19 | | | 2,665,000 | | | | | | 3,219,320 | | | |
| 8.125%, 5/21/24 | | | 970,000 | | | | | | 1,251,300 | | | |
| Series B, 7.00%, 5/4/22 | | | 5,289,000,000 | | | COP | | | 2,781,521 | | | |
| Series B, 10.00%, 7/24/24 | | | 399,000,000 | | | COP | | | 255,195 | | | |
| | | | | | | | | 10,130,876 | | | |
| | | | | | | | | | |
| | | Principal Amount | | | | | Value | |
Costa Rica—0.0% | |
| Republic of Costa Rica Sr. Unsec. Bonds, 4.375%, 4/30/251 | | $ | 305,000 | | | | | $ | 270,688 | |
| Croatia—0.2% | |
| Republic of Croatia Sr. Unsec. Nts.: | | | | | | | | | | |
| 5.50%, 4/4/231 | | | 2,500,000 | | | | | | 2,443,750 | |
| 6.25%, 4/27/171 | | | 1,275,000 | | | | | | 1,361,063 | |
| 6.375%, 3/24/211 | | | 585,000 | | | | | | 615,128 | |
| 6.75%, 11/5/191 | | | 585,000 | | | | | | 636,188 | |
| | | | | | | | | 5,056,129 | |
| Dominican Republic—0.0% | |
| Banco de Reservas de la Republica Dominicana Sub. Nts., 7%, 2/1/231 | | | 910,000 | | | | | | 841,750 | |
| Dominican Republic Sr. Unsec. Bonds, 5.875%, 4/18/241 | | | 1,010,000 | | | | | | 974,650 | |
| | | | | | | | | 1,816,400 | |
| Gabon—0.0% | | | | | | | | | | |
| Gabonese Republic Unsec. Bonds, 6.375%, 12/12/241 | | | 950,000 | | | | | | 957,125 | |
| Germany—0.8% | | | | | | | | | | |
| Federal Republic of Germany Bonds, 2.25%, 4/11/14 | | | 14,250,000 | | | EUR | | | 19,715,721 | |
Greece—0.0% | | | | | | | | | | |
Hellenic Republic Sr. Unsec. Bonds: | |
2.00%, 2/24/232 | | | 25,000 | | | EUR | | | 23,296 | |
2.00%, 2/24/242 | | | 25,000 | | | EUR | | | 22,358 | |
2.00%, 2/24/252 | | | 25,000 | | | EUR | | | 21,611 | |
2.00%, 2/24/262 | | | 25,000 | | | EUR | | | 21,137 | |
2.00%, 2/24/272 | | | 25,000 | | | EUR | | | 20,776 | |
2.00%, 2/24/282 | | | 25,000 | | | EUR | | | 20,089 | |
2.00%, 2/24/292 | | | 25,000 | | | EUR | | | 19,673 | |
2.00%, 2/24/302 | | | 25,000 | | | EUR | | | 19,347 | |
2.00%, 2/24/312 | | | 25,000 | | | EUR | | | 18,962 | |
2.00%, 2/24/322 | | | 25,000 | | | EUR | | | 18,775 | |
2.00%, 2/24/332 | | | 25,000 | | | EUR | | | 18,472 | |
2.00%, 2/24/342 | | | 25,000 | | | EUR | | | 18,359 | |
2.00%, 2/24/352 | | | 25,000 | | | EUR | | | 18,105 | |
2.00%, 2/24/362 | | | 25,000 | | | EUR | | | 18,122 | |
2.00%, 2/24/372 | | | 25,000 | | | EUR | | | 17,959 | |
2.00%, 2/24/382 | | | 25,000 | | | EUR | | | 17,902 | |
2.00%, 2/24/392 | | | 25,000 | | | EUR | | | 17,916 | |
2.00%, 2/24/402 | | | 25,000 | | | EUR | | | 17,827 | |
2.00%, 2/24/412 | | | 25,000 | | | EUR | | | 17,669 | |
2.00%, 2/24/422 | | | 25,000 | | | EUR | | | 17,811 | |
| | | | | | | | | 386,166 | |
Guatemala—0.0% | |
| Republic of Guatemala Sr. Unsec. Bonds, 4.875%, 2/13/281 | | | 660,000 | | | | | | 607,200 | |
| Hungary—1.9% | | | | | | | | | | |
| Hungary Sr. Unsec. Bonds, 7.625%, 3/29/41 | | | 140,000 | | | | | | 153,825 | |
| Hungary Sr. Unsec. Nts.: | | | | | | | | | | |
| 5.375%, 2/21/23 | | | 2,110,000 | | | | | | 2,094,175 | |
| 5.75%, 6/11/18 | | | 310,000 | | | EUR | | | 466,495 | |
| 6.375%, 3/29/21 | | | 2,970,000 | | | | | | 3,200,175 | |
| Hungary Treasury Bills: | |
| 3.522%, 4/30/149 | | | 2,468,000,000 | | | HUF | | | 11,372,150 | |
| 3.512%, 3/5/149 | | | 1,176,000,000 | | | HUF | | | 5,428,693 | |
| 3.559%, 1/8/149 | | | 823,000,000 | | | HUF | | | 3,806,597 | |
| Hungary Unsec. Bonds: | |
| Series 17/A, 6.75%, 11/24/17 | | | 486,000,000 | | | HUF | | | 2,439,650 | |
| Series 19/A, 6.50%, 6/24/19 | | | 510,000,000 | | | HUF | | | 2,548,939 | |
| Series 20/A, 7.50%, 11/12/20 | | | 280,000,000 | | | HUF | | | 1,460,234 | |
| Series 23/A, 6.00%, 11/24/23 | | | 583,200,000 | | | HUF | | | 2,773,070 | |
| Hungary Unsec. Nts.: | �� |
| Series 16/D, 5.50%, 12/22/16 | | | 442,000,000 | | | HUF | | | 2,135,756 | |
| Series 18/A, 5.50%, 12/20/18 | | | 1,266,000,000 | | | HUF | | | 6,068,318 | |
| | | | | | | | | 43,948,077 | |
India—0.0% | | | | | | | | | | |
| Republic of India Treasury Bills, 8.665%, 2/14/149 | | | 1,000,000 | | | INR | | | 16,007 | |
|
| 11 OPPENHEIMER GLOBAL STRATEGIC INCOME FUND/VA |
CONSOLIDATEDSTATEMENTOF INVESTMENTS Continued
| | | | | | | | | | | | |
| | | Principal Amount | | | | | Value | | | |
| | | |
| Indonesia—0.8% | | | | | | | | | | | | |
| | | |
| Perusahaan Penerbit SBSN Indonesia Sr. Unsec. Bonds, 4%, 11/21/181 | | $ | 2,595,000 | | | | | $ | 2,556,075 | | | |
| | | |
| Perusahaan Penerbit SBSN Indonesia Unsec. Nts., 6.125%, 3/15/191 | | | 1,600,000 | | | | | | 1,714,000 | | | |
| | | |
| Republic of Indonesia Sr. Unsec. Bonds: | | | |
| 3.375%, 4/15/231 | | | 870,000 | | | | | | 746,025 | | | |
| 4.875%, 5/5/211 | | | 2,420,000 | | | | | | 2,407,900 | | | |
| 5.25%, 1/17/421 | | | 1,305,000 | | | | | | 1,132,088 | | | |
| 5.375%, 10/17/231 | | | 3,100,000 | | | | | | 3,100,000 | | | |
| 11.625%, 3/4/191 | | | 520,000 | | | | | | 698,100 | | | |
| | | |
| Republic of Indonesia Treasury Bonds: | | | |
| Series FR53, 8.25%, 7/15/21 | | | 4,250,000,000 | | | IDR | | | 346,191 | | | |
| Series FR61, 7.00%, 5/15/22 | | | 6,200,000,000 | | | IDR | | | 465,728 | | | |
| Series FR68, 8.375%, 3/15/34 | | | 14,350,000,000 | | | IDR | | | 1,123,643 | | | |
| Series FR70, 8.375%, 3/15/24 | | | 36,600,000,000 | | | IDR | | | 3,011,154 | | | |
| Series FR71, 9.00%, 3/15/29 | | | 25,070,000,000 | | | IDR | | | 2,081,605 | | | |
| | | | | | | | | | | | |
| | | | | | | | | 19,382,509 | | | |
| | | |
| Italy—0.6% | | | | | | | | | | | | |
| | | |
| Italy Buoni Ordinari del Tesoro BOT, 0.632%, 4/30/149 | | | 465,000 | | | EUR | | | 638,266 | | | |
| | | |
| Republic of Italy Buoni Poliennali del Tesoro Unsec. Bonds: | | | |
| 3.50%, 11/1/17 | | | 645,000 | | | EUR | | | 926,498 | | | |
| 4.00%, 9/1/20 | | | 1,600,000 | | | EUR | | | 2,316,679 | | | |
| 4.50%, 3/1/19 | | | 3,730,000 | | | EUR | | | 5,548,797 | | | |
| 4.75%, 9/1/441 | | | 600,000 | | | EUR | | | 816,873 | | | |
| 5.00%, 3/1/22 | | | 300,000 | | | EUR | | | 451,313 | | | |
| 5.00%, 9/1/40 | | | 1,200,000 | | | EUR | | | 1,702,924 | | | |
| | | |
| Republic of Italy Buoni Poliennali del Tesoro Unsec. Nts., 4.75%, 5/1/17 | | | 805,000 | | | EUR | | | 1,202,291 | | | |
| | | |
| Republic of Italy Certificati di Creditodel Tesoro Unsec. Nts., 1.14%, 10/15/172 | | | 730,000 | | | EUR | | | 982,623 | | | |
| | | |
| Republic of Italy International Sr. Unsec. Bonds, 4.50%, 6/8/15 | | | 141,000,000 | | | JPY | | | 1,397,724 | | | |
| | | | | | | | | | | | |
| | | | | | | | | 15,983,988 | | | |
| | | |
| Ivory Coast—0.2% | | | | | | | | | | | | |
| | | |
| Republic of Cote d’Ivoire Sr. Unsec. Bonds, 7.10%, 12/31/322 | | | 4,825,000 | | | | | | 4,342,500 | | | |
| | | |
| Japan—0.0% | | | | | | | | | | | | |
| | | |
| Japan Bank for International Cooperation Sr. Unsec. Nts., 2.30%, 3/19/18 | | | 395,000 | | | CAD | | | 369,788 | | | |
| | | |
| Kazakhstan—0.0% | | | | | | | | | | | | |
| | | |
| Development Bank of Kazakhstan JSC Sr. Unsec. Bonds, 4.125%, 12/10/221 | | | 770,000 | | | | | | 691,999 | | | |
| | | |
| Latvia—0.1% | | | | | | | | | | | | |
| | | |
| Republic of Latvia Sr. Unsec. Nts., 5.25%, 6/16/211 | | | 1,175,000 | | | | | | 1,273,406 | | | |
| | | |
| Lithuania—0.2% | | | | | | | | | | | | |
| | | |
| Republic of Lithuania Sr. Unsec. Bonds: | | | |
| 6.125%, 3/9/211 | | | 1,990,000 | | | | | | 2,264,222 | | | |
| 6.625%, 2/1/221 | | | 1,840,000 | | | | | | 2,155,100 | | | |
| | | | | | | | | | | | |
| | | | | | | | | 4,419,322 | | | |
| | | |
| Malaysia—0.2% | | | | | | | | | | | | |
| | | |
| Bank Negara Malaysia Monetary Nts., | | | |
| 2.976%, 2/20/149 | | | 5,270,000 | | | MYR | | | 1,602,651 | | | |
| | | |
| Bank Negara Malaysia Monetary Unsec. Nts.: | | | |
| 2.848%, 3/11/149 | | | 4,215,000 | | | MYR | | | 1,279,800 | | | |
| 2.923%, 7/10/149 | | | 3,055,000 | | | MYR | | | 918,495 | | | |
| | | | | | | | | | | | |
| | | | | | | | | 3,800,946 | | | |
| | | |
| Mexico—5.6% | | | | | | | | | | | | |
| United Mexican States Sr. Unsec. Bonds: | | | |
| 6.75%, 9/27/34 | | | 855,000 | | | | | | 1,013,175 | | | |
| 7.50%, 4/8/33 | | | 325,000 | | | | | | 411,937 | | | |
| | | |
| United Mexican States Treasury Bills: | | | |
| 3.597%, 3/6/149 | | | 274,170,000 | | | MXN | | | 20,879,673 | | | |
| 3.67%, 3/20/149 | | | 235,000,000 | | | MXN | | | 17,863,888 | | | |
| 3.607%, 4/30/149 | | | 96,900,000 | | | MXN | | | 7,336,391 | | | |
| 3.561%, 4/16/149 | | | 250,850,000 | | | MXN | | | 19,026,290 | | | |
| 3.529%, 4/3/149 | | | 240,700,000 | | | MXN | | | 18,272,847 | | | |
| | | | | | | | | | |
| | | Principal Amount | | | | | Value | |
| |
| Mexico Continued | | | | | | | | | | |
| |
| United Mexican States Treasury Bills: Continued | |
| 3.58%, 5/29/149 | | | 240,700,000 | | | MXN | | $ | 18,177,537 | |
| 3.581%, 1/2/149 | | | 25,700,000 | | | MXN | | | 1,968,368 | |
| 3.99%, 2/6/149 | | | 39,700,000 | | | MXN | | | 3,030,779 | |
| 3.993%, 1/23/149 | | | 31,600,000 | | | MXN | | | 2,415,386 | |
| |
| United Mexican States Unsec. Bonds: | |
| Series M, 6.50%, 6/9/22 | | | 83,700,000 | | | MXN | | | 6,496,598 | |
| Series M, 7.00%, 6/19/14 | | | 139,700,000 | | | MXN | | | 10,921,092 | |
| Series M, 8.00%, 6/11/20 | | | 20,100,000 | | | MXN | | | 1,727,715 | |
| Series M10, 7.75%, 12/14/17 | | | 22,135,000 | | | MXN | | | 1,862,617 | |
| Series M20, 7.50%, 6/3/27 | | | 51,700,000 | | | MXN | | | 4,232,257 | |
| Series M20, 8.50%, 5/31/29 | | | 40,740,000 | | | MXN | | | 3,551,967 | |
| | | | | | | | | | |
| | | | | | | | | 139,188,517 | |
| |
| Morocco—0.1% | | | | | | | | | | |
| |
| Kingdom of Morocco Sr. Unsec. Nts., 4.25%, 12/11/221 | | | 1,680,000 | | | | | | 1,562,400 | |
| |
| Nigeria—0.2% | | | | | | | | | | |
| |
| Federal Republic of Nigeria Bonds, 4%, 4/23/15 | | | 342,000,000 | | | NGN | | | 1,910,881 | |
| |
| Federal Republic of Nigeria Sr. Unsec. Bonds, 5.125%, 7/12/181 | | | 995,000 | | | | | | 1,023,606 | |
| |
| Federal Republic of Nigeria Treasury Bills, 11.235%, 1/23/149 | | | 166,000,000 | | | NGN | | | 1,031,397 | |
| |
| Federal Republic of Nigeria Unsec. Bonds: | | | | | | | | | | |
| 7.00%, 10/23/19 | | | 214,000,000 | | | NGN | | | 1,021,153 | |
| 16.00%, 6/29/19 | | | 219,000,000 | | | NGN | | | 1,526,359 | |
| | | | | | | | | | |
| | | | | | | | | 6,513,396 | |
| |
| Panama—0.0% | | | | | | | | | | |
| |
| Republic of Panama Sr. Unsec. Bonds: | |
| 5.20%, 1/30/20 | | | 885,000 | | | | | | 967,969 | |
| 6.70%, 1/26/36 | | | 495,000 | | | | | | 555,637 | |
| 8.875%, 9/30/27 | | | 615,000 | | | | | | 824,100 | |
| 9.375%, 4/1/29 | | | 565,000 | | | | | | 786,762 | |
| | | | | | | | | | |
| | | | | | | | | 3,134,468 | |
| |
| Peru—0.3% | | | | | | | | | | |
| |
| Republic of Peru Sr. Unsec. Bonds: | |
| 6.55%, 3/14/37 | | | 1,060,000 | | | | | | 1,224,300 | |
| 7.84%, 8/12/201 | | | 6,380,000 | | | PEN | | | 2,602,918 | |
| 8.20%, 8/12/261 | | | 6,395,000 | | | PEN | | | 2,691,013 | |
| | | | | | | | | | |
| | | | | | | | | 6,518,231 | |
| |
| Philippines—0.2% | | | | | | | | | | |
| |
| Republic of the Philippines Sr. Unsec. Bonds: | |
| 6.375%, 1/15/32 | | | 1,600,000 | | | | | | 1,884,000 | |
| 6.375%, 10/23/34 | | | 1,960,000 | | | | | | 2,337,300 | |
| 7.75%, 1/14/31 | | | 300,000 | | | | | | 396,000 | |
| | | | | | | | | | |
| | | | | | | | | 4,617,300 | |
| |
| Poland—0.5% | | | | | | | | | | |
| |
| Republic of Poland Sr. Unsec. Bonds: | |
| 3.00%, 3/17/23 | | | 1,330,000 | | | | | | 1,214,889 | |
| 5.00%, 3/23/22 | | | 1,295,000 | | | | | | 1,387,269 | |
| 5.125%, 4/21/21 | | | 2,335,000 | | | | | | 2,542,231 | |
| |
| Republic of Poland Unsec. Bonds: | |
| 5.25%, 10/25/20 | | | 8,740,000 | | | PLN | | | 3,105,197 | |
| 5.75%, 10/25/21 | | | 8,390,000 | | | PLN | | | 3,059,064 | |
| | | | | | | | | | |
| | | | | | | | | 11,308,650 | |
| |
| Portugal—0.1% | | | | | | | | | | |
| |
| Republic of Portugal Obrigacoes do Tesouro | |
| OT Sr. Unsec. Bonds: | | | | | | | | | | |
| 4.10%, 4/15/37 | | | 760,000 | | | EUR | | | 765,800 | |
| 4.35%, 10/16/171 | | | 2,200,000 | | | EUR | | | 3,024,497 | |
| 4.75%, 6/14/19 | | | 140,000 | | | EUR | | | 187,533 | |
| | | | | | | | | | |
| | | | | | | | | 3,977,830 | |
| |
| Romania—0.2% | | | | | | | | | | |
| |
| Romania Sr. Unsec. Bonds, 6.75%, 2/7/221 | | | 2,335,000 | | | | | | 2,658,981 | |
| |
| Romania Unsec. Bonds: | | | | | | | | | | |
| 5.85%, 4/26/23 | | | 1,010,000 | | | RON | | | 325,122 | |
| 5.90%, 7/26/17 | | | 8,710,000 | | | RON | | | 2,821,139 | |
| | | | | | | | | | |
| | | | | | | | | 5,805,242 | |
|
| 12 OPPENHEIMER GLOBAL STRATEGIC INCOME FUND/VA |
| | | | | | | | | | | | |
| | | Principal Amount | | | | | Value | | | |
| | | |
Russia—2.0% | | | | | | | | | | | | |
| | | |
| AHML Via AHML Finance Ltd. Unsec. Nts., 7.75%, 2/13/181 | | | 44,700,000 | | | RUB | | $ | 1,343,949 | | | |
| | | |
| Russian Federation Sr. Unsec. Bonds: | | | | | | | | | | | | |
| 5.875%, 9/16/431 | | | 1,105,000 | | | | | | 1,125,995 | | | |
| Series 6211, 7.00%, 1/25/23 | | | 166,000,000 | | | RUB | | | 4,880,423 | | | |
| | | |
| Russian Federation Unsec. Bonds: | | | | | | | | | | | | |
| 6.80%, 12/11/19 | | | 188,300,000 | | | RUB | | | 5,639,668 | | | |
| 7.00%, 8/16/23 | | | 164,200,000 | | | RUB | | | 4,777,830 | | | |
| Series 6204, 7.50%, 3/15/18 | | | 138,400,000 | | | RUB | | | 4,318,925 | | | |
| Series 6205, 7.60%, 4/14/21 | | | 206,100,000 | | | RUB | | | 6,363,277 | | | |
| Series 6209, 7.60%, 7/20/22 | | | 147,800,000 | | | RUB | | | 4,516,108 | | | |
| | | |
| Vnesheconombank Sr. Unsec. Bonds, Series 18, 8.55%, 9/17/322 | | | 36,100,000 | | | RUB | | | 1,116,772 | | | |
| | | |
| Vnesheconombank Sr. Unsec. Bonds, Series 9, 7.90%, 3/18/212 | | | 33,200,000 | | | RUB | | | 1,017,975 | | | |
| | | |
| Vnesheconombank Via VEB Finance plc Sr. Unsec. Bonds: | | | | | | | | | | | | |
| 5.375%, 2/13/171 | | | 1,880,000 | | | | | | 2,009,344 | | | |
| 5.45%, 11/22/171 | | | 1,105,000 | | | | | | 1,186,549 | | | |
6.902%, 7/9/201 | | | 3,545,000 | | | | | | 3,921,656 | | | |
| | | |
| Vnesheconombank Via VEB Financeplc Sr. Unsec. Nts., 5.942%, 11/21/231 | | | 1,770,000 | | | | | | 1,774,425 | | | |
| | | | | | | | | | | | |
| | | | | | | | | 43,992,896 | | | |
| | | |
Serbia—0.1% | | | | | | | | | | | | |
| | | |
| Republic of Serbia Sr. Unsec. Bonds, 5.25%, 11/21/171 | | | 825,000 | | | | | | 831,188 | | | |
| | | |
| Republic of Serbia Treasury Bills: | | | | | | | | | | | | |
| 9.824%, 1/30/149 | | | 38,000,000 | | | RSD | | | 455,512 | | | |
| 10.004%, 6/12/149 | | | 151,000,000 | | | RSD | | | 1,751,457 | | | |
| | | |
| Republic of Serbia Unsec. Bonds, 5.875%, 12/3/181 | | | 940,000 | | | | | | 961,150 | | | |
| | | | | | | | | | | | |
| | | | | | | | | 3,999,307 | | | |
| | | |
South Africa—1.3% | | | | | | | | | | | | |
| | | |
| Republic of South Africa Sr. Unsec. Bonds: | | | | | | | | | | | | |
| 5.875%, 5/30/22 | | | 330,000 | | | | | | 355,163 | | | |
| 5.875%, 9/16/25 | | | 1,625,000 | | | | | | 1,694,875 | | | |
| 6.25%, 3/31/36 | | | 18,100,000 | | | ZAR | | | 1,270,406 | | | |
| Series R207, 7.25%, 1/15/20 | | | 93,930,000 | | | ZAR | | | 8,861,906 | | | |
| Series R208, 6.75%, 3/31/21 | | | 99,675,000 | | | ZAR | | | 9,039,525 | | | |
| | | |
| Republic of South Africa Unsec. Bonds: | | | | | | | | | | | | |
| 10.50%, 12/21/26 | | | 15,600,000 | | | ZAR | | | 1,753,037 | | | |
| Series 2023, 7.75%, 2/28/23 | | | 25,300,000 | | | ZAR | | | 2,390,305 | | | |
| Series R213, 7.00%, 2/28/31 | | | 31,838,000 | | | ZAR | | | 2,535,291 | | | |
| | | | | | | | | | | | |
| | | | | | | | | 27,900,508 | | | |
| | | |
South Korea—0.0% | | | | | | | | | | | | |
| | | |
| Korea Housing Finance Corp. Sec. Nts., 1.625%, 9/15/181 | | | 260,000 | | | | | | 245,656 | | | |
| | | |
Spain—0.0% | | | | | | | | | | | | |
| | | |
| Autonomous Community of Madrid Spain Sr. Unsec. Bonds, 4.30%, 9/15/26 | | | 555,000 | | | EUR | | | 720,296 | | | |
| | | |
| Instituto de Credito Oficial Sr. Unsec. Nts., 5%, 5/15/15 | | | 2,200,000 | | | NOK | | | 368,019 | | | |
| | | |
| Kingdom of Spain Bonds, 5.15%, 10/31/441 | | | 260,000 | | | EUR | | | 366,195 | | | |
| | | |
| Kingdom of Spain Sr. Unsec. Bonds, 4.50%, 1/31/18 | | | 550,000 | | | EUR | | | 815,009 | | | |
| | | | | | | | | | | | |
| | | | | | | | | 2,269,519 | | | |
| | | |
Sri Lanka—0.0% | | | | | | | | | | | | |
| | | |
| Democratic Socialist Republic of Sri Lanka Sr. Unsec. Bonds: | | | | | | | | | | | | |
5.875%, 7/25/221 | | | 620,000 | | | | | | 585,900 | | | |
6.25%, 10/4/201 | | | 715,000 | | | | | | 711,425 | | | |
6.25%, 7/27/211 | | | 780,000 | | | | | | 766,350 | | | |
| | | | | | | | | | | | |
| | | | | | | | | 2,063,675 | | | |
| | | |
Tanzania—0.1% | | | | | | | | | | | | |
| | | |
| United Republic of Tanzania Sr. Unsec. Nts., 6.392%, 3/9/202 | | | 1,230,000 | | | | | | 1,291,500 | | | |
| | | |
Thailand—0.5% | | | | | | | | | | | | |
| | | |
| Kingdom of Thailand Sr. Unsec. Bonds: | | | | | | | | | | | | |
3.58%, 12/17/27 | | | 107,000,000 | | | THB | | | 3,076,742 | | | |
| | | | | | | | | | |
| | | Principal Amount | | | | | Value | |
| |
Thailand (Continued) | | | | | | | | | | |
| |
| Kingdom of Thailand Sr. Unsec. Bonds: Continued | | | | | | | | | | |
3.625%, 6/16/23 | | | 149,400,000 | | | THB | | $ | 4,458,767 | |
3.65%, 12/17/21 | | | 95,700,000 | | | THB | | | 2,896,180 | |
| |
| Kingdom of Thailand Sr. Unsec. Nts., 3.875%, 6/13/19 | | | 91,100,000 | | | THB | | | 2,839,817 | |
| | | | | | | | | | |
| | | | | | | | | 13,271,506 | |
| |
Turkey—1.4% | | | | | | | | | | |
| |
| Republic of Turkey Sr. Unsec. Bonds: | | | | | | | | | | |
4.35%, 11/12/217 | | | 1,760,000 | | | EUR | | | 2,403,073 | |
5.625%, 3/30/21 | | | 1,105,000 | | | | | | 1,114,945 | |
6.25%, 9/26/22 | | | 1,740,000 | | | | | | 1,811,340 | |
6.875%, 3/17/36 | | | 615,000 | | | | | | 605,621 | |
7.375%, 2/5/25 | | | 1,125,000 | | | | | | 1,217,250 | |
8.00%, 6/4/14 | | | 12,525,000 | | | TRY | | | 5,820,715 | |
| |
| Republic of Turkey Unsec. Bonds: | | | | | | | | | | |
5.828%, 2/11/1511 | | | 2,905,000 | | | TRY | | | 1,825,919 | |
6.317%, 2/14/18 | | | 4,445,000 | | | TRY | | | 1,825,160 | |
7.10%, 3/8/23 | | | 5,740,000 | | | TRY | | | 2,193,967 | |
8.30%, 6/20/18 | | | 5,265,000 | | | TRY | | | 2,309,348 | |
9.00%, 3/5/14 | | | 16,685,000 | | | TRY | | | 7,792,959 | |
9.00%, 3/8/17 | | | 8,595,000 | | | TRY | | | 3,897,147 | |
| | | | | | | | | | |
| | | | | | | | | 32,817,444 | |
| |
Ukraine—0.3% | | | | | | | | | | |
| |
| Ukraine International Bonds: | | | | | | | | | | |
6.25%, 6/17/161 | | | 95,000 | | | | | | 89,633 | |
6.58%, 11/21/161 | | | 2,035,000 | | | | | | 1,917,987 | |
6.75%, 11/14/171 | | | 2,035,000 | | | | | | 1,882,375 | |
6.875%, 9/23/151 | | | 2,210,000 | | | | | | 2,158,618 | |
7.75%, 9/23/201 | | | 485,000 | | | | | | 449,838 | |
| | | | | | | | | | |
| | | | | | | | | 6,498,451 | |
| |
United Arab Emirates—0.1% | | | | | | | | | | |
| |
| Emirate of Dubai Sr. Unsec. International Bonds, 5.591%, 6/22/21 | | | 1,810,000 | | | | | | 1,961,588 | |
| |
United Kingdom—0.5% | | | | | | | | | | |
| |
| United Kingdom Treasury Unsec. Bonds, 2.25%, 3/7/14 | | | 7,705,000 | | | GBP | | | 12,802,207 | |
| |
Uruguay—0.1% | | | | | | | | | | |
| |
| Oriental Republic of Uruguay Sr. Unsec. Bonds: | | | | | | | | | | |
4.50%, 8/14/24 | | | 2,675,000 | | | | | | 2,681,688 | |
7.625%, 3/21/36 | | | 175,000 | | | | | | 213,062 | |
| | | | | | | | | | |
| | | | | | | | | 2,894,750 | |
| |
Venezuela—0.4% | | | | | | | | | | |
| |
| Bolivarian Republic of Venezuela Sr. Unsec. Bonds: | | | | | | | | | | |
7.65%, 4/21/25 | | | 1,680,000 | | | | | | 1,142,400 | |
8.25%, 10/13/24 | | | 1,730,000 | | | | | | 1,226,570 | |
9.00%, 5/7/23 | | | 2,340,000 | | | | | | 1,752,660 | |
13.625%, 8/15/18 | | | 355,000 | | | | | | 351,450 | |
13.625%, 8/15/181 | | | 2,265,000 | | | | | | 2,185,725 | |
| |
| Petroleos de Venezuela SA, 9.75% Sr. Unsec. Nts., 5/17/35 | | | 1,140,000 | | | | | | 803,700 | |
| | | | | | | | | | |
| | | | | | | | | 7,462,505 | |
| | | | | | | | | | |
Total Foreign Government Obligations (Cost9a $607,312,892) | | | | | | | | | 585,663,511 | |
| |
Corporate Loans—2.4% | | | | | | | | | | |
| |
| Affinion Group, Inc., Sr. Sec. Credit Facilities 1st Lien Term Loan, Tranche B, 6.50%, 10/9/16 | | | 1,242,474 | | | | | | 1,227,131 | |
| |
| Atlas Energy LP, Sr. Sec. Credit Facilities 1st Lien Term Loan, Tranche B, 6.50%, 7/31/19 | | | 1,062,338 | | | | | | 1,091,552 | |
| |
Autoparts Holdings Ltd., Sr. Sec. Credit Facilities 1st Lien Term Loan,
Lien Term Loan, 6.50%, 7/31/17 | | | 1,022,936 | | | | | | 1,016,969 | |
| |
| BJ’S Wholesale Club, Inc., Sr. Sec. Credit Facilities 2nd Lien Term Loan, 8.50%, 3/26/20 | | | 1,775,000 | | | | | | 1,815,255 | |
|
| 13 OPPENHEIMER GLOBAL STRATEGIC INCOME FUND/VA |
CONSOLIDATEDSTATEMENTOF INVESTMENTS Continued
| | | | | | | | | | |
| | | Principal Amount | | | Value | | | |
| | | |
| Corporate Loans Continued | | | |
| | | |
| Blue Coat Systems, Inc., Sr. Sec. Credit Facilities 2nd Lien Term Loan, 9.50%, 6/26/20 | | $ | 895,000 | | | $ | 912,900 | | | |
| | | |
| Brock Holdings III, Inc., Sr. Sec. Credit Facilities 2nd Lien Term Loan, 10%, 3/16/18 | | | 775,000 | | | | 789,531 | | | |
| | | |
| Caesars Entertainment Operating Co., Inc., Sr. Sec. Credit Facilities 1st Lien Term Loan: | | | | | | | | | | |
| Series Tranche B, 7.00%, 10/11/20 | | | 2,525,000 | | | | 2,515,531 | | | |
| Series Tranche B6, 5.44%, 1/28/18 | | | 2,508,271 | | | | 2,399,898 | | | |
| | | |
| Catalent Pharma Solutions, Inc., Sr. Sec. Credit Facilities Term Loan, 6.50%, 12/31/17 | | | 1,265,000 | | | | 1,283,975 | | | |
| | | |
| Cenveo, Inc., Sr. Sec. Credit Facilities 1st Lien Term Loan, 6.25%, 2/13/17 | | | 1,635,394 | | | | 1,647,659 | | | |
| | | |
| Clear Channel Communications, Inc., Extended Sr. Sec. Credit Facilities 1st Lien Term Loan, Tranche D, 6.914%, 1/30/19 | | | 6,103,532 | | | | 5,844,132 | | | |
| | | |
| Clear Channel Communications, Inc., Sr. Sec. Credit Facilities 1st Lien Term Loan, Tranche B, 3.836%, 1/29/16 | | | 976,487 | | | | 948,535 | | | |
| | | |
| Continental Building, Sr. Sec. Credit Facilities 2nd Lien Term Loan, 8.50%, 2/26/217 | | | 680,000 | | | | 684,534 | | | |
| | | |
| Del Monte Foods Co., Inc., Sr. Sec. Credit Facilities 2nd Lien Term Loan, 8.25%, 7/26/217 | | | 1,360,000 | | | | 1,377,567 | | | |
| | | |
| Deltek, Inc., Sr. Sec. Credit Facilites 2nd Lien Term Loan, 10%, 10/10/19 | | | 2,050,000 | | | | 2,091,000 | | | |
| | | |
| Entegra Holdings LLC, Sr. Sec. Credit Facilities Term Loan, Tranche B, 3.64%, 10/19/157 | | | 6,504,358 | | | | 4,032,702 | | | |
| | | |
| Fairpoint Communications, Inc., Sr. Sec. Credit Facilities 1st Lien Term Loan, Tranche B, 7.50%, 2/14/197 | | | 1,810,486 | | | | 1,871,568 | | | |
| | | |
| Fieldwood Energy LLC, Sr. Sec. Credit Facilities 2nd Lien Term Loan, 8.375%, 9/30/20 | | | 3,000,000 | | | | 3,069,642 | | | |
| | | |
| iStar Financial, Inc., Sr. Sec. Credit Facilities 1st Lien Term Loan, Tranche A2, 7%, 3/19/17 | | | 1,004,129 | | | | 1,039,273 | | | |
| | | |
| JG Wentworth, Sr. Sec. Credit Facilities 1st Lien Term Loan, Tranche B, 9%, 2/8/19 | | | 303,256 | | | | 309,275 | | | |
| | | |
| Lonestar Intermediate Super Holdings LLC, Sr. Sec. Credit Facilities Term Loan, 11%, 9/2/19 | | | 1,555,000 | | | | 1,609,425 | | | |
| | | |
| Moxie Patriot LLC, Sr. Sec. Credit Facilities 1st Lien Term Loan, Tranche B1, 6.75%, 12/11/207 | | | 1,370,000 | | | | 1,404,250 | | | |
| | | |
| Murray Energy Corp., Sr. Sec. Credit Facilities 2nd Lien Term Loan, 9.50%, 11/20/207 | | | 2,110,000 | | | | 2,249,788 | | | |
| | | |
| NFR Energy, Sr. Sec. Credit Facilities 2nd Lien Term Loan, 8.75%, 12/31/18 | | | 1,945,000 | | | | 1,965,261 | | | |
| | | |
| NTELOS, Inc., Sr. Sec. Credit Facilities 1st Lien Term Loan, Tranche B, 5.75%, 11/9/19 | | | 1,209,687 | | | | 1,215,751 | | | |
| | | |
| Nuveen Investments, Inc., Sr. Sec. Credit Facilities 2nd Lien Term Loan, 6.50%, 2/28/19 | | | 2,475,000 | | | | 2,454,118 | | | |
| | | |
| OneLink Communications/San Juan Cable LLC, Sr. Sec. Credit Facilities 2nd Lien Term Loan, 10%, 6/9/18 | | | 1,885,000 | | | | 1,889,713 | | | |
| | | |
| Quicksilver Resources, Inc., Sr. Sec. Credit Facilities 2nd Lien Term Loan, 7%, 6/21/197 | | | 3,135,000 | | | | 3,111,487 | | | |
| | | |
| Revel Entertainment, Inc., Sr. Sec. Credit Facilities 1st Lien Term Loan, 14.573%, 5/20/18 | | | 1,389,589 | | | | 1,264,526 | | | |
| | | |
| Templar Energy, Sr. Sec. Credit Facilities 2nd Lien Term Loan, 8%, 11/25/207 | | | 3,095,000 | | | | 3,112,409 | | | |
| | | | | | | | | | |
| | | | | | | | | | |
| | | | | | | | | | |
| | | | | | | | | | | | |
| | | Principal Amount | | | | | | Value | |
| |
| Corporate Loans Continued | |
| |
| TWCC Holding Corp., Sr. Sec. Credit Facilities 2nd Lien Term Loan, 7%, 6/26/20 | | $ | 2,430,000 | | | | | | | $ | 2,502,900 | |
| | | | | | | | | | | | |
Total Corporate Loans (Cost $58,437,076) | | | | | | | | | | | 58,748,257 | |
| |
Corporate Bonds and Notes—37.0% | |
| |
Consumer Discretionary—5.2% | |
| |
Auto Components—0.7% | |
| |
| Affinia Group, Inc., 7.75% Sr. Unsec. Nts., 5/1/21 | | | 1,735,000 | | | | | | | | 1,830,425 | |
| |
| Continental Rubber of America Corp., 4.50% Sr. Sec. Nts., 9/15/191 | | | 510,000 | | | | | | | | 542,738 | |
| |
| GKN Holdings plc, 6.75% Sr. Unsec. Nts., 10/28/19 | | | 775,000 | | | | GBP | | | | 1,454,215 | |
| |
| Goodyear Tire & Rubber Co., 8.25% Sr. Unsec. Nts., 8/15/20 | | | 3,385,000 | | | | | | | | 3,799,662 | |
| |
| Lear Corp., 4.75% Sr. Unsec. Nts., 1/15/231 | | | 1,710,000 | | | | | | | | 1,611,675 | |
| |
| Servus Luxembourg Holding SCA, 7.75% Sr. Sec. Nts., 6/15/181 | | | 2,025,000 | | | | EUR | | | | 2,944,583 | |
| |
| Visteon Corp., 6.75% Sr. Unsec. Nts., 4/15/19 | | | 3,163,000 | | | | | | | | 3,376,502 | |
| | | | | | | | | | | | |
| | | | | | | | | | | 15,559,800 | |
| |
Automobiles—0.3% | |
| |
| Daimler Finance North America LLC, 2.375% Sr. Unsec. Nts., 8/1/181 | | | 1,375,000 | | | | | | | | 1,372,755 | |
| |
| Ford Motor Co., 7.45% Sr. Unsec. Nts., 7/16/31 | | | 1,025,000 | | | | | | | | 1,255,491 | |
| |
| Jaguar Land Rover Automotive plc: | | | | | | | | | | | | |
| 5.625% Sr. Unsec. Nts., 2/1/231 | | | 1,295,000 | | | | | | | | 1,301,475 | |
| 7.75% Sr. Unsec. Nts., 5/15/181 | | | 500,000 | | | | | | | | 540,625 | |
| 8.25% Sr. Unsec. Nts., 3/15/201 | | | 245,000 | | | | GBP | | | | 462,254 | |
| | | | | | | | | | | | |
| | | | | | | | | | | 4,932,600 | |
| |
Diversified Consumer Services—0.2% | |
| |
| Monitronics International, Inc., 9.125% Sr. Unsec. Nts., 4/1/20 | | | 2,865,000 | | | | | | | | 3,051,225 | |
| |
| ServiceMaster Co., 8% Sr. Unsec. Nts., 2/15/20 | | | 1,565,000 | | | | | | | | 1,604,125 | |
| | | | | | | | | | | | |
| | | | | | | | | | | 4,655,350 | |
| |
Hotels, Restaurants & Leisure—1.1% | |
| |
| ARAMARK Corp., 5.75% Sr. Unsec. Nts., 3/15/201 | | | 2,890,000 | | | | | | | | 3,034,500 | |
| |
| Boyd Gaming Corp., 9.125% Sr. Unsec. Nts., 12/1/18 | | | 2,295,000 | | | | | | | | 2,507,287 | |
| |
| Burger King Corp., 9.875% Sr. Unsec. Nts., 10/15/18 | | | 1,105,000 | | | | | | | | 1,232,075 | |
| |
| Churchill Downs, Inc., 5.375% Sr. Unsec. Nts., 12/15/211 | | | 1,130,000 | | | | | | | | 1,152,600 | |
| |
| HOA Restaurant Group LLC/HOA Finance Corp., 11.25% Sec. Nts., 4/1/171 | | | 1,861,000 | | | | | | | | 1,972,660 | |
| |
| Isle of Capri Casinos, Inc., 7.75% Sr. Unsec. Nts., 3/15/19 | | | 2,290,000 | | | | | | | | 2,490,375 | |
| |
| Landry’s, Inc., 9.375% Sr. Nts., 5/1/201 | | | 2,290,000 | | | | | | | | 2,507,550 | |
| |
| MCE Finance Ltd., 5% Sr. Unsec. Nts., 2/15/211 | | | 1,625,000 | | | | | | | | 1,588,438 | |
| |
MGM Resorts International: | | | | | | | | | | | | |
| 6.625% Sr. Unsec. Nts., 12/15/21 | | | 1,595,000 | | | | | | | | 1,688,706 | |
| 6.75% Sr. Unsec. Nts., 10/1/20 | | | 1,515,000 | | | | | | | | 1,624,838 | |
| |
| MTR Gaming Group, Inc., 11.50% Sec. Nts., 8/1/19 | | | 1,170,825 | | | | | | | | 1,306,933 | |
| |
| PNK Finance Corp., 6.375% Sr. Unsec. Nts., 8/1/211 | | | 1,670,000 | | | | | | | | 1,715,925 | |
| |
| Premier Cruises Ltd., 11% Sr. Nts., 3/15/083,8 | | | 250,000 | | | | | | | | — | |
| |
| Sugarhouse HSP Gaming Prop Mezz LP/Sugarhouse HSP Gaming Finance Corp., 6.375% Sr. Sec. Nts., 6/1/211 | | | 1,250,000 | | | | | | | | 1,212,500 | |
| |
| Viking Cruises Ltd., 8.50% Unsec. Nts., 10/15/221 | | | 930,000 | | | | | | | | 1,055,550 | |
| | | | | | | | | | | | |
| | | | | | | | | | | 25,089,937 | |
| |
Household Durables—0.2% | |
| |
| Arcelik AS, 5% Sr. Unsec. Nts., 4/3/231 | | | 635,000 | | | | | | | | 551,180 | |
14 OPPENHEIMER GLOBAL STRATEGIC INCOME FUND/VA
| | | | | | | | | | | | | | |
| | | Principal Amount | | | | | | Value | | | |
| | | |
Household Durables Continued | | | |
| Beazer Homes USA, Inc., 9.125% Sr. Unsec. Nts., 5/15/19 | | $ | 2,815 000 | | | | | | | $ | 3,026,125 | | | |
| | | |
| K Hovnanian Enterprises, Inc., 9.125% Sec. Nts., 11/15/201 | | | 1,790,000 | | | | | | | | 1,973,475 | | | |
| | | |
| Taylor Morrison Communities, Inc./Monarch Communities, Inc., 5.25% Sr. Unsec. Nts., 4/15/211 | | | 1,050,000 | | | | | | | | 1,023,750 | | | |
| | | | | | | | | | | | | | |
| | | | | | | | | | | 6,574,530 | | | |
| | | |
| Internet & Catalog Retail—0.1% | | | |
| | | |
| Sabre, Inc., 8.50% Sr. Sec. Nts., 5/15/191 | | | 2,135,000 | | | | | | | | 2,377,856 | | | |
| | | |
| Media—1.6% | | | | | | | | | | | | | | |
| | | |
| Belo Corp., 7.75% Sr. Unsec. Nts., 6/1/27 | | | 3,132,000 | | | | | | | | 3,390,390 | | | |
| | | |
| CCO Holdings LLC/CCO Holdings Capital Corp., 5.75% Sr. Unsec. Nts., 9/1/231 | | | 1,620,000 | | | | | | | | 1,543,050 | | | |
| | | |
| Cumulus Media Holdings, Inc., 7.75% Sr. Unsec. Nts., 5/1/19 | | | 1,715,000 | | | | | | | | 1,817,900 | | | |
| | | |
| DISH DBS Corp.: | | | | | | | | | | | | | | |
| 6.75% Sr. Unsec. Nts., 6/1/21 | | | 835,000 | | | | | | | | 889,275 | | | |
| 7.875% Sr. Unsec. Nts., 9/1/19 | | | 2,135,000 | | | | | | | | 2,449,912 | | | |
| | | |
| DreamWorks Animation SKG, Inc., 6.875% Sr. Unsec. Nts., 8/15/201 | | | 1,260,000 | | | | | | | | 1,338,750 | | | |
| | | |
| Entercom Radio LLC, 10.50% Sr. Unsec. Nts., 12/1/19 | | | 1,125,000 | | | | | | | | 1,279,687 | | | |
| | | |
| Gannett Co., Inc., 5.125% Sr. Unsec. Nts., 7/15/201 | | | 1,070,000 | | | | | | | | 1,088,725 | | | |
| | | |
| Gray Television, Inc., 7.50% Sr. Unsec. Nts., 10/1/20 | | | 2,890,000 | | | | | | | | 3,085,075 | | | |
| | | |
| LIN Television Corp., 6.375% Sr. Unsec. Nts., 1/15/21 | | | 1,450,000 | | | | | | | | 1,515,250 | | | |
| | | |
| Myriad International Holdings BV, 6% Sr. Unsec. Nts., 7/18/201 | | | 730,000 | | | | | | | | 784,750 | | | |
| | | |
| Nexstar Broadcasting, Inc., 6.875% Sr. Unsec. Nts., 11/15/20 | | | 1,520,000 | | | | | | | | 1,634,000 | | | |
| | | |
| Sinclair Television Group, Inc.: | | | | | | | | | | | | | | |
| 5.375% Sr. Unsec. Nts., 4/1/21 | | | 1,235,000 | | | | | | | | 1,222,650 | | | |
| 6.125% Sr. Unsec. Nts., 10/1/22 | | | 2,410,000 | | | | | | | | 2,446,150 | | | |
| | | |
| Unitymedia Hessen GmbH & Co. KG/Unitymedia NRW GmbH, 7.50% Sr. Sec. Nts., 3/15/191 | | | 830,000 | | | | | | | | 906,775 | | | |
| | | |
| Univision Communications, Inc., 8.50% Sr. Unsec. Nts., 5/15/211 | | | 1,365,000 | | | | | | | | 1,508,325 | | | |
| | | |
| UPC Holding BV, 6.75% Sr. Unsec. Nts., 3/15/231 | | | 1,400,000 | | | | EUR | | | | 1,979,176 | | | |
| | | |
| UPCB Finance V Ltd., 7.25% Sr. Sec. Nts., 11/15/211 | | | 2,215,000 | | | | | | | | 2,414,350 | | | |
| | | |
| UPCB Finance VI Ltd., 6.875% Sr. Sec. Nts., 1/15/221 | | | 2,765,000 | | | | | | | | 2,951,637 | | | |
| | | |
| Virgin Media Finance plc, 7% Sr. Unsec. Nts., 4/15/231 | | | 755,000 | | | | GBP | | | | 1,306,503 | | | |
| | | |
| Virgin Media Secured Finance plc, 6% Sr. Sec. Nts., 4/15/211 | | | 410,000 | | | | GBP | | | | 700,666 | | | |
| | | | | | | | | | | | | | |
| | | | | | | | | | | 36,252,996 | | | |
| | | |
| Multiline Retail—0.2% | | | | | | | | | | | | | | |
| | | |
| Burlington Coat Factory Warehouse Corp., 10% Sr. Unsec. Nts., 2/15/19 | | | 415,000 | | | | | | | | 469,469 | | | |
| | | |
| Burlington Holdings LLC/Burlington Holding Finance, Inc., 9% Sr. Unsec. Nts., 2/15/181,12 | | | 1,265,000 | | | | | | | | 1,302,950 | | | |
| | | |
| Neiman Marcus Group Ltd., Inc.: | | | | | | | | | | | | | | |
| 8.00% Sr. Unsec. Nts., 10/15/211 | | | 665,000 | | | | | | | | 698,250 | | | |
| 8.75% Sr. Unsec. Nts., 10/15/211,12 | | | 2,360,000 | | | | | | | | 2,483,900 | | | |
| | | | | | | | | | | | | | |
| | | | | | | | | | | 4,954,569 | | | |
| | | |
| Specialty Retail—0.7% | | | | | | | | | | | | | | |
| | | |
| BC Mountain LLC/BC Mountain Finance, Inc., 7% Sr. Unsec. Nts., 2/1/211 | | | 3,240,000 | | | | | | | | 3,288,600 | | | |
| | | |
Claire’s Stores, Inc.: | | | | | | | | | | | | | | |
| 7.75% Sr. Unsec. Nts., 6/1/201 | | | 1,780,000 | | | | | | | | 1,664,300 | | | |
| 8.875% Sr. Unsec. Nts., 3/15/19 | | | 1,555,000 | | | | | | | | 1,609,425 | | | |
| | | | | | | | | | | | |
| | | Principal Amount | | | | | | Value | |
| |
| Specialty Retail Continued | |
| |
| Hot Topic, Inc., 9.25% Sr. Sec. Nts., 6/15/211 | | | 2,785,000 | | | | | | | | 2,931,213 | |
| |
| Michaels FinCo Holdings LLC/Michaels FinCo, Inc., 7.50% Sr. Unsec. Nts., 8/1/181,12 | | $ | 2,530,000 | | | | | | | $ | 2,643,850 | |
| |
| Party City Holdings, Inc., 8.875% Sr. Unsec. Nts., 8/1/20 | | | 1,630,000 | | | | | | | | 1,833,750 | |
| |
| Stackpole International Intermediate/Stackpole International Powder/Stackpl, 7.75% Sr. Sec. Nts., 10/15/211 | | | 1,230,000 | | | | | | | | 1,285,350 | |
| | | | | | | | | | | | |
| | | | | | | | | | | 15,256,488 | |
| |
| Textiles, Apparel & Luxury Goods—0.1% | |
| |
| Levi Strauss & Co., 7.75% Sr. Unsec. Nts., 5/15/18 | | | 145,000 | | | | EUR | | | | 212,442 | |
| |
| Quiksilver, Inc./QS Wholesale, Inc.: | | | | | | | | | | | | |
| 7.875% Sr. Sec. Nts., 8/1/181 | | | 1,060,000 | | | | | | | | 1,155,400 | |
| 10.00% Sr. Unsec. Nts., 8/1/20 | | | 1,060,000 | | | | | | | | 1,203,100 | |
| |
| SIWF Merger Sub, Inc., 6.25% Sr. Sec. Nts., 6/1/211 | | | 1,250,000 | | | | | | | | 1,264,063 | |
| | | | | | | | | | | | |
| | | | | | | | | | | 3,835,005 | |
| |
| Consumer Staples—0.7% | | | | | | | | | | | | |
| |
| Beverages—0.0% | | | | | | | | | | | | |
| |
| Coca-Cola Icecek AS, 4.75% Sr. Unsec. Nts., 10/1/181 | | | 870,000 | | | | | | | | 887,113 | |
| |
Pernod Ricard SA: | | | | | | | | | | | | |
| 4.45% Sr. Unsec. Nts., 1/15/221 | | | 695,000 | | | | | | | | 703,241 | |
| 5.75% Sr. Unsec. Nts., 4/7/211 | | | 585,000 | | | | | | | | 644,998 | |
| | | | | | | | | | | | |
| | | | | | | | | | | 2,235,352 | |
| |
| Food & Staples Retailing—0.2% | |
| |
| BI-LO LLC/BI-LO Finance Corp., 8.625% Sr. Unsec. Nts., 9/15/181,12 | | | 1,225,000 | | | | | | | | 1,286,250 | |
| |
| US Foods, Inc., 8.50% Sr. Unsec. Nts., 6/30/19 | | | 1,690,000 | | | | | | | | 1,852,663 | |
| | | | | | | | | | | | |
| | | | | | | | | | | 3,138,913 | |
| |
| Food Products—0.5% | | | | | | | | | | | | |
| |
| American Seafoods Group LLC/American Seafoods Finance, Inc., 10.75% Sr. Sub. Nts., 5/15/161 | | | 2,770,000 | | | | | | | | 2,880,800 | |
| |
| ASG Consolidated LLC/ASG Finance, Inc., 15% Sr. Nts., 5/15/171,12 | | | 2,794,730 | | | | | | | | 2,438,402 | |
| |
| BRF SA, 5.875% Sr. Unsec. Nts., 6/6/221 | | | 280,000 | | | | | | | | 280,140 | |
| |
| Bumble Bee Holdings, Inc., 9% Sr. Sec. Nts., 12/15/171 | | | 2,809,000 | | | | | | | | 3,089,900 | |
| |
| Chiquita Brands International, Inc./Chiquita Brands LLC, 7.875% Sr. Sec. Nts., 2/1/211 | | | 1,460,000 | | | | | | | | 1,584,100 | |
| |
| MHP SA, 8.25% Sr. Unsec. Nts., 4/2/201 | | | 1,830,000 | | | | | | | | 1,633,641 | |
| |
| Wells Enterprises, Inc., 6.75% Sr. Sec. Nts., 2/1/201 | | | 1,140,000 | | | | | | | | 1,159,950 | |
| | | | | | | | | | | | |
| | | | | | | | | | | 13,066,933 | |
| |
| Tobacco—0.0% | | | | | | | | | | | | |
| |
| Vector Group Ltd., 7.75% Sr. Sec. Nts., 2/15/21 | | | 1,145,000 | | | | | | | | 1,216,563 | |
| |
| Energy—6.3% | | | | | | | | | | | | |
| |
| Energy Equipment & Services—1.2% | |
| |
| Drill Rigs Holdings, Inc., 6.50% Sr. Sec. Nts., 10/1/171 | | | 2,560,000 | | | | | | | | 2,777,600 | |
| |
| Eletson Holdings, 9.625% Sr. Sec. Nts., 1/15/221 | | | 1,245,000 | | | | | | | | 1,282,350 | |
| |
| Exterran Partners LP/EXLP Finance Corp., 6% Sr. Unsec. Nts., 4/1/211 | | | 1,525,000 | | | | | | | | 1,521,188 | |
| |
| Forbes Energy Services Ltd., 9% Sr. Unsec. Nts., 6/15/19 | | | 745,000 | | | | | | | | 733,825 | |
| |
| Hornbeck Offshore Services, Inc., 5.875% Sr. Unsec. Nts., 4/1/20 | | | 2,160,000 | | | | | | | | 2,241,000 | |
| |
| North Atlantic Drilling Ltd., 6.08% Sr. Unsec. Nts., 10/30/181,2 | | | 7,110,000 | | | | NOK | | | | 1,174,587 | |
|
| 15 OPPENHEIMER GLOBAL STRATEGIC INCOME FUND/VA |
CONSOLIDATEDSTATEMENTOF INVESTMENTS Continued
| | | | | | | | | | |
| | | Principal Amount | | | Value | | | |
| | | |
| Energy Equipment & Services Continued | | | |
| | | |
| Odebrecht Offshore Drilling Finance Ltd., 6.75% Sr. Sec. Nts., 10/1/221 | | | $ 1,821,510 | | | $ | 1,868,869 | | | |
| | | |
| Offshore Group Investment Ltd.: | | | | | | | | | | |
| 7.125% Sr. Sec. Nts., 4/1/23 | | | 1,495,000 | | | | 1,532,375 | | | |
| 7.50% Sr. Sec. Nts., 11/1/19 | | | 2,120,000 | | | | 2,316,100 | | | |
| | | |
| Pacific Drilling SA, 5.375% Sr. Sec. Nts., 6/1/201 | | | 1,265,000 | | | | 1,277,650 | | | |
| | | |
| Precision Drilling Corp., 6.625% Sr. Unsec. Nts., 11/15/20 | | | 2,590,000 | | | | 2,777,775 | | | |
| | | |
| QGOG Constellation SA, 6.25% Sr. Unsec. Nts., 11/9/191 | | | 1,380,000 | | | | 1,321,350 | | | |
| | | |
| Seadrill Ltd., 5.625% Sr. Unsec. Nts., 9/15/171 | | | 1,455,000 | | | | 1,513,200 | | | |
| | | |
| Sinopec Group Overseas Development 2013 Ltd., 4.375% Sr. Unsec. Nts., 10/17/231 | | | 1,305,000 | | | | 1,285,862 | | | |
| | | | | | | | | | |
| | | | | | | 23,623,731 | | | |
| | | |
Oil, Gas & Consumable Fuels—5.1% | | | |
| | | |
| Access Midstream Partners LP/ACMP Finance Corp., 6.125% Sr. Unsec. Nts., 7/15/22 | | | 1,640,000 | | | | 1,763,000 | | | |
| | | |
| Afren plc, 6.625% Sr. Sec. Nts., 12/9/201 | | | 775,000 | | | | 778,875 | | | |
| | | |
| Alliance Oil Co. Ltd., 9.875% Sr. Unsec. Nts., 3/11/151 | | | 2,295,000 | | | | 2,424,094 | | | |
| | | |
| Alpha Natural Resources, Inc., 6% Sr. Unsec. Nts., 6/1/19 | | | 1,055,000 | | | | 915,212 | | | |
| | | |
| Antero Resources Finance Corp., 6% Sr. Unsec. Nts., 12/1/20 | | | 1,410,000 | | | | 1,487,550 | | | |
| | | |
Arch Coal, Inc.: 7.25% Sr. Unsec. Nts., 6/15/21 | | | 1,065,000 | | | | 820,050 | | | |
| 8.00% Sec. Nts., 1/15/191 | | | 455,000 | | | | 455,000 | | | |
| | | |
| Atlas Pipeline Partners LP/Atlas Pipeline Finance Corp.: | | | | | | | | | | |
| 5.875% Sr. Unsec. Nts., 8/1/231 | | | 1,280,000 | | | | 1,225,600 | | | |
| 6.625% Sr. Unsec. Nts., 10/1/20 | | | 1,435,000 | | | | 1,506,750 | | | |
| | | |
| Bill Barrett Corp., 7.625% Sr. Unsec. Nts., 10/1/19 | | | 2,355,000 | | | | 2,543,400 | | | |
| | | |
| BreitBurn Energy Partners LP/BreitBurn Finance Corp., 8.625% Sr. Unsec. Nts., 10/15/20 | | | 3,175,000 | | | | 3,429,000 | | | |
| | | |
| Chaparral Energy, Inc., 9.875% Sr. Unsec. Nts., 10/1/20 | | | 650,000 | | | | 737,750 | | | |
| | | |
| Chesapeake Energy Corp., 5.75% Sr. Unsec. Nts., 3/15/23 | | | 1,425,000 | | | | 1,474,875 | | | |
| | | |
| Cimarex Energy Co., 5.875% Sr. Unsec. Unsub. Nts., 5/1/22 | | | 1,700,000 | | | | 1,810,500 | | | |
| | | |
| Cloud Peak Energy Resources LLC/Cloud Peak Energy Finance Corp., 8.50% Sr. Unsec. Nts., 12/15/19 | | | 485,000 | | | | 528,650 | | | |
| | | |
| CNOOC Curtis Funding No 1 Pty Ltd., 4.50% Sr. Unsec. Nts., 10/3/231 | | | 1,280,000 | | | | 1,270,816 | | | |
| | | |
Crestwood Midstream Partners LP/Crestwood Midstream Finance Corp.: | | | | | | | | | | |
| 6.00% Sr. Unsec. Nts., 12/15/20 | | | 495,000 | | | | 512,325 | | | |
| 6.125% Sr. Unsec. Nts., 3/1/221 | | | 1,510,000 | | | | 1,555,300 | | | |
| | | |
| Denbury Resources, Inc., 4.625% Sr. Sub. Nts., 7/15/23 | | | 1,040,000 | | | | 943,800 | | | |
| | | |
| Ecopetrol SA, 7.625% Sr. Unsec. Nts., 7/23/19 | | | 315,000 | | | | 374,850 | | | |
| | | |
| Empresa Nacional del Petroleo: 4.75% Sr. Unsec. Nts., 12/6/211 | | | 1,215,000 | | | | 1,212,619 | | | |
| 5.25% Sr. Unsec. Nts., 8/10/201 | | | 690,000 | | | | 713,708 | | | |
| | | |
| EP Energy LLC/Everest Acquisition Finance, Inc., 7.75% Sr. Unsec. Nts., 9/1/22 | | | 2,450,000 | | | | 2,756,250 | | | |
| | | |
| Gazprom Neft OAO Via GPN Capital SA, 6% Sr. Unsec. Nts., 11/27/231 | | | 2,690,000 | | | | 2,743,800 | | | |
| | | |
| Gazprom OAO Via Gaz Capital SA: | | | | | | | | | | |
| 4.95% Sr. Unsec. Nts., 7/19/221 | | | 4,930,000 | | | | 4,794,425 | | | |
| 5.999% Sr. Unsec. Nts., 1/23/211 | | | 580,000 | | | | 614,800 | | | |
| 8.146% Sr. Unsec. Nts., 4/11/181 | | | 1,950,000 | | | | 2,305,875 | | | |
| 9.25% Sr. Unsec. Nts., 4/23/191 | | | 3,680,000 | | | | 4,544,800 | | | |
| | | | | | | | | | |
| | | | | | | | | | |
| | | | | | | | | | |
| | | | | | | | | | |
| | | | | | | | | | |
| | | | | | | | | | |
| | | | | | | | | | |
| | | | | | | | | | |
| | | | | | | | | | |
| | | | | | | | | | |
| | | | | | | | | | |
| | | | | | | | | | |
| | | | | | | | | | |
| | | | | | | | | | |
| | | | | | | | | | |
| | | | | | | | | | |
| | | | | | | | | | |
| | | | | | | | | | |
| | | | | | | | | | |
| | | | | | | | | | |
| | | | | | | | | | |
| | | | | | | | | | |
| | | | | | | | | | | | |
| | | Principal Amount | | | | | | Value | |
| |
Oil, Gas & Consumable Fuels Continued | |
| |
| Genesis Energy LP/Genesis Energy Finance Corp., 5.75% Sr. Unsec. Nts., 2/15/21 | | | $ 1,480,000 | | | | | | | $ | 1,504,050 | |
| |
| Halcon Resources Corp.: | | | | | | | | | | | | |
| 8.875% Sr. Unsec. Nts., 5/15/21 | | | 2,310,000 | | | | | | | | 2,344,650 | |
| 9.75% Sr. Unsec. Nts., 7/15/201 | | | 605,000 | | | | | | | | 632,981 | |
| |
| Hiland Partners LP/Hiland Partners Finance Corp., 7.25% Sr. Unsec. Nts., 10/1/201 | | | 1,430,000 | | | | | | | | 1,540,825 | |
| |
KazMunayGas National Co. JSC: 7.00% Sr. Unsec. Nts., 5/5/201 | | | 345,000 | | | | | | | | 388,987 | |
| 9.125% Sr. Unsec. Nts., 7/2/181 | | | 905,000 | | | | | | | | 1,100,706 | |
| |
| Kodiak Oil & Gas Corp., 5.50% Sr. Unsec. Nts., 1/15/21 | | | 1,275,000 | | | | | | | | 1,278,188 | |
| |
| LBC Tank Terminals Holding Netherlands BV, 6.875% Sr. Unsec. Nts., 5/15/233 | | | 630,000 | | | | | | | | 654,413 | |
| |
| Lightstream Resources Ltd., 8.625% Sr. Unsec. Nts., 2/1/201 | | | 905,000 | | | | | | | | 918,575 | |
| |
| Linn Energy LLC/Linn Energy Finance Corp., 8.625% Sr. Unsec. Nts., 4/15/20 | | | 4,250,000 | | | | | | | | 4,611,250 | |
| |
| Lukoil International Finance BV, 7.25% Sr. Unsec. Nts., 11/5/191 | | | 590,000 | | | | | | | | 684,400 | |
| |
| MEG Energy Corp.: | | | | | | | | | | | | |
| 6.50% Sr. Unsec. Nts., 3/15/211 | | | 6,150,000 | | | | | | | | 6,503,625 | |
| 7.00% Sr. Unsec. Nts., 3/31/241 | | | 890,000 | | | | | | | | 903,350 | |
| |
Memorial Production Partners LP/Memorial Production Finance Corp.: | | | | | | | | | | | | |
| 7.625% Sr. Unsec. Nts., 5/1/21 | | | 740,000 | | | | | | | | 764,050 | |
| 7.625% Sr. Unsec. Nts., 5/1/211 | | | 685,000 | | | | | | | | 707,263 | |
| |
| Midstates Petroleum Co., Inc./Midstates Petroleum Co. LLC, 9.25% Sr. Unsec. Nts., 6/1/21 | | | 685,000 | | | | | | | | 719,250 | |
| |
| Murray Energy Corp., 8.625% Sr. Sec. Nts., 6/15/211 | | | 635,000 | | | | | | | | 660,400 | |
| |
| Navios Maritime Acquisition Corp./Navios Acquisition Finance US, Inc., 8.125% Sr. Sec. Nts., 11/15/211 | | | 1,245,000 | | | | | | | | 1,276,125 | |
| |
| Novatek OAO via Novatek Finance Ltd.: | | | | | | | | | | | | |
| 4.422% Sr. Unsec. Nts., 12/13/221 | | | 3,350,000 | | | | | | | | 3,090,375 | |
| 7.75% Sr. Unsec. Nts., 2/21/171 | | | 20,260,000 | | | | RUB | | | | 618,746 | |
| |
| Oasis Petroleum, Inc., 6.875% Sr. Unsec. Nts., 1/15/23 | | | 1,110,000 | | | | | | | | 1,187,700 | |
| |
| Odebrecht Drilling Norbe VIII/IX Ltd., 6.35% | | | | | | | | | | | | |
| Sr. Sec. Nts., 6/30/211 | | | 229,500 | | | | | | | | 236,385 | |
| |
| Origin Energy Finance Ltd., 3.50% Sr. Unsec. Nts., 10/9/181 | | | 1,505,000 | | | | | | | | 1,513,318 | |
| |
Pacific Rubiales Energy Corp.: 5.125% Sr. Unsec. Nts., 3/28/231 | | | 1,295,000 | | | | | | | | 1,194,638 | |
| 5.375% Sr. Unsec. Nts., 1/26/191 | | | 1,285,000 | | | | | | | | 1,297,850 | |
| |
| Pemex Project Funding Master Trust, 6.625% Sr. Unsec. Nts., 6/15/35 | | | 1,270,000 | | | | | | | | 1,343,025 | |
| |
| Pertamina Persero PT, 4.875% Sr. Unsec. Nts., 5/3/221 | | | 1,295,000 | | | | | | | | 1,191,400 | |
| |
| Petroleos de Venezuela SA: 5.125% Sr. Unsec. Nts., 10/28/16 | | | 1,010,000 | | | | | | | | 777,700 | |
| 8.50% Sr. Unsec. Nts., 11/2/171 | | | 5,830,000 | | | | | | | | 4,868,050 | |
| |
| Petroleos Mexicanos: | | | | | | | | | | | | |
| 1.95% Sr. Unsec. Nts., 12/20/22 | | | 166,500 | | | | | | | | 163,753 | |
| 2.00% Sec. Nts., 12/20/22 | | | 823,500 | | | | | | | | 811,743 | |
| 3.50% Sr. Unsec. Nts., 1/30/23 | | | 2,940,000 | | | | | | | | 2,701,125 | |
| 4.875% Sr. Unsec. Nts., 1/18/24 | | | 3,940,000 | | | | | | | | 3,949,850 | |
| 5.50% Sr. Unsec. Nts., 6/27/44 | | | 185,000 | | | | | | | | 169,737 | |
| 6.00% Sr. Unsec. Nts., 3/5/20 | | | 3,635,000 | | | | | | | | 4,056,660 | |
| 6.50% Sr. Unsec. Nts., 6/2/41 | | | 1,475,000 | | | | | | | | 1,548,750 | |
| 8.00% Sr. Unsec. Nts., 5/3/19 | | | 965,000 | | | | | | | | 1,172,475 | |
| |
| Petroleum Co. of Trinidad & Tobago Ltd.: | | | | | | | | | | | | |
| 6.00% Sr. Unsec. Nts., 5/8/221 | | | 368,333 | | | | | | | | 392,275 | |
| 9.75% Sr. Unsec. Nts., 8/14/191 | | | 515,000 | | | | | | | | 648,900 | |
| |
| Petronas Capital Ltd., 7.875% Sr. Unsec. Nts., 5/22/221 | | | 1,255,000 | | | | | | | | 1,586,769 | |
|
| 16 OPPENHEIMER GLOBAL STRATEGIC INCOME FUND/VA |
| | | | | | | | | | | | |
| | | |
Oil, Gas & Consumable Fuels Continued | | | |
| | | |
| Range Resources Corp., 5% Sr. Sub. Nts., 8/15/22 | | $ | 995,000 | | | | | $ | 982,562 | | | |
| | | |
| Reliance Industries Ltd., 5.875% Sr. Unsec. Perpetual Bonds1,13 | | | 680,000 | | | | | | 581,400 | | | |
| | | |
| Rentech Nitrogen Partners LP/Rentech Nitrogen Finance Corp., 6.50% Sec. Nts., 4/15/211 | | | 1,555,000 | | | | | | 1,508,350 | | | |
| | | |
| Rosetta Resources, Inc., 5.625% Sr. Unsec. Nts., 5/1/21 | | | 1,525,000 | | | | | | 1,528,813 | | | |
| | | |
| Sabine Pass Liquefaction LLC, 5.625% Sr. Sec. Nts., 2/1/211 | | | 1,230,000 | | | | | | 1,208,475 | | | |
| | | |
| Samson Investment Co., 10.50% Sr. Unsec. Nts., 2/15/201 | | | 2,740,000 | | | | | | 3,000,300 | | | |
| | | |
| Sanchez Energy Corp., 7.75% Sr. Unsec. Nts., 6/15/211 | | | 1,440,000 | | | | | | 1,479,600 | | | |
| | | |
| SandRidge Energy, Inc.: | | | | | | | | | | | | |
| 7.50% Sr. Unsec. Nts., 3/15/21 | | | 1,160,000 | | | | | | 1,220,900 | | | |
| 7.50% Sr. Unsec. Nts., 2/15/23 | | | 1,185,000 | | | | | | 1,208,700 | | | |
| | | |
| Schahin II Finance Co. SPV Ltd., 5.875% Sr. Sec. Nts., 9/25/221 | | | 1,609,440 | | | | | | 1,541,039 | | | |
| | | |
| Sibur Securities Ltd., 3.914% Sr. Unsec. Nts., 1/31/181 | | | 1,470,000 | | | | | | 1,442,438 | | | |
| | | |
| SM Energy Co., 6.50% Sr. Unsec. Nts., 1/1/23 | | | 1,170,000 | | | | | | 1,232,887 | | | |
| | | |
| Tengizchevroil Finance Co. Sarl, 6.124% Sr. Sec. Nts., 11/15/141 | | | 281,959 | | | | | | 288,179 | | | |
| | | |
| Tesoro Logistics LP/Tesoro Logistics Finance Corp., 5.875% Sr. Unsec. Nts., 10/1/20 | | | 1,475,000 | | | | | | 1,515,563 | | | |
| | | |
| Tullow Oil plc, 6% Sr. Unsec. Nts., 11/1/201 | | | 1,151,000 | | | | | | 1,174,020 | | | |
| | | |
| Ultra Petroleum Corp., 5.75% Sr. Unsec. Nts., 12/15/181 | | | 1,130,000 | | | | | | 1,163,900 | | | |
| | | | | | | | | | | | |
| | | | | | | | | 129,035,112 | | | |
| | | |
Financials—8.3% | | | | | | | | | | | | |
| | | |
Capital Markets—1.2% | | | | | | | | | | | | |
| | | |
| American Capital Ltd., 6.50% Sr. Unsec. Nts., 9/15/181 | | | 1,315,000 | | | | | | 1,377,463 | | | |
| | | |
| Cantor Commercial Real Estate Co. LP/CCRE Finance Corp., 7.75% Sr. Unsec. Nts., 2/15/181 | | | 1,880,000 | | | | | | 1,997,500 | | | |
| | | |
| Deutsche Bank AG, 4.296% Jr. Sub. Nts., 5/24/282 | | | 670,000 | | | | | | 606,779 | | | |
| | | |
| Deutsche Bank Capital Trust V, 4.901% Jr. Sub. Perpetual Bonds1,2,13 | | | 610,000 | | | | | | 557,387 | | | |
| | | |
| Goldman Sachs Group, Inc. (The), 0.789% Sr. Unsec. Nts., 2/8/372 | | | 1,059,000 | | | | | | 855,104 | | | |
| | | |
| KION Finance SA, 6.75% Sr. Sec. Nts., 2/15/201 | | | 795,000 | | | EUR | | | 1,197,855 | | | |
| | | |
| Nationstar Mortgage LLC/Nationstar Capital Corp.: | | | | | | | | | | | | |
| 6.50% Sr. Unsec. Nts., 8/1/18 | | | 430,000 | | | | | | 439,675 | | | |
| 7.875% Sr. Unsec. Nts., 10/1/20 | | | 1,655,000 | | | | | | 1,725,338 | | | |
| 10.875% Sr. Unsec. Nts., 4/1/15 | | | 1,295,000 | | | | | | 1,327,375 | | | |
| | | |
| Nuveen Investments, Inc., 9.50% Sr. Unsec. Nts., 10/15/201 | | | 1,215,000 | | | | | | 1,224,112 | | | |
| | | |
| Prospect Medical Holdings, Inc., 8.375% Sr. Sec. Nts., 5/1/191 | | | 1,100,000 | | | | | | 1,185,250 | | | |
| | | |
| Red de Carreteras de Occidente SAPIB de CV, 9% Sr. Sec. Nts., 6/10/281 | | | 23,700,000 | | | MXN | | | 1,642,796 | | | |
| | | |
| Springleaf Finance Corp., 6.90% Sr. Unsec. Nts., 12/15/17 | | | 1,995,000 | | | | | | 2,190,510 | | | |
| | | |
| Tomkins LLC/Tomkins, Inc., 9% Sec. Nts., 10/1/18 | | | 1,473,000 | | | | | | 1,620,300 | | | |
| | | |
| UBS AG (Jersey Branch): | | | | | | | | | | | | |
| 4.28% Jr. Sub. Perpetual Bonds2,13 | | | 195,000 | | | EUR | | | 270,944 | | | |
| 7.152% Jr. Sub. Perpetual Bonds2,13 | | | 125,000 | | | EUR | | | 190,882 | | | |
| 7.25% Sub. Nts., 2/22/222 | | | 2,905,000 | | | | | | 3,191,706 | | | |
| | | |
| US Coatings Acquisition, Inc./Axalta Coating Systems Dutch Holding B BV, 7.375% Sr. Unsec. Nts., 5/1/211 | | | 1,675,000 | | | | | | 1,794,344 | | | |
| | | |
| Verso Paper Holdings LLC/Verso Paper, Inc., 11.75% Sr. Sec. Nts., 1/15/19 | | | 2,350,000 | | | | | | 2,502,750 | | | |
| | | | | | | | | | | | |
| | | | | | | | | | | | |
| | | | | | | | | | | | |
| | | | | | | | | | | | |
| | | | | | | | | | |
| | | Principal Amount | | | | | Value | |
| |
| Capital Markets Continued | | | | | | | | | | |
| |
| Walter Investment Management Corp., 7.875% Sr. Unsec. Nts., 12/15/211 | | $ | 3,400,000 | | | | | $ | 3,459,500 | |
| | | | | | | | | | |
| | | | | | | | | 29,357,570 | |
| |
| Commercial Banks—4.0% | | | | | | | | | | |
| |
| Akbank TAS, 7.50% Sr. Unsec. Nts., 2/5/181 | | | 4,310,000 | | | TRY | | | 1,726,722 | |
| |
| Alfa Bank OJSC Via Alfa Bond Issuance plc, 7.875% Sr. Unsec. Nts., 9/25/171 | | | 1,720,000 | | | | | | 1,917,800 | |
| |
| Banco ABC Brasil SA, 8.50% Sr. Unsec. Nts., 3/28/161 | | | 1,080,000 | | | BRL | | | 418,862 | |
| |
| Banco Bilbao Vizcaya Argentaria SA, 9% Jr. Perpetual Bonds2,13 | | | 50,000 | | | | | | 53,843 | |
| |
| Banco BMG SA: | | | | | | | | | | |
| 8.875% Sub. Nts., 8/5/201 | | | 365,000 | | | | | | 354,050 | |
| 9.15% Sr. Unsec. Nts., 1/15/161 | | | 978,000 | | | | | | 1,000,005 | |
| 9.95% Sub. Nts., 11/5/191 | | | 1,395,000 | | | | | | 1,405,462 | |
| |
| Banco de Costa Rica, 5.25% Sr. Unsec. Nts., 8/12/181 | | | 1,340,000 | | | | | | 1,336,650 | |
| |
| Banco del Estado de Chile: | | | | | | | | | | |
| 3.875% Sr. Unsec. Nts., 2/8/221 | | | 890,000 | | | | | | 871,978 | |
| 4.125% Sr. Unsec. Nts., 10/7/201 | | | 1,305,000 | | | | | | 1,330,603 | |
| |
| Banco do Brasil SA (Cayman), 9.25% Jr. Sub. Perpetual Bonds1,2,13 | | | 2,105,000 | | | | | | 2,178,675 | |
| |
| Banco do Estado do Rio Grande do Sul SA, 7.375% Sub. Nts., 2/2/221 | | | 4,210,000 | | | | | | 4,178,425 | |
| |
| Banco Santander Brasil SA (Cayman Islands), 8% Sr. Unsec. Unsub. Nts., 3/18/161 | | | 1,850,000 | | | BRL | | | 733,178 | |
| |
| Banco Santander Mexico SA Institucion de Banca Multiple Grupo Financiero Santand, 5.95% Jr. Sub. Nts., 1/30/241,2 | | | 1,320,000 | | | | | | 1,339,800 | |
| |
| Bancolombia SA, 5.125% Unsec. Sub. Nts., 9/11/22 | | | 1,850,000 | | | | | | 1,748,250 | |
| |
| Barclays Bank plc: | | | | | | | | | | |
| 4.75% Jr. Sub. Perpetual Bonds2,13 | | | 400,000 | | | EUR | | | 471,023 | |
| 6.00% Jr. Sub. Perpetual Bonds2,13 | | | 1,940,000 | | | GBP | | | 3,027,822 | |
| 14.00% Jr. Sub. Perpetual Bonds2,13 | | | 250,000 | | | GBP | | | 552,748 | |
| |
| Barclays plc, 8.25% Jr. Sub. Perpetual Bonds2,13 | | | 400,000 | | | | | | 413,750 | |
| |
| BBVA Banco Continental SA, 5% Sr. Unsec. Nts., 8/26/221 | | | 1,125,000 | | | | | | 1,127,812 | |
| |
| BNP Paribas SA: | | | | | | | | | | |
| 5.945% Jr. Sub. Perpetual Bonds2,13 | | | 1,890,000 | | | GBP | | | 3,231,475 | |
| 7.195% Jr. Sub. Perpetual Bonds1,2,13 | | | 400,000 | | | | | | 415,000 | |
| |
| BPCE SA: | | | | | | | | | | |
| 5.25% Jr. Sub. Perpetual Bonds2,13 | | | 955,000 | | | EUR | | | 1,330,215 | |
| 5.70% Sub. Nts., 10/22/231 | | | 965,000 | | | | | | 996,150 | |
| 9.00% Jr. Sub. Perpetual Bonds2,13 | | | 2,090,000 | | | EUR | | | 3,058,413 | |
| |
| CIT Group, Inc.: | | | | | | | | | | |
| 4.25% Sr. Unsec. Nts., 8/15/17 | | | 405,000 | | | | | | 423,225 | |
| 5.00% Sr. Unsec. Nts., 8/15/22 | | | 1,740,000 | | | | | | 1,703,744 | |
| |
| Commerzbank AG, 8.125% Sub. Nts., 9/19/231 | | | 2,785,000 | | | | | | 3,084,388 | |
| |
| Corp. Financiera de Desarrollo SA, 4.75% Sr. Unsec. Nts., 2/8/221 | | | 1,275,000 | | | | | | 1,265,437 | |
| |
| CorpGroup Banking SA, 6.75% Sr. Unsec. Nts., 3/15/231 | | | 1,725,000 | | | | | | 1,671,989 | |
| |
| Credit Agricole SA: | | | | | | | | | | |
| 6.637% Jr. Sub. Perpetual Bonds1,2,13 | | | 3,480,000 | | | | | | 3,497,257 | |
| 8.375% Jr. Sub. Perpetual Bonds1,2,13 | | | 2,850,000 | | | | | | 3,249,000 | |
| |
| Danske Bank, 5.684% Jr. Sub. Perpetual Bonds2,13 | | | 1,790,000 | | | GBP | | | 3,023,433 | |
| |
| EUROFIMA, 6.25% Sr. Unsec. Nts., 12/28/18 | | | 935,000 | | | AUD | | | 909,219 | |
| |
| European Investment Bank: | | | | | | | | | | |
| 6.00% Sr. Unsec. Nts., 8/6/20 | | | 465,000 | | | AUD | | | 445,578 | |
| 6.50% Sr. Unsec. Nts., 8/7/19 | | | 565,000 | | | AUD | | | 556,869 | |
| |
| Export-Import Bank of India, 4% Sr. Unsec. Nts., 1/14/23 | | | 460,000 | | | | | | 401,957 | |
|
| 17 OPPENHEIMER GLOBAL STRATEGIC INCOME FUND/VA |
CONSOLIDATEDSTATEMENTOF INVESTMENTS Continued
| | | | | | | | | | | | | | |
| | | Principal Amount | | | | | | Value | | | |
| | | |
| Commercial Banks Continued | | | |
| | | |
| Grupo Aval Ltd.: | | | | | | | | | | | | | | |
| 4.75% Sr. Unsec. Nts., 9/26/221 | | $ | 1,525,000 | | | | | | | $ | 1,410,625 | | | |
| 5.25% Sr. Unsec. Nts., 2/1/171 | | | 430,000 | | | | | | | | 455,370 | | | |
| | | |
| HBOS Capital Funding LP, 6.461% Jr. Sub. Perpetual Bonds2,13 | | | $295,000 | | | | GBP | | | | 501,939 | | | |
| | | |
| Hungarian Development Bank, 6.25% Sr. Unsec. Nts., 10/21/201 | | | 975,000 | | | | | | | | 1,007,906 | | | |
| | | |
| ICICI Bank Ltd., 6.375% Jr. Sub. Nts., 4/30/221,2 | | | 945,000 | | | | | | | | 914,287 | | | |
| | | |
| ICICI Bank Ltd. (Dubai), 4.80% Sr. Unsec. Nts., 5/22/191 | | | 1,340,000 | | | | | | | | 1,351,643 | | | |
| | | |
| Intesa Sanpaolo SpA, 3.875% Sr. Unsec. Nts., 1/15/19 | | | 530,000 | | | | | | | | 527,255 | | | |
| | | |
| LBG Capital No.1 plc: | | | | | | | | | | | | | | |
| 6.439% Sub. Nts., 5/23/20 | | | 1,945,000 | | | | EUR | | | | 2,836,168 | | | |
| 7.869% Sub. Nts., 8/25/20 | | | 265,000 | | | | GBP | | | | 468,886 | | | |
| 11.04% Sub. Nts., 3/19/20 | | | 2,316,000 | | | | GBP | | | | 4,418,538 | | | |
| | | |
| Rabobank Capital Funding Trust IV, 5.556% Jr. Sub. Perpetual Bonds1,2,13 | | | 375,000 | | | | GBP | | | | 639,678 | | | |
| | | |
| RBS Capital Trust III, 5.512% Jr. Sub. Perpetual Bonds2,13 | | | 3,120,000 | | | | | | | | 3,057,600 | | | |
| | | |
| Royal Bank of Scotland Group plc, 6% Sub. Nts., 12/19/23 | | | 2,770,000 | | | | | | | | 2,793,185 | | | |
| | | |
| Royal Bank of Scotland NV: | | | | | | | | | | | | | | |
| 3.372% Sub. Nts., 5/17/182 | | | 275,000 | | | | AUD | | | | 221,498 | | | |
| 3.372% Sub. Nts., 5/17/182 | | | 340,000 | | | | AUD | | | | 273,853 | | | |
| | | |
| Royal Bank of Scotland plc (The): | | | | | | | | | | | | | | |
| 2.375% Sub. Nts., 11/2/15 | | | 85,000 | | | | CHF | | | | 96,371 | | | |
| 13.125% Sub. Nts., 3/19/222 | | | 965,000 | | | | AUD | | | | 1,016,320 | | | |
| | | |
| Santander UK plc, 5% Sub. Nts., 11/7/231 | | | 1,490,000 | | | | | | | | 1,496,058 | | | |
| | | |
| Sberbank of Russia Via SB Capital SA: | | | | | | | | | | | | | | |
| 5.125% Sub. Nts., 10/29/221 | | | 1,365,000 | | | | | | | | 1,310,400 | | | |
| 5.40% Sr. Unsec. Nts., 3/24/17 | | | 790,000 | | | | | | | | 848,420 | | | |
| 6.125% Sr. Unsec. Nts., 2/7/221 | | | 2,100,000 | | | | | | | | 2,220,750 | | | |
| | | |
| Scottish Widows plc, 5.125% Jr. Sub. Perpetual Bonds2,13 | | | 500,000 | | | | GBP | | | | 832,214 | | | |
| | | |
| Skandinaviska Enskilda Banken AB, 2.375% Sr. Unsec. Nts., 11/20/181 | | | 1,410,000 | | | | | | | | 1,404,205 | | | |
| | | |
| Societe Generale SA, 5.922% Jr. Sub. Perpetual Bonds1,2,13 | | | 2,865,000 | | | | | | | | 3,007,230 | | | |
| | | |
| Stadshypotek AB, 6% Sec. Nts., 6/21/17 | | | 5,385,000 | | | | SEK | | | | 951,765 | | | |
| | | |
| Standard Chartered plc, 5.20% Sub. Nts., 1/26/241 | | | 260,000 | | | | | | | | 259,569 | | | |
| | | |
| Toronto-Dominion Bank (The), 2.625% Sr. Unsec. Nts., 9/10/18 | | | 1,395,000 | | | | | | | | 1,423,572 | | | |
| | | |
| Turkiye Is Bankasi AS: | | | | | | | | | | | | | | |
| 5.50% Sr. Unsec. Nts., 4/21/191 | | | 875,000 | | | | | | | | 869,925 | | | |
| 6.00% Sub. Nts., 10/24/221 | | | 1,525,000 | | | | | | | | 1,375,550 | | | |
| 7.244% Unsec. Nts., 1/29/149 | | | 11,800,000 | | | | TRY | | | | 5,455,015 | | | |
| | | |
| Turkiye Sise ve Cam Fabrikalari AS, 4.25% Sr. Unsec. Nts., 5/9/201 | | | 595,000 | | | | | | | | 526,516 | | | |
| | | |
| Turkiye Vakiflar Bankasi Tao: | | | | | | | | | | | | | | |
| 3.75% Sr. Unsec. Nts., 4/15/181 | | | 2,025,000 | | | | | | | | 1,906,538 | | | |
| 5.00% Sr. Unsec. Nts., 10/31/181 | | | 620,000 | | | | | | | | 606,360 | | | |
| | | |
| VTB Bank OJSC Via VTB Capital SA, 6% Sr. Unsec. Nts., 4/12/171 | | | 900,000 | | | | | | | | 958,500 | | | |
| | | |
| Yapi ve Kredi Bankasi AS: | | | | | | | | | | | | | | |
| 5.50% Unsec. Sub. Nts., 12/6/221 | | | 2,005,000 | | | | | | | | 1,699,037 | | | |
| 6.75% Sr. Unsec. Nts., 2/8/171 | | | 1,245,000 | | | | | | | | 1,311,047 | | | |
| | | | | | | | | | | | | | |
| | | | | | | | | | | 105,904,600 | | | |
| | | |
| Consumer Finance—0.6% | | | |
| | | |
| Ahern Rentals, Inc., 9.50% Sec. Nts., 6/15/181 | | | 1,460,000 | | | | | | | | 1,587,750 | | | |
| | | |
| Ally Financial, Inc., 7.50% Sr. Unsec. Nts., 9/15/20 | | | 1,405,000 | | | | | | | | 1,642,094 | | | |
| | | |
| Astana Finance JSC, 9.16% Sr. Unsec. Nts., 12/31/498 | | | 7,200,000 | | | | | | | | 441,000 | | | |
| | | |
| Cash America International, Inc., 5.75% Sr. Unsec. Nts., 5/15/181 | | | 2,920,000 | | | | | | | | 2,788,600 | | | |
| | | | | | | | | | | | |
| | | Principal Amount | | | | | | Value | |
| |
| Consumer Finance Continued | |
| |
| Milestone Aviation Group Ltd. (The), 8.625% Sr. Unsec. Nts., 12/15/171 | | $ | 1,380,000 | | | | | | | $ | 1,480,050 | |
| |
| SLM Corp., 7.25% Sr. Unsec. Nts., 1/25/22 | | | 1,130,000 | | | | | | | | 1,200,625 | |
| |
| Speedy Cash Intermediate Holdings Corp., 10.75% Sec. Nts., 5/15/181 | | | 1,930,000 | | | | | | | | 2,040,975 | |
| |
| TMX Finance LLC/TitleMax Finance Corp., 8.50% Sr. Sec. Nts., 9/15/181 | | | 1,910,000 | | | | | | | | 2,043,700 | |
| | | | | | | | | | | | |
| | | | | | | | | | | 13,224,794 | |
| |
| Diversified Financial Services—1.3% | |
| |
| ABN AMRO Bank NV, 4.31% Jr. Sub. Perpetual Bonds2,13 | | | 3,690,000 | | | | EUR | | | | 5,074,003 | |
| |
| AG Spring Finance II Ltd., 9.50% Sr. Sec. Nts., 6/1/191 | | | 455,000 | | | | EUR | | | | 650,355 | |
| |
| AG Spring Finance Ltd., 7.50% Sr. Sec. Nts., 6/1/181 | | | 345,000 | | | | EUR | | | | 495,974 | |
| |
| Autopistas del Nordeste Cayman Ltd., 9.39% Unsec. Nts., 4/15/241 | | | 2,422,437 | | | | | | | | 2,465,389 | |
| |
| AyT Cedulas Cajas X Fondo de Titulizacion, 3.75% Sec. Nts., 6/30/25 | | | 140,000 | | | | EUR | | | | 169,856 | |
| |
| Baggot Securities Ltd., 10.24% Sec. Perpetual Bonds1,13 | | | 355,000 | | | | EUR | | | | 514,868 | |
| |
| Banco BTG Pactual SA (Cayman Islands): | | | | | | | | | | | | |
| 4.00% Sr. Unsec. Nts., 1/16/201 | | | 2,380,000 | | | | | | | | 2,085,475 | |
| 5.75% Sub. Nts., 9/28/221 | | | 1,205,000 | | | | | | | | 1,048,350 | |
| |
| Banco Invex SA, 6.45% Mtg.-Backed Certificates, Series 062U, 6.45%, 3/13/348, 11 | | | 4,830,531 | | | | MXN | | | | 64,680 | |
| |
| Brazil Loan Trust 1, 5.477% Sec. Nts., 7/24/231 | | | 1,395,000 | | | | | | | | 1,398,488 | |
| |
| Capsugel SA, 7% Sr. Unsec. Nts., 5/15/191,12 | | | 1,500,000 | | | | | | | | 1,530,938 | |
| |
| Cedulas TDA 6 Fondo de Titulizacion de Activos, 3.875% Sec. Nts., 5/23/25 | | | 140,000 | | | | EUR | | | | 172,279 | |
| |
| Chinos Intermediate Holdings A, Inc., 7.75% Sr. Unsec. Nts., 5/1/191,12 | | | 2,140,000 | | | | | | | | 2,193,500 | |
| |
| CNG Holdings, Inc., 9.375% Sr. Sec. Nts., 5/15/201 | | | 200,000 | | | | | | | | 185,000 | |
| |
| Export Credit Bank of Turkey, 5.875% Sr. Unsec. Nts., 4/24/191 | | | 3,240,000 | | | | | | | | 3,289,410 | |
| |
| FTE Verwaltungs GmbH, 9% Sr. Sec. Nts., 7/15/201 | | | 715,000 | | | | EUR | | | | 1,082,603 | |
| |
| ING Verzekeringen NV, 6.375% Sub. Nts., 5/7/272 | | | 2,055,000 | | | | EUR | | | | 3,036,196 | |
| |
| Jefferies Finance LLC/JFIN Co.-Issuer Corp., 7.375% Sr. Unsec. Nts., 4/1/201 | | | 1,715,000 | | | | | | | | 1,792,175 | |
| |
| Jefferies LoanCore LLC/JLC Finance Corp., 6.875% Sr. Unsec. Nts., 6/1/201 | | | 1,685,000 | | | | | | | | 1,676,575 | |
| |
| JPMorgan Hipotecaria su Casita: | | | | | | | | | | | | |
| 6.10% Sec. Nts., 9/25/3511 | | | 1,226,554 | | | | MXN | | | | 133,893 | |
| 6.47% Sec. Nts., 8/26/353,11 | | | 5,808,600 | | | | MXN | | | | 42,264 | |
| |
| Magyar Export-Import Bank RT, 5.50% Sr. Unsec. Nts., 2/12/181 | | | 1,330,000 | | | | | | | | 1,377,388 | |
| |
| National Savings Bank, 8.875% Sr. Unsec. Nts., 9/18/181 | | | 735,000 | | | | | | | | 785,531 | |
| |
| Opal Acquisition, Inc., 8.875% Sr. Unsec. Nts., 12/15/211 | | | 610,000 | | | | | | | | 609,238 | |
| |
| SPCM SA, 5.50% Sr. Sec. Nts., 6/15/201 | | | 295,000 | | | | EUR | | | | 442,356 | |
| |
| Spencer Spirit Holdings, Inc., 9% Sr. Unsec. Nts., 5/1/181,12 | | | 1,685,000 | | | | | | | | 1,722,913 | |
| | | | | | | | | | | | |
| | | | | | | | | | | 34,039,697 | |
| |
| Insurance—0.4% | | | | | | | | | | | | |
| |
| Assicurazioni Generali SpA, 7.75% Sr. Sub. Nts., 12/12/422 | | | 55,000 | | | | EUR | | | | 87,202 | |
| |
| Aviva plc: | | | | | | | | | | | | |
| 5.902% Jr. Sub. Perpetual Bonds2,13 | | | 1,880,000 | | | | GBP | | | | 3,152,101 | |
| 6.125% Jr. Sub. Perpetual Bonds2,13 | | | 1,545,000 | | | | GBP | | | | 2,636,475 | |
| |
| AXA SA, 6.379% Jr. Sub. Perpetual Bonds1,2,13 | | | 530,000 | | | | | | | | 520,725 | |
| |
| Hockey Merger Sub 2, Inc., 7.875% Sr. Unsec. Nts., 10/1/211 | | | 1,505,000 | | | | | | | | 1,553,913 | |
|
| 18 OPPENHEIMER GLOBAL STRATEGIC INCOME FUND/VA |
| | | | | | | | | | | | |
| | | Principal Amount | | | | | Value | | | |
| | | |
| Insurance Continued | | | | | | | | | | | | |
| | | |
| Patriot Merger Corp., 9% Sr. Unsec. Nts., 7/15/211 | | $ | 850,000 | | | | | $ | 896,750 | | | |
| | | |
| Swiss Re Capital I LP, 6.854% Jr. Sub. Perpetual Bonds1,2,13 | | | 2,768,000 | | | | | | 2,939,616 | | | |
| | | |
| Swiss Reinsurance Co. via ELM BV: | | | | | | | | | | | | |
| 3.775% Jr. Sub. Perpetual Bonds2,13 | | | 225,000 | | | AUD | | | 188,516 | | | |
| 7.635% Jr. Sub. Perpetual Bonds2,13 | | | 55,000 | | | AUD | | | 50,855 | | | |
| | | | | | | | | | | | |
| | | | | | | | | 12,026,153 | | | |
| | | |
| Real Estate Investment Trusts (REITs)—0.4% | | | |
| | | |
| DuPont Fabros Technology LP, 5.875% Sr. Unsec. Nts., 9/15/21 | | | 1,535,000 | | | | | | 1,592,563 | | | |
| | | |
| Felcor Lodging LP, 6.75% Sr. Sec. Nts., 6/1/19 | | | 1,175,000 | | | | | | 1,257,250 | | | |
| | | |
| Geo Group, Inc. (The), 5.125% Sr. Unsec. Nts., 4/1/23 | | | 1,615,000 | | | | | | 1,501,950 | | | |
| | | |
| iStar Financial, Inc., 4.875% Sr. Unsec. Nts., 7/1/18 | | | 1,160,000 | | | | | | 1,161,450 | | | |
| | | |
| Omega Healthcare Investors, Inc., 6.75% Sr. Unsec. Nts., 10/15/22 | | | 1,130,000 | | | | | | 1,233,112 | | | |
| | | | | | | | | | | | |
| | | | | | | | | 6,746,325 | | | |
| | | |
| Real Estate Management & Development—0.4% | | | |
| | | |
| Country Garden Holdings Co. Ltd., 7.50% Sr. Unsec. Unsub. Nts., 1/10/231 | | | 2,255,000 | | | | | | 2,170,437 | | | |
| | | |
| Fondo MIVIVIENDA SA, 3.50% Sr. Unsec. Nts., 1/31/231 | | | 1,980,000 | | | | | | 1,777,050 | | | |
| | | |
| Realogy Group LLC: | | | | | | | | | | | | |
| 7.625% Sr. Sec. Nts., 1/15/201 | | | 1,330,000 | | | | | | 1,499,575 | | | |
| 9.00% Sr. Sec. Nts., 1/15/201 | | | 865,000 | | | | | | 1,012,050 | | | |
| | | |
| Techem GmbH, 6.125% Sr. Sec. Nts., 10/1/191 | | | 925,000 | | | EUR | | | 1,392,776 | | | |
| | | | | | | | | | | | |
| | | | | | | | | 7,851,888 | | | |
| | | |
| Health Care—1.5% | | | | | | | | | | | | |
| | | |
| Biotechnology—0.1% | | | | | | | | | | | | |
| | | |
| Universal Hospital Services, Inc., 7.625% Sec. Nts., 8/15/20 | | | 1,570,000 | | | | | | 1,664,200 | | | |
| | | |
| Health Care Equipment & Supplies—0.4% | | | |
| | | |
| Accellent, Inc., 10% Sr. Sub. Nts., 11/1/17 | | | 210,000 | | | | | | 217,875 | | | |
| | | |
| Alere, Inc., 6.50% Sr. Sub. Nts., 6/15/20 | | | 1,045,000 | | | | | | 1,073,738 | | | |
| | | |
| Biomet, Inc.: | | | | | | | | | | | | |
| 6.50% Sr. Unsec. Nts., 8/1/20 | | | 2,090,000 | | | | | | 2,204,950 | | | |
| 6.50% Sr. Unsec. Nts., 10/1/20 | | | 630,000 | | | | | | 652,050 | | | |
| | | |
| ConvaTec Healthcare D Sarl, 10.875% Sr. Unsec. Nts., 12/15/181 | | | 1,195,000 | | | EUR | | | 1,857,676 | | | |
| | | |
| DJO Finance LLC/DJO Finance Corp., 8.75% Sec. Nts., 3/15/18 | | | 1,125,000 | | | | | | 1,240,313 | | | |
| | | |
| Hologic, Inc., 6.25% Sr. Unsec. Nts., 8/1/20 | | | 185,000 | | | | | | 196,100 | | | |
| | | |
| Kinetic Concepts, Inc./KCI USA, Inc., 10.50% Sec. Nts., 11/1/18 | | | 1,840,000 | | | | | | 2,125,200 | | | |
| | | | | | | | | | | | |
| | | | | | | | | 9,567,902 | | | |
| | | |
| Health Care Providers & Services—0.8% | | | |
| | | |
| Acadia Healthcare Co., Inc., 6.125% Sr. Unsec. Nts., 3/15/211 | | | 440,000 | | | | | | 453,200 | | | |
| | | |
| CHS/Community Health Systems, Inc., 7.125% Sr. Unsec. Nts., 7/15/20 | | | 970,000 | | | | | | 1,007,587 | | | |
| | | |
| DaVita HealthCare Partners, Inc., 5.75% Sr. Unsec. Nts., 8/15/22 | | | 895,000 | | | | | | 910,662 | | | |
| | | |
| FGI Operating Co. LLC/FGI Finance, Inc., 7.875% Sec. Nts., 5/1/20 | | | 2,560,000 | | | | | | 2,752,000 | | | |
| | | |
| Fresenius Medical Care US Finance II, Inc.: | | | | | | | | | | | | |
| 5.625% Sr. Unsec. Nts., 7/31/191 | | | 805,000 | | | | | | 873,425 | | | |
| 5.875% Sr. Unsec. Nts., 1/31/221 | | | 405,000 | | | | | | 429,300 | | | |
| | | |
| Gentiva Health Services, Inc., 11.50% Sr. Unsec. Nts., 9/1/18 | | | 1,370,000 | | | | | | 1,421,375 | | | |
| | | |
| HCA, Inc., 7.50% Sr. Unsec. Nts., 2/15/22 | | | 2,695,000 | | | | | | 2,964,500 | | | |
| | | |
| Health Management Associates, Inc., 7.375% Sr. Unsec. Nts., 1/15/20 | | | 1,320,000 | | | | | | 1,483,350 | | | |
| | | |
| HealthSouth Corp., 7.75% Sr. Unsec. Nts., 9/15/22 | | | 761,000 | | | | | | 837,100 | | | |
| | | | | | | | |
| | | Principal Amount | | | Value | |
| |
| Health Care Providers & Services Continued | |
| |
| IASIS Healthcare LLC/IASIS Capital Corp., 8.375% Sr. Unsec. Nts., 5/15/19 | | $ | 2,270,000 | | | $ | 2,417,550 | |
| |
| Kindred Healthcare, Inc., 8.25% Sr. Unsec. Nts., 6/1/19 | | | 1,885,000 | | | | 2,016,950 | |
| |
| LifePoint Hospitals, Inc., 5.50% Sr. Unsec. Nts., 12/1/211 | | | 3,070,000 | | | | 3,089,188 | |
| |
| MultiPlan, Inc., 9.875% Sr. Unsec. Nts., 9/1/181 | | | 1,390,000 | | | | 1,535,950 | |
| |
| Select Medical Corp., 6.375% Sr. Unsec. Nts., 6/1/21 | | | 1,055,000 | | | | 1,036,538 | |
| |
| Tenet Healthcare Corp., 6% Sr. Sec. Nts., 10/1/201 | | | 1,030,000 | | | | 1,076,994 | |
| | | | | | | | |
| | | | | | | 24,305,669 | |
| |
| Life Sciences Tools & Services—0.0% | |
| |
| Jaguar Holding Co. II/Jaguar Merger Sub, Inc., 9.50% Sr. Unsec. Nts., 12/1/191 | | | 990,000 | | | | 1,118,700 | |
| |
| Pharmaceuticals—0.2% | |
| |
| Forest Laboratories, Inc., 5% Sr. Unsec. Nts., 12/15/211 | | | 1,805,000 | | | | 1,816,281 | |
| |
| Salix Pharmaceuticals Ltd., 6% Sr. Unsec. Nts., 1/15/211 | | | 3,060,000 | | | | 3,144,150 | |
| |
| Valeant Pharmaceuticals International, 6.375% Sr. Unsec. Nts., 10/15/201 | | | 920,000 | | | | 974,050 | |
| | | | | | | | |
| | | | | | | 5,934,481 | |
| |
| Industrials—4.1% | | | | | | | | |
| |
| Aerospace & Defense—0.8% | | | | | |
| |
| B/E Aerospace, Inc., 6.875% Sr. Unsec. Nts., 10/1/20 | | | 1,080,000 | | | | 1,190,700 | |
| |
| CBC Ammo LLC/CBC FinCo, Inc., 7.25% Sr. Unsec. Nts., 11/15/211 | | | 2,435,000 | | | | 2,410,650 | |
| |
| DynCorp International, Inc., 10.375% Sr. Unsec. Nts., 7/1/17 | | | 1,985,000 | | | | 2,039,587 | |
| |
| Erickson Air-Crane, Inc., 8.25% Sec. Nts., 5/1/201 | | | 3,057,000 | | | | 3,179,280 | |
| |
| GenCorp, Inc., 7.125% Sec. Nts., 3/15/21 | | | 3,445,000 | | | | 3,703,375 | |
| |
| Huntington Ingalls Industries, Inc., 7.125% Sr. Unsec. Unsub. Nts., 3/15/21 | | | 1,785,000 | | | | 1,967,962 | |
| |
| Kratos Defense & Security Solutions, Inc., 10% Sr. Sec. Nts., 6/1/17 | | | 1,137,000 | | | | 1,232,224 | |
| |
| Schaeffler Finance BV, 8.50% Sr. Sec. Nts., 2/15/191 | | | 1,940,000 | | | | 2,192,200 | |
| |
| TransDigm, Inc., 7.75% Sr. Sub. Nts., 12/15/18 | | | 1,125,000 | | | | 1,212,187 | |
| |
| Triumph Group, Inc., 8.625% Sr. Unsec. Nts., 7/15/18 | | | 650,000 | | | | 705,250 | |
| | | | | | | | |
| | | | | | | 19,833,415 | |
| |
| Air Freight & Couriers—0.1% | |
| |
| Air Medical Group Holdings, Inc., 9.25% Sr. Sec. Nts., 11/1/18 | | | 897,000 | | | | 973,245 | |
| |
| SPL Logistics Escrow LLC/SPL Logistics Finance Corp., 8.875% Sr. Sec. Nts., 8/1/201 | | | 2,560,000 | | | | 2,732,800 | |
| | | | | | | | |
| | | | | | | 3,706,045 | |
| |
| Airlines—0.2% | | | | | | | | |
| |
| Air Canada, 6.75% Sr. Sec. Nts., 10/1/191 | | | 1,100,000 | | | | 1,161,875 | |
| |
| Emirates Airline, 4.50% Sr. Unsec. Nts., 2/6/251 | | | 2,910,000 | | | | 2,677,200 | |
| |
| US Airways 2011-1 Class A Pass Through Trust, 7.125% Pass-Through Certificates, 7.125%, 10/22/23 | | | 1,211,822 | | | | 1,366,329 | |
| | | | | | | | |
| | | | | | | 5,205,404 | |
| |
| Building Products—0.3% | | | | | |
| |
| Nortek, Inc., 8.50% Sr. Unsec. Nts., 4/15/21 | | | 2,740,000 | | | | 3,048,250 | |
|
| 19 OPPENHEIMER GLOBAL STRATEGIC INCOME FUND/VA |
CONSOLIDATED STATEMENT OF INVESTMENTS Continued
| | | | | | | | | | | | |
| | | Principal Amount | | | | | Value | | | |
| | | |
| Building Products Continued | | | |
| | | |
Ply Gem Industries, Inc.: | | | | | | | | | |
| 8.25% Sr. Sec. Nts., 2/15/18 | | | $ 1,163,000 | | | | | | $ 1,244,410 | | | |
| 9.375% Sr. Unsec. Nts., 4/15/17 | | | 1,755,000 | | | | | | 1,904,175 | | | |
| | | | | | | | | | | | |
| | | | | | | | | 6,196,835 | | | |
| | | |
| Commercial Services & Supplies—0.6% | | | |
| | | |
| Affinion Group, Inc., 7.875% Sr. Unsec. Nts., 12/15/18 | | | 3,020,000 | | | | | | 2,733,100 | | | |
| | | |
| Brand Energy & Infrastructure Services, Inc., 8.50% Sr. Unsec. Nts., 12/1/211 | | | 3,070,000 | | | | | | 3,127,563 | | | |
| | | |
| Cenveo Corp., 8.875% Sec. Nts., 2/1/18 | | | 2,955,000 | | | | | | 2,969,775 | | | |
| | | |
| First Data Corp., 6.75% Sr. Sec. Nts., 11/1/201 | | | 2,340,000 | | | | | | 2,445,300 | | | |
| | | |
| R.R. Donnelley & Sons Co., 7.875% Sr. Unsec. Nts., 3/15/21 | | | 1,190,000 | | | | | | 1,326,850 | | | |
| | | |
| STHI Holding Corp., 8% Sec. Nts., 3/15/183 | | | 995,000 | | | | | | 1,069,625 | | | |
| | | |
| Tervita Corp., 8% Sr. Sec. Nts., 11/15/181 | | | 1,220,000 | | | | | | 1,265,750 | | | |
| | | |
| West Corp., 8.625% Sr. Unsec. Nts., 10/1/18 | | | 1,115,000 | | | | | | 1,218,137 | | | |
| | | | | | | | | | | | |
| | | | | | | | | 16,156,100 | | | |
| | | |
| Construction & Engineering—0.3% | | | |
| | | |
| Andrade Gutierrez International SA, 4% Sr. Unsec. Nts., 4/30/181 | | | 1,135,000 | | | | | | 1,075,413 | | | |
| | | |
| IIRSA Norte Finance Ltd., 8.75% Sr. Sec. Nts., 5/30/243 | | | 3,304,817 | | | | | | 3,866,636 | | | |
| | | |
| OAS Investments GmbH, 8.25% Sr. Nts., 10/19/191 | | | 1,790,000 | | | | | | 1,754,200 | | | |
| | | |
| Odebrecht Finance Ltd., 8.25% Sr. Unsec. Nts., 4/25/181 | | | 1,130,000 | | | BRL | | | 398,739 | | | |
| | | | | | | | | | | | |
| | | | | | | | | 7,094,988 | | | |
| | | |
| Electrical Equipment—0.2% | | | |
| | | |
| General Cable Corp., 6.50% Sr. Unsec. Nts., 10/1/221 | | | 1,240,000 | | | | | | 1,221,400 | | | |
| | | |
| Orion Engineered Carbons Bondco GmbH, 10% Nts., 6/15/181 | | | 1,219,500 | | | EUR | | | 1,862,209 | | | |
| | | | | | | | | | | | |
| | | | | | | | | 3,083,609 | | | |
| | | |
| Industrial Conglomerates—0.1% | | | |
| | | |
| General Electric Capital Australia Funding Pty Ltd., 7% Sr. Unsec. Nts., 10/8/15 | | | 625,000 | | | AUD | | | 591,489 | | | |
| | | |
| Hutchison Whampoa Ltd., 3.75% Perpetual Bonds2,13 | | | 110,000 | | | EUR | | | 147,922 | | | |
| | | |
| KOC Holding AS, 3.50% Sr. Unsec. Nts., 4/24/201 | | | 1,870,000 | | | | | | 1,610,444 | | | |
| | | | | | | | | | | | |
| | | | | | | | | 2,349,855 | | | |
| | | |
| Machinery—0.6% | | | |
| | | |
| Actuant Corp., 5.625% Sr. Unsec. Nts., 6/15/22 | | | 1,205,000 | | | | | | 1,226,087 | | | |
| | | |
| Cleaver-Brooks, Inc., 8.75% Sr. Sec. Nts., 12/15/191 | | | 1,690,000 | | | | | | 1,842,100 | | | |
| | | |
| CNH Capital LLC, 6.25% Sr. Unsec. Nts., 11/1/16 | | | 670,000 | | | | | | 742,862 | | | |
| | | |
| Manitowoc Co., Inc. (The), 8.50% Sr. Unsec. Nts., 11/1/20 | | | 2,425,000 | | | | | | 2,764,500 | | | |
| | | |
| Meritor, Inc., 10.625% Sr. Unsec. Nts., 3/15/18 | | | 1,115,000 | | | | | | 1,190,262 | | | |
| | | |
| Navistar International Corp., 8.25% Sr. Unsec. Nts., 11/1/21 | | | 965,000 | | | | | | 1,003,600 | | | |
| | | |
| Terex Corp., 6% Sr. Unsec. Nts., 5/15/21 | | | 2,415,000 | | | | | | 2,508,581 | | | |
| | | |
| Victor Technologies Group, Inc., 9% Sr. Sec. Nts., 12/15/17 | | | 1,871,000 | | | | | | 2,006,647 | | | |
| | | |
| Xerium Technologies, Inc., 8.875% Sr. Unsec. Nts., 6/15/18 | | | 1,580,000 | | | | | | 1,666,900 | | | |
| | | | | | | | | | | | |
| | | | | | | | | 14,951,539 | | | |
| | | |
| Marine—0.1% | | | |
| | | |
| Navios Maritime Holdings, Inc./Navios Maritime Finance II US, Inc., 7.375% Sr. Nts., 1/15/221 | | | 1,330,000 | | | | | | 1,339,975 | | | |
| | | | | | | | | | |
| | | Principal Amount | | | | | Value | |
| |
| Professional Services—0.1% | |
| |
| FTI Consulting, Inc., 6% Sr. Unsec. Nts., 11/15/22 | | | $ 2,565,000 | | | | | | $ 2,609,888 | |
| |
| Road & Rail—0.3% | |
| |
| Avis Budget Car Rental LLC/Avis Budget Finance, Inc., 5.50% Sr. Unsec. Nts., 4/1/23 | | | 1,680,000 | | | | | | 1,635,900 | |
| |
| Kazakhstan Temir Zholy Finance BV, 6.375% Sr. Unsec. Nts., 10/6/201 | | | 860,000 | | | | | | 942,775 | |
| |
| Kenan Advantage Group, Inc. (The), 8.375% Sr. Unsec. Nts., 12/15/183 | | | 2,265,000 | | | | | | 2,395,237 | |
| |
| REFER-Rede Ferroviaria Nacional, 4% Sr. Unsec. Nts., 3/16/15 | | | 540,000 | | | EUR | | | 751,277 | |
| |
| Transnet SOC Ltd., 4% Sr. Unsec. Nts., 7/26/221 | | | 650,000 | | | | | | 575,380 | |
| |
| Ukraine Railways via Shortline plc, 9.50% Sec. Nts., 5/21/181 | | | 310,000 | | | | | | 281,325 | |
| |
| Western Express, Inc., 12.50% Sr. Sec. Nts., 4/15/153 | | | 4,775,000 | | | | | | 3,056,000 | |
| | | | | | | | | | |
| | | | | | | | | 9,637,894 | |
| |
| Trading Companies & Distributors—0.4% | |
| |
| Aircastle Ltd., 4.625% Sr. Unsec. Nts., 12/15/18 | | | 905,000 | | | | | | 914,050 | |
| |
| Fly Leasing Ltd., 6.75% Sr. Unsec. Nts., 12/15/20 | | | 1,695,000 | | | | | | 1,724,663 | |
| |
| HD Supply, Inc., 7.50% Sr. Unsec. Nts., 7/15/20 | | | 3,255,000 | | | | | | 3,523,538 | |
| |
| International Lease Finance Corp., 8.75% Sr. Unsec. Nts., 3/15/17 | | | 1,847,000 | | | | | | 2,184,077 | |
| |
| United Rentals North America, Inc., 7.375% Sr. Unsec. Nts., 5/15/20 | | | 1,125,000 | | | | | | 1,252,969 | |
| | | | | | | | | | |
| | | | | | | | | 9,599,297 | |
| |
| Information Technology—1.4% | |
| |
| Communications Equipment—0.3% | |
| |
| Alcatel-Lucent USA, Inc., 6.75% Sr. Unsec. Nts., 11/15/201 | | | 1,535,000 | | | | | | 1,598,319 | |
| |
| Avaya, Inc., 7% Sr. Sec. Nts., 4/1/191 | | | 1,305,000 | | | | | | 1,285,425 | |
| |
| ViaSat, Inc., 6.875% Sr. Unsec. Nts., 6/15/20 | | | 1,166,000 | | | | | | 1,238,875 | |
| | | | | | | | | | |
| | | | | | | | | 4,122,619 | |
| |
| Computers & Peripherals—0.1% | |
| |
| Denali Borrower LLC/Denali Finance Corp., 5.625% Sr. Sec. Nts., 10/15/201 | | | 1,845,000 | | | | | | 1,833,469 | |
| |
| Electronic Equipment, Instruments, & Components—0.1% | |
| |
| Anixter, Inc., 5.625% Sr. Unsec. Nts., 5/1/19 | | | 980,000 | | | | | | 1,035,125 | |
| |
| Belden, Inc., 5.50% Sr. Sub. Nts., 9/1/221 | | | 1,245,000 | | | | | | 1,226,325 | |
| | | | | | | | | | |
| | | | | | | | | 2,261,450 | |
| |
| Internet Software & Services—0.2% | |
| |
| Cerved Group SpA, 6.375% Sr. Sec. Nts., 1/15/201 | | | 1,110,000 | | | EUR | | | 1,619,718 | |
| |
| EarthLink, Inc., 7.375% Sr. Sec. Nts., 6/1/20 | | | 3,160,000 | | | | | | 3,167,900 | |
| |
| Equinix, Inc., 4.875% Sr. Unsec. Nts., 4/1/20 | | | 1,220,000 | | | | | | 1,220,000 | |
| |
| IAC/InterActiveCorp, 4.75% Sr. Unsec. Nts., 12/15/22 | | | 1,255,000 | | | | | | 1,176,563 | |
| | | | | | | | | | |
| | | | | | | | | 7,184,181 | |
| |
| IT Services—0.3% | |
| |
First Data Corp.: | | | | | | | |
| 8.25% Sec. Nts., 1/15/211 | | | 2,800,000 | | | | | | 2,992,500 | |
| 10.625% Sr. Unsec. Nts., 6/15/211 | | | 730,000 | | | | | | 794,788 | |
| 12.625% Sr. Unsec. Nts., 1/15/21 | | | 1,126,000 | | | | | | 1,327,272 | |
| |
| iPayment, Inc., 10.25% Sr. Unsec. Nts., 5/15/18 | | | 4,380,000 | | | | | | 3,635,400 | |
| | | | | | | | | | |
| | | | | | | | | 8,749,960 | |
| |
| Semiconductors & Semiconductor Equipment—0.2% | |
| |
Freescale Semiconductor, Inc.: | | | | | | | |
| 6.00% Sr. Sec. Nts., 1/15/221 | | | 2,485,000 | | | | | | 2,522,275 | |
| 10.75% Sr. Unsec. Nts., 8/1/20 | | | 1,708,000 | | | | | | 1,947,120 | |
| | | | | | | | | | |
| | | | | | | | | 4,469,395 | |
|
| 20 OPPENHEIMER GLOBAL STRATEGIC INCOME FUND/VA |
| | | | | | | | | | | | |
| | | Principal Amount | | | | | Value | | | |
| | | |
| Software—0.2% | | | |
| | | |
| Blackboard, Inc., 7.75% Sr. Unsec. Nts., 11/15/191 | | | $ 1,865,000 | | | | | | $ 1,860,338 | | | |
| | | |
| BMC Software Finance, Inc., 8.125% Sr. Unsec. Nts., 7/15/211 | | | 1,705,000 | | | | | | 1,764,675 | | | |
| | | |
| Infor US, Inc., 9.375% Sr. Unsec. Nts., 4/1/19 | | | 485,000 | | | | | | 548,050 | | | |
| | | | | | | | | | | | |
| | | | | | | | | 4,173,063 | | | |
| | | |
| Materials—3.7% | | | |
| | | |
| Chemicals—0.7% | | | |
| | | |
| ADS Waste Holdings, Inc., 8.25% Sr. Unsec. Nts., 10/1/20 | | | 1,075,000 | | | | | | 1,171,750 | | | |
| | | |
Braskem Finance Ltd.: | | | | | | | | | |
| 5.375% Sr. Unsec. Nts., 5/2/221 | | | 2,030,000 | | | | | | 1,899,065 | | | |
| 5.75% Sr. Unsec. Nts., 4/15/211 | | | 1,630,000 | | | | | | 1,605,550 | | | |
| | | |
| Hexion US Finance Corp., 6.625% Sr. Sec. Nts., 4/15/20 | | | 1,185,000 | | | | | | 1,220,550 | | | |
| | | |
| Hexion US Finance Corp./Hexion Nova Scotia Finance ULC, 8.875% Sr. Sec. Nts., 2/1/18 | | | 680,000 | | | | | | 709,750 | | | |
| | | |
| Ineos Finance plc, 8.375% Sr. Sec. Nts., 2/15/191 | | | 1,045,000 | | | | | | 1,166,481 | | | |
| | | |
| INEOS Group Holdings SA, 6.125% Sr. Unsec. Nts., 8/15/181 | | | 1,465,000 | | | | | | 1,475,988 | | | |
| | | |
| Mexichem SAB de CV, 4.875% Sr. Unsec. Nts., 9/19/221 | | | 1,365,000 | | | | | | 1,341,112 | | | |
| | | |
| Momentive Performance Materials, Inc., 8.875% Sr. Sec. Nts., 10/15/20 | | | 1,160,000 | | | | | | 1,226,700 | | | |
| | | |
| PetroLogistics LP/PetroLogistics Finance Corp., 6.25% Sr. Unsec. Nts., 4/1/201 | | | 915,000 | | | | | | 921,863 | | | |
| | | |
| PQ Corp., 8.75% Sec. Nts., 5/1/181 | | | 1,140,000 | | | | | | 1,245,450 | | | |
| | | |
| Trinseo Materials Operating SCA/Trinseo Materials Finance, Inc., 8.75% Sr. Sec. Nts., 2/1/191 | | | 1,445,000 | | | | | | 1,499,188 | | | |
| | | | | | | | | | | | |
| | | | | | | | | 15,483,447 | | | |
| | | |
| Construction Materials—0.6% | | | |
| | | |
| Building Materials Corp. of America, 6.75% Sr. Nts., 5/1/211 | | | 1,975,000 | | | | | | 2,142,875 | | | |
| | | |
| Calcipar SA, 6.875% Sr. Sec. Nts., 5/1/181 | | | 90,000 | | | | | | 95,850 | | | |
| | | |
Cemex Espana Luxembourg: | | | | | | | | | |
| 9.25% Sr. Sec. Nts., 5/12/201 | | | 3,280,000 | | | | | | 3,616,200 | | | |
| 9.875% Sr. Sec. Nts., 4/30/191 | | | 3,005,000 | | | | | | 3,448,237 | | | |
| | | |
| Cemex Finance LLC, 9.375% Sr. Sec. Nts., 10/12/221 | | | 1,990,000 | | | | | | 2,253,675 | | | |
| | | |
Cemex SAB de CV: | | | | | | | | | |
| 6.50% Sec. Nts., 12/10/191 | | | 1,560,000 | | | | | | 1,615,380 | | | |
| 7.25% Sr. Sec. Nts., 1/15/211 | | | 1,260,000 | | | | | | 1,307,250 | | | |
| | | |
| HeidelbergCement Finance BV, 8% Sr. Unsec. Nts., 1/31/17 | | | 705,000 | | | EUR | | | 1,136,007 | | | |
| | | |
| Lafarge SA, 5.375% Sr. Unsec. Nts., 6/26/17 | | | 515,000 | | | EUR | | | 783,693 | | | |
| | | | | | | | | | | | |
| | | | | | | | | 16,399,167 | | | |
| | | |
| Containers & Packaging—1.1% | | | |
| | | |
| Ardagh Packaging Finance plc/Ardagh MP Holdings USA, Inc., 7% Sr. Unsec. Nts., 11/15/201 | | | 3,070,000 | | | | | | 3,116,050 | | | |
| | | |
| Berry Plastics Corp., 9.75% Sec. Nts., 1/15/21 | | | 1,580,000 | | | | | | 1,836,750 | | | |
| | | |
| Cascades, Inc., 7.875% Sr. Unsec. Nts., 1/15/20 | | | 1,485,000 | | | | | | 1,596,375 | | | |
| | | |
| Consolidated Container Co. LLC/Consolidated Container Capital, Inc., 10.125% Sr. Unsec. Nts., 7/15/201 | | | 590,000 | | | | | | 631,300 | | | |
| | | |
| Crown Americas LLC/Crown Americas Capital Corp. IV, 4.50% Sr. Unsec. Nts., 1/15/23 | | | 2,335,000 | | | | | | 2,194,900 | | | |
| | | |
| Exopack Holdings SA, 7.875% Sr. Unsec. Nts., 11/1/191 | | | 1,335,000 | | | | | | 1,368,375 | | | |
| | | | | | | | | | |
| | | Principal Amount | | | | | Value | |
| |
| Containers & Packaging Continued | |
| |
| Polymer Group, Inc., 7.75% Sr. Sec. Nts., 2/1/19 | | | $ 1,540,000 | | | | | | $ 1,649,725 | |
| |
| Reynolds Group Issuer, Inc./Reynolds Group Issuer LLC/Reynolds Group Issuer Luxembourg SA: | | | | | | | |
| 5.75% Sr. Sec. Nts., 10/15/20 | | | 1,540,000 | | | | | | 1,578,500 | |
| 9.50% Sr. Unsec. Nts., 4/15/19 | | | 1,285,000 | | | | | | 1,384,587 | |
| |
| Sealed Air Corp.: | | | | | | | |
| 5.25% Sr. Nts., 4/1/231 | | | 1,620,000 | | | | | | 1,583,550 | |
| 6.50% Sr. Unsec. Nts., 12/1/201 | | | 1,445,000 | | | | | | 1,560,600 | |
| |
| Smurfit Kappa Acquisitions: | | | | | | | |
| 4.875% Sr. Sec. Nts., 9/15/181 | | | 664,000 | | | | | | 692,220 | |
| 7.75% Sr. Sec. Nts., 11/15/191 | | | 1,325,000 | | | EUR | | | 1,995,969 | |
| | | | | | | | | | |
| | | | | | | | | 21,188,901 | |
| |
| Metals & Mining—1.3% | |
| |
| Aleris International, Inc.: | | | | | | | |
| 7.625% Sr. Unsec. Nts., 2/15/18 | | | 2,655,000 | | | | | | 2,824,256 | |
| 7.875% Sr. Unsec. Nts., 11/1/20 | | | 2,550,000 | | | | | | 2,722,125 | |
| |
| ALROSA Finance SA, 7.75% Nts., 11/3/201 | | | 3,570,000 | | | | | | 3,975,195 | |
| |
| CSN Islands XI Corp., 6.875% Sr. Unsec. Nts., 9/21/191 | | | 770,000 | | | | | | 802,725 | |
| |
| Evraz Group SA, 6.50% Sr. Unsec. Nts., 4/22/201 | | | 1,515,000 | | | | | | 1,414,631 | |
| |
| Ferrexpo Finance plc, 7.875% Sr. Unsec. Nts., 4/7/161 | | | 1,675,473 | | | | | | 1,629,848 | |
| |
| FMG Resources August 2006 Pty Ltd.: | | | | | | | |
| 6.875% Sr. Unsec. Nts., 2/1/181 | | | ,760,000 | | | | | | 1,856,800 | |
| 6.875% Sr. Unsec. Nts., 4/1/221 | | | 910,000 | | | | | | 996,450 | |
| 8.25% Sr. Unsec. Nts., 11/1/191 | | | 890,000 | | | | | | 1,002,362 | |
| |
| Gerdau Holdings, Inc., 7% Sr. Unsec. Nts., 1/20/201 | | | 305,000 | | | | | | 333,975 | |
| |
| Gerdau Trade, Inc., 5.75% Sr. Unsec. Nts., 1/30/211 | | | 815,000 | | | | | | 835,375 | |
| |
| Gestamp Funding Luxembourg SA, 5.875% Sr. Sec. Nts., 5/31/201 | | | 855,000 | | | EUR | | | 1,246,797 | |
| |
| JMC Steel Group, Inc., 8.25% Sr. Nts., 3/15/181 | | | 205,000 | | | | | | 207,562 | |
| |
| Metalloinvest Finance Ltd., 5.625% Unsec. Nts., 4/17/201 | | | 1,140,000 | | | | | | 1,111,500 | |
| |
| Mexico Generadora de Energia S de RL, 5.50% Sr. Sec. Nts., 12/6/321 | | | 1,270,000 | | | | | | 1,216,025 | |
| |
| MMC Norilsk Nickel OJSC, 5.55% Sr. Unsec. Nts., 10/28/201 | | | 2,020,000 | | | | | | 2,017,475 | |
| |
| Novelis, Inc., 8.75% Sr. Unsec. Nts., 12/15/20 | | | 1,285,000 | | | | | | 1,435,987 | |
| |
| Samarco Mineracao SA: | | | | | | | |
| 4.125% Sr. Unsec. Nts., 11/1/221 | | | 290,000 | | | | | | 261,725 | |
| 5.75% Sr. Unsec. Nts., 10/24/231 | | | 1,060,000 | | | | | | 1,052,050 | |
| |
| Severstal OAO Via Steel Capital SA, 4.45% Sr. Unsec. Nts., 3/19/181 | | | 785,000 | | | | | | 780,094 | |
| |
| Walter Energy, Inc.: | | | | | | | |
| 9.50% Sr. Sec. Nts., 10/15/191 | | | 1,565,000 | | | | | | 1,658,900 | |
| 9.875% Sr. Unsec. Nts., 12/15/20 | | | 1,420,000 | | | | | | 1,235,400 | |
| |
| Wise Metals Group LLC/Wise Alloys Finance Corp., 8.75% Sr. Sec. Nts., 12/15/181 | | | 905,000 | | | | | | 957,038 | |
| |
| Xstrata Finance Canada Ltd., 2.05% Sr. Unsec. Nts., 10/23/151 | | | 1,383,000 | | | | | | 1,401,221 | |
| | | | | | | | | | |
| | | | | | | | | 32,975,516 | |
| |
| Telecommunication Services—3.4% | |
| |
| Diversified Telecommunication Services—2.1% | |
| |
| Altice Financing SA, 6.50% Sec. Nts., 1/15/221 | | | 905,000 | | | | | | 916,313 | |
| |
| Altice Finco SA, 8.125% Sr. Unsec. Nts., 1/15/241 | | | 720,000 | | | | | | 748,800 | |
| |
| Cequel Communications Holdings I LLC/Cequel Capital Corp., 6.375% Sr. Unsec. Nts., 9/15/201 | | | 5,870,000 | | | | | | 6,046,100 | |
| |
| Colombia Telecomunicaciones SA ESP, 5.375% Sr. Unsec. Nts., 9/27/221 | | | 560,000 | | | | | | 525,000 | |
21 OPPENHEIMER GLOBAL STRATEGIC INCOME FUND/VA
CONSOLIDATED STATEMENT OF INVESTMENTS Continued
| | | | | | | | | | | | |
| | | Principal Amount | | | | | Value | | | |
| | | |
| Diversified Telecommunication Services Continued | | | |
| | | |
| Deutsche Telekom International Finance BV, 4.875% Sr. Unsec. Nts., 3/6/421 | | | $ 1,395,000 | | | | | | $ 1,331,547 | | | |
| | | |
| Fairpoint Communications, Inc., 8.75% Sr. Sec. Nts., 8/15/191 | | | 3,600,000 | | | | | | 3,834,000 | | | |
| | | |
| Frontier Communications Corp., 7.625% Sr. Unsec. Nts., 4/15/24 | | | 1,615,000 | | | | | | 1,619,038 | | | |
| | | |
| Intelsat Jackson Holdings SA: | | | | | | | | | |
| 5.50% Sr. Unsec. Nts., 8/1/231 | | | 760,000 | | | | | | 725,800 | | | |
| 7.25% Sr. Unsec. Nts., 10/15/20 | | | 1,460,000 | | | | | | 1,604,175 | | | |
| | | |
| Intelsat Luxembourg SA, 7.75% Sr. Unsec. Nts., 6/1/211 | | | 2,800,000 | | | | | | 3,013,500 | | | |
| | | |
| Koninklijke KPN NV, 6.125% Sr. Sub. Perpetual Bonds2,13 | | | 2,090,000 | | | EUR | | | 3,032,573 | | | |
| | | |
| Level 3 Communications, Inc., 8.875% Sr. Unsec. Nts., 6/1/19 | | | 1,165,000 | | | | | | 1,278,588 | | | |
| | | |
| MetroPCS Wireless, Inc.: | | | | | | | | | |
| 6.25% Sr. Unsec. Unsub. Nts., 4/1/211 | | | 1,610,000 | | | | | | 1,676,413 | | | |
| 6.625% Sr. Unsec. Nts., 11/15/20 | | | 4,340,000 | | | | | | 4,616,675 | | | |
| | | |
| Oi SA, 9.75% Sr. Unsec. Nts., 9/15/161 | | | 2,550,000 | | | BRL | | | 978,171 | | | |
| | | |
| Portugal Telecom International Finance BV: | | | | | | | | | |
| 4.625% Sr. Unsec. Nts., 5/8/20 | | | 1,040,000 | | | EUR | | | 1,469,011 | | | |
| 5.00% Sr. Unsec. Nts., 11/4/19 | | | 350,000 | | | EUR | | | 506,678 | | | |
| 5.625% Sr. Unsec. Nts., 2/8/16 | | | 530,000 | | | EUR | | | 781,943 | | | |
| | | |
| Telecom Italia Capital SA, 7.721% Sr. Unsec. Unsub. Nts., 6/4/38 | | | 1,913,000 | | | | | | 1,922,565 | | | |
| | | |
| Telecom Italia SpA, 7.75% Sub. Nts., 3/20/732 | | | 805,000 | | | EUR | | | 1,146,861 | | | |
| | | |
| Telefonica Chile SA, 3.875% Sr. Unsec. Nts., 10/12/221 | | | 580,000 | | | | | | 532,091 | | | |
| | | |
| Telefonica Europe BV, 6.50% Sr. Sub. Perpetual Bonds2,13 | | | 2,075,000 | | | EUR | | | 3,059,964 | | | |
| | | |
| Telekom Austria AG, 5.625% Sub. Perpetual Bonds2,13 | | | 1,350,000 | | | EUR | | | 1,966,305 | | | |
| | | |
| Telemar Norte Leste SA, 5.50% Sr. Unsec. Nts., 10/23/201 | | | 4,255,000 | | | | | | 4,063,525 | | | |
| | | |
| Verizon Communications, Inc., 6.55% Sr. Unsec. Nts., 9/15/43 | | | 130,000 | | | | | | 152,128 | | | |
| | | |
| Wind Acquisition Finance SA, 7.25% Sr. Sec. Nts., 2/15/181 | | | 2,535,000 | | | | | | 2,680,762 | | | |
| | | |
| Windstream Corp., 7.75% Sr. Unsec. Nts., 10/15/20 | | | 2,845,000 | | | | | | 3,033,481 | | | |
| | | | | | | | | | | | |
| | | | | | | | | 53,262,007 | | | |
| | | |
| Wireless Telecommunication Services—1.3% | | | |
| | | |
| America Movil SAB de CV: | | | | | | | | | |
| 6.45% Sr. Unsec. Nts., 12/5/22 | | | 22,780,000 | | | MXN | | | 1,616,524 | | | |
| 8.46% Sr. Unsec. Nts., 12/18/36 | | | 14,700,000 | | | MXN | | | 1,066,156 | | | |
| | | |
| Digicel Group Ltd., 8.25% Sr. Unsec. Nts., 9/30/201 | | | 1,890,000 | | | | | | 1,967,962 | | | |
| | | |
| ENTEL Chile SA, 4.875% Sr. Unsec. Nts., 10/30/241 | | | 1,325,000 | | | | | | 1,295,450 | | | |
| | | |
| Millicom International Cellular SA, 6.625% Sr. Unsec. Nts., 10/15/211 | | | 840,000 | | | | | | 873,180 | | | |
| | | |
| Mobile Telesystems OJSC via MTS International Funding Ltd.: | | | | | | | | | |
| 5.00% Sr. Unsec. Nts., 5/30/231 | | | 1,145,000 | | | | | | 1,076,300 | | | |
| 8.625% Sr. Unsec. Nts., 6/22/201 | | | 1,450,000 | | | | | | 1,718,250 | | | |
| | | |
| SBA Telecommunications, Inc., 5.75% Sr. Unsec. Nts., 7/15/20 | | | 785,000 | | | | | | 820,325 | | | |
| | | |
| Sistema JSFC via Sistema International Funding SA, 6.95% Sr. Unsec. Nts., 5/17/191 | | | 680,000 | | | | | | 727,600 | | | |
| | | |
| Sprint Communications, Inc., 9% Sr. Unsec. Nts., 11/15/181 | | | 1,045,000 | | | | | | 1,261,837 | | | |
| | | |
| Sprint Corp., 7.25% Sr. Unsec. Nts., 9/15/211 | | | 1,610,000 | | | | | | 1,734,775 | | | |
| | | |
| Vimpel Communications Via VIP Finance Ireland Ltd. OJSC: | | | | | | | | | |
| 7.748% Sr. Unsec. Nts., 2/2/211 | | | 2,140,000 | | | | | | 2,329,925 | | | |
| 9.125% Sr. Unsec. Nts., 4/30/181 | | | 4,520,000 | | | | | | 5,322,300 | | | |
| | | | | | | | | | |
| | | Principal Amount | | | | | Value | |
| |
| Wireless Telecommunication Services Continued | |
| |
| VimpelCom Holdings BV: | | | | | | | |
| 5.95% Sr. Unsec. Unsub. Nts., 2/13/231 | | | $ 2,400,000 | | | | | | $ 2,274,000 | |
| 7.504% Sr. Unsec. Nts., 3/1/221 | | | 4,930,000 | | | | | | 5,162,302 | |
| 9.00% Sr. Unsec. Nts., 2/13/181 | | | 47,100,000 | | | RUB | | | 1,439,163 | |
| |
| Vimpel-Communications OJSC: | | | | | | | |
| 8.85% Sr. Unsec. Nts., 3/8/222 | | | 26,000,000 | | | RUB | | | 800,766 | |
| | | | | | | | | | |
| | | | | | | | | 31,486,815 | |
| |
| Utilities—2.4% | |
| |
| Electric Utilities—1.3% | |
| |
| Bhira Investments Ltd., 8.50% Jr. Sub. Nts., 4/27/712 | | | 50,000 | | | | | | 50,053 | |
| |
| Dubai Electricity & Water Authority, 7.375% Sr. Unsec. Nts., 10/21/201 | | | 5,120,000 | | | | | | 5,990,400 | |
| |
| EDP Finance BV, 6% Sr. Unsec. Nts., 2/2/181 | | | 1,395,000 | | | | | | 1,501,020 | |
| |
| Electricite de France SA, 5.25% Jr. Sub. Perpetual Bonds1,2,13 | | | 2,430,000 | | | | | | 2,420,951 | |
| |
| Empresas Publicas de Medellin ESP: | | | | | | | |
| 7.625% Sr. Unsec. Nts., 7/29/191 | | | 865,000 | | | | | | 1,025,025 | |
| 8.375% Sr. Unsec. Nts., 2/1/211 | | | 2,227,465,000 | | | COP | | | 1,203,754 | |
| |
| Enel SpA: | | | | | | | |
| 6.50% Jr. Sub. Nts., 1/10/742 | | | 590,000 | | | EUR | | | 872,415 | |
| 8.75% Sub. Nts., 9/24/731,2 | | | 575,000 | | | | | | 627,392 | |
| |
| Eskom Holdings Ltd.: | | | | | | | |
| 5.75% Sr. Unsec. Nts., 1/26/211 | | | 690,000 | | | | | | 690,000 | |
| 6.75% Sr. Unsec. Nts., 8/6/231 | | | 2,230,000 | | | | | | 2,291,325 | |
| |
| Iberdrola International BV, 5.75% Sub. Perpetual Bonds2,13 | | | 1,035,000 | | | EUR | | | 1,510,438 | |
| |
| Israel Electric Corp. Ltd.: | | | | | | | |
| 6.70% Sr. Sec. Nts., 2/10/171 | | | 1,885,000 | | | | | | 2,049,770 | |
| 7.25% Sr. Sec. Nts., 1/15/191 | | | 8,830,000 | | | | | | 9,817,945 | |
| 9.375% Sr. Sec. Nts., 1/28/201 | | | 425,000 | | | | | | 515,645 | |
| |
| National Power Corp., 5.875% Sr. Unsec. Nts., 12/19/16 | | | 109,600,000 | | | PHP | | | 2,660,330 | |
| |
| Perusahaan Listrik Negara PT, 5.50% Sr. Unsec. Nts., 11/22/211 | | | 1,295,000 | | | | | | 1,252,912 | |
| | | | | | | | | | |
| | | | | | | | | 34,479,375 | |
| |
| Energy Traders—0.7% | |
| |
| AES Corp.: | | | | | | | |
| 7.375% Sr. Unsec. Nts., 7/1/21 | | | 1,045,000 | | | | | | 1,183,462 | |
| 8.00% Sr. Unsec. Nts., 10/15/17 | | | 1,100,000 | | | | | | 1,298,000 | |
| |
| Calpine Corp.: | | | | | | | |
| 7.50% Sr. Sec. Nts., 2/15/211 | | | 912,000 | | | | | | 999,780 | |
| 7.875% Sr. Sec. Nts., 1/15/231 | | | 884,000 | | | | | | 970,190 | |
| |
| Colbun SA, 6% Sr. Unsec. Nts., 1/21/201 | | | 2,150,000 | | | | | | 2,315,000 | |
| |
| Comision Federal de Electricidad, 4.875% Sr. Unsec. Nts., 1/15/241 | | | 1,310,000 | | | | | | 1,303,450 | |
| |
| Dynegy, Inc., 5.875% Sr. Unsec. Nts., 6/1/231 | | | 420,000 | | | | | | 399,000 | |
| |
| Energy Future Intermediate Holding Co. LLC/EFIH Finance, Inc.: | | | | | | | |
| 10.00% Sr. Sec. Nts., 12/1/201 | | | 1,840,000 | | | | | | 1,959,600 | |
| 12.25% Sec. Nts., 3/1/221 | | | 1,715,000 | | | | | | 2,023,700 | |
| |
| Infinis plc, 7% Sr. Sec. Nts., 2/15/193 | | | 870,000 | | | GBP | | | 1,545,126 | |
| |
| Instituto Costarricense de Electricidad, 6.95% Sr. Unsec. Nts., 11/10/211 | | | 190,000 | | | | | | 195,937 | |
| |
| NRG Energy, Inc., 6.625% Sr. Unsec. Nts., 3/15/23 | | | 1,455,000 | | | | | | 1,473,188 | |
| |
| Power Sector Assets & Liabilities Management Corp., 7.39% Sr. Unsec. Nts., 12/2/241 | | | 415,000 | | | | | | 508,375 | |
| | | | | | | | | | |
| | | | | | | | | 16,174,808 | |
| |
| Gas Utilities—0.3% | |
| |
| AmeriGas Finance LLC/AmeriGas Finance Corp., 6.75% Sr. Unsec. Nts., 5/20/20 | | | 2,595,000 | | | | | | 2,848,012 | |
| |
| Empresa de Energia de Bogota SA, 6.125% Sr. Unsec. Nts., 11/10/211 | | | 1,145,000 | | | | | | 1,225,150 | |
22 OPPENHEIMER GLOBAL STRATEGIC INCOME FUND/VA
| | | | | | | | | | | | |
| | | Principal Amount | | | | | Value | | | |
Gas Utilities Continued | | | |
| Ferrellgas LP/Ferrellgas Finance Corp., 6.50% Sr. Unsec. Nts., 5/1/21 | | | $ 735,000 | | | | | | $ 753,375 | | | |
| Gas Natural Capital Markets SA, 4.375% Sr. Unsec. Nts., 11/2/16 | | | 895,000 | | | EUR | | | 1,337,506 | | | |
| Gas Natural de Lima y Callao SA, 4.375% Sr. Unsec. Nts., 4/1/231 | | | 710,000 | | | | | | 660,300 | | | |
| Transportadora de Gas Internacional SA ESP, 5.70% Sr. Unsec. Nts., 3/20/221 | | | 585,000 | | | | | | 622,294 | | | |
| | | | | | | | | | 7,446,637 | | | |
Multi-Utilities—0.1% | | | |
| National Grid North America, Inc., 1.75% Unsec. Nts., 2/20/18 | | | 990,000 | | | EUR | | | 1,372,478 | | | |
| Veolia Environnement SA, 4.45% Jr. Sub. Perpetual Bonds2,13 | | | 715,000 | | | EUR | | | 976,974 | | | |
| | | | | | | | | 2,349,452 | | | |
Total Corporate Bonds and Notes | | | | | | | | | | | | |
(Cost $904,385,080) | | | | | | | | | 909,352,820 | | | |
| | | | |
| | | Shares | | | | | | | | |
Preferred Stock—0.1% | | | |
| Ally Financial, Inc., 7% Cum., Series G, Non-Vtg.1,13 (Cost $2,433,315) | | | 2,583 | | | | | | 2,479,922 | | | |
| | | | | | | | | | | | | |
Common Stocks—0.2% | | | |
| American Media Operations, Inc.14 | | | 219,796 | | | | | | 1,428,674 | | | |
| Arco Capital Corp. Ltd.3,14 | | | 690,638 | | | | | | — | | | |
| Nortek, Inc.14 | | | 24,095 | | | | | | 1,797,487 | | | |
| Premier Holdings Ltd.14 | | | 18,514 | | | | | | — | | | |
| Revel Entertainment14 | | | 16,153 | | | | | | — | | | |
| Wallace Theater Holdings, Inc.3,14 | | | 1,525 | | | | | | 15,296 | | | |
Total Common Stocks (Cost $9,558,022) | | | | | | | | | 3,241,457 | | | |
| | | | |
| | | Principal Amount | | | | | | | | |
Structured Securities—1.0% | | | |
| Citigroup Global Markets Holdings, Inc., Republic of Colombia Credit Linked Nts., Series 2, 10%, 7/25/24 | | | 1,549,000,000 | | | COP | | | 990,718 | | | |
| Coriolanus Ltd., 18.665% Sr. Sec. Nts., 12/31/173,11 | | | 12,850,000 | | | BRR | | | 7,831,188 | | | |
| Credit Suisse First Boston International, Moitk Total Return Linked Nts., 21%, 3/30/118 | | | 53,910,000 | | | RUR | | | — | | | |
| Credit Suisse First Boston, Inc. (Nassau Branch), Russian Specialized Construction & Installation Administration Total Return Linked Nts., 13%, 5/24/108 | | | 97,250,000 | | | RUR | | | — | | | |
| | | | | | | | | | |
| | | Principal Amount | | | | | Value | |
| Structured Securities Continued | |
| Deutche Bank AG, Opic Reforma I Credit Linked Nts.: | | | | | | | |
| Cl. 2A, 7.208%, 5/25/1522,3 | | | 697,693 | | | MXN | | | $ 50,182 | |
| Cl. 2B, 7.208%, 5/25/152,3 | | | 1,220,632 | | | MXN | | | 87,795 | |
| Cl. 2C, 7.208%, 5/25/152,3 | | | 18,404,162 | | | MXN | | | 1,323,735 | |
| Cl. 2D, 7.208%, 5/25/152,3 | | | 1,341,270 | | | MXN | | | 96,472 | |
| Cl. 2E, 7.208%, 5/25/152,3 | | | 974,458 | | | MXN | | | 70,089 | |
| Cl. 2F, 7.208%, 5/25/152,3 | | | 622,337 | | | MXN | | | 44,762 | |
| Cl. 2G, 7.208%, 5/25/152,3 | | | 114,609 | | | MXN | | | 8,243 | |
| Deutsche Bank AG, Coriolanus Ltd. Sec. Credit Linked Bonds: | | | | | | | |
| 3.01%, 4/30/251,9 | | | 1,560,019 | | | | | | 1,057,517 | |
| 3.138%, 4/30/251,9 | | | 1,533,946 | | | | | | 1,039,842 | |
| 3.191%, 4/30/251,9 | | | 1,909,887 | | | | | | 1,294,687 | |
| 3.242%, 4/30/251,9 | | | 2,179,846 | | | | | | 1,477,689 | |
| 3.269%, 4/30/251,9 | | | 1,741,442 | | | | | | 1,180,501 | |
| 3.346%, 4/30/251,9 | | | 1,636,882 | | | | | | 1,109,621 | |
| 3.905%, 4/30/251,9 | | | 1,987,705 | | | | | | 1,347,439 | |
| 4.005%, 4/30/251,9 | | | 1,716,065 | | | | | | 1,163,298 | |
| Goldman Sachs Capital Markets LP, Republic of Colombia Credit Linked Nts., Cl. B, 10%, 7/30/241 | | | 4,250,000,000 | | | COP | | | 2,718,238 | |
| LB Peru Trust II Certificates, Series 1998-A, 3.796%, 2/28/168,9 | | | 2,994 | | | | | | 2,998 | |
| Morgan Stanley, Russian Federation Total Return Linked Bonds, Series 007, Cl. VR, 5%, 8/22/34 | | | 45,996,391 | | | RUR | | | 701,305 | |
| Total Structured Securities (Cost $29,173,595) | | | | | | | | | 23,596,319 | |
| | | |
| | | Units | | | | | | |
| Rights, Warrants and Certificates—–0.0% | |
| MediaNews Group, Inc. Wts., Strike Price $48.72, 3/19/1714 | | | | | | | | | | |
| (Cost $6,331,150) | | | 22,685 | | | | | | — | |
| | | |
| | | Shares | | | | | | |
Investment Companies—6.6% | | | | | | | | | | |
| iShares iBoxx $ High Yield Corporate Bond Exchange Traded Fund | | | 118,300 | | | | | | 10,987,705 | |
| Oppenheimer Institutional Money Market Fund, Cl. E, 0.09%16,17 | | | 33,054,028 | | | | | | 33,054,028 | |
| Oppenheimer Master Event-Linked Bond Fund, LLC16 | | | 4,827,322 | | | | | | 66,588,345 | |
| Oppenheimer Master Loan Fund, LLC16 | | | 1,023,461 | | | | | | 14,576,015 | |
| Oppenheimer Ultra-Short Duration Fund, Cl. Y16 | | | 3,707,723 | | | | | | 37,151,380 | |
| Total Investment Companies | | | | | | | | | | |
| (Cost $160,470,606) | | | | | | | | | 162,357,473 | |
| | | | | | | | | | | | | | | | | | | | | | | | | | | | | | |
| | | Counterparty | | | Buy / Sell Protection | | | Reference Asset | | | Fixed Rate | | | Expiration Date | | | Notional Amount (000’s) | | | Premium Received / (Paid) | | | Value |
|
Over-the-Counter Credit Default Swaptions Purchased—0.0% |
| Credit Default | | | | | | | | | | | | | | | | | | | | | | | | | | | | | | |
| Swap maturing | | | | | | | | | | | | | | | | | | | | | | | | | | | | | | |
| 12/20/18 Call14 | | | JPM | | | | Buy | | | | CDX.NA.HY.21 | | | | 5.000% | | | | 2/19/14 USD | | | | 675 | | | $ | 5,940 | | | 1,406 |
| Credit Default | | | | | | | | | | | | | | | | | | | | | | | | | | | | | | |
| Swap maturing | | | | | | | | | | | iTraxx Europe Series | | | | | | | | | | | | | | | | | | | |
| 12/20/18 Call14 | | | JPM | | | | Buy | | | | 20 Version 1 | | | | 1.000 | | | | 2/19/14 EUR | | | | 14,585 | | | | 42,567 | | | 6,888 |
| Credit Default | | | | | | | | | | | | | | | | | | | | | | | | | | | | | | |
| Swap maturing | | | | | | | | | | | | | | | | | | | | | | | | | | | | | | |
| 12/20/18 Call14 | | | JPM | | | | Buy | | | | CDX.NA.HY.21 | | | | 5.000 | | | | 1/15/14 USD | | | | 1,805 | | | | 14,440 | | | 250 |
| Credit Default | | | | | | | | | | | | | | | | | | | | | | | | | | | | | | |
| Swap maturing | | | | | | | | | | | iTraxx Europe Series | | | | | | | | | | | | | | | | | | | |
| 12/20/18 Call14 | | | BAC | | | | Buy | | | | 20 Version 1 | | | | 1.000 | | | | 1/15/14 EUR | | | | 7,135 | | | | 21,742 | | | 22 |
| Credit Default | | | | | | | | | | | | | | | | | | | | | | | | | | | | | | |
| Swap maturing | | | | | | | | | | | | | | | | | | | | | | | | | | | | | | |
| 12/20/18 Call14 | | | JPM | | | | Buy | | | | CDX.NA.HY.21 | | | | 5.000 | | | | 1/15/14 USD | | | | 1,805 | | | | 16,065 | | | 250 |
| | | | | | | | | | | | | | | | | | | | | | | | | | | | | | |
| Total Over-the-Counter Credit Default Swaptions Purchased (Cost $100,754) | | | 8,816 |
23 OPPENHEIMER GLOBAL STRATEGIC INCOME FUND/VA
CONSOLIDATED STATEMENT OF INVESTMENTS Continued
| | | | | | | | | | | | | | | | | | | | | | | | | | |
| | | Counterparty | | | Pay / Receive
Floating Rate | | | Floating Rate | | | Fixed Rate | | | Expiration Date | | | Notional
Amount
(000’s) | | | Value |
|
Over-the-Counter Interest Rate Swaptions Purchased—0.2% |
Interest Rate Swap maturing 3/19/24 Call14 | | | BAC | | | | Receive | | |
| Three-Month USD
BBA LIBOR |
| | | 2.745 | % | | | 3/17/14 | | | USD | 6,055 | | | $ 6,466 |
Interest Rate Swap maturing 2/18/24 Call14 | | | GSG | | | | Pay | | |
| Six-Month EUR
EURIBOR |
| | | 2.069 | | | | 2/14/14 | | | EUR | 11,775 | | | 229,874 |
Interest Rate Swap maturing 2/19/24 Call14 | | | UBS | | | | Pay | | |
| Six-Month EUR
EURIBOR |
| | | 2.080 | | | | 2/17/14 | | | EUR | 11,780 | | | 221,250 |
Interest Rate Swap maturing 4/1/19 Call14 | | | GSG | | | | Pay | | |
| Three-Month USD
BBA LIBOR |
| | | 1.703 | | | | 3/28/14 | | | USD | 29,445 | | | 441,467 |
Interest Rate Swap maturing 5/8/19 Call14 | | | JPM | | | | Pay | | |
| Three-Month USD
BBA LIBOR |
| | | 1.795 | | | | 5/6/14 | | | USD | 46,935 | | | 737,608 |
Interest Rate Swap maturing 2/12/24 Call14 | | | JPM | | | | Pay | | |
| Three-Month USD
BBA LIBOR |
| | | 2.975 | | | | 2/10/14 | | | USD | 11,730 | | | 212,272 |
Interest Rate Swap maturing 3/19/19 Call14 | | | UBS | | | | Pay | | |
| Six-Month EUR
EURIBOR |
| | | 1.490 | | | | 3/17/14 | | | EUR | 46,385 | | | 209,882 |
Interest Rate Swap maturing 12/4/45 Call14 | | | GSG | | | | Pay | | |
| Six-Month GBP BBA
LIBOR |
| | | 3.275 | | | | 12/4/15 | | | GBP | 1,320 | | | 227,306 |
Interest Rate Swap maturing 3/10/19 Call14 | | | JPM | | | | Pay | | |
| Three-Month USD
BBA LIBOR |
| | | 2.005 | | | | 3/6/14 | | | USD | 59,555 | | | 282,421 |
Interest Rate Swap maturing 5/22/24 Call14 | | | JPM | | | | Pay | | |
| Three-Month USD
BBA LIBOR |
| | | 3.220 | | | | 5/20/14 | | | USD | 11,815 | | | 238,660 |
Interest Rate Swap maturing 11/25/44 Call14 | | | BAC | | | | Pay | | |
| Six-Month EUR
EURIBOR |
| | | 3.445 | | | | 11/25/14 | | | GBP | 1,355 | | | 117,317 |
Interest Rate Swap maturing 5/2/19 Call14 | | | UBS | | | | Pay | | |
| Three-Month USD
BBA LIBOR |
| | | 2.010 | | | | 4/30/14 | | | USD | 17,495 | | | 165,905 |
Interest Rate Swap maturing 8/4/46 Call14 | | | BOA | | | | Pay | | |
| Three-Month USD
BBA LIBOR |
| | | 4.860 | | | | 8/2/16 | | | USD | 1,395 | | | 79,425 |
Interest Rate Swap maturing 4/10/19 Call14 | | | JPM | | | | Pay | | |
| Three-Month USD
BBA LIBOR |
| | | 2.145 | | | | 4/8/14 | | | USD | 28,960 | | | 153,104 |
Interest Rate Swap maturing 7/27/46 Call14 | | | BOA | | | | Pay | | |
| Three-Month USD
BBA LIBOR |
| | | 3.890 | | | | 7/25/16 | | | USD | 6,860 | | | 936,017 |
Interest Rate Swap maturing 4/27/47 Call14 | | | BAC | | | | Pay | | |
| Three-Month USD
BBA LIBOR |
| | | 3.480 | | | | 4/25/17 | | | USD | 5,040 | | | 1,034,044 |
Interest Rate Swap maturing 5/30/33 Call14 | | | BAC | | | | Pay | | |
| Six-Month GBP BBA
LIBOR |
| | | 3.990 | | | | 5/30/23 | | | GBP | 1,235 | | | 105,467 |
Interest Rate Swap maturing 1/28/17 Call14 | | | UBS | | | | Pay | | |
| Three-Month USD
BBA LIBOR |
| | | 0.840 | | | | 1/24/14 | | | USD | 24,100 | | | 68,155 |
Interest Rate Swap maturing 1/31/19 Call14 | | | BOA | | | | Pay | | |
| Three-Month USD
BBA LIBOR |
| | | 1.590 | | | | 1/29/14 | | | USD | 2,645 | | | 33,450 |
Interest Rate Swap maturing 1/24/17 Call14 | | | BAC | | | | Pay | | |
| Three-Month USD
BBA LIBOR |
| | | 0.835 | | | | 1/22/14 | | | USD | 5,445 | | | 14,471 |
Interest Rate Swap maturing 1/10/19 Call14 | | | BAC | | | | Pay | | |
| Three-Month USD
BBA LIBOR |
| | | 1.985 | | | | 1/8/14 | | | USD | 28,960 | | | 4,148 |
Interest Rate Swap maturing 1/13/19 Call14 | | | BOA | | | | Pay | | |
| Three-Month USD
BBA LIBOR |
| | | 1.993 | | | | 1/9/14 | | | USD | 17,800 | | | 3,359 |
| | | | | | | | | | | | | | | | | | | | | | | | | | |
Total Over-the-Counter Interest Rate Swaptions Purchased (Cost 4,420,162) | | | 5,522,068 |
24 OPPENHEIMER GLOBAL STRATEGIC INCOME FUND/VA
| | | | | | | | | | | | | | | | | | | | | | | | | | |
| | | Counterparty | | | | | | Exercise Price | | | Expiration Date | | | | | | Contracts | | | Value |
|
Over-the-Counter Options Purchased—0.0% |
AUD Currency14 | | | BOA | | | | JPY | | | | 95.500 | | | | 8/4/14 | | | | AUD | | | | 1,395,000 | | | $ 24,717 |
AUD Currency14 | | | GSG | | | | JPY | | | | 102.000 | | | | 9/10/14 | | | | AUD | | | | 1,970,000 | | | 11,146 |
BRL Currency14 | | | GSG | | | | BRL | | | | 2.300 | | | | 1/9/14 | | | | BRL | | | | 19,760,000 | | | 4,387 |
CAD Currency14 | | | JPM | | | | CAD | | | | 1.084 | | | | 11/17/14 | | | | CAD | | | | 730,000 | | | 14,905 |
CNH Currency14 | | | JPM | | | | CNH | | | | 6.147 | | | | 10/16/14 | | | | CNH | | | | 8,100,000 | | | 16,127 |
EUR Currency14 | | | BOA | | | | USD | | | | 1.302 | | | | 5/23/14 | | | | EUR | | | | 1,355,000 | | | 9,325 |
INR Currency14 | | | GSG | | | | INR | | | | 65.250 | | | | 9/3/14 | | | | INR | | | | 82,500,000 | | | 52,057 |
INR Currency14 | | | GSG | | | | INR | | | | 65.000 | | | | 9/2/14 | | | | INR | | | | 82,500,000 | | | 49,252 |
JPY Currency14 | | | GSG | | | | JPY | | | | 103.000 | | | | 5/23/14 | | | | JPY | | | | 70,000,000 | | | 25,900 |
JPY Currency14 | | | GSG | | | | JPY | | | | 108.000 | | | | 5/22/15 | | | | JPY | | | | 650,000,000 | | | 222,300 |
MXN Currency14 | | | GSG | | | | MXN | | | | 13.000 | | | | 9/29/14 | | | | MXN | | | | 17,000,000 | | | 38,437 |
MXN Currency14 | | | BOA | | | | MXN | | | | 12.725 | | | | 3/11/14 | | | | MXN | | | | 197,700,000 | | | 112,294 |
MXN Currency14 | | | BOA | | | | MXN | | | | 13.785 | | | | 1/22/14 | | | | MXN | | | | 163,950,000 | | | 11,477 |
MXN Currency14 | | | CITNA-B | | | | MXN | | | | 12.500 | | | | 1/22/14 | | | | MXN | | | | 148,650,000 | | | 6,689 |
Total Over-the-Counter Options Purchased (Cost $988,486) | | | 599,013 |
|
Total Investments, at Value (Cost $2,504,680,912) | | | | | | | | | | | | | | | | 101.3% | | | 2,485,625,606 |
|
Liabilities in Excess of Other Assets | | | | | | | | | | | | | | | | (1.3) | | | (30,858,428) |
| | | | | | | | | | | | | | | | | | | | | | | |
Net Assets | | | | | | | | | | | | | | | | 100.0% | | | $ 2,454,767,178 |
| | | | | | | | | | | | | | | | | | | | | | | |
Footnotes to Consolidated Statement of Investments
Principal and notional amount and exercise price are reported in U.S. Dollars except for those denoted in the following currencies:
| | | | | | |
AUD | | Australian Dollar | | NGN | | Nigeria Naira |
BRL | | Brazilian Real | | MXN | | Mexican Nuevo Peso |
CAD | | Canadian Dollar | | NOK | | Norwegian Krone |
CHF | | Swiss Franc | | PEN | | Peruvian New Sol |
CNH | | Offshore Chinese Renminbi | | PLN | | Polish Zloty |
COP | | Columbian Peso | | RON | | Romanian Leu |
EUR | | Euro | | RSD | | Serbian Dinar |
HUF | | Hungarian Forint | | RUB | | Russian Ruble |
IDR | | Indonesia Rupiah | | SEK | | Swedish Krona |
INR | | Indian Rupee | | THB | | Thai Bhat |
GBP | | British Pound Sterling | | TRY | | New Turkish Lira |
JPY | | Japanese Yen | | ZAR | | South African Rand |
MYR | | Malaysian Ringgit | | | | |
1. Represents securities sold under Rule 144A, which are exempt from registration under the Securities Act of 1933, as amended. These securities have been determined to be liquid under guidelines established by the Board of Trustees. These securities amount to $699,442,957 or 28.49% of the Fund’s net assets as of December 31, 2013.
2. Represents the current interest rate for a variable or increasing rate security.
3. Restricted security. The aggregate value of restricted securities as of December 31, 2013 was $42,263,098, which represents 1.72% of the Fund’s net assets. See Note 7 of the accompanying Consolidated Notes. Information concerning restricted securities is as follows:
| | | | | | | | | | | | | | | | |
| Security | | Acquisition
Dates | | | Cost | | | Value | | | Unrealized
Appreciation/
(Depreciation) | |
| Arco Capital Corp. Ltd. | | | 6/28/13 | | | $ | — | | | $ | — | | | $ | — | |
| Coriolanus Ltd., 18.665% Sr. Sec. Nts., 12/31/17 | | | 9/19/07 | | | | 6,013,860 | | | | 7,831,188 | | | | 1,817,328 | |
| Deutche Bank AG, Opic Reforma I Credit Linked Nts., Cl. 2A, 7.208%, 5/22/15 | | | 5/21/08 | | | | 67,269 | | | | 50,182 | | | | (17,087) | |
| Deutsche Bank AG, Opic Reforma I Credit Linked Nts., Cl. 2B, 7.208%, 5/22/15 | | | 6/12/08 | | | | 117,680 | | | | 87,795 | | | | (29,885) | |
| Deutsche Bank AG, Opic Reforma I Credit Linked Nts., Cl. 2C, 7.208%, 5/22/15 | | | 6/18/08 | | | | 1,785,486 | | | | 1,323,735 | | | | (461,751) | |
| Deutche Bank AG, Opic Reforma I Credit Linked Nts., Cl. 2D, 7.208%, 5/22/15 | | | 7/8/08 | | | | 130,028 | | | | 96,472 | | | | (33,556) | |
| Deutche Bank AG, Opic Reforma I Credit Linked Nts., Cl. 2E, 7.208%, 5/22/15 | | | 7/15/08 | | | | 94,626 | | | | 70,089 | | | | (24,537) | |
| Deutche Bank AG, Opic Reforma I Credit Linked Nts., Cl. 2F, 7.208%, 5/22/15 | | | 8/8/08 | | | | 61,263 | | | | 44,762 | | | | (16,501) | |
| Deutsche Bank AG, Opic Reforma I Credit Linked Nts., Cl. 2G, 7.208%, 5/22/15 | | | 8/22/08 | | | | 11,304 | | | | 8,243 | | | | (3,061) | |
| Deutsche Mortgage Securities, Inc., Series 2013-RS1, Cl. 1A2, 0.387%, 7/22/36 | | | 9/23/13 | | | | 3,761,483 | | | | 3,895,780 | | | | 134,297 | |
25 OPPENHEIMER GLOBAL STRATEGIC INCOME FUND/VA
CONSOLIDATEDSTATEMENTOF INVESTMENTS Continued
Footnotes to Consolidated Statement of Investments Continued
| | | | | | | | | | | | | | | | |
| Security | | Acquisition
Dates | | | Cost | | | Value | | | Unrealized
Appreciation/
(Depreciation) | |
| |
| ICE EM CLO, Series 2007-1A, Cl. B, 2.096%, 8/15/22 | | | 11/6/07 | | | $ | 7,136,176 | | | $ | 7,181,375 | | | $ | 45,199 | |
| ICE EM CLO, Series 2007-1A, Cl. C, 3.396%, 8/15/22 | | | 6/8/07 | | | | 5,270,000 | | | | 4,439,975 | | | | (830,025) | |
| ICE EM CLO, Series 2007-1A, Cl. D, 5.396%, 8/15/22 | | | 6/8/07 | | | | 5,270,000 | | | | 4,584,900 | | | | (685,100) | |
| IIRSA Norte Finance Ltd., 8.75% Sr. Sec. Nts., 5/30/24 | | | 8/3/06-7/24/07 | | | | 3,506,871 | | | | 3,866,636 | | | | 359,765 | |
| Infinis plc, 7% Sr. Sec. Nts., 2/15/19 | | | 10/2/13-10/6/13 | | | | 1,479,719 | | | | 1,545,126 | | | | 65,407 | |
| JPMorgan Hipotecaria su Casita, 6.47% Sec. Nts., 8/26/35 | | | 3/21/07 | | | | 529,012 | | | | 42,264 | | | | (486,748) | |
| Kenan Advantage Group, Inc. (The), 8.375% Sr. Unsec. Nts., 12/15/18 | | | 12/7/12-12/12/13 | | | | 2,326,031 | | | | 2,395,237 | | | | 69,206 | |
| LBC Tank Terminals Holding Netherlands BV, 6.875% Sr. Unsec. Nts., 5/15/23 | | | 5/8/13 | | | | 630,000 | | | | 654,413 | | | | 24,413 | |
| NC Finance Trust, Series 1999-I, Cl. D, 3.405%, 1/25/29 | | | 8/10/10 | | | | 66,025 | | | | 4,005 | | | | (62,020) | |
| Premier Cruises Ltd., 11% Sr. Nts., 3/15/08 | | | 3/6/98 | | | | 242,675 | | | | — | | | | (242,675) | |
| STHI Holding Corp., 8% Sec. Nts., 3/15/18 | | | 3/11/11 | | | | 995,000 | | | | 1,069,625 | | | | 74,625 | |
| Wallace Theater Holdings, Inc. | | | 3/28/13 | | | | 15 | | | | 15,296 | | | | 15,281 | |
| Western Express, Inc., 12.50% Sr. Sec. Nts., 4/15/15 | | | 4/9/10-5/4/11 | | | | 4,751,506 | | | | 3,056,000 | | | | (1,695,506) | |
| | | | | | | | |
| | | | | | $ | 44,246,029 | | | $ | 42,263,098 | | | $ | (1,982,931) | |
| | | | | | | | |
4. Interest-Only Strips represent the right to receive the monthly interest payments on an underlying pool of mortgage loans. These securities typically decline in price as interest rates decline. Most other fixed income securities increase in price when interest rates decline. The principal amount of the underlying pool represents the notional amount on which current interest is calculated. The price of these securities is typically more sensitive to changes in prepayment rates than traditional mortgage-backed securities (for example, GNMA pass-throughs). Interest rates disclosed represent current yields based upon the current cost basis and estimated timing and amount of future cash flows. These securities amount to $5,987,673 or 0.24% of the Fund’s net assets as of December 31, 2013.
5. Interest rate is less than 0.0005%.
6. The current amortization rate of the security’s cost basis exceeds the future interest payments currently estimated to be received. Both the amortization rate and interest payments are contingent on future mortgage pre-payment speeds and are therefore subject to change.
7. All or a portion of the security position is when-issued or delayed delivery to be delivered and settled after December 31, 2013. See Note 1 of the accompanying Consolidated Notes.
8. This security is not accruing income because the issuer has missed an interest payment on it and/or is not anticipated to make future interest and or principal payments. The rate shown is the original contractual interest rate. See Note 1 of the accompanying Consolidated Notes.
9. Zero coupon bond reflects effective yield on the date of purchase.
10. All or a portion of the security position is held in segregated accounts and pledged to cover margin requirements under certain derivative contracts. The aggregate market value of such securities is $3,670,265. See Note 6 of the accompanying Consolidated Notes.
11. Denotes an inflation-index security: coupon or principal are indexed to a consumer price index.
12. Interest or dividend is paid-in-kind, when applicable.
13. This bond has no contractual maturity date, is not redeemable and contractually pays an indefinite stream of interest. Rate reported represents the current interest rate for this variable rate security.
14. Non-income producing security.
15. All or a portion of the security position is held in accounts at a futures clearing merchant and pledged to cover margin requirements on open futures contracts and written options on futures, if applicable. The aggregate market value of such securities is $3,595,147. See Note 6 of the accompanying Consolidated Notes.
16. Is or was an affiliate, as defined in the Investment Company Act of 1940, at or during the period ended December 31, 2013, by virtue of the Fund owning at least 5% of the voting securities of the issuer or as a result of the Fund and the issuer having the same investment adviser. Transactions during the period in which the issuer was an affiliate are as follows:
| | | | | | | | | | | | | | | | |
| | | Shares December 31, 2012 | | | Gross Additions | | | Gross Reductions | | | Shares December 31, 2013 | |
| |
| Oppenheimer Institutional Money Market Fund, Cl. E | | | 34,093,630 | | | | 1,051,887,133 | | | | 1,052,926,735 | | | | 33,054,028 | |
| Oppenheimer Master Event-Linked Bond Fund, LLC | | | 4,827,322 | | | | — | | | | — | | | | 4,827,322 | |
| Oppenheimer Master Loan Fund, LLC | | | 25,357,850 | | | | 1,023,461 | | | | 25,357,850 | | | | 1,023,461 | |
| Oppenheimer Ultra-Short Duration Fund, Cl. Y | | | 1,010,027 | | | | 2,697,696 | | | | — | | | | 3,707,723 | |
| | | | |
| | | | | | Value | | | Income | | | Realized Gain (Loss) | |
| |
| Oppenheimer Institutional Money Market Fund, Cl. E | | | | | | $ | 33,054,028 | | | $ | 50,862 | | | $ | — | |
| Oppenheimer Master Event-Linked Bond Fund, LLC | | | | | | | 66,588,345 | | | | 5,254,837 a | | | | 42,005 a | |
| Oppenheimer Master Loan Fund, LLC | | | | | | | 14,576,015 | | | | 6,383,509 b | | | | 5,434,614 b | |
| Oppenheimer Ultra-Short Duration Fund, Cl. Y | | | | | | | 37,151,380 | | | | 83,813 | | | | — | |
| | | | | | | | |
Total | | | | | | $ | 151,369,768 | | | $ | 11,773,021 | | | $ | 5,476,619 | |
| | | | | | | | |
a. Represents the amount allocated to the Fund from Oppenheimer Master Event-Linked Bond Fund, LLC.
b. Represents the amount allocated to the Fund from Oppenheimer Master Loan Fund, LLC.
17. Rate shown is the 7-day yield as of December 31, 2013.
26 OPPENHEIMER GLOBAL STRATEGIC INCOME FUND/VA
Footnotes to Consolidated Statement of Investments Continued
Distribution of investments representing geographic holdings, as a percentage of total investments at value, is as follows:
| | | | | | |
| Geographic Holdings | | Value | | | Percent |
|
United States | | $ | 1,401,018,004 | | | 56.4% |
Mexico | | | 178,963,252 | | | 7.2 |
Brazil | | | 117,495,714 | | | 4.7 |
Russia | | | 105,363,325 | | | 4.2 |
Turkey | | | 54,632,301 | | | 2.2 |
United Kingdom | | | 52,800,964 | | | 2.1 |
Hungary | | | 46,333,371 | | | 1.9 |
Canada | | | 41,009,956 | | | 1.6 |
Germany | | | 38,284,465 | | | 1.5 |
South Africa | | | 32,241,963 | | | 1.3 |
Colombia | | | 25,795,818 | | | 1.0 |
Italy | | | 25,468,158 | | | 1.0 |
France | | | 25,277,678 | | | 1.0 |
Peru | | | 24,889,058 | | | 1.0 |
Netherlands | | | 22,356,133 | | | 0.9 |
Indonesia | | | 21,826,821 | | | 0.9 |
Luxembourg | | | 18,761,491 | | | 0.7 |
Supranational | | | 18,117,916 | | | 0.7 |
Australia | | | 17,194,030 | | | 0.7 |
Israel | | | 14,048,473 | | | 0.6 |
Thailand | | | 13,271,506 | | | 0.5 |
Venezuela | | | 13,108,255 | | | 0.5 |
Poland | | | 11,308,650 | | | 0.5 |
Spain | | | 11,193,643 | | | 0.5 |
United Arab Emirates | | | 10,629,188 | | | 0.4 |
Ukraine | | | 10,043,265 | | | 0.4 |
Chile | | | 9,943,438 | | | 0.4 |
Portugal | | | 8,987,759 | | | 0.4 |
Philippines | | | 7,786,005 | | | 0.3 |
Nigeria | | | 7,292,271 | | | 0.3 |
Switzerland | | | 6,832,519 | | | 0.3 |
China | | | 6,331,680 | | | 0.3 |
Romania | | | 5,805,242 | | | 0.2 |
Malaysia | | | 5,387,715 | | | 0.2 |
Croatia | | | 5,056,129 | | | 0.2 |
Ireland | | | 4,927,720 | | | 0.2 |
India | | | 4,852,643 | | | 0.2 |
Greece | | | 4,446,116 | | | 0.2 |
Lithuania | | | 4,419,322 | | | 0.2 |
Ivory Coast | | | 4,342,500 | | | 0.2 |
Dominican Republic | | | 4,281,789 | | | 0.2 |
Serbia | | | 3,999,307 | | | 0.2 |
Kazakhstan | | | 3,853,646 | | | 0.2 |
Panama | | | 3,134,468 | | | 0.1 |
Denmark | | | 3,023,433 | | | 0.1 |
Uruguay | | | 2,894,750 | | | 0.1 |
Sri Lanka | | | 2,849,206 | | | 0.1 |
Norway | | | 2,687,787 | | | 0.1 |
Sweden | | | 2,355,970 | | | 0.1 |
Angola | | | 2,001,825 | | | 0.1 |
Jamaica | | | 1,967,962 | | | 0.1 |
Austria | | | 1,966,305 | | | 0.1 |
Jersey, Channel Islands | | | 1,804,570 | | | 0.1 |
Costa Rica | | | 1,803,275 | | | 0.1 |
Morocco | | | 1,562,400 | | | 0.1 |
Tanzania | | | 1,291,500 | | | 0.1 |
Latvia | | | 1,273,406 | | | 0.1 |
Trinidad | | | 1,041,175 | | | 0.0 |
Gabon | | | 957,125 | | | 0.0 |
Belgium | | | 654,413 | | | 0.0 |
Japan | | | 617,988 | | | 0.0 |
Guatemala | | | 607,200 | | | 0.0 |
Eurozone | | | 460,471 | | | 0.0 |
Bolivia | | | 297,600 | | | 0.0 |
South Korea | | | 245,656 | | | 0.0 |
Hong Kong | | | 147,922 | | | 0.0 |
| | | |
Total | | $ | 2,485,625,606 | | | 100.0% |
| | | |
27 OPPENHEIMER GLOBAL STRATEGIC INCOME FUND/VA
CONSOLIDATEDSTATEMENTOF INVESTMENTS Continued
|
| Footnotes to Consolidated Statement of Investments Continued |
|
Forward Currency Exchange Contracts as of December 31, 2013 |
| | | | | | | | | | | | | | | | | | | | | | | | | | | | |
| Counterparty | | Settlement Month(s) | | | Currency Purchased (000’s) | | | Currency Sold (000’s) | | | Unrealized
Appreciation | | | Unrealized
Depreciation | |
| |
BAC | | | 01/2014 | | | | BRL | | | | 14,500 | | | | USD | | | | 6,268 | | | $ | 19,673 | | | $ | 141,927 | |
BAC | | | 01/2014 | | | | KRW | | | | 4,251,000 | | | | USD | | | | 3,981 | | | | 41,352 | | | | – | |
BAC | | | 02/2014 - 02/2014 | | | | MYR | | | | 63,865 | | | | USD | | | | 20,026 | | | | – | | | | 584,558 | |
BAC | | | 02/2014 | | | | THB | | | | 35,000 | | | | USD | | | | 1,083 | | | | – | | | | 19,851 | |
BAC | | | 01/2014 - 01/2015 | | | | USD | | | | 9,937 | | | | BRL | | | | 23,600 | | | | 253,757 | | | | 11,764 | |
BAC | | | 01/2014 - 02/2014 | | | | USD | | | | 4,646 | | | | EUR | | | | 3,450 | | | | – | | | | 100,216 | |
BAC | | | 01/2014 | | | | USD | | | | 412 | | | | IDR | | | | 5,059,000 | | | | – | | | | 849 | |
BAC | | | 01/2014 | | | | USD | | | | 279 | | | | MYR | | | | 895 | | | | 5,968 | | | | – | |
BAC | | | 02/2014 | | | | USD | | | | 3,094 | | | | ZAR | | | | 31,770 | | | | 79,051 | | | | – | |
BNP | | | 01/2014 | | | | BRL | | | | 3,600 | | | | USD | | | | 1,546 | | | | – | | | | 20,483 | |
BNP | | | 05/2014 | | | | CAD | | | | 4,880 | | | | USD | | | | 4,562 | | | | 15,255 | | | | – | |
BNP | | | 05/2014 | | | | DKK | | | | 3,890 | | | | USD | | | | 713 | | | | 5,017 | | | | – | |
BNP | | | 02/2014 | | | | EUR | | | | 2,140 | | | | USD | | | | 2,879 | | | | 65,209 | | | | – | |
BNP | | | 02/2014 | | | | GBP | | | | 930 | | | | USD | | | | 1,520 | | | | 19,403 | | | | – | |
BNP | | | 01/2014 | | | | MXN | | | | 17,000 | | | | USD | | | | 1,301 | | | | 1,216 | | | | – | |
BNP | | | 05/2014 | | | | NOK | | | | 680 | | | | USD | | | | 111 | | | | 807 | | | | – | |
BNP | | | 01/2014 | | | | RON | | | | 3,150 | | | | USD | | | | 970 | | | | – | | | | 1,261 | |
BNP | | | 02/2014 | | | | USD | | | | 2,178 | | | | AUD | | | | 2,415 | | | | 29,630 | | | | – | |
BNP | | | 01/2014 | | | | USD | | | | 21,818 | | | | CAD | | | | 23,230 | | | | – | | | | 44,807 | |
BNP | | | 05/2014 | | | | USD | | | | 708 | | | | DKK | | | | 3,890 | | | | – | | | | 9,645 | |
BNP | | | 01/2014 | | | | USD | | | | 2,928 | | | | EUR | | | | 2,135 | | | | 2,454 | | | | 11,450 | |
BNP | | | 02/2014 | | | | USD | | | | 18,213 | | | | GBP | | | | 11,165 | | | | – | | | | 268,862 | |
BNP | | | 01/2014 - 06/2014 | | | | USD | | | | 23,525 | | | | MXN | | | | 309,600 | | | | 63,118 | | | | 85,133 | |
BNP | | | 05/2014 | | | | USD | | | | 484 | | | | NOK | | | | 2,980 | | | | – | | | | 4,399 | |
BNP | | | 01/2014 - 06/2014 | | | | USD | | | | 13,663 | | | | TRY | | | | 28,685 | | | | 580,429 | | | | 15,902 | |
BOA | | | 01/2014 | | | | BRL | | | | 21,620 | | | | USD | | | | 9,242 | | | | 25,186 | | | | 103,757 | |
BOA | | | 01/2014 | | | | COP | | | | 347,000 | | | | USD | | | | 178 | | | | 1,409 | | | | – | |
BOA | | | 01/2014 - 01/2014 | | | | IDR | | | | 53,727,000 | | | | USD | | | | 4,759 | | | | – | | | | 364,366 | |
BOA | | | 02/2014 - 05/2014 | | | | JPY | | | | 10,863,000 | | | | USD | | | | 106,253 | | | | – | | | | 3,062,730 | |
BOA | | | 01/2014 | | | | MXN | | | | 59,600 | | | | USD | | | | 4,599 | | | | – | | | | 42,671 | |
BOA | | | 05/2014 | | | | PLN | | | | 1,890 | | | | USD | | | | 612 | | | | 8,255 | | | | – | |
BOA | | | 01/2014 | | | | RON | | | | 6,160 | | | | USD | | | | 1,880 | | | | 13,974 | | | | – | |
BOA | | | 02/2014 | | | | THB | | | | 271,700 | | | | USD | | | | 8,549 | | | | – | | | | 299,544 | |
BOA | | | 01/2014 - 07/2014 | | | | USD | | | | 23,284 | | | | BRL | | | | 54,260 | | | | 466,269 | | | | 17,845 | |
BOA | | | 01/2014 - 01/2014 | | | | USD | | | | 9,869 | | | | IDR | | | | 114,744,000 | | | | 479,311 | | | | – | |
BOA | | | 02/2014 - 05/2014 | | | | USD | | | | 110,976 | | | | JPY | | | | 11,302,000 | | | | 3,615,674 | | | | – | |
BOA | | | 02/2014 - 06/2014 | | | | USD | | | | 26,890 | | | | MXN | | | | 356,895 | | | | 62,735 | | | | 275,622 | |
BOA | | | 01/2014 | | | | USD | | | | 746 | | | | PEN | | | | 2,080 | | | | 5,186 | | | | – | |
BOA | | | 02/2014 | | | | USD | | | | 1,238 | | | | ZAR | | | | 13,140 | | | | – | | | | 8,479 | |
CITNA-B | | | 01/2014 | | | | CLP | | | | 268,000 | | | | USD | | | | 524 | | | | – | | | | 15,626 | |
CITNA-B | | | 01/2014 - 02/2014 | | | | EUR | | | | 50,735 | | | | USD | | | | 68,994 | | | | 801,815 | | | | – | |
CITNA-B | | | 01/2014 - 02/2014 | | | | GBP | | | | 20,835 | | | | USD | | | | 34,007 | | | | 488,449 | | | | – | |
CITNA-B | | | 02/2014 | | | | HUF | | | | 5,000 | | | | USD | | | | 23 | | | | 127 | | | | – | |
CITNA-B | | | 02/2014 | | | | JPY | | | | 288,000 | | | | USD | | | | 2,811 | | | | – | | | | 75,904 | |
CITNA-B | | | 02/2014 | | | | KRW | | | | 4,551,000 | | | | USD | | | | 4,261 | | | | 35,937 | | | | – | |
CITNA-B | | | 01/2014 - 01/2014 | | | | MXN | | | | 237,930 | | | | USD | | | | 18,351 | | | | 5,250 | | | | 159,228 | |
CITNA-B | | | 01/2014 | | | | MYR | | | | 13,615 | | | | USD | | | | 4,299 | | | | – | | | | 148,381 | |
CITNA-B | | | 02/2014 - 05/2014 | | | | USD | | | | 14,232 | | | | AUD | | | | 15,770 | | | | 241,891 | | | | – | |
CITNA-B | | | 05/2014 | | | | USD | | | | 4,973 | | | | CAD | | | | 5,275 | | | | 25,414 | | | | – | |
CITNA-B | | | 01/2014 | | | | USD | | | | 210 | | | | CLP | | | | 112,000 | | | | – | | | | 2,978 | |
CITNA-B | | | 01/2014 - 02/2014 | | | | USD | | | | 126,315 | | | | EUR | | | | 93,505 | | | | 5,218 | | | | 2,323,786 | |
CITNA-B | | | 01/2014 | | | | USD | | | | 55,338 | | | | GBP | | | | 34,435 | | | | – | | | | 1,681,287 | |
CITNA-B | | | 01/2014 - 05/2014 | | | | USD | | | | 46,484 | | | | MXN | | | | 616,800 | | | | – | | | | 373,972 | |
CITNA-B | | | 01/2014 | | | | USD | | | | 1,011 | | | | NOK | | | | 6,000 | | | | 22,336 | | | | – | |
DEU | | | 01/2014 - 02/2014 | | | | EUR | | | | 3,490 | | | | USD | | | | 4,705 | | | | 96,129 | | | | – | |
DEU | | | 02/2014 | | | | GBP | | | | 1,210 | | | | USD | | | | 1,931 | | | | 72,257 | | | | – | |
DEU | | | 01/2014 | | | | PEN | | | | 490 | | | | USD | | | | 174 | | | | 221 | | | | – | |
DEU | | | 01/2014 - 02/2014 | | | | USD | | | | 35,578 | | | | EUR | | | | 26,395 | | | | 15,641 | | | | 748,510 | |
DEU | | | 01/2014 - 02/2014 | | | | USD | | | | 3,991 | | | | GBP | | | | 2,525 | | | | – | | | | 189,520 | |
DEU | | | 05/2014 | | | | USD | | | | 604 | | | | PLN | | | | 1,890 | | | | – | | | | 16,303 | |
DEU | | | 05/2014 | | | | USD | | | | 93 | | | | ZAR | | | | 990 | | | | 909 | | | | – | |
DEU | | | 05/2014 | | | | ZAR | | | | 990 | | | | USD | | | | 95 | | | | – | | | | 2,685 | |
FIB | | | 02/2014 | | | | CAD | | | | 800 | | | | USD | | | | 769 | | | | – | | | | 16,976 | |
FIB | | | 02/2014 | | | | USD | | | | 760 | | | | CAD | | | | 800 | | | | 7,420 | | | | – | |
28 OPPENHEIMER GLOBAL STRATEGIC INCOME FUND/VA
|
|
Forward Currency Exchange Contracts (Continued) |
| | | | | | | | | | | | | | | | | | | | | | | | | | | | |
| Counterparty | | Settlement Month(s) | | | Currency Purchased (000’s) | | | Currency Sold (000’s) | | | Unrealized
Appreciation | | | Unrealized
Depreciation | |
| |
FIB | | | 03/2014 | | | | USD | | | | 5,965 | | | | TRY | | | | 12,330 | | | $ | 300,557 | | | $ | – | |
GSCO-OT | | | 09/2014 | | | | AUD | | | | 130 | | | | USD | | | | 123 | | | | – | | | | 8,665 | |
GSCO-OT | | | 01/2014 | | | | BRL | | | | 14,230 | | | | USD | | | | 6,032 | | | | 26,636 | | | | 27,557 | |
GSCO-OT | | | 02/2014 - 03/2014 | | | | EUR | | | | 93,090 | | | | USD | | | | 127,340 | | | | 828,052 | | | | 106,435 | |
GSCO-OT | | | 01/2014 | | | | KRW | | | | 5,588,000 | | | | USD | | | | 5,229 | | | | 58,275 | | | | – | |
GSCO-OT | | | 09/2014 | | | | USD | | | | 118 | | | | AUD | | | | 130 | | | | 4,039 | | | | – | |
GSCO-OT | | | 01/2014 - 01/2015 | | | | USD | | | | 39,050 | | | | BRL | | | | 93,285 | | | | 913,938 | | | | 18,853 | |
GSCO-OT | | | 02/2014 - 03/2014 | | | | USD | | | | 132,840 | | | | EUR | | | | 97,320 | | | | 105,965 | | | | 1,147,121 | |
GSCO-OT | | | 09/2014 - 09/2014 | | | | USD | | | | 1,258 | | | | INR | | | | 90,200 | | | | – | | | | 123,867 | |
GSCO-OT | | | 10/2014 | | | | USD | | | | 458 | | | | MXN | | | | 6,200 | | | | – | | | | 6,502 | |
HSBC | | | 03/2014 | | | | TRY | | | | 10,300 | | | | USD | | | | 4,939 | | | | – | | | | 207,054 | |
HSBC | | | 03/2014 | | | | USD | | | | 9,705 | | | | TRY | | | | 20,165 | | | | 450,200 | | | | 9,196 | |
JPM | | | 01/2014 - 02/2014 | | | | BRL | | | | 162,593 | | | | USD | | | | 68,535 | | | | 486,061 | | | | 308,086 | |
JPM | | | 01/2014 - 01/2014 | | | | IDR | | | | 96,878,000 | | | | USD | | | | 8,547 | | | | – | | | | 607,190 | |
JPM | | | 01/2014 | | | | KRW | | | | 4,707,000 | | | | USD | | | | 4,449 | | | | 9,017 | | | | – | |
JPM | | | 01/2014 | | | | MXN | | | | 63,300 | | | | USD | | | | 4,885 | | | | – | | | | 45,509 | |
JPM | | | 01/2014 - 02/2014 | | | | MYR | | | | 69,365 | | | | USD | | | | 21,645 | | | | – | | | | 509,068 | |
JPM | | | 01/2014 - 02/2014 | | | | PLN | | | | 37,980 | | | | USD | | | | 12,294 | | | | 257,881 | | | | – | |
JPM | | | 01/2014 | | | | RON | | | | 6,840 | | | | USD | | | | 2,090 | | | | 13,043 | | | | – | |
JPM | | | 05/2014 | | | | THB | | | | 116,400 | | | | USD | | | | 3,707 | | | | – | | | | 184,460 | |
JPM | | | 01/2014 - 10/2014 | | | | USD | | | | 59,870 | | | | BRL | | | | 143,630 | | | | 147,596 | | | | 474,678 | |
JPM | | | 01/2014 | | | | USD | | | | 2,233 | | | | COP | | | | 4,337,000 | | | | – | | | | 12,769 | |
JPM | | | 01/2014 | | | | USD | | | | 5,198 | | | | EUR | | | | 3,800 | | | | – | | | | 29,868 | |
JPM | | | 04/2014 | | | | USD | | | | 5,755 | | | | HUF | | | | 1,293,000 | | | | – | | | | 191,097 | |
JPM | | | 01/2014 - 01/2014 | | | | USD | | | | 9,795 | | | | IDR | | | | 117,139,000 | | | | 198,396 | | | | – | |
JPM | | | 03/2014 | | | | USD | | | | 11,097 | | | | MXN | | | | 146,700 | | | | – | | | | 82,969 | |
JPM | | | 01/2014 | | | | USD | | | | 9,712 | | | | MYR | | | | 31,430 | | | | 139,589 | | | | 9,002 | |
JPM | | | 02/2014 - 03/2014 | | | | USD | | | | 9,925 | | | | RUB | | | | 331,540 | | | | – | | | | 72,362 | |
JPM | | | 05/2014 | | | | USD | | | | 3,845 | | | | THB | | | | 116,400 | | | | 322,845 | | | | – | |
JPM | | | 02/2014 | | | | USD | | | | 1,029 | | | | ZAR | | | | 10,910 | | | | – | | | | 6,788 | |
JPM | | | 02/2014 | | | | ZAR | | | | 28,210 | | | | USD | | | | 2,726 | | | | – | | | | 48,956 | |
MSCO | | | 01/2014 | | | | BRL | | | | 797 | | | | USD | | | | 335 | | | | 3,099 | | | | – | |
MSCO | | | 01/2014 - 02/2014 | | | | EUR | | | | 16,735 | | | | USD | | | | 22,789 | | | | 232,962 | | | | 456 | |
MSCO | | | 01/2014 - 10/2014 | | | | MXN | | | | 11,100 | | | | USD | | | | 844 | | | | 3,553 | | | | 3,248 | |
MSCO | | | 01/2014 | | | | PLN | | | | 22,700 | | | | USD | | | | 7,418 | | | | 89,319 | | | | – | |
MSCO | | | 07/2014 | | | | USD | | | | 5,755 | | | | BRL | | | | 13,300 | | | | 350,448 | | | | – | |
MSCO | | | 01/2014 - 02/2014 | | | | USD | | | | 25,389 | | | | EUR | | | | 18,505 | | | | 24,750 | | | | 93,285 | |
MSCO | | | 02/2014 - 04/2014 | | | | USD | | | | 5,462 | | | | HUF | | | | 1,230,000 | | | | – | | | | 195,003 | |
MSCO | | | 04/2014 | | | | USD | | | | 18,070 | | | | MXN | | | | 240,700 | | | | – | | | | 233,272 | |
MSCO | | | 02/2014 | | | | USD | | | | 246 | | | | PLN | | | | 750 | | | | – | | | | 1,410 | |
MSCO | | | 05/2014 | | | | USD | | | | 960 | | | | SEK | | | | 6,300 | | | | – | | | | 17,077 | |
RBS | | | 05/2014 - 05/2014 | | | | CHF | | | | 995 | | | | USD | | | | 1,109 | | | | 8,612 | | | | 1,110 | |
RBS | | | 01/2014 | | | | NOK | | | | 6,000 | | | | USD | | | | 980 | | | | 9,188 | | | | – | |
RBS | | | 02/2014 | | | | PLN | | | | 50,520 | | | | USD | | | | 16,232 | | | | 436,470 | | | | – | |
RBS | | | 05/2014 - 05/2014 | | | | USD | | | | 1,209 | | | | CHF | | | | 1,080 | | | | 1,033 | | | | 4,043 | |
RBS | | | 01/2014 - 03/2014 | | | | USD | | | | 8,914 | | | | HUF | | | | 1,999,000 | | | | – | | | | 317,485 | |
RBS | | | 01/2014 | | | | USD | | | | 1,170 | | | | NOK | | | | 7,170 | | | | – | | | | 11,784 | |
RBS | | | 02/2014 | | | | USD | | | | 2,777 | | | | PHP | | | | 120,000 | | | | 60,974 | | �� | | – | |
RBS | | | 02/2014 | | | | USD | | | | 302 | | | | PLN | | | | 920 | | | | – | | | | 1,981 | |
| | | | | | | | | | | | | | | | | | | | | | | | |
Total Unrealized Appreciation and Depreciation | | | | | | | $ | 13,161,850 | | | $ | 16,369,483 | |
| | | | | | | | | | | | | | | | | | | | | | | | |
|
|
Futures Contracts as of December 31, 2013 |
| | | | | | | | | | | | | | | | | | | | | | | | |
| Description | | Exchange | | | | | | | Buy/Sell | | | Expiration Date | | | Number of Contracts | | | Unrealized Appreciation
(Depreciation) | |
| |
Australian Treasury Bonds, 10 yr. | | | SFE | | | | | | | | Sell | | | | 3/17/14 | | | | 78 | | | $ | (94,517) | |
Euro-Bundesobligation | | | EUX | | | | | | | | Sell | | | | 3/06/14 | | | | 20 | | | | 40,916 | |
U.S. Treasury Long Bonds | | | CBT | | | | | | | | Buy | | | | 3/20/14 | | | | 544 | | | | (1,295,975) | |
U.S. Treasury Long Bonds | | | CBT | | | | | | | | Sell | | | | 3/20/14 | | | | 68 | | | | 139,039 | |
U.S. Treasury Nts., 2 yr. | | | CBT | | | | | | | | Sell | | | | 3/31/14 | | | | 100 | | | | 3,080 | |
U.S. Treasury Nts., 2 yr. | | | CBT | | | | | | | | Buy | | | | 3/31/14 | | | | 28 | | | | (5,743) | |
U.S. Treasury Nts., 5 yr. | | | CBT | | | | | | | | Sell | | | | 3/31/14 | | | | 103 | | | | 163,750 | |
U.S. Treasury Nts., 10 yr. | | | CBT | | | | | | | | Buy | | | | 3/20/14 | | | | 693 | | | | (1,291,013) | |
U.S. Treasury Nts., 10 yr. | | | CBT | | | | | | | | Sell | | | | 3/20/14 | | | | 79 | | | | 170,017 | |
U.S. Treasury Ultra Bonds | | | CBT | | | | | | | | Buy | | | | 3/20/14 | | | | 197 | | | | (523,307) | |
| United Kingdom Treasury Unsec. Bonds | | | LIF | | | | | | | | Sell | | | | 3/27/14 | | | | 14 | | | | 58,642 | |
| United Kingdom Treasury Unsec. Bonds | | | LIF | | | | | | | | Buy | | | | 3/27/14 | | | | 14 | | | | 11,065 | |
| | | | | | | | | | | | | | | | | | | | | | | | |
| | | | | | | | | | | | | | | | | | | | | | $ | (2,624,046) | |
| | | | | | | | | | | | | | | | | | | | | | | | |
29 OPPENHEIMER GLOBAL STRATEGIC INCOME FUND/VA
CONSOLIDATEDSTATEMENTOF INVESTMENTS Continued
| | | | | | | | | | | | | | | | | | | | | | | | | | | | | | | | |
| |
Over-the-Counter Options Written at December 31, 2013 | |
| Description | | Counterparty | | | Exercise Price | | | Expiration Date | | | Number of Contracts | | | Premiums Received | | | Value | |
| |
| AUD Currency Put | | | BOA | | | | JPY | | | | 70 .000 | | | | 8/4/14 | | | | AUD | | | | (1,395,000) | | | $ | 15,678 | | | $ | (2,905) | |
| |
| AUD Currency Put | | | GSG | | | | JPY | | | | 70 .080 | | | | 9/10/14 | | | | AUD | | | | (1,970,000) | | | | 17,706 | | | | (6,244) | |
| |
| BRL Currency Call | | | GSG | | | | BRL | | | | 2 .210 | | | | 1/9/14 | | | | BRL | | | | (18,990,000) | | | | 36,347 | | | | 0 | |
| |
| BRL Currency Put | | | GSG | | | | BRL | | | | 2 .430 | | | | 1/9/14 | | | | BRL | | | | (20,880,000) | | | | 102,080 | | | | (11,233) | |
| |
| INR Currency Put | | | GSG | | | | INR | | | | 100 .000 | | | | 9/3/14 | | | | INR | | | | (126,500,000) | | | | 22,897 | | | | (253) | |
| |
| INR Currency Put | | | GSG | | | | INR | | | | 98 .320 | | | | 9/2/14 | | | | INR | | | | (124,800,000) | | | | 25,016 | | | | (374) | |
| |
| JPY Currency Put | | | GSG | | | | JPY | | | | 120 .000 | | | | 5/22/15 | | | | JPY | | | | (722,000,000) | | | | 122,138 | | | | (70,034) | |
| |
| JPY Currency Call | | | GSG | | | | JPY | | | | 84 .550 | | | | 12/18/15 | | | | JPY | | | | (446,000,000) | | | | 132,033 | | | | (80,726) | |
| |
| JPY Currency Put | | | GSG | | | | JPY | | | | 108 .000 | | | | 5/23/14 | | | | JPY | | | | (73,000,000) | | | | 5,962 | | | | (10,074) | |
| |
| MXN Currency Call | | | BOA | | | | MXN | | | | 12 .500 | | | | 1/22/14 | | | | MXN | | | | (148,650,000) | | | | 86,372 | | | | (6,689) | |
| |
| MXN Currency Call | | | BOA | | | | MXN | | | | 12 .350 | | | | 3/11/14 | | | | MXN | | | | (191,800,000) | | | | 80,618 | | | | (30,113) | |
| |
| MXN Currency Put | | | BOA | | | | MXN | | | | 13 .600 | | | | 3/11/14 | | | | MXN | | | | (211,200,000) | | | | 146,831 | | | | (141,293) | |
| |
| MXN Currency Put | | | CITNA-B | | | | MXN | | | | 13 .785 | | | | 1/22/14 | | | | MXN | | | | (163,950,000) | | | | 64,521 | | | | (11,476) | |
| |
| MXN Currency Call | | | GSG | | | | MXN | | | | 12 .250 | | | | 9/29/14 | | | | MXN | | | | (16,000,000) | | | | 18,090 | | | | (11,072) | |
| |
| MXN Currency Put | | | GSG | | | | MXN | | | | 15 .750 | | | | 9/29/14 | | | | MXN | | | | (20,600,000) | | | | 27,558 | | | | (13,143) | |
| | | | | | | | | | | | | | | | | | | | | | | | | | | | |
| Total of Over-the-Counter Options Written | | | | | | | $ | 903,847 | | | $ | (395,629)�� | |
| | | | | | | | | | | | | | | | | | | | | | | | | | | | |
|
|
Cleared Credit Default Swaps at December 31, 2013 |
| | | | | | | | | | | | | | | | | | | | | | | | | | | | |
| Reference Asset | | Buy/Sell
Protection | | | Fixed Rate | | | Maturity Date | | | Notional Amount (000’s) | | | Premiums
Received/(Paid) | | | Value | |
| |
| iTraxx Europe Crossover Series 20 | | | Buy | | | | 5 .000 | | | | 12/20/18 | | | | EUR | | | | 5,835 | | | $ | 611,674 | | | $ | (738,350) | |
|
|
Over-the-Counter Credit Default Swaps at December 31, 2013 |
| | | | | | | | | | | | | | | | | | | | | | | | | | | | | | |
| Reference Asset | | Counterparty | | | Buy/Sell
Protection | | | Fixed Rate | | | Maturity Date | | | Notional Amount (000’s) | | | Premiums
Received/(Paid) | | | Value | |
| |
| Banco Bilbao Vizcaya Argentaria Sociedad Anonima | | | UBS | | | | Sell | | | | 3 .000 | | | | 12/20/17 | | | EUR | | | 125 | | | $ | (60 | ) | | $ | 12,956 | |
| |
| Banco Bilbao Vizcaya Argentaria Sociedad Anonima | | | UBS | | | | Sell | | | | 3 .000 | | | | 12/20/17 | | | EUR | | | 125 | | | | (60 | ) | | | 12,956 | |
| |
| Banco Santander SA | | | UBS | | | | Sell | | | | 3 .000 | | | | 9/20/17 | | | EUR | | | 250 | | | | (997 | ) | | | 26,461 | |
| |
| Bolivarian Republic of Venezuela | | | FIB | | | | Buy | | | | 5 .000 | | | | 12/20/18 | | | USD | | | 1,290 | | | | (245,928 | ) | | | 284,324 | |
| |
Republic of Ireland | | | GSG | | | | Buy | | | | 1 .000 | | | | 3/20/18 | | | USD | | | 660 | | | | (27,725 | ) | | | 816 | |
| |
Republic of Ireland | | | GSG | | | | Buy | | | | 1 .000 | | | | 3/20/18 | | | EUR | | | 585 | | | | (21,618 | ) | | | 1,109 | |
| |
Republic of Italy | | | GSG | | | | Sell | | | | 1 .000 | | | | 3/20/23 | | | USD | | | 660 | | | | 105,519 | | | | (54,803) | |
| |
Republic of Peru | | | DEU | | | | Buy | | | | 1 .000 | | | | 12/20/18 | | | USD | | | 3,445 | | | | (69,535 | ) | | | 51,445 | |
| |
Ukraine | | | BOA | | | | Sell | | | | 5 .000 | | | | 12/20/18 | | | USD | | | 970 | | | | 111,726 | | | | (111,605) | |
| |
Ukraine | | | JPM | | | | Buy | | | | 5 .000 | | | | 12/20/18 | | | USD | | | 595 | | | | (119,172 | ) | | | 68,459 | |
| | | | | | | | | | | | | | | | | | | | | | | | | | |
Total of Over-the-Counter Credit Default Swaps | | | | | | | | | $ | (267,850 | ) | | $ | 292,118 | |
| | | | | | | | | | | | | | | | | | | | | | | | | | |
The table that follows shows the undiscounted maximum potential payment by the Fund related to selling credit protection in credit default swaps:
| | | | | | | | | | | | | | | | |
Type of Reference Asset on which the Fund Sold Protection | | Total Maximum Potential
Payments for Selling
Credit Protection
(Undiscounted) | | | | | Amount Recoverable* | | | | | Reference Asset
Rating Range** | |
| |
Investment Grade Single Name | | | | | | | | | | | | | | | | |
Corporate Debt | | | 500,000 | | | EUR | | | — | | | EUR | | | BBB to BBB- | |
Investment Grade Sovereign Debt | | $ | 660,000 | | | | | $ | — | | | | | | BBB | |
Non-Investment Grade Sovereign Debt | | $ | 970,000 | | | | | $ | 595,000 | | | | | | B- | |
| | | | | | | | | | | | | | | | |
Total EUR | | | 500,000 | | | EUR | | | — | | | EUR | | | | |
| | | | | | | | | | | | | | | | |
Total USD | | $ | 1,630,000 | | | | | $ | 595,000 | | | | | | | |
| | | | | | | | | | | | | | | | |
* Amounts recoverable includes potential payments from related purchased protection for instances where the Fund is the seller of protection. In addition, the Fund has no recourse provisions under the credit derivatives and holds no collateral which can offset or reduce potential payments under a triggering event.
** The period end reference asset security ratings, as rated by any rating organization, are included in the equivalent Standard &Poor’s rating category. The reference asset rating represents the likelihood of a potential credit event on the reference asset which would result in a related payment by the Fund.
|
|
Cleared Interest Rate Swaps at December 31, 2013 |
| | | | | | | | | | | | | | | | | | | | | | | | | | | | | | | | |
| Counterparty | | Pay/Receive
Floating Rate | | | Floating Rate | | | Fixed Rate | | | Maturity Date | | | Notional Amount (000’s) | | | Premiums
Received /
(Paid) | | | Value | |
| |
BAC | | | Receive | | |
| Three-Month USD
BBA LIBOR |
| | | 2.183% | | | | 11/20/23 | | | | USD | | | | 2,850 | | | $ | – | | | $ | 216,352 | |
| |
BAC | | | Receive | | |
| Three-Month USD
BBA LIBOR |
| | | 1.552 | | | | 12/9/18 | | | | USD | | | | 19,860 | | | | – | | | | 182,982 | |
| |
BOA | | | Pay | | |
| Six-Month AUD
BBR BBSW |
| | | 5.490 | | | | 11/15/23 | | | | AUD | | | | 2,630 | | | | – | | | | (10,301) | |
30 OPPENHEIMER GLOBAL STRATEGIC INCOME FUND/VA
|
|
Cleared Interest Rate Swaps (Continued) |
| | | | | | | | | | | | | | | | | | | | | | | | | | | | | | | | |
| Counterparty | | Pay/Receive
Floating Rate | | | Floating Rate | | | Fixed Rate | | | Maturity Date | | | Notional Amount (000’s) | | | Premiums
Received /
(Paid) | | | Value | |
| |
BOA | | | Pay | | |
| Three-Month USD
BBA LIBOR |
| | | 2.403% | | | | 12/18/18 | | | | USD | | | | 33,000 | | | $ | – | | | $ | (499,521) | |
| |
BOA | | | Receive | | |
| Three-Month USD
BBA LIBOR |
| | | 2.805 | | | | 10/21/23 | | | | USD | | | �� | 1,455 | | | | – | | | | 24,832 | |
| |
BOA | | | Receive | | |
| Three-Month USD
BBA LIBOR |
| | | 2.785 | | | | 10/15/23 | | | | USD | | | | 14,630 | | | | (13,583) | | | | 265,271 | |
| |
BOA | | | Receive | | |
| Three-Month USD
BBA LIBOR |
| | | 2.810 | | | | 11/18/23 | | | | USD | | | | 1,045 | | | | – | | | | 20,637 | |
| |
BOA | | | Pay | | |
| Six-Month AUD
BBR BBSW |
| | | 4.585 | | | | 10/18/23 | | | | AUD | | | | 1,665 | | | | – | | | | 8,927 | |
| |
BOA | | | Receive | | |
| Three-Month USD
BBA LIBOR |
| | | 1.580 | | | | 10/17/18 | | | | USD | | | | 28,000 | | | | – | | | | 76,139 | |
| |
JPM | | | Receive | | |
| Three-Month USD
BBA LIBOR |
| | | 2.256 | | | | 11/19/23 | | | | USD | | | | 2,640 | | | | – | | | | 182,939 | |
| |
UBS | | | Receive | | |
| Six-Month EUR
EURIBOR |
| | | 2.254 | | | | 9/5/23 | | | | EUR | | | | 2,710 | | | | – | | | | (69,924) | |
| |
UBS | | | Pay | | |
| Six-Month GBP
BBA LIBOR |
| | | 1.820 | | | | 12/5/18 | | | | GBP | | | | 2,620 | | | | – | | | | 54,857 | |
| |
UBS | | | Receive | | |
| Six-Month EUR
EURIBOR |
| | | 1.060 | | | | 12/9/18 | | | | EUR | | | | 3,935 | | | | – | | | | 47,491 | |
| | | | | | | | | | | | | | | | | | | | | | | | | | | | |
Total of Cleared Interest Rate Swaps | | | | | | | $ | (13,583) | | | $ | 500,681 | |
| | | | | | | | | | | | | | | | | | | | | | | | | | | | |
|
| |
Over-the-Counter Interest Rate Swaps at 12/31/13 | |
| Counterparty | | Pay/Receive
Floating Rate | | | Floating Rate | | | Fixed Rate | | | Maturity Date | | | Notional Amount (000’s) | | | Premiums
Received /
(Paid) | | | Value | |
| |
BAC | | | Pay | | |
| MXN TIIE
BANXICO |
| | | 8.255% | | | | 8/10/23 | | | | MXN | | | | 37,700 | | | $ | – | | | $ | (30,971) | |
| |
BAC | | | Pay | | |
| Three-Month ZAR
JIBAR SAFEX |
| | | 6.950 | | | | 11/12/15 | | | | ZAR | | | | 47,400 | | | | – | | | | 12,858 | |
| |
BAC | | | Pay | | |
| Three-Month SEK
STIBOR SIDE |
| | | 2.175 | | | | 5/10/23 | | | | SEK | | | | 5,000 | | | | – | | | | (31,760) | |
| |
BOA | | | Pay | | | | BZDI | | | | 13.230 | | | | 1/4/16 | | | | BRL | | | | 56,860 | | | | – | | | | 92,089 | |
| |
BOA | | | Pay | | |
| Three-Month CAD
BA CDOR |
| | | 1.660 | | | | 5/9/16 | | | | CAD | | | | 6,635 | | | | – | | | | (4,297) | |
| |
DEU | | | Pay | | | | BZDI | | | | 12.850 | | | | 1/4/16 | | | | BRL | | | | 28,750 | | | | – | | | | 14,045 | |
| |
DEU | | | Pay | | | | BZDI | | | | 12.655 | | | | 1/4/16 | | | | BRL | | | | 28,370 | | | | – | | | | (2,691) | |
| |
DEU | | | Pay | | | | BZDI | | | | 12.800 | | | | 1/4/16 | | | | BRL | | | | 28,770 | | | | – | | | | 9,757 | |
| |
DEU | | | Pay | | |
| MXN TIIE
BANXICO |
| | | 6.820 | | | | 12/14/23 | | | | MXN | | | | 14,700 | | | | – | | | | 113 | |
| |
GSG | | | Pay | | |
| Six-Month JPY
BBA LIBOR |
| | | 0.820 | | | | 4/15/23 | | | | JPY | | | | 79,000 | | | | – | | | | (1,646) | |
| |
GSG | | | Pay | | |
| Three-Month ZAR
JIBAR SAFEX |
| | | 7.000 | | | | 11/12/15 | | | | ZAR | | | | 47,400 | | | | – | | | | 14,929 | |
| |
GSG | | | Pay | | | | BZDI | | | | 12.670 | | | | 1/4/16 | | | | BRL | | | | 27,940 | | | | – | | | | (1,394) | |
| |
GSG | | | Pay | | |
| Three-Month ZAR
JIBAR SAFEX |
| | | 6.990 | | | | 12/4/15 | | | | ZAR | | | | 100,400 | | | | – | | | | 24,614 | |
| |
GSG | | | Pay | | | | BZDI | | | | 13.030 | | | | 1/4/16 | | | | BRL | | | | 28,330 | | | | – | | | | 29,045 | |
| |
GSG | | | Pay | | |
| Three-Month ZAR
JIBAR SAFEX |
| | | 6.650 | | | | 11/19/15 | | | | ZAR | | | | 47,600 | | | | – | | | | (494) | |
| |
GSG | | | Pay | | |
| Three-Month ZAR
JIBAR SAFEX |
| | | 6.750 | | | | 11/21/15 | | | | ZAR | | | | 99,800 | | | | – | | | | 3,245 | |
| |
GSG | | | Pay | | |
| MXN TIIE
BANXICO |
| | | 7.730 | | | | 9/7/33 | | | | MXN | | | | 40,400 | | | | – | | | | (43,337) | |
| |
GSG | | | Pay | | |
| MXN TIIE
BANXICO |
| | | 7.900 | | | | 10/10/23 | | | | MXN | | | | 45,500 | | | | – | | | | (81,158) | |
| |
GSG | | | Pay | | |
| Three-Month ZAR
JIBAR SAFEX |
| | | 7.638 | | | | 8/3/16 | | | | ZAR | | | | 155,900 | | | | – | | | | 27,794 | |
| |
GSG | | | Pay | | |
| Three-Month SEK
STIBOR SIDE |
| | | 1.565 | | | | 5/3/18 | | | | SEK | | | | 19,000 | | | | – | | | | (28,332) | |
| |
GSG | | | Pay | | |
| Three-Month ZAR
JIBAR SAFEX |
| | | 7.000 | | | | 6/20/15 | | | | ZAR | | | | 47,400 | | | | – | | | | 35,869 | |
| |
GSG | | | Pay | | | | BZDI | | | | 12.440 | | | | 1/4/16 | | | | BRL | | | | 26,820 | | | | – | | | | (19,857) | |
| |
GSG | | | Pay | | | | BZDI | | | | 12.520 | | | | 1/4/16 | | | | BRL | | | | 20,620 | | | | – | | | | (10,308) | |
| |
GSG | | | Pay | | | | BZDI | | | | 12.703 | | | | 1/4/16 | | | | BRL | | | | 56,220 | | | | – | | | | 2,667 | |
| |
HSBC | | | Pay | | |
| MXN TIIE
BANXICO |
| | | 7.775 | | | | 7/28/23 | | | | MXN | | | | 38,600 | | | | – | | | | (75,947) | |
31 OPPENHEIMER GLOBAL STRATEGIC INCOME FUND/VA
CONSOLIDATEDSTATEMENTOF INVESTMENTS Continued
|
|
Over-the-Counter Interest Rate Swaps Continued |
| | | | | | | | | | | | | | | | | | | | | | | | | | | | | | |
| Counterparty | | Pay/Receive
Floating Rate | | | Floating Rate | | | Fixed Rate | | | Maturity Date | | | Notional Amount (000’s) | | | Premiums
Received /
(Paid) | | | Value | |
| |
| | | | | | | Three-Month ZAR | | | | | | | | | | | | | | | | | | | | | | | |
JPM | | | Pay | | | | JIBAR SAFEX | | | | 7.920% | | | | 6/20/16 | | | ZAR | | | 98,600 | | | $ | – | | | $ | 53,898 | |
| |
| | | | | | | Three-Month ZAR | | | | | | | | | | | | | | | | | | | | | | | |
JPM | | | Pay | | | | JIBAR SAFEX | | | | 6.700 | | | | 11/19/15 | | | ZAR | | | 95,200 | | | | – | | | | 3,166 | |
| |
| | | | | | | Three-Month ZAR | | | | | | | | | | | | | | | | | | | | | | | |
JPM | | | Pay | | | | JIBAR SAFEX | | | | 6.450 | | | | 7/2/15 | | | ZAR | | | 86,000 | | | | – | | | | 21,011 | |
| |
| | | | | | | Three-Month ZAR | | | | | | | | | | | | | | | | | | | | | | | |
JPM | | | Pay | | | | JIBAR SAFEX | | | | 6.760 | | | | 11/21/15 | | | ZAR | | | 47,700 | | | | – | | | | 1,967 | |
| |
JPM | | | Pay | | | | BZDI | | | | 12.490 | | | | 1/4/16 | | | BRL | | | 27,410 | | | | – | | | | (16,173) | |
| |
JPM | | | Pay | | | | BZDI | | | | 12.810 | | | | 1/4/16 | | | BRL | | | 27,970 | | | | – | | | | 10,321 | |
| | | | | | | | | | | | | | | | | | | | | | | | | | |
| Total Over-the-Counter Interest Rate Swaps | | | | | | | | | $ | – | | | $ | 9,023 | |
| | | | | | | | | | | | | | | | | | | | | | | | | | |
|
|
Over-the-Counter Credit Default Swaptions Written at December 31, 2013 |
| | | | | | | | | | | | | | | | | | | | | | | | | | | | | | | | |
| Description | | Counterparty | | | Buy/Sell
Protection | | | Reference Asset | | | Fixed Rate | | | Expiration
Date | | | Notional Amount
(000’s) | | | Premiums
Received | | | Value | |
| |
| Credit Default Swap maturing 12/20/18 Call | | | JPM | | | | Sell | | | | CDX.NA.HY.21 | | | | 5.000% | | | | 1/15/14 | | | | USD 1,805 | | | $ | 3,790 | | | $ | (8) | |
| |
| Credit Default Swap maturing 12/20/18 Call | | | JPM | | | | Sell | | | | CDX.NA.HY.21 | | | | 5.000 | | | | 1/15/14 | | | | USD 1,805 | | | | 8,122 | | | | (25,122) | |
| |
| Credit Default Swap maturing 12/20/18 Call | | | JPM | | | | Sell | | | | CDX.NA.HY.21 | | | | 5.000 | | | | 1/15/14 | | | | USD 1,805 | | | | 8,483 | | | | (25,122) | |
| |
| Credit Default Swap maturing 12/20/18 Call | | | JPM | | | | Sell | | | | CDX.NA.HY.21 | | | | 5.000 | | | | 1/15/14 | | | | USD 1,805 | | | | 3,249 | | | | (8) | |
| |
| Credit Default Swap maturing 12/20/18 Call | | | JPM | | | | Sell | | | | CDX.NA.HY.21 | | | | 5.000 | | | | 2/19/14 | | | | USD 675 | | | | 1,823 | | | | (309) | |
| |
| Credit Default Swap maturing 12/20/18 Call | | | JPM | | | | Sell | | | | CDX.NA.HY.21 | | | | 5.000 | | | | 2/19/14 | | | | USD 675 | | | | 4,118 | | | | (8,872) | |
| |
| Credit Default Swap maturing 12/20/18 Call | | | JPM | | | | Sell | | |
| iTraxx Europe Series
20 Version 1 |
| | | 1.000 | | | | 2/19/14 | | | | EUR 14,585 | | | | 19,799 | | | | (24,546) | |
| |
| Credit Default Swap maturing 12/20/18 Call | | | JPM | | | | Sell | | |
| iTraxx Europe Series
20 Version 1 |
| | | 1.000 | | | | 2/19/14 | | | | EUR 14,585 | | | | 15,839 | | | | (2,103) | |
| | | | | | | | | | | | | | | | | | | | | | | | | | | | |
| Total of Over-the-Counter Credit Default Swaptions Written | | | | | | | | | | | $ | 65,223 | | | $ | (86,090) | |
| | | | | | | | | | | | | | | | | | | | | | | | | | | | |
|
|
Over-the-Counter Interest Rate Swaptions Written at December 31, 2013 |
| | | | | | | | | | | | | | | | | | | | | | | | | | | | | | | | | | |
| Description | | Counterparty | | | Pay/Receive
Floating Rate | | | Floating Rate | | | Fixed Rate | | | Expiration
Date | | | Notional Amount
(000’s) | | | Premiums
Received | | | Value | |
| |
| Interest Rate Swap maturing 1/10/19 Call | | | BAC | | | | Receive | | |
| Three-Month
USD BBA
LIBOR |
| | | 1.485% | | | | 1/8/14 | | | USD | | | 28,960 | | | $ | 75,296 | | | $ | (8) | |
| |
| Interest Rate Swap maturing 2/3/18 Call | | | BAC | | | | Pay | | |
| Six-Month
EUR EURIBOR |
| | | 1.440 | | | | 1/30/14 | | | EUR | | | 29,160 | | | | 117,457 | | | | (121,789) | |
| |
| Interest Rate Swap maturing 11/3/19 Call | | | BAC | | | | Pay | | |
| Six-Month
GBP BBA LIBOR |
| | | 2.175 | | | | 11/3/14 | | | GBP | | | 2,655 | | | | 71,650 | | | | (123,435) | |
| |
| Interest Rate Swap maturing 2/3/18 Call | | | BAC | | | | Pay | | |
| Six-Month
EUR EURIBOR |
| | | 1.457 | | | | 1/30/14 | | | EUR | | | 38,965 | | | | 159,617 | | | | (151,170) | |
| |
| Interest Rate Swap maturing 1/14/19 Call | | | BAC | | | | Pay | | |
| Six-Month
GBP BBA LIBOR |
| | | 1.750 | | | | 1/14/14 | | | GBP | | | 5,280 | | | | 69,354 | | | | (168,394) | |
| |
| Interest Rate Swap maturing 1/24/17 Call | | | BAC | | | | Receive | | |
| Six-Month
EUR EURIBOR |
| | | 0.810 | | | | 1/22/14 | | | EUR | | | 3,965 | | | | 14,745 | | | | (9,568) | |
| |
| Interest Rate Swap maturing 12/27/23 Call | | | BAC | | | | Pay | | |
| MXN TIIE
BANXICO |
| | | 6.580 | | | | 1/7/14 | | | MXN | | | 37,200 | | | | 70,205 | | | | (71,571) | |
| |
| Interest Rate Swap maturing 5/8/19 Call | | | BAC | | | | Receive | | |
| Three-Month
USD BBA
LIBOR |
| | | 1.400 | | | | 5/6/14 | | | USD | | | 17,550 | | | | 40,365 | | | | (4,438) | |
| |
| Interest Rate Swap maturing 4/27/22 Call | | | BAC | | | | Pay | | |
| Three-Month
USD BBA LIBOR |
| | | 3.100 | | | | 4/25/17 | | | USD | | | 20,415 | | | | 528,749 | | | | (1,199,811) | |
| |
| Interest Rate Swap maturing 11/25/19 Call | | | BAC | | | | Pay | | |
| Six-Month
GBP BBA LIBOR |
| | | 2.273 | | | | 11/25/14 | | | GBP | | | 5,410 | | | | 151,190 | | | | (239,592) | |
| |
| Interest Rate Swap maturing 6/1/33 Call | | | BAC | | | | Pay | | |
| Six-Month
EUR EURIBOR |
| | | 3.117 | | | | 5/30/23 | | | EUR | | | 1,345 | | | | 118,392 | | | | (139,199) | |
32 OPPENHEIMER GLOBAL STRATEGIC INCOME FUND/VA
|
|
Over-the-Counter Interest Rate Swaptions Written Continued |
| | | | | | | | | | | | | | | | | | | | | | | | | | | | | | | | | | |
| Description | | Counterparty | | | Pay/Receive
Floating Rate | | | Floating Rate | | | Fixed Rate | | | Expiration
Date | | | Notional Amount
(000’s) | | | Premiums
Received | | | Value | |
| |
| Interest Rate Swap maturing 11/4/19 Call | | | BAC | | | | Pay | | |
| Six-Month
GBP BBA
LIBOR |
| | | 2.178 | | | | 11/4/14 | | | GBP | | | 3,995 | | | $ | 107,701 | | | $ | (185,170) | |
| |
| Interest Rate Swap maturing 1/29/19 Call | | | BOA | | | | Pay | | |
| Three-Month
CAD BA CDOR |
| | | 2.178 | | | | 1/29/14 | | | CAD | | | 2,645 | | | | 16,141 | | | | (18,122) | |
| |
| Interest Rate Swap maturing 5/8/19 Call | | | BOA | | | | Receive | | |
| Three-Month
USD BBA LIBOR |
| | | 1.400 | | | | 5/6/14 | | | USD | | | 29,250 | | | | 68,738 | | | | (7,396) | |
| |
| Interest Rate Swap maturing 2/3/18 Call | | | BOA | | | | Pay | | |
| Six-Month
EUR EURIBOR |
| | | 1.433 | | | | 1/30/14 | | | EUR | | | 17,495 | | | | 70,470 | | | | (75,435) | |
| |
| Interest Rate Swap maturing 5/8/19 Call | | | BOA | | | | Pay | | |
| Three-Month
USD BBA LIBOR |
| | | 2.000 | | | | 5/6/14 | | | USD | | | 29,250 | | | | 219,375 | | | | (299,153) | |
| |
| Interest Rate Swap maturing 1/2/24 Call | | | BOA | | | | Pay | | |
| MXN TIIE
BANXICO |
| | | 6.060 | | | | 1/13/14 | | | MXN | | | 6,630 | | | | 19,218 | | | | (32,788) | |
| |
| Interest Rate Swap maturing 7/27/26 Call | | | BOA | | | | Pay | | |
| Three-Month
USD BBA
LIBOR |
| | | 3.960 | | | | 7/25/16 | | | USD | | | 14,750 | | | | 798,558 | | | | (915,536) | |
| |
| Interest Rate Swap maturing 8/4/21 Call | | | BOA | | | | Pay | | |
| Three-Month
USD BBA LIBOR |
| | | 4.860 | | | | 8/2/16 | | | USD | | | 5,515 | | | | 82,725 | | | | (92,306) | |
| |
| Interest Rate Swap maturing 12/4/20 Call | | | GSG | | | | Pay | | |
| Six-Month
GBP BBA
LIBOR |
| | | 2.055 | | | | 12/4/15 | | | GBP | | | 5,020 | | | | 189,330 | | | | (470,592) | |
| |
| Interest Rate Swap maturing 1/27/18 Call | | | GSG | | | | Pay | | |
| Six-Month
EUR EURIBOR |
| | | 1.500 | | | | 1/23/14 | | | EUR | | | 6,600 | | | | 26,835 | | | | (17,949) | |
| |
| Interest Rate Swap maturing 2/12/24 Call | | | JPM | | | | Pay | | |
| Three-Month
USD BBA
LIBOR |
| | | 3.275 | | | | 2/10/14 | | | USD | | | 11,730 | | | | 78,591 | | | | (57,194) | |
| |
| Interest Rate Swap maturing 5/13/24 Call | | | JPM | | | | Pay | | |
| Six-Month
AUD BBR BBSW |
| | | 4.075 | | | | 5/12/14 | | | AUD | | | 1,330 | | | | 34,620 | | | | (61,914) | |
| |
| Interest Rate Swap maturing 5/8/29 Call | | | JPM | | | | Pay | | |
| Three-Month
USD BBA LIBOR |
| | | 3.473 | | | | 5/6/14 | | | USD | | | 18,775 | | | | 537,904 | | | | (776,439) | |
| |
| Interest Rate Swap maturing 12/27/23 Call | | | JPM | | | | Pay | | |
| MXN TIIE
BANXICO |
| | | 6.585 | | | | 1/7/14 | | | MXN | | | 36,600 | | | | 72,456 | | | | (69,479) | |
| |
| Interest Rate Swap maturing 4/10/19 Call | | | JPM | | | | Pay | | |
| Three-Month
USD BBA
LIBOR |
| | | 2.645 | | | | 4/8/14 | | | USD | | | 28,960 | | | | 94,844 | | | | (41,093) | |
| |
| Interest Rate Swap maturing 1/3/24 Call | | | JPM | | | | Pay | | |
| MXN TIIE
BANXICO |
| | | 6.280 | | | | 1/14/14 | | | MXN | | | 2,600 | | | | 4,743 | | | | (9,622) | |
| |
| Interest Rate Swap maturing 1/28/17 Call | | | UBS | | | | Receive | | |
| Six-Month
EUR EURIBOR |
| | | 0.835 | | | | 1/24/14 | | | EUR | | | 17,460 | | | | 66,880 | | | | (52,335) | |
| |
| Interest Rate Swap maturing 5/23/18 Call | | | UBS | | | | Pay | | |
| Six-Month
GBP BBA LIBOR |
| | | 1.545 | | | | 5/23/16 | | | GBP | | | 2,675 | | | | 35,371 | | | | (123,285) | |
| |
| Interest Rate Swap maturing 3/7/24 Call | | | UBS | | | | Receive | | |
| Six-Month
EUR EURIBOR |
| | | 2.510 | | | | 3/5/14 | | | EUR | | | 2,620 | | | | 68,738 | | | | (103,764) | |
| | | | | | | | | | | | | | | | | | | | | | | | | | | | | | |
| Total of Over-the-Counter Interest Rate Swaptions Written | | | | | | | | | | | | | $ | 4,010,258 | | | $ | (5,638,547) | |
| | | | | | | | | | | | | | | | | | | | | | | | | | | | | | |
Glossary:
Counterparty Abbreviations
| | |
| BAC | | Barclays Bank plc |
| BNP | | BNP Paribas |
| BOA | | Bank of America NA |
| CITNA-B | | Citibank NA |
| DEU | | Deutsche Bank Securities, Inc. |
| FIB | | Credit Suisse International |
| GSCO-OT | | Goldman Sachs Bank USA |
| GSG | | Goldman Sachs Group, Inc. (The) |
| HSBC | | HSBC bank USA NA |
| JPM | | JPMorgan Chase Bank NA |
| MSCO | | Morgan Stanley Capital Services, Inc. |
| RBS | | RBS Greenwich Capital |
| UBS | | UBS AG |
33 OPPENHEIMER GLOBAL STRATEGIC INCOME FUND/VA
CONSOLIDATEDSTATEMENTOF INVESTMENTS Continued
| | |
| Currency abbreviations indicate amounts reporting in currencies |
| AUD | | Australian Dollar |
| BRL | | Brazilian Real |
| CAD | | Canadian Dollar |
| CHF | | Swiss Franc |
| CLP | | Chilean Peso |
| CNH | | Offshore Chinese Renminbi |
| COP | | Colombian Peso |
| DKK | | Danish Krone |
| EUR | | Euro |
| GBP | | British Pound Sterling |
| HUF | | Hungarian Forint |
| IDR | | Indonesian Rupiah |
| INR | | Indian Rupee |
| KRW | | South Korean Won |
| JPY | | Japanese Yen |
| MXN | | Mexican Nuevo Peso |
| MYR | | Malaysian Ringgit |
| NOK | | Norwegian Krone |
| PEN | | Peruvian New Sol |
| PHP | | Philippines Peso |
| PLN | | Polish Zloty |
| RON | | New Romanian Leu |
| SEK | | Swedish Krona |
| THB | | Thailand Baht |
| TRY | | New Turkish Lira |
| RUB | | Russian Ruble |
| ZAR | | South African Rand |
Definitions |
| BA CDOR | | Canada Bankers Acceptances Deposit Offering Rate |
| BBA LIBOR | | British Bankers’ Association London –Interbank Offered Rate |
| BBR BBSW | | Bank Bill Swap Reference Rate (Australian Financial Market) |
| BANXICO | | Banco de Mexico |
| BZDI | | Brazil Interbank Deposit Rate |
| CDX.NA.HY.21 | | Markit CDX North American High Yield |
| EURIBOR | | Euro Interbank Offered Rate |
| iTraxx Europe Crossover Series 20 | | Credit Default Swap Trading Index for a Specific Basket of Securities |
| iTraxx Europe Series 20 Version 1 | | Credit Default Swap Trading Index for a Specific Basket of Securities |
| JIBAR | | South Africa Johannesburg Interbank Agreed Rate |
| SAFEX | | South Africa Futures Exchange |
| STIBOR SIDE | | Stockholm Interbank Offered Rate |
| TIIE | | Interbank Equilibrium Interest Rate |
Exchange Abbreviations |
| CBT | | Chicago Board of Trade |
| EUX | | European Stock Exchanges |
| LIF | | London International Financial Futures and Options Exchange |
| SFE | | Sydney Futures Exchange |
See accompanying Notes to Consolidated Financial Statements.
34 OPPENHEIMER GLOBAL STRATEGIC INCOME FUND/VA
CONSOLIDATED STATEMENT OF ASSETS AND LIABILITIES December 31, 2013
| | | | |
| |
Assets | | | | |
Investments, at value—see accompanying consolidated statement of investments: | | | | |
Unaffiliated companies (cost $2,355,212,206) | | $ | 2,334,255,838 | |
Affiliated companies (cost $149,468,706) | | | 151,369,768 | |
| | | | |
| | | 2,485,625,606 | |
| |
Cash | | | 613,299 | |
| |
Cash—foreign currencies (cost $16) | | | 16 | |
| |
Cash used for collateral on Centrally Cleared Swaps | | | 2,760,155 | |
| |
Unrealized appreciation on foreign currency exchange contracts | | | 13,161,850 | |
| |
Swaps, at value (premiums paid $485,095) | | | 815,914 | |
| |
Receivables and other assets: | | | | |
Investments sold (including $16,310,026 sold on a when-issued or delayed delivery basis) | | | 52,237,197 | |
Interest, dividends and principal paydowns | | | 24,773,569 | |
Shares of beneficial interest sold | | | 14,338,700 | |
Variation margin receivable | | | 1,090,082 | |
Other | | | 161,590 | |
| | | | |
Total assets | | | 2,595,577,978 | |
|
| |
Liabilities | | | | |
Unrealized depreciation on foreign currency exchange contracts | | | 16,369,483 | |
| |
Options written, at value (premiums received $903,847) | | | 395,629 | |
| |
Swaps, at value (premiums received $217,245) | | | 514,773 | |
| |
Swaptions written, at value (premiums received $4,075,481) | | | 5,724,637 | |
| |
Payables and other liabilities: | | | | |
Investments purchased (including $113,411,571 purchased on a when-issued or delayed delivery basis) | | | 113,412,125 | |
Variation margin payable | | | 1,828,892 | |
Shares of beneficial interest redeemed | | | 1,429,946 | |
Distribution and service plan fees | | | 375,467 | |
Transfer and shareholder servicing agent fees | | | 207,393 | |
Shareholder communications | | | 103,908 | |
Trustees’ compensation | | | 81,062 | |
Other | | | 367,485 | |
| | | | |
Total liabilities | | | 140,810,800 | |
|
| |
Net Assets | | $ | 2,454,767,178 | |
| | | | |
| | | | |
| |
Composition of Net Assets | | | | |
Par value of shares of beneficial interest | | $ | 449,575 | |
| |
Additional paid-in capital | | | 2,444,017,008 | |
| |
Accumulated net investment income | | | 119,930,049 | |
| |
Accumulated net realized loss on investments and foreign currency transactions | | | (84,048,360) | |
| |
Net unrealized depreciation on investments and translation of assets and liabilities denominated in foreign currencies | | | (25,581,094) | |
| | | | |
Net Assets | | $ | 2,454,767,178 | |
| | | | |
|
| |
Net Asset Value Per Share | | | | |
Non-Service Shares: | | | | |
Net asset value, redemption price (excludes applicable contingent deferred sales charge) and offering price per share (based on net assets of $738,740,778 and 137,365,988 shares of beneficial interest outstanding) | | | $5.38 | |
| |
Service Shares: | | | | |
Net asset value, redemption price (excludes applicable contingent deferred sales charge) and offering price per share (based on net assets of $1,716,026,400 and 312,209,152 shares of beneficial interest outstanding) | | | $5.50 | |
See accompanying Notes to Consolidated Financial Statements.
35 OPPENHEIMER GLOBAL STRATEGIC INCOME FUND/VA
CONSOLIDATED STATEMENT OF OPERATIONS For the Year Ended December 31, 2013
| | | | |
| |
Allocation of Income and Expenses from master funds1 | | | | |
Net investment income allocated from Oppenheimer Master Event-Linked Bond Fund, LLC: | | | | |
Interest | | $ | 5,252,251 | |
Dividends | | | 2,586 | |
Net Expenses | | | (272,412) | |
| | | | |
Net investment income allocated from Oppenheimer Master Event-Linked Bond Fund, LLC | | | 4,982,425 | |
| |
Net investment income allocated from Oppenheimer Master Loan Fund, LLC | | | | |
Interest | | | 6,380,556 | |
Dividends | | | 2,953 | |
Net Expenses | | | (312,486) | |
| | | | |
Net investment income allocated from Oppenheimer Master Loan Fund, LLC | | | 6,071,023 | |
| | | | |
Total allocation of net investment income from master funds | | | 11,053,448 | |
|
| |
Investment Income | | | | |
Interest: | | | | |
Unaffiliated companies (net of foreign withholding taxes of $35,402) | | | 128,718,858 | |
| |
Fee income on when-issued securities | | | 6,920,497 | |
| |
Dividends: | | | | |
Unaffiliated companies (net of foreign withholding taxes of $62,351) | | | 433,942 | |
Affiliated companies | | | 134,675 | |
| | | | |
Total investment income | | | 136,207,972 | |
|
| |
Expenses | | | | |
Management fees | | | 14,537,604 | |
| |
Distribution and service plan fees—Service shares | | | 4,498,180 | |
| |
Transfer and shareholder servicing agent fees: | | | | |
Non-Service shares | | | 736,800 | |
Service shares | | | 1,799,541 | |
| |
Shareholder communications: | | | | |
Non-Service shares | | | 135,204 | |
Service shares | | | 324,360 | |
| |
Custodian fees and expenses | | | 347,858 | |
| |
Trustees’ compensation | | | 75,220 | |
| |
Other | | | 314,494 | |
| | | | |
Total expenses | | | 22,769,261 | |
Less waivers and reimbursements of expenses | | | (637,303) | |
| | | | |
Net expenses | | | 22,131,958 | |
|
| |
Net Investment Income | | | 125,129,462 | |
36 OPPENHEIMER GLOBAL STRATEGIC INCOME FUND/VA
| | | | |
| |
Realized and Unrealized Gain (Loss) | | | | |
Net realized gain (loss) on: | | | | |
Investments from: | | | | |
Unaffiliated companies (includes premiums on options and swaptions exercised) | | $ | (12,484,014) | |
Closing and expiration of option contracts written | | | 9,039,937 | |
Closing and expiration of futures contracts | | | (15,395,253) | |
Closing and expiration of swaption contracts written | | | (2,229,547) | |
Foreign currency transactions | | | (40,780,206) | |
Swap contracts | | | (4,082,177) | |
| |
Net realized gain allocated from: | | | | |
Oppenheimer Master Event-Linked Bond Fund, LLC | | | 42,005 | |
Oppenheimer Master Loan Fund, LLC | | | 5,434,614 | |
| | | | |
Net realized gain | | | (60,454,641) | |
| |
Net change in unrealized appreciation/depreciation on: | | | | |
Investments | | | (55,705,514) | |
Translation of assets and liabilities denominated in foreign currencies | | | (13,713,694) | |
Futures contracts | | | (1,271,632) | |
Option contracts written | | | (50,307) | |
Swap contracts | | | 402,759 | |
Swaption contracts written | | | (1,501,532) | |
| |
Net change in unrealized appreciation/depreciation allocated from: | | | | |
Oppenheimer Master Event-Linked Bond Fund, LLC | | | 1,990,398 | |
Oppenheimer Master Loan Fund, LLC | | | (3,700,722) | |
| | | | |
Net change in unrealized appreciation/depreciation | | | (73,550,244) | |
|
| |
Net Decrease in Net Assets Resulting from Operations | | $ | (8,875,423) | |
| | | | |
1. The Fund invests in certain affiliated funds that expect to be treated as partnerships for tax purposes. See Note 1 of the accompanying Consolidated Notes.
See accompanying Notes to Consolidated Financial Statements.
37 OPPENHEIMER GLOBAL STRATEGIC INCOME FUND/VA
CONSOLIDATED STATEMENTS OF CHANGES IN NET ASSETS
| | | | | | | | |
| | | Year Ended | | | Year Ended | |
| | | December 31, 2013 | | | December 31, 20121 | |
| |
Operations | | | | | | | | |
Net investment income | | $ | 125,129,462 | | | $ | 140,214,643 | |
| |
Net realized gain (loss) | | | (60,454,641) | | | | (35,412,937) | |
| |
Net change in unrealized appreciation/depreciation | | | (73,550,244) | | | | 192,342,982 | |
| | | | | | | | |
Net increase (decrease) in net assets resulting from operations | | | (8,875,423) | | | | 297,144,688 | |
|
| |
Dividends and/or Distributions to Shareholders | | | | | | | | |
Dividends from net investment income: | | | | | | | | |
Non-Service shares | | | (36,272,242) | | | | (41,097,829) | |
Service shares | | | (83,922,335) | | | | (95,632,597) | |
| | | | |
| | | (120,194,577) | | | | (136,730,426) | |
|
| |
Distributions from net realized gain: | | | | | | | | |
Non-Service shares | | | — | | | | (7,582,316) | |
Service shares | | | — | | | | (18,415,501) | |
| | | | |
| | | — | | | | (25,997,817) | |
|
| |
Beneficial Interest Transactions | | | | | | | | |
Net increase (decrease) in net assets resulting from beneficial interest transactions: | | | | | | | | |
Non-Service shares | | | 33,900,242 | | | | 56,198,952 | |
Service shares | | | (32,780,220) | | | | 139,111,661 | |
| | | | | | | | |
| | | 1,120,022 | | | | 195,310,613 | |
|
| |
Net Assets | | | | | | | | |
Total increase (decrease) | | | (127,949,978) | | | | 329,727,058 | |
| |
Beginning of period | | | 2,582,717,156 | | | | 2,252,990,098 | |
| | | | | | | | |
End of period (including accumulated net investment income of $119,930,049 and $132,294,431, respectively) | | $ | 2,454,767,178 | | | $ | 2,582,717,156 | |
| | | | |
1. Certain amounts have been restated to reflect a change in method of accounting. See Note 1 of the accompanying Consolidated Notes.
See accompanying Notes to Consolidated Financial Statements.
38 OPPENHEIMER GLOBAL STRATEGIC INCOME FUND/VA
CONSOLIDATED FINANCIAL HIGHLIGHTS
| | | | | | | | | | | | | | | | | | | | |
Non-Service Shares | | Year Ended | | | Year Ended | | | Year Ended | | | Year Ended | | | Year Ended | |
| | December | | | December | | | December | | | December | | | December | |
| | 31, 2013 | | | 31, 20121 | | | 30, 20111,2 | | | 31, 2010 | | | 31, 2009 | |
| |
Per Share Operating Data | | | | | | | | | | | | | | | | | | | | |
Net asset value, beginning of period | | $ | 5.67 | | | $ | 5.38 | | | $ | 5.58 | | | $ | 5.30 | | | $ | 4.49 | |
| |
Income (loss) from investment operations: | | | | | | | | | | | | | | | | | | | | |
Net investment income3 | | | 0.28 | | | | 0.33 | | | | 0.36 | | | | 0.34 | | | | 0.30 | |
Net realized and unrealized gain (loss) | | | (0.29) | | | | 0.36 | | | | (0.31) | | | | 0.40 | | | | 0.53 | |
| | | | |
Total from investment operations | | | (0.01) | | | | 0.69 | | | | 0.05 | | | | 0.74 | | | | 0.83 | |
| |
Dividends and/or distributions to shareholders: | | | | | | | | | | | | | | | | | | | | |
Dividends from net investment income | | | (0.28) | | | | (0.34) | | | | (0.18) | | | | (0.46) | | | | (0.02) | |
Distributions from net realized gain | | | 0.00 | | | | (0.06) | | | | (0.07) | | | | 0.00 | | | | 0.004 | |
| | | | |
Total dividends and distributions to shareholders | | | (0.28) | | | | (0.40) | | | | (0.25) | | | | (0.46) | | | | (0.02) | |
| |
Net asset value, end of period | | $ | 5.38 | | | $ | 5.67 | | | $ | 5.38 | | | $ | 5.58 | | | $ | 5.30 | |
| | | | |
|
| |
Total Return, at Net Asset Value5 | | | (0.13)% | | | | 13.53% | | | | 0.85% | | | | 14.97% | | | | 18.83% | |
| |
Ratios/Supplemental Data | | | | | | | | | | | | | | | | | | | | |
Net assets, end of period (in thousands) | | $ | 738,741 | | | $ | 741,996 | | | $ | 648,084 | | | $ | 771,755 | | | $ | 757,772 | |
| |
Average net assets (in thousands) | | $ | 734,707 | | | $ | 690,351 | | | $ | 694,868 | | | $ | 737,071 | | | $ | 681,926 | |
| |
Ratios to average net assets:6,7 | | | | | | | | | | | | | | | | | | | | |
Net investment income | | | 5.12% | | | | 6.01% | | | | 6.50% | | | | 6.47% | | | | 6.20% | |
Total expenses8 | | | 0.74% | | | | 0.77% | | | | 0.77% | | | | 0.75% | | | | 0.67% | |
Expenses after payments, waivers and/or reimbursements and reduction to custodian expenses | | | 0.72% | | | | 0.71% | | | | 0.71% | | | | 0.71% | | | | 0.64% | |
| |
Portfolio turnover rate9 | | | 107% | | | | 78% | | | | 49% | | | | 99% | | | | 110% | |
1. Certain amounts have been restated to reflect a change in a method of accounting. See Note 1 of the accompanying Consolidated Notes.
2. December 30, 2011 represents the last business day of the Fund’s 2011 reporting period.
3. Per share amounts calculated based on the average shares outstanding during the period.
4. Less than $0.005 per share.
5. Assumes an initial investment on the business day before the first day of the fiscal period, with all dividends and distributions reinvested in additional shares on the reinvestment date, and redemption at the net asset value calculated on the last business day of the fiscal period. Total returns are not annualized for periods less than one full year. Total return information does not reflect expenses that apply at the separate account level or to related insurance products. Inclusion of these charges would reduce the total return figures for all periods shown. Returns do not reflect the deduction of taxes that a shareholder would pay on fund distributions or the redemption of fund shares.
6. Annualized for periods less than one full year.
7. Includes the Fund’s share of the allocated expenses and/or net investment income from the master funds.
8. Total expenses including indirect expenses from affiliated fund were as follows:
| | | | | | |
| | Year Ended December 31, 2013 | | 0.74% | | |
| | Year Ended December 31, 2012 | | 0.77% | | |
| | Year Ended December 30, 2011 | | 0.77% | | |
| | Year Ended December 31, 2010 | | 0.75% | | |
| | Year Ended December 31, 2009 | | 0.68% | | |
9. The portfolio turnover rate excludes purchase and sale transactions of To Be Announced (TBA) mortgage-related securities as follows:
| | | | | | | | | | |
| | | Purchase Transactions | | | Sale Transactions | | | |
| | | |
Year Ended December 31, 2013 | | | $4,294,357,677 | | | | $4,679,296,373 | | | |
Year Ended December 31, 2012 | | | $3,862,820,437 | | | | $3,466,796,233 | | | |
Year Ended December 31, 2011 | | | $1,050,654,783 | | | | $1,039,506,614 | | | |
Year Ended December 31, 2010 | | | $1,034,550,699 | | | | $1,085,289,655 | | | |
Year Ended December 31, 2009 | | | $1,909,574,925 | | | | $1,836,038,328 | | | |
See accompanying Notes to Consolidated Financial Statements.
39 OPPENHEIMER GLOBAL STRATEGIC INCOME FUND/VA
CONSOLIDATED FINANCIAL HIGHLIGHTS Continued
| | | | | | | | | | | | | | | | | | | | |
Service Shares | | Year Ended | | | Year Ended | | | Year Ended | | | Year Ended | | | Year Ended | |
| | December 31, | | | December 31, | | | December 30, | | | December 31, | | | December 31, | |
| | 2013 | | | 20121 | | | 20111,2 | | | 2010 | | | 2009 | |
| |
Per Share Operating Data | | | | | | | | | | | | | | | | | | | | |
Net asset value, beginning of period | | $ | 5.79 | | | $ | 5.49 | | | $ | 5.68 | | | $ | 5.38 | | | $ | 4.56 | |
| |
Income (loss) from investment operations: | | | | | | | | | | | | | | | | | | | | |
Net investment income3 | | | 0.27 | | | | 0.33 | | | | 0.35 | | | | 0.33 | | | | 0.29 | |
Net realized and unrealized gain (loss) | | | (0.29) | | | | 0.36 | | | | (0.31) | | | | 0.42 | | | | 0.54 | |
| | | | |
Total from investment operations | | | (0.02) | | | | 0.69 | | | | 0.04 | | | | 0.75 | | | | 0.83 | |
| |
Dividends and/or distributions to shareholders: | | | | | | | | | | | | | | | | | | | | |
Dividends from net investment income | | | (0.27) | | | | (0.33) | | | | (0.16) | | | | (0.45) | | | | (0.01) | |
Distributions from net realized gain | | | 0.00 | | | | (0.06) | | | | (0.07) | | | | 0.00 | | | | 0.004 | |
| | | | |
Total dividends and distributions to shareholders | | | (0.27) | | | | (0.39) | | | | (0.23) | | | | (0.45) | | | | (0.01) | |
| |
Net asset value, end of period | | $ | 5.50 | | | $ | 5.79 | | | $ | 5.49 | | | $ | 5.68 | | | $ | 5.38 | |
| | | | |
|
| |
Total Return, at Net Asset Value5 | | | (0.37)% | | | | 13.15% | | | | 0.65% | | | | 14.77% | | | | 18.41% | |
| |
Ratios/Supplemental Data | | | | | | | | | | | | | | | | | | | | |
Net assets, end of period (in thousands) | | $ | 1,716,026 | | | $ | 1,840,721 | | | $ | 1,604,906 | | | $ | 1,670,340 | | | $ | 3,656,726 | |
| |
Average net assets (in thousands) | | $ | 1,794,640 | | | $ | 1,715,995 | | | $ | 1,673,715 | | | $ | 2,485,427 | | | $ | 3,143,836 | |
| |
Ratios to average net assets:6,7 | | | | | | | | | | | | | | | | | | | | |
Net investment income | | | 4.88% | | | | 5.76% | | | | 6.25% | | | | 6.15% | | | | 5.95% | |
Total expenses8 | | | 0.99% | | | | 1.02% | | | | 1.02% | | | | 0.99% | | | | 0.92% | |
Expenses after payments, waivers and/or reimbursements and reduction to custodian expenses | | | 0.97% | | | | 0.96% | | | | 0.96% | | | | 0.95% | | | | 0.89% | |
| |
Portfolio turnover rate9 | | | 107% | | | | 78% | | | | 49% | | | | 99% | | | | 110% | |
1. Certain amounts have been restated to reflect a change in a method of accounting. See Note 1 of the accompanying Consolidated Notes.
2. December 30, 2011 represents the last business day of the Fund’s 2011 reporting period.
3. Per share amounts calculated based on the average shares outstanding during the period.
4. Less than $0.005 per share.
5. Assumes an initial investment on the business day before the first day of the fiscal period, with all dividends and distributions reinvested in additional shares on the reinvestment date, and redemption at the net asset value calculated on the last business day of the fiscal period. Total returns are not annualized for periods less than one full year. Total return information does not reflect expenses that apply at the separate account level or to related insurance products. Inclusion of these charges would reduce the total return figures for all periods shown. Returns do not reflect the deduction of taxes that a shareholder would pay on fund distributions or the redemption of fund shares.
6. Annualized for periods less than one full year.
7. Includes the Fund’s share of the allocated expenses and/or net investment income from the master funds.
8. Total expenses including indirect expenses from affiliated fund were as follows:
| | | | | | |
| | Year Ended December 31, 2013 | | 0.99% | | |
| | Year Ended December 31, 2012 | | 1.02% | | |
| | Year Ended December 30, 2011 | | 1.02% | | |
| | Year Ended December 31, 2010 | | 0.99% | | |
| | Year Ended December 31, 2009 | | 0.93% | | |
9. The portfolio turnover rate excludes purchase and sale transactions of To Be Announced (TBA) mortgage-related securities as follows:
| | | | | | | | | | |
| | | Purchase Transactions | | | Sale Transactions | | | |
| | | |
Year Ended December 31, 2013 | | | $4,294,357,677 | | | | $4,679,296,373 | | | |
Year Ended December 31, 2012 | | | $3,862,820,437 | | | | $3,466,796,233 | | | |
Year Ended December 31, 2011 | | | $1,050,654,783 | | | | $1,039,506,614 | | | |
Year Ended December 31, 2010 | | | $1,034,550,699 | | | | $1,085,289,655 | | | |
Year Ended December 31, 2009 | | | $1,909,574,925 | | | | $1,836,038,328 | | | |
See accompanying Notes to Consolidated Financial Statements.
40 OPPENHEIMER GLOBAL STRATEGIC INCOME FUND/VA
NOTESTO CONSOLIDATED FINANCIAL STATEMENTS December 31, 2013
1. Significant Accounting Policies
Oppenheimer Global Strategic Income Fund/VA (the “Fund”) is a separate series of Oppenheimer Variable Account Funds, a diversified open-end management investment company registered under the Investment Company Act of 1940, as amended. The Fund’s main investment objective is to seek total return. The Fund’s investment adviser is OFI Global Asset Management, Inc. (“OFI Global” or the “Manager”), a wholly-owned subsidiary of OppenheimerFunds, Inc. (“OFI” or the “Sub-Adviser”). The Manager has entered into a sub-advisory agreement with OFI. Shares of the Fund are sold only to separate accounts of life insurance companies.
The Fund offers two classes of shares. Both classes are sold at their offering price, which is the net asset value per share, to separate investment accounts of participating insurance companies as an underlying investment for variable life insurance policies, variable annuity contracts or other investment products. The class of shares designated as Service shares is subject to a distribution and service plan. Both classes of shares have identical rights and voting privileges with respect to the Fund in general and exclusive voting rights on matters that affect that class alone. Earnings, net assets and net asset value per share may differ due to each class having its own expenses, such as transfer and shareholder servicing agent fees and shareholder communications, directly attributable to that class.
The following is a summary of significant accounting policies consistently followed by the Fund.
Change in Method of Accounting. The accompanying financial statements reflect the financial position of the Fund and its Subsidiary and the results of operations on a consolidated basis. Prior to June 28, 2013, the Subsidiary was shown as an investment of the Fund on the Statement of Investments and the financial statements of the Subsidiary were presented along with the Fund. The staff of the Securities and Exchange Commission has recently commented on their preference to have wholly-owned Cayman investment funds consolidated into the parent fund’s financial statements. Management of the Fund implemented the change in policy because it is a more effective method of providing transparency into the Fund’s holdings and operations. Accordingly, as a result of the change in method of accounting, the Fund consolidates the assets and liabilities as well as the operations of the Subsidiary within its financial statements. The result of the policy change did not have an impact on total net assets of the Fund, however it resulted in the following changes to the financial statements. As of the beginning of the Fund’s fiscal period, the financial statement line items on the Consolidated Statement of Assets and Liabilities were affected by the change as follows: cash increased $1,455,203; payables and other liabilities increased $20,236 and investments at value, wholly-owned subsidiary decreased $1,434,967. For the year ended December 31, 2013, the financial statement line items on the Consolidated Statements of Operations and Changes in Net Assets were affected by the change as follows: net investment income includes a net investment loss from the Subsidiary of $44,838. For the year ended December 31, 2012, the following changes were made to the Consolidated Statement of Changes in Net Assets: net investment income decreased $47,552 and net change in unrealized appreciation increased by $47,552. The changes to the Consolidated Financial Highlights were immaterial.
Structured Securities. The Fund invests in structured securities whose market values, interest rates and/or redemption prices are linked to the performance of underlying foreign currencies, interest rate spreads, stock market indices, prices of individual securities, commodities or other financial instruments or the occurrence of other specific events. The structured securities are often leveraged, increasing the volatility of each note’s market value relative to the change in the underlying linked financial element or event. Fluctuations in value of these securities are recorded as unrealized gains and losses in the accompanying Consolidated Statement of Operations. The Fund records a realized gain or loss when a structured security is sold or matures.
Securities on a When-Issued or Delayed Delivery Basis. The Fund may purchase securities on a “when-issued” basis, and may purchase or sell securities on a “delayed delivery” basis. “When-issued” or “delayed delivery” refers to securities whose terms and indenture are available and for which a market exists, but which are not available for immediate delivery. Delivery and payment for securities that have been purchased by the Fund on a when-issued basis normally takes place within six months and possibly as long as two years or more after the trade date. During this period, such securities do not earn interest, are subject to market fluctuation and may increase or decrease in value prior to their delivery. The purchase of securities on a when-issued basis may increase the volatility of the Fund’s net asset value to the extent the Fund executes such transactions while remaining substantially fully invested. When the Fund engages in when-issued or delayed delivery transactions, it relies on the buyer or seller, as the case may be, to complete the transaction. Their failure to do so may cause the Fund to lose the opportunity to obtain or dispose of the security at a price and yield it considers advantageous. The Fund may also sell securities that it purchased on a when-issued basis or forward commitment prior to settlement of the original purchase.
As of December 31, 2013, the Fund had purchased securities issued on a when-issued or delayed delivery basis and sold securities issued on a delayed delivery basis as follows:
| | | | |
| | | When-Issued or
Delayed Delivery
Basis Transactions | |
| |
Purchased securities | | | $113,411,571 | |
Sold securities | | | 16,310,026 | |
The Fund may enter into “forward roll” transactions with respect to mortgage-related securities. In this type of transaction, the Fund sells a mortgage-related security to a buyer and simultaneously agrees to repurchase a similar security (same type, coupon and maturity) at a later date at a set price. During the period between the sale and the repurchase, the Fund will not be entitled to receive interest and principal payments on the securities that have been sold. The Fund records the incremental difference between the forward purchase and sale of each forward roll as realized gain (loss) on investments or as fee income in the case of such transactions that have an associated fee in lieu of a difference in the forward purchase and sale price.
41 OPPENHEIMER GLOBAL STRATEGIC INCOME FUND/VA
NOTESTO CONSOLIDATED FINANCIAL STATEMENTS Continued
1. Significant Accounting Policies (Continued)
Forward roll transactions may be deemed to entail embedded leverage since the Fund purchases mortgage-related securities with extended settlement dates rather than paying for the securities under a normal settlement cycle. This embedded leverage increases the Fund’s market value of investments relative to its net assets which can incrementally increase the volatility of the Fund’s performance. Forward roll transactions can be replicated over multiple settlement periods.
Risks of entering into forward roll transactions include the potential inability of the counterparty to meet the terms of the agreement; the potential of the Fund to receive inferior securities at redelivery as compared to the securities sold to the counterparty; and counterparty credit risk.
Credit Risk. The Fund invests in high-yield, non-investment-grade bonds, which may be subject to a greater degree of credit risk. Credit risk relates to the ability of the issuer to meet interest or principal payments or both as they become due. The Fund may acquire securities that have missed an interest payment, and is not obligated to dispose of securities whose issuers or underlying obligors subsequently miss an interest payment. Information concerning securities not accruing interest as of December 31, 2013 is as follows:
| | | | |
Cost | | | $14,336,764 | |
Market Value | | | $512,683 | |
Market value as % of Net Assets | | | 0.02% | |
Sovereign Debt Risk. The Fund invests in sovereign debt securities, which are subject to certain special risks. These risks include, but are not limited to, the risk that a governmental entity may delay or refuse, or otherwise be unable, to pay interest or repay the principal on its sovereign debt. There may also be no legal process for collecting sovereign debt that a government does not pay or bankruptcy proceedings through which all or part of such sovereign debt may be collected. In addition, a restructuring or default of sovereign debt may also cause additional impacts to the financial markets, such as downgrades to credit ratings, reduced liquidity and increased volatility, among others.
Investment in Oppenheimer Global Strategic Income Fund (Cayman) Ltd. The Fund may invest up to 25% of its total assets in Oppenheimer Global Strategic Income Fund (Cayman) Ltd., a wholly-owned and controlled Cayman Islands subsidiary (the “Subsidiary”). The Subsidiary invests primarily in commodity-linked derivatives (including commodity related futures, options and swap contracts), exchange traded funds and certain fixed-income securities and other investments that may serve as margin or collateral for its derivatives positions. Investments in the Subsidiary are expected to provide the Fund with exposure to commodities markets within the limitations of the federal tax requirements that apply to the Fund. The Subsidiary is subject to the same investment restrictions and guidelines, and follows the same compliance policies and procedures, as the Fund. The Fund wholly owns and controls the Subsidiary, and the Fund and Subsidiary are both managed by the Manager. The financial statements have been consolidated and include accounts of the Fund and the Subsidiary. Accordingly, all inter-company transactions and balances have been eliminated.
For tax purposes, the Subsidiary is an exempted Cayman investment company. The Subsidiary has received an undertaking from the Government of the Cayman Islands exempting it from all local income, profits and capital gains taxes through September of 2030. No such taxes are levied in the Cayman Islands at the present time. For U.S. income tax purposes, the Subsidiary is a Controlled Foreign Corporation and as such is not subject to U.S. income tax. However, as a wholly-owned Controlled Foreign Corporation, the Subsidiary’s net income and capital gain, to the extent of its earnings and profits, will be included each year in the Fund’s investment company taxable income. For the year ended December 31, 2013, the Subsidiary has a deficit of $44,838 in its taxable earnings and profits. In addition, any in-kind capital contributions made by the Fund to the Subsidiary will result in the Fund recognizing taxable gain to the extent of unrealized gain, if any, on securities transferred to the Subsidiary while any unrealized losses on securities so transferred will not be recognized at the time of transfer.
The financial statements have been consolidated and include accounts of the Fund and the Subsidiary. Accordingly, all inter-company transactions and balances have been eliminated. At December 31, 2013, the Fund owned 15,000 shares with a market value of $1,390,129.
Investment in Oppenheimer Institutional Money Market Fund. The Fund is permitted to invest daily available cash balances in an affiliated money market fund. The Fund may invest the available cash in Class E shares of Oppenheimer Institutional Money Market Fund (“IMMF”) to seek current income while preserving liquidity. IMMF is a registered open-end management investment company, regulated as a money market fund under the Investment Company Act of 1940, as amended. The Manager is the investment adviser of IMMF, and the Sub-Adviser provides investment and related advisory services to IMMF. When applicable, the Fund’s investment in IMMF is included in the Consolidated Statement of Investments. Shares of IMMF are valued at their net asset value per share. As a shareholder, the Fund is subject to its proportional share of IMMF’s Class E expenses, including its management fee. The Manager will waive fees and/or reimburse Fund expenses in an amount equal to the indirect management fees incurred through the Fund’s investment in IMMF.
Investment in Oppenheimer Master Funds. The Fund is permitted to invest in entities sponsored and/or advised by the Manager or an affiliate. Certain of these entities in which the Fund invests are mutual funds registered under the Investment Company Act of 1940 that expect to be treated as partnerships for tax purposes, specifically Oppenheimer Master Loan Fund, LLC and Oppenheimer Master Event-Linked Bond Fund, LLC (the “Master Funds”). Each Master Fund has its own investment risks, and those risks can affect the value of the Fund’s investments and therefore the value of the Fund’s shares. To the extent that the Fund invests more of its assets in one Master Fund than in another, the Fund will have greater exposure to the risks of that Master Fund.
The investment objective of Oppenheimer Master Loan Fund, LLC is to seek as high a level of current income and preservation of capital as is consistent with investing primarily in loans and other debt securities. The investment objective of Oppenheimer Master Event-Linked Bond Fund, LLC is to seek a high level of current income principally derived from interest on debt securities. The Fund’s investments in the Master Funds are included in the
42 OPPENHEIMER GLOBAL STRATEGIC INCOME FUND/VA
1. Significant Accounting Policies (Continued)
Consolidated Statement of Investments. The Fund recognizes income and gain/(loss) on its investments in each Master Fund according to its allocated pro-rata share, based on its relative proportion of total outstanding Master Fund shares held, of the total net income earned and the net gain/(loss) realized on investments sold by the Master Funds. As a shareholder, the Fund is subject to its proportional share of the Master Funds’ expenses, including their management fee. The Manager will waive fees and/or reimburse Fund expenses in an amount equal to the indirect management fees incurred through the Fund’s investment in the Master Funds.
Foreign Currency Translation. The Fund’s accounting records are maintained in U.S. dollars. The values of securities denominated in foreign currencies and amounts related to the purchase and sale of foreign securities and foreign investment income are translated into U.S. dollars as of the close of the New York Stock Exchange (the “Exchange”), normally 4:00 P.M. Eastern time, on each day the Exchange is open for trading. Foreign exchange rates may be valued primarily using a reliable bank, dealer or service authorized by the Board of Trustees.
Reported net realized gains and losses from foreign currency transactions arise from sales of portfolio securities, sales and maturities of short-term securities, sales of foreign currencies, exchange rate fluctuations between the trade and settlement dates on securities transactions, and the difference between the amounts of dividends, interest, and foreign withholding taxes recorded on the Fund’s books and the U.S. dollar equivalent of the amounts actually received or paid. Net unrealized appreciation and depreciation on the translation of assets and liabilities denominated in foreign currencies arise from changes in the values of assets and liabilities, including investments in securities at fiscal period end, resulting from changes in exchange rates.
The effect of changes in foreign currency exchange rates on investments is separately identified from the fluctuations arising from changes in market values of securities held and reported with all other foreign currency gains and losses in the Fund’s Consolidated Statement of Operations.
Allocation of Income, Expenses, Gains and Losses. Income, expenses (other than those attributable to a specific class), gains and losses are allocated on a daily basis to each class of shares based upon the relative proportion of net assets represented by such class. Operating expenses directly attributable to a specific class are charged against the operations of that class.
Federal Taxes. The Fund intends to comply with provisions of the Internal Revenue Code applicable to regulated investment companies and to distribute substantially all of its investment company taxable income, including any net realized gain on investments not offset by capital loss carryforwards, if any, to shareholders. Therefore, no federal income or excise tax provision is required. The Fund files income tax returns in U.S. federal and applicable state jurisdictions. The statute of limitations on the Fund’s tax return filings generally remain open for the three preceding fiscal reporting period ends.
The tax components of capital shown in the following table represent distribution requirements the Fund must satisfy under the income tax regulations, losses the Fund may be able to offset against income and gains realized in future years and unrealized appreciation or depreciation of securities and other investments for federal income tax purposes.
| | | | | | | | | | | | |
Undistributed Net Investment Income | | Undistributed
Long-Term
Gain | | | Accumulated
Loss
Carryforward1,2,3,4 | | | Net Unrealized
Depreciation
Based on cost of
Securities and
Other Investments
for Federal Income
Tax Purposes | |
| |
$107,064,959 | | | $— | | | | $74,011,395 | | | | $20,642,222 | |
1. As of December 31, 2013, the Fund had $73,775,870 of net capital loss carryforwards available to offset future realized capital gains, if any, and thereby reduce future taxable gain distributions. Details of the capital loss carryforwards are included in the table below. Capital loss carryovers with no expiration, if any, must be utilized prior to those with expiration dates.
| | | | |
| Expiring | | | |
| |
2015 | | $ | 5,751,368 | |
2016 | | | 3,339,490 | |
No expiration | | | 64,685,012 | |
| | | | |
Total | | $ | 73,775,870 | |
| | | | |
Of these losses, $10,018,470 are subject to Sec. 382 loss limitation rules resulting from merger activity. These limitations generally reduce the utilization of these losses to a maximum of $3,339,490 per year.
2. The Fund had $235,525 of straddle losses which were deferred.
3. During the fiscal year ended December 31, 2013, the Fund utilized $3,174,670 of capital loss carryforward to offset capital gains realized in that fiscal year.
4. During the fiscal year ended December 31, 2012, the Fund did not utilize any capital loss carryforward.
Net investment income (loss) and net realized gain (loss) may differ for financial statement and tax purposes. The character of dividends and distributions made during the fiscal year from net investment income or net realized gains may differ from their ultimate characterization for federal income tax purposes. Also, due to timing of dividends and distributions, the fiscal year in which amounts are distributed may differ from the fiscal year in which the income or net realized gain was recorded by the Fund.
Accordingly, the following amounts have been reclassified for December 31, 2013. Net assets of the Fund were unaffected by the reclassifications.
43 OPPENHEIMER GLOBAL STRATEGIC INCOME FUND/VA
NOTESTO CONSOLIDATED FINANCIAL STATEMENTS Continued
1. Significant Accounting Policies (Continued)
| | | | | | | | |
Increase to Paid-in Capital | | Reduction to
Accumulated
Net Investment
Income | | | Reduction to Accumulated Net
Realized Loss on Investments | |
| |
$157,579 | | | $17,299,267 | | | | $17,141,688 | |
The tax character of distributions paid during the years ended December 31, 2013 and December 31, 2012 was as follows:
| | | | | | | | |
| | | Year Ended | | | Year Ended | |
| | | December 31, 2013 | | | December 31, 2012 | |
| |
Distributions paid from: | | | | | | | | |
Ordinary income | | $ | 120,194,577 | | | $ | 148,472,568 | |
Long-term capital gain | | | — | | | | 14,255,675 | |
| | | | |
Total | | $ | 120,194,577 | | | $ | 162,728,243 | |
| | | | |
The aggregate cost of securities and other investments and the composition of unrealized appreciation and depreciation of securities and other investments for federal income tax purposes as of December 31, 2013 are noted in the following table. The primary difference between book and tax appreciation or depreciation of securities and other investments, if applicable, is attributable to the tax deferral of losses or tax realization of financial statement unrealized gain or loss.
| | | | |
Federal tax cost of securities | | $ | 2,504,305,329 | |
Federal tax cost of other investments | | | 116,289,387 | |
| | | | |
Total federal tax cost | | $ | 2,620,594,716 | |
| | | | |
Gross unrealized appreciation | | $ | 80,330,827 | |
Gross unrealized depreciation | | | (100,973,049) | |
| | | | |
Net unrealized appreciation | | $ | (20,642,222) | |
| | | | |
Trustees’ Compensation. The Board of Trustees has adopted a compensation deferral plan for independent trustees that enables trustees to elect to defer receipt of all or a portion of the annual compensation they are entitled to receive from the Fund. For purposes of determining the amount owed to the Trustee under the plan, deferred amounts are treated as though equal dollar amounts had been invested in shares of the Fund or in other Oppenheimer funds selected by the Trustee. The Fund purchases shares of the funds selected for deferral by the Trustee in amounts equal to his or her deemed investment, resulting in a Fund asset equal to the deferred compensation liability. Such assets are included as a component of “Other” within the asset section of the Consolidated Statement of Assets and Liabilities. Deferral of trustees’ fees under the plan will not affect the net assets of the Fund, and will not materially affect the Fund’s assets, liabilities or net investment income per share. Amounts will be deferred until distributed in accordance with the compensation deferral plan.
Dividends and Distributions to Shareholders. Dividends and distributions to shareholders, which are determined in accordance with income tax regulations and may differ from U.S. generally accepted accounting principles, are recorded on the ex-dividend date. Income and capital gain distributions, if any, are declared and paid annually or at other times as deemed necessary by the Manager.
Investment Income. Dividend income is recorded on the ex-dividend date or upon ex-dividend notification in the case of certain foreign dividends where the ex-dividend date may have passed. Non-cash dividends included in dividend income, if any, are recorded at the fair market value of the securities received. Interest income is recognized on an accrual basis. Discount and premium, which are included in interest income on the Consolidated Statement of Operations, are amortized or accreted daily.
Custodian Fees. “Custodian fees and expenses” in the Consolidated Statement of Operations may include interest expense incurred by the Fund on any cash overdrafts of its custodian account during the period. Such cash overdrafts may result from the effects of failed trades in portfolio securities and from cash outflows resulting from unanticipated shareholder redemption activity. The Fund pays interest to its custodian on such cash overdrafts, to the extent they are not offset by positive cash balances maintained by the Fund, at a rate equal to the Federal Funds Rate plus 0.50%. The “Reduction to custodian expenses” line item, if applicable, represents earnings on cash balances maintained by the Fund during the period. Such interest expense and other custodian fees may be paid with these earnings.
Security Transactions. Security transactions are recorded on the trade date. Realized gains and losses on securities sold are determined on the basis of identified cost.
Indemnifications. The Fund’s organizational documents provide current and former trustees and officers with a limited indemnification against liabilities arising in connection with the performance of their duties to the Fund. In the normal course of business, the Fund may also enter into contracts that provide general indemnifications. The Fund’s maximum exposure under these arrangements is unknown as this would be dependent on future claims that may be made against the Fund. The risk of material loss from such claims is considered remote.
44 OPPENHEIMER GLOBAL STRATEGIC INCOME FUND/VA
1. Significant Accounting Policies (Continued)
Other. The preparation of financial statements in conformity with accounting principles generally accepted in the United States of America requires management to make estimates and assumptions that affect the reported amounts of assets and liabilities and disclosure of contingent assets and liabilities at the date of the financial statements and the reported amounts of increases and decreases in net assets from operations during the reporting period. Actual results could differ from those estimates.
2. Securities Valuation
The Fund calculates the net asset value of its shares as of the close of the New York Stock Exchange (the “Exchange”), normally 4:00 P.M. Eastern time, on each day the Exchange is open for trading.
The Fund’s Board has adopted procedures for the valuation of the Fund’s securities and has delegated the day-to-day responsibility for valuation determinations under those procedures to the Manager. The Manager has established a Valuation Committee which is responsible for determining a “fair valuation” for any security for which market quotations are not “readily available.” The Valuation Committee’s fair valuation determinations are subject to review, approval and ratification by the Fund’s Board at its next regularly scheduled meeting covering the calendar quarter in which the fair valuation was determined.
Valuation Methods and Inputs
Securities are valued using unadjusted quoted market prices, when available, as supplied primarily by third party pricing services or dealers.
The following methodologies are used to determine the market value or the fair value of the types of securities described below:
Securities traded on a registered U.S. securities exchange (including exchange-traded derivatives other than futures and futures options) are valued based on the last sale price of the security reported on the principal exchange on which it is traded, prior to the time when the Fund’s assets are valued. In the absence of a sale, the security is valued at the last sale price on the prior trading day, if it is within the spread of the current day’s closing “bid” and “asked” prices, and if not, at the current day’s closing bid price. A security of a foreign issuer traded on a foreign exchange, but not listed on a registered U.S. securities exchange, is valued based on the last sale price on the principal exchange on which the security is traded, as identified by the third party pricing service used by the Manager, prior to the time when the Fund’s assets are valued. If the last sale price is unavailable, the security is valued at the most recent official closing price on the principal exchange on which it is traded. If the last sales price or official closing price for a foreign security is not available, the security is valued at the mean between the bid and asked price per the exchange or, if not available from the exchange, obtained from two dealers. If bid and asked prices are not available from either the exchange or two dealers, the security is valued by using one of the following methodologies (listed in order of priority); (1) using a bid from the exchange, (2) the mean between the bid and asked price as provided by a single dealer, or (3) a bid from a single dealer.
Shares of a registered investment company that are not traded on an exchange are valued at that investment company’s net asset value per share.
Corporate and government debt securities (of U.S. or foreign issuers) and municipal debt securities, event-linked bonds, loans, mortgage-backed securities, collateralized mortgage obligations, and asset-backed securities are valued at the mean between the “bid” and “asked” prices utilizing evaluated prices obtained from third party pricing services or broker-dealers who may use matrix pricing methods to determine the evaluated prices.
Short-term money market type debt securities with a remaining maturity of sixty days or less are valued at cost adjusted by the amortization of discount or premium to maturity (amortized cost), which approximates market value. Short-term debt securities with a remaining maturity in excess of sixty days are valued at the mean between the “bid” and “asked” prices utilizing evaluated prices obtained from third party pricing services or broker-dealers.
Structured securities, swaps, swaptions, and other over-the-counter derivatives are valued utilizing evaluated prices obtained from third party pricing services or broker-dealers.
Forward foreign currency exchange contracts are valued utilizing current and forward currency rates obtained from third party pricing services. When the settlement date of a contract is an interim date for which a quotation is not available, interpolated values are derived using the nearest dated forward currency rate.
Futures contracts and futures options traded on a commodities or futures exchange will be valued at the final settlement price or official closing price on the principal exchange as reported by such principal exchange at its trading session ending at, or most recently prior to, the time when the Fund’s assets are valued.
A description of the standard inputs that may generally be considered by the third party pricing vendors in determining their evaluated prices is provided below.
| | |
| Security Type | | Standard inputs generally considered by third-party pricing vendors |
| Corporate debt, government debt, municipal, mortgage-backed and asset-backed securities | | Reported trade data, broker-dealer price quotations, benchmark yields, issuer spreads on comparable securities, the credit quality, yield, maturity, and other appropriate factors. |
| Loans | | Information obtained from market participants regarding reported trade data and broker-dealer price quotations. |
| Event-linked bonds | | Information obtained from market participants regarding reported trade data and broker-dealer price quotations. |
| Structured securities | | Relevant market information such as the price of underlying financial instruments, stock market indices, foreign currencies, interest rate spreads, commodities, or the occurrence of other specific events. |
| Swaps | | Relevant market information, including underlying reference assets such as credit spreads, credit event probabilities, index values, individual security values, forward interest rates, variable interest rates, volatility measures, and forward currency rates. |
45 OPPENHEIMER GLOBAL STRATEGIC INCOME FUND/VA
NOTESTO CONSOLIDATED FINANCIAL STATEMENTS Continued
2. Securities Valuation (Continued)
If a market value or price cannot be determined for a security using the methodologies described above, or if, in the “good faith” opinion of the Manager, the market value or price obtained does not constitute a “readily available market quotation,” or a significant event has occurred that would materially affect the value of the security the security is fair valued either (i) by a standardized fair valuation methodology applicable to the security type or the significant event as previously approved by the Valuation Committee and the Fund’s Board or (ii) as determined in good faith by the Manager’s Valuation Committee. The Valuation Committee considers all relevant facts that are reasonably available, through either public information or information available to the Manager, when determining the fair value of a security. Fair value determinations by the Manager are subject to review, approval and ratification by the Fund’s Board at its next regularly scheduled meeting covering the calendar quarter in which the fair valuation was determined. Those fair valuation standardized methodologies include, but are not limited to, valuing securities at the last sale price or initially at cost and subsequently adjusting the value based on: changes in company specific fundamentals, changes in an appropriate securities index, or changes in the value of similar securities which may be further adjusted for any discounts related to security-specific resale restrictions. When possible, such methodologies use observable market inputs such as unadjusted quoted prices of similar securities, observable interest rates, currency rates and yield curves. The methodologies used for valuing securities are not necessarily an indication of the risks associated with investing in those securities nor can it be assured that the Fund can obtain the fair value assigned to a security if it were to sell the security.
To assess the continuing appropriateness of security valuations, the Manager, or its third party service provider who is subject to oversight by the Manager, regularly compares prior day prices, prices on comparable securities, and sale prices to the current day prices and challenges those prices exceeding certain tolerance levels with the third party pricing service or broker source. For those securities valued by fair valuations, whether through a standardized fair valuation methodology or a fair valuation determination, the Valuation Committee reviews and affirms the reasonableness of the valuations based on such methodologies and fair valuation determinations on a regular basis after considering all relevant information that is reasonably available.
Classifications
Each investment asset or liability of the Fund is assigned a level at measurement date based on the significance and source of the inputs to its valuation. Various data inputs are used in determining the value of each of the Fund’s investments as of the reporting period end. These data inputs are categorized in the following hierarchy under applicable financial accounting standards:
1) Level 1-unadjusted quoted prices in active markets for identical assets or liabilities (including securities actively traded on a securities exchange)
2) Level 2-inputs other than unadjusted quoted prices that are observable for the asset or liability (such as unadjusted quoted prices for similar assets and market corroborated inputs such as interest rates, prepayment speeds, credit risks, etc.)
3) Level 3-significant unobservable inputs (including the Manager’s own judgments about assumptions that market participants would use in pricing the asset or liability).
The inputs used for valuing securities are not necessarily an indication of the risks associated with investing in those securities.
The table below categorizes amounts that are included in the Fund’s Consolidated Statement of Assets and Liabilities as of December 31, 2013 based on valuation input level:
| | | | | | | | | | | | | | | | |
| | | | | | | | | Level 3— | | | | |
| | | Level 1— | | | Level 2— | | | Significant | | | | |
| | | Unadjusted | | | Other Significant | | | Unobservable | | | | |
| ` | | Quoted Prices | | | Observable Inputs | | | Inputs | | | Value | |
Assets Table | | | | | | | | | | | | | | | | |
Investments, at Value: | | | | | | | | | | | | | | | | |
Asset-Backed Securities | | $ | — | | | $ | 56,761,192 | | | $ | 16,206,250 | | | $ | 72,967,442 | |
Mortgage-Backed Obligations | | | — | | | | 481,396,692 | | | | 4,005 | | | | 481,400,697 | |
U.S. Government Obligations | | | — | | | | 179,687,811 | | | | — | | | | 179,687,811 | |
Foreign Government Obligations | | | — | | | | 585,663,511 | | | | — | | | | 585,663,511 | |
Corporate Loans | | | — | | | | 58,748,257 | | | | — | | | | 58,748,257 | |
Corporate Bonds and Notes | | | — | | | | 903,721,421 | | | | 5,631,399 | | | | 909,352,820 | |
Preferred Stocks | | | — | | | | 2,479,922 | | | | — | | | | 2,479,922 | |
Common Stocks | | | 1,797,487 | | | | 1,428,674 | | | | 15,296 | | | | 3,241,457 | |
Structured Securities | | | — | | | | 13,379,550 | | | | 10,216,769 | | | | 23,596,319 | |
Rights, Warrants and Certificates | | | — | | | | — | | | | — | | | | — | |
Investment Companies | | | 81,193,113 | | | | 81,164,360 | | | | — | | | | 162,357,473 | |
Over-the-Counter Credit Default Swaptions Purchased | | | — | | | | 8,816 | | | | — | | | | 8,816 | |
Over-the-Counter Interest Rate Swaptions Purchased | | | — | | | | 5,522,068 | | | | — | | | | 5,522,068 | |
Over-the-Counter Options Purchased | | | — | | | | 599,013 | | | | — | | | | 599,013 | |
| | | | |
Total Investments, at Value | | | 82,990,600 | | | | 2,370,561,287 | | | | 32,073,719 | | | | 2,485,625,606 | |
Other Financial Instruments: | | | | | | | | | | | | | | | | |
Swaps, at value | | | — | | | | 815,914 | | | | — | | | | 815,914 | |
Variation margin receivable | | | 9,655 | | | | 1,080,427 | | | | — | | | | 1,090,082 | |
Foreign currency exchange contracts | | | — | | | | 13,161,850 | | | | — | | | | 13,161,850 | |
| | | | |
Total Assets | | $ | 83,000,255 | | | $ | 2,385,619,478 | | | $ | 32,073,719 | | | $ | 2,500,693,453 | |
| | | | |
46 OPPENHEIMER GLOBAL STRATEGIC INCOME FUND/VA
2. Securities Valuation (Continued)
| | | | | | | | | | | | | | | | |
| | | | | | | | | Level 3— | | | | |
| | | Level 1— | | | Level 2— | | | Significant | | | | |
| | | Unadjusted | | | Other Significant | | | Unobservable | | | | |
| | | Quoted Prices | | | Observable Inputs | | | Inputs | | | Value | |
| |
Liabilities Table | | | | | | | | | | | | | | | | |
Other Financial Instruments: | | | | | | | | | | | | | | | | |
Swaps, at value | | $ | — | | | $ | (514,773) | | | $ | — | | | $ | (514,773) | |
Options written, at value | | | — | | | | (395,629) | | | | — | | | | (395,629) | |
Variation margin payable | | | (510,796) | | | | (1,318,096) | | | | — | | | | (1,828,892) | |
Foreign currency exchange contracts | | | — | | | | (16,369,483) | | | | — | | | | (16,369,483) | |
Swaptions written, at value | | | — | | | | (5,724,637) | | | | — | | | | (5,724,637) | |
| | | | |
Total Liabilities | | $ | (510,796) | | | $ | (24,322,618) | | | $ | — | | | $ | (24,833,414) | |
| | | | |
Currency contracts and forwards, if any, are reported at their unrealized appreciation/ depreciation at measurement date, which represents the change in the contract’s value from trade date. Futures, if any, are reported at their variation margin at measurement date, which represents the amount due to/from the Fund at that date. All additional assets and liabilities included in the above table are reported at their market value at measurement date.
The table below shows the transfers between Level 2 and Level 3. The Fund’s policy is to recognize transfers in and transfers out as of the beginning of the reporting period.
| | | | | | | | | | | | | | | | |
| | | Transfer into | | | Transfer out of | | | Transfers into | | | Transfers out of | |
| | | Level 2* | | | Level 2** | | | Level 3** | | | Level 3* | |
| |
Assets Table | | | | | | | | | | | | | | | | |
Investments, at Value: | | | | | | | | | | | | | | | | |
Mortgage-Backed Obligations | | $ | 501,705 | | | $ | — | | | $ | — | | | $ | (501,705) | |
Corporate Bonds and Notes | | | — | | | | (5,706,055) | | | | 5,706,055 | | | | — | |
Common Stocks | | | 2,527,654 | | | | — | | | | — | | | | (2,527,654) | |
Structured Securities | | | 11,214,572 | | | | (8,108,523) | | | | 8,108,523 | | | | (11,214,572) | |
| | | | |
Total Assets | | $ | 14,243,931 | | | $ | (13,814,578) | | | $ | 13,814,578 | | | $ | (14,243,931) | |
| | | | |
* Transferred from Level 3 to Level 2 due to the availability of market data for this security.
** Transferred from Level 2 to Level 3 because of the lack of observable market data due to a decrease in market activity for these securities.
The following is a reconciliation of assets in which significant unobservable inputs (level 3) were used in determining fair value:
| | | | | | | | | | | | | | | | | | | | |
| | | | | | | | | Change in | | | | | | | |
| | | Value as of | | | | | | unrealized | | | Accretion/ | | | | |
| | | December 31, | | | Realized Gain | | | appreciation/ | | | (amortization) of | | | | |
| | | 2012 | | | (Loss) | | | depreciation | | | premium/discounta | | | Purchase | |
| |
Assets Table | | | | | | | | | | | | | | | | | | | | |
Investments, at Value: | | | | | | | | | | | | | | | | | | | | |
Asset-Backed Securities | | $ | 13,833,500 | | | $ | — | | | $ | 2,290,146 | | | $ | 82,604 | | | $ | — | |
Mortgage-Backed Obligations | | | 4,785,844 | | | | 111,377 | | | | (208,925) | | | | 8,834 | | | | — | |
Corporate Loans | | | 4,212,575 | | | | 607,187 | | | | 37,738 | | | | — | | | | — | |
Corporate Bonds and Notes | | | 1,357,068 | | | | 71,658 | | | | (909,971) | | | | 248,927 | | | | — | |
Preferred Stocks | | | 2,778,825 | | | | (316,640) | | | | 926,275 | | | | — | | | | — | |
Common Stocks | | | 2,939,696 | | | | (3,172,089) | | | | 1,235,343 | | | | — | | | | 2,166,442 | |
Structured Securities | | | 19,537,403 | | | | (7,191,482) | | | | 7,076,576 | | | | 174,652 | | | | — | |
Rights, Warrants and Certificates | | | 816 | | | | — | | | | (816) | | | | — | | | | — | |
| | | | |
Total Assets | | $ | 49,445,727 | | | $ | (9,889,989) | | | $ | 10,446,366 | | | $ | 515,017 | | | $ | 2,166,442 | |
| | | | |
| | | | | | | | | | | | | | | | |
| | | | | | | | | | | | Value as of | |
| | | | | | Transfer into | | | Transfers out of | | | December 31, | |
| | | Sales | | | Level 3 | | | Level 3 | | | 2013 | |
| |
Assets Table | | | | | | | | | | | | | | | | |
Investments, at Value: | | | | | | | | | | | | | | | | |
Asset-Backed Securities | | $ | — | | | $ | — | | | $ | — | | | $ | 16,206,250 | |
Mortgage-Backed Obligations | | | (4,191,420) | | | | — | | | | (501,705) | | | | 4,005 | |
Corporate Loans | | | (4,857,500) | | | | — | | | | — | | | | — | |
Corporate Bonds and Notes | | | (842,338) | | | | 5,706,055 | | | | — | | | | 5,631,399 | |
Preferred Stocks | | | (3,388,460) | | | | — | | | | — | | | | — | |
Common Stocks | | | (626,442) | | | | — | | | | (2,527,654) | | | | 15,296 | |
Structured Securities | | | (6,274,331) | | | | 8,108,523 | | | | (11,214,572) | | | | 10,216,769 | |
Rights, Warrants and Certificates | | | — | | | | — | | | | — | | | | — | |
| | | | |
Total Assets | | $ | (20,180,491) | | | $ | 13,814,578 | | | $ | (14,243,931) | | | $ | 32,073,719 | |
| | | | |
a. Included in net investment income.
The total change in unrealized appreciation/depreciation included in the Consolidated Statement of Operations attributable to Level 3 investments still held at December 31, 2013:
47 OPPENHEIMER GLOBAL STRATEGIC INCOME FUND/VA
NOTESTO CONSOLIDATED FINANCIAL STATEMENTS Continued
2. Securities Valuation (Continued)
| | | | |
| | | Change in | |
| | | unrealized | |
| | | appreciation/ | |
| | | depreciation | |
| |
Assets Table | | | | |
Investments, at Value: | | | | |
Asset-Backed Securities | | $ | 2,290,146 | |
Mortgage-Backed Obligations | | | (1,335) | |
Corporate Bonds and Notes | | | (856,952) | |
Common Stocks | | | (1,810,858) | |
Structured Securities | | | (611,425) | |
Rights, Warrants and Certificates | | | (816) | |
| | | | |
Total Assets | | $ | (991,240) | |
| | | | |
The following table summarizes the valuation techniques and significant unobservable inputs used in determining fair value measurements for those investments classified as Level 3 as of December 31, 2013:
| | | | | | | | | | | | | | | | | | |
| | | Value as of December 31, 2013 | | | Valuation Technique | | | Unobservable input | | | Range of
Unobservable Inputs | | Unobservable
Input Used | | |
|
Assets Table | | | | | | | | | | | | | | | | | | |
Investments, at Value: | | | | | | | | | | | | | | | | | | |
Asset-Backed Securities | | $ | 16,206,250 | | | | Broker quotes | | | | N/A | | | N/A | | N/A | | (a) |
Mortgage-Backed Obligations | | | 4,005 | | | | Broker quotes | | | | N/A | | | N/A | | N/A | | (a) |
Corporate Bonds and Notes | | | 5,190,399 | | | | Broker quotes | | | | N/A | | | N/A | | N/A | | (a) |
Corporate Bonds and Notes | | | 441,000 | | | | Pricing service | | | | N/A | | | N/A | | N/A | | (a) |
Common Stock | | | 15,296 | | | | Discounted cash flow | | |
| Future distributions
Probability of payment |
| | $0-14.01/share
75%-100% | | $13.055/share
76.8% | | (b) |
Structured Securities | | | 2,998 | | |
| Estimated Recovery
proceeds |
| |
| Probability of receipt of
legal fees holdback |
| | N/A | | 50% | | (c) |
Structured Securities | | | 10,213,771 | | | | Broker quotes | | | | N/A | | | N/A | | N/A | | (a) |
| | | | | | | | | | | | | | | | | | |
Total | | $ | 32,073,719 | | | | | | | | | | | | | | | |
| | | | | | | | | | | | | | | | | | |
(a) Securities classified as Level 3 whose unadjusted values were provided by a pricing service or broker-dealer for which such inputs are unobservable. The Manager periodically reviews pricing vendor and broker methodologies and inputs to confirm they are determined using unobservable inputs and have been appropriately classified. Such securities’ fair valuations could change significantly based on changes in unobservable inputs used by the pricing service or broker.
(b) The Fund fair values certain cash distributions to be received as a result of a merger on common stock held using discounts to reflect the uncertainty of the future anticipated distributions. The Manager monitors such investments for additional market information or the occurrence of a significant event which would warrant a re-evaluation of the security’s fair valuation. A significant increase (decrease) in the future distribution amount, or a significant increase (decrease) to the probability of payment rate, will result in a significant increase (decrease) to the fair value of the investment.
(c) The Fund fair values certain structured securities using a discount to the legal fees that have been withheld for litigation. A significant increase (decrease) to the estimated probability of cash flows resulting from the litigation proceedings will result in a significant increase (decrease) to the value of the investment.
3. Shares of Beneficial Interest
The Fund has authorized an unlimited number of $0.001 par value shares of beneficial interest of each class. Transactions in shares of beneficial interest were as follows:
| | | | | | | | | | | | | | | | |
| | | Year Ended December 31, 2013 | | | Year Ended December 31, 2012 | |
| | | Shares | | | Amount | | | Shares | | | Amount | |
| |
Non-Service Shares | | | | | | | | | | | | | | | | |
Sold | | | 20,825,193 | | | $ | 114,175,644 | | | | 11,893,556 | | | $ | 65,980,860 | |
Dividends and/or distributions reinvested | | | 6,754,607 | | | | 36,272,242 | | | | 9,254,780 | | | | 48,680,145 | |
Acquisition—Note 8 | | | — | | | | — | | | | 9,127,251 | | | | 50,838,789 | |
Redeemed | | | (21,107,392) | | | | (116,547,644) | | | | (19,793,962) | | | | (109,300,842) | |
| | | | |
Net increase | | | 6,472,408 | | | $ | 33,900,242 | | | | 10,481,625 | | | $ | 56,198,952 | |
| | | | |
| | | | | | | | | | | | | | | | |
| |
Service Shares | | | | | | | | | | | | | | | | |
Sold | | | 32,262,956 | | | $ | 181,229,821 | | | | 29,727,051 | | | $ | 168,387,762 | |
Dividends and/or distributions reinvested | | | 15,286,400 | | | | 83,922,335 | | | | 21,198,531 | | | | 114,048,098 | |
Acquisition—Note 8 | | | — | | | | — | | | | 10,563,745 | | | | 60,107,709 | |
Redeemed | | | (53,354,375) | | | | (297,932,376) | | | | (35,968,087) | | | | (203,431,908) | |
| | | | |
Net increase (decrease) | | | (5,805,019) | | | $ | (32,780,220) | | | | 25,521,240 | | | $ | 139,111,661 | |
| | | | |
4. Purchases and Sales of Securities
The aggregate cost of purchases and proceeds from sales of securities, other than short-term obligations and investments in IMMF, for the year ended December 31, 2013 were as follows:
48 OPPENHEIMER GLOBAL STRATEGIC INCOME FUND/VA
4. Purchases and Sales of Securities (Continued)
| | | | | | | | |
| | | Purchases | | | Sales | |
| |
Investment securities | | $ | 2,030,154,806 | | | $ | 2,391,464,675 | |
U.S. government and government agency obligations | | | 374,881,299 | | | | 372,621,062 | |
To Be Announced (TBA) mortgage-related securities | | | 4,294,357,677 | | | | 4,679,296,373 | |
5. Fees and Other Transactions with Affiliates
Management Fees. Under the investment advisory agreement, the Fund pays the Manager a management fee based on the daily net assets of the Fund at an annual rate as shown in the following table:
| | | | | | | | |
| | | Fee Schedule Through October 31, 2013 | | | |
| | Up to $200 million | | | 0.75% | | | |
| | Next $200 million | | | 0.72 | | | |
| | Next $200 million | | | 0.69 | | | |
| | Next $200 million | | | 0.66 | | | |
| | Next $200 million | | | 0.60 | | | |
| | Over $1 billion | | | 0.50 | | | |
| | | | | | | | |
| | | | | | |
Fee Schedule Effective November 1, 2013 | | | |
Up to $200 million | | | 0.75% | | |
Next $200 million | | | 0.72 | | |
Next $200 million | | | 0.69 | | |
Next $200 million | | | 0.66 | | |
Next $200 million | | | 0.60 | | |
Next $4 billion | | | 0.50 | | |
Over $5 billion | | | 0.48 | | |
The Manager also provides investment management related services to the Subsidiary. The Subsidiary pays the Manager a monthly management fee at an annual rate according to the above schedule. The Subsidiary also pays certain other expenses including custody and directors’ fees.
Sub-Adviser Fees. The Manager has retained the Sub-Adviser to provide the day-to-day portfolio management of the Fund and the Subsidiary. Under the Sub-Advisory Agreements, the Manager pays the Sub-Adviser an annual fee in monthly installments, equal to a percentage of the investment management fee collected by the Manager from the Fund, which shall be calculated after any investment management fee waivers. The fees paid to the Sub-Adviser are paid by the Manager, not by the Fund.
Transfer Agent Fees. OFI Global (the “Transfer Agent”) serves as the transfer and shareholder servicing agent for the Fund. Fees incurred by the Fund with respect to these services are detailed in the Consolidated Statement of Operations.
Sub-Transfer Agent Fees. The Transfer Agent has retained Shareholder Services, Inc., a wholly-owned subsidiary of OFI (the “Sub-Transfer Agent”), to provide the day-to-day transfer agent and shareholder servicing of the Fund. Under the Sub-Transfer Agency Agreement, the Transfer Agent pays the Sub-Transfer Agent an annual fee in monthly installments, equal to a percentage of the transfer agent fee collected by the Transfer Agent from the Fund, which shall be calculated after any applicable fee waivers. The fee paid to the Sub-Transfer Agent is paid by the Transfer Agent, not by the Fund.
Distribution and Service Plan for Service Shares. The Fund has adopted a Distribution and Service Plan (the “Plan”) in accordance with Rule 12b-1 under the Investment Company Act of 1940 for Service shares to pay OppenheimerFunds Distributor, Inc. (the “Distributor”), for distribution related services, personal service and account maintenance for the Fund’s Service shares. Under the Plan, payments are made periodically at an annual rate of 0.25% of the daily net assets of Service shares of the Fund. The Distributor currently uses all of those fees to compensate sponsors of the insurance product that offers Fund shares, for providing personal service and maintenance of accounts of their variable contract owners that hold Service shares. These fees are paid out of the Fund’s assets on an on-going basis and increase operating expenses of the Service shares, which results in lower performance compared to the Fund’s shares that are not subject to a service fee. Fees incurred by the Fund under the Plan are detailed in the Consolidated Statement of Operations.
Waivers and Reimbursements of Expenses. The Manager has contractually agreed to limit the Fund’s expenses after payments, waivers and/or reimbursements and reduction to custodian expenses, excluding expenses incurred directly or indirectly by the Fund as a result of investments in other investment companies, wholly-owned subsidiaries and pooled investment vehicles; so that those expenses, as percentages of daily net assets, will not exceed the annual rate of 0.75% for Non-Service shares and 1.00% for Service shares.
The Manager has contractually agreed to waive the management fee it receives from the Fund in an amount equal to the management fee it receives from the Subsidiary. This undertaking will continue in effect for so long as the Fund invests in the Subsidiary and may not be terminated unless approved by the Fund’s Board of Trustees. During the year ended December 31, 2013, the Manager waived $10,567.
The Manager will waive fees and/or reimburse Fund expenses in an amount equal to the indirect management fees incurred through the Fund’s investment in IMMF, Oppenheimer Ultra-Short Duration Fund and the Master Funds. During the year ended December 31, 2013, the Manager waived fees and/or reimbursed the Fund $626,736 for IMMF management fees.
Some of these undertakings may be modified or terminated at any time; some may not be modified or terminated until after one year from the date of the current prospectus, as indicated therein.
6. Risk Exposures and the Use of Derivative Instruments
The Fund’s investment objectives not only permit the Fund to purchase investment securities, they also allow the Fund to enter into various types of derivatives contracts, including, but not limited to, futures contracts, forward currency exchange contracts, credit default swaps, interest rate swaps, total
49 OPPENHEIMER GLOBAL STRATEGIC INCOME FUND/VA
NOTESTO CONSOLIDATED FINANCIAL STATEMENTS Continued
6. Risk Exposures and the Use of Derivative Instruments (Continued)
return swaps, variance swaps and purchased and written options. In doing so, the Fund will employ strategies in differing combinations to permit it to increase, decrease, or change the level or types of exposure to market risk factors. These instruments may allow the Fund to pursue its objectives more quickly and efficiently than if it were to make direct purchases or sales of securities capable of effecting a similar response to market factors. Such contracts may be entered into through a bilateral over-the-counter (“OTC”) transaction, or through a securities or futures exchange and cleared through a clearinghouse.
Market Risk Factors. In accordance with its investment objectives, the Fund may use derivatives to increase or decrease its exposure to one or more of the following market risk factors:
Commodity Risk. Commodity risk relates to the change in value of commodities or commodity indexes as they relate to increases or decreases in the commodities market. Commodities are physical assets that have tangible properties. Examples of these types of assets are crude oil, heating oil, metals, livestock, and agricultural products.
Credit Risk. Credit risk relates to the ability of the issuer to meet interest and principal payments, or both, as they come due. In general, lower-grade, higher-yield bonds are subject to credit risk to a greater extent than lower-yield, higher-quality bonds.
Equity Risk. Equity risk relates to the change in value of equity securities as they relate to increases or decreases in the general market.
Foreign Exchange Rate Risk. Foreign exchange rate risk relates to the change in the U.S. dollar value of a security held that is denominated in a foreign currency. The U.S. dollar value of a foreign currency denominated security will decrease as the dollar appreciates against the currency, while the U.S. dollar value will increase as the dollar depreciates against the currency.
Interest Rate Risk. Interest rate risk refers to the fluctuations in value of fixed-income securities resulting from the inverse relationship between price and yield. For example, an increase in general interest rates will tend to reduce the market value of already issued fixed-income investments, and a decline in general interest rates will tend to increase their value. In addition, debt securities with longer maturities, which tend to have higher yields, are subject to potentially greater fluctuations in value from changes in interest rates than obligations with shorter maturities.
Volatility Risk. Volatility risk refers to the magnitude of the movement, but not the direction of the movement, in a financial instrument’s price over a defined time period. Large increases or decreases in a financial instrument’s price over a relative time period typically indicate greater volatility risk, while small increases or decreases in its price typically indicate lower volatility risk.
Derivatives may have little or no initial cash investment relative to their market value exposure and therefore can produce significant gains or losses in excess of their cost due to unanticipated changes in the market risk factors and the overall market. This use of embedded leverage allows the Fund to increase its market value exposure relative to its net assets and can substantially increase the volatility of the Fund’s performance. In instances where the Fund is using derivatives to decrease, or hedge, exposures to market risk factors for securities held by the Fund, there are also risks that those derivatives may not perform as expected resulting in losses for the combined or hedged positions. Some derivatives have the potential for unlimited loss, regardless of the size of the Fund’s initial investment.
Additional associated risks from investing in derivatives also exist and potentially could have significant effects on the valuation of the derivative and the Fund. Typically, the associated risks are not the risks that the Fund is attempting to increase or decrease exposure to, per its investment objectives, but are the additional risks from investing in derivatives. Examples of these associated risks are liquidity risk, which is the risk that the Fund will not be able to sell the derivative in the open market in a timely manner, and counterparty credit risk, which is the risk that the counterparty will not fulfill its obligation to the Fund.
The Fund’s actual exposures to these market risk factors and associated risks during the period are discussed in further detail, by derivative type, below.
Forward Currency Exchange Contracts
The Fund may enter into forward currency exchange contracts (“forward contracts”) for the purchase or sale of a foreign currency at a negotiated rate at a future date. Such contracts are traded in the OTC inter-bank currency dealer market.
Forward contracts are reported on a schedule following the Consolidated Statement of Investments. The unrealized appreciation (depreciation) is reported in the Consolidated Statement of Assets and Liabilities as a receivable (or payable) and in the Consolidated Statement of Operations within the change in unrealized appreciation (depreciation). At contract close, the difference between the original cost of the contract and the value at the close date is recorded as a realized gain (loss) in the Consolidated Statement of Operations.
The Fund has entered into forward contracts with the obligation to purchase specified foreign currencies in the future at a currently negotiated forward rate in order to take a positive investment perspective on the related currency. These forward contracts seek to increase exposure to foreign exchange rate risk.
The Fund has entered into forward contracts with the obligation to purchase specified foreign currencies in the future at a currently negotiated forward rate in order to decrease exposure to foreign exchange rate risk associated with foreign currency denominated securities held by the Fund.
The Fund has entered into forward contracts with the obligation to sell specified foreign currencies in the future at a currently negotiated forward rate in order to take a negative investment perspective on the related currency. These forward contracts seek to increase exposure to foreign exchange rate risk.
The Fund has entered into forward contracts with the obligation to sell specified foreign currencies in the future at a currently negotiated forward rate in order to decrease exposure to foreign exchange rate risk associated with foreign currency denominated securities held by the Fund.
During the year ended December 31, 2013, the Fund had daily average contract amounts on forward contracts to buy and sell of $386,123,324 and $719,427,740, respectively.
50 OPPENHEIMER GLOBAL STRATEGIC INCOME FUND/VA
6. Risk Exposures and the Use of Derivative Instruments (Continued)
Additional associated risk to the Fund includes counterparty credit risk. Counterparty credit risk arises from the possibility that the counterparty to a forward contract will default and fail to perform its obligations to the Fund.
Futures Contracts
A futures contract is a commitment to buy or sell a specific amount of a commodity, financial instrument or currency at a negotiated price on a stipulated future date. The Fund may buy and sell futures contracts and may also buy or write put or call options on these futures contracts. Futures contracts and options thereon are generally entered into on a regulated futures exchange and cleared through a clearinghouse associated with the exchange.
Upon entering into a futures contract, the Fund is required to deposit either cash or securities (initial margin) in an amount equal to a certain percentage of the contract value in an account registered in the futures commission merchant’s name. Subsequent payments (variation margin) are paid to or from the futures commission merchant each day equal to the daily changes in the contract value. Such payments are recorded as unrealized gains and losses. Should the Fund fail to make requested variation margin payments, the futures commission merchant can gain access to the initial margin to satisfy the Fund’s payment obligations.
Futures contracts are reported on a schedule following the Consolidated Statement of Investments. Securities held by a futures commission merchant to cover initial margin requirements on open futures contracts are noted in the Consolidated Statement of Investments. Cash held by a futures commission merchant to cover initial margin requirements on open futures contracts and the receivable and/or payable for the daily mark to market for the variation margin are noted in the Consolidated Statement of Assets and Liabilities. The net change in unrealized appreciation and depreciation is reported in the Consolidated Statement of Operations. Realized gains (losses) are reported in the Consolidated Statement of Operations at the closing or expiration of futures contracts.
The Fund has purchased futures contracts on various bonds and notes to increase exposure to interest rate risk.
The Fund has sold futures contracts on various bonds and notes to decrease exposure to interest rate risk.
The Fund has purchased futures contracts on various equity indexes to increase exposure to equity risk.
The Fund has sold futures contracts on various equity indexes to decrease exposure to equity risk.
The Fund has purchased futures contracts on various currencies to increase exposure to foreign exchange rate risk.
The Fund has sold futures contracts on various currencies to decrease exposure to foreign exchange rate risk.
The Fund has sold futures contracts, which have values that are linked to the price movement of the related volatility indexes, in order to decrease exposure to volatility risk.
During the year ended December 31, 2013, the Fund had an ending monthly average market value of $161,911,816 and $322,693,569 on futures contracts purchased and sold, respectively.
Additional associated risks of entering into futures contracts (and related options) include the possibility that there may be an illiquid market where the Fund is unable to liquidate the contract or enter into an offsetting position and, if used for hedging purposes, the risk that the price of the contract will correlate imperfectly with the prices of the Fund’s securities.
Option Activity
The Fund may buy and sell put and call options, or write put and call options. When an option is written, the Fund receives a premium and becomes obligated to sell or purchase the underlying security, currency or other underlying financial instrument at a fixed price, upon exercise of the option.
Options can be traded through an exchange or through a privately negotiated arrangement with a dealer in an OTC transaction. Options traded through an exchange are generally cleared through a clearinghouse (such as The Options Clearing Corporation). The difference between the premium received or paid, and market value of the option, is recorded as unrealized appreciation or depreciation. The net change in unrealized appreciation or depreciation is reported in the Consolidated Statement of Operations. When an option is exercised, the cost of the security purchased or the proceeds of the security sale are adjusted by the amount of premium received or paid. Upon the expiration or closing of the option transaction, a gain or loss is reported in the Consolidated Statement of Operations.
The Fund has purchased call options on currencies to increase exposure to foreign exchange rate risk. A purchased call option becomes more valuable as the price of the underlying financial instrument appreciates relative to the strike price.
The Fund has purchased put options on currencies to decrease exposure to foreign exchange rate risk. A purchased put option becomes more valuable as the price of the underlying financial instrument depreciates relative to the strike price.
The Fund has purchased call options on treasury and/or euro futures to increase exposure to interest rate risk. A purchased call option becomes more valuable as the price of the underlying financial instrument appreciates relative to the strike price.
The Fund has purchased put options on treasury and/or euro futures to decrease exposure to interest rate risk. A purchased put option becomes more valuable as the price of the underlying financial instrument depreciates relative to the strike price.
During the year ended December 31, 2013, the Fund had an ending monthly average market value of $1,412,133 and $335,772 on purchased call options and purchased put options, respectively.
Options written, if any, are reported in a schedule following the Consolidated Statement of Investments and as a liability in the Consolidated Statement of Assets and Liabilities. Securities held in collateral accounts to cover potential obligations with respect to outstanding written options are noted in the Consolidated Statement of Investments.
The risk in writing a call option is that the market price of the security increases and if the option is exercised, the Fund must either purchase the security at a higher price for delivery or, if the Fund owns the underlying security, give up the opportunity for profit. The risk in writing a put option is that the Fund may incur a loss if the market price of the security decreases and the option is exercised. The risk in buying an option is that the Fund pays a
51 OPPENHEIMER GLOBAL STRATEGIC INCOME FUND/VA
NOTESTO CONSOLIDATED FINANCIAL STATEMENTS Continued
6. Risk Exposures and the Use of Derivative Instruments (Continued)
premium whether or not the option is exercised. The Fund also has the additional risk that there may be an illiquid market where the Fund is unable to close the contract.
The Fund has written put options on currencies to increase exposure to foreign exchange rate risk. A written put option becomes more valuable as the price of the underlying financial instrument appreciates relative to the strike price.
The Fund has written call options on currencies to decrease exposure to foreign exchange rate risk. A written call option becomes more valuable as the price of the underlying financial instrument depreciates relative to the strike price.
The Fund has written call options on treasury and/or euro futures to decrease exposure to interest rate risk. A written call option becomes more valuable as the price of the underlying financial instrument depreciates relative to the strike price.
The Fund has written put options on treasury and/or euro futures to increase exposure to interest rate risk. A written put option becomes more valuable as the price of the underlying financial instrument appreciates relative to the strike price.
During the year ended December 31, 2013, the Fund had an ending monthly average market value of $355,823 and $848,248 on written call options and written put options, respectively.
Additional associated risks to the Fund include counterparty credit risk and liquidity risk.
Written option activity for the year ended December 31, 2013 was as follows:
| | | | | | | | | | | | | | | | |
| | | Call Options | | | Put Options | |
| | | Number of Contracts | | | Amount of
Premiums | | | Number of Contracts | | | Amount of
Premiums | |
| |
Options outstanding as of December 31, 2012 | | | 1,635,535,942 | | | $ | 745,170 | | | | 2,145,319,399 | | | $ | 979,485 | |
Options written | | | 81,589,860,439 | | | | 8,258,624 | | | | 98,258,557,737 | | | | 11,050,089 | |
Options closed or expired | | | (62,554,926,381) | | | | (6,562,231) | | | | (57,555,742,136) | | | | (7,072,790) | |
Options exercised | | | (19,849,030,000) | | | | (2,088,103) | | | | (41,381,840,000) | | | | (4,406,397) | |
| | | | |
Options outstanding as of December 31, 2013 | | | 821,440,000 | | | $ | 353,460 | | | | 1,466,295,000 | | | $ | 550,387 | |
| | | | |
Swap Contracts
The Fund may enter into swap contract agreements with a counterparty to exchange a series of cash flows based on either specified reference rates, the price or volatility of asset or non-asset references, or the occurrence of a credit event, over a specified period. Swaps can be executed in a bi-lateral privately negotiated arrangement with a dealer in an OTC transaction (“OTC swaps”) or executed on a regulated market. Certain swaps, regardless of the venue of their execution, are required to be cleared through a clearinghouse (“cleared swaps”). Swap contracts may include interest rate, equity, debt, index, total return, credit default, currency, and volatility swaps.
Swap contracts are reported on a schedule following the Consolidated Statement of Investments. Daily changes in the value of cleared swaps are reported as variation margin receivable or payable on the Consolidated Statement of Assets and Liabilities. The values of OTC swap contracts are aggregated by positive and negative values and disclosed separately on the Consolidated Statement of Assets and Liabilities. The unrealized appreciation (depreciation) related to the change in the valuation of the notional amount of the swap is combined with the accrued interest due to (owed by) the Fund, if any, at termination or settlement. The net change in this amount during the period is included on the Consolidated Statement of Operations. The Fund also records any periodic payments received from (paid to) the counterparty, including at termination, under such contracts as realized gain (loss) on the Consolidated Statement of Operations.
Swap contract agreements are exposed to the market risk factor of the specific underlying reference rate or asset. Swap contracts are typically more attractively priced compared to similar investments in related cash securities because they isolate the risk to one market risk factor and eliminate the other market risk factors. Investments in cash securities (for instance bonds) have exposure to multiple risk factors (credit and interest rate risk). Because swaps have embedded leverage, they can expose the Fund to substantial risk in the isolated market risk factor.
Credit Default Swap Contracts. A credit default swap is a contract that enables an investor to buy or sell protection against a defined-issuer credit event, such as the issuer’s failure to make timely payments of interest or principal on a debt security, bankruptcy or restructuring. The Fund may enter into credit default swaps either by buying or selling protection on a corporate issuer, sovereign issuer, or a basket or index of issuers (the “reference asset”).
The buyer of protection pays a periodic fee to the seller of protection based on the notional amount of the swap contract. The seller of protection agrees to compensate the buyer of protection for future potential losses as a result of a credit event on the reference asset. The contract effectively transfers the credit event risk of the reference asset from the buyer of protection to the seller of protection.
The ongoing value of the contract will fluctuate throughout the term of the contract based primarily on the credit risk of the reference asset. If the credit quality of the reference asset improves relative to the credit quality at contract initiation, the buyer of protection may have an unrealized loss greater than the anticipated periodic fee owed. This unrealized loss would be the result of current credit protection being cheaper than the cost of credit protection at contract initiation. If the buyer elects to terminate the contract prior to its maturity, and there has been no credit event, this unrealized loss will become realized. If the contract is held to maturity, and there has been no credit event, the realized loss will be equal to the periodic fee paid over the life of the contract.
If there is a credit event, the buyer of protection can exercise its rights under the contract and receive a payment from the seller of protection equal to the notional amount of the swap less the market value of specified debt securities issued by the reference asset. Upon exercise of the contract the
52 OPPENHEIMER GLOBAL STRATEGIC INCOME FUND/VA
6. Risk Exposures and the Use of Derivative Instruments (Continued)
difference between such value and the notional amount is recorded as realized gain (loss) and is included on the Consolidated Statement of Operations.
The Fund has sold credit protection through credit default swaps to increase exposure to the credit risk of individual issuers and/or indexes of issuers that are either unavailable or considered to be less attractive in the bond market.
The Fund has purchased credit protection through credit default swaps to decrease exposure to the credit risk of individual issuers and/or indexes of issuers.
The Fund has engaged in spread curve trades by simultaneously purchasing and selling protection through credit default swaps referenced to the same reference asset but with different maturities. Spread curve trades attempt to gain exposure to credit risk on a forward basis by realizing gains on the expected differences in spreads.
For the year ended December 31, 2013, the Fund had ending monthly average notional amounts of $19,982,295 and $12,165,396 on credit default swaps to buy protection and credit default swaps to sell protection, respectively.
Additional associated risks to the Fund include counterparty credit risk and liquidity risk.
Interest Rate Swap Contracts. An interest rate swap is an agreement between counterparties to exchange periodic payments based on interest rates. One cash flow stream will typically be a floating rate payment based upon a specified floating interest rate while the other is typically a fixed interest rate.
The Fund has entered into interest rate swaps in which it pays a floating interest rate and receives a fixed interest rate in order to increase exposure to interest rate risk. Typically, if relative interest rates rise, payments made by the Fund under a swap agreement will be greater than the payments received by the Fund.
The Fund has entered into interest rate swaps in which it pays a fixed interest rate and receives a floating interest rate in order to decrease exposure to interest rate risk. Typically, if relative interest rates rise, payments received by the Fund under the swap agreement will be greater than the payments made by the Fund.
For the year ended December 31, 2013, the Fund had ending monthly average notional amounts of $50,292,598 and $114,889,632 on interest rate swaps which pay a fixed rate and interest rate swaps which receive a fixed rate, respectively.
Additional associated risks to the Fund include counterparty credit risk and liquidity risk.
Total Return Swap Contracts. A total return swap is an agreement between counterparties to exchange periodic payments based on the value of asset or non-asset references. One cash flow is typically based on a non-asset reference (such as an interest rate) and the other on the total return of a reference asset (such as a security or a basket of securities or securities index). The total return of the reference asset typically includes appreciation or depreciation on the reference asset, plus any interest or dividend payments.
Total return swap contracts are exposed to the market risk factor of the specific underlying financial instrument or index. Total return swaps are less standard in structure than other types of swaps and can isolate and/or include multiple types of market risk factors including equity risk, credit risk, and interest rate risk.
The Fund has entered into total return swaps on various equity securities or indexes to increase exposure to equity risk. These equity risk related total return swaps require the Fund to pay a floating reference interest rate, and an amount equal to the negative price movement of securities or an index (expressed as a percentage) multiplied by the notional amount of the contract. The Fund will receive payments equal to the positive price movement of the same securities or index (expressed as a percentage) multiplied by the notional amount of the contract and, in some cases, dividends paid on the securities.
The Fund has entered into total return swaps on various equity securities or indexes to decrease exposure to equity risk. These equity risk related total return swaps require the Fund to pay an amount equal to the positive price movement of securities or an index (expressed as a percentage) multiplied by the notional amount of the contract and, in some cases, dividends paid on the securities. The Fund will receive payments of a floating reference interest rate and an amount equal to the negative price movement of the same securities or index (expressed as a percentage) multiplied by the notional amount of the contract.
For the year ended December 31, 2013, the Fund had ending monthly average notional amounts of $20,287,797 and $13,379,714 on total return swaps which are long the reference asset and total return swaps which are short the reference asset, respectively.
Additional associated risks to the Fund include counterparty credit risk and liquidity risk.
As of December 31, 2013, the Fund had no such total return swap agreements outstanding.
Volatility Swap Contracts. A volatility swap is an agreement between counterparties to exchange periodic payments based on the measured volatility of a reference security, index, currency or other reference investment over a specified time frame. One cash flow is typically based on the realized volatility of the reference investment as measured by changes in its price or level over the specified time period while the other cash flow is based on a specified rate representing expected volatility for the reference investment at the time the swap is executed, or the measured volatility of a different reference investment over the specified time period. The appreciation or depreciation on a volatility swap will typically depend on the magnitude of the reference investment’s volatility, or size of the movements in its price, over the specified time period, rather than general directional increases or decreases in its price.
Volatility swaps are less standard in structure than other types of swaps and provide pure, or isolated, exposure to volatility risk of the specific underlying reference investment. Volatility swaps are typically used to speculate on future volatility levels, to trade the spread between realized and expected volatility, or to decrease the volatility exposure of investments held by the Fund.
Variance swaps are a type of volatility swap where counterparties agree to exchange periodic payments based on the measured variance (or the volatility squared) of a reference security, index, or other reference investment over a specified time period. At payment date, a net cash flow will be
53 OPPENHEIMER GLOBAL STRATEGIC INCOME FUND/VA
| | |
NOTES TO CONSOLIDATED FINANCIAL STATEMENTS Continued |
6. Risk Exposures and the Use of Derivative Instruments (Continued)
exchanged based on the difference between the realized variance of the reference investment over the specified time period and the specified rate representing expected variance for the reference investment at the time the swap is executed multiplied by the notional amount of the contract.
The Fund has entered into volatility swaps to increase exposure to the volatility risk of various reference investments. These types of volatility swaps require the Fund to pay the measured volatility and receive a fixed rate payment. If the measured volatility of the related reference investment increases over the period, the swaps will depreciate in value. Conversely, if the measured volatility of the related reference investment decreases over the period, the swaps will appreciate in value.
The Fund has entered into volatility swaps to decrease exposure to the volatility risk of various reference investments. These types of volatility swaps require the Fund to pay a fixed rate payment and receive the measured volatility. If the measured volatility of the related reference investment increases over the period, the swaps will appreciate in value. Conversely, if the measured volatility of the related reference investment decreases over the period, the swaps will depreciate in value.
For the year ended December 31, 2013, the Fund had ending monthly average notional amounts of $166,220 and $177,344 on volatility swaps which pay measured volatility/variance and volatility swaps which receive measured volatility/variance, respectively.
Additional associated risks to the Fund include counterparty credit risk and liquidity risk.
As of December 31, 2013, the Fund had no such volatility swap agreements outstanding.
Swaption Transactions
The Fund may enter into a swaption contract which grants the purchaser the right, but not the obligation, to enter into a swap transaction at preset terms detailed in the underlying agreement within a specified period of time. The purchaser pays a premium to the swaption writer who bears the risk of unfavorable changes in the preset terms on the underlying swap.
Purchased swaptions are reported as a component of investments in the Consolidated Statement of Investments and the Consolidated Statement of Assets and Liabilities. Written swaptions are reported on a schedule following the Consolidated Statement of Investments and their value is reported as a separate asset or liability line item in the Consolidated Statement of Assets and Liabilities. The net change in unrealized appreciation or depreciation on written swaptions is separately reported in the Consolidated Statement of Operations. When a swaption is exercised, the cost of the swap is adjusted by the amount of premium paid or received. Upon the expiration or closing of an unexercised swaption contract, a gain or loss is reported in the Consolidated Statement of Operations for the amount of the premium paid or received.
The Fund generally will incur a greater risk when it writes a swaption than when it purchases a swaption. When the Fund writes a swaption it will become obligated, upon exercise of the swaption, according to the terms of the underlying agreement. Swaption contracts written by the Fund do not give rise to counterparty credit risk prior to exercise as they obligate the Fund, not its counterparty, to perform. When the Fund purchases a swaption it only risks losing the amount of the premium it paid if the swaption expires unexercised. However, when the Fund exercises a purchased swaption there is a risk that the counterparty will fail to perform or otherwise default on its obligations under the swaption contract.
The Fund purchased swaptions which gives it the option to enter into an interest rate swap in which it pays a floating interest rate and receives a fixed interest rate in order to increase exposure to interest rate risk. A purchased swaption of this type becomes more valuable as the reference interest rate decreases relative to the preset interest rate.
The Fund has purchased swaptions which gives it the option to enter into an interest rate swap in which it pays a fixed interest rate and receives a floating interest rate in order to decrease exposure to interest rate risk. A purchased swaption of this type becomes more valuable as the reference interest rate increases relative to the preset interest rate.
The Fund has purchased swaptions which gives it the option to sell credit protection through credit default swaps in order to increase exposure to the credit risk of individual issuers and/ or indexes of issuers. A purchased swaption of this type becomes more valuable as the likelihood of a credit event on the reference asset decreases.
The Fund has purchased swaptions which gives it the option to buy credit protection through credit default swaps in order to decrease exposure to the credit risk of individual issuers and/or indexes of issuers. A purchased swaption of this type becomes more valuable as the likelihood of a credit event on the reference asset increases.
The Fund has written swaptions which gives it the obligation, if exercised by the purchaser, to enter into an interest rate swap in which it pays a floating interest rate and receives a fixed interest rate in order to increase exposure to interest rate risk. A written swaption of this type becomes more valuable as the reference interest rate decreases relative to the preset interest rate.
The Fund has written swaptions which gives it the obligation, if exercised by the purchaser, to enter into an interest rate swap in which it pays a fixed interest rate and receives a floating interest rate in order to decrease exposure to interest rate risk. A written swaption of this type becomes more valuable as the reference interest rate increases relative to the preset interest rate.
The Fund has written swaptions which give it the obligation, if exercised by the purchaser, to sell credit protection through credit default swaps in order to increase exposure to the credit risk of individual issuers and/or indexes of issuers. A written swaption of this type becomes more valuable as the likelihood of a credit event on the reference asset decreases.
The Fund has written swaptions which give it the obligation, if exercised by the purchaser, to buy credit protection through credit default swaps in order to decrease exposure to the credit risk of individual issuers and/or, indexes of issuers. A written swaption of this type becomes more valuable as the likelihood of a credit event on the reference asset increases.
During the year ended December 31, 2013, the Fund had an ending monthly average market value of $5,208,861 and $6,332,060 on purchased and written swaptions, respectively.
Written swaption activity for the year ended December 31, 2013 was as follows:
54 OPPENHEIMER GLOBAL STRATEGIC INCOME FUND/VA
6. Risk Exposures and the Use of Derivative Instruments (Continued)
| | | | | | | | | | |
| | | Call Swaptions | | | |
| | | Notional Amount | | | Amount of
Premiums | | | |
|
Swaptions outstanding as of December 31, 2012 | | | 253,267,387 | | | $ | 5,033,479 | | | |
Swaptions written | | | 3,356,075,000 | | | | 22,545,183 | | | |
Swaptions closed or expired | | | (2,975,137,387) | | | | (22,114,856) | | | |
Swaptions exercised | | | (161,660,000) | | | | (1,388,325) | | | |
| | | |
Swaptions outstanding as of December 31, 2013 | | | 472,545,000 | | | $ | 4,075,481 | | | |
| | | |
Counterparty Credit Risk. Derivative positions are subject to the risk that the counterparty will not fulfill its obligation to the Fund. The Fund intends to enter into derivative transactions with counterparties that the Manager believes to be creditworthy at the time of the transaction.
The Fund’s risk of loss from counterparty credit risk on OTC derivatives is generally limited to the aggregate unrealized gain netted against any collateral held by the Fund. For OTC options purchased, the Fund bears the risk of loss of the amount of the premiums paid plus the positive change in market values net of any collateral held by the Fund should the counterparty fail to perform under the contracts. Options written by the Fund do not typically give rise to counterparty credit risk, as options written generally obligate the Fund and not the counterparty to perform.
To reduce counterparty risk with respect to OTC transactions, the Fund has entered into master netting arrangements, established within the Fund’s International Swap and Derivatives Association, Inc. (“ISDA”) master agreements, which allow the Fund to make (or to have an entitlement to receive) a single net payment in the event of default (close-out netting) for outstanding payables and receivables with respect to certain OTC positions in swaps, options, swaptions, and forward currency exchange contracts for each individual counterparty. In addition, the Fund may require that certain counterparties post cash and/or securities in collateral accounts to cover their net payment obligations for those derivative contracts subject to ISDA master agreements. If the counterparty fails to perform under these contracts and agreements, the cash and/or securities will be made available to the Fund.
As of December 31, 2013, the Fund has required certain counterparties to post collateral of $12,147,197.
ISDA master agreements include credit related contingent features which allow counterparties to OTC derivatives to terminate derivative contracts prior to maturity in the event that, for example, the Fund’s net assets decline by a stated percentage or the Fund fails to meet the terms of its ISDA master agreements, which would cause the Fund to accelerate payment of any net liability owed to the counterparty.
For financial reporting purposes, the Fund does not offset derivative assets and derivative liabilities that are subject to netting arrangements in the Consolidated Statement of Assets and Liabilities. Bankruptcy or insolvency laws of a particular jurisdiction may impose restrictions on or prohibitions against the right of offset in bankruptcy, insolvency or other events.
The Fund’s risk of loss from counterparty credit risk on exchange-traded derivatives cleared through a clearinghouse and for cleared swaps is generally considered lower than as compared to OTC derivatives. However, counterparty credit risk exists with respect to initial and variation margin deposited/paid by the Fund that is held in futures commission merchant, broker and/or clearinghouse accounts for such exchange-traded derivatives and for cleared swaps.
With respect to cleared swaps, such transactions will be submitted for clearing, and if cleared, will be held in accounts at futures commission merchants or brokers that are members of clearinghouses. While brokers, futures commission merchants and clearinghouses are required to segregate customer margin from their own assets, in the event that a broker, futures commission merchant or clearinghouse becomes insolvent or goes into bankruptcy and at that time there is a shortfall in the aggregate amount of margin held by the broker, futures commission merchant or clearinghouse for all its customers, U.S. bankruptcy laws will typically allocate that shortfall on a pro-rata basis across all the broker’s, futures commission merchant’s or clearinghouse’s customers, potentially resulting in losses to the Fund.
There is the risk that a broker, futures commission merchant or clearinghouse will decline to clear a transaction on the Fund’s behalf, and the Fund may be required to pay a termination fee to the executing broker with whom the Fund initially enters into the transaction. Clearinghouses may also be permitted to terminate cleared swaps at any time. The Fund is also subject to the risk that the broker or futures commission merchant will improperly use the Fund’s assets deposited/paid as initial or variation margin to satisfy payment obligations of another customer. In the event of a default by another customer of the broker or futures commission merchant, the Fund might not receive its variation margin payments from the clearinghouse, due to the manner in which variation margin payments are aggregated for all customers of the broker/futures commission merchant.
Collateral and margin requirements differ by type of derivative. Margin requirements are established by the broker, futures commission merchant or clearinghouse for exchange-traded and cleared derivatives, including cleared swaps. Brokers, futures commission merchants and clearinghouses can ask for margin in excess of the regulatory minimum, or increase the margin amount, in certain circumstances.
Collateral terms are contract specific for OTC derivatives. For derivatives traded under an ISDA master agreement, the collateral requirements are typically calculated by netting the mark to market amount for each transaction under such agreement and comparing that amount to the value of any collateral currently pledged by the Fund or the counterparty.
For financial reporting purposes, cash collateral that has been pledged to cover obligations of the Fund, if any, is reported separately on the Consolidated Statement of Assets and Liabilities as cash pledged as collateral. Non-cash collateral pledged by the Fund, if any, is noted in the Consolidated Statement of Investments. Generally, the amount of collateral due from or to a party must exceed a minimum transfer amount threshold (e.g. $250,000) before a transfer has to be made. To the extent amounts due to the Fund from its counterparties are not fully collateralized, contractually or otherwise, the Fund bears the risk of loss from counterparty nonperformance.
55 OPPENHEIMER GLOBAL STRATEGIC INCOME FUND/VA
NOTESTOCONSOLIDATED FINANCIAL STATEMENTS Continued
6. Risk Exposures and the Use of Derivative Instruments (Continued)
The following table presents by counterparty the Fund’s OTC derivative assets net of the related collateral posted for the benefit of the Fund at December 31, 2013.
| | | | | | | | | | | | | | | | | | | | |
| | | | | | Gross Amounts Not Offset in the Consolidated Statement of Assets & Liabilities | | | | |
| Counterparty | | Gross Amount of Assets
in the Consolidated
Statement of Assets &
Liabilities* | | | Financial Instruments
Available for Offset | | | Financial Instruments
Collateral Received** | | | Cash Collateral Received** | | | Net Amount | |
| |
Bank of America NA | | $ | 5,980,152 | | | | $ (5,912,652) | | | | $ — | | | | $ — | | | | $ 67,500 | |
Barclays Bank plc | | | 1,694,594 | | | | (1,694,594) | | | | — | | | | — | | | | — | |
BNP Paribas | | | 782,538 | | | | (461,942) | | | | (320,596) | | | | — | | | | — | |
Citibank NA | | | 1,633,126 | | | | (1,633,126) | | | | — | | | | — | | | | — | |
Credit Suisse International | | | 592,301 | | | | (16,976) | | | | (452,040) | | | | — | | | | 123,285 | |
Deutsche Bank Securities, Inc. | | | 260,517 | | | | (260,517) | | | | — | | | | — | | | | — | |
Goldman Sachs Bank USA | | | 1,936,905 | | | | (1,439,000) | | | | (304,525) | | | | — | | | | 193,380 | |
Goldman Sachs Group, Inc. (The) | | | 1,442,214 | | | | (933,023) | | | | (509,191) | | | | — | | | | — | |
HSBC Bank USA NA | | | 450,200 | | | | (292,197) | | | | — | | | | — | | | | 158,003 | |
JPMorgan Chase Bank NA | | | 3,397,141 | | | | (3,397,141) | | | | — | | | | — | | | | — | |
Morgan Stanley Capital Services, Inc. | | | 704,131 | | | | (543,751) | | | | (160,380) | | | | — | | | | — | |
RBS Greenwich Capital | | | 516,277 | | | | (336,403) | | | | — | | | | — | | | | 179,874 | |
UBS AG | | | 717,565 | | | | (279,384) | | | | (429,024) | | | | — | | | | 9,157 | |
| | | | |
| | $ | 20,107,661 | | | | $ (17,200,706) | | | | $ (2,175,756) | | | | $ — | | | | $ 731,199 | |
| | | | |
*OTC derivatives are reported gross on the Consolidated Statement of Assets and Liabilities. Exchange traded options and margin related to cleared swaps and futures are excluded from these reported amounts.
**Reported collateral posted for the benefit of the Fund within this table is limited to the net outstanding amount due from an individual counterparty. The collateral posted for the benefit of the Fund may exceed these amounts.
The following table presents by counterparty the Fund’s OTC derivative liabilities net of the related collateral pledged by the Fund at December 31, 2013.
| | | | | | | | | | | | | | | | | | | | |
| | | | | | Gross Amounts Not Offset in the Consolidated Statement of Assets & Liabilities | | | | |
| Counterparty | | Gross Amount of
Liabilities in the
Consolidated Statement
of Assets & Liabilities* | | | Financial Instruments
Available for Offset | | | Financial Instruments
Collateral Pledged** | | | Cash Collateral Pledged** | | | Net Amount | |
| |
Bank of America NA | | | $ (5,912,652) | | | | $ 5,912,652 | | | | $ — | | | | $ — | | | | $ — | |
Barclays Bank plc | | | (3,336,041) | | | | 1,694,594 | | | | 1,169,421 | | | | — | | | | (472,026) | |
BNP Paribas | | | (461,942) | | | | 461,942 | | | | — | | | | — | | | | — | |
Citibank NA | | | (4,792,638) | | | | 1,633,126 | | | | 1,326,938 | | | | — | | | | (1,832,574) | |
Credit Suisse International | | | (16,976) | | | | 16,976 | | | | — | | | | — | | | | — | |
Deutsche Bank Securities, Inc. | | | (959,709) | | | | 260,517 | | | | 699,192 | | | | — | | | | — | |
Goldman Sachs Bank USA | | | (1,439,000) | | | | 1,439,000 | | | | — | | | | — | | | | — | |
Goldman Sachs Group, Inc. (The) | | | (933,023) | | | | 933,023 | | | | — | | | | — | | | | — | |
HSBC Bank USA NA | | | (292,197) | | | | 292,197 | | | | — | | | | — | | | | — | |
JPMorgan Chase Bank NA | | | (3,700,806) | | | | 3,397,141 | | | | — | | | | — | | | | (303,665) | |
Morgan Stanley Capital Services, Inc. | | | (543,751) | | | | 543,751 | | | | — | | | | — | | | | — | |
RBS Greenwich Capital | | | (336,403) | | | | 336,403 | | | | — | | | | — | | | | — | |
UBS AG | | | (279,384) | | | | 279,384 | | | | — | | | | — | | | | — | |
| | | | |
| | | $ (23,004,522 | ) | | | $ 17,200,706 | | | | $ 3,195,551 | | | | $ — | | | | $ (2,608,265) | |
| | | | |
*OTC derivatives are reported gross on the Consolidated Statement of Assets and Liabilities. Exchange traded options and margin related to cleared swaps and futures are excluded from these reported amounts.
**Reported collateral pledged within this table is limited to the net outstanding amount due from the Fund to an individual counterparty. The securities pledged as collateral by the Fund as reported on the Consolidated Statements of Investments may exceed these amounts.
The following table presents the valuations of derivative instruments by risk exposure as reported within the Consolidated Statement of Assets and Liabilities as of December 31, 2013:
56 OPPENHEIMER GLOBAL STRATEGIC INCOME FUND/VA
6. Risk Exposures and the Use of Derivative Instruments (Continued)
| | | | | | | | | | | | | | | | |
| | | Asset Derivatives | | Liability Derivatives |
Derivatives Not Accounted for as
Hedging Instruments | | Consolidated Statement of
Assets and Liabilities Location | | Value | | Consolidated Statement of
Assets and Liabilities Location | | Value |
|
Credit contracts | | Swaps, at value | | $ | 458,526 | | | | | Swaps, at value | | $ | 166,408 | | | |
Interest rate contracts | | Swaps, at value | | | 357,388 | | | | | Swaps, at value | | | 348,365 | | | |
Credit contracts | | | | | | | | | | Variation margin payable | | | 738,350 | * | | |
Interest rate contracts | | Variation margin receivable | | | 1,090,082 | * | | | | Variation margin payable | | | 1,090,542 | * | | |
Foreign exchange contracts | | Unrealized appreciation on foreign currency exchange contracts | | | 13,161,850 | | | | | Unrealized appreciation on foreign currency exchange contracts | | | 16,369,483 | | | |
Foreign exchange contracts | | | | | | | | | | Options, written at value | | | 395,629 | | | |
Credit contracts | | | | | | | | | | Swaptions, written at value | | | 86,090 | | | |
Interest rate contracts | | | | | | | | | | Swaptions, written at value | | | 5,638,547 | | | |
Credit contracts | | Investments, at value | | | 8,816 | ** | | | | | | | | | | |
Foreign exchange contracts | | Investments, at value | | | 599,013 | ** | | | | | | | | | | |
Interest rate contracts | | Investments, at value | | | 5,522,068 | ** | | | | | | | | | | |
| | | | | | | | | | | | | | | | |
Total | | | | $ | 21,197,743 | | | | | | | $ | 24,833,414 | | | |
| | | | | | | | | | | | | | | | |
* Includes only the current day’s variation margin. Prior variation margin movements have been reflected in cash on the Consolidated Statement of Assets and Liabilities upon receipt or payment.
** Amounts relate to purchased option contracts and purchased swaption contracts.
The effect of derivative instruments on the Consolidated Statement of Operations is as follows:
| | | | | | | | | | | | | | | | | | | | | | | | | | | | |
| Amount of Realized Gain or (Loss) Recognized on Derivatives | |
| |
Derivatives Not
Accounted for as
Hedging Instruments | | Investments from
unaffiliated
companies (including
permiums on options
and swaptions
exercised)* | | | Closing and expiration
of swaption contracts
written | | | Closing and
expiration of
option contract
written | | | Closing and
expiration of
futures
contracts | | | Foreign
currency
transactions | | | Swap contracts | | | Total | |
| |
Credit contracts | | $ | (299,064) | | | $ | 516,688 | | | $ | — | | | $ | — | | | $ | — | | | $ | (495,275) | | | $ | (277,651) | |
Equity contracts | | | — | | | | — | | | | — | | | | (2,398,233) | | | | — | | | | 3,049,555 | | | | 651,322 | |
Foreign exchange contracts | | | 4,439,021 | | | | — | | | | 7,482,224 | | | | 91,386 | | | | 5,903,083 | | | | — | | | | 17,915,714 | |
Interest rate contracts | | | 2,558,326 | | | | (2,746,235) | | | | 1,557,713 | | | | (13,202,185) | | | | — | | | | (1,575,838) | | | | (13,408,219) | |
Volatility contracts | | | — | | | | — | | | | — | | | | 113,779 | | | | — | | | | (5,060,619) | | | | (4,946,840) | |
| | | | |
Total | | $ | 6,698,283 | | | $ | (2,229,547) | | | $ | 9,039,937 | | | $ | (15,395,253) | | | $ | 5,903,083 | | | $ | (4,082,177) | | | $ | (65,674) | |
| | | | |
* Includes purchased option contracts, purchased swaption contracts, written option contracts exercised and written swaption contracts exercised, if any. | |
|
| Amount of Change in Unrealized Gain or (Loss) Recognized on Derivatives | |
| |
Derivatives Not
Accounted for as Hedging
Instruments | | Investments* | | | Swaption contracts
written | | | Option contract
written | | | Futures
contracts | | | Translation of
assets and
liabilities
denominated in
foreign
currencies | | | Swap contracts | | | Total | |
| |
Credit contracts | | $ | (91,938) | | | $ | (20,867) | | | $ | — | | | $ | — | | | $ | — | | | $ | 163,107 | | | $ | 50,302 | |
Equity contracts | | | — | | | | — | | | | — | | | | 634,228 | | | | — | | | | (420,204) | | | | 214,024 | |
Foreign exchange contracts | | | (30,605) | | | | — | | | | (65,106) | | | | 51,728 | | | | (2,572,709) | | | | — | | | | (2,616,692) | |
Interest rate contracts | | | 7,119,272 | | | | (1,480,665) | | | | 14,799 | | | | (1,957,588) | | | | — | | | | 97,341 | | | | 3,793,159 | |
Volatility contracts | | | — | | | | — | | | | — | | | | — | | | | — | | | | 562,515 | | | | 562,515 | |
| | | | |
Total | | $ | 6,996,729 | | | $ | (1,501,532) | | | $ | (50,307) | | | $ | (1,271,632) | | | $ | (2,572,709) | | | $ | 402,759 | | | $ | 2,003,308 | |
| | | | |
* Includes purchased option contracts and purchased swaption contracts, if any.
7. Restricted Securities
As of December 31, 2013, investments in securities included issues that are restricted. A restricted security may have a contractual restriction on its resale and is valued under methods approved by the Board of Trustees as reflecting fair value. Securities that are restricted are marked with an applicable footnote on the Consolidated Statement of Investments. Restricted securities are reported on a schedule following the Consolidated Statement of Investments.
8. Acquisition of Oppenheimer High Income Fund/VA
On October 25, 2012, the Fund acquired all of the net assets of Oppenheimer High Income Fund/VA at a fair market value, pursuant to an Agreement and Plan of Reorganization approved by the Oppenheimer High Income Fund/VA shareholders on September 14, 2012. The purpose of this acquisition is to combine two funds with similar investment objectives, strategies and risks to allow shareholders to benefit from greater asset growth potential as well as lowered total expenses.
The transaction qualified as a tax-free reorganization, (the “merger”) for federal income tax purposes allowing the Fund to use the original cost basis of the investments received to calculate subsequent gains and losses for tax reporting purposes.
57 OPPENHEIMER GLOBAL STRATEGIC INCOME FUND/VA
| | |
NOTES TO CONSOLIDATED FINANCIAL STATEMENTS Continued |
8. Acquisition of Oppenheimer High Income Fund/VA (Continued)
Details of the merger are shown in the following table:
| | | | | | | | |
| | | Exchange Ratio to One
Share of the Oppenheimer
High Income Fund/VA | | Shares of Beneficial
Interest Issued by the
Fund | | Value of Issued Shares of
Beneficial Interest | | Combined Net Assets on October 25, 20121 |
|
Non-Service | | 0.3227303411 | | 8,294,514 | | $46,200,443 | | $ 739,622,804 |
Service | | 0.3184024605 | | 9,433,727 | | $53,677,909 | | $ 1,819,058,909 |
Class 3 | | 0.3263655296 | | 832,737 | | $ 4,638,346 | | See Non-Service shares above |
Class 4 | | 0.3240643234 | | 1,130,018 | | $ 6,429,800 | | See Service shares above |
1. The net assets acquired included net unrealized depreciation of $3,949,765 and an unused capital loss carryforward of $225,414,822, potential utilization subject to tax limitations.
9. Pending Litigation
Since 2009, seven class action lawsuits have been pending in the U.S. District Court for the District of Colorado against OppenheimerFunds, Inc. (“OFI”), OppenheimerFunds Distributor, Inc., the Fund’s principal underwriter and distributor (the “Distributor”), and certain funds (but not including the Fund) advised by OFI Global Asset Management, Inc. and distributed by the Distributor (the “Defendant Funds”). The lawsuits also name as defendants certain officers and current and former trustees of the respective Defendant Funds. The lawsuits raise claims under federal securities law and allege, among other things, that the disclosure documents of the respective Defendant Funds contained misrepresentations and omissions and that the respective Defendant Funds’ investment policies were not followed. The plaintiffs in these actions seek unspecified damages, equitable relief and awards of attorneys’ fees and litigation expenses. The Defendant Funds’ Boards of Trustees have also engaged counsel to represent the Funds and the present and former Independent Trustees named in those suits. On August 26, 2013, the parties in six of these lawsuits executed a memorandum of understanding setting forth the terms of proposed settlements of those actions. The proposed settlements are subject to a variety of contingencies, including the execution of settlement agreements, which will require preliminary and final approval by the court. The proposed settlements do not resolve a seventh outstanding lawsuit relating to Oppenheimer California Municipal Fund.
Other class action and individual lawsuits have been filed since 2008 in various state and federal courts against OFI and certain of its affiliates by investors seeking to recover investments they allegedly lost as a result of the “Ponzi” scheme run by Bernard L. Madoff and his firm, Bernard L. Madoff Investment Securities, LLC (“BLMIS”). Plaintiffs in these suits allege that they suffered losses as a result of their investments in several funds managed by an affiliate of OFI and assert a variety of claims, including breach of fiduciary duty, fraud, negligent misrepresentation, unjust enrichment, and violation of federal and state securities laws and regulations, among others. They seek unspecified damages, equitable relief and awards of attorneys’ fees and litigation expenses. Neither the Distributor, nor any of the Oppenheimer mutual funds, their independent trustees or directors are named as defendants in these lawsuits. None of the Oppenheimer mutual funds invested in any funds or accounts managed by Madoff or BLMIS. On February 28, 2011, a stipulation of partial settlement of three groups of consolidated putative class action lawsuits relating to these matters was filed in the U.S. District Court for the Southern District of New York. On August 19, 2011, the court entered an order and final judgment approving the settlement as fair, reasonable and adequate. In September 2011, certain parties filed notices of appeal from the court’s order approving the settlement. The settlement does not resolve other outstanding lawsuits against OFI and its affiliates relating to BLMIS.
On April 16, 2010, a lawsuit was filed in New York state court against (i) OFI, (ii) an affiliate of OFI and (iii) AAArdvark IV Funding Limited (“AAArdvark IV”), an entity advised by OFI’s affiliate, in connection with investments made by the plaintiffs in AAArdvark IV. Plaintiffs allege breach of contract and common law fraud claims against the defendants and seek compensatory damages, costs and disbursements, including attorney fees. On April 11, 2013, the court granted defendants’ motion for summary judgment, dismissing plaintiffs’ fraud claim with prejudice and dismissing their contract claim without prejudice, and granted plaintiffs leave to replead their contract claim to assert a cause of action for specific performance within 30 days. On May 9, 2013, plaintiffs filed a notice of appeal from the court’s dismissal order. On January 7, 2014, the appellate court affirmed the trial court’s dismissal order. On July 15, 2011, a lawsuit was filed in New York state court against OFI, an affiliate of OFI and AAArdvark Funding Limited (“AAArdvark I”), an entity advised by OFI’s affiliate, in connection with investments made by the plaintiffs in AAArdvark I. The complaint alleges breach of contract and common law fraud claims against the defendants and seeks compensatory damages, costs and disbursements, including attorney fees. On November 9, 2011, a lawsuit was filed in New York state court against OFI, an affiliate of OFI and AAArdvark XS Funding Limited (“AAArdvark XS”), an entity advised by OFI’s affiliate, in connection with investments made by the plaintiffs in AAArdvark XS. The complaint alleged breach of contract against the defendants and sought compensatory damages, costs and disbursements, including attorney fees. On November 8, 2013, the parties filed a stipulation of discontinuance dismissing the lawsuit with prejudice.
OFI believes the lawsuits and appeals described above are without legal merit and, with the exception of actions it has settled, is defending against them vigorously. While it is premature to render any opinion as to the outcome in these lawsuits, or whether any costs that the Defendant Funds may bear in defending the suits might not be reimbursed by insurance, OFI believes that these suits should not impair the ability of OFI or the Distributor to perform their respective duties to the Fund, and that the outcome of all of the suits together should not have any material effect on the operations of any of the Oppenheimer mutual funds.
58 OPPENHEIMER GLOBAL STRATEGIC INCOME FUND/VA
| | |
REPORT OF INDEPENDENT REGISTERED PUBLIC ACCOUNTING FIRM |
The Board of Trustees and Shareholders of Oppenheimer Variable Account Funds:
We have audited the accompanying consolidated statement of assets and liabilities of Oppenheimer Global Strategic Income Fund/VA (a separate series of Oppenheimer Variable Account Funds) and subsidiary, including the consolidated statement of investments, as of December 31, 2013, and the related consolidated statement of operations for the year then ended, the consolidated statements of changes in net assets for each of the years in the two-year period then ended, and the consolidated financial highlights for each of the years in the five-year period then ended. These consolidated financial statements and financial highlights are the responsibility of the Fund’s management. Our responsibility is to express an opinion on these consolidated financial statements and financial highlights based on our audits.
We conducted our audits in accordance with the standards of the Public Company Accounting Oversight Board (United States). Those standards require that we plan and perform the audit to obtain reasonable assurance about whether the consolidated financial statements and financial highlights are free of material misstatement. An audit includes examining, on a test basis, evidence supporting the amounts and disclosures in the consolidated financial statements. Our procedures included confirmation of securities owned as of December 31, 2013, by correspondence with the custodian, transfer agent and brokers, or by other appropriate auditing procedures where replies from brokers were not received. An audit also includes assessing the accounting principles used and significant estimates made by management, as well as evaluating the overall financial statement presentation. We believe that our audits provide a reasonable basis for our opinion.
In our opinion, the consolidated financial statements and financial highlights referred to above present fairly, in all material respects, the financial position of Oppenheimer Global Strategic Income Fund/VA and subsidiary as of December 31, 2013, the results of their operations for the year then ended, the changes in their net assets for each of the years in the two-year period then ended, and the financial highlights for each of the years in the five-year period then ended, in conformity with U.S. generally accepted accounting principles.
As discussed in Note 1 to the consolidated financial statements, Oppenheimer Global Strategic Income Fund /VA has elected to change its method of accounting for its investment in Oppenheimer Global Strategic Income Fund /VA (Cayman) Ltd., a wholly-owned investment company.
KPMGLLP
Denver, Colorado
February 19, 2014
59 OPPENHEIMER GLOBAL STRATEGIC INCOME FUND/VA
| | |
FEDERAL INCOME TAX INFORMATION Unaudited |
In early 2014, if applicable, shareholders of record received information regarding all dividends and distributions paid to them by the Fund during calendar year 2013.
Dividends, if any, paid by the Fund during the fiscal year ended December 31, 2013 which are not designated as capital gain distributions should be multiplied by the maximum amount allowable but not less than 0.25% to arrive at the amount eligible for the corporate dividend-received deduction.
The foregoing information is presented to assist shareholders in reporting distributions received from the Fund to the Internal Revenue Service. Because of the complexity of the federal regulations which may affect your individual tax return and the many variations in state and local tax regulations, we recommend that you consult your tax advisor for specific guidance.
60 OPPENHEIMER GLOBAL STRATEGIC INCOME FUND/VA
| | |
| BOARD APPROVAL OF THE FUND’S INVESTMENT ADVISORY AND SUB-ADVISORY AGREEMENTS Unaudited |
The Fund has entered into an investment advisory agreement with OFI Global Asset Management, Inc. (“OFI Global” or the “Adviser”), a wholly-owned subsidiary of OppenheimerFunds, Inc. (“OFI” or the “Sub-Adviser”) (“OFI Global” and “OFI” together the “Managers”) and OFI Global has entered into a sub-advisory agreement with OFI whereby OFI provides investment sub-advisory services to the Fund (collectively, the “Agreements”). Each year, the Board of Trustees (the “Board”), including a majority of the independent Trustees, is required to determine whether to renew the Agreements. The Investment Company Act of 1940, as amended, requires that the Board request and evaluate, and that the Managers provide, such information as may be reasonably necessary to evaluate the terms of the Agreements. The Board employs an independent consultant to prepare a report that provides information, including comparative information that the Board requests for that purpose. In addition to in-person meetings focused on this evaluation, the Board receives information throughout the year regarding Fund services, fees, expenses and performance.
The Adviser, Sub-Adviser and the independent consultant provided information to the Board on the following factors: (i) the nature, quality and extent of the Managers’ services, (ii) the investment performance of the Fund and the Managers, (iii) the fees and expenses of the Fund, including comparative expense information, (iv) the profitability of the Managers and their affiliates, including an analysis of the cost of providing services, (v) whether economies of scale are realized as the Fund grows and whether fee levels reflect these economies of scale for Fund investors and (vi) other benefits to the Managers from their relationship with the Fund. The Board was aware that there are alternatives to retaining the Managers.
Outlined below is a summary of the principal information considered by the Board as well as the Board’s conclusions.
Nature, Quality and Extent of Services. The Board considered information about the nature, quality and extent of the services provided to the Fund and information regarding the Managers’ key personnel who provide such services. The Sub-Adviser’s duties include providing the Fund with the services of the portfolio managers and the Sub-Adviser’s investment team, who provide research, analysis and other advisory services in regard to the Fund’s investments; securities trading services; oversight of third-party service providers; monitoring compliance with applicable Fund policies and procedures and adherence to the Fund’s investment restrictions; and risk management. The Managers are responsible for providing certain administrative services to the Fund as well. Those services include providing and supervising all administrative and clerical personnel who are necessary in order to provide effective corporate administration for the Fund; compiling and maintaining records with respect to the Fund’s operations; preparing and filing reports required by the Securities and Exchange Commission; preparing periodic reports regarding the operations of the Fund for its shareholders; preparing proxy materials for shareholder meetings; and preparing the registration statements required by Federal and state securities laws for the sale of the Fund’s shares. The Managers also provide the Fund with office space, facilities and equipment.
The Board also considered the quality of the services provided and the quality of the Managers’ resources that are available to the Fund. The Board took account of the fact that the Sub-Adviser has had over fifty years of experience as an investment adviser and that its assets under management rank it among the top mutual fund managers in the United States. The Board evaluated the Sub-Adviser’s advisory, administrative, accounting, legal, compliance services and risk management, and information the Board has received regarding the experience and professional qualifications of the Managers’ key personnel and the size and functions of its staff. In its evaluation of the quality of the portfolio management services provided, the Board considered the experience of Arthur Steinmetz, Krishna Memani, Sara Zervos and Jack Brown, the portfolio managers for the Fund, and the Sub-Adviser’s investment team and analysts. The Board members also considered the totality of their experiences with the Managers as directors or trustees of the Fund and other funds advised by the Managers. The Board considered information regarding the quality of services provided by affiliates of the Managers, which its members have become knowledgeable about in connection with the renewal of the Fund’s service agreements. The Board concluded, in light of the Managers’ experience, reputation, personnel, operations and resources that the Fund benefits from the services provided under the Agreement.
Investment Performance of the Manager and the Fund. Throughout the year, the Manager provided information on the investment performance of the Fund, including comparative performance information. The Board also reviewed information, prepared by the Manager and by the independent consultant, comparing the Fund’s historical performance to relevant market indices and to the performance of other multisector bond funds underlying variable insurance products. The Board considered that the Fund outperformed its category median during the one-, three- and ten-year periods, although the Fund underperformed its category median during the five-year period. The Board also considered that for the one-year period the Fund’s performance was in the first quintile of its performance category.
Costs of Services by the Manager. The Board reviewed the fees paid to the Manager and the other expenses borne by the Fund. The independent consultant provided comparative data in regard to the fees and expenses of the Fund and other multisector bond funds underlying variable insurance products. In reviewing the fees and expenses charged to the VA funds, the Board considered the Manager’s assertion that, because there is much greater disparity in the fees and services that may be provided by a manager to a VA fund as opposed to a retail fund, when comparing the expenses of the various VA funds to those of retail funds, it is most appropriate to focus on total expenses (rather than on the management fees). Accordingly, while the Board reviewed and considered all expenses, it focused on total expenses. The Board considered that the Fund’s total expenses were lower than its peer group median (after waivers) and lower than its category median. The Board also considered that the Fund’s contractual management fee was lower than its respective peer group median and category median. Within the total asset range of $2 billion to $5 billion, the Fund’s effective rate was lower than its peer group median and category median. The Board noted that the Manager has voluntarily agreed to limit the Fund’s total annual operating expenses so that those expenses, as percentages of daily net assets, will not exceed the annual rate of 0.75% for Non-Service Shares and 1.00% for Service Shares. This voluntary expense limitation may be amended or withdrawn at any time without prior notice to shareholders.
Economies of Scale and Profits Realized by the Manager. The Board considered information regarding the Manager’s costs in serving as the Fund’s investment adviser, including the costs associated with the personnel and systems necessary to manage the Fund, and information regarding the Manager’s profitability from its relationship with the Fund. The Board reviewed whether the Manager may realize economies of scale in managing and supporting the Fund. The Board noted that the Fund currently has management fee breakpoints, which are intended to share with Fund shareholders economies of scale that may exist as the Fund’s assets grow. Based on the Board’s evaluation, the Managers agreed to a revised breakpoint schedule as negotiated by the Board that, effective November 2013, includes an additional fee breakpoint of 0.48% for assets in excess of $5 billion.
61 OPPENHEIMER GLOBAL STRATEGIC INCOME FUND/VA
| | |
BOARD APPROVAL OF THE FUND’S INVESTMENT ADVISORY AND SUB-ADVISORY AGREEMENTS Unaudited / Continued |
Other Benefits to the Managers. In addition to considering the profits realized by the Managers, the Board considered information that was provided regarding the direct and indirect benefits the Managers receive as a result of their relationship with the Fund, including compensation paid to the Managers’ affiliates. The Board also considered that the Managers must be able to pay and retain experienced professional personnel at competitive rates to provide quality services to the Fund.
Conclusions. These factors were also considered by the independent Trustees meeting separately from the full Board, assisted by experienced counsel to the Fund and to the independent Trustees. Fund counsel and the independent Trustees’ counsel are independent of the Managers within the meaning and intent of the Securities and Exchange Commission Rules.
Based on its review of the information it received and its evaluations described above, the Board, including a majority of the independent Trustees, decided to continue the Agreements through August 31, 2014. In arriving at its decision, the Board did not identify any factor or factors as being more important than others, but considered all of the above information, and considered the terms and conditions of the Agreements, including the management fees, in light of all the surrounding circumstances.
62 OPPENHEIMER GLOBAL STRATEGIC INCOME FUND/VA
| | |
PORTFOLIO PROXY VOTING POLICIES AND PROCEDURES; UPDATES TO STATEMENTS OF INVESTMENTS Unaudited |
The Fund has adopted Portfolio Proxy Voting Policies and Procedures under which the Fund votes proxies relating to securities (“portfolio proxies”) held by the Fund. A description of the Fund’s Portfolio Proxy Voting Policies and Procedures is available (i) without charge, upon request, by calling the Fund toll-free at 1.800.CALL OPP (225.5677), (ii) on the Fund’s website at oppenheimerfunds.com, and (iii) on the SEC’s website at www.sec.gov. In addition, the Fund is required to file Form N-PX, with its complete proxy voting record for the 12 months ended June 30th, no later than August 31st of each year. The Fund’s voting record is available (i) without charge, upon request, by calling the Fund toll-free at 1.800.CALL OPP (225.5677), and (ii) in the Form N-PX filing on the SEC’s website at www.sec.gov.
The Fund files its complete schedule of portfolio holdings with the SEC for the first quarter and the third quarter of each fiscal year on Form N-Q. The Fund’s Form N-Q filings are available on the SEC’s website at www.sec.gov. Those forms may be reviewed and copied at the SEC’s Public Reference Room in Washington, D.C. Information on the operation of the Public Reference Room may be obtained by calling 1-800-SEC-0330.
63 OPPENHEIMER GLOBAL STRATEGIC INCOME FUND/VA
| | |
TRUSTEES AND OFFICERS Unaudited |
| | |
Name, Position(s) Held with the Fund,
Length of Service, Year of Birth | | Principal Occupation(s) During the Past 5 Years; Other Trusteeships/Directorships Held;
Number of Portfolios in the Fund Complex Currently Overseen |
| |
| INDEPENDENT TRUSTEES | | The address of each Trustee in the chart below is 6803 S. Tucson Way, Centennial, Colorado 80112-3924. Each Trustee serves for an indefinite term, or until his or her resignation, retirement, death or removal. |
| |
Sam Freedman, Chairman of the Board of Trustees (since 2013) and Trustee (since 1996) Year of Birth: 1940 | | Director of Colorado UpLIFT (charitable organization) (since September 1984). Mr. Freedman held several positions with the Sub-Adviser and with subsidiary or affiliated companies of the Sub-Adviser (until October 1994). Oversees 39 portfolios in the OppenheimerFunds complex. Mr. Freedman has served on the Boards of certain Oppenheimer funds since 1996, during which time he has become familiar with the Fund’s (and other Oppenheimer funds’) financial, accounting, regulatory and investment matters and has contributed to the Boards’ deliberations. |
| |
Edward L. Cameron, Trustee (since 1999) Year of Birth: 1938 | | Member of The Life Guard of Mount Vernon (George Washington historical site) (June 2000-June 2006); Partner of PricewaterhouseCoopers LLP (accounting firm) (July 1974-June 1999); Chairman of Price Waterhouse LLP Global Investment Management Industry Services Group (accounting firm) (July 1994-June 1998). Oversees 39 portfolios in the OppenheimerFunds complex. Mr. Cameron has served on the Boards of certain Oppenheimer funds since 1999, during which time he has become familiar with the Fund’s (and other Oppenheimer funds’) financial, accounting, regulatory and investment matters and has contributed to the Boards’ deliberations. |
| |
Jon S. Fossel, Trustee (since 1993) Year of Birth: 1942 | | Chairman of the Board (2006-December 2011) and Director (June 2002-December 2011) of UNUMProvident (insurance company); Director of Northwestern Energy Corp. (public utility corporation) (November 2004-December 2009); Director of P.R. Pharmaceuticals (October 1999-October 2003); Director of Rocky Mountain Elk Foundation (non-profit organization) (February 1998-February 2003 and February 2005-February 2007); Chairman and Director (until October 1996) and President and Chief Executive Officer (until October 1995) of the Sub-Adviser; President, Chief Executive Officer and Director of the following: Oppenheimer Acquisition Corp. (“OAC”) (parent holding company of the Sub-Adviser), Shareholders Services, Inc. and Shareholder Financial Services, Inc. (until October 1995). Oversees 39 portfolios in the OppenheimerFunds complex. Mr. Fossel has served on the Boards of certain Oppenheimer funds since 1990, during which time he has become familiar with the Fund’s (and other Oppenheimer funds’) financial, accounting, regulatory and investment matters and has contributed to the Boards’ deliberations. |
| |
Richard F. Grabish, Trustee (since 2012) Year of Birth: 1948 | | Formerly Senior Vice President and Assistant Director of Sales and Marketing (March 1997-December 2007), Director (March 1987-December 2007) and Manager of Private Client Services (June 1985-June 2005) of A.G. Edwards & Sons, Inc. (broker/dealer and investment firm); Chairman and Chief Executive Officer of A.G. Edwards Trust Company, FSB (March 2001-December 2007); President and Vice Chairman of A.G. Edwards Trust Company, FSB (investment adviser) (April 1987-March 2001); President of A.G. Edwards Trust Company, FSB (investment adviser) (June 2005-December 2007). Oversees 39 portfolios in the OppenheimerFunds complex. Mr. Grabish has served on the Boards of certain Oppenheimer funds since 2001, during which time he has become familiar with the Fund’s (and other Oppenheimer funds’) financial, accounting, regulatory and investment matters and has contributed to the Boards’ deliberations. |
| |
Beverly L. Hamilton, Trustee (since 2002) Year of Birth: 1946 | | Trustee of Monterey Institute for International Studies (educational organization) (since February 2000); Board Member of Middlebury College (educational organization) (December 2005-June 2011); Chairman (since 2010) of American Funds’ Emerging Markets Growth Fund, Inc. (mutual fund); Director of The California Endowment (philanthropic organization) (April 2002-April 2008); Director (February 2002-2005) and Chairman of Trustees (2006-2007) of the Community Hospital of Monterey Peninsula; Director (October 1991-2005); Vice Chairman (2006-2009) of American Funds’ Emerging Markets Growth Fund, Inc. (mutual fund); President of ARCO Investment Management Company (February 1991-April 2000); Member of the investment committees of The Rockefeller Foundation (2001-2006) and The University of Michigan (since 2000); Advisor at Credit Suisse First Boston’s Sprout venture capital unit (venture capital fund) (1994-January 2005); Trustee of MassMutual Institutional Funds (investment company) (1996-June 2004); Trustee of MML Series Investment Fund (investment company) (April 1989-June 2004); Member of the investment committee of Hartford Hospital (2000-2003); and Advisor to Unilever (Holland) pension fund (2000-2003). Oversees 39 portfolios in the OppenheimerFunds complex. Ms. Hamilton has served on the Boards of certain Oppenheimer funds since 2002, during which time she has become familiar with the Fund’s (and other Oppenheimer funds’) financial, accounting, regulatory and investment matters and has contributed to the Boards’ deliberations. |
| |
Victoria J. Herget, Trustee (since 2012) Year of Birth:1951 | | Independent Director of the First American Funds (mutual fund family) (2003-2011); former Managing Director (1993-2001), Principal (1985-1993), Vice President (1978-1985) and Assistant Vice President (1973-1978) of Zurich Scudder Investments (and its predecessor firms); Board Chair (2008-Present) and Director (2004-Present), United Educators (insurance company); Trustee (1992-2007), Chair of the Board of Trustees (1999-2007), Investment Committee Chair (1994-1999) and Investment Committee member (2007-2010) of Wellesley College; Trustee (since 2000) and Chair (since 2010), Newberry Library; Trustee, Mather LifeWays (since 2001); Trustee, BoardSource (2006-2009) and Chicago City Day School (1994-2005). Oversees 39 portfolios in the OppenheimerFunds complex. Ms. Herget has served on the Boards of certain Oppenheimer funds since 2012, during which time she has become familiar with the Fund’s (and other Oppenheimer funds’) financial, accounting, regulatory and investment matters and has contributed to the Boards’ deliberations. |
| |
Robert J. Malone, Trustee (since 2002) Year of Birth: 1944 | | Chairman of the Board (since 2012) and Director (since August 2005) of Jones International University (educational organization) (since August 2005); Chairman, Chief Executive Officer and Director of Steele Street Bank Trust (commercial banking) (since August 2003); Trustee of the Gallagher Family Foundation (non-profit organization) (since 2000); Board of Directors of Opera Colorado Foundation (non-profit organization) (2008-2012); Director of Colorado UpLIFT (charitable organization) (1986-2010); Director of Jones Knowledge, Inc. (2006-2010); Former Chairman of U.S. Bank-Colorado (subsidiary of U.S. Bancorp and formerly Colorado National Bank) (July 1996-April 1999); Director of Commercial Assets, Inc. |
64 OPPENHEIMER GLOBAL STRATEGIC INCOME FUND/VA
| | |
Robert J. Malone, Continued | | (real estate investment trust) (1993-2000); Director of U.S. Exploration, Inc. (oil and gas exploration) (1997-February 2004); Chairman of the Board (1991-1994) and Trustee (1985-1994) of Regis University; and Chairman of the Board (1990-1991 and Trustee (1984-1999) of Young Presidents Organization. Oversees 39 portfolios in the OppenheimerFunds complex. Mr. Malone has served on the Boards of certain Oppenheimer funds since 2002, during which time he has become familiar with the Fund’s (and other Oppenheimer funds’) financial, accounting, regulatory and investment matters and has contributed to the Boards’ deliberations. |
| |
F. William Marshall, Jr., Trustee (since 2000) Year of Birth: 1942 | | Trustee Emeritus of Worcester Polytech Institute (WPI) (private university) (since 2009); Trustee of MassMutual Select Funds (formerly MassMutual Institutional Funds) (investment company) (since 1996), MML Series Investment Fund (investment company) (since 1996) and Mass Mutual Premier Funds (investment company) (since January 2012); President and Treasurer of the SIS Fund (private charitable fund) (January 1999 – March 2011); Former Trustee of WPI (1985-2008); Former Chairman of the Board (2004-2006) and Former Chairman of the Investment Committee of WPI (1994-2008); Chairman of SIS & Family Bank, F.S.B. (formerly SIS Bank) (commercial bank) (January 1999-July 1999); Executive Vice President of Peoples Heritage Financial Group, Inc. (commercial bank) (January 1999-July 1999); and Former President and Chief Executive Officer of SIS Bancorp. (1993-1999). Oversees 43 portfolios in the OppenheimerFunds complex. Mr. Marshall has served on the Boards of certain Oppenheimer funds since 2000, during which time he has become familiar with the Fund’s (and other Oppenheimer funds’) financial, accounting, regulatory and investment matters and has contributed to the Boards’ deliberations. |
| |
Karen L. Stuckey, Trustee (since 2012) Year of Birth: 1953 | | Partner (1990-2012) of PricewaterhouseCoopers LLP (held various positions 1975-1990); Emeritus Trustee (since 2006), Trustee (1992-2006) and member of Executive, Nominating and Audit Committees and Chair of Finance Committee of Lehigh University; and member, Women’s Investment Management Forum since inception. Oversees 39 portfolios in the OppenheimerFunds complex. Ms. Stuckey has served on the Boards of certain Oppenheimer funds since 2012, during which time she has become familiar with the Fund’s (and other Oppenheimer funds’) financial, accounting, regulatory and investment matters and has contributed to the Boards’ deliberations. |
| |
James D. Vaughn, Trustee (since 2012) Year of Birth:1945 | | Retired; former managing partner (1994-2001) of Denver office of Deloitte & Touche LLP, (held various positions 1969-1993); Trustee and Chairman of the Audit Committee of Schroder Funds (2003-2012); Board member and Chairman of Audit Committee of AMG National Trust Bank (since 2005); Trustee and Investment Committee member, University of South Dakota Foundation (since 1996); Board member, Audit Committee Member and past Board Chair, Junior Achievement (since 1993); former Board member, Mile High United Way, Boys and Girls Clubs, Boy Scouts, Colorado Business Committee for the Arts, Economic Club of Colorado and Metro Denver Network. Oversees 39 portfolios in the OppenheimerFunds complex. Mr. Vaughn has served on the Boards of certain Oppenheimer funds since 2012, during which time he has become familiar with the Fund’s (and other Oppenheimer funds’) financial, accounting, regulatory and investment matters and has contributed to the Boards’ deliberations. |
| |
| INTERESTED TRUSTEE AND OFFICER | | Mr. Glavin is an “Interested Trustee” because he is affiliated with the Manager and the Sub-Adviser by virtue of his positions as an officer and director of the Manager and a director of the Sub-Adviser, and as a shareholder of the Sub-Adviser’s parent company. Both as a Trustee and as an officer, he serves for an indefinite term, or until his resignation, retirement, death or removal. Mr. Glavin’s address is Two World Financial Center, 225 Liberty Street, 11th Floor, New York, New York 10281-1008. |
| |
William F. Glavin, Jr., Trustee, President and Principal Executive Officer (since 2009) Year of Birth: 1958 | | Director, Chairman and Chief Executive Officer of the Manager (since January 2013); President of the Manager (January 2013-May 2013); Chairman of the Sub-Adviser (December 2009-December 2012); Chief Executive Officer (January 2009-December 2012) and Director of the Sub-Adviser (since January 2009); President of the Sub-Adviser (May 2009-December 2012); Management Director (since June 2009), President (since December 2009) and Chief Executive Officer (since January 2011) of Oppenheimer Acquisition Corp. (“OAC”) (the Sub-Adviser’s parent holding company); Director of Oppenheimer Real Asset Management, Inc. (since March 2010); Executive Vice President (March 2006-February 2009) and Chief Operating Officer (July 2007-February 2009) of Massachusetts Mutual Life Insurance Company (OAC’s parent company); Director (May 2004-March 2006) and Chief Operating Officer and Chief Compliance Officer (May 2004-January 2005), President (January 2005-March 2006) and Chief Executive Officer (June 2005-March 2006) of Babson Capital Management LLC; Director (March 2005-March 2006), President (May 2003-March 2006) and Chief Compliance Officer (July 2005-March 2006) of Babson Capital Securities, Inc. (a broker-dealer); President (May 2003-March 2006) of Babson Investment Company, Inc.; Director (May 2004-August 2006) of Babson Capital Europe Limited; Director (May 2004-October 2006) of Babson Capital Guernsey Limited; Director (May 2004-March 2006) of Babson Capital Management LLC; Non-Executive Director (March 2005-March 2007) of Baring Asset Management Limited; Director (February 2005-June 2006) Baring Pension Trustees Limited; Director and Treasurer (December 2003-November 2006) of Charter Oak Capital Management, Inc.; Director (May 2006-September 2006) of C.M. Benefit Insurance Company; Director (May 2008-June 2009) and Executive Vice President (June 2007-July 2009) of C.M. Life Insurance Company; President (March 2006-May 2007) of MassMutual Assignment Company; Director (January 2005-December 2006), Deputy Chairman (March 2005-December 2006) and President (February 2005-March 2005) of MassMutual Holdings (Bermuda) Limited; Director (May 2008-June 2009) and Executive Vice President (June 2007-July 2009) of MML Bay State Life Insurance Company; Chief Executive Officer and President (April 2007-January 2009) of MML Distributors, LLC; and Chairman (March 2006-December 2008) and Chief Executive Officer (May 2007-December 2008) of MML Investors Services, Inc. An officer of 90 portfolios in the OppenheimerFunds complex. |
| |
| OTHER OFFICERS OF THE FUND | | The addresses of the Officers in the chart below are as follows: for Messrs. Steinmetz, Memani, Gabinet and Mss. Zervos and Nasta, Two World Financial Center, 225 Liberty Street, New York, New York 10281-1008, for Messrs. Brown, Vandehey and Wixted, 6803 S. Tucson Way, Centennial, Colorado 80112-3924. Each Officer serves for an indefinite term or until his or her resignation, retirement, death or removal. |
65 OPPENHEIMER GLOBAL STRATEGIC INCOME FUND/VA
| | |
TRUSTEES AND OFFICERS Unaudited / Continued |
| | |
Arthur P. Steinmetz, Vice President (since 1993) Year of Birth: 1958 | | President of the Manager (since May 2013); Director of the Manager (since January 2013); President and Director of OFI SteelPath, Inc. (since January 2013);Chief Investment Officer of the OppenheimerFunds advisory entities (January 2013-December 2013); Executive Vice President of the Manager (January 2013-May 2013); Chief Investment Officer of the Sub-Adviser (October 2010-December 2012); Chief Investment Officer, Fixed-Income, of the Sub-Adviser (April 2009-October 2010); Executive Vice President of the Sub-Adviser (October 2009-December 2012); Director of Fixed Income of the Sub-Adviser (January 2009-April 2009); and a Senior Vice President of the Sub-Adviser (March 1993-September 2009). A portfolio manager and an officer of other portfolios in the OppenheimerFunds complex. |
| |
Krishna Memani, Vice President (since 2009) Year of Birth: 1960 | | President of the Sub-Adviser (since January 2013); Executive Vice President of the Manager (since January 2014) and Chief Investment Officer of the OppenheimerFunds advisory entities (since January 2014). Chief Investment Officer, Fixed Income of the Sub-Adviser (January 2013-December 2013); Head of the Investment Grade Fixed Income Team of the Sub-Adviser (March 2009-January 2014); Director of Fixed Income of the Sub-Adviser (October 2010-December 2012); Senior Vice President of the Sub-Adviser (March 2009-December 2012) and Senior Vice President of OFI Global Institutional, Inc. (April 2009-December 2012). Managing Director and Head of the U.S. and European Credit Analyst Team at Deutsche Bank Securities (June 2006-January 2009). Chief Credit Strategist at Credit Suisse Securities (August 2002-March 2006). Managing Director and Senior Portfolio Manager at Putnam Investments (September 1998-June 2002). A portfolio manager and an officer of other portfolios in the OppenheimerFunds complex. |
| |
Sara J. Zervos, Ph.D. Vice President (since 2010) Year of Birth: 1969 | | Senior Vice President of the Sub-Adviser (since January 2011); Head of the Global Debt Team (since October 2010) and the team’s Director of International Research. Ms. Zervos serves on the Board of the Emerging Market Trade Association (EMTA) (since January 2014) and is a member of the Federal Reserve Bank of New York Foreign Exchange Committee (since January 2014). Vice President of the Sub-Adviser (April 2008-December 2010). Portfolio manager with Sailfish Capital Management (May 2007-February 2008) and a portfolio manager for emerging market debt at Dillon Read Capital Management and OTA Asset Management (June 2004-April 2007). A portfolio manager and officer of other portfolios in the OppenheimerFunds complex. |
| |
Jack Brown, Vice President (since 2013) Year of Birth: 1973 | | Vice President of the Sub-Adviser (since May 2009) and was a senior analyst for the High Yield Corporate Debt team (from 2000-2012). He joined the Sub-Adviser (in 1995) and has held numerous positions including fixed income liaison, analyst and senior analyst. A portfolio manager and officer of other portfolios in the OppenheimerFunds complex. |
| |
Arthur S. Gabinet, Secretary and Chief Legal Officer (since 2011) Year of Birth: 1958 | | Executive Vice President, Secretary and General Counsel of the Manager (since January 2013); General Counsel OFI SteelPath, Inc. (since January 2013); Executive Vice President (May 2010-December 2012) and General Counsel (since January 2011) of the Sub-Adviser; General Counsel of the Distributor (since January 2011); General Counsel of Centennial Asset Management Corporation (January 2011-December 2012); Executive Vice President (January 2011-December 2012) and General Counsel of HarbourView Asset Management Corporation (since January 2011); Assistant Secretary (since January 2011) and Director (since January 2011) of OppenheimerFunds International Ltd. and OppenheimerFunds plc; Director of Oppenheimer Real Asset Management, Inc. (January 2011-December 2012) and General Counsel (since January 2011); Executive Vice President (January 2011-December 2011) and General Counsel of Shareholder Financial Services, Inc. and Shareholder Services, Inc. (since January 2011); Executive Vice President (January 2011-December 2012) and General Counsel of OFI Private Investments Inc. (since January 2011); Vice President of OppenheimerFunds Legacy Program (January 2011-December 2011); Executive Vice President (January 2011-December 2012) and General Counsel of OFI Institutional Asset Management, Inc. (since January 2011); General Counsel, Asset Management of the Sub-Adviser (May 2010-December 2010); Principal, The Vanguard Group (November 2005-April 2010); District Administrator, U.S. Securities and Exchange Commission (January 2003-October 2005). An officer of 90 portfolios in the OppenheimerFunds complex. |
| |
Christina M. Nasta, Vice President and Chief Business Officer (since 2011) Year of Birth: 1973 | | Senior Vice President of OppenheimerFunds Distributor, Inc. (since January 2013); Senior Vice President of the Sub-Adviser (July 2010-December 2012); Vice President of the Sub-Adviser (January 2003-July 2010); Vice President of OppenheimerFunds Distributor, Inc. (January 2003-July 2010). An officer of 90 portfolios in the OppenheimerFunds complex. |
| |
Mark S. Vandehey, Vice President and Chief Compliance Officer (since 2004) Year of Birth: 1950 | | Senior Vice President and Chief Compliance Officer of the Manager (since January 2013); Chief Compliance Officer of OFI SteelPath, Inc. (since January 2013); Senior Vice President of the Sub-Adviser (March 2004-December 2012); Chief Compliance Officer of the Sub-Adviser, OppenheimerFunds Distributor, Inc., OFI Trust Company, OFI Institutional Asset Management, Inc., Oppenheimer Real Asset Management, Inc., OFI Private Investments, Inc., Harborview Asset Management Corporation, Trinity Investment Management Corporation, and Shareholder Services, Inc. (since March 2004); Vice President of OppenheimerFunds Distributor, Inc., Centennial Asset Management Corporation and Shareholder Services, Inc. (June 1983-December 2012). An officer of 90 portfolios in the OppenheimerFunds complex. |
| |
Brian W. Wixted, Treasurer and Principal Financial & Accounting Officer (since 1999) Year of Birth: 1959 | | Senior Vice President of the Manager (since January 2013); Treasurer of the Sub-Adviser, HarbourView Asset Management Corporation, Shareholder Financial Services, Inc., Shareholder Services, Inc., and Oppenheimer Real Asset Management, Inc. (March 1999-June 2008), OFI Private Investments, Inc. (March 2000-June 2008), OppenheimerFunds International Ltd. and OppenheimerFunds plc (since May 2000), OFI Institutional Asset Management, Inc. (November 2000-June 2008), and OppenheimerFunds Legacy Program (charitable trust program established by the Sub-Adviser) (June 2003-December 2011); Treasurer and Chief Financial Officer of OFI Trust Company (since May 2000); Assistant Treasurer of Oppenheimer Acquisition Corporation (March 1999-June 2008). An officer of 90 portfolios in the OppenheimerFunds complex. |
66 OPPENHEIMER GLOBAL STRATEGIC INCOME FUND/VA
OPPENHEIMER GLOBAL STRATEGIC INCOME FUND/VA
A Series of Oppenheimer Variable Account Funds
| | |
| Manager | | OFI Global Asset Management, Inc. |
| |
| Sub-Adviser | | OppenheimerFunds, Inc. |
| |
| Distributor | | OppenheimerFunds Distributor, Inc. |
| |
Transfer and Shareholder Servicing Agent | | OFI Global Asset Management, Inc. |
| |
| Sub-Transfer Agent | | Shareholder Services, Inc. |
| | DBA OppenheimerFunds Services |
| |
Independent Registered Public Accounting Firm | | KPMG LLP |
| |
| Counsel | | K&L Gates LLP |
| |
| | Before investing, investors should carefully consider a fund’s investment objectives, risks, charges and expenses. Fund prospectuses and summary prospectuses contain this and other information about the funds, and may be obtained by asking your financial advisor, or calling us at 1.800.988.8287. Read prospectuses and summary prospectuses carefully before investing. |
| |
| | © 2014 OppenheimerFunds, Inc. All rights reserved. Oppenheimer funds are distributed by OppenheimerFunds Distributor, Inc. |

| | | | |
| December 31, 2013 | | |
| | | Oppenheimer Equity Income Fund/VA* A Series of Oppenheimer Variable Account Funds | | Annual Report |
| | |
| | ANNUAL REPORT Listing of Top Holdings Fund Performance Discussion Financial Statements *Prior to 4/30/13, the Fund name was Oppenheimer Value Fund/VA | | |

Portfolio Manager: Michael S. Levine, CFA1
Average Annual Total Returns
For the Periods Ended 12/31/13
| | | | | | |
| | | 1-Year | | 5-Year | | 10-Year |
Non-Service Shares | | 28.93% | | 19.66% | | 8.61% |
| | | |
| | | 1-Year | | 5-Year | | Since
Inception
(9/18/06) |
Service Shares | | 28.70% | | 16.17% | | 4.67% |
Performance data quoted represents past performance, which does not guarantee future results. The investment return and principal value of an investment in the Fund will fluctuate so that an investor’s shares, when redeemed, may be worth more or less than their original cost. Current performance may be lower or higher than the performance quoted. For performance data current to the most recent month end, call us at 1.800.988.8287. The Fund’s total returns should not be expected to be the same as the returns of other funds, whether or not both funds have the same portfolio managers and/or similar names. The Fund’s total returns include changes in share price and reinvested distributions but do not include the charges associated with the separate account products that offer this Fund. Such performance would have been lower if such charges were taken into account.
1. Effective April 30, 2013.
| | | | |
TOP TEN COMMON STOCK HOLDINGS | | | | |
Citigroup, Inc. | | | 4.0 | % |
Apple, Inc. | | | 3.9 | |
JPMorgan Chase & Co. | | | 3.8 | |
General Motors Co. | | | 2.5 | |
Chevron Corp. | | | 2.5 | |
Ford Motor Co. | | | 2.4 | |
General Electric Co. | | | 1.9 | |
Microsoft Corp. | | | 1.9 | |
Merck & Co., Inc. | | | 1.7 | |
MetLife, Inc. | | | 1.7 | |
Portfolio holdings and allocations are subject to change. Percentages are as of December 31, 2013, and are based on net assets. For more current Fund holdings, please visit oppenheimerfunds.com.
SECTOR ALLOCATION
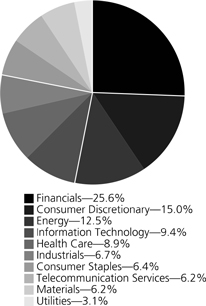
Portfolio holdings and allocations are subject to change. Percentages are as of December 31, 2013, and are based on the total market value of common stocks.
2 OPPENHEIMER EQUITY INCOME FUND/VA
| | |
Fund Performance Discussion |
The Fund’s Non-Service shares produced a total return of 28.93% during the one-year reporting period ended December 31, 2013, underperforming the Russell 1000 Value Index (the “Index”), which returned 32.53% during the same period. The Fund’s underperformance stemmed primarily from weaker relative stock selection in the information technology, health care, consumer discretionary and financials sectors. The Fund outperformed the Index in the consumer staples sector, where favorable stock selection benefited. During the reporting period, the Fund also underperformed the S&P 500 Index, which returned 32.39%.
MARKET OVERVIEW
Equities in the U.S. and developed markets throughout the world delivered strong performance in 2013. Accommodative monetary policies on the part of central banks in the U.S., Europe and Japan, combined with supportive equity valuations relative to bonds, were instrumental in this performance. Signs that the U.S. economy was on the mend, demonstrated by rising house prices, also helped sentiment toward stocks. While equities performed well for the year, numerous concerns remained. Namely, in late May, relatively hawkish remarks by Federal Reserve (“Fed”) chairman Ben Bernanke were widely interpreted as a signal that U.S. monetary policymakers would begin to back away from their quantitative easing program sooner than expected, sparking heightened volatility in financial markets throughout the world. Additionally, fears began to creep into the market about a possible slowdown in the world’s emerging economies. However, market conditions generally stabilized over the summer of 2013. While the Fed unexpectedly refrained from reducing its monthly bond purchases in September, in December, the Central Bank announced that it would reduce its monthly bond purchases by $10 billion, from $85 billion to $75 billion, starting in January 2014. The Fed also announced that it would continue to hold short-term interest rates at very low levels until unemployment in the United States subsided below 6.5%. This was lower than its earlier 7% target.
TOP INDIVIDUAL CONTRIBUTORS
The Fund’s strongest performing holding during the reporting period was drug store operator Walgreen Co. In 2012, the company acquired a 45% stake in European pharmacy chain Alliance Boots. Synergies between the companies appeared strong during the period. Also benefiting performance were energy stock Chevron Corp. and numerous financial firms, including JPMorgan Chase & Co., The Goldman Sachs Group, Inc. and MetLife, Inc. Oil company Chevron’s stock was driven partly by higher refining profitability and a rise in upstream volumes. The financials sector in general performed well as the ongoing, albeit modest, improvement in the economy – largely driven by the continued health of the housing sector – has led to lower foreclosures, increased credit quality, and rising demand for mortgages. JPMorgan Chase also benefited from improved investor sentiment. Over the fourth quarter of 2013, management announced several litigation and regulatory settlements that largely addressed the overhang of “headline” risk that has plagued the stock. Although the total settlement sum is large in absolute terms, it is less than the dollar amount currently reserved for on JPMorgan’s balance sheet. Goldman Sachs saw an increase in underwriting services and its investment banking business performed solidly. Goldman Sachs also took a number of cost-cutting measures during the period. MetLife is a leading life insurance company that benefited from rising interest rates, which can potentially benefit future earnings. At period end, we continue to like MetLife due to its modest valuation and positive sensitivity to rising interest rates.
TOP INDIVIDUAL DETRACTORS
The most significant detractors from performance this reporting period were CYS Investments, Inc., NII Capital Corp. and CenturyLink, Inc. CYS Investments is an agency security real estate investment trust (REIT) that buys agency mortgage-backed securities and historically has had an above average dividend payout. While the recent increase in interest rates improves CYS’ ability to pay its dividend, it also hurts CYS’ book value as higher rates typically lead to lower bond prices. While book value may decline, we currently believe the recent sell off in the stock is overdone. NII Capital is a non-convertible corporate bond of NII Holdings, which is a holding company for the operations of Nextel Communications in select international markets. Our investment in NII Capital declined over the closing months of the period after NII Holdings announced job cuts and higher than anticipated subscriber losses in Mexico. CenturyLink is a leading telecom provider to both the rural market as well as enterprise customers. CenturyLink was perceived by the market to be one of the higher quality/safer high yielding telecommunications companies. Nevertheless, early in the period, the company decided to reduce its dividend to avoid any issues with the rating agencies. The company is redirecting the funds freed up from the cut toward share repurchases. However, the market was not pleased with the dividend cut and the stock declined sharply as a result.
STRATEGY & OUTLOOK
We are optimistic about the market as we look ahead to 2014. We expect the economy to continue to improve driven by an ongoing recovery in the housing market, still low interest rates and better consumer balance sheets. Corporate earnings should continue to grow in-line with an improving economy and dividends should increase in-line with earnings. We expect interest rates to grind higher during 2014 which should result in flat to negative returns for most fixed income asset classes and make equities look even more appealing. Wildcards remain, including the Middle East and Washington D.C., but overall we expect 2014 to be a good year for equities.
3 OPPENHEIMER EQUITY INCOME FUND/VA
Investors should consider the Fund’s investment objective, risks, charges and expenses carefully before investing. The Fund’s prospectus and summary prospectus contain this and other information about the Fund, and may be obtained by asking your financial advisor or calling us at 1.800.988.8287. Read prospectuses and summary prospectuses carefully before investing.
Total returns include changes in share price and reinvestment of dividends and capital gains distributions in a hypothetical investment for the periods shown.
The Fund’s investment strategy and focus can change over time. The mention of specific fund holdings does not constitute a recommendation by OppenheimerFunds, Inc. or its affiliates.
Shares of Oppenheimer funds are not deposits or obligations of any bank, are not guaranteed by any bank, are not insured by the FDIC or any other agency, and involve investment risks, including the possible loss of the principal amount invested.
Comparing the Fund’s Performance to the Market. The graphs that follow show the performance of a hypothetical $10,000 investment in each share class of the Fund held until December 31, 2013. In the case of Non-Service shares, performance is measured over a ten-fiscal-year period. In the case of Service shares, performance is measured from inception of the Class on September 18, 2006. Performance information does not reflect charges that apply to separate accounts investing in the Fund. If these charges were taken into account, performance would be lower. The graphs assume that all dividends and capital gains distributions were reinvested in additional shares.
The Fund’s performance is compared to the performance of the Russell 1000 Value Index and the S&P 500 Index. The Russell 1000 Value Index measures the performance of the large-cap value segment of the U.S. equity universe. It includes those Russell 1000 companies with lower price-to-book ratios and lower expected growth values. The S&P 500 Index is a capitalization-weighted index of 500 stocks intended to be a representative sample of leading companies in leading industries within the U.S. economy. Indices are unmanaged and cannot be purchased directly by investors. Index performance includes reinvestment of income, but does not reflect transaction costs, fees, expenses or taxes. Index performance is shown for illustrative purposes only as a benchmark for the Fund’s performance, and does not predict or depict performance of the Fund. The Fund’s performance reflects the effects of the Fund’s business and operating expenses.
4 OPPENHEIMER EQUITY INCOME FUND/VA
Performance data quoted represents past performance, which does not guarantee future results. The investment return and principal value of an investment in the Fund will fluctuate so that an investor’s shares, when redeemed, may be worth more or less than their original cost. Current performance may be lower or higher than the performance quoted. For performance data current to the most recent month end, call us at 1.800.988.8287. The Fund’s total returns should not be expected to be the same as the returns of other funds, whether or not both funds have the same portfolio managers and/or similar names. The Fund’s total returns include changes in share price and reinvested distributions but do not include the charges associated with the separate account products that offer this Fund. Such performance would have been lower if such charges were taken into account.
5 OPPENHEIMER EQUITY INCOME FUND/VA
Fund Expenses. As a shareholder of the Fund, you incur two types of costs: (1) transaction costs and (2) ongoing costs, including management fees; distribution and service fees; and other Fund expenses. These examples are intended to help you understand your ongoing costs (in dollars) of investing in the Fund and to compare these costs with the ongoing costs of investing in other mutual funds.
The examples are based on an investment of $1,000.00 invested at the beginning of the period and held for the entire
6-month period ended December 31, 2013.
Actual Expenses. The first section of the table provides information about actual account values and actual expenses. You may use the information in this section for the class of shares you hold, together with the amount you invested, to estimate the expense that you paid over the period. Simply divide your account value by $1,000.00 (for example, an $8,600.00 account value divided by $1,000.00 = 8.60), then multiply the result by the number in the first section under the heading entitled “Expenses Paid During Period” to estimate the expenses you paid on your account during this period.
Hypothetical Example for Comparison Purposes.
The second section of the table provides information about hypothetical account values and hypothetical expenses based on the Fund’s actual expense ratio for each class of shares, and an assumed rate of return of 5% per year for each class before expenses, which is not the actual return. The hypothetical account values and expenses may not be used to estimate the actual ending account balance or expenses you paid for the period. You may use this information to compare the ongoing costs of investing in the Fund and other funds. To do so, compare this 5% hypothetical example for the class of shares you hold with the 5% hypothetical examples that appear in the shareholder reports of the other funds.
Please note that the expenses shown in the table are meant to highlight your ongoing costs only and do not reflect any charges associated with the separate accounts that offer this Fund. Therefore, the “hypothetical” lines of the table are useful in comparing ongoing costs only, and will not help you determine the relative total costs of owning different funds. In addition, if these separate account charges were included your costs would have been higher.
| | | | | | | | | | | | | | |
| Actual | | Beginning
Account
Value
July 1, 2013 | | | Ending Account Value
December 31, 2013 | | | Expenses Paid During
6 Months Ended
December 31, 2013 | | | |
Non-Service shares | | $ | 1,000.00 | | | $ | 1,137.80 | | | $ | 4.32 | | | |
Service shares | | | 1,000.00 | | | | 1,136.00 | | | | 5.67 | | | |
| | | | |
Hypothetical | | | | | | | | | | | | | | |
(5% return before expenses) | | | | | | | | | | | | | | |
Non-Service shares | | | 1,000.00 | | | | 1,021.17 | | | | 4.08 | | | |
Service shares | | | 1,000.00 | | | | 1,019.91 | | | | 5.36 | | | |
Expenses are equal to the Fund’s annualized expense ratio for that class, multiplied by the average account value over the period, multiplied by 184/365 (to reflect the one-half year period). Those annualized expense ratios, excluding indirect expenses from affiliated funds, based on the 6-month period ended December 31, 2013 are as follows:
| | | | | | |
| Class | | Expense Ratios | | | |
Non-Service shares | | | 0.80 | % | | |
Service shares | | | 1.05 | | | |
The expense ratios reflect contractual waivers and/or reimbursements of expenses by the Fund’s Manager. Some of these undertakings may be modified or terminated at any time, unless approved by the Board of Trustees. The “Financial Highlights” tables in the Fund’s financial statements, included in this report, also show the gross expense ratios, without such waivers or reimbursements and reduction to custodian expenses, if applicable.
6 OPPENHEIMER EQUITY INCOME FUND/VA
STATEMENT OF INVESTMENTS December 31, 2013
| | | | | | | | | | |
| | | Shares | | | Value | | | |
Common Stocks—87.7% | | | | | | | | | | |
Consumer Discretionary—13.2% | | | | | | | | | | |
Auto Components—1.5% | | | | | | | | | | |
| American Axle & Manufacturing Holdings, Inc.1 | | | 2,600 | | | $ | 53,170 | | | |
Lear Corp. | | | 1,350 | | | | 109,310 | | | |
| | | | | | | | 162,480 | | | |
Automobiles—4.9% | | | | | | | | | | |
Ford Motor Co. | | | 17,500 | | | | 270,025 | | | |
General Motors Co.1 | | | 6,750 | | | | 275,872 | | | |
| | | | | | | | 545,897 | | | |
Hotels, Restaurants & Leisure—0.4% | | | |
McDonald’s Corp. | | | 425 | | | | 41,238 | | | |
Household Durables—1.3% | | | | | | | | | | |
MDC Holdings, Inc.1 | | | 2,875 | | | | 92,690 | | | |
Standard Pacific Corp.1 | | | 6,750 | | | | 61,088 | | | |
| | | | | | | | 153,778 | | | |
Media—0.9% | | | | | | | | | | |
Comcast Corp., Special, Cl. A | | | 2,000 | | | | 99,760 | | | |
Multiline Retail—2.7% | | | | | | | | | | |
J.C. Penney Co., Inc.1 | | | 8,500 | | | | 77,775 | | | |
Kohl’s Corp. | | | 1,750 | | | | 99,313 | | | |
Target Corp. | | | 2,000 | | | | 126,540 | | | |
| | | | | | | | 303,628 | | | |
Specialty Retail—1.5% | | | | | | | | | | |
Best Buy Co., Inc. | | | 1,750 | | | | 69,790 | | | |
Foot Locker, Inc. | | | 2,500 | | | | 103,600 | | | |
| | | | | | | | 173,390 | | | |
Consumer Staples—5.7% | | | | | | | | | | |
Beverages—1.4% | | | | | | | | | | |
| Molson Coors Brewing Co., Cl. B, Non-Vtg., Cl. B | | | 990 | | | | 55,589 | | | |
PepsiCo, Inc. | | | 1,250 | | | | 103,675 | | | |
| | | | | | | | 159,264 | | | |
Food & Staples Retailing—1.6% | | | | | | | | | | |
Kroger Co. (The) | | | 1,000 | | | | 39,530 | | | |
Walgreen Co. | | | 2,250 | | | | 129,240 | | | |
| | | | | | | | 168,770 | | | |
Food Products—1.5% | | | | | | | | | | |
Archer-Daniels-Midland Co. | | | 1,500 | | | | 65,100 | | | |
ConAgra Foods, Inc. | | | 250 | | | | 8,425 | | | |
General Mills, Inc. | | | 825 | | | | 41,176 | | | |
Pinnacle Foods, Inc. | | | 1,630 | | | | 44,760 | | | |
| | | | | | | | 159,461 | | | |
Household Products—0.5% | | | | | | | | | | |
Procter & Gamble Co. (The) | | | 650 | | | | 52,917 | | | |
Tobacco—0.7% | | | | | | | | | | |
Philip Morris International, Inc. | | | 900 | | | | 78,417 | | | |
Energy—11.2% | | | | | | | | | | |
Energy Equipment & Services—2.3% | | | |
Baker Hughes, Inc. | | | 525 | | | | 29,011 | | | |
Ensco plc, Cl. A | | | 2,250 | | | | 128,655 | | | |
Halliburton Co. | | | 1,750 | | | | 88,813 | | | |
| | | | | | | | 246,479 | | | |
Oil, Gas & Consumable Fuels—8.9% | | | |
Apache Corp. | | | 1,040 | | | | 89,378 | | | |
BP plc, Sponsored ADR | | | 3,135 | | | | 152,392 | | | |
Chevron Corp. | | | 2,200 | | | | 274,802 | | | |
CONSOL Energy, Inc. | | | 450 | | | | 17,118 | | | |
Exxon Mobil Corp. | | | 500 | | | | 50,600 | | | |
HollyFrontier Corp. | | | 375 | | | | 18,634 | | | |
Kinder Morgan Management LLC1 | | | 480 | | | | 36,317 | | | |
Kinder Morgan, Inc. | | | 5,000 | | | | 180,000 | | | |
Royal Dutch Shell plc, Cl. A, ADR | | | 1,250 | | | | 89,088 | | | |
Williams Cos., Inc. (The) | | | 1,750 | | | | 67,498 | | | |
| | | | | | | | 975,827 | | | |
Financials—22.5% | | | | | | | | | | |
Capital Markets—3.1% | | | | | | | | | | |
Credit Suisse Group AG, ADR1 | | | 1,650 | | | | 51,216 | | | |
Goldman Sachs Group, Inc. (The) | | | 1,000 | | | | 177,260 | | | |
Morgan Stanley | | | 3,450 | | | | 108,192 | | | |
| | | | | | | 336,668 | | | |
| | | | | | | | |
| | | Shares | | | Value | |
Commercial Banks—0.8% | | | | | | | | |
CIT Group, Inc. | | | 1,250 | | | $ | 65,162 | |
M&T Bank Corp. | | | 90 | | | | 10,478 | |
Wells Fargo & Co. | | | 175 | | | | 7,945 | |
| | | | | | | | 83,585 | |
Diversified Financial Services—8.9% | | | | | | | | |
Bank of America Corp. | | | 2,500 | | | | 38,925 | |
Citigroup, Inc. | | | 8,500 | | | | 442,935 | |
JPMorgan Chase & Co. | | | 7,250 | | | | 423,980 | |
KKR Financial Holdings LLC | | | 7,500 | | | | 91,425 | |
| | | | | | | | 997,265 | |
Insurance—5.1% | | | | | | | | |
ACE Ltd. | | | 450 | | | | 46,589 | |
American International Group, Inc. | | | 750 | | | | 38,287 | |
Assured Guaranty Ltd. | | | 6,500 | | | | 153,335 | |
Everest Re Group Ltd. | | | 375 | | | | 58,451 | |
MetLife, Inc. | | | 3,500 | | | | 188,720 | |
XL Group plc, Cl. A | | | 2,750 | | | | 87,560 | |
| | | | | | | | 572,942 | |
Real Estate Investment Trusts (REITs)—4.6% | |
American Homes 4 Rent, Cl. A | | | 1,500 | | | | 24,300 | |
| Apollo Commercial Real Estate Finance, Inc. | | | 4,000 | | | | 65,000 | |
Ashford Hospitality Prime, Inc. | | | 250 | | | | 4,550 | |
Ashford Hospitality Trust, Inc. | | | 3,750 | | | | 31,050 | |
Blackstone Mortgage Trust, Inc., Cl. A | | | 125 | | | | 3,391 | |
CYS Investments, Inc. | | | 6,125 | | | | 45,386 | |
Colony Financial, Inc. | | | 4,750 | | | | 96,377 | |
Digital Realty Trust, Inc. | | | 1,150 | | | | 56,488 | |
Rayonier, Inc. | | | 1,050 | | | | 44,205 | |
Starwood Property Trust, Inc. | | | 4,250 | | | | 117,725 | |
Two Harbors Investment Corp. | | | 2,625 | | | | 24,360 | |
| | | | | | | | 512,832 | |
Thrifts & Mortgage Finance—0.0% | | | | | | | | |
Hudson City Bancorp, Inc. | | | 300 | | | | 2,829 | |
Health Care—7.8% | | | | | | | | |
Health Care Equipment & Supplies—0.8% | |
Baxter International, Inc. | | | 775 | | | | 53,901 | |
Medtronic, Inc. | | | 500 | | | | 28,695 | |
| | | | | | | | 82,596 | |
Health Care Providers & Services—1.1% | |
UnitedHealth Group, Inc. | | | 1,550 | | | | 116,715 | |
Pharmaceuticals—5.9% | | | | | | | | |
AbbVie, Inc. | | | 100 | | | | 5,281 | |
GlaxoSmithKline plc, Sponsored ADR | | | 1,200 | | | | 64,068 | |
Johnson & Johnson | | | 680 | | | | 62,281 | |
Merck & Co., Inc. | | | 3,875 | | | | 193,944 | |
Pfizer, Inc. | | | 6,000 | | | | 183,780 | |
Roche Holding AG, Sponsored ADR | | | 100 | | | | 7,020 | |
| Teva Pharmaceutical Industries Ltd., Sponsored ADR | | | 3,425 | | | | 137,274 | |
| | | | | | | | 653,648 | |
Industrials—5.6% | | | | | | | | |
Aerospace & Defense—0.7% | | | | | | | | |
General Dynamics Corp. | | | 500 | | | | 47,775 | |
Textron, Inc. | | | 1,000 | | | | 36,760 | |
| | | | | | | | 84,535 | |
Airlines—1.1% | | | | | | | | |
United Continental Holdings, Inc.1 | | | 3,250 | | | | 122,948 | |
Commercial Services & Supplies—0.5% | |
R.R. Donnelley & Sons Co. | | | 3,000 | | | | 60,840 | |
Electrical Equipment—0.3% | | | | | | | | |
General Cable Corp. | | | 1,250 | | | | 36,762 | |
Industrial Conglomerates—1.9% | | | | | | | | |
General Electric Co.2 | | | 7,500 | | | | 210,225 | |
Machinery—0.4% | | | | | | | | |
Navistar International Corp.1 | | | 1,250 | | | | 47,738 | |
Marine—0.2% | | | | | | | | |
Costamare, Inc. | | | 1,500 | | | | 27,405 | |
Road & Rail—0.5% | | | | | | | | |
CSX Corp. | | | 1,750 | | | | 50,347 | |
7 OPPENHEIMER EQUITY INCOME FUND/VA
STATEMENT OF INVESTMENTS Continued
| | | | | | | | | | |
| | | Shares | | | Value | | | |
Information Technology—8.2% | | | |
Communications Equipment—1.8% | | | |
Cisco Systems, Inc. | | | 4,250 | | | $ | 95,412 | | | |
QUALCOMM, Inc. | | | 1,375 | | | | 102,094 | | | |
| | | | | | | | 197,506 | | | |
Computers & Peripherals—4.0% | | | |
Apple, Inc. | | | 775 | | | | 434,860 | | | |
EMC Corp. | | | 600 | | | | 15,090 | | | |
| | | | | | | | 449,950 | | | |
Semiconductors & Semiconductor Equipment—0.5% | | | |
Intel Corp. | | | 2,250 | | | | 58,410 | | | |
Software—1.9% | | | |
Microsoft Corp. | | | 5,500 | | | | 205,865 | | | |
Materials—5.3% | | | |
Chemicals—1.8% | | | |
Celanese Corp., Series A | | | 1,000 | | | | 55,310 | | | |
LyondellBasell Industries NV, Cl. A | | | 950 | | | | 76,266 | | | |
Potash Corp. of Saskatchewan, Inc. | | | 2,000 | | | | 65,920 | | | |
| | | | | | | | 197,496 | | | |
Metals & Mining—1.4% | | | |
Allegheny Technologies, Inc. | | | 2,250 | | | | 80,167 | | | |
| Freeport-McMoRan Copper & Gold, Inc. | | | 2,000 | | | | 75,480 | | | |
| | | | | | | | 155,647 | | | |
Paper & Forest Products—2.1% | | | |
Domtar Corp. | | | 1,100 | | | | 103,774 | | | |
International Paper Co. | | | 2,775 | | | | 136,058 | | | |
| | | | | | | | 239,832 | | | |
Telecommunication Services—5.3% | | | |
Diversified Telecommunication Services—5.3% | | | |
AT&T, Inc. | | | 3,500 | | | | 123,060 | | | |
CenturyLink, Inc. | | | 5,750 | | | | 183,137 | | | |
| Consolidated Communications Holdings, Inc. | | | 2,800 | | | | 54,964 | | | |
Frontier Communications Corp.2 | | | 30,000 | | | | 139,500 | | | |
Verizon Communications, Inc. | | | 325 | | | | 15,971 | | | |
Windstream Holdings, Inc. | | | 9,500 | | | | 75,810 | | | |
| | | | | | | | 592,442 | | | |
Utilities—2.9% | | | |
Electric Utilities—2.6% | | | |
American Electric Power Co., Inc. | | | 1,325 | | | | 61,930 | | | |
Edison International | | | 1,575 | | | | 72,922 | | | |
Exelon Corp. | | | 1,775 | | | | 48,617 | | | |
FirstEnergy Corp. | | | 1,325 | | | | 43,698 | | | |
PPL Corp. | | | 1,500 | | | | 45,135 | | | |
Southern Co. | | | 250 | | | | 10,278 | | | |
| | | | | | | | 282,580 | | | |
Energy Traders—0.3% | | | |
NRG Energy, Inc. | | | 1,000 | | | | 28,720 | | | |
Total Common Stocks (Cost $8,566,573) | | | | | | | 9,729,634 | | | |
| | | | | | | | | | |
| | | | | | | | | | |
| | | | | | | | | | |
| | | | | | | | | | |
| | | | | | | | | | |
| | | Shares | | | Value | | | |
Preferred Stocks—2.0% | | | | | | | |
| American Homes 4 Rent, Series A, 5% Cum., Non-Vtg. | | | 1,500 | | | $ | 37,485 | | | |
| American Homes 4 Rent, Series B, 5% Cum., Non-Vtg.1 | | | 800 | | | | 20,138 | | | |
| Beazer Homes USA, Inc., 7.50% Cv. | | | 1,750 | | | | 65,502 | | | |
| Continental Airlines Finance Trust II, 6% Cv., Non-Vtg. | | | 1,461 | | | | 71,132 | | | |
| iStar Financial, Inc., 4.50% Cv., Non-Vtg. | | | 500 | | | | 31,125 | | | |
| Total Preferred Stocks (Cost $201,734) | | | | | | | 225,382 | | | |
| | | |
| | | Principal
Amount | | | | | | |
Non-Convertible Corporate Bonds and Notes—1.0% | | | |
| J.C. Penney Co., Inc., 5.65% Sr. Unsec. Nts., 6/1/20 | | $ | 25,000 | | | | 19,813 | | | |
| MBIA Insurance Corp., 11.564% Sub. Nts., 1/15/333 | | | 70,000 | | | | 53,375 | | | |
| NII Capital Corp., 7.625% Sr. Unsec. Nts., 4/1/21 | | | 87,500 | | | | 36,531 | | | |
| Total Non-Convertible Corporate Bonds and Notes (Cost $129,664) | | | | | | | 109,719 | | | |
| | | | | | | | | | |
Convertible Corporate Bonds and Notes—8.7% | | | |
| Colony Financial, Inc., 5% Cv. Sr. Unsec. Nts., 4/15/23 | | | 70,000 | | | | 72,056 | | | |
| General Cable Corp., 5% Cv. Unsec. Sub. Nts., 11/15/294 | | | 50,000 | | | | 53,656 | | | |
| iStar Financial, Inc., 3% Cv. Sr. Unsec. Nts., 11/15/16 | | | 50,000 | | | | 68,375 | | | |
| Liberty Interactive LLC, 0.75% Cv. Sr. Unsec. Nts., 3/30/433 | | | 35,000 | | | | 43,794 | | | |
| MGIC Investment Corp., 9% Cv. Jr. Sub. Nts., 4/1/633 | | | 150,000 | | | | 174,000 | | | |
| Micron Technology, Inc., 2.125% Cv. Sr. Unsec. Nts., Series F, 2/15/332,3 | | | 50,000 | | | | 103,344 | | | |
| Navistar International Corp.: | | | | | | | | | | |
| 3.00% Cv. Sr. Sub. Nts., 10/15/14 | | | 35,000 | | | | 35,962 | | | |
| 4.50% Cv. Sr. Sub. Nts., 10/15/183 | | | 93,000 | | | | 96,081 | | | |
| Peabody Energy Corp., 4.75% Cv. Jr. Sub. Nts., 12/15/41 | | | 100,000 | | | | 79,563 | | | |
| Radian Group, Inc., 2.25% Cv. Sr. Unsec. Nts., 3/1/192 | | | 65,000 | | | | 95,631 | | | |
| Starwood Property Trust, Inc., 4% Cv. Sr. Unsec. Nts., 1/15/19 | | | 40,000 | | | | 44,450 | | | |
| United Airlines, Inc., 4.50% Cv. Sr. Unsec. Nts., 1/15/15 | | | 45,000 | | | | 92,138 | | | |
| Total Convertible Corporate Bonds and Notes (Cost $864,491) | | | | | | | 959,050 | | | |
| | | |
| | | Shares | | | | | | |
Investment Company—0.5% | | | | | | | |
| Oppenheimer Institutional Money Market Fund, Cl. E, 0.09%5,6 | | | | | | | | | | |
| (Cost $59,001) | | | 59,001 | | | | 59,001 | | | |
Total Investments, at Value (Cost $9,821,463) | | | 99.9% | | | | 11,082,786 | | | |
Assets in Excess of Other Liabilities | | | 0.1 | | | | 5,943 | | | |
Net Assets | | | 100.0% | | | $ | 11,088,729 | | | |
Footnotes to Statement of Investments
1. Non-income producing security.
2. All or a portion of the security position is held in segregated accounts and pledged to cover margin requirements with respect to outstanding written options. The aggregate market value of such securities is $548,700. See Note 6 of the accompanying Notes.
3. Represents securities sold under Rule 144A, which are exempt from registration under the Securities Act of 1933, as amended. These securities have been determined to be liquid under guidelines established by the Board of Trustees. These securities amount to $470,594 or 4.24% of the Fund’s net assets as of December 31, 2013.
4. Represents the current interest rate for a variable or increasing rate security.
8 OPPENHEIMER EQUITY INCOME FUND/VA
Footnotes to Statement of Investment (Continued)
5. Is or was an affiliate, as defined in the Investment Company Act of 1940, at or during the period ended December 31, 2013, by virtue of the Fund owning at least 5% of the voting securities of the issuer or as a result of the Fund and the issuer having the same investment adviser. Transactions during the period in which the issuer was an affiliate are as follows:
| | | | | | | | | | | | | | | | |
| | | Shares
December 31, 2012 | | | Gross
Additions | | | Gross
Reductions | | | Shares
December 31, 2013 | |
Oppenheimer Institutional Money Market Fund, Cl. E | | | 60,104 | | | | 4,812,678 | | | | 4,813,781 | | | | 59,001 | |
| | | | |
| | | | | | | | | Value | | | Income | |
Oppenheimer Institutional Money Market Fund, Cl. E | | | | | | | | | | $ | 59,001 | | | $ | 224 | |
6. Rate shown is the 7-day yield as of December 31, 2013.
| | | | | | | | | | | | | | | | | | | | | | | | | | |
Exchange-Traded Options Written at December 31, 2013 | |
| Description | | Exercise Price | | | Expiration Date | | | Number of Contracts | | | Premiums Received | | | Value | |
American Airlines Group, Inc. Put | | | USD | | | | 24.000 | | | | 1/18/14 | | | USD | | | (5 | ) | | $ | 171 | | | $ | (190 | ) |
Archer-Daniels-Midland Co. Call | | | USD | | | | 44.000 | | | | 1/18/14 | | | USD | | | (10 | ) | | | 1,248 | | | | (810 | ) |
Best Buy Co., Inc. Put | | | USD | | | | 39.000 | | | | 1/18/14 | | | USD | | | (5 | ) | | | 596 | | | | (490 | ) |
J.C. Penney Co., Inc. Put | | | USD | | | | 9.000 | | | | 1/18/14 | | | USD | | | (20 | ) | | | 2,559 | | | | (900 | ) |
MBIA, Inc. Put | | | USD | | | | 11.000 | | | | 1/18/14 | | | USD | | | (50 | ) | | | 2,248 | | | | (775 | ) |
Microsoft Corp. Call | | | USD | | | | 37.000 | | | | 1/18/14 | | | USD | | | (5 | ) | | | 337 | | | | (445 | ) |
QUALCOMM, Inc. Call | | | USD | | | | 75.000 | | | | 1/18/14 | | | USD | | | (10 | ) | | | 1,159 | | | | (630 | ) |
State Street Corp. Put | | | USD | | | | 72.500 | | | | 1/18/14 | | | USD | | | (5 | ) | | | 1,025 | | | | (375 | ) |
Total of Exchange-Traded Options Written | | | | | | | | | | | | | | | | | | | | $ | 9,343 | | | $ | (4,615 | ) |
See accompanying Notes to Financial Statements.
9 OPPENHEIMER EQUITY INCOME FUND/VA
| | |
STATEMENT OF ASSETS AND LIABILITIES December 31, 2013 |
| | | | |
Assets | | | | |
Investments, at value—see accompanying statement of investments: | | | | |
Unaffiliated companies (cost $9,762,462) | | $ | 11,023,785 | |
Affiliated companies (cost $59,001) | | | 59,001 | |
| | | | 11,082,786 | |
Cash | | | 748 | |
Receivables and other assets: | | | | |
Dividends | | | 30,655 | |
Investments sold | | | 12,341 | |
Other | | | 10,377 | |
Total assets | | | 11,136,907 | |
|
| |
Liabilities | | | | |
Options written, at value (premiums received $9,343) | | | 4,615 | |
Payables and other liabilities: | | | | |
Legal, auditing and other professional fees | | | 17,866 | |
Trustees’ compensation | | | 8,386 | |
Shares of beneficial interest redeemed | | | 7,658 | |
Shareholder communications | | | 6,009 | |
Distribution and service plan fees | | | 2,352 | |
Transfer and shareholder servicing agent fees | | | 931 | |
Other | | | 361 | |
Total liabilities | | | 48,178 | |
|
| | |
Net Assets | | $ | 11,088,729 | |
|
| |
Composition of Net Assets | | | | |
Par value of shares of beneficial interest | | $ | 808 | |
Additional paid-in capital | | | 9,289,354 | |
Accumulated net investment income | | | 148,523 | |
Accumulated net realized gain on investments | | | 383,993 | |
Net unrealized appreciation on investments | | | 1,266,051 | |
Net Assets | | $ | 11,088,729 | |
|
| |
Net Asset Value Per Share | | | | |
Non-Service Shares: | | | | |
| Net asset value, redemption price (excludes applicable contingent deferred sales charge) and offering price per share (based on net assets of $227,236 and 19,519 shares of beneficial interest outstanding) | | | $11.64 | |
| |
Service Shares: | | | | |
| Net asset value, redemption price (excludes applicable contingent deferred sales charge) and offering price per share (based on net assets of $10,861,493 and 788,367 shares of beneficial interest outstanding) | | | $13.78 | |
See accompanying Notes to Financial Statements.
10 OPPENHEIMER EQUITY INCOME FUND/VA
| | |
STATEMENT OF OPERATIONS For the Year Ended December 31, 2013 |
| | | | |
Investment Income | | | | |
Dividends: | | | | |
Unaffiliated companies (net of foreign withholding taxes of $1,645) | | $ | 244,213 | |
Affiliated companies | | | 224 | |
Interest | | | 2,967 | |
Total investment income | | | 247,404 | |
|
| | |
Expenses | | | | |
Management fees | | | 65,542 | |
Distribution and service plan fees - Service shares | | | 21,471 | |
Transfer and shareholder servicing agent fees: | | | | |
Non-Service shares | | | 195 | |
Service shares | | | 8,544 | |
Shareholder communications: | | | | |
Non-Service shares | | | 470 | |
Service shares | | | 20,829 | |
Custodian fees and expenses | | | 1,340 | |
Trustees’ compensation | | | 10,518 | |
Legal, auditing and other professional fees | | | 29,072 | |
Other | | | 6,505 | |
Total expenses | | | 164,486 | |
Less waivers and reimbursements of expenses | | | (72,776 | ) |
Net expenses | | | 91,710 | |
|
| | |
Net Investment Income | | | 155,694 | |
|
| | |
Realized and Unrealized Gain | | | | |
Net realized gain on: | | | | |
Investments from unaffiliated companies (including premiums on options exercised) | | | 1,509,454 | |
Closing and expiration of option contracts written | | | 18,875 | |
Net realized gain | | | 1,528,329 | |
Net change in unrealized appreciation/depreciation on: | | | | |
Investments | | | 487,035 | |
Option contracts written | | | 4,728 | |
Net change in unrealized appreciation/depreciation | | | 491,763 | |
|
| | |
Net Increase in Net Assets Resulting from Operations | | $ | 2,175,786 | |
See accompanying Notes to Financial Statements.
11 OPPENHEIMER EQUITY INCOME FUND/VA
| | |
STATEMENTS OF CHANGES IN NET ASSETS |
| | | | | | | | | | |
| | | Year Ended
December 31, 2013 | | | | | Year Ended
December 31, 2012 | |
Operations | | | | | | | | | | |
Net investment income | | $ | 155,694 | | | | | $ | 92,067 | |
Net realized gain | | | 1,528,329 | | | | | | 255,102 | |
Net change in unrealized appreciation/depreciation | | | 491,763 | | | | | | 530,259 | |
Net increase in net assets resulting from operations | | | 2,175,786 | | | | | | 877,428 | |
|
| |
Dividends and/or Distributions to Shareholders | | | | | | | | | | |
Dividends from net investment income: | | | | | | | | | | |
Non-Service shares | | | (2,605) | | | | | | (1,809) | |
Service shares | | | (91,168) | | | | | | (81,182) | |
| | | (93,773) | | | | | | (82,991) | |
|
| |
Beneficial Interest Transactions | | | | | | | | | | |
Net increase (decrease) in net assets resulting from beneficial interest transactions: | | | | | | | | | | |
Non-Service shares | | | 26,808 | | | | | | 33,842 | |
Service shares | | | 1,928,572 | | | | | | (766,376) | |
| | | 1,955,380 | | | | | | (732,534) | |
|
| |
Net Assets | | | | | | | | | | |
Total increase | | | 4,037,393 | | | | | | 61,903 | |
Beginning of period | | | 7,051,336 | | | | | | 6,989,433 | |
| | | |
End of period (including accumulated net investment income of $148,523 and $84,332, respectively) | | $ | 11,088,729 | | | | | $ | 7,051,336 | |
See accompanying Notes to Financial Statements.
12 OPPENHEIMER EQUITY INCOME FUND/VA
| | | | | | | | | | | | | | | | | | | | |
Non-Service Shares | |
| Year Ended
December
31, 2013 |
| |
| Year Ended
December
31, 2012 |
| |
| Year Ended
December
30, 2011 |
1 | |
| Year Ended
December
31, 2010 |
| |
| Year Ended
December
31, 2009 |
|
Per Share Operating Data | | | | | | | | | | | | | | | | | | | | |
Net asset value, beginning of period | | $ | 9.15 | | | $ | 8.00 | | | $ | 8.49 | | | $ | 7.22 | | | $ | 4.99 | |
Income (loss) from investment operations: | | | | | | | | | | | | | | | | | | | | |
Net investment income2 | | | 0.21 | | | | 0.16 | | | | 0.15 | | | | 0.11 | | | | 0.11 | |
Net realized and unrealized gain (loss) | | | 2.42 | | | | 1.11 | | | | (0.56 | ) | | | 1.24 | | | | 2.14 | |
Total from investment operations | | | 2.63 | | | | 1.27 | | | | (0.41 | ) | | | 1.35 | | | | 2.25 | |
Dividends and/or distributions to shareholders: | | | | | | | | | | | | | | | | | | | | |
Dividends from net investment income | | | (0.14 | ) | | | (0.12 | ) | | | (0.08 | ) | | | (0.08 | ) | | | (0.02 | ) |
Net asset value, end of period | | $ | 11.64 | | | $ | 9.15 | | | $ | 8.00 | | | $ | 8.49 | | | $ | 7.22 | |
| | | | | |
| | | | | | | | | | | | | | | | | | | | | |
Total Return, at Net Asset Value3 | | | 28.93% | | | | 16.08% | | | | (4.93)% | | | | 18.85% | | | | 45.08% | |
| | | | | | | | | | | | | | | | | | | | | |
Ratios/Supplemental Data | | | | | | | | | | | | | | | | | | | | |
Net assets, end of period (in thousands) | | $ | 227 | | | $ | 154 | | | $ | 104 | | | $ | 92 | | | $ | 38 | |
Average net assets (in thousands) | | $ | 195 | | | $ | 132 | | | $ | 101 | | | $ | 57 | | | $ | 20 | |
Ratios to average net assets:4 | | | | | | | | | | | | | | | | | | | | |
Net investment income | | | 2.00% | | | | 1.82% | | | | 1.78% | | | | 1.46% | | | | 1.75% | |
Total expenses5 | | | 1.64% | | | | 1.75% | | | | 1.83% | | | | 2.05% | | | | 2.30% | |
Expenses after payments, waivers and/or reimbursements and reduction to custodian expenses | | | 0.80% | | | | 0.80% | | | | 0.80% | | | | 0.57% | | | | 0.85% | |
Portfolio turnover rate | | | 159% | | | | 87% | | | | 86% | | | | 109% | | | | 122% | |
1. December 30, 2011 represents the last business day of the Fund’s reporting period.
2. Per share amounts calculated based on the average shares outstanding during the period.
3. Assumes an initial investment on the business day before the first day of the fiscal period, with all dividends and distributions reinvested in additional shares on the reinvestment date, and redemption at the net asset value calculated on the last business day of the fiscal period. Total returns are not annualized for periods less than one full year. Total return information does not reflect expenses that apply at the separate account level or to related insurance products. Inclusion of these charges would reduce the total return figures for all periods shown. Returns do not reflect the deduction of taxes that a shareholder would pay on fund distributions or the redemption of fund shares.
4. Annualized for periods less than one full year.
5. Total expenses including indirect expenses from affiliated fund were as follows:
| | | | |
Year Ended December 31, 2013 | | | 1.64 | % |
Year Ended December 31, 2012 | | | 1.75 | % |
Year Ended December 30, 2011 | | | 1.83 | % |
Year Ended December 31, 2010 | | | 2.05 | % |
Year Ended December 31, 2009 | | | 2.31 | % |
See accompanying Notes to Financial Statements.
13 OPPENHEIMER EQUITY INCOME FUND/VA
| | |
FINANCIAL HIGHLIGHTS Continued |
| | | | | | | | | | | | | | | | | | | | |
Service Shares | |
| Year Ended
December
31, 2013 |
| |
| Year Ended
December
31, 2012 |
| |
| Year Ended
December
30, 2011 |
1 | |
| Year Ended
December
31, 2010 |
| |
| Year Ended
December
31, 2009 |
|
Per Share Operating Data | | | | | | | | | | | | | | | | | | | | |
Net asset value, beginning of period | | $ | 10.83 | | | $ | 9.69 | | | $ | 10.23 | | | $ | 8.99 | | | $ | 6.79 | |
Income (loss) from investment operations: | | | | | | | | | | | | | | | | | | | | |
Net investment income2 | | | 0.22 | | | | 0.13 | | | | 0.11 | | | | 0.08 | | | | 0.09 | |
Net realized and unrealized gain (loss) | | | 2.87 | | | | 1.13 | | | | (0.56 | ) | | | 1.24 | | | | 2.12 | |
Total from investment operations | | | 3.09 | | | | 1.26 | | | | (0.45 | ) | | | 1.32 | | | | 2.21 | |
Dividends and/or distributions to shareholders: | | | | | | | | | | | | | | | | | | | | |
Dividends from net investment income | | | (0.14 | ) | | | (0.12 | ) | | | (0.09 | ) | | | (0.08 | ) | | | (0.01 | ) |
Net asset value, end of period | | $ | 13.78 | | | $ | 10.83 | | | $ | 9.69 | | | $ | 10.23 | | | $ | 8.99 | |
| | | | | |
| | | | | | | | | | | | | | | | | | | | | |
Total Return, at Net Asset Value3 | | | 28.70% | | | | 13.09% | | | | (4.48)% | | | | 14.81% | | | | 32.57% | |
| | | | | | | | | | | | | | | | | | | | | |
Ratios/Supplemental Data | | | | | | | | | | | | | | | | | | | | |
Net assets, end of period (in thousands) | | $ | 10,862 | | | $ | 6,897 | | | $ | 6,885 | | | $ | 7,311 | | | $ | 7,505 | |
Average net assets (in thousands) | | $ | 8,549 | | | $ | 7,095 | | | $ | 7,449 | | | $ | 7,008 | | | $ | 5,501 | |
Ratios to average net assets:4 | | | | | | | | | | | | | | | | | | | | |
Net investment income | | | 1.78% | | | | 1.26% | | | | 1.08% | | | | 0.85% | | | | 1.10% | |
Total expenses5 | | | 1.89% | | | | 1.93% | | | | 1.90% | | | | 2.08% | | | | 2.17% | |
Expenses after payments, waivers and/or reimbursements and reduction to custodian expenses | | | 1.05% | | | | 1.04% | | | | 1.05% | | | | 0.93% | | | | 1.15% | |
Portfolio turnover rate | | | 159% | | | | 87% | | | | 86% | | | | 109% | | | | 122% | |
1. December 30, 2011 represents the last business day of the Fund’s reporting period.
2. Per share amounts calculated based on the average shares outstanding during the period.
3. Assumes an initial investment on the business day before the first day of the fiscal period, with all dividends and distributions reinvested in additional shares on the reinvestment date, and redemption at the net asset value calculated on the last business day of the fiscal period. Total returns are not annualized for periods less than one full year. Total return information does not reflect expenses that apply at the separate account level or to related insurance products. Inclusion of these charges would reduce the total return figures for all periods shown. Returns do not reflect the deduction of taxes that a shareholder would pay on fund distributions or the redemption of fund shares.
4. Annualized for periods less than one full year.
5. Total expenses including indirect expenses from affiliated fund were as follows:
| | | | |
Year Ended December 31, 2013 | | | 1.89 | % |
Year Ended December 31, 2012 | | | 1.93 | % |
Year Ended December 30, 2011 | | | 1.90 | % |
Year Ended December 31, 2010 | | | 2.08 | % |
Year Ended December 31, 2009 | | | 2.18 | % |
See accompanying Notes to Financial Statements.
14 OPPENHEIMER EQUITY INCOME FUND/VA
| | |
NOTES TO FINANCIAL STATEMENTS December 31, 2013 |
1. Significant Accounting Policies
Oppenheimer Equity Income Fund/VA (the “Fund”), formerly Oppenheimer Value Fund/VA, is a separate series of Oppenheimer Variable Account Funds, a diversified open-end management investment company registered under the Investment Company Act of 1940, as amended. The Fund’s investment objective is to seek total return. The Fund’s investment adviser is OFI Global Asset Management, Inc. (“OFI Global” or the “Manager”), a wholly-owned subsidiary of OppenheimerFunds, Inc. (“OFI” or the “Sub-Adviser”). The Manager has entered into a sub-advisory agreement with OFI. Shares of the Fund are sold only to separate accounts of life insurance companies.
The Fund offers two classes of shares. Both classes are sold at their offering price, which is the net asset value per share, to separate investment accounts of participating insurance companies as an underlying investment for variable life insurance policies, variable annuity contracts or other investment products. The class of shares designated as Service shares is subject to a distribution and service plan. Both classes of shares have identical rights and voting privileges with respect to the Fund in general and exclusive voting rights on matters that affect that class alone. Earnings, net assets and net asset value per share may differ due to each class having its own expenses, such as transfer and shareholder servicing agent fees and shareholder communications, directly attributable to that class.
The following is a summary of significant accounting policies consistently followed by the Fund.
Investment in Oppenheimer Institutional Money Market Fund. The Fund is permitted to invest daily available cash balances in an affiliated money market fund. The Fund may invest the available cash in Class E shares of Oppenheimer Institutional Money Market Fund (“IMMF”) to seek current income while preserving liquidity. IMMF is a registered open-end management investment company, regulated as a money market fund under the Investment Company Act of 1940, as amended. The Manager is the investment adviser of IMMF, and the Sub-Adviser provides investment and related advisory services to IMMF. When applicable, the Fund’s investment in IMMF is included in the Statement of Investments. Shares of IMMF are valued at their net asset value per share. As a shareholder, the Fund is subject to its proportional share of IMMF’s Class E expenses, including its management fee. The Manager will waive fees and/or reimburse Fund expenses in an amount equal to the indirect management fees incurred through the Fund’s investment in IMMF.
Foreign Currency Translation. The Fund’s accounting records are maintained in U.S. dollars. The values of securities denominated in foreign currencies and amounts related to the purchase and sale of foreign securities and foreign investment income are translated into U.S. dollars as of the close of the New York Stock Exchange (the “Exchange”), normally 4:00 P.M. Eastern time, on each day the Exchange is open for trading. Foreign exchange rates may be valued primarily using a reliable bank, dealer or service authorized by the Board of Trustees.
Reported net realized gains and losses from foreign currency transactions arise from sales of portfolio securities, sales and maturities of short-term securities, sales of foreign currencies, exchange rate fluctuations between the trade and settlement dates on securities transactions, and the difference between the amounts of dividends, interest, and foreign withholding taxes recorded on the Fund’s books and the U.S. dollar equivalent of the amounts actually received or paid. Net unrealized appreciation and depreciation on the translation of assets and liabilities denominated in foreign currencies arise from changes in the values of assets and liabilities, including investments in securities at fiscal period end, resulting from changes in exchange rates.
The effect of changes in foreign currency exchange rates on investments is separately identified from the fluctuations arising from changes in market values of securities held and reported with all other foreign currency gains and losses in the Fund’s Statement of Operations.
Allocation of Income, Expenses, Gains and Losses. Income, expenses (other than those attributable to a specific class), gains and losses are allocated on a daily basis to each class of shares based upon the relative proportion of net assets represented by such class. Operating expenses directly attributable to a specific class are charged against the operations of that class.
Federal Taxes. The Fund intends to comply with provisions of the Internal Revenue Code applicable to regulated investment companies and to distribute substantially all of its investment company taxable income, including any net realized gain on investments not offset by capital loss carryforwards, if any, to shareholders. Therefore, no federal income or excise tax provision is required. The Fund files income tax returns in U.S. federal and applicable state jurisdictions. The statute of limitations on the Fund’s tax return filings generally remain open for the three preceding fiscal reporting period ends.
The tax components of capital shown in the following table represent distribution requirements the Fund must satisfy under the income tax regulations, losses the Fund may be able to offset against income and gains realized in future years and unrealized appreciation or depreciation of securities and other investments for federal income tax purposes.
| | | | | | | | | | | | |
Undistributed Net Investment Income | | Undistributed
Long-Term
Gain | | | Accumulated
Loss
Carryforward1,2 | | | Net Unrealized
Appreciation
Based on cost of
Securities and
Other Investments
for Federal Income
Tax Purposes | |
$167,041 | | $ | 461,978 | | | $ | — | | | $ | 1,172,621 | |
1. During the fiscal year ended December 31, 2013, the Fund utilized $973,499 of capital loss carryforward to offset capital gains realized in that fiscal year.
2. During the fiscal year ended December 31, 2012, the Fund utilized $231,212 of capital loss carryforward to offset capital gains realized in that fiscal year.
15 OPPENHEIMER EQUITY INCOME FUND/VA
| | |
NOTES TO FINANCIAL STATEMENTS Continued |
1. Significant Accounting Policies (Continued)
Net investment income (loss) and net realized gain (loss) may differ for financial statement and tax purposes. The character of dividends and distributions made during the fiscal year from net investment income or net realized gains may differ from their ultimate characterization for federal income tax purposes. Also, due to timing of dividends and distributions, the fiscal year in which amounts are distributed may differ from the fiscal year in which the income or net realized gain was recorded by the Fund.
Accordingly, the following amounts have been reclassified for December 31, 2013. Net assets of the Fund were unaffected by the reclassifications.
| | | | | | | | |
Increase to Paid-in Capital | | Increase to Accumulated
Net Investment
Income | | | Reduction to Accumulated Net
Realized Gain on Investments3 | |
$44,764 | | $ | 2,270 | | | $ | 47,034 | |
3. $44,764, all of which was long-term capital gain, was distributed in connection with Fund share redemptions.
The tax character of distributions paid during the years ended December 31, 2013 and December 31, 2012 was as follows:
| | | | | | | | |
| | | Year Ended December 31, 2013 | | | Year Ended December 31, 2012 | |
Distributions paid from: | | | | | | | | |
Ordinary income | | $ | 93,773 | | | $ | 82,991 | |
The aggregate cost of securities and other investments and the composition of unrealized appreciation and depreciation of securities and other investments for federal income tax purposes as of December 31, 2013 are noted in the following table. The primary difference between book and tax appreciation or depreciation of securities and other investments, if applicable, is attributable to the tax deferral of losses or tax realization of financial statement unrealized gain or loss.
| | | | |
Federal tax cost of securities | | $ | 9,914,893 | |
Federal tax cost of other investments | | | (9,343 | ) |
| | | | |
Total federal tax cost | | $ | 9,905,550 | |
| | | | |
Gross unrealized appreciation | | $ | 1,343,803 | |
Gross unrealized depreciation | | | (171,182 | ) |
| | | | |
Net unrealized appreciation | | $ | 1,172,621 | |
| | | | |
Trustees’ Compensation. The Board of Trustees has adopted a compensation deferral plan for independent trustees that enables trustees to elect to defer receipt of all or a portion of the annual compensation they are entitled to receive from the Fund. For purposes of determining the amount owed to the Trustee under the plan, deferred amounts are treated as though equal dollar amounts had been invested in shares of the Fund or in other Oppenheimer funds selected by the Trustee. The Fund purchases shares of the funds selected for deferral by the Trustee in amounts equal to his or her deemed investment, resulting in a Fund asset equal to the deferred compensation liability. Such assets are included as a component of “Other” within the asset section of the Statement of Assets and Liabilities. Deferral of trustees’ fees under the plan will not affect the net assets of the Fund, and will not materially affect the Fund’s assets, liabilities or net investment income per share. Amounts will be deferred until distributed in accordance with the compensation deferral plan.
Dividends and Distributions to Shareholders. Dividends and distributions to shareholders, which are determined in accordance with income tax regulations and may differ from U.S. generally accepted accounting principles, are recorded on the ex-dividend date. Income and capital gain distributions, if any, are declared and paid annually or at other times as deemed necessary by the Manager.
Investment Income. Dividend income is recorded on the ex-dividend date or upon ex-dividend notification in the case of certain foreign dividends where the ex-dividend date may have passed. Non-cash dividends included in dividend income, if any, are recorded at the fair market value of the securities received. Interest income is recognized on an accrual basis. Discount and premium, which are included in interest income on the Statement of Operations, are amortized or accreted daily.
Custodian Fees. “Custodian fees and expenses” in the Statement of Operations may include interest expense incurred by the Fund on any cash overdrafts of its custodian account during the period. Such cash overdrafts may result from the effects of failed trades in portfolio securities and from cash outflows resulting from unanticipated shareholder redemption activity. The Fund pays interest to its custodian on such cash overdrafts, to the extent they are not offset by positive cash balances maintained by the Fund, at a rate equal to the Federal Funds Rate plus 0.50%. The “Reduction to custodian expenses” line item, if applicable, represents earnings on cash balances maintained by the Fund during the period. Such interest expense and other custodian fees may be paid with these earnings.
Security Transactions. Security transactions are recorded on the trade date. Realized gains and losses on securities sold are determined on the basis of identified cost.
16 OPPENHEIMER EQUITY INCOME FUND/VA
1. Significant Accounting Policies (Continued)
Indemnifications. The Fund’s organizational documents provide current and former trustees and officers with a limited indemnification against liabilities arising in connection with the performance of their duties to the Fund. In the normal course of business, the Fund may also enter into contracts that provide general indemnifications. The Fund’s maximum exposure under these arrangements is unknown as this would be dependent on future claims that may be made against the Fund. The risk of material loss from such claims is considered remote.
Other. The preparation of financial statements in conformity with accounting principles generally accepted in the United States of America requires management to make estimates and assumptions that affect the reported amounts of assets and liabilities and disclosure of contingent assets and liabilities at the date of the financial statements and the reported amounts of increases and decreases in net assets from operations during the reporting period. Actual results could differ from those estimates.
2. Securities Valuation
The Fund calculates the net asset value of its shares as of the close of the New York Stock Exchange (the “Exchange”), normally 4:00 P.M. Eastern time, on each day the Exchange is open for trading.
The Fund’s Board has adopted procedures for the valuation of the Fund’s securities and has delegated the day-to-day responsibility for valuation determinations under those procedures to the Manager. The Manager has established a Valuation Committee which is responsible for determining a “fair valuation” for any security for which market quotations are not “readily available.” The Valuation Committee’s fair valuation determinations are subject to review, approval and ratification by the Fund’s Board at its next regularly scheduled meeting covering the calendar quarter in which the fair valuation was determined.
Valuation Methods and Inputs
Securities are valued using unadjusted quoted market prices, when available, as supplied primarily by third party pricing services or dealers.
The following methodologies are used to determine the market value or the fair value of the types of securities described below:
Securities traded on a registered U.S. securities exchange (including exchange-traded derivatives other than futures and futures options) are valued based on the last sale price of the security reported on the principal exchange on which it is traded, prior to the time when the Fund’s assets are valued. In the absence of a sale, the security is valued at the last sale price on the prior trading day, if it is within the spread of the current day’s closing “bid” and “asked” prices, and if not, at the current day’s closing bid price. A security of a foreign issuer traded on a foreign exchange, but not listed on a registered U.S. securities exchange, is valued based on the last sale price on the principal exchange on which the security is traded, as identified by the third party pricing service used by the Manager, prior to the time when the Fund’s assets are valued. If the last sale price is unavailable, the security is valued at the most recent official closing price on the principal exchange on which it is traded. If the last sales price or official closing price for a foreign security is not available, the security is valued at the mean between the bid and asked price per the exchange or, if not available from the exchange, obtained from two dealers. If bid and asked prices are not available from either the exchange or two dealers, the security is valued by using one of the following methodologies (listed in order of priority); (1) using a bid from the exchange, (2) the mean between the bid and asked price as provided by a single dealer, or (3) a bid from a single dealer.
Shares of a registered investment company that are not traded on an exchange are valued at that investment company’s net asset value per share.
Corporate and government debt securities (of U.S. or foreign issuers) and municipal debt securities, event-linked bonds, loans, mortgage-backed securities, collateralized mortgage obligations, and asset-backed securities are valued at the mean between the “bid” and “asked” prices utilizing evaluated prices obtained from third party pricing services or broker-dealers who may use matrix pricing methods to determine the evaluated prices.
Short-term money market type debt securities with a remaining maturity of sixty days or less are valued at cost adjusted by the amortization of discount or premium to maturity (amortized cost), which approximates market value. Short-term debt securities with a remaining maturity in excess of sixty days are valued at the mean between the “bid” and “asked” prices utilizing evaluated prices obtained from third party pricing services or broker-dealers.
A description of the standard inputs that may generally be considered by the third party pricing vendors in determining their evaluated prices is provided below.
| | |
| Security Type | | Standard inputs generally considered by third-party pricing vendors |
| Corporate debt, government debt, municipal, mortgage-backed and asset-backed securities | | Reported trade data, broker-dealer price quotations, benchmark yields, issuer spreads on comparable securities, the credit quality, yield, maturity, and other appropriate factors. |
| Loans | | Information obtained from market participants regarding reported trade data and broker-dealer price quotations. |
| Event-linked bonds | | Information obtained from market participants regarding reported trade data and broker-dealer price quotations. |
If a market value or price cannot be determined for a security using the methodologies described above, or if, in the “good faith” opinion of the Manager, the market value or price obtained does not constitute a “readily available market quotation,” or a significant event has occurred that would materially affect the value of the security the security is fair valued either (i) by a standardized fair valuation methodology applicable to the security type or the significant event as previously approved by the Valuation Committee and the Fund’s Board or (ii) as determined in good faith by the Manager’s Valuation Committee. The Valuation Committee considers all relevant facts that are reasonably available, through either public information or
17 OPPENHEIMER EQUITY INCOME FUND/VA
| | |
NOTES TO FINANCIAL STATEMENTS Continued |
2. Securities Valuation (Continued)
information available to the Manager, when determining the fair value of a security. Fair value determinations by the Manager are subject to review, approval and ratification by the Fund’s Board at its next regularly scheduled meeting covering the calendar quarter in which the fair valuation was determined. Those fair valuation standardized methodologies include, but are not limited to, valuing securities at the last sale price or initially at cost and subsequently adjusting the value based on: changes in company specific fundamentals, changes in an appropriate securities index, or changes in the value of similar securities which may be further adjusted for any discounts related to security-specific resale restrictions. When possible, such methodologies use observable market inputs such as unadjusted quoted prices of similar securities, observable interest rates, currency rates and yield curves. The methodologies used for valuing securities are not necessarily an indication of the risks associated with investing in those securities nor can it be assured that the Fund can obtain the fair value assigned to a security if it were to sell the security.
To assess the continuing appropriateness of security valuations, the Manager, or its third party service provider who is subject to oversight by the Manager, regularly compares prior day prices, prices on comparable securities, and sale prices to the current day prices and challenges those prices exceeding certain tolerance levels with the third party pricing service or broker source. For those securities valued by fair valuations, whether through a standardized fair valuation methodology or a fair valuation determination, the Valuation Committee reviews and affirms the reasonableness of the valuations based on such methodologies and fair valuation determinations on a regular basis after considering all relevant information that is reasonably available.
Classifications
Each investment asset or liability of the Fund is assigned a level at measurement date based on the significance and source of the inputs to its valuation. Various data inputs are used in determining the value of each of the Fund’s investments as of the reporting period end. These data inputs are categorized in the following hierarchy under applicable financial accounting standards:
1) Level 1-unadjusted quoted prices in active markets for identical assets or liabilities (including securities actively traded on a securities exchange)
2) Level 2-inputs other than unadjusted quoted prices that are observable for the asset or liability (such as unadjusted quoted prices for similar assets and market corroborated inputs such as interest rates, prepayment speeds, credit risks, etc.)
3) Level 3-significant unobservable inputs (including the Manager’s own judgments about assumptions that market participants would use in pricing the asset or liability).
The inputs used for valuing securities are not necessarily an indication of the risks associated with investing in those securities.
The table below categorizes amounts that are included in the Fund’s Statement of Assets and Liabilities as of December 31, 2013 based on valuation input level:
| | | | | | | | | | | | | | | | |
| | | Level 1—
Unadjusted
Quoted Prices | | | Level 2—
Other Significant
Observable Inputs | | | Level 3—
Significant
Unobservable
Inputs | | | Value | |
Assets Table | | | | | | | | | | | | | | | | |
Investments, at Value: | | | | | | | | | | | | | | | | |
Common Stocks | | | | | | | | | | | | | | | | |
Consumer Discretionary | | $ | 1,480,171 | | | $ | — | | | $ | — | | | $ | 1,480,171 | |
Consumer Staples | | | 618,829 | | | | — | | | | — | | | | 618,829 | |
Energy | | | 1,222,306 | | | | — | | | | — | | | | 1,222,306 | |
Financials | | | 2,506,121 | | | | — | | | | — | | | | 2,506,121 | |
Health Care | | | 852,959 | | | | — | | | | — | | | | 852,959 | |
Industrials | | | 640,800 | | | | — | | | | — | | | | 640,800 | |
Information Technology | | | 911,731 | | | | — | | | | — | | | | 911,731 | |
Materials | | | 592,975 | | | | — | | | | — | | | | 592,975 | |
Telecommunication Services | | | 592,442 | | | | — | | | | — | | | | 592,442 | |
Utilities | | | 311,300 | | | | — | | | | — | | | | 311,300 | |
Preferred Stocks | | | 123,125 | | | | 102,257 | | | | — | | | | 225,382 | |
Non-Convertible Corporate Bonds and Notes | | | — | | | | 109,719 | | | | — | | | | 109,719 | |
Convertible Corporate Bonds and Notes | | | — | | | | 959,050 | | | | — | | | | 959,050 | |
Investment Company | | | 59,001 | | | | — | | | | — | | | | 59,001 | |
| | | | |
Total Assets | | $ | 9,911,760 | | | $ | 1,171,026 | | | $ | — | | | $ | 11,082,786 | |
| | | | |
Liabilities Table | | | | | | | | | | | | | | | | |
Other Financial Instruments: | | | | | | | | | | | | | | | | |
Options written, at value | | $ | (4,615) | | | $ | — | | | $ | — | | | $ | (4,615) | |
| | | | |
Total Liabilities | | $ | (4,615) | | | $ | — | | | $ | — | | | $ | (4,615) | |
| | | | |
Currency contracts and forwards, if any, are reported at their unrealized appreciation/ depreciation at measurement date, which represents the change in the contract’s value from trade date. Futures, if any, are reported at their variation margin at measurement date, which represents the amount due to/from the Fund at that date. All additional assets and liabilities included in the above table are reported at their market value at measurement date.
3. Shares of Beneficial Interest
The Fund has authorized an unlimited number of $0.001 par value shares of beneficial interest of each class. Transactions in shares of beneficial interest were as follows:
18 OPPENHEIMER EQUITY INCOME FUND/VA
3. Shares of Beneficial Interest (Continued)
| | | | | | | | | | | | | | | | | | | | |
| | | Year Ended December 31, 2013 | | | | | Year Ended December 31, 2012 | | | |
| | | Shares | | | Amount | | | | | Shares | | | Amount | | | |
Non-Service Shares | | | | | | | | | | | | | | | | | | | | |
Sold | | | 4,307 | | | $ | 45,267 | | | | | | 5,406 | | | $ | 47,076 | | | |
Dividends and/or distributions reinvested | | | 247 | | | | 2,605 | | | | | | 219 | | | | 1,809 | | | |
Redeemed | | | (1,926 | ) | | | (21,064 | ) | | | | | (1,790 | ) | | | (15,043 | ) | | |
| | | |
Net increase | | | 2,628 | | | $ | 26,808 | | | | | | 3,835 | | | $ | 33,842 | | | |
| | | |
| | | | | | | | | | | | | | | | | | | | |
Service Shares | | | | | | | | | | | | | | | | | | | | |
Sold | | | 274,115 | | | $ | 3,450,352 | | | | | | 50,121 | | | $ | 518,469 | | | |
Dividends and/or distributions reinvested | | | 7,299 | | | | 91,168 | | | | | | 8,159 | | | | 81,182 | | | |
Redeemed | | | (129,769 | ) | | | (1,612,948 | ) | | | | | (132,292 | ) | | | (1,366,027 | ) | | |
| | | |
Net increase (decrease) | | | 151,645 | | | $ | 1,928,572 | | | | | | (74,012 | ) | | $ | (766,376 | ) | | |
| | | |
4. Purchases and Sales of Securities
The aggregate cost of purchases and proceeds from sales of securities, other than short-term obligations and investments in IMMF, for the year ended December 31, 2013 were as follows:
| | | | | | | | | | |
| | | Purchases | | | | | Sales | |
Investment securities | | $ | 15,664,202 | | | | | $ | 13,642,125 | |
5. Fees and Other Transactions with Affiliates
Management Fees. Under the investment advisory agreement, the Fund pays the Manager a management fee based on the daily net assets of the Fund at an annual rate as shown in the following table:
��
| | | | |
| Fee Schedule | | | |
Up to $200 million | | | 0.75% | |
Next $200 million | | | 0.72 | |
Next $200 million | | | 0.69 | |
Next $200 million | | | 0.66 | |
Over $800 million | | | 0.60 | |
Sub-Adviser Fees. The Manager has retained the Sub-Adviser to provide the day-to-day portfolio management of the Fund. Under the Sub-Advisory Agreement, the Manager pays the Sub-Adviser an annual fee in monthly installments, equal to a percentage of the investment management fee collected by the Manager from the Fund, which shall be calculated after any investment management fee waivers. The fee paid to the Sub-Adviser is paid by the Manager, not by the Fund.
Transfer Agent Fees. OFI Global (the “Transfer Agent”) serves as the transfer and shareholder servicing agent for the Fund. Fees incurred by the Fund with respect to these services are detailed in the Statement of Operations.
Sub-Transfer Agent Fees. The Transfer Agent has retained Shareholder Services, Inc., a wholly-owned subsidiary of OFI (the “Sub-Transfer Agent”), to provide the day-to-day transfer agent and shareholder servicing of the Fund. Under the Sub-Transfer Agency Agreement, the Transfer Agent pays the Sub-Transfer Agent an annual fee in monthly installments, equal to a percentage of the transfer agent fee collected by the Transfer Agent from the Fund, which shall be calculated after any applicable fee waivers. The fee paid to the Sub-Transfer Agent is paid by the Transfer Agent, not by the Fund.
Distribution and Service Plan for Service Shares. The Fund has adopted a Distribution and Service Plan (the “Plan”) in accordance with Rule 12b-1 under the Investment Company Act of 1940 for Service shares to pay OppenheimerFunds Distributor, Inc. (the “Distributor”), for distribution related services, personal service and account maintenance for the Fund’s Service shares. Under the Plan, payments are made periodically at an annual rate of 0.25% of the daily net assets of Service shares of the Fund. The Distributor currently uses all of those fees to compensate sponsors of the insurance product that offers Fund shares, for providing personal service and maintenance of accounts of their variable contract owners that hold Service shares. These fees are paid out of the Fund’s assets on an on-going basis and increase operating expenses of the Service shares, which results in lower performance compared to the Fund’s shares that are not subject to a service fee. Fees incurred by the Fund under the Plan are detailed in the Statement of Operations.
Waivers and Reimbursements of Expenses. The Manager has contractually agreed to limit the Fund’s expenses after payments, waivers and/or reimbursements and reduction to custodian expenses, excluding expenses incurred directly or indirectly by the Fund as a result of investments in other investment companies, wholly-owned subsidiaries and pooled investment vehicles; so that those expenses, as percentages of daily net assets, will not
19 OPPENHEIMER EQUITY INCOME FUND/VA
| | |
NOTES TO FINANCIAL STATEMENTS Continued |
5. Fees and Other Transactions with Affiliates (Continued)
exceed the annual rate of 0.80% for Non-Service shares and 1.05% for Service shares. During the year ended December 31, 2013, the Manager waived fees and/or reimbursed the Fund $1,621 and $70,957 for Non-Service and Service shares, respectively.
The Manager will waive fees and/or reimburse Fund expenses in an amount equal to the indirect management fees incurred through the Fund’s investment in IMMF. During the year ended December 31, 2013, the Manager waived fees and/or reimbursed the Fund $198 for IMMF management fees.
Some of these undertakings may be modified or terminated at any time; some may not be modified or terminated until after one year from the date of the current prospectus, as indicated therein.
6. Risk Exposures and the Use of Derivative Instruments
The Fund’s investment objectives not only permit the Fund to purchase investment securities, they also allow the Fund to enter into various types of derivatives contracts, including, but not limited to, futures contracts, forward currency exchange contracts, credit default swaps, interest rate swaps, total return swaps, variance swaps and purchased and written options. In doing so, the Fund will employ strategies in differing combinations to permit it to increase, decrease, or change the level or types of exposure to market risk factors. These instruments may allow the Fund to pursue its objectives more quickly and efficiently than if it were to make direct purchases or sales of securities capable of effecting a similar response to market factors. Such contracts may be entered into through a bilateral over-the-counter (“OTC”) transaction, or through a securities or futures exchange and cleared through a clearinghouse.
Market Risk Factors. In accordance with its investment objectives, the Fund may use derivatives to increase or decrease its exposure to one or more of the following market risk factors:
Commodity Risk. Commodity risk relates to the change in value of commodities or commodity indexes as they relate to increases or decreases in the commodities market. Commodities are physical assets that have tangible properties. Examples of these types of assets are crude oil, heating oil, metals, livestock, and agricultural products.
Credit Risk. Credit risk relates to the ability of the issuer to meet interest and principal payments, or both, as they come due. In general, lower-grade, higher-yield bonds are subject to credit risk to a greater extent than lower-yield, higher-quality bonds.
Equity Risk. Equity risk relates to the change in value of equity securities as they relate to increases or decreases in the general market.
Foreign Exchange Rate Risk. Foreign exchange rate risk relates to the change in the U.S. dollar value of a security held that is denominated in a foreign currency. The U.S. dollar value of a foreign currency denominated security will decrease as the dollar appreciates against the currency, while the U.S. dollar value will increase as the dollar depreciates against the currency.
Interest Rate Risk. Interest rate risk refers to the fluctuations in value of fixed-income securities resulting from the inverse relationship between price and yield. For example, an increase in general interest rates will tend to reduce the market value of already issued fixed-income investments, and a decline in general interest rates will tend to increase their value. In addition, debt securities with longer maturities, which tend to have higher yields, are subject to potentially greater fluctuations in value from changes in interest rates than obligations with shorter maturities.
Volatility Risk. Volatility risk refers to the magnitude of the movement, but not the direction of the movement, in a financial instrument’s price over a defined time period. Large increases or decreases in a financial instrument’s price over a relative time period typically indicate greater volatility risk, while small increases or decreases in its price typically indicate lower volatility risk.
Derivatives may have little or no initial cash investment relative to their market value exposure and therefore can produce significant gains or losses in excess of their cost due to unanticipated changes in the market risk factors and the overall market. This use of embedded leverage allows the Fund to increase its market value exposure relative to its net assets and can substantially increase the volatility of the Fund’s performance. In instances where the Fund is using derivatives to decrease, or hedge, exposures to market risk factors for securities held by the Fund, there are also risks that those derivatives may not perform as expected resulting in losses for the combined or hedged positions. Some derivatives have the potential for unlimited loss, regardless of the size of the Fund’s initial investment.
Additional associated risks from investing in derivatives also exist and potentially could have significant effects on the valuation of the derivative and the Fund. Typically, the associated risks are not the risks that the Fund is attempting to increase or decrease exposure to, per its investment objectives, but are the additional risks from investing in derivatives. Examples of these associated risks are liquidity risk, which is the risk that the Fund will not be able to sell the derivative in the open market in a timely manner, and counterparty credit risk, which is the risk that the counterparty will not fulfill its obligation to the Fund.
The Fund’s actual exposures to these market risk factors and associated risks during the period are discussed in further detail, by derivative type, below.
Option Activity
The Fund may buy and sell put and call options, or write put and call options. When an option is written, the Fund receives a premium and becomes obligated to sell or purchase the underlying security, currency or other underlying financial instrument at a fixed price, upon exercise of the option.
Options can be traded through an exchange or through a privately negotiated arrangement with a dealer in an OTC transaction. Options traded through an exchange are generally cleared through a clearinghouse (such as The Options Clearing Corporation). The difference between the premium received or paid, and market value of the option, is recorded as unrealized appreciation or depreciation. The net change in unrealized appreciation or
20 OPPENHEIMER EQUITY INCOME FUND/VA
6. Risk Exposures and the Use of Derivative Instruments (Continued)
depreciation is reported in the Statement of Operations. When an option is exercised, the cost of the security purchased or the proceeds of the security sale are adjusted by the amount of premium received or paid. Upon the expiration or closing of the option transaction, a gain or loss is reported in the Statement of Operations.
The Fund has purchased put options on individual equity securities and/or equity indexes to decrease exposure to equity risk. A purchased put option becomes more valuable as the price of the underlying financial instrument depreciates relative to the strike price.
During the year ended December 31, 2013, the Fund had an ending monthly average market value of $7 on purchased put options.
Options written, if any, are reported in a schedule following the Statement of Investments and as a liability in the Statement of Assets and Liabilities. Securities held in collateral accounts to cover potential obligations with respect to outstanding written options are noted in the Statement of Investments.
The risk in writing a call option is that the market price of the security increases and if the option is exercised, the Fund must either purchase the security at a higher price for delivery or, if the Fund owns the underlying security, give up the opportunity for profit. The risk in writing a put option is that the Fund may incur a loss if the market price of the security decreases and the option is exercised. The risk in buying an option is that the Fund pays a premium whether or not the option is exercised. The Fund also has the additional risk that there may be an illiquid market where the Fund is unable to close the contract.
The Fund has written put options on individual equity securities and/or equity indexes to increase exposure to equity risk. A written put option becomes more valuable as the price of the underlying financial instrument appreciates relative to the strike price.
The Fund has written call options on individual equity securities and/or equity indexes to decrease exposure to equity risk. A written call option becomes more valuable as the price of the underlying financial instrument depreciates relative to the strike price.
During the year ended December 31, 2013, the Fund had an ending monthly average market value of $729 and $1,292 on written call options and written put options, respectively.
Additional associated risks to the Fund include counterparty credit risk and liquidity risk.
Written option activity for the year ended December 31, 2013 was as follows:
| | | | | | | | | | | | | | | | |
| | | Call Options | | | Put Options | |
| | | Number of Contracts | | | Amount of Premiums | | | Number of Contracts | | | Amount of Premiums | |
Options outstanding as of December 31, 2012 | | | — | | | $ | — | | | | — | | | $ | — | |
Options written | | | 127 | | | | 9,302 | | | | 311 | | | | 24,962 | |
Options closed or expired | | | (78) | | | | (5,372) | | | | (166) | | | | (13,502) | |
Options exercised | | | (24) | | | | (1,186) | | | | (60) | | | | (4,861) | |
| | | | |
Options outstanding as of December 31, 2013 | | | 25 | | | $ | 2,744 | | | | 85 | | | $ | 6,599 | |
| | | | |
Counterparty Credit Risk. Derivative positions are subject to the risk that the counterparty will not fulfill its obligation to the Fund. The Fund intends to enter into derivative transactions with counterparties that the Manager believes to be creditworthy at the time of the transaction.
For financial reporting purposes, the Fund does not offset derivative assets and derivative liabilities that are subject to netting arrangements in the Statement of Assets and Liabilities. Bankruptcy or insolvency laws of a particular jurisdiction may impose restrictions on or prohibitions against the right of offset in bankruptcy, insolvency or other events.
The Fund’s risk of loss from counterparty credit risk on exchange-traded derivatives cleared through a clearinghouse and for cleared swaps is generally considered lower than as compared to OTC derivatives. However, counterparty credit risk exists with respect to initial and variation margin deposited/paid by the Fund that is held in futures commission merchant, broker and/or clearinghouse accounts for such exchange-traded derivatives and for cleared swaps.
With respect to cleared swaps, such transactions will be submitted for clearing, and if cleared, will be held in accounts at futures commission merchants or brokers that are members of clearinghouses. While brokers, futures commission merchants and clearinghouses are required to segregate customer margin from their own assets, in the event that a broker, futures commission merchant or clearinghouse becomes insolvent or goes into bankruptcy and at that time there is a shortfall in the aggregate amount of margin held by the broker, futures commission merchant or clearinghouse for all its customers, U.S. bankruptcy laws will typically allocate that shortfall on a pro-rata basis across all the broker’s, futures commission merchant’s or clearinghouse’s customers, potentially resulting in losses to the Fund.
There is the risk that a broker, futures commission merchant or clearinghouse will decline to clear a transaction on the Fund’s behalf, and the Fund may be required to pay a termination fee to the executing broker with whom the Fund initially enters into the transaction. Clearinghouses may also be permitted to terminate cleared swaps at any time. The Fund is also subject to the risk that the broker or futures commission merchant will improperly use the Fund’s assets deposited/paid as initial or variation margin to satisfy payment obligations of another customer. In the event of a default by another customer of the broker or futures commission merchant, the Fund might not receive its variation margin payments from the clearinghouse, due to the manner in which variation margin payments are aggregated for all customers of the broker/futures commission merchant.
Collateral and margin requirements differ by type of derivative. Margin requirements are established by the broker, futures commission merchant or clearinghouse for exchange-traded and cleared derivatives, including cleared swaps. Brokers, futures commission merchants and clearinghouses can ask for margin in excess of the regulatory minimum, or increase the margin amount, in certain circumstances.
For financial reporting purposes, cash collateral that has been pledged to cover obligations of the Fund, if any, is reported separately on the Statement of Assets and Liabilities as cash pledged as collateral. Non-cash collateral pledged by the Fund, if any, is noted in the Statement of Investments.
21 OPPENHEIMER EQUITY INCOME FUND/VA
| | |
NOTES TO FINANCIAL STATEMENTS Continued |
6. Risk Exposures and the Use of Derivative Instruments (Continued)
Generally, the amount of collateral due from or to a party must exceed a minimum transfer amount threshold (e.g. $250,000) before a transfer has to be made. To the extent amounts due to the Fund from its counterparties are not fully collateralized, contractually or otherwise, the Fund bears the risk of loss from counterparty nonperformance.
The following table presents the valuations of derivative instruments by risk exposure as reported within the Statement of Assets and Liabilities as of December 31, 2013:
| | | | | | |
| | | Liability Derivatives | |
| Derivatives Not Accounted for as Hedging Instruments | | Statement of Assets and Liabilities Location | | Value | |
Equity contracts | | Options written, at value | | $ | 4,615 | |
The effect of derivative instruments on the Statement of Operations is as follows:
| | | | |
| Amount of Realized Gain or (Loss) Recognized on Derivatives | |
| Derivatives Not Accounted for as Hedging Instruments | | Closing and expiration of option contracts written | |
Equity contracts | | $ | 18,875 | |
| | | | |
| Amount of Change in Unrealized Gain or (Loss) Recognized on Derivatives | |
| Derivatives Not Accounted for as Hedging Instruments | | Option contracts written | |
Equity contracts | | $ | 4,728 | |
7. Pending Litigation
Since 2009, seven class action lawsuits have been pending in the U.S. District Court for the District of Colorado against OppenheimerFunds, Inc. (“OFI”), OppenheimerFunds Distributor, Inc., the Fund’s principal underwriter and distributor (the “Distributor”), and certain funds (but not including the Fund) advised by OFI Global Asset Management, Inc. and distributed by the Distributor (the “Defendant Funds”). The lawsuits also name as defendants certain officers and current and former trustees of the respective Defendant Funds. The lawsuits raise claims under federal securities law and allege, among other things, that the disclosure documents of the respective Defendant Funds contained misrepresentations and omissions and that the respective Defendant Funds’ investment policies were not followed. The plaintiffs in these actions seek unspecified damages, equitable relief and awards of attorneys’ fees and litigation expenses. The Defendant Funds’ Boards of Trustees have also engaged counsel to represent the Funds and the present and former Independent Trustees named in those suits. On August 26, 2013, the parties in six of these lawsuits executed a memorandum of understanding setting forth the terms of proposed settlements of those actions. The proposed settlements are subject to a variety of contingencies, including the execution of settlement agreements, which will require preliminary and final approval by the court. The proposed settlements do not resolve a seventh outstanding lawsuit relating to Oppenheimer California Municipal Fund.
Other class action and individual lawsuits have been filed since 2008 in various state and federal courts against OFI and certain of its affiliates by investors seeking to recover investments they allegedly lost as a result of the “Ponzi” scheme run by Bernard L. Madoff and his firm, Bernard L. Madoff Investment Securities, LLC (“BLMIS”). Plaintiffs in these suits allege that they suffered losses as a result of their investments in several funds managed by an affiliate of OFI and assert a variety of claims, including breach of fiduciary duty, fraud, negligent misrepresentation, unjust enrichment, and violation of federal and state securities laws and regulations, among others. They seek unspecified damages, equitable relief and awards of attorneys’ fees and litigation expenses. Neither the Distributor, nor any of the Oppenheimer mutual funds, their independent trustees or directors are named as defendants in these lawsuits. None of the Oppenheimer mutual funds invested in any funds or accounts managed by Madoff or BLMIS. On February 28, 2011, a stipulation of partial settlement of three groups of consolidated putative class action lawsuits relating to these matters was filed in the U.S. District Court for the Southern District of New York. On August 19, 2011, the court entered an order and final judgment approving the settlement as fair, reasonable and adequate. In September 2011, certain parties filed notices of appeal from the court’s order approving the settlement. The settlement does not resolve other outstanding lawsuits against OFI and its affiliates relating to BLMIS.
On April 16, 2010, a lawsuit was filed in New York state court against (i) OFI, (ii) an affiliate of OFI and (iii) AAArdvark IV Funding Limited (“AAArdvark IV”), an entity advised by OFI’s affiliate, in connection with investments made by the plaintiffs in AAArdvark IV. Plaintiffs allege breach of contract and common law fraud claims against the defendants and seek compensatory damages, costs and disbursements, including attorney fees. On April 11, 2013, the court granted defendants’ motion for summary judgment, dismissing plaintiffs’ fraud claim with prejudice and dismissing their contract claim without prejudice, and granted plaintiffs leave to replead their contract claim to assert a cause of action for specific performance within 30 days. On May 9, 2013, plaintiffs filed a notice of appeal from the court’s dismissal order. On January 7, 2014, the appellate court affirmed the trial court’s dismissal order. On July 15, 2011, a lawsuit was filed in New York state court against OFI, an affiliate of OFI and AAArdvark Funding Limited (“AAArdvark I”), an entity advised by OFI’s affiliate, in connection with investments made by the plaintiffs in AAArdvark I. The complaint alleges breach of contract and common law fraud claims against the defendants and seeks compensatory damages, costs and disbursements, including attorney fees. On November 9, 2011, a lawsuit was filed in New York state court against OFI, an affiliate of OFI and AAArdvark XS Funding Limited (“AAArdvark XS”), an entity advised by OFI’s affiliate, in connection with investments made by the plaintiffs in AAArdvark XS. The complaint alleged breach of contract against the defendants and sought compensatory damages, costs and disbursements, including attorney fees. On November 8, 2013, the parties filed a stipulation of discontinuance dismissing the lawsuit with prejudice.
22 OPPENHEIMER EQUITY INCOME FUND/VA
7. Pending Litigation (Continued)
OFI believes the lawsuits and appeals described above are without legal merit and, with the exception of actions it has settled, is defending against them vigorously. While it is premature to render any opinion as to the outcome in these lawsuits, or whether any costs that the Defendant Funds may bear in defending the suits might not be reimbursed by insurance, OFI believes that these suits should not impair the ability of OFI or the Distributor to perform their respective duties to the Fund, and that the outcome of all of the suits together should not have any material effect on the operations of any of the Oppenheimer mutual funds.
23 OPPENHEIMER EQUITY INCOME FUND/VA
| | |
REPORT OF INDEPENDENT REGISTERED PUBLIC ACCOUNTING FIRM |
The Board of Trustees and Shareholders of Oppenheimer Variable Account Funds:
We have audited the accompanying statement of assets and liabilities of Oppenheimer Equity Income Fund/VA formerly, Oppenheimer Value Fund/VA (a separate series of Oppenheimer Variable Account Funds), including the statement of investments, as of December 31, 2013, and the related statement of operations for the year then ended, the statements of changes in net assets for each of the years in the two-year period then ended, and the financial highlights for each of the years in the five-year period then ended. These financial statements and financial highlights are the responsibility of the Fund’s management. Our responsibility is to express an opinion on these financial statements and financial highlights based on our audits.
We conducted our audits in accordance with the standards of the Public Company Accounting Oversight Board (United States). Those standards require that we plan and perform the audit to obtain reasonable assurance about whether the financial statements and financial highlights are free of material misstatement. An audit includes examining, on a test basis, evidence supporting the amounts and disclosures in the financial statements. Our procedures included confirmation of securities owned as of December 31, 2013, by correspondence with the custodian and transfer agent. An audit also includes assessing the accounting principles used and significant estimates made by management, as well as evaluating the overall financial statement presentation. We believe that our audits provide a reasonable basis for our opinion.
In our opinion, the financial statements and financial highlights referred to above present fairly, in all material respects, the financial position of Oppenheimer Equity Income Fund/VA as of December 31, 2013, the results of its operations for the year then ended, the changes in its net assets for each of the years in the two-year period then ended, and the financial highlights for each of the years in the five-year period then ended, in conformity with U.S. generally accepted accounting principles.
KPMGLLP
Denver, Colorado
February 14, 2014
24 OPPENHEIMER EQUITY INCOME FUND/VA
| | |
FEDERAL INCOME TAX INFORMATION Unaudited |
In early 2014, if applicable, shareholders of record received information regarding all dividends and distributions paid to them by the Fund during calendar year 2013.
Dividends, if any, paid by the Fund during the fiscal year ended December 31, 2013 which are not designated as capital gain distributions should be multiplied by the maximum amount allowable but not less than 100% to arrive at the amount eligible for the corporate dividend-received deduction.
The foregoing information is presented to assist shareholders in reporting distributions received from the Fund to the Internal Revenue Service. Because of the complexity of the federal regulations which may affect your individual tax return and the many variations in state and local tax regulations, we recommend that you consult your tax advisor for specific guidance.
25 OPPENHEIMER EQUITY INCOME FUND/VA
| | |
BOARD APPROVAL OF THE FUND’S INVESTMENT ADVISORY AND SUB-ADIVSORY AGREEMENTS Unaudited |
The Fund has entered into an investment advisory agreement with OFI Global Asset Management, Inc. (“OFI Global” or the “Adviser”), a wholly-owned subsidiary of OppenheimerFunds, Inc. (“OFI” or the “Sub-Adviser”) (“OFI Global” and “OFI” together the “Managers”) and OFI Global has entered into a sub-advisory agreement with OFI whereby OFI provides investment sub-advisory services to the Fund (collectively, the “Agreements”). Each year, the Board of Trustees (the “Board”), including a majority of the independent Trustees, is required to determine whether to renew the Agreements. The Investment Company Act of 1940, as amended, requires that the Board request and evaluate, and that the Managers provide, such information as may be reasonably necessary to evaluate the terms of the Agreements. The Board employs an independent consultant to prepare a report that provides information, including comparative information that the Board requests for that purpose. In addition to in-person meetings focused on this evaluation, the Board receives information throughout the year regarding Fund services, fees, expenses and performance.
The Adviser, Sub-Adviser and the independent consultant provided information to the Board on the following factors: (i) the nature, quality and extent of the Managers’ services, (ii) the investment performance of the Fund and the Managers, (iii) the fees and expenses of the Fund, including comparative expense information, (iv) the profitability of the Managers and their affiliates, including an analysis of the cost of providing services, (v) whether economies of scale are realized as the Fund grows and whether fee levels reflect these economies of scale for Fund investors and (vi) other benefits to the Managers from their relationship with the Fund. The Board was aware that there are alternatives to retaining the Managers.
Outlined below is a summary of the principal information considered by the Board as well as the Board’s conclusions.
Nature, Quality and Extent of Services. The Board considered information about the nature, quality and extent of the services provided to the Fund and information regarding the Managers’ key personnel who provide such services. The Sub-Adviser’s duties include providing the Fund with the services of the portfolio manager and the Sub-Adviser’s investment team, who provide research, analysis and other advisory services in regard to the Fund’s investments; securities trading services; oversight of third-party service providers; monitoring compliance with applicable Fund policies and procedures and adherence to the Fund’s investment restrictions; and risk management. The Managers are responsible for providing certain administrative services to the Fund as well. Those services include providing and supervising all administrative and clerical personnel who are necessary in order to provide effective corporate administration for the Fund; compiling and maintaining records with respect to the Fund’s operations; preparing and filing reports required by the Securities and Exchange Commission; preparing periodic reports regarding the operations of the Fund for its shareholders; preparing proxy materials for shareholder meetings; and preparing the registration statements required by Federal and state securities laws for the sale of the Fund’s shares. The Managers also provide the Fund with office space, facilities and equipment.
The Board also considered the quality of the services provided and the quality of the Managers’ resources that are available to the Fund. The Board took account of the fact that the Sub-Adviser has had over fifty years of experience as an investment adviser and that its assets under management rank it among the top mutual fund managers in the United States. The Board evaluated the Sub-Adviser’s advisory, administrative, accounting, legal, compliance services and risk management, and information the Board has received regarding the experience and professional qualifications of the Managers’ key personnel and the size and functions of its staff. In its evaluation of the quality of the portfolio management services provided, the Board considered the experience of Michael Levine, the portfolio manager for the Fund, and the Sub-Adviser’s investment team and analysts. The Board members also considered the totality of their experiences with the Managers as directors or trustees of the Fund and other funds advised by the Managers. The Board considered information regarding the quality of services provided by affiliates of the Managers, which its members have become knowledgeable about in connection with the renewal of the Fund’s service agreements. The Board concluded, in light of the Managers’ experience, reputation, personnel, operations and resources that the Fund benefits from the services provided under the Agreement.
Investment Performance of the Fund, the Adviser and the Sub-Adviser. Throughout the year, the Manager provided information on the investment performance of the Fund, including comparative performance information. The Board also reviewed information, prepared by the Manager and by the independent consultant, comparing the Fund’s historical performance to relevant market indices and to the performance of other large value funds underlying variable insurance products. The Board considered that the Fund performed in line with its performance category median during the one- and three-year periods and outperformed its performance category median during the five-year period.
Costs of Services by the Adviser. The Board reviewed the fees paid to the Manager and the other expenses borne by the Fund. The independent consultant provided comparative data in regard to the fees and expenses of the Fund and other large value funds underlying variable insurance products. In reviewing the fees and expenses charged to the VA funds, the Board considered the Manager’s assertion that, because there is much greater disparity in the fees and services that may be provided by a manager to a VA fund as opposed to a retail fund, when comparing the expenses of the various VA funds to those of retail funds, it is most appropriate to focus on total expenses (rather than on the management fees). Accordingly, while the Board reviewed and considered all expenses, it focused on total expenses. The Board considered that the Fund’s total expenses, after waivers, were lower than its peer group median and higher than its category median. The Board also considered that the Fund’s contractual management fee was higher than its respective peer group median and category median. Within the total asset range of $0 to $50 million, the Fund’s effective rate was higher than its peer group median and category median. The Board further noted that the Manager has contractually agreed to limit the Fund’s total annual operating expenses so that those expenses, as percentages of daily net assets, will not exceed the annual rate of 0.80% for Non-Service Shares and 1.05% for Service Shares. This contractual expense limitation may not be amended or withdrawn until one year after the date of the Fund’s prospectus, unless approved by the Board.
Economies of Scale and Profits Realized by the Adviser and Sub-Adviser. The Board considered information regarding the Managers’ costs in serving as the Fund’s investment adviser and sub-adviser, including the costs associated with the personnel and systems necessary to manage the Fund, and information regarding the Managers’ profitability from their relationship with the Fund. The Board reviewed whether the Managers may realize economies of scale in managing and supporting the Fund. The Board noted that the Fund currently has management fee breakpoints, which are intended to share with Fund shareholders economies of scale that may exist as the Fund’s assets grow.
Other Benefits to the Managers. In addition to considering the profits realized by the Managers, the Board considered information that was provided regarding the direct and indirect benefits the Managers receive as a result of their relationship with the Fund, including compensation paid to the Managers’ affiliates and research provided to the Adviser in connection with permissible brokerage arrangements (soft dollar arrangements). The
26 OPPENHEIMER EQUITY INCOME FUND/VA
Board also considered that the Managers must be able to pay and retain experienced professional personnel at competitive rates to provide quality services to the Fund.
Conclusions. These factors were also considered by the independent Trustees meeting separately from the full Board, assisted by experienced counsel to the Fund and to the independent Trustees. Fund counsel and the independent Trustees’ counsel are independent of the Managers within the meaning and intent of the Securities and Exchange Commission Rules.
Based on its review of the information it received and its evaluations described above, the Board, including a majority of the independent Trustees, decided to continue the Agreements through August 31, 2014. In arriving at its decision, the Board did not identify any factor or factors as being more important than others, but considered all of the above information, and considered the terms and conditions of the Agreements, including the management fees, in light of all the surrounding circumstances.
27 OPPENHEIMER EQUITY INCOME FUND/VA
| | |
PORTFOLIO PROXY VOTING POLICIES AND PROCEDURES; UPDATES TO STATEMENTS OF INVESTMENTS Unaudited |
The Fund has adopted Portfolio Proxy Voting Policies and Procedures under which the Fund votes proxies relating to securities (“portfolio proxies”) held by the Fund. A description of the Fund’s Portfolio Proxy Voting Policies and Procedures is available (i) without charge, upon request, by calling the Fund toll-free at 1.800.CALL OPP (225.5677), (ii) on the Fund’s website at oppenheimerfunds.com, and (iii) on the SEC’s website at www.sec.gov. In addition, the Fund is required to file Form N-PX, with its complete proxy voting record for the 12 months ended June 30th, no later than August 31st of each year. The Fund’s voting record is available (i) without charge, upon request, by calling the Fund toll-free at 1.800.CALL OPP (225.5677), and (ii) in the Form N-PX filing on the SEC’s website at www.sec.gov.
The Fund files its complete schedule of portfolio holdings with the SEC for the first quarter and the third quarter of each fiscal year on Form N-Q. The Fund’s Form N-Q filings are available on the SEC’s website at www.sec.gov. Those forms may be reviewed and copied at the SEC’s Public Reference Room in Washington, D.C. Information on the operation of the Public Reference Room may be obtained by calling 1-800-SEC-0330.
28 OPPENHEIMER EQUITY INCOME FUND/VA
| | |
TRUSTEES AND OFFICERS Unaudited |
| | |
Name, Position(s) Held with the Fund, Length of
Service, Year of Birth | | Principal Occupation(s) During the Past 5 Years; Other Trusteeships/Directorships Held; Number of Portfolios in the Fund Complex Currently Overseen |
| |
INDEPENDENT TRUSTEES | | The address of each Trustee in the chart below is 6803 S. Tucson Way, Centennial, Colorado 80112-3924. Each Trustee serves for an indefinite term, or until his or her resignation, retirement, death or removal. |
| |
Sam Freedman, Chairman of the Board of Trustees (since 2013) and Trustee (since 2002) Year of Birth: 1940 | | Director of Colorado UpLIFT (charitable organization) (since September 1984). Mr. Freedman held several positions with the Sub-Adviser and with subsidiary or affiliated companies of the Sub-Adviser (until October 1994). Oversees 39 portfolios in the OppenheimerFunds complex. Mr. Freedman has served on the Boards of certain Oppenheimer funds since 1996, during which time he has become familiar with the Fund’s (and other Oppenheimer funds’) financial, accounting, regulatory and investment matters and has contributed to the Boards’ deliberations. |
| |
Edward L. Cameron, Trustee (since 2002) Year of Birth: 1938 | | Member of The Life Guard of Mount Vernon (George Washington historical site) (June 2000-June 2006); Partner of PricewaterhouseCoopers LLP (accounting firm) (July 1974-June 1999); Chairman of Price Waterhouse LLP Global Investment Management Industry Services Group (accounting firm) (July 1994-June 1998). Oversees 39 portfolios in the OppenheimerFunds complex. Mr. Cameron has served on the Boards of certain Oppenheimer funds since 1999, during which time he has become familiar with the Fund’s (and other Oppenheimer funds’) financial, accounting, regulatory and investment matters and has contributed to the Boards’ deliberations. |
| |
Jon S. Fossel, Trustee (since 2002) Year of Birth: 1942 | | Chairman of the Board (2006-December 2011) and Director (June 2002-December 2011) of UNUMProvident (insurance company); Director of Northwestern Energy Corp. (public utility corporation) (November 2004-December 2009); Director of P.R. Pharmaceuticals (October 1999-October 2003); Director of Rocky Mountain Elk Foundation (non-profit organization) (February 1998-February 2003 and February 2005-February 2007); Chairman and Director (until October 1996) and President and Chief Executive Officer (until October 1995) of the Sub-Adviser; President, Chief Executive Officer and Director of the following: Oppenheimer Acquisition Corp. (“OAC”) (parent holding company of the Sub-Adviser), Shareholders Services, Inc. and Shareholder Financial Services, Inc. (until October 1995). Oversees 39 portfolios in the OppenheimerFunds complex. Mr. Fossel has served on the Boards of certain Oppenheimer funds since 1990, during which time he has become familiar with the Fund’s (and other Oppenheimer funds’) financial, accounting, regulatory and investment matters and has contributed to the Boards’ deliberations. |
| |
Richard F. Grabish, Trustee (since 2012) Year of Birth: 1948 | | Formerly Senior Vice President and Assistant Director of Sales and Marketing (March 1997-December 2007), Director (March 1987-December 2007) and Manager of Private Client Services (June 1985-June 2005) of A.G. Edwards & Sons, Inc. (broker/dealer and investment firm); Chairman and Chief Executive Officer of A.G. Edwards Trust Company, FSB (March 2001-December 2007); President and Vice Chairman of A.G. Edwards Trust Company, FSB (investment adviser) (April 1987-March 2001); President of A.G. Edwards Trust Company, FSB (investment adviser) (June 2005-December 2007). Oversees 39 portfolios in the OppenheimerFunds complex. Mr. Grabish has served on the Boards of certain Oppenheimer funds since 2001, during which time he has become familiar with the Fund’s (and other Oppenheimer funds’) financial, accounting, regulatory and investment matters and has contributed to the Boards’ deliberations. |
| |
Beverly L. Hamilton, Trustee (since 2002) Year of Birth: 1946 | | Trustee of Monterey Institute for International Studies (educational organization) (since February 2000); Board Member of Middlebury College (educational organization) (December 2005-June 2011); Chairman (since 2010) of American Funds’ Emerging Markets Growth Fund, Inc. (mutual fund); Director of The California Endowment (philanthropic organization) (April 2002-April 2008); Director (February 2002-2005) and Chairman of Trustees (2006-2007) of the Community Hospital of Monterey Peninsula; Director (October 1991-2005); Vice Chairman (2006-2009) of American Funds’ Emerging Markets Growth Fund, Inc. (mutual fund); President of ARCO Investment Management Company (February 1991-April 2000); Member of the investment committees of The Rockefeller Foundation (2001-2006) and The University of Michigan (since 2000); Advisor at Credit Suisse First Boston’s Sprout venture capital unit (venture capital fund) (1994-January 2005); Trustee of MassMutual Institutional Funds (investment company) (1996-June 2004); Trustee of MML Series Investment Fund (investment company) (April 1989-June 2004); Member of the investment committee of Hartford Hospital (2000-2003); and Advisor to Unilever (Holland) pension fund (2000-2003). Oversees 39 portfolios in the OppenheimerFunds complex. Ms. Hamilton has served on the Boards of certain Oppenheimer funds since 2002, during which time she has become familiar with the Fund’s (and other Oppenheimer funds’) financial, accounting, regulatory and investment matters and has contributed to the Boards’ deliberations. |
29 OPPENHEIMER EQUITY INCOME FUND/VA
| | |
TRUSTEES AND OFFICERS Unaudited / Continued |
| | |
| |
Victoria J. Herget, Trustee (since 2012) Year of Birth: 1951 | | Independent Director of the First American Funds (mutual fund family) (2003-2011); former Managing Director (1993-2001), Principal (1985-1993), Vice President (1978-1985) and Assistant Vice President (1973-1978) of Zurich Scudder Investments (and its predecessor firms); Board Chair (2008-Present) and Director (2004-Present), United Educators (insurance company); Trustee (1992-2007), Chair of the Board of Trustees (1999-2007), Investment Committee Chair (1994-1999) and Investment Committee member (2007-2010) of Wellesley College; Trustee (since 2000) and Chair (since 2010), Newberry Library; Trustee, Mather LifeWays (since 2001); Trustee, BoardSource (2006-2009) and Chicago City Day School (1994-2005). Oversees 39 portfolios in the OppenheimerFunds complex. Ms. Herget has served on the Boards of certain Oppenheimer funds since 2012, during which time she has become familiar with the Fund’s (and other Oppenheimer funds’) financial, accounting, regulatory and investment matters and has contributed to the Boards’ deliberations. |
| |
Robert J. Malone, Trustee (since 2002) Year of Birth: 1944 | | Chairman of the Board (since 2012) and Director (since August 2005) of Jones International University (educational organization) (since August 2005); Chairman, Chief Executive Officer and Director of Steele Street Bank Trust (commercial banking) (since August 2003); Trustee of the Gallagher Family Foundation (non-profit organization) (since 2000); Board of Directors of Opera Colorado Foundation (non-profit organization) (2008-2012); Director of Colorado UpLIFT (charitable organization) (1986-2010); Director of Jones Knowledge, Inc. (2006-2010); Former Chairman of U.S. Bank-Colorado (subsidiary of U.S. Bancorp and formerly Colorado National Bank) (July 1996-April 1999); Director of Commercial Assets, Inc. (real estate investment trust) (1993-2000); Director of U.S. Exploration, Inc. (oil and gas exploration) (1997-February 2004); Chairman of the Board (1991-1994) and Trustee (1985-1994) of Regis University; and Chairman of the Board (1990-1991 and Trustee (1984-1999) of Young Presidents Organization. Oversees 39 portfolios in the OppenheimerFunds complex. Mr. Malone has served on the Boards of certain Oppenheimer funds since 2002, during which time he has become familiar with the Fund’s (and other Oppenheimer funds’) financial, accounting, regulatory and investment matters and has contributed to the Boards’ deliberations. |
| |
F. William Marshall, Jr., Trustee (since 2002) Year of Birth: 1942 | | Trustee Emeritus of Worcester Polytech Institute (WPI) (private university) (since 2009); Trustee of MassMutual Select Funds (formerly MassMutual Institutional Funds) (investment company) (since 1996), MML Series Investment Fund (investment company) (since 1996) and Mass Mutual Premier Funds (investment company) (since January 2012); President and Treasurer of the SIS Fund (private charitable fund) (January 1999-March 2011); Former Trustee of WPI (1985-2008); Former Chairman of the Board (2004-2006) and Former Chairman of the Investment Committee of WPI (1994-2008); Chairman of SIS & Family Bank, F.S.B. (formerly SIS Bank) (commercial bank) (January 1999-July 1999); Executive Vice President of Peoples Heritage Financial Group, Inc. (commercial bank) (January 1999-July 1999); and Former President and Chief Executive Officer of SIS Bancorp. (1993-1999). Oversees 43 portfolios in the OppenheimerFunds complex. Mr. Marshall has served on the Boards of certain Oppenheimer funds since 2000, during which time he has become familiar with the Fund’s (and other Oppenheimer funds’) financial, accounting, regulatory and investment matters and has contributed to the Boards’ deliberations. |
| |
Karen L. Stuckey, Trustee (since 2012) Year of Birth: 1953 | | Partner (1990-2012) of PricewaterhouseCoopers LLP (held various positions 1975-1990); Emeritus Trustee (since 2006), Trustee (1992-2006) and member of Executive, Nominating and Audit Committees and Chair of Finance Committee of Lehigh University; and member, Women’s Investment Management Forum since inception. Oversees 39 portfolios in the OppenheimerFunds complex. Ms. Stuckey has served on the Boards of certain Oppenheimer funds since 2012, during which time she has become familiar with the Fund’s (and other Oppenheimer funds’) financial, accounting, regulatory and investment matters and has contributed to the Boards’ deliberations. |
| |
James D. Vaughn, Trustee (since 2012) Year of Birth: 1945 | | Retired; former managing partner (1994-2001) of Denver office of Deloitte & Touche LLP, (held various positions 1969-1993); Trustee and Chairman of the Audit Committee of Schroder Funds (2003-2012); Board member and Chairman of Audit Committee of AMG National Trust Bank (since 2005); Trustee and Investment Committee member, University of South Dakota Foundation (since 1996); Board member, Audit Committee Member and past Board Chair, Junior Achievement (since 1993); former Board member, Mile High United Way, Boys and Girls Clubs, Boy Scouts, Colorado Business Committee for the Arts, Economic Club of Colorado and Metro Denver Network. Oversees 39 portfolios in the OppenheimerFunds complex. Mr. Vaughn has served on the Boards of certain Oppenheimer funds since 2012, during which time he has become familiar with the Fund’s (and other Oppenheimer funds’) financial, accounting, regulatory and investment matters and has contributed to the Boards’ deliberations. |
30 OPPENHEIMER EQUITY INCOME FUND/VA
| | |
| | |
INTERESTED TRUSTEE AND OFFICER | | Mr. Glavin is an “Interested Trustee” because he is affiliated with the Manager and the Sub-Adviser by virtue of his positions as an officer and director of the Manager and a director of the Sub-Adviser, and as a shareholder of the Sub-Adviser’s parent company. Both as a Trustee and as an officer, he serves for an indefinite term, or until his resignation, retirement, death or removal. Mr. Glavin’s address is Two World Financial Center, 225 Liberty Street, 11th Floor, New York, New York 10281-1008. |
| |
William F. Glavin, Jr., Trustee, President and Principal Executive Officer (since 2009) Year of Birth: 1958 | | Director, Chairman and Chief Executive Officer of the Manager (since January 2013); President of the Manager (January 2013-May 2013); Chairman of the Sub-Adviser (December 2009-December 2012); Chief Executive Officer (January 2009-December 2012) and Director of the Sub-Adviser (since January 2009); President of the Sub-Adviser (May 2009-December 2012); Management Director (since June 2009), President (since December 2009) and Chief Executive Officer (since January 2011) of Oppenheimer Acquisition Corp. (“OAC”) (the Sub-Adviser’s parent holding company); Director of Oppenheimer Real Asset Management, Inc. (since March 2010); Executive Vice President (March 2006-February 2009) and Chief Operating Officer (July 2007-February 2009) of Massachusetts Mutual Life Insurance Company (OAC’s parent company); Director (May 2004-March 2006) and Chief Operating Officer and Chief Compliance Officer (May 2004-January 2005), President (January 2005-March 2006) and Chief Executive Officer (June 2005-March 2006) of Babson Capital Management LLC; Director (March 2005-March 2006), President (May 2003-March 2006) and Chief Compliance Officer (July 2005-March 2006) of Babson Capital Securities, Inc. (a broker-dealer); President (May 2003-March 2006) of Babson Investment Company, Inc.; Director (May 2004-August 2006) of Babson Capital Europe Limited; Director (May 2004-October 2006) of Babson Capital Guernsey Limited; Director (May 2004-March 2006) of Babson Capital Management LLC; Non-Executive Director (March 2005-March 2007) of Baring Asset Management Limited; Director (February 2005-June 2006) Baring Pension Trustees Limited; Director and Treasurer (December 2003-November 2006) of Charter Oak Capital Management, Inc.; Director (May 2006-September 2006) of C.M. Benefit Insurance Company; Director (May 2008-June 2009) and Executive Vice President (June 2007-July 2009) of C.M. Life Insurance Company; President (March 2006-May 2007) of MassMutual Assignment Company; Director (January 2005-December 2006), Deputy Chairman (March 2005-December 2006) and President (February 2005-March 2005) of MassMutual Holdings (Bermuda) Limited; Director (May 2008-June 2009) and Executive Vice President (June 2007-July 2009) of MML Bay State Life Insurance Company; Chief Executive Officer and President (April 2007-January 2009) of MML Distributors, LLC; and Chairman (March 2006-December 2008) and Chief Executive Officer (May 2007-December 2008) of MML Investors Services, Inc. An officer of 90 portfolios in the OppenheimerFunds complex. |
| | |
OTHER OFFICERS OF THE FUND | | The addresses of the Officers in the chart below are as follows: for Messrs. Levine, Gabinet and Ms. Nasta, Two World Financial Center, 225 Liberty Street, New York, New York 10281-1008, for Messrs. Vandehey and Wixted, 6803 S. Tucson Way, Centennial, Colorado 80112-3924. Each Officer serves for an indefinite term or until his or her resignation, retirement, death or removal. |
| |
Michael S. Levine, Vice President (since 2013) Year of Birth: 1965 | | Vice President of the Sub-Adviser (since June 1998) and Senior Portfolio Manager of the Sub-Adviser (since September 2000). A portfolio manager and an officer of other portfolios in the OppenheimerFunds complex. |
| |
Arthur S. Gabinet, Secretary and Chief Legal Officer (since 2011) Year of Birth: 1958 | | Executive Vice President, Secretary and General Counsel of the Manager (since January 2013); General Counsel OFI SteelPath, Inc. (since January 2013); Executive Vice President (May 2010-December 2012) and General Counsel (since January 2011) of the Sub-Adviser; General Counsel of the Distributor (since January 2011); General Counsel of Centennial Asset Management Corporation (January 2011-December 2012); Executive Vice President (January 2011-December 2012) and General Counsel of HarbourView Asset Management Corporation (since January 2011); Assistant Secretary (since January 2011) and Director (since January 2011) of OppenheimerFunds International Ltd. And OppenheimerFunds plc; Director of Oppenheimer Real Asset Management, Inc. (January 2011-December 2012) and General Counsel (since January 2011); Executive Vice President (January 2011-December 2011) and General Counsel of Shareholder Financial Services, Inc. and Shareholder Services, Inc. (since January 2011); Executive Vice President (January 2011-December 2012) and General Counsel of OFI Private Investments Inc. (since January 2011); Vice President of OppenheimerFunds Legacy Program (January 2011-December 2011); Executive Vice President (January 2011-December 2012) and General Counsel of OFI Institutional Asset Management, Inc. (since January 2011); General Counsel, Asset Management of the Sub-Adviser (May 2010-December 2010); Principal, The Vanguard Group (November 2005-April 2010); District Administrator, U.S. Securities and Exchange Commission (January 2003-October 2005). An officer of 90 portfolios in the OppenheimerFunds complex. |
31 OPPENHEIMER EQUITY INCOME FUND/VA
| | |
TRUSTEES AND OFFICERS Unaudited / Continued |
| | |
| |
Christina M. Nasta, Vice President and Chief Business Officer (since 2011) Year of Birth: 1973 | | Senior Vice President of OppenheimerFunds Distributor, Inc. (since January 2013); Senior Vice President of the Sub-Adviser (July 2010-December 2012); Vice President of the Sub-Adviser (January 2003-July 2010); Vice President of OppenheimerFunds Distributor, Inc. (January 2003-July 2010). An officer of 90 portfolios in the OppenheimerFunds complex. |
| |
Mark S. Vandehey, Vice President and Chief Compliance Officer (since 2004) Year of Birth: 1950 | | Senior Vice President and Chief Compliance Officer of the Manager (since January 2013); Chief Compliance Officer of OFI SteelPath, Inc. (since January 2013); Senior Vice President of the Sub-Adviser (March 2004-December 2012); Chief Compliance Officer of the Sub-Adviser, OppenheimerFunds Distributor, Inc., OFI Trust Company, OFI Institutional Asset Management, Inc., Oppenheimer Real Asset Management, Inc., OFI Private Investments, Inc., Harborview Asset Management Corporation, Trinity Investment Management Corporation, and Shareholder Services, Inc. (since March 2004); Vice President of OppenheimerFunds Distributor, Inc., Centennial Asset Management Corporation and Shareholder Services, Inc. (June 1983-December 2012). An officer of 90 portfolios in the OppenheimerFunds complex. |
| |
Brian W. Wixted, Treasurer and Principal Financial & Accounting Officer (since 2002) Year of Birth: 1959 | | Senior Vice President of the Manager (since January 2013); Treasurer of the Sub-Adviser, HarbourView Asset Management Corporation, Shareholder Financial Services, Inc., Shareholder Services, Inc., and Oppenheimer Real Asset Management, Inc. (March 1999-June 2008), OFI Private Investments, Inc. (March 2000-June 2008), OppenheimerFunds International Ltd. and OppenheimerFunds plc (since May 2000), OFI Institutional Asset Management, Inc. (November 2000-June 2008), and OppenheimerFunds Legacy Program (charitable trust program established by the Sub-Adviser) (June 2003-December 2011); Treasurer and Chief Financial Officer of OFI Trust Company (since May 2000); Assistant Treasurer of Oppenheimer Acquisition Corporation (March 1999-June 2008). An officer of 90 portfolios in the OppenheimerFunds complex. |
The Fund’s Statement of Additional Information contains additional information about the Fund’s Trustees and Officers and is available without charge, upon request, by calling 1.800.988.8287.
32 OPPENHEIMER EQUITY INCOME FUND/VA
| | |
OPPENHEIMER EQUITY INCOME FUND/VA |
| A Series of Oppenheimer Variable Account Funds |
| |
| Manager | | OFI Global Asset Management, Inc. |
| |
| Sub-Adviser | | OppenheimerFunds, Inc. |
| |
| Distributor | | OppenheimerFunds Distributor, Inc. |
| |
Transfer and Shareholder Servicing Agent | | OFI Global Asset Management, Inc. |
| |
| Sub-Transfer Agent | | Shareholder Services, Inc. DBA OppenheimerFunds Services |
| |
Independent Registered
Public Accounting
Firm | | KPMG LLP |
| |
| Counsel | | K&L Gates LLP |
| |
| | Before investing, investors should carefully consider a fund’s investment objectives, risks, charges and expenses. Fund prospectuses and summary prospectuses contain this and other information about the funds, and may be obtained by asking your financial advisor, or calling us at 1.800.988.8287. Read prospectuses and summary prospectuses carefully before investing. |
| |
| | © 2014 OppenheimerFunds, Inc. All rights reserved. Oppenheimer funds are distributed by OppenheimerFunds Distributor, Inc. |
| | | | |
| December 31, 2013 | | |
| | | Oppenheimer Diversified Alternatives Fund/VA A Series of Oppenheimer Variable Account Funds | | Annual Report |
| | |
| | ANNUAL REPORT Listing of Top Holdings Fund Performance Discussion Financial Statements | | |

|
Portfolio Managers: Mark Hamilton, David Wharmby, CFA and Brian Watson, CFA |
Cumulative Total Returns
For the Period Ended 12/31/13
| | |
| | | Since
Inception
(11/14/13) |
Non-Service Shares | | -0.69% |
Service Shares | | -0.72% |
Performance data quoted represents past performance, which does not guarantee future results. The investment return and principal value of an investment in the Fund will fluctuate so that an investor’s shares, when redeemed, may be worth more or less than their original cost. Current performance may be lower or higher than the performance quoted. For performance data current to the most recent month end, call us at 1.800.988.8287. The Fund’s total returns should not be expected to be the same as the returns of other funds, whether or not both funds have the same portfolio managers and/or similar names. The Fund’s total returns include changes in share price and reinvested distributions but do not include the charges associated with the separate account products that offer this Fund. Such performance would have been lower if such charges were taken into account. Returns for periods of less than one year are cumulative and not annualized.
| | | | |
TOP TEN COMMON STOCK HOLDINGS | | | | |
Simon Property Group, Inc. | | | 1.2 | % |
Mitsui Fudosan Co. Ltd. | | | 1.1 | |
Energy Transfer Equity LP | | | 1.0 | |
Freeport-McMoRan Copper & Gold, Inc. | | | 1.0 | |
Sunoco Logistics Partners LP | | | 1.0 | |
Access Midstream Partners LP | | | 1.0 | |
Enterprise Products Partners LP | | | 0.9 | |
Buckeye Partners LP | | | 0.9 | |
Genesis Energy LP | | | 0.9 | |
Regency Energy Partners LP | | | 0.9 | |
Portfolio holdings and allocations are subject to change. Percentages are as of December 31, 2013, and are based on net assets. For more current Fund holdings, please visit oppenheimerfunds.com.
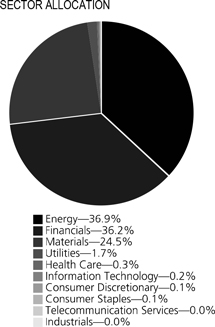
Portfolio holdings and allocations are subject to change. Percentages are as of December 31, 2013, and are based on the total market value of common stocks.
2 OPPENHEIMER DIVERSIFIED ALTERNATIVES FUND/VA
| | |
Fund Performance Discussion |
From the Fund’s inception on November 14, 2013, through December 31, 2013, its Non-Service shares produced a return of -0.69%. In comparison, the Barclays U.S. Aggregate Bond Index returned -0.27% over the same period. The Fund is intended as a solution for diversified exposure to alternative asset classes, including master limited partnerships (MLPs), foreign currencies, real estate, gold and special minerals, and commodities, among others.
MARKET OVERVIEW
Accommodative monetary policies on the part of central banks in the U.S., Europe and Japan, combined with an improving economic outlook, resulted in a rally among risk equities and higher-yielding bonds over the first four months of 2013. At the same time, yields of U.S. government securities remained near historical lows due to the Federal Reserve’s (the “Fed’s”) massive bond buying program. These developments drove financial markets higher through the early spring of 2013. At that time, economic data appeared to confirm that the United States, Europe and Japan had engineered a sustained economic rebound, but investors responded negatively to disappointing economic data from China, India, Brazil, and other emerging markets. The ensuing “flight to quality” toward traditional safe havens produced sharp dislocations in emerging equity, fixed-income and currency markets. In late May, remarks by Fed chairman Ben Bernanke were widely interpreted as a signal that U.S. monetary policymakers would begin to back away from their quantitative easing program sooner than expected, sparking heightened volatility in financial markets throughout the world. However, market conditions generally stabilized over the summer of 2013. In October, the U.S. Congress managed to reach a bipartisan agreement to raise the national debt ceiling, and did so well ahead of the potential default deadline. While the Fed unexpectedly refrained from reducing its monthly bond purchases in September, in December the Central Bank announced that it would reduce its monthly bond purchases by $10 billion, from $85 billion to $75 billion, starting in January 2014. The Fed also announced that it would continue to hold short-term interest rates at very low levels until unemployment in the United States subsided below 6.5%. This was lower than its earlier 7% target.
FUND REVIEW
Since the Fund’s inception on November 14, 2013, the Fund’s investments in infrastructure master limited partnerships (“MLPs”) were the strongest contributers to Fund performance. Top performing stocks in this area included Energy Transfer Equity, L.P., Sunoco Logistics Partners L.P. and Access Midstream Partners, L.P. After a strong first half of the year, the MLP asset class essentially traded sideways (with some volatility) for the rest of 2013. The Fed’s taper talk in May initially put some pressure on MLPs, but the asset class fully recovered in a matter of weeks. We believe investor interest in distributions remains strong in a low-yield world and that MLPs are positioned to benefit from the infrastructure build-out necessary to bring both shale oil and gas to market.
The most significant detractors from performance in this short period included gold companies Randgold Resources Ltd., IAMGOLD Corp. and Goldcorp, Inc. While the precious metals sector has been under significant pressure in 2013, we believe that gold mining equities are currently inexpensive versus bullion on a historical basis.
STRATEGY & OUTLOOK
In our view, the key macro factors that help drive performance of these alternative asset classes remain firmly in place, including accommodative monetary policies in the U.S. and around the world, competitive currency debasement, near zero interest rates and geopolitical turmoil. At the same time, valuations for these assets classes are mixed. Investors now face a world of experimental monetary and fiscal policies, and we believe the potential unintended consequences of these policies could be greater than many appreciate. Furthermore, inflation as measured by the Consumer Price Index remains well behaved and below the Fed’s long-term target. Consequently, it is not surprising that we see minimal investor interest in hedging inflation today. Although volatility has been low for 2013, it can change abruptly, and with many of the major central banks either engaging in quantitative easing or otherwise unconventional monetary policies, we believe interest in hedging inflation could rise dramatically over time.
Investors should consider the Fund’s investment objective, risks, charges and expenses carefully before investing. The Fund’s prospectus and summary prospectus contain this and other information about the Fund, and may be obtained by asking your financial advisor or calling us at 1.800.988.8287. Read prospectuses and summary prospectuses carefully before investing.
Total returns include changes in share price and reinvestment of dividends and capital gains distributions in a hypothetical investment for the periods shown.
3 OPPENHEIMER DIVERSIFIED ALTERNATIVES FUND/VA
The Fund’s investment strategy and focus can change over time. The mention of specific fund holdings does not constitute a recommendation by OppenheimerFunds, Inc. or its affiliates.
Shares of Oppenheimer funds are not deposits or obligations of any bank, are not guaranteed by any bank, are not insured by the FDIC or any other agency, and involve investment risks, including the possible loss of the principal amount invested.
4 OPPENHEIMER DIVERSIFIED ALTERNATIVES FUND/VA
Fund Expenses. As a shareholder of the Fund, you incur two types of costs: (1) transaction costs and (2) ongoing costs, including management fees; distribution and service fees; and other Fund expenses. These examples are intended to help you understand your ongoing costs (in dollars) of investing in the Fund and to compare these costs with the ongoing costs of investing in other mutual funds.
The examples for Actual Expenses are based on an investment of $1,000.00 invested at the beginning of the period, November 14, 2013 (commencement of operations) and held for the period ended December 31, 2013.
The Hypothetical Examples for Comparison Purposes are based on an investment of $1,000.00 invested on July 1, 2013 and held for the entire 6-month period December 31, 2013.
Actual Expenses. The first section of the table provides information about actual account values and actual expenses. You may use the information in this section for the class of shares you hold, together with the amount you invested, to estimate the expense that you paid over the period. Simply divide your account value by $1,000.00 (for example, an $8,600.00 account value divided by $1,000.00 = 8.60), then multiply the result by the number in the first section under the heading entitled “Expenses Paid During Period” to estimate the expenses you paid on your account during this period.
Hypothetical Example for Comparison Purposes.
The second section of the table provides information about hypothetical account values and hypothetical expenses based on the Fund’s actual expense ratio for each class of shares, and an assumed rate of return of 5% per year for each class before expenses, which is not the actual return. The hypothetical account values and expenses may not be used to estimate the actual ending account balance or expenses you paid for the period. You may use this information to compare the ongoing costs of investing in the Fund and other funds. To do so, compare this 5% hypothetical example for the class of shares you hold with the 5% hypothetical examples that appear in the shareholder reports of the other funds.
Please note that the expenses shown in the table are meant to highlight your ongoing costs only and do not reflect any charges associated with the separate accounts that offer this Fund. Therefore, the “hypothetical” lines of the table are useful in comparing ongoing costs only, and will not help you determine the relative total costs of owning different funds. In addition, if these separate account charges were included your costs would have been higher.
| | | | | | | | | | | | | | |
| Actual | | Beginning
Account
Value | | | Ending
Account
Value
December 31, 2013 | | | Expenses
Paid During
the Period Ended
December 31, 20131,2 | | | |
Non-Service shares | | $ | 1,000.00 | | | $ | 993.10 | | | $ | 4.37 | | | |
Service shares | | | 1,000.00 | | | | 992.80 | | | | 4.60 | | | |
| | | | |
Hypothetical | | | | | | | | | | | | | | |
(5% return before expenses) | | | | | | | | | | | | | | |
Non-Service shares | | | 1,000.00 | | | | 1,008.42 | | | | 17.00 | | | |
Service shares | | | 1,000.00 | | | | 1,007.56 | | | | 17.87 | | | |
1. Actual expenses paid are equal to the Fund’s annualized expense ratio for that class, multiplied by the average account value over the period, multiplied by 48/365 to reflect the period from November 14, 2013 (commencement of operations) to December 31, 2013.
2. Hypothetical expenses paid are equal to the Fund’s annualized expense ratio for that class, multiplied by the average account value over the period, multiplied by 184/365 (to reflect the one-half year period).
The annualized expense ratios for the period from November 14, 2013 (commencement of operations) to December 31, 2013 are as follows:
| | | | | | |
| Class | | Expense Ratios |
Non-Service shares | | | 3.33 | % | | |
Service shares | | | 3.50 | | | |
The expense ratios reflect contractual waivers and/or reimbursements of expenses by the Fund’s Manager. Some of these undertakings may be modified or terminated at any time, unless approved by the Board of Trustees. The “Financial Highlights” tables in the Fund’s consolidated financial statements, included in this report, also show the gross expense ratios, without such waivers or reimbursements and reduction to custodian expenses, if applicable.
5 OPPENHEIMER DIVERSIFIED ALTERNATIVES FUND/VA
CONSOLIDATED STATEMENT OF INVESTMENTS December 31, 2013
| | | | | | | | | | |
| | | Shares | | | Value | | | |
Common Stocks—54.3% | | | | | | | | | | |
Consumer Discretionary—0.0% | | | | | | | | | | |
Diversified Consumer Services—0.0% | | | | | | | |
| Mac-Gray Corp. | | | 70 | | | $ | 1,486 | | | |
Media—0.0% | | | |
Harris Interactive, Inc.1 | | | 35 | | | | 70 | | | |
Textiles, Apparel & Luxury Goods—0.0% | | | |
Jones Group, Inc. (The) | | | 199 | | | | 2,977 | | | |
Consumer Staples—0.0% | | | |
Food & Staples Retailing—0.0% | | | |
Arden Group, Inc., Cl. A | | | 23 | | | | 2,910 | | | |
Energy—20.1% | | | |
Energy Equipment & Services—0.1% | | | |
Seadrill Partners LLC | | | 190 | | | | 5,890 | | | |
Oil, Gas & Consumable Fuels—20.0% | | | |
Access Midstream Partners LP | | | 1,690 | | | | 95,620 | | | |
Buckeye Partners LP | | | 1,320 | | | | 93,733 | | | |
DCP Midstream Partners LP | | | 1,810 | | | | 91,133 | | | |
EQT Midstream Partners LP | | | 1,450 | | | | 85,245 | | | |
El Paso Pipeline Partners LP | | | 2,130 | | | | 76,680 | | | |
Energy Transfer Equity LP | | | 1,250 | | | | 102,175 | | | |
Enterprise Products Partners LP | | | 1,420 | | | | 94,146 | | | |
Genesis Energy LP | | | 1,780 | | | | 93,575 | | | |
Holly Energy Partners LP2 | | | 2,860 | | | | 92,464 | | | |
Magellan Midstream Partners LP | | | 1,420 | | | | 89,843 | | | |
MarkWest Energy Partners LP | | | 1,270 | | | | 83,985 | | | |
ONEOK Partners LP | | | 1,660 | | | | 87,399 | | | |
Plains All American Pipeline LP | | | 1,690 | | | | 87,491 | | | |
Regency Energy Partners LP | | | 3,560 | | | | 93,486 | | | |
Spectra Energy Partners LP | | | 1,980 | | | | 89,793 | | | |
Sunoco Logistics Partners LP | | | 1,270 | | | | 95,860 | | | |
TC Pipelines LP | | | 1,830 | | | | 88,627 | | | |
Targa Resources Partners LP | | | 1,720 | | | | 89,956 | | | |
Tesoro Logistics LP | | | 1,620 | | | | 84,791 | | | |
TransMontaigne Partners LP | | | 2,000 | | | | 85,000 | | | |
Western Gas Partners LP | | | 1,440 | | | | 88,834 | | | |
Williams Partners LP | | | 1,730 | | | | 87,988 | | | |
| | | | | | | | 1,977,824 | | | |
Financials—20.0% | | | |
Commercial Banks—0.0% | | | |
Britton & Koontz Capital Corp.1 | | | 93 | | | | 1,483 | | | |
Great Florida Bank, Cl. A1 | | | 470 | | | | 1,480 | | | |
| | | | | | | | 2,963 | | | |
Insurance—0.0% | | | |
Eastern Insurance Holdings, Inc. | | | 61 | | | | 1,494 | | | |
Real Estate Investment Trusts (REITs)—14.6% | | | |
Acadia Realty Trust | | | 1,420 | | | | 35,259 | | | |
Alstria Office REIT AG | | | 1,994 | | | | 25,104 | | | |
Ascendas Real Estate Investment Trust | | | 8,000 | | | | 13,975 | | | |
Associated Estates Realty Corp. | | | 330 | | | | 5,296 | | | |
British Land Co. plc | | | 3,260 | | | | 33,979 | | | |
BRE Properties, Inc. | | | 749 | | | | 40,978 | | | |
Boston Properties, Inc. | | | 390 | | | | 39,144 | | | |
Canadian Real Estate Investment Trust | | | 352 | | | | 14,372 | | | |
CapitaMall Trust | | | 11,000 | | | | 16,637 | | | |
Chesapeake Lodging Trust | | | 1,190 | | | | 30,095 | | | |
Cousins Properties, Inc. | | | 940 | | | | 9,682 | | | |
DCT Industrial Trust, Inc. | | | 5,260 | | | | 37,504 | | | |
DDR Corp. | | | 590 | | | | 9,068 | | | |
Derwent London plc | | | 690 | | | | 28,566 | | | |
Douglas Emmett, Inc. | | | 1,470 | | | | 34,236 | | | |
Equity Residential | | | 560 | | | | 29,047 | | | |
Eurocommercial Properties NV | | | 371 | | | | 15,786 | | | |
Extra Space Storage, Inc. | | | 1,160 | | | | 48,871 | | | |
First Industrial Realty Trust, Inc. | | | 1,480 | | | | 25,826 | | | |
First Real Estate Investment Trust | | | 15,000 | | | | 12,613 | | | |
General Growth Properties, Inc. | | | 2,240 | | | | 44,957 | | | |
GLP J-Reit | | | 23 | | | | 22,493 | | | |
Goodman Group | | | 4,400 | | | | 18,635 | | | |
GPT Group | | | 6,400 | | | | 19,482 | | | |
| | | | | | | | |
| | | Shares | | | Value | |
Real Estate Investment Trusts (REITs) (Continued) | |
Great Portland Estates plc | | | 3,090 | | | $ | 30,748 | |
Hammerson plc | | | 2,750 | | | | 22,871 | |
Highwoods Properties, Inc. | | | 720 | | | | 26,042 | |
Host Hotels & Resorts, Inc. | | | 3,620 | | | | 70,373 | |
Kilroy Realty Corp. | | | 540 | | | | 27,097 | |
Kimco Realty Corp. | | | 1,620 | | | | 31,995 | |
Klepierre | | | 460 | | | | 21,320 | |
LaSalle Hotel Properties | | | 650 | | | | 20,059 | |
Land Securities Group plc | | | 1,930 | | | | 30,811 | |
Link REIT (The) | | | 2,500 | | | | 12,196 | |
Morguard Real Estate Investment Trust | | | 753 | | | | 11,661 | |
Nippon Prologis REIT, Inc. | | | 1 | | | | 9,561 | |
Post Properties, Inc. | | | 330 | | | | 14,926 | |
Prologis, Inc. | | | 730 | | | | 26,973 | |
Regency Centers Corp. | | | 550 | | | | 25,465 | |
Sabra Health Care REIT, Inc. | | | 440 | | | | 11,502 | |
Simon Property Group, Inc. | | | 780 | | | | 118,685 | |
STAG Industrial, Inc. | | | 835 | | | | 17,026 | |
Stockland | | | 8,300 | | | | 26,835 | |
Sunstone Hotel Investors, Inc. | | | 1,900 | | | | 25,460 | |
Tanger Factory Outlet Centers, Inc. | | | 570 | | | | 18,251 | |
Unibail-Rodamco SE | | | 280 | | | | 71,904 | |
Vastned Retail NV | | | 246 | | | | 11,184 | |
Vornado Realty Trust | | | 420 | | | | 37,292 | |
Weyerhaeuser Co. | | | 1,260 | | | | 39,778 | |
Westfield Group | | | 5,000 | | | | 45,065 | |
| | | | | | | | 1,416,685 | |
Real Estate Management & Development—5.4% | |
CapitaLand Ltd. | | | 12,000 | | | | 28,891 | |
Cheung Kong Holdings Ltd. | | | 2,000 | | | | 31,705 | |
Daiwa House Industry Co. Ltd. | | | 1,000 | | | | 19,360 | |
Global Logistic Properties Ltd. | | | 6,000 | | | | 13,767 | |
Hang Lung Properties Ltd. | | | 9,000 | | | | 28,709 | |
Helical Bar plc | | | 2,180 | | | | 11,791 | |
Hufvudstaden AB, Cl. A | | | 1,098 | | | | 14,729 | |
Keppel Land Ltd. | | | 6,000 | | | | 15,939 | |
Kerry Properties Ltd. | | | 5,500 | | | | 19,112 | |
Mitsubishi Estate Co. Ltd. | | | 2,000 | | | | 59,934 | |
Mitsui Fudosan Co. Ltd. | | | 3,000 | | | | 108,217 | |
Sino Land Co. Ltd. | | | 16,000 | | | | 21,913 | |
St. Modwen Properties plc | | | 1,820 | | | | 11,072 | |
Sumitomo Realty & Development Co. Ltd. | | | 1,000 | | | | 49,843 | |
Sun Hung Kai Properties Ltd. | | | 2,000 | | | | 25,495 | |
Tokyo Tatemono Co. Ltd. | | | 3,000 | | | | 33,419 | |
Wharf Holdings Ltd. | | | 5,000 | | | | 38,216 | |
| | | | | | | | 532,112 | |
Health Care—0.1% | | | | | | | | |
Health Care Equipment & Supplies—0.0% | | | | | | | | |
Given Imaging Ltd.1 | | | 50 | | | | 1,504 | |
Health Care Providers & Services—0.1% | | | | | | | | |
Capital Senior Living Corp.1 | | | 600 | | | | 14,394 | |
Pharmaceuticals—0.0% | | | | | | | | |
Hi-Tech Pharmacal Co., Inc.1 | | | 35 | | | | 1,519 | |
NuPathe, Inc.1 | | | 10 | | | | 33 | |
ViroPharma, Inc.1 | | | 30 | | | | 1,495 | |
| | | | | | | | 3,047 | |
Industrials—0.0% | | | | | | | | |
Commercial Services & Supplies—0.0% | | | | | | | | |
Innotrac Corp.1 | | | 187 | | | | 1,533 | |
Electrical Equipment—0.0% | | | | | | | | |
Coleman Cable, Inc. | | | 91 | | | | 2,386 | |
Machinery—0.0% | | | | | | | | |
Flow International Corp.1 | | | 372 | | | | 1,503 | |
Information Technology—0.0% | | | | | | | | |
Communications Equipment—0.0% | | | | | | | | |
Anaren, Inc.1 | | | 54 | | | | 1,511 | |
Performance Technologies, Inc.1 | | | 402 | | | | 1,501 | |
| | | | | | | 3,012 | |
6 OPPENHEIMER DIVERSIFIED ALTERNATIVES FUND/VA
| | | | | | | | | | |
| | | Shares | | | Value | | | |
Computers & Peripherals—0.0% | | | |
Xyratex Ltd. | | | 224 | | | $ | 2,977 | | | |
Electronic Equipment, Instruments, & Components—0.0% | | | |
Aeroflex Holding Corp.1 | | | 154 | | | | 1,001 | | | |
Internet Software & Services—0.0% | | | |
Responsys, Inc.1 | | | 17 | | | | 466 | | | |
IT Services—0.0% | | | |
Dynamics Research Corp.1 | | | 262 | | | | 3,008 | | | |
Semiconductors & Semiconductor Equipment—0.0% | | | |
LSI Corp. | | | 134 | | | | 1,477 | | | |
Software—0.0% | | | |
Trunkbow International Holdings Ltd.1 | | | 1,041 | | | | 1,374 | | | |
Materials—13.2% | | | |
Chemicals—0.0% | | | |
Zoltek Cos., Inc.1 | | | 90 | | | | 1,507 | | | |
Metals & Mining—13.2% | | | |
African Minerals Ltd.1 | | | 3,450 | | | | 11,401 | | | |
Agnico Eagle Mines Ltd. | | | 1,200 | | | | 31,656 | | | |
Alacer Gold Corp. | | | 3,321 | | | | 6,784 | | | |
Alamos Gold, Inc. | | | 3,198 | | | | 38,746 | | | |
Antofagasta plc | | | 600 | | | | 8,233 | | | |
Argonaut Gold, Inc.1 | | | 5,610 | | | | 28,096 | | | |
AuRico Gold, Inc. | | | 3,360 | | | | 12,298 | | | |
B2Gold Corp.1 | | | 11,292 | | | | 23,174 | | | |
Banro Corp.1 | | | 8,090 | | | | 4,498 | | | |
Barrick Gold Corp. | | | 4,330 | | | | 76,338 | | | |
Beadell Resources Ltd.1 | | | 15,000 | | | | 10,580 | | | |
Capstone Mining Corp.1 | | | 5,008 | | | | 14,144 | | | |
Centerra Gold, Inc. | | | 6,247 | | | | 25,406 | | | |
Coeur Mining, Inc.1 | | | 430 | | | | 4,665 | | | |
Compania de Minas Buenaventura SA, ADR | | | 1,310 | | | | 14,698 | | | |
Dominion Diamond Corp.1 | | | 240 | | | | 3,446 | | | |
Duluth Metals Ltd.1 | | | 8,465 | | | | 6,216 | | | |
Dundee Precious Metals, Inc.1 | | | 5,553 | | | | 16,049 | | | |
Eldorado Gold Corp.3 | | | 1,910 | | | | 10,868 | | | |
Eldorado Gold Corp.3 | | | 7,592 | | | | 43,097 | | | |
First Majestic Silver Corp.1 | | | 1,896 | | | | 18,616 | | | |
Franco-Nevada Corp. | | | 2,080 | | | | 84,739 | | | |
Freeport-McMoRan Copper & Gold, Inc.2 | | | 2,660 | | | | 100,388 | | | |
Glencore Xstrata plc1 | | | 2,100 | | | | 10,917 | | | |
Gold Standard Ventures Corp.1 | | | 2,610 | | | | 1,775 | | | |
Goldcorp, Inc. | | | 3,800 | | | | 82,346 | | | |
IAMGOLD Corp. | | | 5,510 | | | | 18,348 | | | |
Ivanhoe Mines Ltd.1 | | | 5,290 | | | | 9,313 | | | |
Kinross Gold Corp.3 | | | 3,254 | | | | 14,244 | | | |
Kinross Gold Corp.3 | | | 1,190 | | | | 5,212 | | | |
Nevsun Resources Ltd. | | | 4,290 | | | | 14,243 | | | |
New Gold, Inc.1,3 | | | 7,375 | | | | 38,602 | | | |
New Gold, Inc.1,3 | | | 470 | | | | 2,463 | | | |
Newmont Mining Corp. | | | 990 | | | | 22,800 | | | |
Orocobre Ltd.1 | | | 400 | | | | 889 | | | |
| | | | | | | | |
| | | Shares | | | Value | |
Metals & Mining (Continued) | |
Osisko Mining Corp.1 | | | 9,544 | | | $ | 42,318 | |
Primero Mining Corp.1 | | | 2,379 | | | | 10,481 | |
Randgold Resources Ltd., ADR | | | 1,330 | | | | 83,537 | |
Regis Resources Ltd. | | | 2,500 | | | | 6,543 | |
Rio Tinto plc, Sponsored ADR | | | 360 | | | | 20,315 | |
Romarco Minerals, Inc.1 | | | 32,675 | | | | 11,535 | |
Royal Gold, Inc. | | | 1,810 | | | | 83,387 | |
Sandstorm Gold Ltd.1 | | | 2,070 | | | | 8,839 | |
SEMAFO, Inc. | | | 17,075 | | | | 44,847 | |
Silver Wheaton Corp. | | | 2,910 | | | | 58,753 | |
Tahoe Resources, Inc.1 | | | 1,050 | | | | 17,472 | |
Teck Resources Ltd., Cl. B | | | 750 | | | | 19,507 | |
Vale SA, Sponsored ADR | | | 2,030 | | | | 30,957 | |
Yamana Gold, Inc. | | | 6,580 | | | | 56,720 | |
| | | | | | | | 1,310,499 | |
Telecommunication Services—0.0% | |
Diversified Telecommunication Services—0.0% | |
NTS, Inc.1 | | | 758 | | | | 1,493 | |
Utilities—0.9% | |
Electric Utilities—0.0% | |
UNS Energy Corp. | | | 24 | | | | 1,436 | |
Gas Utilities—0.9% | |
ONEOK, Inc. | | | 1,500 | | | | 93,270 | |
Total Common Stocks (Cost $5,439,353) | | | | 5,390,298 | |
| | |
| | | Principal
Amount | | | | |
U.S. Government Obligation—18.5% | | | | | |
U.S. Treasury Bills, 0.064%, 3/6/144 | | | | | | | | |
(Cost $1,834,796) | | $ | 1,835,000 | | | | 1,834,848 | |
| | |
| | | Shares | | | | |
Investment Companies—26.2% | | | | | |
Horizons BetaPro S&P/TSX 60 Inverse Exchange Traded Fund1 | | | 2,400 | | | | 20,560 | |
iShares Emerging Markets Corporate Bond Exchange Traded Fund | | | 1,524 | | | | 74,813 | |
iShares iBoxx $ High Yield Corporate Bond Exchange Traded Fund | | | 2,424 | | | | 225,141 | |
Oppenheimer Institutional Money Market Fund, Cl. E, 0.09%5,6 | | | 2,007,344 | | | | 2,007,344 | |
Oppenheimer Master Event-Linked Bond Fund, LLC5 | | | 10,967 | | | | 151,279 | |
Oppenheimer Master Loan Fund, LLC5 | | | 3,578 | | | | 50,958 | |
PowerShares Senior Loan Portfolio Exchange Traded Fund | | | 2,009 | | | | 49,984 | |
SPDR Gold Trust Exchange Traded Fund1 | | | 150 | | | | 17,425 | |
Total Investment Companies (Cost $2,599,367) | | | | 2,597,504 | |
| | | | | | | | | | | | | | | | | | | | | | | | |
| | | Counterparty | | | | | | Exercise Price | | | Expiration Date | | | Contracts | | | | |
Over-the-Counter Options Purchased—0.2% | | | | | | | | | | | | | |
CAD Currency Put1 | | | u-BOA | | | | CAD | | | | 1.060 | | | | 8/26/14CAD | | | | 63,600 | | | | 1,590 | |
CAD Currency Put1 | | | u-BOA | | | | MXN | | | | 11.750 | | | | 3/7/14CAD | | | | 90,000 | | | | 327 | |
EUR Currency Put1 | | | u-BOA | | | | PLN | | | | 4.190 | | | | 1/17/14EUR | | | | 90,000 | | | | 1,286 | |
EUR Currency Put1 | | | u-JPM | | | | PLN | | | | 4.200 | | | | 3/13/14EUR | | | | 175,000 | | | | 3,555 | |
INR Currency Call1 | | | GSG | | | | INR | | | | 63.000 | | | | 5/23/14INR | | | | 9,500,000 | | | | 3,524 | |
JPY Currency Put1 | | | CFI | | | | JPY | | | | 105.000 | | | | 3/18/14JPY | | | | 18,000,000 | | | | 3,294 | |
NZD Currency Put1 | | | GSG | | | | USD | | | | 0.820 | | | | 6/10/14NZD | | | | 115,000 | | | | 3,228 | |
NZD Currency Put1 | | | GSG | | | | USD | | | | 0.820 | | | | 6/10/14NZD | | | | 115,000 | | | | 3,228 | |
SGD Currency Put1 | | | u-BOA | | | | SGD | | | | 1.280 | | | | 8/27/14SGD | | | | 153,600 | | | | 1,624 | |
Total Over-the-Counter Options Purchased (Cost $19,216) | | | | | | | | | | | | | | | | | | | | 21,656 | |
Total Investments, at Value (Cost $9,892,732) | | | | | | | | | | | | | | | | 99.2% | | | | 9,844,306 | |
Assets in Excess of Other Liabilities | | | | | | | | | | | | | | | | | | | 0.8% | | | | 82,435 | |
Net Assets | | | | | | | | | | | | | | | | | | | 100.0% | | | $ | 9,926,741 | |
7 OPPENHEIMER DIVERSIFIED ALTERNATIVES FUND/VA
| | |
CONSOLIDATED STATEMENT OF INVESTMENTS Continued |
Footnotes to Consolidated Statement of Investments
1. Non-income producing security.
2. All or a portion of the security position is held in segregated accounts and pledged to cover margin requirements with respect to outstanding written options. The aggregate market value of such securities is $79,594. See Note 6 of the accompanying Consolidated Notes.
3. The Fund holds securities which have been issued by the same entity and that trade on separate exchanges.
4. Zero coupon bond reflects effective yield on the date of purchase.
5. Is or was an affiliate, as defined in the Investment Company Act of 1940, at or during the period ended December 31, 2013, by virtue of the Fund owning at least 5% of the voting securities of the issuer or as a result of the Fund and the issuer having the same investment adviser. Transactions during the period in which the issuer was an affiliate are as follows:
| | | | | | | | | | | | | | | | |
| | | Shares
November 14, 2013
(Commencement
of Operations) | | | Gross
Additions | | | Gross
Reductions | | | Shares
December 31, 2013 | |
Oppenheimer Institutional Money Market Fund, Cl. E | | | — | | | | 10,317,525 | | | | 8,310,181 | | | | 2,007,344 | |
Oppenheimer Master Event-Linked Bond Fund, LLC | | | — | | | | 10,967 | | | | — | | | | 10,967 | |
Oppenheimer Master Loan Fund, LLC | | | — | | | | 3,578 | | | | — | | | | 3,578 | |
| | | | |
| | | | | | Value | | | Income | | | Realized
Gain (Loss) | |
Oppenheimer Institutional Money Market Fund, Cl. E | | | | | | $ | 2,007,344 | | | $ | 236 | | | $ | — | |
Oppenheimer Master Event-Linked Bond Fund, LLC | | | | | | | 151,279 | | | | 1,353 | | | | 147 | |
Oppenheimer Master Loan Fund, LLC | | | | | | | 50,958 | | | | 1,290 | | | | (964 | ) |
| | | | | | $ | 2,209,581 | | | $ | 2,879 | | | $ | (817 | ) |
6. Rate shown is the 7-day yield as of December 31, 2013.
| | | | | | | | | | | | | | | | | | | | | | | | |
Forward Currency Exchange Contracts as of December 31, 2013 | |
| Counterparty | | Settlement Month(s) | | | Currency Purchased (000’s) | | | Currency Sold (000’s) | | | Unrealized
Appreciation | | | Unrealized
Depreciation | |
BAC | | | 01/2014 | | | EUR | | | 65 | | | USD | | | 88 | | | $ | 1,373 | | | $ | – | |
BAC | | | 02/2014 | | | HUF | | | 6,800 | | | USD | | | 31 | | | | 551 | | | | – | |
BAC | | | 02/2014 | | | PLN | | | 210 | | | USD | | | 67 | | | | 1,798 | | | | – | |
BNP | | | 02/2014 | | | AUD | | | 52 | | | USD | | | 48 | | | | – | | | | 1,767 | |
BNP | | | 02/2014 | | | CAD | | | 50 | | | USD | | | 48 | | | | – | | | | 492 | |
BNP | | | 02/2014 | | | CHF | | | 45 | | | USD | | | 49 | | | | 1,400 | | | | – | |
BNP | | | 02/2014 | | | CZK | | | 980 | | | USD | | | 49 | | | | 802 | | | | – | |
BNP | | | 01/2014 - 02/2014 | | | EUR | | | 70 | | | USD | | | 94 | | | | 2,165 | | | | – | |
BNP | | | 02/2014 | | | GBP | | | 30 | | | USD | | | 48 | | | | 1,487 | | | | – | |
BNP | | | 02/2014 | | | HKD | | | 380 | | | USD | | | 49 | | | | – | | | | 20 | |
BNP | | | 02/2014 | | | HUF | | | 10,700 | | | USD | | | 48 | | | | 1,404 | | | | – | |
BNP | | | 02/2014 | | | JPY | | | 5,000 | | | USD | | | 50 | | | | – | | | | 2,518 | |
BNP | | | 02/2014 | | | MXN | | | 640 | | | USD | | | 49 | | | | 230 | | | | – | |
BNP | | | 02/2014 | | | NOK | | | 300 | | | USD | | | 48 | | | | 1,082 | | | | – | |
BNP | | | 02/2014 | | | NZD | | | 60 | | | USD | | | 50 | | | | – | | | | 305 | |
BNP | | | 02/2014 | | | PLN | | | 150 | | | USD | | | 48 | | | | 1,665 | | | | – | |
BNP | | | 02/2014 | | | SEK | | | 320 | | | USD | | | 48 | | | | 1,867 | | | | – | |
BNP | | | 02/2014 | | | SGD | | | 60 | | | USD | | | 48 | | | | – | | | | 531 | |
BNP | | | 02/2014 | | | TRY | | | 100 | | | USD | | | 48 | | | | – | | | | 1,929 | |
BNP | | | 01/2014 | | | USD | | | 30 | | | CAD | | | 32 | | | | 314 | | | | – | |
BNP | | | 01/2014 | | | USD | | | 161 | | | GBP | | | 100 | | | | – | | | | 4,957 | |
BNP | | | 01/2014 | | | USD | | | 63 | | | TRY | | | 130 | | | | 2,499 | | | | – | |
BNP | | | 02/2014 | | | ZAR | | | 500 | | | USD | | | 48 | | | | – | | | | 417 | |
BOA | | | 01/2014 | | | KRW | | | 31,000 | | | USD | | | 29 | | | | 162 | | | | – | |
BOA | | | 03/2014 | | | MXN | | | 1,160 | | | USD | | | 89 | | | | – | | | | 610 | |
BOA | | | 01/2014 | | | USD | | | 118 | | | CAD | | | 125 | | | | 579 | | | | – | |
CITNA-B | | | 01/2014 | | | BRL | | | 265 | | | USD | | | 111 | | | | 1,399 | | | | – | |
CITNA-B | | | 01/2014 | | | USD | | | 5 | | | CAD | | | 5 | | | | – | | | | 21 | |
CITNA-B | | | 01/2014 - 02/2014 | | | USD | | | 60 | | | CHF | | | 53 | | | | 106 | | | | 13 | |
CITNA-B | | | 01/2014 | | | USD | | | 27 | | | EUR | | | 20 | | | | – | | | | 422 | |
CITNA-B | | | 01/2014 | | | USD | | | 8 | | | GBP | | | 5 | | | | – | | | | 107 | |
CITNA-B | | | 02/2014 | | | USD | | | 2 | | | HKD | | | 15 | | | | – | | | | – | |
CITNA-B | | | 01/2014 - 02/2014 | | | USD | | | 12 | | | JPY | | | 1,200 | | | | 318 | | | | – | |
CITNA-B | | | 02/2014 | | | USD | | | 2 | | | MXN | | | 20 | | | | 6 | | | | – | |
CITNA-B | | | 02/2014 | | | USD | | | 2 | | | NZD | | | 2 | | | | – | | | | 5 | |
CITNA-B | | | 02/2014 | | | USD | | | 2 | | | PLN | | | 5 | | | | – | | | | 24 | |
CITNA-B | | | 02/2014 | | | USD | | | 2 | | | SEK | | | 10 | | | | – | | | | 23 | |
GSCO-OT | | | 01/2014 | | | USD | | | 70 | | | CHF | | | 62 | | | | 23 | | | | – | |
JPM | | | 01/2014 - 02/2014 | | | BRL | | | 520 | | | USD | | | 219 | | | | 1,835 | | | | 942 | |
JPM | | | 01/2014 - 02/2014 | | | CLP | | | 82,200 | | | USD | | | 156 | | | | 714 | | | | 482 | |
JPM | | | 02/2014 | | | CNH | | | 295 | | | USD | | | 48 | | | | 292 | | | | – | |
JPM | | | 02/2014 | | | COP | | | 93,500 | | | USD | | | 48 | | | | 260 | | | | – | |
JPM | | | 02/2014 | | | EUR | | | 35 | | | USD | | | 47 | | | | 788 | | | | – | |
8 OPPENHEIMER DIVERSIFIED ALTERNATIVES FUND/VA
| | | | | | | | | | | | | | | | | | | | | | | | |
Forward Currency Exchange Contracts Continued | |
| Counterparty | | Settlement Month(s) | | | Currency Purchased (000’s) | | | Currency Sold (000’s) | | | Unrealized
Appreciation | | | Unrealized
Depreciation | |
JPM | | | 02/2014 | | | IDR | | | 558,600 | | | USD | | | 48 | | | $ | – | | | $ | 2,597 | |
JPM | | | 02/2014 | | | ILS | | | 170 | | | USD | | | 48 | | | | 781 | | | | – | |
JPM | | | 01/2014 - 02/2014 | | | INR | | | 4,000 | | | USD | | | 62 | | | | 2,218 | | | | – | |
JPM | | | 02/2014 | | | KRW | | | 52,000 | | | USD | | | 48 | | | | 758 | | | | – | |
JPM | | | 02/2014 | | | MYR | | | 155 | | | USD | | | 48 | | | | – | | | | 941 | |
JPM | | | 02/2014 | | | PEN | | | 140 | | | USD | | | 50 | | | | 96 | | | | – | |
JPM | | | 02/2014 | | | PHP | | | 2,000 | | | USD | | | 46 | | | | – | | | | 727 | |
JPM | | | 01/2014 - 02/2014 | | | RUB | | | 4,600 | | | USD | | | 139 | | | | 314 | | | | 191 | |
JPM | | | 02/2014 | | | THB | | | 1,500 | | | USD | | | 47 | | | | – | | | | 1,638 | |
JPM | | | 01/2014 - 02/2014 | | | TWD | | | 3,300 | | | USD | | | 112 | | | | – | | | | 1,263 | |
JPM | | | 01/2014 - 02/2014 | | | USD | | | 340 | | | BRL | | | 805 | | | | 1,475 | | | | 2,615 | |
JPM | | | 01/2014 | | | USD | | | 165 | | | CLP | | | 87,300 | | | | 440 | | | | 995 | |
JPM | | | 01/2014 - 02/2014 | | | USD | | | 47 | | | COP | | | 90,700 | | | | – | | | | 324 | |
JPM | | | 02/2014 | | | USD | | | 2 | | | CZK | | | 40 | | | | – | | | | 24 | |
JPM | | | 02/2014 | | | USD | | | 2 | | | GBP | | | 1 | | | | – | | | | 20 | |
JPM | | | 01/2014 | | | USD | | | 16 | | | INR | | | 1,000 | | | | – | | | | 366 | |
JPM | | | 01/2014 | | | USD | | | 15 | | | MXN | | | 200 | | | | 115 | | | | – | |
JPM | | | 02/2014 | | | USD | | | 2 | | | NOK | | | 10 | | | | – | | | | 30 | |
JPM | | | 02/2014 | | | USD | | | 46 | | | NZD | | | 55 | | | | 532 | | | | – | |
JPM | | | 01/2014 | | | USD | | | 90 | | | RUB | | | 3,000 | | | | – | | | | 287 | |
JPM | | | 01/2014 | | | USD | | | 16 | | | ZAR | | | 170 | | | | 242 | | | | – | |
RBS | | | 02/2014 | | | USD | | | 59 | | | CZK | | | 1,200 | | | | – | | | | 1,141 | |
Total Unrealized Appreciation and Depreciation | | | | | | | | | $ | 32,090 | | | $ | 28,744 | |
| | | | | | | | | | | | | | | | | | | | |
Futures Contracts as of December 31, 2013 | |
| Description | | Exchange | | | Buy/Sell | | | Expiration Date | | | Number of Contracts | | | Unrealized Appreciation (Depreciation) | |
CAC 40 10 Index | | | PAR | | | | Sell | | | | 1/17/14 | | | | 2 | | | $ | (5,984 | ) |
CBOE Volatility Index | | | CBOE | | | | Sell | | | | 3/17/14 | | | | 1 | | | | (102 | ) |
Coffee “C” | | | NYB | | | | Buy | | | | 3/19/14 | | | | 1 | | | | 1,798 | |
Copper | | | CMX | | | | Buy | | | | 3/27/14 | | | | 1 | | | | 5,598 | |
Corn | | | CBT | | | | Buy | | | | 3/14/14 | | | | 4 | | | | (2,910 | ) |
Cotton No. 2 | | | NYB | | | | Buy | | | | 3/07/14 | | | | 1 | | | | 3,593 | |
FTSE 100 Index | | | LIF | | | | Sell | | | | 3/21/14 | | | | 1 | | | | (4,232 | ) |
Gold (100 oz.) | | | CMX | | | | Buy | | | | 4/28/14 | | | | 1 | | | | (8,602 | ) |
Hard Red Winter Wheat | | | KC | | | | Buy | | | | 3/14/14 | | | | 1 | | | | (3,227 | ) |
Lean Hogs | | | CME | | | | Buy | | | | 2/14/14 | | | | 1 | | | | (1,733 | ) |
Live Cattle | | | CME | | | | Buy | | | | 2/28/14 | | | | 1 | | | | 47 | |
London Metal Exchange Aluminum | | | LME | | | | Buy | | | | 3/17/14 | | | | 1 | | | | (388 | ) |
London Metal Exchange Lead | | | LME | | | | Buy | | | | 3/17/14 | | | | 1 | | | | 2,975 | |
London Metal Exchange Zinc | | | LME | | | | Buy | | | | 3/17/14 | | | | 1 | | | | 4,031 | |
Natural Gas | | | NYM | | | | Buy | | | | 2/26/14 | | | | 4 | | | | 21,712 | |
New York Harbor ULSD | | | NYM | | | | Buy | | | | 2/28/14 | | | | 1 | | | | 5,093 | |
Platinum | | | NYM | | | | Buy | | | | 4/28/14 | | | | 1 | | | | 553 | |
S&P 500 E-Mini Index | | | CME | | | | Buy | | | | 3/21/14 | | | | 2 | | | | 6,075 | |
Soybean Meal | | | CBT | | | | Buy | | | | 3/14/14 | | | | 1 | | | | 948 | |
Soybean Oil | | | CBT | | | | Buy | | | | 3/14/14 | | | | 2 | | | | (3,209 | ) |
Soybeans | | | CBT | | | | Buy | | | | 3/14/14 | | | | 1 | | | | (202 | ) |
Sugar #11 World | | | NYB | | | | Buy | | | | 2/28/14 | | | | 3 | | | | (4,173 | ) |
U.S. Treasury Long Bonds | | | CBT | | | | Sell | | | | 3/20/14 | | | | 1 | | | | 2,202 | |
Wheat | | | CBT | | | | Buy | | | | 3/14/14 | | | | 2 | | | | (5,080 | ) |
WTI Crude Oil | | | NYM | | | | Buy | | | | 2/20/14 | | | | 2 | | | | 4,796 | |
| | | | | | | | | | | | | | | | | | $ | 19,579 | |
9 OPPENHEIMER DIVERSIFIED ALTERNATIVES FUND/VA
| | |
CONSOLIDATED STATEMENT OF INVESTMENTS Continued |
| | | | | | | | | | | | | | | | | | | | | | | | | | |
Exchange-Traded Options Written at December 31, 2013 | |
| Description | | Exercise Price | | | Expiration Date | | | Number of Contracts | | | Premiums Received | | | Value | |
Alamos Gold, Inc. Call | | | CAD | | | | 17.000 | | | | 1/18/14 | | | CAD | | | (2) | | | $ | 34 | | | $ | (4) | |
Caterpillar, Inc. Put | | | USD | | | | 75.000 | | | | 2/22/14 | | | USD | | | (1) | | | | 90 | | | | (16) | |
Eastman Chemical Co. Put | | | USD | | | | 67.500 | | | | 3/22/14 | | | USD | | | (1) | | | | 127 | | | | (55) | |
First Quantum Minerals Ltd. Put | | | CAD | | | | 18.000 | | | | 4/19/14 | | | CAD | | | (2) | | | | 261 | | | | (170) | |
First Quantum Minerals Ltd. Put | | | CAD | | | | 17.000 | | | | 7/19/14 | | | CAD | | | (2) | | | | 307 | | | | (203) | |
Franco-Nevada Corp. Call | | | USD | | | | 55.000 | | | | 1/18/14 | | | USD | | | (2) | | | | 48 | | | | (12) | |
Franco-Nevada Corp. Call | | | USD | | | | 50.000 | | | | 1/18/14 | | | USD | | | (1) | | | | 69 | | | | (5) | |
Franco-Nevada Corp. Put | | | USD | | | | 40.000 | | | | 4/19/14 | | | USD | | | (2) | | | | 494 | | | | (615) | |
Freeport-McMoRan Copper & Gold, Inc. Call | | | USD | | | | 32.000 | | | | 1/18/14 | | | USD | | | (1) | | | | 452 | | | | (576) | |
Goldcorp, Inc. Put | | | USD | | | | 24.000 | | | | 1/18/14 | | | USD | | | (1) | | | | 127 | | | | (249) | |
Royal Gold, Inc. Put | | | USD | | | | 40.000 | | | | 1/18/14 | | | USD | | | (1) | | | | 54 | | | | (9) | |
Sociedad Quimica y Minera de Chile, ADR Put | | | USD | | | | 22.500 | | | | 7/19/14 | | | USD | | | (2) | | | | 334 | | | | (270) | |
Teck Resources Ltd. Put | | | USD | | | | 25.000 | | | | 2/22/14 | | | USD | | | (14) | | | | 2,004 | | | | (1,190) | |
U.S. Silica Holdings, Inc. Put | | | USD | | | | 25.000 | | | | 3/22/14 | | | USD | | | (2) | | | | 224 | | | | (90) | |
Total of Exchange-Traded Options Written | | | | | | $ | 4,625 | | | $ | (3,464) | |
| | | | | | | | | | | | | | | | | | | | | | | | | | | | | | | | |
Over-the-Counter Options Written at December 31, 2013 | |
| Description | | Counterparty | | | Exercise Price | | | Expiration Date | | | Number of Contracts | | | Premiums Received | | | Value | |
CAD Currency Put | | | u-BOA | | | | CAD | | | | 1.135 | | | | 8/26/14 | | | | CAD | | | | (68,100) | | | $ | 413 | | | $ | (435) | |
EUR Currency Put | | | u-BOA | | | | PLN | | | | 4.060 | | | | 1/17/14 | | | | EUR | | | | (90,000) | | | | 124 | | | | (13) | |
EUR Currency Put | | | u-JPM | | | | PLN | | | | 4.130 | | | | 3/13/14 | | | | EUR | | | | (175,000) | | | | 1,035 | | | | (1,251) | |
INR Currency Put | | | GSG | | | | INR | | | | 67.000 | | | | 5/23/14 | | | | INR | | | | (10,000,000) | | | | 3,885 | | | | (2,530) | |
INR Currency Call | | | GSG | | | | INR | | | | 60.000 | | | | 5/23/14 | | | | INR | | | | (9,000,000) | | | | 645 | | | | (1,035) | |
JPY Currency Put | | | CFI | | | | JPY | | | | 108.000 | | | | 3/18/14 | | | | JPY | | | | (19,000,000) | | | | 1,108 | | | | (1,368) | |
NZD Currency Call | | | GSG | | | | USD | | | | 0.850 | | | | 6/10/14 | | | | NZD | | | | (115,000) | | | | 1,470 | | | | (1,050) | |
NZD Currency Put | | | GSG | | | | USD | | | | 0.780 | | | | 6/10/14 | | | | NZD | | | | (115,000) | | | | 1,485 | | | | (1,482) | |
NZD Currency Put | | | GSG | | | | USD | | | | 0.780 | | | | 6/10/14 | | | | NZD | | | | (115,000) | | | | 1,763 | | | | (1,482) | |
NZD Currency Call | | | GSG | | | | USD | | | | 0.850 | | | | 6/10/14 | | | | NZD | | | | (115,000) | | | | 1,302 | | | | (1,050) | |
SGD Currency Put | | | u-BOA | | | | SGD | | | | 1.350 | | | | 8/27/14 | | | | SGD | | | | (162,000) | | | | 671 | | | | (618) | |
SGD Currency Call | | | u-BOA | | | | SGD | | | | 1.250 | | | | 8/27/14 | | | | SGD | | | | (150,000) | | | | 2,497 | | | | (1,609) | |
Total of Over-the-Counter Options Written | | | $ | 16,398 | | | $ | (13,923) | |
| | | | | | | | | | | | | | | | | | | | | | | | | | |
Over-the-Counter Total Return Swaps at December 31, 2013 | |
| Reference Asset | | Counterparty | | | Pay/Receive Total
Return | | | Floating Rate | | Maturity Date | | | Notional Amount (000’s) | | | Value | |
CGCNOCAD Custom Basket | | | CITNA-B | | | | Receive | | | One-Month CAD BA CDOR plus 30 basis points | | | 3/11/14 | | | | CAD | | | | 44 | | | $ | (429 | ) |
DBOPSPLG Custom Basket | | | DEU | | | | Receive | | | One-Month USD BBA LIBOR plus 30 basis points | | | 2/7/14 | | | | USD | | | | 52 | | | | 1,257 | |
DBOPSPST Custom Basket | | | DEU | | | | Pay | | | One-Month USD BBA LIBOR plus 30 basis points | | | 2/7/14 | | | | USD | | | | 52 | | | | (1,809 | ) |
GSOPRUTL Custom Basket | | | GSG | | | | Receive | | | One-Month USD BBA LIBOR plus 35 basis points | | | 12/8/14 | | | | USD | | | | 25 | | | | 622 | |
GSOPRUTS Custom Basket | | | GSG | | | | Pay | | | One-Month USD BBA LIBOR minus 75 basis points | | | 12/8/14 | | | | USD | | | | 26 | | | | (889 | ) |
GSOPSPL5 Custom Basket | | | GSG | | | | Receive | | | One-Month USD BBA LIBOR plus 35 basis points | | | 11/20/14 | | | | USD | | | | 155 | | | | 5,679 | |
MLEIOPF2 Custom Basket | | | BOA | | | | Receive | | | One-Month EUR BBA LIBOR plus 29 basis points | | | 11/21/14 | | | | EUR | | | | 71 | | | | 2,905 | |
MLEIOPU2 Custom Basket | | | BOA | | | | Receive | | | One-Month GBP BBA LIBOR plus 34 basis points | | | 11/21/14 | | | | GBP | | | | 60 | | | | 4,212 | |
OEX Index | | | GSG | | | | Pay | | | One-Month USD BBA LIBOR plus 5 basis points | | | 11/20/14 | | | | USD | | | | 2 | | | | (80 | ) |
Total of Over-the-Counter Total Return Swaps | | | | | | | | | | | | | | $ | 11,468 | |
10 OPPENHEIMER DIVERSIFIED ALTERNATIVES FUND/VA
| | | | | | | | | | | | | | | | | | | | | | | | | | | | |
Over-the-Counter Volatility Swaps at December 31, 2013 | |
| Reference Asset | | Counterparty | | | Pay/Receive
Volatility | | | Strike Price | | | Maturity Date | | | | | | Notional Amount | | | Value | |
AUD/NZD spot exchange rate | | | BOA | | | | Receive | | | $ | 8.050 | | | | 1/16/14 | | | | AUD | | | | 40 | | | $ | (77 | ) |
EUR/CHF spot exchange rate | | | MOS-A | | | | Pay | | | | 2.600 | | | | 1/13/14 | | | | EUR | | | | 60 | | | | (16 | ) |
GBP/CHF spot exchange rate | | | JPM | | | | Receive | | | | 6.950 | | | | 1/23/14 | | | | GBP | | | | 20 | | | | 0 | |
GBP/SEK spot exchange rate | | | BOA | | | | Pay | | | | 8.500 | | | | 1/21/14 | | | | GBP | | | | 20 | | | | 13 | |
JPY/CAD spot exchange rate | | | GSG | | | | Pay | | | | 8.850 | | | | 1/9/14 | | | | CAD | | | | 90 | | | | 143 | |
JPY/EUR spot exchange rate | | | JPM | | | | Pay | | | | 9.100 | | | | 1/27/14 | | | | EUR | | | | 30 | | | | (3 | ) |
JPY/EUR spot exchange rate | | | CITNA-B | | | | Pay | | | | 9.250 | | | | 1/31/14 | | | | EUR | | | | 30 | | | | (16 | ) |
JPY/EUR spot exchange rate | | | GSG | | | | Pay | | | | 9.350 | | | | 1/31/14 | | | | EUR | | | | 30 | | | | (21 | ) |
NZD/CHF spot exchange rate | | | BOA | | | | Pay | | | | 10.800 | | | | 1/31/14 | | | | NZD | | | | 50 | | | | (4 | ) |
NZD/CHF spot exchange rate | | | BOA | | | | Pay | | | | 10.750 | | | | 2/3/14 | | | | NZD | | | | 50 | | | | (8 | ) |
NZD/USD spot exchange rate | | | JPM | | | | Pay | | | | 10.300 | | | | 2/7/14 | | | | USD | | | | 40 | | | | (2 | ) |
USD/SEK spot exchange rate | | | MOS-A | | | | Pay | | | | 9 .500 | | | | 1/13/14 | | | | USD | | | | 40 | | | | 55 | |
USD/SEK spot exchange rate | | | JPM | | | | Pay | | | | 9 .560 | | | | 1/21/14 | | | | USD | | | | 40 | | | | 8 | |
USD/SEK spot exchange rate | | | GSG | | | | Pay | | | | 9 .650 | | | | 1/13/14 | | | | USD | | | | 40 | | | | 54 | |
USD/SEK spot exchange rate | | | BOA | | | | Pay | | | | 9 .800 | | | | 1/21/14 | | | | USD | | | | 40 | | | | 23 | |
USD/SEK spot exchange rate | | | JPM | | | | Pay | | | | 10 .480 | | | | 1/17/14 | | | | USD | | | | 40 | | | | 65 | |
Total of Over-the-Counter Volatility Swaps | | | | | | | | | | | | | | | | | | | | | | | | | | $ | 214 | |
| | |
Glossary: | | |
Counterparty Abbreviations: | | |
BAC | | Barclays Bank plc |
BNP | | BNP Paribas |
BOA | | Bank of America NA |
CFI | | Citigroup Funding, Inc. |
CITNA-B | | Citibank NA |
DEU | | Deutsche Bank AG |
GSCO-OT | | Goldman Sachs Bank USA |
GSG | | Goldman Sachs Group, Inc. (The) |
JPM | | JPMorgan Chase Bank NA |
MOS-A | | Morgan Stanley |
RBS | | Royal Bank of Scotland plc (The) |
u-BOA | | Bank of America Corp. |
u-JPM | | JPMorgan Chase & Co. |
|
Currency abbreviations indicate amounts reporting in currencies: |
AUD | | Australian Dollar |
BRL | | Brazilian Real |
CAD | | Canadian Dollar |
CHF | | Swiss Franc |
CLP | | Chilean Peso |
CNH | | Colombian Peso |
COP | | Colombian Peso |
CZK | | Czech Koruna |
EUR | | Euro |
GBP | | British Pound Sterling |
HKD | | Hong Kong Dollar |
HUF | | Hungarian Forint |
IDR | | Indonesia Rupiah |
ILS | | Israeli Shekel |
INR | | Indian Rupee |
JPY | | Japanese Yen |
KRW | | South Korean Won |
MXN | | Mexican Nuevo Peso |
MYR | | Malaysian Ringgit |
NOK | | Norwegian Krone |
NZD | | New Zealand Dollar |
PEN | | Peruvian New Sol |
PHP | | Philippines Peso |
PLN | | Polish Zloty |
RUB | | Russian Ruble |
SEK | | Swedish Krona |
SGD | | Singapore Dollar |
THB | | Thai Bhat |
TRY | | New Turkish Lira |
TWD | | New Taiwan Dollar |
ZAR | | South African Rand |
| |
Definitions: | | |
BA CDOR | | Canada Bankers Acceptances Deposit Offering Rate |
BBA LIBOR | | British Bankers’ Association London-Interbank Offered Rate |
11 OPPENHEIMER DIVERSIFIED ALTERNATIVES FUND/VA
| | |
CONSOLIDATED STATEMENT OF INVESTMENTS Continued |
| | |
|
Definitions: Continued |
CAC | | French Options Market |
CGCNOCAD | | Custom Basket of Securities |
DBOPSPLG | | Custom Basket of Securities |
DBOPSPST | | Custom Basket of Securities |
FTSE 100 | | United Kingdom 100 most highly capitalized companies on the London Stock Exchange |
GSOPRUTL | | Custom Basket of Securities |
GSOPRUTS | | Custom Basket of Securities |
GSOPSPL5 | | Custom Basket of Securities |
MLEIOPF2 | | Custom Basket of Securities |
MLEIOPU2 | | Custom Basket of Securities |
OEX | | Custom Basket of Securities |
S&P | | Standard & Poor’s |
|
Exchange Abbreviations: |
CBOE | | Chicago Board Options Exchange |
CBT | | Chicago Board of Trade |
CME | | Chicago Mercantile Exchange |
CMX | | Commodity Exchange, Inc. |
KC | | Kansas City Board of Trade |
LIF | | London International Financial Futures and Options Exchange |
LME | | London Metal Exchange |
NYB | | New York Board of Trade |
NYM | | New York Mercantile Exchange |
PAR | | Paris Stock Exchange |
See accompanying Notes to Consolidated Financial Statements.
12 OPPENHEIMER DIVERSIFIED ALTERNATIVES FUND/VA
| | |
CONSOLIDATED STATEMENT OF ASSETS AND LIABILITIES December 31, 2013 |
| | | | |
Assets | | | | |
Investments, at value—see accompanying consolidated statement of investments: | | | | |
Unaffiliated companies (cost $7,683,613) | | $ | 7,634,725 | |
Affiliated companies (cost $2,209,119) | | | 2,209,581 | |
| | | | |
| | | | 9,844,306 | |
Cash | | | 472 | |
Cash used for collateral on futures | | | 170,000 | |
Cash used for collateral on OTC derivatives | | | 2,087 | |
Unrealized appreciation on foreign currency exchange contracts | | | 32,090 | |
Swaps, at value | | | 15,036 | |
Receivables and other assets: | | | | |
Expense waivers/reimbursements due from manager | | | 17,050 | |
Interest and dividends | | | 9,472 | |
Investments sold | | | 5,371 | |
Variation margin receivable | | | 4,286 | |
Other | | | 10,581 | |
| | | | |
Total assets | | | 10,110,751 | |
|
| |
Liabilities | | | | |
Bank overdraft-foreign | | | 83 | |
Unrealized depreciation on foreign currency exchange contracts | | | 28,744 | |
Options written, at value (premiums received $21,023) | | | 17,387 | |
Swaps, at value | | | 3,354 | |
Payables and other liabilities: | | | | |
Legal, auditing and other professional fees | | | 67,592 | |
Investments purchased | | | 27,409 | |
Variation margin payable | | | 16,283 | |
Transfer and shareholder servicing agent fees | | | 831 | |
Distribution and service plan fees | | | 3 | |
Other | | | 6,374 | |
| | | | |
Total liabilities | | | 168,060 | |
|
| | |
Net Assets | | $ | 9,942,691 | |
| | | | |
|
| |
Composition of Net Assets | | | | |
Par value of shares of beneficial interest | | $ | 1,001 | |
Additional paid-in capital | | | 10,009,993 | |
Accumulated net investment loss | | | (46,804 | ) |
Accumulated net realized loss on investments and foreign currency transactions | | | (11,429 | ) |
Net unrealized depreciation on investments and translation of assets and liabilities denominated in foreign currencies | | | (10,070 | ) |
Net Assets | | $ | 9,942,691 | |
| | | | |
|
| |
Net Asset Value Per Share | | | | |
Non-Service Shares: | | | | |
| Net asset value, redemption price (excludes applicable contingent deferred sales charge) and offering price per share (based on net assets of $9,932,751 and 1,000,108 shares of beneficial interest outstanding) | | | $9.92 | |
| |
Service Shares: | | | | |
| Net asset value, redemption price (excludes applicable contingent deferred sales charge) and offering price per share (based on net assets of $9,940 and 1,001 shares of beneficial interest outstanding) | | | $9.92 | |
See accompanying Notes to Consolidated Financial Statements.
13 OPPENHEIMER DIVERSIFIED ALTERNATIVES FUND/VA
| | |
CONSOLIDATED STATEMENT OF OPERATIONS For the Period Ended December 31, 20131 |
| | | | |
Allocation of Income and Expenses from master funds2 | | | | |
Net investment income allocated from Oppenheimer Master Event-Linked Bond Fund, LLC: | | | | |
Interest | | $ | 1,353 | |
Expenses | | | (76 | ) |
| | | | |
Net investment income allocated from Oppenheimer Master Event-Linked Bond Fund, LLC | | | 1,277 | |
Net investment income allocated from Oppenheimer Master Loan Fund, LLC | | | | |
Interest | | | 1,290 | |
Expenses | | | (24 | ) |
| | | | |
Net investment income allocated from Oppenheimer Master Loan Fund, LLC | | | 1,266 | |
| | | | |
Total allocation of net investment income from master funds | | | 2,543 | |
|
| | |
Investment Income | | | | |
Dividends: | | | | |
Unaffiliated companies (net of foreign withholding taxes of $646) | | | 16,052 | |
Affiliated companies | | | 236 | |
Interest | | | 104 | |
| | | | |
Total investment income | | | 16,392 | |
|
| | |
Expenses | | | | |
Management fees | | | 14,918 | |
Distribution and service plan fees - Service shares | | | 3 | |
Transfer and shareholder servicing agent fees: | | | | |
Non-Service shares | | | 1,291 | |
Service shares | | | 1 | |
Trustees’ compensation | | | 6,560 | |
Legal, auditing and other professional fees | | | 67,592 | |
Other | | | 2,185 | |
| | | | |
Total expenses | | | 92,550 | |
Less waivers and reimbursements of expenses | | | (49,608 | ) |
| | | | |
Net expenses | | | 42,942 | |
|
| | |
Net Investment Loss | | | (24,007 | ) |
|
| | |
Realized and Unrealized Gain (Loss) | | | | |
Net realized gain (loss) on: | | | | |
Investments from: | | | | |
Unaffiliated companies (including premiums on options exercised) | | | (38,318 | ) |
Closing and expiration of option contracts written | | | 6,052 | |
Closing and expiration of futures contracts | | | 17,507 | |
Foreign currency transactions | | | (12,345 | ) |
Swap contracts | | | 4,689 | |
Net realized gain (loss) allocated from: | | | | |
Oppenheimer Master Event-Linked Bond Fund, LLC | | | 147 | |
Oppenheimer Master Loan Fund, LLC | | | (964 | ) |
| | | | |
Net realized loss | | | (23,232 | ) |
Net change in unrealized appreciation/depreciation on: | | | | |
Investments | | | (31,702 | ) |
Translation of assets and liabilities denominated in foreign currencies | | | (13,727 | ) |
Futures contracts | | | 19,579 | |
Option contracts written | | | 3,636 | |
Swap contracts | | | 11,682 | |
Net change in unrealized appreciation/depreciation allocated from: | | | | |
Oppenheimer Master Event-Linked Bond Fund, LLC | | | (173 | ) |
Oppenheimer Master Loan Fund, LLC | | | 635 | |
| | | | |
Net change in unrealized appreciation/depreciation | | | (10,070 | ) |
|
| | |
Net Decrease in Net Assets Resulting from Operations | | $ | (57,309 | ) |
| | | | |
1. For the period from November 14, 2013 (commencement of operations) to December 31, 2013.
2. The Fund invests in certain affiliated mutual funds that expect to be treated as partnerships for tax purposes. See Note 1 of the accompanying Consolidated Notes.
See accompanying Notes to Consolidated Financial Statements.
14 OPPENHEIMER DIVERSIFIED ALTERNATIVES FUND/VA
| | |
CONSOLIDATED STATEMENT OF CHANGES IN NET ASSETS |
| | | | |
| | | Period Ended
December 31,
20131 | |
Operations | | | | |
Net investment loss | | $ | (24,007 | ) |
Net realized loss | | | (23,232 | ) |
Net change in unrealized appreciation/depreciation | | | (10,070 | ) |
| | | | |
Net decrease in net assets resulting from operations | | | (57,309 | ) |
|
| |
Dividends and/or Distributions to Shareholders | | | | |
Dividends from net investment income: | | | | |
Non-Service shares | | | (10,989 | ) |
Service shares | | | (8 | ) |
| | | | |
| | | (10,997 | ) |
|
| |
Beneficial Interest Transactions | | | | |
Net increase (decrease) in net assets resulting from beneficial interest transactions: | | | | |
Non-Service shares | | | 10,000,989 | |
Service shares | | | 10,008 | |
| | | | |
| | | 10,010,997 | |
|
| |
Net Assets | | | | |
Total increase | | | 9,942,691 | |
Beginning of period | | | — | |
| | | | |
| |
End of period (including accumulated net investment loss of $46,804) | | $ | 9,942,691 | |
| | | | |
1. For the period from November 14, 2013 (commencement of operations) to December 31, 2013.
See accompanying Notes to Consolidated Financial Statements.
15 OPPENHEIMER DIVERSIFIED ALTERNATIVES FUND/VA
| | |
CONSOLIDATED FINANCIAL HIGHLIGHTS |
| | | | |
Non-Service Shares | |
| Period Ended
December
31, 2013 |
1 |
Per Share Operating Data | | | | |
Net asset value, beginning of period | | | 10.00 | |
Income (loss) from investment operations: | | | | |
Net investment loss2 | | | (0.02 | ) |
Net realized and unrealized loss | | | (0.05 | ) |
| | | | |
Total from investment operations | | | (0.07 | ) |
Dividends and/or distributions to shareholders: | | | | |
Dividends from net investment income | | | (0.01 | ) |
Net asset value, end of period | | $ | 9.92 | |
| | | | |
| | | | |
Total Return, at Net Asset Value3 | | | (0.69)% | |
| | | | | |
Ratios/Supplemental Data | | | | |
Net assets, end of period (in thousands) | | $ | 9,917 | |
Average net assets (in thousands) | | $ | 9,827 | |
Ratios to average net assets:4,5 | | | | |
Net investment loss | | | (1.85)% | |
Total expenses6,7 | | | 7.16% | |
Expenses after payments, waivers and/or reimbursements and reduction to custodian expenses | | | 3.33% | |
Portfolio turnover rate | | | 11% | |
1. For the period from November 14, 2013 (commencement of operations) to December 31, 2013.
2. Per share amounts calculated based on the average shares outstanding during the period.
3. Assumes an initial investment on the business day before the first day of the fiscal period, with all dividends and distributions reinvested in additional shares on the reinvestment date, and redemption at the net asset value calculated on the last business day of the fiscal period. Total returns are not annualized for periods less than one full year. Total return information does not reflect expenses that apply at the separate account level or to related insurance products. Inclusion of these charges would reduce the total return figures for all periods shown. Returns do not reflect the deduction of taxes that a shareholder would pay on fund distributions or the redemption of fund shares.
4. Annualized for periods less than one full year.
5. Includes the Fund’s shares of the allocated expenses and/or net investment income from the master funds.
6. Total expenses including indirect expenses from affiliated fund were as follows:
Period Ended December 31, 2013 7.18%
7. Total expense ratio is higher due to the Fund’s limited operating history.
See accompanying Notes to Consolidated Financial Statements.
16 OPPENHEIMER DIVERSIFIED ALTERNATIVES FUND/VA
| | | | |
Service Shares | |
| Period Ended
December
31, 2013 |
1 |
Per Share Operating Data | | | | |
Net asset value, beginning of period | | | 10.00 | |
Income (loss) from investment operations: | | | | |
Net investment loss2 | | | (0.03 | ) |
Net realized and unrealized loss | | | (0.04 | ) |
| | | | |
Total from investment operations | | | (0.07 | ) |
Dividends and/or distributions to shareholders: | | | | |
Dividends from net investment income | | | (0.01 | ) |
Net asset value, end of period | | $ | 9.92 | |
| | | | |
Total Return, at Net Asset Value3 | | | (0.72)% | |
| | | | | |
Ratios/Supplemental Data | | | | |
Net assets, end of period (in thousands) | | $ | 10 | |
Average net assets (in thousands) | | $ | 10 | |
Ratios to average net assets:4,5 | | | | |
Net investment loss | | | (2.12)% | |
Total expenses6,7 | | | 7.43% | |
Expenses after payments, waivers and/or reimbursements and reduction to custodian expenses | | | 3.50% | |
Portfolio turnover rate | | | 11% | |
1. For the period from November 14, 2013 (commencement of operations) to December 31, 2013.
2. Per share amounts calculated based on the average shares outstanding during the period.
3. Assumes an initial investment on the business day before the first day of the fiscal period, with all dividends and distributions reinvested in additional shares on the reinvestment date, and redemption at the net asset value calculated on the last business day of the fiscal period. Total returns are not annualized for periods less than one full year. Total return information does not reflect expenses that apply at the separate account level or to related insurance products. Inclusion of these charges would reduce the total return figures for all periods shown. Returns do not reflect the deduction of taxes that a shareholder would pay on fund distributions or the redemption of fund shares.
4. Annualized for periods less than one full year.
5. Includes the Fund’s share of the allocated expenses and/or net investment income from the master funds.
6. Total expenses including indirect expenses from affiliated fund were as follows:
Period Ended December 31, 2013 7.45%
7. Total expense ratio is higher due to the Fund’s limited operating history.
See accompanying Notes to Consolidated Financial Statements.
17 OPPENHEIMER DIVERSIFIED ALTERNATIVES FUND/VA
| | |
NOTES TO CONSOLIDATED FINANCIAL STATEMENTS December 31, 2013 |
1. Significant Accounting Policies
Oppenheimer Diversified Alternatives Fund/VA (the “Fund”) is a separate series of Oppenheimer Variable Account Funds, a diversified open-end management investment company registered under the Investment Company Act of 1940, as amended. The Fund’s investment objective is to seek total return. The Fund’s investment adviser is OFI Global Asset Management, Inc. (“OFI Global” or the “Manager”), a wholly-owned subsidiary of OppenheimerFunds, Inc. (“OFI” or the “Sub-Adviser”). The Manager has entered into a sub-advisory agreement with OFI. Shares of the Fund are sold only to separate accounts of life insurance companies. The Fund commenced operations on November 14, 2013.
The Fund offers two classes of shares. Both classes are sold at their offering price, which is the net asset value per share, to separate investment accounts of participating insurance companies as an underlying investment for variable life insurance policies, variable annuity contracts or other investment products. The class of shares designated as Service shares is subject to a distribution and service plan. Both classes of shares have identical rights and voting privileges with respect to the Fund in general and exclusive voting rights on matters that affect that class alone. Earnings, net assets and net asset value per share may differ due to each class having its own expenses, such as transfer and shareholder servicing agent fees and shareholder communications, directly attributable to that class.
The following is a summary of significant accounting policies consistently followed by the Fund.
Basis for Consolidation. The Fund has established a Cayman Islands exempted company, Oppenheimer Diversified Alternatives Fund/VA (Cayman) Ltd., which is wholly-owned and controlled by the Fund (the “Subsidiary”). The Fund and Subsidiary are both managed by the Manager. The Fund may invest up to 25% of its total assets in the Subsidiary. The Subsidiary invests primarily in commodity-linked derivatives (including commodity futures, financial futures, options and swap contracts) and exchange-traded funds related to gold or other special minerals. The Subsidiary may also invest in certain fixed-income securities and other investments that may serve as margin or collateral for its derivatives positions. Investments in the Subsidiary are expected to provide the Fund with exposure to commodities markets within the limitations of the federal tax requirements that apply to the Fund. The Subsidiary is subject to the same investment restrictions and guidelines, and follows the same compliance policies and procedures, as the Fund.
The financial statements have been consolidated and include accounts of the Fund and the Subsidiary. Accordingly, all inter-company transactions and balances have been eliminated. At December 31, 2013, the Fund owned 15,186 shares with a market value of $1,495,665.
Investment in Oppenheimer Institutional Money Market Fund. The Fund is permitted to invest daily available cash balances in an affiliated money market fund. The Fund may invest the available cash in Class E shares of Oppenheimer Institutional Money Market Fund (“IMMF”) to seek current income while preserving liquidity. IMMF is a registered open-end management investment company, regulated as a money market fund under the Investment Company Act of 1940, as amended. The Manager is the investment adviser of IMMF, and the Sub-Adviser provides investment and related advisory services to IMMF. When applicable, the Fund’s investment in IMMF is included in the Consolidated Statement of Investments. Shares of IMMF are valued at their net asset value per share. As a shareholder, the Fund is subject to its proportional share of IMMF’s Class E expenses, including its management fee. The Manager will waive fees and/or reimburse Fund expenses in an amount equal to the indirect management fees incurred through the Fund’s investment in IMMF.
Investment in Oppenheimer Master Funds. The Fund is permitted to invest in entities sponsored and/or advised by the Manager or an affiliate. Certain of these entities in which the Fund invests are mutual funds registered under the Investment Company Act of 1940 that expect to be treated as partnerships for tax purposes, specifically Oppenheimer Master Loan Fund, LLC and Oppenheimer Master Event-Linked Bond Fund, LLC (the “Master Funds”). Each Master Fund has its own investment risks, and those risks can affect the value of the Fund’s investments and therefore the value of the Fund’s shares. To the extent that the Fund invests more of its assets in one Master Fund than in another, the Fund will have greater exposure to the risks of that Master Fund.
The investment objective of Oppenheimer Master Loan Fund, LLC is to seek as high a level of current income and preservation of capital as is consistent with investing primarily in loans and other debt securities. The investment objective of Oppenheimer Master Event-Linked Bond Fund, LLC is to seek a high level of current income principally derived from interest on debt securities. The Fund’s investments in the Master Funds are included in the Consolidated Statement of Investments. The Fund recognizes income and gain/(loss) on its investments in each Master Fund according to its allocated pro-rata share, based on its relative proportion of total outstanding Master Fund shares held, of the total net income earned and the net gain/(loss) realized on investments sold by the Master Funds. As a shareholder, the Fund is subject to its proportional share of the Master Funds’ expenses, including their management fee. The Manager will waive fees and/or reimburse Fund expenses in an amount equal to the indirect management fees incurred through the Fund’s investment in the Master Funds.
Master Limited Partnerships (“MLPs”). MLPs issue common units that represent an equity ownership interest in a partnership and provide limited voting rights. MLP common units are registered with the Securities and Exchange Commission (“SEC”), and are freely tradable on securities exchanges such as the NYSE and the NASDAQ Stock Market (“NASDAQ”), or in the over-the-counter (“OTC”) market. An MLP consists of one or more general partners, who conduct the business, and one or more limited partners, who contribute capital. MLP common unit holders have a limited role in the partnership’s operations and management. The Fund, as a limited partner, normally would not be liable for the debts of the MLP beyond the amounts the Fund has contributed, but would not be shielded to the same extent that a shareholder of a corporation would be. In certain circumstances creditors of an MLP would have the right to seek return of capital distributed to a limited partner. This right of an MLP’s creditors would continue after the Fund sold its investment in the MLP.
18 OPPENHEIMER DIVERSIFIED ALTERNATIVES FUND/VA
1. Significant Accounting Policies (Continued)
Foreign Currency Translation. The Fund’s accounting records are maintained in U.S. dollars. The values of securities denominated in foreign currencies and amounts related to the purchase and sale of foreign securities and foreign investment income are translated into U.S. dollars as of the close of the New York Stock Exchange (the “Exchange”), normally 4:00 P.M. Eastern time, on each day the Exchange is open for trading. Foreign exchange rates may be valued primarily using a reliable bank, dealer or service authorized by the Board of Trustees.
Reported net realized gains and losses from foreign currency transactions arise from sales of portfolio securities, sales and maturities of short-term securities, sales of foreign currencies, exchange rate fluctuations between the trade and settlement dates on securities transactions, and the difference between the amounts of dividends, interest, and foreign withholding taxes recorded on the Fund’s books and the U.S. dollar equivalent of the amounts actually received or paid. Net unrealized appreciation and depreciation on the translation of assets and liabilities denominated in foreign currencies arise from changes in the values of assets and liabilities, including investments in securities at fiscal period end, resulting from changes in exchange rates.
The effect of changes in foreign currency exchange rates on investments is separately identified from the fluctuations arising from changes in market values of securities held and reported with all other foreign currency gains and losses in the Fund’s Consolidated Statement of Operations.
Allocation of Income, Expenses, Gains and Losses. Income, expenses (other than those attributable to a specific class), gains and losses are allocated on a daily basis to each class of shares based upon the relative proportion of net assets represented by such class. Operating expenses directly attributable to a specific class are charged against the operations of that class.
Federal Taxes. The Fund intends to comply with provisions of the Internal Revenue Code applicable to regulated investment companies and to distribute substantially all of its investment company taxable income, including any net realized gain on investments not offset by capital loss carryforwards, if any, to shareholders. Therefore, no federal income or excise tax provision is required. The Fund files income tax returns in U.S. federal and applicable state jurisdictions. The statute of limitations on the Fund’s tax return filings generally remain open for the three preceding fiscal reporting period ends.
Subchapter M requires, among other things, that at least 90% of the Fund’s gross income be derived from securities or derived with respect to its business of investing in securities (typically referred to as “qualifying income”). Income from commodity-linked derivatives may not be treated as “qualifying income” for purposes of the 90% gross income requirement. The Internal Revenue Service (IRS) has previously issued a number of private letter rulings which conclude that income derived from commodity index-linked notes and investments in a wholly-owned subsidiary will be “qualifying income.” As a result, the Fund will gain exposure to commodities through commodity-linked notes and its wholly-owned subsidiary.
The IRS has suspended the granting of private letter rulings pending further review. As a result, there can be no assurance that the IRS will not change its position with respect to commodity-linked notes and wholly-owned subsidiaries. In addition, future legislation and guidance from Treasury and the IRS may adversely affect the fund’s ability to gain exposure to commodities through commodity-linked notes and its wholly-owned subsidiary.
The Fund is required to include in income for federal income tax purposes all of the subsidiary’s net income and gains whether or not such income is distributed by the subsidiary. Net income and gains from the subsidiary are generally treated as ordinary income by the Fund, regardless of the character of the subsidiary’s underlying income. Net losses from the subsidiary do not pass through to the Fund for federal income tax purposes.
The tax components of capital shown in the following table represent distribution requirements the Fund must satisfy under the income tax regulations, losses the Fund may be able to offset against income and gains realized in future years and unrealized appreciation or depreciation of securities and other investments for federal income tax purposes.
| | | | | | | | | | | | |
Undistributed
Net Investment
Income | |
| Undistributed
Long-Term
Gain |
| |
| Accumulated
Loss
Carryforward1,2 |
| |
| Net Unrealized
Depreciation
Based on cost of
Securities and
Other Investments
for Federal Income
Tax Purposes |
|
$2,564 | | | $— | | | | $6,513 | | | | $36,561 | |
1. As of December 31, 2013, the Fund had $6,513 of net capital loss carryforwards available to offset future realized capital gains, if any, and thereby reduce future taxable gain distributions. Details of the capital loss carryforwards are included in the table below. Capital loss carryovers with no expiration, if any, must be utilized prior to those with expiration dates.
| | | | |
Expiring | | | | |
No expiration | | $ | 6,513 | |
2. During the fiscal year ended December 31, 2013, the Fund did not utilize any capital loss carryforward.
Net investment income (loss) and net realized gain (loss) may differ for financial statement and tax purposes. The character of dividends and distributions made during the fiscal year from net investment income or net realized gains may differ from their ultimate characterization for federal income tax purposes. Also, due to timing of dividends and distributions, the fiscal year in which amounts are distributed may differ from the fiscal year in which the income or net realized gain was recorded by the Fund.
Accordingly, the following amounts have been reclassified for December 31, 2013. Net assets of the Fund were unaffected by the reclassifications.
19 OPPENHEIMER DIVERSIFIED ALTERNATIVES FUND/VA
| | |
NOTES TO CONSOLIDATED FINANCIAL STATEMENTS Continued |
1. Significant Accounting Policies (Continued)
| | | | | | | | |
Reduction
to Paid-in Capital | | Increase
to Accumulated
Net Investment
Loss | | | Reduction
to Accumulated Net
Realized Loss
on Investments | |
$3 | | $ | 11,800 | | | $ | 11,803 | |
The tax character of distributions paid during the period ended December 31, 2013:
| | | | |
| | | Period Ended
December 31, 2013 | |
Distributions paid from: | | | | |
Ordinary income | | $ | 10,997 | |
The aggregate cost of securities and other investments and the composition of unrealized appreciation and depreciation of securities and other investments for federal income tax purposes as of December 31, 2013 are noted in the following table. The primary difference between book and tax appreciation or depreciation of securities and other investments, if applicable, is attributable to the tax deferral of losses or tax realization of financial statement unrealized gain or loss.
| | | | |
Federal tax cost of securities | | $ | 9,892,244 | |
Federal tax cost of other investments | | | 1,273,397 | |
| | | | |
Total federal tax cost | | $ | 11,165,641 | |
| | | | |
Gross unrealized appreciation | | $ | 270,732 | |
Gross unrealized depreciation | | | (307,293 | ) |
| | | | |
Net unrealized depreciation | | $ | (36,561 | ) |
| | | | |
Trustees’ Compensation. The Board of Trustees has adopted a compensation deferral plan for independent trustees that enables trustees to elect to defer receipt of all or a portion of the annual compensation they are entitled to receive from the Fund. For purposes of determining the amount owed to the Trustee under the plan, deferred amounts are treated as though equal dollar amounts had been invested in shares of the Fund or in other Oppenheimer funds selected by the Trustee. The Fund purchases shares of the funds selected for deferral by the Trustee in amounts equal to his or her deemed investment, resulting in a Fund asset equal to the deferred compensation liability. Such assets are included as a component of “Other” within the asset section of the Consolidated Statement of Assets and Liabilities. Deferral of trustees’ fees under the plan will not affect the net assets of the Fund, and will not materially affect the Fund’s assets, liabilities or net investment income per share. Amounts will be deferred until distributed in accordance with the compensation deferral plan.
Dividends and Distributions to Shareholders. Dividends and distributions to shareholders, which are determined in accordance with income tax regulations and may differ from U.S. generally accepted accounting principles, are recorded on the ex-dividend date. Income and capital gain distributions, if any, are declared and paid annually or at other times as deemed necessary by the Manager.
Investment Income. Dividend income is recorded on the ex-dividend date or upon ex-dividend notification in the case of certain foreign dividends where the ex-dividend date may have passed. Non-cash dividends included in dividend income, if any, are recorded at the fair market value of the securities received. Interest income is recognized on an accrual basis. Discount and premium, which are included in interest income on the Consolidated Statement of Operations, are amortized or accreted daily.
Custodian Fees. “Custodian fees and expenses” in the Consolidated Statement of Operations may include interest expense incurred by the Fund on any cash overdrafts of its custodian account during the period. Such cash overdrafts may result from the effects of failed trades in portfolio securities and from cash outflows resulting from unanticipated shareholder redemption activity. The Fund pays interest to its custodian on such cash overdrafts, to the extent they are not offset by positive cash balances maintained by the Fund, at a rate equal to the Federal Funds Rate plus 0.50%. The “Reduction to custodian expenses” line item, if applicable, represents earnings on cash balances maintained by the Fund during the period. Such interest expense and other custodian fees may be paid with these earnings.
Security Transactions. Security transactions are recorded on the trade date. Realized gains and losses on securities sold are determined on the basis of identified cost.
Indemnifications. The Fund’s organizational documents provide current and former trustees and officers with a limited indemnification against liabilities arising in connection with the performance of their duties to the Fund. In the normal course of business, the Fund may also enter into contracts that provide general indemnifications. The Fund’s maximum exposure under these arrangements is unknown as this would be dependent on future claims that may be made against the Fund. The risk of material loss from such claims is considered remote.
20 OPPENHEIMER DIVERSIFIED ALTERNATIVES FUND/VA
1. Significant Accounting Policies (Continued)
Other. The preparation of financial statements in conformity with accounting principles generally accepted in the United States of America requires management to make estimates and assumptions that affect the reported amounts of assets and liabilities and disclosure of contingent assets and liabilities at the date of the financial statements and the reported amounts of increases and decreases in net assets from operations during the reporting period. Actual results could differ from those estimates.
2. Securities Valuation
The Fund calculates the net asset value of its shares as of the close of the New York Stock Exchange (the “Exchange”), normally 4:00 P.M. Eastern time, on each day the Exchange is open for trading.
The Fund’s Board has adopted procedures for the valuation of the Fund’s securities and has delegated the day-to-day responsibility for valuation determinations under those procedures to the Manager. The Manager has established a Valuation Committee which is responsible for determining a “fair valuation” for any security for which market quotations are not “readily available.” The Valuation Committee’s fair valuation determinations are subject to review, approval and ratification by the Fund’s Board at its next regularly scheduled meeting covering the calendar quarter in which the fair valuation was determined.
Valuation Methods and Inputs
Securities are valued using unadjusted quoted market prices, when available, as supplied primarily by third party pricing services or dealers.
The following methodologies are used to determine the market value or the fair value of the types of securities described below:
Securities traded on a registered U.S. securities exchange (including exchange-traded derivatives other than futures and futures options) are valued based on the last sale price of the security reported on the principal exchange on which it is traded, prior to the time when the Fund’s assets are valued. In the absence of a sale, the security is valued at the last sale price on the prior trading day, if it is within the spread of the current day’s closing “bid” and “asked” prices, and if not, at the current day’s closing bid price. A security of a foreign issuer traded on a foreign exchange, but not listed on a registered U.S. securities exchange, is valued based on the last sale price on the principal exchange on which the security is traded, as identified by the third party pricing service used by the Manager, prior to the time when the Fund’s assets are valued. If the last sale price is unavailable, the security is valued at the most recent official closing price on the principal exchange on which it is traded. If the last sales price or official closing price for a foreign security is not available, the security is valued at the mean between the bid and asked price per the exchange or, if not available from the exchange, obtained from two dealers. If bid and asked prices are not available from either the exchange or two dealers, the security is valued by using one of the following methodologies (listed in order of priority); (1) using a bid from the exchange, (2) the mean between the bid and asked price as provided by a single dealer, or (3) a bid from a single dealer.
Shares of a registered investment company that are not traded on an exchange are valued at that investment company’s net asset value per share.
Corporate and government debt securities (of U.S. or foreign issuers) and municipal debt securities, event-linked bonds, loans, mortgage-backed securities, collateralized mortgage obligations, and asset-backed securities are valued at the mean between the “bid” and “asked” prices utilizing evaluated prices obtained from third party pricing services or broker-dealers who may use matrix pricing methods to determine the evaluated prices.
Short-term money market type debt securities with a remaining maturity of sixty days or less are valued at cost adjusted by the amortization of discount or premium to maturity (amortized cost), which approximates market value. Short-term debt securities with a remaining maturity in excess of sixty days are valued at the mean between the “bid” and “asked” prices utilizing evaluated prices obtained from third party pricing services or broker-dealers.
Structured securities, swaps, swaptions, and other over-the-counter derivatives are valued utilizing evaluated prices obtained from third party pricing services or broker-dealers.
Forward foreign currency exchange contracts are valued utilizing current and forward currency rates obtained from third party pricing services. When the settlement date of a contract is an interim date for which a quotation is not available, interpolated values are derived using the nearest dated forward currency rate.
Futures contracts and futures options traded on a commodities or futures exchange will be valued at the final settlement price or official closing price on the principal exchange as reported by such principal exchange at its trading session ending at, or most recently prior to, the time when the Fund’s assets are valued.
A description of the standard inputs that may generally be considered by the third party pricing vendors in determining their evaluated prices is provided below.
| | |
| Security Type | | Standard inputs generally considered by third-party pricing vendors |
| Corporate debt, government debt, municipal, mortgage-backed and asset-backed securities | | Reported trade data, broker-dealer price quotations, benchmark yields, issuer spreads on comparable securities, the credit quality, yield, maturity, and other appropriate factors. |
| Loans | | Information obtained from market participants regarding reported trade data and broker-dealer price quotations. |
| Event-linked bonds | | Information obtained from market participants regarding reported trade data and broker-dealer price quotations. |
| Structured securities | | Relevant market information such as the price of underlying financial instruments, stock market indices, foreign currencies, interest rate spreads, commodities, or the occurrence of other specific events. |
| Swaps | | Relevant market information, including underlying reference assets such as credit spreads, credit event probabilities, index values, individual security values, forward interest rates, variable interest rates, volatility measures, and forward currency rates. |
21 OPPENHEIMER DIVERSIFIED ALTERNATIVES FUND/VA
| | |
NOTES TO CONSOLIDATED FINANCIAL STATEMENTS Continued |
2. Securities Valuation (Continued)
If a market value or price cannot be determined for a security using the methodologies described above, or if, in the “good faith” opinion of the Manager, the market value or price obtained does not constitute a “readily available market quotation,” or a significant event has occurred that would materially affect the value of the security the security is fair valued either (i) by a standardized fair valuation methodology applicable to the security type or the significant event as previously approved by the Valuation Committee and the Fund’s Board or (ii) as determined in good faith by the Manager’s Valuation Committee. The Valuation Committee considers all relevant facts that are reasonably available, through either public information or information available to the Manager, when determining the fair value of a security. Fair value determinations by the Manager are subject to review, approval and ratification by the Fund’s Board at its next regularly scheduled meeting covering the calendar quarter in which the fair valuation was determined. Those fair valuation standardized methodologies include, but are not limited to, valuing securities at the last sale price or initially at cost and subsequently adjusting the value based on: changes in company specific fundamentals, changes in an appropriate securities index, or changes in the value of similar securities which may be further adjusted for any discounts related to security-specific resale restrictions. When possible, such methodologies use observable market inputs such as unadjusted quoted prices of similar securities, observable interest rates, currency rates and yield curves. The methodologies used for valuing securities are not necessarily an indication of the risks associated with investing in those securities nor can it be assured that the Fund can obtain the fair value assigned to a security if it were to sell the security.
To assess the continuing appropriateness of security valuations, the Manager, or its third party service provider who is subject to oversight by the Manager, regularly compares prior day prices, prices on comparable securities, and sale prices to the current day prices and challenges those prices exceeding certain tolerance levels with the third party pricing service or broker source. For those securities valued by fair valuations, whether through a standardized fair valuation methodology or a fair valuation determination, the Valuation Committee reviews and affirms the reasonableness of the valuations based on such methodologies and fair valuation determinations on a regular basis after considering all relevant information that is reasonably available.
Classifications
Each investment asset or liability of the Fund is assigned a level at measurement date based on the significance and source of the inputs to its valuation. Various data inputs are used in determining the value of each of the Fund’s investments as of the reporting period end. These data inputs are categorized in the following hierarchy under applicable financial accounting standards:
1) Level 1-unadjusted quoted prices in active markets for identical assets or liabilities (including securities actively
traded on a securities exchange)
2) Level 2-inputs other than unadjusted quoted prices that are observable for the asset or liability (such as unadjusted
quoted prices for similar assets and market corroborated inputs such as interest rates, prepayment speeds, credit risks,
etc.)
3) Level 3-significant unobservable inputs (including the Manager’s own judgments about assumptions that market
participants would use in pricing the asset or liability).
The inputs used for valuing securities are not necessarily an indication of the risks associated with investing in those securities.
The table below categorizes amounts that are included in the Fund’s Consolidated Statement of Assets and Liabilities as of December 31, 2013 based on valuation input level:
| | | | | | | | | | | | | | | | |
| | | Level 1—
Unadjusted
Quoted Prices | | | Level 2—
Other Significant
Observable Inputs | | | Level 3—
Significant
Unobservable
Inputs | | | Value | |
Assets Table | | | | | | | | | | | | | | | | |
Investments, at Value: | | | | | | | | | | | | | | | | |
Common Stocks | | | | | | | | | | | | | | | | |
Consumer Discretionary | | $ | 4,533 | | | $ | — | | | $ | — | | | $ | 4,533 | |
Consumer Staples | | | 2,910 | | | | — | | | | — | | | | 2,910 | |
Energy | | | 1,983,714 | | | | — | | | | — | | | | 1,983,714 | |
Financials | | | 931,377 | | | | 1,021,877 | | | | — | | | | 1,953,254 | |
Health Care | | | 18,945 | | | | — | | | | — | | | | 18,945 | |
Industrials | | | 5,422 | | | | — | | | | — | | | | 5,422 | |
Information Technology | | | 13,315 | | | | — | | | | — | | | | 13,315 | |
Materials | | | 1,263,443 | | | | 48,563 | | | | — | | | | 1,312,006 | |
Telecommunication Services | | | 1,493 | | | | — | | | | — | | | | 1,493 | |
Utilities | | | 94,706 | | | | — | | | | — | | | | 94,706 | |
U.S. Government Obligation | | | — | | | | 1,834,848 | | | | — | | | | 1,834,848 | |
Investment Companies | | | 2,395,267 | | | | 202,237 | | | | — | | | | 2,597,504 | |
Over-the-Counter Option Purchased | | | — | | | | 21,656 | | | | — | | | | 21,656 | |
| | | | |
Total Investments, at Value | | | 6,715,125 | | | | 3,129,181 | | | | — | | | | 9,844,306 | |
Other Financial Instruments: | | | | | | | | | | | | | | | | |
Swaps, at value | | | — | | | | 15,036 | | | | — | | | | 15,036 | |
Variation margin receivable | | | 4,286 | | | | — | | | | — | | | | 4,286 | |
Foreign currency exchange contracts | | | — | | | | 32,090 | | | | — | | | | 32,090 | |
| | | | |
Total Assets | | $ | 6,719,411 | | | $ | 3,176,307 | | | $ | — | | | $ | 9,895,718 | |
| | | | |
22 OPPENHEIMER DIVERSIFIED ALTERNATIVES FUND/VA
2. Securities Valuation (Continued)
| | | | | | | | | | | | | | | | |
| | | Level 1—
Unadjusted
Quoted Prices | | | Level 2—
Other Significant
Observable Inputs | | | Level 3—
Significant
Unobservable
Inputs | | | Value | |
Liabilities Table | | | | | | | | | | | | | | | | |
Other Financial Instruments: | | | | | | | | | | | | | | | | |
Swaps, at value | | $ | — | | | $ | (3,354 | ) | | $ | — | | | $ | (3,354 | ) |
Options written, at value | | | — | | | | (17,387 | ) | | | — | | | | (17,387 | ) |
Variation margin payable | | | (16,283 | ) | | | — | | | | — | | | | (16,283 | ) |
Foreign currency exchange contracts | | | — | | | | (28,744 | ) | | | — | | | | (28,744 | ) |
| | | | |
Total Liabilities | | $ | (16,283 | ) | | $ | (49,485 | ) | | $ | — | | | $ | (65,768) | |
| | | | |
Currency contracts and forwards, if any, are reported at their unrealized appreciation/ depreciation at measurement date, which represents the change in the contract’s value from trade date. Futures, if any, are reported at their variation margin at measurement date, which represents the amount due to/from the Fund at that date. All additional assets and liabilities included in the above table are reported at their market value at measurement date.
3. Shares of Beneficial Interest
The Fund has authorized an unlimited number of $0.001 par value shares of beneficial interest of each class. Transactions in shares of beneficial interest were as follows:
| | | | | | | | |
| | | Period Ended December 31, 20131 | |
| | | Shares | | | Amount | |
Non-Service Shares | | | | | | | | |
Sold | | | 999,000 | | | $ | 9,990,000 | |
Dividends and/or distributions reinvested | | | 1,108 | | | | 10,989 | |
Redeemed | | | — | | | | — | |
| | | | |
Net increase | | | 1,000,108 | | | $ | 10,000,989 | |
| | | | |
| | | | | | | | |
Service Shares | | | | | | | | |
Sold | | | 1,000 | | | $ | 10,000 | |
Dividends and/or distributions reinvested | | | 1 | | | | 8 | |
Redeemed | | | — | | | | — | |
| | | | |
Net increase | | | 1,001 | | | $ | 10,008 | |
| | | | |
1. For the period from November 14, 2013 (commencement of operations) to December 31, 2013.
4. Purchases and Sales of Securities
The aggregate cost of purchases and proceeds from sales of securities, other than short-term obligations and investments in IMMF, for the period ended December 31, 2013 were as follows:
| | | | | | | | | | | | | | | | | | |
| | | Purchases | | | | | | | | | | | | | Sales | |
Investment securities | | $ | 6,505,057 | | | | | | | | | | | | | $ | 443,499 | |
5. Fees and Other Transactions with Affiliates
Management Fees. Under the investment advisory agreement, the Fund pays the Manager a management fee based on the daily net assets of the Fund at an annual rate as shown in the following table:
| | | | |
| Fee Schedule | | | |
Up to $500 million | | | 1.00 | % |
Next $500 million | | | 0.95 | |
Next $4 billion | | | 0.90 | |
Over $5 billion | | | 0.88 | |
The Manager also provides investment management related services to the Subsidiary. The Subsidiary pays the Manager a monthly management fee at an annual rate according to the above schedule. The Subsidiary also pays certain other expenses including custody and directors’ fees.
Sub-Adviser Fees. The Manager has retained the Sub-Adviser to provide the day-to-day portfolio management of the Fund and the Subsidiary. Under the Sub-Advisory Agreements, the Manager pays the Sub-Adviser an annual fee in monthly installments, equal to a percentage of the investment management fee collected by the Manager from the Fund, which shall be calculated after any investment management fee waivers. The fees paid to the Sub-Adviser are paid by the Manager, not by the Fund.
Transfer Agent Fees. OFI Global (the “Transfer Agent”) serves as the transfer and shareholder servicing agent for the Fund. Fees incurred by the Fund with respect to these services are detailed in the Consolidated Statement of Operations.
23 OPPENHEIMER DIVERSIFIED ALTERNATIVES FUND/VA
| | |
NOTES TO CONSOLIDATED FINANCIAL STATEMENTS Continued |
5. Fees and Other Transactions with Affiliates (Continued)
Sub-Transfer Agent Fees. The Transfer Agent has retained Shareholder Services, Inc., a wholly-owned subsidiary of OFI (the “Sub-Transfer Agent”), to provide the day-to-day transfer agent and shareholder servicing of the Fund. Under the Sub-Transfer Agency Agreement, the Transfer Agent pays the Sub-Transfer Agent an annual fee in monthly installments, equal to a percentage of the transfer agent fee collected by the Transfer Agent from the Fund, which shall be calculated after any applicable fee waivers. The fee paid to the Sub-Transfer Agent is paid by the Transfer Agent, not by the Fund.
Distribution and Service Plan for Service Shares. The Fund has adopted a Distribution and Service Plan (the “Plan”) in accordance with Rule 12b-1 under the Investment Company Act of 1940 for Service shares to pay OppenheimerFunds Distributor, Inc. (the “Distributor”), for distribution related services, personal service and account maintenance for the Fund’s Service shares. Under the Plan, payments are made periodically at an annual rate of 0.25% of the daily net assets of Service shares of the Fund. The Distributor currently uses all of those fees to compensate sponsors of the insurance product that offers Fund shares, for providing personal service and maintenance of accounts of their variable contract owners that hold Service shares. These fees are paid out of the Fund’s assets on an on-going basis and increase operating expenses of the Service shares, which results in lower performance compared to the Fund’s shares that are not subject to a service fee. Fees incurred by the Fund under the Plan are detailed in the Consolidated Statement of Operations.
Waivers and Reimbursements of Expenses. The Manager has contractually agreed to waive fees and/or reimburse expenses to limit the Fund’s “Expenses after payments, waivers and/or reimbursements and reduction to custodian expenses” (excluding any applicable dividend expense, taxes, interest and fees from borrowing, any subsidiary expenses, Acquired Fund Fees and Expenses, brokerage commissions, extraordinary expenses and certain other Fund expenses) so that, as percentages of average daily net assets, those expenses will not exceed the annual rate of 1.20% for Non-Service shares and 1.45% for Service shares. During the period ended December 31, 2013, the Manager waived fees and/or reimbursed the Fund $47,572 and $49 for Non-Service and Service, respectively.
The Manager has contractually agreed to waive the Fund’s management fee in an amount equal to the management fee of the Subsidiary. During the period ended December 31, 2013, this waiver reduced the Fund’s management fee by $1,580.
The Manager will waive fees and/or reimburse Fund expenses in an amount equal to the indirect management fees incurred through the Fund’s investment in IMMF and the Master Funds. During the period ended December 31, 2013, the Manager waived fees and/or reimbursed the Fund $407 for management fees.
Some of these undertakings may be modified or terminated at any time; some may not be modified or terminated until after one year from the date of the current prospectus, as indicated therein.
6. Risk Exposures and the Use of Derivative Instruments
The Fund’s investment objectives not only permit the Fund to purchase investment securities, they also allow the Fund to enter into various types of derivatives contracts, including, but not limited to, futures contracts, forward currency exchange contracts, credit default swaps, interest rate swaps, total return swaps, variance swaps and purchased and written options. In doing so, the Fund will employ strategies in differing combinations to permit it to increase, decrease, or change the level or types of exposure to market risk factors. These instruments may allow the Fund to pursue its objectives more quickly and efficiently than if it were to make direct purchases or sales of securities capable of effecting a similar response to market factors. Such contracts may be entered into through a bilateral over-the-counter (“OTC”) transaction, or through a securities or futures exchange and cleared through a clearinghouse.
Market Risk Factors. In accordance with its investment objectives, the Fund may use derivatives to increase or decrease its exposure to one or more of the following market risk factors:
Commodity Risk. Commodity risk relates to the change in value of commodities or commodity indexes as they relate to increases or decreases in the commodities market. Commodities are physical assets that have tangible properties. Examples of these types of assets are crude oil, heating oil, metals, livestock, and agricultural products.
Credit Risk. Credit risk relates to the ability of the issuer to meet interest and principal payments, or both, as they come due. In general, lower-grade, higher-yield bonds are subject to credit risk to a greater extent than lower-yield, higher-quality bonds.
Equity Risk. Equity risk relates to the change in value of equity securities as they relate to increases or decreases in the general market.
Foreign Exchange Rate Risk. Foreign exchange rate risk relates to the change in the U.S. dollar value of a security held that is denominated in a foreign currency. The U.S. dollar value of a foreign currency denominated security will decrease as the dollar appreciates against the currency, while the U.S. dollar value will increase as the dollar depreciates against the currency.
Interest Rate Risk. Interest rate risk refers to the fluctuations in value of fixed-income securities resulting from the inverse relationship between price and yield. For example, an increase in general interest rates will tend to reduce the market value of already issued fixed-income investments, and a decline in general interest rates will tend to increase their value. In addition, debt securities with longer maturities, which tend to have higher yields, are subject to potentially greater fluctuations in value from changes in interest rates than obligations with shorter maturities.
Volatility Risk. Volatility risk refers to the magnitude of the movement, but not the direction of the movement, in a financial instrument’s price over a defined time period. Large increases or decreases in a financial instrument’s price over a relative time period typically indicate greater volatility risk, while small increases or decreases in its price typically indicate lower volatility risk.
24 OPPENHEIMER DIVERSIFIED ALTERNATIVES FUND/VA
6. Risk Exposures and the Use of Derivative Instruments (Continued)
Derivatives may have little or no initial cash investment relative to their market value exposure and therefore can produce significant gains or losses in excess of their cost due to unanticipated changes in the market risk factors and the overall market. This use of embedded leverage allows the Fund to increase its market value exposure relative to its net assets and can substantially increase the volatility of the Fund’s performance. In instances where the Fund is using derivatives to decrease, or hedge, exposures to market risk factors for securities held by the Fund, there are also risks that those derivatives may not perform as expected resulting in losses for the combined or hedged positions. Some derivatives have the potential for unlimited loss, regardless of the size of the Fund’s initial investment.
Additional associated risks from investing in derivatives also exist and potentially could have significant effects on the valuation of the derivative and the Fund. Typically, the associated risks are not the risks that the Fund is attempting to increase or decrease exposure to, per its investment objectives, but are the additional risks from investing in derivatives. Examples of these associated risks are liquidity risk, which is the risk that the Fund will not be able to sell the derivative in the open market in a timely manner, and counterparty credit risk, which is the risk that the counterparty will not fulfill its obligation to the Fund.
The Fund’s actual exposures to these market risk factors and associated risks during the period are discussed in further detail, by derivative type, below.
Forward Currency Exchange Contracts
The Fund may enter into forward currency exchange contracts (“forward contracts”) for the purchase or sale of a foreign currency at a negotiated rate at a future date. Such contracts are traded in the OTC inter-bank currency dealer market.
Forward contracts are reported on a schedule following the Consolidated Statement of Investments. The unrealized appreciation (depreciation) is reported in the Consolidated Statement of Assets and Liabilities as a receivable (or payable) and in the Consolidated Statement of Operations within the change in unrealized appreciation (depreciation). At contract close, the difference between the original cost of the contract and the value at the close date is recorded as a realized gain (loss) in the Consolidated Statement of Operations.
The Fund has entered into forward contracts with the obligation to purchase specified foreign currencies in the future at a currently negotiated forward rate in order to take a positive investment perspective on the related currency. These forward contracts seek to increase exposure to foreign exchange rate risk.
The Fund has entered into forward contracts with the obligation to purchase specified foreign currencies in the future at a currently negotiated forward rate in order to decrease exposure to foreign exchange rate risk associated with foreign currency denominated securities held by the Fund.
The Fund has entered into forward contracts with the obligation to sell specified foreign currencies in the future at a currently negotiated forward rate in order to take a negative investment perspective on the related currency. These forward contracts seek to increase exposure to foreign exchange rate risk.
The Fund has entered into forward contracts with the obligation to sell specified foreign currencies in the future at a currently negotiated forward rate in order to decrease exposure to foreign exchange rate risk associated with foreign currency denominated securities held by the Fund.
During the period ended December 31, 2013, the Fund had daily average contract amounts on forward contracts to buy and sell of $1,769,906 and $3,960,945, respectively.
Additional associated risk to the Fund includes counterparty credit risk. Counterparty credit risk arises from the possibility that the counterparty to a forward contract will default and fail to perform its obligations to the Fund.
Futures Contracts
A futures contract is a commitment to buy or sell a specific amount of a commodity, financial instrument or currency at a negotiated price on a stipulated future date. The Fund may buy and sell futures contracts and may also buy or write put or call options on these futures contracts. Futures contracts and options thereon are generally entered into on a regulated futures exchange and cleared through a clearinghouse associated with the exchange.
Upon entering into a futures contract, the Fund is required to deposit either cash or securities (initial margin) in an amount equal to a certain percentage of the contract value in an account registered in the futures commission merchant’s name. Subsequent payments (variation margin) are paid to or from the futures commission merchant each day equal to the daily changes in the contract value. Such payments are recorded as unrealized gains and losses. Should the Fund fail to make requested variation margin payments, the futures commission merchant can gain access to the initial margin to satisfy the Fund’s payment obligations.
Futures contracts are reported on a schedule following the Consolidated Statement of Investments. Securities held by a futures commission merchant to cover initial margin requirements on open futures contracts are noted in the Consolidated Statement of Investments. Cash held by a futures commission merchant to cover initial margin requirements on open futures contracts and the receivable and/or payable for the daily mark to market for the variation margin are noted in the Consolidated Statement of Assets and Liabilities. The net change in unrealized appreciation and depreciation is reported in the Consolidated Statement of Operations. Realized gains (losses) are reported in the Consolidated Statement of Operations at the closing or expiration of futures contracts.
The Fund has sold futures contracts on various bonds and notes to decrease exposure to interest rate risk.
The Fund has purchased futures contracts on various equity indexes to increase exposure to equity risk.
The Fund has sold futures contracts on various equity indexes to decrease exposure to equity risk.
The Fund has sold futures contracts, which have values that are linked to the price movement of the related volatility indexes, in order to decrease exposure to volatility risk.
The Fund has purchased futures contracts, which have values that are linked to the price movement of the related commodities, in order to increase exposure to commodity risk.
25 OPPENHEIMER DIVERSIFIED ALTERNATIVES FUND/VA
| | |
NOTES TO CONSOLIDATED FINANCIAL STATEMENTS Continued |
6. Risk Exposures and the Use of Derivative Instruments (Continued)
During the period ended December 31, 2013, the Fund had an ending monthly average market value of $1,160,749 and $224,140 on futures contracts purchased and sold, respectively.
Additional associated risks of entering into futures contracts (and related options) include the possibility that there may be an illiquid market where the Fund is unable to liquidate the contract or enter into an offsetting position and, if used for hedging purposes, the risk that the price of the contract will correlate imperfectly with the prices of the Fund’s securities.
Option Activity
The Fund may buy and sell put and call options, or write put and call options. When an option is written, the Fund receives a premium and becomes obligated to sell or purchase the underlying security, currency or other underlying financial instrument at a fixed price, upon exercise of the option.
Options can be traded through an exchange or through a privately negotiated arrangement with a dealer in an OTC transaction. Options traded through an exchange are generally cleared through a clearinghouse (such as The Options Clearing Corporation). The difference between the premium received or paid, and market value of the option, is recorded as unrealized appreciation or depreciation. The net change in unrealized appreciation or depreciation is reported in the Consolidated Statement of Operations. When an option is exercised, the cost of the security purchased or the proceeds of the security sale are adjusted by the amount of premium received or paid. Upon the expiration or closing of the option transaction, a gain or loss is reported in the Consolidated Statement of Operations.
The Fund has purchased call options on currencies to increase exposure to foreign exchange rate risk. A purchased call option becomes more valuable as the price of the underlying financial instrument appreciates relative to the strike price.
The Fund has purchased put options on currencies to decrease exposure to foreign exchange rate risk. A purchased put option becomes more valuable as the price of the underlying financial instrument depreciates relative to the strike price.
During the period ended December 31, 2013, the Fund had an ending monthly average market value of $2,205 and $8,891 on purchased call options and purchased put options, respectively.
Options written, if any, are reported in a schedule following the Consolidated Statement of Investments and as a liability in the Consolidated Statement of Assets and Liabilities. Securities held in collateral accounts to cover potential obligations with respect to outstanding written options are noted in the Consolidated Statement of Investments.
The risk in writing a call option is that the market price of the security increases and if the option is exercised, the Fund must either purchase the security at a higher price for delivery or, if the Fund owns the underlying security, give up the opportunity for profit. The risk in writing a put option is that the Fund may incur a loss if the market price of the security decreases and the option is exercised. The risk in buying an option is that the Fund pays a premium whether or not the option is exercised. The Fund also has the additional risk that there may be an illiquid market where the Fund is unable to close the contract.
The Fund has written put options on currencies to increase exposure to foreign exchange rate risk. A written put option becomes more valuable as the price of the underlying financial instrument appreciates relative to the strike price.
The Fund has written call options on currencies to decrease exposure to foreign exchange rate risk. A written call option becomes more valuable as the price of the underlying financial instrument depreciates relative to the strike price.
The Fund has written put options on individual equity securities and/or equity indexes to increase exposure to equity risk. A written put option becomes more valuable as the price of the underlying financial instrument appreciates relative to the strike price.
The Fund has written call options on individual equity securities and/or equity indexes to decrease exposure to equity risk. A written call option becomes more valuable as the price of the underlying financial instrument depreciates relative to the strike price.
During the period ended December 31, 2013, the Fund had an ending monthly average market value of $10,521 and $11,191 on written call options and written put options, respectively.
Additional associated risks to the Fund include counterparty credit risk and liquidity risk.
Written option activity for the period ended December 31, 2013 was as follows:
| | | | | | | | | | | | | | | | |
| | | Call Options | | | Put Options | |
| | | Number of
Contracts | | | Amount of
Premiums | | | Number of
Contracts | | | Amount of
Premiums | |
Options outstanding as of November 14, 2013 (commencement of operations) | | | – | | | $ | – | | | | – | | | $ | – | |
Options written | | | 9,890,916 | | | | 48,041 | | | | 122,811,538 | | | | 26,548 | |
Options closed or expired | | | (4 | ) | | | (120 | ) | | | (61,446,610 | ) | | | (5,931 | ) |
Options exercised | | | (510,906 | ) | | | (41,404 | ) | | | (31,639,800 | ) | | | (6,111 | ) |
| | | | |
Options outstanding as of December 31, 2013 | | | 9,380,006 | | | | $ 6,517 | | | | 29,725,128 | | | | $14,506 | |
| | | | |
Swap Contracts
The Fund may enter into swap contract agreements with a counterparty to exchange a series of cash flows based on either specified reference rates, the price or volatility of asset or non-asset references, or the occurrence of a credit event, over a specified period. Swaps can be executed in a bi-lateral privately negotiated arrangement with a dealer in an OTC transaction (“OTC swaps”) or executed on a regulated market. Certain swaps, regardless of the venue of their execution, are required to be cleared through a clearinghouse (“cleared swaps”). Swap contracts may include interest rate, equity, debt, index, total return, credit default, currency, and volatility swaps.
26 OPPENHEIMER DIVERSIFIED ALTERNATIVES FUND/VA
6. Risk Exposures and the Use of Derivative Instruments (Continued)
Swap contracts are reported on a schedule following the Consolidated Statement of Investments. Daily changes in the value of cleared swaps are reported as variation margin receivable or payable on the Consolidated Statement of Assets and Liabilities. The values of OTC swap contracts are aggregated by positive and negative values and disclosed separately on the Consolidated Statement of Assets and Liabilities. The unrealized appreciation (depreciation) related to the change in the valuation of the notional amount of the swap is combined with the accrued interest due to (owed by) the Fund, if any, at termination or settlement. The net change in this amount during the period is included on the Consolidated Statement of Operations. The Fund also records any periodic payments received from (paid to) the counterparty, including at termination, under such contracts as realized gain (loss) on the Consolidated Statement of Operations.
Swap contract agreements are exposed to the market risk factor of the specific underlying reference rate or asset. Swap contracts are typically more attractively priced compared to similar investments in related cash securities because they isolate the risk to one market risk factor and eliminate the other market risk factors. Investments in cash securities (for instance bonds) have exposure to multiple risk factors (credit and interest rate risk). Because swaps have embedded leverage, they can expose the Fund to substantial risk in the isolated market risk factor.
Interest Rate Swap Contracts. An interest rate swap is an agreement between counterparties to exchange periodic payments based on interest rates. One cash flow stream will typically be a floating rate payment based upon a specified floating interest rate while the other is typically a fixed interest rate.
The Fund has entered into interest rate swaps in which it pays a floating interest rate and receives a fixed interest rate in order to increase exposure to interest rate risk. Typically, if relative interest rates rise, payments made by the Fund under a swap agreement will be greater than the payments received by the Fund.
The Fund has entered into interest rate swaps in which it pays a fixed interest rate and receives a floating interest rate in order to decrease exposure to interest rate risk. Typically, if relative interest rates rise, payments received by the Fund under the swap agreement will be greater than the payments made by the Fund.
For the period ended December 31, 2013, the Fund had ending monthly average notional amounts of $33,237 and $34,085 on interest rate swaps which pay a fixed rate and interest rate swaps which receive a fixed rate, respectively.
Additional associated risks to the Fund include counterparty credit risk and liquidity risk.
Total Return Swap Contracts. A total return swap is an agreement between counterparties to exchange periodic payments based on the value of asset or non-asset references. One cash flow is typically based on a non-asset reference (such as an interest rate) and the other on the total return of a reference asset (such as a security or a basket of securities or securities index). The total return of the reference asset typically includes appreciation or depreciation on the reference asset, plus any interest or dividend payments.
Total return swap contracts are exposed to the market risk factor of the specific underlying financial instrument or index. Total return swaps are less standard in structure than other types of swaps and can isolate and/or include multiple types of market risk factors including equity risk, credit risk, and interest rate risk.
The Fund has entered into total return swaps on various equity securities or indexes to increase exposure to equity risk. These equity risk related total return swaps require the Fund to pay a floating reference interest rate, and an amount equal to the negative price movement of securities or an index (expressed as a percentage) multiplied by the notional amount of the contract. The Fund will receive payments equal to the positive price movement of the same securities or index (expressed as a percentage) multiplied by the notional amount of the contract and, in some cases, dividends paid on the securities.
The Fund has entered into total return swaps on various equity securities or indexes to decrease exposure to equity risk. These equity risk related total return swaps require the Fund to pay an amount equal to the positive price movement of securities or an index (expressed as a percentage) multiplied by the notional amount of the contract and, in some cases, dividends paid on the securities. The Fund will receive payments of a floating reference interest rate and an amount equal to the negative price movement of the same securities or index (expressed as a percentage) multiplied by the notional amount of the contract.
For the period ended December 31, 2013, the Fund had ending monthly average notional amounts of $62,044 and $321,641 on total return swaps which are long the reference asset and total return swaps which are short the reference asset, respectively.
Additional associated risks to the Fund include counterparty credit risk and liquidity risk.
Volatility Swap Contracts. A volatility swap is an agreement between counterparties to exchange periodic payments based on the measured volatility of a reference security, index, currency or other reference investment over a specified time frame. One cash flow is typically based on the realized volatility of the reference investment as measured by changes in its price or level over the specified time period while the other cash flow is based on a specified rate representing expected volatility for the reference investment at the time the swap is executed, or the measured volatility of a different reference investment over the specified time period. The appreciation or depreciation on a volatility swap will typically depend on the magnitude of the reference investment’s volatility, or size of the movements in its price, over the specified time period, rather than general directional increases or decreases in its price.
Volatility swaps are less standard in structure than other types of swaps and provide pure, or isolated, exposure to volatility risk of the specific underlying reference investment. Volatility swaps are typically used to speculate on future volatility levels, to trade the spread between realized and expected volatility, or to decrease the volatility exposure of investments held by the Fund.
Variance swaps are a type of volatility swap where counterparties agree to exchange periodic payments based on the measured variance (or the volatility squared) of a reference security, index, or other reference investment over a specified time period. At payment date, a net cash flow will be exchanged based on the difference between the realized variance of the reference investment over the specified time period and the specified rate representing expected variance for the reference investment at the time the swap is executed multiplied by the notional amount of the contract.
27 OPPENHEIMER DIVERSIFIED ALTERNATIVES FUND/VA
| | |
NOTES TO CONSOLIDATED FINANCIAL STATEMENTS Continued |
6. Risk Exposures and the Use of Derivative Instruments (Continued)
The Fund has entered into volatility swaps to increase exposure to the volatility risk of various reference investments. These types of volatility swaps require the Fund to pay the measured volatility and receive a fixed rate payment. If the measured volatility of the related reference investment increases over the period, the swaps will depreciate in value. Conversely, if the measured volatility of the related reference investment decreases over the period, the swaps will appreciate in value.
The Fund has entered into volatility swaps to decrease exposure to the volatility risk of various reference investments. These types of volatility swaps require the Fund to pay a fixed rate payment and receive the measured volatility. If the measured volatility of the related reference investment increases over the period, the swaps will appreciate in value. Conversely, if the measured volatility of the related reference investment decreases over the period, the swaps will depreciate in value.
For the period ended December 31, 2013, the Fund had ending monthly average notional amounts of $4,996,562 and $501,203 on volatility swaps which pay measured volatility/variance and volatility swaps which receive measured volatility/variance, respectively.
Additional associated risks to the Fund include counterparty credit risk and liquidity risk.
Counterparty Credit Risk. Derivative positions are subject to the risk that the counterparty will not fulfill its obligation to the Fund. The Fund intends to enter into derivative transactions with counterparties that the Manager believes to be creditworthy at the time of the transaction.
The Fund’s risk of loss from counterparty credit risk on OTC derivatives is generally limited to the aggregate unrealized gain netted against any collateral held by the Fund. For OTC options purchased, the Fund bears the risk of loss of the amount of the premiums paid plus the positive change in market values net of any collateral held by the Fund should the counterparty fail to perform under the contracts. Options written by the Fund do not typically give rise to counterparty credit risk, as options written generally obligate the Fund and not the counterparty to perform.
To reduce counterparty risk with respect to OTC transactions, the Fund has entered into master netting arrangements, established within the Fund’s International Swap and Derivatives Association, Inc. (“ISDA”) master agreements, which allow the Fund to make (or to have an entitlement to receive) a single net payment in the event of default (close-out netting) for outstanding payables and receivables with respect to certain OTC positions in swaps, options, swaptions, and forward currency exchange contracts for each individual counterparty. In addition, the Fund may require that certain counterparties post cash and/or securities in collateral accounts to cover their net payment obligations for those derivative contracts subject to ISDA master agreements. If the counterparty fails to perform under these contracts and agreements, the cash and/or securities will be made available to the Fund.
ISDA master agreements include credit related contingent features which allow counterparties to OTC derivatives to terminate derivative contracts prior to maturity in the event that, for example, the Fund’s net assets decline by a stated percentage or the Fund fails to meet the terms of its ISDA master agreements, which would cause the Fund to accelerate payment of any net liability owed to the counterparty.
For financial reporting purposes, the Fund does not offset derivative assets and derivative liabilities that are subject to netting arrangements in the Consolidated Statement of Assets and Liabilities. Bankruptcy or insolvency laws of a particular jurisdiction may impose restrictions on or prohibitions against the right of offset in bankruptcy, insolvency or other events.
The Fund’s risk of loss from counterparty credit risk on exchange-traded derivatives cleared through a clearinghouse and for cleared swaps is generally considered lower than as compared to OTC derivatives. However, counterparty credit risk exists with respect to initial and variation margin deposited/paid by the Fund that is held in futures commission merchant, broker and/or clearinghouse accounts for such exchange-traded derivatives and for cleared swaps.
With respect to cleared swaps, such transactions will be submitted for clearing, and if cleared, will be held in accounts at futures commission merchants or brokers that are members of clearinghouses. While brokers, futures commission merchants and clearinghouses are required to segregate customer margin from their own assets, in the event that a broker, futures commission merchant or clearinghouse becomes insolvent or goes into bankruptcy and at that time there is a shortfall in the aggregate amount of margin held by the broker, futures commission merchant or clearinghouse for all its customers, U.S. bankruptcy laws will typically allocate that shortfall on a pro-rata basis across all the broker’s, futures commission merchant’s or clearinghouse’s customers, potentially resulting in losses to the Fund.
There is the risk that a broker, futures commission merchant or clearinghouse will decline to clear a transaction on the Fund’s behalf, and the Fund may be required to pay a termination fee to the executing broker with whom the Fund initially enters into the transaction. Clearinghouses may also be permitted to terminate cleared swaps at any time. The Fund is also subject to the risk that the broker or futures commission merchant will improperly use the Fund’s assets deposited/paid as initial or variation margin to satisfy payment obligations of another customer. In the event of a default by another customer of the broker or futures commission merchant, the Fund might not receive its variation margin payments from the clearinghouse, due to the manner in which variation margin payments are aggregated for all customers of the broker/futures commission merchant.
Collateral and margin requirements differ by type of derivative. Margin requirements are established by the broker, futures commission merchant or clearinghouse for exchange-traded and cleared derivatives, including cleared swaps. Brokers, futures commission merchants and clearinghouses can ask for margin in excess of the regulatory minimum, or increase the margin amount, in certain circumstances.
Collateral terms are contract specific for OTC derivatives. For derivatives traded under an ISDA master agreement, the collateral requirements are typically calculated by netting the mark to market amount for each transaction under such agreement and comparing that amount to the value of any collateral currently pledged by the Fund or the counterparty.
For financial reporting purposes, cash collateral that has been pledged to cover obligations of the Fund, if any, is reported separately on the Consolidated Statement of Assets and Liabilities as cash pledged as collateral. Non-cash collateral pledged by the Fund, if any, is noted in the Consolidated Statement of Investments. Generally, the amount of collateral due from or to a party must exceed a minimum transfer amount threshold (e.g. $250,000) before a transfer has to be made. To the extent amounts due to the Fund from its counterparties are not fully collateralized, contractually or otherwise, the Fund bears the risk of loss from counterparty nonperformance.
28 OPPENHEIMER DIVERSIFIED ALTERNATIVES FUND/VA
6. Risk Exposures and the Use of Derivative Instruments (Continued)
The following table presents by counterparty the Fund’s OTC derivative assets net of the related collateral posted for the benefit of the Fund at December 31, 2013:
| | | | | | | | | | | | | | | | | | | | |
| | | | | | Gross Amounts Not Offset in the
Consolidated Statement of Assets & Liabilities | | | | |
| Counterparty | | Gross Amount of
Assets in the
Consolidated
Statement of Assets &
Liabilities* | | | Financial Instruments
Available for Offset | | | Financial Instruments
Collateral Received** | | | Cash Collateral
Received** | | | Net Amount | |
Bank of America Corp. | | | $ 4,827 | | | | $ (2,675 | ) | | | $— | | | | $ — | | | | $ 2,152 | |
Bank of America NA | | | 7,894 | | | | (699 | ) | | | — | | | | — | | | | 7,195 | |
Barclays Bank plc | | | 3,722 | | | | — | | | | — | | | | (83 | ) | | | 3,639 | |
BNP Paribas | | | 14,915 | | | | (12,936 | ) | | | — | | | | — | | | | 1,979 | |
Citibank NA | | | 1,829 | | | | (1,060 | ) | | | — | | | | — | | | | 769 | |
Citigroup Funding, Inc. | | | 3,294 | | | | (1,368 | ) | | | — | | | | — | | | | 1,926 | |
Deutsche Bank AG | | | 1,257 | | | | (1,257 | ) | | | — | | | | — | | | | — | |
Goldman Sachs Bank USA | | | 23 | | | | — | | | | — | | | | — | | | | 23 | |
Goldman Sachs Group, Inc. (The) | | | 16,478 | | | | (9,619 | ) | | | — | | | | — | | | | 6,859 | |
JPMorgan Chase & Co. | | | 3,555 | | | | (1,251 | ) | | | — | | | | — | | | | 2,304 | |
JPMorgan Chase Bank NA | | | 10,933 | | | | (10,933 | ) | | | — | | | | — | | | | — | |
Morgan Stanley | | | 55 | | | | (16 | ) | | | — | | | | — | | | | 39 | |
| | | | |
Total | | | $68,782 | | | | $(41,814 | ) | | | $— | | | | $(83) | | | | $26,885 | |
| | | | |
*OTC derivatives are reported gross on the Consolidated Statement of Assets and Liabilities. Exchange traded options and margin related to cleared swaps and futures are excluded from these reported amounts.
**Reported collateral posted for the benefit of the Fund within this table is limited to the net outstanding amount due from an individual counterparty. The collateral posted for the benefit of the Fund may exceed these amounts.
The following table presents by counterparty the Fund’s OTC derivative liabilities net of the related collateral pledged by the Fund at December 31, 2013:
| | | | | | | | | | | | | | | | | | | | |
| | | | | | Gross Amounts Not Offset in the
Consolidated Statement of Assets & Liabilities | | | | |
| Counterparty | | Gross Amount of
Liabilities in the
Consolidated Statement
of Assets & Liabilities* | | | Financial Instruments
Available for Offset | | | Financial Instruments
Collateral Pledged** | | | Cash Collateral
Pledged** | | | Net Amount | |
Bank of America Corp. | | | $ (2,675 | ) | | | $ 2,675 | | | | $— | | | | $— | | | | $ — | |
Bank of America NA | | | (699 | ) | | | 699 | | | | — | | | | — | | | | — | |
BNP Paribas | | | (12,936 | ) | | | 12,936 | | | | — | | | | — | | | | — | |
Citibank NA | | | (1,060 | ) | | | 1,060 | | | | — | | | | — | | | | — | |
Citigroup Funding, Inc. | | | (1,368 | ) | | | 1,368 | | | | — | | | | — | | | | — | |
Deutsche Bank AG | | | (1,809 | ) | | | 1,257 | | | | — | | | | — | | | | (552 | ) |
Goldman Sachs Group, Inc. (The) | | | (9,619 | ) | | | 9,619 | | | | — | | | | — | | | | — | |
JPMorgan Chase & Co. | | | (1,251 | ) | | | 1,251 | | | | — | | | | — | | | | — | |
JPMorgan Chase Bank NA | | | (13,447 | ) | | | 10,933 | | | | — | | | | — | | | | (2,514 | ) |
Morgan Stanley | | | (16 | ) | | | 16 | | | | — | | | | — | | | | — | |
Royal Bank of Scotland plc (The) | | | (1,141 | ) | | | — | | | | — | | | | — | | | | (1,141 | ) |
| | | | |
Total | | | $(46,021) | | | | $41,814 | | | | $— | | | | $— | | | | $(4,207) | |
| | | | |
*OTC derivatives are reported gross on the Consolidated Statement of Assets and Liabilities. Exchange traded options and margin related to cleared swaps and futures are excluded from these reported amounts.
**Reported collateral pledged within this table is limited to the net outstanding amount due from the Fund to an individual counterparty. The securities pledged as collateral by the Fund as reported on the Consolidated Statements of Investments may exceed these amounts.
The following table presents the valuations of derivative instruments by risk exposure as reported within the Consolidated Statement of Assets and Liabilities as of December 31, 2013:
| | | | | | | | | | | | |
| | | Asset Derivatives | | | Liability Derivatives | |
Derivatives Not Accounted for as
Hedging Instruments | | Consolidated Statement of Assets
and Liabilities Location | | Value | | | Consolidated Statement of Assets
and Liabilities Location | | Value | |
Equity contracts | | Swaps, at value | | $ | 14,675 | | | Swaps, at value | | $ | 3,207 | |
Volatility contracts | | Swaps, at value | | | 361 | | | Swaps, at value | | | 147 | |
Commodity contracts | | Variation margins | | | 2,251 | * | | Variation margins | | | 15,843 | * |
Equity contracts | | Variation margins | | | 1,367 | * | | Variation margins | | | 440 | * |
Interest rate contracts | | Variation margins | | | 468 | * | | | | | | |
Volatility contracts | | Variation margins | | | 200 | * | | | | | | |
Foreign exchange contracts | | Unrealized appreciation on foreign currency exchange contracts | | | 32,090 | | | Unrealized depreciation on foreign currency exchange contracts | | | 28,744 | |
Equity contracts | | | | | | | | Options written, at value | | | 3,464 | |
Foreign exchange contracts | | | | | | | | Options written, at value | | | 13,923 | |
Foreign exchange contracts | | Investments, at value | | | 21,656 | ** | | | | | | |
| | | | | | | | | | | | |
Total | | | | $ | 73,068 | | | | | $ | 65,768 | |
| | | | | | | | | | | | |
29 OPPENHEIMER DIVERSIFIED ALTERNATIVES FUND/VA
| | |
NOTES TO CONSOLIDATED FINANCIAL STATEMENTS Continued |
6. Risk Exposures and the Use of Derivative Instruments (Continued)
*Includes only the current day’s variation margin. Prior variation margin movements have been reflected in cash on the Consolidated Statement of Assets and Liabilities upon receipt or payment.
**Amounts relate to purchased option contracts and purchased swaption contracts.
The effect of derivative instruments on the Consolidated Statement of Operations is as follows:
| | | | | | | | | | | | | | | | | | | | | | | | |
| Amount of Realized Gain or (Loss) Recognized on Derivatives | |
Derivatives Not Accounted for
as Hedging Instruments | | Investments from
unaffiliated
companies (including
permiums on options
exercised)* | | | Closing and expiration of option contracts written | | | Closing and expiration of futures contracts | | | Foreign currency
transactions | | | Swap contracts | | | Total | |
Commodity contracts | | $ | — | | | $ | — | | | $ | (156 | ) | | $ | — | | | $ | — | | | $ | (156 | ) |
Equity contracts | | | (5,544 | ) | | | 928 | | | | 15,971 | | | | — | | | | 2,396 | | | | 13,751 | |
Foreign exchange contracts | | | 705 | | | | 5,124 | | | | — | | | | (8,447 | ) | | | — | | | | (2,618 | ) |
Interest rate contracts | | | — | | | | — | | | | 685 | | | | — | | | | (92 | ) | | | 593 | |
Volatility contracts | | | — | | | | — | | | | 1,007 | | | | — | | | | 2,385 | | | | 3,392 | |
| | | | |
Total | | $ | (4,839 | ) | | $ | 6,052 | | | $ | 17,507 | | | $ | (8,447 | ) | | $ | 4,689 | | | $ | 14,962 | |
| | | | |
*Includes purchased option contracts, purchased swaption contracts, written option contracts and written swaption contracts exercised, if any.
| | | | | | | | | | | | | | | | | | | | | | | | |
| Amount of Change in Unrealized Gain or (Loss) Recognized on Derivatives | |
Derivatives Not Accounted
for as Hedging Instruments | | Investments* | | | Option contracts written | | | Futures contracts | | | Translation of
assets and liabilities
denominated in
foreign currencies | | | Swap contracts | | | Total | |
Commodity contracts | | $ | — | | | $ | — | | | $ | 21,620 | | | $ | — | | | $ | — | | | $ | 21,620 | |
Equity contracts | | | — | | | | 1,161 | | | | (4,141 | ) | | | — | | | | 11,468 | | | | 8,488 | |
Foreign exchange contracts | | | 2,440 | | | | 2,475 | | | | — | | | | 3,346 | | | | — | | | | 8,261 | |
Interest rate contracts | | | — | | | | — | | | | 2,202 | | | | — | | | | — | | | | 2,202 | |
Volatility contracts | | | — | | | | — | | | | (102 | ) | | | — | | | | 214 | | | | 112 | |
| | | | |
Total | | $ | 2,440 | | | $ | 3,636 | | | $ | 19,579 | | | $ | 3,346 | | | $ | 11,682 | | | $ | 40,683 | |
| | | | |
*Includes purchased option contracts and purchased swaption contracts, if any.
7. Pending Litigation
Since 2009, seven class action lawsuits have been pending in the U.S. District Court for the District of Colorado against OppenheimerFunds, Inc. (“OFI”), OppenheimerFunds Distributor, Inc., the Fund’s principal underwriter and distributor (the “Distributor”), and certain funds (but not including the Fund) advised by OFI Global Asset Management, Inc. and distributed by the Distributor (the “Defendant Funds”). The lawsuits also name as defendants certain officers and current and former trustees of the respective Defendant Funds. The lawsuits raise claims under federal securities law and allege, among other things, that the disclosure documents of the respective Defendant Funds contained misrepresentations and omissions and that the respective Defendant Funds’ investment policies were not followed. The plaintiffs in these actions seek unspecified damages, equitable relief and awards of attorneys’ fees and litigation expenses. The Defendant Funds’ Boards of Trustees have also engaged counsel to represent the Funds and the present and former Independent Trustees named in those suits. On August 26, 2013, the parties in six of these lawsuits executed a memorandum of understanding setting forth the terms of proposed settlements of those actions. The proposed settlements are subject to a variety of contingencies, including the execution of settlement agreements, which will require preliminary and final approval by the court. The proposed settlements do not resolve a seventh outstanding lawsuit relating to Oppenheimer California Municipal Fund.
Other class action and individual lawsuits have been filed since 2008 in various state and federal courts against OFI and certain of its affiliates by investors seeking to recover investments they allegedly lost as a result of the “Ponzi” scheme run by Bernard L. Madoff and his firm, Bernard L. Madoff Investment Securities, LLC (“BLMIS”). Plaintiffs in these suits allege that they suffered losses as a result of their investments in several funds managed by an affiliate of OFI and assert a variety of claims, including breach of fiduciary duty, fraud, negligent misrepresentation, unjust enrichment, and violation of federal and state securities laws and regulations, among others. They seek unspecified damages, equitable relief and awards of attorneys’ fees and litigation expenses. Neither the Distributor, nor any of the Oppenheimer mutual funds, their independent trustees or directors are named as defendants in these lawsuits. None of the Oppenheimer mutual funds invested in any funds or accounts managed by Madoff or BLMIS. On February 28, 2011, a stipulation of partial settlement of three groups of consolidated putative class action lawsuits relating to these matters was filed in the U.S. District Court for the Southern District of New York. On August 19, 2011, the court entered an order and final judgment approving the settlement as fair, reasonable and adequate. In September 2011, certain parties filed notices of appeal from the court’s order approving the settlement. The settlement does not resolve other outstanding lawsuits against OFI and its affiliates relating to BLMIS.
On April 16, 2010, a lawsuit was filed in New York state court against (i) OFI, (ii) an affiliate of OFI and (iii) AAArdvark IV Funding Limited (“AAArdvark IV”), an entity advised by OFI’s affiliate, in connection with investments made by the plaintiffs in AAArdvark IV. Plaintiffs allege breach of contract and common law fraud claims against the defendants and seek compensatory damages, costs and disbursements, including attorney fees. On April 11, 2013, the court granted defendants’ motion for summary judgment, dismissing plaintiffs’ fraud claim with prejudice and dismissing their
30 OPPENHEIMER DIVERSIFIED ALTERNATIVES FUND/VA
7. Pending Litigation (Continued)
contract claim without prejudice, and granted plaintiffs leave to replead their contract claim to assert a cause of action for specific performance within 30 days. On May 9, 2013, plaintiffs filed a notice of appeal from the court’s dismissal order. On January 7, 2014, the appellate court affirmed the trial court’s dismissal order. On July 15, 2011, a lawsuit was filed in New York state court against OFI, an affiliate of OFI and AAArdvark Funding Limited (“AAArdvark I”), an entity advised by OFI’s affiliate, in connection with investments made by the plaintiffs in AAArdvark I. The complaint alleges breach of contract and common law fraud claims against the defendants and seeks compensatory damages, costs and disbursements, including attorney fees. On November 9, 2011, a lawsuit was filed in New York state court against OFI, an affiliate of OFI and AAArdvark XS Funding Limited (“AAArdvark XS”), an entity advised by OFI’s affiliate, in connection with investments made by the plaintiffs in AAArdvark XS. The complaint alleged breach of contract against the defendants and sought compensatory damages, costs and disbursements, including attorney fees. On November 8, 2013, the parties filed a stipulation of discontinuance dismissing the lawsuit with prejudice.
OFI believes the lawsuits and appeals described above are without legal merit and, with the exception of actions it has settled, is defending against them vigorously. While it is premature to render any opinion as to the outcome in these lawsuits, or whether any costs that the Defendant Funds may bear in defending the suits might not be reimbursed by insurance, OFI believes that these suits should not impair the ability of OFI or the Distributor to perform their respective duties to the Fund, and that the outcome of all of the suits together should not have any material effect on the operations of any of the Oppenheimer mutual funds.
31 OPPENHEIMER DIVERSIFIED ALTERNATIVES FUND/VA
| | |
REPORT OF INDEPENDENT REGISTERED PUBLIC ACCOUNTING FIRM |
The Board of Trustees and Shareholders of Oppenheimer Variable Account Funds:
We have audited the accompanying consolidated statement of assets and liabilities of Oppenheimer Diversified Alternatives Fund/VA (a separate series of Oppenheimer Variable Account Funds) and subsidiary, including the consolidated statement of investments, as of December 31, 2013, and the related consolidated statement of operations, the consolidated statement of changes in net assets and the consolidated financial highlights for the period from November 14, 2013 (commencement of operations) to December 31, 2013. These consolidated financial statements and financial highlights are the responsibility of the Fund’s management. Our responsibility is to express an opinion on these consolidated financial statements and financial highlights based on our audit.
We conducted our audit in accordance with the standards of the Public Company Accounting Oversight Board (United States). Those standards require that we plan and perform the audit to obtain reasonable assurance about whether the consolidated financial statements and financial highlights are free of material misstatement. An audit includes examining, on a test basis, evidence supporting the amounts and disclosures in the consolidated financial statements. Our procedures included confirmation of securities owned as of December 31, 2013, by correspondence with the custodian. An audit also includes assessing the accounting principles used and significant estimates made by management, as well as evaluating the overall financial statement presentation. We believe that our audit provides a reasonable basis for our opinion.
In our opinion, the consolidated financial statements and financial highlights referred to above present fairly, in all material respects, the financial position of Oppenheimer Diversified Alternatives Fund/VA and subsidiary as of December 31, 2013, the results of their operations, the changes in their net assets and the financial highlights for the period from November 14, 2013 (commencement of operations) to December 31, 2013, in conformity with U.S. generally accepted accounting principles.
KPMG LLP
Denver, Colorado
February 19, 2014
32 OPPENHEIMER DIVERSIFIED ALTERNATIVES FUND/VA
| | |
FEDERAL INCOME TAX INFORMATION Unaudited |
In early 2014, if applicable, shareholders of record received information regarding all dividends and distributions paid to them by the Fund during calendar year 2013.
Dividends, if any, paid by the Fund during the fiscal year ended December 31, 2013 which are not designated as capital gain distributions should be multiplied by the maximum amount allowable but not less than 2.65% to arrive at the amount eligible for the corporate dividend-received deduction
The foregoing information is presented to assist shareholders in reporting distributions received from the Fund to the Internal Revenue Service. Because of the complexity of the federal regulations which may affect your individual tax return and the many variations in state and local tax regulations, we recommend that you consult your tax advisor for specific guidance.
33 OPPENHEIMER DIVERSIFIED ALTERNATIVES FUND/VA
BOARD APPROVAL OF THE FUND’S INVESTMENT ADVISORY AND SUB-ADIVSORY AGREEMENTS Unaudited
The Fund has entered into an investment advisory agreement with OFI Global Asset Management, Inc. (“OFI Global” or the “Adviser”), a wholly-owned subsidiary of OppenheimerFunds, Inc. (“OFI” or the “Sub-Adviser”) (“OFI Global” and “OFI” together the “Managers”) and OFI Global has entered into a sub-advisory agreement with OFI whereby OFI provides investment sub-advisory services to the Fund (collectively, the “Agreements”). The Board of Trustees (the “Board”), including a majority of the independent Trustees, is required to determine whether to approve the Agreements. The Investment Company Act of 1940, as amended, requires that the Board request and evaluate, and that the Managers provide, such information as may be reasonably necessary to evaluate the terms of the Agreements. The Board employs an independent consultant to prepare a report that provides information, including comparative information that the Board requests for that purpose.
In approving the Fund’s Agreements, the Board considered information provided by the Managers on the following factors: (i) the nature, quality and extent of the Managers’ services to be provided, (ii) the fees and other projected expenses of the Fund, including estimated and comparative expense information, (iii) whether economies of scale may be realized as the Fund grows and whether fee levels reflect these economies of scale for Fund investors and (iv) other benefits that the Managers may receive from their relationship with the Fund. The Board was aware that there are alternatives to retaining the Managers.
Outlined below is a summary of the principal information considered by the Board as well as the Board’s conclusions.
Nature, Quality and Extent of Services. The Board considered information about the nature, quality and extent of the services to be provided to the Fund and information regarding the Managers’ key personnel who will provide such services. The Sub-Adviser’s duties will include providing the Fund with the services of the portfolio managers and the Sub-Adviser’s investment team, who will provide research, analysis and other advisory services in regard to the Fund’s investments; securities trading services; oversight of third-party service providers; monitoring compliance with applicable Fund policies and procedures and adherence to the Fund’s investment restrictions; and risk management. The Managers will be responsible for providing certain administrative services to the Fund as well. Those services include providing and supervising all administrative and clerical personnel who are necessary in order to provide effective corporate administration for the Fund; compiling and maintaining records with respect to the Fund’s operations; preparing and filing reports required by the Securities and Exchange Commission; preparing periodic reports regarding the operations of the Fund for its shareholders; preparing proxy materials for shareholder meetings; and preparing the registration statements required by Federal and state securities laws for the sale of the Fund’s shares. The Managers will also provide the Fund with office space, facilities and equipment.
The Board also considered the quality of the services expected to be provided and the quality of the Managers’ resources that will be available to the Fund. The Board took account of the fact that the Sub-Adviser has had over fifty years of experience as an investment adviser and that its assets under management rank it among the top mutual fund managers in the United States. The Board evaluated the Sub-Adviser’s advisory, administrative, accounting, legal, compliance services and risk management, and information the Board has received regarding the experience and professional qualifications of the Managers’ key personnel and the size and functions of its staff. In its evaluation of the quality of the portfolio management services provided, the Board considered the experience of Mark Hamilton, David Wharmby, and Brian Watson, the portfolio managers for the Fund, and the Sub-Adviser’s investment team and analysts. The Board members also considered the totality of their experiences with the Managers as directors or trustees of the Fund and other funds advised by the Managers. The Board considered information regarding the quality of services provided by affiliates of the Managers, which its members have become knowledgeable about in connection with the renewal of the Fund’s service agreements. The Board concluded, in light of the Managers’ experience, reputation, personnel, operations and resources that the Fund should benefit from the services to be provided under the Agreements.
Costs of Services by the Adviser. The Board reviewed the fees to be paid to the Manager and the other expenses to be borne by the Fund. Due to the limited number of “Multialternative”VA peer funds, the Board reviewed the Morningstar World Allocation and Mutlialternative categories for select unaffiliated retail and VA funds. Based on this comparative universe, the Board considered that the proposed management fee would be higher than the peer group median and the peer group average. The Board also considered that the Fund’s gross total expenses would be lower than the peer group median and peer group average but that its net total expenses would be higher than the peer group median and peer group average. In reviewing the fees and expenses to be charged to the Fund, the Board considered the Manager’s assertion that, because there is much greater disparity in the fees and services that may be provided by a manager to a VA fund as opposed to a retail fund, when comparing the expenses of the Fund to those of retail funds, it is most appropriate to focus on total expenses (rather than on the management fees). Accordingly, while the Board reviewed and considered all expenses, it focused on total expenses. The Board further considered that the Manager has contractually agreed to limit the Fund’s total annual operating expenses so that those expenses, as percentages of daily net assets, will not exceed the annual rate of 1.20% for Non-Service Shares and 1.45% for Service Shares. This waiver and/or reimbursement may not be amended or withdrawn for one year from the date of the Fund’s prospectus.
Performance. The Board considered that the Fund has no operational history and that its performance could not be a factor in deciding whether to approve the Agreements.
Economies of Scale. The Board considered information regarding the Managers’ anticipated costs in serving as the Fund’s investment adviser and sub-adviser, including the costs associated with the personnel and systems necessary to manage the Fund. The Board reviewed whether the Managers may realize economies of scale in managing and supporting the Fund. The Board noted that the Fund has management fee breakpoints, which are intended to share with Fund shareholders economies of scale that may exist as the Fund’s assets grow.
Other Benefits to the Managers. The Board considered information that was provided regarding the direct and indirect benefits the Managers may receive as a result of their relationship with the Fund, including compensation that may be paid to the Managers’ affiliates and research that may be provided to the Adviser in connection with permissible brokerage arrangements (soft dollar arrangements). The Board also considered that the Managers must be able to pay and retain experienced professional personnel at competitive rates to provide quality services to the Fund.
Conclusions. These factors were also considered by the independent Trustees meeting separately from the full Board, assisted by experienced counsel to the Fund and to the independent Trustees. Fund counsel and the independent Trustees’ counsel are independent of the Managers within the meaning and intent of the Securities and Exchange Commission Rules.
34 OPPENHEIMER DIVERSIFIED ALTERNATIVES FUND/VA
Based on its review of the information it received and its evaluations described above, the Board, including a majority of the independent Trustees, decided to approve the Agreements through August 20, 2015. In arriving at its decision, the Board did not identify any factor or factors as being more important than others, but considered all of the above information, and considered the terms and conditions of the Agreements, including the management fees, in light of all the surrounding circumstances.
35 OPPENHEIMER DIVERSIFIED ALTERNATIVES FUND/VA
PORTFOLIO PROXY VOTING POLICIES AND PROCEDURES; UPDATES TO STATEMENTS OF INVESTMENTS Unaudited / Continued
The Fund has adopted Portfolio Proxy Voting Policies and Procedures under which the Fund votes proxies relating to securities (“portfolio proxies”) held by the Fund. A description of the Fund’s Portfolio Proxy Voting Policies and Procedures is available (i) without charge, upon request, by calling the Fund toll-free at 1.800.CALL OPP (225.5677), (ii) on the Fund’s website at oppenheimerfunds.com, and (iii) on the SEC’s website at www.sec.gov. In addition, the Fund is required to file Form N-PX, with its complete proxy voting record for the 12 months ended June 30th, no later than August 31st of each year. The Fund’s voting record is available (i) without charge, upon request, by calling the Fund toll-free at 1.800.CALL OPP (225.5677), and (ii) in the Form N-PX filing on the SEC’s website at www.sec.gov.
The Fund files its complete schedule of portfolio holdings with the SEC for the first quarter and the third quarter of each fiscal year on Form N-Q. The Fund’s Form N-Q filings are available on the SEC’s website at www.sec.gov. Those forms may be reviewed and copied at the SEC’s Public Reference Room in Washington, D.C. Information on the operation of the Public Reference Room may be obtained by calling 1-800-SEC-0330.
36 OPPENHEIMER DIVERSIFIED ALTERNATIVES FUND/VA
| | |
TRUSTEES AND OFFICERS Unaudited |
| | |
| |
Name, Position(s) Held with the Fund, Length of
Service, Year of Birth | | Principal Occupation(s) During the Past 5 Years; Other Trusteeships/Directorships Held; Number of Portfolios in the Fund Complex Currently Overseen |
| |
INDEPENDENT TRUSTEES | | The address of each Trustee in the chart below is 6803 S. Tucson Way, Centennial, Colorado 80112-3924. Each Trustee serves for an indefinite term, or until his or her resignation, retirement, death or removal. |
| |
Sam Freedman, Chairman of the Board of Trustees and Trustee (since 2013) Year of Birth: 1940 | | Director of Colorado UpLIFT (charitable organization) (since September 1984). Mr. Freedman held several positions with the Sub-Adviser and with subsidiary or affiliated companies of the Sub-Adviser (until October 1994). Oversees 39 portfolios in the OppenheimerFunds complex. Mr. Freedman has served on the Boards of certain Oppenheimer funds since 1996, during which time he has become familiar with the Fund’s (and other Oppenheimer funds’) financial, accounting, regulatory and investment matters and has contributed to the Boards’ deliberations. |
| |
Edward L. Cameron, Trustee (since 2013) Year of Birth: 1938 | | Member of The Life Guard of Mount Vernon (George Washington historical site) (June 2000-June 2006); Partner of PricewaterhouseCoopers LLP (accounting firm) (July 1974-June 1999); Chairman of Price Waterhouse LLP Global Investment Management Industry Services Group (accounting firm) (July 1994-June 1998). Oversees 39 portfolios in the OppenheimerFunds complex. Mr. Cameron has served on the Boards of certain Oppenheimer funds since 1999, during which time he has become familiar with the Fund’s (and other Oppenheimer funds’) financial, accounting, regulatory and investment matters and has contributed to the Boards’ deliberations. |
| |
Jon S. Fossel, Trustee (since 2013) Year of Birth: 1942 | | Chairman of the Board (2006-December 2011) and Director (June 2002-December 2011) of UNUMProvident (insurance company); Director of Northwestern Energy Corp. (public utility corporation) (November 2004-December 2009); Director of P.R. Pharmaceuticals (October 1999-October 2003); Director of Rocky Mountain Elk Foundation (non-profit organization) (February 1998-February 2003 and February 2005-February 2007); Chairman and Director (until October 1996) and President and Chief Executive Officer (until October 1995) of the Sub-Adviser; President, Chief Executive Officer and Director of the following: Oppenheimer Acquisition Corp. (“OAC”) (parent holding company of the Sub-Adviser), Shareholders Services, Inc. and Shareholder Financial Services, Inc. (until October 1995). Oversees 39 portfolios in the OppenheimerFunds complex. Mr. Fossel has served on the Boards of certain Oppenheimer funds since 1990, during which time he has become familiar with the Fund’s (and other Oppenheimer funds’) financial, accounting, regulatory and investment matters and has contributed to the Boards’ deliberations. |
| |
Richard F. Grabish, Trustee (since 2013) Year of Birth: 1948 | | Formerly Senior Vice President and Assistant Director of Sales and Marketing (March 1997-December 2007), Director (March 1987-December 2007) and Manager of Private Client Services (June 1985-June 2005) of A.G. Edwards & Sons, Inc. (broker/dealer and investment firm); Chairman and Chief Executive Officer of A.G. Edwards Trust Company, FSB (March 2001-December 2007); President and Vice Chairman of A.G. Edwards Trust Company, FSB (investment adviser) (April 1987-March 2001); President of A.G. Edwards Trust Company, FSB (investment adviser) (June 2005-December 2007). Oversees 39 portfolios in the OppenheimerFunds complex. Mr. Grabish has served on the Boards of certain Oppenheimer funds since 2001, during which time he has become familiar with the Fund’s (and other Oppenheimer funds’) financial, accounting, regulatory and investment matters and has contributed to the Boards’ deliberations. |
| |
Beverly L. Hamilton, Trustee (since 2013) Year of Birth: 1946 | | Trustee of Monterey Institute for International Studies (educational organization) (since February 2000); Board Member of Middlebury College (educational organization) (December 2005-June 2011); Chairman (since 2010) of American Funds’ Emerging Markets Growth Fund, Inc. (mutual fund); Director of The California Endowment (philanthropic organization) (April 2002-April 2008); Director (February 2002-2005) and Chairman of Trustees (2006-2007) of the Community Hospital of Monterey Peninsula; Director (October 1991-2005); Vice Chairman (2006-2009) of American Funds’ Emerging Markets Growth Fund, Inc. (mutual fund); President of ARCO Investment Management Company (February 1991-April 2000); Member of the investment committees of The Rockefeller Foundation (2001-2006) and The University of Michigan (since 2000); Advisor at Credit Suisse First Boston’s Sprout venture capital unit (venture capital fund) (1994-January 2005); Trustee of MassMutual Institutional Funds (investment company) (1996-June 2004); Trustee of MML Series Investment Fund (investment company) (April 1989-June 2004); Member of the investment committee of Hartford Hospital (2000-2003); and Advisor to Unilever (Holland) pension fund (2000-2003). Oversees 39 portfolios in the OppenheimerFunds complex. Ms. Hamilton has served on the Boards of certain Oppenheimer funds since 2002, during which time she has become familiar with the Fund’s (and other Oppenheimer funds’) financial, accounting, regulatory and investment matters and has contributed to the Boards’ deliberations. |
| |
Victoria J. Herget, Trustee (since 2013) Year of Birth:1951 | | Independent Director of the First American Funds (mutual fund family) (2003-2011); former Managing Director (1993-2001), Principal (1985-1993), Vice President (1978-1985) and Assistant Vice President (1973-1978) of Zurich Scudder Investments (and its predecessor firms); Board Chair (2008-Present) and Director (2004-Present), United Educators (insurance company); Trustee (1992-2007), Chair of the Board of Trustees (1999-2007), Investment Committee Chair (1994-1999) and Investment Committee member (2007-2010) of Wellesley College; Trustee (since 2000) and Chair (since 2010), Newberry Library; Trustee, Mather LifeWays (since 2001); Trustee, BoardSource (2006-2009) and Chicago City Day School (1994-2005). Oversees 39 portfolios in the OppenheimerFunds complex. Ms. Herget has served on the Boards of certain Oppenheimer funds since 2012, during which time she has become familiar with the Fund’s (and other Oppenheimer funds’) financial, accounting, regulatory and investment matters and has contributed to the Boards’ deliberations. |
| |
Robert J. Malone, Trustee (since 2013) Year of Birth: 1944 | | Chairman of the Board (since 2012) and Director (since August 2005) of Jones International University (educational organization) (since August 2005); Chairman, Chief Executive Officer and Director of Steele Street Bank Trust (commercial banking) (since August 2003); Trustee of the Gallagher Family Foundation (non-profit organization) (since 2000); Board of Directors of Opera Colorado Foundation (non-profit organization) (2008-2012); Director of Colorado UpLIFT (charitable organization) (1986-2010); Director of Jones Knowledge, Inc. (2006-2010); Former Chairman of U.S. Bank-Colorado (subsidiary |
37 OPPENHEIMER DIVERSIFIED ALTERNATIVES FUND/VA
| | |
TRUSTEES AND OFFICERS Unaudited / Continued |
| | |
Robert J. Malone, Continued | | of U.S. Bancorp and formerly Colorado National Bank) (July 1996-April 1999); Director of Commercial Assets, Inc. (real estate investment trust) (1993-2000); Director of U.S. Exploration, Inc. (oil and gas exploration) (1997-February 2004); Chairman of the Board (1991-1994) and Trustee (1985-1994) of Regis University; and Chairman of the Board (1990-1991 and Trustee (1984-1999) of Young Presidents Organization. Oversees 39 portfolios in the OppenheimerFunds complex. Mr. Malone has served on the Boards of certain Oppenheimer funds since 2002, during which time he has become familiar with the Fund’s (and other Oppenheimer funds’) financial, accounting, regulatory and investment matters and has contributed to the Boards’ deliberations. |
| |
F. William Marshall, Jr., Trustee (since 2013) Year of Birth: 1942 | | Trustee Emeritus of Worcester Polytech Institute (WPI) (private university) (since 2009); Trustee of MassMutual Select Funds (formerly MassMutual Institutional Funds) (investment company) (since 1996), MML Series Investment Fund (investment company) (since 1996) and Mass Mutual Premier Funds (investment company) (since January 2012); President and Treasurer of the SIS Fund (private charitable fund) (January 1999 – March 2011); Former Trustee of WPI (1985-2008); Former Chairman of the Board (2004-2006) and Former Chairman of the Investment Committee of WPI (1994-2008); Chairman of SIS & Family Bank, F.S.B. (formerly SIS Bank) (commercial bank) (January 1999-July 1999); Executive Vice President of Peoples Heritage Financial Group, Inc. (commercial bank) (January 1999-July 1999); and Former President and Chief Executive Officer of SIS Bancorp. (1993-1999). Oversees 43 portfolios in the OppenheimerFunds complex. Mr. Marshall has served on the Boards of certain Oppenheimer funds since 2000, during which time he has become familiar with the Fund’s (and other Oppenheimer funds’) financial, accounting, regulatory and investment matters and has contributed to the Boards’ deliberations. |
| |
Karen L. Stuckey, Trustee (since 2013) Year of Birth: 1953 | | Partner (1990-2012) of PricewaterhouseCoopers LLP (held various positions 1975-1990); Emeritus Trustee (since 2006), Trustee (1992-2006) and member of Executive, Nominating and Audit Committees and Chair of Finance Committee of Lehigh University; and member, Women’s Investment Management Forum since inception. Oversees 39 portfolios in the OppenheimerFunds complex. Ms. Stuckey has served on the Boards of certain Oppenheimer funds since 2012, during which time she has become familiar with the Fund’s (and other Oppenheimer funds’) financial, accounting, regulatory and investment matters and has contributed to the Boards’ deliberations. |
| |
James D. Vaughn, Trustee (since 2013) Year of Birth: 1945 | | Retired; former managing partner (1994-2001) of Denver office of Deloitte & Touche LLP, (held various positions 1969-1993); Trustee and Chairman of the Audit Committee of Schroder Funds (2003-2012); Board member and Chairman of Audit Committee of AMG National Trust Bank (since 2005); Trustee and Investment Committee member, University of South Dakota Foundation (since 1996); Board member, Audit Committee Member and past Board Chair, Junior Achievement (since 1993); former Board member, Mile High United Way, Boys and Girls Clubs, Boy Scouts, Colorado Business Committee for the Arts, Economic Club of Colorado and Metro Denver Network. Oversees 39 portfolios in the OppenheimerFunds complex. Mr. Vaughn has served on the Boards of certain Oppenheimer funds since 2012, during which time he has become familiar with the Fund’s (and other Oppenheimer funds’) financial, accounting, regulatory and investment matters and has contributed to the Boards’ deliberations. |
| | |
INTERESTED TRUSTEE AND OFFICER | | Mr. Glavin is an “Interested Trustee” because he is affiliated with the Manager and the Sub-Adviser by virtue of his positions as an officer and director of the Manager and a director of the Sub-Adviser, and as a shareholder of the Sub-Adviser’s parent company. Both as a Trustee and as an officer, he serves for an indefinite term, or until his resignation, retirement, death or removal. Mr. Glavin’s address is Two World Financial Center, 225 Liberty Street, 11th Floor, New York, New York 10281-1008. |
| |
William F. Glavin, Jr., Trustee, President and Principal Executive Officer (since 2013) Year of Birth: 1958 | | Director, Chairman and Chief Executive Officer of the Manager (since January 2013); President of the Manager (January 2013-May 2013); Chairman of the Sub-Adviser (December 2009-December 2012); Chief Executive Officer (January 2009-December 2012) and Director of the Sub-Adviser (since January 2009); President of the Sub-Adviser (May 2009-December 2012); Management Director (since June 2009), President (since December 2009) and Chief Executive Officer (since January 2011) of Oppenheimer Acquisition Corp. (“OAC”) (the Sub-Adviser’s parent holding company); Director of Oppenheimer Real Asset Management, Inc. (since March 2010); Executive Vice President (March 2006-February 2009) and Chief Operating Officer (July 2007-February 2009) of Massachusetts Mutual Life Insurance Company (OAC’s parent company); Director (May 2004-March 2006) and Chief Operating Officer and Chief Compliance Officer (May 2004-January 2005), President (January 2005-March 2006) and Chief Executive Officer (June 2005-March 2006) of Babson Capital Management LLC; Director (March 2005-March 2006), President (May 2003-March 2006) and Chief Compliance Officer (July 2005-March 2006) of Babson Capital Securities, Inc. (a broker-dealer); President (May 2003-March 2006) of Babson Investment Company, Inc.; Director (May 2004-August 2006) of Babson Capital Europe Limited; Director (May 2004-October 2006) of Babson Capital Guernsey Limited; Director (May 2004-March 2006) of Babson Capital Management LLC; Non-Executive Director (March 2005-March 2007) of Baring Asset Management Limited; Director (February 2005-June 2006) Baring Pension Trustees Limited; Director and Treasurer (December 2003-November 2006) of Charter Oak Capital Management, Inc.; Director (May 2006-September 2006) of C.M. Benefit Insurance Company; Director (May 2008-June 2009) and Executive Vice President (June 2007-July 2009) of C.M. Life Insurance Company; President (March 2006-May 2007) of MassMutual Assignment Company; Director (January 2005-December 2006), Deputy Chairman (March 2005-December 2006) and President (February 2005-March 2005) of MassMutual Holdings (Bermuda) Limited; Director (May 2008-June 2009) and Executive Vice President (June 2007-July 2009) of MML Bay State Life Insurance Company; Chief Executive Officer and President (April 2007-January 2009) of MML Distributors, LLC; and Chairman (March 2006-December 2008) and Chief Executive Officer (May 2007-December 2008) of MML Investors Services, Inc. An officer of 90 portfolios in the OppenheimerFunds complex. |
| | |
OTHER OFFICERS OF THE FUND | | The addresses of the Officers in the chart below are as follows: for Messrs. Hamilton and Gabinet and Ms. Nasta, Two World Financial Center, 225 Liberty Street, New York, New York 10281-1008, for Messrs. Vandehey and Wixted, 6803 S. Tucson Way, Centennial, Colorado 80112-3924. Each Officer serves for an indefinite term or until his or her resignation, retirement, death or removal. |
38 OPPENHEIMER DIVERSIFIED ALTERNATIVES FUND/VA
| | |
| |
Mark Hamilton Vice President (since 2013) Year of Birth: 1965 | | Chief Investment Officer, Asset Allocation of the Sub-Adviser (since April 2013) and a Senior Vice President of the Sub-Adviser (since April 2013). Mr. Hamilton served at AllianceBernstein L.P. (from 1994-2013), as an Investment Director of Dynamic Asset Allocation (from 2010-2013), Head of North American Blend Team (from 2009-2010), and Senior Portfolio Manager of Blend Strategies (from 2006-2010). A portfolio manager and officer of other portfolios in the OppenheimerFunds complex. |
| |
Arthur S. Gabinet, Secretary and Chief Legal Officer (since 2013) Year of Birth: 1958 | | Executive Vice President, Secretary and General Counsel of the Manager (since January 2013); General Counsel OFI SteelPath, Inc. (since January 2013); Executive Vice President (May 2010-December 2012) and General Counsel (since January 2011) of the Sub-Adviser; General Counsel of the Distributor (since January 2011); General Counsel of Centennial Asset Management Corporation (January 2011-December 2012); Executive Vice President (January 2011-December 2012) and General Counsel of HarbourView Asset Management Corporation (since January 2011); Assistant Secretary (since January 2011) and Director (since January 2011) of OppenheimerFunds International Ltd. and OppenheimerFunds plc; Director of Oppenheimer Real Asset Management, Inc. (January 2011-December 2012) and General Counsel (since January 2011); Executive Vice President (January 2011-December 2011) and General Counsel of Shareholder Financial Services, Inc. and Shareholder Services, Inc. (since January 2011); Executive Vice President (January 2011-December 2012) and General Counsel of OFI Private Investments Inc. (since January 2011); Vice President of OppenheimerFunds Legacy Program (January 2011-December 2011); Executive Vice President (January 2011-December 2012) and General Counsel of OFI Institutional Asset Management, Inc. (since January 2011); General Counsel, Asset Management of the Sub-Adviser (May 2010-December 2010); Principal, The Vanguard Group (November 2005-April 2010); District Administrator, U.S. Securities and Exchange Commission (January 2003-October 2005). An officer of 90 portfolios in the OppenheimerFunds complex. |
| |
Christina M. Nasta, Vice President and Chief Business Officer (since 2013) Year of Birth: 1973 | | Senior Vice President of OppenheimerFunds Distributor, Inc. (since January 2013); Senior Vice President of the Sub-Adviser (July 2010-December 2012); Vice President of the Sub-Adviser (January 2003-July 2010); Vice President of OppenheimerFunds Distributor, Inc. (January 2003-July 2010). An officer of 90 portfolios in the OppenheimerFunds complex. |
| |
Mark S. Vandehey, Vice President and Chief Compliance Officer (since 2013) Year of Birth: 1950 | | Senior Vice President and Chief Compliance Officer of the Manager (since January 2013); Chief Compliance Officer of OFI SteelPath, Inc. (since January 2013); Senior Vice President of the Sub-Adviser (March 2004-December 2012); Chief Compliance Officer of the Sub-Adviser, OppenheimerFunds Distributor, Inc., OFI Trust Company, OFI Institutional Asset Management, Inc., Oppenheimer Real Asset Management, Inc., OFI Private Investments, Inc., Harborview Asset Management Corporation, Trinity Investment Management Corporation, and Shareholder Services, Inc. (since March 2004); Vice President of OppenheimerFunds Distributor, Inc., Centennial Asset Management Corporation and Shareholder Services, Inc. (June 1983-December 2012). An officer of 90 portfolios in the OppenheimerFunds complex. |
| |
Brian W. Wixted, Treasurer and Principal Financial & Accounting Officer (since 2013) Year of Birth: 1959 | | Senior Vice President of the Manager (since January 2013); Treasurer of the Sub-Adviser, HarbourView Asset Management Corporation, Shareholder Financial Services, Inc., Shareholder Services, Inc., and Oppenheimer Real Asset Management, Inc. (March 1999-June 2008), OFI Private Investments, Inc. (March 2000-June 2008), OppenheimerFunds International Ltd. and OppenheimerFunds plc (since May 2000), OFI Institutional Asset Management, Inc. (November 2000-June 2008), and OppenheimerFunds Legacy Program (charitable trust program established by the Sub-Adviser) (June 2003-December 2011); Treasurer and Chief Financial Officer of OFI Trust Company (since May 2000); Assistant Treasurer of Oppenheimer Acquisition Corporation (March 1999-June 2008). An officer of 90 portfolios in the OppenheimerFunds complex. |
The Fund’s Statement of Additional Information contains additional information about the Fund’s Trustees and Officers and is available without charge, upon request, by calling 1.800.988.8287.
39 OPPENHEIMER DIVERSIFIED ALTERNATIVES FUND/VA
OPPENHEIMER DIVERSIFIED ALTERNATIVES FUND/VA
| | |
| A Series of Oppenheimer Variable Account Funds |
| |
| Manager | | OFI Global Asset Management, Inc. |
| |
| Sub-Adviser | | OppenheimerFunds, Inc. |
| |
| Distributor | | OppenheimerFunds Distributor, Inc. |
| |
Transfer and Shareholder Servicing Agent | | OFI Global Asset Management, Inc. |
| |
| Sub-Transfer Agent | | Shareholder Services, Inc. OppenheimerFunds Services |
| |
Independent Registered Public
Accounting Firm | | KPMG LLP |
| |
| Counsel | | K&L Gates LLP |
| |
| | Before investing, investors should carefully consider a fund’s investment objectives, risks, charges and expenses. Fund prospectuses and summary prospectuses contain this and other information about the funds, and may be obtained by asking your financial advisor, or calling us at 1.800.988.8287. Read prospectuses and summary prospectuses carefully before investing. |
| |
| | © 2014 OppenheimerFunds, Inc. All rights reserved. Oppenheimer funds are distributed by OppenheimerFunds Distributor, Inc. |

Item 2. Code of Ethics.
The registrant has adopted a code of ethics that applies to the registrant’s principal executive officer, principal financial officer, principal accounting officer or controller or persons performing similar functions.
Item 3. Audit Committee Financial Expert.
The Board of Trustees of the registrant has determined that F. William Marshall, Jr., the Chairman of the Board’s Audit Committee, is the audit committee financial expert and that Mr. Marshall is “independent” for purposes of this Item 3.
Item 4. Principal Accountant Fees and Services.
The principal accountant for the audit of the registrant’s annual financial statements billed $308,000 in fiscal 2013 and $288,400 in fiscal 2012.
The principal accountant for the audit of the registrant’s annual financial statements billed $1,500 in fiscal 2013 and $13,050 in fiscal 2012.
The principal accountant for the audit of the registrant’s annual financial statements billed $697,965 in fiscal 2013 and $264,139 in fiscal 2012 to the registrant’s investment adviser or any entity controlling, controlled by, or under common control with the adviser that provides ongoing services to the registrant.
Such services include: Internal control reviews, GIPS attestation procedures, internal audit training, surprise exams, reorganization, and system conversion testing.
The principal accountant for the audit of the registrant’s annual financial statements billed $16,834 in fiscal 2013 and $6,785 in fiscal 2012.
The principal accountant for the audit of the registrant’s annual financial statements billed $581,620 in fiscal 2013 and $451,924 in fiscal 2012 to the registrant’s investment adviser or any entity controlling, controlled by, or under common control with the adviser that provides ongoing services to the registrant.
Such services include: tax compliance, tax planning and tax advice. Tax compliance generally involves preparation of original and amended tax returns, claims for a refund and tax payment-planning services. Tax planning and tax advice includes assistance with tax audits and appeals, tax advice related to mergers and acquisitions and requests for rulings or technical advice from taxing authorities.
The principal accountant for the audit of the registrant’s annual financial statements billed no such fees in fiscal 2013 and no such fees in fiscal 2012.
The principal accountant for the audit of the registrant’s annual financial statements billed no such fees in fiscal 2013 and no such fees in fiscal 2012 to the registrant’s investment adviser or any entity controlling, controlled by, or under common control with the adviser that provides ongoing services to the registrant.
Such fees would include the cost to the principal accountant of attending audit committee meetings and consultations regarding the registrant’s retirement plan with respect to its Trustees.
| (e) | (1) During its regularly scheduled periodic meetings, the registrant’s audit committee will pre-approve all audit, audit-related, tax and other services to be provided by the principal accountants of the registrant. |
The audit committee has delegated pre-approval authority to its Chairman for any subsequent new engagements that arise between regularly scheduled meeting dates provided that any fees such pre-approved are presented to the audit committee at its next regularly scheduled meeting.
Under applicable laws, pre-approval of non-audit services may be waived provided that: 1) the aggregate amount of all such services provided constitutes no more than five percent of the total amount of fees paid by the registrant to its principal accountant during the fiscal year in which services are provided 2) such services were not recognized by the registrant at the time of engagement as non-audit services and 3) such services are promptly brought to the attention of the audit committee of the registrant and approved prior to the completion of the audit.
(2) 0%
| (f) | Not applicable as less than 50%. |
| (g) | The principal accountant for the audit of the registrant’s annual financial statements billed $14,093,769 in fiscal 2013 and $7,180,465 in fiscal 2012 to the registrant and the registrant’s investment adviser or any entity controlling, controlled by, or under common control with the adviser that provides ongoing services to the registrant related to non-audit fees. Those billings did not include any prohibited non-audit services as defined by the Securities Exchange Act of 1934. |
| (h) | The registrant’s audit committee of the board of Trustees has considered whether the provision of non-audit services that were rendered to the registrant’s investment adviser, and any entity controlling, controlled by, or under common control with the investment adviser that provides ongoing services to the registrant that were not pre-approved pursuant to paragraph (c)(7)(ii) of Rule 2-01 of Regulation S-X is compatible with maintaining the principal accountant’s independence. No such services were rendered. |
Item 5. Audit Committee of Listed Registrants
Not applicable.
Item 6. Schedule of Investments.
a) Not applicable. The complete schedule of investments is included in Item 1 of this Form N-CSR.
b) Not applicable.
Item 7. Disclosure of Proxy Voting Policies and Procedures for Closed-End Management Investment Companies.
Not applicable.
Item 8. Portfolio Managers of Closed-End Management Investment Companies.
Not applicable.
Item 9. Purchases of Equity Securities by Closed-End Management Investment Company and Affiliated Purchasers.
Not applicable.
Item 10. Submission of Matters to a Vote of Security Holders.
The Fund’s Governance Committee Provisions with Respect to Nominations of Directors/Trustees to the Respective Boards
None
Item 11. Controls and Procedures.
Based on their evaluation of the registrant’s disclosure controls and procedures (as defined in rule 30a-3(c) under the Investment Company Act of 1940 (17 CFR 270.30a-3(c)) as of 12/31/2013, the registrant’s principal executive officer and principal financial officer found the registrant’s disclosure controls and procedures to provide reasonable assurances that information required to be disclosed by the registrant in the reports that it files under the Securities Exchange Act of 1934 (a) is accumulated and communicated to registrant’s management, including its principal executive officer and principal financial officer, to allow timely decisions regarding required disclosure, and (b) is recorded, processed, summarized and reported, within the time periods specified in the rules and forms adopted by the U.S. Securities and Exchange Commission.
There have been no changes in the registrant’s internal controls over financial reporting that occurred during the registrant’s second fiscal quarter of the period covered by this report that have materially affected, or are reasonably likely to materially affect, the registrant’s internal control over financial reporting.
Item 12. Exhibits.
| (a) | (1) Exhibit attached hereto. |
(2) Exhibits attached hereto.
(3) Not applicable.
| (b) | Exhibit attached hereto. |
SIGNATURES
Pursuant to the requirements of the Securities Exchange Act of 1934 and the Investment Company Act of 1940, the registrant has duly caused this report to be signed on its behalf by the undersigned, thereunto duly authorized.
Oppenheimer Variable Account Funds
| | |
| By: | | /s/ William F. Glavin, Jr. |
| | William F. Glavin, Jr. |
| | Principal Executive Officer |
| Date: | | 2/10/2014 |
Pursuant to the requirements of the Securities Exchange Act of 1934 and the Investment Company Act of 1940, this report has been signed below by the following persons on behalf of the registrant and in the capacities and on the dates indicated.
| | |
| By: | | /s/ William F. Glavin, Jr. |
| | William F. Glavin, Jr. |
| | Principal Executive Officer |
| Date: | | 2/10/2014 |
| |
| By: | | /s/ Brian W. Wixted |
| | Brian W. Wixted |
| | Principal Financial Officer |
| Date: | | 2/10/2014 |