UNITED STATES
SECURITIES AND EXCHANGE COMMISSION
WASHINGTON, D.C. 20549
FORM N-CSR/A
CERTIFIED SHAREHOLDER REPORT OF REGISTERED MANAGEMENT
INVESTMENT COMPANIES
Investment Company Act file number 811-4108
Oppenheimer Variable Account Funds
(Exact name of registrant as specified in charter)
6803 South Tucson Way, Centennial, Colorado 80112-3924
(Address of principal executive offices) (Zip code)
Arthur S. Gabinet
OFI Global Asset Management, Inc.
225 Liberty Street, New York, New York 10281-1008
(Name and address of agent for service)
Registrant’s telephone number, including area code: (303) 768-3200
Date of fiscal year end: December 31
Date of reporting period: 12/31/2015
Item 1. Reports to Stockholders.
PORTFOLIO MANAGERS: Ronald J. Zibelli, Jr., CFA and Justin Livengood, CFA
AVERAGE ANNUAL TOTAL RETURNS FOR THE PERIODS ENDED 12/31/15
| | | | | | | | | | | | | | | | |
| | | Inception Date | | | 1-Year | | | 5-Year | | | 10-Year | |
Non-Service Shares | | | 8/15/86 | | | | 6.61% | | | | 12.54% | | | | 5.46 | % |
Service Shares | | | 10/16/00 | | | | 6.35 | | | | 12.26 | | | | 5.19 | |
Russell Midcap Growth Index | | | | | | | -0.20 | | | | 11.54 | | | | 8.16 | |
Performance data quoted represents past performance, which does not guarantee future results. The investment return and principal value of an investment in the Fund will fluctuate so that an investor’s shares, when redeemed, may be worth more or less than their original cost. Current performance may be lower or higher than the performance quoted. For performance data current to the most recent month end, call us at 1.800.988.8287. The Fund’s total returns should not be expected to be the same as the returns of other funds, whether or not both funds have the same portfolio managers and/or similar names. The Fund’s total returns include changes in share price and reinvested distributions but do not include the charges associated with the separate account products that offer this Fund. Such performance would have been lower if such charges were taken into account.
TOP HOLDINGS AND ALLOCATIONS
TOP TEN COMMON STOCK HOLDINGS
| | |
O’Reilly Automotive, Inc. | | 2.6% |
Acuity Brands, Inc. | | 2.6 |
Ulta Salon, Cosmetics & Fragrance, Inc. | | 2.1 |
Constellation Brands, Inc., Cl. A | | 2.0 |
Snap-on, Inc. | | 2.0 |
ServiceNow, Inc. | | 1.9 |
Palo Alto Networks, Inc. | | 1.8 |
Activision Blizzard, Inc. | | 1.8 |
Signature Bank | | 1.8 |
Monster Beverage Corp. | | 1.7 |
Portfolio holdings and allocations are subject to change. Percentages are as of December 31, 2015, and are based on net assets. For more current Fund holdings, please visit oppenheimerfunds.com.
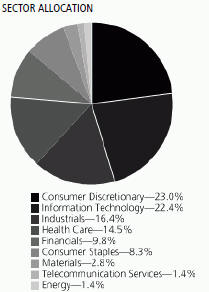
Portfolio holdings and allocations are subject to change. Percentages are as of December 31, 2015, and are based on the total market value of common stocks.
2 OPPENHEIMER DISCOVERY MID CAP GROWTH FUND/VA
Fund Performance Discussion
The Fund’s Non-Service shares produced a return of 6.61% during the reporting period, outperforming the Russell Midcap Growth Index’s return of -0.20% and the Morningstar U.S. Insurance Fund Mid-Cap Growth peer group’s return of -0.03%. In addition, the Fund’s Non-Service shares ranked in the 3rd percentile (7 out of 99 funds) in Morningstar’s U.S. Insurance Fund Mid-Cap Growth peer group over the 1-year period ended December 31, 2015. Over the longer-term, Fund’s Non-Service shares ranked in the 18th (21 out of 95 funds), 10th (12 out of 94 funds), and 82nd (67 out of 76 funds) percentiles for the 3-, 5- and 10-year periods ended December 31, 2015, respectively. Note that we have managed the Fund under the current investment process for just over five years.
The Fund’s outperformance in 2015 was due to good stock selection. The strong results were broad-based as almost every sector outperformed, led by information technology, industrials and consumer discretionary. Our fundamental research continued to steer us away from companies with cyclical businesses or commodity exposure in sectors such as materials, energy and industrials. Instead, we found good investment opportunities in higher-quality growth companies in sectors such as consumer discretionary, information technology and health care.
MARKET OVERVIEW
2015 will go down as a year in which volatility returned to the financial markets following a multi-year hiatus. Global growth struggled to gain traction as many of the world’s largest economies expanded below their long-term trends. China’s industrial production slowed for the fifth consecutive year and weighed on the world’s exporters—especially commodity producers. In the United States, a strong dollar impaired the competitiveness of many American companies and proved to be a drag on corporate earnings.
The generally disappointing performance of global equity markets was marked by pockets of significant weakness in the energy sector and many emerging markets. U.S. equities generally outperformed their counterparts in other regions in 2015, though with tempered results and only after a market correction in August that tested investors’ nerves. Interest rates globally remained low, even as investors spent most of the year contemplating the first U.S. interest-rate hike by the Federal Reserve (the “Fed”) in almost a decade. The Fed did not raise interest rates until late in the year at its December 16 meeting, when the benchmark federal funds rate was raised by 0.25%.
TOP INDIVIDUAL CONTRIBUTORS
Top performing stocks for the Fund this reporting period included Acuity Brands, O’Reilly Automotive and Palo Alto Networks. Acuity Brands manufactures and distributes a range of indoor and outdoor lighting fixtures and control systems. Shares of Acuity Brands generated a 57% return after the company reported consistently strong earnings results. This is an outstanding result when compared to the industrials sector as a whole, which declined. We believe their leadership in energy efficient LED technology should provide a tailwind for strong growth in the future. O’Reilly Automotive, a leading distributor and retailer of automotive parts, had another solid year. The company reported strong financial results throughout the reporting period, and consistently exceeded expectations. In 2015, O’Reilly is expected to generate earnings per share (EPS) growth in excess of 20% for the seventh consecutive year. Palo Alto Networks, a leading network security solutions company, posted revenue growth above 50% for the year, which significantly exceeded expectations. These were among the largest holdings in the Fund at the end of the year and the Fund has owned all three stocks for an extended period.
TOP INDIVIDUAL DETRACTORS
Detractors from performance this reporting period included Mobileye NV and Akamai Technologies, Inc. Mobileye develops Advanced Driver Assistance Systems software and cameras that warn drivers about collisions, traffic jams and more. Mobileye’s shares declined during the period due to concerns about potential market share loss and margin compression. Akamai Technologies is a provider of cloud services for delivering, optimizing and securing online content and business applications. Shares of Akamai fell after the company reported earnings that missed analysts’ expectations and we exited our position during the period.
STRATEGY & OUTLOOK
Our long-term investment process remains the same. We seek dynamic companies with above average and sustainable revenue and earnings growth that we believe are positioned to outperform. These companies typically hold leading positions in their industry and are run by management teams that have proven records of performance. In addition, we seek to diversify the portfolio across economic sectors and by position while also employing sell disciplines to enhance performance. We are pleased that this investment process produced favorable absolute and relative performance during the period, despite volatile market conditions.
3 OPPENHEIMER DISCOVERY MID CAP GROWTH FUND/VA
The macroeconomic environment is characterized by modest economic expansion, weak profit growth and increased merger and acquisition activity. We believe that this is an environment that favors growth companies and that mid-cap stocks offer investors an ongoing opportunity to generate outperformance versus market indices through effective stock selection.
Investors should consider the Fund’s investment objective, risks, charges and expenses carefully before investing. The Fund’s prospectus and summary prospectus contain this and other information about the Fund, and may be obtained by asking your financial advisor or calling us at 1.800.988.8287. Read prospectuses and summary prospectuses carefully before investing.
Total returns include changes in share price and reinvestment of dividends and capital gains distributions in a hypothetical investment for the periods shown.
The Fund’s investment strategy and focus can change over time. The mention of specific fund holdings does not constitute a recommendation by OppenheimerFunds, Inc. or its affiliates.
Shares of Oppenheimer funds are not deposits or obligations of any bank, are not guaranteed by any bank, are not insured by the FDIC or any other agency, and involve investment risks, including the possible loss of the principal amount invested.
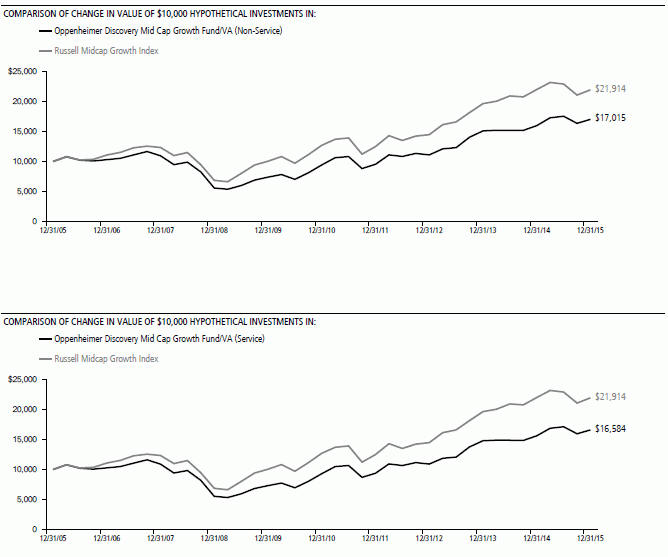
Comparing the Fund’s Performance to the Market. The graphs that follow show the performance of a hypothetical $10,000 investment in each share class of the Fund held until December 31, 2015. Performance is measured over a ten-fiscal-year period for both Classes. Performance information does not reflect charges that apply to separate accounts investing in the Fund. If these charges were taken into account, performance would be lower. The graphs assume that all dividends and capital gains distributions were reinvested in additional shares.
The Fund’s performance is compared to the performance of the Russell Midcap Growth Index. The Russell Midcap Growth Index measures the performance of the mid-cap growth segment of the U.S. equity universe. It includes those Russell Midcap companies with higher price-to-book ratios and higher forecasted growth values. The Index is unmanaged and cannot be purchased directly by investors. While index comparisons may be useful to provide a benchmark for the Fund’s performance, it must be noted that the Fund’s investments are not limited to the investments comprising the Index. Index performance includes reinvestment of income, but does not reflect transaction costs, fees, expenses or taxes. Index performance is shown for illustrative purposes only as a benchmark for the Fund’s performance, and does not predict or depict performance of the Fund. The Fund’s performance reflects the effects of the Fund’s business and operating expenses.
The Morningstar U.S. Insurance Fund Mid-Cap Growth Funds Category Average is the average return of the mutual funds within the investment category as defined by Morningstar. Returns include the reinvestment of distributions but do not consider sales charges. Morningstar U.S. Insurance Fund Mid-Cap Growth Funds Category Average performance is shown for illustrative purposes only and does not predict or depict the performance of the Fund.
Morningstar ranking is for Non-Service shares and ranking may include more than one share class of funds in the category, including other share classes of this Fund. Ranking is based on total return as of 12/31/15, without considering sales charges. Different share classes may have different expenses and performance characteristics. Fund rankings are subject to change monthly. The Fund’s total-return percentile rank is relative to all funds that are in the Morningstar U.S. Insurance Fund Mid-Cap Growth Funds category. The highest (or most favorable) percentile rank is 1 and the lowest (or least favorable) percentile rank is 100. The top-performing fund in a category will always receive a rank of 1.
4 OPPENHEIMER DISCOVERY MID CAP GROWTH FUND/VA
Performance data quoted represents past performance, which does not guarantee future results. The investment return and principal value of an investment in the Fund will fluctuate so that an investor’s shares, when redeemed, may be worth more or less than their original cost. Current performance may be lower or higher than the performance quoted. For performance data current to the most recent month end, call us at 1.800.988.8287. The Fund’s total returns should not be expected to be the same as the returns of other funds, whether or not both funds have the same portfolio managers and/or similar names. The Fund’s total returns include changes in share price and reinvested distributions but do not include the charges associated with the separate account products that offer this Fund. Such performance would have been lower if such charges were taken into account.
5 OPPENHEIMER DISCOVERY MID CAP GROWTH FUND/VA
Fund Expenses
Fund Expenses. As a shareholder of the Fund, you incur two types of costs: (1) transaction costs and (2) ongoing costs, including management fees; distribution and service fees; and other Fund expenses. These examples are intended to help you understand your ongoing costs (in dollars) of investing in the Fund and to compare these costs with the ongoing costs of investing in other mutual funds.
The examples are based on an investment of $1,000.00 invested at the beginning of the period and held for the entire 6-month period ended December 31, 2015.
Actual Expenses. The first section of the table provides information about actual account values and actual expenses. You may use the information in this section for the class of shares you hold, together with the amount you invested, to estimate the expense that you paid over the period. Simply divide your account value by $1,000.00 (for example, an $8,600.00 account value divided by $1,000.00 = 8.60), then multiply the result by the number in the first section under the heading entitled “Expenses Paid During 6 Months Ended December 31, 2015” to estimate the expenses you paid on your account during this period.
Hypothetical Example for Comparison Purposes.
The second section of the table provides information about hypothetical account values and hypothetical expenses based on the Fund’s actual expense ratio for each class of shares, and an assumed rate of return of 5% per year for each class before expenses, which is not the actual return. The hypothetical account values and expenses may not be used to estimate the actual ending account balance or expenses you paid for the period. You may use this information to compare the ongoing costs of investing in the Fund and other funds. To do so, compare this 5% hypothetical example for the class of shares you hold with the 5% hypothetical examples that appear in the shareholder reports of the other funds.
Please note that the expenses shown in the table are meant to highlight your ongoing fund costs only and do not reflect any charges associated with the separate accounts that offer this Fund. Therefore, the “hypothetical” lines of the table are useful in comparing ongoing fund costs only, and will not help you determine the relative total costs of owning different funds. In addition, if these separate account charges were included your costs would have been higher.
| | | | | | | | | | | | |
| Actual | | Beginning Account Value July 1, 2015 | | | Ending
Account
Value
December 31, 2015 | | | Expenses
Paid During
6 Months Ended
December 31, 2015 | |
Non-Service shares | | | $ 1,000.00 | | | | $ 970.90 | | | | $ 3.98 | |
Service shares | | | 1,000.00 | | | | 969.70 | | | | 5.23 | |
| | | |
Hypothetical (5% return before expenses) | | | | | | | | | |
Non-Service shares | | | 1,000.00 | | | | 1,021.17 | | | | 4.08 | |
Service shares | | | 1,000.00 | | | | 1,019.91 | | | | 5.36 | |
Expenses are equal to the Fund’s annualized expense ratio for that class, multiplied by the average account value over the period, multiplied by 184/365 (to reflect the one-half year period). Those annualized expense ratios, excluding indirect expenses from affiliated funds, based on the 6-month period ended December 31, 2015 are as follows:
| | | | | | |
| Class | | Expense Ratios | | | |
Non-Service shares | | | 0.80 | % | | |
Service shares | | | 1.05 | | | |
The expense ratios reflect voluntary and/or contractual waivers and/or reimbursements of expenses by the Fund’s Manager. Some of these undertakings may be modified or terminated at any time, as indicated in the Fund’s prospectus. The “Financial Highlights” tables in the Fund’s financial statements, included in this report, also show the gross expense ratios, without such waivers or reimbursements and reduction to custodian expenses, if applicable.
6 OPPENHEIMER DISCOVERY MID CAP GROWTH FUND/VA
STATEMENT OF INVESTMENTS December 31, 2015
| | | | | | | | | | |
| | | Shares | | | Value | | | |
| | | |
| Common Stocks—97.0% | | | | | | | |
| | | |
| Consumer Discretionary—22.4% | | | | | | | |
| | | |
| Auto Components—1.0% | | | | | | | |
| | | |
| Delphi Automotive plc | | | 83,810 | | | | $ 7,185,031 | | | |
| |
| | | |
| Diversified Consumer Services—0.9% | | | | | | | |
| | | |
| Bright Horizons Family Solutions, Inc.1 | | | 87,180 | | | | 5,823,624 | | | |
| |
| | | |
| Hotels, Restaurants & Leisure—3.9% | | | | | | | |
| | | |
| Buffalo Wild Wings, Inc.1 | | | 19,020 | | | | 3,036,543 | | | |
| | | |
| Domino’s Pizza, Inc. | | | 98,200 | | | | 10,924,750 | | | |
| | | |
| Norwegian Cruise Line Holdings Ltd.1 | | | 169,730 | | | | 9,946,178 | | | |
| | | |
| Six Flags Entertainment Corp. | | | 32,330 | | | | 1,776,210 | | | |
| | | |
| Vail Resorts, Inc. | | | 13,660 | | | | 1,748,344 | | | |
| | | | | | | | | | |
| | | | | | | 27,432,025 | | | |
| |
| | | |
| Household Durables—2.5% | | | | | | | |
| | | |
| DR Horton, Inc. | | | 276,650 | | | | 8,861,099 | | | |
| | | |
| Mohawk Industries, Inc.1 | | | 44,640 | | | | 8,454,370 | | | |
| | | | | | | | | | |
| | | | | | | 17,315,469 | | | |
| |
| | | |
| Internet & Catalog Retail—0.8% | | | | | | | |
| | | |
| Expedia, Inc. | | | 41,310 | | | | 5,134,833 | | | |
| |
| | | |
| Leisure Products—1.1% | | | | | | | |
| | | |
| Hasbro, Inc. | | | 117,430 | | | | 7,910,085 | | | |
| |
| | | |
| Specialty Retail—10.6% | | | | | | | |
| | | |
| AutoZone, Inc.1 | | | 7,830 | | | | 5,809,155 | | | |
| | | |
| L Brands, Inc. | | | 103,380 | | | | 9,905,872 | | | |
| | | |
| O’Reilly Automotive, Inc.1 | | | 71,120 | | | | 18,023,231 | | | |
| | | |
| Ross Stores, Inc. | | | 158,340 | | | | 8,520,275 | | | |
| | | |
| Signet Jewelers Ltd. | | | 41,060 | | | | 5,078,711 | | | |
| | | |
| Tractor Supply Co. | | | 140,070 | | | | 11,975,985 | | | |
| | | |
| Ulta Salon, Cosmetics & Fragrance, Inc.1 | | | 80,150 | | | | 14,827,750 | | | |
| | | | | | | | | | |
| | | | | | | 74,140,979 | | | |
| |
| | | |
| Textiles, Apparel & Luxury Goods—1.6% | | | | | | | |
| | | |
| Hanesbrands, Inc. | | | 134,914 | | | | 3,970,519 | | | |
| | | |
| Under Armour, Inc., Cl. A1 | | | 85,910 | | | | 6,925,205 | | | |
| | | | | | | | | | |
| | | | | | | 10,895,724 | | | |
| |
| | | |
| Consumer Staples—8.1% | | | | | | | |
| | | |
| Beverages—3.7% | | | | | | | |
| | | |
| Constellation Brands, Inc., Cl. A | | | 98,460 | | | | 14,024,643 | | | |
| | | |
| Monster Beverage Corp.1 | | | 80,840 | | | | 12,041,926 | | | |
| | | | | | | | | | |
| | | | | | | 26,066,569 | | | |
| |
| | | |
| Food & Staples Retailing—1.7% | | | | | | | |
| | | |
| Kroger Co. (The) | | | 284,580 | | | | 11,903,981 | | | |
| |
| | | |
| Food Products—2.7% | | | | | | | |
| | | |
| Hormel Foods Corp. | | | 146,060 | | | | 11,550,425 | | | |
| | | |
WhiteWave Foods Co. (The),
Cl. A1 | | | 176,320 | | | | 6,860,611 | | | |
| | | | | | | | | | |
| | | | | | | 18,411,036 | | | |
| |
| | | |
| Energy—1.4% | | | | | | | |
| | | |
| Oil, Gas & Consumable Fuels—1.4% | | | | | | | |
| | | |
| Concho Resources, Inc.1 | | | 66,479 | | | | 6,173,240 | | | |
| | | |
| Memorial Resource Development Corp.1 | | | 203,174 | | | | 3,281,260 | | | |
| | | | | | | | | | |
| | | | | | | 9,454,500 | | | |
| |
| | | |
| Financials—9.5% | | | | | | | |
| | | |
| Capital Markets—1.8% | | | | | | | |
| | | |
| E*TRADE Financial Corp.1 | | | 175,800 | | | | 5,210,712 | | | |
| | | |
| Lazard Ltd., Cl. A2 | | | 57,240 | | | | 2,576,373 | | | |
| | | |
| SEI Investments Co. | | | 97,160 | | | | 5,091,184 | | | |
| | | | | | | | | | |
| | | | | | | 12,878,269 | | | |
| |
| | | |
| Commercial Banks—3.9% | | | | | | | |
| | | |
| First Republic Bank | | | 149,700 | | | | 9,889,182 | | | |
| | | |
| Signature Bank1 | | | 80,060 | | | | 12,278,802 | | | |
| | | | | | | | | | |
| | | Shares | | | Value | | | |
| | | |
| Commercial Banks (Continued) | | | | | | | |
| | | |
| SVB Financial Group1 | | | 43,070 | | | | $ 5,121,023 | | | |
| | | | | | | | | | |
| | | | | | | 27,289,007 | | | |
| |
| | | |
| Diversified Financial Services—1.3% | | | | | | | |
| | | |
| MarketAxess Holdings, Inc. | | | 35,800 | | | | 3,994,922 | | | |
| | | |
| MSCI, Inc., Cl. A | | | 66,710 | | | | 4,811,792 | | | |
| | | | | | | | | | |
| | | | | | | 8,806,714 | | | |
| |
| | | |
| Real Estate Investment Trusts (REITs)—1.4% | | | |
| | | |
| Equinix, Inc. | | | 31,930 | | | | 9,655,632 | | | |
| |
| | | |
| Real Estate Management & Development—1.1% | | | |
| | | |
| Jones Lang LaSalle, Inc. | | | 48,080 | | | | 7,686,069 | | | |
| |
| | | |
| Health Care—14.0% | | | | | | | |
| | | |
| Biotechnology—1.6% | | | | | | | |
| | | |
| Anacor Pharmaceuticals, Inc.1 | | | 33,230 | | | | 3,753,993 | | | |
| | | |
| Incyte Corp.1 | | | 70,890 | | | | 7,688,021 | | | |
| | | | | | | | | | |
| | | | | | | 11,442,014 | | | |
| |
| | | |
| Health Care Equipment & Supplies—4.5% | | | | | | | |
| | | |
| Align Technology, Inc.1 | | | 54,040 | | | | 3,558,534 | | | |
| | | |
| DexCom, Inc.1 | | | 101,590 | | | | 8,320,221 | | | |
| | | |
| Edwards Lifesciences Corp.1 | | | 134,820 | | | | 10,648,083 | | | |
| | | |
| Hologic, Inc.1 | | | 218,430 | | | | 8,451,057 | | | |
| | | | | | | | | | |
| | | | | | | 30,977,895 | | | |
| |
| | | |
| Health Care Providers & Services—6.9% | | | | | | | |
| | | |
| AmerisourceBergen Corp., Cl. A | | | 79,920 | | | | 8,288,503 | | | |
| | | |
| Centene Corp.1 | | | 178,010 | | | | 11,714,838 | | | |
| | | |
| Henry Schein, Inc.1 | | | 45,160 | | | | 7,143,860 | | | |
| | | |
| MEDNAX, Inc.1 | | | 91,080 | | | | 6,526,793 | | | |
| | | |
Universal Health Services, Inc.,
Cl. B | | | 29,630 | | | | 3,540,489 | | | |
| | | |
| VCA, Inc.1 | | | 203,410 | | | | 11,187,550 | | | |
| | | | | | | | | | |
| | | | | | | 48,402,033 | | | |
| |
| | | |
| Life Sciences Tools & Services—1.0% | | | | | | | |
| | | |
| Quintiles Transnational Holdings, Inc.1 | | | 101,350 | | | | 6,958,691 | | | |
| |
| | | |
| Industrials—15.9% | | | | | | | |
| | | |
| Aerospace & Defense—1.6% | | | | | | | |
| | | |
| TransDigm Group, Inc.1 | | | 48,810 | | | | 11,150,644 | | | |
| |
| | | |
| Airlines—0.8% | | | | | | | |
| | | |
| Alaska Air Group, Inc. | | | 72,360 | | | | 5,825,704 | | | |
| |
| | | |
| Building Products—3.6% | | | | | | | |
| | | |
| A.O. Smith Corp. | | | 119,190 | | | | 9,131,146 | | | |
| | | |
| Lennox International, Inc. | | | 76,670 | | | | 9,576,083 | | | |
| | | |
| Masco Corp. | | | 240,070 | | | | 6,793,981 | | | |
| | | | | | | | | | |
| | | | | | | 25,501,210 | | | |
| |
| | | |
| Commercial Services & Supplies—0.9% | | | | | | | |
| | | |
| Cintas Corp. | | | 68,390 | | | | 6,226,909 | | | |
| |
| | | |
| Electrical Equipment—2.6% | | | | | | | |
| | | |
| Acuity Brands, Inc. | | | 76,540 | | | | 17,895,052 | | | |
| |
| | | |
| Industrial Conglomerates—0.5% | | | | | | | |
| | | |
| Carlisle Cos., Inc. | | | 39,724 | | | | 3,523,122 | | | |
| |
| | | |
| Machinery—3.8% | | | | | | | |
| | | |
| Middleby Corp. (The)1 | | | 81,540 | | | | 8,795,720 | | | |
| | | |
| Snap-on, Inc. | | | 81,479 | | | | 13,967,945 | | | |
| | | |
| Wabtec Corp. | | | 50,190 | | | | 3,569,513 | | | |
| | | | | | | | | | |
| | | | | | | 26,333,178 | | | |
| |
| | | |
| Professional Services—2.1% | | | | | | | |
| | | |
| Equifax, Inc. | | | 98,510 | | | | 10,971,059 | | | |
| | | |
| Verisk Analytics, Inc., Cl. A1 | | | 48,080 | | | | 3,696,390 | | | |
| | | | | | | | | | |
| | | | | | | 14,667,449 | | | |
7 OPPENHEIMER DISCOVERY MID CAP GROWTH FUND/VA
STATEMENT OF INVESTMENTS Continued
| | | | | | | | | | |
| | | Shares | | | Value | | | |
| | | |
Information Technology—21.7% | | | | | | | |
| | | |
Communications Equipment—1.8% | | | | | | | |
| | | |
Palo Alto Networks, Inc.1 | | | 72,590 | | | | $ 12,786,003 | | | |
| |
| | | |
Internet Software & Services—2.3% | | | | | | | |
| | | |
CoStar Group, Inc.1 | | | 54,680 | | | | 11,301,809 | | | |
| | | |
LinkedIn Corp., Cl. A1 | | | 21,510 | | | | 4,841,471 | | | |
| | | | | | | | | | |
| | | | | | | 16,143,280 | | | |
| |
| | | |
IT Services—3.7% | | | | | | | |
| | | |
Fiserv, Inc.1 | | | 112,460 | | | | 10,285,592 | | | |
| | | |
Global Payments, Inc. | | | 160,010 | | | | 10,322,245 | | | |
| | | |
Vantiv, Inc., Cl. A1 | | | 104,050 | | | | 4,934,051 | | | |
| | | | | | | | | | |
| | | | | | | 25,541,888 | | | |
| |
| | | |
Semiconductors & Semiconductor Equipment—2.9% | | | |
| | | |
Avago Technologies Ltd., Cl. A | | | 33,100 | | | | 4,804,465 | | | |
| | | |
Cavium, Inc.1 | | | 54,540 | | | | 3,583,823 | | | |
| | | |
NVIDIA Corp. | | | 210,350 | | | | 6,933,136 | | | |
| | | |
NXP Semiconductors NV1 | | | 57,420 | | | | 4,837,635 | | | |
| | | | | | | | | | |
| | | | | | | 20,159,059 | | | |
| |
| | | |
Software—11.0% | | | | | | | |
| | | |
Activision Blizzard, Inc. | | | 325,600 | | | | 12,603,976 | | | |
| | | |
Atlassian Corp. plc, Cl. A1 | | | 39,230 | | | | 1,180,038 | | | |
| | | |
Electronic Arts, Inc.1 | | | 124,260 | | | | 8,539,147 | | | |
| | | |
Guidewire Software, Inc.1 | | | 59,330 | | | | 3,569,293 | | | |
| | | |
Mobileye NV1 | | | 100,040 | | | | 4,229,691 | | | |
| | | |
Red Hat, Inc.1 | | | 117,020 | | | | 9,690,426 | | | |
| | | | | | | | |
| | | Shares | | | Value | |
| |
| Software—11.0% | | | | | |
| |
| ServiceNow, Inc.1 | | | 153,420 | | | | $13,280,035 | |
| |
| SS&C Technologies Holdings, Inc. | | | 77,250 | | | | 5,273,858 | |
| |
| Tableau Software, Inc., Cl. A1 | | | 46,440 | | | | 4,375,577 | |
| |
| Tyler Technologies, Inc.1 | | | 20,570 | | | | 3,585,763 | |
| |
Ultimate Software Group, Inc.
(The)1 | | | 52,740 | | | | 10,311,197 | |
| | | | | | | | |
| | | | | | | 76,639,001 | |
|
| |
| Materials—2.7% | | | | | |
| |
| Chemicals—1.2% | | | | | |
| |
| Sherwin-Williams Co. (The) | | | 31,460 | | | | 8,167,016 | |
|
| |
| Construction Materials—1.5% | | | | | |
| |
| Vulcan Materials Co. | | | 114,970 | | | | 10,918,701 | |
|
| |
| Telecommunication Services—1.3% | | | | | |
| |
| Wireless Telecommunication Services—1.3% | | | | | |
| |
| SBA Communications Corp., Cl. A1 | | | 87,290 | | | | 9,171,560 | |
| | | | | | | | |
Total Common Stocks
(Cost $515,000,183) | | | | | | | 676,419,956 | |
|
| |
| Investment Company—2.9% | | | | | |
| |
Oppenheimer Institutional Money Market Fund, Cl. E, 0.30%3,4
(Cost $20,396,181) | | | 20,396,181 | | | | 20,396,181 | |
|
| |
Total Investments, at Value
(Cost $535,396,364) | | | 99.9% | | | | 696,816,137 | |
| |
| Net Other Assets (Liabilities) | | | 0.1 | | | | 662,890 | |
| | | | |
| Net Assets | | | 100.0% | | | | $ 697,479,027 | |
| | | | |
Footnotes to Statement of Investments
1. Non-income producing security.
2. Security is a Master Limited Partnership.
3. Rate shown is the 7-day yield at period end.
4. Is or was an affiliate, as defined in the Investment Company Act of 1940, as amended, at or during the reporting period, by virtue of the Fund owning at least 5% of the voting securities of the issuer or as a result of the Fund and the issuer having the same investment adviser. Transactions during the reporting period in which the issuer was an affiliate are as follows:
| | | | | | | | | | | | | | | | |
| | | Shares
December 31, 2014 | | | Gross
Additions | | | Gross Reductions | | | Shares
December 31, 2015 | |
| |
| Oppenheimer Institutional Money Market Fund, Cl. E | | | 11,090,218 | | | | 293,471,395 | | | | 284,165,432 | | | | 20,396,181 | |
| | | | |
| | | | | | | | | Value | | | Income | |
| |
| Oppenheimer Institutional Money Market Fund, Cl. E | | | | | | | | | | $ | 20,396,181 | | | $ | 32,170 | |
See accompanying Notes to Financial Statements.
8 OPPENHEIMER DISCOVERY MID CAP GROWTH FUND/VA
STATEMENT OF ASSETS AND LIABILITIES December 31, 2015
| | | | |
| |
Assets | | | | |
Investments, at value—see accompanying statement of investments: | | | | |
Unaffiliated companies (cost $515,000,183) | | $ | 676,419,956 | |
Affiliated companies (cost $20,396,181) | | | 20,396,181 | |
| | | | |
| | | 696,816,137 | |
| |
Cash | | | 500,000 | |
| |
Receivables and other assets: | | | | |
Investments sold | | | 2,894,183 | |
Dividends | | | 57,700 | |
Shares of beneficial interest sold | | | 51,083 | |
Other | | | 44,467 | |
| | | | |
Total assets | | | 700,363,570 | |
|
| |
Liabilities | | | | |
Payables and other liabilities: | | | | |
Investments purchased | | | 1,783,652 | |
Shares of beneficial interest redeemed | | | 997,551 | |
Trustees’ compensation | | | 38,674 | |
Shareholder communications | | | 31,179 | |
Distribution and service plan fees | | | 7,926 | |
Other | | | 25,561 | |
| | | | |
Total liabilities | | | 2,884,543 | |
|
| |
Net Assets | | $ | 697,479,027 | |
| | | | |
|
| |
Composition of Net Assets | | | | |
Par value of shares of beneficial interest | | $ | 9,095 | |
| |
Additional paid-in capital | | | 485,887,223 | |
| |
Accumulated net investment income | | | 233,299 | |
| |
Accumulated net realized gain on investments | | | 49,929,637 | |
| |
Net unrealized appreciation on investments | | | 161,419,773 | |
| | | | |
Net Assets | | $ | 697,479,027 | |
| | | | |
|
| |
Net Asset Value Per Share | | | | |
Non-Service Shares: | | | | |
| Net asset value, redemption price and offering price per share (based on net assets of $660,449,850 and 8,593,838 shares of beneficial interest outstanding) | | | $76.85 | |
| |
| |
Service Shares: | | | | |
| Net asset value, redemption price and offering price per share (based on net assets of $37,029,177 and 501,212 shares of beneficial interest outstanding) | | | $73.88 | |
See accompanying Notes to Financial Statements.
9 OPPENHEIMER DISCOVERY MID CAP GROWTH FUND/VA
STATEMENT OF OPERATIONS For the Year Ended December 31, 2015
| | | | |
| |
Investment Income | | | | |
Dividends: | | | | |
Unaffiliated companies | | $ | 4,076,807 | |
Affiliated companies | | | 32,170 | |
| |
Interest | | | 129 | |
| | | | |
Total investment income | | | 4,109,106 | |
|
| |
Expenses | | | | |
Management fees | | | 5,169,569 | |
| |
Distribution and service plan fees: | | | | |
Service shares | | | 81,935 | |
| |
Transfer and shareholder servicing agent fees: | | | | |
Non-Service shares | | | 695,902 | |
Service shares | | | 32,820 | |
| |
Shareholder communications: | | | | |
Non-Service shares | | | 49,416 | |
Service shares | | | 2,324 | |
| |
Trustees’ compensation | | | 28,603 | |
| |
Borrowing fees | | | 5,333 | |
| |
Custodian fees and expenses | | | 4,959 | |
| |
Other | | | 57,899 | |
| | | | |
Total expenses | | | 6,128,760 | |
Less reduction to custodian expenses | | | (198) | |
Less waivers and reimbursements of expenses | | | (211,872) | |
| | | | |
Net expenses | | | 5,916,690 | |
|
| |
Net Investment Loss | | | (1,807,584) | |
|
| |
Realized and Unrealized Gain (Loss) | | | | |
Net realized gain on investments from unaffiliated companies | | | 54,533,950 | |
| |
Net change in unrealized appreciation/depreciation on investments | | | (5,614,443) | |
| |
Net Increase in Net Assets Resulting from Operations | | $ | 47,111,923 | |
| | | | |
See accompanying Notes to Financial Statements.
10 OPPENHEIMER DISCOVERY MID CAP GROWTH FUND/VA
STATEMENTS OF CHANGES IN NET ASSETS
| | | | | | | | |
| | | Year Ended
December 31, 2015 | | | Year Ended
December 31, 2014 | |
| |
Operations | | | | | | | | |
Net investment loss | | $ | (1,807,584) | | | $ | (2,911,214) | |
| |
Net realized gain | | | 54,533,950 | | | | 120,740,276 | |
| |
Net change in unrealized appreciation/depreciation | | | (5,614,443) | | | | (78,732,569) | |
| | | | | | | | |
Net increase in net assets resulting from operations | | | 47,111,923 | | | | 39,096,493 | |
|
| |
Dividends and/or Distributions to Shareholders | | | | | | | | |
Distributions from net realized gain: | | | | | | | | |
Non-Service shares | | | (61,563,484) | | | | — | |
Service shares | | | (2,875,460) | | | | — | |
| | | | |
| | | (64,438,944) | | | | — | |
|
| |
Beneficial Interest Transactions | | | | | | | | |
Net increase (decrease) in net assets resulting from beneficial interest transactions: | | | | | | | | |
Non-Service shares | | | (5,761,632) | | | | (80,362,833) | |
Service shares | | | 7,088,846 | | | | (7,209,426) | |
| | | | | | | | |
| | | 1,327,214 | | | | (87,572,259) | |
|
| |
Net Assets | | | | | | | | |
Total decrease | | | (15,999,807) | | | | (48,475,766) | |
| |
Beginning of period | | | 713,478,834 | | | | 761,954,600 | |
| | | | | | | | |
| End of period (including accumulated net investment income of $233,299 and $6,401, respectively) | | $ | 697,479,027 | | | $ | 713,478,834 | |
| | | | |
See accompanying Notes to Financial Statements.
11 OPPENHEIMER DISCOVERY MID CAP GROWTH FUND/VA
FINANCIAL HIGHLIGHTS
| | | | | | | | | | | | | | | | | | | | |
| Non-Service Shares | | Year Ended
December 31, 2015 | | | Year Ended
December 31, 2014 | | | Year Ended
December 31, 2013 | | | Year Ended
December 31, 2012 | | | Year Ended
December 30, 20111 | |
| |
Per Share Operating Data | | | | | | | | | | | | | | | | | | | | |
Net asset value, beginning of period | | $ | 78.82 | | | $ | 74.51 | | | $ | 54.80 | | | $ | 47.06 | | | $ | 46.55 | |
| |
Income (loss) from investment operations: | | | | | | | | | | | | | | | | | | | | |
Net investment income (loss)2 | | | (0.19) | | | | (0.29) | | | | (0.16) | | | | 0.01 | | | | (0.26) | |
Net realized and unrealized gain | | | 5.67 | | | | 4.60 | | | | 19.88 | | | | 7.73 | | | | 0.77 | |
| | | | |
Total from investment operations | | | 5.48 | | | | 4.31 | | | | 19.72 | | | | 7.74 | | | | 0.51 | |
| |
Dividends and/or distributions to shareholders: | | | | | | | | | | | | | | | | | | | | |
Dividends from net investment income | | | 0.00 | | | | 0.00 | | | | (0.01) | | | | 0.00 | | | | 0.00 | |
Distributions from net realized gain | | | (7.45) | | | | 0.00 | | | | 0.00 | | | | 0.00 | | | | 0.00 | |
| | | | |
Total dividends and/or distributions to shareholders | | | (7.45) | | | | 0.00 | | | | (0.01) | | | | 0.00 | | | | 0.00 | |
| |
Net asset value, end of period | | $ | 76.85 | | | $ | 78.82 | | | $ | 74.51 | | | $ | 54.80 | | | $ | 47.06 | |
| | | | |
|
| |
Total Return, at Net Asset Value3 | | | 6.61% | | | | 5.78% | | | | 35.98% | | | | 16.45% | | | | 1.09% | |
| |
Ratios/Supplemental Data | | | | | | | | | | | | | | | | | | | | |
Net assets, end of period (in thousands) | | $ | 660,450 | | | $ | 682,515 | | | $ | 725,406 | | | $ | 558,934 | | | $ | 543,020 | |
| |
Average net assets (in thousands) | | $ | 695,736 | | | $ | 688,259 | | | $ | 618,970 | | | $ | 575,072 | | | $ | 605,083 | |
| |
Ratios to average net assets:4 | | | | | | | | | | | | | | | | | | | | |
Net investment income (loss) | | | (0.24)% | | | | (0.39)% | | | | (0.24)% | | | | 0.03% | | | | (0.53)% | |
Expenses excluding interest and fees from borrowings | | | 0.83% | | | | 0.83% | | | | 0.84% | | | | 0.85% | | | | 0.84% | |
| Interest and fees from borrowings | | | 0.00%5 | | | | 0.00% | | | | 0.00% | | | | 0.00% | | | | 0.00% | |
| | | | |
Total expenses6 | | | 0.83% | | | | 0.83% | | | | 0.84% | | | | 0.85% | | | | 0.84% | |
| Expenses after payments, waivers and/or reimbursements and reduction to custodian expenses | | | 0.80% | | | | 0.80% | | | | 0.80% | | | | 0.80% | | | | 0.80% | |
| |
Portfolio turnover rate | | | 81% | | | | 113% | | | | 84% | | | | 66% | | | | 91% | |
1. December 30, 2011 represents the last business day of the Fund’s reporting period. See Note 2 of the accompanying Notes.
2. Per share amounts calculated based on the average shares outstanding during the period.
3. Assumes an initial investment on the business day before the first day of the fiscal period, with all dividends and distributions reinvested in additional shares on the reinvestment date, and redemption at the net asset value calculated on the last business day of the fiscal period. Total returns are not annualized for periods less than one full year. Total return information does not reflect expenses that apply at the separate account level or to related insurance products. Inclusion of these charges would reduce the total return figures for all periods shown. Returns do not reflect the deduction of taxes that a shareholder would pay on fund distributions or the redemption of fund shares.
4. Annualized for periods less than one full year.
5. Less than 0.005%.
6. Total expenses including indirect expenses from affiliated fund fees and expenses were as follows:
| | | | |
Year Ended December 31, 2015 | | | 0.83 | % |
Year Ended December 31, 2014 | | | 0.83 | % |
Year Ended December 31, 2013 | | | 0.84 | % |
Year Ended December 31, 2012 | | | 0.85 | % |
Year Ended December 30, 2011 | | | 0.84 | % |
See accompanying Notes to Financial Statements.
12 OPPENHEIMER DISCOVERY MID CAP GROWTH FUND/VA
| | | | | | | | | | | | | | | | | | | | |
| Service Shares | | Year Ended
December 31, 2015 | | | Year Ended
December 31, 2014 | | | Year Ended
December 31, 2013 | | | Year Ended
December 31, 2012 | | | Year Ended
December 30, 20111 | |
| |
Per Share Operating Data | | | | | | | | | | | | | | | | | | | | |
Net asset value, beginning of period | | $ | 76.21 | | | $ | 72.22 | | | $ | 53.25 | | | $ | 45.84 | | | $ | 45.46 | |
| |
Income (loss) from investment operations: | | | | | | | | | | | | | | | | | | | | |
Net investment loss2 | | | (0.38) | | | | (0.46) | | | | (0.30) | | | | (0.12) | | | | (0.37) | |
Net realized and unrealized gain | | | 5.50 | | | | 4.45 | | | | 19.27 | | | | 7.53 | | | | 0.75 | |
| | | | |
Total from investment operations | | | 5.12 | | | | 3.99 | | | | 18.97 | | | | 7.41 | | | | 0.38 | |
| |
Dividends and/or distributions to shareholders: | | | | | | | | | | | | | | | | | | | | |
Dividends from net investment income | | | 0.00 | | | | 0.00 | | | | 0.00 | | | | 0.00 | | | | 0.00 | |
Distributions from net realized gain | | | (7.45) | | | | 0.00 | | | | 0.00 | | | | 0.00 | | | | 0.00 | |
| | | | |
Total dividends and/or distributions to shareholders | | | (7.45) | | | | 0.00 | | | | 0.00 | | | | 0.00 | | | | 0.00 | |
| |
Net asset value, end of period | | $ | 73.88 | | | $ | 76.21 | | | $ | 72.22 | | | $ | 53.25 | | | $ | 45.84 | |
| | | | |
|
| |
Total Return, at Net Asset Value3 | | | 6.35% | | | | 5.53% | | | | 35.62% | | | | 16.17% | | | | 0.83% | |
| |
Ratios/Supplemental Data | | | | | | | | | | | | | | | | | | | | |
Net assets, end of period (in thousands) | | $ | 37,029 | | | $ | 30,964 | | | $ | 36,549 | | | $ | 35,942 | | | $ | 35,773 | |
| |
Average net assets (in thousands) | | $ | 32,812 | | | $ | 32,927 | | | $ | 35,905 | | | $ | 37,842 | | | $ | 37,775 | |
| |
Ratios to average net assets:4 | | | | | | | | | | | | | | | | | | | | |
Net investment loss | | | (0.49)% | | | | (0.64)% | | | | (0.49)% | | | | (0.22)% | | | | (0.78)% | |
Expenses excluding interest and fees from borrowings | | | 1.08% | | | | 1.08% | | | | 1.09% | | | | 1.10% | | | | 1.09% | |
| Interest and fees from borrowings | | | 0.00%5 | | | | 0.00% | | | | 0.00% | | | | 0.00% | | | | 0.00% | |
| | | | |
Total expenses6 | | | 1.08% | | | | 1.08% | | | | 1.09% | | | | 1.10% | | | | 1.09% | |
| Expenses after payments, waivers and/or reimbursements and reduction to custodian expenses | | | 1.05% | | | | 1.05% | | | | 1.05% | | | | 1.05% | | | | 1.05% | |
| |
Portfolio turnover rate | | | 81% | | | | 113% | | | | 84% | | | | 66% | | | | 91% | |
1. December 30, 2011 represents the last business day of the Fund’s reporting period. See Note 2 of the accompanying Notes.
2. Per share amounts calculated based on the average shares outstanding during the period.
3. Assumes an initial investment on the business day before the first day of the fiscal period, with all dividends and distributions reinvested in additional shares on the reinvestment date, and redemption at the net asset value calculated on the last business day of the fiscal period. Total returns are not annualized for periods less than one full year. Total return information does not reflect expenses that apply at the separate account level or to related insurance products. Inclusion of these charges would reduce the total return figures for all periods shown. Returns do not reflect the deduction of taxes that a shareholder would pay on fund distributions or the redemption of fund shares.
4. Annualized for periods less than one full year.
5. Less than 0.005%.
6. Total expenses including indirect expenses from affiliated fund fees and expenses were as follows:
| | | | |
Year Ended December 31, 2015 | | | 1.08 | % |
Year Ended December 31, 2014 | | | 1.08 | % |
Year Ended December 31, 2013 | | | 1.09 | % |
Year Ended December 31, 2012 | | | 1.10 | % |
Year Ended December 30, 2011 | | | 1.09 | % |
See accompanying Notes to Financial Statements.
13 OPPENHEIMER DISCOVERY MID CAP GROWTH FUND/VA
|
| NOTES TO FINANCIAL STATEMENTS December 31, 2015 |
1. Organization
Oppenheimer Discovery Mid Cap Growth Fund/VA (the “Fund”), a separate series of Oppenheimer Variable Account Funds, is a diversified open-end management investment company registered under the Investment Company Act of 1940 (“1940 Act”), as amended. The Fund’s investment objective is to seek capital appreciation. The Fund’s investment adviser is OFI Global Asset Management, Inc. (“OFI Global” or the “Manager”), a wholly-owned subsidiary of OppenheimerFunds, Inc. (“OFI” or the “Sub-Adviser”). The Manager has entered into a sub-advisory agreement with OFI. Shares of the Fund are sold only to separate accounts of life insurance companies.
The Fund offers two classes of shares. Both classes are sold at their offering price, which is the net asset value per share, to separate investment accounts of participating insurance companies as an underlying investment for variable life insurance policies, variable annuity contracts or other investment products. The class of shares designated as Service shares is subject to a distribution and service plan. Both classes of shares have identical rights and voting privileges with respect to the Fund in general and exclusive voting rights on matters that affect that class alone. Earnings, net assets and net asset value per share may differ due to each class having its own expenses, such as transfer and shareholder servicing agent fees and shareholder communications, directly attributable to that class.
The following is a summary of significant accounting policies followed in the Fund’s preparation of financial statements in accordance with accounting principles generally accepted in the United States (“U.S. GAAP”).
2. Significant Accounting Policies
Security Valuation. All investments in securities are recorded at their estimated fair value, as described in Note 3.
Reporting Period End Date. The last day of the Fund’s reporting period is the last day the New York Stock Exchange was open for trading during the period. The Fund’s financial statements have been presented through that date to maintain consistency with the Fund’s net asset value calculations used for shareholder transactions.
Allocation of Income, Expenses, Gains and Losses. Income, expenses (other than those attributable to a specific class), gains and losses are allocated on a daily basis to each class of shares based upon the relative proportion of net assets represented by such class. Operating expenses directly attributable to a specific class are charged against the operations of that class.
Dividends and Distributions to Shareholders. Dividends and distributions to shareholders, which are determined in accordance with income tax regulations and may differ from U.S. GAAP, are recorded on the ex-dividend date. Income and capital gain distributions, if any, are declared and paid annually or at other times as deemed necessary by the Manager.
Investment Income. Dividend income is recorded on the ex-dividend date or upon ex-dividend notification in the case of certain foreign dividends where the ex-dividend date may have passed. Non-cash dividends included in dividend income, if any, are recorded at the fair market value of the securities received. Interest income is recognized on an accrual basis. Discount and premium, which are included in interest income on the Statement of Operations, are amortized or accreted daily.
Return of Capital Estimates. Distributions received from the Fund’s investments in Master Limited Partnerships (MLPs) and Real Estate Investments Trusts (REITs), generally are comprised of income and return of capital. The Fund records investment income and return of capital based on estimates. Such estimates are based on historical information available from each MLP, REIT and other industry sources. These estimates may subsequently be revised based on information received from MLPs and REITs after their tax reporting periods are concluded.
Custodian Fees. “Custodian fees and expenses” in the Statement of Operations may include interest expense incurred by the Fund on any cash overdrafts of its custodian account during the period. Such cash overdrafts may result from the effects of failed trades in portfolio securities and from cash outflows resulting from unanticipated shareholder redemption activity. The Fund pays interest to its custodian on such cash overdrafts, to the extent they are not offset by positive cash balances maintained by the Fund, at a rate equal to the Federal Funds Rate plus 0.50%. The “Reduction to custodian expenses” line item, if applicable, represents earnings on cash balances maintained by the Fund during the period. Such interest expense and other custodian fees may be paid with these earnings.
Security Transactions. Security transactions are recorded on the trade date. Realized gains and losses on securities sold are determined on the basis of identified cost.
Indemnifications. The Fund’s organizational documents provide current and former Trustees and officers with a limited indemnification against liabilities arising in connection with the performance of their duties to the Fund. In the normal course of business, the Fund may also enter into contracts that provide general indemnifications. The Fund’s maximum exposure under these arrangements is unknown as this would be dependent on future claims that may be made against the Fund. The risk of material loss from such claims is considered remote.
Federal Taxes. The Fund intends to comply with provisions of the Internal Revenue Code applicable to regulated investment companies and to distribute substantially all of its investment company taxable income, including any net realized gain on investments not offset by capital loss carryforwards, if any, to shareholders. Therefore, no federal income or excise tax provision is required. The Fund files income tax returns in U.S. federal
14 OPPENHEIMER DISCOVERY MID CAP GROWTH FUND/VA
2. Significant Accounting Policies (Continued)
and applicable state jurisdictions. The statute of limitations on the Fund’s tax return filings generally remains open for the three preceding fiscal reporting period ends.
The tax components of capital shown in the following table represent distribution requirements the Fund must satisfy under the income tax regulations, losses the Fund may be able to offset against income and gains realized in future years and unrealized appreciation or depreciation of securities and other investments for federal income tax purposes.
| | | | | | | | | | | | |
Undistributed Net Investment Income | | Undistributed
Long-Term
Gain | | | Accumulated
Loss
Carryforward1,2 | | | Net Unrealized
Appreciation
Based on cost of
Securities and
Other Investments
for Federal Income
Tax Purposes | |
| |
$— | | | $50,898,335 | | | | $— | | | | $160,723,039 | |
1. During the reporting period, the Fund did not utilize any capital loss carryforward.
2. During the previous reporting period, the Fund utilized $50,885,832 of capital loss carryforward to offset capital gains realized in that fiscal year.
Net investment income (loss) and net realized gain (loss) may differ for financial statement and tax purposes. The character of dividends and distributions made during the fiscal year from net investment income or net realized gains are determined in accordance with federal income tax requirements, which may differ from the character of net investment income or net realized gains presented in those financial statements in accordance with U.S. GAAP. Also, due to timing of dividends and distributions, the fiscal year in which amounts are distributed may differ from the fiscal year in which the income or net realized gain was recorded by the Fund.
Accordingly, the following amounts have been reclassified for the reporting period. Net assets of the Fund were unaffected by the reclassifications.
| | | | | | | | |
Increase to Paid-in Capital | | Reduction
to Accumulated
Net Investment
Loss | | | Reduction
to Accumulated Net
Realized Gain
on Investments3 | |
| |
$1,279,465 | | | $2,034,482 | | | | $3,313,947 | |
3. $3,313,947, all of which was long-term capital gain, was distributed in connection with Fund share redemptions.
The tax character of distributions paid during the reporting periods:
| | | | | | | | |
| | | Year Ended
December 31, 2015 | | | Year Ended
December 31, 2014 | |
| |
Distributions paid from: | | | | | | | | |
Long-term capital gain | | $ | 64,438,944 | | | $ | — | |
The aggregate cost of securities and other investments and the composition of unrealized appreciation and depreciation of securities and other investments for federal income tax purposes at period end are noted in the following table. The primary difference between book and tax appreciation or depreciation of securities and other investments, if applicable, is attributable to the tax deferral of losses or tax realization of financial statement unrealized gain or loss.
| | | | |
Federal tax cost of securities | | $ | 536,093,098 | |
| | | | |
Gross unrealized appreciation | | $ | 167,786,319 | |
Gross unrealized depreciation | | | (7,063,280) | |
| | | | |
Net unrealized appreciation | | $ | 160,723,039 | |
| | | | |
Use of Estimates. The preparation of financial statements in conformity with U.S. GAAP requires management to make estimates and assumptions that affect the reported amounts of assets and liabilities and disclosure of contingent assets and liabilities at the date of the financial statements and the reported amounts of increases and decreases in net assets from operations during the reporting period. Actual results could differ from those estimates.
3. Securities Valuation
The Fund calculates the net asset value of its shares as of the close of the New York Stock Exchange (the “Exchange”), normally 4:00 P.M. Eastern time, on each day the Exchange is open for trading, except in the case of a scheduled early closing of the Exchange, in which case the Fund will calculate net asset value of the shares as of the scheduled early closing time of the Exchange.
The Fund’s Board has adopted procedures for the valuation of the Fund’s securities and has delegated the day-to-day responsibility for valuation determinations under those procedures to the Manager. The Manager has established a Valuation Committee which is responsible for determining a “fair valuation” for any security for which market quotations are not “readily available.” The Valuation Committee’s fair valuation determinations are
15 OPPENHEIMER DISCOVERY MID CAP GROWTH FUND/VA
NOTES TO FINANCIAL STATEMENTS Continued
3. Securities Valuation (Continued)
subject to review, approval and ratification by the Fund’s Board at its next regularly scheduled meeting covering the calendar quarter in which the fair valuation was determined.
Valuation Methods and Inputs
Securities are valued using unadjusted quoted market prices, when available, as supplied primarily by third party pricing services or dealers.
The following methodologies are used to determine the market value or the fair value of the types of securities described below:
Securities traded on a registered U.S. securities exchange (including exchange-traded derivatives other than futures and futures options) are valued based on the last sale price of the security reported on the principal exchange on which it is traded, prior to the time when the Fund’s assets are valued. In the absence of a sale, the security is valued at the mean between the bid and asked price on the principal exchange or, if not available from the principal exchange, obtained from two dealers. If bid and asked prices are not available from either the exchange or two dealers, the security is valued by using one of the following methodologies (listed in order of priority): (1) a bid from the principal exchange, (2) the mean between the bid and asked price as provided by a single dealer, or (3) a bid from a single dealer. A security of a foreign issuer traded on a foreign exchange, but not listed on a registered U.S. securities exchange, is valued based on the last sale price on the principal exchange on which the security is traded, as identified by the third party pricing service used by the Manager, prior to the time when the Fund’s assets are valued. If the last sale price is unavailable, the security is valued at the most recent official closing price on the principal exchange on which it is traded. If the last sales price or official closing price for a foreign security is not available, the security is valued at the mean between the bid and asked price per the exchange or, if not available from the exchange, obtained from two dealers. If bid and asked prices are not available from either the exchange or two dealers, the security is valued by using one of the following methodologies (listed in order of priority): (1) a bid from the exchange, (2) the mean between the bid and asked price as provided by a single dealer, or (3) a bid from a single dealer.
Shares of a registered investment company that are not traded on an exchange are valued at that investment company’s net asset value per share.
Corporate and government debt securities (of U.S. or foreign issuers) and municipal debt securities, event-linked bonds, loans, mortgage-backed securities, collateralized mortgage obligations, and asset-backed securities are valued at the mean between the “bid” and “asked” prices utilizing evaluated prices obtained from third party pricing services or broker-dealers who may use matrix pricing methods to determine the evaluated prices.
Short-term money market type debt securities with a remaining maturity of sixty days or less are valued at cost adjusted by the amortization of discount or premium to maturity (amortized cost), which approximates market value. Short-term debt securities with a remaining maturity in excess of sixty days are valued at the mean between the “bid” and “asked” prices utilizing evaluated prices obtained from third party pricing services or broker-dealers.
A description of the standard inputs that may generally be considered by the third party pricing vendors in determining their evaluated prices is provided below.
| | |
| Security Type | | Standard inputs generally considered by third-party pricing vendors |
| Corporate debt, government debt, municipal, mortgage-backed and asset-backed securities | | Reported trade data, broker-dealer price quotations, benchmark yields, issuer spreads on comparable securities, the credit quality, yield, maturity, and other appropriate factors. |
| Loans | | Information obtained from market participants regarding reported trade data and broker-dealer price quotations. |
| Event-linked bonds | | Information obtained from market participants regarding reported trade data and broker-dealer price quotations. |
If a market value or price cannot be determined for a security using the methodologies described above, or if, in the “good faith” opinion of the Manager, the market value or price obtained does not constitute a “readily available market quotation,” or a significant event has occurred that would materially affect the value of the security, the security is fair valued either (i) by a standardized fair valuation methodology applicable to the security type or the significant event as previously approved by the Valuation Committee and the Fund’s Board or (ii) as determined in good faith by the Manager’s Valuation Committee. The Valuation Committee considers all relevant facts that are reasonably available, through either public information or information available to the Manager, when determining the fair value of a security. Fair value determinations by the Manager are subject to review, approval and ratification by the Fund’s Board at its next regularly scheduled meeting covering the calendar quarter in which the fair valuation was determined. Those fair valuation standardized methodologies include, but are not limited to, valuing securities at the last sale price or initially at cost and subsequently adjusting the value based on: changes in company specific fundamentals, changes in an appropriate securities index, or changes in the value of similar securities which may be further adjusted for any discounts related to security-specific resale restrictions. When possible, such methodologies use observable market inputs such as unadjusted quoted prices of similar securities, observable interest rates, currency rates and yield curves. The methodologies used for valuing securities are not necessarily an indication of the risks associated with investing in those securities nor can it be assured that the Fund can obtain the fair value assigned to a security if it were to sell the security.
To assess the continuing appropriateness of security valuations, the Manager, or its third party service provider who is subject to oversight by the Manager, regularly compares prior day prices, prices on comparable securities, and sale prices to the current day prices and challenges those prices exceeding certain tolerance levels with the third party pricing service or broker source. For those securities valued by fair valuations, whether through a standardized fair valuation methodology or a fair valuation determination, the Valuation Committee reviews and affirms the reasonableness of the valuations based on such methodologies and fair valuation determinations on a regular basis after considering all relevant information that is reasonably available.
16 OPPENHEIMER DISCOVERY MID CAP GROWTH FUND/VA
3. Securities Valuation (Continued)
Classifications
Each investment asset or liability of the Fund is assigned a level at measurement date based on the significance and source of the inputs to its valuation. Various data inputs are used in determining the value of each of the Fund’s investments as of the reporting period end. These data inputs are categorized in the following hierarchy under applicable financial accounting standards:
1) Level 1-unadjusted quoted prices in active markets for identical assets or liabilities (including securities actively traded on a securities exchange)
2) Level 2-inputs other than unadjusted quoted prices that are observable for the asset or liability (such as unadjusted quoted prices for similar assets and market corroborated inputs such as interest rates, prepayment speeds, credit risks, etc.)
3) Level 3-significant unobservable inputs (including the Manager’s own judgments about assumptions that market participants would use in pricing the asset or liability).
The inputs used for valuing securities are not necessarily an indication of the risks associated with investing in those securities.
The table below categorizes amounts that are included in the Fund’s Statement of Assets and Liabilities at period end based on valuation input level:
| | | | | | | | | | | | | | | | |
| | | Level 1— Unadjusted Quoted Prices | | | Level 2— Other Significant
Observable Inputs | | | Level 3—
Significant
Unobservable
Inputs | | | Value | |
| |
Assets Table | | | | | | | | | | | | | | | | |
Investments, at Value: | | | | | | | | | | | | | | | | |
Common Stocks | | | | | | | | | | | | | | | | |
Consumer Discretionary | | $ | 155,837,770 | | | $ | — | | | $ | — | | | $ | 155,837,770 | |
Consumer Staples | | | 56,381,586 | | | | — | | | | — | | | | 56,381,586 | |
Energy | | | 9,454,500 | | | | — | | | | — | | | | 9,454,500 | |
Financials | | | 66,315,691 | | | | — | | | | — | | | | 66,315,691 | |
Health Care | | | 97,780,633 | | | | — | | | | — | | | | 97,780,633 | |
Industrials | | | 111,123,268 | | | | — | | | | — | | | | 111,123,268 | |
Information Technology | | | 151,269,231 | | | | — | | | | — | | | | 151,269,231 | |
Materials | | | 19,085,717 | | | | — | | | | — | | | | 19,085,717 | |
Telecommunication Services | | | 9,171,560 | | | | — | | | | — | | | | 9,171,560 | |
Investment Company | | | 20,396,181 | | | | — | | | | — | | | | 20,396,181 | |
| | | | |
Total Assets | | $ | 696,816,137 | | | $ | — | | | $ | — | | | $ | 696,816,137 | |
| | | | |
Forward currency exchange contracts and futures contracts, if any, are reported at their unrealized appreciation/depreciation at measurement date, which represents the change in the contract’s value from trade date. All additional assets and liabilities included in the above table are reported at their market value at measurement date.
4. Investments and Risks
Investments in Affiliated Funds. The Fund is permitted to invest in other mutual funds advised by the Manager (“Affiliated Funds”). Affiliated Funds are open-end management investment companies registered under the 1940 Act, as amended. The Manager is the investment adviser of, and the Sub-Adviser provides investment and related advisory services to, the Affiliated Funds. When applicable, the Fund’s investments in Affiliated Funds are included in the Statement of Investments. Shares of Affiliated Funds are valued at their net asset value per share. As a shareholder, the Fund is subject to its proportional share of the Affiliated Funds’ expenses, including their management fee. The Manager will waive fees and/or reimburse Fund expenses in an amount equal to the indirect management fees incurred through the Fund’s investment in the Affiliated Funds.
Each of the Affiliated Funds in which the Fund invests has its own investment risks, and those risks can affect the value of the Fund’s investments and therefore the value of the Fund’s shares. To the extent that the Fund invests more of its assets in one Affiliated Fund than in another, the Fund will have greater exposure to the risks of that Affiliated Fund.
Investment in Oppenheimer Institutional Money Market Fund. The Fund is permitted to invest daily available cash balances in a money market Affiliated Fund. The Fund may invest the available cash in Class E shares of Oppenheimer Institutional Money Market Fund (“IMMF”) to seek current income while preserving liquidity or for defensive purposes. IMMF is regulated as a money market fund under the Investment Company Act of 1940, as amended.
Master Limited Partnerships (“MLPs”). MLPs issue common units that represent an equity ownership interest in a partnership and provide limited voting rights. MLP common units are registered with the Securities and Exchange Commission (“SEC”), and are freely tradable on securities exchanges such as the NYSE and the NASDAQ Stock Market (“NASDAQ”), or in the over-the-counter (“OTC”) market. An MLP consists of one or more general partners, who conduct the business, and one or more limited partners, who contribute capital. MLP common unit holders have a limited role in the partnership’s operations and management. The Fund, as a limited partner, normally would not be liable for the debts of the MLP beyond the amounts the Fund has contributed, but would not be shielded to the same extent that a shareholder of a corporation would be. In certain circumstances creditors of an MLP would have the right to seek return of capital distributed to a limited partner. This right of an MLP’s creditors would continue after the Fund sold its investment in the MLP.
17 OPPENHEIMER DISCOVERY MID CAP GROWTH FUND/VA
NOTES TO FINANCIAL STATEMENTS Continued
4. Investments and Risks (Continued)
Equity Security Risk. Stocks and other equity securities fluctuate in price. The value of the Fund’s portfolio may be affected by changes in the equity markets generally. Equity markets may experience significant short-term volatility and may fall sharply at times. Different markets may behave differently from each other and U.S. equity markets may move in the opposite direction from one or more foreign stock markets. Adverse events in any part of the equity or fixed-income markets may have unexpected negative effects on other market segments.
The prices of individual equity securities generally do not all move in the same direction at the same time and a variety of factors can affect the price of a particular company’s securities. These factors may include, but are not limited to, poor earnings reports, a loss of customers, litigation against the company, general unfavorable performance of the company’s sector or industry, or changes in government regulations affecting the company or its industry.
5. Market Risk Factors
The Fund’s investments in securities and/or financial derivatives may expose the fund to various market risk factors:
Commodity Risk. Commodity risk relates to the change in value of commodities or commodity indexes as they relate to increases or decreases in the commodities market. Commodities are physical assets that have tangible properties. Examples of these types of assets are crude oil, heating oil, metals, livestock, and agricultural products.
Credit Risk. Credit risk relates to the ability of the issuer of debt to meet interest and principal payments, or both, as they come due. In general, lower-grade, higher-yield debt securities are subject to credit risk to a greater extent than lower-yield, higher-quality securities.
Equity Risk. Equity risk relates to the change in value of equity securities as they relate to increases or decreases in the general market.
Foreign Exchange Rate Risk. Foreign exchange rate risk relates to the change in the U.S. dollar value of a security held that is denominated in a foreign currency. The U.S. dollar value of a foreign currency denominated security will decrease as the dollar appreciates against the currency, while the U.S. dollar value will increase as the dollar depreciates against the currency.
Interest Rate Risk. Interest rate risk refers to the fluctuations in value of fixed-income securities resulting from the inverse relationship between price and yield. For example, an increase in general interest rates will tend to reduce the market value of already issued fixed-income investments, and a decline in general interest rates will tend to increase their value. In addition, debt securities with longer maturities, which tend to have higher yields, are subject to potentially greater fluctuations in value from changes in interest rates than obligations with shorter maturities.
Volatility Risk. Volatility risk refers to the magnitude of the movement, but not the direction of the movement, in a financial instrument’s price over a defined time period. Large increases or decreases in a financial instrument’s price over a relative time period typically indicate greater volatility risk, while small increases or decreases in its price typically indicate lower volatility risk.
6. Shares of Beneficial Interest
The Fund has authorized an unlimited number of $0.001 par value shares of beneficial interest of each class. Transactions in shares of beneficial interest were as follows:
| | | | | | | | | | | | | | | | | | | | | | |
| | | Year Ended December 31, 2015 | | | | | | | Year Ended December 31, 2014 | | | |
| | | Shares | | | Amount | | | | | | | Shares | | | Amount | | | |
|
Non-Service Shares | | | | | | | | | | | | | | | | | | | | | | |
Sold | | | 316,843 | | | $ | 25,835,263 | | | | | | | | 416,592 | | | $ | 31,353,214 | | | |
Dividends and/or distributions reinvested | | | 772,150 | | | | 61,563,484 | | | | | | | | — | | | | — | | | |
Redeemed | | | (1,154,717 | ) | | | (93,160,379 | ) | | | | | | | (1,493,014 | ) | | | (111,716,047 | ) | | |
| | | |
Net decrease | | | (65,724 | ) | | $ | (5,761,632 | ) | | | | | | | (1,076,422 | ) | | $ | (80,362,833 | ) | | |
| | | |
| | | |
|
Service Shares | | | | | | | | | | | | | | | | | | | | | | |
Sold | | | 153,951 | | | $ | 11,748,349 | | | | | | | | 42,402 | | | $ | 3,058,524 | | | |
Dividends and/or distributions reinvested | | | 37,465 | | | | 2,875,460 | | | | | | | | — | | | | — | | | |
Redeemed | | | (96,510 | ) | | | (7,534,963 | ) | | | | | | | (142,155 | ) | | | (10,267,950 | ) | | |
| | | |
Net increase (decrease) | | | 94,906 | | | $ | 7,088,846 | | | | | | | | (99,753 | ) | | $ | (7,209,426 | ) | | |
| | | |
7. Purchases and Sales of Securities
The aggregate cost of purchases and proceeds from sales of securities, other than short-term obligations and investments in IMMF, for the reporting period were as follows:
| | | | | | | | |
| | | | | Purchases | | Sales | | |
| | | | |
| | Investment securities | | $569,949,774 | | $644,955,367 | | |
8. Fees and Other Transactions with Affiliates
Management Fees. Under the investment advisory agreement, the Fund pays the Manager a management fee based on the daily net assets of the Fund at an annual rate as shown in the following table:
18 OPPENHEIMER DISCOVERY MID CAP GROWTH FUND/VA
8. Fees and Other Transactions with Affiliates (Continued)
| | | | |
| Fee Schedule | | | |
| |
Up to $200 million | | | 0.75% | |
Next $200 million | | | 0.72 | |
Next $200 million | | | 0.69 | |
Next $200 million | | | 0.66 | |
Next $700 million | | | 0.60 | |
Over $1.5 billion | | | 0.58 | |
The Fund’s effective management fee for the reporting period was 0.71% of average annual net assets before any applicable waivers.
Sub-Adviser Fees. The Manager has retained the Sub-Adviser to provide the day-to-day portfolio management of the Fund. Under the Sub-Advisory Agreement, the Manager pays the Sub-Adviser an annual fee in monthly installments, equal to a percentage of the investment management fee collected by the Manager from the Fund, which shall be calculated after any investment management fee waivers. The fee paid to the Sub-Adviser is paid by the Manager, not by the Fund.
Transfer Agent Fees. OFI Global (the “Transfer Agent”) serves as the transfer and shareholder servicing agent for the Fund. The Fund pays the Transfer Agent a fee based on annual net assets. Fees incurred and average net assets for each class with respect to these services are detailed in the Statement of Operations and Financial Highlights, respectively.
Sub-Transfer Agent Fees. The Transfer Agent has retained Shareholder Services, Inc., a wholly-owned subsidiary of OFI (the “Sub-Transfer Agent”), to provide the day-to-day transfer agent and shareholder servicing of the Fund. Under the Sub-Transfer Agency Agreement, the Transfer Agent pays the Sub-Transfer Agent an annual fee in monthly installments, equal to a percentage of the transfer agent fee collected by the Transfer Agent from the Fund, which shall be calculated after any applicable fee waivers. The fee paid to the Sub-Transfer Agent is paid by the Transfer Agent, not by the Fund.
Trustees’ Compensation. The Fund’s Board of Trustees (“Board”) has adopted a compensation deferral plan for Independent Trustees that enables Trustees to elect to defer receipt of all or a portion of the annual compensation they are entitled to receive from the Fund. For purposes of determining the amount owed to the Trustees under the plan, deferred amounts are treated as though equal dollar amounts had been invested in shares of the Fund or in other Oppenheimer funds selected by the Trustees. The Fund purchases shares of the funds selected for deferral by the Trustees in amounts equal to his or her deemed investment, resulting in a Fund asset equal to the deferred compensation liability. Such assets are included as a component of “Other” within the asset section of the Statement of Assets and Liabilities. Deferral of Trustees’ fees under the plan will not affect the net assets of the Fund and will not materially affect the Fund’s assets, liabilities or net investment income per share. Amounts will be deferred until distributed in accordance with the compensation deferral plan.
Distribution and Service Plan for Service Shares. The Fund has adopted a Distribution and Service Plan (the “Plan”) pursuant to Rule 12b-1 under the 1940 Act for Service shares to pay OppenheimerFunds Distributor, Inc. (the “Distributor”), for distribution related services, personal service and account maintenance for the Fund’s Service shares. Under the Plan, payments are made periodically at an annual rate of 0.25% of the daily net assets of Service shares of the Fund. The Distributor currently uses all of those fees to compensate sponsors of the insurance product that offers Fund shares, for providing personal service and maintenance of accounts of their variable contract owners that hold Service shares. These fees are paid out of the Fund’s assets on an on-going basis and increase operating expenses of the Service shares, which results in lower performance compared to the Fund’s shares that are not subject to a service fee. Fees incurred by the Fund under the Plan are detailed in the Statement of Operations.
Waivers and Reimbursements of Expenses. The Manager has contractually agreed to limit the Fund’s expenses after payments, waivers and/or reimbursements and reduction to custodian expenses, excluding expenses incurred directly or indirectly by the Fund as a result of investments in other investment companies, wholly-owned subsidiaries and pooled investment vehicles; so that those expenses, as percentages of daily net assets, will not exceed the annual rate of 0.80% for Non-Service shares and 1.05% for Service shares. The expense limitations do not include interest and fees from borrowing, and other expenses not incurred in the ordinary course of the Fund’s business. During the reporting period, the Manager waived fees and/or reimbursed the Fund $183,031 and $9,057 for Non-Service and Service shares, respectively.
The Manager will waive fees and/or reimburse Fund expenses in an amount equal to the indirect management fees incurred through the Fund’s investment in IMMF. During the reporting period, the Manager waived fees and/or reimbursed the Fund $19,784 for IMMF management fees.
Waivers and/or reimbursements may be modified or terminated as set forth according to the terms in the prospectus.
9. Borrowings and Other Financing
Joint Credit Facility. A number of mutual funds managed by the Manager participate in a $1.28 billion revolving credit facility (the “Facility”) intended to provide short-term financing, if necessary, subject to certain restrictions in connection with atypical redemption activity. Expenses and fees related to the Facility are paid by the participating funds and are disclosed separately or as other expenses on the Statement of Operations. The Fund did not utilize the Facility during the reporting period.
19 OPPENHEIMER DISCOVERY MID CAP GROWTH FUND/VA
NOTES TO FINANCIAL STATEMENTS Continued
10. Pending Litigation
In 2009, several putative class action lawsuits were filed and later consolidated before the U.S. District Court for the District of Colorado against OppenheimerFunds, Inc. (“OFI”), OppenheimerFunds Distributor, Inc. (“OFDI”), and Oppenheimer Rochester California Municipal Fund, a fund advised by OFI Global Asset Management, Inc. and distributed by the Distributor (the “California Fund”), in connection with the California Fund’s investment performance. The plaintiffs asserted claims against OFI, OFDI and certain present and former trustees and officers of the California Fund under the federal securities laws, alleging, among other things, that the disclosure documents of the California Fund contained misrepresentations and omissions and the investment policies of the California Fund were not followed. Plaintiffs in the suit filed an amended complaint and defendants filed a motion to dismiss. In 2011, the court issued an order which granted in part and denied in part the defendants’ motion to dismiss. In 2012, plaintiffs filed a motion, which defendants opposed, to certify a class and appoint class representatives and class counsel. In March 2015, the court granted plaintiffs’ motion for class certification. In May 2015, the U.S. Court of Appeals for the Tenth Circuit vacated the class certification order and remanded the matter to the district court for further proceedings. In October 2015, the district court reaffirmed its order and determined that the suit will proceed as a class action. In December 2015, the Tenth Circuit denied defendants’ petition to appeal the district court’s reaffirmed class certification order.
OFI and OFDI believe the suit is without merit; that it is premature to render any opinion as to the likelihood of an outcome unfavorable to them in the suit; and that no estimate can yet be made as to the amount or range of any potential loss. Furthermore, OFI believes that the suit should not impair the ability of OFI or OFDI to perform their respective duties to the Fund and that the outcome of the suit should not have any material effect on the operations of any of the Oppenheimer funds.
20 OPPENHEIMER DISCOVERY MID CAP GROWTH FUND/VA
REPORT OF INDEPENDENT REGISTERED PUBLIC ACCOUNTING FIRM
The Board of Trustees and Shareholders of Oppenheimer Variable Account Funds:
We have audited the accompanying statement of assets and liabilities of Oppenheimer Discovery Mid Cap Growth Fund/VA (a separate series of Oppenheimer Variable Account Funds), including the statement of investments, as of December 31, 2015, and the related statement of operations for the year then ended, the statements of changes in net assets for each of the years in the two-year period then ended, and the financial highlights for each of the years in the five-year period then ended. These financial statements and financial highlights are the responsibility of the Fund’s management. Our responsibility is to express an opinion on these financial statements and financial highlights based on our audits.
We conducted our audits in accordance with the standards of the Public Company Accounting Oversight Board (United States). Those standards require that we plan and perform the audit to obtain reasonable assurance about whether the financial statements and financial highlights are free of material misstatement. An audit includes examining, on a test basis, evidence supporting the amounts and disclosures in the financial statements. Our procedures included confirmation of securities owned as of December 31, 2015, by correspondence with the custodian, transfer agent and brokers, or by other appropriate auditing procedures where replies from brokers were not received. An audit also includes assessing the accounting principles used and significant estimates made by management, as well as evaluating the overall financial statement presentation. We believe that our audits provide a reasonable basis for our opinion.
In our opinion, the financial statements and financial highlights referred to above present fairly, in all material respects, the financial position of Oppenheimer Discovery Mid Cap Growth Fund/VA as of December 31, 2015, the results of its operations for the year then ended, the changes in its net assets for each of the years in the two-year period then ended, and the financial highlights for each of the years in the five-year period then ended, in conformity with U.S. generally accepted accounting principles.
KPMGLLP
Denver, Colorado
February 12, 2016
21 OPPENHEIMER DISCOVERY MID CAP GROWTH FUND/VA
FEDERALINCOMETAXINFORMATION Unaudited
In early 2016, if applicable, shareholders of record received information regarding all dividends and distributions paid to them by the Fund during calendar year 2015.
Capital gain distributions of $7.44587 per share were paid to Non-Service and Service shareholders, respectively, on June 16, 2015. Whether received in stock or in cash, the capital gain distribution should be treated by shareholders as a gain from the sale of the capital assets held for more than one year (long-term capital gains).
None of the dividends paid by the Fund during the reporting period are eligible for the corporate dividend-received deduction.
The foregoing information is presented to assist shareholders in reporting distributions received from the Fund to the Internal Revenue Service. Because of the complexity of the federal regulations which may affect your individual tax return and the many variations in state and local tax regulations, we recommend that you consult your tax advisor for specific guidance.
22 OPPENHEIMER DISCOVERY MID CAP GROWTH FUND/VA
BOARD APPROVAL OF THE FUND’S INVESTMENT ADVISORY AND SUB-ADVISORY AGREEMENTS Unaudited
The Fund has entered into an investment advisory agreement with OFI Global Asset Management, Inc. (“OFI Global” or the “Adviser”), a wholly-owned subsidiary of OppenheimerFunds, Inc. (“OFI” or the “Sub-Adviser”) (“OFI Global” and “OFI” together the “Managers”) and OFI Global has entered into a sub-advisory agreement with OFI whereby OFI provides investment sub-advisory services to the Fund (collectively, the “Agreements”). Each year, the Board of Trustees (the “Board”), including a majority of the independent Trustees, is required to determine whether to approve the terms of the Agreements and the renewal thereof. The Investment Company Act of 1940, as amended, requires that the Board request and evaluate, and that the Managers provide, such information as may be reasonably necessary to evaluate the terms of the Agreements. The Board employs an independent consultant to prepare a report that provides information, including comparative information that the Board requests for that purpose. In addition to in-person meetings focused on this evaluation, the Board receives information throughout the year regarding Fund services, fees, expenses and performance.
The Adviser, Sub-Adviser and the independent consultant provided information to the Board on the following factors: (i) the nature, quality and extent of the Managers’ services, (ii) the comparative investment performance of the Fund and the Managers, (iii) the fees and expenses of the Fund, including comparative fee and expense information, (iv) the profitability of the Managers and their affiliates, including an analysis of the cost of providing services, (v) whether economies of scale are realized as the Fund grows and whether fee levels reflect these economies of scale for Fund investors and (vi) other benefits to the Managers from their relationship with the Fund. The Board was aware that there are alternatives to retaining the Managers.
Outlined below is a summary of the principal information considered by the Board as well as the Board’s conclusions.
Nature, Quality and Extent of Services. The Board considered information about the nature, quality and extent of the services provided to the Fund and information regarding the Managers’ key personnel who provide such services. The Managers’ duties include providing the Fund with the services of the portfolio managers and the Sub-Adviser’s investment team, who provide research, analysis and other advisory services in regard to the Fund’s investments; and securities trading services. OFI Global is responsible for oversight of third-party service providers; monitoring compliance with applicable Fund policies and procedures and adherence to the Fund’s investment restrictions; risk management; and oversight of the Sub-Adviser. OFI Global is also responsible for providing certain administrative services to the Fund as well. Those services include providing and supervising all administrative and clerical personnel who are necessary in order to provide effective corporate administration for the Fund; compiling and maintaining records with respect to the Fund’s operations; preparing and filing reports required by the U.S. Securities and Exchange Commission; preparing periodic reports regarding the operations of the Fund for its shareholders; preparing proxy materials for shareholder meetings; and preparing the registration statements required by federal and state securities laws for the sale of the Fund’s shares. OFI Global also provides the Fund with office space, facilities and equipment.
The Board also considered the quality of the services provided and the quality of the Managers’ resources that are available to the Fund. The Board took account of the fact that the Sub-Adviser has had over fifty years of experience as an investment adviser and that its assets under management rank it among the top mutual fund managers in the United States. The Board evaluated the Managers’ advisory, administrative, accounting, legal, compliance services and risk management, and information the Board has received regarding the experience and professional qualifications of the Managers’ key personnel and the size and functions of its staff. In its evaluation of the quality of the portfolio management services provided, the Board considered the experience of Ronald Zibelli and Justin Livengood, the portfolio managers for the Fund, and the Sub-Adviser’s investment team and analysts. The Board members also considered the totality of their experiences with the Managers as directors or trustees of the Fund and other funds advised by the Managers. The Board considered information regarding the quality of services provided by affiliates of the Managers, which the Board members have become knowledgeable about through their experiences with the Managers and in connection with the renewal of the Fund’s service agreements. The Board concluded, in light of the Managers’ experience, reputation, personnel, operations and resources that the Fund benefits from the services provided under the Agreements.
Investment Performance of the Managers and the Fund. Throughout the year, the Managers provided information on the investment performance of the Fund, including comparative performance information. The Board also reviewed information, prepared by the Managers and by the independent consultant, comparing the Fund’s historical performance to relevant market indices and to the performance of other mid-cap growth funds underlying variable insurance products. The Board considered that the Fund underperformed its performance category median for the one- and ten-year periods but outperformed for the three- and five-year periods. The Board also considered that the Adviser is satisfied with the overall performance of the Fund, noting the Adviser’s assertion that the Fund’s performance ranks in the 14th percentile when compared to the overall mid-cap growth category for the year to date period ended April 30, 2015.
Fees and Expenses of the Fund. The Board reviewed the fees paid to the Adviser and the other expenses borne by the Fund. The independent consultant provided comparative data in regard to the fees and expenses of the Fund and other mid-cap growth funds underlying variable insurance products. In reviewing the fees and expenses charged to the VA funds, the Board considered the Adviser’s assertion that, because there is much greater disparity in the fees and services that may be provided by a manager to a VA fund as opposed to a retail fund, when comparing the expenses of the various VA funds to those of retail funds, it is most appropriate to focus on total expenses (rather than on the management fees). Accordingly, while the Board reviewed and considered all expenses, it focused on total expenses. The Board considered that the Fund’s contractual management fees and total expenses were lower than their respective peer group medians and category medians. Within the total asset range of $500 million to $1 billion, the Fund’s effective management fee rate was lower than its peer group median and category median. The Board noted that the Adviser has contractually agreed to limit the Fund’s total annual operating expenses so that those expenses, as percentages of daily net assets, will not exceed the annual rate of 0.80% for Non-Service Shares and 1.05% for Service Shares. This contractual expense limitation may not be amended or withdrawn for one year from the date of the Fund’s prospectus, unless approved by the Board.
Economies of Scale and Profits Realized by the Managers. The Board considered information regarding the Managers’ costs in serving as the Fund’s investment adviser and sub-adviser, including the costs associated with the personnel and systems necessary to manage the Fund, and information regarding the Managers’ profitability from their relationship with the Fund. The Board reviewed whether the Managers may realize
23 OPPENHEIMER DISCOVERY MID CAP GROWTH FUND/VA
BOARD APPROVAL OF THE FUND’S INVESTMENT ADVISORY AND SUB-ADVISORY AGREEMENTS Unaudited / Continued
economies of scale in managing and supporting the Fund. The Board noted that the Fund currently has management fee breakpoints, which are intended to share with Fund shareholders economies of scale that may exist as the Fund’s assets grow.
Other Benefits to the Managers. In addition to considering the profits realized by the Managers, the Board considered information that was provided regarding the direct and indirect benefits the Managers receive as a result of their relationship with the Fund, including compensation paid to the Managers’ affiliates and research provided to the Adviser in connection with permissible brokerage arrangements (soft dollar arrangements).
Conclusions. These factors were also considered by the independent Trustees meeting separately from the full Board, assisted by experienced counsel to the Fund and to the independent Trustees. Fund counsel and the independent Trustees’ counsel are independent of the Managers within the meaning and intent of the Securities and Exchange Commission Rules.
Based on its review of the information it received and its evaluations described above, the Board, including a majority of the independent Trustees, decided to continue the Agreements through August 31, 2016. In arriving at its decision, the Board did not identify any factor or factors as being more important than others, but considered all of the above information, and considered the terms and conditions of the Agreements, including the management fees, in light of all the surrounding circumstances.
24 OPPENHEIMER DISCOVERY MID CAP GROWTH FUND/VA
PORTFOLIO PROXY VOTING POLICIES AND PROCEDURES; UPDATES TO STATEMENTS OF INVESTMENTS Unaudited
The Fund has adopted Portfolio Proxy Voting Policies and Procedures under which the Fund votes proxies relating to securities (“portfolio proxies”) held by the Fund. A description of the Fund’s Portfolio Proxy Voting Policies and Procedures is available (i) without charge, upon request, by calling the Fund toll-free at 1.800.525.7048, (ii) on the Fund’s website at www.oppenheimerfunds.com, and (iii) on the SEC’s website at www.sec.gov. In addition, the Fund is required to file Form N-PX, with its complete proxy voting record for the 12 months ended June 30th, no later than August 31st of each year. The Fund’s voting record is available (i) without charge, upon request, by calling the Fund toll-free at 1.800.525.7048, and (ii) in the Form N-PX filing on the SEC’s website at www.sec.gov.
The Fund files its complete schedule of portfolio holdings with the SEC for the first quarter and the third quarter of each fiscal year on Form N-Q. The Fund’s Form N-Q filings are available on the SEC’s website at www.sec.gov. Those forms may be reviewed and copied at the SEC’s Public Reference Room in Washington, D.C. Information on the operation of the Public Reference Room may be obtained by calling 1-800-SEC-0330.
25 OPPENHEIMER DISCOVERY MID CAP GROWTH FUND/VA
TRUSTEES AND OFFICERS Unaudited
| | |
Name, Position(s) Held with the Fund, Length of
Service, Year of Birth | | Principal Occupation(s) During the Past 5 Years; Other Trusteeships/Directorships
Held; Number of Portfolios in the Fund Complex Currently Overseen |
| |
| INDEPENDENT TRUSTEES | | The address of each Trustee in the chart below is 6803 S. Tucson Way, Centennial, Colorado 80112-3924. Each Trustee serves for an indefinite term, or until his or her resignation, retirement, death or removal. |
| |
Sam Freedman, Chairman of the Board of Trustees (since 2013) and Trustee (since 1996) Year of Birth: 1940 | | Director of Colorado UpLIFT (charitable organization) (since September 1984). Mr. Freedman held several positions with the Sub-Adviser and with subsidiary or affiliated companies of the Sub-Adviser (until October 1994). Oversees 47 portfolios in the OppenheimerFunds complex. Mr. Freedman has served on the Boards of certain Oppenheimer funds since 1996, during which time he has become familiar with the Fund’s (and other Oppenheimer funds’) financial, accounting, regulatory and investment matters and has contributed to the Boards’ deliberations. |
| |
Jon S. Fossel, Trustee (since 1990) Year of Birth: 1942 | | Chairman of the Board of Jack Creek Preserve Foundation (non-profit organization) (since 2005); Chairman of the Board (2006-December 2011) and Director (June 2002-December 2011) of UNUMProvident (insurance company); Director of Northwestern Energy Corp. (public utility corporation) (November 2004-December 2009); Director of P.R. Pharmaceuticals (October 1999-October 2003); Director of Rocky Mountain Elk Foundation (non-profit organization) (February 1998-February 2003 and February 2005-February 2007); Chairman and Director (until October 1996) and President and Chief Executive Officer (until October 1995) of the Sub-Adviser; President, Chief Executive Officer and Director of the following: Oppenheimer Acquisition Corp. (“OAC”) (parent holding company of the Sub-Adviser), Shareholders Services, Inc. and Shareholder Financial Services, Inc. (until October 1995). Oversees 47 portfolios in the OppenheimerFunds complex. Mr. Fossel has served on the Boards of certain Oppenheimer funds since 1990, during which time he has become familiar with the Fund’s (and other Oppenheimer funds’) financial, accounting, regulatory and investment matters and has contributed to the Boards’ deliberations. |
| |
Richard F. Grabish, Trustee (since 2012) Year of Birth: 1948 | | Formerly Senior Vice President and Assistant Director of Sales and Marketing (March 1997-December 2007), Director (March 1987-December 2007) and Manager of Private Client Services (June 1985-June 2005) of A.G. Edwards & Sons, Inc. (broker/dealer and investment firm); Chairman and Chief Executive Officer of A.G. Edwards Trust Company, FSB (March 2001- December 2007); President and Vice Chairman of A.G. Edwards Trust Company, FSB (investment adviser) (April 1987-March 2001); President of A.G. Edwards Trust Company, FSB (investment adviser) (June 2005-December 2007). Oversees 47 portfolios in the OppenheimerFunds complex. Mr. Grabish has served on the Boards of certain Oppenheimer funds since 2001, during which time he has become familiar with the Fund’s (and other Oppenheimer funds’) financial, accounting, regulatory and investment matters and has contributed to the Boards’ deliberations. |
| |
Beverly L. Hamilton, Trustee (since 2002) Year of Birth: 1946 | | Trustee of Monterey Institute for International Studies (educational organization) (since February 2000); Board Member of Middlebury College (educational organization) (December 2005-June 2011); Chairman (since 2010) of American Funds’ Emerging Markets Growth Fund, Inc. (mutual fund); Director of The California Endowment (philanthropic organization) (April 2002-April 2008); Director (February 2002-2005) and Chairman of Trustees (2006-2007) of the Community Hospital of Monterey Peninsula; Director (October 1991-2005); Vice Chairman (2006-2009) of American Funds’ Emerging Markets Growth Fund, Inc. (mutual fund); President of ARCO Investment Management Company (February 1991-April 2000); Member of the investment committees of The Rockefeller Foundation (2001-2006) and The University of Michigan (since 2000); Advisor at Credit Suisse First Boston’s Sprout venture capital unit (venture capital fund) (1994-January 2005); Trustee of MassMutual Institutional Funds (investment company) (1996-June 2004); Trustee of MML Series Investment Fund (investment company) (April 1989-June 2004); Member of the investment committee of Hartford Hospital (2000-2003); and Advisor to Unilever (Holland) pension fund (2000-2003). Oversees 47 portfolios in the OppenheimerFunds complex. Ms. Hamilton has served on the Boards of certain Oppenheimer funds since 2002, during which time she has become familiar with the Fund’s (and other Oppenheimer funds’) financial, accounting, regulatory and investment matters and has contributed to the Boards’ deliberations. |
| |
Victoria J. Herget, Trustee (since 2012) Year of Birth:1951 | | Board Chair (2008-Present) and Director (2004-Present), United Educators (insurance company); Trustee (since 2000) and Chair (since 2010), Newberry Library (independent research library); Trustee, Mather LifeWays (senior living organization) (since 2001); Independent Director of the First American Funds (mutual fund family) (2003-2011); former Managing Director (1993-2001), Principal (1985-1993), Vice President (1978-1985) and Assistant Vice President (1973-1978) of Zurich Scudder Investments (investment adviser) (and its predecessor firms); Trustee (1992-2007), Chair of the Board of Trustees (1999- 2007), Investment Committee Chair (1994-1999) and Investment Committee member (2007-2010) of Wellesley College; Trustee, BoardSource (non-profit organization) (2006-2009) and Chicago City Day School (K-8 School) (1994-2005). Oversees 47 portfolios in the OppenheimerFunds complex. Ms. Herget has served on the Boards of certain Oppenheimer funds since 2012, during which time she has become familiar with the Fund’s (and other Oppenheimer funds’) financial, accounting, regulatory and investment matters and has contributed to the Boards’ deliberations. |
| |
Robert J. Malone, Trustee (since 2002) Year of Birth: 1944 | | Chairman - Colorado Market of MidFirst Bank (since January 2015); Chairman of the Board (since 2012) and Director (since August 2005) of Jones International University (educational organization); Trustee of the Gallagher Family Foundation (non-profit organization) (2000-2015); Chairman, Chief Executive Officer and Director of Steele Street Bank Trust (commercial banking) (August 2003-January 2015); Board of Directors of Opera Colorado Foundation (non-profit organization) (2008- 2012); Director of Colorado UpLIFT (charitable organization) (1986-2010); Director of Jones Knowledge, Inc. (2006-2010); Former Chairman of U.S. Bank-Colorado (subsidiary of U.S. Bancorp and formerly Colorado National Bank) (July 1996-April 1999); Director of Commercial Assets, Inc. (real estate investment trust) (1993-2000); Director of U.S. Exploration, Inc. (oil and gas exploration) (1997-February 2004); Chairman of the Board (1991-1994) and Trustee (1985-1994) of Regis University; and Chairman of the Board (1990-1991 and Trustee (1984-1999) of Young Presidents Organization. Oversees 47 portfolios in the OppenheimerFunds complex. Mr. Malone has served on the Boards of certain Oppenheimer funds since 2002, during which time he has become familiar with the Fund’s (and other Oppenheimer funds’) financial, accounting, regulatory and investment matters and has contributed to the Boards’ deliberations. |
26 OPPENHEIMER DISCOVERY MID CAP GROWTH FUND/VA
| | |
| |
F. William Marshall, Jr., Trustee (since 2000) Year of Birth: 1942 | | Trustee Emeritus of Worcester Polytech Institute (WPI) (private university) (since 2009); Trustee of MassMutual Select Funds (formerly MassMutual Institutional Funds) (investment company) (since 1996), MML Series Investment Fund (investment company) (since 1996) and Mass Mutual Premier Funds (investment company) (since January 2012); President and Treasurer of the SIS Funds (private charitable fund) (January 1999-March 2011); Former Trustee of WPI (1985-2008); Former Chairman of the Board (2004-2006) and Former Chairman of the Investment Committee of WPI (1994-2008); Chairman of SIS Family Bank, F.S.B. (formerly SIS Bank) (commercial bank) (January 1999-July 1999); Executive Vice President of Peoples Heritage Financial Group, Inc. (commercial bank) (January 1999-July 1999); and Former President and Chief Executive Officer of SIS Bancorp. (1993-1999). Oversees 47 portfolios in the OppenheimerFunds complex. Mr. Marshall has served on the Boards of certain Oppenheimer funds since 2000, during which time he has become familiar with the Fund’s (and other Oppenheimer funds’) financial, accounting, regulatory and investment matters and has contributed to the Boards’ deliberations. |
| |
Karen L. Stuckey, Trustee (since 2012) Year of Birth: 1953 | | Partner (1990-2012) of PricewaterhouseCoopers LLP (professional services firm) (held various positions 1975-1990); Trustee (1992-2006) and member of Executive, Nominating and Audit Committees and Chair of Finance Committee of Lehigh University; and member, Women’s Investment Management Forum (professional organization) since inception. Oversees 47 portfolios in the OppenheimerFunds complex. Ms. Stuckey has served on the Boards of certain Oppenheimer funds since 2012, during which time she has become familiar with the Fund’s (and other Oppenheimer funds’) financial, accounting, regulatory and investment matters and has contributed to the Boards’ deliberations. |
| |
James D. Vaughn, Trustee (since 2012) Year of Birth: 1945 | | Retired; former managing partner (1994-2001) of Denver office of Deloitte & Touche LLP, (held various positions 1969-1993); Trustee and Chairman of the Audit Committee of Schroder Funds (2003-2012); Board member and Chairman of Audit Committee of AMG National Trust Bank (since 2005); Trustee, Investment Committee member, University of South Dakota Foundation (since 1996); Board member, Audit Committee Member and past Board Chair, Junior Achievement (since 1993); former Board member, Mile High United Way, Boys and Girls Clubs, Boy Scouts, Colorado Business Committee for the Arts, Economic Club of Colorado and Metro Denver Network. Oversees 47 portfolios in the OppenheimerFunds complex. Mr. Vaughn has served on the Boards of certain Oppenheimer funds since 2012, during which time he has become familiar with the Fund’s (and other Oppenheimer funds’) financial, accounting, regulatory and investment matters and has contributed to the Boards’ deliberations. |
|
| |
| INTERESTED TRUSTEE AND OFFICER | | Mr. Steinmetz is an “Interested Trustee” because he is affiliated with the Manager and the Sub-Adviser by virtue of his positions as Chairman and director of the Sub-Adviser and officer and director of the Manager. Both as a Trustee and as an officer, Mr. Steinmetz serves for an indefinite term, or until his resignation, retirement, death or removal. Mr. Steinmetz’s address is 225 Liberty Street, New York, New York 10281-1008. |
| |
Arthur P. Steinmetz Trustee (Since 2015), President and Principal Executive Officer (since 2014) Year of Birth: 1958 | | Chairman of the Sub-Adviser (since January 2015); CEO and Chairman of the Manager (since July 2014), President of the Manager (since May 2013), a Director of the Manager (since January 2013), Director of the Sub-Adviser (since July 2014), President, Management Director and CEO of Oppenheimer Acquisition Corp. (the Sub-Adviser’s parent holding company) (since July 2014), and President and Director of OFI SteelPath, Inc. (since January 2013). Chief Investment Officer of the OppenheimerFunds advisory entities from (January 2013-December 2013); Executive Vice President of the Manager (January 2013-May 2013); Chief Investment Officer of the Sub-Adviser (October 2010-December 2012); Chief Investment Officer, Fixed- Income, of the Sub-Adviser (April 2009-October 2010); Executive Vice President of the Sub-Adviser (October 2009-December 2012); Director of Fixed Income of the Sub-Adviser (January 2009-April 2009); and a Senior Vice President of the Sub-Adviser (March 1993-September 2009). An officer of 101 portfolios in the OppenheimerFunds complex. |
|
| OTHER OFFICERS OF THE FUND | | The addresses of the Officers in the chart below are as follows: for Messrs. Zibelli, Jr., Livengood, Gabinet, Mss. Sexton and Picciotto, 225 Liberty Street, New York, New York 10281-1008, for Mr. Wixted, 6803 S. Tucson Way, Centennial, Colorado 80112-3924. Each Officer serves for an indefinite term or until his or her resignation, retirement, death or removal. |
| |
Ronald J. Zibelli, Jr., Vice President (since 2008) Year of Birth: 1959 | | Senior Vice President of the Sub-Adviser (since January 2014); Senior Portfolio Manager of the Sub-Adviser (since May 2006) and Vice President of the Sub-Adviser (May 2006-January 2014). Prior to joining the Sub-Adviser, he spent six years at Merrill Lynch Investment Managers, during which time he was a Managing Director and Small Cap Growth Team Leader, responsible for managing 11 portfolios. Prior to joining Merrill Lynch Investment Managers, Mr. Zibelli spent 12 years with Chase Manhattan Bank, including two years as Senior Portfolio Manager (U.S. Small Cap Equity) at Chase Asset Management. A portfolio manager and an officer of other portfolios in the OppenheimerFunds complex. |
| |
Justin Livengood, Vice President (since 2014) Year of Birth: 1974 | | Vice President (since May 2006) and Senior Portfolio (since January 2014) of the Sub-Adviser. Senior Research Analyst of the Sub-Adviser (May 2006-January 2014), responsible for the health care, energy and financial services sectors for mid- and small-cap growth accounts. Before joining the Sub-Adviser in May 2006, Mr. Livengood was a vice president and fund analyst with Merrill Lynch Investment Managers, where he specialized in financial services, health care, energy and basic materials for the Merrill Lynch Small Cap Growth Fund. During his tenure at Merrill Lynch he also worked as an investment banking analyst in the Global Media Group and as an associate with Merrill Lynch Ventures. A portfolio manager and an officer of other portfolios in the OppenheimerFunds complex. |
| |
Arthur S. Gabinet, Secretary and Chief Legal Officer (since 2011) Year of Birth: 1958 | | Executive Vice President, Secretary and General Counsel of the Manager (since January 2013); General Counsel OFI SteelPath, Inc. (since January 2013); Executive Vice President (May 2010-December 2012) and General Counsel (since January 2011) of the Sub-Adviser; General Counsel of the Distributor (since January 2011); General Counsel of Centennial Asset Management Corporation (January 2011-December 2012); Executive Vice President (January 2011-December 2012) and General Counsel of HarbourView Asset Management Corporation (since January 2011); Assistant Secretary (since January 2011) and Director (since January 2011) of OppenheimerFunds International Ltd. and OppenheimerFunds plc; Director of Oppenheimer Real Asset Management, Inc. (January 2011-December 2012) and General Counsel (since January 2011); Executive Vice President (January 2011-December 2011) and General Counsel of Shareholder Financial Services, Inc. and Shareholder Services, Inc. |
27 OPPENHEIMER DISCOVERY MID CAP GROWTH FUND/VA
TRUSTEES AND OFFICERS Unaudited / Continued
| | |
| |
Arthur S. Gabinet, Continued | | (since January 2011); Executive Vice President (January 2011-December 2012) and General Counsel of OFI Private Investments Inc. (since January 2011); Vice President of OppenheimerFunds Legacy Program (January 2011-December 2011); Executive Vice President (January 2011-December 2012) and General Counsel of OFI Institutional Asset Management, Inc. (since January 2011); General Counsel, Asset Management of the Sub-Adviser (May 2010-December 2010); Principal, The Vanguard Group (November 2005-April 2010); District Administrator, U.S. Securities and Exchange Commission (January 2003-October 2005). An officer of 101 Portfolios in the OppenheimerFunds complex. |
| |
Jennifer Sexton, Vice President and Chief Business Officer (since 2014) Year of Birth: 1969 | | Senior Vice President of OppenheimerFunds Distributor, Inc. (since June 2014); Vice President of OppenheimerFunds Distributor, Inc. (April 2006-June 2014); Vice President of the Sub-Adviser (January 1998-March 2006); Assistant Vice President of the Sub-Adviser (October 1991-December 1998). An officer of 101 Portfolios in the OppenheimerFunds complex. |
| |
Mary Ann Picciotto, Chief Compliance Officer and Chief Anti-Money Laundering Officer (since 2014) Year of Birth: 1973 | | Senior Vice President and Chief Compliance Officer of the Manager (since March 2014); Chief Compliance Officer of the Sub- Adviser, OFI SteelPath, Inc., OFI Global Trust Company, OFI Global Institutional, Inc., Oppenheimer Real Asset Management, Inc., OFI Private Investments, Inc., Harborview Asset Management Corporation, Trinity Investment Management Corporation, and Shareholder Services, Inc. (since March 2014); Managing Director of Morgan Stanley Investment Management Inc. and certain of its various affiliated entities; Chief Compliance Officer of various Morgan Stanley Funds (May 2010-January 2014); Chief Compliance Officer of Morgan Stanley Investment Management Inc. (April 2007-January 2014). An officer of 101 Portfolios in the OppenheimerFunds complex. |
| |
Brian W. Wixted, Treasurer and Principal Financial & Accounting Officer (since 1999) Year of Birth: 1959 | | Senior Vice President of the Manager (since January 2013); Treasurer of the Sub-Adviser, HarbourView Asset Management Corporation, Shareholder Financial Services, Inc., Shareholder Services, Inc., and Oppenheimer Real Asset Management, Inc. (March 1999-June 2008), OFI Private Investments, Inc. (March 2000-June 2008), OppenheimerFunds International Ltd. and OppenheimerFunds plc (since May 2000), OFI Institutional Asset Management, Inc. (November 2000-June 2008), and OppenheimerFunds Legacy Program (charitable trust program established by the Sub-Adviser) (June 2003-December 2011); Treasurer and Chief Financial Officer of OFI Trust Company (since May 2000); Assistant Treasurer of Oppenheimer Acquisition Corporation (March 1999-June 2008). An officer of 101 Portfolios in the OppenheimerFunds complex. |
The Fund’s Statement of Additional Information contains additional information about the Fund’s Trustees and Officers and is available without charge, upon request, by calling 1.800.988.8287.
28 OPPENHEIMER DISCOVERY MID CAP GROWTH FUND/VA
THIS PAGE INTENTIONALLY LEFT BLANK.
29 OPPENHEIMER DISCOVERY MID CAP GROWTH FUND/VA
THIS PAGE INTENTIONALLY LEFT BLANK.
30 OPPENHEIMER DISCOVERY MID CAP GROWTH FUND/VA
THIS PAGE INTENTIONALLY LEFT BLANK.
31 OPPENHEIMER DISCOVERY MID CAP GROWTH FUND/VA
OPPENHEIMER DISCOVERY MID CAP GROWTH FUND/VA
A Series of Oppenheimer Variable Account Funds
| | |
Manager | | OFI Global Asset Management, Inc. |
| |
Sub-Adviser | | OppenheimerFunds, Inc. |
| |
Distributor | | OppenheimerFunds Distributor, Inc. |
| |
Transfer and | | OFI Global Asset Management, Inc. |
Shareholder | | |
Servicing Agent | | |
| |
Sub-Transfer Agent | | Shareholder Services, Inc. |
| | DBA OppenheimerFunds Services |
| |
Independent | | KPMGLLP |
Registered | | |
Public | | |
Accounting | | |
Firm | | |
| |
Counsel | | Ropes & Gray LLP |
| |
| | Before investing in any of the Oppenheimer funds, investors should carefully consider a fund’s investment objectives, risks, charges and expenses. Fund prospectuses and summary prospectuses contain this and other information about the funds, and may be obtained by asking your financial advisor, or calling us at 1.800.988.8287. Read prospectuses and summary prospectuses carefully before investing. |
| |
| | © 2016 OppenheimerFunds, Inc. All rights reserved. Oppenheimer funds are distributed by OppenheimerFunds Distributor, Inc. |
PORTFOLIO MANAGERS: Magnus Krantz and Krishna Memani
AVERAGE ANNUAL TOTAL RETURNS FOR THE PERIODS ENDED 12/31/15
| | | | | | | | | | | | | | | | |
| | |
| Inception
Date |
| | | 1-Year | | | | 5-Year | | | | 10-Year | |
Non-Service Shares | | | 2/9/87 | | | | 0.83 | % | | | 6.91 | % | | | 2.29 | % |
Service Shares | | | 5/1/02 | | | | 0.57 | | | | 6.64 | | | | 2.03 | |
Russell 3000 Index | | | | | | | 0.48 | | | | 12.18 | | | | 7.35 | |
Barclays U.S. Aggregate Bond Index | | | | | | | 0.55 | | | | 3.25 | | | | 4.51 | |
Reference Index | | | | | | | 0.85 | | | | 6.66 | | | | 6.11 | |
Performance data quoted represents past performance, which does not guarantee future results. The investment return and principal value of an investment in the Fund will fluctuate so that an investor’s shares, when redeemed, may be worth more or less than their original cost. Current performance may be lower or higher than the performance quoted. For performance data current to the most recent month end, call us at 1.800.988.8287. The Fund’s total returns should not be expected to be the same as the returns of other funds, whether or not both funds have the same portfolio managers and/or similar names. The Fund’s total returns include changes in share price and reinvested distributions but do not include the charges associated with the separate account products that offer this Fund. Such performance would have been lower if such charges were taken into account.
TOP HOLDINGS AND ALLOCATIONS
TOP TEN COMMON STOCK HOLDINGS
| | |
Alphabet, Inc., Cl. C | | 1.7% |
Apple, Inc. | | 1.4 |
Citigroup, Inc. | | 1.0 |
PG&E Corp. | | 0.8 |
Johnson & Johnson | | 0.8 |
Simon Property Group, Inc. | | 0.8 |
ACE Ltd. | | 0.7 |
Comcast Corp., Cl. A | | 0.7 |
Suncor Energy, Inc. | | 0.7 |
Chevron Corp. | | 0.7 |
Portfolio holdings and allocations are subject to change. Percentages are as of December 31, 2015, and are based on net assets. For more current Fund holdings, please visit oppenheimerfunds.com.
PORTFOLIO ALLOCATION
| | | | |
Common Stocks | | | 31.5% | |
Mortgage-Backed Obligations | | | | |
Government Agency | | | 20.9 | |
Non-Agency | | | 7.6 | |
Non-Convertible Corporate Bonds and Notes | | | 28.1 | |
Asset-Backed Securities | | | 9.5 | |
Investment Companies | | | | |
Oppenheimer Institutional Money Market Fund | | | 2.1 | |
U.S. Government Obligations | | | 0.3 | |
Portfolio holdings and allocations are subject to change. Percentages are as of December 31, 2015, and are based on the total market value of investments.
2 OPPENHEIMER CONSERVATIVE BALANCED FUND/VA
Fund Performance Discussion
The Fund’s Non-Service shares produced a return of 0.83% during the reporting period. On a relative basis, the Fund performed in line with its Reference Index, which returned 0.85%. The Fund’s Reference Index is a customized weighted index currently comprised of the following underlying broad-based security indices: 65% of the Barclays U.S. Aggregate Bond Index and 35% of the Russell 3000 Index. Measured separately, the Barclays U.S. Aggregate Bond Index returned 0.55% and the Russell 3000 Index returned 0.48%.
MARKET OVERVIEW
2015 will go down as a year in which volatility returned to the financial markets following a multi-year hiatus. Global growth struggled to gain traction as many of the world’s largest economies expanded below their long-term trends. China’s industrial production slowed for the fifth consecutive year and weighed on the world’s exporters—especially commodity producers. In the United States, a strong dollar impaired the competitiveness of many American companies and proved to be a drag on corporate earnings.
The environment led to a turbulent environment for various asset classes, particularly over the second half of 2015. The prospect of more sluggish demand for energy and construction materials from China and other emerging markets sent equity and commodity prices broadly lower. The Federal Reserve finally hiked interest rates 0.25% in December, which followed a somewhat underwhelming easing program by the European Central Bank (ECB) earlier in the month.
Global investors became increasingly risk-averse, engaging in a “flight to quality” that punished riskier assets and favored some traditional safe havens, such as U.S. government securities.
EQUITY STRATEGY REVIEW
The equity strategy produced positive absolute performance during the reporting period, and outperformed the Russell 3000 Index. The equity strategy’s outperformance stemmed largely from stronger relative stock selection in the financials, energy and health care sectors. The equity strategy underperformed the Russell 3000 Index in the consumer discretionary and industrials sectors, due to less favorable stock selection.
The equity strategy’s top contributors to performance included Alphabet, Inc., Mondelez International, Inc. and Salix Pharmaceuticals, Ltd. Alphabet is the new holding company vehicle for what was previously known as Google. Alphabet’s stock outperformed as quarterly results showed evidence of improved cost control and the company announced plans to enhance financial disclosures to investors, thereby providing greater transparency into the drivers of value creation. With the recent arrival of a new CFO, investors have gained conviction in greater cost controls and more effective capital allocation—both of which should lead to rising profitability. In addition, the company announced a stock buyback over the fourth quarter of 2015. While small in magnitude, this move reinforced the view that management is committed to driving shareholder value rather than growth at any cost. Mondelez manufactures and sells global consumer products—primarily in the snack food and confection categories, including brand names such as Oreos, Cadbury and Trident. Operating margins continued to expand, surprising investors favorably and leading to the stock’s positive performance. The stock of Salix Pharmaceuticals, a developer of drugs aimed at treating gastrointestinal diseases, rallied early in the year as Valeant acquired Salix for $173 per share in cash.
Detractors from performance included Western Digital Corp., PVH Corp. and Xerox Corp. Western Digital manufactures computer disk drives and other data storage solutions. The stock continues to be negatively impacted by near-term fundamentals which remain weak, particularly demand for personal computers. Further, the stock reacted unfavorably when management announced the acquisition of SanDisk at a substantial price premium. PVH designs, sources and markets brands in various clothing and fashion accessories. PVH’s Calvin Klein brand finally began showing signs of a turnaround two years after its acquisition and much reinvestment just as core Tommy Hilfiger began to decelerate. Also, PVH’s guidance for currency pressure in 2016 was much greater than expected. Xerox provides business process and information technology outsourcing, and document management services. Over the first half of the period, weak quarterly guidance triggered a major selloff in the stock as poor execution led to further downward revisions of earnings estimates. We exited our position in the common stock of PVH and Xerox during the period.
FIXED-INCOME STRATEGY REVIEW
During the reporting period, the fixed-income strategy received its strongest results from its investments in corporate bonds and mortgage-backed securities (“MBS”). The strategy had exposure to both investment grade and below investment grade corporate bonds during the reporting period. Both produced positive results. Among MBS, the fixed-income strategy had its largest exposure to government agency MBS, with a smaller allocation to non-agency MBS. Security selection within the agency MBS sector and an allocation to non-agency MBS contributed positively to performance during this reporting period. The primary
3 OPPENHEIMER CONSERVATIVE BALANCED FUND/VA
detractor from performance versus the Barclays U.S. Aggregate Bond Index this reporting period was the fixed-income strategy’s underweight to U.S. Treasuries, which performed well as investors sought out safety.
Investors should consider the Fund’s investment objective, risks, charges and expenses carefully before investing. The Fund’s prospectus and summary prospectus contain this and other information about the Fund, and may be obtained by asking your financial advisor or calling us at 1.800.988.8287. Read prospectuses and summary prospectuses carefully before investing.
Total returns include changes in share price and reinvestment of dividends and capital gains distributions in a hypothetical investment for the periods shown.
The Fund’s investment strategy and focus can change over time. The mention of specific fund holdings does not constitute a recommendation by OppenheimerFunds, Inc. or its affiliates.
Shares of Oppenheimer funds are not deposits or obligations of any bank, are not guaranteed by any bank, are not insured by the FDIC or any other agency, and involve investment risks, including the possible loss of the principal amount invested.
Comparing the Fund’s Performance to the Market. The graphs that follow show the performance of a hypothetical $10,000 investment in each share class of the Fund held until December 31, 2015. Performance is measured over a ten-fiscal-year period for both Classes. Performance information does not reflect charges that apply to separate accounts investing in the Fund. If these charges were taken into account, performance would be lower. The graphs assume that all dividends and capital gains distributions were reinvested in additional shares.
The Fund’s performance is compared to the performance of the Russell 3000 Index, the Barclays U.S. Aggregate Bond Index and the Fund’s Reference Index. The Russell 3000 Index measures the performance of the largest 3,000 U.S. companies, representing approximately 98% of the investable U.S. equity market. The Barclays U.S. Aggregate Bond Index is an index of U.S dollar-denominated, investment-grade U.S. corporate government and mortgage-backed securities. The Fund’s Reference Index is a customized weighted index currently comprised of 65% of the Barclays U.S. Aggregate Bond Index and 35% of the Russell 3000 Index. The Indices are unmanaged and cannot be purchased directly by investors. Index performance is shown for illustrative purposes only and does not predict or depict the performance of the Fund. While index comparisons may be useful to provide a benchmark for the Fund’s performance, it must be noted that the Fund’s investments are not limited to the investments comprising the indices. Index performance includes reinvestment of income, but does not reflect transaction costs, fees, expenses or taxes. Index performance is shown for illustrative purposes only as a benchmark for the Fund’s performance, and does not predict or depict.
4 OPPENHEIMER CONSERVATIVE BALANCED FUND/VA

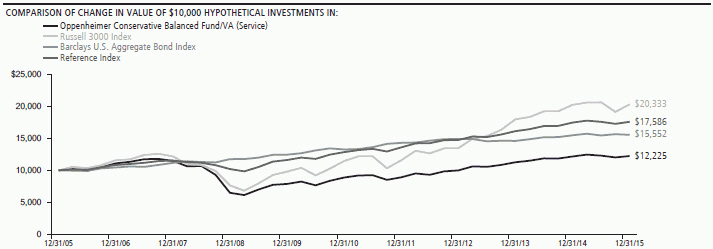
Performance data quoted represents past performance, which does not guarantee future results. The investment return and principal value of an investment in the Fund will fluctuate so that an investor’s shares, when redeemed, may be worth more or less than their original cost. Current performance may be lower or higher than the performance quoted. For performance data current to the most recent month end, call us at 1.800.988.8287. The Fund’s total returns should not be expected to be the same as the returns of other funds, whether or not both funds have the same portfolio managers and/or similar names. The Fund's total returns include changes in share price and reinvested distributions but do not include the charges associated with the separate account products that offer this Fund. Such performance would have been lower if such charges were taken into account.
5 OPPENHEIMER CONSERVATIVE BALANCED FUND/VA
Fund Expenses
Fund Expenses. As a shareholder of the Fund, you incur two types of costs: (1) transaction costs and (2) ongoing costs, including management fees; distribution and service fees; and other Fund expenses. These examples are intended to help you understand your ongoing costs (in dollars) of investing in the Fund and to compare these costs with the ongoing costs of investing in other mutual funds.
The examples are based on an investment of $1,000.00 invested at the beginning of the period and held for the entire 6-month period ended December 31, 2015.
Actual Expenses. The first section of the table provides information about actual account values and actual expenses. You may use the information in this section for the class of shares you hold, together with the amount you invested, to estimate the expense that you paid over the period. Simply divide your account value by $1,000.00 (for example, an $8,600.00 account value divided by $1,000.00 = 8.60), then multiply the result by the number in the first section under the heading entitled “Expenses Paid During 6 Months Ended December 31, 2015” to estimate the expenses you paid on your account during this period.
Hypothetical Example for Comparison Purposes.
The second section of the table provides information about hypothetical account values and hypothetical expenses based on the Fund’s actual expense ratio for each class of shares, and an assumed rate of return of 5% per year for each class before expenses, which is not the actual return. The hypothetical account values and expenses may not be used to estimate the actual ending account balance or expenses you paid for the period. You may use this information to compare the ongoing costs of investing in the Fund and other funds. To do so, compare this 5% hypothetical example for the class of shares you hold with the 5% hypothetical examples that appear in the shareholder reports of the other funds.
Please note that the expenses shown in the table are meant to highlight your ongoing fund costs only and do not reflect any charges associated with the separate accounts that offer this Fund. Therefore, the “hypothetical” lines of the table are useful in comparing ongoing fund costs only, and will not help you determine the relative total costs of owning different funds. In addition, if these separate account charges were included your costs would have been higher.
| | | | | | | | | | | | |
| Actual | | Beginning Account Value July 1, 2015 | | | Ending
Account Value
December 31, 2015 | | | Expenses
Paid During
6 Months Ended
December 31, 2015 | |
Non-Service shares | | $ | 1,000.00 | | | $ | 995.20 | | | $ | 3.38 | |
Service shares | | | 1,000.00 | | | | 994.40 | | | | 4.64 | |
| | | |
Hypothetical (5% return before expenses) | | | | | | | | | |
Non-Service shares | | | 1,000.00 | | | | 1,021.83 | | | | 3.42 | |
Service shares | | | 1,000.00 | | | | 1,020.57 | | | | 4.70 | |
Expenses are equal to the Fund’s annualized expense ratio for that class, multiplied by the average account value over the period, multiplied by 184/365 (to reflect the one-half year period). Those annualized expense ratios, excluding indirect expenses from affiliated funds, based on the 6-month period ended December 31, 2015 are as follows:
| | | | | | |
| Class | | Expense Ratios | | | |
Non-Service shares | | | 0.67% | | | |
Service shares | | | 0.92 | | | |
The expense ratios reflect voluntary and/or contractual waivers and/or reimbursements of expenses by the Fund’s Manager. Some of these undertakings may be modified or terminated at any time, as indicated in the Fund’s prospectus. The “Financial Highlights” tables in the Fund’s financial statements, included in this report, also show the gross expense ratios, without such waivers or reimbursements and reduction to custodian expenses, if applicable.
6 OPPENHEIMER CONSERVATIVE BALANCED FUND/VA
STATEMENT OF INVESTMENTS December 31, 2015
| | | | | | | | |
| | | Shares | | | Value | |
| |
Common Stocks—33.7% | | | | | | | | |
| |
| Consumer Discretionary—3.8% | | | | | | | | |
| |
| Auto Components—0.3% | | | | | | | | |
| |
| Delphi Automotive plc | | | 8,500 | | | $ | 728,705 | |
|
| |
| Automobiles—0.4% | | | | | | | | |
| |
| General Motors Co. | | | 25,160 | | | | 855,692 | |
|
| |
| Hotels, Restaurants & Leisure—0.3% | | | | | | | | |
| |
| International Speedway Corp., Cl. A | | | 7,580 | | | | 255,598 | |
| |
| Popeyes Louisiana Kitchen, Inc.1 | | | 7,300 | | | | 427,050 | |
| | | | | | | | |
| | | | | | | 682,648 | |
|
| |
| Household Durables—0.3% | | | | | | | | |
| |
| Toll Brothers, Inc.1 | | | 18,370 | | | | 611,721 | |
|
| |
| Internet & Catalog Retail—0.4% | | | | | | | | |
| |
| Amazon.com, Inc.1 | | | 1,580 | | | | 1,067,906 | |
|
| |
| Media—0.9% | | | | | | | | |
| |
| Comcast Corp., Cl. A | | | 28,520 | | | | 1,609,383 | |
| |
| Twenty-First Century Fox, Inc., Cl. A | | | 17,950 | | | | 487,522 | |
| | | | | | | | |
| | | | | | | 2,096,905 | |
|
| |
| Specialty Retail—1.2% | | | | | | | | |
| |
| AutoZone, Inc.1 | | | 1,720 | | | | 1,276,085 | |
| |
| Ross Stores, Inc. | | | 20,770 | | | | 1,117,633 | |
| |
| Sally Beauty Holdings, Inc.1 | | | 17,730 | | | | 494,490 | |
| | | | | | | | |
| | | | | | | 2,888,208 | |
|
| |
| Consumer Staples—3.0% | | | | | | | | |
| |
| Beverages—0.9% | | | | | | | | |
| |
| Molson Coors Brewing Co., Cl. B | | | 8,050 | | | | 756,056 | |
| |
| PepsiCo, Inc. | | | 14,000 | | | | 1,398,880 | |
| | | | | | | | |
| | | | | | | 2,154,936 | |
|
| |
| Food Products—1.2% | | | | | | | | |
| |
| Flowers Foods, Inc. | | | 37,435 | | | | 804,478 | |
| |
| Kraft Heinz Co. (The) | | | 11,650 | | | | 847,654 | |
| |
| Mondelez International, Inc., Cl. A | | | 24,190 | | | | 1,084,680 | |
| | | | | | | | |
| | | | | | | 2,736,812 | |
|
| |
| Tobacco—0.9% | | | | | | | | |
| |
| Philip Morris International, Inc. | | | 14,110 | | | | 1,240,410 | |
| |
| Reynolds American, Inc. | | | 18,300 | | | | 844,545 | |
| | | | | | | | |
| | | | | | | 2,084,955 | |
|
| |
| Energy—2.2% | | | | | | | | |
| |
| Oil, Gas & Consumable Fuels—2.2% | | | | | | | | |
| |
| Chevron Corp. | | | 17,036 | | | | 1,532,559 | |
| |
| HollyFrontier Corp. | | | 10,869 | | | | 433,564 | |
| |
| Noble Energy, Inc. | | | 32,009 | | | | 1,054,056 | |
| |
| Suncor Energy, Inc. | | | 62,370 | | | | 1,609,146 | |
| |
| Western Refining, Inc. | | | 12,345 | | | | 439,729 | |
| | | | | | | | |
| | | | | | | 5,069,054 | |
|
| |
| Financials—6.5% | | | | | | | | |
| |
| Commercial Banks—2.5% | | | | | | | | |
| |
| BancorpSouth, Inc. | | | 26,840 | | | | 643,892 | |
| |
| Citigroup, Inc. | | | 44,550 | | | | 2,305,462 | |
| |
| FirstMerit Corp. | | | 39,650 | | | | 739,472 | |
| |
| JPMorgan Chase & Co. | | | 20,470 | | | | 1,351,634 | |
| |
| Webster Financial Corp. | | | 18,840 | | | | 700,660 | |
| | | | | | | | |
| | | | | | | 5,741,120 | |
|
| |
| Consumer Finance—0.4% | | | | | | | | |
| |
| Synchrony Financial1 | | | 34,190 | | | | 1,039,718 | |
|
| |
| Insurance—1.3% | | | | | | | | |
| |
| ACE Ltd. | | | 14,650 | | | | 1,711,853 | |
| |
| FNF Group | | | 39,060 | | | | 1,354,210 | |
| | | | | | | | |
| | | | | | | 3,066,063 | |
| | | | | | | | |
| | | Shares | | | Value | |
| |
| Real Estate Investment Trusts (REITs)—1.8% | |
| |
| Apollo Commercial Real Estate Finance, Inc. | | | 39,320 | | | $ | 677,484 | |
| |
| Digital Realty Trust, Inc. | | | 14,200 | | | | 1,073,804 | |
| |
| Lamar Advertising Co., Cl. A | | | 10,430 | | | | 625,591 | |
| |
| Simon Property Group, Inc. | | | 9,510 | | | | 1,849,124 | |
| | | | | | | | |
| | | | | | | 4,226,003 | |
|
| |
| Thrifts & Mortgage Finance—0.5% | |
| |
| New York Community Bancorp, Inc. | | | 66,030 | | | | 1,077,610 | |
|
| |
| Health Care—5.0% | | | | | | | | |
| |
| Biotechnology—0.7% | | | | | | | | |
| |
| BioMarin Pharmaceutical, Inc.1 | | | 4,700 | | | | 492,372 | |
| |
| Gilead Sciences, Inc. | | | 10,970 | | | | 1,110,054 | |
| | | | | | | | |
| | | | | | | 1,602,426 | |
|
| |
| Health Care Equipment & Supplies—0.6% | |
| |
| DexCom, Inc.1 | | | 4,960 | | | | 406,224 | |
| |
| Medtronic plc | | | 13,189 | | | | 1,014,498 | |
| | | | | | | | |
| | | | | | | 1,420,722 | |
|
| |
| Health Care Providers & Services—1.9% | |
| |
| Centene Corp.1 | | | 12,250 | | | | 806,172 | |
| |
| Diplomat Pharmacy, Inc.1 | | | 15,000 | | | | 513,300 | |
| |
| Express Scripts Holding Co.1 | | | 7,540 | | | | 659,071 | |
| |
| McKesson Corp. | | | 5,260 | | | | 1,037,430 | |
| |
| Universal Health Services, Inc., Cl. B | | | 8,970 | | | | 1,071,825 | |
| |
| WellCare Health Plans, Inc.1 | | | 5,260 | | | | 411,385 | |
| | | | | | | | |
| | | | | | | 4,499,183 | |
|
| |
| Life Sciences Tools & Services—0.2% | |
| |
| Agilent Technologies, Inc. | | | 10,480 | | | | 438,169 | |
|
| |
| Pharmaceuticals—1.6% | | | | | | | | |
| |
| Bristol-Myers Squibb Co. | | | 8,380 | | | | 576,460 | |
| |
| Johnson & Johnson | | | 18,410 | | | | 1,891,075 | |
| |
| Mylan NV1 | | | 10,090 | | | | 545,567 | |
| |
| Prestige Brands Holdings, Inc.1 | | | 15,890 | | | | 818,017 | |
| | | | | | | | |
| | | | | | | 3,831,119 | |
|
| |
| Industrials—3.5% | | | | | | | | |
| |
| Aerospace & Defense—0.3% | | | | | | | | |
| |
| L-3 Communications Holdings, Inc. | | | 6,600 | | | | 788,766 | |
|
| |
| Airlines—0.2% | | | | | | | | |
| |
| Spirit Airlines, Inc.1 | | | 10,510 | | | | 418,824 | |
|
| |
| Building Products—0.2% | | | | | | | | |
| |
| Masonite International Corp.1 | | | 6,530 | | | | 399,832 | |
|
| |
| Commercial Services & Supplies—0.9% | |
| |
| KAR Auction Services, Inc. | | | 16,450 | | | | 609,143 | |
| |
| Tyco International plc | | | 24,730 | | | | 788,640 | |
| |
| Waste Connections, Inc. | | | 13,230 | | | | 745,114 | |
| | | | | | | | |
| | | | | | | 2,142,897 | |
|
| |
| Construction & Engineering—0.2% | | | | | | | | |
| |
| AECOM1 | | | 15,920 | | | | 478,078 | |
|
| |
| Industrial Conglomerates—0.6% | | | | | | | | |
| |
| General Electric Co. | | | 44,730 | | | | 1,393,339 | |
|
| |
| Machinery—0.3% | | | | | | | | |
| |
| Xylem, Inc. | | | 18,990 | | | | 693,135 | |
|
| |
| Professional Services—0.5% | | | | | | | | |
| |
| Nielsen Holdings plc | | | 8,240 | | | | 383,984 | |
| |
| Robert Half International, Inc. | | | 15,630 | | | | 736,798 | |
| | | | | | | | |
| | | | | | | 1,120,782 | |
|
| |
| Road & Rail—0.3% | | | | | | | | |
| |
| CSX Corp. | | | 32,490 | | | | 843,115 | |
7 OPPENHEIMER CONSERVATIVE BALANCED FUND/VA
STATEMENT OF INVESTMENTS Continued
| | | | | | | | |
| | | Shares | | | Value | |
| |
Information Technology—6.9% | | | | | |
| |
| Electronic Equipment, Instruments, & Components—0.4% | |
| |
| SYNNEX Corp. | | | 9,100 | | | $ | 818,363 | |
|
| |
| Internet Software & Services—2.1% | |
| |
| Alphabet, Inc., Cl. C1 | | | 5,390 | | | | 4,090,363 | |
| |
| j2 Global, Inc. | | | 10,120 | | | | 833,079 | |
| | | | | | | | |
| | | | | | | 4,923,442 | |
|
| |
| IT Services—1.2% | |
| |
| Amdocs Ltd. | | | 14,450 | | | | 788,536 | |
| |
| MasterCard, Inc., Cl. A | | | 5,900 | | | | 574,424 | |
| |
| PayPal Holdings, Inc.1 | | | 38,140 | | | | 1,380,668 | |
| | | | | | | | |
| | | | | | | 2,743,628 | |
|
| |
| Semiconductors & Semiconductor Equipment—0.6% | |
| |
| Applied Materials, Inc. | | | 41,540 | | | | 775,552 | |
| |
| Skyworks Solutions, Inc. | | | 9,550 | | | | 733,726 | |
| | | | | | | | |
| | | | | | | 1,509,278 | |
|
| |
| Software—0.9% | | | | | |
| |
| Fortinet, Inc.1 | | | 13,140 | | | | 409,574 | |
| |
| Guidewire Software, Inc.1 | | | 8,660 | | | | 520,986 | |
| |
| Imperva, Inc.1 | | | 5,490 | | | | 347,572 | |
| |
| ServiceNow, Inc.1 | | | 5,750 | | | | 497,720 | |
| |
| Splunk, Inc.1 | | | 7,440 | | | | 437,546 | |
| | | | | | | | |
| | | | | | | 2,213,398 | |
|
| |
| Technology Hardware, Storage & Peripherals—1.7% | |
| |
| Apple, Inc. | | | 31,630 | | | | 3,329,374 | |
| |
| Western Digital Corp. | | | 10,600 | | | | 636,530 | |
| | | | | | | | |
| | | | | | | 3,965,904 | |
|
| |
| Materials—1.0% | | | | | |
| |
| Chemicals—0.2% | | | | | |
| |
| Eastman Chemical Co. | | | 8,480 | | | | 572,485 | |
|
| |
| Construction Materials—0.4% | | | | | |
| |
| Vulcan Materials Co. | | | 9,180 | | | | 871,825 | |
|
| |
| Metals & Mining—0.4% | | | | | |
| |
| Alcoa, Inc. | | | 45,380 | | | | 447,900 | |
| |
| Franco-Nevada Corp. | | | 10,160 | | | | 464,820 | |
| | | | | | | | |
| | | | | | | 912,720 | |
|
| |
| Telecommunication Services—0.6% | | | | | |
| |
| Diversified Telecommunication Services—0.6% | |
| |
| ORBCOMM, Inc.1 | | | 375 | | | | 2,715 | |
| |
| Verizon Communications, Inc. | | | 29,230 | | | | 1,351,011 | |
| | | | | | | | |
| | | | | | | 1,353,726 | |
|
| |
| Utilities—1.2% | | | | | |
| |
| Multi-Utilities—1.2% | | | | | |
| |
| Consolidated Edison, Inc. | | | 15,580 | | | | 1,001,327 | |
| |
| PG&E Corp. | | | 35,770 | | | | 1,902,606 | |
| | | | | | | | |
| | | | | | | 2,903,933 | |
| | | | | | | | |
| Total Common Stocks (Cost $69,580,332) | | | | 78,987,145 | |
| | |
| | | Principal
Amount | | | | |
| |
Asset-Backed Securities—10.1% | | | | | |
| |
| Auto Loan—9.5% | | | | | |
| |
| American Credit Acceptance Receivables Trust: | | | | | |
| Series 2013-2,Cl. B, 2.84%, 5/15/192 | | $ | 176,465 | | | | 176,749 | |
| Series 2014-1,Cl. B, 2.39%, 11/12/192 | | | 494,191 | | | | 494,863 | |
| Series 2014-2,Cl. B, 2.26%, 3/10/202 | | | 153,587 | | | | 153,637 | |
| Series 2014-3,Cl. B, 2.43%, 6/10/202 | | | 595,000 | | | | 591,351 | |
| Series 2014-4,Cl. B, 2.60%, 10/12/202 | | | 175,000 | | | | 173,171 | |
| Series 2015-1,Cl. B, 2.85%, 2/12/212 | | | 445,000 | | | | 438,362 | |
| Series 2015-3,Cl. B, 3.56%, 10/12/213 | | | 360,000 | | | | 357,615 | |
| |
| AmeriCredit Automobile Receivables Trust: | | | | | |
| Series 2012-2,Cl. E, 4.85%, 8/8/192 | | | 380,000 | | | | 385,527 | |
| Series 2012-4,Cl. D, 2.68%, 10/9/18 | | | 115,000 | | | | 115,902 | |
| | | | | | | | |
| | | Principal
Amount | | | Value | |
| |
| Auto Loan (Continued) | |
| |
| AmeriCredit Automobile Receivables Trust: (Continued) | |
| Series 2013-2,Cl. E, 3.41%, 10/8/202 | | | $ 415,000 | | | | $ 418,277 | |
| Series 2013-3,Cl. E, 3.74%, 12/8/202 | | | 165,000 | | | | 165,019 | |
| Series 2013-4,Cl. D, 3.31%, 10/8/19 | | | 677,000 | | | | 688,359 | |
| Series 2014-1,Cl. D, 2.54%, 6/8/20 | | | 480,000 | | | | 479,519 | |
| Series 2014-1,Cl. E, 3.58%, 8/9/21 | | | 355,000 | | | | 353,483 | |
| Series 2014-2,Cl. D, 2.57%, 7/8/20 | | | 280,000 | | | | 277,359 | |
| Series 2014-2,Cl. E, 3.37%, 11/8/21 | | | 440,000 | | | | 433,642 | |
| Series 2014-3,Cl. D, 3.13%, 10/8/20 | | | 230,000 | | | | 229,995 | |
| Series 2014-4,Cl. D, 3.07%, 11/9/20 | | | 275,000 | | | | 273,944 | |
| Series 2015-2,Cl. C, 2.40%, 1/8/21 | | | 120,000 | | | | 118,547 | |
| Series 2015-2,Cl. D, 3.00%, 6/8/21 | | | 80,000 | | | | 79,019 | |
| Series 2015-3,Cl. D, 3.34%, 8/8/21 | | | 210,000 | | | | 208,018 | |
| |
| California Republic Auto Receivables Trust: | | | | | |
| Series 2014-2,Cl. C, 3.29%, 3/15/21 | | | 95,000 | | | | 93,945 | |
| Series 2014-4,Cl. C, 3.56%, 9/15/21 | | | 125,000 | | | | 123,608 | |
| |
| Capital Auto Receivables Asset Trust: | | | | | |
| Series 2013-1,Cl. D, 2.19%, 9/20/21 | | | 125,000 | | | | 124,674 | |
| Series 2014-1,Cl. D, 3.39%, 7/22/19 | | | 140,000 | | | | 142,251 | |
| Series 2014-3,Cl. D, 3.14%, 2/20/20 | | | 195,000 | | | | 194,324 | |
| Series 2015-1,Cl. D, 3.16%, 8/20/20 | | | 195,000 | | | | 192,640 | |
| Series 2015-2,Cl. C, 2.67%, 8/20/20 | | | 180,000 | | | | 178,289 | |
| Series 2015-4,Cl. D, 3.62%, 5/20/21 | | | 295,000 | | | | 291,288 | |
| |
| CarFinance Capital Auto Trust: | | | | | |
| Series 2013-2A,Cl. B, 3.15%, 8/15/192 | | | 685,000 | | | | 688,599 | |
| Series 2014-1A,Cl. A, 1.46%, 12/17/182 | | | 45,384 | | | | 45,320 | |
| Series 2015-1A,Cl. A, 1.75%, 6/15/212 | | | 187,573 | | | | 186,464 | |
| |
| CarMax Auto Owner Trust: | | | | | |
| Series 2015-2,Cl. D, 3.04%, 11/15/21 | | | 115,000 | | | | 114,134 | |
| Series 2015-3,Cl. D, 3.27%, 3/15/22 | | | 210,000 | | | | 209,520 | |
| |
| CPS Auto Receivables Trust: | | | | | | | | |
| Series 2012-B,Cl. A, 2.52%, 9/16/192 | | | 67,553 | | | | 67,620 | |
| Series 2014-A,Cl. A, 1.21%, 8/15/182 | | | 195,931 | | | | 195,353 | |
| Series 2014-C,Cl. A, 1.31%, 2/15/192 | | | 193,512 | | | | 192,115 | |
| |
| CPS Auto Trust, Series 2012-C, Cl. A, 1.82%, 12/16/192 | | | 25,178 | | | | 25,078 | |
| |
| Credit Acceptance Auto Loan Trust: | | | | | |
| Series 2013-1A,Cl. B, 1.83%, 4/15/212 | | | 165,000 | | | | 164,954 | |
| Series 2014-1A,Cl. B, 2.29%, 4/15/222 | | | 270,000 | | | | 269,103 | |
| Series 2014-2A,Cl. B, 2.67%, 9/15/222 | | | 195,000 | | | | 194,971 | |
| Series 2015-1A,Cl. C, 3.30%, 7/17/232 | | | 265,000 | | | | 261,825 | |
| Series 2015-2A,Cl. B, 3.04%, 8/15/232 | | | 385,000 | | | | 383,468 | |
| |
| Drive Auto Receivables Trust: | | | | | |
| Series 2015-AA,Cl. C, 3.06%, 5/17/212 | | | 285,000 | | | | 285,493 | |
| Series 2015-BA,Cl. C, 2.76%, 7/15/212 | | | 345,000 | | | | 342,812 | |
| Series 2015-DA,Cl. C, 3.38%, 11/15/212 | | | 285,000 | | | | 283,863 | |
| |
| DT Auto Owner Trust: | | | | | |
| Series 2013-1A,Cl. D, 3.74%, 5/15/202 | | | 200,000 | | | | 200,821 | |
| Series 2013-2A,Cl. D, 4.18%, 6/15/202 | | | 545,000 | | | | 548,520 | |
| Series 2014-1A,Cl. D, 3.98%, 1/15/212 | | | 435,000 | | | | 434,875 | |
| Series 2014-2A,Cl. D, 3.68%, 4/15/212 | | | 615,000 | | | | 612,696 | |
| Series 2014-3A,Cl. D, 4.47%, 11/15/212 | | | 245,000 | | | | 245,282 | |
| Series 2015-1A,Cl. C, 2.87%, 11/16/202 | | | 205,000 | | | | 204,248 | |
| |
| Exeter Automobile Receivables Trust: | | | | | |
| Series 2014-1A,Cl. B, 2.42%, 1/15/192 | | | 280,000 | | | | 280,014 | |
| Series 2014-1A,Cl. C, 3.57%, 7/15/192 | | | 280,000 | | | | 280,283 | |
| Series 2014-2A,Cl. A, 1.06%, 8/15/182 | | | 30,816 | | | | 30,734 | |
| Series 2014-2A,Cl. C, 3.26%, 12/16/192 | | | 135,000 | | | | 133,027 | |
| |
| First Investors Auto Owner Trust: | | | | | |
| Series 2012-1A,Cl. D, 5.65%, 4/15/182 | | | 140,000 | | | | 140,178 | |
| Series 2013-3A,Cl. B, 2.32%, 10/15/192 | | | 465,000 | | | | 466,146 | |
| Series 2013-3A,Cl. C, 2.91%, 1/15/202 | | | 200,000 | | | | 200,451 | |
| Series 2013-3A,Cl. D, 3.67%, 5/15/202 | | | 165,000 | | | | 165,237 | |
| Series 2014-1A,Cl. D, 3.28%, 4/15/212 | | | 270,000 | | | | 267,270 | |
| Series 2014-3A,Cl. D, 3.85%, 2/15/222 | | | 175,000 | | | | 175,175 | |
| |
| Flagship Credit Auto Trust: | | | | | | | | |
| Series 2014-1,Cl. A, 1.21%, 4/15/192 | | | 90,263 | | | | 89,846 | |
| Series 2014-2,Cl. A, 1.43%, 12/16/192 | | | 202,557 | | | | 201,305 | |
| |
| GM Financial Automobile Leasing Trust, Series | |
| 2015-1, Cl. D, 3.01%, 3/20/20 | | | 280,000 | | | | 277,135 | |
8 OPPENHEIMER CONSERVATIVE BALANCED FUND/VA
| | | | | | | | |
| | | Principal
Amount | | | Value | |
| |
| Auto Loan (Continued) | | | | | | | | |
| |
| GO Financial Auto Securitization Trust, Series | | | | | |
| 2015-1, Cl. A, 1.81%, 3/15/182 | | | $ 127,818 | | | | $ 127,638 | |
| |
| Navistar Financial Dealer Note Master Trust, Series | | | | | | | | |
| 2014-1, Cl. D, 2.722%, 10/25/192,4 | | | 145,000 | | | | 144,173 | |
| |
| Santander Drive Auto Receivables Trust: | | | | | |
| Series 2013-3,Cl. D, 2.42%, 4/15/19 | | | 105,000 | | | | 104,790 | |
| Series 2013-4,Cl. D, 3.92%, 1/15/20 | | | 475,000 | | | | 486,088 | |
| Series 2013-5,Cl. D, 2.73%, 10/15/19 | | | 140,000 | | | | 140,506 | |
| Series 2013-A,Cl. E, 4.71%, 1/15/212 | | | 325,000 | | | | 332,501 | |
| Series 2014-1,Cl. D, 2.91%, 4/15/20 | | | 265,000 | | | | 266,354 | |
| Series 2014-2,Cl. D, 2.76%, 2/18/20 | | | 200,000 | | | | 199,220 | |
| Series 2014-4,Cl. D, 3.10%, 11/16/20 | | | 225,000 | | | | 225,130 | |
| Series 2014-5,Cl. D, 3.21%, 1/15/21 | | | 380,000 | | | | 381,068 | |
| Series 2015-1,Cl. D, 3.24%, 4/15/21 | | | 300,000 | | | | 299,702 | |
| Series 2015-2,Cl. C, 2.44%, 4/15/21 | | | 265,000 | | | | 262,302 | |
| Series 2015-2,Cl. D, 3.02%, 4/15/21 | | | 320,000 | | | | 315,164 | |
| Series 2015-4,Cl. D, 3.53%, 8/16/21 | | | 315,000 | | | | 312,504 | |
| Series 2015-5,Cl. C, 2.74%, 12/15/21 | | | 225,000 | | | | 223,330 | |
| |
| SNAAC Auto Receivables Trust: | | | | | |
| Series 2013-1A,Cl. C, 3.07%, 8/15/182 | | | 89,368 | | | | 89,744 | |
| Series 2014-1A,Cl. A, 1.03%, 9/17/182 | | | 26,820 | | | | 26,809 | |
| Series 2014-1A,Cl. D, 2.88%, 1/15/202 | | | 165,000 | | | | 165,219 | |
| |
| TCF Auto Receivables Owner Trust: | | | | | |
| Series 2014-1A,Cl. C, 3.12%, 4/15/212 | | | 115,000 | | | | 114,308 | |
| Series 2015-1A,Cl. D, 3.53%, 3/15/222 | | | 190,000 | | | | 187,701 | |
| |
| United Auto Credit Securitization Trust, Series | | | | | |
| 2015-1, Cl. D, 2.92%, 6/17/192 | | | 260,000 | | | | 258,150 | |
| |
| Westlake Automobile Receivables Trust: | | | | | |
| Series 2014-1A,Cl. D, 2.20%, 2/15/212 | | | 180,000 | | | | 178,026 | |
| Series 2014-2A,Cl. D, 2.86%, 7/15/212 | | | 195,000 | | | | 191,883 | |
| Series 2015-1A,Cl. C, 2.29%, 11/16/202 | | | 205,000 | | | | 203,198 | |
| Series 2015-2A,Cl. C, 2.45%, 1/15/212 | | | 250,000 | | | | 246,933 | |
| | | | | | | | |
| | | | | | | 22,299,753 | |
|
| |
| Equipment—0.3% | | | | | | | | |
| |
| CLI Funding V LLC, Series 2014-2A, Cl. A, 3.38%, 10/18/292 | | | 278,184 | | | | 270,020 | |
| |
| Cronos Containers Program I Ltd., Series 2014-2A, Cl. A, 3.27%, 11/18/292 | | | 233,102 | | | | 227,668 | |
| |
| FRS I LLC, Series 2013-1A, Cl. A1, 1.80%, 4/15/432 | | | 44,055 | | | | 43,217 | |
| |
| Trip Rail Master Funding LLC, Series 2014-1A, Cl. A1, 2.863%, 4/15/442 | | | 136,534 | | | | 136,728 | |
| | | | | | | | |
| | | | | | | 677,633 | |
|
| |
| Home Equity Loan—0.2% | | | | | | | | |
| |
| American Credit Acceptance Receivables Trust, | | | | | | | | |
| Series 2015-2, Cl. B, 2.97%, 5/12/212 | | | 425,000 | | | | 418,047 | |
|
| |
| Loans: Other—0.1% | | | | | | | | |
| |
| Element Rail Leasing I LLC, Series 2014-1A, Cl. A1, 2.299%, 4/19/442 | | | 309,234 | | | | 304,525 | |
| | | | | | | | |
Total Asset-Backed Securities (Cost $23,817,568) | | | | 23,699,958 | |
| |
Mortgage-Backed Obligations—30.5% | |
| |
Government Agency—22.4% | |
| |
| FHLMC/FNMA/FHLB/Sponsored—11.8% | |
| |
Federal Home Loan Mortgage Corp. Gold Pool: | |
| 4.50%, 10/1/18 | | | 28,094 | | | | 29,018 | |
| 5.00%, 12/1/34 | | | 3,432 | | | | 3,805 | |
| 5.50%, 9/1/39 | | | 472,828 | | | | 523,417 | |
| 6.50%, 4/1/18-4/1/34 | | | 33,480 | | | | 37,679 | |
| 7.00%, 10/1/31-10/1/37 | | | 156,510 | | | | 177,975 | |
| 8.00%, 4/1/16 | | | 37 | | | | 37 | |
| 9.00%, 8/1/22-5/1/25 | | | 3,196 | | | | 3,514 | |
| |
| Federal Home Loan Mortgage Corp., Interest-Only Stripped Mtg.-Backed Security: | |
| Series 183,Cl. IO, 12.314%, 4/1/275 | | | 80,590 | | | | 17,079 | |
| Series 192,Cl. IO, 5.017%, 2/1/285 | | | 23,132 | | | | 4,993 | |
| Series 243,Cl. 6, 2.237%, 12/15/325 | | | 65,053 | | | | 12,769 | |
| | | | | | | | |
| | | Principal
Amount | | | Value | |
| |
| FHLMC/FNMA/FHLB/Sponsored (Continued) | |
| |
| Federal Home Loan Mortgage Corp., Mtg.-Linked Amortizing Global Debt Securities, Series 2012-1, Cl. A10, 2.06%, 1/15/22 | | | $ 257,301 | | | | $ 259,771 | |
| |
| Federal Home Loan Mortgage Corp., Principal-Only Stripped Mtg.-Backed Security, Series 176, Cl. PO, 4.205%, 6/1/266 | | | 25,951 | | | | 24,156 | |
| |
| Federal Home Loan Mortgage Corp., Real Estate Mtg. Investment Conduit Multiclass Pass-Through Certificates: | |
| Series 2426,Cl. BG, 6.00%, 3/15/17 | | | 27,270 | | | | 27,948 | |
| Series 2427,Cl. ZM, 6.50%, 3/15/32 | | | 131,401 | | | | 150,784 | |
| Series 2461,Cl. PZ, 6.50%, 6/15/32 | | | 59,493 | | | | 67,699 | |
| Series 2564,Cl. MP, 5.00%, 2/15/18 | | | 100,103 | | | | 103,342 | |
| Series 2585,Cl. HJ, 4.50%, 3/15/18 | | | 56,260 | | | | 58,057 | |
| Series 2626,Cl. TB, 5.00%, 6/15/33 | | | 125,406 | | | | 134,470 | |
| Series 2635,Cl. AG, 3.50%, 5/15/32 | | | 48,706 | | | | 50,520 | |
| Series 2707,Cl. QE, 4.50%, 11/15/18 | | | 283,634 | | | | 293,690 | |
| Series 2770,Cl. TW, 4.50%, 3/15/19 | | | 12,398 | | | | 12,879 | |
| Series 3010,Cl. WB, 4.50%, 7/15/20 | | | 36,867 | | | | 38,444 | |
| Series 3025,Cl. SJ, 23.538%, 8/15/354 | | | 21,517 | | | | 33,799 | |
| Series 3030,Cl. FL, 0.731%, 9/15/354 | | | 112,531 | | | | 112,918 | |
| Series 3741,Cl. PA, 2.15%, 2/15/35 | | | 298,545 | | | | 301,509 | |
| Series 3815,Cl. BD, 3.00%, 10/15/20 | | | 10,420 | | | | 10,608 | |
| Series 3822,Cl. JA, 5.00%, 6/15/40 | | | 86,149 | | | | 91,279 | |
| Series 3840,Cl. CA, 2.00%, 9/15/18 | | | 7,710 | | | | 7,775 | |
| Series 3848,Cl. WL, 4.00%, 4/15/40 | | | 156,039 | | | | 163,487 | |
| Series 3857,Cl. GL, 3.00%, 5/15/40 | | | 8,901 | | | | 9,170 | |
| Series 4221,Cl. HJ, 1.50%, 7/15/23 | | | 862,904 | | | | 858,180 | |
| |
| Federal Home Loan Mortgage Corp., Real Estate Mtg. Investment Conduit Multiclass Pass-Through Certificates, Interest-Only Stripped Mtg.-Backed Security: | |
| Series 2130,Cl. SC, 48.33%, 3/15/295 | | | 79,946 | | | | 17,380 | |
| Series 2796,Cl. SD, 48.601%, 7/15/265 | | | 112,007 | | | | 20,448 | |
| Series 2920,Cl. S, 50.68%, 1/15/355 | | | 571,964 | | | | 104,911 | |
| Series 2922,Cl. SE, 5.232%, 2/15/355 | | | 33,934 | | | | 6,061 | |
| Series 2981,Cl. AS, 0.00%, 5/15/355,7 | | | 317,707 | | | | 62,346 | |
| Series 3201,Cl. SG, 1.579%, 8/15/365 | | | 88,692 | | | | 16,688 | |
| Series 3397,Cl. GS, 14.856%, 12/15/375 | | | 38,214 | | | | 7,124 | |
| Series 3424,Cl. EI, 14.62%, 4/15/385 | | | 19,749 | | | | 2,333 | |
| Series 3450,Cl. BI, 8.091%, 5/15/385 | | | 103,766 | | | | 16,391 | |
| Series 3606,Cl. SN, 0.296%, 12/15/395 | | | 56,271 | | | | 9,855 | |
| |
| Federal National Mortgage Assn.: | | | | | | | | |
| 3.00%, 1/1/318 | | | 5,815,000 | | | | 5,989,696 | |
| 3.50%, 1/15/468 | | | 165,000 | | | | 170,193 | |
| 4.00%, 1/1/468 | | | 7,245,000 | | | | 7,665,128 | |
| 4.50%, 1/1/318 | | | 219,000 | | | | 226,327 | |
| 5.00%, 1/1/468 | | | 3,260,000 | | | | 3,588,397 | |
| 6.00%, 1/1/468 | | | 425,000 | | | | 480,220 | |
| |
| Federal National Mortgage Assn. Pool: | | | | | | | | |
| 3.50%, 12/1/20-2/1/22 | | | 359,892 | | | | 377,109 | |
| 5.00%, 3/1/21 | | | 13,893 | | | | 14,555 | |
| 5.50%, 9/1/20 | | | 3,135 | | | | 3,327 | |
| 6.00%, 11/1/17-3/1/37 | | | 222,322 | | | | 250,397 | |
| 6.50%, 5/1/17-10/1/19 | | | 25,645 | | | | 26,197 | |
| 7.00%, 11/1/17-10/1/35 | | | 9,332 | | | | 9,794 | |
| 7.50%, 1/1/33 | | | 77,786 | | | | 92,563 | |
| 8.50%, 7/1/32 | | | 4,546 | | | | 4,910 | |
| |
| Federal National Mortgage Assn., Interest-Only Stripped Mtg.-Backed Security: | |
| Series 222,Cl. 2, 16.899%, 6/25/235 | | | 173,837 | | | | 29,879 | |
| Series 233,Cl. 2, 36.338%, 8/25/235 | | | 125,279 | | | | 25,642 | |
| Series 252,Cl. 2, 36.36%, 11/25/235 | | | 165,623 | | | | 35,585 | |
| Series 319,Cl. 2, 0.00%, 2/25/325,7 | | | 36,320 | | | | 7,779 | |
| Series 320,Cl. 2, 8.298%, 4/25/325 | | | 12,001 | | | | 3,190 | |
| Series 321,Cl. 2, 0.00%, 4/25/325,7 | | | 128,587 | | | | 27,410 | |
| Series 331,Cl. 9, 10.377%, 2/25/335 | | | 149,362 | | | | 32,995 | |
| Series 334,Cl. 17, 17.717%, 2/25/335 | | | 83,993 | | | | 16,702 | |
| Series 339,Cl. 12, 0.00%, 6/25/335,7 | | | 115,892 | | | | 25,004 | |
| Series 339,Cl. 7, 0.00%, 11/25/335,7 | | | 329,955 | | | | 69,311 | |
| Series 343,Cl. 13, 3.874%, 9/25/335 | | | 119,182 | | | | 23,978 | |
| Series 345,Cl. 9, 0.00%, 1/25/345,7 | | | 106,167 | | | | 21,903 | |
| Series 351,Cl. 10, 0.00%, 4/25/345,7 | | | 15,019 | | | | 2,842 | |
9 OPPENHEIMER CONSERVATIVE BALANCED FUND/VA
STATEMENT OF INVESTMENTS Continued
| | | | | | | | |
| | | Principal
Amount | | | Value | |
| |
| FHLMC/FNMA/FHLB/Sponsored (Continued) | |
| |
| Federal National Mortgage Assn., Interest-Only Stripped Mtg.-Backed Security: (Continued) | |
| Series 351,Cl. 8, 0.00%, 4/25/345,7 | | | $ 51,391 | | | | $ 9,851 | |
| Series 356,Cl. 10, 0.00%, 6/25/355,7 | | | 36,408 | | | | 7,316 | |
| Series 356,Cl. 12, 0.00%, 2/25/355,7 | | | 19,502 | | | | 3,987 | |
| Series 362,Cl. 13, 0.00%, 8/25/355,7 | | | 137,809 | | | | 29,451 | |
| Series 364,Cl. 16, 0.00%, 9/25/355,7 | | | 97,412 | | | | 17,292 | |
| |
| Federal National Mortgage Assn., Real Estate Mtg. Investment Conduit Multiclass Pass-Through Certificates: | |
| Series 1998-61,Cl. PL, 6.00%, 11/25/28 | | | 59,354 | | | | 67,252 | |
| Series 2003-100,Cl. PA, 5.00%, 10/25/18 | | | 212,387 | | | | 220,479 | |
| Series 2003-130,Cl. CS, 13.257%, 12/25/334 | | | 13,197 | | | | 15,448 | |
| Series 2003-84,Cl. GE, 4.50%, 9/25/18 | | | 16,062 | | | | 16,612 | |
| Series 2004-101,Cl. BG, 5.00%, 1/25/20 | | | 74,729 | | | | 75,835 | |
| Series 2004-25,Cl. PC, 5.50%, 1/25/34 | | | 150,348 | | | | 157,000 | |
| Series 2005-104,Cl. MC, 5.50%, 12/25/25 | | | 268,649 | | | | 292,461 | |
| Series 2005-31,Cl. PB, 5.50%, 4/25/35 | | | 250,000 | | | | 289,509 | |
| Series 2005-73,Cl. DF, 0.672%, 8/25/354 | | | 228,030 | | | | 229,001 | |
| Series 2006-11,Cl. PS, 23.021%, 3/25/364 | | | 80,079 | | | | 124,055 | |
| Series 2006-46,Cl. SW, 22.653%, 6/25/364 | | | 57,073 | | | | 75,763 | |
| Series 2006-50,Cl. KS, 22.654%, 6/25/364 | | | 12,080 | | | | 18,455 | |
| Series 2008-75,Cl. DB, 4.50%, 9/25/23 | | | 64,573 | | | | 66,599 | |
| Series 2009-113,Cl. DB, 3.00%, 12/25/20 | | | 226,989 | | | | 231,255 | |
| Series 2009-36,Cl. FA, 1.362%, 6/25/374 | | | 85,978 | | | | 88,283 | |
| Series 2009-37,Cl. HA, 4.00%, 4/25/19 | | | 63,075 | | | | 64,676 | |
| Series 2009-70,Cl. TL, 4.00%, 8/25/19 | | | 681,991 | | | | 697,122 | |
| Series 2010-43,Cl. KG, 3.00%, 1/25/21 | | | 112,051 | | | | 114,502 | |
| Series 2011-15,Cl. DA, 4.00%, 3/25/41 | | | 39,992 | | | | 41,505 | |
| Series 2011-3,Cl. EL, 3.00%, 5/25/20 | | | 375,625 | | | | 382,689 | |
| Series 2011-3,Cl. KA, 5.00%, 4/25/40 | | | 192,504 | | | | 208,921 | |
| Series 2011-38,Cl. AH, 2.75%, 5/25/20 | | | 8,560 | | | | 8,696 | |
| Series 2011-82,Cl. AD, 4.00%, 8/25/26 | | | 239,166 | | | | 245,940 | |
| |
| Federal National Mortgage Assn., Real Estate Mtg. Investment Conduit Multiclass Pass-Through Certificates, Interest-Only Stripped Mtg.-Backed Security: | |
| Series 2001-65,Cl. S, 26.986%, 11/25/315 | | | 141,575 | | | | 30,926 | |
| Series 2001-81,Cl. S, 22.064%, 1/25/325 | | | 36,783 | | | | 10,283 | |
| Series 2002-47,Cl. NS, 27.624%, 4/25/325 | | | 97,677 | | | | 22,688 | |
| Series 2002-51,Cl. S, 27.81%, 8/25/325 | | | 89,691 | | | | 19,256 | |
| Series 2002-52,Cl. SD, 33.799%, 9/25/325 | | | 128,893 | | | | 30,064 | |
| Series 2002-77,Cl. SH, 31.555%, 12/18/325 | | | 55,410 | | | | 11,727 | |
| Series 2002-84,Cl. SA, 33.349%, 12/25/325 | | | 135,309 | | | | 30,695 | |
| Series 2002-9,Cl. MS, 22.928%, 3/25/325 | | | 38,045 | | | | 8,676 | |
| Series 2003-33,Cl. SP, 28.197%, 5/25/335 | | | 147,376 | | | | 33,215 | |
| Series 2003-4,Cl. S, 29.665%, 2/25/335 | | | 80,942 | | | | 20,783 | |
| Series 2003-46,Cl. IH, 0.00%, 6/25/235,7 | | | 284,417 | | | | 37,229 | |
| Series 2004-54,Cl. DS, 37.028%, 11/25/305 | | | 108,094 | | | | 20,411 | |
| Series 2004-56,Cl. SE, 11.185%, 10/25/335 | | | 27,974 | | | | 6,009 | |
| Series 2005-12,Cl. SC, 8.096%, 3/25/355 | | | 15,998 | | | | 3,101 | |
| Series 2005-14,Cl. SE, 33.407%, 3/25/355 | | | 53,559 | | | | 8,353 | |
| Series 2005-40,Cl. SA, 46.534%, 5/25/355 | | | 282,976 | | | | 50,370 | |
| Series 2005-52,Cl. JH, 0.00%, 5/25/355,7 | | | 730,054 | | | | 130,690 | |
| Series 2005-93,Cl. SI, 21.314%, 10/25/355 | | | 64,897 | | | | 11,060 | |
| Series 2007-88,Cl. XI, 33.727%, 6/25/375 | | | 162,483 | | | | 27,441 | |
| Series 2008-55,Cl. SA, 12.503%, 7/25/385 | | | 73,164 | | | | 9,631 | |
| Series 2009-8,Cl. BS, 0.00%, 2/25/245,7 | | | 19,067 | | | | 848 | |
| Series 2011-96,Cl. SA, 4.685%, 10/25/415 | | | 155,349 | | | | 26,998 | |
| Series 2012-134,Cl. SA, 10.761%, 12/25/425 | | | 577,702 | | | | 139,710 | |
| Series 2012-40,Cl. PI, 0.00%, 4/25/415,7 | | | 329,190 | | | | 44,769 | |
| |
| Federal National Mortgage Assn., Real Estate Mtg. Investment Conduit Multiclass Pass-Through Certificates, Principal-Only Stripped Mtg.-Backed | |
| Security, Series 1993-184, Cl. M, 5.135%, | | | | | | | | |
| 9/25/236 | | | 63,589 | | | | 60,369 | |
| | | | | | | | |
| | | | | | | 27,700,598 | |
|
| |
| GNMA/Guaranteed—10.6% | | | | | |
| |
| Government National Mortgage Assn. I Pool: | | | | | |
| 7.00%, 1/15/24 | | | 33,239 | | | | 35,741 | |
| 7.50%, 1/15/23-6/15/24 | | | 33,401 | | | | 35,777 | |
| 8.00%, 5/15/17-4/15/23 | | | 19,970 | | | | 21,725 | |
| 8.50%, 8/15/17-12/15/17 | | | 2,465 | | | | 2,535 | |
| | | | | | | | |
| | | Principal
Amount | | | Value | |
| |
| GNMA/Guaranteed (Continued) | |
| |
| Government National Mortgage Assn. II Pool: | | | | | |
| 3.50%, 1/15/468 | | | $ 18,970,000 | | | | $ 19,770,396 | |
| 4.00%, 1/20/468 | | | 4,430,000 | | | | 4,703,626 | |
| |
| Government National Mortgage Assn., Interest-Only Stripped Mtg.-Backed Security: | |
| Series 2002-15,Cl. SM, 53.639%, 2/16/325 | | | 175,564 | | | | 32,153 | |
| Series 2002-76,Cl. SY, 56.529%, 12/16/265 | | | 354,369 | | | | 68,457 | |
| Series 2007-17,Cl. AI, 18.119%, 4/16/375 | | | 405,473 | | | | 80,790 | |
| Series 2011-52,Cl. HS, 7.744%, 4/16/415 | | | 198,053 | | | | 36,738 | |
| | | | | | | | |
| | | | | | | 24,787,938 | |
|
| |
| Non-Agency—8.1% | | | | | | | | |
| |
| Commercial—7.0% | | | | | | | | |
| |
| Banc of America Funding Trust: | | | | | | | | |
| Series 2006-G,Cl. 2A4, 0.692%, 7/20/364 | | | 813,234 | | | | 764,679 | |
| Series 2014-R7,Cl. 3A1, 2.763%, 3/26/363,4 | | | 348,342 | | | | 353,498 | |
| |
| BCAP LLC Trust, Series 2011-R11, Cl. 18A5, 2.43%, 9/26/352,4 | | | 214,335 | | | | 216,704 | |
| |
| Bear Stearns ARM Trust: | | | | | | | | |
| Series 2005-2,Cl. A1, 2.68%, 3/25/354 | | | 304,157 | | | | 305,521 | |
| Series 2005-9,Cl. A1, 2.66%, 10/25/354 | | | 779,029 | | | | 768,542 | |
| |
| Chase Mortgage Finance Trust, Series 2005-A2, | | | | | | | | |
| Cl. 1A3, 2.544%, 1/25/364 | | | 195,266 | | | | 182,864 | |
| |
| Citigroup Commercial Mortgage Trust, Series 2013-GC11, Cl. D, 4.457%, 4/10/462,4 | | | 185,000 | | | | 168,199 | |
| |
| Citigroup Mortgage Loan Trust, Inc., Series 2006- AR1, Cl. 1A1, 2.57%, 10/25/354 | | | 711,201 | | | | 705,980 | |
| |
| COMM Mortgage Trust: | | | | | | | | |
| Series 2012-CR4,Cl. D, 4.574%, 10/15/452,4 | | | 185,000 | | | | 173,726 | |
| Series 2012-CR5,Cl. E, 4.337%, 12/10/452,4 | | | 480,000 | | | | 445,622 | |
| Series 2013-CR7,Cl. D, 4.352%, 3/10/462,4 | | | 445,000 | | | | 402,353 | |
| Series 2014-CR21,Cl. AM, 3.987%, 12/10/47 | | | 860,000 | | | | 889,353 | |
| |
| COMM Mortgage Trust, Interest-Only Stripped Mtg.-Backed Security, Series 2012-CR5, Cl. XA, 0%, 12/10/455,7 | | | 420,191 | | | | 32,845 | |
| |
| CSMC: | | | | | | | | |
| Series 2006-6,Cl. 1A4, 6.00%, 7/25/36 | | | 196,551 | | | | 150,905 | |
| Series 2009-13R,Cl. 4A1, 2.747%, 9/26/362,4 | | | 51,404 | | | | 51,611 | |
| |
| DBUBS Mortgage Trust, Series 2011-LC1A, Cl. E, 5.663%, 11/10/462,4 | | | 50,000 | | | | 52,877 | |
| |
| First Horizon Alternative Mortgage Securities Trust: | | | | | | | | |
| Series 2004-FA2,Cl. 3A1, 6.00%, 1/25/35 | | | 121,342 | | | | 115,406 | |
| Series 2005-FA8,Cl. 1A6, 1.072%, 11/25/354 | | | 127,079 | | | | 89,889 | |
| |
| FREMF Mortgage Trust: | | | | | | | | |
| Series 2012-K501,Cl. C, 3.397%, 11/25/462,4 | | | 50,000 | | | | 50,170 | |
| Series 2013-K25,Cl. C, 3.618%, 11/25/452,4 | | | 60,000 | | | | 57,103 | |
| Series 2013-K26,Cl. C, 3.599%, 12/25/452,4 | | | 40,000 | | | | 38,784 | |
| Series 2013-K27,Cl. C, 3.496%, 1/25/462,4 | | | 110,000 | | | | 102,945 | |
| Series 2013-K28,Cl. C, 3.494%, 6/25/462,4 | | | 450,000 | | | | 421,574 | |
| Series 2013-K502,Cl. C, 3.18%, 3/25/452,4 | | | 220,000 | | | | 221,917 | |
| Series 2013-K712,Cl. C, 3.371%, 5/25/452,4 | | | 70,000 | | | | 69,455 | |
| Series 2013-K713,Cl. C, 3.165%, 4/25/462,4 | | | 145,000 | | | | 140,081 | |
| Series 2014-K715,Cl. C, 4.123%, 2/25/462,4 | | | 35,000 | | | | 35,554 | |
| Series 2015-K44,Cl. B, 3.685%, 1/25/482,4 | | | 365,000 | | | | 327,693 | |
| |
| GSMSC Pass-Through Trust, Series 2009-3R, Cl. 1A2, 6%, 4/25/372,4 | | | 469,120 | | | | 440,952 | |
| |
| GSR Mortgage Loan Trust, Series 2005-AR4, Cl. 6A1, 2.863%, 7/25/354 | | | 41,244 | | | | 40,834 | |
| |
| JP Morgan Chase Commercial Mortgage Securities Corp., Series 2012-LC9, Cl. E, 4.42%, 12/15/472,4 | | | 285,000 | | | | 263,364 | |
| |
| JP Morgan Chase Commercial Mortgage Securities Trust: Series 2006-LDP8,Cl. AJ, 5.48%, 5/15/454 | | | 690,000 | | | | 701,987 | |
| Series 2012-C6,Cl. E, 5.192%, 5/15/452,4 | | | 380,000 | | | | 371,993 | |
| |
| JP Morgan Mortgage Trust, Series 2007-A1, Cl. 5A1, 2.726%, 7/25/354 | | | 171,476 | | | | 172,226 | |
| |
| JP Morgan Resecuritization Trust: | | | | | | | | |
| Series 2009-11,Cl. 5A1, 2.747%, 9/26/362,4 | | | 190,989 | | | | 191,224 | |
| Series 2009-5,Cl. 1A2, 2.738%, 7/26/362,4 | | | 252,943 | | | | 226,547 | |
| |
| JPMBB Commercial Mortgage Securities Trust: | | | | | | | | |
| Series 2014-C25,Cl. AS, 4.065%, 11/15/47 | | | 360,000 | | | | 371,963 | |
| Series 2014-C26,Cl. AS, 3.80%, 1/15/48 | | | 180,000 | | | | 181,330 | |
10 OPPENHEIMER CONSERVATIVE BALANCED FUND/VA
| | | | | | | | |
| | | Principal
Amount | | | Value | |
| |
| Commercial (Continued) | | | | | |
| |
| MASTR Adjustable Rate Mortgages Trust, Series 2004-13, Cl. 2A2, 2.775%, 4/21/344 | | | $ 72,417 | | | | $ 74,057 | |
| |
| Morgan Stanley Bank of America Merrill Lynch Trust: | |
| Series 2012-C6,Cl. E, 4.657%, 11/15/452,4 | | | 385,000 | | | | 370,129 | |
| Series 2013-C7,Cl. D, 4.297%, 2/15/462,4 | | | 115,000 | | | | 106,549 | |
| Series 2013-C8,Cl. D, 4.169%, 12/15/482,4 | | | 80,000 | | | | 73,702 | |
| Series 2014-C19,Cl. AS, 3.832%, 12/15/47 | | | 720,000 | | | | 730,442 | |
| |
| Morgan Stanley Capital I Trust, Series 2007-IQ13, Cl. AM, 5.406%, 3/15/44 | | | 260,000 | | | | 267,099 | |
| |
| Morgan Stanley Re-Remic Trust, Series 2012-R3, Cl. 1B, 2.176%, 11/26/362,4 | | | 250,004 | | | | 166,693 | |
| |
| Morgan Stanley Resecuritization Trust, Series 2013-R9, Cl. 3A, 2.402%, 6/26/462,4 | | | 514,728 | | | | 517,233 | |
| |
| RBSSP Resecuritization Trust, Series 2010-1, Cl. 2A1, 2.109%, 7/26/452,4 | | | 37,750 | | | | 37,675 | |
| |
| Structured Adjustable Rate Mortgage Loan Trust, | | | | | | | | |
| Series 2004-10, Cl. 2A, 2.446%, 8/25/344 | | | 316,484 | | | | 318,293 | |
| |
| Structured Agency Credit Risk Debt Nts.: | | | | | | | | |
| Series 2014-DN1,Cl. M2, 2.622%, 2/25/244 | | | 145,000 | | | | 144,622 | |
| Series 2015-DNA2,Cl. M2, 3.022%, 12/25/274 | | | 85,000 | | | | 84,602 | |
| |
| UBS-Barclays Commercial Mortgage Trust, Series | | | | | | | | |
| 2012-C2, Cl. E, 4.888%, 5/10/632,4 | | | 45,000 | | | | 43,658 | |
| |
| WaMu Mortgage Pass-Through Certificates Trust: | | | | | | | | |
| Series 2005-AR14,Cl. 1A4, 2.523%, 12/25/354 | | | 148,528 | | | | 144,184 | |
| Series 2005-AR16,Cl. 1A1, 2.568%, 12/25/354 | | | 138,793 | | | | 132,381 | |
| |
| Wells Fargo Mortgage-Backed Securities Trust: | | | | | | | | |
| Series 2005-AR1,Cl. 1A1, 2.662%, 2/25/354 | | | 32,059 | | | | 32,175 | |
| Series 2005-AR10,Cl. 1A1, 2.74%, 6/25/354 | | | 613,437 | | | | 627,765 | |
| Series 2005-AR15,Cl. 1A6, 2.736%, 9/25/354 | | | 422,621 | | | | 403,893 | |
| Series 2006-AR7,Cl. 2A4, 2.738%, 5/25/364 | | | 226,110 | | | | 215,871 | |
| Series 2006-AR8,Cl. 2A4, 2.744%, 4/25/364 | | | 148,756 | | | | 145,734 | |
| Series 2007-16,Cl. 1A1, 6.00%, 12/28/37 | | | 86,000 | | | | 89,688 | |
| Series 2007-AR8,Cl. A1, 2.809%, 11/25/374 | | | 449,897 | | | | 399,235 | |
| |
| WF-RBS Commercial Mortgage Trust: | | | | | | | | |
| Series 2012-C10,Cl. D, 4.454%, 12/15/452,4 | | | 160,000 | | | | 149,695 | |
| Series 2012-C7,Cl. E, 4.838%, 6/15/452,4 | | | 80,000 | | | | 77,560 | |
| Series 2012-C8,Cl. E, 4.875%, 8/15/452,4 | | | 365,000 | | | | 354,148 | |
| Series 2013-C11,Cl. D, 4.179%, 3/15/452,4 | | | 49,000 | | | | 45,570 | |
| Series 2013-C15,Cl. D, 4.48%, 8/15/462,4 | | | 225,000 | | | | 208,674 | |
| |
| WF-RBS Commercial Mortgage Trust, Interest-Only Commercial Mtg. Pass-Through Certificates, Series 2011-C3, Cl. XA, 0%, 3/15/442,5,7 | | | 3,273,440 | | | | 149,722 | |
| | | | | | | | |
| | | | | | | 16,409,319 | |
| |
| Multi-Family—0.1% | | | | | | | | |
| |
| Wells Fargo Mortgage-Backed Securities Trust: | | | | | | | | |
| Series 2005-AR15,Cl. 1A2, 2.736%, 9/25/354 | | | 216,100 | | | | 211,347 | |
| Series 2006-AR2,Cl. 2A3, 2.763%, 3/25/364 | | | 40,960 | | | | 40,466 | |
| | | | | | | | |
| | | | | | | 251,813 | |
| |
| Residential—1.0% | | | | | | | | |
| |
| Alternative Loan Trust, Series 2005-29CB, Cl. A4, 5%, 7/25/35 | | | 357,209 | | | | 325,965 | |
| |
| Banc of America Funding Trust: | | | | | | | | |
| Series 2007-1,Cl. 1A3, 6.00%, 1/25/37 | | | 87,507 | | | | 80,477 | |
| Series 2007-C,Cl. 1A4, 4.007%, 5/20/364 | | | 36,538 | | | | 34,263 | |
| |
| Banc of America Mortgage Trust, Series 2004-E, Cl. 2A6, 2.864%, 6/25/344 | | | 104,628 | | | | 103,847 | |
| |
| Bear Stearns ARM Trust, Series 2006-1, Cl. A1, 2.58%, 2/25/364 | | | 323,496 | | | | 321,244 | |
| |
| Carrington Mortgage Loan Trust, Series 2006- FRE1, Cl. A2, 0.532%, 7/25/364 | | | 46,051 | | | | 45,581 | |
| |
| CHL Mortgage Pass-Through Trust: | | | | | | | | |
| Series 2005-26,Cl. 1A8, 5.50%, 11/25/35 | | | 108,930 | | | | 104,218 | |
| Series 2006-6,Cl. A3, 6.00%, 4/25/36 | | | 58,827 | | | | 56,768 | |
| |
| HomeBanc Mortgage Trust, Series 2005-3, Cl. A2, 0.732%, 7/25/354 | | | 51,618 | | | | 48,534 | |
| |
| RALI Trust: | | | | | | | | |
| Series 2003-QS1,Cl. A2, 5.75%, 1/25/33 | | | 1,174 | | | | 1,174 | |
| | | | | | | | |
| | | Principal
Amount | | | Value | |
| |
| Residential (Continued) | | | | | | | | |
| |
| RALI Trust: (Continued) | | | | | | | | |
| Series 2006-QS13,Cl. 1A8, 6.00%, 9/25/36 | | | $ 13,451 | | | | $ 10,858 | |
| |
| WaMu Mortgage Pass-Through Certificates Trust, Series 2003-AR10, Cl. A7, 2.535%, 10/25/334 | | | 151,446 | | | | 155,018 | |
| |
| Wells Fargo Mortgage Backed Securities Trust: | | | | | | | | |
| Series 2005-AR13,Cl. 1A5, 2.74%, 5/25/354 | | | 204,883 | | | | 206,346 | |
| Series 2006-AR10,Cl. 5A5, 2.738%, 7/25/364 | | | 311,065 | | | | 302,789 | |
| |
| Wells Fargo Mortgage-Backed Securities Trust: | | | | | | | | |
| Series 2005-AR4,Cl. 2A2, 2.683%, 4/25/354 | | | 414,039 | | | | 416,940 | |
| Series 2006-AR14,Cl. 1A2, 5.851%, 10/25/364 | | | 74,651 | | | | 72,517 | |
| Series 2006-AR8,Cl. 2A1, 2.744%, 4/25/364 | | | 140,213 | | | | 137,365 | |
| | | | | | | | |
| | | | | | | 2,423,904 | |
| | | | | | | | |
Total Mortgage-Backed Obligations (Cost $71,492,184) | | | | 71,573,572 | |
| |
U.S. Government Obligations—0.3% | |
| |
| Federal Home Loan Mortgage Corp. Nts.: | | | | | | | | |
| 1.00% Nts., 12/15/17 | | | 193,000 | | | | 192,553 | |
| 5.50% Nts., 7/18/16 | | | 65,000 | | | | 66,682 | |
| |
| United States Treasury Nts., 1.50%, 5/31/19 | | | 552,000 | | | | 552,711 | |
| | | | | | | | |
Total U.S. Government Obligations (Cost $813,370) | | | | | | | 811,946 | |
| |
Non-Convertible Corporate Bonds and Notes—30.0% | |
| |
| Consumer Discretionary—4.9% | | | | | |
| |
| Auto Components—0.1% | | | | | | | | |
| |
| BorgWarner, Inc., 4.375% Sr. Unsec. Nts., 3/15/45 | | | 128,000 | | | | 114,616 | |
| |
| Johnson Controls, Inc., 1.40% Sr. Unsec. Nts., 11/2/17 | | | 77,000 | | | | 76,241 | |
| | | | | | | | |
| | | | | | | 190,857 | |
|
| |
| Automobiles—1.3% | | | | | | | | |
| |
| Daimler Finance North America LLC, 8.50% Sr. Unsec. Unsub. Nts., 1/18/31 | | | 271,000 | | | | 393,584 | |
| |
| Ford Motor Credit Co. LLC, 3.664% Sr. Unsec. Nts., 9/8/24 | | | 970,000 | | | | 945,703 | |
| |
| General Motors Co., 6.25% Sr. Unsec. Nts., 10/2/43 | | | 437,000 | | | | 462,653 | |
| |
| General Motors Financial Co., Inc., 3% Sr. Unsec. Nts., 9/25/17 | | | 401,000 | | | | 402,696 | |
| |
| Harley-Davidson, Inc., 4.625% Sr. Unsec. Nts., 7/28/45 | | | 107,000 | | | | 105,162 | |
| |
| Hyundai Capital America, 2.40% Sr. Unsec. Nts., 10/30/182 | | | 392,000 | | | | 390,978 | |
| |
| Kia Motors Corp., 3.625% Sr. Unsec. Nts., 6/14/162 | | | 341,000 | | | | 343,834 | |
| | | | | | | | |
| | | | | | | 3,044,610 | |
|
| |
| Hotels, Restaurants & Leisure—0.7% | | | | | |
| |
| Carnival Corp., 1.20% Sr. Unsec. Nts., 2/5/16 | | | 465,000 | | | | 465,153 | |
| |
| Marriott International, Inc.: | | | | | | | | |
| 3.25% Sr. Unsec. Nts., 9/15/22 | | | 262,000 | | | | 259,500 | |
| 6.375% Sr. Unsec. Nts., 6/15/17 | | | 354,000 | | | | 378,511 | |
| |
| McDonald’s Corp.: | | | | | | | | |
| 2.75% Sr. Unsec. Nts., 12/9/20 | | | 173,000 | | | | 173,113 | |
| 4.875% Sr. Unsec. Nts., 12/9/45 | | | 29,000 | | | | 29,270 | |
| |
| Wyndham Worldwide Corp., 6% Sr. Unsec. Nts., 12/1/16 | | | 403,000 | | | | 418,530 | |
| | | | | | | | |
| | | | | | | 1,724,077 | |
|
| |
| Household Durables—0.5% | | | | | |
| |
| Jarden Corp., 5% Sr. Unsec. Nts., 11/15/232 | | | 391,000 | | | | 401,752 | |
| |
| Lennar Corp., 4.75% Sr. Unsec. Nts., 5/30/25 | | | 183,000 | | | | 179,798 | |
| |
| Toll Brothers Finance Corp., 4.375% Sr. Unsec. Nts., 4/15/23 | | | 410,000 | | | | 399,750 | |
| |
| Whirlpool Corp.: | | | | | | | | |
| 1.35% Sr. Unsec. Nts., 3/1/17 | | | 123,000 | | | | 122,318 | |
| 1.65% Sr. Unsec. Nts., 11/1/17 | | | 105,000 | | | | 104,502 | |
| | | | | | | | |
| | | | | | | 1,208,120 | |
11 OPPENHEIMER CONSERVATIVE BALANCED FUND/VA
STATEMENT OF INVESTMENTS Continued
| | | | | | | | |
| | | Principal
Amount | | | Value | |
| |
| Leisure Equipment & Products—0.2% | |
| |
| Mattel, Inc., 1.70% Sr. Unsec. Nts., 3/15/18 | | | $ 433,000 | | | | $ 427,545 | |
|
| |
| Media—1.4% | | | | | | | | |
| |
| 21st Century Fox America, Inc., 6.15% Sr. Unsec. Nts., 2/15/41 | | | 92,000 | | | | 103,776 | |
| |
| CCO Safari II LLC: | | | | | | | | |
| 4.908% Sr. Sec. Nts., 7/23/252 | | | 124,000 | | | | 124,065 | |
| 6.484% Sr. Sec. Nts., 10/23/452 | | | 207,000 | | | | 207,615 | |
| |
| Comcast Cable Communications Holdings, Inc., 9.455% Sr. Unsec. Nts., 11/15/22 | | | 211,000 | | | | 291,569 | |
| |
| Comcast Corp., 4.65% Sr. Unsec. Unsub. Nts., 7/15/42 | | | 156,000 | | | | 159,100 | |
| |
| Historic TW, Inc.: | | | | | | | | |
| 8.05% Sr. Unsec. Nts., 1/15/16 | | | 77,000 | | | | 77,127 | |
| 9.15% Debs., 2/1/23 | | | 118,000 | | | | 153,401 | |
| |
| Interpublic Group of Cos., Inc. (The), 4.20% Sr. Unsec. Nts., 4/15/24 | | | 226,000 | | | | 224,347 | |
| |
| Pearson Funding Two plc, 4% Sr. Unsec. Nts., 5/17/162 | | | 101,000 | | | | 101,722 | |
| |
| Scripps Networks Interactive, Inc., 2.70% Sr. Unsec. Nts., 12/15/16 | | | 404,000 | | | | 406,975 | |
| |
| Sky plc, 3.75% Sr. Unsec. Nts., 9/16/242 | | | 217,000 | | | | 212,450 | |
| |
| Thomson Reuters Corp., 1.65% Sr. Unsec. Nts., 9/29/17 | | | 416,000 | | | | 414,059 | |
| |
| Time Warner Cable, Inc., 4.50% Sr. Unsec. Unsub. Nts., 9/15/42 | | | 145,000 | | | | 114,184 | |
| |
| Viacom, Inc., 2.50% Sr. Unsec. Nts., 12/15/16 | | | 183,000 | | | | 183,426 | |
| |
| Virgin Media Secured Finance plc, 5.25% Sr. Sec. Nts., 1/15/262 | | | 415,000 | | | | 404,625 | |
| | | | | | | | |
| | | | | | | 3,178,441 | |
|
| |
| Multiline Retail—0.2% | | | | | | | | |
| |
| Dollar Tree, Inc., 5.75% Sr. Sec. Nts., 3/1/232 | | | 300,000 | | | | 314,250 | |
| |
| Kohl’s Corp., 5.55% Sr. Unsec. Nts., 7/17/45 | | | 129,000 | | | | 120,485 | |
| | | | | | | | |
| | | | | | | 434,735 | |
|
| |
| Specialty Retail—0.4% | | | | | | | | |
| |
| Best Buy Co., Inc., 5.50% Sr. Unsec. Nts., 3/15/21 | | | 415,000 | | | | 430,044 | |
| |
| Home Depot, Inc. (The), 4.875% Sr. Unsec. Nts., 2/15/44 | | | 167,000 | | | | 184,349 | |
| |
| Ross Stores, Inc., 3.375% Sr. Unsec. Nts., 9/15/24 | | | 225,000 | | | | 221,893 | |
| |
| Signet UK Finance plc, 4.70% Sr. Unsec. Nts., 6/15/24 | | | 119,000 | | | | 117,445 | |
| | | | | | | | |
| | | | | | | 953,731 | |
|
| |
| Textiles, Apparel & Luxury Goods—0.1% | |
| |
| PVH Corp., 4.50% Sr. Unsec. Unsub. Nts., 12/15/22 | | | 341,000 | | | | 335,032 | |
|
| |
| Consumer Staples—3.0% | | | | | | | | |
| |
| Beverages—0.6% | | | | | | | | |
| |
| Anheuser-Busch InBev Worldwide, Inc., 8.20% Sr. Unsec. Unsub. Nts., 1/15/39 | | | 262,000 | | | | 378,102 | |
| |
| Constellation Brands, Inc., 4.75% Sr. Unsec. Nts., 11/15/24 | | | 390,000 | | | | 398,775 | |
| |
| Pernod Ricard SA: | | | | | | | | |
| 2.95% Sr. Unsec. Nts., 1/15/172 | | | 423,000 | | | | 428,385 | |
| 4.25% Sr. Unsec. Nts., 7/15/222 | | | 260,000 | | | | 267,456 | |
| | | | | | | | |
| | | | | | | 1,472,718 | |
|
| |
| Food & Staples Retailing—0.5% | | | | | | | | |
| |
| CVS Health Corp.: | | | | | | | | |
| 5.125% Sr. Unsec. Nts., 7/20/45 | | | 109,000 | | | | 115,267 | |
| 5.30% Sr. Unsec. Nts., 12/5/43 | | | 101,000 | | | | 109,802 | |
| |
| Delhaize Group: | | | | | | | | |
| 5.70% Sr. Unsec. Nts., 10/1/40 | | | 101,000 | | | | 104,190 | |
| 6.50% Sr. Unsec. Nts., 6/15/17 | | | 48,000 | | | | 50,780 | |
| |
| Kroger Co. (The): | | | | | | | | |
| 6.40% Sr. Unsec. Nts., 8/15/17 | | | 386,000 | | | | 414,672 | |
| 6.90% Sr. Unsec. Nts., 4/15/38 | | | 109,000 | | | | 135,098 | |
| | | | | | | | |
| | | Principal
Amount | | | Value | |
| |
| Food & Staples Retailing (Continued) | |
| |
| Wal-Mart Stores, Inc., 4.30% Sr. Unsec. Nts., 4/22/44 | | | $ 220,000 | | | | $ 224,860 | |
| | | | | | | | |
| | | | | | | 1,154,669 | |
|
| |
| Food Products—1.3% | | | | | | | | |
| |
| Bunge Ltd. Finance Corp.: | | | | | | | | |
| 3.20% Sr. Unsec. Nts., 6/15/17 | | | 350,000 | | | | 353,568 | |
| 8.50% Sr. Unsec. Nts., 6/15/19 | | | 320,000 | | | | 370,980 | |
| |
| ConAgra Foods, Inc., 4.65% Sr. Unsec. Nts., 1/25/43 | | | 123,000 | | | | 110,112 | |
| |
| Ingredion, Inc., 1.80% Sr. Unsec. Nts., 9/25/17 | | | 424,000 | | | | 420,334 | |
| |
| JM Smucker Co., 1.75% Sr. Unsec. Nts., 3/15/18 | | | 334,000 | | | | 332,627 | |
| |
| Kraft Foods Group, Inc., 5% Sr. Unsec. Nts., 6/4/42 | | | 99,000 | | | | 100,045 | |
| |
| Kraft Heinz Foods Co.: | | | | | | | | |
| 3.95% Sr. Unsec. Nts., 7/15/252 | | | 215,000 | | | | 217,501 | |
| 5.20% Sr. Unsec. Nts., 7/15/452 | | | 49,000 | | | | 51,360 | |
| |
| TreeHouse Foods, Inc., 4.875% Sr. Unsec. Nts., 3/15/22 | | | 420,000 | | | | 401,100 | |
| |
| Tyson Foods, Inc.: | | | | | | | | |
| 4.875% Sr. Unsec. Nts., 8/15/34 | | | 140,000 | | | | 143,221 | |
| 6.60% Sr. Unsec. Nts., 4/1/16 | | | 402,000 | | | | 407,346 | |
| | | | | | | | |
| | | | | | | 2,908,194 | |
|
| |
| Tobacco—0.6% | | | | | | | | |
| |
| Altria Group, Inc., 10.20% Sr. Unsec. Nts., 2/6/39 | | | 241,000 | | | | 396,359 | |
| |
| Imperial Tobacco Finance plc, 2.05% Sr. Unsec. Nts., 7/20/182 | | | 411,000 | | | | 409,046 | |
| |
| Reynolds American, Inc.: | | | | | | | | |
| 5.85% Sr. Unsec. Nts., 8/15/45 | | | 185,000 | | | | 206,292 | |
| 6.75% Sr. Unsec. Nts., 6/15/17 | | | 388,000 | | | | 414,352 | |
| | | | | | | | |
| | | | | | | 1,426,049 | |
|
| |
| Energy—3.0% | | | | | | | | |
| |
| Energy Equipment & Services—0.7% | |
| |
| Halliburton Co., 5% Sr. Unsec. Nts., 11/15/45 | | | 102,000 | | | | 100,991 | |
| |
| Helmerich & Payne International Drilling Co., 4.65% Sr. Unsec. Nts., 3/15/25 | | | 165,000 | | | | 165,472 | |
| |
| Nabors Industries, Inc., 2.35% Sr. Unsec. Nts., 9/15/16 | | | 371,000 | | | | 369,232 | |
| |
| Schlumberger Holdings Corp.: | | | | | | | | |
| 1.90% Sr. Unsec. Nts., 12/21/172 | | | 416,000 | | | | 414,641 | |
| 4.00% Sr. Unsec. Nts., 12/21/252 | | | 272,000 | | | | 269,094 | |
| |
| Sinopec Group Overseas Development 2014 Ltd., | | | | | | | | |
| 1.75% Sr. Unsec. Nts., 4/10/172 | | | 431,000 | | | | 429,715 | |
| | | | | | | | |
| | | | | | | 1,749,145 | |
|
| |
| Oil, Gas & Consumable Fuels—2.3% | | | | | |
| |
| Anadarko Petroleum Corp., 6.20% Sr. Unsec. Nts., 3/15/40 | | | 231,000 | | | | 213,157 | |
| |
| Apache Corp., 4.75% Sr. Unsec. Nts., 4/15/43 | | | 124,000 | | | | 106,904 | |
| |
| Boardwalk Pipelines LP, 4.95% Sr. Unsec. Nts., 12/15/24 | | | 234,000 | | | | 203,910 | |
| |
| Buckeye Partners LP, 6.05% Sr. Unsec. Nts., 1/15/18 | | | 189,000 | | | | 196,300 | |
| |
| Canadian Natural Resources Ltd.: | | | | | | | | |
| 1.75% Sr. Unsec. Nts., 1/15/18 | | | 165,000 | | | | 160,586 | |
| 5.90% Sr. Unsec. Nts., 2/1/18 | | | 186,000 | | | | 193,760 | |
| |
| Cenovus Energy, Inc., 5.20% Sr. Unsec. Nts., 9/15/43 | | | 116,000 | | | | 91,095 | |
| |
| Cimarex Energy Co., 4.375% Sr. Unsec. Nts., 6/1/24 | | | 224,000 | | | | 199,143 | |
| |
| CNOOC Nexen Finance 2014 ULC, 1.625% Sr. Unsec. Nts., 4/30/17 | | | 444,000 | | | | 441,720 | |
| |
| Columbia Pipeline Group, Inc., 4.50% Sr. Unsec. Nts., 6/1/252 | | | 224,000 | | | | 203,408 | |
| |
| Devon Energy Corp., 4.75% Sr. Unsec. Nts., 5/15/42 | | | 197,000 | | | | 140,203 | |
| |
| EnLink Midstream Partners LP: | | | | | | | | |
| 2.70% Sr. Unsec. Nts., 4/1/19 | | | 356,000 | | | | 325,057 | |
12 OPPENHEIMER CONSERVATIVE BALANCED FUND/VA
| | | | | | | | |
| | | Principal
Amount | | | Value | |
| |
| Oil, Gas & Consumable Fuels (Continued) | |
| |
| EnLink Midstream Partners LP: (Continued) | | | | | |
| 4.40% Sr. Unsec. Nts., 4/1/24 | | | $ 112,000 | | | | $ 88,870 | |
| |
| Enterprise Products Operating LLC: | | | | | | | | |
| 4.85% Sr. Unsec. Nts., 8/15/42 | | | 119,000 | | | | 95,467 | |
| 4.90% Sr. Unsec. Nts., 5/15/46 | | | 42,000 | | | | 34,435 | |
| |
| Husky Energy, Inc., 6.20% Sr. Unsec. Nts., 9/15/17 | | | 236,000 | | | | 246,171 | |
| |
| Kinder Morgan, Inc., 5.55% Sr. Unsec. Nts., 6/1/45 | | | 279,000 | | | | 218,560 | |
| |
| Origin Energy Finance Ltd.: | | | | | | | | |
| 3.50% Sr. Unsec. Nts., 10/9/182 | | | 468,000 | | | | 456,717 | |
| 5.45% Sr. Unsec. Nts., 10/14/212 | | | 147,000 | | | | 143,292 | |
| |
| Pioneer Natural Resources Co., 6.65% Sr. Unsec. Nts., 3/15/17 | | | 385,000 | | | | 397,625 | |
| |
| Regency Energy Partners LP/Regency Energy Finance Corp., 5% Sr. Unsec. Nts., 10/1/22 | | | 280,000 | | | | 248,498 | |
| |
| Spectra Energy Partners LP, 4.60% Sr. Unsec. Nts., 6/15/21 | | | 277,000 | | | | 280,036 | |
| |
| Western Gas Partners LP, 4% Sr. Unsec. Nts., 7/1/22 | | | 273,000 | | | | 241,892 | |
| |
| Woodside Finance Ltd., 4.60% Sr. Unsec. Unsub. Nts., 5/10/212 | | | 372,000 | | | | 377,775 | |
| | | | | | | | |
| | | | | | | 5,304,581 | |
|
| |
| Financials—8.5% | | | | | | | | |
| |
| Capital Markets—1.9% | | | | | | | | |
| |
| Apollo Management Holdings LP, 4% Sr. Unsec. Nts., 5/30/242 | | | 322,000 | | | | 318,571 | |
| |
| Blackstone Holdings Finance Co. LLC, 5% Sr. Unsec. Nts., 6/15/442 | | | 458,000 | | | | 467,979 | |
| |
| Credit Suisse AG, New York, 3.625% Sr. Unsec. Nts., 9/9/24 | | | 470,000 | | | | 474,389 | |
| |
| Deutsche Bank AG, 4.50% Sub. Nts., 4/1/25 | | | 341,000 | | | | 314,306 | |
| |
| Goldman Sachs Group, Inc. (The), 5.15% Sub. Nts., 5/22/45 | | | 301,000 | | | | 293,270 | |
| |
| KKR Group Finance Co. III LLC, 5.125% Sr. Unsec. Nts., 6/1/442 | | | 355,000 | | | | 348,451 | |
| |
| Lazard Group LLC, 4.25% Sr. Unsec. Nts., 11/14/20 | | | 401,000 | | | | 415,967 | |
| |
| Morgan Stanley, 5% Sub. Nts., 11/24/25 | | | 395,000 | | | | 420,377 | |
| |
| Nomura Holdings, Inc., 2% Sr. Unsec. Nts., 9/13/16 | | | 452,000 | | | | 453,882 | |
| |
| Raymond James Financial, Inc., 5.625% Sr. Unsec. Unsub. Nts., 4/1/24 | | | 265,000 | | | | 293,984 | |
| |
| UBS Preferred Funding Trust V, 6.243% Jr. Sub. | | | | | | | | |
| |
| Perpetual Bonds, Series 14,9 | | | 638,000 | | | | 641,190 | |
| | | | | | | | |
| | | | | | | 4,442,366 | |
|
| |
| Commercial Banks—2.6% | | | | | | | | |
| |
| ABN AMRO Bank NV, 4.75% Sub. Nts., 7/28/252 | | | 416,000 | | | | 415,439 | |
| |
| Bank of America Corp., 7.75% Jr. Sub. Nts., 5/14/38 | | | 424,000 | | | | 576,645 | |
| |
| Barclays plc, 3.65% Sr. Unsec. Nts., 3/16/25 | | | 353,000 | | | | 339,894 | |
| |
| BNP Paribas SA, 4.375% Sub. Nts., 9/28/252 | | | 397,000 | | | | 389,616 | |
| |
| Citigroup, Inc., 4.65% Sr. Unsec. Nts., 7/30/45 | | | 330,000 | | | | 335,115 | |
| |
| Citizens Financial Group, Inc., 5.50% Jr. Sub. Perpetual Bonds2,4,9 | | | 194,000 | | | | 191,478 | |
| |
| Cooperatieve Centrale Raiffeisen-Boerenleenbank BA (Netherlands), 4.375% Sub. Nts., 8/4/25 | | | 297,000 | | | | 302,692 | |
| |
| Credit Agricole SA, 8.375% Jr. Sub. Perpetual Bonds2,4,9 | | | 370,000 | | | | 416,250 | |
| |
| FirstMerit Bank NA, 4.27% Sub. Nts., 11/25/26 | | | 432,000 | | | | 433,790 | |
| |
| JPMorgan Chase & Co., 6.75% Jr. Sub. Perpetual Bonds, Series S4,9 | | | 294,000 | | | | 320,828 | |
| |
| Lloyds Banking Group plc, 6.657% Jr. Sub. Perpetual Bonds2,4,9 | | | 400,000 | | | | 449,500 | |
| |
| Regions Bank, Birmingham AL: | | | | | | | | |
| 2.25% Sr. Unsec. Nts., 9/14/18 | | | 328,000 | | | | 327,896 | |
| 6.45% Sub. Nts., 6/26/37 | | | 334,000 | | | | 389,894 | |
| |
| Royal Bank of Scotland Group plc, 7.64% Jr. Sub. Perpetual Bonds, Series U4,9 | | | 500,000 | | | | 525,000 | |
| | | | | | | | |
| | | Principal
Amount | | | Value | |
| |
| Commercial Banks (Continued) | | | | | | | | |
| |
| Societe Generale SA, 5.922% Jr. Sub. Perpetual Bonds2,4,9 | | | $ 440,000 | | | | $ 448,250 | |
| |
| SunTrust Banks, Inc., 3.50% Sr. Unsec. Nts., 1/20/17 | | | 227,000 | | | | 230,978 | |
| | | | | | | | |
| | | | | | | 6,093,265 | |
|
| |
| Consumer Finance—0.8% | | | | | | | | |
| |
| Ally Financial, Inc., 8% Sr. Unsec. Nts., 11/1/31 | | | 339,000 | | | | 392,816 | |
| |
| Capital One Financial Corp., 3.20% Sr. Unsec. Nts., 2/5/25 | | | 342,000 | | | | 331,426 | |
| |
| Discover Financial Services: | | | | | | | | |
| 3.75% Sr. Unsec. Nts., 3/4/25 | | | 338,000 | | | | 325,378 | |
| 3.95% Sr. Unsec. Nts., 11/6/24 | | | 331,000 | | | | 327,025 | |
| |
| Synchrony Financial: | | | | | | | | |
| 4.25% Sr. Unsec. Nts., 8/15/24 | | | 117,000 | | | | 115,636 | |
| 4.50% Sr. Unsec. Nts., 7/23/25 | | | 310,000 | | | | 310,028 | |
| | | | | | | | |
| | | | | | | 1,802,309 | |
|
| |
| Diversified Financial Services—0.5% | |
| |
| McGraw Hill Financial, Inc., 2.50% Sr. Unsec. Nts., 8/15/18 | | | 105,000 | | | | 105,730 | |
| |
| Nationwide Building Society, 3.90% Sr. Unsec. Nts., 7/21/252 | | | 410,000 | | | | 423,607 | |
| |
| Peachtree Corners Funding Trust, 3.976% Sr. Unsec. Nts., 2/15/252 | | | 221,000 | | | | 219,840 | |
| |
| Voya Financial, Inc., 5.65% Jr. Sub. Nts., 5/15/534 | | | 495,000 | | | | 490,050 | |
| | | | | | | | |
| | | | | | | 1,239,227 | |
|
| |
| Insurance—1.2% | | | | | | | | |
| |
| ACE INA Holdings, Inc.: | | | | | | | | |
| 3.35% Sr. Unsec. Nts., 5/3/26 | | | 200,000 | | | | 199,683 | |
| 4.35% Sr. Unsec. Nts., 11/3/45 | | | 160,000 | | | | 163,003 | |
| |
| AXIS Specialty Finance plc, 5.15% Sr. Unsec. Nts., 4/1/45 | | | 368,000 | | | | 362,263 | |
| |
| Five Corners Funding Trust, 4.419% Unsec. Nts., 11/15/232 | | | 374,000 | | | | 391,140 | |
| |
| Liberty Mutual Group, Inc., 4.25% Sr. Unsec. Nts., 6/15/232 | | | 543,000 | | | | 553,002 | |
| |
| MetLife, Inc., 5.25% Jr. Sub. Perpetual Bonds4,9 | | | 296,000 | | | | 301,920 | |
| |
| Prudential Financial, Inc., 5.20% Jr. Sub. Nts., 3/15/444 | | | 331,000 | | | | 320,822 | |
| |
| TIAA Asset Management Finance Co. LLC, 4.125% Sr. Unsec. Nts., 11/1/242 | | | 437,000 | | | | 439,529 | |
| |
| XLIT Ltd., 6.50% Jr. Sub. Perpetual Bonds4,9 | | | 243,000 | | | | 177,086 | |
| | | | | | | | |
| | | | | | | 2,908,448 | |
|
| |
| Real Estate Investment Trusts (REITs)—1.3% | |
| |
| American Tower Corp., 5.90% Sr. Unsec. Nts., 11/1/21 | | | 233,000 | | | | 259,881 | |
| |
| Corrections Corp. of America, 4.625% Sr. Unsec. Nts., 5/1/23 | | | 425,000 | | | | 412,250 | |
| |
| First Industrial LP, 7.50% Sr. Unsec. Nts., 12/1/17 | | | 360,000 | | | | 393,846 | |
| |
| HCP, Inc., 5.625% Sr. Unsec. Nts., 5/1/17 | | | 125,000 | | | | 130,790 | |
| |
| Highwoods Realty LP, 7.50% Sr. Unsec. Nts., 4/15/18 | | | 366,000 | | | | 404,730 | |
| |
| Host Hotels & Resorts LP, 3.75% Sr. Unsec. Nts., 10/15/23 | | | 244,000 | | | | 235,660 | |
| |
| Liberty Property LP, 5.50% Sr. Unsec. Nts., 12/15/16 | | | 268,000 | | | | 276,871 | |
| |
| Prologis LP, 4% Sr. Unsec. Nts., 1/15/18 | | | 219,000 | | | | 226,524 | |
| |
| Regency Centers LP, 5.875% Sr. Unsec. Nts., 6/15/17 | | | 36,000 | | | | 37,978 | |
| |
| Ventas Realty LP, 1.25% Sr. Unsec. Nts., 4/17/17 | | | 178,000 | | | | 176,754 | |
| |
| WEA Finance LLC/Westfield UK & Europe Finance plc, 1.75% Sr. Unsec. Nts., 9/15/172 | | | 369,000 | | | | 366,003 | |
| |
| Welltower, Inc., 2.25% Sr. Unsec. Nts., 3/15/18 | | | 88,000 | | | | 87,969 | |
| | | | | | | | |
| | | | | | | 3,009,256 | |
13 OPPENHEIMER CONSERVATIVE BALANCED FUND/VA
STATEMENT OF INVESTMENTS Continued
| | | | | | | | |
| | | Principal
Amount | | | Value | |
| |
| Real Estate Management & Development—0.2% | |
| |
| Brookfield Asset Management, Inc., 4% Sr. Unsec. Nts., 1/15/25 | | | $ 475,000 | | | | $ 464,896 | |
|
| |
| Health Care—1.8% | | | | | | | | |
| |
| Biotechnology—0.3% | | | | | | | | |
| |
| AbbVie, Inc.: | | | | | | | | |
| 3.60% Sr. Unsec. Nts., 5/14/25 | | | 208,000 | | | | 205,713 | |
| 4.70% Sr. Unsec. Nts., 5/14/45 | | | 83,000 | | | | 81,488 | |
| |
| Biogen, Inc., 5.20% Sr. Unsec. Nts., 9/15/45 | | | 110,000 | | | | 110,444 | |
| |
| Celgene Corp.: | | | | | | | | |
| 3.875% Sr. Unsec. Nts., 8/15/25 | | | 208,000 | | | | 207,752 | |
| 5.00% Sr. Unsec. Nts., 8/15/45 | | | 56,000 | | | | 56,430 | |
| | | | | | | | |
| | | | | | | 661,827 | |
|
| |
| Health Care Equipment & Supplies—0.5% | |
| |
| Becton Dickinson & Co.: | | | | | | | | |
| 1.45% Sr. Unsec. Nts., 5/15/17 | | | 453,000 | | | | 451,267 | |
| 3.875% Sr. Unsec. Nts., 5/15/24 | | | 221,000 | | | | 224,424 | |
| |
| DENTSPLY International, Inc., 2.75% Sr. Unsec. Nts., 8/15/16 | | | 425,000 | | | | 428,207 | |
| |
| Zimmer Biomet Holdings, Inc., 3.55% Sr. Unsec. Nts., 4/1/25 | | | 130,000 | | | | 126,639 | |
| | | | | | | | |
| | | | | | | 1,230,537 | |
| |
| Health Care Providers & Services—0.7% | |
| |
| Cardinal Health, Inc., 3.50% Sr. Unsec. Nts., 11/15/24 | | | 214,000 | | | | 214,762 | |
| |
| Fresenius Medical Care US Finance II, Inc., 5.875% Sr. Unsec. Nts., 1/31/222 | | | 422,000 | | | | 453,650 | |
| |
| Laboratory Corp. of America Holdings, 3.60% Sr. Unsec. Nts., 2/1/25 | | | 610,000 | | | | 589,790 | |
| |
| McKesson Corp., 4.883% Sr. Unsec. Nts., 3/15/44 | | | 180,000 | | | | 180,681 | |
| |
| Medco Health Solutions, Inc., 7.125% Sr. Unsec. Nts., 3/15/18 | | | 178,000 | | | | 196,882 | |
| | | | | | | | |
| | | | | | | 1,635,765 | |
|
| |
| Life Sciences Tools & Services—0.1% | | | | | |
| |
| Thermo Fisher Scientific, Inc.: | | | | | | | | |
| 2.15% Sr. Unsec. Nts., 12/14/18 | | | 156,000 | | | | 156,026 | |
| 4.15% Sr. Unsec. Nts., 2/1/24 | | | 144,000 | | | | 149,902 | |
| 5.30% Sr. Unsec. Nts., 2/1/44 | | | 40,000 | | | | 42,862 | |
| | | | | | | | |
| | | | | | | 348,790 | |
|
| |
| Pharmaceuticals—0.2% | | | | | | | | |
| |
| Actavis Funding SCS: | | | | | | | | |
| 3.80% Sr. Unsec. Nts., 3/15/25 | | | 277,000 | | | | 276,141 | |
| 4.75% Sr. Unsec. Nts., 3/15/45 | | | 136,000 | | | | 133,097 | |
| | | | | | | | |
| | | | | | | 409,238 | |
|
| |
| Industrials—2.2% | | | | | | | | |
| |
| Aerospace & Defense—0.5% | | | | | | | | |
| |
| BAE Systems Holdings, Inc., 3.85% Sr. Unsec. Nts., 12/15/252 | | | 292,000 | | | | 289,839 | |
| |
| L-3 Communications Corp.: | | | | | | | | |
| 1.50% Sr. Unsec. Nts., 5/28/17 | | | 118,000 | | | | 116,576 | |
| 3.95% Sr. Unsec. Nts., 11/15/16 | | | 145,000 | | | | 147,216 | |
| |
| Lockheed Martin Corp., 3.55% Sr. Unsec. Nts., 1/15/26 | | | 208,000 | | | | 209,498 | |
| |
| Northrop Grumman Corp., 4.75% Sr. Unsec. Nts., 6/1/43 | | | 200,000 | | | | 206,630 | |
| |
| Textron, Inc., 3.875% Sr. Unsec. Nts., 3/1/25 | | | 129,000 | | | | 126,825 | |
| | | | | | | | |
| | | | | | | 1,096,584 | |
|
| |
| Building Products—0.2% | |
| |
| Owens Corning, 4.20% Sr. Unsec. Nts., 12/15/22 | | | 505,000 | | | | 506,369 | |
|
| |
| Commercial Services & Supplies—0.2% | |
| |
| Pitney Bowes, Inc., 4.625% Sr. Unsec. Nts., 3/15/24 | | | 575,000 | | | | 564,507 | |
| | | | | | | | |
| | | Principal
Amount | | | Value | |
| |
| Electrical Equipment—0.1% | | | | | | | | |
| |
| Sensata Technologies BV, 4.875% Sr. Unsec. Nts., 10/15/232 | | | $ 349,000 | | | | $ 340,711 | |
|
| |
| Industrial Conglomerates—0.1% | | | | | | | | |
| |
| Roper Technologies, Inc., 3.85% Sr. Unsec. Nts., 12/15/25 | | | 192,000 | | | | 191,550 | |
|
| |
| Machinery—0.2% | | | | | | | | |
| |
| Crane Co., 4.45% Sr. Unsec. Nts., 12/15/23 | | | 234,000 | | | | 241,416 | |
| |
| Ingersoll-Rand Global Holding Co. Ltd., 4.25% Sr. Unsec. Nts., 6/15/23 | | | 120,000 | | | | 123,802 | |
| | | | | | | | |
| | | | | | | 365,218 | |
|
| |
| Marine—0.0% | | | | | | | | |
| |
| AP Moeller-Maersk, 3.875% Unsec. Nts., 9/28/252 | | | 43,000 | | | | 41,556 | |
|
| |
| Professional Services—0.2% | | | | | | | | |
| |
| Experian Finance plc, 2.375% Sr. Unsec. Nts., 6/15/172 | | | 427,000 | | | | 425,271 | |
|
| |
| Road & Rail—0.5% | | | | | | | | |
| |
| Canadian Pacific Railway Co., 4.80% Sr. Unsec. Nts., 9/15/35 | | | 76,000 | | | | 75,284 | |
| |
| ERAC USA Finance LLC, 4.50% Sr. Unsec. Nts., 2/15/452 | | | 126,000 | | | | 117,552 | |
| |
| Kansas City Southern, 3% Sr. Unsec. Nts., 5/15/232 | | | 141,000 | | | | 133,671 | |
| |
| Norfolk Southern Corp., 4.65% Sr. Unsec. Nts., 1/15/46 | | | 124,000 | | | | 118,953 | |
| |
| Penske Truck Leasing Co. LP/PTL Finance Corp.: | | | | | | | | |
| 2.50% Sr. Unsec. Nts., 3/15/162 | | | 187,000 | | | | 187,334 | |
| 3.75% Sr. Unsec. Nts., 5/11/172 | | | 220,000 | | | | 224,510 | |
| 4.25% Sr. Unsec. Nts., 1/17/232 | | | 250,000 | | | | 252,027 | |
| | | | | | | | |
| | | | | | | 1,109,331 | |
|
| |
| Trading Companies & Distributors—0.2% | |
| |
| Air Lease Corp., 3.875% Sr. Unsec. Nts., 4/1/21 | | | 456,000 | | | | 459,420 | |
|
| |
| Information Technology—1.4% | | | | | | | | |
| |
| Electronic Equipment, Instruments, & Components—0.4% | |
| |
| Arrow Electronics, Inc., 5.125% Sr. Unsec. Unsub. Nts., 3/1/21 | | | 525,000 | | | | 552,462 | |
| |
| Flextronics International Ltd., 4.75% Sr. Unsec. Nts., 6/15/252 | | | 330,000 | | | | 322,162 | |
| | | | | | | | |
| | | | | | | 874,624 | |
|
| |
| IT Services—0.3% | | | | | | | | |
| |
| Fidelity National Information Services, Inc., 1.45% | | | | | | | | |
| Sr. Unsec. Nts., 6/5/17 | | | 351,000 | | | | 346,384 | |
| |
| Visa, Inc., 4.30% Sr. Unsec. Nts., 12/14/45 | | | 141,000 | | | | 143,274 | |
| |
| Xerox Corp.: | | | | | | | | |
| 2.95% Sr. Unsec. Nts., 3/15/17 | | | 149,000 | | | | 150,156 | |
| 6.75% Sr. Unsec. Nts., 2/1/17 | | | 75,000 | | | | 78,614 | |
| | | | | | | | |
| | | | | | | 718,428 | |
|
| |
| Semiconductors & Semiconductor Equipment—0.0% | |
| |
| Intel Corp., 4.90% Sr. Unsec. Nts., 7/29/45 | | | 107,000 | | | | 113,378 | |
|
| |
| Software—0.4% | | | | | | | | |
| |
| Autodesk, Inc.: | | | | | | | | |
| 1.95% Sr. Unsec. Nts., 12/15/17 | | | 313,000 | | | | 312,120 | |
| 4.375% Sr. Unsec. Nts., 6/15/25 | | | 125,000 | | | | 123,082 | |
| |
| Open Text Corp., 5.625% Sr. Unsec. Nts., 1/15/232 | | | 174,000 | | | | 172,695 | |
| |
| Oracle Corp., 3.40% Sr. Unsec. Nts., 7/8/24 | | | 322,000 | | | | 327,502 | |
| | | | | | | | |
| | | | | | | 935,399 | |
|
| |
| Technology Hardware, Storage & Peripherals—0.3% | |
| |
| Apple, Inc., 4.375% Sr. Unsec. Nts., 5/13/45 | | | 227,000 | | | | 229,602 | |
| |
| Hewlett Packard Enterprise Co.: | | | | | | | | |
| 2.45% Sr. Unsec. Nts., 10/5/172 | | | 267,000 | | | | 266,900 | |
| 6.35% Sr. Unsec. Nts., 10/15/452 | | | 184,000 | | | | 175,235 | |
| | | | | | | | |
| | | | | | | 671,737 | |
14 OPPENHEIMER CONSERVATIVE BALANCED FUND/VA
| | | | | | | | |
| | | Principal
Amount | | | Value | |
| |
| Materials—1.4% | | | | | | | | |
| |
| Chemicals—0.6% | | | | | | | | |
| |
| Agrium, Inc.: | | | | | | | | |
| 3.375% Sr. Unsec. Nts., 3/15/25 | | | $ 174,000 | | | | $ 159,149 | |
| 4.125% Sr. Unsec. Nts., 3/15/35 | | | 87,000 | | | | 74,235 | |
| |
| Eastman Chemical Co., 4.65% Sr. Unsec. Nts., 10/15/44 | | | 112,000 | | | | 99,729 | |
| |
| LYB International Finance BV, 5.25% Sr. Unsec. Nts., 7/15/43 | | | 144,000 | | | | 138,656 | |
| |
| Methanex Corp., 4.25% Sr. Unsec. Nts., 12/1/24 | | | 256,000 | | | | 227,543 | |
| |
| RPM International, Inc., 3.45% Sr. Unsec. Unsub. Nts., 11/15/22 | | | 378,000 | | | | 363,204 | |
| |
| Valspar Corp. (The): | | | | | | | | |
| 3.30% Sr. Unsec. Nts., 2/1/25 | | | 122,000 | | | | 116,486 | |
| 3.95% Sr. Unsec. Nts., 1/15/26 | | | 174,000 | | | | 173,318 | |
| | | | | | | | |
| | | | | | | 1,352,320 | |
|
| |
| Construction Materials—0.3% | | | | | | | | |
| |
| CRH America, Inc., 5.125% Sr. Unsec. Nts., 5/18/452 | | | 282,000 | | | | 283,222 | |
| |
| James Hardie International Finance Ltd., 5.875% Sr. Unsec. Nts., 2/15/232 | | | 421,000 | | | | 431,525 | |
| | | | | | | | |
| | | | | | | 714,747 | |
|
| |
| Containers & Packaging—0.2% | | | | | | | | |
| |
| Packaging Corp. of America: | | | | | | | | |
| 3.65% Sr. Unsec. Nts., 9/15/24 | | | 113,000 | | | | 110,071 | |
| 4.50% Sr. Unsec. Nts., 11/1/23 | | | 358,000 | | | | 376,692 | |
| | | | | | | | |
| | | | | | | 486,763 | |
| |
| Metals & Mining—0.3% | | | | | | | | |
| |
| Carpenter Technology Corp., 4.45% Sr. Unsec. Unsub. Nts., 3/1/23 | | | 159,000 | | | | 153,059 | |
| |
| Glencore Finance Canada Ltd., 3.60% Sr. Unsec. Nts., 1/15/172 | | | 348,000 | | | | 336,251 | |
| |
| Glencore Funding LLC, 4.625% Sr. Unsec. Nts., 4/29/242 | | | 75,000 | | | | 54,839 | |
| |
| Goldcorp, Inc., 5.45% Sr. Unsec. Nts., 6/9/44 | | | 116,000 | | | | 93,489 | |
| | | | | | | | |
| | | | | | | 637,638 | |
|
| |
| Paper & Forest Products—0.0% | | | | | | | | |
| |
| International Paper Co., 4.80% Sr. Unsec. Nts., 6/15/44 | | | 183,000 | | | | 166,970 | |
|
| |
| Telecommunication Services—1.6% | | | | | |
| |
| Diversified Telecommunication Services—1.5% | |
| |
| AT&T, Inc., 4.35% Sr. Unsec. Nts., 6/15/45 | | | 614,000 | | | | 529,719 | |
| |
| British Telecommunications plc, 9.625% Sr. Unsec. Nts., 12/15/30 | | | 288,000 | | | | 421,641 | |
| |
| Deutsche Telekom International Finance BV, 5.75% Sr. Unsec. Nts., 3/23/16 | | | 402,000 | | | | 405,734 | |
| |
| DIRECTV Holdings LLC/DIRECTV Financing Co., Inc., 5.15% Sr. Unsec. Nts., 3/15/42 | | | 65,000 | | | | 60,769 | |
| |
| Orange SA, 2.75% Sr. Unsec. Nts., 9/14/16 | | | 111,000 | | | | 112,263 | |
| |
| Telecom Italia Capital SA, 7.721% Sr. Unsec. | | | | | | | | |
| Unsub. Nts., 6/4/38 | | | 277,000 | | | | 290,158 | |
| |
| Telefonica Emisiones SAU: | | | | | | | | |
| 3.192% Sr. Unsec. Nts., 4/27/18 | | | 397,000 | | | | 404,972 | |
| 7.045% Sr. Unsec. Unsub. Nts., 6/20/36 | | | 169,000 | | | | 203,732 | |
| |
| Verizon Communications, Inc.: | | | | | | | | |
| 3.50% Sr. Unsec. Nts., 11/1/24 | | | 189,000 | | | | 187,119 | |
| 4.50% Sr. Unsec. Nts., 9/15/20 | | | 522,000 | | | | 561,513 | |
| 4.522% Sr. Unsec. Nts., 9/15/48 | | | 288,000 | | | | 258,571 | |
| 5.012% Sr. Unsec. Nts., 8/21/54 | | | 105,000 | | | | 96,507 | |
| | | | | | | | |
| | | | | | | 3,532,698 | |
|
| |
| Wireless Telecommunication Services—0.1% | |
| |
| Rogers Communications, Inc., 3.625% Sr. Unsec. Nts., 12/15/25 | | | 77,000 | | | | 75,902 | |
| | | | | | | | |
| | | Principal
Amount | | | Value | |
| |
| Utilities—2.2% | | | | | | | | |
| |
| Electric Utilities—1.5% | | | | | | | | |
| |
| AEP Texas Central Co., 3.85% Sr. Unsec. Nts., 10/1/252 | | | $ 198,000 | | | | $ 200,642 | |
| |
| American Transmission Systems, Inc., 5% Sr. Unsec. Nts., 9/1/442 | | | 118,000 | | | | 118,698 | |
| |
| EDP Finance BV, 5.25% Sr. Unsec. Nts., 1/14/212 | | | 375,000 | | | | 388,536 | |
| |
| Enel Finance International NV, 6.25% Sr. Unsec. Nts., 9/15/172 | | | 389,000 | | | | 414,681 | |
| |
| ITC Holdings Corp., 5.30% Sr. Unsec. Nts., 7/1/43 | | | 93,000 | | | | 95,571 | |
| |
| NextEra Energy Capital Holdings, Inc., 1.586% Sr. Unsec. Nts., 6/1/17 | | | 419,000 | | | | 417,636 | |
| |
| Pennsylvania Electric Co., 5.20% Sr. Unsec. Nts., 4/1/20 | | | 88,000 | | | | 93,917 | |
| |
| PPL Capital Funding, Inc., 3.50% Sr. Unsec. Unsub. Nts., 12/1/22 | | | 158,000 | | | | 159,478 | |
| |
| PPL WEM Ltd./Western Power Distribution Ltd., 5.375% Sr. Unsec. Unsub. Nts., 5/1/212 | | | 600,000 | | | | 655,455 | |
| |
| Public Service Co. of New Mexico, 7.95% Sr. Unsec. Nts., 5/15/18 | | | 347,000 | | | | 388,563 | |
| |
| Southern Power Co., 1.85% Sr. Unsec. Nts., 12/1/17 | | | 373,000 | | | | 373,003 | |
| |
| Trans-Allegheny Interstate Line Co., 3.85% Sr. Unsec. Nts., 6/1/252 | | | 277,000 | | | | 277,589 | |
| | | | | | | | |
| | | | | | | 3,583,769 | |
|
| |
| Independent Power and Renewable Electricity Producers—0.1% | |
| |
| Dayton Power & Light Co. (The), 1.875% Sec. Nts., 9/15/16 | | | 329,000 | | | | 329,335 | |
|
| |
| Multi-Utilities—0.6% | | | | | | | | |
| |
| CenterPoint Energy, Inc., 5.95% Sr. Unsec. Nts., 2/1/17 | | | 386,000 | | | | 402,832 | |
| |
| CMS Energy Corp., 3.875% Sr. Unsec. Nts., 3/1/24 | | | 240,000 | | | | 244,167 | |
| |
| Consolidated Edison Co. of New York, Inc., 4.625% Sr. Unsec. Nts., 12/1/54 | | | 100,000 | | | | 98,576 | |
| |
| Dominion Gas Holdings LLC, 4.60% Sr. Unsec. Nts., 12/15/44 | | | 170,000 | | | | 158,502 | |
| |
| NiSource Finance Corp., 4.80% Sr. Unsec. Nts., 2/15/44 | | | 179,000 | | | | 182,500 | |
| |
| Puget Energy, Inc., 3.65% Sec. Nts., 5/15/252 | | | 206,000 | | | | 200,091 | |
| | | | | | | | |
| | | | | | | 1,286,668 | |
| | | | | | | | |
| Total Non-Convertible Corporate Bonds and Notes (Cost $70,806,545) | | | | | | | 70,339,321 | |
| | |
| | | Shares | | | | |
| |
Investment Company—2.3% | | | | | | | | |
| |
| Oppenheimer Institutional Money Market Fund, Cl. E, 0.30%10,11 (Cost $5,367,607) | | | 5,367,607 | | | | 5,367,607 | |
|
| |
| Total Investments, at Value (Cost $241,877,606) | | | 106.9 | % | | | 250,779,549 | |
| |
| Net Other Assets (Liabilities) | | | (6.9 | ) | | | (16,147,851) | |
| | | | |
| Net Assets | | | 100.0 | % | | | $ 234,631,698 | |
| | | | |
15 OPPENHEIMER CONSERVATIVE BALANCED FUND/VA
STATEMENT OF INVESTMENTS Continued
Footnotes to Statement of Investments
1. Non-income producing security.
2. Represents securities sold under Rule 144A, which are exempt from registration under the Securities Act of 1933, as amended. These securities have been determined to be liquid under guidelines established by the Board of Trustees. These securities amount to $40,471,024 or 17.25% of the Fund’s net assets at period end.
3. Restricted security. The aggregate value of restricted securities at period end was $711,113, which represents 0.30% of the Fund’s net assets. See Note 4 of the accompanying Notes. Information concerning restricted securities is as follows:
| | | | | | | | | | | | | | | | |
Security | | Acquisition Dates | | | Cost | | | Value | | | Unrealized Depreciation | |
| |
American Credit Acceptance Receivables Trust, Series
2015-3, Cl. B, 3.56%, 10/12/21 | | | 9/30/15 | | | $ | 359,964 | | | $ | 357,615 | | | $ | 2,349 | |
Banc of America Funding Trust, Series 2014-R7, Cl.
3A1, 2.763%, 3/26/36 | | | 3/6/15-5/13/15 | | | | 355,307 | | | | 353,498 | | | | 1,809 | |
| | | | | | | | |
| | | | | | $ | 715,271 | | | $ | 711,113 | | | $ | 4,158 | |
| | | | | | | | |
4. Represents the current interest rate for a variable or increasing rate security.
5. Interest-Only Strips represent the right to receive the monthly interest payments on an underlying pool of mortgage loans. These securities typically decline in price as interest rates decline. Most other fixed income securities increase in price when interest rates decline. The principal amount of the underlying pool represents the notional amount on which current interest is calculated. The price of these securities is typically more sensitive to changes in prepayment rates than traditional mortgage-backed securities (for example, GNMA pass-throughs). Interest rates disclosed represent current yields based upon the current cost basis and estimated timing and amount of future cash flows. These securities amount to $1,824,133 or 0.78% of the Fund’s net assets at period end.
6. Principal-Only Strips represent the right to receive the monthly principal payments on an underlying pool of mortgage loans. The value of these securities generally increases as interest rates decline and prepayment rates rise. The price of these securities is typically more volatile than that of coupon-bearing bonds of the same maturity. Interest rates disclosed represent current yields based upon the current cost basis and estimated timing of future cash flows. These securities amount to $84,525 or 0.04% of the Fund’s net assets at period end.
7. Interest rate is less than 0.0005%.
8. All or a portion of the security position is when-issued or delayed delivery to be delivered and settled after period end. See Note 4 of the accompanying Notes.
9. This bond has no contractual maturity date, is not redeemable and contractually pays an indefinite stream of interest.
10. Rate shown is the 7-day yield at period end.
11. Is or was an affiliate, as defined in the Investment Company Act of 1940, as amended, at or during the reporting period, by virtue of the Fund owning at least 5% of the voting securities of the issuer or as a result of the Fund and the issuer having the same investment adviser. Transactions during the reporting period in which the issuer was an affiliate are as follows:
| | | | | | | | | | | | | | | | |
| | | Shares December 31, 2014 | | | Gross Additions | | | Gross Reductions | | | Shares December 31, 2015 | |
| |
| Oppenheimer Institutional Money Market Fund, Cl. E | | | 5,367,607 | | | | — | | | | — | | | | 5,367,607 | |
| | | | |
| | | | | | | | | Value | | | Income | |
| |
| Oppenheimer Institutional Money Market Fund, Cl. E | | | | | | | | | | $ | 5,367,607 | | | $ | 8,298 | |
| | | | | | | | | | | | | | | | | | | | | | | | |
| Futures Contracts as of December 31, 2015 | |
| | | | | | |
| Description | | Exchange | | | Buy/Sell | | | Expiration Date | | | Number of Contracts | | | Value | | | Unrealized
Appreciation (Depreciation) | |
| |
United States Treasury Long Bonds | | | CBT | | | | Sell | | | | 3/21/16 | | | | 8 | | | $ | 1,230,000 | | | $ | 10,924 | |
United States Treasury Nts., 2 yr. | | | CBT | | | | Buy | | | | 3/31/16 | | | | 34 | | | | 7,385,969 | | | | (9,129) | |
United States Treasury Nts., 5 yr. | | | CBT | | | | Buy | | | | 3/31/16 | | | | 28 | | | | 3,312,969 | | | | (11,600) | |
United States Treasury Nts., 10 yr. | | | CBT | | | | Sell | | | | 3/21/16 | | | | 14 | | | | 1,762,688 | | | | 9,859 | |
United States Ultra Bonds | | | CBT | | | | Buy | | | | 3/21/16 | | | | 50 | | | | 7,934,375 | | | | 26,591 | |
| | | | | | | | | | | | | | | | | | | | | | | | |
| | | | | | | | | | | | | | | | | | | | | | $ | 26,645 | |
| | | | | | | | | | | | | | | | | | | | | | | | |
Glossary:
Exchange Abbreviations
| | |
| CBT | | Chicago Board of Trade |
See accompanying Notes to Financial Statements.
16 OPPENHEIMER CONSERVATIVE BALANCED FUND/VA
STATEMENT OF ASSETS AND LIABILITIES December 31, 2015
| | | | |
| |
Assets | | | | |
Investments, at value—see accompanying statement of investments: | | | | |
Unaffiliated companies (cost $236,509,999) | | $ | 245,411,942 | |
Affiliated companies (cost $5,367,607) | | | 5,367,607 | |
| | | | |
| | | 250,779,549 | |
| |
Cash | | | 25,063,100 | |
| |
Cash used for collateral on futures | | | 260,000 | |
| |
Receivables and other assets: | | | | |
Investments sold (including $1,746,142 sold on a when-issued or delayed delivery basis) | | | 2,154,301 | |
Interest, dividends and principal paydowns | | | 1,034,151 | |
Variation margin receivable | | | 55,531 | |
Shares of beneficial interest sold | | | 14,843 | |
Other | | | 37,613 | |
| | | | |
Total assets | | | 279,399,088 | |
|
| |
Liabilities | | | | |
Payables and other liabilities: | | | | |
Investments purchased on a when-issued or delayed delivery basis | | | 44,394,738 | |
Shares of beneficial interest redeemed | | | 251,096 | |
Trustees’ compensation | | | 32,493 | |
Shareholder communications | | | 11,800 | |
Distribution and service plan fees | | | 11,438 | |
Variation margin payable | | | 10,502 | |
Other | | | 55,323 | |
| | | | |
Total liabilities | | | 44,767,390 | |
|
| |
Net Assets | | $ | 234,631,698 | |
| | | | |
| | | | |
|
| |
Composition of Net Assets | | | | |
| Par value of shares of beneficial interest | | $ | 16,271 | |
| |
| Additional paid-in capital | | | 232,833,337 | |
| |
| Accumulated net investment income | | | 5,254,734 | |
| |
| Accumulated net realized loss on investments and foreign currency transactions | | | (12,398,289) | |
| |
| Net unrealized appreciation on investments and translation of assets and liabilities denominated in foreign currencies | | | 8,925,645 | |
| | | | |
| |
Net Assets | | $ | 234,631,698 | |
| | | | |
| | | | |
| |
Net Asset Value Per Share | | | | |
| |
Non-Service Shares: | | | | |
| Net asset value, redemption price per share and offering price per share (based on net assets of $182,405,527 and 12,613,126 shares of beneficial interest outstanding) | | $ | 14.46 | |
| |
| |
| Service Shares: | | | | |
| Net asset value, redemption price per share and offering price per share (based on net assets of $52,226,171 and 3,658,028 shares of beneficial interest outstanding) | | $ | 14.28 | |
See accompanying Notes to Financial Statements.
17 OPPENHEIMER CONSERVATIVE BALANCED FUND/VA
STATEMENT OF OPERATIONS For the Year Ended December 31, 2015
| | | | |
| |
Investment Income | | | | |
| Interest: | | $ | 5,479,918 | |
| |
| Dividends: | | | | |
| Unaffiliated companies (net of foreign withholding taxes of $8,401) | | | 1,503,044 | |
| Affiliated companies | | | 8,298 | |
| | | | |
| Total investment income | | | 6,991,260 | |
| | | | |
| |
Expenses | | | | |
| Management fees | | | 1,884,550 | |
| |
| Distribution and service plan fees—Service shares | | | 147,790 | |
| |
| Transfer and shareholder servicing agent fees: | | | | |
| Non-Service shares | | | 194,298 | |
| Service shares | | | 59,112 | |
| |
| Shareholder communications: | | | | |
| Non-Service shares | | | 33,355 | |
| Service shares | | | 10,169 | |
| |
| Borrowing fees | | | 1,814 | |
| |
| Custodian fees and expenses | | | 48,564 | |
| |
| Trustees’ compensation | | | 14,708 | |
| |
| Other | | | 69,595 | |
| | | | |
| Total expenses | | | 2,463,955 | |
| Less reduction to custodian expenses | | | (1,474) | |
| Less waivers and reimbursements of expenses | | | (614,960) | |
| | | | |
Net expenses | | | 1,847,521 | |
| |
| Net Investment Income | | | 5,143,739 | |
|
| |
Realized and Unrealized Gain (Loss) | | | | |
| Net realized gain (loss) on: | | | | |
| Investments from unaffiliated companies | | | 8,527,872 | |
| Closing and expiration of futures contracts | | | (514,594) | |
| Foreign currency transactions | | | (1,786) | |
| | | | |
| Net realized gain | | | 8,011,492 | |
| |
| Net change in unrealized appreciation/depreciation on: | | | | |
| Investments | | | (10,802,314) | |
| Translation of assets and liabilities denominated in foreign currencies | | | 189,788 | |
| Futures contracts | | | (276,896) | |
| | | | |
| Net change in unrealized appreciation/depreciation | | | (10,889,422) | |
| | | | |
| |
| Net Increase in Net Assets Resulting from Operations | | $ | 2,265,809 | |
| | | | |
See accompanying Notes to Financial Statements.
18 OPPENHEIMER CONSERVATIVE BALANCED FUND/VA
STATEMENTS OF CHANGES IN NET ASSETS
| | | | | | | | |
| | | Year Ended
December 31, 2015 | | | Year Ended
December 31, 2014 | |
| |
Operations | | | | | | | | |
Net investment income | | $ | 5,143,739 | | | $ | 5,395,256 | |
| |
Net realized gain | | | 8,011,492 | | | | 12,573,539 | |
| |
Net change in unrealized appreciation/depreciation | | | (10,889,422) | | | | 3,629,766 | |
| | | | | | | | |
Net increase in net assets resulting from operations | | | 2,265,809 | | | | 21,598,561 | |
|
| |
Dividends and/or Distributions to Shareholders | | | | | | | | |
Dividends from net investment income: | | | | | | | | |
Non-Service shares | | | (4,370,338) | | | | (4,273,013) | |
Service shares | | | (1,196,499) | | | | (1,173,553) | |
| | | | |
| | | (5,566,837) | | | | (5,446,566) | |
|
| |
Beneficial Interest Transactions | | | | | | | | |
Net decrease in net assets resulting from beneficial interest transactions: | | | | | | | | |
Non-Service shares | | | (18,739,351) | | | | (22,300,027) | |
Service shares | | | (10,891,668) | | | | (9,586,563) | |
| | | | | | | | |
| | | (29,631,019) | | | | (31,886,590) | |
| | | | | | | | |
| |
Net Assets | | | | | | | | |
Total decrease | | | (32,932,047) | | | | (15,734,595) | |
| |
Beginning of period | | | 267,563,745 | | | | 283,298,340 | |
| | | | | | | | |
| End of period (including accumulated net investment income of $ 5,254,734 and $ 5,500,006, respectively) | | $ | 234,631,698 | | | $ | 267,563,745 | |
| | | | |
See accompanying Notes to Financial Statements.
19 OPPENHEIMER CONSERVATIVE BALANCED FUND/VA
FINANCIAL HIGHLIGHTS
| | | | | | | | | | | | | | | | | | | | |
| Non-Service Shares | | Year Ended
December
31, 2015 | | | Year Ended
December
31, 2014 | | | Year Ended
December
31, 2013 | | | Year Ended
December
31, 2012 | | | Year Ended
December
30, 20111 | |
| |
Per Share Operating Data | | | | | | | | | | | | | | | | | | | | |
Net asset value, beginning of period | | $ | 14.67 | | | $ | 13.84 | | | $ | 12 .52 | | | $ | 11 .30 | | | $ | 11 .47 | |
| |
Income (loss) from investment operations: | | | | | | | | | | | | | | | | | | | | |
Net investment income2 | | | 0 .31 | | | | 0 .29 | | | | 0 .25 | | | | 0 .29 | | | | 0 .20 | |
Net realized and unrealized gain (loss) | | | (0 .18) | | | | 0 .83 | | | | 1 .38 | | | | 1 .09 | | | | (0 .11) | |
| | | | |
Total from investment operations | | | 0 .13 | | | | 1 .12 | | | | 1 .63 | | | | 1 .38 | | | | 0 .09 | |
| |
Dividends and/or distributions to shareholders: | | | | | | | | | | | | | | | | | | | | |
Dividends from net investment income | | | (0 .34) | | | | (0 .29) | | | | (0 .31) | | | | (0 .16) | | | | (0 .26) | |
| |
Net asset value, end of period | | $ | 14 .46 | | | $ | 14 .67 | | | $ | 13 .84 | | | $ | 12.52 | | | $ | 11.30 | |
| | | | |
|
| |
Total Return, at Net Asset Value3 | | | 0 .83% | | | | 8 .20% | | | | 13 .17% | | | | 12 .34% | | | | 0 .72% | |
|
| |
Ratios/Supplemental Data | | | | | | | | | | | | | | | | | | | | |
Net assets, end of period (in thousands) | | $ | 182,406 | | | $ | 203,684 | | | $ | 213,697 | | | $ | 218,032 | | | $ | 128,383 | |
| |
Average net assets (in thousands) | | $ | 194,208 | | | $ | 208,556 | | | $ | 218,090 | | | $ | 191,416 | | | $ | 141,848 | |
| |
Ratios to average net assets:4 | | | | | | | | | | | | | | | | | | | | |
Net investment income | | | 2 .09% | | | | 2 .03% | | | | 1 .87% | | | | 2 .46% | | | | 1 .70% | |
Expenses excluding interest and fees from borrowings | | | 0 .91% | | | | 0 .90% | | | | 0 .89% | | | | 0 .90% | | | | 0 .91% | |
| Interest and fees from borrowings | | | 0 .00%5 | | | | 0 .00% | | | | 0 .00% | | | | 0 .00% | | | | 0 .00% | |
| | | | |
Total expenses6 | | | 0 .91% | | | | 0 .90% | | | | 0 .89% | | | | 0 .90% | | | | 0 .91% | |
| Expenses after payments, waivers and/or reimbursements and reduction to custodian expenses | | | 0 .67% | | | | 0 .67% | | | | 0 .66% | | | | 0 .66% | | | | 0 .67% | |
| |
Portfolio turnover rate7 | | | 68% | | | | 98% | | | | 187% | | | | 110% | | | | 102% | |
1. December 30, 2011 represents the last business day of the Fund’s reporting period. See Note 2 of the accompanying Notes.
2. Per share amounts calculated based on the average shares outstanding during the period.
3. Assumes an initial investment on the business day before the first day of the fiscal period, with all dividends and distributions reinvested in additional shares on the reinvestment date, and redemption at the net asset value calculated on the last business day of the fiscal period. Total returns are not annualized for periods less than one full year. Total return information does not reflect expenses that apply at the separate account level or to related insurance products. Inclusion of these charges would reduce the total return figures for all periods shown. Returns do not reflect the deduction of taxes that a shareholder would pay on fund distributions or the redemption of fund shares.
4. Annualized for periods less than one full year.
5. Less than 0.005%.
6. Total expenses including indirect expenses from affiliated fund fees and expenses were as follows:
| | | | |
Year Ended December 31, 2015 | | | 0.91 | % |
Year Ended December 31, 2014 | | | 0.90 | % |
Year Ended December 31, 2013 | | | 0.90 | % |
Year Ended December 31, 2012 | | | 0.91 | % |
Year Ended December 30, 2011 | | | 0.93 | % |
7. The portfolio turnover rate excludes purchase and sale transactions of To Be Announced (TBA) mortgage-related securities as follows:
| | | | | | | | | | |
| | | | | Purchase Transactions | | | Sale Transactions | |
| | | |
| | Year Ended December 31, 2015 | | | $829,988,104 | | | | $849,696,153 | |
| | Year Ended December 31, 2014 | | | $697,503,637 | | | | $678,765,376 | |
| | Year Ended December 31, 2013 | | | $794,398,216 | | | | $800,879,825 | |
| | Year Ended December 31, 2012 | | | $555,111,600 | | | | $549,805,766 | |
| | Year Ended December 30, 2011 | | | $450,804,195 | | | | $453,759,282 | |
See accompanying Notes to Financial Statements.
20 OPPENHEIMER CONSERVATIVE BALANCED FUND/VA
| | | | | | | | | | | | | | | | | | | | |
| Service Shares | | Year Ended December 31, 2015 | | | Year Ended December 31, 2014 | | | Year Ended December 31, 2013 | | | Year Ended December 31, 2012 | | | Year Ended December 30, 20111 | |
| |
Per Share Operating Data | | | | | | | | | | | | | | | | | | | | |
Net asset value, beginning of period | | $ | 14.49 | | | $ | 13.66 | | | $ | 12.37 | | | $ | 11.17 | | | $ | 11.35 | |
| |
Income (loss) from investment operations: | | | | | | | | | | | | | | | | | | | | |
Net investment income2 | | | 0 .27 | | | | 0 .25 | | | | 0 .21 | | | | 0 .26 | | | | 0 .16 | |
Net realized and unrealized gain (loss) | | | (0 .18) | | | | 0 .84 | | | | 1 .36 | | | | 1 .08 | | | | (0 .11) | |
| | | | |
Total from investment operations | | | 0 .09 | | | | 1 .09 | | | | 1 .57 | | | | 1 .34 | | | | 0 .05 | |
| |
Dividends and/or distributions to shareholders: | | | | | | | | | | | | | | | | | | | | |
Dividends from net investment income | | | (0 .30) | | | | (0 .26) | | | | (0 .28) | | | | (0 .14) | | | | (0 .23) | |
| |
Net asset value, end of period | | $ | 14 .28 | | | $ | 14 .49 | | | $ | 13.66 | | | $ | 12.37 | | | $ | 11.17 | |
| | | | |
|
| |
Total Return, at Net Asset Value3 | | | 0 .57% | | | | 8 .02% | | | | 12 .83% | | | | 12 .11% | | | | 0 .38% | |
|
| |
Ratios/Supplemental Data | | | | | | | | | | | | | | | | | | | | |
Net assets, end of period (in thousands) | | $ | 52,226 | | | $ | 63,880 | | | $ | 69,601 | | | $ | 72,872 | | | $ | 77,551 | |
| |
Average net assets (in thousands) | | $ | 59,085 | | | $ | 65,450 | | | $ | 72,332 | | | $ | 76,257 | | | $ | 85,157 | |
| |
Ratios to average net assets:4 | | | | | | | | | | | | | | | | | | | | |
Net investment income | | | 1 .84% | | | | 1 .78% | | | | 1 .62% | | | | 2 .18% | | | | 1 .45% | |
Expenses excluding interest and fees from borrowings | | | 1 .16% | | | | 1 .15% | | | | 1 .15% | | | | 1 .16% | | | | 1 .16% | |
Interest and fees from borrowings | | | 0 .00%5 | | | | 0 .00% | | | | 0 .00% | | | | 0 .00% | | | | 0 .00% | |
| | | | |
Total expenses6 | | | 1 .16% | | | | 1 .15% | | | | 1 .15% | | | | 1 .16% | | | | 1 .16% | |
| Expenses after payments, waivers and/or reimbursements and reduction to custodian expenses | | | 0 .92% | | | | 0 .92% | | | | 0 .92% | | | | 0 .92% | | | | 0 .92% | |
| |
Portfolio turnover rate7 | | | 68% | | | | 98% | | | | 187% | | | | 110% | | | | 102% | |
1. December 30, 2011 represents the last business day of the Fund’s reporting period. See Note 2 of the accompanying Notes.
2. Per share amounts calculated based on the average shares outstanding during the period.
3. Assumes an initial investment on the business day before the first day of the fiscal period, with all dividends and distributions reinvested in additional shares on the reinvestment date, and redemption at the net asset value calculated on the last business day of the fiscal period. Total returns are not annualized for periods less than one full year. Total return information does not reflect expenses that apply at the separate account level or to related insurance products. Inclusion of these charges would reduce the total return figures for all periods shown. Returns do not reflect the deduction of taxes that a shareholder would pay on fund distributions or the redemption of fund shares.
4. Annualized for periods less than one full year.
5. Less than 0.005%.
6. Total expenses including indirect expenses from affiliated fund fees and expenses were as follows:
| | | | |
Year Ended December 31, 2015 | | | 1.16 | % |
Year Ended December 31, 2014 | | | 1.15 | % |
Year Ended December 31, 2013 | | | 1.16 | % |
Year Ended December 31, 2012 | | | 1.17 | % |
Year Ended December 30, 2011 | | | 1.18 | % |
7. The portfolio turnover rate excludes purchase and sale transactions of To Be Announced (TBA) mortgage-related securities as follows:
| | | | | | | | | | |
| | | | | Purchase Transactions | | | Sale Transactions | |
| | | |
| | Year Ended December 31, 2015 | | | $829,988,104 | | | | $849,696,153 | |
| | Year Ended December 31, 2014 | | | $697,503,637 | | | | $678,765,376 | |
| | Year Ended December 31, 2013 | | | $794,398,216 | | | | $800,879,825 | |
| | Year Ended December 31, 2012 | | | $555,111,600 | | | | $549,805,766 | |
| | Year Ended December 30, 2011 | | | $450,804,195 | | | | $453,759,282 | |
See accompanying Notes to Financial Statements.
21 OPPENHEIMER CONSERVATIVE BALANCED FUND/VA
NOTES TO FINANCIAL STATEMENTS December 31, 2015
1. Organization
Oppenheimer Conservative Balanced Fund/VA (the “Fund”), formerly named Oppenheimer Capital Income Fund/VA, (the “Fund”), a separate series of Oppenheimer Variable Account Funds, is a diversified open-end management investment company registered under the Investment Company Act of 1940 (“1940 Act”), as amended. The Fund’s investment objective is to seek total return. The Fund’s investment adviser is OFI Global Asset Management, Inc. (“OFI Global” or the “Manager”), a wholly-owned subsidiary of OppenheimerFunds, Inc. (“OFI” or the “Sub-Adviser”). The Manager has entered into a sub-advisory agreement with OFI. Shares of the Fund are sold only to separate accounts of life insurance companies.
The Fund offers two classes of shares. Both classes are sold at their offering price, which is the net asset value per share, to separate investment accounts of participating insurance companies as an underlying investment for variable life insurance policies, variable annuity contracts or other investment products. The class of shares designated as Service shares is subject to a distribution and service plan. Both classes of shares have identical rights and voting privileges with respect to the Fund in general and exclusive voting rights on matters that affect that class alone. Earnings, net assets and net asset value per share may differ due to each class having its own expenses, such as transfer and shareholder servicing agent fees and shareholder communications, directly attributable to that class.
The following is a summary of significant accounting policies followed in the Fund’s preparation of financial statements in accordance with accounting principles generally accepted in the United States (“U.S. GAAP”).
2. Significant Accounting Policies
Security Valuation. All investments in securities are recorded at their estimated fair value, as described in Note 3.
Reporting Period End Date. The last day of the Fund’s reporting period is the last day the New York Stock Exchange was open for trading during the period. The Fund’s financial statements have been presented through that date to maintain consistency with the Fund’s net asset value calculations used for shareholder transactions.
Foreign Currency Translation. The Fund’s accounting records are maintained in U.S. dollars. The values of securities denominated in foreign currencies and amounts related to the purchase and sale of foreign securities and foreign investment income are translated into U.S. dollars as of the close of the New York Stock Exchange (the “Exchange”), normally 4:00 P.M. Eastern time, on each day the Exchange is open for trading. Foreign exchange rates may be valued primarily using a reliable bank, dealer or service authorized by the Board of Trustees.
Reported net realized gains and losses from foreign currency transactions arise from sales of portfolio securities, sales and maturities of short-term securities, sales of foreign currencies, exchange rate fluctuations between the trade and settlement dates on securities transactions, and the difference between the amounts of dividends, interest, and foreign withholding taxes recorded on the Fund’s books and the U.S. dollar equivalent of the amounts actually received or paid. Net unrealized appreciation and depreciation on the translation of assets and liabilities denominated in foreign currencies arise from changes in the values of assets and liabilities, including investments in securities at fiscal period end, resulting from changes in exchange rates.
The effect of changes in foreign currency exchange rates on investments is separately identified from the fluctuations arising from changes in market values of securities held and reported with all other foreign currency gains and losses in the Fund’s Statement of Operations.
Allocation of Income, Expenses, Gains and Losses. Income, expenses (other than those attributable to a specific class), gains and losses are allocated on a daily basis to each class of shares based upon the relative proportion of net assets represented by such class. Operating expenses directly attributable to a specific class are charged against the operations of that class.
Dividends and Distributions to Shareholders. Dividends and distributions to shareholders, which are determined in accordance with income tax regulations and may differ from U.S. GAAP, are recorded on the ex-dividend date. Income and capital gain distributions, if any, are declared and paid annually or at other times as deemed necessary by the Manager.
Investment Income. Dividend income is recorded on the ex-dividend date or upon ex-dividend notification in the case of certain foreign dividends where the ex-dividend date may have passed. Non-cash dividends included in dividend income, if any, are recorded at the fair market value of the securities received. Interest income is recognized on an accrual basis. Discount and premium, which are included in interest income on the Statement of Operations, are amortized or accreted daily.
Return of Capital Estimates. Distributions received from the Fund’s investments in Master Limited Partnerships (MLPs) and Real Estate Investments Trusts (REITs), generally are comprised of income and return of capital. The Fund records investment income and return of capital based on estimates. Such estimates are based on historical information available from each MLP, REIT and other industry sources. These estimates may subsequently be revised based on information received from MLPs and REITs after their tax reporting periods are concluded.
Custodian Fees. “Custodian fees and expenses” in the Statement of Operations may include interest expense incurred by the Fund on any cash overdrafts of its custodian account during the period. Such cash overdrafts may result from the effects of failed trades in portfolio securities and from cash outflows resulting from unanticipated shareholder redemption activity. The Fund pays interest to its custodian on such cash overdrafts, to the extent they are not offset by positive cash balances maintained by the Fund, at a rate equal to the Federal Funds Rate plus 0.50%. The “Reduction to custodian expenses” line item, if applicable, represents earnings on cash balances maintained by the Fund during the period. Such interest expense and other custodian fees may be paid with these earnings.
22 OPPENHEIMER CONSERVATIVE BALANCED FUND/VA
2. Significant Accounting Policies (Continued)
Security Transactions. Security transactions are recorded on the trade date. Realized gains and losses on securities sold are determined on the basis of identified cost.
Indemnifications. The Fund’s organizational documents provide current and former Trustees and officers with a limited indemnification against liabilities arising in connection with the performance of their duties to the Fund. In the normal course of business, the Fund may also enter into contracts that provide general indemnifications. The Fund’s maximum exposure under these arrangements is unknown as this would be dependent on future claims that may be made against the Fund. The risk of material loss from such claims is considered remote.
Federal Taxes. The Fund intends to comply with provisions of the Internal Revenue Code applicable to regulated investment companies and to distribute substantially all of its investment company taxable income, including any net realized gain on investments not offset by capital loss carryforwards, if any, to shareholders. Therefore, no federal income or excise tax provision is required. The Fund files income tax returns in U.S. federal and applicable state jurisdictions. The statute of limitations on the Fund’s tax return filings generally remains open for the three preceding fiscal reporting period ends.
The tax components of capital shown in the following table represent distribution requirements the Fund must satisfy under the income tax regulations, losses the Fund may be able to offset against income and gains realized in future years and unrealized appreciation or depreciation of securities and other investments for federal income tax purposes.
| | | | | | | | | | | | |
Undistributed Net Investment Income | | Undistributed Long-Term Gain | | | Accumulated Loss Carryforward1,2,3,4 | | | Net Unrealized Appreciation Based on cost of Securities and Other Investments for Federal Income Tax Purposes | |
| |
$5,319,438 | | | $— | | | | $12,145,339 | | | | $8,640,479 | |
1. At period end, the Fund had $11,904,119 of net capital loss carryforward available to offset future realized capital gains, if any, and thereby reduce future taxable gain distributions. Details of the capital loss carryforwards are included in the table below. Capital loss carryovers with no expiration, if any, must be utilized prior to those with expiration dates.
| | | | |
| Expiring | | | |
| |
2016 | | $ | 3,323,244 | |
2017 | | | 8,580,875 | |
| | | | |
Total | | $ | 11,904,119 | |
| | | | |
Of these losses, $3,323,244 are subject to loss limitation rules resulting from merger activity. These limitations generally reduce the utilization of these losses to a maximum of $3,323,244 per year.
2. At period end, the Fund had $241,220 of post-October losses available to offset future realized capital gains, if any.
3. During the reporting period, the Fund utilized $7,623,518 of capital loss carryforward to offset capital gains realized in that fiscal year.
4. During the previous reporting period, the Fund utilized $13,107,726 of capital loss carryforward to offset capital gains realized in that fiscal year.
Net investment income (loss) and net realized gain (loss) may differ for financial statement and tax purposes. The character of dividends and distributions made during the fiscal year from net investment income or net realized gains are determined in accordance with federal income tax requirements, which may differ from the character of net investment income or net realized gains presented in those financial statements in accordance with U.S. GAAP. Also, due to timing of dividends and distributions, the fiscal year in which amounts are distributed may differ from the fiscal year in which the income or net realized gain was recorded by the Fund.
Accordingly, the following amounts have been reclassified for the reporting period. Net assets of the Fund were unaffected by the reclassifications.
| | | | | | | | |
Reduction to Paid-in Capital | | Increase to Accumulated Net Investment Income | | | Increase to Accumulated Net Realized Loss on Investments | |
| |
$212 | | | $177,826 | | | | $177,614 | |
The tax character of distributions paid during the reporting periods:
| | | | | | | | |
| | | Year Ended | | | Year Ended | |
| | | December 31, 2015 | | | December 31, 2014 | |
| |
Distributions paid from: | | | | | | | | |
Ordinary income | | $ | 5,566,837 | | | $ | 5,446,566 | |
The aggregate cost of securities and other investments and the composition of unrealized appreciation and depreciation of securities and other investments for federal income tax purposes at period end are noted in the following table. The primary difference between book and tax appreciation or depreciation of securities and other investments, if applicable, is attributable to the tax deferral of losses or tax realization of financial statement unrealized gain or loss.
23 OPPENHEIMER CONSERVATIVE BALANCED FUND/VA
| | |
NOTES TO FINANCIAL STATEMENTS Continued |
2. Significant Accounting Policies (Continued)
| | | | |
Federal tax cost of securities | | $ | 242,136,128 | |
Federal tax cost of other investments | | | 2,942 | |
| | | | |
Total federal tax cost | | $ | 242,139,070 | |
| | | | |
Gross unrealized appreciation | | $ | 13,060,670 | |
Gross unrealized depreciation | | | (4,420,191) | |
| | | | |
Net unrealized appreciation | | $ | 8,640,479 | |
| | | | |
Use of Estimates. The preparation of financial statements in conformity with U.S. GAAP requires management to make estimates and assumptions that affect the reported amounts of assets and liabilities and disclosure of contingent assets and liabilities at the date of the financial statements and the reported amounts of increases and decreases in net assets from operations during the reporting period. Actual results could differ from those estimates.
3. Securities Valuation
The Fund calculates the net asset value of its shares as of the close of the New York Stock Exchange (the “Exchange”), normally 4:00 P.M. Eastern time, on each day the Exchange is open for trading, except in the case of a scheduled early closing of the Exchange, in which case the Fund will calculate net asset value of the shares as of the scheduled early closing time of the Exchange.
The Fund’s Board has adopted procedures for the valuation of the Fund’s securities and has delegated the day-to-day responsibility for valuation determinations under those procedures to the Manager. The Manager has established a Valuation Committee which is responsible for determining a “fair valuation” for any security for which market quotations are not “readily available.” The Valuation Committee’s fair valuation determinations are subject to review, approval and ratification by the Fund’s Board at its next regularly scheduled meeting covering the calendar quarter in which the fair valuation was determined.
Valuation Methods and Inputs
Securities are valued using unadjusted quoted market prices, when available, as supplied primarily by third party pricing services or dealers.
The following methodologies are used to determine the market value or the fair value of the types of securities described below:
Securities traded on a registered U.S. securities exchange (including exchange-traded derivatives other than futures and futures options) are valued based on the last sale price of the security reported on the principal exchange on which it is traded, prior to the time when the Fund’s assets are valued. In the absence of a sale, the security is valued at the mean between the bid and asked price on the principal exchange or, if not available from the principal exchange, obtained from two dealers. If bid and asked prices are not available from either the exchange or two dealers, the security is valued by using one of the following methodologies (listed in order of priority): (1) bid from the principal exchange, (2) the mean between the bid and asked price as provided by a single dealer, or (3) a bid from a single dealer. A security of a foreign issuer traded on a foreign exchange, but not listed on a registered U.S. securities exchange, is valued based on the last sale price on the principal exchange on which the security is traded, as identified by the third party pricing service used by the Manager, prior to the time when the Fund’s assets are valued. If the last sale price is unavailable, the security is valued at the most recent official closing price on the principal exchange on which it is traded. If the last sales price or official closing price for a foreign security is not available, the security is valued at the mean between the bid and asked price per the exchange or, if not available from the exchange, obtained from two dealers. If bid and asked prices are not available from either the exchange or two dealers, the security is valued by using one of the following methodologies (listed in order of priority): (1) a bid from the exchange, (2) the mean between the bid and asked price as provided by a single dealer, or (3) a bid from a single dealer.
Shares of a registered investment company that are not traded on an exchange are valued at that investment company’s net asset value per share.
Corporate and government debt securities (of U.S. or foreign issuers) and municipal debt securities, event-linked bonds, loans, mortgage-backed securities, collateralized mortgage obligations, and asset-backed securities are valued at the mean between the “bid” and “asked” prices utilizing evaluated prices obtained from third party pricing services or broker-dealers who may use matrix pricing methods to determine the evaluated prices.
Short-term money market type debt securities with a remaining maturity of sixty days or less are valued at cost adjusted by the amortization of discount or premium to maturity (amortized cost), which approximates market value. Short-term debt securities with a remaining maturity in excess of sixty days are valued at the mean between the “bid” and “asked” prices utilizing evaluated prices obtained from third party pricing services or broker-dealers.
Futures contracts and futures options traded on a commodities or futures exchange will be valued at the final settlement price or official closing price on the principal exchange as reported by such principal exchange at its trading session ending at, or most recently prior to, the time when the Fund’s assets are valued.
A description of the standard inputs that may generally be considered by the third party pricing vendors in determining their evaluated prices is provided below.
| | |
| Security Type | | Standard inputs generally considered by third-party pricing vendors |
|
| Corporate debt, government debt, municipal, mortgage-backed and asset-backed securities | | Reported trade data, broker-dealer price quotations, benchmark yields, issuer spreads on comparable securities, the credit quality, yield, maturity, and other appropriate factors. |
|
| Loans | | Information obtained from market participants regarding reported trade data and broker-dealer price quotations. |
|
| Event-linked bonds | | Information obtained from market participants regarding reported trade data and broker-dealer price quotations. |
24 OPPENHEIMER CONSERVATIVE BALANCED FUND/VA
3. Securities Valuation (Continued)
If a market value or price cannot be determined for a security using the methodologies described above, or if, in the “good faith” opinion of the Manager, the market value or price obtained does not constitute a “readily available market quotation,” or a significant event has occurred that would materially affect the value of the security, the security is fair valued either (i) by a standardized fair valuation methodology applicable to the security type or the significant event as previously approved by the Valuation Committee and the Fund’s Board or (ii) as determined in good faith by the Manager’s Valuation Committee. The Valuation Committee considers all relevant facts that are reasonably available, through either public information or information available to the Manager, when determining the fair value of a security. Fair value determinations by the Manager are subject to review, approval and ratification by the Fund’s Board at its next regularly scheduled meeting covering the calendar quarter in which the fair valuation was determined. Those fair valuation standardized methodologies include, but are not limited to, valuing securities at the last sale price or initially at cost and subsequently adjusting the value based on: changes in company specific fundamentals, changes in an appropriate securities index, or changes in the value of similar securities which may be further adjusted for any discounts related to security-specific resale restrictions. When possible, such methodologies use observable market inputs such as unadjusted quoted prices of similar securities, observable interest rates, currency rates and yield curves. The methodologies used for valuing securities are not necessarily an indication of the risks associated with investing in those securities nor can it be assured that the Fund can obtain the fair value assigned to a security if it were to sell the security.
To assess the continuing appropriateness of security valuations, the Manager, or its third party service provider who is subject to oversight by the Manager, regularly compares prior day prices, prices on comparable securities, and sale prices to the current day prices and challenges those prices exceeding certain tolerance levels with the third party pricing service or broker source. For those securities valued by fair valuations, whether through a standardized fair valuation methodology or a fair valuation determination, the Valuation Committee reviews and affirms the reasonableness of the valuations based on such methodologies and fair valuation determinations on a regular basis after considering all relevant information that is reasonably available.
Classifications
Each investment asset or liability of the Fund is assigned a level at measurement date based on the significance and source of the inputs to its valuation. Various data inputs are used in determining the value of each of the Fund’s investments as of the reporting period end. These data inputs are categorized in the following hierarchy under applicable financial accounting standards:
1) Level 1-unadjusted quoted prices in active markets for identical assets or liabilities (including securities actively traded on a securities exchange)
2) Level 2-inputs other than unadjusted quoted prices that are observable for the asset or liability (such as unadjusted quoted prices for similar assets and market corroborated inputs such as interest rates, prepayment speeds, credit risks, etc.)
3) Level 3-significant unobservable inputs (including the Manager’s own judgments about assumptions that market participants would use in pricing the asset or liability).
The inputs used for valuing securities are not necessarily an indication of the risks associated with investing in those securities.
The table below categorizes amounts that are included in the Fund’s Statement of Assets and Liabilities at period end based on valuation input level:
| | | | | | | | | | | | | | | | |
| | | Level 1— Unadjusted
Quoted Prices | | | Level 2—
Other Significant
Observable Inputs | | | Level 3—
Significant Unobservable
Inputs | | | Value | |
| |
Assets Table | | | | | | | | | | | | | | | | |
Investments, at Value: | | | | | | | | | | | | | | | | |
Common Stocks | | | | | | | | | | | | | | | | |
Consumer Discretionary | | $ | 8,931,785 | | | $ | — | | | $ | — | | | $ | 8,931,785 | |
Consumer Staples | | | 6,976,703 | | | | — | | | | — | | | | 6,976,703 | |
Energy | | | 5,069,054 | | | | — | | | | — | | | | 5,069,054 | |
Financials | | | 15,150,514 | | | | — | | | | — | | | | 15,150,514 | |
Health Care | | | 11,791,619 | | | | — | | | | — | | | | 11,791,619 | |
Industrials | | | 8,278,768 | | | | — | | | | — | | | | 8,278,768 | |
Information Technology | | | 16,174,013 | | | | — | | | | — | | | | 16,174,013 | |
Materials | | | 2,357,030 | | | | — | | | | — | | | | 2,357,030 �� | |
Telecommunication Services | | | 1,353,726 | | | | — | | | | — | | | | 1,353,726 | |
Utilities | | | 2,903,933 | | | | — | | | | — | | | | 2,903,933 | |
Asset-Backed Securities | | | — | | | | 23,699,958 | | | | — | | | | 23,699,958 | |
Mortgage-Backed Obligations | | | — | | | | 71,573,572 | | | | — | | | | 71,573,572 | |
U.S. Government Obligations | | | — | | | | 811,946 | | | | — | | | | 811,946 | |
Non-Convertible Corporate Bonds and Notes | | | — | | | | 70,339,321 | | | | — | | | | 70,339,321 | |
Investment Company | | | 5,367,607 | | | | — | | | | — | | | | 5,367,607 | |
| | | | |
Total Investments, at Value | | | 84,354,752 | | | | 166,424,797 | | | | — | | | | 250,779,549 | |
Other Financial Instruments: | | | | | | | | | | | | | | | | |
Futures contracts | | | 47,374 | | | | — | | | | — | | | | 47,374 | |
| | | | |
Total Assets | | $ | 84,402,126 | | | $ | 166,424,797 | | | $ | — | | | $ | 250,826,923 | |
| | | | |
| | | | |
Liabilities Table | | | | | | | | | | | | | | | | |
Other Financial Instruments: | | | | | | | | | | | | | | | | |
Futures contracts | | $ | (20,729 | ) | | $ | — | | | $ | — | | | $ | (20,729) | |
| | | | |
Total Liabilities | | $ | (20,729 | ) | | $ | — | | | $ | — | | | $ | (20,729) | |
| | | | |
25 OPPENHEIMER CONSERVATIVE BALANCED FUND/VA
NOTES TO FINANCIAL STATEMENTS Continued
3. Securities Valuation (Continued)
Forward currency exchange contracts and futures contracts, if any, are reported at their unrealized appreciation/depreciation at measurement date, which represents the change in the contract’s value from trade date. All additional assets and liabilities included in the above table are reported at their market value at measurement date.
4. Investments and Risks
Investments in Affiliated Funds. The Fund is permitted to invest in other mutual funds advised by the Manager (“Affiliated Funds”). Affiliated Funds are open-end management investment companies registered under the 1940 Act, as amended. The Manager is the investment adviser of, and the Sub-Adviser provides investment and related advisory services to, the Affiliated Funds. When applicable, the Fund’s investments in Affiliated Funds are included in the Statement of Investments. Shares of Affiliated Funds are valued at their net asset value per share. As a shareholder, the Fund is subject to its proportional share of the Affiliated Funds’ expenses, including their management fee. The Manager will waive fees and/or reimburse Fund expenses in an amount equal to the indirect management fees incurred through the Fund’s investment in the Affiliated Funds.
Each of the Affiliated Funds in which the Fund invests has its own investment risks, and those risks can affect the value of the Fund’s investments and therefore the value of the Fund’s shares. To the extent that the Fund invests more of its assets in one Affiliated Fund than in another, the Fund will have greater exposure to the risks of that Affiliated Fund.
Investment in Oppenheimer Institutional Money Market Fund. The Fund is permitted to invest daily available cash balances in a money market Affiliated Fund. The Fund may invest the available cash in Class E shares of Oppenheimer Institutional Money Market Fund (“IMMF”) to seek current income while preserving liquidity or for defensive purposes. IMMF is regulated as a money market fund under the Investment Company Act of 1940, as amended.
Master Limited Partnerships (“MLPs”). MLPs issue common units that represent an equity ownership interest in a partnership and provide limited voting rights. MLP common units are registered with the Securities and Exchange Commission (“SEC”), and are freely tradable on securities exchanges such as the NYSE and the NASDAQ Stock Market (“NASDAQ”), or in the over-the-counter (“OTC”) market. An MLP consists of one or more general partners, who conduct the business, and one or more limited partners, who contribute capital. MLP common unit holders have a limited role in the partnership’s operations and management. The Fund, as a limited partner, normally would not be liable for the debts of the MLP beyond the amounts the Fund has contributed, but would not be shielded to the same extent that a shareholder of a corporation would be. In certain circumstances creditors of an MLP would have the right to seek return of capital distributed to a limited partner. This right of an MLP’s creditors would continue after the Fund sold its investment in the MLP.
Securities on a When-Issued or Delayed Delivery Basis. The Fund may purchase securities on a “when-issued” basis, and may purchase or sell securities on a “delayed delivery” basis. “When-issued” or “delayed delivery” refers to securities whose terms and indenture are available and for which a market exists, but which are not available for immediate delivery. Delivery and payment for securities that have been purchased by the Fund on a when-issued basis normally takes place within six months and possibly as long as two years or more after the trade date. During this period, such securities do not earn interest, are subject to market fluctuation and may increase or decrease in value prior to their delivery. The purchase of securities on a when-issued basis may increase the volatility of the Fund’s net asset value to the extent the Fund executes such transactions while remaining substantially fully invested. When the Fund engages in when-issued or delayed delivery transactions, it relies on the buyer or seller, as the case may be, to complete the transaction. Their failure to do so may cause the Fund to lose the opportunity to obtain or dispose of the security at a price and yield it considers advantageous. The Fund may also sell securities that it purchased on a when-issued basis or forward commitment prior to settlement of the original purchase.
At period end, the Fund had purchased securities issued on a when-issued or delayed delivery basis and sold securities issued on a delayed delivery basis as follows:
| | | | |
| | | When-Issued or
Delayed Delivery
Basis Transactions | |
| |
Purchased securities | | $ | 44,394,738 | |
Sold securities | | | 1,746,142 | |
The Fund may enter into “forward roll” transactions with respect to mortgage-related securities. In this type of transaction, the Fund sells a mortgage-related security to a buyer and simultaneously agrees to repurchase a similar security (same type, coupon and maturity) at a later date at a set price. During the period between the sale and the repurchase, the Fund will not be entitled to receive interest and principal payments on the securities that have been sold. The Fund records the incremental difference between the forward purchase and sale of each forward roll as realized gain (loss) on investments or as fee income in the case of such transactions that have an associated fee in lieu of a difference in the forward purchase and sale price.
Forward roll transactions may be deemed to entail embedded leverage since the Fund purchases mortgage-related securities with extended settlement dates rather than paying for the securities under a normal settlement cycle. This embedded leverage increases the Fund’s market value of investments relative to its net assets which can incrementally increase the volatility of the Fund’s performance. Forward roll transactions can be replicated over multiple settlement periods.
26 OPPENHEIMER CONSERVATIVE BALANCED FUND/VA
4. Investments and Risks (Continued)
Risks of entering into forward roll transactions include the potential inability of the counterparty to meet the terms of the agreement; the potential of the Fund to receive inferior securities at redelivery as compared to the securities sold to the counterparty; and counterparty credit risk.
Restricted Securities. At period end, investments in securities included issues that are restricted. A restricted security may have a contractual restriction on its resale and is valued under methods approved by the Board of Trustees as reflecting fair value. Securities that are restricted are marked with an applicable footnote on the Statement of Investments. Restricted securities are reported on a schedule following the Statement of Investments.
Equity Security Risk. Stocks and other equity securities fluctuate in price. The value of the Fund’s portfolio may be affected by changes in the equity markets generally. Equity markets may experience significant short-term volatility and may fall sharply at times. Different markets may behave differently from each other and U.S. equity markets may move in the opposite direction from one or more foreign stock markets. Adverse events in any part of the equity or fixed-income markets may have unexpected negative effects on other market segments.
The prices of individual equity securities generally do not all move in the same direction at the same time and a variety of factors can affect the price of a particular company’s securities. These factors may include, but are not limited to, poor earnings reports, a loss of customers, litigation against the company, general unfavorable performance of the company’s sector or industry, or changes in government regulations affecting the company or its industry.
Shareholder Concentration. At period end, one shareholder owned 20% or more of the Fund’s total outstanding shares comprising 22.46% of the Fund. The shareholder is a related party of the Fund. Related parties may include, but are not limited to, the investment manager and its affiliates, affiliated broker dealers, fund of funds, and directors or employees.
5. Market Risk Factors
The Fund’s investments in securities and/or financial derivatives may expose the fund to various market risk factors:
Commodity Risk. Commodity risk relates to the change in value of commodities or commodity indexes as they relate to increases or decreases in the commodities market. Commodities are physical assets that have tangible properties. Examples of these types of assets are crude oil, heating oil, metals, livestock, and agricultural products.
Credit Risk. Credit risk relates to the ability of the issuer of debt to meet interest and principal payments, or both, as they come due. In general, lower-grade, higher-yield debt securities are subject to credit risk to a greater extent than lower-yield, higher-quality securities.
Equity Risk. Equity risk relates to the change in value of equity securities as they relate to increases or decreases in the general market.
Foreign Exchange Rate Risk. Foreign exchange rate risk relates to the change in the U.S. dollar value of a security held that is denominated in a foreign currency. The U.S. dollar value of a foreign currency denominated security will decrease as the dollar appreciates against the currency, while the U.S. dollar value will increase as the dollar depreciates against the currency.
Interest Rate Risk. Interest rate risk refers to the fluctuations in value of fixed-income securities resulting from the inverse relationship between price and yield. For example, an increase in general interest rates will tend to reduce the market value of already issued fixed-income investments, and a decline in general interest rates will tend to increase their value. In addition, debt securities with longer maturities, which tend to have higher yields, are subject to potentially greater fluctuations in value from changes in interest rates than obligations with shorter maturities.
Volatility Risk. Volatility risk refers to the magnitude of the movement, but not the direction of the movement, in a financial instrument’s price over a defined time period. Large increases or decreases in a financial instrument’s price over a relative time period typically indicate greater volatility risk, while small increases or decreases in its price typically indicate lower volatility risk.
6. Use of Derivatives
The Fund’s investment objective not only permits the Fund to purchase investment securities, it also allows the Fund to enter into various types of derivatives contracts, including, but not limited to, futures contracts, forward currency exchange contracts, credit default swaps, interest rate swaps, total return swaps, variance swaps and purchased and written options. In doing so, the Fund will employ strategies in differing combinations to permit it to increase, decrease, or change the level or types of exposure to market risk factors. These instruments may allow the Fund to pursue its objectives more quickly and efficiently than if it were to make direct purchases or sales of securities capable of effecting a similar response to market factors. Such contracts may be entered into through a bilateral over-the-counter (“OTC”) transaction, or through a securities or futures exchange and cleared through a clearinghouse.
Derivatives may have little or no initial cash investment relative to their market value exposure and therefore can produce significant gains or losses in excess of their cost due to unanticipated changes in the market risk factors and the overall market. This use of embedded leverage allows the Fund to increase its market value exposure relative to its net assets and can substantially increase the volatility of the Fund’s performance. In instances where the Fund is using derivatives to decrease, or hedge, exposures to market risk factors for securities held by the Fund, there are also risks that those derivatives may not perform as expected resulting in losses for the combined or hedged positions. Some derivatives have the potential for unlimited loss, regardless of the size of the Fund’s initial investment.
Additional associated risks from investing in derivatives also exist and potentially could have significant effects on the valuation of the derivative and the Fund. Typically, the associated risks are not the risks that the Fund is attempting to increase or decrease exposure to, per its investment objectives, but are the additional risks from investing in derivatives. Examples of these associated risks are liquidity risk, which is the risk that the Fund will not be
27 OPPENHEIMER CONSERVATIVE BALANCED FUND/VA
NOTES TO FINANCIAL STATEMENTS Continued
6. Use of Derivatives (Continued)
able to sell the derivative in the open market in a timely manner, and counterparty credit risk, which is the risk that the counterparty will not fulfill its obligation to the Fund.
The Fund’s actual exposures to these market risk factors and associated risks during the period are discussed in further detail, by derivative type, below.
Futures Contracts
A futures contract is a commitment to buy or sell a specific amount of a commodity, financial instrument or currency at a negotiated price on a stipulated future date. The Fund may buy and sell futures contracts and may also buy or write put or call options on these futures contracts. Futures contracts and options thereon are generally entered into on a regulated futures exchange and cleared through a clearinghouse associated with the exchange.
Upon entering into a futures contract, the Fund is required to deposit either cash or securities (initial margin) in an amount equal to a certain percentage of the contract value in an account registered in the futures commission merchant’s name. Subsequent payments (variation margin) are paid to or from the futures commission merchant each day equal to the daily changes in the contract value. Such payments are recorded as unrealized gains and losses. Should the Fund fail to make requested variation margin payments, the futures commission merchant can gain access to the initial margin to satisfy the Fund’s payment obligations.
Futures contracts are reported on a schedule following the Statement of Investments. Securities held by a futures commission merchant to cover initial margin requirements on open futures contracts are noted in the Statement of Investments. Cash held by a futures commission merchant to cover initial margin requirements on open futures contracts and the receivable and/or payable for the daily mark to market for the variation margin are noted in the Statement of Assets and Liabilities. The net change in unrealized appreciation and depreciation is reported in the Statement of Operations. Realized gains (losses) are reported in the Statement of Operations at the closing or expiration of futures contracts.
The Fund has purchased futures contracts on various bonds and notes to increase exposure to interest rate risk.
The Fund has sold futures contracts on various bonds and notes to decrease exposure to interest rate risk.
During the reporting period, the Fund had an ending monthly average market value of $11,498,475 and $19,843,566 on futures contracts purchased and sold, respectively.
Additional associated risks of entering into futures contracts (and related options) include the possibility that there may be an illiquid market where the Fund is unable to liquidate the contract or enter into an offsetting position and, if used for hedging purposes, the risk that the price of the contract will correlate imperfectly with the prices of the Fund’s securities.
Counterparty Credit Risk. Derivative positions are subject to the risk that the counterparty will not fulfill its obligation to the Fund. The Fund intends to enter into derivative transactions with counterparties that the Manager believes to be creditworthy at the time of the transaction.
For financial reporting purposes, the Fund does not offset derivative assets and derivative liabilities that are subject to netting arrangements in the Statement of Assets and Liabilities. Bankruptcy or insolvency laws of a particular jurisdiction may impose restrictions on or prohibitions against the right of offset in bankruptcy, insolvency or other events.
The Fund’s risk of loss from counterparty credit risk on exchange-traded derivatives cleared through a clearinghouse and for centrally cleared swaps is generally considered lower than as compared to OTC derivatives. However, counterparty credit risk exists with respect to initial and variation margin deposited/paid by the Fund that is held in futures commission merchant, broker and/or clearinghouse accounts for such exchange-traded derivatives and for centrally cleared swaps.
With respect to centrally cleared swaps, such transactions will be submitted for clearing, and if cleared, will be held in accounts at futures commission merchants or brokers that are members of clearinghouses. While brokers, futures commission merchants and clearinghouses are required to segregate customer margin from their own assets, in the event that a broker, futures commission merchant or clearinghouse becomes insolvent or goes into bankruptcy and at that time there is a shortfall in the aggregate amount of margin held by the broker, futures commission merchant or clearinghouse for all its customers, U.S. bankruptcy laws will typically allocate that shortfall on a pro-rata basis across all the broker’s, futures commission merchant’s or clearinghouse’s customers, potentially resulting in losses to the Fund.
There is the risk that a broker, futures commission merchant or clearinghouse will decline to clear a transaction on the Fund’s behalf, and the Fund may be required to pay a termination fee to the executing broker with whom the Fund initially enters into the transaction. Clearinghouses may also be permitted to terminate centrally cleared swaps at any time. The Fund is also subject to the risk that the broker or futures commission merchant will improperly use the Fund’s assets deposited/paid as initial or variation margin to satisfy payment obligations of another customer. In the event of a default by another customer of the broker or futures commission merchant, the Fund might not receive its variation margin payments from the clearinghouse, due to the manner in which variation margin payments are aggregated for all customers of the broker/futures commission merchant.
Collateral and margin requirements differ by type of derivative. Margin requirements are established by the broker, futures commission merchant or clearinghouse for exchange-traded and cleared derivatives, including centrally cleared swaps. Brokers, futures commission merchants and clearinghouses can ask for margin in excess of the regulatory minimum, or increase the margin amount, in certain circumstances.
For financial reporting purposes, cash collateral that has been pledged to cover obligations of the Fund, if any, is reported separately on the Statement of Assets and Liabilities as cash pledged as collateral. Non-cash collateral pledged by the Fund, if any, is noted in the Statement of Investments. Generally, the amount of collateral due from or to a party must exceed a minimum transfer amount threshold (e.g. $250,000) before a transfer has to be made. To the extent amounts due to the Fund from its counterparties are not fully collateralized, contractually or otherwise, the Fund bears the risk of loss from counterparty nonperformance.
28 OPPENHEIMER CONSERVATIVE BALANCED FUND/VA
6. Use of Derivatives (Continued)
The following table presents the valuations of derivative instruments by risk exposure as reported within the Statement of Assets and Liabilities at period end:
| | | | | | | | | | | | |
| | | Asset Derivatives | | | Liability Derivatives | |
Derivatives Not Accounted for as Hedging Instruments | | Statement of Assets and
Liabilities Location | | Value | | | Statement of Assets and
Liabilities Location | | Value | |
| |
Interest rate contracts | | Variation margin receivable | | | $ 55,531 * | | | Variation margin payable | | | $ 10,502 * | |
*Includes only the current day’s variation margin. Prior variation margin movements have been reflected in cash on the Statement of Assets and Liabilities upon receipt or payment.
The effect of derivative instruments on the Statement of Operations is as follows:
| | |
| Amount of Realized Gain or (Loss) Recognized on Derivatives |
|
Derivatives Not Accounted for as Hedging Instruments | | Closing and expiration of futures contracts |
|
Interest rate contracts | | $ (514,594) |
| | |
| Amount of Change in Unrealized Gain or (Loss) Recognized on Derivatives |
|
Derivatives Not Accounted for as Hedging Instruments | | Futures contracts |
|
Interest rate contracts | | $ (276,896) |
7. Shares of Beneficial Interest
The Fund has authorized an unlimited number of $0.001 par value shares of beneficial interest of each class. Transactions in shares of beneficial interest were as follows:
| | | | | | | | | | | | | | | | |
| | | Year Ended December 31, 2015 | | | Year Ended December 31, 2014 | |
| | | Shares | | | Amount | | | Shares | | | Amount | |
| |
Non-Service Shares | | | | | | | | | | | | | | | | |
Sold | | | 192,335 | | | $ | 2,822,887 | | | | 249,594 | | | $ | 3,564,995 | |
Dividends and/or distributions reinvested | | | 299,338 | | | | 4,370,338 | | | | 300,916 | | | | 4,273,013 | |
Redeemed | | | (1,759,489 | ) | | | (25,932,576 | ) | | | (2,114,253 | ) | | | (30,138,035) | |
| | | | |
Net decrease | | | (1,267,816 | ) | | $ | (18,739,351 | ) | | | (1,563,743 | ) | | $ | (22,300,027) | |
| | | | |
| | | | | | | | | | | | | | | | |
| |
Service Shares | | | | | | | | | | | | | | | | |
Sold | | | 228,285 | | | $ | 3,296,473 | | | | 373,936 | | | $ | 5,300,929 | |
Dividends and/or distributions reinvested | | | 82,918 | | | | 1,196,499 | | | | 83,586 | | | | 1,173,552 | |
Redeemed | | | (1,062,479 | ) | | | (15,384,640 | ) | | | (1,142,911 | ) | | | (16,061,044) | |
| | | | |
Net decrease | | | (751,276 | ) | | $ | (10,891,668 | ) | | | (685,389 | ) | | $ | (9,586,563) | |
| | | | |
8. Purchases and Sales of Securities
The aggregate cost of purchases and proceeds from sales of securities, other than short-term obligations and investments in IMMF, for the reporting period were as follows:
| | | | |
| | | Purchases | | Sales |
|
Investment securities | | $150,509,095 | | $191,064,439 |
U.S. government and government agency obligations | | 9,206,655 | | 9,998,260 |
To Be Announced (TBA) mortgage-related securities | | 829,988,104 | | 849,696,153 |
9. Fees and Other Transactions with Affiliates
Management Fees. Under the investment advisory agreement, the Fund pays the Manager a management fee based on the daily net assets of the Fund at an annual rate as shown in the following table:
| | | | |
| Fee Schedule | | | |
| |
Up to $200 million | | | 0.75% | |
Next $200 million | | | 0.72 | |
Next $200 million | | | 0.69 | |
Next $200 million | | | 0.66 | |
Over $800 million | | | 0.60 | |
The Fund’s effective management fee for the reporting period was 0.74% of average annual net assets before any applicable waivers.
Sub-Adviser Fees. The Manager has retained the Sub-Adviser to provide the day-to-day portfolio management of the Fund. Under the Sub-Advisory Agreement, the Manager pays the Sub-Adviser an annual fee in monthly installments, equal to a percentage of the investment management fee collected by the Manager from the Fund, which shall be calculated after any investment management fee waivers. The fee paid to the Sub-Adviser is paid by the Manager, not by the Fund.
29 OPPENHEIMER CONSERVATIVE BALANCED FUND/VA
NOTES TO FINANCIAL STATEMENTS Continued
9. Fees and Other Transactions with Affiliates (Continued)
Transfer Agent Fees. OFI Global (the “Transfer Agent”) serves as the transfer and shareholder servicing agent for the Fund. The Fund pays the Transfer Agent a fee based on annual net assets. Fees incurred and average net assets for each class with respect to these services are detailed in the Statement of Operations and Financial Highlights, respectively.
Sub-Transfer Agent Fees. The Transfer Agent has retained Shareholder Services, Inc., a wholly-owned subsidiary of OFI (the “Sub-Transfer Agent”), to provide the day-to-day transfer agent and shareholder servicing of the Fund. Under the Sub-Transfer Agency Agreement, the Transfer Agent pays the Sub-Transfer Agent an annual fee in monthly installments, equal to a percentage of the transfer agent fee collected by the Transfer Agent from the Fund, which shall be calculated after any applicable fee waivers. The fee paid to the Sub-Transfer Agent is paid by the Transfer Agent, not by the Fund.
Trustees’ Compensation. The Fund’s Board of Trustees (“Board”) has adopted a compensation deferral plan for Independent Trustees that enables Trustees to elect to defer receipt of all or a portion of the annual compensation they are entitled to receive from the Fund. For purposes of determining the amount owed to the Trustees under the plan, deferred amounts are treated as though equal dollar amounts had been invested in shares of the Fund or in other Oppenheimer funds selected by the Trustees. The Fund purchases shares of the funds selected for deferral by the Trustees in amounts equal to his or her deemed investment, resulting in a Fund asset equal to the deferred compensation liability. Such assets are included as a component of “Other” within the asset section of the Statement of Assets and Liabilities. Deferral of Trustees’ fees under the plan will not affect the net assets of the Fund and will not materially affect the Fund’s assets, liabilities or net investment income per share. Amounts will be deferred until distributed in accordance with the compensation deferral plan.
Distribution and Service Plan for Service Shares. The Fund has adopted a Distribution and Service Plan (the “Plan”) pursuant to Rule 12b-1 under the 1940 Act for Service shares to pay OppenheimerFunds Distributor, Inc. (the “Distributor”), for distribution related services, personal service and account maintenance for the Fund’s Service shares. Under the Plan, payments are made periodically at an annual rate of 0.25% of the daily net assets of Service shares of the Fund. The Distributor currently uses all of those fees to compensate sponsors of the insurance product that offers Fund shares, for providing personal service and maintenance of accounts of their variable contract owners that hold Service shares. These fees are paid out of the Fund’s assets on an on-going basis and increase operating expenses of the Service shares, which results in lower performance compared to the Fund’s shares that are not subject to a service fee. Fees incurred by the Fund under the Plan are detailed in the Statement of Operations.
Waivers and Reimbursements of Expenses. The Manager has contractually agreed to limit the Fund’s expenses after payments, waivers and/or reimbursements and reduction to custodian expenses, excluding expenses incurred directly or indirectly by the Fund as a result of investments in other investment companies, wholly-owned subsidiaries and pooled investment vehicles; so that those expenses, as percentages of daily net assets, will not exceed the annual rate of 0.67% for Non-Service shares and 0.92% for Service shares. The expense limitations do not include interest and fees from borrowing, and other expenses not incurred in the ordinary course of the Fund’s business. During the reporting period, the Manager waived fees and/or reimbursed the Fund $467,563 and $142,028 for Non-Service and Service shares, respectively.
The Manager will waive fees and/or reimburse Fund expenses in an amount equal to the indirect management fees incurred through the Fund’s investment in IMMF. During the reporting period, the Manager waived fees and/or reimbursed the Fund $5,369 for IMMF management fees.
Waivers and/or reimbursements may be modified or terminated as set forth according to the terms in the prospectus.
10. Borrowings and Other Financing
Joint Credit Facility. A number of mutual funds managed by the Manager participate in a $1.28 billion revolving credit facility (the “Facility”) intended to provide short-term financing, if necessary, subject to certain restrictions in connection with atypical redemption activity. Expenses and fees related to the Facility are paid by the participating funds and are disclosed separately or as other expenses on the Statement of Operations. The Fund did not utilize the Facility during the reporting period.
11. Pending Litigation
In 2009, several putative class action lawsuits were filed and later consolidated before the U.S. District Court for the District of Colorado against OppenheimerFunds, Inc. (“OFI”), OppenheimerFunds Distributor, Inc. (“OFDI”), and Oppenheimer Rochester California Municipal Fund, a fund advised by OFI Global Asset Management, Inc. and distributed by the Distributor (the “California Fund”), in connection with the California Fund’s investment performance. The plaintiffs asserted claims against OFI, OFDI and certain present and former trustees and officers of the California Fund under the federal securities laws, alleging, among other things, that the disclosure documents of the California Fund contained misrepresentations and omissions and the investment policies of the California Fund were not followed. Plaintiffs in the suit filed an amended complaint and defendants filed a motion to dismiss. In 2011, the court issued an order which granted in part and denied in part the defendants’ motion to dismiss. In 2012, plaintiffs filed a motion, which defendants opposed, to certify a class and appoint class representatives and class counsel. In March 2015, the court granted plaintiffs’ motion for class certification. In May 2015, the U.S. Court of Appeals for the Tenth Circuit vacated the class certification order and remanded the matter to the district court for further proceedings. In October 2015, the district court reaffirmed its order and determined that the suit will proceed as a class action. In December 2015, the Tenth Circuit denied defendants’ petition to appeal the district court’s reaffirmed class certification order.
OFI and OFDI believe the suit is without merit; that it is premature to render any opinion as to the likelihood of an outcome unfavorable to them in the suit; and that no estimate can yet be made as to the amount or range of any potential loss. Furthermore, OFI believes that the suit should not impair the
30 OPPENHEIMER CONSERVATIVE BALANCED FUND/VA
11. Pending Litigation (Continued)
ability of OFI or OFDI to perform their respective duties to the Fund and that the outcome of the suit should not have any material effect on the operations of any of the Oppenheimer funds.
31 OPPENHEIMER CONSERVATIVE BALANCED FUND/VA
REPORT OF INDEPENDENT REGISTERED PUBLIC ACCOUNTING FIRM
The Board of Trustees and Shareholders of Oppenheimer Variable Account Funds:
We have audited the accompanying statement of assets and liabilities of Oppenheimer Conservative Balanced Fund/VA (formerly Oppenheimer Capital Income Fund/VA) (a separate series of Oppenheimer Variable Account Funds), including the statement of investments, as of December 31, 2015, and the related statement of operations for the year then ended, the statements of changes in net assets for each of the years in the two-year period then ended, and the financial highlights for each of the years in the five-year period then ended. These financial statements and financial highlights are the responsibility of the Fund’s management. Our responsibility is to express an opinion on these financial statements and financial highlights based on our audits.
We conducted our audits in accordance with the standards of the Public Company Accounting Oversight Board (United States). Those standards require that we plan and perform the audit to obtain reasonable assurance about whether the financial statements and financial highlights are free of material misstatement. An audit includes examining, on a test basis, evidence supporting the amounts and disclosures in the financial statements. Our procedures included confirmation of securities owned as of December 31, 2015, by correspondence with the custodian, transfer agent and brokers, or by other appropriate auditing procedures where replies from brokers were not received. An audit also includes assessing the accounting principles used and significant estimates made by management, as well as evaluating the overall financial statement presentation. We believe that our audits provide a reasonable basis for our opinion.
In our opinion, the financial statements and financial highlights referred to above present fairly, in all material respects, the financial position of Oppenheimer Conservative Balanced Fund/VA as of December 31, 2015, the results of its operations for the year then ended, the changes in its net assets for each of the years in the two-year period then ended, and the financial highlights for each of the years in the five-year period then ended, in conformity with U.S. generally accepted accounting principles.
KPMGLLP
Denver, Colorado
February 12, 2016
32 OPPENHEIMER CONSERVATIVE BALANCED FUND/VA
FEDERAL INCOME TAX INFORMATION Unaudited
In early 2016, if applicable, shareholders of record received information regarding all dividends and distributions paid to them by the Fund during calendar year 2015.
Dividends, if any, paid by the Fund during the reporting period which are not designated as capital gain distributions should be multiplied by the maximum amount allowable but not less than 21.37% to arrive at the amount eligible for the corporate dividend-received deduction.
The foregoing information is presented to assist shareholders in reporting distributions received from the Fund to the Internal Revenue Service. Because of the complexity of the federal regulations which may affect your individual tax return and the many variations in state and local tax regulations, we recommend that you consult your tax advisor for specific guidance.
33 OPPENHEIMER CONSERVATIVE BALANCED FUND/VA
BOARD APPROVAL OF THE FUND’S INVESTMENT ADVISORY AND SUB-ADVISORY AGREEMENTS Unaudited
The Fund has entered into an investment advisory agreement with OFI Global Asset Management, Inc. (“OFI Global” or the “Adviser”), a wholly-owned subsidiary of OppenheimerFunds, Inc. (“OFI” or the “Sub-Adviser”) (“OFI Global” and “OFI” together the “Managers”) and OFI Global has entered into a sub-advisory agreement with OFI whereby OFI provides investment sub-advisory services to the Fund (collectively, the “Agreements”). Each year, the Board of Trustees (the “Board”), including a majority of the independent Trustees, is required to determine whether to approve the terms of the Agreements and the renewal thereof. The Investment Company Act of 1940, as amended, requires that the Board request and evaluate, and that the Managers provide, such information as may be reasonably necessary to evaluate the terms of the Agreements. The Board employs an independent consultant to prepare a report that provides information, including comparative information that the Board requests for that purpose. In addition to in-person meetings focused on this evaluation, the Board receives information throughout the year regarding Fund services, fees, expenses and performance.
The Adviser, Sub-Adviser and the independent consultant provided information to the Board on the following factors: (i) the nature, quality and extent of the Managers’ services, (ii) the comparative investment performance of the Fund and the Managers, (iii) the fees and expenses of the Fund, including comparative fee and expense information, (iv) the profitability of the Managers and their affiliates, including an analysis of the cost of providing services, (v) whether economies of scale are realized as the Fund grows and whether fee levels reflect these economies of scale for Fund investors and (vi) other benefits to the Managers from their relationship with the Fund. The Board was aware that there are alternatives to retaining the Managers.
Outlined below is a summary of the principal information considered by the Board as well as the Board’s conclusions.
Nature, Quality and Extent of Services. The Board considered information about the nature, quality and extent of the services provided to the Fund and information regarding the Managers’ key personnel who provide such services. The Managers’ duties include providing the Fund with the services of the portfolio managers and the Sub-Adviser’s investment team, who provide research, analysis and other advisory services in regard to the Fund’s investments; and securities trading services. OFI Global is responsible for oversight of third-party service providers; monitoring compliance with applicable Fund policies and procedures and adherence to the Fund’s investment restrictions; risk management; and oversight of the Sub-Adviser. OFI Global is also responsible for providing certain administrative services to the Fund as well. Those services include providing and supervising all administrative and clerical personnel who are necessary in order to provide effective corporate administration for the Fund; compiling and maintaining records with respect to the Fund’s operations; preparing and filing reports required by the U.S. Securities and Exchange Commission; preparing periodic reports regarding the operations of the Fund for its shareholders; preparing proxy materials for shareholder meetings; and preparing the registration statements required by federal and state securities laws for the sale of the Fund’s shares. OFI Global also provides the Fund with office space, facilities and equipment.
The Board also considered the quality of the services provided and the quality of the Managers’ resources that are available to the Fund. The Board took account of the fact that the Sub-Adviser has had over fifty years of experience as an investment adviser and that its assets under management rank it among the top mutual fund managers in the United States. The Board evaluated the Managers’ advisory, administrative, accounting, legal, compliance services and risk management, and information the Board has received regarding the experience and professional qualifications of the Managers’ key personnel and the size and functions of its staff. In its evaluation of the quality of the portfolio management services provided, the Board considered the experience of Krishna Memani and Magnus Krantz, the portfolio managers for the Fund, and the Sub-Adviser’s investment team and analysts. The Board members also considered the totality of their experiences with the Managers as directors or trustees of the Fund and other funds advised by the Managers. The Board considered information regarding the quality of services provided by affiliates of the Managers, which the Board members have become knowledgeable about through their experiences with the Managers and in connection with the renewal of the Fund’s service agreements. The Board concluded, in light of the Managers’ experience, reputation, personnel, operations and resources that the Fund benefits from the services provided under the Agreements.
Investment Performance of the Managers and the Fund. Throughout the year, the Managers provided information on the investment performance of the Fund, including comparative performance information. The Board also reviewed information, prepared by the Managers and by the independent consultant, comparing the Fund’s historical performance to relevant market indices and to the performance of other conservative allocation funds underlying variable insurance products. The Board considered that the Fund outperformed its performance category during the one-, three- and five-year periods, but underperformed for the ten-year period.
Fees and Expenses of the Fund. The Board reviewed the fees paid to the Adviser and the other expenses borne by the Fund. The Board noted that the Adviser, not the Fund, pays the Sub-Adviser’s fee under the sub-advisory agreement. The independent consultant provided comparative data in regard to the fees and expenses of the Fund and other conservative allocation funds underlying variable insurance products. In reviewing the fees and expenses charged to the VA funds, the Board considered the Adviser’s assertion that, because there is much greater disparity in the fees and services that may be provided by a manager to a VA fund as opposed to a retail fund, when comparing the expenses of the various VA funds to those of retail funds, it is most appropriate to focus on total expenses (rather than on the management fees). Accordingly, while the Board reviewed and considered all expenses, it focused on total expenses. The Board considered that the Fund’s total expenses, after waivers, were lower than its peer group median and category median. The Board also considered that the Fund’s contractual management fee was lower than its peer group median and higher than its category median. Within the total asset range of $250 million to $500 million, the Fund’s effective management fee rate was equal to its peer group median and higher than its category median. The Board noted that the Adviser has contractually agreed to limit the Fund’s total annual operating expenses so that those expenses, as percentages of daily net assets, will not exceed the annual rate of 0.67% for Non-Service Shares and 0.92% for Service Shares. This contractual expense limitation may not be amended or withdrawn until one year after the date of the Fund’s prospectus, unless approved by the Board.
Economies of Scale and Profits Realized by the Managers. The Board considered information regarding the Managers’ costs in serving as the Fund’s investment adviser and sub-adviser, including the costs associated with the personnel and systems necessary to manage the Fund, and information regarding the Managers’ profitability from their relationship with the Fund. The Board reviewed whether the Managers may realize
34 OPPENHEIMER CONSERVATIVE BALANCED FUND/VA
economies of scale in managing and supporting the Fund. The Board noted that the Fund currently has management fee breakpoints, which are intended to share with Fund shareholders economies of scale that may exist as the Fund’s assets grow.
Other Benefits to the Managers. In addition to considering the profits realized by the Managers, the Board considered information that was provided regarding the direct and indirect benefits the Managers receive as a result of their relationship with the Fund, including compensation paid to the Managers’ affiliates and research provided to the Adviser in connection with permissible brokerage arrangements (soft dollar arrangements).
Conclusions. These factors were also considered by the independent Trustees meeting separately from the full Board, assisted by experienced counsel to the Fund and to the independent Trustees. Fund counsel and the independent Trustees’ counsel are independent of the Managers within the meaning and intent of the Securities and Exchange Commission Rules.
Based on its review of the information it received and its evaluations described above, the Board, including a majority of the independent Trustees, decided to continue the Agreements through August 31, 2016. In arriving at its decision, the Board did not identify any factor or factors as being more important than others, but considered all of the above information, and considered the terms and conditions of the Agreements, including the management fees, in light of all the surrounding circumstances.
35 OPPENHEIMER CONSERVATIVE BALANCED FUND/VA
PORTFOLIO PROXY VOTING POLICIES AND PROCEDURES; UPDATES TO STATEMENTS OF INVESTMENTS Unaudited
The Fund has adopted Portfolio Proxy Voting Policies and Procedures under which the Fund votes proxies relating to securities (“portfolio proxies”) held by the Fund. A description of the Fund’s Portfolio Proxy Voting Policies and Procedures is available (i) without charge, upon request, by calling the Fund toll-free at 1.800.525.7048, (ii) on the Fund’s website at www.oppenheimerfunds.com, and (iii) on the SEC’s website at www.sec.gov. In addition, the Fund is required to file Form N-PX, with its complete proxy voting record for the 12 months ended June 30th, no later than August 31st of each year. The Fund’s voting record is available (i) without charge, upon request, by calling the Fund toll-free at 1.800.525.7048, and (ii) in the Form N-PX filing on the SEC’s website at www.sec.gov.
The Fund files its complete schedule of portfolio holdings with the SEC for the first quarter and the third quarter of each fiscal year on Form N-Q. The Fund’s Form N-Q filings are available on the SEC’s website at www.sec.gov. Those forms may be reviewed and copied at the SEC’s Public Reference Room in Washington, D.C. Information on the operation of the Public Reference Room may be obtained by calling 1-800-SEC-0330.
36 OPPENHEIMER CONSERVATIVE BALANCED FUND/VA
TRUSTEES AND OFFICERS Unaudited
| | |
| |
| Name, Position(s) Held with the Fund, Length of Service, Age | | Principal Occupation(s) During the Past 5 Years; Other Trusteeships/Directorships Held; Number of Portfolios in the Fund Complex Currently Overseen |
| |
| INDEPENDENT TRUSTEES | | The address of each Trustee in the chart below is 6803 S. Tucson Way, Centennial, Colorado 80112-3924. Each Trustee serves for an indefinite term, or until his or her resignation, retirement, death or removal. |
| |
Sam Freedman, Chairman of the Board of Trustees (since 2013) and Trustee (since 1996) Year of Birth: 1940 | | Director of Colorado UpLIFT (charitable organization) (since September 1984). Mr. Freedman held several positions with the Sub-Adviser and with subsidiary or affiliated companies of the Sub-Adviser (until October 1994). Oversees 47 portfolios in the OppenheimerFunds complex. Mr. Freedman has served on the Boards of certain Oppenheimer funds since 1996, during which time he has become familiar with the Fund’s (and other Oppenheimer funds’) financial, accounting, regulatory and investment matters and has contributed to the Boards’ deliberations. |
| |
Jon S. Fossel, Trustee (since 1990) Year of Birth: 1942 | | Chairman of the Board of Jack Creek Preserve Foundation (non-profit organization) (since 2005); Chairman of the Board (2006-December 2011) and Director (June 2002-December 2011) of UNUMProvident (insurance company); Director of Northwestern Energy Corp. (public utility corporation) (November 2004-December 2009); Director of P.R. Pharmaceuticals (October 1999-October 2003); Director of Rocky Mountain Elk Foundation (non-profit organization) (February 1998-February 2003 and February 2005-February 2007); Chairman and Director (until October 1996) and President and Chief Executive Officer (until October 1995) of the Sub-Adviser; President, Chief Executive Officer and Director of the following: Oppenheimer Acquisition Corp. (“OAC”) (parent holding company of the Sub-Adviser), Shareholders Services, Inc. and Shareholder Financial Services, Inc. (until October 1995). Oversees 47 portfolios in the OppenheimerFunds complex. Mr. Fossel has served on the Boards of certain Oppenheimer funds since 1990, during which time he has become familiar with the Fund’s (and other Oppenheimer funds’) financial, accounting, regulatory and investment matters and has contributed to the Boards’ deliberations. |
| |
Richard F. Grabish, Trustee (since 2012) Year of Birth: 1948 | | Formerly Senior Vice President and Assistant Director of Sales and Marketing (March 1997-December 2007), Director (March 1987-December 2007) and Manager of Private Client Services (June 1985-June 2005) of A.G. Edwards & Sons, Inc. (broker/dealer and investment firm); Chairman and Chief Executive Officer of A.G. Edwards Trust Company, FSB (March 2001- December 2007); President and Vice Chairman of A.G. Edwards Trust Company, FSB (investment adviser) (April 1987-March 2001); President of A.G. Edwards Trust Company, FSB (investment adviser) (June 2005-December 2007). Oversees 47 portfolios in the OppenheimerFunds complex. Mr. Grabish has served on the Boards of certain Oppenheimer funds since 2001, during which time he has become familiar with the Fund’s (and other Oppenheimer funds’) financial, accounting, regulatory and investment matters and has contributed to the Boards’ deliberations. |
| |
Beverly L. Hamilton, Trustee (since 2002) Year of Birth: 1946 | | Trustee of Monterey Institute for International Studies (educational organization) (since February 2000); Board Member of Middlebury College (educational organization) (December 2005-June 2011); Chairman (since 2010) of American Funds’ Emerging Markets Growth Fund, Inc. (mutual fund); Director of The California Endowment (philanthropic organization) (April 2002-April 2008); Director (February 2002-2005) and Chairman of Trustees (2006-2007) of the Community Hospital of Monterey Peninsula; Director (October 1991-2005); Vice Chairman (2006-2009) of American Funds’ Emerging Markets Growth Fund, Inc. (mutual fund); President of ARCO Investment Management Company (February 1991-April 2000); Member of the investment committees of The Rockefeller Foundation (2001-2006) and The University of Michigan (since 2000); Advisor at Credit Suisse First Boston’s Sprout venture capital unit (venture capital fund) (1994-January 2005); Trustee of MassMutual Institutional Funds (investment company) (1996-June 2004); Trustee of MML Series Investment Fund (investment company) (April 1989-June 2004); Member of the investment committee of Hartford Hospital (2000-2003); and Advisor to Unilever (Holland) pension fund (2000-2003). Oversees 47 portfolios in the OppenheimerFunds complex. Ms. Hamilton has served on the Boards of certain Oppenheimer funds since 2002, during which time she has become familiar with the Fund’s (and other Oppenheimer funds’) financial, accounting, regulatory and investment matters and has contributed to the Boards’ deliberations. |
| |
Victoria J. Herget, Trustee (since 2012) Year of Birth:1951 | | Board Chair (2008-Present) and Director (2004-Present), United Educators (insurance company); Trustee (since 2000) and Chair (since 2010), Newberry Library (independent research library); Trustee, Mather LifeWays (senior living organization) (since 2001); Independent Director of the First American Funds (mutual fund family) (2003-2011); former Managing Director (1993-2001), Principal (1985-1993), Vice President (1978-1985) and Assistant Vice President (1973-1978) of Zurich Scudder Investments (investment adviser) (and its predecessor firms); Trustee (1992-2007), Chair of the Board of Trustees (1999-2007), Investment Committee Chair (1994-1999) and Investment Committee member (2007-2010) of Wellesley College; Trustee, BoardSource (non-profit organization) (2006-2009) and Chicago City Day School (K-8 School) (1994-2005). Oversees 47 portfolios in the OppenheimerFunds complex. Ms. Herget has served on the Boards of certain Oppenheimer funds since 2012, during which time she has become familiar with the Fund’s (and other Oppenheimer funds’) financial, accounting, regulatory and investment matters and has contributed to the Boards’ deliberations. |
| |
Robert J. Malone, Trustee (since 2002) Year of Birth: 1944 | | Chairman - Colorado Market of MidFirst Bank (since January 2015); Chairman of the Board (since 2012) and Director (since August 2005) of Jones International University (educational organization); Trustee of the Gallagher Family Foundation (non-profit organization) (2000-2015); Chairman, Chief Executive Officer and Director of Steele Street Bank Trust (commercial banking) (August 2003-January 2015); Board of Directors of Opera Colorado Foundation (non-profit organization) (2008- 2012); Director of Colorado UpLIFT (charitable organization) (1986-2010); Director of Jones Knowledge, Inc. (2006-2010); Former Chairman of U.S. Bank-Colorado (subsidiary of U.S. Bancorp and formerly Colorado National Bank) (July 1996-April 1999); Director of Commercial Assets, Inc. (real estate investment trust) (1993-2000); Director of U.S. Exploration, Inc. (oil and gas exploration) (1997-February 2004); Chairman of the Board (1991-1994) and Trustee (1985-1994) of Regis University; and Chairman of the Board (1990-1991 and Trustee (1984-1999) of Young Presidents Organization. Oversees 47 portfolios in the OppenheimerFunds complex. Mr. Malone has served on the Boards of certain Oppenheimer funds since 2002, during which time he has become familiar with the Fund’s (and other Oppenheimer funds’) financial, accounting, regulatory and investment |
37 OPPENHEIMER CONSERVATIVE BALANCED FUND/VA
TRUSTEES AND OFFICERS Unaudited / Continued
| | |
| | matters and has contributed to the Boards’ deliberations. |
| |
F. William Marshall, Jr., Trustee (since 2000) Year of Birth: 1942 | | Trustee Emeritus of Worcester Polytech Institute (WPI) (private university) (since 2009); Trustee of MassMutual Select Funds (formerly MassMutual Institutional Funds) (investment company) (since 1996), MML Series Investment Fund (investment company) (since 1996) and Mass Mutual Premier Funds (investment company) (since January 2012); President and Treasurer of the SIS Funds (private charitable fund) (January 1999-March 2011); Former Trustee of WPI (1985-2008); Former Chairman of the Board (2004-2006) and Former Chairman of the Investment Committee of WPI (1994-2008); Chairman of SIS Family Bank, F.S.B. (formerly SIS Bank) (commercial bank) (January 1999-July 1999); Executive Vice President of Peoples Heritage Financial Group, Inc. (commercial bank) (January 1999-July 1999); and Former President and Chief Executive Officer of SIS Bancorp. (1993-1999). Oversees 47 portfolios in the OppenheimerFunds complex. Mr. Marshall has served on the Boards of certain Oppenheimer funds since 2000, during which time he has become familiar with the Fund’s (and other Oppenheimer funds’) financial, accounting, regulatory and investment matters and has contributed to the Boards’ deliberations. |
| |
Karen L. Stuckey, Trustee (since 2012) Year of Birth: 1953 | | Partner (1990-2012) of PricewaterhouseCoopers LLP (professional services firm) (held various positions 1975-1990); Trustee (1992-2006) and member of Executive, Nominating and Audit Committees and Chair of Finance Committee of Lehigh University; and member, Women’s Investment Management Forum (professional organization) since inception. Oversees 47 portfolios in the OppenheimerFunds complex. Ms. Stuckey has served on the Boards of certain Oppenheimer funds since 2012, during which time she has become familiar with the Fund’s (and other Oppenheimer funds’) financial, accounting, regulatory and investment matters and has contributed to the Boards’ deliberations. |
| |
James D. Vaughn, Trustee (since 2012) Year of Birth: 1945 | | Retired; former managing partner (1994-2001) of Denver office of Deloitte & Touche LLP, (held various positions 1969-1993); Trustee and Chairman of the Audit Committee of Schroder Funds (2003-2012); Board member and Chairman of Audit Committee of AMG National Trust Bank (since 2005); Trustee, Investment Committee member, University of South Dakota Foundation (since 1996); Board member, Audit Committee Member and past Board Chair, Junior Achievement (since 1993); former Board member, Mile High United Way, Boys and Girls Clubs, Boy Scouts, Colorado Business Committee for the Arts, Economic Club of Colorado and Metro Denver Network. Oversees 47 portfolios in the OppenheimerFunds complex. Mr. Vaughn has served on the Boards of certain Oppenheimer funds since 2012, during which time he has become familiar with the Fund’s (and other Oppenheimer funds’) financial, accounting, regulatory and investment matters and has contributed to the Boards’ deliberations. |
|
| |
INTERESTED TRUSTEE AND OFFICER | | Mr. Steinmetz is an “Interested Trustee” because he is affiliated with the Manager and the Sub-Adviser by virtue of his positions as Chairman and director of the Sub-Adviser and officer and director of the Manager. Both as a Trustee and as an officer, Mr. Steinmetz serves for an indefinite term, or until his resignation, retirement, death or removal. Mr. Steinmetz’s address is 225 Liberty Street, New York, New York 10281-1008. |
| |
Arthur P. Steinmetz Trustee (Since 2015), President and Principal Executive Officer (since 2014) Year of Birth: 1958 | | Chairman of the Sub-Adviser (since January 2015); CEO and Chairman of the Manager (since July 2014), President of the Manager (since May 2013), a Director of the Manager (since January 2013), Director of the Sub-Adviser (since July 2014), President, Management Director and CEO of Oppenheimer Acquisition Corp. (the Sub-Adviser’s parent holding company) (since July 2014), and President and Director of OFI SteelPath, Inc. (since January 2013). Chief Investment Officer of the OppenheimerFunds advisory entities from (January 2013-December 2013); Executive Vice President of the Manager (January 2013-May 2013); Chief Investment Officer of the Sub-Adviser (October 2010-December 2012); Chief Investment Officer, Fixed- Income, of the Sub-Adviser (April 2009-October 2010); Executive Vice President of the Sub-Adviser (October 2009-December 2012); Director of Fixed Income of the Sub-Adviser (January 2009-April 2009); and a Senior Vice President of the Sub-Adviser (March 1993-September 2009). An officer of 101 portfolios in the OppenheimerFunds complex. |
|
| |
| OTHER OFFICERS OF THE FUND | | The addresses of the Officers in the chart below are as follows: for Messrs. Memani, Krantz, Gabinet, Mss. Sexton and Picciotto, 225 Liberty Street, New York, New York 10281-1008, for Mr. Wixted, 6803 S. Tucson Way, Centennial, Colorado 80112-3924. Each Officer serves for an indefinite term or until his or her resignation, retirement, death or removal. |
| |
Krishna Memani, Vice President (since 2009) Year of Birth: 1960 | | President of the Sub-Adviser (since January 2013); Executive Vice President of the Manager (since January 2014) and Chief Investment Officer of the OppenheimerFunds advisory entities (since January 2014). Chief Investment Officer, Fixed Income of the Sub-Adviser (January 2013-December 2013); Head of the Investment Grade Fixed Income Team of the Sub-Adviser (March 2009-January 2014); Director of Fixed Income of the Sub-Adviser (October 2010-December 2012); Senior Vice President of the Sub-Adviser (March 2009-December 2012) and Senior Vice President of OFI Global Institutional, Inc. (April 2009-December 2012). Managing Director and Head of the U.S. and European Credit Analyst Team at Deutsche Bank Securities (June 2006- January 2009). Chief Credit Strategist at Credit Suisse Securities (August 2002-March 2006). Managing Director and Senior Portfolio Manager at Putnam Investments (September 1998-June 2002). A portfolio manager and an officer of other portfolios in the OppenheimerFunds complex. |
| |
Magnus Krantz, Vice President (since 2013) Year of Birth: 1967 | | Vice President of the Sub-Adviser (since May 2009) and a portfolio manager of the Sub-Adviser (since November 2012); sector manager for technology for the Sub-Adviser’s Main Street Investment Team (since May 2009). Prior to joining the Sub- Adviser, Mr. Krantz was a sector manager at RS Investment and Guardian Life Insurance Company. Mr. Krantz joined Guardian Life Insurance Company in December 2005 and transitioned to RS Investments in October 2006 in connection with Guardian Life Insurance Company’s acquisition of an interest in RS Investments. Portfolio manager and analyst at Citigroup Asset Management (1998-2005) and as a consultant at Price Waterhouse (1997-1998). He also served as product development engineer at Newbridge Networks (1993-1996) and as a software engineer at Mitel Corporation (1990-1993). A portfolio manager and officer of other portfolios in the OppenheimerFunds complex. |
38 OPPENHEIMER CONSERVATIVE BALANCED FUND/VA
| | |
Arthur S. Gabinet, Secretary and Chief Legal Officer (since 2011) Year of Birth: 1958 | | Executive Vice President, Secretary and General Counsel of the Manager (since January 2013); General Counsel OFI SteelPath, Inc. (since January 2013); Executive Vice President (May 2010-December 2012) and General Counsel (since January 2011) of the Sub-Adviser; General Counsel of the Distributor (since January 2011); General Counsel of Centennial Asset Management Corporation (January 2011-December 2012); Executive Vice President (January 2011-December 2012) and General Counsel of HarbourView Asset Management Corporation (since January 2011); Assistant Secretary (since January 2011) and Director (since January 2011) of OppenheimerFunds International Ltd. and OppenheimerFunds plc; Director of Oppenheimer Real Asset Management, Inc. (January 2011-December 2012) and General Counsel (since January 2011); Executive Vice President (January 2011-December 2011) and General Counsel of Shareholder Financial Services, Inc. and Shareholder Services, Inc. (since January 2011); Executive Vice President (January 2011-December 2012) and General Counsel of OFI Private Investments Inc. (since January 2011); Vice President of OppenheimerFunds Legacy Program (January 2011-December 2011); Executive Vice President (January 2011-December 2012) and General Counsel of OFI Institutional Asset Management, Inc. (since January 2011); General Counsel, Asset Management of the Sub-Adviser (May 2010-December 2010); Principal, The Vanguard Group (November 2005-April 2010); District Administrator, U.S. Securities and Exchange Commission (January 2003-October 2005). An officer of 101 Portfolios in the OppenheimerFunds complex. |
| |
Jennifer Sexton, Vice President and Chief Business Officer (since 2014) Year of Birth: 1969 | | Senior Vice President of OppenheimerFunds Distributor, Inc. (since June 2014); Vice President of OppenheimerFunds Distributor, Inc. (April 2006-June 2014); Vice President of the Sub-Adviser (January 1998-March 2006); Assistant Vice President of the Sub-Adviser (October 1991-December 1998). An officer of 101 Portfolios in the OppenheimerFunds complex. |
| |
Mary Ann Picciotto, Chief Compliance Officer and Chief Anti-Money Laundering Officer (since 2014) Year of Birth: 1973 | | Senior Vice President and Chief Compliance Officer of the Manager (since March 2014); Chief Compliance Officer of the Sub- Adviser, OFI SteelPath, Inc., OFI Global Trust Company, OFI Global Institutional, Inc., Oppenheimer Real Asset Management, Inc., OFI Private Investments, Inc., Harborview Asset Management Corporation, Trinity Investment Management Corporation, and Shareholder Services, Inc. (since March 2014); Managing Director of Morgan Stanley Investment Management Inc. and certain of its various affiliated entities; Chief Compliance Officer of various Morgan Stanley Funds (May 2010-January 2014); Chief Compliance Officer of Morgan Stanley Investment Management Inc. (April 2007-January 2014). An officer of 101 Portfolios in the OppenheimerFunds complex. |
| |
Brian W. Wixted, Treasurer and Principal Financial & Accounting Officer (since 1999) Year of Birth: 1959 | | Senior Vice President of the Manager (since January 2013); Treasurer of the Sub-Adviser, HarbourView Asset Management Corporation, Shareholder Financial Services, Inc., Shareholder Services, Inc., and Oppenheimer Real Asset Management, Inc. (March 1999-June 2008), OFI Private Investments, Inc. (March 2000-June 2008), OppenheimerFunds International Ltd. and OppenheimerFunds plc (since May 2000), OFI Institutional Asset Management, Inc. (November 2000-June 2008), and OppenheimerFunds Legacy Program (charitable trust program established by the Sub-Adviser) (June 2003-December 2011); Treasurer and Chief Financial Officer of OFI Trust Company (since May 2000); Assistant Treasurer of Oppenheimer Acquisition Corporation (March 1999-June 2008). An officer of 101 Portfolios in the OppenheimerFunds complex. |
The Fund’s Statement of Additional Information contains additional information about the Fund’s Trustees and Officers and is available without charge, upon request, by calling 1.800.988.8287.
39 OPPENHEIMER CONSERVATIVE BALANCED FUND/VA
OPPENHEIMER CONSERVATIVE BALANCED FUND/VA
A Series of Oppenheimer Variable Account Funds
| | |
| Manager | | OFI Global Asset Management, Inc. |
| |
| Sub-Adviser | | OppenheimerFunds, Inc. |
| |
| Distributor | | OppenheimerFunds Distributor, Inc. |
| |
| Transfer and | | OFI Global Asset Management, Inc. |
| Shareholder | | |
| Servicing Agent | | |
| |
| Sub-Transfer Agent | | Shareholder Services, Inc. |
| | DBA OppenheimerFunds Services |
| |
| Independent | | KPMGLLP |
| Registered | | |
| Public | | |
| Accounting | | |
| Firm | | |
| |
| Counsel | | Ropes & Gray LLP |
| |
| | Before investing in any of the Oppenheimer funds, investors should carefully consider a fund’s investment objectives, risks, charges and expenses. Fund prospectuses and summary prospectuses contain this and other information about the funds, and may be obtained by asking your financial advisor, or calling us at 1.800.988.8287. Read prospectuses and summary prospectuses carefully before investing. |
| |
| | © 2016 OppenheimerFunds, Inc. All rights reserved. Oppenheimer funds are distributed by OppenheimerFunds Distributor, Inc. |


PORTFOLIO MANAGER: Michael Kotlarz
AVERAGE ANNUAL TOTAL RETURNS FOR THE PERIODS ENDED 12/31/15
| | | | | | | | | | | | | | |
| | | Inception Date | | 1-Year | | | 5-Year | | | 10-Year | |
Non-Service Shares | | 4/3/85 | | | 3.54 | % | | | 11.83 | % | | | 6.38 | % |
Service Shares | | 9/18/01 | | | 3.27 | | | | 11.55 | | | | 6.12 | |
S&P 500 Index | | – | | | 1.38 | | | | 12.57 | | | | 7.31 | |
Russell 1000 Growth Index | | – | | | 5.67 | | | | 13.53 | | | | 8.53 | |
Performance data quoted represents past performance, which does not guarantee future results. The investment return and principal value of an investment in the Fund will fluctuate so that an investor’s shares, when redeemed, may be worth more or less than their original cost. Current performance may be lower or higher than the performance quoted. For performance data current to the most recent month end, call us at 1.800.988.8287. The Fund’s total returns should not be expected to be the same as the returns of other funds, whether or not both funds have the same portfolio managers and/or similar names. The Fund’s total returns include changes in share price and reinvested distributions but do not include the charges associated with the separate account products that offer this Fund. Such performance would have been lower if such charges were taken into account.
TOP HOLDINGS AND ALLOCATIONS
TOP TEN COMMON STOCK HOLDINGS
| | | | |
| |
Facebook, Inc., Cl. A | | | 5.6% | |
| |
Allergan plc | | | 5.4 | |
| |
LinkedIn Corp., Cl. A | | | 4.6 | |
| |
Gilead Sciences, Inc. | | | 4.2 | |
| |
Alphabet, Inc., Cl. A | | | 3.9 | |
| |
Biogen, Inc. | | | 3.9 | |
| |
Amazon.com, Inc. | | | 3.6 | |
| |
PayPal Holdings, Inc. | | | 3.5 | |
| |
MasterCard, Inc., Cl. A | | | 3.4 | |
| |
Visa, Inc., Cl. A | | | 3.1 | |
| |
Portfolio holdings and allocations are subject to change. Percentages are as of December 31, 2015, and are based on net assets. For more current Fund holdings, please visit oppenheimerfunds.com.
SECTOR ALLOCATION
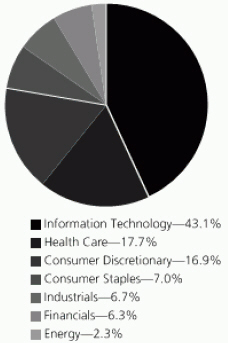
Portfolio holdings and allocations are subject to change. Percentages are as of December 31, 2015, and are based on the total market value of common stocks.
2 OPPENHEIMER CAPITAL APPRECIATION FUND/VA
Fund Performance Discussion
The Fund’s Non-Service shares produced a return of 3.54 % during the reporting period, underperforming the Russell 1000 Growth Index (the “Index”), which returned 5.67% for the same period. The Fund’s underperformance stemmed largely from weaker relative stock selection in the consumer discretionary sector. The Fund outperformed the Index within the information technology, industrials and materials sectors, due primarily to stronger relative stock selection.
MARKET OVERVIEW
2015 will go down as a year in which volatility returned to the financial markets following a multi-year hiatus. Global growth struggled to gain traction as many of the world’s largest economies expanded below their long-term trends. China’s industrial production slowed for the fifth consecutive year and weighed on the world’s exporters—especially commodity producers. In the United States, a strong dollar impaired the competitiveness of many American companies and proved to be a drag on corporate earnings.
The generally disappointing performance of global equity markets was marked by pockets of significant weakness in the energy sector and many emerging markets. U.S. equities generally outperformed their counterparts in other regions in 2015, though with tempered results and only after a market correction in August that tested investors’ nerves. Interest rates globally remained low, even as investors spent most of the year contemplating the first U.S. interest-rate hike by the Federal Reserve (the “Fed”) in almost a decade. The Fed did not raise interest rates until late in the year at its December 16 meeting, when the benchmark federal funds rate was raised by 0.25%.
TOP INDIVIDUAL CONTRIBUTORS
During the reporting period, top performing holdings included Facebook, Inc., Amazon.com, Inc. and Allergan plc. Facebook, the world’s largest social-networking site, had a strong reporting period. Not only did it grow profit and revenue during the reporting period, but it also increased its already massive user base and mobile advertising, as well as usage of its non-Facebook apps like Instagram, Messenger and WhatsApp. E-commerce giant Amazon.com reached an all-time high during the reporting period. The company reported a surprise third-quarter profit, driven by a boost in revenue from its Prime Day promotion and continued strong growth in its cloud-computing offerings. During the reporting period, specialty pharmaceutical company Actavis, with exposure to both generic and branded drugs, continued to augment its growth potential with the closure of its acquisition of Allergan. The company was re-named Allergan during the reporting period.
TOP INDIVIDUAL DETRACTORS
Detractors from performance this reporting period included Western Digital Corp., Oracle Corp. and Valeant Pharmaceuticals International, Inc. Western Digital is a data storage solutions company that announced a decline in net revenues over the first half of the reporting period. Lower demand for enterprise hard drives also hurt the company this period. The market also raised concerns over whether or not Western Digital’s proposed purchase of Sandisk will create shareholder value given an expensive purchase price. Oracle is a provider of enterprise software and computer hardware products, and services. Although Oracle’s cloud business started to gain momentum, the company was negatively impacted by decreasing licensed software sales and a strong dollar, which weighed down its overseas business. Valeant Pharmaceuticals International is a specialty pharmaceutical and medical device company. The company was under pressure over how it prices its drugs and its relationship with Philidor Rx Services, a mail-order pharmacy that it cut ties with at the end of October.
STRATEGY & OUTLOOK
Although the U.S. economy has remained resilient, it continues to grow at a below normal expansionary pace. The U.S. economy’s resilience has been supported by strong productivity gains, low structural energy costs and a relatively attractive currency. Looking forward, we believe the U.S. economy will retain many of these tailwinds and for the markets to reward differentiated valuations to those companies demonstrating consistent quality, growth, and innovation. We expect that companies with capital discipline, strong management, and sustainable competitive advantages, have the greatest prospects for outperformance over time.
Investors should consider the Fund’s investment objective, risks, charges and expenses carefully before investing. The Fund’s prospectus and summary prospectus contain this and other information about the Fund, and may be obtained by asking your financial advisor or calling us at 1.800.988.8287. Read prospectuses and summary prospectuses carefully before investing.
Total returns include changes in share price and reinvestment of dividends and capital gains distributions in a hypothetical investment for the periods shown.
3 OPPENHEIMER CAPITAL APPRECIATION FUND/VA
The Fund’s investment strategy and focus can change over time. The mention of specific fund holdings does not constitute a recommendation by OppenheimerFunds, Inc. or its affiliates.
Shares of Oppenheimer funds are not deposits or obligations of any bank, are not guaranteed by any bank, are not insured by the FDIC or any other agency, and involve investment risks, including the possible loss of the principal amount invested.
Comparing the Fund’s Performance to the Market. The graphs that follow show the performance of a hypothetical $10,000 investment in each share class of the Fund held until December 31, 2015. Performance is measured over a ten-fiscal-year period for both Classes. Performance information does not reflect charges that apply to separate accounts investing in the Fund. If these charges were taken into account, performance would be lower. The graphs assume that all dividends and capital gains distributions were reinvested in additional shares.
The Fund’s performance is compared to the performance of the S&P 500 Index and the Russell 1000 Growth Index. The S&P 500 Index is a broad-based measure of domestic stock performance. The Russell 1000 Growth Index measures the performance of the large-cap growth segment of the U.S. equity universe. It includes those Russell 1000 companies with higher price-to-book ratios and higher forecasted growth values. The Indices are unmanaged and cannot be purchased directly by investors. Index performance is shown for illustrative purposes only and does not predict or depict the performance of the Fund. While index comparisons may be useful to provide a benchmark for the Fund’s performance, it must be noted that the Fund’s investments are not limited to the investments comprising the indices. Index performance includes reinvestment of income, but does not reflect transaction costs, fees, expenses or taxes. Index performance is shown for illustrative purposes only as a benchmark for the Fund’s performance, and does not predict or depict performance of the Fund. The Fund’s performance reflects the effects of the Fund’s business and operating expenses.
4 OPPENHEIMER CAPITAL APPRECIATION FUND/VA
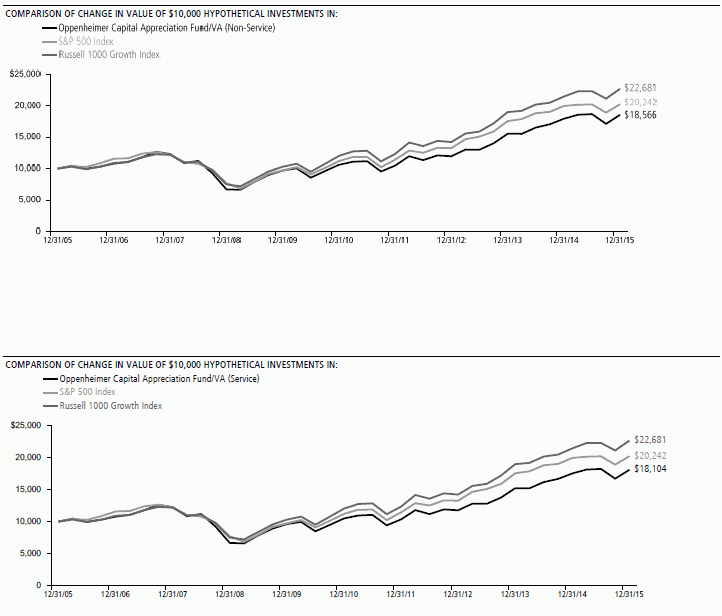
Performance data quoted represents past performance, which does not guarantee future results. The investment return and principal value of an investment in the Fund will fluctuate so that an investor’s shares, when redeemed, may be worth more or less than their original cost. Current performance may be lower or higher than the performance quoted. For performance data current to the most recent month end, call us at 1.800. 988.8287. The Fund’s total returns should not be expected to be the same as the returns of other funds, whether or not both funds have the same portfolio managers and/or similar names. The Fund’s total returns include changes in share price and reinvested distributions but do not include the charges associated with the separate account products that offer this Fund. Such performance would have been lower if such charges were taken into account.
5 OPPENHEIMER CAPITAL APPRECIATION FUND/VA
Fund Expenses
Fund Expenses. As a shareholder of the Fund, you incur two types of costs: (1) transaction costs and (2) ongoing costs, including management fees; distribution and service fees; and other Fund expenses. These examples are intended to help you understand your ongoing costs (in dollars) of investing in the Fund and to compare these costs with the ongoing costs of investing in other mutual funds.
The examples are based on an investment of $1,000.00 invested at the beginning of the period and held for the entire 6-month period ended December 31, 2015.
Actual Expenses. The first section of the table provides information about actual account values and actual expenses. You may use the information in this section for the class of shares you hold, together with the amount you invested, to estimate the expense that you paid over the period. Simply divide your account value by $1,000.00 (for example, an $8,600.00 account value divided by $1,000.00 = 8.60), then multiply the result by the number in the first section under the heading entitled “Expenses Paid During 6 Months Ended December 31, 2015” to estimate the expenses you paid on your account during this period.
Hypothetical Example for Comparison Purposes.
The second section of the table provides information about hypothetical account values and hypothetical expenses based on the Fund’s actual expense ratio for each class of shares, and an assumed rate of return of 5% per year for each class before expenses, which is not the actual return. The hypothetical account values and expenses may not be used to estimate the actual ending account balance or expenses you paid for the period. You may use this information to compare the ongoing costs of investing in the Fund and other funds. To do so, compare this 5% hypothetical example for the class of shares you hold with the 5% hypothetical examples that appear in the shareholder reports of the other funds.
Please note that the expenses shown in the table are meant to highlight your ongoing fund costs only and do not reflect any charges associated with the separate accounts that offer this Fund. Therefore, the “hypothetical” lines of the table are useful in comparing ongoing fund costs only, and will not help you determine the relative total costs of owning different funds. In addition, if these separate account charges were included your costs would have been higher.
| | | | | | | | | | | | |
| Actual | | Beginning Account Value July 1, 2015 | | | Ending Account Value December 31, 2015 | | | Expenses Paid During 6 Months Ended December 31, 2015 | |
| |
Non-Service shares | | $ | 1,000.00 | | | $ | 994.10 | | | $ | 4.03 | |
| |
Service shares | | | 1,000.00 | | | | 992.80 | | | | 5.29 | |
| |
| | | |
| Hypothetical | | | | | | | | | |
| (5% return before expenses) | | | | | | | | | |
| |
Non-Service shares | | | 1,000.00 | | | | 1,021.17 | | | | 4.08 | |
| |
Service shares | | | 1,000.00 | | | | 1,019.91 | | | | 5.36 | |
| |
Expenses are equal to the Fund’s annualized expense ratio for that class, multiplied by the average account value over the period, multiplied by 184/365 (to reflect the one-half year period). Those annualized expense ratios, excluding indirect expenses from affiliated funds, based on the 6-month period ended December 31, 2015 are as follows:
| | | | |
| Class | | Expense Ratios | |
| |
Non-Service shares | | | 0.80% | |
| |
Service shares | | | 1.05 | |
| |
The expense ratios reflect voluntary and/or contractual waivers and/or reimbursements of expenses by the Fund’s Manager. Some of these undertakings may be modified or terminated at any time, as indicated in the Fund’s prospectus. The “Financial Highlights” tables in the Fund’s financial statements, included in this report, also show the gross expense ratios, without such waivers or reimbursements and reduction to custodian expenses, if applicable.
6 OPPENHEIMER CAPITAL APPRECIATION FUND/VA
STATEMENT OF INVESTMENTS December 31, 2015
| | | | | | | | | | |
| | | Shares | | | Value | | | |
| | | |
Common Stocks—99.8% | | | |
| | | |
Consumer Discretionary—16.8% | | | | | | | |
| | | |
Diversified Consumer Services—0.4% | | | |
| | | |
Service Corp. International | | | 133,470 | | | $ | 3,472,889 | | | |
| | | |
| |
Hotels, Restaurants & Leisure—2.1% | | | |
| | | |
McDonald’s Corp. | | | 48,750 | | | | 5,759,325 | | | |
| | | |
Starbucks Corp. | | | 211,940 | | | | 12,722,758 | | | |
| | | | | | | | | | |
| | | | | | | 18,482,083 | | | |
| | | | | | | | | | |
| | | |
Internet & Catalog Retail—5.7% | | | | | | | | | | |
| | | |
Amazon.com, Inc.1 | | | 47,034 | | | | 31,789,810 | | | |
| | | |
Netflix, Inc.1 | | | 73,620 | | | | 8,420,656 | | | |
| | | |
TripAdvisor, Inc.1 | | | 119,880 | | | | 10,219,770 | | | |
| | | | | | | | | | |
| | | | | | | 50,430,236 | | | |
| | | |
Leisure Products—1.2% | | | | | | | | | | |
| | | |
Hasbro, Inc. | | | 155,020 | | | | 10,442,147 | | | |
| | | |
Media—1.8% | | | | | | | | | | |
| | | |
Walt Disney Co. (The) | | | 147,310 | | | | 15,479,335 | | | |
| | | |
Specialty Retail—3.0% | | | | | | | | | | |
| | | |
Foot Locker, Inc. | | | 91,280 | | | | 5,941,415 | | | |
| | | |
Home Depot, Inc. (The) | | | 24,740 | | | | 3,271,865 | | | |
| | | |
TJX Cos., Inc. (The) | | | 249,980 | | | | 17,726,082 | | | |
| | | | | | | | | | |
| | | | | | | 26,939,362 | | | |
| | | |
Textiles, Apparel & Luxury Goods—2.6% | | | |
| | | |
NIKE, Inc., Cl. B | | | 299,840 | | | | 18,740,000 | | | |
| | | |
VF Corp. | | | 71,080 | | | | 4,424,730 | | | |
| | | | | | | | | | |
| | | | | | | 23,164,730 | | | |
| | | |
Consumer Staples—7.0% | | | | | | | | | | |
| | | |
Beverages—1.5% | | | | | | | | | | |
| | | |
Constellation Brands, Inc., Cl. A | | | 92,410 | | | | 13,162,881 | | | |
| | | |
Food & Staples Retailing—5.5% | | | | | | | | | | |
| | | |
Costco Wholesale Corp. | | | 125,760 | | | | 20,310,240 | | | |
| | | |
CVS Health Corp. | | | 171,080 | | | | 16,726,492 | | | |
| | | |
Kroger Co. (The) | | | 264,250 | | | | 11,053,577 | | | |
| | | | | | | | | | |
| | | | | | | 48,090,309 | | | |
| | | |
Energy—2.3% | | | | | | | | | | |
| | | |
Energy Equipment & Services—0.5% | | | |
| | | |
Halliburton Co. | | | 136,400 | | | | 4,643,056 | | | |
| | | |
Oil, Gas & Consumable Fuels—1.8% | | | | | | | | | | |
| | | |
EOG Resources, Inc. | | | 137,180 | | | | 9,710,972 | | | |
| | | |
Newfield Exploration Co.1 | | | 76,700 | | | | 2,497,352 | | | |
| | | |
Pioneer Natural Resources Co. | | | 26,190 | | | | 3,283,702 | | | |
| | | | | | | | | | |
| | | | | | | 15,492,026 | | | |
| | | |
Financials—6.3% | | | | | | | | | | |
| | | |
Capital Markets—2.4% | | | | | | | | | | |
| | | |
Charles Schwab Corp. (The) | | | 609,610 | | | | 20,074,457 | | | |
| | | |
Invesco Ltd. | | | 32,950 | | | | 1,103,166 | | | |
| | | | | | | | | | |
| | | | | | | 21,177,623 | | | |
| | | |
Commercial Banks—3.5% | | | | | | | | | | |
| | | |
JPMorgan Chase & Co. | | | 385,250 | | | | 25,438,058 | | | |
| | | |
SVB Financial Group1 | | | 50,650 | | | | 6,022,285 | | | |
| | | | | | | | | | |
| | | | | | | 31,460,343 | | | |
| | | |
Insurance—0.3% | | | | | | | | | | |
| | | |
Aon plc | | | 25,600 | | | | 2,360,576 | | | |
| | | |
Real Estate Management & Development—0.1% | | | |
| | | |
Realogy Holdings Corp.1 | | | 19,360 | | | | 709,931 | | | |
| | | |
Health Care—17.7% | | | | | | | | | | |
| | | |
Biotechnology—10.3% | | | | | | | | | | |
| | | |
Biogen, Inc.1 | | | 111,870 | | | | 34,271,374 | | | |
| | | |
Celgene Corp.1 | | | 92,544 | | | | 11,083,069 | | | |
| | | | | | | | |
| | | Shares | | | Value | |
| |
Biotechnology (Continued) | | | | | | | | |
| |
Gilead Sciences, Inc. | | | 367,240 | | | $ | 37,161,016 | |
| |
Incyte Corp.1 | | | 36,490 | | | | 3,957,341 | |
| |
Vertex Pharmaceuticals, Inc.1 | | | 36,735 | | | | 4,622,365 | |
| | | | | | | | |
| | | | | | | 91,095,165 | |
| |
Health Care Equipment & Supplies—0.5% | |
| |
Abbott Laboratories | | | 80,100 | | | | 3,597,291 | |
| |
Hologic, Inc.1 | | | 29,290 | | | | 1,133,230 | |
| | | | | | | | |
| | | | | | | 4,730,521 | |
| |
Pharmaceuticals—6.9% | | | | | | | | |
| |
Allergan plc1 | | | 151,720 | | | | 47,412,500 | |
| |
Bristol-Myers Squibb Co. | | | 43,420 | | | | 2,986,862 | |
| |
Perrigo Co. plc | | | 7,900 | | | | 1,143,130 | |
| |
Shire plc, ADR | | | 6,030 | | | | 1,236,150 | |
| |
| Valeant Pharmaceuticals International, Inc.1 | | | 75,287 | | | | 7,652,924 | |
| | | | | | | | |
| | | | | | | 60,431,566 | |
| |
Industrials—6.7% | | | | | | | | |
| |
Aerospace & Defense—1.0% | | | | | | | | |
| |
TransDigm Group, Inc.1 | | | 39,370 | | | | 8,994,077 | |
| |
Building Products—1.0% | | | | | | | | |
| |
A.O. Smith Corp. | | | 54,110 | | | | 4,145,367 | |
| |
Allegion plc | | | 70,500 | | | | 4,647,360 | |
| | | | | | | | |
| | | | | | | 8,792,727 | |
| |
Commercial Services & Supplies—1.3% | |
| |
Cintas Corp. | | | 127,940 | | | | 11,648,937 | |
| |
Electrical Equipment—0.9% | | | | | | | | |
| |
Acuity Brands, Inc. | | | 31,350 | | | | 7,329,630 | |
| |
Industrial Conglomerates—0.9% | | | | | | | | |
| |
Danaher Corp. | | | 85,180 | | | | 7,911,518 | |
| |
Machinery—1.6% | | | | | | | | |
| |
Ingersoll-Rand plc | | | 49,040 | | | | 2,711,422 | |
| |
Stanley Black & Decker, Inc. | | | 79,160 | | | | 8,448,747 | |
| |
Wabtec Corp. | | | 44,480 | | | | 3,163,417 | |
| | | | | | | | |
| | | | | | | 14,323,586 | |
| |
Information Technology—43.0% | | | | | | | | |
| |
Internet Software & Services—16.9% | |
| |
Alphabet, Inc., Cl. A1 | | | 44,480 | | | | 34,605,885 | |
| |
eBay, Inc.1 | | | 914,630 | | | | 25,134,033 | |
| |
Facebook, Inc., Cl. A1 | | | 469,880 | | | | 49,177,641 | |
| |
LinkedIn Corp., Cl. A1 | | | 178,580 | | | | 40,194,786 | |
| | | | | | | | |
| | | | | | | 149,112,345 | |
| |
IT Services—11.1% | | | | | | | | |
| |
Computer Sciences Corp. | | | 119,060 | | | | 3,890,881 | |
| |
CSRA, Inc. | | | 175,770 | | | | 5,273,100 | |
| |
MasterCard, Inc., Cl. A | | | 311,430 | | | | 30,320,825 | |
| |
PayPal Holdings, Inc.1 | | | 858,180 | | | | 31,066,116 | |
| |
Visa, Inc., Cl. A | | | 355,878 | | | | 27,598,339 | |
| | | | | | | | |
| | | | | | | 98,149,261 | |
| |
Semiconductors & Semiconductor Equipment—1.2% | |
| |
NVIDIA Corp. | | | 307,790 | | | | 10,144,758 | |
| |
Software—10.4% | | | | | | | | |
| |
Activision Blizzard, Inc. | | | 487,390 | | | | 18,866,867 | |
| |
Electronic Arts, Inc.1 | | | 261,100 | | | | 17,942,792 | |
| |
Microsoft Corp. | | | 486,380 | | | | 26,984,362 | |
| |
Oracle Corp. | | | 712,640 | | | | 26,032,739 | |
| |
ServiceNow, Inc.1 | | | 25,580 | | | | 2,214,205 | |
| | | | | | | | |
| | | | | | | 92,040,965 | |
| |
Technology Hardware, Storage & Peripherals—3.4% | |
Apple, Inc. | | | 190,640 | | | | 20,066,766 | |
7 OPPENHEIMER CAPITAL APPRECIATION FUND/VA
STATEMENT OF INVESTMENTS Continued
| | | | | | | | | | |
| | | Shares | | | Value | | | |
| | | |
Technology Hardware, Storage & Peripherals (Continued) | | | |
| | | |
Western Digital Corp. | | | 158,360 | | | $ | 9,509,518 | | | |
| | | | | | | | | | |
| | | | | | | 29,576,284 | | | |
| | | | | | | | | | |
Total Common Stocks (Cost $675,278,688) | | | | 879,788,867 | | | |
| | | | | | | | | | |
| | | | | | | | | | |
| | | | | | | | | | |
| | | | | | | | | | |
| | | | | | | | | | |
| | | | | | | | |
| | | Shares | | | Value | |
| |
Investment Company—0.9% | |
| |
Oppenheimer Institutional Money Market Fund, Cl. E, 0.30%2,3 (Cost $8,225,463) | | | 8,225,463 | | | $ | 8,225,463 | |
| |
Total Investments, at Value (Cost $683,504,151) | | | 100.7% | | | | 888,014,330 | |
| |
Net Other Assets (Liabilities) | | | (0.7) | | | | (5,762,889) | |
| | | | |
Net Assets | | | 100.0% | | | $ | 882,251,441 | |
| | | | |
Footnotes to Statement of Investments
1. Non-income producing security.
2. Is or was an affiliate, as defined in the Investment Company Act of 1940, as amended, at or during the reporting period, by virtue of the Fund owning at least 5% of the voting securities of the issuer or as a result of the Fund and the issuer having the same investment adviser. Transactions during the reporting period in which the issuer was an affiliate are as follows:
| | | | | | | | | | | | | | | | |
| | | Shares
December 31, 2014 | | | Gross
Additions | | | Gross
Reductions | | | Shares
December 31, 2015 | |
| |
Oppenheimer Institutional Money Market Fund, Cl. E | | | 3,087,900 | | | | 178,973,504 | | | | 173,835,941 | | | | 8,225,463 | |
| | | | |
| | | | | | | | | Value | | | Income | |
| |
Oppenheimer Institutional Money Market Fund, Cl. E | | | | | | | | | | $ | 8,225,463 | | | $ | 9,439 | |
3. Rate shown is the 7-day yield at period end.
See accompanying Notes to Financial Statements.
8 OPPENHEIMER CAPITAL APPRECIATION FUND/VA
STATEMENT OF ASSETS AND LIABILITIES December 31, 2015
| | | | |
| |
Assets | | | | |
Investments, at value—see accompanying statement of investments: | | | | |
Unaffiliated companies (cost $675,278,688) | | $ | 879,788,867 | |
Affiliated companies (cost $8,225,463) | | | 8,225,463 | |
| | | | |
| | | 888,014,330 | |
| |
Cash | | | 1,999,999 | |
| |
Receivables and other assets: | |
Dividends | | | 515,404 | |
Shares of beneficial interest sold | | | 144,227 | |
Other | | | 67,473 | |
| | | | |
Total assets | | | 890,741,433 | |
|
| |
Liabilities | | | | |
Payables and other liabilities: | | | | |
Shares of beneficial interest redeemed | | | 8,286,562 | |
Distribution and service plan fees | | | 69,289 | |
Trustees’ compensation | | | 61,117 | |
Shareholder communications | | | 41,362 | |
Other | | | 31,662 | |
| | | | |
Total liabilities | | | 8,489,992 | |
| | | | |
|
| |
Net Assets | | $ | 882,251,441 | |
| | | | |
|
| |
Composition of Net Assets | | | | |
Par value of shares of beneficial interest | | $ | 15,971 | |
| |
Additional paid-in capital | | | 594,907,610 | |
| |
Accumulated net investment income | | | 1,047,015 | |
| |
Accumulated net realized gain on investments and foreign currency transactions | | | 81,790,101 | |
| |
Net unrealized appreciation on investments and translation of assets and liabilities denominated in foreign currencies | | | 204,490,744 | |
| | | | |
Net Assets | | $ | 882,251,441 | |
| | | | |
|
| |
Net Asset Value Per Share | | | | |
Non-Service Shares: | | | | |
| Net asset value, redemption price per share and offering price per share (based on net assets of $564,514,287 and 10,173,666 shares of beneficial interest outstanding) | | | $55.49 | |
| |
Service Shares: | | | | |
| Net asset value, redemption price per share and offering price per share (based on net assets of $317,737,154 and 5,797,693 shares of beneficial interest outstanding) | | | $54.80 | |
See accompanying Notes to Financial Statements.
9 OPPENHEIMER CAPITAL APPRECIATION FUND/VA
STATEMENT OF OPERATIONS For the Year Ended December 31, 2015
| | | | |
| |
Investment Income | | | | |
Dividends: | | | | |
Unaffiliated companies (net of foreign withholding taxes of $11,653) | | $ | 10,851,760 | |
Affiliated companies | | | 9,439 | |
| | | | |
Total investment income | | | 10,861,199 | |
| |
Expenses | | | | |
Management fees | | | 6,445,151 | |
Distribution and service plan fees-Service shares | | | 831,680 | |
| |
Transfer and shareholder servicing agent fees: | | | | |
Non-Service shares | | | 601,501 | |
Service shares | | | 332,694 | |
| |
Shareholder communications: | | | | |
Non-Service shares | | | 64,123 | |
Service shares | | | 35,402 | |
| |
Trustees’ compensation | | | 34,289 | |
| |
Custodian fees and expenses | | | 13,715 | |
| |
Borrowing fees | | | 6,730 | |
| |
Other | | | 67,353 | |
| | | | |
Total expenses | | | 8,432,638 | |
Less reduction to custodian expenses | | | (866) | |
Less waivers and reimbursements of expenses | | | (119,285) | |
| | | | |
Net expenses | | | 8,312,487 | |
| |
Net Investment Income | | | 2,548,712 | |
| |
Realized and Unrealized Gain (Loss) | | | | |
Net realized gain on: | | | | |
Investments from unaffiliated companies | | | 91,591,300 | |
Foreign currency transactions | | | 10,167 | |
| | | | |
Net realized gain | | | 91,601,467 | |
| |
Net change in unrealized appreciation/depreciation on: | | | | |
Investments | | | (62,458,970) | |
Translation of assets and liabilities denominated in foreign currencies | | | 274,050 | |
| | | | |
Net change in unrealized appreciation/depreciation | | | (62,184,920) | |
| |
Net Increase in Net Assets Resulting from Operations | | $ | 31,965,259 | |
| | | | |
See accompanying Notes to Financial Statements.
10 OPPENHEIMER CAPITAL APPRECIATION FUND/VA
STATEMENTS OF CHANGES IN NET ASSETS
| | | | | | | | |
| | | Year Ended
December 31, 2015 | | | Year Ended
December 31, 2014 | |
| |
Operations | | | | | | | | |
Net investment income | | $ | 2,548,712 | | | $ | 594,123 | |
| |
Net realized gain | | | 91,601,467 | | | | 183,603,215 | |
| |
Net change in unrealized appreciation/depreciation | | | (62,184,920) | | | | (48,516,600) | |
| | | | | | | | |
Net increase in net assets resulting from operations | | | 31,965,259 | | | | 135,680,738 | |
| |
Dividends and/or Distributions to Shareholders | | | | | | | | |
Dividends from net investment income: | | | | | | | | |
Non-Service shares | | | (554,707) | | | | (2,755,561) | |
Service shares | | | — | | | | (632,322) | |
| | | | |
| | | (554,707) | | | | (3,387,883) | |
| |
Distributions from net realized gain: | | | | | | | | |
Non-Service shares | | | (106,184,924) | | | | (15,002,872) | |
Service shares | | | (59,885,291) | | | | (8,466,690) | |
| | | | |
| | | (166,070,215) | | | | (23,469,562) | |
| |
Beneficial Interest Transactions | | | | | | | | |
Net increase (decrease) in net assets resulting from beneficial interest transactions: | | | | | | | | |
Non-Service shares | | | 32,611,326 | | | | (80,263,666) | |
Service shares | | | 30,119,410 | | | | (65,500,468) | |
| | | | | | | | |
| | | 62,730,736 | | | | (145,764,134) | |
| |
Net Assets | | | | | | | | |
Total decrease | | | (71,928,927) | | | | (36,940,841) | |
| |
Beginning of period | | | 954,180,368 | | | | 991,121,209 | |
| | | | | | | | |
End of period (including accumulated net investment income (loss) of $1,047,015 and $(837,141), respectively) | | $ | 882,251,441 | | | $ | 954,180,368 | |
| | | | |
See accompanying Notes to Financial Statements.
11 OPPENHEIMER CAPITAL APPRECIATION FUND/VA
FINANCIAL HIGHLIGHTS
| | | | | | | | | | | | | | | | | | | | |
| Non-Service Shares | | Year Ended
December 31, 2015 | | | Year Ended
December 31, 2014 | | | Year Ended
December 31, 2013 | | | Year Ended
December 31, 2012 | | | Year Ended
December 30, 20111 | |
| |
Per Share Operating Data | | | | | | | | | | | | | | | | | | | | |
Net asset value, beginning of period | | $ | 64.87 | | | $ | 57.88 | | | $ | 45.06 | | | $ | 39.75 | | | $ | 40.35 | |
| |
Income (loss) from investment operations: | | | | | | | | | | | | | | | | | | | | |
Net investment income2 | | | 0 .22 | | | | 0.09 | | | | 0.23 | | | | 0.42 | | | | 0.23 | |
Net realized and unrealized gain (loss) | | | 2.25 | | | | 8.64 | | | | 13.09 | | | | 5.18 | | | | (0.69) | |
| | | | |
Total from investment operations | | | 2.47 | | | | 8.73 | | | | 13.32 | | | | 5.60 | | | | (0.46) | |
| |
Dividends and/or distributions to shareholders: | | | | | | | | | | | | | | | | | | | | |
Dividends from net investment income | | | (0.06) | | | | (0.27) | | | | (0.50) | | | | (0.29) | | | | (0.14) | |
Distributions from net realized gain | | | (11.79) | | | | (1.47) | | | | 0.00 | | | | 0.00 | | | | 0.00�� | |
| | | | |
Total dividends and/or distributions to shareholders | | | (11.85) | | | | (1.74) | | | | (0.50) | | | | (0.29) | | | | (0.14) | |
| |
Net asset value, end of period | | $ | 55.49 | | | $ | 64.87 | | | $ | 57.88 | | | $ | 45.06 | | | $ | 39.75 | |
| | | | |
| | | | |
| |
Total Return, at Net Asset Value3 | | | 3.54% | | | | 15.41% | | | | 29.74% | | | | 14.12% | | | | (1.15)% | |
| |
Ratios/Supplemental Data | | | | | | | | | | | | | | | | | | | | |
Net assets, end of period (in thousands) | | $ | 564,514 | | | $ | 616,862 | | | $ | 626,907 | | | $ | 573,684 | | | $ | 637,868 | |
| |
Average net assets (in thousands) | | $ | 601,110 | | | $ | 614,272 | | | $ | 595,912 | | | $ | 600,121 | | | $ | 713,770 | |
| |
Ratios to average net assets:4 | | | | | | | | | | | | | | | | | | | | |
Net investment income | | | 0.36% | | | | 0.15% | | | | 0.44% | | | | 0.95% | | | | 0.57% | |
Expenses excluding interest and fees from borrowings | | | 0.81% | | | | 0.80% | | | | 0.81% | | | | 0.81% | | | | 0.80% | |
Interest and fees from borrowings | | | 0.00%5 | | | | 0.00% | | | | 0.00% | | | | 0.00% | | | | 0.00% | |
| | | | |
Total expenses6 | | | 0.81% | | | | 0.80% | | | | 0.81% | | | | 0.81% | | | | 0.80% | |
Expenses after payments, waivers and/or reimbursements and reduction to custodian expenses | | | 0.80% | | | | 0.80% | | | | 0.80% | | | | 0.80% | | | | 0.80% | |
| |
Portfolio turnover rate | | | 60% | | | | 61% | | | | 77% | | | | 28% | | | | 27% | |
1. December 30, 2011 represents the last business day of the Fund’s reporting period. See Note 2 of the accompanying Notes.
2. Per share amounts calculated based on the average shares outstanding during the period.
3. Assumes an initial investment on the business day before the first day of the fiscal period, with all dividends and distributions reinvested in additional shares on the reinvestment date, and redemption at the net asset value calculated on the last business day of the fiscal period. Total returns are not annualized for periods less than one full year. Total return information does not reflect expenses that apply at the separate account level or to related insurance products. Inclusion of these charges would reduce the total return figures for all periods shown. Returns do not reflect the deduction of taxes that a shareholder would pay on fund distributions or the redemption of fund shares.
4. Annualized for periods less than one full year.
5. Less than 0.005%.
6. Total expenses including indirect expenses from affiliated fund fees and expenses were as follows:
| | | | | | |
| | Year Ended December 31, 2015 | | 0.81% | | |
| | Year Ended December 31, 2014 | | 0.80% | | |
| | Year Ended December 31, 2013 | | 0.81% | | |
| | Year Ended December 31, 2012 | | 0.81% | | |
| | Year Ended December 30, 2011 | | 0.80% | | |
See accompanying Notes to Financial Statements.
12 OPPENHEIMER CAPITAL APPRECIATION FUND/VA
| | | | | | | | | | | | | | | | | | | | |
| Service Shares | | Year Ended
December
31, 2015 | | | Year Ended
December
31, 2014 | | | Year Ended
December
31, 2013 | | | Year Ended
December
31, 2012 | | | Year Ended
December
30, 20111 | |
| |
Per Share Operating Data | | | | | | | | | | | | | | | | | | | | |
Net asset value, beginning of period | | $ | 64.30 | | | $ | 57.37 | | | $ | 44.66 | | | $ | 39.40 | | | $ | 39.99 | |
| |
Income (loss) from investment operations: | | | | | | | | | | | | | | | | | | | | |
Net investment income (loss)2 | | | 0.07 | | | | (0.06) | | | | 0.10 | | | | 0.31 | | | | 0.13 | |
Net realized and unrealized gain (loss) | | | 2.22 | | | | 8.57 | | | | 12.98 | | | | 5.12 | | | | (0.68) | |
| | | | |
Total from investment operations | | | 2.29 | | | | 8.51 | | | | 13.08 | | | | 5.43 | | | | (0.55) | |
| |
Dividends and/or distributions to shareholders: | | | | | | | | | | | | | | | | | | | | |
Dividends from net investment income | | | 0.00 | | | | (0.11) | | | | (0.37) | | | | (0.17) | | | | (0.04) | |
Distributions from net realized gain | | | (11.79) | | | | (1.47) | | | | 0.00 | | | | 0.00 | | | | 0.00 | |
| | | | |
Total dividends and/or distributions to shareholders | | | (11.79) | | | | (1.58) | | | | (0.37) | | | | (0.17) | | | | (0.04) | |
| |
Net asset value, end of period | | $ | 54.80 | | | $ | 64.30 | | | $ | 57.37 | | | $ | 44.66 | | | $ | 39.40 | |
| | | | |
| | | | |
| |
Total Return, at Net Asset Value3 | | | 3.27% | | | | 15.13% | | | | 29.43% | | | | 13.81% | | | | (1.37)% | |
| |
Ratios/Supplemental Data | | | | | | | | | | | | | | | | | | | | |
Net assets, end of period (in thousands) | | $ | 317,737 | | | $ | 337,318 | | | $ | 364,214 | | | $ | 366,664 | | | $ | 375,330 | |
| |
Average net assets (in thousands) | | $ | 332,468 | | | $ | 343,254 | | | $ | 367,615 | | | $ | 382,196 | | | $ | 407,413 | |
| |
Ratios to average net assets:4 | | | | | | | | | | | | | | | | | | | | |
Net investment income (loss) | | | 0.12% | | | | (0.10)% | | | | 0.20% | | | | 0.71% | | | | 0.32% | |
Expenses excluding interest and fees from borrowings | | | 1.06% | | | | 1.05% | | | | 1.06% | | | | 1.06% | | | | 1.05% | |
Interest and fees from borrowings | | | 0.00%5 | | | | 0.00% | | | | 0.00% | | | | 0.00% | | | | 0.00% | |
| | | | |
Total expenses6 | | | 1.06% | | | | 1.05% | | | | 1.06% | | | | 1.06% | | | | 1.05% | |
Expenses after payments, waivers and/or reimbursements and reduction to custodian expenses | | | 1.05% | | | | 1.05% | | | | 1.05% | | | | 1.05% | | | | 1.05% | |
| |
Portfolio turnover rate | | | 60% | | | | 61% | | | | 77% | | | | 28% | | | | 27% | |
1. December 30, 2011 represents the last business day of the Fund’s reporting period. See Note 2 of the accompanying Notes.
2. Per share amounts calculated based on the average shares outstanding during the period.
3. Assumes an initial investment on the business day before the first day of the fiscal period, with all dividends and distributions reinvested in additional shares on the reinvestment date, and redemption at the net asset value calculated on the last business day of the fiscal period. Total returns are not annualized for periods less than one full year. Total return information does not reflect expenses that apply at the separate account level or to related insurance products. Inclusion of these charges would reduce the total return figures for all periods shown. Returns do not reflect the deduction of taxes that a shareholder would pay on fund distributions or the redemption of fund shares.
4. Annualized for periods less than one full year.
5. Less than 0.005%.
6. Total expenses including indirect expenses from affiliated fund fees and expenses were as follows:
| | | | | | |
| | Year Ended December 31, 2015 | | 1.06% | | |
| | Year Ended December 31, 2014 | | 1.05% | | |
| | Year Ended December 31, 2013 | | 1.06% | | |
| | Year Ended December 31, 2012 | | 1.06% | | |
| | Year Ended December 30, 2011 | | 1.05% | | |
See accompanying Notes to Financial Statements.
13 OPPENHEIMER CAPITAL APPRECIATION FUND/VA
NOTES TO FINANCIAL STATEMENTS December 31, 2015
1. Organization
Oppenheimer Capital Appreciation Fund/VA (the “Fund”), a separate series of Oppenheimer Variable Account Funds, is a diversified open-end management investment company registered under the Investment Company Act of 1940 (“1940 Act”), as amended. The Fund’s investment objective is to seek capital appreciation. The Fund’s investment adviser is OFI Global Asset Management, Inc. (“OFI Global” or the “Manager”), a wholly-owned subsidiary of OppenheimerFunds, Inc. (“OFI” or the “Sub-Adviser”). The Manager has entered into a sub-advisory agreement with OFI. Shares of the Fund are sold only to separate accounts of life insurance companies.
The Fund offers two classes of shares. Both classes are sold at their offering price, which is the net asset value per share, to separate investment accounts of participating insurance companies as an underlying investment for variable life insurance policies, variable annuity contracts or other investment products. The class of shares designated as Service shares is subject to a distribution and service plan. Both classes of shares have identical rights and voting privileges with respect to the Fund in general and exclusive voting rights on matters that affect that class alone. Earnings, net assets and net asset value per share may differ due to each class having its own expenses, such as transfer and shareholder servicing agent fees and shareholder communications, directly attributable to that class.
The following is a summary of significant accounting policies followed in the Fund’s preparation of financial statements in accordance with accounting principles generally accepted in the United States (“U.S. GAAP”).
2. Significant Accounting Policies
Security Valuation. All investments in securities are recorded at their estimated fair value, as described in Note 3.
Reporting Period End Date. The last day of the Fund’s reporting period is the last day the New York Stock Exchange was open for trading during the period. The Fund’s financial statements have been presented through that date to maintain consistency with the Fund’s net asset value calculations used for shareholder transactions.
Foreign Currency Translation. The Fund’s accounting records are maintained in U.S. dollars. The values of securities denominated in foreign currencies and amounts related to the purchase and sale of foreign securities and foreign investment income are translated into U.S. dollars as of the close of the New York Stock Exchange (the “Exchange”), normally 4:00 P.M. Eastern time, on each day the Exchange is open for trading. Foreign exchange rates may be valued primarily using a reliable bank, dealer or service authorized by the Board of Trustees.
Reported net realized gains and losses from foreign currency transactions arise from sales of portfolio securities, sales and maturities of short-term securities, sales of foreign currencies, exchange rate fluctuations between the trade and settlement dates on securities transactions, and the difference between the amounts of dividends, interest, and foreign withholding taxes recorded on the Fund’s books and the U.S. dollar equivalent of the amounts actually received or paid. Net unrealized appreciation and depreciation on the translation of assets and liabilities denominated in foreign currencies arise from changes in the values of assets and liabilities, including investments in securities at fiscal period end, resulting from changes in exchange rates.
The effect of changes in foreign currency exchange rates on investments is separately identified from the fluctuations arising from changes in market values of securities held and reported with all other foreign currency gains and losses in the Fund’s Statement of Operations.
Allocation of Income, Expenses, Gains and Losses. Income, expenses (other than those attributable to a specific class), gains and losses are allocated on a daily basis to each class of shares based upon the relative proportion of net assets represented by such class. Operating expenses directly attributable to a specific class are charged against the operations of that class.
Dividends and Distributions to Shareholders. Dividends and distributions to shareholders, which are determined in accordance with income tax regulations and may differ from U.S. GAAP, are recorded on the ex-dividend date. Income and capital gain distributions, if any, are declared and paid annually or at other times as deemed necessary by the Manager.
Investment Income. Dividend income is recorded on the ex-dividend date or upon ex-dividend notification in the case of certain foreign dividends where the ex-dividend date may have passed. Non-cash dividends included in dividend income, if any, are recorded at the fair market value of the securities received. Interest income is recognized on an accrual basis. Discount and premium, which are included in interest income on the Statement of Operations, are amortized or accreted daily.
Custodian Fees. “Custodian fees and expenses” in the Statement of Operations may include interest expense incurred by the Fund on any cash overdrafts of its custodian account during the period. Such cash overdrafts may result from the effects of failed trades in portfolio securities and from cash outflows resulting from unanticipated shareholder redemption activity. The Fund pays interest to its custodian on such cash overdrafts, to the extent they are not offset by positive cash balances maintained by the Fund, at a rate equal to the Federal Funds Rate plus 0.50%. The “Reduction to custodian expenses” line item, if applicable, represents earnings on cash balances maintained by the Fund during the period. Such interest expense and other custodian fees may be paid with these earnings.
Security Transactions. Security transactions are recorded on the trade date. Realized gains and losses on securities sold are determined on the basis of identified cost.
Indemnifications. The Fund’s organizational documents provide current and former Trustees and officers with a limited indemnification against liabilities arising in connection with the performance of their duties to the Fund. In the normal course of business, the Fund may also enter into contracts
14 OPPENHEIMER CAPITAL APPRECIATION FUND/VA
2. Significant Accounting Policies (Continued)
that provide general indemnifications. The Fund’s maximum exposure under these arrangements is unknown as this would be dependent on future claims that may be made against the Fund. The risk of material loss from such claims is considered remote.
Federal Taxes. The Fund intends to comply with provisions of the Internal Revenue Code applicable to regulated investment companies and to distribute substantially all of its investment company taxable income, including any net realized gain on investments not offset by capital loss carryforwards, if any, to shareholders. Therefore, no federal income or excise tax provision is required. The Fund files income tax returns in U.S. federal and applicable state jurisdictions. The statute of limitations on the Fund’s tax return filings generally remains open for the three preceding fiscal reporting period ends.
The tax components of capital shown in the following table represent distribution requirements the Fund must satisfy under the income tax regulations, losses the Fund may be able to offset against income and gains realized in future years and unrealized appreciation or depreciation of securities and other investments for federal income tax purposes.
| | | | | | | | | | | | |
Undistributed Net Investment Income | | Undistributed
Long-Term
Gain | | | Accumulated
Loss
Carryforward | | | Net Unrealized
Appreciation Based on cost of
Securities and Other Investments
for Federal Income
Tax Purposes | |
| |
$2,430,374 | | | $82,511,230 | | | | $— | | | | $203,629,978 | |
Net investment income (loss) and net realized gain (loss) may differ for financial statement and tax purposes. The character of dividends and distributions made during the fiscal year from net investment income or net realized gains are determined in accordance with federal income tax requirements, which may differ from the character of net investment income or net realized gains presented in those financial statements in accordance with U.S. GAAP. Also, due to timing of dividends and distributions, the fiscal year in which amounts are distributed may differ from the fiscal year in which the income or net realized gain was recorded by the Fund.
Accordingly, the following amounts have been reclassified for the reporting period. Net assets of the Fund were unaffected by the reclassifications.
| | | | | | | | |
Increase to Paid-in Capital | | Reduction to Accumulated
Net Investment
Income | | | Reduction to Accumulated Net
Realized Gain on Investments1 | |
| |
$8,762,833 | | | $109,849 | | | | $8,652,984 | |
1. $8,762,833, all of which was long-term capital gain, was distributed in connection with Fund share redemptions.
The tax character of distributions paid during the reporting periods:
| | | | | | | | |
| | | Year Ended
December 31, 2015 | | | Year Ended
December 31, 2014 | |
| |
Distributions paid from: | | | | | | | | |
Ordinary income | | $ | 24,673,136 | | | $ | 3,387,883 | |
Long-term capital gain | | | 141,951,786 | | | | 23,469,562 | |
| | | | |
Total | | $ | 166,624,922 | | | $ | 26,857,445 | |
| | | | |
The aggregate cost of securities and other investments and the composition of unrealized appreciation and depreciation of securities and other investments for federal income tax purposes at period end are noted in the following table. The primary difference between book and tax appreciation or depreciation of securities and other investments, if applicable, is attributable to the tax deferral of losses or tax realization of financial statement unrealized gain or loss.
| | | | |
Federal tax cost of securities | | | $ 684,364,917 | |
| | | | |
| |
Gross unrealized appreciation | | | $ 223,873,312 | |
Gross unrealized depreciation | | | (20,243,334) | |
| | | | |
Net unrealized appreciation | | | $ 203,629,978 | |
| | | | |
Use of Estimates. The preparation of financial statements in conformity with U.S. GAAP requires management to make estimates and assumptions that affect the reported amounts of assets and liabilities and disclosure of contingent assets and liabilities at the date of the financial statements and the reported amounts of increases and decreases in net assets from operations during the reporting period. Actual results could differ from those estimates.
15 OPPENHEIMER CAPITAL APPRECIATION FUND/VA
NOTES TO FINANCIAL STATEMENTS Continued
3. Securities Valuation
The Fund calculates the net asset value of its shares as of the close of the New York Stock Exchange (the “Exchange”), normally 4:00 P.M. Eastern time, on each day the Exchange is open for trading, except in the case of a scheduled early closing of the Exchange, in which case the Fund will calculate net asset value of the shares as of the scheduled early closing time of the Exchange.
The Fund’s Board has adopted procedures for the valuation of the Fund’s securities and has delegated the day-to-day responsibility for valuation determinations under those procedures to the Manager. The Manager has established a Valuation Committee which is responsible for determining a “fair valuation” for any security for which market quotations are not “readily available.” The Valuation Committee’s fair valuation determinations are subject to review, approval and ratification by the Fund’s Board at its next regularly scheduled meeting covering the calendar quarter in which the fair valuation was determined.
Valuation Methods and Inputs
Securities are valued using unadjusted quoted market prices, when available, as supplied primarily by third party pricing services or dealers.
The following methodologies are used to determine the market value or the fair value of the types of securities described below:
Securities traded on a registered U.S. securities exchange (including exchange-traded derivatives other than futures and futures options) are valued based on the last sale price of the security reported on the principal exchange on which it is traded, prior to the time when the Fund’s assets are valued. In the absence of a sale, the security is valued at the mean between the bid and asked price on the principal exchange or, if not available from the principal exchange, obtained from two dealers. If bid and asked prices are not available from either the exchange or two dealers, the security is valued by using one of the following methodologies (listed in order of priority): (1) a bid from the principal exchange, (2) the mean between the bid and asked price as provided by a single dealer, or (3) a bid from a single dealer. A security of a foreign issuer traded on a foreign exchange, but not listed on a registered U.S. securities exchange, is valued based on the last sale price on the principal exchange on which the security is traded, as identified by the third party pricing service used by the Manager, prior to the time when the Fund’s assets are valued. If the last sale price is unavailable, the security is valued at the most recent official closing price on the principal exchange on which it is traded. If the last sales price or official closing price for a foreign security is not available, the security is valued at the mean between the bid and asked price per the exchange or, if not available from the exchange, obtained from two dealers. If bid and asked prices are not available from either the exchange or two dealers, the security is valued by using one of the following methodologies (listed in order of priority): (1) a bid from the exchange, (2) the mean between the bid and asked price as provided by a single dealer, or (3) a bid from a single dealer.
Shares of a registered investment company that are not traded on an exchange are valued at that investment company’s net asset value per share. Corporate and government debt securities (of U.S. or foreign issuers) and municipal debt securities, event-linked bonds, loans, mortgage-backed securities, collateralized mortgage obligations, and asset-backed securities are valued at the mean between the “bid” and “asked” prices utilizing evaluated prices obtained from third party pricing services or broker-dealers who may use matrix pricing methods to determine the evaluated prices.
Short-term money market type debt securities with a remaining maturity of sixty days or less are valued at cost adjusted by the amortization of discount or premium to maturity (amortized cost), which approximates market value. Short-term debt securities with a remaining maturity in excess of sixty days are valued at the mean between the “bid” and “asked” prices utilizing evaluated prices obtained from third party pricing services or broker-dealers.
A description of the standard inputs that may generally be considered by the third party pricing vendors in determining their evaluated prices is provided below.
| | |
| Security Type | | Standard inputs generally considered by third-party pricing vendors |
| Corporate debt, government debt, municipal, mortgage- backed and asset-backed securities | | Reported trade data, broker-dealer price quotations, benchmark yields, issuer spreads on comparable securities, the credit quality, yield, maturity, and other appropriate factors. |
| Loans | | Information obtained from market participants regarding reported trade data and broker-dealer price quotations. |
| Event-linked bonds | | Information obtained from market participants regarding reported trade data and broker-dealer price quotations. |
If a market value or price cannot be determined for a security using the methodologies described above, or if, in the “good faith” opinion of the Manager, the market value or price obtained does not constitute a “readily available market quotation,” or a significant event has occurred that would materially affect the value of the security, the security is fair valued either (i) by a standardized fair valuation methodology applicable to the security type or the significant event as previously approved by the Valuation Committee and the Fund’s Board or (ii) as determined in good faith by the Manager’s Valuation Committee. The Valuation Committee considers all relevant facts that are reasonably available, through either public information or information available to the Manager, when determining the fair value of a security. Fair value determinations by the Manager are subject to review, approval and ratification by the Fund’s Board at its next regularly scheduled meeting covering the calendar quarter in which the fair valuation was determined. Those fair valuation standardized methodologies include, but are not limited to, valuing securities at the last sale price or initially at cost and subsequently adjusting the value based on: changes in company specific fundamentals, changes in an appropriate securities index, or changes in the value of similar securities which may be further adjusted for any discounts related to security-specific resale restrictions. When possible, such methodologies use observable market inputs such as unadjusted quoted prices of similar securities, observable interest rates, currency rates and yield curves. The methodologies used for valuing securities are not necessarily an indication of the risks associated with investing in those securities nor can it be assured that the Fund can obtain the fair value assigned to a security if it were to sell the security.
To assess the continuing appropriateness of security valuations, the Manager, or its third party service provider who is subject to oversight by the Manager, regularly compares prior day prices, prices on comparable securities, and sale prices to the current day prices and challenges those prices
16 OPPENHEIMER CAPITAL APPRECIATION FUND/VA
3. Securities Valuation (Continued)
exceeding certain tolerance levels with the third party pricing service or broker source. For those securities valued by fair valuations, whether through a standardized fair valuation methodology or a fair valuation determination, the Valuation Committee reviews and affirms the reasonableness of the valuations based on such methodologies and fair valuation determinations on a regular basis after considering all relevant information that is reasonably available.
Classifications
Each investment asset or liability of the Fund is assigned a level at measurement date based on the significance and source of the inputs to its valuation. Various data inputs are used in determining the value of each of the Fund’s investments as of the reporting period end. These data inputs are categorized in the following hierarchy under applicable financial accounting standards:
1) Level 1-unadjusted quoted prices in active markets for identical assets or liabilities (including securities actively traded on a securities exchange)
2) Level 2-inputs other than unadjusted quoted prices that are observable for the asset or liability (such as unadjusted quoted prices for similar assets and market corroborated inputs such as interest rates, prepayment speeds, credit risks, etc.)
3) Level 3-significant unobservable inputs (including the Manager’s own judgments about assumptions that market participants would use in pricing the asset or liability).
The inputs used for valuing securities are not necessarily an indication of the risks associated with investing in those securities.
The table below categorizes amounts that are included in the Fund’s Statement of Assets and Liabilities at period end based on valuation input level:
| | | | | | | | | | | | | | | | |
| | | Level 1— Unadjusted
Quoted Prices | | | Level 2— Other Significant
Observable Inputs | | | Level 3— Significant
Unobservable
Inputs | | | Value | |
| |
Assets Table | | | | | | | | | | | | | | | | |
Investments, at Value: | | | | | | | | | | | | | | | | |
Common Stocks | | | | | | | | | | | | | | | | |
Consumer Discretionary | | $ | 148,410,782 | | | $ | — | | | $ | — | | | $ | 148,410,782 | |
Consumer Staples | | | 61,253,190 | | | | — | | | | — | | | | 61,253,190 | |
Energy | | | 20,135,082 | | | | — | | | | — | | | | 20,135,082 | |
Financials | | | 55,708,473 | | | | — | | | | — | | | | 55,708,473 | |
Health Care | | | 156,257,252 | | | | — | | | | — | | | | 156,257,252 | |
Industrials | | | 59,000,475 | | | | — | | | | — | | | | 59,000,475 | |
Information Technology | | | 379,023,613 | | | | — | | | | — | | | | 379,023,613 | |
Investment Company | | | 8,225,463 | | | | — | | | | — | | | | 8,225,463 | |
Total Assets | | $ | 888,014,330 | | | $ | — | | | $ | — | | | $ | 888,014,330 | |
| | | | |
Forward currency exchange contracts and futures contracts, if any, are reported at their unrealized appreciation/depreciation at measurement date, which represents the change in the contract’s value from trade date. All additional assets and liabilities included in the above table are reported at their market value at measurement date.
4. Investments and Risks
Investments in Affiliated Funds. The Fund is permitted to invest in other mutual funds advised by the Manager (“Affiliated Funds”). Affiliated Funds are open-end management investment companies registered under the 1940 Act, as amended. The Manager is the investment adviser of, and the Sub-Adviser provides investment and related advisory services to, the Affiliated Funds. When applicable, the Fund’s investments in Affiliated Funds are included in the Statement of Investments. Shares of Affiliated Funds are valued at their net asset value per share. As a shareholder, the Fund is subject to its proportional share of the Affiliated Funds’ expenses, including their management fee. The Manager will waive fees and/or reimburse Fund expenses in an amount equal to the indirect management fees incurred through the Fund’s investment in the Affiliated Funds.
Each of the Affiliated Funds in which the Fund invests has its own investment risks, and those risks can affect the value of the Fund’s investments and therefore the value of the Fund’s shares. To the extent that the Fund invests more of its assets in one Affiliated Fund than in another, the Fund will have greater exposure to the risks of that Affiliated Fund.
Investment in Oppenheimer Institutional Money Market Fund. The Fund is permitted to invest daily available cash balances in a money market Affiliated Fund. The Fund may invest the available cash in Class E shares of Oppenheimer Institutional Money Market Fund (“IMMF”) to seek current income while preserving liquidity or for defensive purposes. IMMF is regulated as a money market fund under the Investment Company Act of 1940, as amended.
Equity Security Risk. Stocks and other equity securities fluctuate in price. The value of the Fund’s portfolio may be affected by changes in the equity markets generally. Equity markets may experience significant short-term volatility and may fall sharply at times. Different markets may behave differently from each other and U.S. equity markets may move in the opposite direction from one or more foreign stock markets. Adverse events in any part of the equity or fixed-income markets may have unexpected negative effects on other market segments.
The prices of individual equity securities generally do not all move in the same direction at the same time and a variety of factors can affect the price of a particular company’s securities. These factors may include, but are not limited to, poor earnings reports, a loss of customers, litigation against the
17 OPPENHEIMER CAPITAL APPRECIATION FUND/VA
NOTES TO FINANCIAL STATEMENTS Continued
4. Investments and Risks (Continued)
company, general unfavorable performance of the company’s sector or industry, or changes in government regulations affecting the company or its industry.
5. Market Risk Factors
The Fund’s investments in securities and/or financial derivatives may expose the fund to various market risk factors:
Commodity Risk. Commodity risk relates to the change in value of commodities or commodity indexes as they relate to increases or decreases in the commodities market. Commodities are physical assets that have tangible properties. Examples of these types of assets are crude oil, heating oil, metals, livestock, and agricultural products.
Credit Risk. Credit risk relates to the ability of the issuer of debt to meet interest and principal payments, or both, as they come due. In general, lower-grade, higher-yield debt securities are subject to credit risk to a greater extent than lower-yield, higher-quality securities.
Equity Risk. Equity risk relates to the change in value of equity securities as they relate to increases or decreases in the general market.
Foreign Exchange Rate Risk. Foreign exchange rate risk relates to the change in the U.S. dollar value of a security held that is denominated in a foreign currency. The U.S. dollar value of a foreign currency denominated security will decrease as the dollar appreciates against the currency, while the U.S. dollar value will increase as the dollar depreciates against the currency.
Interest Rate Risk. Interest rate risk refers to the fluctuations in value of fixed-income securities resulting from the inverse relationship between price and yield. For example, an increase in general interest rates will tend to reduce the market value of already issued fixed-income investments, and a decline in general interest rates will tend to increase their value. In addition, debt securities with longer maturities, which tend to have higher yields, are subject to potentially greater fluctuations in value from changes in interest rates than obligations with shorter maturities.
Volatility Risk. Volatility risk refers to the magnitude of the movement, but not the direction of the movement, in a financial instrument’s price over a defined time period. Large increases or decreases in a financial instrument’s price over a relative time period typically indicate greater volatility risk, while small increases or decreases in its price typically indicate lower volatility risk.
6. Shares of Beneficial Interest
The Fund has authorized an unlimited number of $0.001 par value shares of beneficial interest of each class. Transactions in shares of beneficial interest were as follows:
| | | | | | | | | | | | | | | | |
| | | Year Ended December 31, 2015 | | | Year Ended December 31, 2014 | |
| | | Shares | | | Amount | | | Shares | | | Amount | |
| |
Non-Service Shares | | | | | | | | | | | | | | | | |
Sold | | | 257,353 | | | $ | 15,042,314 | | | | 297,082 | | | $ | 17,790,087 | |
Dividends and/or distributions reinvested | | | 1,895,571 | | | | 106,739,631 | | | | 303,563 | | | | 17,758,433 | |
Redeemed | | | (1,488,512) | | | | (89,170,619) | | | | (1,922,275) | | | | (115,812,186) | |
| | | | |
Net increase (decrease) | | | 664,412 | | | $ | 32,611,326 | | | | (1,321,630) | | | $ | (80,263,666) | |
| | | | |
|
| |
Service Shares | | | | | | | | | | | | | | | | |
Sold | | | 931,104 | | | $ | 54,653,065 | | | | 259,544 | | | $ | 15,480,606 | |
Dividends and/or distributions reinvested | | | 1,075,333 | | | | 59,885,291 | | | | 156,718 | | | | 9,099,012 | |
Redeemed | | | (1,455,061) | | | | (84,418,946) | | | | (1,518,264) | | | | (90,080,086) | |
| | | | |
Net increase (decrease) | | | 551,376 | | | $ | 30,119,410 | | | | (1,102,002) | | | $ | (65,500,468) | |
| | | | |
7. Purchases and Sales of Securities
The aggregate cost of purchases and proceeds from sales of securities, other than short-term obligations and investments in IMMF, for the reporting period were as follows:
| | | | | | | | |
| | | Purchases | | | Sales | |
| |
Investment securities | | | $552,319,459 | | | | $654,416,231 | |
8. Fees and Other Transactions with Affiliates
Management Fees. Under the investment advisory agreement, the Fund pays the Manager a management fee based on the daily net assets of the Fund at an annual rate as shown in the following table:
| | |
| Fee Schedule |
|
Up to $200 million | | 0.75% |
Next $200 million | | 0.72 |
Next $200 million | | 0.69 |
Next $200 million | | 0.66 |
Next $200 million | | 0.60 |
Over $1 billion | | 0.58 |
The Fund’s effective management fee for the reporting period was 0.69% of average annual net assets before any applicable waivers.
18 OPPENHEIMER CAPITAL APPRECIATION FUND/VA
8. Fees and Other Transactions with Affiliates (Continued)
Sub-Adviser Fees. The Manager has retained the Sub-Adviser to provide the day-to-day portfolio management of the Fund. Under the Sub-Advisory Agreement, the Manager pays the Sub-Adviser an annual fee in monthly installments, equal to a percentage of the investment management fee collected by the Manager from the Fund, which shall be calculated after any investment management fee waivers. The fee paid to the Sub-Adviser is paid by the Manager, not by the Fund.
Transfer Agent Fees. OFI Global (the “Transfer Agent”) serves as the transfer and shareholder servicing agent for the Fund. The Fund pays the Transfer Agent a fee based on annual net assets. Fees incurred and average net assets for each class with respect to these services are detailed in the Statement of Operations and Financial Highlights, respectively.
Sub-Transfer Agent Fees. The Transfer Agent has retained Shareholder Services, Inc., a wholly-owned subsidiary of OFI (the “Sub-Transfer Agent”), to provide the day-to-day transfer agent and shareholder servicing of the Fund. Under the Sub-Transfer Agency Agreement, the Transfer Agent pays the Sub-Transfer Agent an annual fee in monthly installments, equal to a percentage of the transfer agent fee collected by the Transfer Agent from the Fund, which shall be calculated after any applicable fee waivers. The fee paid to the Sub-Transfer Agent is paid by the Transfer Agent, not by the Fund.
Trustees’ Compensation. The Fund’s Board of Trustees (“Board”) has adopted a compensation deferral plan for Independent Trustees that enables Trustees to elect to defer receipt of all or a portion of the annual compensation they are entitled to receive from the Fund. For purposes of determining the amount owed to the Trustees under the plan, deferred amounts are treated as though equal dollar amounts had been invested in shares of the Fund or in other Oppenheimer funds selected by the Trustees. The Fund purchases shares of the funds selected for deferral by the Trustees in amounts equal to his or her deemed investment, resulting in a Fund asset equal to the deferred compensation liability. Such assets are included as a component of “Other” within the asset section of the Statement of Assets and Liabilities. Deferral of Trustees’ fees under the plan will not affect the net assets of the Fund and will not materially affect the Fund’s assets, liabilities or net investment income per share. Amounts will be deferred until distributed in accordance with the compensation deferral plan.
Distribution and Service Plan for Service Shares. The Fund has adopted a Distribution and Service Plan (the “Plan”) pursuant to Rule 12b-1 under the 1940 Act for Service shares to pay OppenheimerFunds Distributor, Inc. (the “Distributor”), for distribution related services, personal service and account maintenance for the Fund’s Service shares. Under the Plan, payments are made periodically at an annual rate of 0.25% of the daily net assets of Service shares of the Fund. The Distributor currently uses all of those fees to compensate sponsors of the insurance product that offers Fund shares, for providing personal service and maintenance of accounts of their variable contract owners that hold Service shares. These fees are paid out of the Fund’s assets on an on-going basis and increase operating expenses of the Service shares, which results in lower performance compared to the Fund’s shares that are not subject to a service fee. Fees incurred by the Fund under the Plan are detailed in the Statement of Operations.
Waivers and Reimbursements of Expenses. The Manager has voluntarily agreed to limit the Fund’s expenses after payments, waivers and/or reimbursements and reduction to custodian expenses, excluding expenses incurred directly or indirectly by the Fund as a result of investments in other investment companies, wholly-owned subsidiaries and pooled investment vehicles; so that those expenses, as percentages of daily net assets, will not exceed the annual rate of 0.80% for Non-Service shares and 1.05% for Service shares. The expense limitations do not include interest and fees from borrowing, and other expenses not incurred in the ordinary course of the Fund’s business. During the reporting period, the Manager waived fees and/or reimbursed the Fund $72,978 and $40,818 for Non-Service and Service shares, respectively.
The Manager will waive fees and/or reimburse Fund expenses in an amount equal to the indirect management fees incurred through the Fund’s investment in IMMF. During the reporting period, the Manager waived fees and/or reimbursed the Fund $5,489 for IMMF management fees.
Waivers and/or reimbursements may be modified or terminated as set forth according to the terms in the prospectus.
9. Borrowings and Other Financing
Joint Credit Facility. A number of mutual funds managed by the Manager participate in a $1.28 billion revolving credit facility (the “Facility”) intended to provide short-term financing, if necessary, subject to certain restrictions in connection with atypical redemption activity. Expenses and fees related to the Facility are paid by the participating funds and are disclosed separately or as other expenses on the Statement of Operations. The Fund did not utilize the Facility during the reporting period.
10. Pending Litigation
In 2009, several putative class action lawsuits were filed and later consolidated before the U.S. District Court for the District of Colorado against OppenheimerFunds, Inc. (“OFI”), OppenheimerFunds Distributor, Inc. (“OFDI”), and Oppenheimer Rochester California Municipal Fund, a fund advised by OFI Global Asset Management, Inc. and distributed by the Distributor (the “California Fund”), in connection with the California Fund’s investment performance. The plaintiffs asserted claims against OFI, OFDI and certain present and former trustees and officers of the California Fund under the federal securities laws, alleging, among other things, that the disclosure documents of the California Fund contained misrepresentations and omissions and the investment policies of the California Fund were not followed. Plaintiffs in the suit filed an amended complaint and defendants filed a motion to dismiss. In 2011, the court issued an order which granted in part and denied in part the defendants’ motion to dismiss. In 2012, plaintiffs filed a motion, which defendants opposed, to certify a class and appoint class representatives and class counsel. In March 2015, the court granted plaintiffs’ motion for class certification. In May 2015, the U.S. Court of Appeals for the Tenth Circuit vacated the class certification order and remanded the matter to the
19 OPPENHEIMER CAPITAL APPRECIATION FUND/VA
NOTES TO FINANCIAL STATEMENTS Continued
10. Pending Litigation (Continued)
district court for further proceedings. In October 2015, the district court reaffirmed its order and determined that the suit will proceed as a class action. In December 2015, the Tenth Circuit denied defendants’ petition to appeal the district court’s reaffirmed class certification order.
OFI and OFDI believe the suit is without merit; that it is premature to render any opinion as to the likelihood of an outcome unfavorable to them in the suit; and that no estimate can yet be made as to the amount or range of any potential loss. Furthermore, OFI believes that the suit should not impair the ability of OFI or OFDI to perform their respective duties to the Fund and that the outcome of the suit should not have any material effect on the operations of any of the Oppenheimer funds.
20 OPPENHEIMER CAPITAL APPRECIATION FUND/VA
REPORT OF INDEPENDENT REGISTERED PUBLIC ACCOUNTING FIRM
The Board of Trustees and Shareholders of Oppenheimer Variable Account Funds:
We have audited the accompanying statement of assets and liabilities of Oppenheimer Capital Appreciation Fund/VA (a separate series of Oppenheimer Variable Account Funds), including the statement of investments, as of December 31, 2015, and the related statement of operations for the year then ended, the statements of changes in net assets for each of the years in the two-year period then ended, and the financial highlights for each of the years in the five-year period then ended. These financial statements and financial highlights are the responsibility of the Fund’s management. Our responsibility is to express an opinion on these financial statements and financial highlights based on our audits.
We conducted our audits in accordance with the standards of the Public Company Accounting Oversight Board (United States). Those standards require that we plan and perform the audit to obtain reasonable assurance about whether the financial statements and financial highlights are free of material misstatement. An audit includes examining, on a test basis, evidence supporting the amounts and disclosures in the financial statements. Our procedures included confirmation of securities owned as of December 31, 2015, by correspondence with the custodian and transfer agent. An audit also includes assessing the accounting principles used and significant estimates made by management, as well as evaluating the overall financial statement presentation. We believe that our audits provide a reasonable basis for our opinion.
In our opinion, the financial statements and financial highlights referred to above present fairly, in all material respects, the financial position of Oppenheimer Capital Appreciation Fund/VA as of December 31, 2015, the results of its operations for the year then ended, the changes in its net assets for each of the years in the two-year period then ended, and the financial highlights for each of the years in the five-year period then ended, in conformity with U.S. generally accepted accounting principles.
KPMGLLP
Denver, Colorado
February 12, 2016
21 OPPENHEIMER CAPITAL APPRECIATION FUND/VA
FEDERAL INCOME TAX INFORMATION Unaudited
In early 2016, if applicable, shareholders of record received information regarding all dividends and distributions paid to them by the Fund during calendar year 2015.
Capital gain distributions of $10.07741 per share were paid to Non-Service and Service shareholders, respectively, on June 16, 2015. Whether received in stock or in cash, the capital gain distribution should be treated by shareholders as a gain from the sale of the capital assets held for more than one year (long-term capital gains).
Dividends, if any, paid by the Fund during the reporting period which are not designated as capital gain distributions should be multiplied by the maximum amount allowable but not less than 100% to arrive at the amount eligible for the corporate dividend-received deduction.
The foregoing information is presented to assist shareholders in reporting distributions received from the Fund to the Internal Revenue Service. Because of the complexity of the federal regulations which may affect your individual tax return and the many variations in state and local tax regulations, we recommend that you consult your tax advisor for specific guidance.
22 OPPENHEIMER CAPITAL APPRECIATION FUND/VA
BOARD APPROVAL OF THE FUND’S INVESTMENT ADVISORY AND SUB-ADVISORY AGREEMENTS Unaudited
The Fund has entered into an investment advisory agreement with OFI Global Asset Management, Inc. (“OFI Global” or the “Adviser”), a wholly-owned subsidiary of OppenheimerFunds, Inc. (“OFI” or the “Sub-Adviser”) (“OFI Global” and “OFI” together the “Managers”) and OFI Global has entered into a sub-advisory agreement with OFI whereby OFI provides investment sub-advisory services to the Fund (collectively, the “Agreements”). Each year, the Board of Trustees (the “Board”), including a majority of the independent Trustees, is required to determine whether to approve the terms of the Agreements and the renewal thereof. The Investment Company Act of 1940, as amended, requires that the Board request and evaluate, and that the Managers provide, such information as may be reasonably necessary to evaluate the terms of the Agreements. The Board employs an independent consultant to prepare a report that provides information, including comparative information that the Board requests for that purpose. In addition to in-person meetings focused on this evaluation, the Board receives information throughout the year regarding Fund services, fees, expenses and performance.
The Adviser, Sub-Adviser and the independent consultant provided information to the Board on the following factors: (i) the nature, quality and extent of the Managers’ services, (ii) the comparative investment performance of the Fund and the Managers, (iii) the fees and expenses of the Fund, including comparative fee and expense information, (iv) the profitability of the Managers and their affiliates, including an analysis of the cost of providing services, (v) whether economies of scale are realized as the Fund grows and whether fee levels reflect these economies of scale for Fund investors and (vi) other benefits to the Managers from their relationship with the Fund. The Board was aware that there are alternatives to retaining the Managers.
Outlined below is a summary of the principal information considered by the Board as well as the Board’s conclusions.
Nature, Quality and Extent of Services. The Board considered information about the nature, quality and extent of the services provided to the Fund and information regarding the Managers’ key personnel who provide such services. The Managers’ duties include providing the Fund with the services of the portfolio manager and the Sub-Adviser’s investment team, who provide research, analysis and other advisory services in regard to the Fund’s investments; and securities trading services. OFI Global is responsible for oversight of third-party service providers; monitoring compliance with applicable Fund policies and procedures and adherence to the Fund’s investment restrictions; risk management; and oversight of the Sub-Adviser. OFI Global is also responsible for providing certain administrative services to the Fund as well. Those services include providing and supervising all administrative and clerical personnel who are necessary in order to provide effective corporate administration for the Fund; compiling and maintaining records with respect to the Fund’s operations; preparing and filing reports required by the U.S. Securities and Exchange Commission; preparing periodic reports regarding the operations of the Fund for its shareholders; preparing proxy materials for shareholder meetings; and preparing the registration statements required by federal and state securities laws for the sale of the Fund’s shares. OFI Global also provides the Fund with office space, facilities and equipment.
The Board also considered the quality of the services provided and the quality of the Managers’ resources that are available to the Fund. The Board took account of the fact that the Sub-Adviser has had over fifty years of experience as an investment adviser and that its assets under management rank it among the top mutual fund managers in the United States. The Board evaluated the Managers’ advisory, administrative, accounting, legal, compliance services and risk management, and information the Board has received regarding the experience and professional qualifications of the Managers’ key personnel and the size and functions of its staff. In its evaluation of the quality of the portfolio management services provided, the Board considered the experience of Michael Kotlarz, the portfolio manager for the Fund, and the Sub-Adviser’s investment team and analysts. The Board members also considered the totality of their experiences with the Managers as directors or trustees of the Fund and other funds advised by the Managers. The Board considered information regarding the quality of services provided by affiliates of the Managers, which the Board members have become knowledgeable about through their experiences with the Managers and in connection with the renewal of the Fund’s service agreements. The Board concluded, in light of the Managers’ experience, reputation, personnel, operations and resources that the Fund benefits from the services provided under the Agreements.
Investment Performance of the Managers and the Fund. Throughout the year, the Managers provided information on the investment performance of the Fund, including comparative performance information. The Board also reviewed information, prepared by the Managers and by the independent consultant, comparing the Fund’s historical performance to relevant market indices and to the performance of other large growth funds underlying variable insurance products. The Board noted that the Fund underperformed its category median during the three-, five- and ten-year periods but outperformed its category median during the one-year period. The Board considered the Fund’s change in portfolio management in June 2012 and noted the Fund’s improved performance since that time.
Fees and Expenses of the Fund. The Board reviewed the fees paid to the Adviser and the other expenses borne by the Fund. The Board noted that the Adviser, not the Fund, pays the Sub-Adviser’s fee under the sub-advisory agreement. The independent consultant provided comparative data in regard to the fees and expenses of the Fund and other large growth funds underlying variable insurance products. In reviewing the fees and expenses charged to the VA funds, the Board considered the Adviser’s assertion that, because there is much greater disparity in the fees and services that may be provided by a manager to a VA fund as opposed to a retail fund, when comparing the expenses of the various VA funds to those of retail funds, it is most appropriate to focus on total expenses (rather than on the management fees). Accordingly, while the Board reviewed and considered all expenses, it focused on total expenses. The Board considered that the Fund’s total expenses were higher than its peer group median and its category median and that its contractual management fees were lower than its peer group median and category median. The Board also considered that although the Fund’s total expenses rank in the fourth quintile, they are only six basis points above the peer group median, as noted in the independent consultant’s report. Within the total asset range of $500 million to $1 billion, the Fund’s effective management fee rate was lower than its peer group and category median. The Adviser has voluntarily agreed to limit the Fund’s total annual operating expenses so that those expenses, as percentages of daily net assets, will not exceed the annual rate of 0.80% for Non-Service Shares and 1.05% for Service Shares. This waiver and/or reimbursement may be amended or withdrawn at any time without prior notice to shareholders.
Economies of Scale and Profits Realized by the Managers. The Board considered information regarding the Managers’ costs in serving as the Fund’s investment adviser and sub-adviser, including the costs associated with the personnel and systems necessary to manage the Fund, and information regarding the Managers’ profitability from their relationship with the Fund. The Board reviewed whether the Managers may realize
23 OPPENHEIMER CAPITAL APPRECIATION FUND/VA
BOARD APPROVAL OF THE FUND’S INVESTMENT ADVISORY AND SUB-ADVISORY
AGREEMENTS Unaudited /Continued
economies of scale in managing and supporting the Fund. The Board noted that the Fund currently has management fee breakpoints, which are intended to share with Fund shareholders economies of scale that may exist as the Fund’s assets grow.
Other Benefits to the Managers. In addition to considering the profits realized by the Managers, the Board considered information that was provided regarding the direct and indirect benefits the Managers receive as a result of their relationship with the Fund, including compensation paid to the Managers’ affiliates and research provided to the Adviser in connection with permissible brokerage arrangements (soft dollar arrangements).
Conclusions. These factors were also considered by the independent Trustees meeting separately from the full Board, assisted by experienced counsel to the Fund and to the independent Trustees. Fund counsel and the independent Trustees’ counsel are independent of the Managers within the meaning and intent of the Securities and Exchange Commission Rules.
Based on its review of the information it received and its evaluations described above, the Board, including a majority of the independent Trustees, decided to continue the Agreements through August 31, 2016. In arriving at its decision, the Board did not identify any factor or factors as being more important than others, but considered all of the above information, and considered the terms and conditions of the Agreements, including the management fees, in light of all the surrounding circumstances.
24 OPPENHEIMER CAPITAL APPRECIATION FUND/VA
PORTFOLIO PROXY VOTING POLICIES AND PROCEDURES; UPDATES TO STATEMENTS OF INVESTMENTS Unaudited
The Fund has adopted Portfolio Proxy Voting Policies and Procedures under which the Fund votes proxies relating to securities (“portfolio proxies”) held by the Fund. A description of the Fund’s Portfolio Proxy Voting Policies and Procedures is available (i) without charge, upon request, by calling the Fund toll-free at 1.800.525.7048, (ii) on the Fund’s website at www.oppenheimerfunds.com, and (iii) on the SEC’s website at www.sec.gov. In addition, the Fund is required to file Form N-PX, with its complete proxy voting record for the 12 months ended June 30th, no later than August 31st of each year. The Fund’s voting record is available (i) without charge, upon request, by calling the Fund toll-free at 1.800.525.7048, and (ii) in the Form N-PX filing on the SEC’s website at www.sec.gov.
The Fund files its complete schedule of portfolio holdings with the SEC for the first quarter and the third quarter of each fiscal year on Form N-Q. The Fund’s Form N-Q filings are available on the SEC’s website at www.sec.gov. Those forms may be reviewed and copied at the SEC’s Public Reference Room in Washington, D.C. Information on the operation of the Public Reference Room may be obtained by calling 1-800-SEC-0330.
25 OPPENHEIMER CAPITAL APPRECIATION FUND/VA
TRUSTEES AND OFFICERS Unaudited
| | |
| Name, Position(s) Held with the Fund, Length of Service, Year of Birth | | Principal Occupation(s) During the Past 5 Years; Other Trusteeships/Directorships Held; Number of Portfolios in the Fund Complex Currently Overseen |
| |
| INDEPENDENT TRUSTEES | | The address of each Trustee in the chart below is 6803 S. Tucson Way, Centennial, Colorado 80112-3924. Each Trustee serves for an indefinite term, or until his or her resignation, retirement, death or removal. |
| |
Sam Freedman, Chairman of the Board of Trustees (since 2013) and Trustee (since 1996) Year of Birth: 1940 | | Director of Colorado UpLIFT (charitable organization) (since September 1984). Mr. Freedman held several positions with the Sub-Adviser and with subsidiary or affiliated companies of the Sub-Adviser (until October 1994). Oversees 47 portfolios in the OppenheimerFunds complex. Mr. Freedman has served on the Boards of certain Oppenheimer funds since 1996, during which time he has become familiar with the Fund’s (and other Oppenheimer funds’) financial, accounting, regulatory and investment matters and has contributed to the Boards’ deliberations. |
| |
Jon S. Fossel, Trustee (since 1990) Year of Birth: 1942 | | Chairman of the Board of Jack Creek Preserve Foundation (non-profit organization) (since 2005); Chairman of the Board (2006-December 2011) and Director (June 2002-December 2011) of UNUMProvident (insurance company); Director of Northwestern Energy Corp. (public utility corporation) (November 2004-December 2009); Director of P.R. Pharmaceuticals (October 1999-October 2003); Director of Rocky Mountain Elk Foundation (non-profit organization) (February 1998-February 2003 and February 2005-February 2007); Chairman and Director (until October 1996) and President and Chief Executive Officer (until October 1995) of the Sub-Adviser; President, Chief Executive Officer and Director of the following: Oppenheimer Acquisition Corp. (“OAC”) (parent holding company of the Sub-Adviser), Shareholders Services, Inc. and Shareholder Financial Services, Inc. (until October 1995). Oversees 47 portfolios in the OppenheimerFunds complex. Mr. Fossel has served on the Boards of certain Oppenheimer funds since 1990, during which time he has become familiar with the Fund’s (and other Oppenheimer funds’) financial, accounting, regulatory and investment matters and has contributed to the Boards’ deliberations. |
| |
Richard F. Grabish, Trustee (since 2012) Year of Birth: 1948 | | Formerly Senior Vice President and Assistant Director of Sales and Marketing (March 1997-December 2007), Director (March 1987-December 2007) and Manager of Private Client Services (June 1985-June 2005) of A.G. Edwards & Sons, Inc. (broker/dealer and investment firm); Chairman and Chief Executive Officer of A.G. Edwards Trust Company, FSB (March 2001- December 2007); President and Vice Chairman of A.G. Edwards Trust Company, FSB (investment adviser) (April 1987-March 2001); President of A.G. Edwards Trust Company, FSB (investment adviser) (June 2005-December 2007). Oversees 47 portfolios in the OppenheimerFunds complex. Mr. Grabish has served on the Boards of certain Oppenheimer funds since 2001, during which time he has become familiar with the Fund’s (and other Oppenheimer funds’) financial, accounting, regulatory and investment matters and has contributed to the Boards’ deliberations. |
| |
Beverly L. Hamilton, Trustee (since 2002) Year of Birth: 1946 | | Trustee of Monterey Institute for International Studies (educational organization) (since February 2000); Board Member of Middlebury College (educational organization) (December 2005-June 2011); Chairman (since 2010) of American Funds’ Emerging Markets Growth Fund, Inc. (mutual fund); Director of The California Endowment (philanthropic organization) (April 2002-April 2008); Director (February 2002-2005) and Chairman of Trustees (2006-2007) of the Community Hospital of Monterey Peninsula; Director (October 1991-2005); Vice Chairman (2006-2009) of American Funds’ Emerging Markets Growth Fund, Inc. (mutual fund); President of ARCO Investment Management Company (February 1991-April 2000); Member of the investment committees of The Rockefeller Foundation (2001-2006) and The University of Michigan (since 2000); Advisor at Credit Suisse First Boston’s Sprout venture capital unit (venture capital fund) (1994-January 2005); Trustee of MassMutual Institutional Funds (investment company) (1996-June 2004); Trustee of MML Series Investment Fund (investment company) (April 1989-June 2004); Member of the investment committee of Hartford Hospital (2000-2003); and Advisor to Unilever (Holland) pension fund (2000-2003). Oversees 47 portfolios in the OppenheimerFunds complex. Ms. Hamilton has served on the Boards of certain Oppenheimer funds since 2002, during which time she has become familiar with the Fund’s (and other Oppenheimer funds’) financial, accounting, regulatory and investment matters and has contributed to the Boards’ deliberations. |
| |
Victoria J. Herget, Trustee (since 2012) Year of Birth:1951 | | Board Chair (2008-Present) and Director (2004-Present), United Educators (insurance company); Trustee (since 2000) and Chair (since 2010), Newberry Library (independent research library); Trustee, Mather LifeWays (senior living organization) (since 2001); Independent Director of the First American Funds (mutual fund family) (2003-2011); former Managing Director (1993-2001), Principal (1985-1993), Vice President (1978-1985) and Assistant Vice President (1973-1978) of Zurich Scudder Investments (investment adviser) (and its predecessor firms); Trustee (1992-2007), Chair of the Board of Trustees (1999- 2007), Investment Committee Chair (1994-1999) and Investment Committee member (2007-2010) of Wellesley College; Trustee, BoardSource (non-profit organization) (2006-2009) and Chicago City Day School (K-8 School) (1994-2005). Oversees 47 portfolios in the OppenheimerFunds complex. Ms. Herget has served on the Boards of certain Oppenheimer funds since 2012, during which time she has become familiar with the Fund’s (and other Oppenheimer funds’) financial, accounting, regulatory and investment matters and has contributed to the Boards’ deliberations. |
| |
Robert J. Malone, Trustee (since 2002) Year of Birth: 1944 | | Chairman - Colorado Market of MidFirst Bank (since January 2015); Chairman of the Board (since 2012) and Director (since August 2005) of Jones International University (educational organization); Trustee of the Gallagher Family Foundation (non-profit organization) (2000-2015); Chairman, Chief Executive Officer and Director of Steele Street Bank Trust (commercial banking) (August 2003-January 2015); Board of Directors of Opera Colorado Foundation (non-profit organization) (2008- 2012); Director of Colorado UpLIFT (charitable organization) (1986-2010); Director of Jones Knowledge, Inc. (2006-2010); Former Chairman of U.S. Bank-Colorado (subsidiary of U.S. Bancorp and formerly Colorado National Bank) (July 1996-April 1999); Director of Commercial Assets, Inc. (real estate investment trust) (1993-2000); Director of U.S. Exploration, Inc. (oil and gas exploration) (1997-February 2004); Chairman of the Board (1991-1994) and Trustee (1985-1994) of Regis University; and Chairman of the Board (1990-1991 and Trustee (1984-1999) of Young Presidents Organization. Oversees 47 portfolios in the OppenheimerFunds complex. Mr. Malone has served on the Boards of certain Oppenheimer funds since 2002, during which time he has become familiar with the Fund’s (and other Oppenheimer funds’) financial, accounting, regulatory and investment matters and has contributed to the Boards’ deliberations. |
26 OPPENHEIMER CAPITAL APPRECIATION FUND/VA
| | |
| |
F. William Marshall, Jr., Trustee (since 2000) Year of Birth: 1942 | | Trustee Emeritus of Worcester Polytech Institute (WPI) (private university) (since 2009); Trustee of MassMutual Select Funds (formerly MassMutual Institutional Funds) (investment company) (since 1996), MML Series Investment Fund (investment company) (since 1996) and Mass Mutual Premier Funds (investment company) (since January 2012); President and Treasurer of the SIS Funds (private charitable fund) (January 1999-March 2011); Former Trustee of WPI (1985-2008); Former Chairman of the Board (2004-2006) and Former Chairman of the Investment Committee of WPI (1994-2008); Chairman of SIS Family Bank, F.S.B. (formerly SIS Bank) (commercial bank) (January 1999-July 1999); Executive Vice President of Peoples Heritage Financial Group, Inc. (commercial bank) (January 1999-July 1999); and Former President and Chief Executive Officer of SIS Bancorp. (1993-1999). Oversees 47 portfolios in the OppenheimerFunds complex. Mr. Marshall has served on the Boards of certain Oppenheimer funds since 2000, during which time he has become familiar with the Fund’s (and other Oppenheimer funds’) financial, accounting, regulatory and investment matters and has contributed to the Boards’ deliberations. |
| |
Karen L. Stuckey, Trustee (since 2012) Year of Birth: 1953 | | Partner (1990-2012) of PricewaterhouseCoopers LLP (professional services firm) (held various positions 1975-1990); Trustee (1992-2006) and member of Executive, Nominating and Audit Committees and Chair of Finance Committee of Lehigh University; and member, Women’s Investment Management Forum (professional organization) since inception. Oversees 47 portfolios in the OppenheimerFunds complex. Ms. Stuckey has served on the Boards of certain Oppenheimer funds since 2012, during which time she has become familiar with the Fund’s (and other Oppenheimer funds’) financial, accounting, regulatory and investment matters and has contributed to the Boards’ deliberations. |
| |
James D. Vaughn, Trustee (since 2012) Year of Birth: 1945 | | Retired; former managing partner (1994-2001) of Denver office of Deloitte & Touche LLP, (held various positions 1969-1993); Trustee and Chairman of the Audit Committee of Schroder Funds (2003-2012); Board member and Chairman of Audit Committee of AMG National Trust Bank (since 2005); Trustee, Investment Committee member, University of South Dakota Foundation (since 1996); Board member, Audit Committee Member and past Board Chair, Junior Achievement (since 1993); former Board member, Mile High United Way, Boys and Girls Clubs, Boy Scouts, Colorado Business Committee for the Arts, Economic Club of Colorado and Metro Denver Network. Oversees 47 portfolios in the OppenheimerFunds complex. Mr. Vaughn has served on the Boards of certain Oppenheimer funds since 2012, during which time he has become familiar with the Fund’s (and other Oppenheimer funds’) financial, accounting, regulatory and investment matters and has contributed to the Boards’ deliberations. |
| | |
| INTERESTED TRUSTEE AND OFFICER | | Mr. Steinmetz is an “Interested Trustee” because he is affiliated with the Manager and the Sub-Adviser by virtue of his positions as Chairman and director of the Sub-Adviser and officer and director of the Manager. Both as a Trustee and as an officer, Mr. Steinmetz serves for an indefinite term, or until his resignation, retirement, death or removal. Mr. Steinmetz’s address is 225 Liberty Street, New York, New York 10281-1008. |
| |
Arthur P. Steinmetz Trustee (Since 2015), President and Principal Executive Officer (since 2014) Year of Birth: 1958 Year | | Chairman of the Sub-Adviser (since January 2015); CEO and Chairman of the Manager (since July 2014), President of the Manager (since May 2013), a Director of the Manager (since January 2013), Director of the Sub-Adviser (since July 2014), President, Management Director and CEO of Oppenheimer Acquisition Corp. (the Sub-Adviser’s parent holding company) (since July 2014), and President and Director of OFI SteelPath, Inc. (since January 2013). Chief Investment Officer of the OppenheimerFunds advisory entities from (January 2013-December 2013); Executive Vice President of the Manager (January 2013-May 2013); Chief Investment Officer of the Sub-Adviser (October 2010-December 2012); Chief Investment Officer, Fixed- Income, of the Sub-Adviser (April 2009-October 2010); Executive Vice President of the Sub-Adviser (October 2009-December 2012); Director of Fixed Income of the Sub-Adviser (January 2009-April 2009); and a Senior Vice President of the Sub-Adviser (March 1993-September 2009). An officer of 101 portfolios in the OppenheimerFunds complex. |
| | |
| OTHER OFFICERS OF THE FUND | | The addresses of the Officers in the chart below are as follows: for Messrs. Kotlarz, Gabinet, Mss. Sexton and Picciotto, 225 Liberty Street, New York, New York 10281-1008, for Mr. Wixted, 6803 S. Tucson Way, Centennial, Colorado 80112-3924. Each Officer serves for an indefinite term or until his or her resignation, retirement, death or removal. |
| |
Michael Kotlarz, Vice President (since 2012) Year of Birth: 1972 | | Vice President of the Sub-Adviser (since March 2008). Senior Research Analyst of the Sub-Adviser (March 2008-May 2013). Managing Director of Equity Research at Ark Asset Management (March 2000-March 2008). A portfolio manager and officer of other portfolios in the OppenheimerFunds complex. |
| |
Arthur S. Gabinet, Secretary and Chief Legal Officer (since 2011) Year of Birth: 1958 | | Executive Vice President, Secretary and General Counsel of the Manager (since January 2013); General Counsel OFI SteelPath, Inc. (since January 2013); Executive Vice President (May 2010-December 2012) and General Counsel (since January 2011) of the Sub-Adviser; General Counsel of the Distributor (since January 2011); General Counsel of Centennial Asset Management Corporation (January 2011-December 2012); Executive Vice President (January 2011-December 2012) and General Counsel of HarbourView Asset Management Corporation (since January 2011); Assistant Secretary (since January 2011) and Director (since January 2011) of OppenheimerFunds International Ltd. and OppenheimerFunds plc; Director of Oppenheimer Real Asset Management, Inc. (January 2011-December 2012) and General Counsel (since January 2011); Executive Vice President (January 2011-December 2011) and General Counsel of Shareholder Financial Services, Inc. and Shareholder Services, Inc. (since January 2011); Executive Vice President (January 2011-December 2012) and General Counsel of OFI Private Investments Inc. (since January 2011); Vice President of OppenheimerFunds Legacy Program (January 2011-December 2011); Executive Vice President (January 2011-December 2012) and General Counsel of OFI Institutional Asset Management, Inc. (since January 2011); General Counsel, Asset Management of the Sub-Adviser (May 2010-December 2010); Principal, The Vanguard Group (November 2005-April 2010); District Administrator, U.S. Securities and Exchange Commission (January 2003-October 2005). An officer of 101 Portfolios in the OppenheimerFunds complex. |
| |
Jennifer Sexton, Vice President and Chief Business Officer (since 2014) Year of Birth: 1969 | | Senior Vice President of OppenheimerFunds Distributor, Inc. (since June 2014); Vice President of OppenheimerFunds Distributor, Inc. (April 2006-June 2014); Vice President of the Sub-Adviser (January 1998-March 2006); Assistant Vice President of the Sub-Adviser (October 1991-December 1998). An officer of 101 Portfolios in the OppenheimerFunds complex. |
27 OPPENHEIMER CAPITAL APPRECIATION FUND/VA
TRUSTEES AND OFFICERS Unaudited / Continued
| | |
Mary Ann Picciotto, Chief Compliance Officer and Chief Anti-Money Laundering Officer (since 2014) Year of Birth: 1973 | | Senior Vice President and Chief Compliance Officer of the Manager (since March 2014); Chief Compliance Officer of the Sub- Adviser, OFI SteelPath, Inc., OFI Global Trust Company, OFI Global Institutional, Inc., Oppenheimer Real Asset Management, Inc., OFI Private Investments, Inc., Harborview Asset Management Corporation, Trinity Investment Management Corporation, and Shareholder Services, Inc. (since March 2014); Managing Director of Morgan Stanley Investment Management Inc. and certain of its various affiliated entities; Chief Compliance Officer of various Morgan Stanley Funds (May 2010-January 2014); Chief Compliance Officer of Morgan Stanley Investment Management Inc. (April 2007-January 2014). An officer of 101 Portfolios in the OppenheimerFunds complex. |
| |
Brian W. Wixted, Treasurer and Principal Financial & Accounting Officer (since 1999) Year of Birth: 1959 | | Senior Vice President of the Manager (since January 2013); Treasurer of the Sub-Adviser, HarbourView Asset Management Corporation, Shareholder Financial Services, Inc., Shareholder Services, Inc., and Oppenheimer Real Asset Management, Inc. (March 1999-June 2008), OFI Private Investments, Inc. (March 2000-June 2008), OppenheimerFunds International Ltd. and OppenheimerFunds plc (since May 2000), OFI Institutional Asset Management, Inc. (November 2000-June 2008), and OppenheimerFunds Legacy Program (charitable trust program established by the Sub-Adviser) (June 2003-December 2011); Treasurer and Chief Financial Officer of OFI Trust Company (since May 2000); Assistant Treasurer of Oppenheimer Acquisition Corporation (March 1999-June 2008). An officer of 101 Portfolios in the OppenheimerFunds complex. |
The Fund’s Statement of Additional Information contains additional information about the Fund’s Trustees and Officers and is available without charge, upon request, by calling 1.800. 988.8287.
28 OPPENHEIMER CAPITAL APPRECIATION FUND/VA
THIS PAGE INTENTIONALLY LEFT BLANK.
29 OPPENHEIMER CAPITAL APPRECIATION FUND/VA
THIS PAGE INTENTIONALLY LEFT BLANK.
30 OPPENHEIMER CAPITAL APPRECIATION FUND/VA
THIS PAGE INTENTIONALLY LEFT BLANK.
31 OPPENHEIMER CAPITAL APPRECIATION FUND/VA
OPPENHEIMER CAPITAL APPRECIATION FUND/VA
A Series of Oppenheimer Variable Account Funds
| | |
| |
| Manager | | OFI Global Asset Management, Inc. |
| |
| Sub-Adviser | | OppenheimerFunds, Inc. |
| |
| Distributor | | OppenheimerFunds Distributor, Inc. |
| |
Transfer and Shareholder Servicing Agent | | OFI Global Asset Management, Inc. |
| |
| Sub-Transfer Agent | | Shareholder Services, Inc. DBA OppenheimerFunds Services |
| |
Independent Registered Public Accounting Firm | | KPMGLLP |
| |
| Counsel | | Ropes & Gray LLP |
| |
| | Before investing in any of the Oppenheimer funds, investors should carefully consider a fund’s investment objectives, risks, charges and expenses. Fund prospectuses and summary prospectuses contain this and other information about the funds, and may be obtained by asking your financial advisor, or calling us at 1.800.988.8287. Read prospectuses and summary prospectuses carefully before investing. |
| |
| | © 2016 OppenheimerFunds, Inc. All rights reserved. Oppenheimer funds are distributed by OppenheimerFunds Distributor, Inc. |


PORTFOLIO MANAGERS: Krishna Memani and Peter A. Strzalkowski, CFA
AVERAGE ANNUAL TOTAL RETURNS FOR THE PERIODS ENDED 12/31/15
| | | | | | | | | | | | | | | | |
| | | Inception Date | | | 1-Year | | | 5-Year | | | 10-Year | |
Non-Service Shares | | | 4/3/85 | | | | 0.96% | | | | 5.26% | | | | 0.55% | |
Service Shares | | | 5/1/02 | | | | 0.70 | | | | 4.99 | | | | 0.30 | |
Barclays Credit Index | | | | | | | -0.77 | | | | 4.38 | | | | 5.18 | |
Barclays U.S. Aggregate Bond Index | | | | | | | 0.55 | | | | 3.25 | | | | 4.51 | |
Citigroup Broad Investment Grade Bond Index | | | | 0.53 | | | | 3.23 | | | | 4.60 | |
Performance data quoted represents past performance, which does not guarantee future results. The investment return and principal value of an investment in the Fund will fluctuate so that an investor’s shares, when redeemed, may be worth more or less than their original cost. Current performance may be lower or higher than the performance quoted. For performance data current to the most recent month end, call us at 1.800.988.8287. The Fund’s total returns should not be expected to be the same as the returns of other funds, whether or not both funds have the same portfolio managers and/or similar names. The Fund’s total returns include changes in share price and reinvested distributions but do not include the charges associated with the separate account products that offer this Fund. Such performance would have been lower if such charges were taken into account.
TOP HOLDINGS AND ALLOCATIONS
| | | | |
| CORPORATE BONDS & NOTES - TOP TEN INDUSTRIES | |
|
| |
Commercial Banks | | | 3.7% | |
| |
Oil, Gas & Consumable Fuels | | | 3.3 | |
| |
Capital Markets | | | 3.1 | |
| |
Electric Utilities | | | 2.3 | |
| |
Diversified Telecommunication Services | | | 2.2 | |
| |
Real Estate Investment Trusts (REITs) | | | 2.0 | |
| |
Media | | | 1.9 | |
| |
Automobiles | | | 1.9 | |
| |
Food Products | | | 1.9 | |
| |
Insurance | | | 1.7 | |
| |
Portfolio holdings and allocations are subject to change. Percentages are as of December 31, 2015, and are based on net assets.
| | | | |
| CREDIT RATING BREAKDOWN | | NRSRO ONLY TOTAL | |
|
| |
AAA | | | 43.2% | |
| |
AA | | | 5.3 | |
| |
A | | | 14.0 | |
| |
BBB | | | 30.6 | |
| |
BB | | | 3.3 | |
| |
B | | | 0.2 | |
| |
CCC | | | 1.2 | |
| |
D | | | 2.1 | |
| |
Unrated | | | 0.1 | |
| |
Total | | | 100.0% | |
| |
The percentages above are based on the market value of the Fund’s securities as of December 31, 2015, and are subject to change. Except for securities labeled “Unrated,” and except for certain securities issued or guaranteed by a foreign sovereign, all securities have been rated by at least one Nationally Recognized Statistical Rating Organization (“NRSRO”), such as Standard & Poor’s (“S&P”). For securities rated only by an NRSRO other than S&P, OppenheimerFunds, Inc. (the “Sub-Adviser”) converts that rating to the equivalent S&P rating. If two or more NRSROs have assigned a rating to a security, the highest S&P equivalent rating is used. Unrated securities issued or guaranteed by a foreign sovereign are assigned a credit rating equal to the highest NRSRO rating assigned to that foreign sovereign. For securities not rated by an NRSRO, the Sub-Adviser uses its own credit analysis to assign ratings in categories similar to those of S&P. The use of similar categories is not an indication that the Sub-Adviser’s credit analysis process is consistent or comparable with any NRSRO’s process were that NRSRO to rate the same security. Fund assets invested in Oppenheimer Institutional Money Market Fund are assigned that fund’s S&P rating, which is currently AAA. For the purposes of this table, “investment-grade” securities are securities rated within the NRSROs’ four highest rating categories (AAA, AA, A and BBB). Unrated securities do not necessarily indicate low credit quality, and may or may not be the equivalent of investment-grade. Please consult the Fund’s prospectus and Statement of Additional Information for further information.
2 OPPENHEIMER CORE BOND FUND/VA
Fund Performance Discussion
The Fund’s Non-Service shares produced a return of 0.96% during the reporting period. On a relative basis, the Fund outperformed its benchmarks, the Barclays U.S. Aggregate Bond Index (the “Index”), the Barclays Credit Index and the Citigroup Broad Investment Grade Bond Index, which returned 0.55%, -0.77%, 0.53%, respectively.
MARKET OVERVIEW
2015 will go down as a year in which volatility returned to the financial markets following a multi-year hiatus. Global growth struggled to gain traction as many of the world’s largest economies expanded below their long-term trends. China’s industrial production slowed for the fifth consecutive year and weighed on the world’s exporters—especially commodity producers. In the United States, a strong dollar impaired the competitiveness of many American companies and proved to be a drag on corporate earnings.
The environment led to a turbulent environment for various asset classes, particularly over the second half of 2015. The prospect of more sluggish demand for energy and construction materials from China and other emerging markets sent equity and commodity prices broadly lower. The Federal Reserve finally hiked interest rates 0.25% in December, which followed a somewhat underwhelming easing program by the European Central Bank (ECB) earlier in the month.
Global investors became increasingly risk-averse, engaging in a “flight to quality” that punished riskier assets and favored some traditional safe havens, such as U.S. government securities.
FUND REVIEW
During the reporting period, the Fund received its strongest results from its investments in corporate bonds and mortgage-backed securities (“MBS”). Areas that performed particularly well were metals and mining and banking. In metals and mining, the Fund benefited from an underweight position relative to the Index and security selection. Outperformance in banking was driven by security selection. Corporate bond sectors that detracted from performance included technology and industrial energy. Among MBS, the Fund had its largest exposure to government agency MBS, with a smaller allocation to non-agency MBS. Security selection within the agency MBS sector and an allocation to non-agency MBS contributed positively to performance during this reporting period.
The primary detractor from performance versus the Index this reporting period was the Fund’s underweight to U.S. Treasuries, which performed well as investors sought out safety.
STRATEGY & OUTLOOK
Although there will continue to be questions as to the effectiveness of both dovish and hawkish monetary policies, we believe U.S. fixed income markets should be the beneficiary of flows from developed countries where policy easing is extended. As the Fed increases overnight interest rates, it is likely the Treasury yield curve will continue to flatten, as yields on shorter maturity notes rise with the Fed, and long-term rates remain more stable amid continued risk aversion.
As challenges to the global economy continue, it is likely that commodity prices will remain depressed. Although the worst might be behind us, firms producing such commodities will see earnings and balance sheets tested. The Fund remains underweight the energy and the metals and mining sectors given this view. The Fund has been actively reducing exposure to BB-rated corporate bonds as market sentiment has shifted and contagion has built from issues in other sectors. Historically, BB-rated securities have offered attractive yields for slightly greater credit risk relative to their BBB-rated counterparts.
We have been opportunistically taking advantage of movement in the agency residential mortgage-backed securities (RMBS) market. The Fund’s overweight to asset-backed securities (ABS) is primarily concentrated in securities backed by auto loans which currently feature attractive yields and strong underwriting, while its overweight in commercial mortgage-backed securities (CMBS) is focused on the top of the capital structure in non-agency issued securities.
Investors should consider the Fund’s investment objective, risks, charges and expenses carefully before investing. The Fund’s prospectus and summary prospectus contain this and other information about the Fund, and may be obtained by asking your financial advisor or calling us at 1.800.988.8287. Read prospectuses and summary prospectuses carefully before investing.
Total returns include changes in share price and reinvestment of dividends and capital gains distributions in a hypothetical investment for the periods shown.
3 OPPENHEIMER CORE BOND FUND/VA
The Fund’s investment strategy and focus can change over time. The mention of specific fund holdings does not constitute a recommendation by OppenheimerFunds, Inc. and its affiliates.
Shares of Oppenheimer funds are not deposits or obligations of any bank, are not guaranteed by any bank, are not insured by the FDIC or any other agency, and involve investment risks, including the possible loss of the principal amount invested.
Comparing the Fund’s Performance to the Market. The graphs that follow show the performance of a hypothetical $10,000 investment in each share class of the Fund held until December 31, 2015. Performance is measured over a ten-fiscal-year period for both Classes. Performance information does not reflect charges that apply to separate accounts investing in the Fund. If these charges were taken into account, performance would be lower. The graphs assume that all dividends and capital gains distributions were reinvested in additional shares.
The Fund’s performance is compared to the performance of the Barclays Credit Index, an index of non-convertible U.S. investment grade corporate bonds; the Barclays U.S. Aggregate Bond Index, an index of U.S. corporate and government bonds and the Citigroup Broad Investment Grade Bond Index, an index of institutionally traded U.S. Treasury Bonds, government-sponsored bonds, mortgage-backed securities and corporate securities. The indices are unmanaged and cannot be purchased directly by investors. While index comparisons may be useful to provide a benchmark for the Fund’s performance, it must be noted that the Fund’s investments are not limited to the investments comprising the indices. Index performance includes reinvestment of income, but does not reflect transaction costs, fees, expenses or taxes. Index performance is shown for illustrative purposes only as a benchmark for the Fund’s performance, and does not predict or depict performance of the Fund. The Fund’s performance reflects the effects of the Fund’s business and operating expenses.
4 OPPENHEIMER CORE BOND FUND/VA
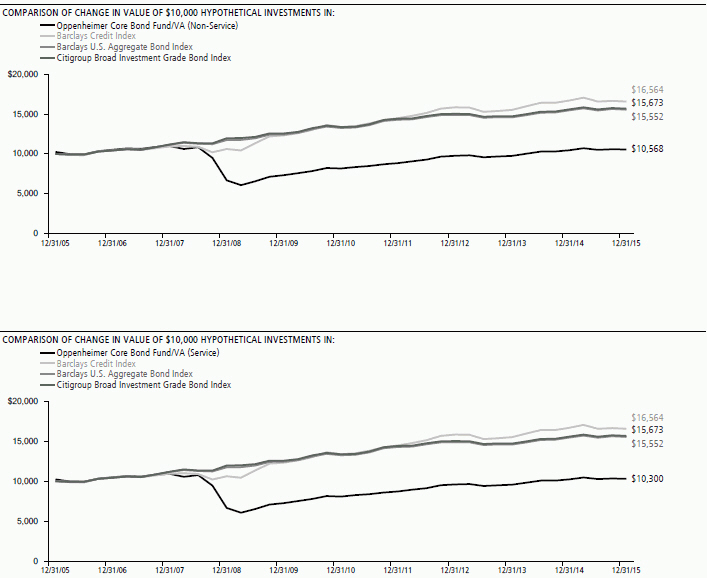
Performance data quoted represents past performance, which does not guarantee future results. The investment return and principal value of an investment in the Fund will fluctuate so that an investor’s shares, when redeemed, may be worth more or less than their original cost. Current performance may be lower or higher than the performance quoted. For performance data current to the most recent month end, call us at 1.800.988.8287. The Fund’s total returns should not be expected to be the same as the returns of other funds, whether or not both funds have the same portfolio managers and/or similar names. The Fund’s total returns include changes in share price and reinvested distributions but do not include the charges associated with the separate account products that offer this Fund. Such performance would have been lower if such charges were taken into account.
5 OPPENHEIMER CORE BOND FUND/VA
Fund Expenses
Fund Expenses. As a shareholder of the Fund, you incur two types of costs: (1) transaction costs and (2) ongoing costs, including management fees; distribution and service fees; and other Fund expenses. These examples are intended to help you understand your ongoing costs (in dollars) of investing in the Fund and to compare these costs with the ongoing costs of investing in other mutual funds.
The examples are based on an investment of $1,000.00 invested at the beginning of the period and held for the entire 6-month period ended December 31, 2015.
Actual Expenses. The first section of the table provides information about actual account values and actual expenses. You may use the information in this section for the class of shares you hold, together with the amount you invested, to estimate the expense that you paid over the period. Simply divide your account value by $1,000.00 (for example, an $8,600.00 account value divided by $1,000.00 = 8.60), then multiply the result by the number in the first section under the heading entitled “Expenses Paid During 6 Months Ended December 31, 2015” to estimate the expenses you paid on your account during this period.
Hypothetical Example for Comparison Purposes.
The second section of the table provides information about hypothetical account values and hypothetical expenses based on the Fund’s actual expense ratio for each class of shares, and an assumed rate of return of 5% per year for each class before expenses, which is not the actual return. The hypothetical account values and expenses may not be used to estimate the actual ending account balance or expenses you paid for the period. You may use this information to compare the ongoing costs of investing in the Fund and other funds. To do so, compare this 5% hypothetical example for the class of shares you hold with the 5% hypothetical examples that appear in the shareholder reports of the other funds.
Please note that the expenses shown in the table are meant to highlight your ongoing fund costs only and do not reflect any charges associated with the separate accounts that offer this Fund. Therefore, the “hypothetical” lines of the table are useful in comparing ongoing fund costs only, and will not help you determine the relative total costs of owning different funds. In addition, if these separate account charges were included your costs would have been higher.
| | | | | | | | | | | | |
Actual | | Beginning Account Value July 1, 2015 | | | Ending Account Value December 31, 2015 | | | Expenses Paid During 6 Months Ended December 31, 2015 | |
Non-Service shares | | $ | 1,000.00 | | | $ | 1,005.20 | | | $ | 3.80 | |
Service shares | | | 1,000.00 | | | | 1,002.60 | | | | 5.06 | |
| | | |
Hypothetical | | | | | | | | | | | | |
(5% return before expenses) | | | | | | | | | | | | |
Non-Service shares | | | 1,000.00 | | | | 1,021.42 | | | | 3.83 | |
Service shares | | | 1,000.00 | | | | 1,020.16 | | | | 5.10 | |
Expenses are equal to the Fund’s annualized expense ratio for that class, multiplied by the average account value over the period, multiplied by 184/365 (to reflect the one-half year period). Those annualized expense ratios, excluding indirect expenses from affiliated funds, based on the 6-month period ended December 31, 2015 are as follows:
| | |
| Class | | Expense Ratios |
Non-Service shares | | 0.75% |
Service shares | | 1.00 |
The expense ratios reflect voluntary and/or contractual waivers and/or reimbursements of expenses by the Fund’s Manager. Some of these undertakings may be modified or terminated at any time, as indicated in the Fund’s prospectus. The “Financial Highlights” tables in the Fund’s financial statements, included in this report, also show the gross expense ratios, without such waivers or reimbursements and reduction to custodian expenses, if applicable.
6 OPPENHEIMER CORE BOND FUND/VA
| | | | |
| |
| STATEMENT OF INVESTMENTS December 31, 2015 | | |
| | | | |
| | | | | | |
| | | Principal
Amount | | | Value |
|
| Asset-Backed Securities—15.7% |
|
| Auto Loan—14.7% | | | | | | |
|
| American Credit Acceptance Receivables Trust: |
| Series 2013-2,Cl. B, 2.84%, 5/15/191 | | $ | 151,768 | | | $ 152,012 |
| Series 2014-1,Cl. B, 2.39%, 11/12/191 | | | 411,167 | | | 411,726 |
| Series 2014-2,Cl. B, 2.26%, 3/10/201 | | | 129,589 | | | 129,631 |
| Series 2014-3,Cl. B, 2.43%, 6/10/201 | | | 445,000 | | | 442,271 |
| Series 2014-4,Cl. B, 2.60%, 10/12/201 | | | 145,000 | | | 143,485 |
| Series 2015-1,Cl. B, 2.85%, 2/12/211 | | | 385,000 | | | 379,257 |
| Series 2015-3,Cl. B, 3.56%, 10/12/212 | | | 325,000 | | | 322,847 |
|
| AmeriCredit Automobile Receivables Trust: |
| Series 2012-2,Cl. E, 4.85%, 8/8/191 | | | 375,000 | | | 380,455 |
| Series 2012-4,Cl. D, 2.68%, 10/9/18 | | | 100,000 | | | 100,784 |
| Series 2013-2,Cl. E, 3.41%, 10/8/201 | | | 345,000 | | | 347,725 |
| Series 2013-3,Cl. E, 3.74%, 12/8/201 | | | 145,000 | | | 145,017 |
| Series 2013-4,Cl. D, 3.31%, 10/8/19 | | | 30,000 | | | 30,503 |
| Series 2013-5,Cl. D, 2.86%, 12/9/19 | | | 225,000 | | | 226,478 |
| Series 2014-1,Cl. D, 2.54%, 6/8/20 | | | 400,000 | | | 399,600 |
| Series 2014-1,Cl. E, 3.58%, 8/9/21 | | | 310,000 | | | 308,675 |
| Series 2014-2,Cl. D, 2.57%, 7/8/20 | | | 305,000 | | | 302,123 |
| Series 2014-2,Cl. E, 3.37%, 11/8/21 | | | 385,000 | | | 379,437 |
| Series 2014-3,Cl. D, 3.13%, 10/8/20 | | | 460,000 | | | 459,989 |
| Series 2014-4,Cl. D, 3.07%, 11/9/20 | | | 235,000 | | | 234,098 |
| Series 2015-2,Cl. C, 2.40%, 1/8/21 | | | 90,000 | | | 88,911 |
| Series 2015-2,Cl. D, 3.00%, 6/8/21 | | | 70,000 | | | 69,141 |
| Series 2015-3,Cl. D, 3.34%, 8/8/21 | | | 175,000 | | | 173,348 |
|
| California Republic Auto Receivables Trust: | | | |
| Series 2013-2,Cl. C, 3.32%, 8/17/20 | | | 230,000 | | | 232,444 |
| Series 2014-2,Cl. C, 3.29%, 3/15/21 | | | 80,000 | | | 79,112 |
| Series 2014-4,Cl. C, 3.56%, 9/15/21 | | | 100,000 | | | 98,887 |
|
| Capital Auto Receivables Asset Trust: | | | |
| Series 2013-4,Cl. D, 3.22%, 5/20/19 | | | 105,000 | | | 106,686 |
| Series 2014-1,Cl. D, 3.39%, 7/22/19 | | | 115,000 | | | 116,849 |
| Series 2014-3,Cl. D, 3.14%, 2/20/20 | | | 160,000 | | | 159,445 |
| Series 2015-1,Cl. D, 3.16%, 8/20/20 | | | 165,000 | | | 163,003 |
| Series 2015-2,Cl. C, 2.67%, 8/20/20 | | | 155,000 | | | 153,526 |
| Series 2015-4,Cl. D, 3.62%, 5/20/21 | | | 260,000 | | | 256,729 |
|
| CarFinance Capital Auto Trust: | | | | | | |
| Series 2013-2A,Cl. B, 3.15%, 8/15/191 | | | 575,000 | | | 578,021 |
| Series 2014-1A,Cl. A, 1.46%, 12/17/181 | | | 39,081 | | | 39,025 |
| Series 2015-1A,Cl. A, 1.75%, 6/15/211 | | | 160,777 | | | 159,826 |
|
| CarMax Auto Owner Trust: | | | | | | |
| Series 2015-2,Cl. D, 3.04%, 11/15/21 | | | 100,000 | | | 99,247 |
| Series 2015-3,Cl. D, 3.27%, 3/15/22 | | | 180,000 | | | 179,589 |
|
| CPS Auto Receivables Trust: | | | | | | |
| Series 2012-B,Cl. A, 2.52%, 9/16/191 | | | 109,330 | | | 109,437 |
| Series 2014-A,Cl. A, 1.21%, 8/15/181 | | | 164,505 | | | 164,020 |
| Series 2014-C,Cl. A, 1.31%, 2/15/191 | | | 162,132 | | | 160,962 |
|
| Credit Acceptance Auto Loan Trust: | | | | | | |
| Series 2013-1A,Cl. B, 1.83%, 4/15/211 | | | 235,000 | | | 234,934 |
| Series 2014-1A,Cl. B, 2.29%, 4/15/221 | | | 215,000 | | | 214,286 |
| Series 2014-2A,Cl. B, 2.67%, 9/15/221 | | | 160,000 | | | 159,976 |
| Series 2015-1A,Cl. C, 3.30%, 7/17/231 | | | 225,000 | | | 222,304 |
| Series 2015-2A,Cl. B, 3.04%, 8/15/231 | | | 330,000 | | | 328,687 |
|
| Drive Auto Receivables Trust: | | | | | | |
| Series 2015-AA,Cl. C, 3.06%, 5/17/211 | | | 250,000 | | | 250,432 |
| Series 2015-BA,Cl. C, 2.76%, 7/15/211 | | | 300,000 | | | 298,098 |
| Series 2015-DA,Cl. C, 3.38%, 11/15/211 | | | 245,000 | | | 244,022 |
|
| DT Auto Owner Trust: | | | | | | |
| Series 2013-1A,Cl. D, 3.74%, 5/15/201 | | | 175,000 | | | 175,719 |
| Series 2013-2A,Cl. D, 4.18%, 6/15/201 | | | 485,000 | | | 488,133 |
| Series 2014-1A,Cl. D, 3.98%, 1/15/211 | | | 360,000 | | | 359,897 |
| Series 2014-2A,Cl. D, 3.68%, 4/15/211 | | | 525,000 | | | 523,033 |
| Series 2014-3A,Cl. D, 4.47%, 11/15/211 | | | 205,000 | | | 205,236 |
| Series 2015-1A,Cl. C, 2.87%, 11/16/201 | | | 180,000 | | | 179,340 |
|
Exeter Automobile Receivables Trust: | | | |
| Series 2014-1A,Cl. B, 2.42%, 1/15/191 | | | 230,000 | | | 230,011 |
| Series 2014-1A,Cl. C, 3.57%, 7/15/191 | | | 230,000 | | | 230,232 |
| Series 2014-2A,Cl. A, 1.06%, 8/15/181 | | | 25,109 | | | 25,042 |
| Series 2014-2A,Cl. C, 3.26%, 12/16/191 | | | 110,000 | | | 108,392 |
| | | | | | |
| | | Principal
Amount | | | Value |
|
| Auto Loan (Continued) | | | | | | |
|
| First Investors Auto Owner Trust: | | | | | | |
| Series 2012-1A,Cl. C, 3.54%, 11/15/171 | | $ | 18,756 | | | $ 18,769 |
| Series 2012-1A,Cl. D, 5.65%, 4/15/181 | | | 155,000 | | | 155,197 |
| Series 2013-3A,Cl. B, 2.32%, 10/15/191 | | | 385,000 | | | 385,949 |
| Series 2013-3A,Cl. C, 2.91%, 1/15/201 | | | 165,000 | | | 165,372 |
| Series 2013-3A,Cl. D, 3.67%, 5/15/201 | | | 125,000 | | | 125,179 |
| Series 2014-1A,Cl. D, 3.28%, 4/15/211 | | | 225,000 | | | 222,725 |
| Series 2014-3A,Cl. D, 3.85%, 2/15/221 | | | 140,000 | | | 140,140 |
|
| Flagship Credit Auto Trust: | | | | | | |
| Series 2014-1,Cl. A, 1.21%, 4/15/191 | | | 78,341 | | | 77,980 |
| Series 2014-2,Cl. A, 1.43%, 12/16/191 | | | 175,550 | | | 174,464 |
|
| GM Financial Automobile Leasing Trust, Series 2015-1, Cl. D, 3.01%, 3/20/20 | | | 240,000 | | | 237,544 |
|
| GO Financial Auto Securitization Trust, Series 2015-1, Cl. A, 1.81%, 3/15/181 | | | 110,851 | | | 110,695 |
|
| Navistar Financial Dealer Note Master Trust, Series 2014-1, Cl. D, 2.722%, 10/25/191,3 | | | 125,000 | | | 124,287 |
|
| Santander Drive Auto Receivables Trust: |
| Series 2013-3,Cl. D, 2.42%, 4/15/19 | | | 55,000 | | | 54,890 |
| Series 2013-4,Cl. D, 3.92%, 1/15/20 | | | 560,000 | | | 573,072 |
| Series 2013-4,Cl. E, 4.67%, 1/15/201 | | | 360,000 | | | 369,503 |
| Series 2013-5,Cl. D, 2.73%, 10/15/19 | | | 205,000 | | | 205,741 |
| Series 2013-A,Cl. E, 4.71%, 1/15/211 | | | 270,000 | | | 276,232 |
| Series 2014-2,Cl. D, 2.76%, 2/18/20 | | | 215,000 | | | 214,161 |
| Series 2014-4,Cl. D, 3.10%, 11/16/20 | | | 185,000 | | | 185,107 |
| Series 2014-5,Cl. D, 3.21%, 1/15/21 | | | 335,000 | | | 335,942 |
| Series 2015-1,Cl. D, 3.24%, 4/15/21 | | | 260,000 | | | 259,742 |
| Series 2015-2,Cl. C, 2.44%, 4/15/21 | | | 290,000 | | | 287,047 |
| Series 2015-2,Cl. D, 3.02%, 4/15/21 | | | 275,000 | | | 270,844 |
| Series 2015-3,Cl. D, 3.49%, 5/17/21 | | | 345,000 | | | 342,304 |
| Series 2015-4,Cl. D, 3.53%, 8/16/21 | | | 265,000 | | | 262,900 |
| Series 2015-5,Cl. C, 2.74%, 12/15/21 | | | 200,000 | | | 198,515 |
|
| SNAAC Auto Receivables Trust: | | | | | | |
| Series 2013-1A,Cl. C, 3.07%, 8/15/181 | | | 129,583 | | | 130,128 |
| Series 2014-1A,Cl. A, 1.03%, 9/17/181 | | | 22,989 | | | 22,979 |
| Series 2014-1A,Cl. D, 2.88%, 1/15/201 | | | 140,000 | | | 140,186 |
|
| TCF Auto Receivables Owner Trust: | | | | | | |
| Series 2014-1A,Cl. C, 3.12%, 4/15/211 | | | 100,000 | | | 99,398 |
| Series 2015-1A,Cl. D, 3.53%, 3/15/221 | | | 160,000 | | | 158,064 |
|
| United Auto Credit Securitization Trust, Series 2015-1, Cl. D, 2.92%, 6/17/191 | | | 225,000 | | | 223,399 |
|
| Westlake Automobile Receivables Trust: | | | | | | |
| Series 2014-1A,Cl. D, 2.20%, 2/15/211 | | | 155,000 | | | 153,300 |
| Series 2014-2A,Cl. D, 2.86%, 7/15/211 | | | 165,000 | | | 162,363 |
| Series 2015-1A,Cl. C, 2.29%, 11/16/201 | | | 215,000 | | | 213,110 |
| Series 2015-2A,Cl. C, 2.45%, 1/15/211 | | | 215,000 | | | 212,362 |
| | | | | | |
| | | | | | 20,251,685 |
|
|
| Equipment—0.5% | | | | | | |
|
| CLI Funding V LLC, Series 2014-2A, Cl. A, 3.38%, 10/18/291 | | | 300,262 | | | 291,450 |
|
| Cronos Containers Program I Ltd., Series 2014-2A, Cl. A, 3.27%, 11/18/291 | | | 202,315 | | | 197,599 |
|
| FRS I LLC, Series 2013-1A, Cl. A1, 1.80%, 4/15/431 | | | 63,329 | | | 62,124 |
|
| Trip Rail Master Funding LLC, Series 2014-1A, Cl. A1, 2.863%, 4/15/441 | | | 85,334 | | | 85,455 |
| | | | | | |
| | | | | | 636,628 |
|
|
| Home Equity Loan—0.3% | | | | | | |
|
| American Credit Acceptance Receivables Trust, Series 2015-2, Cl. B, 2.97%, 5/12/211 | | | 370,000 | | | 363,947 |
|
|
| Loans: Other—0.2% | | | | | | |
|
| Element Rail Leasing I LLC, Series 2014-1A, Cl. A1, 2.299%, 4/19/441 | | | 339,040 | | | 333,877 |
| | | | | | |
| Total Asset-Backed Securities (Cost $21,696,763) | | | | | | 21,586,137 |
7 OPPENHEIMER CORE BOND FUND/VA
| | | | |
| |
| STATEMENT OF INVESTMENTS Continued | | |
| | | | |
| | | | | | | | |
| | | Principal
Amount | | | Value | |
| |
| Mortgage-Backed Obligations—46.0% | | | | | |
| |
| Government Agency—34.0% | | | | | | | | |
| |
| FHLMC/FNMA/FHLB/Sponsored—18.1% | | | | | |
| |
| Federal Home Loan Mortgage Corp. Gold Pool: | | | | | |
| 5.00%, 12/1/34 | | $ | 5,835 | | | $ | 6,469 | |
| 5.50%, 9/1/39 | | | 460,827 | | | | 510,132 | |
| 6.00%, 5/1/18-10/1/29 | | | 683,645 | | | | 764,952 | |
| 6.50%, 4/1/18-4/1/34 | | | 177,685 | | | | 200,477 | |
| 7.00%, 8/1/16-10/1/37 | | | 194,785 | | | | 214,926 | |
| 8.00%, 4/1/16 | | | 173 | | | | 174 | |
| 9.00%, 8/1/22-5/1/25 | | | 14,112 | | | | 15,517 | |
| |
| Federal Home Loan Mortgage Corp. Non Gold Pool, 10.50%, 10/1/20 | | | 1,383 | | | | 1,530 | |
| |
| Federal Home Loan Mortgage Corp., Interest-Only Stripped Mtg.-Backed Security: | |
| Series 205,Cl. IO, 0.00%, 9/1/294,5 | | | 8,018 | | | | 1,926 | |
| Series 206,Cl. IO, 0.00%, 12/1/294,5 | | | 126,056 | | | | 32,564 | |
| Series 243,Cl. 6, 0.00%, 12/15/324,5 | | | 88,136 | | | | 17,300 | |
| |
| Federal Home Loan Mortgage Corp., Mtg.-Linked Amortizing Global Debt Securities, Series 2012-1, Cl. A10, 2.06%, 1/15/22 | | | 483,575 | | | | 488,217 | |
| |
| Federal Home Loan Mortgage Corp., Principal-Only Stripped Mtg.-Backed Security, Series 176, Cl. PO, 4.115%, 6/1/266 | | | 43,252 | | | | 40,260 | |
| |
| Federal Home Loan Mortgage Corp., Real Estate Mtg. Investment Conduit Multiclass Pass-Through Certificates: | |
| Series 151,Cl. F, 9.00%, 5/15/21 | | | 3,867 | | | | 4,268 | |
| Series 1674,Cl. Z, 6.75%, 2/15/24 | | | 14,305 | | | | 15,714 | |
| Series 2034,Cl. Z, 6.50%, 2/15/28 | | �� | 2,301 | | | | 2,622 | |
| Series 2042,Cl. N, 6.50%, 3/15/28 | | | 5,608 | | | | 6,174 | |
| Series 2043,Cl. ZP, 6.50%, 4/15/28 | | | 269,164 | | | | 297,480 | |
| Series 2046,Cl. G, 6.50%, 4/15/28 | | | 15,455 | | | | 17,607 | |
| Series 2053,Cl. Z, 6.50%, 4/15/28 | | | 2,432 | | | | 2,771 | |
| Series 2066,Cl. Z, 6.50%, 6/15/28 | | | 266,804 | | | | 303,952 | |
| Series 2195,Cl. LH, 6.50%, 10/15/29 | | | 207,157 | | | | 236,168 | |
| Series 2220,Cl. PD, 8.00%, 3/15/30 | | | 1,302 | | | | 1,519 | |
| Series 2326,Cl. ZP, 6.50%, 6/15/31 | | | 60,819 | | | | 67,485 | |
| Series 2461,Cl. PZ, 6.50%, 6/15/32 | | | 251,278 | | | | 285,938 | |
| Series 2470,Cl. LF, 1.331%, 2/15/323 | | | 2,002 | | | | 2,055 | |
| Series 2564,Cl. MP, 5.00%, 2/15/18 | | | 71,433 | | | | 73,744 | |
| Series 2585,Cl. HJ, 4.50%, 3/15/18 | | | 40,186 | | | | 41,469 | |
| Series 2635,Cl. AG, 3.50%, 5/15/32 | | | 38,614 | | | | 40,052 | |
| Series 2707,Cl. QE, 4.50%, 11/15/18 | | | 16,301 | | | | 16,879 | |
| Series 2770,Cl. TW, 4.50%, 3/15/19 | | | 9,918 | | | | 10,304 | |
| Series 3010,Cl. WB, 4.50%, 7/15/20 | | | 24,578 | | | | 25,629 | |
| Series 3025,Cl. SJ, 23.538%, 8/15/353 | | | 21,517 | | | | 33,799 | |
| Series 3030,Cl. FL, 0.731%, 9/15/353 | | | 3,246 | | | | 3,257 | |
| Series 3645,Cl. EH, 3.00%, 12/15/20 | | | 85,525 | | | | 87,396 | |
| Series 3741,Cl. PA, 2.15%, 2/15/35 | | | 242,063 | | | | 244,467 | |
| Series 3815,Cl. BD, 3.00%, 10/15/20 | | | 5,210 | | | | 5,304 | |
| Series 3822,Cl. JA, 5.00%, 6/15/40 | | | 8,484 | | | | 8,990 | |
| Series 3840,Cl. CA, 2.00%, 9/15/18 | | | 3,855 | | | | 3,888 | |
| Series 3848,Cl. WL, 4.00%, 4/15/40 | | | 37,565 | | | | 39,358 | |
| Series 3857,Cl. GL, 3.00%, 5/15/40 | | | 7,630 | | | | 7,860 | |
| Series 4221,Cl. HJ, 1.50%, 7/15/23 | | | 130,192 | | | | 129,480 | |
| |
| Federal Home Loan Mortgage Corp., Real Estate Mtg. Investment Conduit Multiclass Pass-Through Certificates, Interest-Only Stripped Mtg.-Backed Security: | |
| Series 2074,Cl. S, 16.424%, 7/17/284 | | | 1,720 | | | | 326 | |
| Series 2079,Cl. S, 0.00%, 7/17/284,7 | | | 3,104 | | | | 619 | |
| Series 2130,Cl. SC, 0.00%, 3/15/294,7 | | | 123,400 | | | | 26,826 | |
| Series 2526,Cl. SE, 0.326%, 6/15/294 | | | 3,620 | | | | 819 | |
| Series 2796,Cl. SD, 0.00%, 7/15/264,7 | | | 190,255 | | | | 34,733 | |
| Series 2920,Cl. S, 17.62%, 1/15/354 | | | 726,142 | | | | 133,190 | |
| Series 2922,Cl. SE, 0.00%, 2/15/354,5 | | | 86,501 | | | | 15,451 | |
| Series 2981,Cl. AS, 0.00%, 5/15/354,5 | | | 118,271 | | | | 23,209 | |
| Series 3004,Cl. SB, 0.00%, 7/15/354,5 | | | 34,250 | | | | 5,203 | |
| Series 3201,Cl. SG, 0.00%, 8/15/364,5 | | | 205,157 | | | | 38,603 | |
| Series 3397,Cl. GS, 0.00%, 12/15/374,5 | | | 17,789 | | | | 3,316 | |
| Series 3424,Cl. EI, 0.00%, 4/15/384,5 | | | 17,723 | | | | 2,094 | |
| Series 3450,Cl. BI, 0.00%, 5/15/384,5 | | | 453,029 | | | | 71,559 | |
| Series 3606,Cl. SN, 0.00%, 12/15/394,5 | | | 121,920 | | | | 21,353 | |
| | | | | | | | |
| | | Principal
Amount | | | Value | |
| |
| FHLMC/FNMA/FHLB/Sponsored (Continued) | | | | | |
| |
| Federal National Mortgage Assn.: | | | | | | | | |
| 3.00%, 1/1/318 | | $ | 5,165,000 | | | $ | 5,320,168 | |
| 3.50%, 1/15/468 | | | 190,000 | | | | 195,980 | |
| 4.00%, 1/1/468 | | | 6,500,000 | | | | 6,876,927 | |
| 5.00%, 1/1/468 | | | 2,220,000 | | | | 2,443,632 | |
| 6.00%, 1/1/468 | | | 160,000 | | | | 180,789 | |
| |
| Federal National Mortgage Assn. Pool: | | | | | |
| 3.50%, 12/1/20-2/1/22 | | | 208,315 | | | | 218,281 | |
| 5.00%, 3/1/21-7/1/22 | | | 12,598 | | | | 13,225 | |
| 5.50%, 2/1/35-5/1/36 | | | 189,692 | | | | 213,661 | |
| 6.50%, 5/1/17-1/1/34 | | | 122,389 | | | | 126,456 | |
| 7.00%, 11/1/17-7/1/35 | | | 51,788 | | | | 58,224 | |
| 7.50%, 1/1/33 | | | 4,971 | | | | 5,915 | |
| 8.50%, 7/1/32 | | | 10,715 | | | | 11,573 | |
| |
| Federal National Mortgage Assn., Interest-Only Stripped Mtg.-Backed Security: | |
| Series 221,Cl. 2, 7.152%, 5/25/234 | | | 2,704 | | | | 541 | |
| Series 222,Cl. 2, 0.00%, 6/25/234,5 | | | 288,720 | | | | 49,624 | |
| Series 252,Cl. 2, 9.92%, 11/25/234 | | | 282,418 | | | | 60,679 | |
| Series 294,Cl. 2, 0.00%, 2/25/284,5 | | | 31,745 | | | | 7,946 | |
| Series 301,Cl. 2, 0.00%, 4/25/294,5 | | | 2,818 | | | | 610 | |
| Series 303,Cl. IO, 0.00%, 11/25/294,5 | | | 56,055 | | | | 13,446 | |
| Series 320,Cl. 2, 0.00%, 4/25/324,5 | | | 211,365 | | | | 56,182 | |
| Series 321,Cl. 2, 0.00%, 4/25/324,5 | | | 572,924 | | | | 122,125 | |
| Series 324,Cl. 2, 0.00%, 7/25/324,5 | | | 6,005 | | | | 1,399 | |
| Series 331,Cl. 5, 0.00%, 2/25/334,5 | | | 8,372 | | | | 1,703 | |
| Series 331,Cl. 9, 0.00%, 2/25/334,5 | | | 185,177 | | | | 40,907 | |
| Series 334,Cl. 12, 0.00%, 3/25/334,5 | | | 13,757 | | | | 3,304 | |
| Series 334,Cl. 17, 1.047%, 2/25/334 | | | 119,905 | | | | 23,842 | |
| Series 339,Cl. 12, 0.00%, 6/25/334,5 | | | 195,744 | | | | 42,232 | |
| Series 339,Cl. 7, 0.00%, 11/25/334,5 | | | 412,694 | | | | 86,691 | |
| Series 343,Cl. 13, 0.00%, 9/25/334,5 | | | 200,107 | | | | 40,260 | |
| Series 343,Cl. 18, 0.00%, 5/25/344,5 | | | 49,558 | | | | 9,902 | |
| Series 345,Cl. 9, 0.00%, 1/25/344,5 | | | 141,051 | | | | 29,100 | |
| Series 351,Cl. 10, 0.00%, 4/25/344,5 | | | 65,483 | | | | 12,389 | |
| Series 351,Cl. 8, 0.00%, 4/25/344,5 | | | 109,805 | | | | 21,049 | |
| Series 356,Cl. 10, 0.00%, 6/25/354,5 | | | 79,665 | | | | 16,008 | |
| Series 356,Cl. 12, 0.00%, 2/25/354,5 | | | 39,004 | | | | 7,975 | |
| Series 362,Cl. 13, 0.00%, 8/25/354,5 | | | 152,202 | | | | 32,527 | |
| Series 364,Cl. 15, 0.00%, 9/25/354,5 | | | 8,132 | | | | 1,607 | |
| Series 364,Cl. 16, 0.00%, 9/25/354,5 | | | 164,882 | | | | 29,268 | |
| Series 365,Cl. 16, 0.00%, 3/25/364,5 | | | 232,069 | | | | 46,764 | |
| |
| Federal National Mortgage Assn., Real Estate Mtg. Investment Conduit Multiclass Pass-Through Certificates: | |
| Series 1993-87,Cl. Z, 6.50%, 6/25/23 | | | 201,938 | | | | 221,886 | |
| Series 1998-58,Cl. PC, 6.50%, 10/25/28 | | | 159,301 | | | | 177,606 | |
| Series 1998-61,Cl. PL, 6.00%, 11/25/28 | | | 77,000 | | | | 87,246 | |
| Series 1999-54,Cl. LH, 6.50%, 11/25/29 | | | 119,477 | | | | 135,589 | |
| Series 2001-44,Cl. QC, 6.00%, 9/25/16 | | | 873 | | | | 887 | |
| Series 2001-51,Cl. OD, 6.50%, 10/25/31 | | | 9,525 | | | | 10,563 | |
| Series 2001-74,Cl. QE, 6.00%, 12/25/31 | | | 189,041 | | | | 214,643 | |
| Series 2002-12,Cl. PG, 6.00%, 3/25/17 | | | 813 | | | | 831 | |
| Series 2003-100,Cl. PA, 5.00%, 10/25/18 | | | 157,688 | | | | 163,696 | |
| Series 2003-28,Cl. KG, 5.50%, 4/25/23 | | | 634,011 | | | | 688,043 | |
| Series 2003-84,Cl. GE, 4.50%, 9/25/18 | | | 7,413 | | | | 7,667 | |
| Series 2004-101,Cl. BG, 5.00%, 1/25/20 | | | 101,645 | | | | 103,150 | |
| Series 2004-25,Cl. PC, 5.50%, 1/25/34 | | | 6,014 | | | | 6,280 | |
| Series 2005-73,Cl. DF, 0.672%, 8/25/353 | | | 9,364 | | | | 9,403 | |
| Series 2006-11,Cl. PS, 23.021%, 3/25/363 | | | 107,026 | | | | 165,798 | |
| Series 2006-46,Cl. SW, 22.653%, 6/25/363 | | | 76,348 | | | | 101,350 | |
| Series 2006-50,Cl. KS, 22.654%, 6/25/363 | | | 105,167 | | | | 160,669 | |
| Series 2008-75,Cl. DB, 4.50%, 9/25/23 | | | 50,536 | | | | 52,121 | |
| Series 2009-113,Cl. DB, 3.00%, 12/25/20 | | | 167,052 | | | | 170,191 | |
| Series 2009-36,Cl. FA, 1.362%, 6/25/373 | | | 90,997 | | | | 93,436 | |
| Series 2009-70,Cl. TL, 4.00%, 8/25/19 | | | 73,570 | | | | 75,202 | |
| Series 2010-43,Cl. KG, 3.00%, 1/25/21 | | | 47,861 | | | | 48,908 | |
| Series 2011-3,Cl. EL, 3.00%, 5/25/20 | | | 276,440 | | | | 281,638 | |
| Series 2011-38,Cl. AH, 2.75%, 5/25/20 | | | 4,609 | | | | 4,682 | |
| Series 2011-82,Cl. AD, 4.00%, 8/25/26 | | | 92,385 | | | | 95,002 | |
8 OPPENHEIMER CORE BOND FUND/VA
| | | | | | | | |
| | | Principal
Amount | | | Value | |
| |
FHLMC/FNMA/FHLB/Sponsored (Continued) | |
| |
| Federal National Mortgage Assn., Real Estate Mtg. Investment Conduit Multiclass | |
| Pass-Through Certificates, Interest-Only Stripped Mtg.-Backed Security: | |
| Series 2001-61,Cl. SH, 0.00%, 11/18/314,5 | | $ | 7,519 | | | $ | 1,585 | |
| Series 2001-63,Cl. SD, 0.875%, 12/18/314 | | | 2,599 | | | | 539 | |
| Series 2001-65,Cl. S, 0.00%, 11/25/314,5 | | | 188,647 | | | | 41,209 | |
| Series 2001-68,Cl. SC, 0.00%, 11/25/314,5 | | | 1,675 | | | | 374 | |
| Series 2001-81,Cl. S, 0.00%, 1/25/324,5 | | | 55,796 | | | | 15,598 | |
| Series 2002-28,Cl. SA, 2.458%, 4/25/324 | | | 1,668 | | | | 384 | |
| Series 2002-38,Cl. SO, 12.714%, 4/25/324 | | | 4,692 | | | | 913 | |
| Series 2002-39,Cl. SD, 8.059%, 3/18/324 | | | 3,103 | | | | 705 | |
| Series 2002-47,Cl. NS, 0.839%, 4/25/324 | | | 165,991 | | | | 38,556 | |
| Series 2002-48,Cl. S, 1.431%, 7/25/324 | | | 2,755 | | | | 644 | |
| Series 2002-51,Cl. S, 0.94%, 8/25/324 | | | 152,380 | | | | 32,714 | |
| Series 2002-52,Cl. SD, 7.68%, 9/25/324 | | | 218,370 | | | | 50,935 | |
| Series 2002-52,Cl. SL, 1.686%, 9/25/324 | | | 1,724 | | | | 400 | |
| Series 2002-53,Cl. SK, 6.23%, 4/25/324 | | | 10,810 | | | | 2,564 | |
| Series 2002-56,Cl. SN, 2.268%, 7/25/324 | | | 3,756 | | | | 864 | |
| Series 2002-60,Cl. SM, 0.222%, 8/25/324 | | | 24,611 | | | | 4,742 | |
| Series 2002-7,Cl. SK, 0.00%, 1/25/324,5 | | | 11,237 | | | | 2,214 | |
| Series 2002-77,Cl. BS, 0.00%, 12/18/324,5 | | | 15,310 | | | | 3,489 | |
| Series 2002-77,Cl. IS, 10.169%, 12/18/324 | | | 7,994 | | | | 1,792 | |
| Series 2002-77,Cl. SH, 0.00%, 12/18/324,5 | | | 79,336 | | | | 16,791 | |
| Series 2002-84,Cl. SA, 3.315%, 12/25/324 | | | 180,438 | | | | 40,933 | |
| Series 2002-9,Cl. MS, 0.00%, 3/25/324,5 | | | 2,827 | | | | 645 | |
| Series 2002-90,Cl. SN, 0.719%, 8/25/324 | | | 12,661 | | | | 2,439 | |
| Series 2002-90,Cl. SY, 4.129%, 9/25/324 | | | 9,031 | | | | 1,711 | |
| Series 2003-26,Cl. DI, 0.00%, 4/25/334,5 | | | 8,358 | | | | 2,032 | |
| Series 2003-33,Cl. SP, 1.323%, 5/25/334 | | | 186,075 | | | | 41,937 | |
| Series 2003-4,Cl. S, 0.723%, 2/25/334 | | | 115,909 | | | | 29,762 | |
| Series 2004-54,Cl. DS, 10.798%, 11/25/304 | | | 158,978 | | | | 30,019 | |
| Series 2005-12,Cl. SC, 0.00%, 3/25/354,5 | | | 40,871 | | | | 7,923 | |
| Series 2005-14,Cl. SE, 6.828%, 3/25/354 | | | 127,747 | | | | 19,922 | |
| Series 2005-40,Cl. SA, 15.246%, 5/25/354 | | | 360,939 | | | | 64,247 | |
| Series 2005-40,Cl. SB, 14.019%, 5/25/354 | | | 16,056 | | | | 2,769 | |
| Series 2005-52,Cl. JH, 0.00%, 5/25/354,5 | | | 94,767 | | | | 16,965 | |
| Series 2005-93,Cl. SI, 0.00%, 10/25/354,5 | | | 266,948 | | | | 45,492 | |
| Series 2008-55,Cl. SA, 0.00%, 7/25/384,5 | | | 19,424 | | | | 2,557 | |
| Series 2009-8,Cl. BS, 0.00%, 2/25/244,5 | | | 61,583 | | | | 2,739 | |
| Series 2011-96,Cl. SA, 4.18%, 10/25/414 | | | 72,995 | | | | 12,686 | |
| Series 2012-134,Cl. SA, 9.421%, 12/25/424 | | | 200,591 | | | | 48,511 | |
| Series 2012-40,Cl. PI, 0.00%, 4/25/414,5 | | | 164,595 | | | | 22,385 | |
| |
| Federal National Mortgage Assn., Real Estate Mtg. Investment Conduit Multiclass Pass-Through Certificates, Principal-Only Stripped Mtg.-Backed Security, Series 1993-184, Cl. M, 4.992%, 9/25/236 | | | 91,122 | | | | 86,507 | |
| | | | | | | | |
| | | | | | | 24,885,965 | |
| | | | | | | | |
| |
| GNMA/Guaranteed—15.9% | |
| |
| Government National Mortgage Assn. I Pool: | |
| 7.00%, 12/15/23-3/15/26 | | | 8,575 | | | | 9,299 | |
8.50%, 8/15/17-12/15/17 | | | 11,460 | | | | 11,784 | |
| |
| Government National Mortgage Assn. II Pool: | |
| 3.50%, 1/15/468 | | | 16,845,000 | | | | 17,555,736 | |
| 4.00%, 1/20/468 | | | 3,935,000 | | | | 4,178,052 | |
| |
| Government National Mortgage Assn., Interest-Only Stripped Mtg.-Backed Security: | |
| Series 2002-15,Cl. SM, 23.703%, 2/16/324 | | | 269,854 | | | | 49,421 | |
| Series 2007-17,Cl. AI, 4.787%, 4/16/374 | | | 84,867 | | | | 16,909 | |
| Series 2011-52,Cl. HS, 0.00%, 4/16/414,5 | | | 564,220 | | | | 104,661 | |
| |
| Government National Mortgage Assn., Real Estate Mtg. Investment Conduit Multiclass Pass-Through Certificates, Series 1999-32, Cl. ZB, 8%, 9/16/29 | | | 39,085 | | | | 45,731 | |
| | | | | | | | |
| | | | | | | 21,971,593 | |
| | | | | | | | |
| |
| Non-Agency—12.0% | | | | | | | | |
| |
| Commercial—9.6% | | | | | | | | |
| |
| Asset Securitization Corp., Interest-Only Stripped Mtg.-Backed Security, Series 1997-D4, Cl. PS1, 0.00%, 4/14/294,5 | | | 1,379,532 | | | | 30,148 | |
| | | | | | | | |
| | | Principal
Amount | | | Value | |
| |
| Commercial (Continued) | | | | | | | | |
| |
| Banc of America Funding Trust: | | | | | | | | |
| Series 2006-G,Cl. 2A4, 0.692%, 7/20/363 | | $ | 680,548 | | | $ | 639,916 | |
| Series 2014-R7,Cl. 3A1, 2.763%, 3/26/362,3 | | | 340,770 | | | | 345,813 | |
| |
| BCAP LLC Trust, Series 2011-R11, Cl. 18A5, 2.43%, 9/26/351,3 | | | 162,239 | | | | 164,033 | |
| |
| Bear Stearns ARM Trust: | | | | | | | | |
| Series 2005-2,Cl. A1, 2.68%, 3/25/353 | | | 216,344 | | | | 217,314 | |
| Series 2005-9,Cl. A1, 2.66%, 10/25/353 | | | 210,027 | | | | 207,200 | |
| |
| Capital Lease Funding Securitization LP, Interest- Only Commercial Mtg. Pass-Through Certificates, Series 1997-CTL1, Cl. IO, 0.00%, 6/22/241,4,5 | | | 1,205,668 | | | | 48,691 | |
| |
| Chase Mortgage Finance Trust, Series 2005-A2, Cl. 1A3, 2.544%, 1/25/363 | | | 153,631 | | | | 143,873 | |
| |
| CHL Mortgage Pass-Through Trust, Series 2005-17, Cl. 1A8, 5.50%, 9/25/35 | | | 23,552 | | | | 23,309 | |
| |
| Citigroup Commercial Mortgage Trust, Series 2013-GC11, Cl. D, 4.457%, 4/10/461,3 | | | 160,000 | | | | 145,469 | |
| |
| Citigroup Global Markets Mortgage Securities VII, Inc., Interest-Only Stripped Mtg.-Backed Security, Series 1999-C1, Cl. X, 0.00%, 5/18/324,5 | | | 3,097,855 | | | | 31 | |
| |
| Citigroup Mortgage Loan Trust, Inc., Series 2006- AR1, Cl. 1A1, 2.57%, 10/25/353 | | | 612,619 | | | | 608,122 | |
| |
| COMM Mortgage Trust: | | | | | | | | |
| Series 2012-CR4,Cl. D, 4.574%, 10/15/451,3 | | | 50,000 | | | | 46,953 | |
| Series 2012-CR5,Cl. E, 4.337%, 12/10/451,3 | | | 300,000 | | | | 278,514 | |
| Series 2013-CR7,Cl. D, 4.352%, 3/10/461,3 | | | 390,000 | | | | 352,624 | |
| Series 2014-CR21,Cl. AM, 3.987%, 12/10/47 | | | 710,000 | | | | 734,233 | |
| |
| COMM Mortgage Trust, Interest-Only Stripped Mtg.-Backed Security, Series 2012-CR5, Cl. XA, 0.00%, 12/10/454,5 | | | 2,651,875 | | | | 207,290 | |
| |
| CSMC: | | | | | | | | |
| Series 2006-6,Cl. 1A4, 6.00%, 7/25/36 | | | 230,833 | | | | 177,225 | |
| Series 2009-13R,Cl. 4A1, 2.747%, 9/26/361,3 | | | 28,639 | | | | 28,755 | |
| |
| DBUBS Mortgage Trust, Series 2011-LC1A, Cl. E, 5.663%, 11/10/461,3 | | | 75,000 | | | | 79,315 | |
| |
| First Horizon Alternative Mortgage Securities Trust: | |
| Series 2004-FA2,Cl. 3A1, 6.00%, 1/25/35 | | | 175,776 | | | | 167,176 | |
| Series 2005-FA8,Cl. 1A6, 1.072%, 11/25/353 | | | 192,545 | | | | 136,195 | |
| |
| FREMF Mortgage Trust: | | | | | | | | |
| Series 2012-K501,Cl. C, 3.397%, 11/25/461,3 | | | 35,000 | | | | 35,119 | |
| Series 2013-K25,Cl. C, 3.618%, 11/25/451,3 | | | 90,000 | | | | 85,654 | |
| Series 2013-K26,Cl. C, 3.599%, 12/25/451,3 | | | 60,000 | | | | 58,175 | |
| Series 2013-K27,Cl. C, 3.496%, 1/25/461,3 | | | 95,000 | | | | 88,907 | |
| Series 2013-K28,Cl. C, 3.494%, 6/25/461,3 | | | 285,000 | | | | 266,997 | |
| Series 2013-K502,Cl. C, 3.18%, 3/25/451,3 | | | 175,000 | | | | 176,525 | |
| Series 2013-K712,Cl. C, 3.371%, 5/25/451,3 | | | 75,000 | | | | 74,416 | |
| Series 2013-K713,Cl. C, 3.165%, 4/25/461,3 | | | 115,000 | | | | 111,099 | |
| Series 2014-K715,Cl. C, 4.123%, 2/25/461,3 | | | 50,000 | | | | 50,791 | |
| Series 2015-K44,Cl. B, 3.685%, 1/25/481,3 | | | 315,000 | | | | 282,803 | |
| |
| GSMSC Pass-Through Trust, Series 2009-3R, Cl. 1A2, 6%, 4/25/371,3 | | | 436,486 | | | | 410,277 | |
| |
| GSR Mortgage Loan Trust, Series 2005-AR4, Cl. 6A1, 2.863%, 7/25/353 | | | 116,538 | | | | 115,379 | |
| |
| JP Morgan Chase Commercial Mortgage Securities | | | | | | | | |
| Corp., Series 2012-LC9, Cl. E, 4.42%, 12/15/471,3 | | | 245,000 | | | | 226,401 | |
| |
| JP Morgan Chase Commercial Mortgage Securities Trust: | |
| Series 2006-LDP8,Cl. AJ, 5.48%, 5/15/453 | | | 275,000 | | | | 279,778 | |
| Series 2012-C6,Cl. E, 5.192%, 5/15/451,3 | | | 325,000 | | | | 318,152 | |
| |
| JP Morgan Mortgage Trust, Series 2007-A1, Cl. 5A1, 2.726%, 7/25/353 | | | 121,531 | | | | 122,063 | |
| |
| JP Morgan Resecuritization Trust: | |
| Series 2009-11,Cl. 5A1, 2.747%, 9/26/361,3 | | | 109,084 | | | | 109,218 | |
| Series 2009-5,Cl. 1A2, 2.738%, 7/26/361,3 | | | 404,709 | | | | 362,475 | |
| |
| JPMBB Commercial Mortgage Securities Trust: | |
| Series 2014-C25,Cl. AS, 4.065%, 11/15/47 | | | 300,000 | | | | 309,969 | |
| Series 2014-C26,Cl. AS, 3.80%, 1/15/48 | | | 145,000 | | | | 146,072 | |
| |
| LB Commercial Conduit Mortgage Trust, Interest- Only Stripped Mtg.-Backed Security, Series 1998- C1, Cl. IO, 0.00%, 2/18/304,5 | | | 373,810 | | | | 3,869 | |
9 OPPENHEIMER CORE BOND FUND/VA
| | | | |
| |
| STATEMENT OF INVESTMENTS Continued | | |
| | | | |
| | | | | | | | |
| | | Principal
Amount | | | Value | |
| |
| Commercial (Continued) | | | | | |
| |
| Lehman Structured Securities Corp., Series 2002- GE1, Cl. A, 2.514%, 7/26/241,3 | | $ | 54,749 | | | $ | 45,818 | |
| |
| Morgan Stanley Bank of America Merrill Lynch Trust: | |
| Series 2012-C6,Cl. E, 4.657%, 11/15/451,3 | | | 400,000 | | | | 384,550 | |
| Series 2013-C7,Cl. D, 4.297%, 2/15/461,3 | | | 175,000 | | | | 162,141 | |
| Series 2013-C8,Cl. D, 4.169%, 12/15/481,3 | | | 130,000 | | | | 119,766 | |
| Series 2014-C19,Cl. AS, 3.832%, 12/15/47 | | | 595,000 | | | | 603,630 | |
| |
| Morgan Stanley Capital I Trust, Series 2007-IQ13, Cl. AM, 5.406%, 3/15/44 | | | 295,000 | | | | 303,054 | |
| |
| Morgan Stanley Re-Remic Trust, Series 2012-R3, Cl. 1B, 2.176%, 11/26/361,3 | | | 451,761 | | | | 301,217 | |
| |
| Morgan Stanley Resecuritization Trust, Series 2013-R9, Cl. 3A, 2.402%, 6/26/461,3 | | | 284,939 | | | | 286,326 | |
| |
| RBSSP Resecuritization Trust, Series 2010-1, Cl. 2A1, 2.109%, 7/26/451,3 | | | 29,803 | | | | 29,743 | |
| |
| Structured Agency Credit Risk Debt Nts.: | |
| Series 2014-DN1,Cl. M2, 2.622%, 2/25/243 | | | 180,000 | | | | 179,531 | |
| Series 2015-DNA2,Cl. M2, 3.022%, 12/25/273 | | | 115,000 | | | | 114,461 | |
| |
| UBS-Barclays Commercial Mortgage Trust, Series 2012-C2, Cl. E, 4.888%, 5/10/631,3 | | | 65,000 | | | | 63,062 | |
| |
| WaMu Mortgage Pass-Through Certificates Trust: | |
| Series 2005-AR14,Cl. 1A4, 2.523%, 12/25/353 | | | 256,331 | | | | 248,835 | |
| Series 2005-AR16,Cl. 1A1, 2.568%, 12/25/353 | | | 113,968 | | | | 108,703 | |
| |
| Wells Fargo Mortgage-Backed Securities Trust: | |
| Series 2005-AR10,Cl. 1A1, 2.74%, 6/25/353 | | | 517,909 | | | | 530,005 | |
| Series 2005-AR15,Cl. 1A6, 2.736%, 9/25/353 | | | 59,524 | | | | 56,886 | |
| Series 2006-AR7,Cl. 2A4, 2.738%, 5/25/363 | | | 9,393 | | | | 8,968 | |
| Series 2006-AR8,Cl. 2A4, 2.744%, 4/25/363 | | | 138,661 | | | | 135,844 | |
| Series 2007-16,Cl. 1A1, 6.00%, 12/28/37 | | | 131,567 | | | | 137,210 | |
| Series 2007-AR3,Cl. A4, 5.809%, 4/25/373 | | | 69,335 | | | | 67,556 | |
| Series 2007-AR8,Cl. A1, 2.809%, 11/25/373 | | | 185,892 | | | | 164,959 | |
| |
| WF-RBS Commercial Mortgage Trust: | |
| Series 2012-C10,Cl. D, 4.454%, 12/15/451,3 | | | 175,000 | | | | 163,729 | |
| Series 2012-C7,Cl. E, 4.838%, 6/15/451,3 | | | 120,000 | | | | 116,340 | |
| Series 2012-C8,Cl. E, 4.875%, 8/15/451,3 | | | 355,000 | | | | 344,445 | |
| Series 2013-C11,Cl. D, 4.179%, 3/15/451,3 | | | 74,000 | | | | 68,819 | |
| | | | | | | | |
| | | | | | | 13,161,936 | |
| |
| Multi-Family—0.2% | | | | | | | | |
| |
| Wells Fargo Mortgage-Backed Securities Trust: | |
| Series 2005-AR15,Cl. 1A2, 2.736%, 9/25/353 | | | 150,450 | | | | 147,140 | |
| Series 2006-AR2,Cl. 2A3, 2.763%, 3/25/363 | | | 130,843 | | | | 129,266 | |
| | | | | | | | |
| | | | | | | 276,406 | |
| |
| Residential—2.2% | | | | | | | | |
| |
| Banc of America Funding Trust: | |
| Series 2007-1,Cl. 1A3, 6.00%, 1/25/37 | | | 163,347 | | | | 150,223 | |
| Series 2007-C,Cl. 1A4, 4.007%, 5/20/363 | | | 70,793 | | | | 66,384 | |
| |
| Banc of America Mortgage Trust, Series 2007-1, Cl. 1A24, 6%, 3/25/37 | | | 109,296 | | | | 99,559 | |
| |
| Bear Stearns ARM Trust, Series 2006-1, Cl. A1, 2.58%, 2/25/363 | | | 293,022 | | | | 290,982 | |
| |
| Carrington Mortgage Loan Trust, Series 2006- FRE1, Cl. A2, 0.532%, 7/25/363 | | | 89,253 | | | | 88,342 | |
| |
CHL Mortgage Pass-Through Trust: | |
| Series 2005-26,Cl. 1A8, 5.50%, 11/25/35 | | | 128,996 | | | | 123,417 | |
| Series 2005-J4,Cl. A7, 5.50%, 11/25/35 | | | 18,794 | | | | 18,706 | |
| |
| HomeBanc Mortgage Trust, Series 2005-3, Cl. A2, 0.732%, 7/25/353 | | | 53,683 | | | | 50,476 | |
| |
| MASTR Asset Backed Securities Trust, Series 2006- WMC3, Cl. A3, 0.522%, 8/25/363 | | | 52,063 | | | | 22,866 | |
| |
| NC Finance Trust, Series 1999-I, Cl. D, 8.75%, 1/25/292,9 | | | 3,370,016 | | | | 842,504 | |
| |
| RALI Trust: | | | | | | | | |
| Series 2003-QS1,Cl. A2, 5.75%, 1/25/33 | | | 1,595 | | | | 1,595 | |
| Series 2006-QS13,Cl. 1A8, 6.00%, 9/25/36 | | | 1,065 | | | | 859 | |
| Series 2007-QS6,Cl. A28, 5.75%, 4/25/37 | | | 13,153 | | | | 10,714 | |
| |
| WaMu Mortgage Pass-Through Certificates Trust, Series 2003-AR10, Cl. A7, 2.535%, 10/25/333 | | | 133,699 | | | | 136,852 | |
| | | | | | | | |
| | | Principal
Amount | | | Value | |
| |
| Residential (Continued) | | | | | | | | |
| |
| Wells Fargo Mortgage Backed Securities Trust: | |
| Series 2005-AR13,Cl. 1A5, 2.74%, 5/25/353 | | $ | 207,689 | | | $ | 209,172 | |
| Series 2006-AR10,Cl. 5A5, 2.738%, 7/25/363 | | | 282,032 | | | | 274,529 | |
| |
| Wells Fargo Mortgage-Backed Securities Trust: | |
| Series 2005-AR4,Cl. 2A2, 2.683%, 4/25/353 | | | 352,050 | | | | 354,517 | |
| Series 2006-AR14,Cl. 1A2, 5.851%, 10/25/363 | | | 146,000 | | | | 141,825 | |
| Series 2006-AR8,Cl. 2A1, 2.744%, 4/25/363 | | | 173,448 | | | | 169,925 | |
| | | | | | | | |
| | | | | | | 3,053,447 | |
| | | | | | | | |
| Total Mortgage-Backed Obligations (Cost $67,167,678) | | | | | | | 63,349,347 | |
| | | | | | | | |
| |
U.S. Government Obligations—1.2% | | | | | |
| |
| Federal Home Loan Mortgage Corp. Nts., 1%, 12/15/17 | | | 259,000 | | | | 258,400 | |
| |
| United States Treasury Nts., 1.50%, 5/31/19 | | | 1,438,000 | | | | 1,439,851 | |
| | | | | | | | |
| Total U.S. Government Obligations (Cost $1,703,181) | | | | | | | 1,698,251 | |
|
| |
Corporate Bonds and Notes—44.7% | | | | | |
| |
| Consumer Discretionary—7.2% | | | | | |
| |
| Auto Components—0.1% | |
| |
| BorgWarner, Inc., 4.375% Sr. Unsec. Nts., 3/15/45 | | | 109,000 | | | | 97,603 | |
| |
| Johnson Controls, Inc., 1.40% Sr. Unsec. Nts., 11/2/17 | | | 66,000 | | | | 65,349 | |
| | | | | | | | |
| | | | | | | 162,952 | |
|
| |
| Automobiles—1.9% | | | | | | | | |
| |
| Daimler Finance North America LLC, 8.50% Sr. Unsec. Unsub. Nts., 1/18/31 | | | 237,000 | | | | 344,204 | |
| |
| Ford Motor Credit Co. LLC, 3.664% Sr. Unsec. Nts., 9/8/24 | | | 796,000 | | | | 776,062 | |
| |
| General Motors Co., 6.25% Sr. Unsec. Nts., 10/2/43 | | | 363,000 | | | | 384,309 | |
| |
| General Motors Financial Co., Inc., 3% Sr. Unsec. Nts., 9/25/17 | | | 344,000 | | | | 345,455 | |
| |
| Harley-Davidson, Inc., 4.625% Sr. Unsec. Nts., 7/28/45 | | | 93,000 | | | | 91,402 | |
| |
| Hyundai Capital America, 2.40% Sr. Unsec. Nts., 10/30/181 | | | 348,000 | | | | 347,093 | |
| |
| Kia Motors Corp., 3.625% Sr. Unsec. Nts., 6/14/161 | | | 284,000 | | | | 286,360 | |
| | | | | | | | |
| | | | | | | 2,574,885 | |
| |
| Hotels, Restaurants & Leisure—1.1% | |
| |
| Carnival Corp., 1.20% Sr. Unsec. Nts., 2/5/16 | | | 386,000 | | | | 386,127 | |
| |
| Marriott International, Inc.: 3.25% Sr. Unsec. Nts., 9/15/22 | | | 228,000 | | | | 225,824 | |
| 6.375% Sr. Unsec. Nts., 6/15/17 | | | 314,000 | | | | 335,741 | |
| |
| McDonald’s Corp.: | | | | | | | | |
| 2.75% Sr. Unsec. Nts., 12/9/20 | | | 153,000 | | | | 153,100 | |
| 4.875% Sr. Unsec. Nts., 12/9/45 | | | 26,000 | | | | 26,242 | |
| |
| Wyndham Worldwide Corp., 6% Sr. Unsec. Nts., 12/1/16 | | | 335,000 | | | | 347,910 | |
| | | | | | | | |
| | | | | | | 1,474,944 | |
| |
| Household Durables—0.7% | |
| |
| Jarden Corp., 5% Sr. Unsec. Nts., 11/15/231 | | | 346,000 | | | | 355,515 | |
| |
| Lennar Corp., 4.75% Sr. Unsec. Nts., 5/30/25 | | | 159,000 | | | | 156,217 | |
| |
| Toll Brothers Finance Corp., 4.375% Sr. Unsec. Nts., 4/15/23 | | | 352,000 | | | | 343,200 | |
| |
| Whirlpool Corp.: | | | | | | | | |
| 1.35% Sr. Unsec. Nts., 3/1/17 | | | 104,000 | | | | 103,424 | |
10 OPPENHEIMER CORE BOND FUND/VA
| | | | | | | | |
| | | Principal
Amount | | | Value | |
| |
| Household Durables (Continued) | | | | | |
| |
| Whirlpool Corp.: (Continued) | | | | | | | | |
| 1.65% Sr. Unsec. Nts., 11/1/17 | | $ | 85,000 | | | $ | 84,597 | |
| | | | | | | | |
| | | | | | | 1,042,953 | |
| |
| Leisure Equipment & Products—0.3% | | | | | |
| |
| Mattel, Inc., 1.70% Sr. Unsec. Nts., 3/15/18 | | | 371,000 | | | | 366,326 | |
|
| |
| Media—1.9% | | | | | | | | |
| |
| 21st Century Fox America, Inc., 6.15% Sr. Unsec. Nts., 2/15/41 | | | 79,000 | | | | 89,112 | |
| |
| CCO Safari II LLC: | | | | | | | | |
| 4.908% Sr. Sec. Nts., 7/23/251 | | | 112,000 | | | | 112,059 | |
| 6.484% Sr. Sec. Nts., 10/23/451 | | | 185,000 | | | | 185,550 | |
| |
| Comcast Cable Communications Holdings, Inc., 9.455% Sr. Unsec. Nts., 11/15/22 | | | 242,000 | | | | 334,407 | |
| |
| Historic TW, Inc.: | | | | | | | | |
| 8.05% Sr. Unsec. Nts., 1/15/16 | | | 64,000 | | | | 64,106 | |
| 9.15% Debs., 2/1/23 | | | 96,000 | | | | 124,800 | |
| |
| Interpublic Group of Cos., Inc. (The), 4.20% Sr. Unsec. Nts., 4/15/24 | | | 191,000 | | | | 189,603 | |
| |
| Pearson Funding Two plc, 4% Sr. Unsec. Nts., 5/17/161 | | | 85,000 | | | | 85,607 | |
| |
| Scripps Networks Interactive, Inc., 2.70% Sr. Unsec. Nts., 12/15/16 | | | 351,000 | | | | 353,585 | |
| |
| Sky plc, 3.75% Sr. Unsec. Nts., 9/16/241 | | | 187,000 | | | | 183,079 | |
| |
| Thomson Reuters Corp., 1.65% Sr. Unsec. Nts., 9/29/17 | | | 366,000 | | | | 364,293 | |
| |
| Time Warner Cable, Inc., 4.50% Sr. Unsec. Unsub. Nts., 9/15/42 | | | 126,000 | | | | 99,221 | |
| |
| Viacom, Inc., 2.50% Sr. Unsec. Nts., 12/15/16 | | | 155,000 | | | | 155,361 | |
| |
| Virgin Media Secured Finance plc, 5.25% Sr. Sec. Nts., 1/15/261 | | | 360,000 | | | | 351,000 | |
| | | | | | | | |
| | | | | | | 2,691,783 | |
|
| |
| Multiline Retail—0.3% | | | | | | | | |
| |
| Dollar Tree, Inc., 5.75% Sr. Sec. Nts., 3/1/231 | | | 260,000 | | | | 272,350 | |
| |
| Kohl’s Corp., 5.55% Sr. Unsec. Nts., 7/17/45 | | | 112,000 | | | | 104,608 | |
| | | | | | | | |
| | | | | | | 376,958 | |
| |
| Specialty Retail—0.7% | | | | | | | | |
| |
| Best Buy Co., Inc., 5.50% Sr. Unsec. Nts., 3/15/21 | | | 349,000 | | | | 361,651 | |
| |
| Home Depot, Inc. (The), 4.875% Sr. Unsec. Nts., 2/15/44 | | | 142,000 | | | | 156,752 | |
| |
| Ross Stores, Inc., 3.375% Sr. Unsec. Nts., 9/15/24 | | | 355,000 | | | | 350,097 | |
| |
| Signet UK Finance plc, 4.70% Sr. Unsec. Nts., 6/15/24 | | | 101,000 | | | | 99,681 | |
| | | | | | | | |
| | | | | | | 968,181 | |
|
| |
| Textiles, Apparel & Luxury Goods—0.2% | |
| |
| PVH Corp., 4.50% Sr. Unsec. Unsub. Nts., 12/15/22 | | | 293,000 | | | | 287,872 | |
|
| |
| Consumer Staples—4.5% | |
| |
| Beverages—0.9% | | | | | | | | |
| |
| Anheuser-Busch InBev Worldwide, Inc., 8.20% Sr. Unsec. Unsub. Nts., 1/15/39 | | | 230,000 | | | | 331,922 | |
| |
| Constellation Brands, Inc., 4.75% Sr. Unsec. Nts., 11/15/24 | | | 350,000 | | | | 357,875 | |
| |
| Pernod Ricard SA: | | | | | | | | |
| 2.95% Sr. Unsec. Nts., 1/15/171 | | | 357,000 | | | | 361,545 | |
| 4.25% Sr. Unsec. Nts., 7/15/221 | | | 222,000 | | | | 228,366 | |
| | | | | | | | |
| | | | | | | 1,279,708 | |
| | | | | | | | |
| | | Principal
Amount | | | Value | |
| |
| Food & Staples Retailing—0.8% | |
| |
| CVS Health Corp.: | | | | | | | | |
| 5.125% Sr. Unsec. Nts., 7/20/45 | | $ | 95,000 | | | $ | 100,462 | |
| 5.30% Sr. Unsec. Nts., 12/5/43 | | | 84,000 | | | | 91,321 | |
| |
| Delhaize Group: | | | | | | | | |
| 5.70% Sr. Unsec. Nts., 10/1/40 | | | 215,000 | | | | 221,790 | |
| 6.50% Sr. Unsec. Nts., 6/15/17 | | | 42,000 | | | | 44,432 | |
| |
| Kroger Co. (The): | | | | | | | | |
| 6.40% Sr. Unsec. Nts., 8/15/17 | | | 330,000 | | | | 354,513 | |
| 6.90% Sr. Unsec. Nts., 4/15/38 | | | 90,000 | | | | 111,549 | |
| |
| Wal-Mart Stores, Inc., 4.30% Sr. Unsec. Nts., 4/22/44 | | | 192,000 | | | | 196,241 | |
| | | | | | | | |
| | | | | | | 1,120,308 | |
|
| |
| Food Products—1.9% | | | | | | | | |
| |
| Bunge Ltd. Finance Corp.: | | | | | | | | |
| 3.20% Sr. Unsec. Nts., 6/15/17 | | | 300,000 | | | | 303,058 | |
| 8.50% Sr. Unsec. Nts., 6/15/19 | | | 289,000 | | | | 335,041 | |
| |
| ConAgra Foods, Inc., 4.65% Sr. Unsec. Nts., 1/25/43 | | | 109,000 | | | | 97,580 | |
| |
| Ingredion, Inc., 1.80% Sr. Unsec. Nts., 9/25/17 | | | 374,000 | | | | 370,766 | |
| |
| JM Smucker Co., 1.75% Sr. Unsec. Nts., 3/15/18 | | | 288,000 | | | | 286,816 | |
| |
| Kraft Foods Group, Inc., 5% Sr. Unsec. Nts., 6/4/42 | | | 85,000 | | | | 85,897 | |
| |
| Kraft Heinz Foods Co.: | | | | | | | | |
| 3.95% Sr. Unsec. Nts., 7/15/251 | | | 186,000 | | | | 188,163 | |
| 5.20% Sr. Unsec. Nts., 7/15/451 | | | 42,000 | | | | 44,023 | |
| |
| TreeHouse Foods, Inc., 4.875% Sr. Unsec. Nts., 3/15/22 | | | 365,000 | | | | 348,575 | |
| |
| Tyson Foods, Inc.: | | | | | | | | |
| 4.875% Sr. Unsec. Nts., 8/15/34 | | | 118,000 | | | | 120,715 | |
| 6.60% Sr. Unsec. Nts., 4/1/16 | | | 341,000 | | | | 345,535 | |
| | | | | | | | |
| | | | | | | 2,526,169 | |
|
| |
| Tobacco—0.9% | | | | | | | | |
| |
| Altria Group, Inc., 10.20% Sr. Unsec. Nts., 2/6/39 | | | 202,000 | | | | 332,217 | |
| |
| Imperial Tobacco Finance plc, 2.05% Sr. Unsec. Nts., 7/20/181 | | | 357,000 | | | | 355,303 | |
| |
| Reynolds American, Inc.: | | | | | | | | |
| 5.85% Sr. Unsec. Nts., 8/15/45 | | | 162,000 | | | | 180,645 | |
| 6.75% Sr. Unsec. Nts., 6/15/17 | | | 325,000 | | | | 347,073 | |
| | | | | | | | |
| | | | | | | 1,215,238 | |
|
| |
| Energy—4.4% | | | | | | | | |
| |
| Energy Equipment & Services—1.1% | |
| |
| Halliburton Co., 5% Sr. Unsec. Nts., 11/15/45 | | | 92,000 | | | | 91,090 | |
| |
| Helmerich & Payne International Drilling Co., 4.65% Sr. Unsec. Nts., 3/15/25 | | | 146,000 | | | | 146,418 | |
| |
| Nabors Industries, Inc., 2.35% Sr. Unsec. Nts., 9/15/16 | | | 333,000 | | | | 331,413 | |
| |
| Schlumberger Holdings Corp.: | | | | | | | | |
| 1.90% Sr. Unsec. Nts., 12/21/171 | | | 374,000 | | | | 372,778 | |
| 4.00% Sr. Unsec. Nts., 12/21/251 | | | 244,000 | | | | 241,393 | |
| |
| Sinopec Group Overseas Development 2014 Ltd., 1.75% Sr. Unsec. Nts., 4/10/171 | | | 369,000 | | | | 367,900 | |
| | | | | | | | |
| | | | | | | 1,550,992 | |
|
| |
| Oil, Gas & Consumable Fuels—3.3% | |
| |
| Anadarko Petroleum Corp., 6.20% Sr. Unsec. Nts., 3/15/40 | | | 203,000 | | | | 187,319 | |
| |
| Apache Corp., 4.75% Sr. Unsec. Nts., 4/15/43 | | | 107,000 | | | | 92,248 | |
| |
| Boardwalk Pipelines LP, 4.95% Sr. Unsec. Nts., 12/15/24 | | | 201,000 | | | | 175,154 | |
| |
| Buckeye Partners LP, 6.05% Sr. Unsec. Nts., 1/15/18 | | | 164,000 | | | | 170,334 | |
11 OPPENHEIMER CORE BOND FUND/VA
| | | | |
| |
| STATEMENT OF INVESTMENTS Continued | | |
| | | | |
| | | | | | | | |
| | | Principal Amount | | | Value | |
| |
Oil, Gas & Consumable Fuels (Continued) | | | | | |
| |
| Canadian Natural Resources Ltd.: | | | | | | | | |
| 1.75% Sr. Unsec. Nts., 1/15/18 | | $ | 142,000 | | | $ | 138,201 | |
| 5.90% Sr. Unsec. Nts., 2/1/18 | | | 160,000 | | | | 166,675 | |
| |
| Cenovus Energy, Inc., 5.20% Sr. Unsec. Nts., 9/15/43 | | | 102,000 | | | | 80,100 | |
| |
| Cimarex Energy Co., 4.375% Sr. Unsec. Nts., 6/1/24 | | | 195,000 | | | | 173,361 | |
| |
| CNOOC Nexen Finance 2014 ULC, 1.625% Sr. Unsec. Nts., 4/30/17 | | | 373,000 | | | | 371,085 | |
| |
| Columbia Pipeline Group, Inc., 4.50% Sr. Unsec. Nts., 6/1/251 | | | 195,000 | | | | 177,074 | |
| |
| Devon Energy Corp., 4.75% Sr. Unsec. Nts., 5/15/42 | | | 162,000 | | | | 115,294 | |
| |
| EnLink Midstream Partners LP, 2.70% Sr. Unsec. Nts., 4/1/19 | | | 299,000 | | | | 273,012 | |
| |
| Enterprise Products Operating LLC: | | | | | | | | |
| 4.85% Sr. Unsec. Nts., 8/15/42 | | | 105,000 | | | | 84,235 | |
| 4.90% Sr. Unsec. Nts., 5/15/46 | | | 37,000 | | | | 30,336 | |
| |
| Husky Energy, Inc., 6.20% Sr. Unsec. Nts., 9/15/17 | | | 207,000 | | | | 215,921 | |
| |
| Kinder Morgan, Inc., 5.55% Sr. Unsec. Nts., 6/1/45 | | | 250,000 | | | | 195,842 | |
| |
| Origin Energy Finance Ltd.: | | | | | | | | |
| 3.50% Sr. Unsec. Nts., 10/9/181 | | | 394,000 | | | | 384,501 | |
| 5.45% Sr. Unsec. Nts., 10/14/211 | | | 122,000 | | | | 118,923 | |
| |
| Phillips 66 Partners LP, 3.605% Sr. Unsec. Nts., 2/15/25 | | | 28,000 | | | | 24,634 | |
| |
| Pioneer Natural Resources Co., 6.65% Sr. Unsec. Nts., 3/15/17 | | | 331,000 | | | | 341,854 | |
| |
| Regency Energy Partners LP/Regency Energy | | | | | | | | |
| Finance Corp., 5% Sr. Unsec. Nts., 10/1/22 | | | 245,000 | | | | 217,435 | |
| |
| Spectra Energy Partners LP, 4.60% Sr. Unsec. Nts., 6/15/21 | | | 238,000 | | | | 240,609 | |
| |
| Western Gas Partners LP, 4% Sr. Unsec. Nts., 7/1/22 | | | 239,000 | | | | 211,767 | |
| |
| Woodside Finance Ltd., 4.60% Sr. Unsec. Unsub. Nts., 5/10/211 | | | 284,000 | | | | 288,409 | |
| | | | | | | | |
| | | | | | | 4,474,323 | |
| | | | | | | | |
| |
| Financials—12.6% | | | | | | | | |
| |
| Capital Markets—3.1% | | | | | | | | |
| |
| Apollo Management Holdings LP, 4% Sr. Unsec. Nts., 5/30/241 | | | 277,000 | | | | 274,050 | |
| |
| Blackstone Holdings Finance Co. LLC, 5% Sr. Unsec. Nts., 6/15/441 | | | 382,000 | | | | 390,324 | |
| |
| Credit Suisse AG, New York, 3.625% Sr. Unsec. Nts., 9/9/24 | | | 421,000 | | | | 424,932 | |
| |
| Deutsche Bank AG, 4.50% Sub. Nts., 4/1/25 | | | 297,000 | | | | 273,750 | |
| |
| Goldman Sachs Group, Inc. (The), 5.15% Sub. Nts., 5/22/45 | | | 262,000 | | | | 255,272 | |
| |
| KKR Group Finance Co. III LLC, 5.125% Sr. Unsec. Nts., 6/1/441 | | | 305,000 | | | | 299,373 | |
| |
| Lazard Group LLC, 4.25% Sr. Unsec. Nts., 11/14/20 | | | 337,000 | | | | 349,578 | |
| |
| Morgan Stanley: | | | | | | | | |
| 4.30% Sr. Unsec. Nts., 1/27/45 | | | 217,000 | | | | 207,744 | |
| 5.00% Sub. Nts., 11/24/25 | | | 332,000 | | | | 353,329 | |
| |
| Nomura Holdings, Inc., 2% Sr. Unsec. Nts., 9/13/16 | | | 373,000 | | | | 374,553 | |
| |
| Raymond James Financial, Inc., 5.625% Sr. Unsec. Unsub. Nts., 4/1/24 | | | 417,000 | | | �� | 462,609 | |
| |
| UBS Preferred Funding Trust V, 6.243% Jr. Sub. Perpetual Bonds, Series 13,10 | | | 556,000 | | | | 558,780 | |
| | | | | | | | |
| | | | | | | 4,224,294 | |
| | | | | | | | |
| |
| Commercial Banks—3.7% | | | | | | | | |
| |
| ABN AMRO Bank NV, 4.75% Sub. Nts., 7/28/251 | | | 360,000 | | | | 359,514 | |
| | | | | | | | |
| | | Principal Amount | | | Value | |
| |
| Commercial Banks (Continued) | |
| |
| Bank of America Corp., 7.75% Jr. Sub. Nts., 5/14/38 | | $ | 354,000 | | | $ | 481,444 | |
| |
| Barclays plc, 3.65% Sr. Unsec. Nts., 3/16/25 | | | 303,000 | | | | 291,751 | |
| |
| BNP Paribas SA, 4.375% Sub. Nts., 9/28/251 | | | 354,000 | | | | 347,416 | |
| |
| Citigroup, Inc., 4.65% Sr. Unsec. Nts., 7/30/45 | | | 290,000 | | | | 294,495 | |
| |
| Citizens Financial Group, Inc., 5.50% Jr. Sub. Perpetual Bonds1,3,10 | | | 166,000 | | | | 163,842 | |
| |
| Cooperatieve Centrale Raiffeisen- Boerenleenbank BA (Netherlands), 4.375% Sub. Nts., 8/4/25 | | | 260,000 | | | | 264,983 | |
| |
| Credit Agricole SA, 8.375% Jr. Sub. Perpetual Bonds1,3,10 | | | 320,000 | | | | 360,000 | |
| |
| FirstMerit Bank NA, 4.27% Sub. Nts., 11/25/26 | | | 362,000 | | | | 363,500 | |
| |
| JPMorgan Chase & Co., 6.75% Jr. Sub. Perpetual Bonds, Series S3,10 | | | 264,000 | | | | 288,090 | |
| |
| Lloyds Banking Group plc, 6.657% Jr. Sub. Perpetual Bonds1,3,10 | | | 334,000 | | | | 375,332 | |
| |
| Regions Bank, Birmingham AL: | | | | | | | | |
| 2.25% Sr. Unsec. Nts., 9/14/18 | | | 287,000 | | | | 286,909 | |
| 6.45% Sub. Nts., 6/26/37 | | | 283,000 | | | | 330,359 | |
| |
| Regions Financial Corp., 7.375% Sub. Nts., 12/10/37 | | | 4,000 | | | | 5,033 | |
| |
| Royal Bank of Scotland Group plc, 7.64% Jr. Sub. Perpetual Bonds, Series U3,10 | | | 300,000 | | | | 315,000 | |
| |
| Societe Generale SA, 5.922% Jr. Sub. Perpetual Bonds1,3,10 | | | 370,000 | | | | 376,938 | |
| |
| SunTrust Banks, Inc., 3.50% Sr. Unsec. Nts., 1/20/17 | | | 203,000 | | | | 206,558 | |
| | | | | | | | |
| | | | | | | 5,111,164 | |
| | | | | | | | |
| |
| Consumer Finance—1.1% | | | | | | | | |
| |
| Ally Financial, Inc., 8% Sr. Unsec. Nts., 11/1/31 | | | 283,000 | | | | 327,926 | |
| |
| Capital One Financial Corp., 3.20% Sr. Unsec. Nts., 2/5/25 | | | 302,000 | | | | 292,662 | |
| |
| Discover Financial Services: | | | | | | | | |
| 3.75% Sr. Unsec. Nts., 3/4/25 | | | 301,000 | | | | 289,760 | |
| 3.95% Sr. Unsec. Nts., 11/6/24 | | | 280,000 | | | | 276,637 | |
| |
| Synchrony Financial: | | | | | | | | |
| 4.25% Sr. Unsec. Nts., 8/15/24 | | | 109,000 | | | | 107,729 | |
| 4.50% Sr. Unsec. Nts., 7/23/25 | | | 262,000 | | | | 262,024 | |
| | | | | | | | |
| | | | | | | 1,556,738 | |
| | | | | | | | |
| |
| Diversified Financial Services—0.7% | |
| |
| McGraw Hill Financial, Inc., 2.50% Sr. Unsec. Nts., 8/15/18 | | | 90,000 | | | | 90,626 | |
| |
| Nationwide Building Society, 3.90% Sr. Unsec. Nts., 7/21/251 | | | 356,000 | | | | 367,815 | |
| |
| Peachtree Corners Funding Trust, 3.976% Sr. Unsec. Nts., 2/15/251 | | | 189,000 | | | | 188,008 | |
| |
| Voya Financial, Inc., 5.65% Jr. Sub. Nts., 5/15/533 | | | 355,000 | | | | 351,450 | |
| | | | | | | | |
| | | | | | | 997,899 | |
| | | | | | | | |
| |
| Insurance—1.7% | | | | | | | | |
| |
| ACE INA Holdings, Inc.: | | | | | | | | |
| 3.35% Sr. Unsec. Nts., 5/3/26 | | | 178,000 | | | | 177,718 | |
| 4.35% Sr. Unsec. Nts., 11/3/45 | | | 140,000 | | | | 142,628 | |
| |
| AXIS Specialty Finance plc, 5.15% Sr. Unsec. Nts., 4/1/45 | | | 308,000 | | | | 303,198 | |
| |
| Five Corners Funding Trust, 4.419% Unsec. Nts., 11/15/231 | | | 310,000 | | | | 324,207 | |
| |
| Liberty Mutual Group, Inc., 4.25% Sr. Unsec. Nts., 6/15/231 | | | 276,000 | | | | 281,084 | |
| |
| MetLife, Inc., 5.25% Jr. Sub. Perpetual Bonds3,10 | | | 258,000 | | | | 263,160 | |
12 OPPENHEIMER CORE BOND FUND/VA
| | | | | | | | |
| | | Principal
Amount | | | Value | |
| |
Insurance (Continued) | | | | | |
| |
| Prudential Financial, Inc., 5.20% Jr. Sub. Nts., 3/15/443 | | $ | 300,000 | | | $ | 290,775 | |
| |
| TIAA Asset Management Finance Co. LLC, 4.125% Sr. Unsec. Nts., 11/1/241 | | | 371,000 | | | | 373,147 | |
| |
| XLIT Ltd., 6.50% Jr. Sub. Perpetual Bonds3,10 | | | 212,000 | | | | 154,495 | |
| | | | | | | | |
| | | | | | | 2,310,412 | |
| | | | | | | | |
| |
Real Estate Investment Trusts (REITs)—2.0% | | | | | |
| |
| American Tower Corp.: | | | | | | | | |
| 5.05% Sr. Unsec. Unsub. Nts., 9/1/20 | | | 149,000 | | | | 161,017 | |
| 5.90% Sr. Unsec. Nts., 11/1/21 | | | 200,000 | | | | 223,074 | |
| |
| Corrections Corp. of America, 4.625% Sr. Unsec. Nts., 5/1/23 | | | 370,000 | | | | 358,900 | |
| |
| First Industrial LP, 7.50% Sr. Unsec. Nts., 12/1/17 | | | 320,000 | | | | 350,086 | |
| |
| HCP, Inc., 5.625% Sr. Unsec. Nts., 5/1/17 | | | 107,000 | | | | 111,956 | |
| |
| Highwoods Realty LP, 7.50% Sr. Unsec. Nts., 4/15/18 | | | 320,000 | | | | 353,862 | |
| |
| Host Hotels & Resorts LP, 3.75% Sr. Unsec. Nts., 10/15/23 | | | 212,000 | | | | 204,753 | |
| |
| Liberty Property LP, 5.50% Sr. Unsec. Nts., 12/15/16 | | | 228,000 | | | | 235,547 | |
| |
| Prologis LP, 4% Sr. Unsec. Nts., 1/15/18 | | | 189,000 | | | | 195,493 | |
| |
| Regency Centers LP, 5.875% Sr. Unsec. Nts., 6/15/17 | | | 31,000 | | | | 32,703 | |
| |
| Ventas Realty LP, 1.25% Sr. Unsec. Nts., 4/17/17 | | | 151,000 | | | | 149,943 | |
| |
| WEA Finance LLC/Westfield UK & Europe Finance plc, 1.75% Sr. Unsec. Nts., 9/15/171 | | | 318,000 | | | | 315,417 | |
| |
| Welltower, Inc., 2.25% Sr. Unsec. Nts., 3/15/18 | | | 75,000 | | | | 74,974 | |
| | | | | | | | |
| | | | | | | 2,767,725 | |
| | | | | | | | |
| |
| Real Estate Management & Development—0.3% | |
| |
| Brookfield Asset Management, Inc., 4% Sr. Unsec. Nts., 1/15/25 | | | 395,000 | | | | 386,598 | |
| | | | | | | | |
| |
Health Care—2.7% | | | | | |
| |
Biotechnology—0.4% | | | | | |
| |
| AbbVie, Inc.: | | | | | | | | |
| 3.60% Sr. Unsec. Nts., 5/14/25 | | | 184,000 | | | | 181,977 | |
| 4.70% Sr. Unsec. Nts., 5/14/45 | | | 74,000 | | | | 72,652 | |
| |
| Biogen, Inc., 5.20% Sr. Unsec. Nts., 9/15/45 | | | 100,000 | | | | 100,403 | |
| |
| Celgene Corp.: | | | | | | | | |
| 3.875% Sr. Unsec. Nts., 8/15/25 | | | 180,000 | | | | 179,785 | |
| 5.00% Sr. Unsec. Nts., 8/15/45 | | | 49,000 | | | | 49,376 | |
| | | | | | | | |
| | | | | | | 584,193 | |
| | | | | | | | |
| |
Health Care Equipment & Supplies—0.8% | | | | | |
| |
| Becton Dickinson & Co.: | | | | | | | | |
| 1.45% Sr. Unsec. Nts., 5/15/17 | | | 384,000 | | | | 382,531 | |
| 3.875% Sr. Unsec. Nts., 5/15/24 | | | 188,000 | | | | 190,913 | |
| |
| DENTSPLY International, Inc., 2.75% Sr. Unsec. Nts., 8/15/16 | | | 352,000 | | | | 354,656 | |
| |
| Zimmer Biomet Holdings, Inc., 3.55% Sr. Unsec. Nts., 4/1/25 | | | 111,000 | | | | 108,130 | |
| | | | | | | | |
| | | | | | | 1,036,230 | |
| | | | | | | | |
| |
Health Care Providers & Services—1.0% | | | | | |
| |
| Cardinal Health, Inc., 3.50% Sr. Unsec. Nts., 11/15/24 | | | 180,000 | | | | 180,641 | |
| |
| Fresenius Medical Care US Finance II, Inc., 5.875% Sr. Unsec. Nts., 1/31/221 | | | 350,000 | | | | 376,250 | |
| |
| Laboratory Corp. of America Holdings, 3.60% Sr. Unsec. Nts., 2/1/25 | | | 534,000 | | | | 516,307 | |
| | | | | | | | |
| | | Principal
Amount | | | Value | |
| |
Health Care Providers & Services (Continued) | | | | | |
| |
| McKesson Corp., 4.883% Sr. Unsec. Nts., 3/15/44 | | $ | 155,000 | | | $ | 155,587 | |
| |
| Medco Health Solutions, Inc., 7.125% Sr. Unsec. Nts., 3/15/18 | | | 156,000 | | | | 172,549 | |
| | | | | | | | |
| | | | | | | 1,401,334 | |
| | | | | | | | |
| |
Life Sciences Tools & Services—0.2% | | | | | |
| |
| Thermo Fisher Scientific, Inc.: | | | | | | | | |
| 2.15% Sr. Unsec. Nts., 12/14/18 | | | 138,000 | | | | 138,023 | |
| 4.15% Sr. Unsec. Nts., 2/1/24 | | | 121,000 | | | | 125,960 | |
| 5.30% Sr. Unsec. Nts., 2/1/44 | | | 45,000 | | | | 48,219 | |
| | | | | | | | |
| | | | | | | 312,202 | |
| | | | | | | | |
| |
Pharmaceuticals—0.3% | | | | | |
| |
| Actavis Funding SCS: | | | | | | | | |
| 3.80% Sr. Unsec. Nts., 3/15/25 | | | 243,000 | | | | 242,247 | |
| 4.75% Sr. Unsec. Nts., 3/15/45 | | | 119,000 | | | | 116,460 | |
| | | | | | | | |
| | | | | | | 358,707 | |
| | | | | | | | |
| |
Industrials—3.2% | | | | | |
| |
Aerospace & Defense—0.7% | | | | | |
| |
| BAE Systems Holdings, Inc., 3.85% Sr. Unsec. Nts., 12/15/251 | | | 258,000 | | | | 256,091 | |
| |
| L-3 Communications Corp.: | | | | | | | | |
| 1.50% Sr. Unsec. Nts., 5/28/17 | | | 100,000 | | | | 98,793 | |
| 3.95% Sr. Unsec. Nts., 11/15/16 | | | 127,000 | | | | 128,941 | |
| |
| Lockheed Martin Corp., 3.55% Sr. Unsec. Nts., 1/15/26 | | | 186,000 | | | | 187,339 | |
| |
| Northrop Grumman Corp., 4.75% Sr. Unsec. Nts., 6/1/43 | | | 180,000 | | | | 185,967 | |
| |
| Textron, Inc., 3.875% Sr. Unsec. Nts., 3/1/25 | | | 111,000 | | | | 109,128 | |
| | | | | | | | |
| | | | | | | 966,259 | |
| | | | | | | | |
| |
Building Products—0.3% | | | | | |
| |
| Owens Corning, 4.20% Sr. Unsec. Nts., 12/15/22 | | | 422,000 | | | | 423,144 | |
| | | | | | | | |
| |
Commercial Services & Supplies—0.3% | | | | | |
| |
| Pitney Bowes, Inc., 4.625% Sr. Unsec. Nts., 3/15/24 | | | 431,000 | | | | 423,135 | |
| | | | | | | | |
| |
Electrical Equipment—0.2% | | | | | |
| |
| Sensata Technologies BV, 4.875% Sr. Unsec. Nts., 10/15/231 | | | 294,000 | | | | 287,017 | |
| | | | | | | | |
| |
Industrial Conglomerates—0.1% | | | | | |
| |
| Roper Technologies, Inc., 3.85% Sr. Unsec. Nts., 12/15/25 | | | 170,000 | | | | 169,602 | |
| | | | | | | | |
| |
Machinery—0.3% | | | | | |
| |
| Crane Co., 4.45% Sr. Unsec. Nts., 12/15/23 | | | 193,000 | | | | 199,116 | |
| |
| Ingersoll-Rand Global Holding Co. Ltd., 4.25% Sr. Unsec. Nts., 6/15/23 | | | 130,000 | | | | 134,119 | |
| | | | | | | | |
| | | | | | | 333,235 | |
| | | | | | | | |
| |
Marine—0.0% | | | | | |
| |
| AP Moeller-Maersk, 3.875% Unsec. Nts., 9/28/251 | | | 39,000 | | | | 37,691 | |
| | | | | | | | |
| |
Professional Services—0.3% | | | | | |
| |
| Experian Finance plc, 2.375% Sr. Unsec. Nts., 6/15/171 | | | 361,000 | | | | 359,539 | |
| | | | | | | | |
| |
Road & Rail—0.7% | | | | | |
| |
| Canadian Pacific Railway Co., 4.80% Sr. Unsec. Nts., 9/15/35 | | | 68,000 | | | | 67,359 | |
| |
| ERAC USA Finance LLC, 4.50% Sr. Unsec. Nts., 2/15/451 | | | 110,000 | | | | 102,625 | |
| |
| Kansas City Southern, 3% Sr. Unsec. Nts., 5/15/231 | | | 119,000 | | | | 112,814 | |
13 OPPENHEIMER CORE BOND FUND/VA
| | | | |
| |
| STATEMENT OF INVESTMENTS Continued | | |
| | | | |
| | | | | | | | |
| | | Principal
Amount | | | Value | |
| |
Road & Rail (Continued) | | | | | |
| |
| Norfolk Southern Corp., 4.65% Sr. Unsec. Nts., 1/15/46 | | $ | 110,000 | | | $ | 105,523 | |
| |
| Penske Truck Leasing Co. LP/PTL Finance Corp.: | | | | | | | | |
| 2.50% Sr. Unsec. Nts., 3/15/161 | | | 154,000 | | | | 154,275 | |
| 3.75% Sr. Unsec. Nts., 5/11/171 | | | 195,000 | | | | 198,998 | |
| 4.25% Sr. Unsec. Nts., 1/17/231 | | | 230,000 | | | | 231,865 | |
| | | | | | | | |
| | | | | | | 973,459 | |
| | | | | | | | |
| |
Trading Companies & Distributors—0.3% | | | | | |
| |
| Air Lease Corp., 3.875% Sr. Unsec. Nts., 4/1/21 | | | 383,000 | | | | 385,872 | |
| | | | | | | | |
| |
Information Technology—2.3% | | | | | |
| |
Electronic Equipment, Instruments, & Components—0.7% | |
| |
| Arrow Electronics, Inc., 5.125% Sr. Unsec. Unsub. Nts., 3/1/21 | | | 407,000 | | | | 428,289 | |
| |
| Avnet, Inc., 4.875% Sr. Unsec. Unsub. Nts., 12/1/22 | | | 280,000 | | | | 287,111 | |
| |
| Flextronics International Ltd., 4.75% Sr. Unsec. Nts., 6/15/251 | | | 290,000 | | | | 283,113 | |
| | | | | | | | |
| | | | | | | 998,513 | |
| | | | | | | | |
| |
IT Services—0.5% | | | | | |
| |
| Fidelity National Information Services, Inc., 1.45% Sr. Unsec. Nts., 6/5/17 | | | 297,000 | | | | 293,094 | |
| |
| Visa, Inc., 4.30% Sr. Unsec. Nts., 12/14/45 | | | 127,000 | | | | 129,049 | |
| |
| Xerox Corp.: | | | | | | | | |
| 2.95% Sr. Unsec. Nts., 3/15/17 | | | 130,000 | | | | 131,008 | |
| 6.75% Sr. Unsec. Nts., 2/1/17 | | | 65,000 | | | | 68,132 | |
| | | | | | | | |
| | | | | | | 621,283 | |
| | | | | | | | |
| |
Semiconductors & Semiconductor Equipment—0.1% | |
| |
| Intel Corp., 4.90% Sr. Unsec. Nts., 7/29/45 | | | 93,000 | | | | 98,543 | |
| | | | | | | | |
| |
Software—0.6% | | | | | |
| |
| Autodesk, Inc.: | | | | | | | | |
| 1.95% Sr. Unsec. Nts., 12/15/17 | | | 279,000 | | | | 278,216 | |
| 4.375% Sr. Unsec. Nts., 6/15/25 | | | 110,000 | | | | 108,312 | |
| |
| Open Text Corp., 5.625% Sr. Unsec. Nts., 1/15/231 | | | 236,000 | | | | 234,230 | |
| |
| Oracle Corp., 3.40% Sr. Unsec. Nts., 7/8/24 | | | 269,000 | | | | 273,596 | |
| | | | | | | | |
| | | | | | | 894,354 | |
| | | | | | | | |
| |
| Technology Hardware, Storage & Peripherals—0.4% | |
| |
| Apple, Inc., 4.375% Sr. Unsec. Nts., 5/13/45 | | | 198,000 | | | | 200,270 | |
| |
| Hewlett Packard Enterprise Co.: | | | | | | | | |
| 2.45% Sr. Unsec. Nts., 10/5/171 | | | 238,000 | | | | 237,911 | |
| 6.35% Sr. Unsec. Nts., 10/15/451 | | | 162,000 | | | | 154,283 | |
| | | | | | | | |
| | | | | | | 592,464 | |
| | | | | | | | |
| |
Materials—2.1% | | | | | |
| |
Chemicals—0.8% | | | | | |
| |
| Agrium, Inc.: | | | | | | | | |
| 3.375% Sr. Unsec. Nts., 3/15/25 | | | 151,000 | | | | 138,112 | |
| 4.125% Sr. Unsec. Nts., 3/15/35 | | | 75,000 | | | | 63,996 | |
| |
| Eastman Chemical Co., 4.65% Sr. Unsec. Nts., 10/15/44 | | | 92,000 | | | | 81,921 | |
| |
| LYB International Finance BV, 5.25% Sr. Unsec. Nts., 7/15/43 | | | 123,000 | | | | 118,435 | |
| |
| Methanex Corp., 4.25% Sr. Unsec. Nts., 12/1/24 | | | 215,000 | | | | 191,100 | |
| |
| RPM International, Inc., 3.45% Sr. Unsec. Unsub. Nts., 11/15/22 | | | 325,000 | | | | 312,279 | |
| |
| Valspar Corp. (The): | | | | | | | | |
| 3.30% Sr. Unsec. Nts., 2/1/25 | | | 103,000 | | | | 98,345 | |
| 3.95% Sr. Unsec. Nts., 1/15/26 | | | 152,000 | | | | 151,404 | |
| | | | | | | | |
| | | | | | | 1,155,592 | |
| | | | | | | | |
| | | Principal
Amount | | | Value | |
| |
Construction Materials—0.5% | | | | | |
| |
| CRH America, Inc., 5.125% Sr. Unsec. Nts., 5/18/451 | | $ | 245,000 | | | $ | 246,062 | |
| |
| James Hardie International Finance Ltd., 5.875% Sr. Unsec. Nts., 2/15/231 | | | 364,000 | | | | 373,100 | |
| | | | | | | | |
| | | | | | | 619,162 | |
| | | | | | | | |
| |
Containers & Packaging—0.3% | | | | | |
| |
| Packaging Corp. of America: | | | | | | | | |
| 3.65% Sr. Unsec. Nts., 9/15/24 | | | 94,000 | | | | 91,564 | |
| 4.50% Sr. Unsec. Nts., 11/1/23 | | | 300,000 | | | | 315,663 | |
| | | | | | | | |
| | | | | | | 407,227 | |
| | | | | | | | |
| |
Metals & Mining—0.4% | | | | | |
| |
| Carpenter Technology Corp., 4.45% Sr. Unsec. Unsub. Nts., 3/1/23 | | | 145,000 | | | | 139,582 | |
| |
| Glencore Finance Canada Ltd., 3.60% Sr. Unsec. Nts., 1/15/171 | | | 302,000 | | | | 291,804 | |
| |
| Glencore Funding LLC, 4.625% Sr. Unsec. Nts., 4/29/241 | | | 65,000 | | | | 47,527 | |
| |
| Goldcorp, Inc., 5.45% Sr. Unsec. Nts., 6/9/44 | | | 101,000 | | | | 81,400 | |
| | | | | | | | |
| | | | | | | 560,313 | |
| | | | | | | | |
| |
Paper & Forest Products—0.1% | | | | | |
| |
| International Paper Co., 4.80% Sr. Unsec. Nts., 6/15/44 | | | 153,000 | | | | 139,597 | |
| | | | | | | | |
| |
Telecommunication Services—2.2% | | | | | |
| |
Diversified Telecommunication Services—2.2% | |
| |
| AT&T, Inc., 4.35% Sr. Unsec. Nts., 6/15/45 | | | 543,000 | | | | 468,464 | |
| |
| British Telecommunications plc, 9.625% Sr. Unsec. Nts., 12/15/30 | | | 247,000 | | | | 361,616 | |
| |
| Deutsche Telekom International Finance BV, 5.75% Sr. Unsec. Nts., 3/23/16 | | | 349,000 | | | | 352,242 | |
| |
| DIRECTV Holdings LLC/DIRECTV Financing Co., Inc., 5.15% Sr. Unsec. Nts., 3/15/42 | | | 55,000 | | | | 51,420 | |
| |
| Orange SA, 2.75% Sr. Unsec. Nts., 9/14/16 | | | 97,000 | | | | 98,104 | |
| |
| Telecom Italia Capital SA, 7.721% Sr. Unsec. Unsub. Nts., 6/4/38 | | | 230,000 | | | | 240,925 | |
| |
| Telefonica Emisiones SAU: | | | | | | | | |
| 3.192% Sr. Unsec. Nts., 4/27/18 | | | 347,000 | | | | 353,968 | |
| 7.045% Sr. Unsec. Unsub. Nts., 6/20/36 | | | 142,000 | | | | 171,183 | |
| |
| Verizon Communications, Inc.: | | | | | | | | |
| 3.50% Sr. Unsec. Nts., 11/1/24 | | | 163,000 | | | | 161,377 | |
| 4.50% Sr. Unsec. Nts., 9/15/20 | | | 448,000 | | | | 481,912 | |
| 4.522% Sr. Unsec. Nts., 9/15/48 | | | 252,000 | | | | 226,250 | |
| 5.012% Sr. Unsec. Nts., 8/21/54 | | | 50,000 | | | | 45,956 | |
| | | | | | | | |
| | | | | | | 3,013,417 | |
| | | | | | | | |
| |
Wireless Telecommunication Services—0.0% | |
| |
| Rogers Communications, Inc., 3.625% Sr. Unsec. Nts., 12/15/25 | | | 68,000 | | | | 67,031 | |
| | | | | | | | |
| |
Utilities—3.5% | | | | | |
| |
Electric Utilities—2.3% | | | | | |
| |
| AEP Texas Central Co., 3.85% Sr. Unsec. Nts., 10/1/251 | | | 177,000 | | | | 179,362 | |
| |
| American Transmission Systems, Inc., 5% Sr. Unsec. Nts., 9/1/441 | | | 99,000 | | | | 99,586 | |
| |
| EDP Finance BV, 5.25% Sr. Unsec. Nts., 1/14/211 | | | 330,000 | | | | 341,911 | |
| |
| Enel Finance International NV, 6.25% Sr. Unsec. Nts., 9/15/171 | | | 333,000 | | | | 354,984 | |
| |
| ITC Holdings Corp., 5.30% Sr. Unsec. Nts., 7/1/43 | | | 78,000 | | | | 80,156 | |
| |
| NextEra Energy Capital Holdings, Inc., 1.586% Sr. Unsec. Nts., 6/1/17 | | | 369,000 | | | | 367,799 | |
| |
| Pennsylvania Electric Co., 5.20% Sr. Unsec. Nts., 4/1/20 | | | 73,000 | | | | 77,908 | |
14 OPPENHEIMER CORE BOND FUND/VA
| | | | | | | | | | |
| | | Principal
Amount | | | Value | | | |
| | | |
Electric Utilities (Continued) | | | | | | | |
| | | |
| PPL Capital Funding, Inc., 3.50% Sr. Unsec. Unsub. Nts., 12/1/22 | | $ | 204,000 | | | $ | 205,908 | | | |
| | | |
| PPL WEM Ltd./Western Power Distribution Ltd., 5.375% Sr. Unsec. Unsub. Nts., 5/1/211 | | | 444,000 | | | | 485,037 | | | |
| | | |
| Public Service Co. of New Mexico, 7.95% | | | | | | | | | | |
| Sr. Unsec. Nts., 5/15/18 | | | 307,000 | | | | 343,772 | | | |
| | | |
| Southern Power Co., 1.85% Sr. Unsec. Nts., 12/1/17 | | | 328,000 | | | | 328,003 | | | |
| | | |
| Trans-Allegheny Interstate Line Co., 3.85% Sr. Unsec. Nts., 6/1/251 | | | 231,000 | | | | 231,491 | | | |
| | | |
| | | | | | | 3,095,917 | | | |
| | | | | | | | | | |
| | | |
| Independent Power and Renewable Electricity Producers—0.2% | | | |
| | | |
| Dayton Power & Light Co. (The), 1.875% Sec. Nts., 9/15/16 | | | 272,000 | | | | 272,277 | | | |
| | | | | | | | | | |
| | | |
| Multi-Utilities—1.0% | | | | | | | | | | |
| | | |
| CenterPoint Energy, Inc., 5.95% Sr. Unsec. Nts., 2/1/17 | | | 327,000 | | | | 341,259 | | | |
| | | |
| CMS Energy Corp.: | | | | | | | | | | |
| 3.875% Sr. Unsec. Nts., 3/1/24 | | | 202,000 | | | | 205,507 | | | |
| 5.05% Sr. Unsec. Unsub. Nts., 3/15/22 | | | 286,000 | | | | 311,628 | | | |
| | | | | | | | |
| | | Principal
Amount | | | Value | |
| |
Multi-Utilities (Continued) | | | | | |
| |
| Consolidated Edison Co. of New York, Inc., | | | | | | | | |
| 4.625% Sr. Unsec. Nts., 12/1/54 | | $ | 84,000 | | | $ | 82,804 | |
| |
| Dominion Gas Holdings LLC, 4.60% Sr. Unsec. Nts., 12/15/44 | | | 141,000 | | | | 131,463 | |
| |
| NiSource Finance Corp., 4.80% Sr. Unsec. Nts., 2/15/44 | | | 148,000 | | | | 150,894 | |
| |
| Puget Energy, Inc., 3.65% Sec. Nts., 5/15/251 | | | 183,000 | | | | 177,751 | |
| | | | | | | | |
| | | | | | | 1,401,306 | |
| | | | | | | | |
Total Corporate Bonds and Notes
(Cost $61,693,939) | | | | 61,457,037 | |
| | | | | | | | |
| | | Shares | | | | |
| |
| Investment Company—17.5% | |
| |
| Oppenheimer Institutional Money Market Fund, Cl. E, 0.30%11,12 (Cost $24,144,526) | | | 24,144,526 | | | | 24,144,526 | |
|
| |
Total Investments, at Value
(Cost $176,406,087) | | | 125.1% | | | | 172,235,298 | |
| |
| Net Other Assets (Liabilities) | | | (25.1) | | | | (34,556,307) | |
| | | | |
| Net Assets | | | 100.0% | | | $ | 137,678,991 | |
| | | | |
Footnotes to Statement of Investments
1. Represents securities sold under Rule 144A, which are exempt from registration under the Securities Act of 1933, as amended. These securities have been determined to be liquid under guidelines established by the Board of Trustees. These securities amount to $35,262,971 or 25.61% of the Fund’s net assets at period end.
2. Restricted security. The aggregate value of restricted securities at period end was $1,511,164, which represents 1.10% of the Fund’s net assets. See Note 4 of the accompanying Notes.
Information concerning restricted securities is as follows:
| | | | | | | | | | | | | | | | |
| Security | | Acquisition
Dates | | | Cost | | | Value | | | Unrealized
Depreciation | |
| |
| American Credit Acceptance Receivables Trust, Series 2015-3, Cl. B, 3.56%, 10/12/21 | | | 9/30/15 | | | $ | 324,967 | | | $ | 322,847 | | | $ | 2,120 | |
| Banc of America Funding Trust, Series 2014-R7, Cl. 3A1, 2.763%, 3/26/36 | | | 3/6/15-5/13/15 | | | | 347,577 | �� | | | 345,813 | | | | 1,764 | |
| NC Finance Trust, Series 1999-I, Cl. D, 8.75%, 1/25/29 | | | 8/10/10 | | | | 3,281,116 | | | | 842,504 | | | | 2,438,612 | |
| | | | | | | | |
| | | | | | $ | 3,953,660 | | | $ | 1,511,164 | | | $ | 2,442,496 | |
| | | | | | | | |
3. Represents the current interest rate for a variable or increasing rate security.
4. Interest-Only Strips represent the right to receive the monthly interest payments on an underlying pool of mortgage loans. These securities typically decline in price as interest rates decline.
Most other fixed income securities increase in price when interest rates decline. The principal amount of the underlying pool represents the notional amount on which current interest is calculated. The price of these securities is typically more sensitive to changes in prepayment rates than traditional mortgage-backed securities (for example, GNMA pass-throughs). Interest rates disclosed represent current yields based upon the current cost basis and estimated timing and amount of future cash flows. These securities amount to $2,260,877 or 1.64% of the Fund’s net assets at period end.
5. Interest rate is less than 0.0005%.
6. Principal-Only Strips represent the right to receive the monthly principal payments on an underlying pool of mortgage loans. The value of these securities generally increases as interest rates decline and prepayment rates rise. The price of these securities is typically more volatile than that of coupon-bearing bonds of the same maturity. Interest rates disclosed represent current yields based upon the current cost basis and estimated timing of future cash flows. These securities amount to $126,767 or 0.09% of the Fund’s net assets at period end.
7. The current amortization rate of the security’s cost basis exceeds the future interest payments currently estimated to be received. Both the amortization rate and interest payments are contingent on future mortgage pre-payment speeds and are therefore subject to change.
8. All or a portion of the security position is when-issued or delayed delivery to be delivered and settled after period end. See Note 4 of the accompanying Notes.
9. This security is not accruing income because the issuer has missed an interest payment on it and/or is not anticipated to make future interest and or principal payments. The rate shown is the contractual interest rate. See Note 4 of the accompanying Notes.
10. This bond has no contractual maturity date, is not redeemable and contractually pays an indefinite stream of interest.
11. Rate shown is the 7-day yield at period end.
12. Is or was an affiliate, as defined in the Investment Company Act of 1940, as amended, at or during the reporting period, by virtue of the Fund owning at least 5% of the voting securities of the issuer or as a result of the Fund and the issuer having the same investment adviser. Transactions during the reporting period in which the issuer was an affiliate are as follows:
| | | | | | | | | | | | | | | | |
| | | Shares
December 31, 2014 | | | Gross
Additions | | | Gross
Reductions | | | Shares
December 31, 2015 | |
| |
| Oppenheimer Institutional Money Market Fund, Cl. E | | | 6,496,088 | | | | 69,074,504 | | | | 51,426,066 | | | | 24,144,526 | |
| | | | |
| | | | | | | | | Value | | | Income | |
| |
| Oppenheimer Institutional Money Market Fund, Cl. E | | | | | | | | | | $ | 24,144,526 | | | $ | 17,296 | |
15 OPPENHEIMER CORE BOND FUND/VA
| | |
| |
STATEMENT OF INVESTMENTS Continued | | |
| | | | | | | | | | | | | | | | | | | | | | | | |
| Futures Contracts as of December 31, 2015 | | | | | | | | | | | | | | | | | | |
| Description | | Exchange | | | Buy/Sell | | | Expiration Date | | | Number of Contracts | | | Value | | | Unrealized Appreciation (Depreciation) | |
| |
United States Treasury Long Bonds | | | CBT | | | | Sell | | | | 3/21/16 | | | | 31 | | | $ | 4,766,250 | | | $ | 16,326 | |
United States Treasury Nts., 10 yr. | | | CBT | | | | Sell | | | | 3/21/16 | | | | 1 | | | | 125,906 | | | | 1,077 | |
United States Treasury Nts., 2 yr. | | | CBT | | | | Buy | | | | 3/31/16 | | | | 1 | | | | 217,234 | | | | (17) | |
United States Treasury Nts., 5 yr. | | | CBT | | | | Buy | | | | 3/31/16 | | | | 20 | | | | 2,366,406 | | | | (8,029) | |
United States Ultra Bonds | | | CBT | | | | Buy | | | | 3/21/16 | | | | 67 | | | | 10,632,063 | | | | 35,306 | |
| | | | | | | | | | | | | | | | | | | | | | | | |
| | | | | | | | | | | | | | | | | | | | | | $ | 44,663 | |
| | | | | | | | | | | | | | | | | | | | | | | | |
Glossary:
Exchange Abbreviations
CBT Chicago Board of Trade
See accompanying Notes to Financial Statements.
16 OPPENHEIMER CORE BOND FUND/VA
| | |
| |
| STATEMENT OF ASSETS AND LIABILITIES December 31, 2015 | | |
| | | | |
Assets | | | | |
Investments, at value—see accompanying statement of investments: | | | | |
Unaffiliated companies (cost $152,261,561) | | $ | 148,090,772 | |
Affiliated companies (cost $24,144,526) | | | 24,144,526 | |
| | | | 172,235,298 | |
Cash | | | 500,236 | |
Cash used for collateral on futures | | | 220,000 | |
Receivables and other assets: | | | | |
Investments sold (including $1,628,595 sold on a when-issued or delayed delivery basis) | | | 1,982,756 | |
Interest, dividends and principal paydowns | | | 790,722 | |
Shares of beneficial interest sold | | | 463,882 | |
Variation margin receivable | | | 69,813 | |
Other | | | 32,748 | |
Total assets | | | 176,295,455 | |
Liabilities | | | | |
Payables and other liabilities: | | | | |
Investments purchased on a when-issued or delayed delivery basis | | | 38,429,029 | |
Shares of beneficial interest redeemed | | | 59,803 | |
Trustees’ compensation | | | 25,642 | |
Variation margin payable | | | 19,030 | |
Shareholder communications | | | 16,007 | |
Distribution and service plan fees | | | 11,153 | |
Other | | | 55,800 | |
Total liabilities | | | 38,616,464 | |
Net Assets | | $ | 137,678,991 | |
| | | | |
| | | | |
Composition of Net Assets | | | | |
Par value of shares of beneficial interest | | $ | 17,947 | |
Additional paid-in capital | | | 219,044,385 | |
Accumulated net investment income | | | 4,110,201 | |
Accumulated net realized loss on investments | | | (81,367,416) | |
Net unrealized depreciation on investments | | | (4,126,126) | |
Net Assets | | $ | 137,678,991 | |
| | | | |
| | | | |
Net Asset Value Per Share | | | | |
Non-Service Shares: | | | | |
| Net asset value, redemption price per share and offering price per share (based on net assets of $85,160,169 and 11,046,907 shares of beneficial interest outstanding) | | | $7.71 | |
Service Shares: | | | | |
| Net asset value, redemption price per share and offering price per share (based on net assets of $52,518,822 and 6,900,582 shares of beneficial interest outstanding) | | | $7.61 | |
See accompanying Notes to Financial Statements.
17 OPPENHEIMER CORE BOND FUND/VA
| | |
| |
| STATEMENT OF OPERATIONS For the Year Ended December 31, 2015 | | |
| | | | |
Investment Income | | | | |
Interest - unaffiliated companies (net of foreign withholding taxes of $1,696) | | $ | 5,108,162 | |
Fee income on when-issued securities | | | 938,508 | |
Dividends -affiliated companies | | | 17,296 | |
Total investment income | | | 6,063,966 | |
Expenses | | | | |
Management fees | | | 863,572 | |
Distribution and service plan fees: | | | | |
Service shares | | | 135,062 | |
Transfer and shareholder servicing agent fees: | | | | |
Non-Service shares | | | 89,915 | |
Service shares | | | 54,014 | |
Shareholder communications: | | | | |
Non-Service shares | | | 23,996 | |
Service shares | | | 14,387 | |
Legal, auditing and other professional fees | | | 61,091 | |
Custodian fees and expenses | | | 47,871 | |
Trustees’ compensation | | | 16,740 | |
Borrowing fees | | | 1,034 | |
Other | | | 8,835 | |
Total expenses | | | 1,316,517 | |
Less reduction to custodian expenses | | | (208) | |
Less waivers and reimbursements of expenses | | | (100,708) | |
Net expenses | | | 1,215,601 | |
Net Investment Income | | | 4,848,365 | |
Realized and Unrealized Gain (Loss) | | | | |
Net realized gain (loss) on: | | | | |
Investments from unaffiliated companies | | | 202,188 | |
Closing and expiration of futures contracts | | | (547,969) | |
Net realized loss | | | (345,781) | |
Net change in unrealized appreciation/depreciation on: | | | | |
Investments | | | (2,906,685) | |
Futures contracts | | | (314,212) | |
Net change in unrealized appreciation/depreciation | | | (3,220,897) | |
Net Increase in Net Assets Resulting from Operations | | $ | 1,281,687 | |
| | | | |
See accompanying Notes to Financial Statements.
18 OPPENHEIMER CORE BOND FUND/VA
| | |
| |
STATEMENTS OF CHANGES IN NET ASSETS | | |
| | | | | | | | |
| | | Year Ended December 31, 2015 | | | Year Ended December 31, 2014 | |
| |
Operations | | | | | | | | |
Net investment income | | $ | 4,848,365 | | | $ | 5,421,470 | |
| |
Net realized gain (loss) | | | (345,781) | | | | 3,158,701 | |
| |
Net change in unrealized appreciation/depreciation | | | (3,220,897) | | | | 1,727,274 | |
| | | | | | | | |
Net increase in net assets resulting from operations | | | 1,281,687 | | | | 10,307,445 | |
| |
Dividends and/or Distributions to Shareholders | | | | | | | | |
Dividends from net investment income: | | | | | | | | |
Non-Service shares | | | (3,667,301) | | | | (4,942,642) | |
Service shares | | | (2,079,404) | | | | (2,786,126) | |
| | | | |
| | | (5,746,705) | | | | (7,728,768) | |
| |
Beneficial Interest Transactions | | | | | | | | |
Net increase (decrease) in net assets resulting from beneficial interest transactions: | | | | | | | | |
Non-Service shares | | | (2,833,378) | | | | (7,710,673) | |
Service shares | | | 1,545,644 | | | | (3,167,239) | |
| | | | | | | | |
| | | (1,287,734) | | | | (10,877,912) | |
| |
Net Assets | | | | | | | | |
Total decrease | | | (5,752,752) | | | | (8,299,235) | |
| |
Beginning of period | | | 143,431,743 | | | | 151,730,978 | |
| | | | | | | | |
| End of period (including accumulated net investment income of $4,110,201 and $4,847,120, respectively) | | $ | 137,678,991 | | | $ | 143,431,743 | |
| | | | |
See accompanying Notes to Financial Statements.
19 OPPENHEIMER CORE BOND FUND/VA
| | | | | | | | | | | | | | | | | | | | |
Non-Service Shares | | Year Ended December 31, 2015 | | | Year Ended December 31, 2014 | | | Year Ended December 31, 2013 | | | Year Ended December 31, 2012 | | | Year Ended December 30, 20111 | |
| |
| Per Share Operating Data | | | | | | | | | | | | | | | | | | | | |
| Net asset value, beginning of period | | $ | 7.96 | | | $ | 7.83 | | | $ | 8.26 | | | $ | 7.88 | | | $ | 7.73 | |
| |
| Income (loss) from investment operations: | | | | | | | | | | | | | | | | | | | | |
| Net investment income2 | | | 0.27 | | | | 0.30 | | | | 0.36 | | | | 0.35 | | | | 0.36 | |
| Net realized and unrealized gain (loss) | | | (0.19) | | | | 0.26 | | | | (0.37) | | | | 0.44 | | | | 0.25 | |
| | | | |
| Total from investment operations | | | 0.08 | | | | 0.56 | | | | (0.01) | | | | 0.79 | | | | 0.61 | |
| |
| Dividends and/or distributions to shareholders: | | | | | | | | | | | | | | | | | | | | |
| Dividends from net investment income | | | (0.33) | | | | (0.43) | | | | (0.42) | | | | (0.41) | | | | (0.46) | |
| |
| Net asset value, end of period | | $ | 7.71 | | | $ | 7.96 | | | $ | 7.83 | | | $ | 8.26 | | | $ | 7.88 | |
| | | | |
| | | | | | | | | | | | | | | | | | | | |
| |
| Total Return, at Net Asset Value3 | | | 0.96% | | | | 7.27% | | | | (0.10)% | | | | 10.29% | | | | 8.27% | |
| | | | | | | | | | | | | | | | | | | | |
| |
| Ratios/Supplemental Data | | | | | | | | | | | | | | | | | | | | |
| Net assets, end of period (in thousands) | | $ | 85,160 | | | $ | 90,757 | | | $ | 96,785 | | | $ | 116,989 | | | $ | 122,271 | |
| |
| Average net assets (in thousands) | | $ | 89,919 | | | $ | 94,336 | | | $ | 105,012 | | | $ | 119,547 | | | $ | 127,341 | |
| |
| Ratios to average net assets:4 | | | | | | | | | | | | | | | | | | | | |
| Net investment income | | | 3.46% | | | | 3.72% | | | | 4.51% | | | | 4.34% | | | | 4.71% | |
| Expenses excluding interest and fees from borrowings | | | 0.82% | | | | 0.80% | | | | 0.80% | | | | 0.77% | | | | 0.77% | |
| Interest and fees from borrowings | | | 0.00%5 | | | | 0.00% | | | | 0.00% | | | | 0.00% | | | | 0.00% | |
| | | | |
| Total expenses6 | | | 0.82% | | | | 0.80% | | | | 0.80% | | | | 0.77% | | | | 0.77% | |
| Expenses after payments, waivers and/or reimbursements and reduction to custodian expenses | | | 0.75% | | | | 0.75% | | | | 0.75% | | | | 0.75% | | | | 0.75% | |
| |
| Portfolio turnover rate7 | | | 73% | | | | 127% | | | | 115% | | | | 140% | | | | 99% | |
1. December 30, 2011 represents the last business day of the Fund’s reporting period. See Note 2 of the accompanying Notes.
2. Per share amounts calculated based on the average shares outstanding during the period.
3. Assumes an initial investment on the business day before the first day of the fiscal period, with all dividends and distributions reinvested in additional shares on the reinvestment date, and redemption at the net asset value calculated on the last business day of the fiscal period. Total returns are not annualized for periods less than one full year. Total return information does not reflect expenses that apply at the separate account level or to related insurance products. Inclusion of these charges would reduce the total return figures for all periods shown. Returns do not reflect the deduction of taxes that a shareholder would pay on fund distributions or the redemption of fund shares.
4. Annualized for periods less than one full year.
5. Less than 0.005%.
6. Total expenses including indirect expenses from affiliated fund fees and expenses were as follows:
| | | | | | | | |
| | Year Ended December 31, 2015 | | 0.83% | | | | |
| | Year Ended December 31, 2014 | | 0.81% | | | | |
| | Year Ended December 31, 2013 | | 0.81% | | | | |
| | Year Ended December 31, 2012 | | 0.79% | | | | |
| | Year Ended December 30, 2011 | | 0.79% | | | | |
7. The portfolio turnover rate excludes purchase and sale transactions of To Be Announced (TBA) mortgage-related securities as follows:
| | | | | | | | |
| | | Purchase Transactions | | | Sale Transactions | |
Year Ended December 31, 2015 | | | $697,962,198 | | | | $709,720,690 | |
Year Ended December 31, 2014 | | | $560,409,975 | | | | $543,669,748 | |
Year Ended December 31, 2013 | | | $776,927,298 | | | | $806,883,121 | |
Year Ended December 31, 2012 | | | $930,202,858 | | | | $942,406,652 | |
Year Ended December 30, 2011 | | | $911,850,847 | | | | $909,531,196 | |
See accompanying Notes to Financial Statements.
20 OPPENHEIMER CORE BOND FUND/VA
| | | | | | | | | | | | | | | | | | | | |
| Service Shares | | Year Ended
December
31, 2015 | | | Year Ended
December
31, 2014 | | | Year Ended
December
31, 2013 | | | Year Ended
December
31, 2012 | | | Year Ended
December
30, 20111 | |
| |
Per Share Operating Data | | | | | | | | | | | | | | | | | | | | |
Net asset value, beginning of period | | $ | 7.86 | | | $ | 7.74 | | | $ | 8.17 | | | $ | 7.79 | | | | $7.65 | |
| |
Income (loss) from investment operations: | | | | | | | | | | | | | | | | | | | | |
Net investment income2 | | | 0.25 | | | | 0.27 | | | | 0.34 | | | | 0.33 | | | | 0.34 | |
Net realized and unrealized gain (loss) | | | (0.19) | | | | 0.26 | | | | (0.37) | | | | 0.44 | | | | 0.24 | |
| | | | |
Total from investment operations | | | 0.06 | | | | 0.53 | | | | (0.03) | | | | 0.77 | | | | 0.58 | |
| |
Dividends and/or distributions to shareholders: | | | | | | | | | | | | | | | | | | | | |
Dividends from net investment income | | | (0.31) | | | | (0 .41) | | | | (0.40) | | | | (0.39) | | | | (0.44) | |
| |
Net asset value, end of period | | $ | 7.61 | | | $ | 7.86 | | | $ | 7.74 | | | $ | 8.17 | | | | $7.79 | |
| | | | |
| | | | | | | | | | | | | | | | | | | | |
| |
Total Return, at Net Asset Value3 | | | 0.70% | | | | 6.93% | | | | (0.38)% | | | | 10.17% | | | | 7.93% | |
| | | | | | | | | | | | | | | | | | | | |
| |
Ratios/Supplemental Data | | | | | | | | | | | | | | | | | | | | |
Net assets, end of period (in thousands) | | $ | 52,519 | | | $ | 52,675 | | | $ | 54,946 | | | $ | 64,694 | | | | $62,294 | |
| |
Average net assets (in thousands) | | $ | 54,016 | | | $ | 55,215 | | | $ | 59,523 | | | $ | 67,116 | | | | $58,629 | |
| |
Ratios to average net assets:4 | | | | | | | | | | | | | | | | | | | | |
Net investment income | | | 3.21% | | | | 3.47% | | | | 4.26% | | | | 4.07% | | | | 4.42% | |
Expenses excluding interest and fees from borrowings | | | 1.07% | | | | 1.04% | | | | 1.05% | | | | 1.02% | | | | 1.02% | |
Interest and fees from borrowings | | | 0.00%5 | | | | 0.00% | | | | 0.00% | | | | 0.00% | | | | 0.00% | |
| | | | |
Total expenses6 | | | 1.07% | | | | 1.04% | | | | 1.05% | | | | 1.02% | | | | 1.02% | |
| Expenses after payments, waivers and/or reimbursements and reduction to custodian expenses | | | 1.00% | | | | 1.00% | | | | 1.00% | | | | 1.00% | | | | 1.00% | |
| |
Portfolio turnover rate7 | | | 73% | | | | 127% | | | | 115% | | | | 140% | | | | 99% | |
1. December 30, 2011 represents the last business day of the Fund’s reporting period. See Note 2 of the accompanying Notes.
2. Per share amounts calculated based on the average shares outstanding during the period.
3. Assumes an initial investment on the business day before the first day of the fiscal period, with all dividends and distributions reinvested in additional shares on the reinvestment date, and redemption at the net asset value calculated on the last business day of the fiscal period. Total returns are not annualized for periods less than one full year. Total return information does not reflect expenses that apply at the separate account level or to related insurance products. Inclusion of these charges would reduce the total return figures for all periods shown. Returns do not reflect the deduction of taxes that a shareholder would pay on fund distributions or the redemption of fund shares.
4. Annualized for periods less than one full year.
5. Less than 0.005%.
6. Total expenses including indirect expenses from affiliated fund fees and expenses were as follows:
| | | | | | | | |
| | Year Ended December 31, 2015 | | | 1 .08 | % | | |
| | Year Ended December 31, 2014 | | | 1 .05 | % | | |
| | Year Ended December 31, 2013 | | | 1 .06 | % | | |
| | Year Ended December 31, 2012 | | | 1 .04 | % | | |
| | Year Ended December 30, 2011 | | | 1 .04 | % | | |
7. The portfolio turnover rate excludes purchase and sale transactions of To Be Announced (TBA) mortgage-related securities as follows:
| | | | | | | | |
| | | Purchase Transactions | | | Sale Transactions | |
| |
Year Ended December 31, 2015 | | | $697,962,198 | | | | $709,720,690 | |
Year Ended December 31, 2014 | | | $560,409,975 | | | | $543,669,748 | |
Year Ended December 31, 2013 | | | $776,927,298 | | | | $806,883,121 | |
Year Ended December 31, 2012 | | | $930,202,858 | | | | $942,406,652 | |
Year Ended December 30, 2011 | | | $911,850,847 | | | | $909,531,196 | |
See accompanying Notes to Financial Statements.
21 OPPENHEIMER CORE BOND FUND/VA
NOTES TO FINANCIAL STATEMENTS December 31, 2015
1. Organization
Oppenheimer Core Bond Fund/VA (the “Fund”), a separate series of Oppenheimer Variable Account Funds, is a diversified open-end management investment company registered under the Investment Company Act of 1940 (“1940 Act”), as amended. The Fund’s main investment objective is to seek total return. The Fund’s investment adviser is OFI Global Asset Management, Inc. (“OFI Global” or the “Manager”), a wholly-owned subsidiary of OppenheimerFunds, Inc. (“OFI” or the “Sub-Adviser”). The Manager has entered into a sub-advisory agreement with OFI. Shares of the Fund are sold only to separate accounts of life insurance companies.
The Fund offers two classes of shares. Both classes are sold at their offering price, which is the net asset value per share, to separate investment accounts of participating insurance companies as an underlying investment for variable life insurance policies, variable annuity contracts or other investment products. The class of shares designated as Service shares is subject to a distribution and service plan. Both classes of shares have identical rights and voting privileges with respect to the Fund in general and exclusive voting rights on matters that affect that class alone. Earnings, net assets and net asset value per share may differ due to each class having its own expenses, such as transfer and shareholder servicing agent fees and shareholder communications, directly attributable to that class.
The following is a summary of significant accounting policies followed in the Fund’s preparation of financial statements in accordance with accounting principles generally accepted in the United States (“U.S. GAAP”).
2. Significant Accounting Policies
Security Valuation. All investments in securities are recorded at their estimated fair value, as described in Note 3.
Reporting Period End Date. The last day of the Fund’s reporting period is the last day the New York Stock Exchange was open for trading during the period. The Fund’s financial statements have been presented through that date to maintain consistency with the Fund’s net asset value calculations used for shareholder transactions.
Allocation of Income, Expenses, Gains and Losses. Income, expenses (other than those attributable to a specific class), gains and losses are allocated on a daily basis to each class of shares based upon the relative proportion of net assets represented by such class. Operating expenses directly attributable to a specific class are charged against the operations of that class.
Dividends and Distributions to Shareholders. Dividends and distributions to shareholders, which are determined in accordance with income tax regulations and may differ from U.S. GAAP, are recorded on the ex-dividend date. Income and capital gain distributions, if any, are declared and paid annually or at other times as deemed necessary by the Manager.
Investment Income. Dividend income is recorded on the ex-dividend date or upon ex-dividend notification in the case of certain foreign dividends where the ex-dividend date may have passed. Non-cash dividends included in dividend income, if any, are recorded at the fair market value of the securities received. Interest income is recognized on an accrual basis. Discount and premium, which are included in interest income on the Statement of Operations, are amortized or accreted daily.
Custodian Fees. “Custodian fees and expenses” in the Statement of Operations may include interest expense incurred by the Fund on any cash overdrafts of its custodian account during the period. Such cash overdrafts may result from the effects of failed trades in portfolio securities and from cash outflows resulting from unanticipated shareholder redemption activity. The Fund pays interest to its custodian on such cash overdrafts, to the extent they are not offset by positive cash balances maintained by the Fund, at a rate equal to the Federal Funds Rate plus 0.50%. The “Reduction to custodian expenses” line item, if applicable, represents earnings on cash balances maintained by the Fund during the period. Such interest expense and other custodian fees may be paid with these earnings.
Security Transactions. Security transactions are recorded on the trade date. Realized gains and losses on securities sold are determined on the basis of identified cost.
Indemnifications. The Fund’s organizational documents provide current and former Trustees and officers with a limited indemnification against liabilities arising in connection with the performance of their duties to the Fund. In the normal course of business, the Fund may also enter into contracts that provide general indemnifications. The Fund’s maximum exposure under these arrangements is unknown as this would be dependent on future claims that may be made against the Fund. The risk of material loss from such claims is considered remote.
Federal Taxes. The Fund intends to comply with provisions of the Internal Revenue Code applicable to regulated investment companies and to distribute substantially all of its investment company taxable income, including any net realized gain on investments not offset by capital loss carryforwards, if any, to shareholders. Therefore, no federal income or excise tax provision is required. The Fund files income tax returns in U.S. federal and applicable state jurisdictions. The statute of limitations on the Fund’s tax return filings generally remains open for the three preceding fiscal reporting period ends.
The tax components of capital shown in the following table represent distribution requirements the Fund must satisfy under the income tax regulations, losses the Fund may be able to offset against income and gains realized in future years and unrealized appreciation or depreciation of securities and other investments for federal income tax purposes.
22 OPPENHEIMER CORE BOND FUND/VA
2. Significant Accounting Policies (Continued)
| | | | | | | | | | | | |
Undistributed Net Investment Income | | Undistributed
Long-Term
Gain | | | Accumulated
Loss
Carryforward1,2,3 | | | Net Unrealized
Depreciation
Based on cost of
Securities and
Other Investments
for Federal Income
Tax Purposes | |
| |
$5,090,138 | | | $— | | | | $81,314,664 | | | | $4,192,019 | |
1. At period end, the Fund had $81,314,664 of net capital loss carryforward available to offset future realized capital gains, if any, and thereby reduce future taxable gain distributions. Details of the capital loss carryforwards are included in the table below. Capital loss carryovers with no expiration, if any, must be utilized prior to those with expiration dates.
| | | | |
| Expiring | |
| |
2016 | | $ | 5,303,131 | |
2017 | | | 75,069,850 | |
No expiration | | | 941,683 | |
| | | | |
Total | | $ | 81,314,664 | |
| | | | |
2. During the reporting period, the Fund did not utilize any capital loss carryforward.
3. During the previous reporting period, the Fund utilized $3,055,475 of capital loss carryforward to offset capital gains realized in that fiscal year.
Net investment income (loss) and net realized gain (loss) may differ for financial statement and tax purposes. The character of dividends and distributions made during the fiscal year from net investment income or net realized gains are determined in accordance with federal income tax requirements, which may differ from the character of net investment income or net realized gains presented in those financial statements in accordance with U.S. GAAP. Also, due to timing of dividends and distributions, the fiscal year in which amounts are distributed may differ from the fiscal year in which the income or net realized gain was recorded by the Fund.
Accordingly, the following amounts have been reclassified for the reporting period. Net assets of the Fund were unaffected by the reclassifications.
| | | | |
Increase to Accumulated Net Investment Income | | Increase to Accumulated Net
Realized Loss
on Investments | |
| |
$161,421 | | | $161,421 | |
The tax character of distributions paid during the reporting periods:
| | | | | | | | |
| | | Year Ended
December 31, 2015 | | | Year Ended
December 31, 2014 | |
| |
Distributions paid from: | | | | | | | | |
Ordinary income | | $ | 5,746,705 | | | $ | 7,728,768 | |
The aggregate cost of securities and other investments and the composition of unrealized appreciation and depreciation of securities and other investments for federal income tax purposes at period end are noted in the following table. The primary difference between book and tax appreciation or depreciation of securities and other investments, if applicable, is attributable to the tax deferral of losses or tax realization of financial statement unrealized gain or loss.
| | | | |
Federal tax cost of securities | | $ | 176,427,317 | |
Federal tax cost of other investments | | | 8,323,547 | |
| | | | |
Total federal tax cost | | $ | 184,750,864 | |
| | | | |
Gross unrealized appreciation | | | $2,247,261 | |
Gross unrealized depreciation | | | (6,439,280) | |
| | | | |
Net unrealized depreciation | | $ | (4,192,019) | |
| | | | |
Use of Estimates. The preparation of financial statements in conformity with U.S. GAAP requires management to make estimates and assumptions that affect the reported amounts of assets and liabilities and disclosure of contingent assets and liabilities at the date of the financial statements and the reported amounts of increases and decreases in net assets from operations during the reporting period. Actual results could differ from those estimates.
3. Securities Valuation
The Fund calculates the net asset value of its shares as of the close of the New York Stock Exchange (the “Exchange”), normally 4:00 P.M. Eastern time, on each day the Exchange is open for trading, except in the case of a scheduled early closing of the Exchange, in which case the Fund will calculate net asset value of the shares as of the scheduled early closing time of the Exchange.
The Fund’s Board has adopted procedures for the valuation of the Fund’s securities and has delegated the day-to-day responsibility for valuation determinations under those procedures to the Manager. The Manager has established a Valuation Committee which is responsible for determining a “fair valuation” for any security for which market quotations are not “readily available.” The Valuation Committee’s fair valuation determinations are
23 OPPENHEIMER CORE BOND FUND/VA
| | |
NOTES TO FINANCIAL STATEMENTS Continued |
| 3. Securities Valuation (Continued) | | |
subject to review, approval and ratification by the Fund’s Board at its next regularly scheduled meeting covering the calendar quarter in which the fair valuation was determined.
Valuation Methods and Inputs
Securities are valued using unadjusted quoted market prices, when available, as supplied primarily by third party pricing services or dealers.
The following methodologies are used to determine the market value or the fair value of the types of securities described below:
Securities traded on a registered U.S. securities exchange (including exchange-traded derivatives other than futures and futures options) are valued based on the last sale price of the security reported on the principal exchange on which it is traded, prior to the time when the Fund’s assets are valued. In the absence of a sale, the security is valued at the mean between the bid and asked price on the principal exchange or, if not available from the principal exchange, obtained from two dealers. If bid and asked prices are not available from either the exchange or two dealers, the security is valued by using one of the following methodologies (listed in order of priority): (1) a bid from the principal exchange, (2) the mean between the bid and asked price as provided by a single dealer, or (3) a bid from a single dealer. A security of a foreign issuer traded on a foreign exchange, but not listed on a registered U.S. securities exchange, is valued based on the last sale price on the principal exchange on which the security is traded, as identified by the third party pricing service used by the Manager, prior to the time when the Fund’s assets are valued. If the last sale price is unavailable, the security is valued at the most recent official closing price on the principal exchange on which it is traded. If the last sales price or official closing price for a foreign security is not available, the security is valued at the mean between the bid and asked price per the exchange or, if not available from the exchange, obtained from two dealers. If bid and asked prices are not available from either the exchange or two dealers, the security is valued by using one of the following methodologies (listed in order of priority): (1) a bid from the exchange, (2) the mean between the bid and asked price as provided by a single dealer, or (3) a bid from a single dealer.
Shares of a registered investment company that are not traded on an exchange are valued at that investment company’s net asset value per share. Corporate and government debt securities (of U.S. or foreign issuers) and municipal debt securities, event-linked bonds, loans, mortgage-backed securities, collateralized mortgage obligations, and asset-backed securities are valued at the mean between the “bid” and “asked” prices utilizing evaluated prices obtained from third party pricing services or broker-dealers who may use matrix pricing methods to determine the evaluated prices.
Short-term money market type debt securities with a remaining maturity of sixty days or less are valued at cost adjusted by the amortization of discount or premium to maturity (amortized cost), which approximates market value. Short-term debt securities with a remaining maturity in excess of sixty days are valued at the mean between the “bid” and “asked” prices utilizing evaluated prices obtained from third party pricing services or broker-dealers.
Futures contracts and futures options traded on a commodities or futures exchange will be valued at the final settlement price or official closing price on the principal exchange as reported by such principal exchange at its trading session ending at, or most recently prior to, the time when the Fund’s assets are valued.
A description of the standard inputs that may generally be considered by the third party pricing vendors in determining their evaluated prices is provided below.
| | |
| Security Type | | Standard inputs generally considered by third-party pricing vendors |
| Corporate debt, government debt, municipal, mortgage-backed and asset-backed securities | | Reported trade data, broker-dealer price quotations, benchmark yields, issuer spreads on comparable securities, the credit quality, yield, maturity, and other appropriate factors. |
| Loans | | Information obtained from market participants regarding reported trade data and broker-dealer price quotations. |
| Event-linked bonds | | Information obtained from market participants regarding reported trade data and broker-dealer price quotations. |
If a market value or price cannot be determined for a security using the methodologies described above, or if, in the “good faith” opinion of the Manager, the market value or price obtained does not constitute a “readily available market quotation,” or a significant event has occurred that would materially affect the value of the security, the security is fair valued either (i) by a standardized fair valuation methodology applicable to the security type or the significant event as previously approved by the Valuation Committee and the Fund’s Board or (ii) as determined in good faith by the Manager’s Valuation Committee. The Valuation Committee considers all relevant facts that are reasonably available, through either public information or information available to the Manager, when determining the fair value of a security. Fair value determinations by the Manager are subject to review, approval and ratification by the Fund’s Board at its next regularly scheduled meeting covering the calendar quarter in which the fair valuation was determined. Those fair valuation standardized methodologies include, but are not limited to, valuing securities at the last sale price or initially at cost and subsequently adjusting the value based on: changes in company specific fundamentals, changes in an appropriate securities index, or changes in the value of similar securities which may be further adjusted for any discounts related to security-specific resale restrictions. When possible, such methodologies use observable market inputs such as unadjusted quoted prices of similar securities, observable interest rates, currency rates and yield curves. The methodologies used for valuing securities are not necessarily an indication of the risks associated with investing in those securities nor can it be assured that the Fund can obtain the fair value assigned to a security if it were to sell the security.
To assess the continuing appropriateness of security valuations, the Manager, or its third party service provider who is subject to oversight by the Manager, regularly compares prior day prices, prices on comparable securities, and sale prices to the current day prices and challenges those prices exceeding certain tolerance levels with the third party pricing service or broker source. For those securities valued by fair valuations, whether through a standardized fair valuation methodology or a fair valuation determination, the Valuation Committee reviews and affirms the reasonableness of the
24 OPPENHEIMER CORE BOND FUND/VA
3. Securities Valuation (Continued)
valuations based on such methodologies and fair valuation determinations on a regular basis after considering all relevant information that is reasonably available.
Classifications
Each investment asset or liability of the Fund is assigned a level at measurement date based on the significance and source of the inputs to its valuation. Various data inputs are used in determining the value of each of the Fund’s investments as of the reporting period end. These data inputs are categorized in the following hierarchy under applicable financial accounting standards:
1) Level 1-unadjusted quoted prices in active markets for identical assets or liabilities (including securities actively traded on a securities exchange)
2) Level 2-inputs other than unadjusted quoted prices that are observable for the asset or liability (such as unadjusted quoted prices for similar assets and market corroborated inputs such as interest rates, prepayment speeds, credit risks, etc.)
3) Level 3-significant unobservable inputs (including the Manager’s own judgments about assumptions that market participants would use in pricing the asset or liability).
The inputs used for valuing securities are not necessarily an indication of the risks associated with investing in those securities.
The table below categorizes amounts that are included in the Fund’s Statement of Assets and Liabilities at period end based on valuation input level:
| | | | | | | | | | | | | | | | |
| | | Level 1—
Unadjusted Quoted Prices | | | Level 2— Other Significant Observable Inputs | | | Level 3—
Significant
Unobservable
Inputs | | | Value | |
Assets Table | | | | | | | | | | | | | | | | |
Investments, at Value: | | | | | | | | | | | | | | | | |
Asset-Backed Securities | | $ | — | | | $ | 21,586,137 | | | $ | — | | | $ | 21,586,137 | |
Mortgage-Backed Obligations | | | — | | | | 62,412,334 | | | | 937,013 | | | | 63,349,347 | |
U.S. Government Obligations | | | — | | | | 1,698,251 | | | | — | | | | 1,698,251 | |
Corporate Bonds and Notes | | | — | | | | 61,457,037 | | | | — | | | | 61,457,037 | |
Investment Company | | | 24,144,526 | | | | — | | | | — | | | | 24,144,526 | |
Total Investments, at Value | | | 24,144,526 | | | | 147,153,759 | | | | 937,013 | | | | 172,235,298 | |
| | | | |
Other Financial Instruments: | | | | | | | | | | | | | | | | |
Futures contracts | | | 52,709 | | | | — | | | | — | | | | 52,709 | |
| | | | |
Total Assets | | $ | 24,197,235 | | | $ | 147,153,759 | | | $ | 937,013 | | | $ | 172,288,007 | |
| | | | |
| | | | |
Liabilities Table | | | | | | | | | | | | | | | | |
Other Financial Instruments: | | | | | | | | | | | | | | | | |
Futures contracts | | $ | (8,046) | | | $ | — | | | $ | — | | | $ | (8,046) | |
| | | | |
Total Liabilities | | $ | (8,046) | | | $ | — | | | $ | — | | | $ | (8,046) | |
| | | | |
Forward currency exchange contracts and futures contracts, if any, are reported at their unrealized appreciation/depreciation at measurement date, which represents the change in the contract’s value from trade date. All additional assets and liabilities included in the above table are reported at their market value at measurement date.
4. Investments and Risks
Investments in Affiliated Funds. The Fund is permitted to invest in other mutual funds advised by the Manager (“Affiliated Funds”). Affiliated Funds are open-end management investment companies registered under the 1940 Act, as amended. The Manager is the investment adviser of, and the Sub-Adviser provides investment and related advisory services to, the Affiliated Funds. When applicable, the Fund’s investments in Affiliated Funds are included in the Statement of Investments. Shares of Affiliated Funds are valued at their net asset value per share. As a shareholder, the Fund is subject to its proportional share of the Affiliated Funds’ expenses, including their management fee. The Manager will waive fees and/or reimburse Fund expenses in an amount equal to the indirect management fees incurred through the Fund’s investment in the Affiliated Funds.
Each of the Affiliated Funds in which the Fund invests has its own investment risks, and those risks can affect the value of the Fund’s investments and therefore the value of the Fund’s shares. To the extent that the Fund invests more of its assets in one Affiliated Fund than in another, the Fund will have greater exposure to the risks of that Affiliated Fund.
Investment in Oppenheimer Institutional Money Market Fund. The Fund is permitted to invest daily available cash balances in a money market Affiliated Fund. The Fund may invest the available cash in Class E shares of Oppenheimer Institutional Money Market Fund (“IMMF”) to seek current income while preserving liquidity or for defensive purposes. IMMF is regulated as a money market fund under the Investment Company Act of 1940, as amended.
Securities on a When-Issued or Delayed Delivery Basis. The Fund may purchase securities on a “when-issued” basis, and may purchase or sell securities on a “delayed delivery” basis. “When-issued” or “delayed delivery” refers to securities whose terms and indenture are available and for which a market exists, but which are not available for immediate delivery. Delivery and payment for securities that have been purchased by the Fund on a when-issued basis normally takes place within six months and possibly as long as two years or more after the trade date. During this period, such securities do not earn interest, are subject to market fluctuation and may increase or decrease in value prior to their delivery. The purchase of securities on a when-issued basis may increase the volatility of the Fund’s net asset value to the extent the Fund executes such transactions while remaining
25 OPPENHEIMER CORE BOND FUND/VA
| | |
| NOTES TO FINANCIAL STATEMENTS Continued | | |
| | |
4. Investments and Risks (Continued)
substantially fully invested. When the Fund engages in when-issued or delayed delivery transactions, it relies on the buyer or seller, as the case may be, to complete the transaction. Their failure to do so may cause the Fund to lose the opportunity to obtain or dispose of the security at a price and yield it considers advantageous. The Fund may also sell securities that it purchased on a when-issued basis or forward commitment prior to settlement of the original purchase.
At period end, the Fund had purchased securities issued on a when-issued or delayed delivery basis and sold securities issued on a delayed delivery basis as follows:
| | | | |
| | | When-Issued or
Delayed Delivery
Basis Transactions | |
| |
Purchased securities | | | $38,429,029 | |
Sold securities | | | 1,628,595 | |
The Fund may enter into “forward roll” transactions with respect to mortgage-related securities. In this type of transaction, the Fund sells a mortgage-related security to a buyer and simultaneously agrees to repurchase a similar security (same type, coupon and maturity) at a later date at a set price. During the period between the sale and the repurchase, the Fund will not be entitled to receive interest and principal payments on the securities that have been sold. The Fund records the incremental difference between the forward purchase and sale of each forward roll as realized gain (loss) on investments or as fee income in the case of such transactions that have an associated fee in lieu of a difference in the forward purchase and sale price.
Forward roll transactions may be deemed to entail embedded leverage since the Fund purchases mortgage-related securities with extended settlement dates rather than paying for the securities under a normal settlement cycle. This embedded leverage increases the Fund’s market value of investments relative to its net assets which can incrementally increase the volatility of the Fund’s performance. Forward roll transactions can be replicated over multiple settlement periods.
Risks of entering into forward roll transactions include the potential inability of the counterparty to meet the terms of the agreement; the potential of the Fund to receive inferior securities at redelivery as compared to the securities sold to the counterparty; and counterparty credit risk.
Restricted Securities. At period end, investments in securities included issues that are restricted. A restricted security may have a contractual restriction on its resale and is valued under methods approved by the Board of Trustees as reflecting fair value. Securities that are restricted are marked with an applicable footnote on the Statement of Investments. Restricted securities are reported on a schedule following the Statement of Investments.
Credit Risk. The Fund invests in high-yield, non-investment-grade bonds, which may be subject to a greater degree of credit risk. Credit risk relates to the ability of the issuer to meet interest or principal payments or both as they become due. The Fund may acquire securities that have missed an interest payment, and is not obligated to dispose of securities whose issuers or underlying obligors subsequently miss an interest payment.
Information concerning securities not accruing interest at period end is as follows:
| | | | | | |
| | Cost | | | $3,281,116 | |
| | Market Value | | | $842,504 | |
| | Market Value as % of Net Assets | | | 0.61% | |
5. Market Risk Factors
The Fund’s investments in securities and/or financial derivatives may expose the fund to various market risk factors:
Commodity Risk. Commodity risk relates to the change in value of commodities or commodity indexes as they relate to increases or decreases in the commodities market. Commodities are physical assets that have tangible properties. Examples of these types of assets are crude oil, heating oil, metals, livestock, and agricultural products.
Credit Risk. Credit risk relates to the ability of the issuer of debt to meet interest and principal payments, or both, as they come due. In general, lower-grade, higher-yield debt securities are subject to credit risk to a greater extent than lower-yield, higher-quality securities.
Equity Risk. Equity risk relates to the change in value of equity securities as they relate to increases or decreases in the general market.
Foreign Exchange Rate Risk. Foreign exchange rate risk relates to the change in the U.S. dollar value of a security held that is denominated in a foreign currency. The U.S. dollar value of a foreign currency denominated security will decrease as the dollar appreciates against the currency, while the U.S. dollar value will increase as the dollar depreciates against the currency.
Interest Rate Risk. Interest rate risk refers to the fluctuations in value of fixed-income securities resulting from the inverse relationship between price and yield. For example, an increase in general interest rates will tend to reduce the market value of already issued fixed-income investments, and a decline in general interest rates will tend to increase their value. In addition, debt securities with longer maturities, which tend to have higher yields, are subject to potentially greater fluctuations in value from changes in interest rates than obligations with shorter maturities.
Volatility Risk. Volatility risk refers to the magnitude of the movement, but not the direction of the movement, in a financial instrument’s price over a defined time period. Large increases or decreases in a financial instrument’s price over a relative time period typically indicate greater volatility risk, while small increases or decreases in its price typically indicate lower volatility risk.
26 OPPENHEIMER CORE BOND FUND/VA
6. Use of Derivatives
The Fund’s investment objective not only permits the Fund to purchase investment securities, it also allows the Fund to enter into various types of derivatives contracts, including, but not limited to, futures contracts, forward currency exchange contracts, credit default swaps, interest rate swaps, total return swaps, variance swaps and purchased and written options. In doing so, the Fund will employ strategies in differing combinations to permit it to increase, decrease, or change the level or types of exposure to market risk factors. These instruments may allow the Fund to pursue its objectives more quickly and efficiently than if it were to make direct purchases or sales of securities capable of effecting a similar response to market factors. Such contracts may be entered into through a bilateral over-the-counter (“OTC”) transaction, or through a securities or futures exchange and cleared through a clearinghouse.
Derivatives may have little or no initial cash investment relative to their market value exposure and therefore can produce significant gains or losses in excess of their cost due to unanticipated changes in the market risk factors and the overall market. This use of embedded leverage allows the Fund to increase its market value exposure relative to its net assets and can substantially increase the volatility of the Fund’s performance. In instances where the Fund is using derivatives to decrease, or hedge, exposures to market risk factors for securities held by the Fund, there are also risks that those derivatives may not perform as expected resulting in losses for the combined or hedged positions. Some derivatives have the potential for unlimited loss, regardless of the size of the Fund’s initial investment.
Additional associated risks from investing in derivatives also exist and potentially could have significant effects on the valuation of the derivative and the Fund. Typically, the associated risks are not the risks that the Fund is attempting to increase or decrease exposure to, per its investment objectives, but are the additional risks from investing in derivatives. Examples of these associated risks are liquidity risk, which is the risk that the Fund will not be able to sell the derivative in the open market in a timely manner, and counterparty credit risk, which is the risk that the counterparty will not fulfill its obligation to the Fund.
The Fund’s actual exposures to these market risk factors and associated risks during the period are discussed in further detail, by derivative type, below.
Futures Contracts
A futures contract is a commitment to buy or sell a specific amount of a commodity, financial instrument or currency at a negotiated price on a stipulated future date. The Fund may buy and sell futures contracts and may also buy or write put or call options on these futures contracts. Futures contracts and options thereon are generally entered into on a regulated futures exchange and cleared through a clearinghouse associated with the exchange.
Upon entering into a futures contract, the Fund is required to deposit either cash or securities (initial margin) in an amount equal to a certain percentage of the contract value in an account registered in the futures commission merchant’s name. Subsequent payments (variation margin) are paid to or from the futures commission merchant each day equal to the daily changes in the contract value. Such payments are recorded as unrealized gains and losses. Should the Fund fail to make requested variation margin payments, the futures commission merchant can gain access to the initial margin to satisfy the Fund’s payment obligations.
Futures contracts are reported on a schedule following the Statement of Investments. Securities held by a futures commission merchant to cover initial margin requirements on open futures contracts are noted in the Statement of Investments. Cash held by a futures commission merchant to cover initial margin requirements on open futures contracts and the receivable and/or payable for the daily mark to market for the variation margin are noted in the Statement of Assets and Liabilities. The net change in unrealized appreciation and depreciation is reported in the Statement of Operations. Realized gains (losses) are reported in the Statement of Operations at the closing or expiration of futures contracts.
The Fund has purchased futures contracts on various bonds and notes to increase exposure to interest rate risk.
The Fund has sold futures contracts on various bonds and notes to decrease exposure to interest rate risk.
During the reporting period, the Fund had an ending monthly average market value of $12,027,028 and $22,460,813 on futures contracts purchased and sold, respectively.
Additional associated risks of entering into futures contracts (and related options) include the possibility that there may be an illiquid market where the Fund is unable to liquidate the contract or enter into an offsetting position and, if used for hedging purposes, the risk that the price of the contract will correlate imperfectly with the prices of the Fund’s securities.
Counterparty Credit Risk. Derivative positions are subject to the risk that the counterparty will not fulfill its obligation to the Fund. The Fund intends to enter into derivative transactions with counterparties that the Manager believes to be creditworthy at the time of the transaction.
For financial reporting purposes, the Fund does not offset derivative assets and derivative liabilities that are subject to netting arrangements in the Statement of Assets and Liabilities. Bankruptcy or insolvency laws of a particular jurisdiction may impose restrictions on or prohibitions against the right of offset in bankruptcy, insolvency or other events.
The Fund’s risk of loss from counterparty credit risk on exchange-traded derivatives cleared through a clearinghouse and for centrally cleared swaps is generally considered lower than as compared to OTC derivatives. However, counterparty credit risk exists with respect to initial and variation margin deposited/paid by the Fund that is held in futures commission merchant, broker and/or clearinghouse accounts for such exchange-traded derivatives and for centrally cleared swaps.
With respect to centrally cleared swaps, such transactions will be submitted for clearing, and if cleared, will be held in accounts at futures commission merchants or brokers that are members of clearinghouses. While brokers, futures commission merchants and clearinghouses are required to segregate customer margin from their own assets, in the event that a broker, futures commission merchant or clearinghouse becomes insolvent or goes into bankruptcy and at that time there is a shortfall in the aggregate amount of margin held by the broker, futures commission merchant or clearinghouse for all its customers, U.S. bankruptcy laws will typically allocate that shortfall on a pro-rata basis across all the broker’s, futures commission merchant’s or clearinghouse’s customers, potentially resulting in losses to the Fund.
27 OPPENHEIMER CORE BOND FUND/VA
| | |
| NOTES TO FINANCIAL STATEMENTS Continued | | |
| | |
6. Use of Derivatives (Continued)
There is the risk that a broker, futures commission merchant or clearinghouse will decline to clear a transaction on the Fund’s behalf, and the Fund may be required to pay a termination fee to the executing broker with whom the Fund initially enters into the transaction. Clearinghouses may also be permitted to terminate centrally cleared swaps at any time. The Fund is also subject to the risk that the broker or futures commission merchant will improperly use the Fund’s assets deposited/paid as initial or variation margin to satisfy payment obligations of another customer. In the event of a default by another customer of the broker or futures commission merchant, the Fund might not receive its variation margin payments from the clearinghouse, due to the manner in which variation margin payments are aggregated for all customers of the broker/futures commission merchant.
Collateral and margin requirements differ by type of derivative. Margin requirements are established by the broker, futures commission merchant or clearinghouse for exchange-traded and cleared derivatives, including centrally cleared swaps. Brokers, futures commission merchants and clearinghouses can ask for margin in excess of the regulatory minimum, or increase the margin amount, in certain circumstances.
For financial reporting purposes, cash collateral that has been pledged to cover obligations of the Fund, if any, is reported separately on the Statement of Assets and Liabilities as cash pledged as collateral. Non-cash collateral pledged by the Fund, if any, is noted in the Statement of Investments. Generally, the amount of collateral due from or to a party must exceed a minimum transfer amount threshold (e.g. $250,000) before a transfer has to be made. To the extent amounts due to the Fund from its counterparties are not fully collateralized, contractually or otherwise, the Fund bears the risk of loss from counterparty nonperformance.
The following table presents the valuations of derivative instruments by risk exposure as reported within the Statement of Assets and Liabilities at period end:
| | | | | | | | | | | | |
| | | Asset Derivatives | | | Liability Derivatives | |
Derivatives Not Accounted for as
Hedging Instruments | | Statement of Assets and Liabilities Location | | Value | | | Statement of Assets and Liabilities Location | | Value | |
Interest rate contracts | | Variation margin receivable | | | $69,813 * | | | Variation margin payable | | | $19,030 * | |
*Includes only the current day’s variation margin. Prior variation margin movements have been reflected in cash on the Statement of Assets and Liabilities upon receipt or payment.
The effect of derivative instruments on the Statement of Operations is as follows:
| | | | |
| Amount of Realized Gain or (Loss) Recognized on Derivatives | |
Derivatives Not Accounted for as Hedging Instruments | | Closing and expiration of
futures contracts | |
Interest rate contracts | | | $(547,969) | |
|
| Amount of Change in Unrealized Gain or (Loss) Recognized on Derivatives | |
Derivatives Not Accounted for as Hedging Instruments | | Futures contracts | |
Interest rate contracts | | | $(314,212) | |
7. Shares of Beneficial Interest
The Fund has authorized an unlimited number of $0.001 par value shares of beneficial interest of each class. Transactions in shares of beneficial interest were as follows:
| | | | | | | | | | | | | | | | |
| | | Year Ended December 31, 2015 | | | Year Ended December 31, 2014 | |
| | | Shares | | | Amount | | | Shares | | | Amount | |
Non-Service Shares | | | | | | | | | | | | | | | | |
Sold | | | 1,062,552 | | | $ | 8,456,159 | | | | 473,147 | | | $ | 3,766,474 | |
Dividends and/or distributions reinvested | | | 476,892 | | | | 3,667,301 | | | | 636,119 | | | | 4,942,642 | |
Redeemed | | | (1,900,400 | ) | | | (14,956,838) | | | | (2,061,362 | ) | | | (16,419,789) | |
| | | | |
Net decrease | | | (360,956 | ) | | $ | (2,833,378) | | | | (952,096 | ) | | $ | (7,710,673) | |
| | | | |
| | | | | | | | | | | | | | | | |
| |
Service Shares | | | | | | | | | | | | | | | | |
Sold | | | 2,849,289 | | | $ | 22,223,803 | | | | 1,990,358 | | | $ | 15,655,488 | |
Dividends and/or distributions reinvested | | | 273,246 | | | | 2,079,404 | | | | 362,777 | | | | 2,786,126 | |
Redeemed | | | (2,925,634 | ) | | | (22,757,563) | | | | (2,750,766 | ) | | | (21,608,853) | |
| | | | |
Net increase (decrease) | | | 196,901 | | | $ | 1,545,644 | | | | (397,631 | ) | | $ | (3,167,239) | |
| | | | |
8. Purchases and Sales of Securities
The aggregate cost of purchases and proceeds from sales of securities, other than short-term obligations and investments in IMMF, for the reporting period were as follows:
| | | | | | | | | | |
| | | Purchases | | | | | Sales | |
Investment securities | | $ | 86,933,866 | | | | | $ | 105,024,840 | |
U.S. government and government agency obligations | | | 9,149,534 | | | | | | 10,194,743 | |
To Be Announced (TBA) mortgage-related securities | | | 697,962,198 | | | | | | 709,720,690 | |
28 OPPENHEIMER CORE BOND FUND/VA
9. Fees and Other Transactions with Affiliates
Management Fees. Under the investment advisory agreement, the Fund pays the Manager a management fee based on the daily net assets of the Fund at an annual rate as shown in the following table:
| | | | |
| Fee Schedule | | | |
Up to $1 billion | | | 0.60% | |
Over $1 billion | | | 0.50 | |
The Fund’s effective management fee for the reporting period was 0.60% of average annual net assets before any applicable waivers.
Sub-Adviser Fees. The Manager has retained the Sub-Adviser to provide the day-to-day portfolio management of the Fund. Under the Sub-Advisory Agreement, the Manager pays the Sub-Adviser an annual fee in monthly installments, equal to a percentage of the investment management fee collected by the Manager from the Fund, which shall be calculated after any investment management fee waivers. The fee paid to the Sub-Adviser is paid by the Manager, not by the Fund.
Transfer Agent Fees. OFI Global (the “Transfer Agent”) serves as the transfer and shareholder servicing agent for the Fund. The Fund pays the Transfer Agent a fee based on annual net assets. Fees incurred and average net assets for each class with respect to these services are detailed in the Statement of Operations and Financial Highlights, respectively.
Sub-Transfer Agent Fees. The Transfer Agent has retained Shareholder Services, Inc., a wholly-owned subsidiary of OFI (the “Sub-Transfer Agent”), to provide the day-to-day transfer agent and shareholder servicing of the Fund. Under the Sub-Transfer Agency Agreement, the Transfer Agent pays the Sub-Transfer Agent an annual fee in monthly installments, equal to a percentage of the transfer agent fee collected by the Transfer Agent from the Fund, which shall be calculated after any applicable fee waivers. The fee paid to the Sub-Transfer Agent is paid by the Transfer Agent, not by the Fund.
Trustees’ Compensation. The Fund’s Board of Trustees (“Board”) has adopted a compensation deferral plan for Independent Trustees that enables Trustees to elect to defer receipt of all or a portion of the annual compensation they are entitled to receive from the Fund. For purposes of determining the amount owed to the Trustees under the plan, deferred amounts are treated as though equal dollar amounts had been invested in shares of the Fund or in other Oppenheimer funds selected by the Trustees. The Fund purchases shares of the funds selected for deferral by the Trustees in amounts equal to his or her deemed investment, resulting in a Fund asset equal to the deferred compensation liability. Such assets are included as a component of “Other” within the asset section of the Statement of Assets and Liabilities. Deferral of Trustees’ fees under the plan will not affect the net assets of the Fund and will not materially affect the Fund’s assets, liabilities or net investment income per share. Amounts will be deferred until distributed in accordance with the compensation deferral plan.
Distribution and Service Plan for Service Shares. The Fund has adopted a Distribution and Service Plan (the “Plan”) pursuant to Rule 12b-1 under the 1940 Act for Service shares to pay OppenheimerFunds Distributor, Inc. (the “Distributor”), for distribution related services, personal service and account maintenance for the Fund’s Service shares. Under the Plan, payments are made periodically at an annual rate of 0.25% of the daily net assets of Service shares of the Fund. The Distributor currently uses all of those fees to compensate sponsors of the insurance product that offers Fund shares, for providing personal service and maintenance of accounts of their variable contract owners that hold Service shares. These fees are paid out of the Fund’s assets on an on-going basis and increase operating expenses of the Service shares, which results in lower performance compared to the Fund’s shares that are not subject to a service fee. Fees incurred by the Fund under the Plan are detailed in the Statement of Operations.
Waivers and Reimbursements of Expenses. The Manager has contractually agreed to limit the Fund’s expenses after payments, waivers and/or reimbursements and reduction to custodian expenses, excluding expenses incurred directly or indirectly by the Fund as a result of investments in other investment companies, wholly-owned subsidiaries and pooled investment vehicles; so that those expenses, as percentages of daily net assets, will not exceed the annual rate of 0.75% for Non-Service shares and 1.00% for Service shares. The expense limitations do not include interest and fees from borrowing, and other expenses not incurred in the ordinary course of the Fund’s business. During the reporting period, the Manager waived fees and/or reimbursed the Fund $56,872 and $33,877 for Non-Service and Service shares, respectively.
The Manager will waive fees and/or reimburse Fund expenses in an amount equal to the indirect management fees incurred through the Fund’s investment in IMMF. During the reporting period, the Manager waived fees and/or reimbursed the Fund $9,959 for IMMF management fees.
Waivers and/or reimbursements may be modified or terminated as set forth according to the terms in the prospectus.
10. Borrowings and Other Financing
Joint Credit Facility. A number of mutual funds managed by the Manager participate in a $1.28 billion revolving credit facility (the “Facility”) intended to provide short-term financing, if necessary, subject to certain restrictions in connection with atypical redemption activity. Expenses and fees related to the Facility are paid by the participating funds and are disclosed separately or as other expenses on the Statement of Operations. The Fund did not utilize the Facility during the reporting period.
11. Pending Litigation
In 2009, several putative class action lawsuits were filed and later consolidated before the U.S. District Court for the District of Colorado against OppenheimerFunds, Inc. (“OFI”), OppenheimerFunds Distributor, Inc. (“OFDI”), and Oppenheimer Rochester California Municipal Fund, a fund advised
29 OPPENHEIMER CORE BOND FUND/VA
| | |
| NOTES TO FINANCIAL STATEMENTS Continued | | |
| | |
11. Pending Litigation (Continued)
by OFI Global Asset Management, Inc. and distributed by the Distributor (the “California Fund”), in connection with the California Fund’s investment performance. The plaintiffs asserted claims against OFI, OFDI and certain present and former trustees and officers of the California Fund under the federal securities laws, alleging, among other things, that the disclosure documents of the California Fund contained misrepresentations and omissions and the investment policies of the California Fund were not followed. Plaintiffs in the suit filed an amended complaint and defendants filed a motion to dismiss. In 2011, the court issued an order which granted in part and denied in part the defendants’ motion to dismiss. In 2012, plaintiffs filed a motion, which defendants opposed, to certify a class and appoint class representatives and class counsel. In March 2015, the court granted plaintiffs’ motion for class certification. In May 2015, the U.S. Court of Appeals for the Tenth Circuit vacated the class certification order and remanded the matter to the district court for further proceedings. In October 2015, the district court reaffirmed its order and determined that the suit will proceed as a class action. In December 2015, the Tenth Circuit denied defendants’ petition to appeal the district court’s reaffirmed class certification order.
OFI and OFDI believe the suit is without merit; that it is premature to render any opinion as to the likelihood of an outcome unfavorable to them in the suit; and that no estimate can yet be made as to the amount or range of any potential loss. Furthermore, OFI believes that the suit should not impair the ability of OFI or OFDI to perform their respective duties to the Fund and that the outcome of the suit should not have any material effect on the operations of any of the Oppenheimer funds.
30 OPPENHEIMER CORE BOND FUND/VA
REPORT OF INDEPENDENT REGISTERED PUBLIC ACCOUNTING FIRM
The Board of Trustees and Shareholders of Oppenheimer Variable Account Funds:
We have audited the accompanying statement of assets and liabilities of Oppenheimer Core Bond Fund/VA (a separate series of Oppenheimer Variable Account Funds), including the statement of investments, as of December 31, 2015, and the related statement of operations for the year then ended, the statements of changes in net assets for each of the years in the two-year period then ended, and the financial highlights for each of the years in the five-year period then ended. These financial statements and financial highlights are the responsibility of the Fund’s management. Our responsibility is to express an opinion on these financial statements and financial highlights based on our audits.
We conducted our audits in accordance with the standards of the Public Company Accounting Oversight Board (United States). Those standards require that we plan and perform the audit to obtain reasonable assurance about whether the financial statements and financial highlights are free of material misstatement. An audit includes examining, on a test basis, evidence supporting the amounts and disclosures in the financial statements. Our procedures included confirmation of securities owned as of December 31, 2015, by correspondence with the custodian, transfer agent and brokers, or by other appropriate auditing procedures where replies from brokers were not received. An audit also includes assessing the accounting principles used and significant estimates made by management, as well as evaluating the overall financial statement presentation. We believe that our audits provide a reasonable basis for our opinion.
In our opinion, the financial statements and financial highlights referred to above present fairly, in all material respects, the financial position of Oppenheimer Core Bond Fund/VA as of December 31, 2015, the results of its operations for the year then ended, the changes in its net assets for each of the years in the two-year period then ended, and the financial highlights for each of the years in the five-year period then ended, in conformity with U.S. generally accepted accounting principles.
KPMG LLP
Denver, Colorado
February 12, 2016
31 OPPENHEIMER CORE BOND FUND/VA
FEDERAL INCOME TAX INFORMATION Unaudited
In early 2016, if applicable, shareholders of record received information regarding all dividends and distributions paid to them by the Fund during calendar year 2015.
The foregoing information is presented to assist shareholders in reporting distributions received from the Fund to the Internal Revenue Service. Because of the complexity of the federal regulations which may affect your individual tax return and the many variations in state and local tax regulations, we recommend that you consult your tax advisor for specific guidance.
32 OPPENHEIMER CORE BOND FUND/VA
BOARD APPROVAL OF THE FUND’S INVESTMENT ADVISORY AND SUB-ADVISORY AGREEMENTS Unaudited
The Fund has entered into an investment advisory agreement with OFI Global Asset Management, Inc. (“OFI Global” or the “Adviser”), a wholly-owned subsidiary of OppenheimerFunds, Inc. (“OFI” or the “Sub-Adviser”) (“OFI Global” and “OFI” together the “Managers”) and OFI Global has entered into a sub-advisory agreement with OFI whereby OFI provides investment sub-advisory services to the Fund (collectively, the “Agreements”). Each year, the Board of Trustees (the “Board”), including a majority of the independent Trustees, is required to determine whether to approve the terms of the Agreements and the renewal thereof. The Investment Company Act of 1940, as amended, requires that the Board request and evaluate, and that the Managers provide, such information as may be reasonably necessary to evaluate the terms of the Agreements. The Board employs an independent consultant to prepare a report that provides information, including comparative information that the Board requests for that purpose. In addition to in-person meetings focused on this evaluation, the Board receives information throughout the year regarding Fund services, fees, expenses and performance.
The Adviser, Sub-Adviser and the independent consultant provided information to the Board on the following factors: (i) the nature, quality and extent of the Managers’ services, (ii) the comparative investment performance of the Fund and the Managers, (iii) the fees and expenses of the Fund, including comparative fee and expense information, (iv) the profitability of the Managers and their affiliates, including an analysis of the cost of providing services, (v) whether economies of scale are realized as the Fund grows and whether fee levels reflect these economies of scale for Fund investors and (vi) other benefits to the Managers from their relationship with the Fund. The Board was aware that there are alternatives to retaining the Managers.
Outlined below is a summary of the principal information considered by the Board as well as the Board’s conclusions.
Nature, Quality and Extent of Services. The Board considered information about the nature, quality and extent of the services provided to the Fund and information regarding the Managers’ key personnel who provide such services. The Managers’ duties include providing the Fund with the services of the portfolio managers and the Sub-Adviser’s investment team, who provide research, analysis and other advisory services in regard to the Fund’s investments; and securities trading services. OFI Global is responsible for oversight of third-party service providers; monitoring compliance with applicable Fund policies and procedures and adherence to the Fund’s investment restrictions; risk management; and oversight of the Sub-Adviser. OFI Global is also responsible for providing certain administrative services to the Fund as well. Those services include providing and supervising all administrative and clerical personnel who are necessary in order to provide effective corporate administration for the Fund; compiling and maintaining records with respect to the Fund’s operations; preparing and filing reports required by the U.S. Securities and Exchange Commission; preparing periodic reports regarding the operations of the Fund for its shareholders; preparing proxy materials for shareholder meetings; and preparing the registration statements required by federal and state securities laws for the sale of the Fund’s shares. OFI Global also provides the Fund with office space, facilities and equipment.
The Board also considered the quality of the services provided and the quality of the Managers’ resources that are available to the Fund. The Board took account of the fact that the Sub-Adviser has had over fifty years of experience as an investment adviser and that its assets under management rank it among the top mutual fund managers in the United States. The Board evaluated the Managers’ advisory, administrative, accounting, legal, compliance services and risk management, and information the Board has received regarding the experience and professional qualifications of the Managers’ key personnel and the size and functions of its staff. In its evaluation of the quality of the portfolio management services provided, the Board considered the experience of Krishna Memani and Peter Strzalkowski, the portfolio managers for the Fund, and the Sub-Adviser’s investment team and analysts. The Board members also considered the totality of their experiences with the Managers as directors or trustees of the Fund and other funds advised by the Managers. The Board considered information regarding the quality of services provided by affiliates of the Managers, which the Board members have become knowledgeable about through their experiences with the Managers and in connection with the renewal of the Fund’s service agreements. The Board concluded, in light of the Managers’ experience, reputation, personnel, operations and resources that the Fund benefits from the services provided under the Agreements.
Investment Performance of the Managers and the Fund. Throughout the year, the Managers provided information on the investment performance of the Fund, including comparative performance information. The Board also reviewed information, prepared by the Managers and by the independent consultant, comparing the Fund’s historical performance to relevant market indices and to the performance of other intermediate-term bond funds underlying variable insurance products. The Board considered that the Fund outperformed its performance category median during the one-, three- and five-year periods, although it underperformed for the ten-year period. The Board noted that the Fund ranked in the first quintile of its performance category for the one-, three- and five-year periods.
Fees and Expenses of the Fund. The Board reviewed the fees paid to the Adviser and the other expenses borne by the Fund. The Board noted that the Adviser, not the Fund, pays the Sub-Adviser’s fee under the sub-advisory agreement. The independent consultant provided comparative data in regard to the fees and expenses of the Fund and other intermediate-term bond funds underlying variable insurance products. In reviewing the fees and expenses charged to the VA funds, the Board considered the Adviser’s assertion that, because there is much greater disparity in the fees and services that may be provided by a manager to a VA fund as opposed to a retail fund, when comparing the expenses of the various VA funds to those of retail funds, it is most appropriate to focus on total expenses (rather than on the management fees). Accordingly, while the Board reviewed and considered all expenses, it focused on total expenses. The Board considered that the Fund’s total expenses were higher than its peer group median and category median. The Board also considered that the Fund’s contractual management fee was higher than its peer group median and its category median. Within the total asset range of $100 million to $250 million, the Fund’s effective management fee rate was higher than its peer group median and category median. The Board considered that the Adviser has contractually agreed to limit the Fund’s total annual operating expenses so that those expenses, as percentages of daily net assets, will not exceed that annual rate of 0.75% for Non-Service Shares and 1.00% for Service Shares. This contractual expense limitation may not be amended or withdrawn until one year after the date of the Fund’s prospectus, unless approved by the Board.
Economies of Scale and Profits Realized by the Managers. The Board considered information regarding the Managers’ costs in serving as the Fund’s investment adviser and sub-adviser, including the costs associated with the personnel and systems necessary to manage the Fund, and information regarding the Managers’ profitability from their relationship with the Fund. The Board reviewed whether the Managers may realize
33 OPPENHEIMER CORE BOND FUND/VA
BOARD APPROVAL OF THE FUND’S INVESTMENT ADVISORY AND SUB-ADVISORY AGREEMENTS Unaudited / Continued
economies of scale in managing and supporting the Fund. The Board noted that the Fund currently has management fee breakpoints, which are intended to share with Fund shareholders economies of scale that may exist as the Fund’s assets grow.
Other Benefits to the Managers. In addition to considering the profits realized by the Managers, the Board considered information that was provided regarding the direct and indirect benefits the Managers receive as a result of their relationship with the Fund, including compensation paid to the Managers’ affiliates.
Conclusions. These factors were also considered by the independent Trustees meeting separately from the full Board, assisted by experienced counsel to the Fund and to the independent Trustees. Fund counsel and the independent Trustees’ counsel are independent of the Managers within the meaning and intent of the Securities and Exchange Commission Rules.
Based on its review of the information it received and its evaluations described above, the Board, including a majority of the independent Trustees, decided to continue the Agreements through August 31, 2016. In arriving at its decision, the Board did not identify any factor or factors as being more important than others, but considered all of the above information, and considered the terms and conditions of the Agreements, including the management fees, in light of all the surrounding circumstances.
34 OPPENHEIMER CORE BOND FUND/VA
PORTFOLIO PROXY VOTING POLICIES AND PROCEDURES; UPDATES TO STATEMENTS OF INVESTMENTS Unaudited
The Fund has adopted Portfolio Proxy Voting Policies and Procedures under which the Fund votes proxies relating to securities (“portfolio proxies”) held by the Fund. A description of the Fund’s Portfolio Proxy Voting Policies and Procedures is available (i) without charge, upon request, by calling the Fund toll-free at 1.800.525.7048, (ii) on the Fund’s website at www.oppenheimerfunds.com, and (iii) on the SEC’s website at www.sec.gov. In addition, the Fund is required to file Form N-PX, with its complete proxy voting record for the 12 months ended June 30th, no later than August 31st of each year. The Fund’s voting record is available (i) without charge, upon request, by calling the Fund toll-free at 1.800.525.7048, and (ii) in the Form N-PX filing on the SEC’s website at www.sec.gov.
The Fund files its complete schedule of portfolio holdings with the SEC for the first quarter and the third quarter of each fiscal year on Form N-Q. The Fund’s Form N-Q filings are available on the SEC’s website at www.sec.gov. Those forms may be reviewed and copied at the SEC’s Public Reference Room in Washington, D.C. Information on the operation of the Public Reference Room may be obtained by calling 1-800-SEC-0330.
35 OPPENHEIMER CORE BOND FUND/VA
TRUSTEES AND OFFICERS Unaudited
| | |
Name, Position(s) Held with the Fund, Length of Service, Age | | Principal Occupation(s) During the Past 5 Years; Other Trusteeships/Directorships Held; Number of Portfolios in the Fund Complex Currently Overseen |
| |
INDEPENDENT TRUSTEES | | The address of each Trustee in the chart below is 6803 S. Tucson Way, Centennial, Colorado 80112-3924. Each Trustee serves for an indefinite term, or until his or her resignation, retirement, death or removal. |
| |
Sam Freedman, Chairman of the Board of Trustees (since 2013) and Trustee (since 1996) Year of Birth: 1940 | | Director of Colorado UpLIFT (charitable organization) (since September 1984). Mr. Freedman held several positions with the Sub- Adviser and with subsidiary or affiliated companies of the Sub-Adviser (until October 1994). Oversees 47 portfolios in the OppenheimerFunds complex. Mr. Freedman has served on the Boards of certain Oppenheimer funds since 1996, during which time he has become familiar with the Fund’s (and other Oppenheimer funds’) financial, accounting, regulatory and investment matters and has contributed to the Boards’ deliberations. |
| |
Jon S. Fossel, Trustee (since 1990) Year of Birth: 1942 | | Chairman of the Board of Jack Creek Preserve Foundation (non-profit organization) (since 2005); Chairman of the Board (2006- December 2011) and Director (June 2002-December 2011) of UNUMProvident (insurance company); Director of Northwestern Energy Corp. (public utility corporation) (November 2004-December 2009); Director of P.R. Pharmaceuticals (October 1999- October 2003); Director of Rocky Mountain Elk Foundation (non-profit organization) (February 1998-February 2003 and February 2005-February 2007); Chairman and Director (until October 1996) and President and Chief Executive Officer (until October 1995) of the Sub-Adviser; President, Chief Executive Officer and Director of the following: Oppenheimer Acquisition Corp. (“OAC”) (parent holding company of the Sub-Adviser), Shareholders Services, Inc. and Shareholder Financial Services, Inc. (until October 1995). Oversees 47 portfolios in the OppenheimerFunds complex. Mr. Fossel has served on the Boards of certain Oppenheimer funds since 1990, during which time he has become familiar with the Fund’s (and other Oppenheimer funds’) financial, accounting, regulatory and investment matters and has contributed to the Boards’ deliberations. |
| |
Richard Grabish, Trustee (since 2012) Year of Birth: 1948 | | Formerly Senior Vice President and Assistant Director of Sales and Marketing (March 1997-December 2007), Director (March 1987-December 2007) and Manager of Private Client Services (June 1985-June 2005) of A.G. Edwards & Sons, Inc. (broker/dealer and investment firm); Chairman and Chief Executive Officer of A.G. Edwards Trust Company, FSB (March 2001- December 2007); President and Vice Chairman of A.G. Edwards Trust Company, FSB (investment adviser) (April 1987-March 2001); President of A.G. Edwards Trust Company, FSB (investment adviser) (June 2005-December 2007). Oversees 47 portfolios in the OppenheimerFunds complex. Mr. Grabish has served on the Boards of certain Oppenheimer funds since 2001, during which time he has become familiar with the Fund’s (and other Oppenheimer funds’) financial, accounting, regulatory and investment matters and has contributed to the Boards’ deliberations. |
| |
Beverly L. Hamilton, Trustee (since 2002) Year of Birth: 1946 | | Trustee of Monterey Institute for International Studies (educational organization) (since February 2000); Board Member of Middlebury College (educational organization) (December 2005-June 2011); Chairman (since 2010) of American Funds’ Emerging Markets Growth Fund, Inc. (mutual fund); Director of The California Endowment (philanthropic organization) (April 2002-April 2008); Director (February 2002-2005) and Chairman of Trustees (2006-2007) of the Community Hospital of Monterey Peninsula; Director (October 1991-2005); Vice Chairman (2006-2009) of American Funds’ Emerging Markets Growth Fund, Inc. (mutual fund); President of ARCO Investment Management Company (February 1991-April 2000); Member of the investment committees of The Rockefeller Foundation (2001-2006) and The University of Michigan (since 2000); Advisor at Credit Suisse First Boston’s Sprout venture capital unit (venture capital fund) (1994-January 2005); Trustee of MassMutual Institutional Funds (investment company) (1996-June 2004); Trustee of MML Series Investment Fund (investment company) (April 1989-June 2004); Member of the investment committee of Hartford Hospital (2000-2003); and Advisor to Unilever (Holland) pension fund (2000-2003). Oversees 47 portfolios in the OppenheimerFunds complex. Ms. Hamilton has served on the Boards of certain Oppenheimer funds since 2002, during which time she has become familiar with the Fund’s (and other Oppenheimer funds’) financial, accounting, regulatory and investment matters and has contributed to the Boards’ deliberations. |
| |
Victoria J. Herget, Trustee (since 2012) Year of Birth:1951 | | Board Chair (2008-Present) and Director (2004-Present), United Educators (insurance company); Trustee (since 2000) and Chair (since 2010), Newberry Library (independent research library); Trustee, Mather LifeWays (senior living organization) (since 2001); Independent Director of the First American Funds (mutual fund family) (2003-2011); former Managing Director (1993-2001), Principal (1985-1993), Vice President (1978-1985) and Assistant Vice President (1973-1978) of Zurich Scudder Investments (investment adviser) (and its predecessor firms); Trustee (1992-2007), Chair of the Board of Trustees (1999-2007), Investment Committee Chair (1994-1999) and Investment Committee member (2007-2010) of Wellesley College; Trustee, BoardSource (non-profit organization) (2006-2009) and Chicago City Day School (K-8 School) (1994-2005). Oversees 47 portfolios in the OppenheimerFunds complex. Ms. Herget has served on the Boards of certain Oppenheimer funds since 2012, during which time she has become familiar with the Fund’s (and other Oppenheimer funds’) financial, accounting, regulatory and investment matters and has contributed to the Boards’ deliberations. |
| |
Robert J. Malone, Trustee (since 2002) Year of Birth: 1944 | | Chairman - Colorado Market of MidFirst Bank (since January 2015); Chairman of the Board (since 2012) and Director (since August 2005) of Jones International University (educational organization); Trustee of the Gallagher Family Foundation (non-profit organization) (2000-2015); Chairman, Chief Executive Officer and Director of Steele Street Bank Trust (commercial banking) (August 2003-January 2015); Board of Directors of Opera Colorado Foundation (non-profit organization) (2008-2012); Director of Colorado UpLIFT (charitable organization) (1986-2010); Director of Jones Knowledge, Inc. (2006-2010); Former Chairman of U.S. Bank-Colorado (subsidiary of U.S. Bancorp and formerly Colorado National Bank) (July 1996-April 1999); Director of Commercial Assets, Inc. (real estate investment trust) (1993-2000); Director of U.S. Exploration, Inc. (oil and gas exploration) (1997-February 2004); Chairman of the Board (1991-1994) and Trustee (1985-1994) of Regis University; and Chairman of the Board (1990-1991 and Trustee (1984-1999) of Young Presidents Organization. Oversees 47 portfolios in the OppenheimerFunds complex. Mr. Malone has served on the Boards of certain Oppenheimer funds since 2002, during which time he has become familiar with the Fund’s (and other Oppenheimer funds’) financial, accounting, regulatory and investment matters and has contributed to the Boards’ deliberations. |
36 OPPENHEIMER CORE BOND FUND/VA
| | |
F. William Marshall, Jr., Trustee (since 2000) Year of Birth: 1942 | | Trustee Emeritus of Worcester Polytech Institute (WPI) (private university) (since 2009); Trustee of MassMutual Select Funds (formerly MassMutual Institutional Funds) (investment company) (since 1996), MML Series Investment Fund (investment company) (since 1996) and Mass Mutual Premier Funds (investment company) (since January 2012); President and Treasurer of the SIS Funds (private charitable fund) (January 1999-March 2011); Former Trustee of WPI (1985-2008); Former Chairman of the Board (2004-2006) and Former Chairman of the Investment Committee of WPI (1994-2008); Chairman of SIS Family Bank, F.S.B. (formerly SIS Bank) (commercial bank) (January 1999-July 1999); Executive Vice President of Peoples Heritage Financial Group, Inc. (commercial bank) (January 1999-July 1999); and Former President and Chief Executive Officer of SIS Bancorp. (1993-1999). Oversees 47 portfolios in the OppenheimerFunds complex. Mr. Marshall has served on the Boards of certain Oppenheimer funds since 2000, during which time he has become familiar with the Fund’s (and other Oppenheimer funds’) financial, accounting, regulatory and investment matters and has contributed to the Boards’ deliberations. |
| |
Karen L. Stuckey, Trustee (since 2012) Year of Birth: 1953 | | Partner (1990-2012) of PricewaterhouseCoopers LLP (professional services firm) (held various positions 1975-1990); Trustee (1992-2006) and member of Executive, Nominating and Audit Committees and Chair of Finance Committee of Lehigh University; and member, Women’s Investment Management Forum (professional organization) since inception. Oversees 47 portfolios in the OppenheimerFunds complex. Ms. Stuckey has served on the Boards of certain Oppenheimer funds since 2012, during which time she has become familiar with the Fund’s (and other Oppenheimer funds’) financial, accounting, regulatory and investment matters and has contributed to the Boards’ deliberations. |
| |
James D. Vaughn, Trustee (since 2012) Year of Birth: 1945 | | Retired; former managing partner (1994-2001) of Denver office of Deloitte & Touche LLP, (held various positions 1969-1993); Trustee and Chairman of the Audit Committee of Schroder Funds (2003-2012); Board member and Chairman of Audit Committee of AMG National Trust Bank (since 2005); Trustee, Investment Committee member, University of South Dakota Foundation (since 1996); Board member, Audit Committee Member and past Board Chair, Junior Achievement (since 1993); former Board member, Mile High United Way, Boys and Girls Clubs, Boy Scouts, Colorado Business Committee for the Arts, Economic Club of Colorado and Metro Denver Network. Oversees 47 portfolios in the OppenheimerFunds complex. Mr. Vaughn has served on the Boards of certain Oppenheimer funds since 2012, during which time he has become familiar with the Fund’s (and other Oppenheimer funds’) financial, accounting, regulatory and investment matters and has contributed to the Boards’ deliberations. |
| |
INTERESTED TRUSTEE AND OFFICER | | Mr. Steinmetz is an “Interested Trustee” because he is affiliated with the Manager and the Sub-Adviser by virtue of his positions as Chairman and director of the Sub-Adviser and officer and director of the Manager. Both as a Trustee and as an officer, Mr. Steinmetz serves for an indefinite term, or until his resignation, retirement, death or removal. Mr. Steinmetz’s address is 225 Liberty Street, New York, New York 10281-1008. |
| |
Arthur P. Steinmetz Trustee (Since 2015), President and Principal Executive Officer (since 2014) Year of Birth: 1958 | | Chairman of the Sub-Adviser (since January 2015); CEO and Chairman of the Manager (since July 2014), President of the Manager (since May 2013), a Director of the Manager (since January 2013), Director of the Sub-Adviser (since July 2014), President, Management Director and CEO of Oppenheimer Acquisition Corp. (the Sub-Adviser’s parent holding company) (since July 2014), and President and Director of OFI SteelPath, Inc. (since January 2013). Chief Investment Officer of the OppenheimerFunds advisory entities from (January 2013-December 2013); Executive Vice President of the Manager (January 2013-May 2013); Chief Investment Officer of the Sub-Adviser (October 2010-December 2012); Chief Investment Officer, Fixed- Income, of the Sub-Adviser (April 2009-October 2010); Executive Vice President of the Sub-Adviser (October 2009-December 2012); Director of Fixed Income of the Sub-Adviser (January 2009-April 2009); and a Senior Vice President of the Sub-Adviser (March 1993-September 2009). An officer of 101 portfolios in the OppenheimerFunds complex. |
| |
OTHER OFFICERS OF THE FUND | | The addresses of the Officers in the chart below are as follows: for Messrs. Memani, Strzalkowski, Gabinet, Mss. Sexton and Picciotto, 225 Liberty Street, New York, New York 10281-1008, for Mr. Wixted, 6803 S. Tucson Way, Centennial, Colorado 80112-3924. Each Officer serves for an indefinite term or until his or her resignation, retirement, death or removal. |
| |
Krishna Memani, Vice President (since 2009) Year of Birth: 1960 | | President of the Sub-Adviser (since January 2013); Executive Vice President of the Manager (since January 2014) and Chief Investment Officer of the OppenheimerFunds advisory entities (since January 2014). Chief Investment Officer, Fixed Income of the Sub-Adviser (January 2013-December 2013); Head of the Investment Grade Fixed Income Team of the Sub-Adviser (March 2009-January 2014); Director of Fixed Income of the Sub-Adviser (October 2010-December 2012); Senior Vice President of the Sub-Adviser (March 2009-December 2012) and Senior Vice President of OFI Global Institutional, Inc. (April 2009-December 2012). Managing Director and Head of the U.S. and European Credit Analyst Team at Deutsche Bank Securities (June 2006- January 2009). Chief Credit Strategist at Credit Suisse Securities (August 2002-March 2006). Managing Director and Senior Portfolio Manager at Putnam Investments (September 1998-June 2002). A portfolio manager and an officer of other portfolios in the OppenheimerFunds complex. |
| |
Peter A. Strzalkowski, Vice President (since 2009) Year of Birth: 1965 | | Vice President and Senior Portfolio Manager of the Sub-Adviser (since August 2007) and co-Team Leader for the Sub-Adviser’s Investment Grade Fixed Income Team (since January 2014). A member of the Sub-Adviser’s Investment Grade Fixed Income Team (April 2009-January 2014). Managing Partner and Chief Investment Officer of Vector Capital Management, LLC, a structured products money management firm he founded, (July 2006-August 2007). Senior Portfolio Manager at Highland Capital Management, L.P. (June 2005-July 2006) and a Senior Fixed Income Portfolio Manager at Microsoft Corp. (June 2003- June 2005). Vice President and Senior Fixed Income Portfolio Manager at First Citizens Bank Trust, Capital Management Group (April 2000-June 2003) and a Vice President and Fixed Income Portfolio Manager at Centura Banks (November 1998-April 2000). A portfolio manager and officer of other portfolios in the OppenheimerFunds complex. |
37 OPPENHEIMER CORE BOND FUND/VA
TRUSTEES AND OFFICERS Unaudited / Continued
| | |
Arthur S. Gabinet, Secretary and Chief Legal Officer (since 2011) Year of Birth: 1958 | | Executive Vice President, Secretary and General Counsel of the Manager (since January 2013); General Counsel OFI SteelPath, Inc. (since January 2013); Executive Vice President (May 2010-December 2012) and General Counsel (since January 2011) of the Sub-Adviser; General Counsel of the Distributor (since January 2011); General Counsel of Centennial Asset Management Corporation (January 2011-December 2012); Executive Vice President (January 2011-December 2012) and General Counsel of HarbourView Asset Management Corporation (since January 2011); Assistant Secretary (since January 2011) and Director (since January 2011) of OppenheimerFunds International Ltd. and OppenheimerFunds plc; Director of Oppenheimer Real Asset Management, Inc. (January 2011-December 2012) and General Counsel (since January 2011); Executive Vice President (January 2011-December 2011) and General Counsel of Shareholder Financial Services, Inc. and Shareholder Services, Inc. (since January 2011); Executive Vice President (January 2011-December 2012) and General Counsel of OFI Private Investments Inc. (since January 2011); Vice President of OppenheimerFunds Legacy Program (January 2011-December 2011); Executive Vice President (January 2011-December 2012) and General Counsel of OFI Institutional Asset Management, Inc. (since January 2011); General Counsel, Asset Management of the Sub-Adviser (May 2010-December 2010); Principal, The Vanguard Group (November 2005- April 2010); District Administrator, U.S. Securities and Exchange Commission (January 2003-October 2005). An officer of 101 Portfolios in the OppenheimerFunds complex. |
| |
Jennifer Sexton, Vice President and Chief Business Officer (since 2014) Year of Birth: 1969 | | Senior Vice President of OppenheimerFunds Distributor, Inc. (since June 2014); Vice President of OppenheimerFunds Distributor, Inc. (April 2006-June 2014); Vice President of the Sub-Adviser (January 1998-March 2006); Assistant Vice President of the Sub- Adviser (October 1991-December 1998). An officer of 101 Portfolios in the OppenheimerFunds complex. |
| |
Mary Ann Picciotto, Chief Compliance Officer and Chief Anti-Money Laundering Officer (since 2014) Year of Birth: 1973 | | Senior Vice President and Chief Compliance Officer of the Manager (since March 2014); Chief Compliance Officer of the Sub- Adviser, OFI SteelPath, Inc., OFI Global Trust Company, OFI Global Institutional, Inc., Oppenheimer Real Asset Management, Inc., OFI Private Investments, Inc., Harborview Asset Management Corporation, Trinity Investment Management Corporation, and Shareholder Services, Inc. (since March 2014); Managing Director of Morgan Stanley Investment Management Inc. and certain of its various affiliated entities; Chief Compliance Officer of various Morgan Stanley Funds (May 2010-January 2014); Chief Compliance Officer of Morgan Stanley Investment Management Inc. (April 2007-January 2014). An officer of 101 Portfolios in the OppenheimerFunds complex. |
| |
Brian W. Wixted, Treasurer and Principal Financial & Accounting Officer (since 1999) Year of Birth: 1959 | | Senior Vice President of the Manager (since January 2013); Treasurer of the Sub-Adviser, HarbourView Asset Management Corporation, Shareholder Financial Services, Inc., Shareholder Services, Inc., and Oppenheimer Real Asset Management, Inc. (March 1999-June 2008), OFI Private Investments, Inc. (March 2000-June 2008), OppenheimerFunds International Ltd. and OppenheimerFunds plc (since May 2000), OFI Institutional Asset Management, Inc. (November 2000-June 2008), and OppenheimerFunds Legacy Program (charitable trust program established by the Sub-Adviser) (June 2003-December 2011); Treasurer and Chief Financial Officer of OFI Trust Company (since May 2000); Assistant Treasurer of Oppenheimer Acquisition Corporation (March 1999-June 2008). An officer of 101 Portfolios in the OppenheimerFunds complex. |
The Fund’s Statement of Additional Information contains additional information about the Fund’s Trustees and Officers and is available without charge, upon request, by calling 1.800.988.8287.
38 OPPENHEIMER CORE BOND FUND/VA
THIS PAGE INTENTIONALLY LEFT BLANK.
39 OPPENHEIMER CORE BOND FUND/VA
OPPENHEIMER CORE BOND FUND/VA
A Series of Oppenheimer Variable Account Funds
| | |
| Manager | | OFI Global Asset Management, Inc. |
| |
| Sub-Adviser | | OppenheimerFunds, Inc. |
| |
| Distributor | | OppenheimerFunds Distributor, Inc. |
| |
Transfer and Shareholder Servicing Agent | | OFI Global Asset Management, Inc. |
| |
| Sub-Transfer Agent | | Shareholder Services, Inc. DBA OppenheimerFunds Services |
| |
Independent Registered Public Accounting Firm | | KPMG LLP |
| |
| Counsel | | Ropes & Gray LLP |
| |
| | Before investing in any of the Oppenheimer funds, investors should carefully consider a fund’s investment objectives, risks, charges and expenses. Fund prospectuses and summary prospectuses contain this and other information about the funds, and may be obtained by asking your financial advisor, or calling us at 1.800.988.8287. Read prospectuses and summary prospectuses carefully before investing. |
| |
| | © 2016 OppenheimerFunds, Inc. All rights reserved. Oppenheimer funds are distributed by OppenheimerFunds Distributor, Inc. |

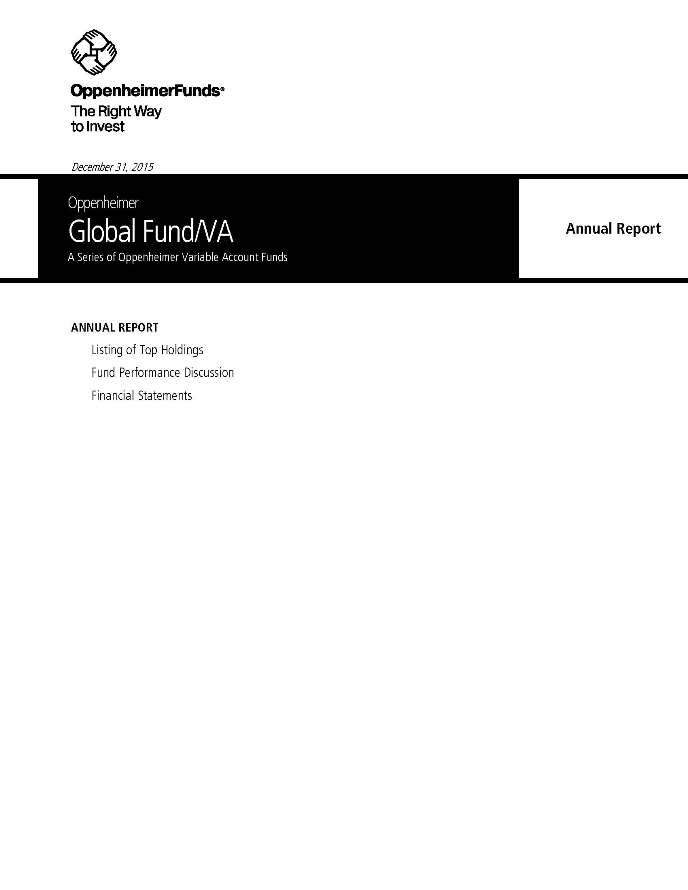
PORTFOLIO MANAGER: Rajeev Bhaman, CFA
AVERAGE ANNUAL TOTAL RETURNS FOR THE PERIODS ENDED 12/31/15
| | | | | | | | |
| | | Inception Date | | 1-Year | | 5-Year | | 10-Year |
Non-Service Shares | | 11/12/90 | | 3.94% | | 8.53% | | 6.21% |
|
Service Shares | | 7/13/00 | | 3.67 | | 8.25 | | 5.94 |
|
MSCI All Country World Index | | | | -2.36 | | 6.09 | | 4.76 |
|
Performance data quoted represents past performance, which does not guarantee future results. The investment return and principal value of an investment in the Fund will fluctuate so that an investor’s shares, when redeemed, may be worth more or less than their original cost. Current performance may be lower or higher than the performance quoted. For performance data current to the most recent month end, call us at 1.800.988.8287. The Fund’s total returns should not be expected to be the same as the returns of other funds, whether or not both funds have the same portfolio managers and/or similar names. The Fund’s total returns include changes in share price and reinvested distributions but do not include the charges associated with the separate account products that offer this Fund. Such performance would have been lower if such charges were taken into account.
TOP HOLDINGS AND ALLOCTIONS
TOP TEN COMMON STOCK HOLDINGS
| | | | |
| |
McGraw Hill Financial, Inc. | | | 2.7% | |
| |
Aetna, Inc. | | | 2.4 | |
| |
Airbus Group SE | | | 2.3 | |
| |
Alphabet, Inc., Cl. C | | | 2.3 | |
| |
Murata Manufacturing Co. Ltd. | | | 2.3 | |
| |
Alphabet, Inc., Cl. A | | | 2.3 | |
| |
Adobe Systems, Inc. | | | 2.2 | |
| |
Colgate-Palmolive Co. | | | 2.2 | |
| |
Citigroup, Inc. | | | 2.1 | |
| |
Maxim Integrated Products, Inc. | | | 2.0 | |
| |
Portfolio holdings and allocations are subject to change. Percentages are as of December 31, 2015, and are based on net assets. For more current Fund holdings, please visit oppenheimerfunds.com.
REGIONAL ALLOCATION
Portfolio holdings and allocations are subject to change. Percentages are as of December 31, 2015, and are based on the total market value of investments.
2 OPPENHEIMER GLOBAL FUND/VA
Fund Performance Discussion
The Fund’s Non-Service shares returned 3.94% for the year 2015, while its benchmark, the MSCI All Country World Index, returned -2.36%.
The Fund’s outperformance versus the Index is partly structural, as we have been oriented away from commodity businesses and utilities throughout the past 7 to 10 years, and partly a result of our stock picks. The denomination of our holdings outside of the U.S. in U.S. dollars declines as the dollar rises versus other currencies, but the underlying earnings are often even higher as a portion of their sales are in dollars. The timing, however, of that recognition is not always immediate as is the change in dollar notional value of foreign stocks. This is a paradox we embrace as far as reality and logic tend to triumph over “what’s working now” and over fear.
We look to areas where we have high conviction to form the majority of our portfolio. We believe health care, information technology, and high-quality consumer brand names can provide long-term secular growth opportunities, which are the pools that are the best stocked for us to fish in. In the early part of the year, our pharmaceutical and biotechnology holdings provided us a meaningful tailwind; however, by the end of the year, it had turned into a headwind as we got into the midst of the political season and the candidates for President decided to voice greater and greater populist rhetoric that included pronouncements to control drug prices. Our most meaningful allocation is in information technology, especially in software and the Internet, which paid off well in 2015 with our stocks outperforming the Index. Despite our reduced enthusiasm for financial stocks, as our perspective on the likelihood of interest rate rises in the economy changed from possible to unlikely, we still own a significant number of stocks in the sector around the world, believing them to offer among the best opportunity for meaningful returns over the next 5 years. Virtually no one is willing to consider a less onerous regulatory and punitive environment than the current one, which is why the opportunity exists. Here too our stock selection seemed to be somewhat better than average.
MARKET OVERVIEW
The obsession of the market in 2015 can be characterized under 4 headings: China, oil, the Federal Reserve (the “Fed”) and currencies. The belated realization that the Chinese economy was slowing or that it even could, led to disruptions in markets around the world. The daily concern about China’s putative growth rate is a bit amusing, as if anyone could predict the impact on the earnings of a company with any accuracy if one knew the quarterly growth rate of the economy or the industrial production number. We spend little time on this subject. We have been concerned, however, for some time that the fixed investment in capital goods and infrastructure was unsustainable and have predicated our thesis on commodity prices on this very belief.
The lack of expected demand growth for oil in China combined with the supply from U.S. shale interacting with the seeming collapse in OPEC’s cartel with Saudi Arabia’s decision to no longer curtail its oil production has led to an oil glut and the collapse in oil prices from $100 per barrel to $30 per barrel. No longer are oil companies and their followers convinced that the rational range for oil prices is over $80 per barrel. Confusion reigns with little conviction anywhere. Our perspective is that commodity prices stabilize at the marginal cost of production, which is significantly under $80 per barrel, but perhaps slightly north of $30 per barrel, though in the near term, storage and inventories will play a role in the price. The damage to oil stocks has been immense and that has helped us some.
The next obsession has been the Fed and its date of raising rates from zero. This conversation has been going on for some time but reached its apogee in 2015, with the precise date seeming to matter to many. It was our conviction that whether the Fed raised rates or not, the global economy was not strong enough to tolerate much raising, which suggested the raising would be small and unenduring. This is why we have been less enthusiastic than we were earlier on financial stocks. Now that the Fed raised rates, we can see the economy and the “body language” of the Fed is not so confident.
Part of our belief on the Fed’s unlikeliness to get aggressive on rate rises was that our perspective was shaped by the meaningful decline of most currencies against the U.S. dollar, which effectively tightened U.S. monetary policy without the Fed acting on rates. The fall in the price of oil, and hence the biggest component of U.S. imports, meant that the U.S. trade deficit was going to be lower. A dramatically shrinking U.S. trade deficit and a shrinking budget deficit shrinks the availability of dollars for world trade as a majority of it is denominated in U.S. dollars. Despite protestations to the contrary, the Fed must consider the impact of its policies on the rest of the world, as the U.S. circumstance cannot be decoupled for long from the circumstances in the rest of the world. The U.S. dollar is after all the world’s reserve currency. The weakness in almost all currencies against the dollar have led to further concerns that the Chinese yuan, which has steadfastly appreciated against it for years, will also be forced to weaken to stimulate faltering Chinese growth.
Our concerns about the world economy are mostly around regulation, protectionism and restraint of trade. Notwithstanding the signing of the Trans Pacific Partnership (TPP), a free trade agreement, the behavior of governments seems to be increasingly protectionist. This is not good for world trade growth and hence global GDP growth. Overly prescriptive regulations threaten the creation of new business and entrepreneurship, favoring incumbents and hurting
3 OPPENHEIMER GLOBAL FUND/VA
innovators. The forces unleashed by the Internet combined with entrepreneurial ingenuity are disrupting businesses everywhere but in a good way for consumers. The disruption from interfering politicians is doing it in a bad way that will only be recognized over the longer duration.
FUND REVIEW
Our long-term holdings, Airbus and Alphabet (Google), were meaningful contributors to the Fund’s performance during the year. The opportunities for both companies to continue to grow faster than nominal GDP growth with valuations are still quite appealing. As the world is more and more connected on a physical as well as a virtual level, we believe the revenue opportunity for both these companies is growing.
The triumph of mobile communication and the always connected customer increase the opportunity for Google to provide its search, but also its content services, to a growing population worldwide. Further options embedded in Alphabet include the most advanced position in the driverless car and large opportunities in the aware home and continuously monitored healthcare. At a cash flow valuation only slightly greater than the market, this is a company that provides growth opportunity many times greater than the market with scalable, advantaged technologies.
Airbus is positioned to grow its earnings over the next few years through increased revenue and profitability as its backlog is over 8 years long. As newer planes provide higher profitability, we believe the company’s earnings can be stable and sustainable. The weakness of the euro offers a further fillip.
We also had good contributions to performance from Murata, a components supplier to the electronics industry, and Adobe, the software company – both long-term holdings. In addition Facebook, a rare initial public offering (IPO) purchase for us, had a disastrous start, but has almost tripled from its IPO price.
Our recent mishaps have included Sunedison and Banca Monte dei Paschi di Siena, a builder of solar facilities for utilities and commercial establishments and an Italian bank respectively, where the waning of the market’s risk appetite led to a meaningful decline in the short term. Our thesis on both remains unshaken and we believe that as conditions improve we will see favorable returns from our original investment prices. Luxury goods and biotechnology also hurt in the period with delays to expected drug approval for Clovis and Celldex and trial failures for Bluebird Bio leading to losses, while LVMH (Louis Vuitton) and Tiffany are feeling the slowdown in global demand on profits. The fundamental strengths of the luxury business are inarguable and we believe they remain very attractive businesses for the long run. We believe our biotech holdings provide the greatest opportunity for exponential growth. The ability to cure or significantly ameliorate very serious health conditions, which is absolutely necessary for society, provides the underlying dynamic for potential profitability.
STRATEGY PERSPECTIVE
The Fund focuses on the long term. We look for a meaningful appreciation in our stocks with solid risk characteristics in what we hope is a fund for all seasons. Our principles are the same as they have been since inception – to look for advantaged businesses run by capable shareholder-oriented managers where the opportunity set in the future is meaningfully larger than it is currently. We look to buy those when they are not in favor or where the opportunity is mispriced. We look to focus on where we are advantaged either by knowledge or temperament and avoid the transient and fleeting that seem appealing for the short run but have little long-term raison d’etre.
Investors should consider the Fund’s investment objective, risks, charges and expenses carefully before investing. The Fund’s prospectus and summary prospectus contain this and other information about the Fund, and may be obtained by asking your financial advisor or calling us at 1.800.988.8287. Read prospectuses and summary prospectuses carefully before investing.
Total returns include changes in share price and reinvestment of dividends and capital gains distributions in a hypothetical investment for the periods shown.
The Fund’s investment strategy and focus can change over time. The mention of specific fund holdings does not constitute a recommendation by OppenheimerFunds, Inc. or its affiliates.
Shares of Oppenheimer funds are not deposits or obligations of any bank, are not guaranteed by any bank, are not insured by the FDIC or any other agency, and involve investment risks, including the possible loss of the principal amount invested.
Comparing the Fund’s Performance to the Market. The graphs that follow show the performance of a hypothetical $10,000 investment in each share class of the Fund held until December 31, 2015. In the case of Non-Service shares and Service shares, performance is measured over a ten-fiscal-year period.
4 OPPENHEIMER GLOBAL FUND/VA
Performance information does not reflect charges that apply to separate accounts investing in the Fund. If these charges were taken into account, performance would be lower. The graphs assume that all dividends and capital gains distributions were reinvested in additional shares.
The Fund’s performance is compared to the performance of the MSCI All Country (AC) World Index, a free float-adjusted market capitalization weighted index that is designed to measure the equity market performance of developed and emerging markets. The Index is unmanaged and cannot be purchased directly by investors. While index comparisons may be useful to provide a benchmark for the Fund’s performance, it must be noted that the Fund’s investments are not limited to the investments comprising the Index. Index performance includes reinvestment of income, but does not reflect transaction costs, fees, expenses or taxes. Index performance is shown for illustrative purposes only as a benchmark for the Fund’s performance, and does not predict or depict performance of the Fund. The Fund’s performance reflects the effects of the Fund’s business and operating expenses.
5 OPPENHEIMER GLOBAL FUND/VA
COMPARISON OF CHANGE IN VALUE OF $10,000 HYPOTHETICAL INVESTMENTS IN:
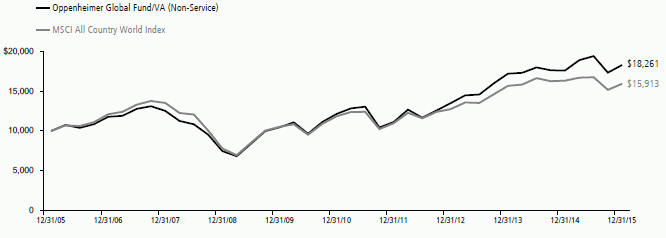
COMPARISON OF CHANGE IN VALUE OF $10,000 HYPOTHETICAL INVESTMENTS IN:
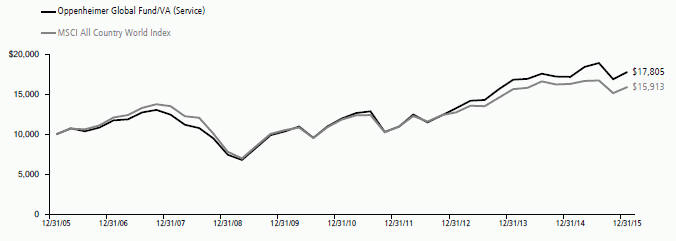
Performance data quoted represents past performance, which does not guarantee future results. The investment return and principal value of an investment in the Fund will fluctuate so that an investor’s shares, when redeemed, may be worth more or less than their original cost. Current performance may be lower or higher than the performance quoted. For performance data current to the most recent month end, call us at 1.800.988.8287. The Fund’s total returns should not be expected to be the same as the returns of other funds, whether or not both funds have the same portfolio managers and/or similar names. The Fund’s total returns include changes in share price and reinvested distributions but do not include the charges associated with the separate account products that offer this Fund. Such performance would have been lower if such charges were taken into account.
6 OPPENHEIMER GLOBAL FUND/VA
Fund Expenses
Fund Expenses. As a shareholder of the Fund, you incur two types of costs: (1) transaction costs and (2) ongoing costs, including management fees; distribution and service fees; and other Fund expenses. These examples are intended to help you understand your ongoing costs (in dollars) of investing in the Fund and to compare these costs with the ongoing costs of investing in other mutual funds.
The examples are based on an investment of $1,000.00 invested at the beginning of the period and held for the entire 6-month period ended December 31, 2015.
Actual Expenses. The first section of the table provides information about actual account values and actual expenses. You may use the information in this section for the class of shares you hold, together with the amount you invested, to estimate the expense that you paid over the period. Simply divide your account value by $1,000.00 (for example, an $8,600.00 account value divided by $1,000.00 = 8.60), then multiply the result by the number in the first section under the heading entitled “Expenses Paid During 6 Months Ended December 31, 2015” to estimate the expenses you paid on your account during this period.
Hypothetical Example for Comparison Purposes.
The second section of the table provides information about hypothetical account values and hypothetical expenses based on the Fund’s actual expense ratio for each class of shares, and an assumed rate of return of 5% per year for each class before expenses, which is not the actual return. The hypothetical account values and expenses may not be used to estimate the actual ending account balance or expenses you paid for the period. You may use this information to compare the ongoing costs of investing in the Fund and other funds. To do so, compare this 5% hypothetical example for the class of shares you hold with the 5% hypothetical examples that appear in the shareholder reports of the other funds.
Please note that the expenses shown in the table are meant to highlight your ongoing fund costs only and do not reflect any charges associated with the separate accounts that offer this Fund. Therefore, the “hypothetical” lines of the table are useful in comparing ongoing fund costs only, and will not help you determine the relative total costs of owning different funds. In addition, if these separate account charges were included your costs would have been higher.
| | | | | | | | | | | | |
| Actual | | Beginning
Account Value
July 1, 2015 | | | Ending Account Value December 31, 2015 | | | Expenses Paid During 6 Months Ended December 31, 2015 | |
Non-Service shares | | $ | 1,000.00 | | | $ | 942.50 | | | $ | 3.73 | |
Service shares | | | 1,000.00 | | | | 941.20 | | | | 4.95 | |
| | | |
Hypothetical (5% return before expenses) | | | | | | | | | |
Non-Service shares | | | 1,000.00 | | | | 1,021.37 | | | | 3.88 | |
Service shares | | | 1,000.00 | | | | 1,020.11 | | | | 5.16 | |
Expenses are equal to the Fund’s annualized expense ratio for that class, multiplied by the average account value over the period, multiplied by 184/365 (to reflect the one-half year period). Those annualized expense ratios, excluding indirect expenses from affiliated funds, based on the 6-month period ended December 31, 2015 are as follows:
| | | | |
| Class | | Expense Ratios | |
Non-Service shares | | | 0.76% | |
Service shares | | | 1.01 | |
The expense ratios reflect voluntary and/or contractual waivers and/or reimbursements of expenses by the Fund’s Manager. Some of these undertakings may be modified or terminated at any time, as indicated in the Fund’s prospectus. The “Financial Highlights” tables in the Fund’s financial statements, included in this report, also show the gross expense ratios, without such waivers or reimbursements and reduction to custodian expenses, if applicable.
7 OPPENHEIMER GLOBAL FUND/VA
STATEMENT OF INVESTMENTS December 31, 2015
| | | | | | | | |
| | | Shares | | | Value | |
Common Stocks—97.2% | |
Consumer Discretionary—12.7% | |
Automobiles—0.5% | |
Suzuki Motor Corp. | | | 425,100 | | | $ | 12,905,359 | |
| | | | | | | | | |
Hotels, Restaurants & Leisure—1.1% | |
International Game Technology plc | | | 748,881 | | | | 12,116,895 | |
McDonald’s Corp. | | | 135,920 | | | | 16,057,589 | |
| | | | | | | 28,174,484 | |
| | | | | | | | | |
Internet & Catalog Retail—1.3% | |
JD.com, Inc., ADR1 | | | 989,222 | | | | 31,917,248 | |
| | | | | | | | | |
Leisure Products—0.2% | | | | | | | | |
Nintendo Co. Ltd. | | | 42,200 | | | | 5,809,330 | |
| | | | | | | | | |
Media—2.8% | | | | | | | | |
Walt Disney Co. (The) | | | 446,960 | | | | 46,966,557 | |
Zee Entertainment Enterprises Ltd. | | | 3,246,821 | | | | 21,426,244 | |
| | | | | | | 68,392,801 | |
| | | | | | | | | |
Specialty Retail—3.1% | |
Industria de Diseno Textil SA | | | 1,377,628 | | | | 47,275,044 | |
Tiffany & Co. | | | 375,420 | | | | 28,640,792 | |
| | | | | | | 75,915,836 | |
| | | | | | | | | |
Textiles, Apparel & Luxury Goods—3.7% | |
Brunello Cucinelli SpA | | | 425,969 | | | | 7,508,482 | |
Kering | | | 175,540 | | | | 29,921,470 | |
LVMH Moet Hennessy Louis Vuitton SE | | | 287,170 | | | | 44,892,333 | |
Tod’s SpA | | | 137,066 | | | | 10,824,905 | |
| | | | | | | 93,147,190 | |
| | | | | | | | | |
Consumer Staples—5.5% | | | | | | | | |
Beverages—0.5% | | | | | | | | |
Fomento Economico Mexicano SAB de CV, ADR | | | 147,345 | | | | 13,607,311 | |
Food Products—2.8% | | | | | | | | |
Nestle SA | | | 341,927 | | | | 25,344,881 | |
Unilever plc | | | 1,041,213 | | | | 44,582,421 | |
| | | | | | | 69,927,302 | |
| | | | | | | | | |
Household Products—2.2% | | | | | |
Colgate-Palmolive Co. | | | 809,210 | | | | 53,909,570 | |
| | | | | | | | | |
Energy—1.2% | |
Energy Equipment & Services—0.7% | |
Technip SA | | | 355,030 | | | | 17,537,078 | |
| | | | | | | | | |
Oil, Gas & Consumable Fuels—0.5% | |
Repsol SA | | | 1,071,548 | | | | 11,665,962 | |
| | | | | | | | | |
Financials—22.0% | | | | | | | | |
Capital Markets—5.9% | | | | | | | | |
Credit Suisse Group AG1 | | | 1,368,433 | | | | 29,576,407 | |
Deutsche Bank AG | | | 900,751 | | | | 22,108,153 | |
| Goldman Sachs Group, Inc. (The) | | | 204,750 | | | | 36,902,093 | |
Nomura Holdings, Inc. | | | 2,057,500 | | | | 11,434,953 | |
UBS Group AG | | | 2,467,252 | | | | 47,479,555 | |
| | | | | | | 147,501,161 | |
| | | | | | | | | |
Commercial Banks—6.5% | |
Banca Monte dei Paschi di Siena SpA1 | | | 6,568,177 | | | | 8,674,699 | |
Banco Bilbao Vizcaya Argentaria SA | | | 2,744,757 | | | | 20,016,376 | |
Citigroup, Inc. | | | 1,032,760 | | | | 53,445,330 | |
ICICI Bank Ltd., Sponsored ADR | | | 3,923,630 | | | | 30,722,023 | |
Societe Generale SA | | | 500,519 | | | | 23,087,684 | |
Sumitomo Mitsui Financial Group, Inc. | | | 706,000 | | | | 26,631,940 | |
| | | | | | | 162,578,052 | |
| | | | | | | | | |
Diversified Financial Services—2.7% | |
McGraw Hill Financial, Inc. | | | 669,610 | | | | 66,010,154 | |
| | | | | | | | |
| | | Shares | | | Value | |
| Insurance—5.7% | | | | | | | | |
| Allianz SE | | | 254,772 | | | $ | 45,134,309 | |
| Dai-ichi Life Insurance Co. Ltd. (The) | | | 2,090,000 | | | | 34,678,875 | |
| FNF Group | | | 547,660 | | | | 18,987,372 | |
| Prudential plc | | | 1,936,467 | | | | 43,353,443 | |
| | | | | | | 142,153,999 | |
| | | | | | | | | |
| Real Estate Management & Development—1.2% | |
| DLF Ltd. | | | 16,573,168 | | | | 28,767,983 | |
| | | | | | | | | |
| Health Care—17.2% | |
| Biotechnology—7.9% | |
ACADIA Pharmaceuticals, Inc.1 | | | 451,240 | | | | 16,086,706 | |
| Biogen, Inc.1 | | | 86,840 | | | | 26,603,434 | |
| BioMarin Pharmaceutical, Inc.1 | | | 193,250 | | | | 20,244,870 | |
| Bluebird Bio, Inc.1 | | | 179,560 | | | | 11,531,343 | |
| Celldex Therapeutics, Inc.1 | | | 1,195,760 | | | | 18,749,517 | |
| Circassia Pharmaceuticals plc1 | | | 4,471,614 | | | | 21,041,399 | |
| Clovis Oncology, Inc.1 | | | 170,360 | | | | 5,962,600 | |
| Gilead Sciences, Inc. | | | 332,130 | | | | 33,608,235 | |
| Ionis Pharmaceuticals, Inc.1 | | | 173,230 | | | | 10,728,134 | |
| MacroGenics, Inc.1 | | | 388,620 | | | | 12,035,561 | |
| Medivation, Inc.1 | | | 153,510 | | | | 7,420,673 | |
| Vertex Pharmaceuticals, Inc.1 | | | 96,400 | | | | 12,130,012 | |
| | | | | | | 196,142,484 | |
| | | | | | | | | |
| Health Care Equipment & Supplies—1.7% | |
| St. Jude Medical, Inc. | | | 248,020 | | | | 15,320,195 | |
| Zimmer Biomet Holdings, Inc. | | | 259,630 | | | | 26,635,442 | |
| | | | | | | 41,955,637 | |
| | | | | | | | | |
| Health Care Providers & Services—4.5% | |
| Aetna, Inc. | | | 561,800 | | | | 60,741,816 | |
| Anthem, Inc. | | | 302,515 | | | | 42,182,691 | |
| Cigna Corp. | | | 45,470 | | | | 6,653,625 | |
| Humana, Inc. | | | 13,260 | | | | 2,367,043 | |
| | | | | | | 111,945,175 | |
| | | | | | | | | |
| Pharmaceuticals—3.1% | | | | | | | | |
| Bayer AG | | | 290,006 | | | | 36,384,534 | |
| Roche Holding AG | | | 84,580 | | | | 23,309,244 | |
| Shire plc | | | 231,700 | | | | 15,879,287 | |
| Theravance Biopharma, Inc.1 | | | 157,022 | | | | 2,573,591 | |
| | | | | | | 78,146,656 | |
| | | | | | | | | |
| Industrials—11.5% | | | | | | | | |
| Aerospace & Defense—3.1% | |
| Airbus Group SE | | | 846,960 | | | | 56,867,844 | |
| Embraer SA, Sponsored ADR | | | 668,033 | | | | 19,733,695 | |
| | | | | | | 76,601,539 | |
| | | | | | | | | |
| Air Freight & Couriers—1.2% | |
| United Parcel Service, Inc., Cl. B | | | 329,200 | | | | 31,678,916 | |
| | | | | | | | | |
| Building Products—1.7% | | | | | | | | |
| Assa Abloy AB, Cl. B | | | 2,022,568 | | | | 42,362,043 | |
| | | | | | | | | |
| Construction & Engineering—0.3% | |
| FLSmidth & Co. AS | | | 197,846 | | | | 6,853,151 | |
| | | | | | | | | |
| Electrical Equipment—2.6% | |
| Emerson Electric Co. | | | 348,460 | | | | 16,666,842 | |
| Nidec Corp. | | | 516,100 | | | | 37,356,545 | |
| Prysmian SpA | | | 472,300 | | | | 10,331,028 | |
| | | | | | | 64,354,415 | |
| | | | | | | | | |
| Industrial Conglomerates—1.9% | |
| 3M Co. | | | 230,450 | | | | 34,714,988 | |
| Siemens AG | | | 125,116 | | | | 12,138,890 | |
| | | | | | | 46,853,878 | |
8 OPPENHEIMER GLOBAL FUND/VA
| | | | | | | | |
| | | Shares | | | Value | |
| Machinery—0.7% | | | | | | | | |
| FANUC Corp. | | | 99,100 | | | $ | 17,083,972 | |
| | | | | | | | | |
| Information Technology—24.7% | |
| Communications Equipment—1.4% | |
Telefonaktiebolaget LM Ericsson, Cl. B | | | 3,710,825 | | | | 35,945,661 | |
| | | | | | | | | |
| Electronic Equipment, Instruments, & Components—5.0% | |
| Keyence Corp. | | | 74,511 | | | | 40,895,027 | |
| Kyocera Corp. | | | 592,000 | | | | 27,438,730 | |
| Murata Manufacturing Co. Ltd. | | | 393,500 | | | | 56,477,758 | |
| | | | | | | 124,811,515 | |
| | | | | | | | | |
| Internet Software & Services—7.9% | |
| Alphabet, Inc., Cl. A1 | | | 72,100 | | | | 56,094,521 | |
| Alphabet, Inc., Cl. C1 | | | 74,782 | | | | 56,750,564 | |
| eBay, Inc.1 | | | 974,050 | | | | 26,766,894 | |
| Facebook, Inc., Cl. A1 | | | 433,150 | | | | 45,333,479 | |
| Qihoo 360 Technology Co. Ltd., ADR1 | | | 156,380 | | | | 11,386,028 | |
| | | | | | | 196,331,486 | |
| | | | | | | | | |
| IT Services—1.6% | | | | | | | | |
| Earthport plc1 | | | 9,752,433 | | | | 3,568,553 | |
| PayPal Holdings, Inc.1 | | | 974,050 | | | | 35,260,610 | |
| | | | | | | 38,829,163 | |
| | | | | | | | | |
| Semiconductors & Semiconductor Equipment—2.8% | |
| Maxim Integrated Products, Inc. | | | 1,303,915 | | | | 49,548,770 | |
| SunEdison, Inc.1 | | | 3,891,700 | | | | 19,808,753 | |
| | | | | | | 69,357,523 | |
| | | | | | | | | |
| Software—6.0% | | | | | | | | |
| Adobe Systems, Inc.1 | | | 585,113 | | | | 54,965,515 | |
| Intuit, Inc. | | | 475,300 | | | | 45,866,450 | |
| SAP SE | | | 617,600 | | | | 49,192,591 | |
| | | | | | | 150,024,556 | |
| | | | | | | | |
| | | | | | | | |
| | | Shares | | | Value | |
| Materials—0.8% | | | | | | | | |
| Chemicals—0.8% | | | | | | | | |
Linde AG | | | 136,037 | | | $ | 19,746,225 | |
| Telecommunication Services—1.6% | |
| Wireless Telecommunication Services—1.6% | |
| KDDI Corp. | | | 1,500,500 | | | | 38,843,395 | |
Total Common Stocks (Cost $1,377,008,361) | | | | 2,417,788,210 | |
| | | | | | | | | |
| Preferred Stocks—1.9% | |
| Bayerische Motoren Werke (BMW) AG, | | | | | |
| Preference | | | 544,767 | | | | 45,632,183 | |
| Zee Entertainment Enterprises Ltd., 6% Cum. | | | | | |
| Non-Cv. | | | 79,253,601 | | | | 1,078,178 | |
Total Preferred Stocks (Cost $16,137,192) | | | | | | | 46,710,361 | |
| | | | | | | | |
| | |
| | | Units | | | | |
| Rights, Warrants and Certificates—0.0% | |
Repsol SA Rts. Strike Price 1EUR, Exp. 1/7/161
(Cost $—) | | | 1,071,548 | | | | 534,508 | |
| | | | | | | | |
| | |
| | | Shares | | | | |
| Investment Company—0.8% | |
Oppenheimer Institutional Money Market Fund, | | | | | | | | |
Cl. E, 0.30%2,3 (Cost $20,379,539) | | | 20,379,539 | | | | 20,379,539 | |
| | | | | | | | | |
Total Investments, at Value (Cost $1,413,525,092) | | | 99.9% | | | | 2,485,412,618 | |
| Net Other Assets (Liabilities) | | | 0.1 | | | | 2,298,885 | |
| Net Assets | | | 100.0% | | | $ | 2,487,711,503 | |
| | | | | | | | |
Footnotes to Statement of Investments
Strike price is reported in U.S. Dollars, except for those denoted in the following currency:
EUR European Dollar
1. Non-income producing security.
2. Rate shown is the 7-day yield at period end.
3. Is or was an affiliate, as defined in the Investment Company Act of 1940, as amended, at or during the reporting period, by virtue of the Fund owning at least 5% of the voting securities of the issuer or as a result of the Fund and the issuer having the same investment adviser. Transactions during the reporting period in which the issuer was an affiliate are as follows:
| | | | | | | | | | | | | | | | |
| | | Shares
December 31, 2014 | | | Gross
Additions | | | Gross
Reductions | | | Shares
December 31, 2015 | |
Oppenheimer Institutional Money Market Fund, Cl. E | | | 12,394,365 | | | | 492,938,031 | | | | 484,952,857 | | | | 20,379,539 | |
| | | | | | | | |
| | | Value | | | Income | |
Oppenheimer Institutional Money Market Fund, Cl. E | | $ | 20,379,539 | | | $ | 40,181 | |
| | | | | | | | |
| Distribution of investments representing geographic holdings, as a percentage of total investments at value, is as follows: | | | | |
| Geographic Holdings (Unaudited) | | Value | | | Percent | |
United States | | $ | 1,143,757,195 | | | | 46.0% | |
Japan | | | 309,555,885 | | | | 12.5 | |
Germany | | | 230,336,885 | | | | 9.3 | |
Switzerland | | | 125,710,087 | | | | 5.1 | |
United Kingdom | | | 124,662,711 | | | | 5.0 | |
France | | | 115,438,565 | | | | 4.6 | |
India | | | 81,994,428 | | | | 3.3 | |
Spain | | | 79,491,890 | | | | 3.2 | |
Sweden | | | 78,307,704 | | | | 3.2 | |
Netherlands | | | 56,867,844 | | | | 2.3 | |
China | | | 43,303,276 | | | | 1.7 | |
Italy | | | 37,339,114 | | | | 1.5 | |
Brazil | | | 19,733,695 | | | | 0.8 | |
Ireland | | | 15,879,287 | | | | 0.6 | |
Mexico | | | 13,607,311 | | | | 0.5 | |
Denmark | | | 6,853,151 | | | | 0.3 | |
9 OPPENHEIMER GLOBAL FUND/VA
STATEMENT OF INVESTMENTS Continued
| | | | | | | | |
| Geographic Holdings (Unaudited / Continued) | | Value | | | Percent | |
Cayman Islands | | $ | 2,573,590 | | | | 0.1% | |
Total | | $ | 2,485,412,618 | | | | 100.0% | |
| | | | | | | | |
See accompanying Notes to Financial Statements.
10 OPPENHEIMER GLOBAL FUND/VA
STATEMENT OF ASSETS AND LIABILITIES December 31, 2015
| | | | |
Assets | | | | |
Investments, at value—see accompanying statement of investments: | | | | |
Unaffiliated companies (cost $1,393,145,553) | | $ | 2,465,033,079 | |
Affiliated companies (cost $20,379,539) | | | 20,379,539 | |
| | | | 2,485,412,618 | |
Cash | | | 2,000,000 | |
Receivables and other assets: | | | | |
Dividends | | | 4,650,563 | |
Shares of beneficial interest sold | | | 213,385 | |
Other | | | 99,959 | |
Total assets | | | 2,492,376,525 | |
Liabilities | | | | |
Payables and other liabilities: | | | | |
Shares of beneficial interest redeemed | | | 4,121,227 | |
Distribution and service plan fees | | | 233,871 | |
Shareholder communications | | | 105,519 | |
Trustees’ compensation | | | 86,369 | |
Foreign capital gains tax | | | 10,662 | |
Other | | | 107,374 | |
Total liabilities | | | 4,665,022 | |
Net Assets | | $ | 2,487,711,503 | |
| | | | |
| | | | | |
Composition of Net Assets | | | | |
Par value of shares of beneficial interest | | $ | 65,777 | |
Additional paid-in capital | | | 1,273,599,755 | |
Accumulated net investment income | | | 18,960,340 | |
Accumulated net realized gain on investments and foreign currency transactions | | | 123,709,199 | |
Net unrealized appreciation on investments and translation of assets and liabilities denominated in foreign currencies | | | 1,071,376,432 | |
Net Assets | | $ | 2,487,711,503 | |
| | | | |
| | | | | |
Net Asset Value Per Share | | | | |
Non-Service Shares: | | | | |
Net asset value, redemption price per share and offering price per share (based on net assets of $1,406,000,514 and 37,001,506 shares of beneficial interest outstanding) | | | $38.00 | |
Service Shares: | | | | |
Net asset value, redemption price per share and offering price per share (based on net assets of $1,081,710,989 and 28,775,770 shares of beneficial interest outstanding) | | | $37.59 | |
See accompanying Notes to Financial Statements.
11 OPPENHEIMER GLOBAL FUND/VA
STATEMENT OF OPERATIONS For the Year Ended December 31, 2015
| | | | |
Investment Income | | | | |
Dividends: | | | | |
Unaffiliated companies (net of foreign withholding taxes of $3,377,941) | | $ | 44,236,692 | |
Affiliated companies | | | 40,181 | |
Interest | | | 49 | |
Portfolio lending fees | | | 6,775 | |
Total investment income | | | 44,283,697 | |
Expenses | | | | |
Management fees | | | 17,181,922 | |
Distribution and service plan fees: | | | | |
Service shares | | | 3,025,751 | |
Transfer and shareholder servicing agent fees: | | | | |
Non-Service shares | | | 1,503,338 | |
Service shares | | | 1,220,316 | |
Shareholder communications: | | | | |
Non-Service shares | | | 129,333 | |
Service shares | | | 104,471 | |
Custodian fees and expenses | | | 193,905 | |
Trustees’ compensation | | | 67,448 | |
Borrowing fees | | | 20,052 | |
Other | | | 247,346 | |
Total expenses | | | 23,693,882 | |
Less reduction to custodian expenses | | | (948 | ) |
Less waivers and reimbursements of expenses | | | (25,889 | ) |
Net expenses | | | 23,667,045 | |
Net Investment Income | | | 20,616,652 | |
Realized and Unrealized Gain (Loss) | | | | |
Net realized gain on: | | | | |
Investments from unaffiliated companies | | | 169,014,249 | |
Foreign currency transactions | | | 68,665 | |
Net realized gain | | | 169,082,914 | |
Net change in unrealized appreciation/depreciation on: | | | | |
Investments | | | (72,585,240 | ) |
Translation of assets and liabilities denominated in foreign currencies | | | (15,515,887 | ) |
Net change in unrealized appreciation/depreciation | | | (88,101,127 | ) |
Net Increase in Net Assets Resulting from Operations | | $ | 101,598,439 | |
| | | | |
See accompanying Notes to Financial Statements.
12 OPPENHEIMER GLOBAL FUND/VA
STATEMENTS OF CHANGES IN NET ASSETS
| | | | | | | | | | |
| | | Year Ended
December 31, 2015 | | | | | Year Ended
December 31, 2014 | |
Operations | | | | | | | | | | |
Net investment income | | $ | 20,616,652 | | | | | $ | 31,557,766 | |
Net realized gain | | | 169,082,914 | | | | | | 197,744,443 | |
Net change in unrealized appreciation/depreciation | | | (88,101,127) | | | | | | (172,610,475) | |
| | | | | | | | | | |
Net increase in net assets resulting from operations | | | 101,598,439 | | | | | | 56,691,734 | |
Dividends and/or Distributions to Shareholders | | | | | | | | | | |
Dividends from net investment income: | | | | | | | | | | |
Non-Service shares | | | (19,562,644) | | | | | | (16,920,293) | |
Service shares | | | (13,304,683) | | | | | | (10,958,436) | |
| | | | | | | | | | |
| | | (32,867,327) | | | | | | (27,878,729) | |
Distributions from net realized gain: | | | | | | | | | | |
Non-Service shares | | | (97,527,552) | | | | | | (69,030,952) | |
Service shares | | | (81,961,759) | | | | | | (57,658,820) | |
| | | | | | | | | | |
| | | (179,489,311) | | | | | | (126,689,772) | |
Beneficial Interest Transactions | | | | | | | | | | |
Net decrease in net assets resulting from beneficial interest transactions: | | | | | | | | | | |
Non-Service shares | | | (4,461,169) | | | | | | (70,199,522) | |
Service shares | | | (69,555,025) | | | | | | (60,956,871) | |
| | | | | | | | | | |
| | | (74,016,194) | | | | | | (131,156,393) | |
Net Assets | | | | | | | | | | |
Total decrease | | | (184,774,393) | | | | | | (229,033,160) | |
Beginning of period | | | 2,672,485,896 | | | | | | 2,901,519,056 | |
| | | | | | | | | | |
| | | |
End of period (including accumulated net investment income of $ 18,960,340 and $ 31,095,795, respectively) | | $ | 2,487,711,503 | | | | | $ | 2,672,485,896 | |
| | | | |
See accompanying Notes to Financial Statements.
13 OPPENHEIMER GLOBAL FUND/VA
FINANCIAL HIGHLIGHTS
| | | | | | | | | | | | | | | | | | | | |
| Non-Service Shares | | Year Ended
December 31,
2015 | | | Year Ended
December 31,
2014 | | | Year Ended
December 31,
2013 | | | Year Ended
December 31,
2012 | | | Year Ended
December 30,
20111 | |
Per Share Operating Data | | | | | | | | | | | | | | | | | | | | |
Net asset value, beginning of period | | $ | 39.50 | | | $ | 40.86 | | | $ | 32.55 | | | $ | 27.46 | | | $ | 30.30 | |
Income (loss) from investment operations: | | | | | | | | | | | | | | | | | | | | |
Net investment income2 | | | 0.35 | | | | 0.50 | | | | 0.41 | | | | 0.44 | | | | 0.65 | |
Net realized and unrealized gain (loss) | | | 1.40 | | | | 0.46 | | | | 8.40 | | | | 5.29 | | | | (3.11) | |
Total from investment operations | | | 1.75 | | | | 0.96 | | | | 8.81 | | | | 5.73 | | | | (2.46) | |
Dividends and/or distributions to shareholders: | | | | | | | | | | | | | | | | | | | | |
Dividends from net investment income | | | (0.54) | | | | (0.46) | | | | (0.50) | | | | (0.64) | | | | (0.38) | |
Distributions from net realized gain | | | (2.71) | | | | (1.86) | | | | 0.00 | | | | 0.00 | | | | 0.00 | |
Total dividends and/or distributions to shareholders | | | (3.25) | | | | (2.32) | | | | (0.50) | | | | (0.64) | | | | (0.38) | |
Net asset value, end of period | | $ | 38.00 | | | $ | 39.50 | | | $ | 40.86 | | | $ | 32.55 | | | $ | 27.46 | |
| | | | |
| | | | |
| | | | |
| | | | | | | | | | | | | | | | | | | | |
| | | | |
Total Return, at Net Asset Value3 | | | 3.94% | | | | 2.29% | | | | 27.31% | | | | 21.27% | | | | (8.29)% | |
| | | | | | | | | | | | | | | | | | | | |
Ratios/Supplemental Data | | | | | | | | | | | | | | | | | | | | |
Net assets, end of period (in thousands) | | $ | 1,406,001 | | | $ | 1,468,107 | | | $ | 1,397,026 | | | $ | 1,252,127 | | | $ | 1,165,141 | |
Average net assets (in thousands) | | $ | 1,502,338 | | | $ | 1,532,383 | | | $ | 1,333,848 | | | $ | 1,206,244 | | | $ | 1,335,403 | |
Ratios to average net assets:4 | | | | | | | | | | | | | | | | | | | | |
Net investment income | | | 0.86% | | | | 1.24% | | | | 1.13% | | | | 1.48% | | | | 2.17% | |
Expenses excluding interest and fees from borrowings | | | 0.76% | | | | 0.76% | | | | 0.77% | | | | 0.76% | | | | 0.76% | |
Interest and fees from borrowings | | | 0.00%5 | | | | 0.00% | | | | 0.00% | | | | 0.00% | | | | 0.00% | |
Total expenses6 | | | 0.76% | | | | 0.76% | | | | 0.77% | | | | 0.76% | | | | 0.76% | |
Expenses after payments, waivers and/or reimbursements and reduction to custodian expenses | | | 0.76% | | | | 0.76% | | | | 0.77% | | | | 0.76% | | | | 0.76% | |
Portfolio turnover rate | | | 14% | | | | 13% | | | | 11% | | | | 14% | | | | 13% | |
1. December 30, 2011 represents the last business day of the Fund’s reporting period. See Note 2 of the accompanying Notes.
2. Per share amounts calculated based on the average shares outstanding during the period.
3. Assumes an initial investment on the business day before the first day of the fiscal period, with all dividends and distributions reinvested in additional shares on the reinvestment date, and redemption at the net asset value calculated on the last business day of the fiscal period. Total returns are not annualized for periods less than one full year. Total return information does not reflect expenses that apply at the separate account level or to related insurance products. Inclusion of these charges would reduce the total return figures for all periods shown. Returns do not reflect the deduction of taxes that a shareholder would pay on fund distributions or the redemption of fund shares.
4. Annualized for periods less than one full year.
5. Less than 0.005%.
6. Total expenses including indirect expenses from affiliated fund fees and expenses were as follows:
| | | | | | | | |
| | Year Ended December 31, 2015 | | | 0.76 | % | | |
| | Year Ended December 31, 2014 | | | 0.76 | % | | |
| | Year Ended December 31, 2013 | | | 0.77 | % | | |
| | Year Ended December 31, 2012 | | | 0.76 | % | | |
| | Year Ended December 30, 2011 | | | 0.76 | % | | |
See accompanying Notes to Financial Statements.
14 OPPENHEIMER GLOBAL FUND/VA
FINANCIAL HIGHLIGHTS Continued
| | | | | | | | | | | | | | | | | | | | |
| Service Shares | | Year Ended
December 31,
2015 | | | Year Ended
December 31,
2014 | | | Year Ended
December 31,
2013 | | | Year Ended
December 31,
2012 | | | Year Ended
December 30,
20111 | |
Per Share Operating Data | | | | | | | | | | | | | | | | | | | | |
Net asset value, beginning of period | | $ | 39.10 | | | $ | 40.47 | | | $ | 32.25 | | | $ | 27.21 | | | $ | 30.04 | |
Income (loss) from investment operations: | | | | | | | | | | | | | | | | | | | | |
Net investment income2 | | | 0.25 | | | | 0.40 | | | | 0.32 | | | | 0.36 | | | | 0.56 | |
Net realized and unrealized gain (loss) | | | 1.39 | | | | 0.44 | | | | 8.32 | | | | 5.25 | | | | (3.08) | |
Total from investment operations | | | 1.64 | | | | 0.84 | | | | 8.64 | | | | 5.61 | | | | (2.52) | |
Dividends and/or distributions to shareholders: | | | | | | | | | | | | | | | | | | | | |
Dividends from net investment income | | | (0.44) | | | | (0.35) | | | | (0.42) | | | | (0.57) | | | | (0.31) | |
Distributions from net realized gain | | | (2.71) | | | | (1.86) | | | | 0.00 | | | | 0.00 | | | | 0.00 | |
Total dividends and/or distributions to shareholders | | | (3.15) | | | | (2.21) | | | | (0.42) | | | | (0.57) | | | | (0.31) | |
Net asset value, end of period | | $ | 37.59 | | | $ | 39.10 | | | $ | 40.47 | | | $ | 32.25 | | | $ | 27.21 | |
| | | | |
| | | | |
| | | | |
| | | | | | | | | | | | | | | | | | | | |
| | | | |
Total Return, at Net Asset Value3 | | | 3.67% | | | | 2.06% | | | | 26.99% | | | | 20.95% | | | | (8.53)% | |
| | | | | | | | | | | | | | | | | | | | |
Ratios/Supplemental Data | | | | | | | | | | | | | | | | | | | | |
Net assets, end of period (in thousands) | | $ | 1,081,711 | | | $ | 1,204,379 | | | $ | 1,216,285 | | | $ | 1,130,388 | | | $ | 1,003,839 | |
Average net assets (in thousands) | | $ | 1,219,501 | | | $ | 1,265,528 | | | $ | 1,174,119 | | | $ | 1,069,295 | | | $ | 1,091,128 | |
Ratios to average net assets:4 | | | | | | | | | | | | | | | | | | | | |
Net investment income | | | 0.63% | | | | 0.99% | | | | 0.89% | | | | 1.23% | | | | 1.90% | |
Expenses excluding interest and fees from borrowings | | | 1.01% | | | | 1.01% | | | | 1.02% | | | | 1.01% | | | | 1.01% | |
Interest and fees from borrowings | | | 0.00%5 | | | | 0.00% | | | | 0.00% | | | | 0.00% | | | | 0.00% | |
Total expenses6 | | | 1.01% | | | | 1.01% | | | | 1.02% | | | | 1.01% | | | | 1.01% | |
Expenses after payments, waivers and/or reimbursements and reduction to custodian expenses | | | 1.01% | | | | 1.01% | | | | 1.02% | | | | 1.01% | | | | 1.01% | |
Portfolio turnover rate | | | 14% | | | | 13% | | | | 11% | | | | 14% | | | | 13% | |
1. December 30, 2011 represents the last business day of the Fund’s reporting period. See Note 2 of the accompanying Notes.
2. Per share amounts calculated based on the average shares outstanding during the period.
3. Assumes an initial investment on the business day before the first day of the fiscal period, with all dividends and distributions reinvested in additional shares on the reinvestment date, and redemption at the net asset value calculated on the last business day of the fiscal period. Total returns are not annualized for periods less than one full year. Total return information does not reflect expenses that apply at the separate account level or to related insurance products. Inclusion of these charges would reduce the total return figures for all periods shown. Returns do not reflect the deduction of taxes that a shareholder would pay on fund distributions or the redemption of fund shares.
4. Annualized for periods less than one full year.
5. Less than 0.005%.
6. Total expenses including indirect expenses from affiliated fund fees and expenses were as follows:
| | | | | | | | |
| | Year Ended December 31, 2015 | | | 1.01 | % | | |
| | Year Ended December 31, 2014 | | | 1.01 | % | | |
| | Year Ended December 31, 2013 | | | 1.03 | % | | |
| | Year Ended December 31, 2012 | | | 1.01 | % | | |
| | Year Ended December 30, 2011 | | | 1.01 | % | | |
See accompanying Notes to Financial Statements.
15 OPPENHEIMER GLOBAL FUND/VA
NOTES TO FINANCIAL STATEMENTS December 31, 2015
1. Organization
Oppenheimer Global Fund/VA (the “Fund”), a separate series of Oppenheimer Variable Account Funds, is a diversified open-end management investment company registered under the Investment Company Act of 1940 (“1940 Act”), as amended. The Fund’s investment objective is to seek capital appreciation. The Fund’s investment adviser is OFI Global Asset Management, Inc. (“OFI Global” or the “Manager”), a wholly-owned subsidiary of OppenheimerFunds, Inc. (“OFI” or the “Sub-Adviser”). The Manager has entered into a sub-advisory agreement with OFI. Shares of the Fund are sold only to separate accounts of life insurance companies.
The Fund offers two classes of shares. Both classes are sold at their offering price, which is the net asset value per share, to separate investment accounts of participating insurance companies as an underlying investment for variable life insurance policies, variable annuity contracts or other investment products. The class of shares designated as Service shares is subject to a distribution and service plan. Both classes of shares have identical rights and voting privileges with respect to the Fund in general and exclusive voting rights on matters that affect that class alone. Earnings, net assets and net asset value per share may differ due to each class having its own expenses, such as transfer and shareholder servicing agent fees and shareholder communications, directly attributable to that class.
The following is a summary of significant accounting policies followed in the Fund’s preparation of financial statements in accordance with accounting principles generally accepted in the United States (“U.S. GAAP”).
2. Significant Accounting Policies
Security Valuation. All investments in securities are recorded at their estimated fair value, as described in Note 3.
Reporting Period End Date. The last day of the Fund’s reporting period is the last day the New York Stock Exchange was open for trading during the period. The Fund’s financial statements have been presented through that date to maintain consistency with the Fund’s net asset value calculations used for shareholder transactions.
Foreign Currency Translation. The Fund’s accounting records are maintained in U.S. dollars. The values of securities denominated in foreign currencies and amounts related to the purchase and sale of foreign securities and foreign investment income are translated into U.S. dollars as of the close of the New York Stock Exchange (the “Exchange”), normally 4:00 P.M. Eastern time, on each day the Exchange is open for trading. Foreign exchange rates may be valued primarily using a reliable bank, dealer or service authorized by the Board of Trustees.
Reported net realized gains and losses from foreign currency transactions arise from sales of portfolio securities, sales and maturities of short-term securities, sales of foreign currencies, exchange rate fluctuations between the trade and settlement dates on securities transactions, and the difference between the amounts of dividends, interest, and foreign withholding taxes recorded on the Fund’s books and the U.S. dollar equivalent of the amounts actually received or paid. Net unrealized appreciation and depreciation on the translation of assets and liabilities denominated in foreign currencies arise from changes in the values of assets and liabilities, including investments in securities at fiscal period end, resulting from changes in exchange rates.
The effect of changes in foreign currency exchange rates on investments is separately identified from the fluctuations arising from changes in market values of securities held and reported with all other foreign currency gains and losses in the Fund’s Statement of Operations.
Allocation of Income, Expenses, Gains and Losses. Income, expenses (other than those attributable to a specific class), gains and losses are allocated on a daily basis to each class of shares based upon the relative proportion of net assets represented by such class. Operating expenses directly attributable to a specific class are charged against the operations of that class.
Dividends and Distributions to Shareholders. Dividends and distributions to shareholders, which are determined in accordance with income tax regulations and may differ from U.S. GAAP, are recorded on the ex-dividend date. Income and capital gain distributions, if any, are declared and paid annually or at other times as deemed necessary by the Manager.
Investment Income. Dividend income is recorded on the ex-dividend date or upon ex-dividend notification in the case of certain foreign dividends where the ex-dividend date may have passed. Non-cash dividends included in dividend income, if any, are recorded at the fair market value of the securities received. Interest income is recognized on an accrual basis. Discount and premium, which are included in interest income on the Statement of Operations, are amortized or accreted daily.
Custodian Fees. “Custodian fees and expenses” in the Statement of Operations may include interest expense incurred by the Fund on any cash overdrafts of its custodian account during the period. Such cash overdrafts may result from the effects of failed trades in portfolio securities and from cash outflows resulting from unanticipated shareholder redemption activity. The Fund pays interest to its custodian on such cash overdrafts, to the extent they are not offset by positive cash balances maintained by the Fund, at a rate equal to the Federal Funds Rate plus 0.50%. The “Reduction to custodian expenses” line item, if applicable, represents earnings on cash balances maintained by the Fund during the period. Such interest expense and other custodian fees may be paid with these earnings.
Security Transactions. Security transactions are recorded on the trade date. Realized gains and losses on securities sold are determined on the basis of identified cost.
Indemnifications. The Fund’s organizational documents provide current and former Trustees and officers with a limited indemnification against liabilities arising in connection with the performance of their duties to the Fund. In the normal course of business, the Fund may also enter into contracts
16 OPPENHEIMER GLOBAL FUND/VA
2. Significant Accounting Policies (Continued)
that provide general indemnifications. The Fund’s maximum exposure under these arrangements is unknown as this would be dependent on future claims that may be made against the Fund. The risk of material loss from such claims is considered remote.
Federal Taxes. The Fund intends to comply with provisions of the Internal Revenue Code applicable to regulated investment companies and to distribute substantially all of its investment company taxable income, including any net realized gain on investments not offset by capital loss carryforwards, if any, to shareholders. Therefore, no federal income or excise tax provision is required. The Fund files income tax returns in U.S. federal and applicable state jurisdictions. The statute of limitations on the Fund’s tax return filings generally remains open for the three preceding fiscal reporting period ends.
The tax components of capital shown in the following table represent distribution requirements the Fund must satisfy under the income tax regulations, losses the Fund may be able to offset against income and gains realized in future years and unrealized appreciation or depreciation of securities and other investments for federal income tax purposes.
| | | | | | | | | | | | |
Undistributed Net Investment Income | | Undistributed
Long-Term
Gain | | | Accumulated
Loss
Carryforward | | | Net Unrealized
Appreciation
Based on cost of
Securities and
Other Investments
for Federal Income
Tax Purposes | |
$24,147,520 | | | $148,392,604 | | | | $— | | | | $1,041,592,062 | |
Net investment income (loss) and net realized gain (loss) may differ for financial statement and tax purposes. The character of dividends and distributions made during the fiscal year from net investment income or net realized gains are determined in accordance with federal income tax requirements, which may differ from the character of net investment income or net realized gains presented in those financial statements in accordance with U.S. GAAP. Also, due to timing of dividends and distributions, the fiscal year in which amounts are distributed may differ from the fiscal year in which the income or net realized gain was recorded by the Fund.
Accordingly, the following amounts have been reclassified for the reporting period. Net assets of the Fund were unaffected by the reclassifications.
| | | | | | | | |
Increase to Paid-in Capital | | Increase to Accumulated
Net Investment
Income | | | Reduction to Accumulated Net
Realized Gain on Investments1 | |
$20,324,043 | | | $115,220 | | | | $20,439,263 | |
1. $20,324,043, including $19,912,523 of long-term capital gain, was distributed in connection with Fund share redemptions.
The tax character of distributions paid during the reporting periods:
| | | | | | | | |
| | | Year Ended
December 31, 2015 | | | Year Ended
December 31, 2014 | |
Distributions paid from: | | | | | | | | |
Ordinary income | | $ | 32,867,327 | | | $ | 27,878,729 | |
Long-term capital gain | | | 179,489,311 | | | | 126,689,772 | |
| | | | |
Total | | $ | 212,356,638 | | | $ | 154,568,501 | |
| | | | |
The aggregate cost of securities and other investments and the composition of unrealized appreciation and depreciation of securities and other investments for federal income tax purposes at period end are noted in the following table. The primary difference between book and tax appreciation or depreciation of securities and other investments, if applicable, is attributable to the tax deferral of losses or tax realization of financial statement unrealized gain or loss.
| | | | |
Federal tax cost of securities | | $ | 1,443,309,462 | |
| | | | |
Gross unrealized appreciation | | $ | 1,183,263,170 | |
Gross unrealized depreciation | | | (141,671,108) | |
| | | | |
Net unrealized appreciation | | $ | 1,041,592,062 | |
| | | | |
Certain foreign countries impose a tax on capital gains which is accrued by the Fund based on unrealized appreciation, if any, on affected securities. The tax is paid when the gain is realized.
Use of Estimates. The preparation of financial statements in conformity with U.S. GAAP requires management to make estimates and assumptions that affect the reported amounts of assets and liabilities and disclosure of contingent assets and liabilities at the date of the financial statements and the reported amounts of increases and decreases in net assets from operations during the reporting period. Actual results could differ from those estimates.
17 OPPENHEIMER GLOBAL FUND/VA
|
NOTES TO FINANCIAL STATEMENTS Continued |
3. Securities Valuation
The Fund calculates the net asset value of its shares as of the close of the New York Stock Exchange (the “Exchange”), normally 4:00 P.M. Eastern time, on each day the Exchange is open for trading, except in the case of a scheduled early closing of the Exchange, in which case the Fund will calculate net asset value of the shares as of the scheduled early closing time of the Exchange.
The Fund’s Board has adopted procedures for the valuation of the Fund’s securities and has delegated the day-to-day responsibility for valuation determinations under those procedures to the Manager. The Manager has established a Valuation Committee which is responsible for determining a “fair valuation” for any security for which market quotations are not “readily available.” The Valuation Committee’s fair valuation determinations are subject to review, approval and ratification by the Fund’s Board at its next regularly scheduled meeting covering the calendar quarter in which the fair valuation was determined.
Valuation Methods and Inputs
Securities are valued using unadjusted quoted market prices, when available, as supplied primarily by third party pricing services or dealers.
The following methodologies are used to determine the market value or the fair value of the types of securities described below:
Securities traded on a registered U.S. securities exchange (including exchange-traded derivatives other than futures and futures options) are valued based on the last sale price of the security reported on the principal exchange on which it is traded, prior to the time when the Fund’s assets are valued. In the absence of a sale, the security is valued at the mean between the bid and asked price on the principal exchange or, if not available from the principal exchange, obtained from two dealers. If bid and asked prices are not available from either the exchange or two dealers, the security is valued by using one of the following methodologies (listed in order of priority): (1) a bid from the principal exchange, (2) the mean between the bid and asked price as provided by a single dealer, or (3) a bid from a single dealer. A security of a foreign issuer traded on a foreign exchange, but not listed on a registered U.S. securities exchange, is valued based on the last sale price on the principal exchange on which the security is traded, as identified by the third party pricing service used by the Manager, prior to the time when the Fund’s assets are valued. If the last sale price is unavailable, the security is valued at the most recent official closing price on the principal exchange on which it is traded. If the last sales price or official closing price for a foreign security is not available, the security is valued at the mean between the bid and asked price per the exchange or, if not available from the exchange, obtained from two dealers. If bid and asked prices are not available from either the exchange or two dealers, the security is valued by using one of the following methodologies (listed in order of priority): (1) a bid from the exchange, (2) the mean between the bid and asked price as provided by a single dealer, or (3) a bid from a single dealer.
Shares of a registered investment company that are not traded on an exchange are valued at that investment company’s net asset value per share.
Corporate and government debt securities (of U.S. or foreign issuers) and municipal debt securities, event-linked bonds, loans, mortgage-backed securities, collateralized mortgage obligations, and asset-backed securities are valued at the mean between the “bid” and “asked” prices utilizing evaluated prices obtained from third party pricing services or broker-dealers who may use matrix pricing methods to determine the evaluated prices.
Short-term money market type debt securities with a remaining maturity of sixty days or less are valued at cost adjusted by the amortization of discount or premium to maturity (amortized cost), which approximates market value. Short-term debt securities with a remaining maturity in excess of sixty days are valued at the mean between the “bid” and “asked” prices utilizing evaluated prices obtained from third party pricing services or broker-dealers.
A description of the standard inputs that may generally be considered by the third party pricing vendors in determining their evaluated prices is provided below.
| | |
| Security Type | | Standard inputs generally considered by third-party pricing vendors |
| Corporate debt, government debt, municipal, mortgage- backed and asset-backed securities | | Reported trade data, broker-dealer price quotations, benchmark yields, issuer spreads on comparable securities, the credit quality, yield, maturity, and other appropriate factors. |
| Loans | | Information obtained from market participants regarding reported trade data and broker-dealer price quotations. |
Event-linked bonds | | Information obtained from market participants regarding reported trade data and broker-dealer price quotations. |
If a market value or price cannot be determined for a security using the methodologies described above, or if, in the “good faith” opinion of the Manager, the market value or price obtained does not constitute a “readily available market quotation,” or a significant event has occurred that would materially affect the value of the security, the security is fair valued either (i) by a standardized fair valuation methodology applicable to the security type or the significant event as previously approved by the Valuation Committee and the Fund’s Board or (ii) as determined in good faith by the Manager’s Valuation Committee. The Valuation Committee considers all relevant facts that are reasonably available, through either public information or information available to the Manager, when determining the fair value of a security. Fair value determinations by the Manager are subject to review, approval and ratification by the Fund’s Board at its next regularly scheduled meeting covering the calendar quarter in which the fair valuation was determined. Those fair valuation standardized methodologies include, but are not limited to, valuing securities at the last sale price or initially at cost and subsequently adjusting the value based on: changes in company specific fundamentals, changes in an appropriate securities index, or changes in the value of similar securities which may be further adjusted for any discounts related to security-specific resale restrictions. When possible, such methodologies use observable market inputs such as unadjusted quoted prices of similar securities, observable interest rates, currency rates and yield curves. The methodologies used for valuing securities are not necessarily an indication of the risks associated with investing in those securities nor can it be assured that the Fund can obtain the fair value assigned to a security if it were to sell the security.
To assess the continuing appropriateness of security valuations, the Manager, or its third party service provider who is subject to oversight by the Manager, regularly compares prior day prices, prices on comparable securities, and sale prices to the current day prices and challenges those prices
18 OPPENHEIMER GLOBAL FUND/VA
3. Securities Valuation (Continued)
exceeding certain tolerance levels with the third party pricing service or broker source. For those securities valued by fair valuations, whether through a standardized fair valuation methodology or a fair valuation determination, the Valuation Committee reviews and affirms the reasonableness of the valuations based on such methodologies and fair valuation determinations on a regular basis after considering all relevant information that is reasonably available.
Classifications
Each investment asset or liability of the Fund is assigned a level at measurement date based on the significance and source of the inputs to its valuation. Various data inputs are used in determining the value of each of the Fund’s investments as of the reporting period end. These data inputs are categorized in the following hierarchy under applicable financial accounting standards:
1) Level 1-unadjusted quoted prices in active markets for identical assets or liabilities (including securities actively traded on a securities exchange)
2) Level 2-inputs other than unadjusted quoted prices that are observable for the asset or liability (such as unadjusted quoted prices for similar assets and market corroborated inputs such as interest rates, prepayment speeds, credit risks, etc.)
3) Level 3-significant unobservable inputs (including the Manager’s own judgments about assumptions that market participants would use in pricing the asset or liability).
The inputs used for valuing securities are not necessarily an indication of the risks associated with investing in those securities.
The table below categorizes amounts that are included in the Fund’s Statement of Assets and Liabilities at period end based on valuation input level:
| | | | | | | | | | | | | | | | |
| | | Level 1— Unadjusted Quoted Prices | | | Level 2— Other Significant
Observable Inputs | | | Level 3—
Significant
Unobservable
Inputs | | | Value | |
Assets Table | | | | | | | | | | | | | | | | |
Investments, at Value: | | | | | | | | | | | | | | | | |
Common Stocks | | | | | | | | | | | | | | | | |
Consumer Discretionary | | $ | 135,699,081 | | | $ | 180,563,167 | | | $ | — | | | $ | 316,262,248 | |
Consumer Staples | | | 67,516,881 | | | | 69,927,302 | | | | — | | | | 137,444,183 | |
Energy | | | — | | | | 29,203,040 | | | | — | | | | 29,203,040 | |
Financials | | | 206,066,972 | | | | 340,944,377 | | | | — | | | | 547,011,349 | |
Health Care | | | 331,575,488 | | | | 96,614,464 | | | | — | | | | 428,189,952 | |
Industrials | | | 102,794,441 | | | | 182,993,473 | | | | — | | | | 285,787,914 | |
Information Technology | | | 401,781,584 | | | | 213,518,320 | | | | — | | | | 615,299,904 | |
Materials | | | — | | | | 19,746,225 | | | | — | | | | 19,746,225 | |
Telecommunication Services | | | — | | | | 38,843,395 | | | | — | | | | 38,843,395 | |
Preferred Stocks | | | 1,078,178 | | | | 45,632,183 | | | | — | | | | 46,710,361 | |
Rights, Warrants and Certificates | | | — | | | | 534,508 | | | | — | | | | 534,508 | |
Investment Company | | | 20,379,539 | | | | — | | | | — | | | | 20,379,539 | |
Total Assets | | $ | 1,266,892,164 | | | $ | 1,218,520,454 | | | $ | — | | | $ | 2,485,412,618 | |
Forward currency exchange contracts and futures contracts, if any, are reported at their unrealized appreciation/depreciation at measurement date, which represents the change in the contract’s value from trade date. All additional assets and liabilities included in the above table are reported at their market value at measurement date.
The table below shows the transfers between Level 1 and Level 2. The Fund’s policy is to recognize transfers in and transfers out as of the beginning of the reporting period.
| | | | | | | | |
| | | Transfers out of Level 1* | | | Transfers into Level 2* | |
Assets Table | | | | | | | | |
Investments, at Value: | | | | | | | | |
Common Stocks | | | | | | | | |
Financials | | $ | (47,359,051 | ) | | $ | 47,359,051 | |
| | | | |
Total Assets | | $ | (47,359,051 | ) | | $ | 47,359,051 | |
| | | | |
*Transfers from Level 1 to Level 2 are a result of a change from the use of an exchange traded price to a valuation received from a third-party pricing service or a fair valuation determined based on observable market information other than quoted prices from an active market
4. Investments and Risks
Risks of Foreign Investing. The Fund may invest in foreign securities which are subject to special risks. Securities traded in foreign markets may be less liquid and more volatile than those traded in U.S. markets. Foreign issuers are usually not subject to the same accounting and disclosure requirements that U.S. companies are subject to, which may make it difficult for the Fund to evaluate a foreign company’s operations or financial condition. A change in the value of a foreign currency against the U.S. dollar will result in a change in the U.S. dollar value of investments denominated in that foreign currency and in the value of any income or distributions the Fund may receive on those investments. The value of foreign investments may be affected by exchange control regulations, foreign taxes, higher transaction and other costs, delays in the settlement of transactions, changes in economic or monetary policy in the United States or abroad, expropriation or nationalization of a company’s assets, or other political and economic factors. In addition, due to the inter-relationship of global economies and financial markets, changes in political and economic factors in one country or
19 OPPENHEIMER GLOBAL FUND/VA
|
NOTES TO FINANCIAL STATEMENTS Continued |
4. Investments and Risks (Continued)
region could adversely affect conditions in another country or region. Investments in foreign securities may also expose the Fund to time-zone arbitrage risk. Foreign securities may trade on weekends or other days when the Fund does not price its shares. At times, the Fund may emphasize investments in a particular country or region and may be subject to greater risks from adverse events that occur in that country or region. Foreign securities and foreign currencies held in foreign banks and securities depositories may be subject to limited or no regulatory oversight.
Investments in Affiliated Funds. The Fund is permitted to invest in other mutual funds advised by the Manager (“Affiliated Funds”). Affiliated Funds are open-end management investment companies registered under the 1940 Act, as amended. The Manager is the investment adviser of, and the Sub-Adviser provides investment and related advisory services to, the Affiliated Funds. When applicable, the Fund’s investments in Affiliated Funds are included in the Statement of Investments. Shares of Affiliated Funds are valued at their net asset value per share. As a shareholder, the Fund is subject to its proportional share of the Affiliated Funds’ expenses, including their management fee. The Manager will waive fees and/or reimburse Fund expenses in an amount equal to the indirect management fees incurred through the Fund’s investment in the Affiliated Funds.
Each of the Affiliated Funds in which the Fund invests has its own investment risks, and those risks can affect the value of the Fund’s investments and therefore the value of the Fund’s shares. To the extent that the Fund invests more of its assets in one Affiliated Fund than in another, the Fund will have greater exposure to the risks of that Affiliated Fund.
Investment in Oppenheimer Institutional Money Market Fund. The Fund is permitted to invest daily available cash balances in a money market Affiliated Fund. The Fund may invest the available cash in Class E shares of Oppenheimer Institutional Money Market Fund (“IMMF”) to seek current income while preserving liquidity or for defensive purposes. IMMF is regulated as a money market fund under the Investment Company Act of 1940, as amended.
Equity Security Risk. Stocks and other equity securities fluctuate in price. The value of the Fund’s portfolio may be affected by changes in the equity markets generally. Equity markets may experience significant short-term volatility and may fall sharply at times. Different markets may behave differently from each other and U.S. equity markets may move in the opposite direction from one or more foreign stock markets. Adverse events in any part of the equity or fixed-income markets may have unexpected negative effects on other market segments.
The prices of individual equity securities generally do not all move in the same direction at the same time and a variety of factors can affect the price of a particular company’s securities. These factors may include, but are not limited to, poor earnings reports, a loss of customers, litigation against the company, general unfavorable performance of the company’s sector or industry, or changes in government regulations affecting the company or its industry.
5. Market Risk Factors
The Fund’s investments in securities and/or financial derivatives may expose the fund to various market risk factors:
Commodity Risk. Commodity risk relates to the change in value of commodities or commodity indexes as they relate to increases or decreases in the commodities market. Commodities are physical assets that have tangible properties. Examples of these types of assets are crude oil, heating oil, metals, livestock, and agricultural products.
Credit Risk. Credit risk relates to the ability of the issuer of debt to meet interest and principal payments, or both, as they come due. In general, lower-grade, higher-yield debt securities are subject to credit risk to a greater extent than lower-yield, higher-quality securities.
Equity Risk. Equity risk relates to the change in value of equity securities as they relate to increases or decreases in the general market.
Foreign Exchange Rate Risk. Foreign exchange rate risk relates to the change in the U.S. dollar value of a security held that is denominated in a foreign currency. The U.S. dollar value of a foreign currency denominated security will decrease as the dollar appreciates against the currency, while the U.S. dollar value will increase as the dollar depreciates against the currency.
Interest Rate Risk. Interest rate risk refers to the fluctuations in value of fixed-income securities resulting from the inverse relationship between price and yield. For example, an increase in general interest rates will tend to reduce the market value of already issued fixed-income investments, and a decline in general interest rates will tend to increase their value. In addition, debt securities with longer maturities, which tend to have higher yields, are subject to potentially greater fluctuations in value from changes in interest rates than obligations with shorter maturities.
Volatility Risk. Volatility risk refers to the magnitude of the movement, but not the direction of the movement, in a financial instrument’s price over a defined time period. Large increases or decreases in a financial instrument’s price over a relative time period typically indicate greater volatility risk, while small increases or decreases in its price typically indicate lower volatility risk.
6. Shares of Beneficial Interest
The Fund has authorized an unlimited number of $0.001 par value shares of beneficial interest of each class. Transactions in shares of beneficial interest were as follows:
20 OPPENHEIMER GLOBAL FUND/VA
6. Shares of Beneficial Interest (Continued)
| | | | | | | | | | | | | | | | |
| | | Year Ended December 31, 2015 | | | Year Ended December 31, 2014 | |
| | | Shares | | | Amount | | | Shares | | | Amount | |
Non-Service Shares | | | | | | | | | | | | | | | | |
Sold | | | 3,090,155 | | | $ | 125,761,536 | | | | 6,078,139 | | | $ | 247,743,232 | |
Dividends and/or distributions reinvested | | | 2,891,830 | | | | 117,090,196 | | | | 2,154,167 | | | | 85,951,245 | |
Redeemed | | | (6,149,839) | | | | (247,312,901) | | | | (9,920,341) | | | | (403,893,999)1 | |
| | | | |
Net decrease | | | (167,854) | | | $ | (4,461,169) | | | | (1,688,035) | | | $ | (70,199,522) | |
| | | | | | | | | | | | | | | | | |
Service Shares | | | | | | | | | | | | | | | | |
Sold | | | 5,612,447 | | | $ | 223,502,452 | | | | 6,195,494 | | | $ | 248,008,573 | |
Dividends and/or distributions reinvested | | | 2,375,130 | | | | 95,266,442 | | | | 1,734,511 | | | | 68,617,256 | |
Redeemed | | | (10,010,458) | | | | (388,323,919) | | | | (9,552,933) | | | | (377,582,700)1 | |
| | | | |
Net decrease | | | (2,022,881) | | | $ | (69,555,025) | | | | (1,622,928) | | | $ | (60,956,871) | |
| | | | |
1. Net of redemption fees of $1,517 and $1,367 for Non-Service and Service shares, respectively.
7. Purchases and Sales of Securities
The aggregate cost of purchases and proceeds from sales of securities, other than short-term obligations and investments in IMMF, for the reporting period were as follows:
| | | | | | | | |
| | | Purchases | | | Sales | |
Investment securities | | $ | 367,703,497 | | | $ | 639,786,392 | |
8. Fees and Other Transactions with Affiliates
Management Fees. Under the investment advisory agreement, the Fund pays the Manager a management fee based on the daily net assets of the Fund at an annual rate as shown in the following table:
| | | | |
| Fee Schedule | | | |
Up to $200 million | | | 0.75 | % |
Next $200 million | | | 0.72 | |
Next $200 million | | | 0.69 | |
Next $200 million | | | 0.66 | |
Next $4.2 billion | | | 0.60 | |
Over $5 billion | | | 0.58 | |
The Fund’s effective management fee for the reporting period was 0.63% of average annual net assets before any applicable waivers.
Sub-Adviser Fees. The Manager has retained the Sub-Adviser to provide the day-to-day portfolio management of the Fund. Under the Sub-Advisory Agreement, the Manager pays the Sub-Adviser an annual fee in monthly installments, equal to a percentage of the investment management fee collected by the Manager from the Fund, which shall be calculated after any investment management fee waivers. The fee paid to the Sub-Adviser is paid by the Manager, not by the Fund.
Transfer Agent Fees. OFI Global (the “Transfer Agent”) serves as the transfer and shareholder servicing agent for the Fund. The Fund pays the Transfer Agent a fee based on annual net assets. Fees incurred and average net assets for each class with respect to these services are detailed in the Statement of Operations and Financial Highlights, respectively.
Sub-Transfer Agent Fees. The Transfer Agent has retained Shareholder Services, Inc., a wholly-owned subsidiary of OFI (the “Sub-Transfer Agent”), to provide the day-to-day transfer agent and shareholder servicing of the Fund. Under the Sub-Transfer Agency Agreement, the Transfer Agent pays the Sub-Transfer Agent an annual fee in monthly installments, equal to a percentage of the transfer agent fee collected by the Transfer Agent from the Fund, which shall be calculated after any applicable fee waivers. The fee paid to the Sub-Transfer Agent is paid by the Transfer Agent, not by the Fund.
Trustees’ Compensation. The Fund’s Board of Trustees (“Board”) has adopted a compensation deferral plan for Independent Trustees that enables Trustees to elect to defer receipt of all or a portion of the annual compensation they are entitled to receive from the Fund. For purposes of determining the amount owed to the Trustees under the plan, deferred amounts are treated as though equal dollar amounts had been invested in shares of the Fund or in other Oppenheimer funds selected by the Trustees. The Fund purchases shares of the funds selected for deferral by the Trustees in amounts equal to his or her deemed investment, resulting in a Fund asset equal to the deferred compensation liability. Such assets are included as a component of “Other” within the asset section of the Statement of Assets and Liabilities. Deferral of Trustees’ fees under the plan will not affect the net assets of the Fund and will not materially affect the Fund’s assets, liabilities or net investment income per share. Amounts will be deferred until distributed in accordance with the compensation deferral plan.
Distribution and Service Plan for Service Shares. The Fund has adopted a Distribution and Service Plan (the “Plan”) pursuant to Rule 12b-1 under the 1940 Act for Service shares to pay OppenheimerFunds Distributor, Inc. (the “Distributor”), for distribution related services, personal service and
21 OPPENHEIMER GLOBAL FUND/VA
|
NOTES TO FINANCIAL STATEMENTS Continued |
8. Fees and Other Transactions with Affiliates (Continued)
account maintenance for the Fund’s Service shares. Under the Plan, payments are made periodically at an annual rate of 0.25% of the daily net assets of Service shares of the Fund. The Distributor currently uses all of those fees to compensate sponsors of the insurance product that offers Fund shares, for providing personal service and maintenance of accounts of their variable contract owners that hold Service shares. These fees are paid out of the Fund’s assets on an on-going basis and increase operating expenses of the Service shares, which results in lower performance compared to the Fund’s shares that are not subject to a service fee. Fees incurred by the Fund under the Plan are detailed in the Statement of Operations.
Waivers and Reimbursements of Expenses. The Manager has contractually agreed to limit the Fund’s expenses after payments, waivers and/or reimbursements and reduction to custodian expenses, excluding expenses incurred directly or indirectly by the Fund as a result of investments in other investment companies, wholly-owned subsidiaries and pooled investment vehicles; so that those expenses, as percentages of daily net assets, will not exceed the annual rate of 1.00% for Non-Service shares and 1.25% for Service shares. The expense limitations do not include interest and fees from borrowing, and other expenses not incurred in the ordinary course of the Fund’s business.
The Manager will waive fees and/or reimburse Fund expenses in an amount equal to the indirect management fees incurred through the Fund’s investment in IMMF. During the reporting period, the Manager waived fees and/or reimbursed the Fund $25,889 for IMMF management fees.
Waivers and/or reimbursements may be modified or terminated as set forth according to the terms in the prospectus.
9. Borrowings and Other Financing
Joint Credit Facility. A number of mutual funds managed by the Manager participate in a $1.28 billion revolving credit facility (the “Facility”) intended to provide short-term financing, if necessary, subject to certain restrictions in connection with atypical redemption activity. Expenses and fees related to the Facility are paid by the participating funds and are disclosed separately or as other expenses on the Statement of Operations. The Fund did not utilize the Facility during the reporting period.
Securities Lending. The Fund lends portfolio securities from time to time in order to earn additional income in the form of fees, or interest on cash or securities received as collateral. The loans are secured by collateral (either securities, letters of credit, or cash) in an amount of at least 102% of the market value of the loaned U.S. securities, and at least 105% of the market value of loaned foreign securities during the period of the loan. The market value of the loaned securities is determined at the close of each business day and any additional required collateral is delivered to the Fund on the next business day. If the borrower defaults on its obligation to return the securities loaned because of insolvency or other reasons, the Fund could experience delays and cost in recovering the securities loaned or in gaining access to the collateral. The Fund continues to receive the economic benefit of interest or dividends paid on the securities loaned in the form of a substitute payment received from the borrower and recognizes the change in the fair value of the securities loaned that may occur during the term of the loan. The Fund has the right under the lending agreement to recover the securities from the borrower on demand. At period end, the Fund had no securities on loan.
10. Pending Litigation
In 2009, several putative class action lawsuits were filed and later consolidated before the U.S. District Court for the District of Colorado against OppenheimerFunds, Inc. (“OFI”), OppenheimerFunds Distributor, Inc. (“OFDI”), and Oppenheimer Rochester California Municipal Fund, a fund advised by OFI Global Asset Management, Inc. and distributed by the Distributor (the “California Fund”), in connection with the California Fund’s investment performance. The plaintiffs asserted claims against OFI, OFDI and certain present and former trustees and officers of the California Fund under the federal securities laws, alleging, among other things, that the disclosure documents of the California Fund contained misrepresentations and omissions and the investment policies of the California Fund were not followed. Plaintiffs in the suit filed an amended complaint and defendants filed a motion to dismiss. In 2011, the court issued an order which granted in part and denied in part the defendants’ motion to dismiss. In 2012, plaintiffs filed a motion, which defendants opposed, to certify a class and appoint class representatives and class counsel. In March 2015, the court granted plaintiffs’ motion for class certification. In May 2015, the U.S. Court of Appeals for the Tenth Circuit vacated the class certification order and remanded the matter to the district court for further proceedings. In October 2015, the district court reaffirmed its order and determined that the suit will proceed as a class action. In December 2015, the Tenth Circuit denied defendants’ petition to appeal the district court’s reaffirmed class certification order.
OFI and OFDI believe the suit is without merit; that it is premature to render any opinion as to the likelihood of an outcome unfavorable to them in the suit; and that no estimate can yet be made as to the amount or range of any potential loss. Furthermore, OFI believes that the suit should not impair the ability of OFI or OFDI to perform their respective duties to the Fund and that the outcome of the suit should not have any material effect on the operations of any of the Oppenheimer funds.
22 OPPENHEIMER GLOBAL FUND/VA
|
| REPORT OF INDEPENDENT REGISTERED PUBLIC ACCOUNTING FIRM |
The Board of Trustees and Shareholders of Oppenheimer Variable Account Funds:
We have audited the accompanying statement of assets and liabilities of Oppenheimer Global Fund/VA (a separate series of Oppenheimer Variable Account Funds), including the statement of investments, as of December 31, 2015, and the related statement of operations for the year then ended, the statements of changes in net assets for each of the years in the two-year period then ended, and the financial highlights for each of the years in the five-year period then ended. These financial statements and financial highlights are the responsibility of the Fund’s management. Our responsibility is to express an opinion on these financial statements and financial highlights based on our audits.
We conducted our audits in accordance with the standards of the Public Company Accounting Oversight Board (United States). Those standards require that we plan and perform the audit to obtain reasonable assurance about whether the financial statements and financial highlights are free of material misstatement. An audit includes examining, on a test basis, evidence supporting the amounts and disclosures in the financial statements. Our procedures included confirmation of securities owned as of December 31, 2015, by correspondence with the custodian and transfer agent. An audit also includes assessing the accounting principles used and significant estimates made by management, as well as evaluating the overall financial statement presentation. We believe that our audits provide a reasonable basis for our opinion.
In our opinion, the financial statements and financial highlights referred to above present fairly, in all material respects, the financial position of Oppenheimer Global Fund/VA as of December 31, 2015, the results of its operations for the year then ended, the changes in its net assets for each of the years in the two-year period then ended, and the financial highlights for each of the years in the five-year period then ended, in conformity with U.S. generally accepted accounting principles.
KPMG LLP
Denver, Colorado
February 12, 2016
23 OPPENHEIMER GLOBAL FUND/VA
|
FEDERAL INCOME TAX INFORMATION Unaudited |
In early 2016, if applicable, shareholders of record received information regarding all dividends and distributions paid to them by the Fund during calendar year 2015.
Capital gain distributions of $2.71395 per share were paid to Non-Service and Service shareholders, respectively, on June 16, 2015. Whether received in stock or in cash, the capital gain distribution should be treated by shareholders as a gain from the sale of the capital assets held for more than one year (long-term capital gains).
Dividends, if any, paid by the Fund during the reporting period which are not designated as capital gain distributions should be multiplied by the maximum amount allowable but not less than 48.40% to arrive at the amount eligible for the corporate dividend-received deduction.
The Fund has elected the application of Section 853 of the Internal Revenue Code to permit shareholders to take a federal income tax credit or deduction, at their option, on a per share basis. The maximum amount allowable but not less than $3,402,729 of foreign income taxes were paid by the Fund during the reporting period. A separate notice will be mailed to each shareholder, which will reflect the proportionate share of such foreign taxes which must be treated by shareholders as gross income for federal income tax purposes.
Gross income of the maximum amount allowable but not less than $19,601,167 was derived from sources within foreign countries or possessions of the United States.
The foregoing information is presented to assist shareholders in reporting distributions received from the Fund to the Internal Revenue Service. Because of the complexity of the federal regulations which may affect your individual tax return and the many variations in state and local tax regulations, we recommend that you consult your tax advisor for specific guidance.
24 OPPENHEIMER GLOBAL FUND/VA
BOARD APPROVAL OF THE FUND’S INVESTMENT ADVISORY AND SUB-ADVISORY AGREEMENTS Unaudited
The Fund has entered into an investment advisory agreement with OFI Global Asset Management, Inc. (“OFI Global” or the “Adviser”), a wholly-owned subsidiary of OppenheimerFunds, Inc. (“OFI” or the “Sub-Adviser”) (“OFI Global” and “OFI” together the “Managers”) and OFI Global has entered into a sub-advisory agreement with OFI whereby OFI provides investment sub-advisory services to the Fund (collectively, the “Agreements”). Each year, the Board of Trustees (the “Board”), including a majority of the independent Trustees, is required to determine whether to approve the terms of the Agreements and the renewal thereof. The Investment Company Act of 1940, as amended, requires that the Board request and evaluate, and that the Managers provide, such information as may be reasonably necessary to evaluate the terms of the Agreements. The Board employs an independent consultant to prepare a report that provides information, including comparative information that the Board requests for that purpose. In addition to in-person meetings focused on this evaluation, the Board receives information throughout the year regarding Fund services, fees, expenses and performance.
The Adviser, Sub-Adviser and the independent consultant provided information to the Board on the following factors: (i) the nature, quality and extent of the Managers’ services, (ii) the comparative investment performance of the Fund and the Managers, (iii) the fees and expenses of the Fund, including comparative fee and expense information, (iv) the profitability of the Managers and their affiliates, including an analysis of the cost of providing services, (v) whether economies of scale are realized as the Fund grows and whether fee levels reflect these economies of scale for Fund investors and (vi) other benefits to the Managers from their relationship with the Fund. The Board was aware that there are alternatives to retaining the Managers.
Outlined below is a summary of the principal information considered by the Board as well as the Board’s conclusions.
Nature, Quality and Extent of Services. The Board considered information about the nature, quality and extent of the services provided to the Fund and information regarding the Managers’ key personnel who provide such services. The Managers’ duties include providing the Fund with the services of the portfolio manager and the Sub-Adviser’s investment team, who provide research, analysis and other advisory services in regard to the Fund’s investments; and securities trading services. OFI Global is responsible for oversight of third-party service providers; monitoring compliance with applicable Fund policies and procedures and adherence to the Fund’s investment restrictions; risk management; and oversight of the Sub-Adviser. OFI Global is also responsible for providing certain administrative services to the Fund as well. Those services include providing and supervising all administrative and clerical personnel who are necessary in order to provide effective corporate administration for the Fund; compiling and maintaining records with respect to the Fund’s operations; preparing and filing reports required by the U.S. Securities and Exchange Commission; preparing periodic reports regarding the operations of the Fund for its shareholders; preparing proxy materials for shareholder meetings; and preparing the registration statements required by federal and state securities laws for the sale of the Fund’s shares. OFI Global also provides the Fund with office space, facilities and equipment.
The Board also considered the quality of the services provided and the quality of the Managers’ resources that are available to the Fund. The Board took account of the fact that the Sub-Adviser has had over fifty years of experience as an investment adviser and that its assets under management rank it among the top mutual fund managers in the United States. The Board evaluated the Managers’ advisory, administrative, accounting, legal, compliance services and risk management, and information the Board has received regarding the experience and professional qualifications of the Managers’ key personnel and the size and functions of its staff. In its evaluation of the quality of the portfolio management services provided, the Board considered the experience of Rajeev Bhaman, the portfolio manager for the Fund, and the Sub-Adviser’s investment team and analysts. The Board members also considered the totality of their experiences with the Managers as directors or trustees of the Fund and other funds advised by the Managers. The Board considered information regarding the quality of services provided by affiliates of the Managers, which the Board members have become knowledgeable about through their experiences with the Managers and in connection with the renewal of the Fund’s service agreements. The Board concluded, in light of the Managers’ experience, reputation, personnel, operations and resources that the Fund benefits from the services provided under the Agreements.
Investment Performance of the Managers and the Fund. Throughout the year, the Managers provided information on the investment performance of the Fund, including comparative performance information. The Board also reviewed information, prepared by the Managers and by the independent consultant, comparing the Fund’s historical performance to relevant market indices and to the performance of other world stock funds underlying variable insurance products. The Board considered that the Fund outperformed its performance category median during the three-, five- and ten-year periods, although it underperformed its category median in the one-year period. The Board also considered that the Fund ranked in the third quintile of its performance category for the one-year period and the second quintile for the three-, five- and ten-year periods.
Fees and Expenses of the Fund. The Board reviewed the fees paid to the Adviser and the other expenses borne by the Fund. The Board noted that the Adviser, not the Fund, pays the Sub-Adviser’s fee under the sub-advisory agreement. The independent consultant provided comparative data in regard to the fees and expenses of the Fund and other world stock funds underlying variable insurance products. In reviewing the fees and expenses charged to the VA funds, the Board considered the Adviser’s assertion that, because there is much greater disparity in the fees and services that may be provided by a manager to a VA fund as opposed to a retail fund, when comparing the expenses of the various VA funds to those of retail funds, it is most appropriate to focus on total expenses (rather than on the management fees). Accordingly, while the Board reviewed and considered all expenses, it focused on total expenses. The Board considered that the Fund’s total expenses and contractual management fee were lower than its peer group median and its category median. Within the total asset range of $2 billion to $5 billion, the Fund’s effective management fee rate was lower than its peer group median and category median. The Board further considered that the Adviser has voluntarily agreed to limit the Fund’s total annual operating expenses so that those expenses, as percentages of daily net assets, will not exceed the annual rate of 1.00% for Non-Service Shares and 1.25% for Service Shares. This voluntary expense limitation may be amended or withdrawn at any time without prior notice to shareholders.
Economies of Scale and Profits Realized by the Managers. The Board considered information regarding the Managers’ costs in serving as the Fund’s investment adviser and sub-adviser, including the costs associated with the personnel and systems necessary to manage the Fund, and information regarding the Managers’ profitability from their relationship with the Fund. The Board reviewed whether the Managers may realize economies of scale in managing and supporting the Fund. The Board noted that the Fund currently has management fee breakpoints, which are intended to share with Fund shareholders economies of scale that may exist as the Fund’s assets grow.
25 OPPENHEIMER GLOBAL FUND/VA
|
BOARD APPROVAL OF THE FUND’S INVESTMENT ADVISORY AND SUB-ADVISORY AGREEMENTS
Unaudited / Continued |
Other Benefits to the Managers. In addition to considering the profits realized by the Managers, the Board considered information that was provided regarding the direct and indirect benefits the Managers receive as a result of their relationship with the Fund, including compensation paid to the Managers’ affiliates and research provided to the Adviser in connection with permissible brokerage arrangements (soft dollar arrangements).
Conclusions. These factors were also considered by the independent Trustees meeting separately from the full Board, assisted by experienced counsel to the Fund and to the independent Trustees. Fund counsel and the independent Trustees’ counsel are independent of the Managers within the meaning and intent of the Securities and Exchange Commission Rules.
Based on its review of the information it received and its evaluations described above, the Board, including a majority of the independent Trustees, decided to continue the Agreements through August 31, 2016. In arriving at its decision, the Board did not identify any factor or factors as being more important than others, but considered all of the above information, and considered the terms and conditions of the Agreements, including the management fees, in light of all the surrounding circumstances.
26 OPPENHEIMER GLOBAL FUND/VA
PORTFOLIO PROXY VOTING POLICIES AND PROCEDURES; UPDATES TO STATEMENTS OF INVESTMENTS Unaudited
The Fund has adopted Portfolio Proxy Voting Policies and Procedures under which the Fund votes proxies relating to securities (“portfolio proxies”) held by the Fund. A description of the Fund’s Portfolio Proxy Voting Policies and Procedures is available (i) without charge, upon request, by calling the Fund toll-free at 1.800.525.7048, (ii) on the Fund’s website at www.oppenheimerfunds.com, and (iii) on the SEC’s website at www.sec.gov. In addition, the Fund is required to file Form N-PX, with its complete proxy voting record for the 12 months ended June 30th, no later than August 31st of each year. The Fund’s voting record is available (i) without charge, upon request, by calling the Fund toll-free at 1.800.525.7048, and (ii) in the Form N-PX filing on the SEC’s website at www.sec.gov.
The Fund files its complete schedule of portfolio holdings with the SEC for the first quarter and the third quarter of each fiscal year on Form N-Q. The Fund’s Form N-Q filings are available on the SEC’s website at www.sec.gov. Those forms may be reviewed and copied at the SEC’s Public Reference Room in Washington, D.C. Information on the operation of the Public Reference Room may be obtained by calling 1-800-SEC-0330.
27 OPPENHEIMER GLOBAL FUND/VA
TRUSTEES AND OFFICERS Unaudited
| | |
Name, Position(s) Held with the Fund, Length of
Service, Age | | Principal Occupation(s) During the Past 5 Years; Other Trusteeships/Directorships
Held; Number of Portfolios in the Fund Complex Currently Overseen |
| |
| INDEPENDENT TRUSTEES | | The address of each Trustee in the chart below is 6803 S. Tucson Way, Centennial, Colorado 80112-3924. Each Trustee serves for an indefinite term, or until his or her resignation, retirement, death or removal. |
| |
Sam Freedman, Chairman of the Board of Trustees (since 2013) and Trustee (since 1996) Year of Birth: 1940 | | Director of Colorado UpLIFT (charitable organization) (since September 1984). Mr. Freedman held several positions with the Sub- Adviser and with subsidiary or affiliated companies of the Sub-Adviser (until October 1994). Oversees 47 portfolios in the OppenheimerFunds complex. Mr. Freedman has served on the Boards of certain Oppenheimer funds since 1996, during which time he has become familiar with the Fund’s (and other Oppenheimer funds’) financial, accounting, regulatory and investment matters and has contributed to the Boards’ deliberations. |
| |
Jon S. Fossel, Trustee (since 1990) Year of Birth: 1942 | | Chairman of the Board of Jack Creek Preserve Foundation (non-profit organization) (since 2005); Chairman of the Board (2006- December 2011) and Director (June 2002-December 2011) of UNUMProvident (insurance company); Director of Northwestern Energy Corp. (public utility corporation) (November 2004-December 2009); Director of P.R. Pharmaceuticals (October 1999- October 2003); Director of Rocky Mountain Elk Foundation (non-profit organization) (February 1998-February 2003 and February 2005-February 2007); Chairman and Director (until October 1996) and President and Chief Executive Officer (until October 1995) of the Sub-Adviser; President, Chief Executive Officer and Director of the following: Oppenheimer Acquisition Corp. (“OAC”) (parent holding company of the Sub-Adviser), Shareholders Services, Inc. and Shareholder Financial Services, Inc. (until October 1995). Oversees 47 portfolios in the OppenheimerFunds complex. Mr. Fossel has served on the Boards of certain Oppenheimer funds since 1990, during which time he has become familiar with the Fund’s (and other Oppenheimer funds’) financial, accounting, regulatory and investment matters and has contributed to the Boards’ deliberations. |
| |
Richard F. Grabish, Trustee (since 2012) Year of Birth: 1948 | | Formerly Senior Vice President and Assistant Director of Sales and Marketing (March 1997-December 2007), Director (March 1987-December 2007) and Manager of Private Client Services (June 1985-June 2005) of A.G. Edwards & Sons, Inc. (broker/dealer and investment firm); Chairman and Chief Executive Officer of A.G. Edwards Trust Company, FSB (March 2001- December 2007); President and Vice Chairman of A.G. Edwards Trust Company, FSB (investment adviser) (April 1987-March 2001); President of A.G. Edwards Trust Company, FSB (investment adviser) (June 2005-December 2007). Oversees 47 portfolios in the OppenheimerFunds complex. Mr. Grabish has served on the Boards of certain Oppenheimer funds since 2001, during which time he has become familiar with the Fund’s (and other Oppenheimer funds’) financial, accounting, regulatory and investment matters and has contributed to the Boards’ deliberations. |
| |
Beverly L. Hamilton, Trustee (since 2002) Year of Birth: 1946 | | Trustee of Monterey Institute for International Studies (educational organization) (since February 2000); Board Member of Middlebury College (educational organization) (December 2005-June 2011); Chairman (since 2010) of American Funds’ Emerging Markets Growth Fund, Inc. (mutual fund); Director of The California Endowment (philanthropic organization) (April 2002-April 2008); Director (February 2002-2005) and Chairman of Trustees (2006-2007) of the Community Hospital of Monterey Peninsula; Director (October 1991-2005); Vice Chairman (2006-2009) of American Funds’ Emerging Markets Growth Fund, Inc. (mutual fund); President of ARCO Investment Management Company (February 1991-April 2000); Member of the investment committees of The Rockefeller Foundation (2001-2006) and The University of Michigan (since 2000); Advisor at Credit Suisse First Boston’s Sprout venture capital unit (venture capital fund) (1994-January 2005); Trustee of MassMutual Institutional Funds (investment company) (1996-June 2004); Trustee of MML Series Investment Fund (investment company) (April 1989-June 2004); Member of the investment committee of Hartford Hospital (2000-2003); and Advisor to Unilever (Holland) pension fund (2000-2003). Oversees 47 portfolios in the OppenheimerFunds complex. Ms. Hamilton has served on the Boards of certain Oppenheimer funds since 2002, during which time she has become familiar with the Fund’s (and other Oppenheimer funds’) financial, accounting, regulatory and investment matters and has contributed to the Boards’ deliberations. |
| |
Victoria J. Herget, Trustee (since 2012) Year of Birth:1951 | | Board Chair (2008-Present) and Director (2004-Present), United Educators (insurance company); Trustee (since 2000) and Chair (since 2010), Newberry Library (independent research library); Trustee, Mather LifeWays (senior living organization) (since 2001); Independent Director of the First American Funds (mutual fund family) (2003-2011); former Managing Director (1993-2001), Principal (1985-1993), Vice President (1978-1985) and Assistant Vice President (1973-1978) of Zurich Scudder Investments (investment adviser) (and its predecessor firms); Trustee (1992-2007), Chair of the Board of Trustees (1999-2007), Investment Committee Chair (1994-1999) and Investment Committee member (2007-2010) of Wellesley College; Trustee, BoardSource (non-profit organization) (2006-2009) and Chicago City Day School (K-8 School) (1994-2005). Oversees 47 portfolios in the OppenheimerFunds complex. Ms. Herget has served on the Boards of certain Oppenheimer funds since 2012, during which time she has become familiar with the Fund’s (and other Oppenheimer funds’) financial, accounting, regulatory and investment matters and has contributed to the Boards’ deliberations. |
| |
Robert J. Malone, Trustee (since 2002) Year of Birth: 1944 | | Chairman - Colorado Market of MidFirst Bank (since January 2015); Chairman of the Board (since 2012) and Director (since August 2005) of Jones International University (educational organization); Trustee of the Gallagher Family Foundation (non-profit organization) (2000-2015); Chairman, Chief Executive Officer and Director of Steele Street Bank Trust (commercial banking) (August 2003-January 2015); Board of Directors of Opera Colorado Foundation (non-profit organization) (2008-2012); Director of Colorado UpLIFT (charitable organization) (1986-2010); Director of Jones Knowledge, Inc. (2006-2010); Former Chairman of U.S. Bank-Colorado (subsidiary of U.S. Bancorp and formerly Colorado National Bank) (July 1996-April 1999); Director of Commercial Assets, Inc. (real estate investment trust) (1993-2000); Director of U.S. Exploration, Inc. (oil and gas exploration) (1997-February 2004); Chairman of the Board (1991-1994) and Trustee (1985-1994) of Regis University; and Chairman of the Board (1990-1991 and Trustee (1984-1999) of Young Presidents Organization. Oversees 47 portfolios in the OppenheimerFunds complex. Mr. Malone has served on the Boards of certain Oppenheimer funds since 2002, during which time he has become familiar with the Fund’s (and other Oppenheimer funds’) financial, accounting, regulatory and investment matters and has contributed to the Boards’ deliberations. |
28 OPPENHEIMER GLOBAL FUND/VA
| | |
| |
F. William Marshall, Jr., Trustee (since 2000) Year of Birth: 1942 | | Trustee Emeritus of Worcester Polytech Institute (WPI) (private university) (since 2009); Trustee of MassMutual Select Funds (formerly MassMutual Institutional Funds) (investment company) (since 1996), MML Series Investment Fund (investment company) (since 1996) and Mass Mutual Premier Funds (investment company) (since January 2012); President and Treasurer of the SIS Funds (private charitable fund) (January 1999-March 2011); Former Trustee of WPI (1985-2008); Former Chairman of the Board (2004-2006) and Former Chairman of the Investment Committee of WPI (1994-2008); Chairman of SIS Family Bank, F.S.B. (formerly SIS Bank) (commercial bank) (January 1999-July 1999); Executive Vice President of Peoples Heritage Financial Group, Inc. (commercial bank) (January 1999-July 1999); and Former President and Chief Executive Officer of SIS Bancorp. (1993-1999). Oversees 47 portfolios in the OppenheimerFunds complex. Mr. Marshall has served on the Boards of certain Oppenheimer funds since 2000, during which time he has become familiar with the Fund’s (and other Oppenheimer funds’) financial, accounting, regulatory and investment matters and has contributed to the Boards’ deliberations. |
| |
Karen L. Stuckey, Trustee (since 2012) Year of Birth: 1953 | | Partner (1990-2012) of PricewaterhouseCoopers LLP (professional services firm) (held various positions 1975-1990); Trustee (1992-2006) and member of Executive, Nominating and Audit Committees and Chair of Finance Committee of Lehigh University; and member, Women’s Investment Management Forum (professional organization) since inception. Oversees 47 portfolios in the OppenheimerFunds complex. Ms. Stuckey has served on the Boards of certain Oppenheimer funds since 2012, during which time she has become familiar with the Fund’s (and other Oppenheimer funds’) financial, accounting, regulatory and investment matters and has contributed to the Boards’ deliberations. |
| |
James D. Vaughn, Trustee (since 2012) Year of Birth:1945 | | Retired; former managing partner (1994-2001) of Denver office of Deloitte & Touche LLP, (held various positions 1969-1993); Trustee and Chairman of the Audit Committee of Schroder Funds (2003-2012); Board member and Chairman of Audit Committee of AMG National Trust Bank (since 2005); Trustee, Investment Committee member, University of South Dakota Foundation (since 1996); Board member, Audit Committee Member and past Board Chair, Junior Achievement (since 1993); former Board member, Mile High United Way, Boys and Girls Clubs, Boy Scouts, Colorado Business Committee for the Arts, Economic Club of Colorado and Metro Denver Network. Oversees 47 portfolios in the OppenheimerFunds complex. Mr. Vaughn has served on the Boards of certain Oppenheimer funds since 2012, during which time he has become familiar with the Fund’s (and other Oppenheimer funds’) financial, accounting, regulatory and investment matters and has contributed to the Boards’ deliberations. |
| | |
| |
INTERESTED TRUSTEE AND OFFICER | | Mr. Steinmetz is an “Interested Trustee” because he is affiliated with the Manager and the Sub-Adviser by virtue of his positions as Chairman and director of the Sub-Adviser and officer and director of the Manager. Both as a Trustee and as an officer, Mr. Steinmetz serves for an indefinite term, or until his resignation, retirement, death or removal. Mr. Steinmetz’s address is 225 Liberty Street, New York, New York 10281-1008. |
| |
Arthur P. Steinmetz Trustee (Since 2015), President and Principal Executive
Officer (since 2014) Year of Birth: 1958 | | Chairman of the Sub-Adviser (since January 2015); CEO and Chairman of the Manager (since July 2014), President of the Manager (since May 2013), a Director of the Manager (since January 2013), Director of the Sub-Adviser (since July 2014), President, Management Director and CEO of Oppenheimer Acquisition Corp. (the Sub-Adviser’s parent holding company) (since July 2014), and President and Director of OFI SteelPath, Inc. (since January 2013). Chief Investment Officer of the OppenheimerFunds advisory entities from (January 2013-December 2013); Executive Vice President of the Manager (January 2013-May 2013); Chief Investment Officer of the Sub-Adviser (October 2010-December 2012); Chief Investment Officer, Fixed- Income, of the Sub-Adviser (April 2009-October 2010); Executive Vice President of the Sub-Adviser (October 2009-December 2012); Director of Fixed Income of the Sub-Adviser (January 2009-April 2009); and a Senior Vice President of the Sub-Adviser (March 1993-September 2009). An officer of 101 portfolios in the OppenheimerFunds complex. |
| | |
| |
OTHER OFFICERS OF THE FUND | | The addresses of the Officers in the chart below are as follows: for Messrs. Bhaman, Gabinet, Mss. Sexton and Picciotto, 225 Liberty Street, New York, New York 10281-1008, for Mr. Wixted, 6803 S. Tucson Way, Centennial, Colorado 80112-3924. Each Officer serves for an indefinite term or until his or her resignation, retirement, death or removal. |
| |
Rajeev Bhaman, Vice President (since 2004) Year of Birth: 1963 | | Director of Global Equities of the Sub-Adviser (since January 2013); Senior Vice President of the Sub-Adviser (since May 2006); Vice President of the Sub-Adviser (January 1997-May 2006). An officer of other portfolios in the OppenheimerFunds complex. |
| |
Arthur S. Gabinet, Secretary and Chief Legal Officer (since 2011)
Year of Birth: 1958 | | Executive Vice President, Secretary and General Counsel of the Manager (since January 2013); General Counsel OFI SteelPath, Inc. (since January 2013); Executive Vice President (May 2010-December 2012) and General Counsel (since January 2011) of the Sub-Adviser; General Counsel of the Distributor (since January 2011); General Counsel of Centennial Asset Management Corporation (January 2011-December 2012); Executive Vice President (January 2011-December 2012) and General Counsel of HarbourView Asset Management Corporation (since January 2011); Assistant Secretary (since January 2011) and Director (since January 2011) of OppenheimerFunds International Ltd. and OppenheimerFunds plc; Director of Oppenheimer Real Asset Management, Inc. (January 2011-December 2012) and General Counsel (since January 2011); Executive Vice President (January 2011-December 2011) and General Counsel of Shareholder Financial Services, Inc. and Shareholder Services, Inc. (since January 2011); Executive Vice President (January 2011-December 2012) and General Counsel of OFI Private Investments Inc. (since January 2011); Vice President of OppenheimerFunds Legacy Program (January 2011-December 2011); Executive Vice President (January 2011-December 2012) and General Counsel of OFI Institutional Asset Management, Inc. (since January 2011); General Counsel, Asset Management of the Sub-Adviser (May 2010-December 2010); Principal, The Vanguard Group (November 2005- April 2010); District Administrator, U.S. Securities and Exchange Commission (January 2003-October 2005). An officer of 101 Portfolios in the OppenheimerFunds complex. |
| |
Jennifer Sexton, Vice President and Chief Business Officer (since 2014) Year of Birth: 1969 | | Senior Vice President of OppenheimerFunds Distributor, Inc. (since June 2014); Vice President of OppenheimerFunds Distributor, Inc. (April 2006-June 2014); Vice President of the Sub-Adviser (January 1998-March 2006); Assistant Vice President of the Sub- Adviser (October 1991-December 1998). An officer of 101 Portfolios in the OppenheimerFunds complex. |
29 OPPENHEIMER GLOBAL FUND/VA
TRUSTEES AND OFFICERS Unaudited / Continued
| | |
| |
Mary Ann Picciotto, Chief Compliance Officer and Chief Anti-Money Laundering Officer (since 2014) Year of Birth: 1973 | | Senior Vice President and Chief Compliance Officer of the Manager (since March 2014); Chief Compliance Officer of the Sub- Adviser, OFI SteelPath, Inc., OFI Global Trust Company, OFI Global Institutional, Inc., Oppenheimer Real Asset Management, Inc., OFI Private Investments, Inc., Harborview Asset Management Corporation, Trinity Investment Management Corporation, and Shareholder Services, Inc. (since March 2014); Managing Director of Morgan Stanley Investment Management Inc. and certain of its various affiliated entities; Chief Compliance Officer of various Morgan Stanley Funds (May 2010-January 2014); Chief Compliance Officer of Morgan Stanley Investment Management Inc. (April 2007-January 2014). An officer of 101 Portfolios in the OppenheimerFunds complex. |
| |
Brian W. Wixted, Treasurer and Principal Financial & Accounting Officer
(since 1999) Year of Birth: 1959 | | Senior Vice President of the Manager (since January 2013); Treasurer of the Sub-Adviser, HarbourView Asset Management Corporation, Shareholder Financial Services, Inc., Shareholder Services, Inc., and Oppenheimer Real Asset Management, Inc. (March 1999-June 2008), OFI Private Investments, Inc. (March 2000-June 2008), OppenheimerFunds International Ltd. and OppenheimerFunds plc (since May 2000), OFI Institutional Asset Management, Inc. (November 2000-June 2008), and OppenheimerFunds Legacy Program (charitable trust program established by the Sub-Adviser) (June 2003-December 2011); Treasurer and Chief Financial Officer of OFI Trust Company (since May 2000); Assistant Treasurer of Oppenheimer Acquisition Corporation (March 1999-June 2008). An officer of 101 Portfolios in the OppenheimerFunds complex. |
The Fund’s Statement of Additional Information contains additional information about the Fund’s Trustees and Officers and is available without charge, upon request, by calling 1.800.988.8287.
30 OPPENHEIMER GLOBAL FUND/VA
THIS PAGE INTENTIONALLY LEFT BLANK.
31 OPPENHEIMER GLOBAL FUND/VA
OPPENHEIMER GLOBAL FUND/VA
A Series of Oppenheimer Variable Account Funds
| | |
| |
| Manager | | OFI Global Asset Management, Inc. |
| |
| Sub-Adviser | | OppenheimerFunds, Inc. |
| |
| Distributor | | OppenheimerFunds Distributor, Inc. |
| |
Transfer and Shareholder Servicing Agent | | OFI Global Asset Management, Inc. |
| |
| Sub-Transfer Agent | | Shareholder Services, Inc. DBA OppenheimerFunds Services |
| |
Independent Registered Public Accounting Firm | | KPMG LLP |
| |
| Counsel | | Ropes & Gray LLP |
| |
| | Before investing in any of the Oppenheimer funds, investors should carefully consider a fund’s investment objectives, risks, charges and expenses. Fund prospectuses and summary prospectuses contain this and other information about the funds, and may be obtained by asking your financial advisor, or calling us at 1.800.988.8287. Read prospectuses and summary prospectuses carefully before investing. |
| |
| | © 2016 OppenheimerFunds, Inc. All rights reserved. Oppenheimer funds are distributed by OppenheimerFunds Distributor, Inc. |

PORTFOLIO MANAGERS: Manind (“Mani”) Govil, CFA, Benjamin Ram and Paul Larson
AVERAGE ANNUAL TOTAL RETURNS FOR THE PERIODS ENDED 12/31/15
| | | | | | | | | | | | | | |
| | | Inception
Date | | 1-Year | | | 5-Year | | | 10-Year | |
Non-Service Shares | | 7/5/95 | | | 3.33 | % | | | 11.99 | % | | | 6.85 | % |
Service Shares | | 7/13/00 | | | 3.11 | | | | 11.70 | | | | 6.58 | |
S&P 500 Index | | | | | 1.38 | | | | 12.57 | | | | 7.31 | |
Performance data quoted represents past performance, which does not guarantee future results. The investment return and principal value of an investment in the Fund will fluctuate so that an investor’s shares, when redeemed, may be worth more or less than their original cost. Current performance may be lower or higher than the performance quoted. For performance data current to the most recent month end, call us at 1.800.988.8287. The Fund’s total returns should not be expected to be the same as the returns of other funds, whether or not both funds have the same portfolio managers and/or similar names. The Fund’s total returns include changes in share price and reinvested distributions but do not include the charges associated with the separate account products that offer this Fund. Such performance would have been lower if such charges were taken into account.
TOP HOLDINGS AND ALLOCATIONS
| | |
| TOP TEN COMMON STOCK HOLDINGS | | SECTOR ALLOCATION |
| | | | |
Alphabet, Inc., Cl. C | | | 5.2% | |
Apple, Inc. | | | 4.6 | |
General Electric Co. | | | 4.0 | |
Citigroup, Inc. | | | 3.6 | |
Mondelez International, Inc., Cl. A | | | 3.5 | |
CME Group, Inc., Cl. A | | | 3.0 | |
Philip Morris International, Inc. | | | 2.8 | |
PepsiCo, Inc. | | | 2.5 | |
Johnson & Johnson | | | 2.4 | |
Chevron Corp. | | | 2.4 | |
Portfolio holdings and allocations are subject to change. Percentages are as of December 31, 2015, and are based on net assets. For more current Fund holdings, please visit oppenheimerfunds.com.
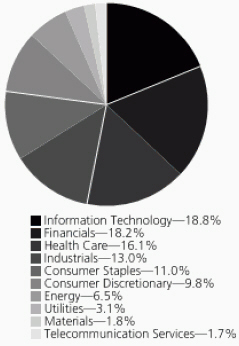
Portfolio holdings and allocations are subject to change. Percentages are as of December 31, 2015, and are based on the total market value of common stocks.
2 OPPENHEIMER MAIN STREET FUND/VA
Fund Performance Discussion
The Fund’s Non-Service shares produced a total return of 3.33% during the reporting period. In comparison, the Fund outperformed the S&P 500 Index (the “Index”), which returned 1.38%. The Fund outperformed the Index due largely to stronger relative stock selection in the materials, health care, consumer staples and information technology sectors. Detractors from performance included less favorable stock selection in financials and stock selection and an overweight position in industrials.
MARKET OVERVIEW
While returns for domestic equities — across the capitalization spectrum — were in positive territory for the fourth quarter of the year, the uplift in stock prices was insufficient to close-out the year on a favorable note. In particular, large-caps barely eked-out a positive return for 2015 (due mainly to the contribution from dividends, as prices, overall, were down) while both mid- and small-cap stocks, generally, declined in 2015. The year was marked by heightened volatility as uncertainty over when, or if the Federal Reserve (the “Fed”) would raise interest rates (eventually they lifted the Fed Funds rate in mid-December), combined with plummeting energy prices, decelerating emerging market growth and sluggish developed market growth — including our own domestic economy — resulted in investor sentiment that swung back and forth like a pendulum.
Returns were influenced by big macro trends. Most evident was the ongoing slide in oil prices that continued to negatively impact energy stocks — making the sector the worst performer in the year. Commodity prices, generally, have been on a downward trend all year and this, combined with slowing global growth has hurt economically sensitive segments — particularly materials and industrials. The ongoing strength of the dollar also impacted commodity prices and contributed to the lowered guidance from many industrial firms as expectations for export growth has been reigned-in.
The much anticipated rise in interest rates also influenced relative returns across sectors during the year. Naturally, stocks hurt by the expectation of rising interest rates, including higher yielding sectors such as utilities and real estate investment trusts (“REITs”), generally underperformed in 2015. By comparison, health care stocks held up well, ending 2015 among the top performing sectors in the market. Generally, health care returns were driven by rising valuations — particularly in the life sciences and biotechnology categories.
TOP INDIVIDUAL CONTRIBUTORS
Top contributors to performance this period included Alphabet, Inc., Mondelez International, Inc. and Vulcan Materials Co. Alphabet is the new holding company vehicle for what was previously known as Google. Alphabet’s stock outperformed as quarterly results showed evidence of improved cost control and the company announced plans to enhance financial disclosures to investors, thereby providing greater transparency into the drivers of value creation. With the recent arrival of a new CFO, investors have gained conviction in greater cost controls and more effective capital allocation—both of which should lead to rising profitability. In addition, the company announced a stock buyback over the fourth quarter of 2015. While small in magnitude, this move reinforced the view that management is committed to driving shareholder value rather than growth at any cost. Mondelez manufactures and sells global consumer products—primarily in the snack food and confection categories, including brand names such as Oreos, Cadbury and Trident. Operating margins continued to expand, surprising investors favorably and leading to the stock’s positive performance. Shares of Vulcan Materials, a provider of aggregates, delivered strong results as construction demand continued to improve. Additionally, management issued an optimistic outlook for the company’s growth over the next several years, which resulted in rising investor sentiment.
TOP INDIVIDUAL DETRACTORS
The top detractors from performance included Tyco International plc, Western Digital Corp., and National Oilwell Varco, Inc. Tyco International provides security products and services, fire detection and suppression products and services, and life safety products. Tyco surprised investors with a disappointing earnings outlook when they reported fiscal second quarter 2015 results in late April. We had underestimated the company’s exposure to much weaker oil and gas markets which only represent approximately 5% of total company sales, though deliver well above average profit margins relative to their other end markets. We trimmed our position modestly (though still retain a sizeable overweight) as we reallocated capital to other names where we have higher conviction in near-term fundamentals. Western Digital manufactures computer disk drives and other data storage solutions. The stock continues to be negatively impacted by near-term fundamentals which remain weak, particularly demand for personal computers. Further, the stock reacted unfavorably when management announced the acquisition of SanDisk at a substantial price premium. While we believe acquiring SanDisk makes sense from a long-term perspective, as the Company vertically integrates into NAND flash storage, investors were initially uncertain as to its strategic value. National Oilwell Varco experienced declines—along with most energy-related stocks—due to the decline in oil prices. National Oilwell Varco is a worldwide supplier of equipment to the energy sector. The company’s
3 OPPENHEIMER MAIN STREET FUND/VA
management revised the outlook for earnings downward. As oil prices have fallen, many of the company’s customers have decreased spending expectations, thereby negatively impacting the projected growth of National Oilwell’s products and services. We exited our position.
STRATEGY & OUTLOOK
The past year has been characterized by a “three speed global economy.” Domestically, growth has continued slow and steady, with inflation subdued and unemployment near full employment levels. The strong dollar, however, has weakened manufacturing though the service sector remains strong. Europe, on the other hand, has seen essentially no growth in its GDP while emerging markets continue to grow, but at a decelerating rate.
As “Corporate America” has experienced low revenue growth — with little aid from pricing — earnings growth has partially come from “manufactured” sources. Share repurchases — funded by low cost financings — have resulted in debt amounts twice their 2008 levels (excluding financials). A significant step-up in Merger & Acquisition activities has also contributed to the “manufactured” source of earnings growth. Finally, increasingly companies are resorting to reporting “Adjusted” earnings which often are a far cry above the more normal usage of Generally Accepted Accounting Principles (GAAP) earnings. These trends have led to profit margins which are near peak levels, but are likely unsustainable.
We believe the risks inherent to this market include the misallocation of capital, fueled by an environment of ongoing relatively low interest rates and possibly leading to “bubble-like” valuations for some companies. Additionally, fundamental disruptions across market segments have been elevated. The “poster-child” for this risk remains Amazon, which continues to change the way consumers make purchases — disrupting the legacy retailers who are scrambling to adjust to the new reality.
We expect this economic and market environment to continue, resulting in increased volatility of equity prices. Traditionally, during periods of economic uncertainty and heightened market volatility, investors favor stocks of higher quality companies — with greater consistency and stability of revenue and earnings — leading to relatively better stock performance of those companies. We aim to build “all weather” portfolios by targeting companies with: 1) sustainable competitive advantages; 2) skilled management with a proven track record of executing effectively; and 3) financial resources to generate improving profitability, gain market share, and/or return significant cash to shareholders. During times of economic volatility such companies frequently widen their lead over weaker competitors. We seek to invest in companies, characterized by these qualities, at compelling valuations and believe this disciplined approach is essential to generating superior long-term performance.
Investors should consider the Fund’s investment objective, risks, charges and expenses carefully before investing. The Fund’s prospectus and summary prospectus contain this and other information about the Fund, and may be obtained by asking your financial advisor or calling us at 1.800.988.8287. Read prospectuses and summary prospectuses carefully before investing.
Total returns include changes in share price and reinvestment of dividends and capital gains distributions in a hypothetical investment for the periods shown.
The Fund’s investment strategy and focus can change over time. The mention of specific fund holdings does not constitute a recommendation by OppenheimerFunds, Inc. or its affiliates.
Shares of Oppenheimer funds are not deposits or obligations of any bank, are not guaranteed by any bank, are not insured by the FDIC or any other agency, and involve investment risks, including the possible loss of the principal amount invested.
Comparing the Fund’s Performance to the Market. The graphs that follow show the performance of a hypothetical $10,000 investment in each share class of the Fund held until December 31, 2015. Performance is measured over a ten-fiscal-year period for both Classes. Performance information does not reflect charges that apply to separate accounts investing in the Fund. If these charges were taken into account, performance would be lower. The graphs assume that all dividends and capital gains distributions were reinvested in additional shares.
The Fund’s performance is compared to the performance of the S&P 500 Index. The S&P 500 Index is a broad-based measure of domestic stock performance. The Index is unmanaged and cannot be purchased directly by investors. While index comparisons may be useful to provide a benchmark for the Fund’s performance, it must be noted that the Fund’s investments are not limited to the investments comprising the Index. Index performance includes reinvestment of income, but does not reflect transaction costs, fees, expenses or taxes. Index performance is shown for illustrative purposes only as a benchmark for the Fund’s performance, and does not predict or depict performance of the Fund. The Fund’s performance reflects the effects of the Fund’s business and operating expenses.
4 OPPENHEIMER MAIN STREET FUND/VA
COMPARISON OF CHANGE IN VALUE OF $10,000 HYPOTHETICAL INVESTMENTS IN:
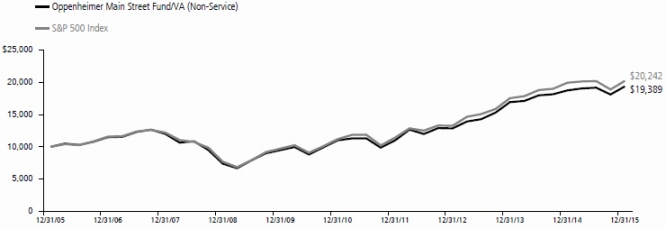
COMPARISON OF CHANGE IN VALUE OF $10,000 HYPOTHETICAL INVESTMENTS IN:
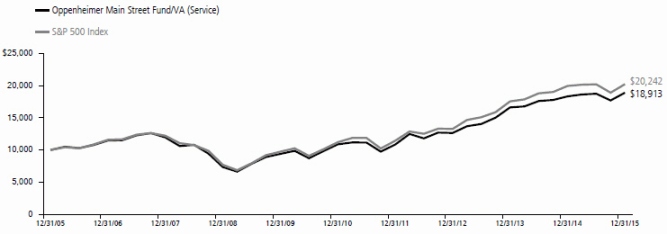
The performance data quoted represents past performance, which does not guarantee future results. The investment return and principal value of an investment in the Fund will fluctuate so that an investor’s shares, when redeemed, may be worth more or less than their original cost. Current performance may be lower or higher than the performance quoted. For performance data current to the most recent month end, call us at 1.800.988.8287. The Fund’s total returns should not be expected to be the same as the returns of other funds, whether or not both funds have the same portfolio managers and/or similar names. The Fund’s total returns include changes in share price and reinvested distributions but do not include the charges associated with the separate account products that offer this Fund. Such performance would have been lower if such charges were taken into account.
5 OPPENHEIMER MAIN STREET FUND/VA
Fund Expenses
Fund Expenses. As a shareholder of the Fund, you incur two types of costs: (1) transaction costs and (2) ongoing costs, including management fees; distribution and service fees; and other Fund expenses. These examples are intended to help you understand your ongoing costs (in dollars) of investing in the Fund and to compare these costs with the ongoing costs of investing in other mutual funds.
The examples are based on an investment of $1,000.00 invested at the beginning of the period and held for the entire 6-month period ended December 31, 2015.
Actual Expenses. The first section of the table provides information about actual account values and actual expenses. You may use the information in this section for the class of shares you hold, together with the amount you invested, to estimate the expense that you paid over the period. Simply divide your account value by $1,000.00 (for example, an $8,600.00 account value divided by $1,000.00 = 8.60), then multiply the result by the number in the first section under the heading entitled “Expenses Paid During 6 Months Ended December 31, 2015” to estimate the expenses you paid on your account during this period.
Hypothetical Example for Comparison Purposes.
The second section of the table provides information about hypothetical account values and hypothetical expenses based on the Fund’s actual expense ratio for each class of shares, and an assumed rate of return of 5% per year for each class before expenses, which is not the actual return. The hypothetical account values and expenses may not be used to estimate the actual ending account balance or expenses you paid for the period. You may use this information to compare the ongoing costs of investing in the Fund and other funds. To do so, compare this 5% hypothetical example for the class of shares you hold with the 5% hypothetical examples that appear in the shareholder reports of the other funds.
Please note that the expenses shown in the table are meant to highlight your ongoing fund costs only and do not reflect any charges associated with the separate accounts that offer this Fund. Therefore, the “hypothetical” lines of the table are useful in comparing ongoing fund costs only, and will not help you determine the relative total costs of owning different funds. In addition, if these separate account charges were included your costs would have been higher.
| | | | | | | | | | | | |
| Actual | | Beginning
Account
Value
July 1, 2015 | | | Ending Account Value
December 31, 2015 | | | Expenses Paid During 6 Months Ended
December 31, 2015 | |
Non-Service shares | | $ | 1,000.00 | | | $ | 1,010.00 | | | $ | 3.96 | |
Service shares | | | 1,000.00 | | | | 1,008.70 | | | | 5.23 | |
| | | |
| Hypothetical | | | | | | | | | |
(5% return before expenses) | | | | | | | | | | | | |
Non-Service shares | | | 1,000.00 | | | | 1,021.27 | | | | 3.98 | |
Service shares | | | 1,000.00 | | | | 1,020.01 | | | | 5.26 | |
Expenses are equal to the Fund’s annualized expense ratio for that class, multiplied by the average account value over the period, multiplied by 184/365 (to reflect the one-half year period). Those annualized expense ratios, excluding indirect expenses from affiliated funds, based on the 6-month period ended December 31, 2015 are as follows:
| | | | |
| Class | | Expense Ratios | |
Non-Service shares | | | 0.78% | |
Service shares | | | 1.03 | |
The expense ratios reflect voluntary and/or contractual waivers and/or reimbursements of expenses by the Fund’s Manager. Some of these undertakings may be modified or terminated at any time, as indicated in the Fund’s prospectus. The “Financial Highlights” tables in the Fund’s financial statements, included in this report, also show the gross expense ratios, without such waivers or reimbursements and reduction to custodian expenses, if applicable.
6 OPPENHEIMER MAIN STREET FUND/VA
STATEMENT OF INVESTMENTS December 31, 2015
| | | | | | | | |
| | | Shares | | | Value | |
Common Stocks—97.7% | |
Consumer Discretionary—9.6% | |
Auto Components—0.9% | |
Delphi Automotive plc | | | 87,180 | | | $ | 7,473,941 | |
Lear Corp. | | | 29,760 | | | | 3,655,421 | |
| | | | | | | 11,129,362 | |
| | | | | | | | | |
Automobiles—1.2% | |
| General Motors Co. | | | 324,062 | | | | 11,021,349 | |
Harley-Davidson, Inc. | | | 81,740 | | | | 3,710,178 | |
| | | | | | | 14,731,527 | |
| | | | | | | | | |
Hotels, Restaurants & Leisure—0.5% | |
Dunkin’ Brands Group, Inc. | | | 150,550 | | | | 6,411,925 | |
| | | | | | | | | |
Internet & Catalog Retail—1.6% | |
Amazon.com, Inc.1 | | | 28,910 | | | | 19,539,980 | |
| | | | | | | | | |
Media—2.2% | |
Comcast Corp., Cl. A | | | 478,245 | | | | 26,987,365 | |
| | | | | | | | | |
Specialty Retail—3.2% | |
AutoZone, Inc.1 | | | 18,510 | | | | 13,732,754 | |
Home Depot, Inc. (The) | | | 197,257 | | | | 26,087,238 | |
| | | | | | | 39,819,992 | |
| | | | | | | | | |
Consumer Staples—10.8% | |
Beverages—2.5% | |
PepsiCo, Inc. | | | 312,590 | | | | 31,233,993 | |
| | | | | | | | | |
Food Products—4.6% | | | | | | | | |
Kraft Heinz Co. (The) | | | 176,110 | | | | 12,813,764 | |
Mondelez International, Inc., Cl. A | | | 958,280 | | | | 42,969,275 | |
| | | | | | | 55,783,039 | |
| | | | | | | | | |
Household Products—0.9% | |
Henkel AG & Co. KGaA | | | 113,231 | | | | 10,865,888 | |
| | | | | | | | | |
Tobacco—2.8% | |
Philip Morris International, Inc. | | | 396,789 | | | | 34,881,721 | |
| | | | | | | | | |
Energy—6.3% | |
Oil, Gas & Consumable Fuels—6.3% | |
Chevron Corp. | | | 326,383 | | | | 29,361,415 | |
HollyFrontier Corp. | | | 165,440 | | | | 6,599,401 | |
Magellan Midstream Partners LP2 | | | 148,955 | | | | 10,117,024 | |
Noble Energy, Inc. | | | 412,415 | | | | 13,580,826 | |
Suncor Energy, Inc. | | | 719,680 | | | | 18,567,744 | |
| | | | | | | 78,226,410 | |
| | | | | | | | | |
Financials—17.7% | |
Capital Markets—1.8% | |
Bank of New York Mellon Corp. (The) | | | 535,680 | | | | 22,080,730 | |
| | | | | | | | | |
Commercial Banks—4.4% | |
Citigroup, Inc. | | | 849,418 | | | | 43,957,381 | |
M&T Bank Corp. | | | 84,460 | | | | 10,234,863 | |
| | | | | | | 54,192,244 | |
| | | | | | | | | |
Consumer Finance—1.1% | |
Discover Financial Services | | | 261,473 | | | | 14,020,182 | |
| | | | | | | | | |
Diversified Financial Services—6.6% | |
Berkshire Hathaway, Inc., Cl. B1 | | | 192,240 | | | | 25,383,370 | |
CME Group, Inc., Cl. A | | | 401,870 | | | | 36,409,422 | |
McGraw Hill Financial, Inc. | | | 199,791 | | | | 19,695,397 | |
| | | | | | | 81,488,189 | |
| | | | | | | | | |
Insurance—2.5% | |
American International Group, Inc. | | | 171,450 | | | | 10,624,756 | |
Genworth Financial, Inc., Cl. A1 | | | 987,070 | | | | 3,681,771 | |
Marsh & McLennan Cos., Inc. | | | 287,990 | | | | 15,969,046 | |
| | | | | | | 30,275,573 | |
| | | | | | | | |
| | | Shares | | | Value | |
Real Estate Investment Trusts (REITs)—1.3% | |
Simon Property Group, Inc. | | | 85,580 | | | $ | 16,640,175 | |
| | | | | | | | | |
Health Care—15.7% | |
Biotechnology—2.3% | |
Gilead Sciences, Inc. | | | 282,350 | | | | 28,570,996 | |
| | | | | | | | | |
Health Care Equipment & Supplies—1.3% | |
Boston Scientific Corp.1 | | | 861,320 | | | | 15,882,741 | |
| | | | | | | | | |
Health Care Providers & Services—5.1% | |
Express Scripts Holding Co.1 | | | 316,797 | | | | 27,691,226 | |
McKesson Corp. | | | 58,800 | | | | 11,597,124 | |
UnitedHealth Group, Inc. | | | 201,480 | | | | 23,702,107 | |
| | | | | | | 62,990,457 | |
| | | | | | | | | |
Pharmaceuticals—7.0% | |
Bristol-Myers Squibb Co. | | | 338,690 | | | | 23,298,485 | |
Johnson & Johnson | | | 287,590 | | | | 29,541,245 | |
Merck & Co., Inc. | | | 339,970 | | | | 17,957,216 | |
Mylan NV1 | | | 286,490 | | | | 15,490,514 | |
| | | | | | | 86,287,460 | |
| | | | | | | | | |
Industrials—12.7% | |
Aerospace & Defense—1.9% | |
Lockheed Martin Corp. | | | 59,660 | | | | 12,955,169 | |
United Technologies Corp. | | | 113,800 | | | | 10,932,766 | |
| | | | | | | 23,887,935 | |
| | | | | | | | | |
Commercial Services & Supplies—2.2% | |
Republic Services, Inc., Cl. A | | | 101,520 | | | | 4,465,865 | |
Tyco International plc | | | 485,125 | | | | 15,470,636 | |
Waste Connections, Inc. | | | 127,080 | | | | 7,157,146 | |
| | | | | | | 27,093,647 | |
| | | | | | | | | |
Industrial Conglomerates—4.0% | |
General Electric Co. | | | 1,587,970 | | | | 49,465,265 | |
| | | | | | | | | |
Machinery—1.1% | |
Deere & Co. | | | 184,780 | | | | 14,093,171 | |
| | | | | | | | | |
Professional Services—1.3% | |
Nielsen Holdings plc | | | 333,990 | | | | 15,563,934 | |
| | | | | | | | | |
Road & Rail—2.2% | |
Canadian National Railway Co. | | | 239,880 | | | | 13,404,494 | |
Canadian Pacific Railway Ltd. | | | 47,130 | | | | 6,013,788 | |
CSX Corp. | | | 285,190 | | | | 7,400,681 | |
| | | | | | | 26,818,963 | |
| | | | | | | | | |
Information Technology—18.4% | |
Internet Software & Services—6.9% | |
Alphabet, Inc., Cl. C1 | | | 85,047 | | | | 64,540,468 | |
Facebook, Inc., Cl. A1 | | | 189,370 | | | | 19,819,464 | |
| | | | | | | 84,359,932 | |
| | | | | | | | | |
IT Services—5.3% | |
Amdocs Ltd. | | | 415,960 | | | | 22,698,937 | |
MasterCard, Inc., Cl. A | | | 84,470 | | | | 8,223,999 | |
PayPal Holdings, Inc.1 | | | 614,070 | | | | 22,229,334 | |
Xerox Corp. | | | 1,193,957 | | | | 12,691,763 | |
| | | | | | | 65,844,033 | |
| | | | | | | | | |
Semiconductors & Semiconductor Equipment—0.8% | |
Applied Materials, Inc. | | | 525,000 | | | | 9,801,750 | |
| | | | | | | | | |
Technology Hardware, Storage & Peripherals—5.4% | |
Apple, Inc. | | | 542,286 | | | | 57,081,024 | |
Western Digital Corp. | | | 161,940 | | | | 9,724,497 | |
| | | | | | | 66,805,521 | |
7 OPPENHEIMER MAIN STREET FUND/VA
STATEMENT OF INVESTMENTS Continued
| | | | | | | | | | |
| | | Shares | | | Value | | | |
Materials—1.7% | | | | | | | | | | |
Chemicals—0.6% | | | | | | | | | | |
PPG Industries, Inc. | | | 81,370 | | | $ | 8,040,983 | | | |
| | | | | | | | | | | |
Construction Materials—1.0% | | | | | | | | | | |
Vulcan Materials Co. | | | 132,900 | | | | 12,621,513 | | | |
| | | | | | | | | | | |
Metals & Mining—0.1% | | | | | | | | | | |
Teck Resources Ltd., Cl. B | | | 206,560 | | | | 797,322 | | | |
| | | | | | | | | | | |
Telecommunication Services—1.7% | | | |
Diversified Telecommunication Services—1.7% | | | |
Verizon Communications, Inc. | | | 441,750 | | | | 20,417,685 | | | |
| | | | | | | | | | |
| | | | | | | | | | |
| | | | | | | | | | |
| | | | | | | | | | |
| | | | | | | | | | |
| | | | | | | | | | |
| | | | | | | | | | |
| | | | | | | | |
| | | Shares | | | Value | |
Utilities—3.1% | | | | | | | | |
Electric Utilities—0.4% | | | | | | | | |
ITC Holdings Corp. | | | 116,850 | | | $ | 4,586,363 | |
| | | | | | | | | |
Gas Utilities—0.5% | | | | | | | | |
AmeriGas Partners LP2 | | | 171,215 | | | | 5,867,538 | |
| | | | | | | | | |
Multi-Utilities—2.2% | | | | | | | | |
PG&E Corp. | | | 510,460 | | | | 27,151,367 | |
Total Common Stocks (Cost $942,986,384) | | | | 1,205,256,871 | |
| | | | | | | | | |
Investment Company—1.5% | |
| Oppenheimer Institutional Money Market Fund, Cl. E, 0.30%3,4 (Cost $18,174,708) | | | 18,174,708 | | | | 18,174,708 | |
| | | | | | | | | |
Total Investments, at Value
(Cost $961,161,092) | | | 99.2% | | | | 1,223,431,579 | |
Net Other Assets (Liabilities) | | | 0.8 | | | | 10,352,648 | |
Net Assets | | | 100.0% | | | $ | 1,233,784,227 | |
| | | | | | | | |
Footnotes to Statement of Investments
1. Non-income producing security.
2. Security is a Master Limited Partnership.
3. Is or was an affiliate, as defined in the Investment Company Act of 1940, as amended, at or during the reporting period, by virtue of the Fund owning at least 5% of the voting securities of the issuer or as a result of the Fund and the issuer having the same investment adviser. Transactions during the reporting period in which the issuer was an affiliate are as follows:
| | | | | | | | | | | | | | | | |
| | | Shares
December 31, 2014 | | | Gross
Additions | | | Gross Reductions | | | Shares
December 31, 2015 | |
Oppenheimer Institutional Money Market Fund, Cl. E | | | 26,546,400 | | | | 328,411,595 | | | | 336,783,287 | | | | 18,174,708 | |
| | | | |
| | | | | | | | | Value | | | Income | |
Oppenheimer Institutional Money Market Fund, Cl. E | | | | | | | | | | $ | 18,174,708 | | | $ | 29,026 | |
4. Rate shown is the 7-day yield at period end.
See accompanying Notes to Financial Statements.
8 OPPENHEIMER MAIN STREET FUND/VA
STATEMENT OF ASSETS OF LIABILITIES December 31, 2015
| | | | |
Assets | | | | |
Investments, at value—see accompanying statement of investments: | | | | |
Unaffiliated companies (cost $942,986,384) | | $ | 1,205,256,871 | |
Affiliated companies (cost $18,174,708) | | | 18,174,708 | |
| | | | 1,223,431,579 | |
Cash | | | 748,259 | |
Receivables and other assets: | | | | |
Investments sold | | | 6,734,286 | |
Dividends | | | 3,512,525 | |
Shares of beneficial interest sold | | | 1,277,285 | |
Other | | | 83,469 | |
Total assets | | | 1,235,787,403 | |
Liabilities | | | | |
Payables and other liabilities: | | | | |
Investments purchased | | | 981,463 | |
Shares of beneficial interest redeemed | | | 703,737 | |
Distribution and service plan fees | | | 154,733 | |
Trustees’ compensation | | | 76,046 | |
Shareholder communications | | | 53,084 | |
Other | | | 34,113 | |
Total liabilities | | | 2,003,176 | |
Net Assets | | $ | 1,233,784,227 | |
| | | | |
| | | | |
Composition of Net Assets | | | | |
Par value of shares of beneficial interest | | $ | 42,415 | |
Additional paid-in capital | | | 818,915,683 | |
Accumulated net investment income | | | 11,585,433 | |
Accumulated net realized gain on investments and foreign currency transactions | | | 140,984,216 | |
Net unrealized appreciation on investments and translation of assets and liabilities denominated in foreign currencies | | | 262,256,480 | |
Net Assets | | $ | 1,233,784,227 | |
| | | | |
| | | | |
Net Asset Value Per Share | | | | |
Non-Service Shares: | | | | |
Net asset value, redemption price per share and offering price per share (based on net assets of $518,456,257 and 17,730,405 shares of beneficial interest outstanding) | | | $29.24 | |
Service Shares: | | | | |
Net asset value, redemption price per share and offering price per share (based on net assets of $715,327,970 and 24,684,458 shares of beneficial interest outstanding) | | | $28.98 | |
See accompanying Notes to Financial Statements.
9 OPPENHEIMER MAIN STREET FUND/VA
STATEMENT OF OPERATIONS For the Year Ended December 31, 2015
| | | | |
Investment Income | | | | |
Dividends: | | | | |
Unaffiliated companies (net of foreign withholding taxes of $217,565) | | $ | 23,709,510 | |
Affiliated companies | | | 29,026 | |
Interest | | | 492 | |
Total investment income | | | 23,739,028 | |
Expenses | | | | |
Management fees | | | 8,575,831 | |
Distribution and service plan fees—Service shares | | | 1,893,943 | |
Transfer and shareholder servicing agent fees: | | | | |
Non-Service shares | | | 541,451 | |
Service shares | | | 757,830 | |
Shareholder communications: | | | | |
Non-Service shares | | | 42,730 | |
Service shares | | | 59,625 | |
Borrowing fees | | | 9,318 | |
Custodian fees and expenses | | | 10,427 | |
Trustees’ compensation | | | 44,388 | |
Other | | | 78,297 | |
Total expenses | | | 12,013,840 | |
Less reduction to custodian expenses | | | (335) | |
Less waivers and reimbursements of expenses | | | (17,882) | |
Net expenses | | | 11,995,623 | |
Net Investment Income | | | 11,743,405 | |
Realized and Unrealized Gain (Loss) | | | | |
Net realized gain (loss) on: | | | | |
Investments from unaffiliated companies | | | 162,468,446 | |
Foreign currency transactions | | | (25,652) | |
Net realized gain | | | 162,442,794 | |
Net change in unrealized appreciation/depreciation on: | | | | |
Investments | | | (136,109,854) | |
Translation of assets and liabilities denominated in foreign currencies | | | 3,102,168 | |
Net change in unrealized appreciation/depreciation | | | (133,007,686) | |
Net Increase in Net Assets Resulting from Operations | | $ | 41,178,513 | |
| | | | |
See accompanying Notes to Financial Statements.
10 OPPENHEIMER MAIN STREET FUND/VA
STATEMENTS OF CHANGES IN NET ASSETS
| | | | | | | | | | |
| | | Year Ended
December 31, 2015 | | | | | Year Ended
December 31, 2014 | |
Operations | | | | | | | | | | |
Net investment income | | $ | 11,743,405 | | | | | $ | 9,960,183 | |
Net realized gain | | | 162,442,794 | | | | | | 220,233,059 | |
Net change in unrealized appreciation/depreciation | | | (133,007,686) | | | | | | (89,842,290) | |
| | | | | | | | | | |
Net increase in net assets resulting from operations | | | 41,178,513 | | | | | | 140,350,952 | |
| | | | | | | | | | |
Dividends and/or Distributions to Shareholders | | | | | | | | | | |
Dividends from net investment income: | | | | | | | | | | |
Non-Service shares | | | (5,010,080) | | | | | | (4,609,193) | |
Service shares | | | (4,935,637) | | | | | | (4,984,596) | |
| | | | | | | | | | |
| | | (9,945,717) | | | | | | (9,593,789) | |
Distributions from net realized gain: | | | | | | | | | | |
Non-Service shares | | | (81,805,950) | | | | | | (11,141,625) | |
Service shares | | | (115,456,402) | | | | | | (17,524,841) | |
| | | | | | | | | | |
| | | (197,262,352) | | | | | | (28,666,466) | |
Beneficial Interest Transactions | | | | | | | | | | |
Net increase (decrease) in net assets resulting from beneficial interest transactions: | | | | | | | | | | |
Non-Service shares | | | 27,294,558 | | | | | | (41,637,582) | |
Service shares | | | 6,563,579 | | | | | | (170,539,977) | |
| | | | | | | | | | |
| | | 33,858,137 | | | | | | (212,177,559) | |
Net Assets | | | | | | | | | | |
Total decrease | | | (132,171,419) | | | | | | (110,086,862) | |
Beginning of period | | | 1,365,955,646 | | | | | | 1,476,042,508 | |
| | | | | | | | | | |
| | | |
End of period (including accumulated net investment income of $11,585,433 and $9,807,537, respectively) | | $ | 1,233,784,227 | | | | | $ | 1,365,955,646 | |
| | | | |
See accompanying Notes to Financial Statements.
11 OPPENHEIMER MAIN STREET FUND/VA
FINANCIAL HIGHLIGHTS
| | | | | | | | | | | | | | | | | | | | |
| Non-Service Shares | | Year Ended
December
31, 2015 | | | Year Ended
December
31, 2014 | | | Year Ended
December
31, 2013 | | | Year Ended
December
31, 2012 | | | Year Ended
December
30, 20111 | |
Per Share Operating Data | | | | | | | | | | | | | | | | | | | | |
Net asset value, beginning of period | | $ | 33.61 | | | $ | 31.24 | | | $ | 23.97 | | | $ | 20.71 | | | $ | 20.88 | |
Income (loss) from investment operations: | | | | | | | | | | | | | | | | | | | | |
Net investment income2 | | | 0.33 | | | | 0.28 | | | | 0.24 | | | | 0.26 | | | | 0.16 | |
Net realized and unrealized gain (loss) | | | 0.80 | | | | 3.01 | | | | 7.33 | | | | 3.22 | | | | (0.16) | |
Total from investment operations | | | 1.13 | | | | 3.29 | | | | 7.57 | | | | 3.48 | | | | 0.00 | |
Dividends and/or distributions to shareholders: | | | | | | | | | | | | | | | | | | | | |
Dividends from net investment income | | | (0.32) | | | | (0.27) | | | | (0.30) | | | | (0.22) | | | | (0.17) | |
Distributions from net realized gain | | | (5.18) | | | | (0.65) | | | | 0.00 | | | | 0.00 | | | | 0.00 | |
Total dividends and/or distributions to shareholders | | | (5.50) | | | | (0.92) | | | | (0.30) | | | | (0.22) | | | | (0.17) | |
Net asset value, end of period | | $ | 29.24 | | | $ | 33.61 | | | $ | 31.24 | | | $ | 23.97 | | | $ | 20.71 | |
| | | | | | | | | | | | | | | | | | | | |
| | | | |
Total Return, at Net Asset Value3 | | | 3.33% | | | | 10.70% | | | | 31.77% | | | | 16.87% | | | | (0.01)% | |
| | | | |
Ratios/Supplemental Data | | | | | | | | | | | | | | | | | | | | |
Net assets, end of period (in thousands) | | $ | 518,456 | | | $ | 559,933 | | | $ | 561,016 | | | $ | 481,089 | | | $ | 392,861 | |
Average net assets (in thousands) | | $ | 541,020 | | | $ | 554,449 | | | $ | 517,750 | | | $ | 466,231 | | | $ | 426,354 | |
Ratios to average net assets:4 | | | | | | | | | | | | | | | | | | | | |
Net investment income | | | 1.05% | | | | 0.86% | | | | 0.87% | | | | 1.12% | | | | 0.79% | |
Expenses excluding interest and fees from borrowings | | | 0.78% | | | | 0.77% | | | | 0.78% | | | | 0.78% | | | | 0.78% | |
Interest and fees from borrowings | | | 0.00%5 | | | | 0.00% | | | | 0.00% | | | | 0.00% | | | | 0.00% | |
Total expenses6 | | | 0.78% | | | | 0.77% | | | | 0.78% | | | | 0.78% | | | | 0.78% | |
Expenses after payments, waivers and/or reimbursements and reduction to custodian expenses | | | 0.78% | | | | 0.77% | | | | 0.78% | | | | 0.78% | | | | 0.78% | |
| Portfolio turnover rate | | | 44% | | | | 43% | | | | 49% | | | | 37% | | | | 38% | |
1. December 30, 2011 represents the last business day of the Fund’s reporting period. See Note 2 of the accompanying Notes.
2. Per share amounts calculated based on the average shares outstanding during the period.
3. Assumes an initial investment on the business day before the first day of the fiscal period, with all dividends and distributions reinvested in additional shares on the reinvestment date, and redemption at the net asset value calculated on the last business day of the fiscal period. Total returns are not annualized for periods less than one full year. Total return information does not reflect expenses that apply at the separate account level or to related insurance products. Inclusion of these charges would reduce the total return figures for all periods shown. Returns do not reflect the deduction of taxes that a shareholder would pay on fund distributions or the redemption of fund shares.
4. Annualized for periods less than one full year.
5. Less than 0.005%.
6. Total expenses including indirect expenses from affiliated fund fees and expenses were as follows:
| | | | | | | | |
| | Year Ended December 31, 2015 | | | 0.78 | % | | |
| | Year Ended December 31, 2014 | | | 0.77 | % | | |
| | Year Ended December 31, 2013 | | | 0.78 | % | | |
| | Year Ended December 31, 2012 | | | 0.78 | % | | |
| | Year Ended December 30, 2011 | | | 0.78 | % | | |
See accompanying Notes to Financial Statements.
12 OPPENHEIMER MAIN STREET FUND/VA
| | | | | | | | | | | | | | | | | | | | |
| Service Shares | | Year Ended
December
31, 2015 | | | Year Ended
December
31, 2014 | | | Year Ended
December
31, 2013 | | | Year Ended
December
31, 2012 | | | Year Ended
December 30, 20111 | |
Per Share Operating Data | | | | | | | | | | | | | | | | | | | | |
Net asset value, beginning of period | | $ | 33.33 | | | $ | 30.99 | | | $ | 23.78 | | | $ | 20.53 | | | $ | 20.71 | |
Income (loss) from investment operations: | | | | | | | | | | | | | | | | | | | | |
Net investment income2 | | | 0.25 | | | | 0.19 | | | | 0.17 | | | | 0.20 | | | | 0.114 | |
Net realized and unrealized gain (loss) | | | 0.80 | | | | 2.99 | | | | 7.27 | | | | 3.20 | | | | (0.17) | |
Total from investment operations | | | 1.05 | | | | 3.18 | | | | 7.44 | | | | 3.40 | | | | (0.06) | |
Dividends and/or distributions to shareholders: | | | | | | | | | | | | | | | | | | | | |
Dividends from net investment income | | | (0.22) | | | | (0.19) | | | | (0.23) | | | | (0.15) | | | | (0.12) | |
Distributions from net realized gain | | | (5.18) | | | | (0.65) | | | | 0.00 | | | | 0.00 | | | | 0.00 | |
Total dividends and/or distributions to shareholders | | | (5.40) | | | | (0.84) | | | | (0.23) | | | | (0.15) | | | | (0.12) | |
Net asset value, end of period | | $ | 28.98 | | | $ | 33.33 | | | $ | 30.99 | | | $ | 23.78 | | | $ | 20.53 | |
| | | | |
| | | | |
Total Return, at Net Asset Value3 | | | 3.11% | | | | 10.40% | | | | 31.44% | | | | 16.61% | | | | (0.32)% | |
| | | | |
Ratios/Supplemental Data | | | | | | | | | | | | | | | | | | | | |
Net assets, end of period (in thousands) | | $ | 715,328 | | | $ | 806,023 | | | $ | 915,027 | | | $ | 869,372 | | | $ | 1,003,184 | |
Average net assets (in thousands) | | $ | 757,218 | | | $ | 856,467 | | | $ | 895,073 | | | $ | 913,871 | | | $ | 1,094,254 | |
Ratios to average net assets:4 | | | | | | | | | | | | | | | | | | | | |
Net investment income | | | 0.80% | | | | 0.61% | | | | 0.62% | | | | 0.85% | | | | 0.54% | |
Expenses excluding interest and fees from borrowings | | | 1.03% | | | | 1.02% | | | | 1.04% | | | | 1.03% | | | | 1.03% | |
Interest and fees from borrowings | | | 0.00%5 | | | | 0.00% | | | | 0.00% | | | | 0.00% | | | | 0.00% | |
Total expenses6 | | | 1.03% | | | | 1.02% | | | | 1.04% | | | | 1.03% | | | | 1.03% | |
| Expenses after payments, waivers and/or reimbursements and reduction to custodian expenses | | | 1.03% | | | | 1.02% | | | | 1.04% | | | | 1.03% | | | | 1.03% | |
| Portfolio turnover rate | | | 44% | | | | 43% | | | | 49% | | | | 37% | | | | 38% | |
1. December 30, 2011 represents the last business day of the Fund’s reporting period. See Note 2 of the accompanying Notes.
2. Per share amounts calculated based on the average shares outstanding during the period.
3. Assumes an initial investment on the business day before the first day of the fiscal period, with all dividends and distributions reinvested in additional shares on the reinvestment date, and redemption at the net asset value calculated on the last business day of the fiscal period. Total returns are not annualized for periods less than one full year. Total return information does not reflect expenses that apply at the separate account level or to related insurance products. Inclusion of these charges would reduce the total return figures for all periods shown. Returns do not reflect the deduction of taxes that a shareholder would pay on fund distributions or the redemption of fund shares.
4. Annualized for periods less than one full year.
5. Less than 0.005%.
6. Total expenses including indirect expenses from affiliated fund fees and expenses were as follows:
| | | | | | | | |
| | Year Ended December 31, 2015 | | | 1.03 | % | | |
| | Year Ended December 31, 2014 | | | 1.02 | % | | |
| | Year Ended December 31, 2013 | | | 1.04 | % | | |
| | Year Ended December 31, 2012 | | | 1.03 | % | | |
| | Year Ended December 30, 2011 | | | 1.03 | % | | |
See accompanying Notes to Financial Statements.
13 OPPENHEIMER MAIN STREET FUND/VA
NOTES TO FINANCIAL STATEMENTS December 31, 2015
1. Organization
Oppenheimer Main Street Fund/VA (the “Fund”), a separate series of Oppenheimer Variable Account Funds, is a diversified open-end management investment company registered under the Investment Company Act of 1940 (“1940 Act”), as amended. The Fund’s investment objective is to seek capital appreciation. The Fund’s investment adviser is OFI Global Asset Management, Inc. (“OFI Global” or the “Manager”), a wholly-owned subsidiary of OppenheimerFunds, Inc. (“OFI” or the “Sub-Adviser”). The Manager has entered into a sub-advisory agreement with OFI. Shares of the Fund are sold only to separate accounts of life insurance companies.
The Fund offers two classes of shares. Both classes are sold at their offering price, which is the net asset value per share, to separate investment accounts of participating insurance companies as an underlying investment for variable life insurance policies, variable annuity contracts or other investment products. The class of shares designated as Service shares is subject to a distribution and service plan. Both classes of shares have identical rights and voting privileges with respect to the Fund in general and exclusive voting rights on matters that affect that class alone. Earnings, net assets and net asset value per share may differ due to each class having its own expenses, such as transfer and shareholder servicing agent fees and shareholder communications, directly attributable to that class.
The following is a summary of significant accounting policies followed in the Fund’s preparation of financial statements in accordance with accounting principles generally accepted in the United States (“U.S. GAAP”).
2. Significant Accounting Policies
Security Valuation. All investments in securities are recorded at their estimated fair value, as described in Note 3.
Reporting Period End Date. The last day of the Fund’s reporting period is the last day the New York Stock Exchange was open for trading during the period. The Fund’s financial statements have been presented through that date to maintain consistency with the Fund’s net asset value calculations used for shareholder transactions.
Foreign Currency Translation. The Fund’s accounting records are maintained in U.S. dollars. The values of securities denominated in foreign currencies and amounts related to the purchase and sale of foreign securities and foreign investment income are translated into U.S. dollars as of the close of the New York Stock Exchange (the “Exchange”), normally 4:00 P.M. Eastern time, on each day the Exchange is open for trading. Foreign exchange rates may be valued primarily using a reliable bank, dealer or service authorized by the Board of Trustees.
Reported net realized gains and losses from foreign currency transactions arise from sales of portfolio securities, sales and maturities of short-term securities, sales of foreign currencies, exchange rate fluctuations between the trade and settlement dates on securities transactions, and the difference between the amounts of dividends, interest, and foreign withholding taxes recorded on the Fund’s books and the U.S. dollar equivalent of the amounts actually received or paid. Net unrealized appreciation and depreciation on the translation of assets and liabilities denominated in foreign currencies arise from changes in the values of assets and liabilities, including investments in securities at fiscal period end, resulting from changes in exchange rates.
The effect of changes in foreign currency exchange rates on investments is separately identified from the fluctuations arising from changes in market values of securities held and reported with all other foreign currency gains and losses in the Fund’s Statement of Operations.
Allocation of Income, Expenses, Gains and Losses. Income, expenses (other than those attributable to a specific class), gains and losses are allocated on a daily basis to each class of shares based upon the relative proportion of net assets represented by such class. Operating expenses directly attributable to a specific class are charged against the operations of that class.
Dividends and Distributions to Shareholders. Dividends and distributions to shareholders, which are determined in accordance with income tax regulations and may differ from U.S. GAAP, are recorded on the ex-dividend date. Income and capital gain distributions, if any, are declared and paid annually or at other times as deemed necessary by the Manager.
Investment Income. Dividend income is recorded on the ex-dividend date or upon ex-dividend notification in the case of certain foreign dividends where the ex-dividend date may have passed. Non-cash dividends included in dividend income, if any, are recorded at the fair market value of the securities received. Interest income is recognized on an accrual basis. Discount and premium, which are included in interest income on the Statement of Operations, are amortized or accreted daily.
Return of Capital Estimates. Distributions received from the Fund’s investments in Master Limited Partnerships (MLPs) and Real Estate Investments Trusts (REITs), generally are comprised of income and return of capital. The Fund records investment income and return of capital based on estimates. Such estimates are based on historical information available from each MLP, REIT and other industry sources. These estimates may subsequently be revised based on information received from MLPs and REITs after their tax reporting periods are concluded.
Custodian Fees. “Custodian fees and expenses” in the Statement of Operations may include interest expense incurred by the Fund on any cash overdrafts of its custodian account during the period. Such cash overdrafts may result from the effects of failed trades in portfolio securities and from cash outflows resulting from unanticipated shareholder redemption activity. The Fund pays interest to its custodian on such cash overdrafts, to the extent they are not offset by positive cash balances maintained by the Fund, at a rate equal to the Federal Funds Rate plus 0.50%. The “Reduction to custodian
14 OPPENHEIMER MAIN STREET FUND/VA
2. Significant Accounting Policies (Continued)
expenses” line item, if applicable, represents earnings on cash balances maintained by the Fund during the period. Such interest expense and other custodian fees may be paid with these earnings.
Security Transactions. Security transactions are recorded on the trade date. Realized gains and losses on securities sold are determined on the basis of identified cost.
Indemnifications. The Fund’s organizational documents provide current and former Trustees and officers with a limited indemnification against liabilities arising in connection with the performance of their duties to the Fund. In the normal course of business, the Fund may also enter into contracts that provide general indemnifications. The Fund’s maximum exposure under these arrangements is unknown as this would be dependent on future claims that may be made against the Fund. The risk of material loss from such claims is considered remote.
Federal Taxes. The Fund intends to comply with provisions of the Internal Revenue Code applicable to regulated investment companies and to distribute substantially all of its investment company taxable income, including any net realized gain on investments not offset by capital loss carryforwards, if any, to shareholders. Therefore, no federal income or excise tax provision is required. The Fund files income tax returns in U.S. federal and applicable state jurisdictions. The statute of limitations on the Fund’s tax return filings generally remains open for the three preceding fiscal reporting period ends.
The tax components of capital shown in the following table represent distribution requirements the Fund must satisfy under the income tax regulations, losses the Fund may be able to offset against income and gains realized in future years and unrealized appreciation or depreciation of securities and other investments for federal income tax purposes.
| | | | | | | | | | | | |
Undistributed Net Investment Income | | Undistributed
Long-Term
Gain | | | Accumulated
Loss
Carryforward1,2,3 | | | Net Unrealized
Appreciation
Based on cost of
Securities and
Other Investments
for Federal Income
Tax Purposes | |
$15,930,686 | | $ | 140,247,071 | | | | $2,513,988 | | | | $261,238,399 | |
1. At period end, the Fund had $2,513,988 of net capital loss carryforward available to offset future realized capital gains, if any, and thereby reduce future taxable gain distributions. Details of the capital loss carryforwards are included in the table below. Capital loss carryovers with no expiration, if any, must be utilized prior to those with expiration dates.
| | | | |
Expiring | | | | |
2016 | | $ | 2,513,988 | |
Of these losses, $2,513,988 are subject to loss limitation rules resulting from merger activity. These limitations generally reduce the utilization of these losses to a maximum of $2,513,988 per year.
2. During the reporting period, the Fund utilized $2,513,988 of capital loss carryforward to offset capital gains realized in that fiscal year.
3. During the previous reporting period, the Fund utilized $2,513,988 of capital loss carryforward to offset capital gains realized in that fiscal year.
Net investment income (loss) and net realized gain (loss) may differ for financial statement and tax purposes. The character of dividends and distributions made during the fiscal year from net investment income or net realized gains are determined in accordance with federal income tax requirements, which may differ from the character of net investment income or net realized gains presented in those financial statements in accordance with U.S. GAAP. Also, due to timing of dividends and distributions, the fiscal year in which amounts are distributed may differ from the fiscal year in which the income or net realized gain was recorded by the Fund.
Accordingly, the following amounts have been reclassified for the reporting period. Net assets of the Fund were unaffected by the reclassifications.
| | | | | | | | |
Increase to Paid-in Capital | | Reduction
to Accumulated
Net Investment
Income | | | Reduction
to Accumulated
Net Realized
Gain on
Investments4 | |
$14,546,380 | | | $19,792 | | | | $14,526,588 | |
4. $14,547,167, including $14,117,424 of long-term capital gain, was distributed in connection with Fund share redemptions.
The tax character of distributions paid during the reporting periods:
| | | | | | | | |
| | | Year Ended
December 31, 2015 | | | Year Ended
December 31, 2014 | |
Distributions paid from: | | | | | | | | |
Ordinary income | | $ | 39,268,736 | | | $ | 9,593,789 | |
Long-term capital gain | | | 167,939,333 | | | | 28,666,466 | |
| | | | |
Total | | $ | 207,208,069 | | | $ | 38,260,255 | |
| | | | |
15 OPPENHEIMER MAIN STREET FUND/VA
NOTES TO FINANCIAL STATEMENTS Continued
2. Significant Accounting Policies (Continued)
The aggregate cost of securities and other investments and the composition of unrealized appreciation and depreciation of securities and other investments for federal income tax purposes at period end are noted in the following table. The primary difference between book and tax appreciation or depreciation of securities and other investments, if applicable, is attributable to the tax deferral of losses or tax realization of financial statement unrealized gain or loss.
| | | | |
Federal tax cost of securities | | $ | 962,179,173 | |
| | | | |
Gross unrealized appreciation | | $ | 302,133,017 | |
Gross unrealized depreciation | | | (40,894,618) | |
| | | | |
Net unrealized appreciation | | $ | 261,238,399 | |
| | | | |
Use of Estimates. The preparation of financial statements in conformity with U.S. GAAP requires management to make estimates and assumptions that affect the reported amounts of assets and liabilities and disclosure of contingent assets and liabilities at the date of the financial statements and the reported amounts of increases and decreases in net assets from operations during the reporting period. Actual results could differ from those estimates.
3. Securities Valuation
The Fund calculates the net asset value of its shares as of the close of the New York Stock Exchange (the “Exchange”), normally 4:00 P.M. Eastern time, on each day the Exchange is open for trading, except in the case of a scheduled early closing of the Exchange, in which case the Fund will calculate net asset value of the shares as of the scheduled early closing time of the Exchange.
The Fund’s Board has adopted procedures for the valuation of the Fund’s securities and has delegated the day-to-day responsibility for valuation determinations under those procedures to the Manager. The Manager has established a Valuation Committee which is responsible for determining a “fair valuation” for any security for which market quotations are not “readily available.” The Valuation Committee’s fair valuation determinations are subject to review, approval and ratification by the Fund’s Board at its next regularly scheduled meeting covering the calendar quarter in which the fair valuation was determined.
Valuation Methods and Inputs
Securities are valued using unadjusted quoted market prices, when available, as supplied primarily by third party pricing services or dealers.
The following methodologies are used to determine the market value or the fair value of the types of securities described below:
Securities traded on a registered U.S. securities exchange (including exchange-traded derivatives other than futures and futures options) are valued based on the last sale price of the security reported on the principal exchange on which it is traded, prior to the time when the Fund’s assets are valued. In the absence of a sale, the security is valued at the mean between the bid and asked price on the principal exchange or, if not available from the principal exchange, obtained from two dealers. If bid and asked prices are not available from either the exchange or two dealers, the security is valued by using one of the following methodologies (listed in order of priority): (1) a bid from the principal exchange, (2) the mean between the bid and asked price as provided by a single dealer, or (3) a bid from a single dealer. A security of a foreign issuer traded on a foreign exchange, but not listed on a registered U.S. securities exchange, is valued based on the last sale price on the principal exchange on which the security is traded, as identified by the third party pricing service used by the Manager, prior to the time when the Fund’s assets are valued. If the last sale price is unavailable, the security is valued at the most recent official closing price on the principal exchange on which it is traded. If the last sales price or official closing price for a foreign security is not available, the security is valued at the mean between the bid and asked price per the exchange or, if not available from the exchange, obtained from two dealers. If bid and asked prices are not available from either the exchange or two dealers, the security is valued by using one of the following methodologies (listed in order of priority): (1) a bid from the exchange, (2) the mean between the bid and asked price as provided by a single dealer, or (3) a bid from a single dealer.
Shares of a registered investment company that are not traded on an exchange are valued at that investment company’s net asset value per share.
Corporate and government debt securities (of U.S. or foreign issuers) and municipal debt securities, event-linked bonds, loans, mortgage-backed securities, collateralized mortgage obligations, and asset-backed securities are valued at the mean between the “bid” and “asked” prices utilizing evaluated prices obtained from third party pricing services or broker-dealers who may use matrix pricing methods to determine the evaluated prices.
Short-term money market type debt securities with a remaining maturity of sixty days or less are valued at cost adjusted by the amortization of discount or premium to maturity (amortized cost), which approximates market value. Short-term debt securities with a remaining maturity in excess of sixty days are valued at the mean between the “bid” and “asked” prices utilizing evaluated prices obtained from third party pricing services or broker-dealers.
A description of the standard inputs that may generally be considered by the third party pricing vendors in determining their evaluated prices is provided below.
| | |
| Security Type | | Standard inputs generally considered by third-party pricing vendors |
| Corporate debt, government debt, municipal, mortgage-backed and asset-backed securities | | Reported trade data, broker-dealer price quotations, benchmark yields, issuer spreads on comparable securities, the credit quality, yield, maturity, and other appropriate factors. |
| Loans | | Information obtained from market participants regarding reported trade data and broker-dealer price quotations. |
Event-linked bonds | | Information obtained from market participants regarding reported trade data and broker-dealer price quotations. |
16 OPPENHEIMER MAIN STREET FUND/VA
3. Securities Valuation (Continued)
If a market value or price cannot be determined for a security using the methodologies described above, or if, in the “good faith” opinion of the Manager, the market value or price obtained does not constitute a “readily available market quotation,” or a significant event has occurred that would materially affect the value of the security, the security is fair valued either (i) by a standardized fair valuation methodology applicable to the security type or the significant event as previously approved by the Valuation Committee and the Fund’s Board or (ii) as determined in good faith by the Manager’s Valuation Committee. The Valuation Committee considers all relevant facts that are reasonably available, through either public information or information available to the Manager, when determining the fair value of a security. Fair value determinations by the Manager are subject to review, approval and ratification by the Fund’s Board at its next regularly scheduled meeting covering the calendar quarter in which the fair valuation was determined. Those fair valuation standardized methodologies include, but are not limited to, valuing securities at the last sale price or initially at cost and subsequently adjusting the value based on: changes in company specific fundamentals, changes in an appropriate securities index, or changes in the value of similar securities which may be further adjusted for any discounts related to security-specific resale restrictions. When possible, such methodologies use observable market inputs such as unadjusted quoted prices of similar securities, observable interest rates, currency rates and yield curves. The methodologies used for valuing securities are not necessarily an indication of the risks associated with investing in those securities nor can it be assured that the Fund can obtain the fair value assigned to a security if it were to sell the security.
To assess the continuing appropriateness of security valuations, the Manager, or its third party service provider who is subject to oversight by the Manager, regularly compares prior day prices, prices on comparable securities, and sale prices to the current day prices and challenges those prices exceeding certain tolerance levels with the third party pricing service or broker source. For those securities valued by fair valuations, whether through a standardized fair valuation methodology or a fair valuation determination, the Valuation Committee reviews and affirms the reasonableness of the valuations based on such methodologies and fair valuation determinations on a regular basis after considering all relevant information that is reasonably available.
Classifications
Each investment asset or liability of the Fund is assigned a level at measurement date based on the significance and source of the inputs to its valuation. Various data inputs are used in determining the value of each of the Fund’s investments as of the reporting period end. These data inputs are categorized in the following hierarchy under applicable financial accounting standards:
1) Level 1-unadjusted quoted prices in active markets for identical assets or liabilities (including securities actively traded on a securities exchange)
2) Level 2-inputs other than unadjusted quoted prices that are observable for the asset or liability (such as unadjusted quoted prices for similar assets and market corroborated inputs such as interest rates, prepayment speeds, credit risks, etc.)
3) Level 3-significant unobservable inputs (including the Manager’s own judgments about assumptions that market participants would use in pricing the asset or liability).
The inputs used for valuing securities are not necessarily an indication of the risks associated with investing in those securities.
The table below categorizes amounts that are included in the Fund’s Statement of Assets and Liabilities at period end based on valuation input level:
| | | | | | | | | | | | | | | | |
| | | Level 1— Unadjusted Quoted Prices | | | Level 2—
Other Significant
Observable Inputs | | | Level 3—
Significant
Unobservable
Inputs | | | Value | |
Assets Table | | | | | | | | | | | | | | | | |
Investments, at Value: | | | | | | | | | | | | | | | | |
Common Stocks | | | | | | | | | | | | | | | | |
Consumer Discretionary | | $ | 118,620,151 | | | $ | — | | | $ | — | | | $ | 118,620,151 | |
Consumer Staples | | | 121,898,753 | | | | 10,865,888 | | | | — | | | | 132,764,641 | |
Energy | | | 78,226,410 | | | | — | | | | — | | | | 78,226,410 | |
Financials | | | 218,697,093 | | | | — | | | | — | | | | 218,697,093 | |
Health Care | | | 193,731,654 | | | | — | | | | — | | | | 193,731,654 | |
Industrials | | | 156,922,915 | | | | — | | | | — | | | | 156,922,915 | |
Information Technology | | | 226,811,236 | | | | — | | | | — | | | | 226,811,236 | |
Materials | | | 21,459,818 | | | | — | | | | — | | | | 21,459,818 | |
Telecommunication Services | | | 20,417,685 | | | | — | | | | — | | | | 20,417,685 | |
Utilities | | | 37,605,268 | | | | — | | | | — | | | | 37,605,268 | |
Investment Company | | | 18,174,708 | | | | — | | | | — | | | | 18,174,708 | |
Total Assets | | $ | 1,212,565,691 | | | $ | 10,865,888 | | | $ | — | | | $ | 1,223,431,579 | |
Forward currency exchange contracts and futures contracts, if any, are reported at their unrealized appreciation/depreciation at measurement date, which represents the change in the contract’s value from trade date. All additional assets and liabilities included in the above table are reported at their market value at measurement date.
4. Investments and Risks
Investments in Affiliated Funds. The Fund is permitted to invest in other mutual funds advised by the Manager (“Affiliated Funds”). Affiliated Funds are open-end management investment companies registered under the 1940 Act, as amended. The Manager is the investment adviser of, and the Sub-Adviser provides investment and related advisory services to, the Affiliated Funds. When applicable, the Fund’s investments in Affiliated Funds are included in the Statement of Investments. Shares of Affiliated Funds are valued at their net asset value per share. As a shareholder, the Fund is subject to
17 OPPENHEIMER MAIN STREET FUND/VA
NOTES TO FINANCIAL STATEMENTS Continued
4. Investments and Risks (Continued)
its proportional share of the Affiliated Funds’ expenses, including their management fee. The Manager will waive fees and/or reimburse Fund expenses in an amount equal to the indirect management fees incurred through the Fund’s investment in the Affiliated Funds.
Each of the Affiliated Funds in which the Fund invests has its own investment risks, and those risks can affect the value of the Fund’s investments and therefore the value of the Fund’s shares. To the extent that the Fund invests more of its assets in one Affiliated Fund than in another, the Fund will have greater exposure to the risks of that Affiliated Fund.
Investment in Oppenheimer Institutional Money Market Fund. The Fund is permitted to invest daily available cash balances in a money market Affiliated Fund. The Fund may invest the available cash in Class E shares of Oppenheimer Institutional Money Market Fund (“IMMF”) to seek current income while preserving liquidity or for defensive purposes. IMMF is regulated as a money market fund under the Investment Company Act of 1940, as amended.
Master Limited Partnerships (“MLPs”). MLPs issue common units that represent an equity ownership interest in a partnership and provide limited voting rights. MLP common units are registered with the Securities and Exchange Commission (“SEC”), and are freely tradable on securities exchanges such as the NYSE and the NASDAQ Stock Market (“NASDAQ”), or in the over-the-counter (“OTC”) market. An MLP consists of one or more general partners, who conduct the business, and one or more limited partners, who contribute capital. MLP common unit holders have a limited role in the partnership’s operations and management. The Fund, as a limited partner, normally would not be liable for the debts of the MLP beyond the amounts the Fund has contributed, but would not be shielded to the same extent that a shareholder of a corporation would be. In certain circumstances creditors of an MLP would have the right to seek return of capital distributed to a limited partner. This right of an MLP’s creditors would continue after the Fund sold its investment in the MLP.
Equity Security Risk. Stocks and other equity securities fluctuate in price. The value of the Fund’s portfolio may be affected by changes in the equity markets generally. Equity markets may experience significant short-term volatility and may fall sharply at times. Different markets may behave differently from each other and U.S. equity markets may move in the opposite direction from one or more foreign stock markets. Adverse events in any part of the equity or fixed-income markets may have unexpected negative effects on other market segments.
The prices of individual equity securities generally do not all move in the same direction at the same time and a variety of factors can affect the price of a particular company’s securities. These factors may include, but are not limited to, poor earnings reports, a loss of customers, litigation against the company, general unfavorable performance of the company’s sector or industry, or changes in government regulations affecting the company or its industry.
5. Market Risk Factors
The Fund’s investments in securities and/or financial derivatives may expose the fund to various market risk factors:
Commodity Risk. Commodity risk relates to the change in value of commodities or commodity indexes as they relate to increases or decreases in the commodities market. Commodities are physical assets that have tangible properties. Examples of these types of assets are crude oil, heating oil, metals, livestock, and agricultural products.
Credit Risk. Credit risk relates to the ability of the issuer of debt to meet interest and principal payments, or both, as they come due. In general, lower-grade, higher-yield debt securities are subject to credit risk to a greater extent than lower-yield, higher-quality securities.
Equity Risk. Equity risk relates to the change in value of equity securities as they relate to increases or decreases in the general market.
Foreign Exchange Rate Risk. Foreign exchange rate risk relates to the change in the U.S. dollar value of a security held that is denominated in a foreign currency. The U.S. dollar value of a foreign currency denominated security will decrease as the dollar appreciates against the currency, while the U.S. dollar value will increase as the dollar depreciates against the currency.
Interest Rate Risk. Interest rate risk refers to the fluctuations in value of fixed-income securities resulting from the inverse relationship between price and yield. For example, an increase in general interest rates will tend to reduce the market value of already issued fixed-income investments, and a decline in general interest rates will tend to increase their value. In addition, debt securities with longer maturities, which tend to have higher yields, are subject to potentially greater fluctuations in value from changes in interest rates than obligations with shorter maturities.
Volatility Risk. Volatility risk refers to the magnitude of the movement, but not the direction of the movement, in a financial instrument’s price over a defined time period. Large increases or decreases in a financial instrument’s price over a relative time period typically indicate greater volatility risk, while small increases or decreases in its price typically indicate lower volatility risk.
6. Shares of Beneficial Interest
The Fund has authorized an unlimited number of $0.001 par value shares of beneficial interest of each class. Transactions in shares of beneficial interest were as follows:
18 OPPENHEIMER MAIN STREET FUND/VA
6. Shares of Beneficial Interest (Continued)
| | | | | | | | | | | | | | | | |
| | | Year Ended December 31, 2015 | | | Year Ended December 31, 2014 | |
| | | Shares | | | Amount | | | Shares | | | Amount | |
Non-Service Shares | | | | | | | | | | | | | | | | |
Sold | | | 517,352 | | | $ | 15,973,699 | | | | 649,656 | | | $ | 20,858,404 | |
Dividends and/or distributions reinvested | | | 2,966,041 | | | | 86,816,030 | | | | 493,447 | | | | 15,750,818 | |
Redeemed | | | (2,414,970) | | | | (75,495,171) | | | | (2,439,387) | | | | (78,246,804) | |
Net increase (decrease) | | | 1,068,423 | | | $ | 27,294,558 | | | | (1,296,284) | | | $ | (41,637,582) | |
| | | | | | | | | | | | | | | | |
| | | | | | | | | | | | | | | | |
| | | | | | | | | | | | | | | | | |
Service Shares | | | | | | | | | | | | | | | | |
Sold | | | 1,895,395 | | | $ | 56,747,875 | | | | 485,595 | | | $ | 15,571,150 | |
Dividends and/or distributions reinvested | | | 4,144,304 | | | | 120,392,039 | | | | 709,853 | | | | 22,509,437 | |
Redeemed | | | (5,534,911) | | | | (170,576,335) | | | | (6,541,357) | | | | (208,620,564) | |
Net increase (decrease) | | | 504,788 | | | $ | 6,563,579 | | | | (5,345,909) | | | $ | (170,539,977) | |
| | | | | | | | | | | | | | | | |
| | | | | | | | | | | | | | | | |
7. Purchases and Sales of Securities
The aggregate cost of purchases and proceeds from sales of securities, other than short-term obligations and investments in IMMF, for the reporting period were as follows:
| | | | | | | | |
| | | Purchases | | | Sales | |
Investment securities | | $ | 561,730,574 | | | $ | 723,085,015 | |
8. Fees and Other Transactions with Affiliates
Management Fees. Under the investment advisory agreement, the Fund pays the Manager a management fee based on the daily net assets of the Fund at an annual rate as shown in the following table:
| | | | | | | | |
| Fee Schedule Through October 31, 2015 | | | | Fee Schedule Effective November 1, 2015 | | | |
Up to $200 million | | 0.75% | | Up to $200 million | | | 0.75 | % |
Next $200 million | | 0.72 | | Next $200 million | | | 0.72 | |
Next $200 million | | 0.69 | | Next $200 million | | | 0.69 | |
Next $200 million | | 0.66 | | Next $200 million | | | 0.66 | |
Next $200 million | | 0.60 | | Next $200 million | | | 0.60 | |
Over $1 billion | | 0.58 | | Next $4 billion | | | 0.58 | |
| | | | Over $5 billion | | | 0.56 | |
The Fund’s effective management fee for the reporting period was 0.66% of average annual net assets before any applicable waivers.
Sub-Adviser Fees. The Manager has retained the Sub-Adviser to provide the day-to-day portfolio management of the Fund. Under the Sub-Advisory Agreement, the Manager pays the Sub-Adviser an annual fee in monthly installments, equal to a percentage of the investment management fee collected by the Manager from the Fund, which shall be calculated after any investment management fee waivers. The fee paid to the Sub-Adviser is paid by the Manager, not by the Fund.
Transfer Agent Fees. OFI Global (the “Transfer Agent”) serves as the transfer and shareholder servicing agent for the Fund. The Fund pays the Transfer Agent a fee based on annual net assets. Fees incurred and average net assets for each class with respect to these services are detailed in the Statement of Operations and Financial Highlights, respectively.
Sub-Transfer Agent Fees. The Transfer Agent has retained Shareholder Services, Inc., a wholly-owned subsidiary of OFI (the “Sub-Transfer Agent”), to provide the day-to-day transfer agent and shareholder servicing of the Fund. Under the Sub-Transfer Agency Agreement, the Transfer Agent pays the Sub-Transfer Agent an annual fee in monthly installments, equal to a percentage of the transfer agent fee collected by the Transfer Agent from the Fund, which shall be calculated after any applicable fee waivers. The fee paid to the Sub-Transfer Agent is paid by the Transfer Agent, not by the Fund.
Trustees’ Compensation. The Fund’s Board of Trustees (“Board”) has adopted a compensation deferral plan for Independent Trustees that enables Trustees to elect to defer receipt of all or a portion of the annual compensation they are entitled to receive from the Fund. For purposes of determining the amount owed to the Trustees under the plan, deferred amounts are treated as though equal dollar amounts had been invested in shares of the Fund or in other Oppenheimer funds selected by the Trustees. The Fund purchases shares of the funds selected for deferral by the Trustees in amounts equal to his or her deemed investment, resulting in a Fund asset equal to the deferred compensation liability. Such assets are included as a component of “Other” within the asset section of the Statement of Assets and Liabilities. Deferral of Trustees’ fees under the plan will not affect the net assets of the Fund and will not materially affect the Fund’s assets, liabilities or net investment income per share. Amounts will be deferred until distributed in accordance with the compensation deferral plan.
Distribution and Service Plan for Service Shares. The Fund has adopted a Distribution and Service Plan (the “Plan”) pursuant to Rule 12b-1 under the 1940 Act for Service shares to pay OppenheimerFunds Distributor, Inc. (the “Distributor”), for distribution related services, personal service and account maintenance for the Fund’s Service shares. Under the Plan, payments are made periodically at an annual rate of 0.25% of the daily net assets of
19 OPPENHEIMER MAIN STREET FUND/VA
NOTES TO FINANCIAL STATEMENTS Continued
8. Fees and Other Transactions with Affiliates (Continued)
Service shares of the Fund. The Distributor currently uses all of those fees to compensate sponsors of the insurance product that offers Fund shares, for providing personal service and maintenance of accounts of their variable contract owners that hold Service shares. These fees are paid out of the Fund’s assets on an on-going basis and increase operating expenses of the Service shares, which results in lower performance compared to the Fund’s shares that are not subject to a service fee. Fees incurred by the Fund under the Plan are detailed in the Statement of Operations.
Waivers and Reimbursements of Expenses. The Manager has voluntarily agreed to limit the Fund’s expenses after payments, waivers and/or reimbursements and reduction to custodian expenses, excluding expenses incurred directly or indirectly by the Fund as a result of investments in other investment companies, wholly-owned subsidiaries and pooled investment vehicles; so that those expenses, as percentages of daily net assets, will not exceed the annual rate of 0.80% for Non-Service shares and 1.05% for Service shares. The expense limitations do not include interest and fees from borrowing, and other expenses not incurred in the ordinary course of the Fund’s business.
The Manager will waive fees and/or reimburse Fund expenses in an amount equal to the indirect management fees incurred through the Fund’s investment in IMMF. During the reporting period, the Manager waived fees and/or reimbursed the Fund $17,882 for IMMF management fees.
Waivers and/or reimbursements may be modified or terminated as set forth according to the terms in the prospectus.
9. Borrowings and Other Financing
Joint Credit Facility. A number of mutual funds managed by the Manager participate in a $1.28 billion revolving credit facility (the “Facility”) intended to provide short-term financing, if necessary, subject to certain restrictions in connection with atypical redemption activity. Expenses and fees related to the Facility are paid by the participating funds and are disclosed separately or as other expenses on the Statement of Operations. The Fund did not utilize the Facility during the reporting period.
10. Pending Litigation
In 2009, several putative class action lawsuits were filed and later consolidated before the U.S. District Court for the District of Colorado against OppenheimerFunds, Inc. (“OFI”), OppenheimerFunds Distributor, Inc. (“OFDI”), and Oppenheimer Rochester California Municipal Fund, a fund advised by OFI Global Asset Management, Inc. and distributed by the Distributor (the “California Fund”), in connection with the California Fund’s investment performance. The plaintiffs asserted claims against OFI, OFDI and certain present and former trustees and officers of the California Fund under the federal securities laws, alleging, among other things, that the disclosure documents of the California Fund contained misrepresentations and omissions and the investment policies of the California Fund were not followed. Plaintiffs in the suit filed an amended complaint and defendants filed a motion to dismiss. In 2011, the court issued an order which granted in part and denied in part the defendants’ motion to dismiss. In 2012, plaintiffs filed a motion, which defendants opposed, to certify a class and appoint class representatives and class counsel. In March 2015, the court granted plaintiffs’ motion for class certification. In May 2015, the U.S. Court of Appeals for the Tenth Circuit vacated the class certification order and remanded the matter to the district court for further proceedings. In October 2015, the district court reaffirmed its order and determined that the suit will proceed as a class action. In December 2015, the Tenth Circuit denied defendants’ petition to appeal the district court’s reaffirmed class certification order.
OFI and OFDI believe the suit is without merit; that it is premature to render any opinion as to the likelihood of an outcome unfavorable to them in the suit; and that no estimate can yet be made as to the amount or range of any potential loss. Furthermore, OFI believes that the suit should not impair the ability of OFI or OFDI to perform their respective duties to the Fund and that the outcome of the suit should not have any material effect on the operations of any of the Oppenheimer funds.
20 OPPENHEIMER MAIN STREET FUND/VA
REPORT OF INDEPENDENT REGISTERED PUBLIC ACCOUNTING FIRM
The Board of Trustees and Shareholders of Oppenheimer Variable Account Funds:
We have audited the accompanying statement of assets and liabilities of Oppenheimer Main Street Fund/VA (a separate series of Oppenheimer Variable Account Funds), including the statement of investments, as of December 31, 2015, and the related statement of operations for the year then ended, the statements of changes in net assets for each of the years in the two-year period then ended, and the financial highlights for each of the years in the five-year period then ended. These financial statements and financial highlights are the responsibility of the Fund’s management. Our responsibility is to express an opinion on these financial statements and financial highlights based on our audits.
We conducted our audits in accordance with the standards of the Public Company Accounting Oversight Board (United States). Those standards require that we plan and perform the audit to obtain reasonable assurance about whether the financial statements and financial highlights are free of material misstatement. An audit includes examining, on a test basis, evidence supporting the amounts and disclosures in the financial statements. Our procedures included confirmation of securities owned as of December 31, 2015, by correspondence with the custodian, transfer agent and brokers, or by other appropriate auditing procedures where replies from brokers were not received. An audit also includes assessing the accounting principles used and significant estimates made by management, as well as evaluating the overall financial statement presentation. We believe that our audits provide a reasonable basis for our opinion.
In our opinion, the financial statements and financial highlights referred to above present fairly, in all material respects, the financial position of Oppenheimer Main Street Fund/VA as of December 31, 2015, the results of its operations for the year then ended, the changes in its net assets for each of the years in the two-year period then ended, and the financial highlights for each of the years in the five-year period then ended, in conformity with U.S. generally accepted accounting principles.
KPMGLLP
Denver, Colorado
February 12, 2016
21 OPPENHEIMER MAIN STREET FUND/VA
FEDERAL INCOME TAX INFORMATION Unaudited
In early 2016, if applicable, shareholders of record received information regarding all dividends and distributions paid to them by the Fund during calendar year 2015.
Capital gain distributions of $4.40761 per share were paid to Non-Service and Service shareholders, respectively, on June 16, 2015. Whether received in stock or in cash, the capital gain distribution should be treated by shareholders as a gain from the sale of the capital assets held for more than one year (long-term capital gains).
Dividends, if any, paid by the Fund during the reporting period which are not designated as capital gain distributions should be multiplied by the maximum amount allowable but not less than 100% to arrive at the amount eligible for the corporate dividend-received deduction.
The foregoing information is presented to assist shareholders in reporting distributions received from the Fund to the Internal Revenue Service. Because of the complexity of the federal regulations which may affect your individual tax return and the many variations in state and local tax regulations, we recommend that you consult your tax advisor for specific guidance.
22 OPPENHEIMER MAIN STREET FUND/VA
BOARD APPROVAL OF THE FUND’S INVESTMENT ADVISORY AND SUB-ADVISORY AGREEMENTS Unaudited
The Fund has entered into an investment advisory agreement with OFI Global Asset Management, Inc. (“OFI Global” or the “Adviser”), a wholly-owned subsidiary of OppenheimerFunds, Inc. (“OFI” or the “Sub-Adviser”) (“OFI Global” and “OFI” together the “Managers”) and OFI Global has entered into a sub-advisory agreement with OFI whereby OFI provides investment sub-advisory services to the Fund (collectively, the “Agreements”). Each year, the Board of Trustees (the “Board”), including a majority of the independent Trustees, is required to determine whether to approve the terms of the Agreements and the renewal thereof. The Investment Company Act of 1940, as amended, requires that the Board request and evaluate, and that the Managers provide, such information as may be reasonably necessary to evaluate the terms of the Agreements. The Board employs an independent consultant to prepare a report that provides information, including comparative information that the Board requests for that purpose. In addition to in-person meetings focused on this evaluation, the Board receives information throughout the year regarding Fund services, fees, expenses and performance.
The Adviser, Sub-Adviser and the independent consultant provided information to the Board on the following factors: (i) the nature, quality and extent of the Managers’ services, (ii) the comparative investment performance of the Fund and the Managers, (iii) the fees and expenses of the Fund, including comparative fee and expense information, (iv) the profitability of the Managers and their affiliates, including an analysis of the cost of providing services, (v) whether economies of scale are realized as the Fund grows and whether fee levels reflect these economies of scale for Fund investors and (vi) other benefits to the Managers from their relationship with the Fund. The Board was aware that there are alternatives to retaining the Managers.
Outlined below is a summary of the principal information considered by the Board as well as the Board’s conclusions.
Nature, Quality and Extent of Services. The Board considered information about the nature, quality and extent of the services provided to the Fund and information regarding the Managers’ key personnel who provide such services. The Managers’ duties include providing the Fund with the services of the portfolio managers and the Sub-Adviser’s investment team, who provide research, analysis and other advisory services in regard to the Fund’s investments; and securities trading services. OFI Global is responsible for oversight of third-party service providers; monitoring compliance with applicable Fund policies and procedures and adherence to the Fund’s investment restrictions; risk management; and oversight of the Sub-Adviser. OFI Global is also responsible for providing certain administrative services to the Fund as well. Those services include providing and supervising all administrative and clerical personnel who are necessary in order to provide effective corporate administration for the Fund; compiling and maintaining records with respect to the Fund’s operations; preparing and filing reports required by the U.S. Securities and Exchange Commission; preparing periodic reports regarding the operations of the Fund for its shareholders; preparing proxy materials for shareholder meetings; and preparing the registration statements required by federal and state securities laws for the sale of the Fund’s shares. OFI Global also provides the Fund with office space, facilities and equipment.
The Board also considered the quality of the services provided and the quality of the Managers’ resources that are available to the Fund. The Board took account of the fact that the Sub-Adviser has had over fifty years of experience as an investment adviser and that its assets under management rank it among the top mutual fund managers in the United States. The Board evaluated the Managers’ advisory, administrative, accounting, legal, compliance services and risk management, and information the Board has received regarding the experience and professional qualifications of the Managers’ key personnel and the size and functions of its staff. In its evaluation of the quality of the portfolio management services provided, the Board considered the experience of Manind Govil, Benjamin Ram and Paul Larson, the portfolio managers for the Fund, and the Sub-Adviser’s investment team and analysts. The Board members also considered the totality of their experiences with the Managers as directors or trustees of the Fund and other funds advised by the Managers. The Board considered information regarding the quality of services provided by affiliates of the Managers, which the Board members have become knowledgeable about through their experiences with the Managers and in connection with the renewal of the Fund’s service agreements. The Board concluded, in light of the Managers’ experience, reputation, personnel, operations and resources that the Fund benefits from the services provided under the Agreements.
Investment Performance of the Managers and the Fund. Throughout the year, the Managers provided information on the investment performance of the Fund, including comparative performance information. The Board also reviewed information, prepared by the Managers and by the independent consultant, comparing the Fund’s historical performance to relevant market indices and to the performance of other large blend funds underlying variable insurance products. The Board considered that the Fund outperformed its performance category median during the three- and five-year periods but underperformed for the one- and ten-year periods.
Fees and Expenses of the Fund. The Board reviewed the fees paid to the Adviser and the other expenses borne by the Fund. The Board noted that the Adviser, not the Fund, pays the Sub-Adviser’s fee under the sub-advisory agreement. The independent consultant provided comparative data in regard to the fees and expenses of the Fund and other large blend funds underlying variable insurance products. In reviewing the fees and expenses charged to the VA funds, the Board considered the Adviser’s assertion that, because there is much greater disparity in the fees and services that may be provided by a manager to a VA fund as opposed to a retail fund, when comparing the expenses of the various VA funds to those of retail funds, it is most appropriate to focus on total expenses (rather than on the management fees). Accordingly, while the Board reviewed and considered all expenses, it focused on total expenses. The Board considered that the Fund’s total expenses were higher than its peer group median and category median. The Board also considered that the Fund’s contractual management fee was lower than its category median and equal to its peer group median. Within the total asset range of $1 billion to $2 billion, the Fund’s effective management fee rate was higher than its peer group median and its category median. The Board noted that the Adviser has voluntarily agreed to limit the Fund’s total annual operating expenses so that those expenses, as percentages of daily net assets, will not exceed the annual rate of 0.80% for Non-Service Shares and 1.05% for Service Shares. This voluntary expense limitation may be amended or withdrawn at any time without prior notice to shareholders. The Board considered that the Adviser proposed an additional breakpoint at 0.56% for annual net assets in excess of $5 billion, which went into effect on November 1, 2015.
Economies of Scale and Profits Realized by the Managers. The Board considered information regarding the Managers’ costs in serving as the Fund’s investment adviser and sub-adviser, including the costs associated with the personnel and systems necessary to manage the Fund, and information regarding the Managers’ profitability from their relationship with the Fund. The Board reviewed whether the Managers may realize
23 OPPENHEIMER MAIN STREET FUND/VA
BOARD APPROVAL OF THE FUND’S INVESTMENT ADVISORY AND SUB-ADVISORY
AGREEMENTS Unaudited / Continued
economies of scale in managing and supporting the Fund. The Board noted that the Fund currently has management fee breakpoints, which are intended to share with Fund shareholders economies of scale that may exist as the Fund’s assets grow.
Other Benefits to the Managers. In addition to considering the profits realized by the Managers, the Board considered information that was provided regarding the direct and indirect benefits the Managers receive as a result of their relationship with the Fund, including compensation paid to the Managers’ affiliates and research provided to the Adviser in connection with permissible brokerage arrangements (soft dollar arrangements).
Conclusions. These factors were also considered by the independent Trustees meeting separately from the full Board, assisted by experienced counsel to the Fund and to the independent Trustees. Fund counsel and the independent Trustees’ counsel are independent of the Managers within the meaning and intent of the Securities and Exchange Commission Rules.
Based on its review of the information it received and its evaluations described above, the Board, including a majority of the independent Trustees, decided to continue the Agreements through August 31, 2016. In arriving at its decision, the Board did not identify any factor or factors as being more important than others, but considered all of the above information, and considered the terms and conditions of the Agreements, including the management fees, in light of all the surrounding circumstances.
24 OPPENHEIMER MAIN STREET FUND/VA
PORTFOLIO PROXY VOTING POLICIES AND PROCEDURES; UPDATES TO STATEMENTS OF INVESTMENTS Unaudited
The Fund has adopted Portfolio Proxy Voting Policies and Procedures under which the Fund votes proxies relating to securities (“portfolio proxies”) held by the Fund. A description of the Fund’s Portfolio Proxy Voting Policies and Procedures is available (i) without charge, upon request, by calling the Fund toll-free at 1.800.525.7048, (ii) on the Fund’s website at www.oppenheimerfunds.com, and (iii) on the SEC’s website at www.sec.gov. In addition, the Fund is required to file Form N-PX, with its complete proxy voting record for the 12 months ended June 30th, no later than August 31st of each year. The Fund’s voting record is available (i) without charge, upon request, by calling the Fund toll-free at 1.800.525.7048, and (ii) in the Form N-PX filing on the SEC’s website at www.sec.gov.
The Fund files its complete schedule of portfolio holdings with the SEC for the first quarter and the third quarter of each fiscal year on Form N-Q. The Fund’s Form N-Q filings are available on the SEC’s website at www.sec.gov. Those forms may be reviewed and copied at the SEC’s Public Reference Room in Washington, D.C. Information on the operation of the Public Reference Room may be obtained by calling 1-800-SEC-0330.
25 OPPENHEIMER MAIN STREET FUND/VA
TRUSTEES AND OFFICERS Unaudited
| | |
Name, Position(s) Held with the Fund, Length of
Service, Age | | Principal Occupation(s) During the Past 5 Years; Other Trusteeships/Directorships
Held; Number of Portfolios in the Fund Complex Currently Overseen |
| |
| INDEPENDENT TRUSTEES | | The address of each Trustee in the chart below is 6803 S. Tucson Way, Centennial, Colorado 80112-3924. Each Trustee serves for an indefinite term, or until his or her resignation, retirement, death or removal. |
| |
Sam Freedman, Chairman of the Board of Trustees (since 2013) and Trustee (since 1996) Year of Birth: 1940 | | Director of Colorado UpLIFT (charitable organization) (since September 1984). Mr. Freedman held several positions with the Sub-Adviser and with subsidiary or affiliated companies of the Sub-Adviser (until October 1994). Oversees 47 portfolios in the OppenheimerFunds complex. Mr. Freedman has served on the Boards of certain Oppenheimer funds since 1996, during which time he has become familiar with the Fund’s (and other Oppenheimer funds’) financial, accounting, regulatory and investment matters and has contributed to the Boards’ deliberations. |
| |
Jon S. Fossel, Trustee (since 1990) Year of Birth: 1942 | | Chairman of the Board of Jack Creek Preserve Foundation (non-profit organization) (since 2005); Chairman of the Board (2006-December 2011) and Director (June 2002-December 2011) of UNUMProvident (insurance company); Director of Northwestern Energy Corp. (public utility corporation) (November 2004-December 2009); Director of P.R. Pharmaceuticals (October 1999-October 2003); Director of Rocky Mountain Elk Foundation (non-profit organization) (February 1998-February 2003 and February 2005-February 2007); Chairman and Director (until October 1996) and President and Chief Executive Officer (until October 1995) of the Sub-Adviser; President, Chief Executive Officer and Director of the following: Oppenheimer Acquisition Corp. (“OAC”) (parent holding company of the Sub-Adviser), Shareholders Services, Inc. and Shareholder Financial Services, Inc. (until October 1995). Oversees 47 portfolios in the OppenheimerFunds complex. Mr. Fossel has served on the Boards of certain Oppenheimer funds since 1990, during which time he has become familiar with the Fund’s (and other Oppenheimer funds’) financial, accounting, regulatory and investment matters and has contributed to the Boards’ deliberations. |
| |
Richard F. Grabish, Trustee (since 2012) Year of Birth: 1948 | | Formerly Senior Vice President and Assistant Director of Sales and Marketing (March 1997-December 2007), Director (March 1987-December 2007) and Manager of Private Client Services (June 1985-June 2005) of A.G. Edwards & Sons, Inc. (broker/dealer and investment firm); Chairman and Chief Executive Officer of A.G. Edwards Trust Company, FSB (March 2001- December 2007); President and Vice Chairman of A.G. Edwards Trust Company, FSB (investment adviser) (April 1987-March 2001); President of A.G. Edwards Trust Company, FSB (investment adviser) (June 2005-December 2007). Oversees 47 portfolios in the OppenheimerFunds complex. Mr. Grabish has served on the Boards of certain Oppenheimer funds since 2001, during which time he has become familiar with the Fund’s (and other Oppenheimer funds’) financial, accounting, regulatory and investment matters and has contributed to the Boards’ deliberations. |
| |
Beverly L. Hamilton, Trustee (since 2002) Year of Birth: 1946 | | Trustee of Monterey Institute for International Studies (educational organization) (since February 2000); Board Member of Middlebury College (educational organization) (December 2005-June 2011); Chairman (since 2010) of American Funds’ Emerging Markets Growth Fund, Inc. (mutual fund); Director of The California Endowment (philanthropic organization) (April 2002-April 2008); Director (February 2002-2005) and Chairman of Trustees (2006-2007) of the Community Hospital of Monterey Peninsula; Director (October 1991-2005); Vice Chairman (2006-2009) of American Funds’ Emerging Markets Growth Fund, Inc. (mutual fund); President of ARCO Investment Management Company (February 1991-April 2000); Member of the investment committees of The Rockefeller Foundation (2001-2006) and The University of Michigan (since 2000); Advisor at Credit Suisse First Boston’s Sprout venture capital unit (venture capital fund) (1994-January 2005); Trustee of MassMutual Institutional Funds (investment company) (1996-June 2004); Trustee of MML Series Investment Fund (investment company) (April 1989-June 2004); Member of the investment committee of Hartford Hospital (2000-2003); and Advisor to Unilever (Holland) pension fund (2000-2003). Oversees 47 portfolios in the OppenheimerFunds complex. Ms. Hamilton has served on the Boards of certain Oppenheimer funds since 2002, during which time she has become familiar with the Fund’s (and other Oppenheimer funds’) financial, accounting, regulatory and investment matters and has contributed to the Boards’ deliberations. |
| |
Victoria J. Herget, Trustee (since 2012) Year of Birth:1951 | | Board Chair (2008-Present) and Director (2004-Present), United Educators (insurance company); Trustee (since 2000) and Chair (since 2010), Newberry Library (independent research library); Trustee, Mather LifeWays (senior living organization) (since 2001); Independent Director of the First American Funds (mutual fund family) (2003-2011); former Managing Director (1993-2001), Principal (1985-1993), Vice President (1978-1985) and Assistant Vice President (1973-1978) of Zurich Scudder Investments (investment adviser) (and its predecessor firms); Trustee (1992-2007), Chair of the Board of Trustees (1999-2007), Investment Committee Chair (1994-1999) and Investment Committee member (2007-2010) of Wellesley College; Trustee, BoardSource (non-profit organization) (2006-2009) and Chicago City Day School (K-8 School) (1994-2005). Oversees 47 portfolios in the OppenheimerFunds complex. Ms. Herget has served on the Boards of certain Oppenheimer funds since 2012, during which time she has become familiar with the Fund’s (and other Oppenheimer funds’) financial, accounting, regulatory and investment matters and has contributed to the Boards’ deliberations. |
| |
Robert J. Malone, Trustee (since 2002) Year of Birth: 1944 | | Chairman - Colorado Market of MidFirst Bank (since January 2015); Chairman of the Board (since 2012) and Director (since August 2005) of Jones International University (educational organization); Trustee of the Gallagher Family Foundation (non-profit organization) (2000-2015); Chairman, Chief Executive Officer and Director of Steele Street Bank Trust (commercial banking) (August 2003-January 2015); Board of Directors of Opera Colorado Foundation (non-profit organization) (2008- 2012); Director of Colorado UpLIFT (charitable organization) (1986-2010); Director of Jones Knowledge, Inc. (2006-2010); Former Chairman of U.S. Bank-Colorado (subsidiary of U.S. Bancorp and formerly Colorado National Bank) (July 1996-April 1999); Director of Commercial Assets, Inc. (real estate investment trust) (1993-2000); Director of U.S. Exploration, Inc. (oil and gas exploration) (1997-February 2004); Chairman of the Board (1991-1994) and Trustee (1985-1994) of Regis University; and Chairman of the Board (1990-1991 and Trustee (1984-1999) of Young Presidents Organization. Oversees 47 portfolios in the OppenheimerFunds complex. Mr. Malone has served on the Boards of certain Oppenheimer funds since 2002, during which time he has become familiar with the Fund’s (and other Oppenheimer funds’) financial, accounting, regulatory and investment matters and has contributed to the Boards’ deliberations. |
26 OPPENHEIMER MAIN STREET FUND/VA
| | |
| |
F. William Marshall, Jr., Trustee (since 2000) Year of Birth: 1942 | | Trustee Emeritus of Worcester Polytech Institute (WPI) (private university) (since 2009); Trustee of MassMutual Select Funds (formerly MassMutual Institutional Funds) (investment company) (since 1996), MML Series Investment Fund (investment company) (since 1996) and Mass Mutual Premier Funds (investment company) (since January 2012); President and Treasurer of the SIS Funds (private charitable fund) (January 1999-March 2011); Former Trustee of WPI (1985-2008); Former Chairman of the Board (2004-2006) and Former Chairman of the Investment Committee of WPI (1994-2008); Chairman of SIS Family Bank, F.S.B. (formerly SIS Bank) (commercial bank) (January 1999-July 1999); Executive Vice President of Peoples Heritage Financial Group, Inc. (commercial bank) (January 1999-July 1999); and Former President and Chief Executive Officer of SIS Bancorp. (1993-1999). Oversees 47 portfolios in the OppenheimerFunds complex. Mr. Marshall has served on the Boards of certain Oppenheimer funds since 2000, during which time he has become familiar with the Fund’s (and other Oppenheimer funds’) financial, accounting, regulatory and investment matters and has contributed to the Boards’ deliberations. |
| |
Karen L. Stuckey, Trustee (since 2012) Year of Birth: 1953 | | Partner (1990-2012) of PricewaterhouseCoopers LLP (professional services firm) (held various positions 1975-1990); Trustee (1992-2006) and member of Executive, Nominating and Audit Committees and Chair of Finance Committee of Lehigh University; and member, Women’s Investment Management Forum (professional organization) since inception. Oversees 47 portfolios in the OppenheimerFunds complex. Ms. Stuckey has served on the Boards of certain Oppenheimer funds since 2012, during which time she has become familiar with the Fund’s (and other Oppenheimer funds’) financial, accounting, regulatory and investment matters and has contributed to the Boards’ deliberations. |
| |
James D. Vaughn, Trustee (since 2012) Year of Birth:1945 | | Retired; former managing partner (1994-2001) of Denver office of Deloitte & Touche LLP, (held various positions 1969-1993); Trustee and Chairman of the Audit Committee of Schroder Funds (2003-2012); Board member and Chairman of Audit Committee of AMG National Trust Bank (since 2005); Trustee, Investment Committee member, University of South Dakota Foundation (since 1996); Board member, Audit Committee Member and past Board Chair, Junior Achievement (since 1993); former Board member, Mile High United Way, Boys and Girls Clubs, Boy Scouts, Colorado Business Committee for the Arts, Economic Club of Colorado and Metro Denver Network. Oversees 47 portfolios in the OppenheimerFunds complex. Mr. Vaughn has served on the Boards of certain Oppenheimer funds since 2012, during which time he has become familiar with the Fund’s (and other Oppenheimer funds’) financial, accounting, regulatory and investment matters and has contributed to the Boards’ deliberations. |
| | |
| INTERESTED TRUSTEE AND OFFICER | | Mr. Steinmetz is an “Interested Trustee” because he is affiliated with the Manager and the Sub-Adviser by virtue of his positions as Chairman and director of the Sub-Adviser and officer and director of the Manager. Both as a Trustee and as an officer, Mr. Steinmetz serves for an indefinite term, or until his resignation, retirement, death or removal. Mr. Steinmetz’s address is 225 Liberty Street, New York, New York 10281-1008. |
| |
Arthur P. Steinmetz Trustee (Since 2015), President and Principal Executive Officer (since 2014) Year of Birth: 1958 | | Chairman of the Sub-Adviser (since January 2015); CEO and Chairman of the Manager (since July 2014), President of the Manager (since May 2013), a Director of the Manager (since January 2013), Director of the Sub-Adviser (since July 2014), President, Management Director and CEO of Oppenheimer Acquisition Corp. (the Sub-Adviser’s parent holding company) (since July 2014), and President and Director of OFI SteelPath, Inc. (since January 2013). Chief Investment Officer of the OppenheimerFunds advisory entities from (January 2013-December 2013); Executive Vice President of the Manager (January 2013-May 2013); Chief Investment Officer of the Sub-Adviser (October 2010-December 2012); Chief Investment Officer, Fixed- Income, of the Sub-Adviser (April 2009-October 2010); Executive Vice President of the Sub-Adviser (October 2009-December 2012); Director of Fixed Income of the Sub-Adviser (January 2009-April 2009); and a Senior Vice President of the Sub-Adviser (March 1993-September 2009). An officer of 101 portfolios in the OppenheimerFunds complex. |
| |
| OTHER OFFICERS OF THE FUND | | The addresses of the Officers in the chart below are as follows: for Messrs. Govil, Ram, Larson, Gabinet, Mss. Sexton and Picciotto, 225 Liberty Street, New York, New York 10281-1008, for Mr. Wixted, 6803 S. Tucson Way, Centennial, Colorado 80112-3924. Each Officer serves for an indefinite term or until his or her resignation, retirement, death or removal. |
| |
Manind Govil, Vice President (since 2009) Year of Birth: 1969 | | Senior Vice President, the Main Street Team Leader and a portfolio manager of the Sub-Adviser (since May 2009). Portfolio manager with RS Investment Management Co. LLC (October 2006-March 2009). Head of equity investments at The Guardian Life Insurance Company of America (August 2005-October 2006) when Guardian Life Insurance acquired an interest in RS Investment Management Co. LLC. Lead portfolio manager – large cap blend/core equity, co-head of equities and head of equity research (2001-July 2005), and was lead portfolio manager – core equity (April 1996-July 2005), at Mercantile Capital Advisers, Inc. A portfolio manager and officer of other portfolios in the OppenheimerFunds complex. |
| |
Benjamin Ram, Vice President (since 2009) Year of Birth: 1972 | | Vice President of the Sub-Adviser (since May 2009); Senior Portfolio Manager of the Sub-Adviser (since January 2011) and Portfolio Manager of the Sub-Adviser (May 2009-December 2010). Sector manager for financial investments and a co portfolio manager for mid-cap portfolios with the RS Core Equity Team of RS Investment Management Co. LLC (October 2006-May 2009). Portfolio Manager of Mid Cap Strategies, Sector Manager Financials at The Guardian Life Insurance Company of America (January 2006-October 2006) when Guardian Life Insurance acquired an interest in RS Investment Management Co. LLC. Financial analyst (2003-2005), and co-portfolio manager (2005-2006) at Mercantile Capital Advisers, Inc.; bank analyst at Legg Mason Securities (2000-2003) and a senior financial analyst at the CitiFinancial division of Citigroup, Inc. (1997- 2000). A portfolio manager and officer of other portfolios in the OppenheimerFunds complex. |
| |
Paul Larson, Vice President (since 2014) Year of Birth: 1971 | | Vice President of the Sub-Adviser (since January 2013). Prior to joining the Sub-Adviser, he was a portfolio manager and Chief Equity Strategist at Morningstar. He was previously an analyst at Morningstar covering the energy sector and oversaw the firm’s natural resources analysts. Prior to joining Morningstar in 2002, Mr. Larson was an analyst with The Motley Fool. A portfolio manager and officer of other portfolios in the OppenheimerFunds complex. |
27 OPPENHEIMER MAIN STREET FUND/VA
TRUSTEES AND OFFICERS Unaudited / Continued
| | |
| |
Arthur S. Gabinet, Secretary and Chief Legal Officer (since 2011) Year of Birth: 1958 | | Executive Vice President, Secretary and General Counsel of the Manager (since January 2013); General Counsel OFI SteelPath, Inc. (since January 2013); Executive Vice President (May 2010-December 2012) and General Counsel (since January 2011) of the Sub-Adviser; General Counsel of the Distributor (since January 2011); General Counsel of Centennial Asset Management Corporation (January 2011-December 2012); Executive Vice President (January 2011-December 2012) and General Counsel of HarbourView Asset Management Corporation (since January 2011); Assistant Secretary (since January 2011) and Director (since January 2011) of OppenheimerFunds International Ltd. and OppenheimerFunds plc; Director of Oppenheimer Real Asset Management, Inc. (January 2011-December 2012) and General Counsel (since January 2011); Executive Vice President (January 2011-December 2011) and General Counsel of Shareholder Financial Services, Inc. and Shareholder Services, Inc. (since January 2011); Executive Vice President (January 2011-December 2012) and General Counsel of OFI Private Investments Inc. (since January 2011); Vice President of OppenheimerFunds Legacy Program (January 2011-December 2011); Executive Vice President (January 2011-December 2012) and General Counsel of OFI Institutional Asset Management, Inc. (since January 2011); General Counsel, Asset Management of the Sub-Adviser (May 2010-December 2010); Principal, The Vanguard Group (November 2005-April 2010); District Administrator, U.S. Securities and Exchange Commission (January 2003-October 2005). An officer of 101 Portfolios in the OppenheimerFunds complex. |
| |
Jennifer Sexton, Vice President and Chief Business Officer (since 2014) Year of Birth: 1969 | | Senior Vice President of OppenheimerFunds Distributor, Inc. (since June 2014); Vice President of OppenheimerFunds Distributor, Inc. (April 2006-June 2014); Vice President of the Sub-Adviser (January 1998-March 2006); Assistant Vice President of the Sub-Adviser (October 1991-December 1998). An officer of 101 Portfolios in the OppenheimerFunds complex. |
| |
Mary Ann Picciotto, Chief Compliance Officer and Chief Anti-Money Laundering Officer (since 2014) Year of Birth: 1973 | | Senior Vice President and Chief Compliance Officer of the Manager (since March 2014); Chief Compliance Officer of the Sub- Adviser, OFI SteelPath, Inc., OFI Global Trust Company, OFI Global Institutional, Inc., Oppenheimer Real Asset Management, Inc., OFI Private Investments, Inc., Harborview Asset Management Corporation, Trinity Investment Management Corporation, and Shareholder Services, Inc. (since March 2014); Managing Director of Morgan Stanley Investment Management Inc. and certain of its various affiliated entities; Chief Compliance Officer of various Morgan Stanley Funds (May 2010-January 2014); Chief Compliance Officer of Morgan Stanley Investment Management Inc. (April 2007-January 2014). An officer of 101 Portfolios in the OppenheimerFunds complex. |
| |
Brian W. Wixted, Treasurer and Principal Financial & Accounting Officer (since 1999) Year of Birth: 1959 | | Senior Vice President of the Manager (since January 2013); Treasurer of the Sub-Adviser, HarbourView Asset Management Corporation, Shareholder Financial Services, Inc., Shareholder Services, Inc., and Oppenheimer Real Asset Management, Inc. (March 1999-June 2008), OFI Private Investments, Inc. (March 2000-June 2008), OppenheimerFunds International Ltd. and OppenheimerFunds plc (since May 2000), OFI Institutional Asset Management, Inc. (November 2000-June 2008), and OppenheimerFunds Legacy Program (charitable trust program established by the Sub-Adviser) (June 2003-December 2011); Treasurer and Chief Financial Officer of OFI Trust Company (since May 2000); Assistant Treasurer of Oppenheimer Acquisition Corporation (March 1999-June 2008). An officer of 101 Portfolios in the OppenheimerFunds complex. |
The Fund’s Statement of Additional Information contains additional information about the Fund’s Trustees and Officers and is available without charge, upon request, by calling 1.800.988.8287.
28 OPPENHEIMER MAIN STREET FUND/VA
THIS PAGE INTENTIONALLY LEFT BLANK.
29 OPPENHEIMER MAIN STREET FUND/VA
THIS PAGE INTENTIONALLY LEFT BLANK.
30 OPPENHEIMER MAIN STREET FUND/VA
THIS PAGE INTENTIONALLY LEFT BLANK.
31 OPPENHEIMER MAIN STREET FUND/VA
OPPENHEIMER MAIN STREET FUND/VA
A Series of Oppenheimer Variable Account Funds
| | |
| |
| Manager | | OFI Global Asset Management, Inc. |
| |
| Sub-Adviser | | OppenheimerFunds, Inc. |
| |
| Distributor | | OppenheimerFunds Distributor, Inc. |
| |
Transfer and Shareholder Servicing Agent | | OFI Global Asset Management, Inc. |
| |
| Sub-Transfer Agent | | Shareholder Services, Inc. |
| | DBA OppenheimerFunds Services |
| |
Independent Registered Public Accounting Firm | | KPMGLLP |
| |
| Counsel | | Ropes & Gray LLP |
| |
| | Before investing in any of the Oppenheimer funds, investors should carefully consider a fund’s investment objectives, risks, charges and expenses. Fund prospectuses and summary prospectuses contain this and other information about the funds, and may be obtained by asking your financial advisor, or calling us at 1.800.988.8287. Read prospectuses and summary prospectuses carefully before investing. |
| |
| | © 2016 OppenheimerFunds, Inc. All rights reserved. Oppenheimer funds are distributed by OppenheimerFunds Distributor, Inc. |


PORTFOLIO MANAGERS: Matthew P. Ziehl, CFA, Raymond Anello, CFA, Raman Vardharaj, CFA, Joy Budzinski, Kristin Ketner, Magnus Krantz and Adam Weiner
AVERAGE ANNUAL TOTAL RETURNS FOR THE PERIODS ENDED 12/31/15
| | | | | | | | | | | | | | | | |
| | | Inception Date | | | 1-Year | | | 5-Year | | | 10-Year | |
Non-Service Shares | | | 5/1/98 | | | | -5.90% | | | | 11.38% | | | | 7.44% | |
Service Shares | | | 7/16/01 | | | | -6.09 | | | | 11.11 | | | | 7.18 | |
Russell 2000 Index | | | | | | | -4.41 | | | | 9.19 | | | | 6.80 | |
The performance data quoted represents past performance, which does not guarantee future results. The investment return and principal value of an investment in the Fund will fluctuate so that an investor’s shares, when redeemed, may be worth more or less than their original cost. Current performance may be lower or higher than the performance quoted. For performance data current to the most recent month end, call us at 1.800.988.8287. The Fund’s total returns should not be expected to be the same as the returns of other funds, whether or not both funds have the same portfolio managers and/or similar names. The Fund’s total returns include changes in share price and reinvested distributions but do not include the charges associated with the separate account products that offer this Fund. Such performance would have been lower if such charges were taken into account.
TOP HOLDINGS AND ALLOCATIONS
| | | | |
| TOP TEN COMMON STOCK HOLDINGS | |
Pinnacle Foods, Inc. | | | 2.3% | |
WellCare Health Plans, Inc. | | | 2.3 | |
j2 Global, Inc. | | | 2.1 | |
KAR Auction Services, Inc. | | | 2.1 | |
BankUnited, Inc. | | | 2.0 | |
Korn/Ferry International | | | 2.0 | |
BancorpSouth, Inc. | | | 1.9 | |
MB Financial, Inc. | | | 1.8 | |
SYNNEX Corp. | | | 1.8 | |
FirstMerit Corp. | | | 1.7 | |
Portfolio holdings and allocations are subject to change. Percentages are as of December 31, 2015, and are based on net assets. For more current Fund holdings, please visit oppenheimerfunds.com.
SECTOR ALLOCATION
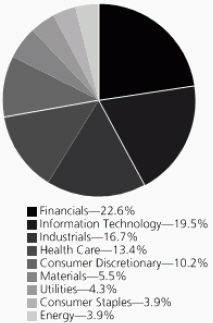
Portfolio holdings and allocations are subject to change. Percentages are as of December 31, 2015, and are based on the total market value of common stocks.
2 OPPENHEIMER MAIN STREET SMALL CAP FUND/VA
Fund Performance Discussion
The Fund’s Non-Service shares produced a total return of -5.90% during the reporting period. In comparison, the Fund underperformed the Russell 2000 Index (the “Index”), which returned -4.41%, primarily due to weaker relative stock selection in the health care, consumer discretionary and materials sectors. The Fund outperformed the Index within the information technology, financials and energy sectors, due largely to stronger relative stock selection.
MARKET OVERVIEW
While returns for domestic equities — across the capitalization spectrum — were in positive territory for the fourth quarter of the year, the uplift in stock prices was insufficient to close-out the year on a favorable note. In particular, large-caps barely eked-out a positive return for 2015 (due mainly to the contribution from dividends, as prices, overall, were down) while both mid- and small-cap stocks, generally, declined in 2015. The year was marked by heightened volatility as uncertainty over when, or if the Federal Reserve (the “Fed”) would raise interest rates (eventually they lifted the Fed Funds rate in mid-December), combined with plummeting energy prices, decelerating emerging market growth and sluggish developed market growth — including our own domestic economy — resulted in investor sentiment that swung back and forth like a pendulum.
Returns were influenced by big macro trends. Most evident was the ongoing slide in oil prices that continued to negatively impact energy stocks — making the sector the worst performer in the year. Commodity prices, generally, have been on a downward trend all year and this, combined with slowing global growth has hurt economically sensitive segments — particularly materials and industrials. The ongoing strength of the dollar also impacted commodity prices and contributed to the lowered guidance from many industrial firms as expectations for export growth has been reigned-in.
The much anticipated rise in interest rates also influenced relative returns across sectors during the year. Naturally, stocks hurt by the expectation of rising interest rates, including higher yielding sectors such as utilities and real estate investment trusts (“REITs”), generally underperformed in 2015. By comparison, health care stocks held up well, ending 2015 among the top performing sectors in the market. Generally, health care returns were driven by rising valuations — particularly in the life sciences and biotechnology categories.
TOP INDIVIDUAL CONTRIBUTORS
Fund holdings that were contributors to performance this period included Prestige Brands Holdings, Inc., Paylocity Holding Corp., and j2 Global. Prestige Brands Holdings, a distributor of over-the-counter healthcare and household products, improved as destocking by retailers — which had hurt prior quarter results for Prestige Brands — came to an end. Consequently, revenues topped expectations, propelling the stock higher. Management also provided further “color” on its planned integration of the recently closed Insight acquisition, which added the $100 million Monistat brand — now Prestige’s largest product line. This information helped to improve visibility and boost investor sentiment. Paylocity, a cloud-based payroll and human resource management software provider, reported strong results during the period, suggesting that the secular opportunity for small/medium businesses to automate and/or modernize their payroll/HR systems remains strong. The company has been very methodical in its approach, which is translating into a richer multiple being assigned to the stock. j2 Global provides cloud-based communications and storage messaging services. Management’s track record of execution has been very strong and they continue to bolt on acquisitions to grow the company and drive scale.
TOP INDIVIDUAL DETRACTORS
Top detractors from performance included Spectranetics Corp., Dana Holding Corp. and Century Aluminum Co. Spectranetics develops single-use medical devices used in minimally-invasive cardiovascular procedures. The company had a disappointing quarterly result during the reporting period and guided estimates down based on lower-than-expected U.S. peripheral atherectomy (a procedure to remove plaque from blood vessels) growth. Dana is a supplier of automotive and other vehicle, i.e., trucks and off-highway, parts and systems primarily to original-equipment manufacturers (OEMs). The company disappointed investors in October with third quarter 2015 that were below expectations and a weak outlook for fourth quarter 2015. While some of the company’s end-markets have become more challenging (e.g. Class 8 trucks), at least some of its issues have been self-inflicted as production issues led to market share losses. Valuation seems to discount a lot of bad news ahead, and appears to give low probability to our expectation that newly installed CEO James Kamsickas can improve results at the Company. The stock of aluminum producer Century Aluminum suffered from weakening London Metals Exchange (LME) prices. Commodities, broadly, witnessed weak pricing as a result of anemic global growth throughout the reporting period. We exited our position in Century Aluminum.
3 OPPENHEIMER MAIN STREET SMALL CAP FUND/VA
STRATEGY & OUTLOOK
The past year has been characterized by a “three speed global economy.” Domestically, growth has continued slow and steady, with inflation subdued and unemployment near full employment levels. The strong dollar, however, has weakened manufacturing though the service sector remains strong. Europe, on the other hand, has seen essentially no growth in its GDP while emerging markets continue to grow, but at a decelerating rate.
As “Corporate America” has experienced low revenue growth — with little aid from pricing — earnings growth has partially come from “manufactured” sources. Share repurchases — funded by low cost financings — have resulted in debt amounts twice their 2008 levels (excluding financials). A significant step-up in Merger & Acquisition activities has also contributed to the “manufactured” source of earnings growth. Finally, increasingly companies are resorting to reporting “Adjusted” earnings which often are a far cry above the more normal usage of Generally Accepted Accounting Principles (GAAP) earnings. These trends have led to profit margins which are near peak levels, but are likely unsustainable.
We believe the risks inherent to this market include the misallocation of capital, fueled by an environment of ongoing relatively low interest rates and possibly leading to “bubble-like” valuations for some companies. Additionally, fundamental disruptions across market segments have been elevated.
We expect this economic and market environment to continue, resulting in increased volatility of equity prices. Traditionally, during periods of economic uncertainty and heightened market volatility, investors favor stocks of higher quality companies — with greater consistency and stability of revenue and earnings — leading to relatively better stock performance of those companies. We aim to build “all weather” portfolios by targeting companies with: 1) sustainable competitive advantages; 2) skilled management with a proven track record of executing effectively; and 3) financial resources to generate improving profitability, gain market share, and/or return significant cash to shareholders. During times of economic volatility such companies frequently widen their lead over weaker competitors. We seek to invest in companies, characterized by these qualities, at compelling valuations and believe this disciplined approach is essential to generating superior long-term performance.
Investors should consider the Fund’s investment objective, risks, charges and expenses carefully before investing. The Fund’s prospectus and summary prospectus contain this and other information about the Fund, and may be obtained by asking your financial advisor or calling us at 1.800.988.8287. Read prospectuses and summary prospectuses carefully before investing.
Total returns include changes in share price and reinvestment of dividends and capital gains distributions in a hypothetical investment for the periods shown.
The Fund’s investment strategy and focus can change over time. The mention of specific fund holdings does not constitute a recommendation by OppenheimerFunds, Inc. or its affiliates.
Shares of Oppenheimer funds are not deposits or obligations of any bank, are not guaranteed by any bank, are not insured by the FDIC or any other agency, and involve investment risks, including the possible loss of the principal amount invested.
Comparing the Fund’s Performance to the Market. The graphs that follow show the performance of a hypothetical $10,000 investment in each share class of the Fund held until December 31, 2015. Performance is measured over a ten-fiscal-year period for both Classes. Performance information does not reflect charges that apply to separate accounts investing in the Fund. If these charges were taken into account, performance would be lower. The graphs assume that all dividends and capital gains distributions were reinvested in additional shares.
The Russell 2000 Index measures the performance of the small-cap segment of the U.S. equity universe. The Russell 2000 Index is a subset of the Russell 3000 Index representing approximately 10% of the total market capitalization of that index. It includes approximately 2000 of the smallest securities based on a combination of their market cap and current index membership. The index is unmanaged and cannot be purchased directly by investors. While index comparisons may be useful to provide a benchmark for the Fund’s performance, it must be noted that the Fund’s investments are not limited to the investments comprising the Index. Index performance includes reinvestment of income, but does not reflect transaction costs, fees, expenses or taxes. Index performance is shown for illustrative purposes only as a benchmark for the Fund’s performance, and does not predict or depict performance of the Fund. The Fund’s performance reflects the effects of the Fund’s business and operating expenses.
4 OPPENHEIMER MAIN STREET SMALL CAP FUND/VA
COMPARISON OF CHANGE IN VALUE OF $10,000 HYPOTHETICAL INVESTMENTS IN:
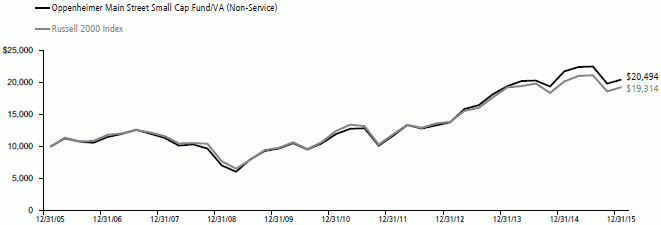
COMPARISON OF CHANGE IN VALUE OF $10,000 HYPOTHETICAL INVESTMENTS IN:
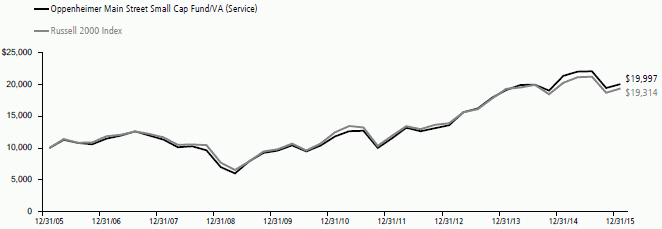
The performance data quoted represents past performance, which does not guarantee future results. The investment return and principal value of an investment in the Fund will fluctuate so that an investor’s shares, when redeemed, may be worth more or less than their original cost. Current performance may be lower or higher than the performance quoted. For performance data current to the most recent month end, call us at 1.800.988.8287. The Fund’s total returns should not be expected to be the same as the returns of other funds, whether or not both funds have the same portfolio managers and/or similar names. The Fund’s total returns include changes in share price and reinvested distributions but do not include the charges associated with the separate account products that offer this Fund. Such performance would have been lower if such charges were taken into account.
5 OPPENHEIMER MAIN STREET SMALL CAP FUND/VA
Fund Expenses
Fund Expenses. As a shareholder of the Fund, you incur two types of costs: (1) transaction costs and (2) ongoing costs, including management fees; distribution and service fees; and other Fund expenses. These examples are intended to help you understand your ongoing costs (in dollars) of investing in the Fund and to compare these costs with the ongoing costs of investing in other mutual funds.
The examples are based on an investment of $1,000.00 invested at the beginning of the period and held for the entire 6-month period ended December 31, 2015.
Actual Expenses. The first section of the table provides information about actual account values and actual expenses. You may use the information in this section for the class of shares you hold, together with the amount you invested, to estimate the expense that you paid over the period. Simply divide your account value by $1,000.00 (for example, an $8,600.00 account value divided by $1,000.00 = 8.60), then multiply the result by the number in the first section under the heading entitled “Expenses Paid During 6 Months Ended December 31, 2015” to estimate the expenses you paid on your account during this period.
Hypothetical Example for Comparison Purposes.
The second section of the table provides information about hypothetical account values and hypothetical expenses based on the Fund’s actual expense ratio for each class of shares, and an assumed rate of return of 5% per year for each class before expenses, which is not the actual return. The hypothetical account values and expenses may not be used to estimate the actual ending account balance or expenses you paid for the period. You may use this information to compare the ongoing costs of investing in the Fund and other funds. To do so, compare this 5% hypothetical example for the class of shares you hold with the 5% hypothetical examples that appear in the shareholder reports of the other funds.
Please note that the expenses shown in the table are meant to highlight your ongoing fund costs only and do not reflect any charges associated with the separate accounts that offer this Fund. Therefore, the “hypothetical” lines of the table are useful in comparing ongoing fund costs only, and will not help you determine the relative total costs of owning different funds. In addition, if these separate account charges were included your costs would have been higher.
| | | | | | | | | | | | |
| Actual | | Beginning Account Value July 1, 2015 | | | Ending Account Value December 31, 2015 | | | Expenses Paid During 6 Months Ended December 31, 2015 | |
Non-Service shares | | $ | 1,000.00 | | | $ | 909.50 | | | $ | 3.86 | |
Service shares | | | 1,000.00 | | | | 908.50 | | | | 5.07 | |
| | | |
Hypothetical | | | | | | | | | | | | |
(5% return before expenses) | | | | | | | | | | | | |
Non-Service shares | | | 1,000.00 | | | | 1,021.17 | | | | 4.08 | |
Service shares | | | 1,000.00 | | | | 1,019.91 | | | | 5.36 | |
Expenses are equal to the Fund’s annualized expense ratio for that class, multiplied by the average account value over the period, multiplied by 184/365 (to reflect the one-half year period). Those annualized expense ratios, excluding indirect expenses from affiliated funds, based on the 6-month period ended December 31, 2015 are as follows:
| | |
| Class | | Expense Ratios |
Non-Service shares | | 0.80% |
Service shares | | 1.05 |
The expense ratios reflect voluntary and/or contractual waivers and/or reimbursements of expenses by the Fund’s Manager. Some of these undertakings may be modified or terminated at any time, as indicated in the Fund’s prospectus. The “Financial Highlights” tables in the Fund’s financial statements, included in this report, also show the gross expense ratios, without such waivers or reimbursements and reduction to custodian expenses, if applicable.
6 OPPENHEIMER MAIN STREET SMALL CAP FUND/VA
STATEMENT OF INVESTMENTS December 31, 2015
| | | | | | |
| | | Shares | | | Value |
|
Common Stocks—98.3% |
|
Consumer Discretionary—10.1% |
|
Auto Components—2.2% | | | | | | |
|
Dana Holding Corp. | | | 1,008,313 | | | $ 13,914,719 |
|
Visteon Corp.1 | | | 64,850 | | | 7,425,325 |
| | | | | | |
| | | | | | 21,340,044 |
|
|
Diversified Consumer Services—0.6% |
|
DeVry Education Group, Inc. | | | 224,510 | | | 5,682,348 |
|
|
Hotels, Restaurants & Leisure—4.3% |
|
Brinker International, Inc. | | | 109,340 | | | 5,242,853 |
|
International Speedway Corp., Cl. A | | | 220,787 | | | 7,444,937 |
|
Popeyes Louisiana Kitchen, Inc.1 | | | 276,620 | | | 16,182,270 |
|
Texas Roadhouse, Inc., Cl. A | | | 379,540 | | | 13,576,146 |
| | | | | | |
| | | | | | 42,446,206 |
|
|
Multiline Retail—1.6% |
|
Burlington Stores, Inc.1 | | | 368,660 | | | 15,815,514 |
|
|
Specialty Retail—1.4% |
|
Party City Holdco, Inc.1 | | | 418,890 | | | 5,407,870 |
|
Sally Beauty Holdings, Inc.1 | | | 285,090 | | | 7,951,160 |
| | | | | | |
| | | | | | 13,359,030 |
|
|
Consumer Staples—3.9% |
|
Food Products—2.3% |
|
Pinnacle Foods, Inc. | | | 524,650 | | | 22,276,639 |
|
|
Household Products—0.4% |
|
Energizer Holdings, Inc. | | | 125,510 | | | 4,274,871 |
|
|
Tobacco—1.2% |
|
Universal Corp. | | | 214,650 | | | 12,037,572 |
|
|
Energy—3.7% |
|
Energy Equipment & Services—0.5% |
|
RigNet, Inc.1 | | | 260,140 | | | 5,382,297 |
|
|
Oil, Gas & Consumable Fuels—3.2% |
|
Cone Midstream Partners LP2 | | | 506,943 | | | 4,993,389 |
|
Range Resources Corp. | | | 225,207 | | | 5,542,344 |
|
Renewable Energy Group, Inc.1 | | | 959,723 | | | 8,915,827 |
|
Western Refining, Inc. | | | 224,181 | | | 7,985,327 |
|
WPX Energy, Inc.1 | | | 763,380 | | | 4,381,801 |
| | | | | | |
| | | | | | 31,818,688 |
|
|
Financials—22.2% |
|
Capital Markets—1.2% |
|
Evercore Partners, Inc., Cl. A | | | 135,973 | | | 7,352,060 |
|
Stifel Financial Corp.1 | | | 115,160 | | | 4,878,178 |
| | | | | | |
| | | | | | 12,230,238 |
|
|
Commercial Banks—10.0% |
|
BancorpSouth, Inc. | | | 761,220 | | | 18,261,668 |
|
BankUnited, Inc. | | | 549,455 | | | 19,813,347 |
|
FirstMerit Corp. | | | 917,566 | | | 17,112,606 |
|
MB Financial, Inc. | | | 551,990 | | | 17,867,916 |
|
Talmer Bancorp, Inc., Cl. A | | | 635,170 | | | 11,502,929 |
|
Webster Financial Corp. | | | 374,770 | | | 13,937,696 |
| | | | | | |
| | | | | | 98,496,162 |
|
|
Insurance—2.9% |
|
Endurance Specialty Holdings Ltd. | | | 162,050 | | | 10,369,580 |
|
James River Group Holdings Ltd. | | | 294,680 | | | 9,883,567 |
|
Old Republic International Corp. | | | 447,270 | | | 8,332,640 |
| | | | | | |
| | | | | | 28,585,787 |
|
|
Real Estate Investment Trusts (REITs)—7.2% |
|
Apollo Commercial Real Estate Finance, Inc. | | | 734,692 | | | 12,658,743 |
|
Chatham Lodging Trust | | | 685,426 | | | 14,037,524 |
|
CYS Investments, Inc. | | | 1,835,330 | | | 13,085,903 |
|
DuPont Fabros Technology, Inc. | | | 313,320 | | | 9,960,443 |
| | | | | | |
| | | Shares | | | Value |
|
Real Estate Investment Trusts (REITs) (Continued) |
|
National Storage Affiliates Trust | | | 671,356 | | | $ 11,500,328 |
|
STAG Industrial, Inc. | | | 533,970 | | | 9,851,747 |
| | | | | | |
| | | | | | 71,094,688 |
|
|
Thrifts & Mortgage Finance—0.9% |
|
Oritani Financial Corp. | | | 518,300 | | | 8,551,950 |
|
|
Health Care—13.1% |
|
Biotechnology—2.1% |
|
ACADIA Pharmaceuticals, Inc.1 | | | 205,920 | | | 7,341,048 |
|
Axovant Sciences Ltd.1 | | | 123,090 | | | 2,219,313 |
|
Santhera Pharmaceutical Holding AG1 | | | 33,298 | | | 2,962,765 |
|
Ultragenyx Pharmaceutical, Inc.1 | | | 71,790 | | | 8,053,402 |
| | | | | | |
| | | | | | 20,576,528 |
|
|
Health Care Equipment & Supplies—1.5% |
|
NxStage Medical, Inc.1 | | | 390,050 | | | 8,545,996 |
|
Spectranetics Corp. (The)1 | | | 447,100 | | | 6,733,326 |
| | | | | | |
| | | | | | 15,279,322 |
|
|
Health Care Providers & Services—6.9% |
|
Acadia Healthcare Co., Inc.1 | | | 194,870 | | | 12,171,580 |
|
Addus HomeCare Corp.1 | | | 100,010 | | | 2,328,233 |
|
Diplomat Pharmacy, Inc.1 | | | 295,180 | | | 10,101,060 |
|
HealthSouth Corp. | | | 333,280 | | | 11,601,477 |
|
Team Health Holdings, Inc.1 | | | 212,370 | | | 9,320,919 |
|
WellCare Health Plans, Inc.1 | | | 283,801 | | | 22,196,076 |
| | | | | | |
| | | | | | 67,719,345 |
|
|
Life Sciences Tools & Services—0.8% |
|
VWR Corp.1 | | | 296,610 | | | 8,397,029 |
|
|
Pharmaceuticals—1.8% |
|
Aratana Therapeutics, Inc.1 | | | 310,570 | | | 1,732,980 |
|
Prestige Brands Holdings, Inc.1 | | | 307,716 | | | 15,841,220 |
| | | | | | |
| | | | | | 17,574,200 |
|
|
Industrials—16.5% |
|
Aerospace & Defense—0.8% |
|
AAR Corp. | | | 276,405 | | | 7,266,688 |
|
Curtiss-Wright Corp. | | | 9,900 | | | 678,150 |
| | | | | | |
| | | | | | 7,944,838 |
|
|
Airlines—0.7% |
|
Spirit Airlines, Inc.1 | | | 176,720 | | | 7,042,292 |
|
|
Building Products—1.0% |
|
Masonite International Corp.1 | | | 161,490 | | | 9,888,033 |
|
|
Commercial Services & Supplies—6.4% |
|
ABM Industries, Inc. | | | 393,430 | | | 11,200,952 |
|
ACCO Brands Corp.1 | | | 1,395,717 | | | 9,951,462 |
|
KAR Auction Services, Inc. | | | 548,950 | | | 20,327,618 |
|
Matthews International Corp., Cl. A | | | 166,420 | | | 8,895,149 |
|
Pitney Bowes, Inc. | | | 366,590 | | | 7,570,084 |
|
Progressive Waste Solutions Ltd. | | | 237,260 | | | 5,587,473 |
| | | | | | |
| | | | | | 63,532,738 |
|
|
Construction & Engineering—1.0% |
|
AECOM1 | | | 330,993 | | | 9,939,720 |
|
|
Electrical Equipment—0.7% |
|
Generac Holdings, Inc.1 | | | 242,730 | | | 7,226,072 |
|
|
Machinery—0.5% |
|
SPX FLOW, Inc.1 | | | 168,330 | | | 4,698,090 |
|
|
Professional Services—3.6% |
|
Korn/Ferry International | | | 579,691 | | | 19,234,147 |
|
On Assignment, Inc.1 | | | 353,320 | | | 15,881,734 |
| | | | | | |
| | | | | | 35,115,881 |
7 OPPENHEIMER MAIN STREET SMALL CAP FUND/VA
STATEMENT OF INVESTMENTS Continued
| | | | | | |
| | | Shares | | | Value |
|
| Road & Rail—1.3% |
|
| Saia, Inc.1 | | | 240,900 | | | $ 5,360,025 |
|
| Swift Transportation Co., Cl. A1 | | | 531,314 | | | 7,342,760 |
| | | | | | |
| | | | | | 12,702,785 |
|
|
| Transportation Infrastructure—0.5% |
|
| Wesco Aircraft Holdings, Inc.1 | | | 415,570 | | | 4,974,373 |
|
|
| Information Technology—19.2% |
|
| Electronic Equipment, Instruments, & Components—1.8% |
|
| SYNNEX Corp. | | | 197,980 | | | 17,804,341 |
|
|
| Internet Software & Services—2.1% |
|
| j2 Global, Inc. | | | 246,563 | | | 20,297,066 |
|
|
| IT Services—3.7% |
|
| Black Knight Financial Services, Inc., Cl. A1 | | | 274,962 | | | 9,090,244 |
|
| Booz Allen Hamilton Holding Corp., Cl. A | | | 409,290 | | | 12,626,596 |
|
| CACI International, Inc., Cl. A1 | | | 156,470 | | | 14,517,287 |
| | | | | | |
| | | | | | 36,234,127 |
|
|
| Semiconductors & Semiconductor Equipment—3.5% |
|
| Cavium, Inc.1 | | | 159,470 | | | 10,478,774 |
|
| Cypress Semiconductor Corp.1 | | | 732,861 | | | 7,189,366 |
|
| MKS Instruments, Inc. | | | 467,650 | | | 16,835,400 |
| | | | | | |
| | | | | | 34,503,540 |
|
|
| Software—8.1% | | | |
|
| FleetMatics Group plc1 | | | 193,260 | | | 9,815,675 |
|
| Fortinet, Inc.1 | | | 291,941 | | | 9,099,801 |
|
| Guidewire Software, Inc.1 | | | 253,100 | | | 15,226,496 |
|
| Imperva, Inc.1 | | | 203,240 | | | 12,867,125 |
|
| Paylocity Holding Corp.1 | | | 346,610 | | | 14,055,036 |
|
| Proofpoint, Inc.1 | | | 174,740 | | | 11,359,847 |
|
| Zynga, Inc., Cl. A1 | | | 2,876,740 | | | 7,709,663 |
| | | | | | |
| | | | | | 80,133,643 |
| | | | | | |
| | | Shares | | | Value |
|
| Materials—5.4% |
|
| Chemicals—0.5% |
|
| A. Schulman, Inc. | | | 170,088 | | | $ 5,211,496 |
|
|
| Construction Materials—0.5% |
|
| Summit Materials, Inc., Cl. A1 | | | 226,984 | | | 4,548,759 |
|
|
| Metals & Mining—2.1% |
|
| Kaiser Aluminum Corp. | | | 200,960 | | | 16,812,313 |
|
| Osisko Gold Royalties Ltd. | | | 412,112 | | | 4,071,382 |
| | | | | | |
| | | | | | 20,883,695 |
|
|
| Paper & Forest Products—2.3% |
|
| Boise Cascade Co.1 | | | 382,470 | | | 9,764,459 |
|
| PH Glatfelter Co. | | | 677,659 | | | 12,496,032 |
| | | | | | |
| | | | | | 22,260,491 |
|
|
| Utilities—4.2% |
|
| Electric Utilities—2.8% |
|
| ALLETE, Inc. | | | 287,060 | | | 14,591,260 |
|
| Portland General Electric Co. | | | 360,400 | | | 13,107,748 |
| | | | | | |
| | | | | | 27,699,008 |
|
|
| Gas Utilities—0.8% |
|
| Suburban Propane Partners LP2 | | | 314,305 | | | 7,640,755 |
|
|
| Water Utilities—0.6% |
|
| California Water Service Group | | | 250,670 | | | 5,833,091 |
| | | | | | |
| Total Common Stocks (Cost $837,878,493) | | | | | | 969,053,292 |
|
|
| Investment Company—1.5% |
|
| Oppenheimer Institutional Money Market Fund, Cl. | | | | | | |
| E, 0.30%3,4 (Cost $14,384,001) | | | 14,384,001 | | | 14,384,001 |
|
|
Total Investments, at Value
(Cost $852,262,494) | | | 99.8% | | | 983,437,293 |
|
| Net Other Assets (Liabilities) | | | 0.2 | | | 2,385,447 |
| | | |
| Net Assets | | | 100.0% | | | $985,822,740 |
| | | |
Footnotes to Statement of Investments
1. Non-income producing security.
2. Security is a Master Limited Partnership.
3. Rate shown is the 7-day yield at period end.
4. Is or was an affiliate, as defined in the Investment Company Act of 1940, as amended, at or during the reporting period, by virtue of the Fund owning at least 5% of the voting securities of the issuer or as a result of the Fund and the issuer having the same investment adviser. Transactions during the reporting period in which the issuer was an affiliate are as follows:
| | | | | | | | | | | | | | | | |
| | | Shares | | | Gross | | | Gross | | | Shares | |
| | | December 31, 2014 | | | Additions | | | Reductions | | | December 31, 2015 | |
Oppenheimer Institutional Money Market Fund, Cl. E | | | 3,962,569 | | | | 288,837,546 | | | | 278,416,114 | | | | 14,384,001 | |
| | | | |
| | | | | | | | | Value | | | Income | |
Oppenheimer Institutional Money Market Fund, Cl. E | | | | | | | | | | $ | 14,384,001 | | | $ | 26,871 | |
See accompanying Notes to Financial Statements.
8 OPPENHEIMER MAIN STREET SMALL CAP FUND/VA
STATEMENT OF ASSETS AND LIABILITIES December 31, 2015
| | | | |
Assets | | | | |
| Investments, at value—see accompanying statement of investments: | | | | |
| Unaffiliated companies (cost $837,878,493) | | $ | �� 969,053,292 | |
| Affiliated companies (cost $14,384,001) | | | 14,384,001 | |
| | | | 983,437,293 | |
| Cash | | | 1,000,000 | |
| Receivables and other assets: | | | | |
| Dividends | | | 1,427,542 | |
| Investments sold | | | 1,043,328 | |
| Shares of beneficial interest sold | | | 738,632 | |
| Other | | | 41,063 | |
| Total assets | | | 987,687,858 | |
| | | | |
| Liabilities | | | | |
| Payables and other liabilities: | | | | |
| Shares of beneficial interest redeemed | | | 1,502,941 | |
| Distribution and service plan fees | | | 184,724 | |
| Shareholder communications | | | 73,706 | |
| Investments purchased | | | 38,093 | |
| Trustees’ compensation | | | 36,703 | |
| Other | | | 28,951 | |
Total liabilities | | | 1,865,118 | |
| Net Assets | | $ | 985,822,740 | |
| | | | |
| | | | |
| Composition of Net Assets | | | | |
| Par value of shares of beneficial interest | | $ | 46,761 | |
| Additional paid-in capital | | | 815,095,647 | |
| Accumulated net investment income | | | 2,764,432 | |
| Accumulated net realized gain on investments and foreign currency transactions | | | 36,741,095 | |
| Net unrealized appreciation on investments and translation of assets and liabilities denominated in foreign currencies | | | 131,174,805 | |
| Net Assets | | $ | 985,822,740 | |
| | | | |
| | | | |
| Net Asset Value Per Share | | | | |
| Non-Service Shares: | | | | |
| Net asset value, redemption price per share and offering price per share (based on net assets of $129,104,095 and 6,054,207 shares of beneficial interest outstanding) | | | $21.32 | |
Service Shares: | | | | |
| Net asset value, redemption price per share and offering price per share (based on net assets of $856,718,645 and 40,706,342 shares of beneficial interest outstanding) | | | $21.05 | |
See accompanying Notes to Financial Statements.
9 OPPENHEIMER MAIN STREET SMALL CAP FUND/VA
STATEMENT OF OPERATIONS For the Year Ended December 31, 2015
| | | | |
Investment Income | | | | |
Dividends: | | | | |
Unaffiliated companies (net of foreign withholding taxes of $9,145) | | $ | 13,654,411 | |
Affiliated companies | | | 26,871 | |
Interest | | | 8 | |
Total investment income | | | 13,681,290 | |
| | | | |
Expenses | | | | |
Management fees | | | 7,205,948 | |
Distribution and service plan fees - Service shares | | | 2,320,522 | |
Transfer and shareholder servicing agent fees: | | | | |
Non-Service shares | | | 135,023 | |
Service shares | | | 928,148 | |
Shareholder communications: | | | | |
Non-Service shares | | | 14,823 | |
Service shares | | | 101,509 | |
Trustees’ compensation | | | 37,657 | |
Borrowing fees | | | 7,665 | |
Custodian fees and expenses | | | 5,845 | |
Other | | | 66,225 | |
Total expenses | | | 10,823,365 | |
Less reduction to custodian expenses | | | (416) | |
Less waivers and reimbursements of expenses | | | (17,540) | |
Net expenses | | | 10,805,409 | |
Net Investment Income | | | 2,875,881 | |
Realized and Unrealized Gain (Loss) | | | | |
Net realized gain (loss) on: | | | | |
Investments from unaffiliated companies | | | 41,966,232 | |
Foreign currency transactions | | | (12,340) | |
Net realized gain | | | 41,953,892 | |
Net change in unrealized appreciation/depreciation on: | | | | |
Investments | | | (107,617,283) | |
Translation of assets and liabilities denominated in foreign currencies | | | (46,849) | |
Net change in unrealized appreciation/depreciation | | | (107,664,132) | |
| | | | |
Net Decrease in Net Assets Resulting from Operations | | $ | (62,834,359) | |
| | | | |
See accompanying Notes to Financial Statements.
10 OPPENHEIMER MAIN STREET SMALL CAP FUND/VA
STATEMENTS OF CHANGES IN NET ASSETS
| | | | | | | | | | |
| | | Year Ended
December 31, 2015 | | | | | Year Ended
December 31, 2014 | |
Operations | | | | | | | | | | |
Net investment income | | $ | 2,875,881 | | | | | $ | 8,483,013 | |
Net realized gain | | | 41,953,892 | | | | | | 178,986,366 | |
Net change in unrealized appreciation/depreciation | | | (107,664,132 | ) | | | | | (66,686,269 | ) |
| | | | | | | | | | |
Net increase (decrease) in net assets resulting from operations | | | (62,834,359 | ) | | | | | 120,783,110 | |
Dividends and/or Distributions to Shareholders | | | | | | | | | | |
Dividends from net investment income: | | | | | | | | | | |
Non-Service shares | | | (1,186,413 | ) | | | | | (1,181,678 | ) |
Service shares | | | (5,919,665 | ) | | | | | (6,176,380 | ) |
| | | | | | | | | | |
| | | (7,106,078 | ) | | | | | (7,358,058 | ) |
Distributions from net realized gain: | | | | | | | | | | |
Non-Service shares | | | (19,582,501 | ) | | | | | (18,983,832 | ) |
Service shares | | | (137,100,829 | ) | | | | | (137,086,830 | ) |
| | | | | | | | | | |
| | | (156,683,330 | ) | | | | | (156,070,662 | ) |
Beneficial Interest Transactions | | | | | | | | | | |
Net increase in net assets resulting from beneficial interest transactions: | | | | | | | | | | |
Non-Service shares | | | 21,318,007 | | | | | | 6,791,213 | |
Service shares | | | 86,089,174 | | | | | | 16,033,807 | |
| | | | | | | | | | |
| | | 107,407,181 | | | | | | 22,825,020 | |
Net Assets | | | | | | | | | | |
Total decrease | | | (119,216,586 | ) | | | | | (19,820,590 | ) |
Beginning of period | | | 1,105,039,326 | | | | | | 1,124,859,916 | |
| | | | | | | | | | |
| | | |
| End of period (including accumulated net investment income of $ 2,764,432 and $ 6,499,588, respectively) | | $ | 985,822,740 | | | | | $ | 1,105,039,326 | |
| | | | |
See accompanying Notes to Financial Statements.
11 OPPENHEIMER MAIN STREET SMALL CAP FUND/VA
FINANCIAL HIGHLIGHTS
| | | | | | | | | | | | | | | | | | | | |
| Non-Service Shares | | Year Ended
December
31, 2015 | | | Year Ended
December
31, 2014 | | | Year Ended
December
31, 2013 | | | Year Ended
December
31, 2012 | | | Year Ended
December
30, 20111 | |
Per Share Operating Data | | | | | | | | | | | | | | | | | | | | |
Net asset value, beginning of period | | $ | 26.56 | | | $ | 27.80 | | | $ | 20.14 | | | $ | 17.17 | | | $ | 17.66 | |
Income (loss) from investment operations: | | | | | | | | | | | | | | | | | | | | |
Net investment income2 | | | 0.12 | | | | 0.26 | | | | 0.16 | | | | 0.21 | | | | 0.10 | |
Net realized and unrealized gain (loss) | | | (1.28) | | | | 2.74 | | | | 8.01 | | | | 2.87 | | | | (0.48) | |
Total from investment operations | | | (1.16) | | | | 3.00 | | | | 8.17 | | | | 3.08 | | | | (0.38) | |
Dividends and/or distributions to shareholders: | | | | | | | | | | | | | | | | | | | | |
Dividends from net investment income | | | (0.23) | | | | (0.25) | | | | (0.22) | | | | (0.11) | | | | (0.11) | |
Distributions from net realized gain | | | (3.85) | | | | (3.99) | | | | (0.29) | | | | 0.00 | | | | 0.00 | |
Total dividends and/or distributions to shareholders | | | (4.08) | | | | (4.24) | | | | (0.51) | | | | (0.11) | | | | (0.11) | |
Net asset value, end of period | | $ | 21.32 | | | $ | 26.56 | | | $ | 27.80 | | | $ | 20.14 | | | $ | 17.17 | |
| | | | |
| |
| | | | |
Total Return, at Net Asset Value3 | | | (5.90)% | | | | 11.93% | | | | 41.01% | | | | 17.99% | | | | (2.21)% | |
| | | | | | | | | | | | | | | | | | | | |
Ratios/Supplemental Data | | | | | | | | | | | | | | | | | | | | |
Net assets, end of period (in thousands) | | $ | 129,104 | | | $ | 136,402 | | | $ | 134,692 | | | $ | 87,267 | | | $ | 79,722 | |
Average net assets (in thousands) | | $ | 134,932 | | | $ | 133,864 | | | $ | 113,522 | | | $ | 83,790 | | | $ | 86,796 | |
Ratios to average net assets:4 | | | | | | | | | | | | | | | | | | | | |
Net investment income | | | 0.49% | | | | 0.99% | | | | 0.67% | | | | 1.09% | | | | 0.58% | |
Expenses excluding interest and fees from borrowings | | | 0.80% | | | | 0.80% | | | | 0.81% | | | | 0.83% | | | | 0.83% | |
Interest and fees from borrowings | | | 0.00%5 | | | | 0.00% | | | | 0.00% | | | | 0.00% | | | | 0.00% | |
Total expenses6 | | | 0.80% | | | | 0.80% | | | | 0.81% | | | | 0.83% | | | | 0.83% | |
| Expenses after payments, waivers and/or reimbursements and reduction to custodian expenses | | | 0.80% | | | | 0.79% | | | | 0.80% | | | | 0.80% | | | | 0.80% | |
Portfolio turnover rate | | | 43% | | | | 65% | | | | 60% | | | | 92% | | | | 108% | |
1. December 30, 2011 represents the last business day of the Fund’s reporting period. See Note 2 of the accompanying Notes.
2. Per share amounts calculated based on the average shares outstanding during the period.
3. Assumes an initial investment on the business day before the first day of the fiscal period, with all dividends and distributions reinvested in additional shares on the reinvestment date, and redemption at the net asset value calculated on the last business day of the fiscal period. Total returns are not annualized for periods less than one full year. Total return information does not reflect expenses that apply at the separate account level or to related insurance products. Inclusion of these charges would reduce the total return figures for all periods shown. Returns do not reflect the deduction of taxes that a shareholder would pay on fund distributions or the redemption of fund shares.
4. Annualized for periods less than one full year.
5. Less than 0.005%.
6. Total expenses including indirect expenses from affiliated fund fees and expenses were as follows:
| | | | | | | | |
| | Year Ended December 31, 2015 | | | 0.80 | % | | |
| | Year Ended December 31, 2014 | | | 0.80 | % | | |
| | Year Ended December 31, 2013 | | | 0.81 | % | | |
| | Year Ended December 31, 2012 | | | 0.83 | % | | |
| | Year Ended December 30, 2011 | | | 0.83 | % | | |
See accompanying Notes to Financial Statements.
12 OPPENHEIMER MAIN STREET SMALL CAP FUND/VA
| | | | | | | | | | | | | | | | | | | | |
| Service Shares | | Year Ended
December
31, 2015 | | | Year Ended
December
31, 2014 | | | Year Ended
December
31, 2013 | | | Year Ended
December
31, 2012 | | | Year Ended
December
30, 20111 | |
Per Share Operating Data | | | | | | | | | | | | | | | | | | | | |
Net asset value, beginning of period | | $ | 26.26 | | | $ | 27.53 | | | $ | 19.96 | | | $ | 17.02 | | | $ | 17.50 | |
Income (loss) from investment operations: | | | | | | | | | | | | | | | | | | | | |
Net investment income2 | | | 0.06 | | | | 0.19 | | | | 0.10 | | | | 0.15 | | | | 0.06 | |
Net realized and unrealized gain (loss) | | | (1.25) | | | | 2.71 | | | | 7.93 | | | | 2.85 | | | | (0.47) | |
Total from investment operations | | | (1.19) | | | | 2.90 | | | | 8.03 | | | | 3.00 | | | | (0.41) | |
Dividends and/or distributions to shareholders: | | | | | | | | | | | | | | | | | | | | |
Dividends from net investment income | | | (0.17) | | | | (0.18) | | | | (0.17) | | | | (0.06) | | | | (0.07) | |
Distributions from net realized gain | | | (3.85) | | | | (3.99) | | | | (0.29) | | | | 0.00 | | | | 0.00 | |
Total dividends and/or distributions to shareholders | | | (4.02) | | | | (4.17) | | | | (0.46) | | | | (0.06) | | | | (0.07) | |
Net asset value, end of period | | $ | 21.05 | | | $ | 26.26 | | | $ | 27.53 | | | $ | 19.96 | | | $ | 17.02 | |
| | | | |
| |
| | | | |
Total Return, at Net Asset Value3 | | | (6.09)% | | | | 11.66% | | | | 40.62% | | | | 17.67% | | | | (2.38)% | |
| | | | | | | | | | | | | | | | | | | | |
Ratios/Supplemental Data | | | | | | | | | | | | | | | | | | | | |
Net assets, end of period (in thousands) | | $ | 856,719 | | | $ | 968,637 | | | $ | 990,168 | | | $ | 849,920 | | | $ | 790,752 | |
Average net assets (in thousands) | | $ | 927,514 | | | $ | 957,874 | | | $ | 935,083 | | | $ | 836,487 | | | $ | 823,201 | |
Ratios to average net assets:4 | | | | | | | | | | | | | | | | | | | | |
Net investment income | | | 0.24% | | | | 0.75% | | | | 0.43% | | | | 0.82% | | | | 0.34% | |
Expenses excluding interest and fees from borrowings | | | 1.05% | | | | 1.05% | | | | 1.06% | | | | 1.08% | | | | 1.08% | |
Interest and fees from borrowings | | | 0.00%5 | | | | 0.00% | | | | 0.00% | | | | 0.00% | | | | 0.00% | |
Total expenses6 | | | 1.05% | | | | 1.05% | | | | 1.06% | | | | 1.08% | | | | 1.08% | |
| Expenses after payments, waivers and/or reimbursements and reduction to custodian expenses | | | 1.05% | | | | 1.04% | | | | 1.05% | | | | 1.05% | | | | 1.05% | |
Portfolio turnover rate | | | 43% | | | | 65% | | | | 60% | | | | 92% | | | | 108% | |
1. December 30, 2011 represents the last business day of the Fund’s reporting period. See Note 2 of the accompanying Notes.
2. Per share amounts calculated based on the average shares outstanding during the period.
3. Assumes an initial investment on the business day before the first day of the fiscal period, with all dividends and distributions reinvested in additional shares on the reinvestment date, and redemption at the net asset value calculated on the last business day of the fiscal period. Total returns are not annualized for periods less than one full year. Total return information does not reflect expenses that apply at the separate account level or to related insurance products. Inclusion of these charges would reduce the total return figures for all periods shown. Returns do not reflect the deduction of taxes that a shareholder would pay on fund distributions or the redemption of fund shares.
4. Annualized for periods less than one full year.
5. Less than 0.005%.
6. Total expenses including indirect expenses from affiliated fund fees and expenses were as follows:
| | | | | | | | |
| | Year Ended December 31, 2015 | | | 1.05 | % | | |
| | Year Ended December 31, 2014 | | | 1.05 | % | | |
| | Year Ended December 31, 2013 | | | 1.06 | % | | |
| | Year Ended December 31, 2012 | | | 1.08 | % | | |
| | Year Ended December 30, 2011 | | | 1.08 | % | | |
See accompanying Notes to Financial Statements.
13 OPPENHEIMER MAIN STREET SMALL CAP FUND/VA
NOTES TO FINANCIAL STATEMENTS December 31, 2015
1. Organization
Oppenheimer Main Street Small Cap Fund/VA (the “Fund”), a separate series of Oppenheimer Variable Account Funds, is a diversified open-end management investment company registered under the Investment Company Act of 1940 (“1940 Act”), as amended. The Fund’s investment objective is to seek capital appreciation. The Fund’s investment adviser is OFI Global Asset Management, Inc. (“OFI Global” or the “Manager”), a wholly-owned subsidiary of OppenheimerFunds, Inc. (“OFI” or the “Sub-Adviser”). The Manager has entered into a sub-advisory agreement with OFI. Shares of the Fund are sold only to separate accounts of life insurance companies.
The Fund offers two classes of shares. Both classes are sold at their offering price, which is the net asset value per share, to separate investment accounts of participating insurance companies as an underlying investment for variable life insurance policies, variable annuity contracts or other investment products. The class of shares designated as Service shares is subject to a distribution and service plan. Both classes of shares have identical rights and voting privileges with respect to the Fund in general and exclusive voting rights on matters that affect that class alone. Earnings, net assets and net asset value per share may differ due to each class having its own expenses, such as transfer and shareholder servicing agent fees and shareholder communications, directly attributable to that class.
The following is a summary of significant accounting policies followed in the Fund’s preparation of financial statements in accordance with accounting principles generally accepted in the United States (“U.S. GAAP”).
2. Significant Accounting Policies
Security Valuation. All investments in securities are recorded at their estimated fair value, as described in Note 3.
Reporting Period End Date. The last day of the Fund’s reporting period is the last day the New York Stock Exchange was open for trading during the period. The Fund’s financial statements have been presented through that date to maintain consistency with the Fund’s net asset value calculations used for shareholder transactions.
Foreign Currency Translation. The Fund’s accounting records are maintained in U.S. dollars. The values of securities denominated in foreign currencies and amounts related to the purchase and sale of foreign securities and foreign investment income are translated into U.S. dollars as of the close of the New York Stock Exchange (the “Exchange”), normally 4:00 P.M. Eastern time, on each day the Exchange is open for trading. Foreign exchange rates may be valued primarily using a reliable bank, dealer or service authorized by the Board of Trustees.
Reported net realized gains and losses from foreign currency transactions arise from sales of portfolio securities, sales and maturities of short-term securities, sales of foreign currencies, exchange rate fluctuations between the trade and settlement dates on securities transactions, and the difference between the amounts of dividends, interest, and foreign withholding taxes recorded on the Fund’s books and the U.S. dollar equivalent of the amounts actually received or paid. Net unrealized appreciation and depreciation on the translation of assets and liabilities denominated in foreign currencies arise from changes in the values of assets and liabilities, including investments in securities at fiscal period end, resulting from changes in exchange rates.
The effect of changes in foreign currency exchange rates on investments is separately identified from the fluctuations arising from changes in market values of securities held and reported with all other foreign currency gains and losses in the Fund’s Statement of Operations.
Allocation of Income, Expenses, Gains and Losses. Income, expenses (other than those attributable to a specific class), gains and losses are allocated on a daily basis to each class of shares based upon the relative proportion of net assets represented by such class. Operating expenses directly attributable to a specific class are charged against the operations of that class.
Dividends and Distributions to Shareholders. Dividends and distributions to shareholders, which are determined in accordance with income tax regulations and may differ from U.S. GAAP, are recorded on the ex-dividend date. Income and capital gain distributions, if any, are declared and paid annually or at other times as deemed necessary by the Manager.
Investment Income. Dividend income is recorded on the ex-dividend date or upon ex-dividend notification in the case of certain foreign dividends where the ex-dividend date may have passed. Non-cash dividends included in dividend income, if any, are recorded at the fair market value of the securities received. Interest income is recognized on an accrual basis. Discount and premium, which are included in interest income on the Statement of Operations, are amortized or accreted daily.
Return of Capital Estimates. Distributions received from the Fund’s investments in Master Limited Partnerships (MLPs) and Real Estate Investments Trusts (REITs), generally are comprised of income and return of capital. The Fund records investment income and return of capital based on estimates. Such estimates are based on historical information available from each MLP, REIT and other industry sources. These estimates may subsequently be revised based on information received from MLPs and REITs after their tax reporting periods are concluded.
Custodian Fees. “Custodian fees and expenses” in the Statement of Operations may include interest expense incurred by the Fund on any cash overdrafts of its custodian account during the period. Such cash overdrafts may result from the effects of failed trades in portfolio securities and from cash outflows resulting from unanticipated shareholder redemption activity. The Fund pays interest to its custodian on such cash overdrafts, to the extent they are not offset by positive cash balances maintained by the Fund, at a rate equal to the Federal Funds Rate plus 0.50%. The “Reduction to custodian expenses” line item, if applicable, represents earnings on cash balances maintained by the Fund during the period. Such interest expense and other custodian fees may be paid with these earnings.
14 OPPENHEIMER MAIN STREET SMALL CAP FUND/VA
2. Significant Accounting Policies (Continued)
Security Transactions. Security transactions are recorded on the trade date. Realized gains and losses on securities sold are determined on the basis of identified cost.
Indemnifications. The Fund’s organizational documents provide current and former Trustees and officers with a limited indemnification against liabilities arising in connection with the performance of their duties to the Fund. In the normal course of business, the Fund may also enter into contracts that provide general indemnifications. The Fund’s maximum exposure under these arrangements is unknown as this would be dependent on future claims that may be made against the Fund. The risk of material loss from such claims is considered remote.
Federal Taxes. The Fund intends to comply with provisions of the Internal Revenue Code applicable to regulated investment companies and to distribute substantially all of its investment company taxable income, including any net realized gain on investments not offset by capital loss carryforwards, if any, to shareholders. Therefore, no federal income or excise tax provision is required. The Fund files income tax returns in U.S. federal and applicable state jurisdictions. The statute of limitations on the Fund’s tax return filings generally remains open for the three preceding fiscal reporting period ends.
The tax components of capital shown in the following table represent distribution requirements the Fund must satisfy under the income tax regulations, losses the Fund may be able to offset against income and gains realized in future years and unrealized appreciation or depreciation of securities and other investments for federal income tax purposes.
| | | | | | | | | | | | |
Undistributed Net Investment Income | | Undistributed
Long-Term
Gain | | | Accumulated
Loss
Carryforward | | | Net Unrealized
Appreciation
Based on cost of
Securities and
Other Investments
for Federal Income
Tax Purposes | |
$2,801,135 | | | $37,921,718 | | | | $— | | | | $130,056,801 | |
Net investment income (loss) and net realized gain (loss) may differ for financial statement and tax purposes. The character of dividends and distributions made during the fiscal year from net investment income or net realized gains are determined in accordance with federal income tax requirements, which may differ from the character of net investment income or net realized gains presented in those financial statements in accordance with U.S. GAAP. Also, due to timing of dividends and distributions, the fiscal year in which amounts are distributed may differ from the fiscal year in which the income or net realized gain was recorded by the Fund.
Accordingly, the following amounts have been reclassified for the reporting period. Net assets of the Fund were unaffected by the reclassifications.
| | | | | | | | |
Increase to Paid-in Capital | | Increase to Accumulated
Net Investment
Income | | | Reduction to
Accumulated Net
Realized Gain on
Investments1 | |
$2,987,351 | | | $495,041 | | | | $3,482,392 | |
1. $2,987,379, all of which was long-term capital gain, was distributed in connection with Fund share redemptions.
The tax character of distributions paid during the reporting periods:
| | | | | | | | |
| | | Year Ended
December 31, 2015 | | | Year Ended
December 31, 2014 | |
Distributions paid from: | | | | | | | | |
Ordinary income | | $ | 11,136,711 | | | $ | 82,496,622 | |
Long-term capital gain | | | 152,652,697 | | | | 80,932,098 | |
| | | | |
Total | | $ | 163,789,408 | | | $ | 163,428,720 | |
| | | | |
The aggregate cost of securities and other investments and the composition of unrealized appreciation and depreciation of securities and other investments for federal income tax purposes at period end are noted in the following table. The primary difference between book and tax appreciation or depreciation of securities and other investments, if applicable, is attributable to the tax deferral of losses or tax realization of financial statement unrealized gain or loss.
| | | | |
Federal tax cost of securities | | $ | 853,380,498 | |
| | | | |
Gross unrealized appreciation | | $ | 181,507,915 | |
Gross unrealized depreciation | | | (51,451,114) | |
| | | | |
Net unrealized appreciation | | $ | 130,056,801 | |
| | | | |
Use of Estimates. The preparation of financial statements in conformity with U.S. GAAP requires management to make estimates and assumptions that affect the reported amounts of assets and liabilities and disclosure of contingent assets and liabilities at the date of the financial statements and the reported amounts of increases and decreases in net assets from operations during the reporting period. Actual results could differ from those estimates.
15 OPPENHEIMER MAIN STREET SMALL CAP FUND/VA
NOTES TO FINANCIAL STATEMENTS Continued
3. Securities Valuation
The Fund calculates the net asset value of its shares as of the close of the New York Stock Exchange (the “Exchange”), normally 4:00 P.M. Eastern time, on each day the Exchange is open for trading, except in the case of a scheduled early closing of the Exchange, in which case the Fund will calculate net asset value of the shares as of the scheduled early closing time of the Exchange.
The Fund’s Board has adopted procedures for the valuation of the Fund’s securities and has delegated the day-to-day responsibility for valuation determinations under those procedures to the Manager. The Manager has established a Valuation Committee which is responsible for determining a “fair valuation” for any security for which market quotations are not “readily available.” The Valuation Committee’s fair valuation determinations are subject to review, approval and ratification by the Fund’s Board at its next regularly scheduled meeting covering the calendar quarter in which the fair valuation was determined.
Valuation Methods and Inputs
Securities are valued using unadjusted quoted market prices, when available, as supplied primarily by third party pricing services or dealers.
The following methodologies are used to determine the market value or the fair value of the types of securities described below:
Securities traded on a registered U.S. securities exchange (including exchange-traded derivatives other than futures and futures options) are valued based on the last sale price of the security reported on the principal exchange on which it is traded, prior to the time when the Fund’s assets are valued. In the absence of a sale, the security is valued at the mean between the bid and asked price on the principal exchange or, if not available from the principal exchange, obtained from two dealers. If bid and asked prices are not available from either the exchange or two dealers, the security is valued by using one of the following methodologies (listed in order of priority): (1) a bid from the principal exchange, (2) the mean between the bid and asked price as provided by a single dealer, or (3) a bid from a single dealer. A security of a foreign issuer traded on a foreign exchange, but not listed on a registered U.S. securities exchange, is valued based on the last sale price on the principal exchange on which the security is traded, as identified by the third party pricing service used by the Manager, prior to the time when the Fund’s assets are valued. If the last sale price is unavailable, the security is valued at the most recent official closing price on the principal exchange on which it is traded. If the last sales price or official closing price for a foreign security is not available, the security is valued at the mean between the bid and asked price per the exchange or, if not available from the exchange, obtained from two dealers. If bid and asked prices are not available from either the exchange or two dealers, the security is valued by using one of the following methodologies (listed in order of priority): (1) a bid from the exchange, (2) the mean between the bid and asked price as provided by a single dealer, or (3) a bid from a single dealer.
Shares of a registered investment company that are not traded on an exchange are valued at that investment company’s net asset value per share.
Corporate and government debt securities (of U.S. or foreign issuers) and municipal debt securities, event-linked bonds, loans, mortgage-backed securities, collateralized mortgage obligations, and asset-backed securities are valued at the mean between the “bid” and “asked” prices utilizing evaluated prices obtained from third party pricing services or broker-dealers who may use matrix pricing methods to determine the evaluated prices.
Short-term money market type debt securities with a remaining maturity of sixty days or less are valued at cost adjusted by the amortization of discount or premium to maturity (amortized cost), which approximates market value. Short-term debt securities with a remaining maturity in excess of sixty days are valued at the mean between the “bid” and “asked” prices utilizing evaluated prices obtained from third party pricing services or broker-dealers.
A description of the standard inputs that may generally be considered by the third party pricing vendors in determining their evaluated prices is provided below.
| | |
| Security Type | | Standard inputs generally considered by third-party pricing vendors |
Corporate debt, government debt, municipal, mortgage-backed and asset-backed securities | | Reported trade data, broker-dealer price quotations, benchmark yields, issuer spreads on comparable securities, the credit quality, yield, maturity, and other appropriate factors. |
| Loans | | Information obtained from market participants regarding reported trade data and broker-dealer price quotations. |
Event-linked bonds | | Information obtained from market participants regarding reported trade data and broker-dealer price quotations. |
If a market value or price cannot be determined for a security using the methodologies described above, or if, in the “good faith” opinion of the Manager, the market value or price obtained does not constitute a “readily available market quotation,” or a significant event has occurred that would materially affect the value of the security, the security is fair valued either (i) by a standardized fair valuation methodology applicable to the security type or the significant event as previously approved by the Valuation Committee and the Fund’s Board or (ii) as determined in good faith by the Manager’s Valuation Committee. The Valuation Committee considers all relevant facts that are reasonably available, through either public information or information available to the Manager, when determining the fair value of a security. Fair value determinations by the Manager are subject to review, approval and ratification by the Fund’s Board at its next regularly scheduled meeting covering the calendar quarter in which the fair valuation was determined. Those fair valuation standardized methodologies include, but are not limited to, valuing securities at the last sale price or initially at cost and subsequently adjusting the value based on: changes in company specific fundamentals, changes in an appropriate securities index, or changes in the value of similar securities which may be further adjusted for any discounts related to security-specific resale restrictions. When possible, such methodologies use observable market inputs such as unadjusted quoted prices of similar securities, observable interest rates, currency rates and yield curves. The methodologies used for valuing securities are not necessarily an indication of the risks associated with investing in those securities nor can it be assured that the Fund can obtain the fair value assigned to a security if it were to sell the security.
16 OPPENHEIMER MAIN STREET SMALL CAP FUND/VA
3. Securities Valuation (Continued)
To assess the continuing appropriateness of security valuations, the Manager, or its third party service provider who is subject to oversight by the Manager, regularly compares prior day prices, prices on comparable securities, and sale prices to the current day prices and challenges those prices exceeding certain tolerance levels with the third party pricing service or broker source. For those securities valued by fair valuations, whether through a standardized fair valuation methodology or a fair valuation determination, the Valuation Committee reviews and affirms the reasonableness of the valuations based on such methodologies and fair valuation determinations on a regular basis after considering all relevant information that is reasonably available.
Classifications
Each investment asset or liability of the Fund is assigned a level at measurement date based on the significance and source of the inputs to its valuation. Various data inputs are used in determining the value of each of the Fund’s investments as of the reporting period end. These data inputs are categorized in the following hierarchy under applicable financial accounting standards:
1) Level 1-unadjusted quoted prices in active markets for identical assets or liabilities (including securities actively traded on a securities exchange)
2) Level 2-inputs other than unadjusted quoted prices that are observable for the asset or liability (such as unadjusted quoted prices for similar assets and market corroborated inputs such as interest rates, prepayment speeds, credit risks, etc.)
3) Level 3-significant unobservable inputs (including the Manager’s own judgments about assumptions that market participants would use in pricing the asset or liability).
The inputs used for valuing securities are not necessarily an indication of the risks associated with investing in those securities.
The table below categorizes amounts that are included in the Fund’s Statement of Assets and Liabilities at period end based on valuation input level:
| | | | | | | | | | | | | | | | |
| | | Level 1— Unadjusted Quoted
Prices | | | Level 2—
Other Significant
Observable Inputs | | | Level 3—
Significant
Unobservable
Inputs | | | Value | |
Assets Table | | | | | | | | | | | | | | | | |
Investments, at Value: | | | | | | | | | | | | | | | | |
Common Stocks | | | | | | | | | | | | | | | | |
Consumer Discretionary | | $ | 98,643,142 | | | $ | — | | | $ | — | | | $ | 98,643,142 | |
Consumer Staples | | | 38,589,082 | | | | — | | | | — | | | | 38,589,082 | |
Energy | | | 37,200,985 | | | | — | | | | — | | | | 37,200,985 | |
Financials | | | 218,958,825 | | | | — | | | | — | | | | 218,958,825 | |
Health Care | | | 126,583,659 | | | | 2,962,765 | | | | — | | | | 129,546,424 | |
Industrials | | | 163,064,822 | | | | — | | | | — | | | | 163,064,822 | |
Information Technology | | | 188,972,717 | | | | — | | | | — | | | | 188,972,717 | |
Materials | | | 52,904,441 | | | | — | | | | — | | | | 52,904,441 | |
Utilities | | | 41,172,854 | | | | — | | | | — | | | | 41,172,854 | |
Investment Company | | | 14,384,001 | | | | — | | | | — | | | | 14,384,001 | |
Total Assets | | $ | 980,474,528 | | | $ | 2,962,765 | | | $ | — | | | $ | 983,437,293 | |
Forward currency exchange contracts and futures contracts, if any, are reported at their unrealized appreciation/depreciation at measurement date, which represents the change in the contract’s value from trade date. All additional assets and liabilities included in the above table are reported at their market value at measurement date.
4. Investments and Risks
Investments in Affiliated Funds. The Fund is permitted to invest in other mutual funds advised by the Manager (“Affiliated Funds”). Affiliated Funds are open-end management investment companies registered under the 1940 Act, as amended. The Manager is the investment adviser of, and the Sub-Adviser provides investment and related advisory services to, the Affiliated Funds. When applicable, the Fund’s investments in Affiliated Funds are included in the Statement of Investments. Shares of Affiliated Funds are valued at their net asset value per share. As a shareholder, the Fund is subject to its proportional share of the Affiliated Funds’ expenses, including their management fee. The Manager will waive fees and/or reimburse Fund expenses in an amount equal to the indirect management fees incurred through the Fund’s investment in the Affiliated Funds.
Each of the Affiliated Funds in which the Fund invests has its own investment risks, and those risks can affect the value of the Fund’s investments and therefore the value of the Fund’s shares. To the extent that the Fund invests more of its assets in one Affiliated Fund than in another, the Fund will have greater exposure to the risks of that Affiliated Fund.
Investment in Oppenheimer Institutional Money Market Fund. The Fund is permitted to invest daily available cash balances in a money market Affiliated Fund. The Fund may invest the available cash in Class E shares of Oppenheimer Institutional Money Market Fund (“IMMF”) to seek current income while preserving liquidity or for defensive purposes. IMMF is regulated as a money market fund under the Investment Company Act of 1940, as amended.
17 OPPENHEIMER MAIN STREET SMALL CAP FUND/VA
NOTES TO FINANCIAL STATEMENTS Continued
4. Investments and Risks (Continued)
Master Limited Partnerships (“MLPs”). MLPs issue common units that represent an equity ownership interest in a partnership and provide limited voting rights. MLP common units are registered with the Securities and Exchange Commission (“SEC”), and are freely tradable on securities exchanges such as the NYSE and the NASDAQ Stock Market (“NASDAQ”), or in the over-the-counter (“OTC”) market. An MLP consists of one or more general partners, who conduct the business, and one or more limited partners, who contribute capital. MLP common unit holders have a limited role in the partnership’s operations and management. The Fund, as a limited partner, normally would not be liable for the debts of the MLP beyond the amounts the Fund has contributed, but would not be shielded to the same extent that a shareholder of a corporation would be. In certain circumstances creditors of an MLP would have the right to seek return of capital distributed to a limited partner. This right of an MLP’s creditors would continue after the Fund sold its investment in the MLP.
Equity Security Risk. Stocks and other equity securities fluctuate in price. The value of the Fund’s portfolio may be affected by changes in the equity markets generally. Equity markets may experience significant short-term volatility and may fall sharply at times. Different markets may behave differently from each other and U.S. equity markets may move in the opposite direction from one or more foreign stock markets. Adverse events in any part of the equity or fixed-income markets may have unexpected negative effects on other market segments.
The prices of individual equity securities generally do not all move in the same direction at the same time and a variety of factors can affect the price of a particular company’s securities. These factors may include, but are not limited to, poor earnings reports, a loss of customers, litigation against the company, general unfavorable performance of the company’s sector or industry, or changes in government regulations affecting the company or its industry.
5. Market Risk Factors
The Fund’s investments in securities and/or financial derivatives may expose the fund to various market risk factors:
Commodity Risk. Commodity risk relates to the change in value of commodities or commodity indexes as they relate to increases or decreases in the commodities market. Commodities are physical assets that have tangible properties. Examples of these types of assets are crude oil, heating oil, metals, livestock, and agricultural products.
Credit Risk. Credit risk relates to the ability of the issuer of debt to meet interest and principal payments, or both, as they come due. In general, lower-grade, higher-yield debt securities are subject to credit risk to a greater extent than lower-yield, higher-quality securities.
Equity Risk. Equity risk relates to the change in value of equity securities as they relate to increases or decreases in the general market.
Foreign Exchange Rate Risk. Foreign exchange rate risk relates to the change in the U.S. dollar value of a security held that is denominated in a foreign currency. The U.S. dollar value of a foreign currency denominated security will decrease as the dollar appreciates against the currency, while the U.S. dollar value will increase as the dollar depreciates against the currency.
Interest Rate Risk. Interest rate risk refers to the fluctuations in value of fixed-income securities resulting from the inverse relationship between price and yield. For example, an increase in general interest rates will tend to reduce the market value of already issued fixed-income investments, and a decline in general interest rates will tend to increase their value. In addition, debt securities with longer maturities, which tend to have higher yields, are subject to potentially greater fluctuations in value from changes in interest rates than obligations with shorter maturities.
Volatility Risk. Volatility risk refers to the magnitude of the movement, but not the direction of the movement, in a financial instrument’s price over a defined time period. Large increases or decreases in a financial instrument’s price over a relative time period typically indicate greater volatility risk, while small increases or decreases in its price typically indicate lower volatility risk.
6. Shares of Beneficial Interest
The Fund has authorized an unlimited number of $0.001 par value shares of beneficial interest of each class. Transactions in shares of beneficial interest were as follows:
| | | | | | | | | | | | | | | | |
| | | Year Ended December 31, 2015 | | | Year Ended December 31, 2014 | |
| | | Shares | | | Amount | | | Shares | | | Amount | |
Non-Service Shares | | | | | | | | | | | | | | | | |
Sold | | | 1,409,497 | | | $ | 33,342,939 | | | | 1,046,887 | | | $ | 27,673,554 | |
Dividends and/or distributions reinvested | | | 876,695 | | | | 20,768,914 | | | | 817,408 | | | | 20,165,510 | |
Redeemed | | | (1,368,306 | ) | | | (32,793,846 | ) | | | (1,573,636 | ) | | | (41,047,851) | |
Net increase | | | 917,886 | | | $ | 21,318,007 | | | | 290,659 | | | $ | 6,791,213 | |
| | | | | | | | | | | | | | | | |
| | | | | | | | | | | | | | | | | |
Service Shares | | | | | | | | | | | | | | | | |
Sold | | | 3,720,118 | | | $ | 87,937,386 | | | | 3,683,961 | | | $ | 93,934,405 | |
Dividends and/or distributions reinvested | | | 6,109,352 | | | | 143,020,494 | | | | 5,866,634 | | | | 143,263,210 | |
Redeemed | | | (6,013,134 | ) | | | (144,868,706 | ) | | | (8,630,744 | ) | | | (221,163,808) | |
Net increase | | | 3,816,336 | | | $ | 86,089,174 | | | | 919,851 | | | $ | 16,033,807 | |
| | | | | | | | | | | | | | | | |
7. Purchases and Sales of Securities
The aggregate cost of purchases and proceeds from sales of securities, other than short-term obligations and investments in IMMF, for the reporting period were as follows:
18 OPPENHEIMER MAIN STREET SMALL CAP FUND/VA
7. Purchases and Sales of Securities (Continued)
| | | | | | | | |
| | | Purchases | | | Sales | |
Investment securities | | $ | 442,687,846 | | | $ | 500,491,006 | |
8. Fees and Other Transactions with Affiliates
Management Fees. Under the investment advisory agreement, the Fund pays the Manager a management fee based on the daily net assets of the Fund at an annual rate as shown in the following table:
| | | | | | | | | | |
| Fee Schedule Through October 31, 2015 | | | Fee Schedule Effective November 1, 2015 | |
Up to $200 million | | | 0.75% | | | Up to $200 million | | | 0.75% | |
Next $200 million | | | 0.72 | | | Next $200 million | | | 0.72 | |
Next $200 million | | | 0.69 | | | Next $200 million | | | 0.69 | |
Next $200 million | | | 0.66 | | | Next $200 million | | | 0.66 | |
Next $200 million | | | 0.60 | | | Next $200 million | | | 0.60 | |
Over $1 billion | | | 0.58 | | | Next $4 billion | | | 0.58 | |
| | | | | | Over $5 billion | | | 0.56 | |
The Fund’s effective management fee for the reporting period was 0.68% of average annual net assets before any applicable waivers.
Sub-Adviser Fees. The Manager has retained the Sub-Adviser to provide the day-to-day portfolio management of the Fund. Under the Sub-Advisory Agreement, the Manager pays the Sub-Adviser an annual fee in monthly installments, equal to a percentage of the investment management fee collected by the Manager from the Fund, which shall be calculated after any investment management fee waivers. The fee paid to the Sub-Adviser is paid by the Manager, not by the Fund.
Transfer Agent Fees. OFI Global (the “Transfer Agent”) serves as the transfer and shareholder servicing agent for the Fund. The Fund pays the Transfer Agent a fee based on annual net assets. Fees incurred and average net assets for each class with respect to these services are detailed in the Statement of Operations and Financial Highlights, respectively.
Sub-Transfer Agent Fees. The Transfer Agent has retained Shareholder Services, Inc., a wholly-owned subsidiary of OFI (the “Sub-Transfer Agent”), to provide the day-to-day transfer agent and shareholder servicing of the Fund. Under the Sub-Transfer Agency Agreement, the Transfer Agent pays the Sub-Transfer Agent an annual fee in monthly installments, equal to a percentage of the transfer agent fee collected by the Transfer Agent from the Fund, which shall be calculated after any applicable fee waivers. The fee paid to the Sub-Transfer Agent is paid by the Transfer Agent, not by the Fund.
Trustees’ Compensation. The Fund’s Board of Trustees (“Board”) has adopted a compensation deferral plan for Independent Trustees that enables Trustees to elect to defer receipt of all or a portion of the annual compensation they are entitled to receive from the Fund. For purposes of determining the amount owed to the Trustees under the plan, deferred amounts are treated as though equal dollar amounts had been invested in shares of the Fund or in other Oppenheimer funds selected by the Trustees. The Fund purchases shares of the funds selected for deferral by the Trustees in amounts equal to his or her deemed investment, resulting in a Fund asset equal to the deferred compensation liability. Such assets are included as a component of “Other” within the asset section of the Statement of Assets and Liabilities. Deferral of Trustees’ fees under the plan will not affect the net assets of the Fund and will not materially affect the Fund’s assets, liabilities or net investment income per share. Amounts will be deferred until distributed in accordance with the compensation deferral plan.
Distribution and Service Plan for Service Shares. The Fund has adopted a Distribution and Service Plan (the “Plan”) pursuant to Rule 12b-1 under the 1940 Act for Service shares to pay OppenheimerFunds Distributor, Inc. (the “Distributor”), for distribution related services, personal service and account maintenance for the Fund’s Service shares. Under the Plan, payments are made periodically at an annual rate of 0.25% of the daily net assets of Service shares of the Fund. The Distributor currently uses all of those fees to compensate sponsors of the insurance product that offers Fund shares, for providing personal service and maintenance of accounts of their variable contract owners that hold Service shares. These fees are paid out of the Fund’s assets on an on-going basis and increase operating expenses of the Service shares, which results in lower performance compared to the Fund’s shares that are not subject to a service fee. Fees incurred by the Fund under the Plan are detailed in the Statement of Operations.
Waivers and Reimbursements of Expenses. The Manager has voluntarily agreed to limit the Fund’s expenses after payments, waivers and/or reimbursements and reduction to custodian expenses, excluding expenses incurred directly or indirectly by the Fund as a result of investments in other investment companies, wholly-owned subsidiaries and pooled investment vehicles; so that those expenses, as percentages of daily net assets, will not exceed the annual rate of 0.80% for Non-Service shares and 1.05% for Service shares. The expense limitations do not include interest and fees from borrowing, and other expenses not incurred in the ordinary course of the Fund’s business.
The Manager will waive fees and/or reimburse Fund expenses in an amount equal to the indirect management fees incurred through the Fund’s investment in IMMF. During the reporting period, the Manager waived fees and/or reimbursed the Fund $17,540 for IMMF management fees.
Waivers and/or reimbursements may be modified or terminated as set forth according to the terms in the prospectus.
19 OPPENHEIMER MAIN STREET SMALL CAP FUND/VA
NOTES TO FINANCIAL STATEMENTS Continued
9. Borrowing and Other Financing
Joint Credit Facility. A number of mutual funds managed by the Manager participate in a $1.28 billion revolving credit facility (the “Facility”) intended to provide short-term financing, if necessary, subject to certain restrictions in connection with atypical redemption activity. Expenses and fees related to the Facility are paid by the participating funds and are disclosed separately or as other expenses on the Statement of Operations. The Fund did not utilize the Facility during the reporting period.
10. Pending Litigation
In 2009, several putative class action lawsuits were filed and later consolidated before the U.S. District Court for the District of Colorado against OppenheimerFunds, Inc. (“OFI”), OppenheimerFunds Distributor, Inc. (“OFDI”), and Oppenheimer Rochester California Municipal Fund, a fund advised by OFI Global Asset Management, Inc. and distributed by the Distributor (the “California Fund”), in connection with the California Fund’s investment performance. The plaintiffs asserted claims against OFI, OFDI and certain present and former trustees and officers of the California Fund under the federal securities laws, alleging, among other things, that the disclosure documents of the California Fund contained misrepresentations and omissions and the investment policies of the California Fund were not followed. Plaintiffs in the suit filed an amended complaint and defendants filed a motion to dismiss. In 2011, the court issued an order which granted in part and denied in part the defendants’ motion to dismiss. In 2012, plaintiffs filed a motion, which defendants opposed, to certify a class and appoint class representatives and class counsel. In March 2015, the court granted plaintiffs’ motion for class certification. In May 2015, the U.S. Court of Appeals for the Tenth Circuit vacated the class certification order and remanded the matter to the district court for further proceedings. In October 2015, the district court reaffirmed its order and determined that the suit will proceed as a class action. In December 2015, the Tenth Circuit denied defendants’ petition to appeal the district court’s reaffirmed class certification order.
OFI and OFDI believe the suit is without merit; that it is premature to render any opinion as to the likelihood of an outcome unfavorable to them in the suit; and that no estimate can yet be made as to the amount or range of any potential loss. Furthermore, OFI believes that the suit should not impair the ability of OFI or OFDI to perform their respective duties to the Fund and that the outcome of the suit should not have any material effect on the operations of any of the Oppenheimer funds.
20 OPPENHEIMER MAIN STREET SMALL CAP FUND/VA
REPORT OF INDEPENDENT REGISTERED PUBLIC ACCOUNTING FIRM
The Board of Trustees and Shareholders of Oppenheimer Variable Account Funds:
We have audited the accompanying statement of assets and liabilities of Oppenheimer Main Street Small Cap Fund/VA (a separate series of Oppenheimer Variable Account Funds), including the statement of investments, as of December 31, 2015, and the related statement of operations for the year then ended, the statements of changes in net assets for each of the years in the two-year period then ended, and the financial highlights for each of the years in the five-year period then ended. These financial statements and financial highlights are the responsibility of the Fund’s management. Our responsibility is to express an opinion on these financial statements and financial highlights based on our audits.
We conducted our audits in accordance with the standards of the Public Company Accounting Oversight Board (United States). Those standards require that we plan and perform the audit to obtain reasonable assurance about whether the financial statements and financial highlights are free of material misstatement. An audit includes examining, on a test basis, evidence supporting the amounts and disclosures in the financial statements. Our procedures included confirmation of securities owned as of December 31, 2015, by correspondence with the custodian, transfer agent and brokers, or by other appropriate auditing procedures where replies from brokers were not received. An audit also includes assessing the accounting principles used and significant estimates made by management, as well as evaluating the overall financial statement presentation. We believe that our audits provide a reasonable basis for our opinion.
In our opinion, the financial statements and financial highlights referred to above present fairly, in all material respects, the financial position of Oppenheimer Main Street Small Cap Fund/VA as of December 31, 2015, the results of its operations for the year then ended, the changes in its net assets for each of the years in the two-year period then ended, and the financial highlights for each of the years in the five-year period then ended, in conformity with U.S. generally accepted accounting principles.
KPMG LLP
Denver, Colorado
February 12, 2016
21 OPPENHEIMER MAIN STREET SMALL CAP FUND/VA
FEDERAL INCOME TAX INFORMATION Unaudited
In early 2016, if applicable, shareholders of record received information regarding all dividends and distributions paid to them by the Fund during calendar year 2015.
Capital gain distributions of $3.74944 per share were paid to Non-Service and Service shareholders, respectively, on June 16, 2015. Whether received in stock or in cash, the capital gain distribution should be treated by shareholders as a gain from the sale of the capital assets held for more than one year (long-term capital gains).
Dividends, if any, paid by the Fund during the reporting period which are not designated as capital gain distributions should be multiplied by the maximum amount allowable but not less than 100% to arrive at the amount eligible for the corporate dividend-received deduction.
The foregoing information is presented to assist shareholders in reporting distributions received from the Fund to the Internal Revenue Service. Because of the complexity of the federal regulations which may affect your individual tax return and the many variations in state and local tax regulations, we recommend that you consult your tax advisor for specific guidance.
22 OPPENHEIMER MAIN STREET SMALL CAP FUND/VA
BOARD APPROVAL OF THE FUND���S INVESTMENT ADVISORY AND SUB-ADVISORY AGREEMENTS Unaudited
The Fund has entered into an investment advisory agreement with OFI Global Asset Management, Inc. (“OFI Global” or the “Adviser”), a wholly-owned subsidiary of OppenheimerFunds, Inc. (“OFI” or the “Sub-Adviser”) (“OFI Global” and “OFI” together the “Managers”) and OFI Global has entered into a sub-advisory agreement with OFI whereby OFI provides investment sub-advisory services to the Fund (collectively, the “Agreements”). Each year, the Board of Trustees (the “Board”), including a majority of the independent Trustees, is required to determine whether to approve the terms of the Agreements and the renewal thereof. The Investment Company Act of 1940, as amended, requires that the Board request and evaluate, and that the Managers provide, such information as may be reasonably necessary to evaluate the terms of the Agreements. The Board employs an independent consultant to prepare a report that provides information, including comparative information that the Board requests for that purpose. In addition to in-person meetings focused on this evaluation, the Board receives information throughout the year regarding Fund services, fees, expenses and performance.
The Adviser, Sub-Adviser and the independent consultant provided information to the Board on the following factors: (i) the nature, quality and extent of the Managers’ services, (ii) the comparative investment performance of the Fund and the Managers, (iii) the fees and expenses of the Fund, including comparative fee and expense information, (iv) the profitability of the Managers and their affiliates, including an analysis of the cost of providing services, (v) whether economies of scale are realized as the Fund grows and whether fee levels reflect these economies of scale for Fund investors and (vi) other benefits to the Managers from their relationship with the Fund. The Board was aware that there are alternatives to retaining the Managers.
Outlined below is a summary of the principal information considered by the Board as well as the Board’s conclusions.
Nature, Quality and Extent of Services. The Board considered information about the nature, quality and extent of the services provided to the Fund and information regarding the Managers’ key personnel who provide such services. The Managers’ duties include providing the Fund with the services of the portfolio managers and the Sub-Adviser’s investment team, who provide research, analysis and other advisory services in regard to the Fund’s investments; and securities trading services. OFI Global is responsible for oversight of third-party service providers; monitoring compliance with applicable Fund policies and procedures and adherence to the Fund’s investment restrictions; risk management; and oversight of the Sub-Adviser. OFI Global is also responsible for providing certain administrative services to the Fund as well. Those services include providing and supervising all administrative and clerical personnel who are necessary in order to provide effective corporate administration for the Fund; compiling and maintaining records with respect to the Fund’s operations; preparing and filing reports required by the U.S. Securities and Exchange Commission; preparing periodic reports regarding the operations of the Fund for its shareholders; preparing proxy materials for shareholder meetings; and preparing the registration statements required by federal and state securities laws for the sale of the Fund’s shares. OFI Global also provides the Fund with office space, facilities and equipment.
The Board also considered the quality of the services provided and the quality of the Managers’ resources that are available to the Fund. The Board took account of the fact that the Sub-Adviser has had over fifty years of experience as an investment adviser and that its assets under management rank it among the top mutual fund managers in the United States. The Board evaluated the Managers’ advisory, administrative, accounting, legal, compliance services and risk management, and information the Board has received regarding the experience and professional qualifications of the Managers’ key personnel and the size and functions of its staff. In its evaluation of the quality of the portfolio management services provided, the Board considered the experience of Matthew Ziehl, Raymond Anello, Raman Vardharaj, Joy Budzinski, Kristin Ketner, Magnus Krantz and Adam Weiner, the portfolio managers for the Fund, and the Sub-Adviser’s investment team and analysts. The Board members also considered the totality of their experiences with the Managers as directors or trustees of the Fund and other funds advised by the Managers. The Board considered information regarding the quality of services provided by affiliates of the Managers, which the Board members have become knowledgeable about through their experiences with the Managers and in connection with the renewal of the Fund’s service agreements. The Board concluded, in light of the Managers’ experience, reputation, personnel, operations and resources that the Fund benefits from the services provided under the Agreements.
Investment Performance of the Managers and the Fund. Throughout the year, the Managers provided information on the investment performance of the Fund, including comparative performance information. The Board also reviewed information, prepared by the Managers and by the independent consultant, comparing the Fund’s historical performance to relevant market indices and to the performance of other small blend funds underlying variable insurance products. The Board noted that the Fund outperformed its performance category median for each of the one-, three-, five- and ten-year periods. The Board also noted that the Fund performed in the first quintile of its performance category for the one-, three-, five- and ten-year periods.
Fees and Expenses of the Fund. The Board reviewed the fees paid to the Adviser and the other expenses borne by the Fund. The Board noted that the Adviser, not the Fund, pays the Sub-Adviser’s fee under the sub-advisory agreement. The independent consultant provided comparative data in regard to the fees and expenses of the Fund and other small blend funds underlying variable insurance products. In reviewing the fees and expenses charged to the VA funds, the Board considered the Adviser’s assertion that, because there is much greater disparity in the fees and services that may be provided by a manager to a VA fund as opposed to a retail fund, when comparing the expenses of the various VA funds to those of retail funds, it is most appropriate to focus on total expenses (rather than on the management fees). Accordingly, while the Board reviewed and considered all expenses, it focused on total expenses. The Board considered that the Fund’s contractual management fee and total expenses were lower than their respective peer group medians and category medians. Within the total asset range of $1 billion to $2 billion, the Fund’s effective management fee rate was lower than its peer group medians and category medians. The Board also considered that the Adviser has voluntarily agreed to limit the Fund’s total annual operating expenses so that those expenses, as percentages of daily net assets, will not exceed the annual rate of 0.80% for Non-Service Shares and 1.05% for Service Shares. This voluntary expense limitation may be amended or withdrawn at any time without prior notice to shareholders. The Board considered that the Adviser proposed an additional breakpoint at 0.56% for annual net assets in excess of $5 billion, which went into effect on November 1, 2015.
Economies of Scale and Profits Realized by the Managers. The Board considered information regarding the Managers’ costs in serving as the Fund’s investment adviser and sub-adviser, including the costs associated with the personnel and systems necessary to manage the Fund, and information regarding the Managers’ profitability from their relationship with the Fund. The Board reviewed whether the Managers may realize
23 OPPENHEIMER MAIN STREET SMALL CAP FUND/VA
BOARD APPROVAL OF THE FUND’S INVESTMENT ADVISORY AND SUB-ADVISORY AGREEMENTS Unaudited / Continued
economies of scale in managing and supporting the Fund. The Board noted that the Fund currently has management fee breakpoints, which are intended to share with Fund shareholders economies of scale that may exist as the Fund’s assets grow.
Other Benefits to the Managers. In addition to considering the profits realized by the Managers, the Board considered information that was provided regarding the direct and indirect benefits the Managers receive as a result of their relationship with the Fund, including compensation paid to the Managers’ affiliates and research provided to the Adviser in connection with permissible brokerage arrangements (soft dollar arrangements).
Conclusions. These factors were also considered by the independent Trustees meeting separately from the full Board, assisted by experienced counsel to the Fund and to the independent Trustees. Fund counsel and the independent Trustees’ counsel are independent of the Managers within the meaning and intent of the Securities and Exchange Commission Rules.
Based on its review of the information it received and its evaluations described above, the Board, including a majority of the independent Trustees, decided to continue the Agreements through August 31, 2016. In arriving at its decision, the Board did not identify any factor or factors as being more important than others, but considered all of the above information, and considered the terms and conditions of the Agreements, including the management fees, in light of all the surrounding circumstances.
24 OPPENHEIMER MAIN STREET SMALL CAP FUND/VA
PORTFOLIO PROXY VOTING POLICIES AND PROCEDURES; UPDATES TO STATEMENTS OF INVESTMENTS Unaudited
The Fund has adopted Portfolio Proxy Voting Policies and Procedures under which the Fund votes proxies relating to securities (“portfolio proxies”) held by the Fund. A description of the Fund’s Portfolio Proxy Voting Policies and Procedures is available (i) without charge, upon request, by calling the Fund toll-free at 1.800.525.7048, (ii) on the Fund’s website at www.oppenheimerfunds.com, and (iii) on the SEC’s website at www.sec.gov. In addition, the Fund is required to file Form N-PX, with its complete proxy voting record for the 12 months ended June 30th, no later than August 31st of each year. The Fund’s voting record is available (i) without charge, upon request, by calling the Fund toll-free at 1.800.525.7048, and (ii) in the Form N-PX filing on the SEC’s website at www.sec.gov.
The Fund files its complete schedule of portfolio holdings with the SEC for the first quarter and the third quarter of each fiscal year on Form N-Q. The Fund’s Form N-Q filings are available on the SEC’s website at www.sec.gov. Those forms may be reviewed and copied at the SEC’s Public Reference Room in Washington, D.C. Information on the operation of the Public Reference Room may be obtained by calling 1-800-SEC-0330.
25 OPPENHEIMER MAIN STREET SMALL CAP FUND/VA
TRUSTEES AND OFFICERS Unaudited
| | |
Name, Position(s) Held with the Fund, Length of
Service, Age | | Principal Occupation(s) During the Past 5 Years; Other Trusteeships/Directorships
Held; Number of Portfolios in the Fund Complex Currently Overseen |
| |
| INDEPENDENT TRUSTEES | | The address of each Trustee in the chart below is 6803 S. Tucson Way, Centennial, Colorado 80112-3924. Each Trustee serves for an indefinite term, or until his or her resignation, retirement, death or removal. |
| |
Sam Freedman, Chairman of the Board of Trustees (since 2013) and Trustee (since 1996) Year of Birth: 1940 | | Director of Colorado UpLIFT (charitable organization) (since September 1984). Mr. Freedman held several positions with the Sub-Adviser and with subsidiary or affiliated companies of the Sub-Adviser (until October 1994). Oversees 47 portfolios in the OppenheimerFunds complex. Mr. Freedman has served on the Boards of certain Oppenheimer funds since 1996, during which time he has become familiar with the Fund’s (and other Oppenheimer funds’) financial, accounting, regulatory and investment matters and has contributed to the Boards’ deliberations. |
| |
Jon S. Fossel, Trustee (since 1990) Year of Birth: 1942 | | Chairman of the Board of Jack Creek Preserve Foundation (non-profit organization) (since 2005); Chairman of the Board (2006-December 2011) and Director (June 2002-December 2011) of UNUMProvident (insurance company); Director of Northwestern Energy Corp. (public utility corporation) (November 2004-December 2009); Director of P.R. Pharmaceuticals (October 1999-October 2003); Director of Rocky Mountain Elk Foundation (non-profit organization) (February 1998-February 2003 and February 2005-February 2007); Chairman and Director (until October 1996) and President and Chief Executive Officer (until October 1995) of the Sub-Adviser; President, Chief Executive Officer and Director of the following: Oppenheimer Acquisition Corp. (“OAC”) (parent holding company of the Sub-Adviser), Shareholders Services, Inc. and Shareholder Financial Services, Inc. (until October 1995). Oversees 47 portfolios in the OppenheimerFunds complex. Mr. Fossel has served on the Boards of certain Oppenheimer funds since 1990, during which time he has become familiar with the Fund’s (and other Oppenheimer funds’) financial, accounting, regulatory and investment matters and has contributed to the Boards’ deliberations. |
| |
Richard F. Grabish, Trustee (since 2012) Year of Birth: 1948 | | Formerly Senior Vice President and Assistant Director of Sales and Marketing (March 1997-December 2007), Director (March 1987-December 2007) and Manager of Private Client Services (June 1985-June 2005) of A.G. Edwards & Sons, Inc. (broker/dealer and investment firm); Chairman and Chief Executive Officer of A.G. Edwards Trust Company, FSB (March 2001- December 2007); President and Vice Chairman of A.G. Edwards Trust Company, FSB (investment adviser) (April 1987-March 2001); President of A.G. Edwards Trust Company, FSB (investment adviser) (June 2005-December 2007). Oversees 47 portfolios in the OppenheimerFunds complex. Mr. Grabish has served on the Boards of certain Oppenheimer funds since 2001, during which time he has become familiar with the Fund’s (and other Oppenheimer funds’) financial, accounting, regulatory and investment matters and has contributed to the Boards’ deliberations. |
| |
Beverly L. Hamilton, Trustee (since 2002) Year of Birth: 1946 | | Trustee of Monterey Institute for International Studies (educational organization) (since February 2000); Board Member of Middlebury College (educational organization) (December 2005-June 2011); Chairman (since 2010) of American Funds’ Emerging Markets Growth Fund, Inc. (mutual fund); Director of The California Endowment (philanthropic organization) (April 2002-April 2008); Director (February 2002-2005) and Chairman of Trustees (2006-2007) of the Community Hospital of Monterey Peninsula; Director (October 1991-2005); Vice Chairman (2006-2009) of American Funds’ Emerging Markets Growth Fund, Inc. (mutual fund); President of ARCO Investment Management Company (February 1991-April 2000); Member of the investment committees of The Rockefeller Foundation (2001-2006) and The University of Michigan (since 2000); Advisor at Credit Suisse First Boston’s Sprout venture capital unit (venture capital fund) (1994-January 2005); Trustee of MassMutual Institutional Funds (investment company) (1996-June 2004); Trustee of MML Series Investment Fund (investment company) (April 1989-June 2004); Member of the investment committee of Hartford Hospital (2000-2003); and Advisor to Unilever (Holland) pension fund (2000-2003). Oversees 47 portfolios in the OppenheimerFunds complex. Ms. Hamilton has served on the Boards of certain Oppenheimer funds since 2002, during which time she has become familiar with the Fund’s (and other Oppenheimer funds’) financial, accounting, regulatory and investment matters and has contributed to the Boards’ deliberations. |
| |
Victoria J. Herget, Trustee (since 2012) Year of Birth:1951 | | Board Chair (2008-Present) and Director (2004-Present), United Educators (insurance company); Trustee (since 2000) and Chair (since 2010), Newberry Library (independent research library); Trustee, Mather LifeWays (senior living organization) (since 2001); Independent Director of the First American Funds (mutual fund family) (2003-2011); former Managing Director (1993-2001), Principal (1985-1993), Vice President (1978-1985) and Assistant Vice President (1973-1978) of Zurich Scudder Investments (investment adviser) (and its predecessor firms); Trustee (1992-2007), Chair of the Board of Trustees (1999-2007), Investment Committee Chair (1994-1999) and Investment Committee member (2007-2010) of Wellesley College; Trustee, BoardSource (non-profit organization) (2006-2009) and Chicago City Day School (K-8 School) (1994-2005). Oversees 47 portfolios in the OppenheimerFunds complex. Ms. Herget has served on the Boards of certain Oppenheimer funds since 2012, during which time she has become familiar with the Fund’s (and other Oppenheimer funds’) financial, accounting, regulatory and investment matters and has contributed to the Boards’ deliberations. |
| |
Robert J. Malone, Trustee (since 2002) Year of Birth: 1944 | | Chairman - Colorado Market of MidFirst Bank (since January 2015); Chairman of the Board (since 2012) and Director (since August 2005) of Jones International University (educational organization); Trustee of the Gallagher Family Foundation (non-profit organization) (2000-2015); Chairman, Chief Executive Officer and Director of Steele Street Bank Trust (commercial banking) (August 2003-January 2015); Board of Directors of Opera Colorado Foundation (non-profit organization) (2008- 2012); Director of Colorado UpLIFT (charitable organization) (1986-2010); Director of Jones Knowledge, Inc. (2006-2010); Former Chairman of U.S. Bank-Colorado (subsidiary of U.S. Bancorp and formerly Colorado National Bank) (July 1996-April 1999); Director of Commercial Assets, Inc. (real estate investment trust) (1993-2000); Director of U.S. Exploration, Inc. (oil and gas exploration) (1997-February 2004); Chairman of the Board (1991-1994) and Trustee (1985-1994) of Regis University; and Chairman of the Board (1990-1991 and Trustee (1984-1999) of Young Presidents Organization. Oversees 47 portfolios in the OppenheimerFunds complex. Mr. Malone has served on the Boards of certain Oppenheimer funds since 2002, during which time he has become familiar with the Fund’s (and other Oppenheimer funds’) financial, accounting, regulatory and investment matters and has contributed to the Boards’ deliberations. |
26 OPPENHEIMER MAIN STREET SMALL CAP FUND/VA
| | |
| |
F. William Marshall, Jr., Trustee (since 2000) Year of Birth: 1942 | | Trustee Emeritus of Worcester Polytech Institute (WPI) (private university) (since 2009); Trustee of MassMutual Select Funds (formerly MassMutual Institutional Funds) (investment company) (since 1996), MML Series Investment Fund (investment company) (since 1996) and Mass Mutual Premier Funds (investment company) (since January 2012); President and Treasurer of the SIS Funds (private charitable fund) (January 1999-March 2011); Former Trustee of WPI (1985-2008); Former Chairman of the Board (2004-2006) and Former Chairman of the Investment Committee of WPI (1994-2008); Chairman of SIS Family Bank, F.S.B. (formerly SIS Bank) (commercial bank) (January 1999-July 1999); Executive Vice President of Peoples Heritage Financial Group, Inc. (commercial bank) (January 1999-July 1999); and Former President and Chief Executive Officer of SIS Bancorp. (1993-1999). Oversees 47 portfolios in the OppenheimerFunds complex. Mr. Marshall has served on the Boards of certain Oppenheimer funds since 2000, during which time he has become familiar with the Fund’s (and other Oppenheimer funds’) financial, accounting, regulatory and investment matters and has contributed to the Boards’ deliberations. |
| |
Karen L. Stuckey, Trustee (since 2012) Year of Birth: 1953 | | Partner (1990-2012) of PricewaterhouseCoopers LLP (professional services firm) (held various positions 1975-1990); Trustee (1992-2006) and member of Executive, Nominating and Audit Committees and Chair of Finance Committee of Lehigh University; and member, Women’s Investment Management Forum (professional organization) since inception. Oversees 47 portfolios in the OppenheimerFunds complex. Ms. Stuckey has served on the Boards of certain Oppenheimer funds since 2012, during which time she has become familiar with the Fund’s (and other Oppenheimer funds’) financial, accounting, regulatory and investment matters and has contributed to the Boards’ deliberations. |
| |
James D. Vaughn, Trustee (since 2012) Year of Birth:1945 | | Retired; former managing partner (1994-2001) of Denver office of Deloitte & Touche LLP, (held various positions 1969-1993); Trustee and Chairman of the Audit Committee of Schroder Funds (2003-2012); Board member and Chairman of Audit Committee of AMG National Trust Bank (since 2005); Trustee, Investment Committee member, University of South Dakota Foundation (since 1996); Board member, Audit Committee Member and past Board Chair, Junior Achievement (since 1993); former Board member, Mile High United Way, Boys and Girls Clubs, Boy Scouts, Colorado Business Committee for the Arts, Economic Club of Colorado and Metro Denver Network. Oversees 47 portfolios in the OppenheimerFunds complex. Mr. Vaughn has served on the Boards of certain Oppenheimer funds since 2012, during which time he has become familiar with the Fund’s (and other Oppenheimer funds’) financial, accounting, regulatory and investment matters and has contributed to the Boards’ deliberations. |
| | |
| INTERESTED TRUSTEE AND OFFICER | | Mr. Steinmetz is an “Interested Trustee” because he is affiliated with the Manager and the Sub-Adviser by virtue of his positions as Chairman and director of the Sub-Adviser and officer and director of the Manager. Both as a Trustee and as an officer, Mr. Steinmetz serves for an indefinite term, or until his resignation, retirement, death or removal. Mr. Steinmetz’s address is 225 Liberty Street, New York, New York 10281-1008. |
| |
Arthur P. Steinmetz Trustee (Since 2015), President and Principal Executive Officer (since 2014) Year of Birth: 1958 | | Chairman of the Sub-Adviser (since January 2015); CEO and Chairman of the Manager (since July 2014), President of the Manager (since May 2013), a Director of the Manager (since January 2013), Director of the Sub-Adviser (since July 2014), President, Management Director and CEO of Oppenheimer Acquisition Corp. (the Sub-Adviser’s parent holding company) (since July 2014), and President and Director of OFI SteelPath, Inc. (since January 2013). Chief Investment Officer of the OppenheimerFunds advisory entities from (January 2013-December 2013); Executive Vice President of the Manager (January 2013-May 2013); Chief Investment Officer of the Sub-Adviser (October 2010-December 2012); Chief Investment Officer, Fixed- Income, of the Sub-Adviser (April 2009-October 2010); Executive Vice President of the Sub-Adviser (October 2009-December 2012); Director of Fixed Income of the Sub-Adviser (January 2009-April 2009); and a Senior Vice President of the Sub-Adviser (March 1993-September 2009). An officer of 101 portfolios in the OppenheimerFunds complex. |
| |
| OTHER OFFICERS OF THE FUND | | The addresses of the Officers in the chart below are as follows: for Messrs. Ziehl, Vardharaj, Anello, Krantz, Weiner, Gabinet, Mss. Budzinski, Ketner, Sexton and Picciotto, 225 Liberty Street, New York, New York 10281-1008, for Mr. Wixted, 6803 S. Tucson Way, Centennial, Colorado 80112-3924. Each Officer serves for an indefinite term or until his or her resignation, retirement, death or removal. |
| |
Matthew P. Ziehl, Vice President (since 2009) Year of Birth: 1967 | | Vice President and Senior Portfolio Manager of the Sub-Adviser (since May 2009). Portfolio manager with RS Investment Management Co. LLC (October 2006-May 2009); Managing Director at The Guardian Life Insurance Company (December 2001-October 2006) when Guardian Life Insurance acquired an interest in RS Investment Management Co. LLC. Team leader and co portfolio manager with Salomon Brothers Asset Management, Inc. for small growth portfolios (January 2001-December 2001). A portfolio manager and officer of other portfolios in the OppenheimerFunds complex. |
| |
Raman Vardharaj, Vice President (since 2009) Year of Birth: 1971 | | Vice President and portfolio manager of the Sub-Adviser (since May 2009). Sector manager and a senior quantitative analyst creating stock selection models, monitoring portfolio risks and analyzing portfolio performance across the RS Core Equity Team of RS Investment Management Co. LLC (October 2006-May 2009). Quantitative analyst at The Guardian Life Insurance Company of America (1998-October 2006) when Guardian Life Insurance acquired an interest in RS Investment Management Co. LLC. A portfolio manager and officer of other portfolios in the OppenheimerFunds complex. |
| |
Raymond Anello, Vice President (since 2011) Year of Birth: 1964 | | Vice President of the Sub-Adviser (since May 2009) and a portfolio manager of the Sub-Adviser (since April 2011). Sector manager for energy and utilities for the Sub-Adviser’s Main Street Investment Team (since May 2009). Portfolio Manager of the RS All Cap Dividend product (from its inception in July 2007-April 2009) and served as a sector manager for energy and utilities for various other RS Investments products. Guardian Life Insurance Company (October 1999) and transitioned to RS Investments (October 2006) in connection with Guardian Life Insurance Company’s acquisition of an interest in RS Investments. Mr. Anello served as an equity portfolio manager/analyst and high yield analyst at Orion Capital (1995-1998) and an assistant portfolio manager at the Garrison Bradford portfolio management firm (1988-1995). A portfolio manager and officer of other portfolios in the OppenheimerFunds complex. |
27 OPPENHEIMER MAIN STREET SMALL CAP FUND/VA
TRUSTEES AND OFFICERS Unaudited / Continued
| | |
| |
Joy Budzinski, Vice President (since 2012) Year of Birth: 1968 | | Vice President of the Sub-Adviser (since May 2009) and a portfolio manager of the Sub-Adviser (since November 2012). Sector manager for healthcare for the Sub-Adviser’s Main Street Investment Team (since May 2009). Healthcare sector manager at RS Investment and Guardian Life Insurance Company. Guardian Life Insurance Company (August 2006) and transitioned to RS Investments (October 2006) in connection with Guardian Life Insurance Company’s acquisition of an interest in RS Investments. Senior equity analyst at Bank of New York BNY Asset Management (2001 -2006); portfolio manager and analyst at Alliance of America (1999-2001); portfolio manager and analyst at JP Morgan Chase (1993-1997); analyst at Prudential Investments (1997-1998). A portfolio manager and officer of other portfolios in the OppenheimerFunds complex. |
| |
Kristin Ketner, Vice President (since 2012) Year of Birth: 1965 | | Vice President of the Sub-Adviser (since June 2009) and a portfolio manager of the Sub-Adviser (since November 2012). Sector manager for consumer discretionary and consumer staples for the Sub-Adviser’s Main Street Investment Team (since May 2009). Sector manager at RS Investment and Guardian Life Insurance Company. Guardian Life Insurance Company in February 2006 and transitioned to RS Investments in October 2006 in connection with Guardian Life Insurance Company’s acquisition of an interest in RS Investments. Portfolio Manager at Solstice Equity Management (2002-2005); retail analyst at Goldman Sachs (1999-2001); Director of Strategy and Integration at Staples (1997-1999); investment banker at Merrill Lynch (1987-1992 and 1995-1997) and Montgomery Securities (1994-1995). A portfolio manager and officer of other portfolios in the OppenheimerFunds complex. |
| |
Magnus Krantz, Vice President (since 2012) Year of Birth: 1967 | | Vice President of the Sub-Adviser (since May 2009) and a portfolio manager of the Sub-Adviser (since November 2012); sector manager for technology for the Sub-Adviser’s Main Street Investment Team (since May 2009). Prior to joining the Sub-Adviser, Mr. Krantz was a sector manager at RS Investment and Guardian Life Insurance Company. Mr. Krantz joined Guardian Life Insurance Company in December 2005 and transitioned to RS Investments in October 2006 in connection with Guardian Life Insurance Company’s acquisition of an interest in RS Investments. Portfolio manager and analyst at Citigroup Asset Management (1998-2005) and as a consultant at Price Waterhouse (1997-1998). He also served as product development engineer at Newbridge Networks (1993-1996) and as a software engineer at Mitel Corporation (1990-1993). A portfolio manager and officer of other portfolios in the OppenheimerFunds complex. |
| |
Adam Weiner, Vice President (since 2012) Year of Birth: 1969 | | Vice President of the Sub-Adviser (since May 2009) and a portfolio manager of the Sub-Adviser (since November 2012). Sector manager for industrials and materials for the Sub-Adviser’s Main Street Investment Team (since May 2009). Sector manager at RS Investment for industrials and materials (January 2007-April 2009). Director and senior equity analyst at Credit Suisse Asset Management (CSAM) (September 2004-December 2006). Equity analyst at Credit Suisse First Boston 2004-2006 (buy-side) and 1999-2004 (sell-side) and Morgan Stanley (1996-1999); internal auditor at Dun and Bradstreet (1992-1996). Budget analyst, Information Resources Division of the Executive Office of the President (1990-1992). A portfolio manager and officer of other portfolios in the OppenheimerFunds complex. |
| |
Arthur S. Gabinet, Secretary and Chief Legal Officer (since 2011) Year of Birth: 1958 | | Executive Vice President, Secretary and General Counsel of the Manager (since January 2013); General Counsel OFI SteelPath, Inc. (since January 2013); Executive Vice President (May 2010-December 2012) and General Counsel (since January 2011) of the Sub-Adviser; General Counsel of the Distributor (since January 2011); General Counsel of Centennial Asset Management Corporation (January 2011-December 2012); Executive Vice President (January 2011-December 2012) and General Counsel of HarbourView Asset Management Corporation (since January 2011); Assistant Secretary (since January 2011) and Director (since January 2011) of OppenheimerFunds International Ltd. and OppenheimerFunds plc; Director of Oppenheimer Real Asset Management, Inc. (January 2011-December 2012) and General Counsel (since January 2011); Executive Vice President (January 2011-December 2011) and General Counsel of Shareholder Financial Services, Inc. and Shareholder Services, Inc. (since January 2011); Executive Vice President (January 2011-December 2012) and General Counsel of OFI Private Investments Inc. (since January 2011); Vice President of OppenheimerFunds Legacy Program (January 2011-December 2011); Executive Vice President (January 2011-December 2012) and General Counsel of OFI Institutional Asset Management, Inc. (since January 2011); General Counsel, Asset Management of the Sub-Adviser (May 2010-December 2010); Principal, The Vanguard Group (November 2005-April 2010); District Administrator, U.S. Securities and Exchange Commission (January 2003-October 2005). An officer of 101 Portfolios in the OppenheimerFunds complex. |
| |
Jennifer Sexton, Vice President and Chief Business Officer (since 2014) Year of Birth: 1969 | | Senior Vice President of OppenheimerFunds Distributor, Inc. (since June 2014); Vice President of OppenheimerFunds Distributor, Inc. (April 2006-June 2014); Vice President of the Sub-Adviser (January 1998-March 2006); Assistant Vice President of the Sub-Adviser (October 1991-December 1998). An officer of 101 Portfolios in the OppenheimerFunds complex. |
| |
Mary Ann Picciotto, Chief Compliance Officer and Chief Anti-Money Laundering Officer (since 2014) Year of Birth: 1973 | | Senior Vice President and Chief Compliance Officer of the Manager (since March 2014); Chief Compliance Officer of the Sub- Adviser, OFI SteelPath, Inc., OFI Global Trust Company, OFI Global Institutional, Inc., Oppenheimer Real Asset Management, Inc., OFI Private Investments, Inc., Harborview Asset Management Corporation, Trinity Investment Management Corporation, and Shareholder Services, Inc. (since March 2014); Managing Director of Morgan Stanley Investment Management Inc. and certain of its various affiliated entities; Chief Compliance Officer of various Morgan Stanley Funds (May 2010-January 2014); Chief Compliance Officer of Morgan Stanley Investment Management Inc. (April 2007-January 2014). An officer of 101 Portfolios in the OppenheimerFunds complex. |
| |
Brian W. Wixted, Treasurer and Principal Financial & Accounting Officer (since 1999) Year of Birth: 1959 | | Senior Vice President of the Manager (since January 2013); Treasurer of the Sub-Adviser, HarbourView Asset Management Corporation, Shareholder Financial Services, Inc., Shareholder Services, Inc., and Oppenheimer Real Asset Management, Inc. (March 1999-June 2008), OFI Private Investments, Inc. (March 2000-June 2008), OppenheimerFunds International Ltd. and OppenheimerFunds plc (since May 2000), OFI Institutional Asset Management, Inc. (November 2000-June 2008), and OppenheimerFunds Legacy Program (charitable trust program established by the Sub-Adviser) (June 2003-December 2011); Treasurer and Chief Financial Officer of OFI Trust Company (since May 2000); Assistant Treasurer of Oppenheimer Acquisition Corporation (March 1999-June 2008). An officer of 101 Portfolios in the OppenheimerFunds complex. |
The Fund’s Statement of Additional Information contains additional information about the Fund’s Trustees and Officers and is available without charge, upon request, by calling 1.800.988.8287.
28 OPPENHEIMER MAIN STREET SMALL CAP FUND/VA
THIS PAGE INTENTIONALLY LEFT BLANK.
29 OPPENHEIMER MAIN STREET SMALL CAP FUND/VA
THIS PAGE INTENTIONALLY LEFT BLANK.
30 OPPENHEIMER MAIN STREET SMALL CAP FUND/VA
THIS PAGE INTENTIONALLY LEFT BLANK.
31 OPPENHEIMER MAIN STREET SMALL CAP FUND/VA
OPPENHEIMER MAIN STREET SMALL CAP FUND/VA
A Series of Oppenheimer Variable Account Funds
| | |
| Manager | | OFI Global Asset Management, Inc. |
| |
| Sub-Adviser | | OppenheimerFunds, Inc. |
| |
| Distributor | | OppenheimerFunds Distributor, Inc. |
| |
Transfer and Shareholder Servicing Agent | | OFI Global Asset Management, Inc. |
| |
| Sub-Transfer Agent | | Shareholder Services, Inc. DBA OppenheimerFunds Services |
| |
Independent Registered Public Accounting Firm | | KPMGLLP |
| |
| Counsel | | Ropes & Gray LLP |
| |
| | Before investing in any of the Oppenheimer funds, investors should carefully consider a fund’s investment objectives, risks, charges and expenses. Fund prospectuses and summary prospectuses contain this and other information about the funds, and may be obtained by asking your financial advisor, or calling us at 1.800.988.8287. Read prospectuses and summary prospectuses carefully before investing. |
| |
| | © 2016 OppenheimerFunds, Inc. All rights reserved. Oppenheimer funds are distributed by OppenheimerFunds Distributor, Inc. |


PORTFOLIO MANAGERS: Christopher Proctor, CFA and Adam S. Wilde, CFA
| | | | |
| | | |
Current Yield | |
For the 7-Day Period Ended 12/31/15 | |
With Compounding | | 0.01% | |
Without Compounding | | 0.01% | |
| | |
For the 12-Month Period Ended 12/31/15 | |
With Compounding | | 0.01% | |
Without Compounding | | 0.01% | |
The performance data quoted represents past performance, which does not guarantee future results. Yields include dividends in a hypothetical investment for the periods shown. Current performance may be lower or higher than the performance quoted. For performance data current to the most recent month end, call us at 1.800.988.8287. The yields take into account voluntary fee waivers and/or expense reimbursements, without which yields would have been lower. Some of these undertakings may be modified at any time, as indicated in the prospectus. There is no guarantee that the Fund will maintain a positive yield. The Fund’s performance should not be expected to be the same as the returns of other funds, whether or not both funds have the same portfolio managers and/or similar names. The Fund’s performance does not include the charges associated with the separate account products that offer this Fund. Such performance would have been lower if such charges were taken into account.
| | | | |
PORTFOLIO ALLOCATION | | | | |
Short-Term Notes/Commercial Paper | | 59.2% | |
Certificates of Deposit | | 22.9 | |
Direct Bank Obligations | | 11.5 | |
Investment Companies | | 6.4 | |
Portfolio holdings and allocations are subject to change. Percentages are as of December 31, 2015, and are based on the total market value of investments. | |
2 OPPENHEIMER MONEY FUND/VA
Fund Performance Discussion
In the closing months of 2015, short-term interest rates were beginning to wiggle free from the anchor placed on them in December of 2008. The Federal Reserve (the “Fed”) increased its target from the zero bound range to 0.25% to 0.50% for the first time in 7 years. The uptick in rates has led to increased yield, which has proved beneficial for the Fund.
MARKET OVERVIEW
2015 will go down as a year in which volatility returned to the financial markets following a multi-year hiatus. Global growth struggled to gain traction as many of the world’s largest economies expanded below their long-term trends. China’s industrial production slowed for the fifth consecutive year and weighed on the world’s exporters—especially commodity producers. In the United States, a strong dollar impaired the competitiveness of many American companies and proved to be a drag on corporate earnings.
The generally disappointing performance of global equity markets was marked by pockets of significant weakness in the energy sector and many emerging markets. U.S. equities generally outperformed their counterparts in other regions in 2015, though with tempered results and only after a market correction in August that tested investors’ nerves. Interest rates globally remained low, even as investors spent most of the year contemplating the first U.S. interest-rate hike by the Federal Reserve (the “Fed”) in almost a decade. The Fed did not raise interest rates until late in the year at its December 16 meeting, when the benchmark federal funds rate was raised by 0.25%. As the markets anticipated this rate hike during the reporting period, short-term interest rates began to rise, which benefited the Fund.
FUND REVIEW
At period end, the deadline for complying with the money market fund reform (the “Reform Rules”) adopted by the Securities and Exchange Commission (SEC) in July 2014 is fast approaching. There are notable changes: variable net asset value, and the ability to impose liquidity fees and/or gates. The Reform Rules include numerous other rule amendments and we continue to work on facilitating the Fund’s compliance with respect to historical data collection, diversification, stress testing, Form PF, and Form N-MFP, to mention a few of the new requirements. In analyzing the Reform Rules, while factoring in feedback from our clients, the Fund’s name will change from Oppenheimer Money Fund/VA to Oppenheimer Government Money Fund/VA on or around April 29, 2016. Please see the Fund’s prospectus for additional information.
Throughout the reporting period, the Fund continued to generate consistent and competitive levels of current income. The weighted average maturity (WAM) of the Fund is well below the industry average due to the above average liquidity required to manage the funds volatile cash flows.
STRATEGY & OUTLOOK
For the month of December, we saw a 19 basis points increase in the 1-month Libor and similarly a 19 basis points increase in the 3-month Libor. Because the Fund maintains a lower than average WAM, it was able to benefit more quickly from the Fed rate hike. The outlook for the Fund is to remain conservative and continue to maintain a 10 to 15 day WAM.
An investment in the Fund is not insured or guaranteed by the Federal Deposit Insurance Corporation or any other government agency. Although the Fund seeks to preserve the value of your investment at $1.00 per share, it is possible to lose money by investing in the Fund.
Investors should consider the Fund’s investment objective, risks, charges and expenses carefully before investing. The Fund’s prospectus and summary prospectus contain this and other information about the Fund, and may be obtained by asking your financial advisor or calling us at 1.800.988.8287. Read prospectuses and summary prospectuses carefully before investing.
Shares of Oppenheimer funds are not deposits or obligations of any bank, are not guaranteed by any bank, are not insured by the FDIC or any other agency, and involve investment risks, including the possible loss of the principal amount invested.
3 OPPENHEIMER MONEY FUND/VA
Fund Expenses
Fund Expenses. As a shareholder of the Fund, you incur two types of costs: (1) transaction costs and (2) ongoing costs, including management fees; and other Fund expenses. These examples are intended to help you understand your ongoing costs (in dollars) of investing in the Fund and to compare these costs with the ongoing costs of investing in other mutual funds.
The examples are based on an investment of $1,000.00 invested at the beginning of the period and held for the entire 6-month period ended December 31, 2015.
Actual Expenses. The first section of the table provides information about actual account values and actual expenses. You may use the information in this section, together with the amount you invested, to estimate the expense that you paid over the period. Simply divide your account value by $1,000.00 (for example, an $8,600.00 account value divided by $1,000.00 = 8.60), then multiply the result by the number in the first section under the heading entitled “Expenses Paid During 6 Months Ended December 31, 2015” to estimate the expenses you paid on your account during this period.
Hypothetical Example for Comparison Purposes.
The second section of the table provides information about hypothetical account values and hypothetical expenses based on the Fund’s actual expense ratio, and an assumed rate of return of 5% per year before expenses, which is not the actual return. The hypothetical account values and expenses may not be used to estimate the actual ending account balance or expenses you paid for the period. You may use this information to compare the ongoing costs of investing in the Fund and other funds. To do so, compare this 5% hypothetical example with the 5% hypothetical examples that appear in the shareholder reports of the other funds.
Please note that the expenses shown in the table are meant to highlight your ongoing fund costs only and do not reflect any charges associated with the separate accounts that offer this Fund. Therefore, the “hypothetical” lines of the table are useful in comparing ongoing fund costs only, and will not help you determine the relative total costs of owning different funds. In addition, if these separate account charges were included your costs would have been higher.
| | | | | | | | |
Actual | | Beginning Account Value July 1, 2015 | | | Ending Account Value December 31, 2015 | | Expenses Paid During 6 Months Ended December 31, 2015 |
| | | $ | 1,000.00 | | | $ 1,000.10 | | $ 0.96 |
| | | |
Hypothetical | | | | | | | | |
(5% return before expenses) | | | | | | | | |
| | | | 1,000.00 | | | 1,024.25 | | 0.97 |
Expenses are equal to the Fund’s annualized expense ratio, multiplied by the average account value over the period, multiplied by 184/365 (to reflect the one-half year period). This annualized expense ratio, excluding indirect expenses from affiliated funds, based on the 6-month period ended December 31, 2015 is as follows:
The expense ratio reflects voluntary and/or contractual waivers and/or reimbursements of expenses by the Fund’s Manager. Some of these undertakings may be modified or terminated at any time, as indicated in the Fund’s prospectus. The “Financial Highlights” table in the Fund’s financial statements, included in this report, also shows the gross expense ratio, without such waivers or reimbursements and reduction to custodian expenses, if applicable.
4 OPPENHEIMER MONEY FUND/VA
STATEMENT OF INVESTMENTS December 31, 2015
| | | | | | | | | | | | | | | | |
| | | Maturity Date* | | | Final Legal Maturity Date** | | | Principal Amount | | | Value | |
| |
Certificates of Deposit—17.7% | | | | | | | | | | | | | | | | |
Yankee Certificates of Deposit—17.7% | | | | | | | | | | | | | | | | |
| Bank of Nova Scotia, Houston TX: | | | | | | | | | | | | | | | | |
| 0.34%1 | | | 1/4/16 | | | | 1/4/16 | | | $ | 3,000,000 | | | | $ 3,000,000 | |
| 0.38% | | | 1/4/16 | | | | 1/4/16 | | | | 20,000,000 | | | | 20,000,049 | |
| 0.42% | | | 3/21/16 | | | | 3/21/16 | | | | 5,500,000 | | | | 5,500,000 | |
| 0.55%1 | | | 1/4/16 | | | | 3/23/16 | | | | 2,000,000 | | | | 2,000,000 | |
| 0.648%1 | | | 1/4/16 | | | | 3/4/16 | | | | 5,000,000 | | | | 5,000,678 | |
| |
| Canadian Imperial Bank of Commerce NY, 0.36% | | | 2/9/16 | | | | 2/9/16 | | | | 110,000,000 | | | | 110,000,000 | |
| |
| Citibank NA, 0.43% | | | 1/19/16 | | | | 1/19/16 | | | | 75,000,000 | | | | 75,000,000 | |
| |
| Mitsubishi UFJ TR & BK NY: | | | | | | | | | | | | | | | | |
| 0.50%2 | | | 4/1/16 | | | | 4/1/16 | | | | 7,600,000 | | | | 7,600,000 | |
| 0.50%2 | | | 3/16/16 | | | | 3/16/16 | | | | 5,000,000 | | | | 5,000,000 | |
| |
| Royal Bank of Canada, New York, 0.379%1 | | | 1/6/16 | | | | 1/6/16 | | | | 5,000,000 | | | | 5,000,000 | |
| |
| Skandinaviska Enskilda Banken, Grand Cayman, 0.15% | | | 1/4/16 | | | | 1/4/16 | | | | 100,000,000 | | | | 100,000,000 | |
| |
| Societe Generale, New York, 0.36% | | | 1/5/16 | | | | 1/5/16 | | | | 50,000,000 | | | | 50,000,000 | |
| |
| State Street Bank & Trust, 0.471%1 | | | 1/11/16 | | | | 2/11/16 | | | | 5,000,000 | | | | 5,000,000 | |
| |
| Sumitomo Mutsui Bank NY: | | | | | | | | | | | | | | | | |
| 0.40% | | | 3/1/16 | | | | 3/1/16 | | | | 20,000,000 | | | | 20,000,000 | |
| 0.42% | | | 2/1/16 | | | | 2/1/16 | | | | 50,000,000 | | | | 50,000,000 | |
| |
| Toronto Dominion Bank, New York, 0.495%1 | | | 1/19/16 | | | | 3/16/16 | | | | 5,000,000 | | | | 5,000,000 | |
| Total Certificates of Deposit (Cost $468,100,727) | | | | | | | | | | | | | | | 468,100,727 | |
| | | | | | | | | | | | | | | | |
| | | | | | | | | | | | | | | | |
| |
Direct Bank Obligations—8.9% | | | | | | | | | | | | | | | | |
| Credit Agricole Corporate & Investment Bank, New York Branch: | | | | | | | | | | | | | | | | |
| 0.30% | | | 1/6/16 | | | | 1/6/16 | | | | 54,000,000 | | | | 53,997,750 | |
| 0.30% | | | 1/7/16 | | | | 1/7/16 | | | | 48,000,000 | | | | 47,997,600 | |
| 0.34% | | | 1/5/16 | | | | 1/5/16 | | | | 9,000,000 | | | | 8,999,660 | |
| 0.34% | | | 1/4/16 | | | | 1/4/16 | | | | 17,800,000 | | | | 17,799,496 | |
| |
| Danske Corp., 0.42%3 | | | 1/7/16 | | | | 1/7/16 | | | | 49,000,000 | | | | 48,996,570 | |
| |
| ING (US) Funding LLC, 0.37% | | | 1/4/16 | | | | 1/4/16 | | | | 20,000,000 | | | | 19,999,383 | |
| |
| Societe Generale, 0.50%3 | | | 2/1/16 | | | | 2/1/16 | | | | 35,000,000 | | | | 34,984,930 | |
| Total Direct Bank Obligations (Cost $232,775,389) | | | | | | | | | | | | | | | 232,775,389 | |
| | | | | | | | | | | | | | | | |
| | | | | | | | | | | | | | | | |
| |
Short-Term Notes/Commercial Paper—45.5% | | | | | | | | | | | | | | | | |
Leasing & Factoring—1.0% | | | | | | | | | | | | | | | | |
| Toyota Motor Credit Corp.: | | | | | | | | | | | | | | | | |
| 0.50% | | | 2/22/16 | | | | 2/22/16 | | | | 20,000,000 | | | | 19,985,556 | |
| 0.592%1 | | | 1/25/16 | | | | 2/22/16 | | | | 5,000,000 | | | | 5,000,000 | |
| | | | | | | | | | | | | | | | |
| | | | | | | | | | | | | | | 24,985,556 | |
| | | | | | | | | | | | | | | | |
| |
Machinery—1.9% | | | | | | | | | | | | | | | | |
| Caterpillar Financial Services Corp., 0.45% | | | 1/6/16 | | | | 1/6/16 | | | | 51,000,000 | | | | 50,996,813 | |
| |
Municipal—5.2% | | | | | | | | | | | | | | | | |
| Albany Industrial Development Agency Bonds, Albany Medical Center Hospital, Series 2007B, 0.40%1 | | | 1/7/16 | | | | 1/7/16 | | | | 1,710,000 | | | | 1,710,000 | |
| |
| Baltimore, MD General Obligation Bonds, Series 2003D, 0.35%1 | | | 1/7/16 | | | | 1/7/16 | | | | 1,850,000 | | | | 1,850,000 | |
| |
| Broward Cnty., FL Housing Finance Authority Multi-Family Housing Revenue Bonds, Sailboat Bend Artist Lofts Project, Series 06, 0.11%1 | | | 1/7/16 | | | | 1/7/16 | | | | 1,400,000 | | | | 1,400,000 | |
| |
| Fort Collins, CO Economic Development Revenue Bonds, Oakridge Project, Series A, 0.17%1 | | | 1/7/16 | | | | 1/7/16 | | | | 2,565,000 | | | | 2,565,000 | |
| |
Grand River Dam Authority Revenue Bonds, Series 2014C, 0.39%1 | | | 1/7/16 | | | | 1/7/16 | | | | 5,750,000 | | | | 5,750,000 | |
| |
| IN Development Finance Authority, TTP, Inc. Project, Series 2001, 0.15%1 | | | 1/7/16 | | | | 1/7/16 | | | | 1,680,000 | | | | 1,680,000 | |
| |
| Knox, IN Economic Development Revenue Bonds, Toll IN LLC Project, Series 2014, 0.42%1 | | | 1/7/16 | | | | 1/7/16 | | | | 11,300,000 | | | | 11,300,000 | |
| |
| Macon-Bibb Cnty. Industrial Development Authority Revenue Bonds, Bass Pro Outdoor World, Series 2015, 0.42%1,2 | | | 1/7/16 | | | | 1/7/16 | | | | 8,500,000 | | | | 8,500,000 | |
| |
| MI Finance Authority School Loan Revolving Fund Revenue Bonds, Series 2010B, 0.35%1 | | | 1/7/16 | | | | 1/7/16 | | | | 7,000,000 | | | | 7,000,000 | |
| |
| NJ Health Care Facilities Financing Authority, Saint Barnabas Corp., Series 2011C, 0.30%1 | | | 1/7/16 | | | | 1/7/16 | | | | 3,270,000 | | | | 3,270,000 | |
| |
| NYS Housing Finance Agency 8 East 102nd State Housing Revenue Bonds, Series 2010B, 0.36%1 | | | 1/7/16 | | | | 1/7/16 | | | | 8,010,000 | | | | 8,010,000 | |
| |
| NYS Housing Finance Agency Clinton Park Phase ll Housing Revenue Bonds, MH Rental LLC, Series 2011B, 0.42%1 | | | 1/7/16 | | | | 1/7/16 | | | | 11,000,000 | | | | 11,000,000 | |
| |
| Portland Clinic LLP (The) Bonds, Series 20081 | | | 1/7/16 | | | | 1/7/16 | | | | 10,215,000 | | | | 10,215,000 | |
| |
| Seminole Cnty., FL Industrial Development Authority Revenue Bonds, 3100 Camp Road LLC Project, Series 2008, 0.11%1 | | | 1/7/16 | | | | 1/7/16 | | | | 2,210,000 | | | | 2,210,000 | |
| |
| St. Paul, MN Bonds, Rivercentre Arena Project, Series 2009A, 0.42%1 | | | 1/7/16 | | | | 1/7/16 | | | | 900,000 | | | | 900,000 | |
5 OPPENHEIMER MONEY FUND/VA
STATEMENT OF INVESTMENTS Continued
| | | | | | | | | | | | | | | | |
| | | Maturity Date* | | | Final Legal Maturity Date** | | | Principal Amount | | | Value | |
| |
Municipal (Continued) | | | | | | | | | | | | | | | | |
| |
| University Hospitals Health System, Inc. Hospital Revenue Bonds, Series 2013C, 0.42%1 | | | 1/7/16 | | | | 1/7/16 | | | $ | 36,250,000 | | | | $ 36,250,000 | |
| |
| Valdosta-Lowndes Cnty., GA Industrial Authority Revenue Bonds, Steeda Autosports, Inc. Project, Series 08, 0.15%1 | | | 1/7/16 | | | | 1/7/16 | | | | 1,000,000 | | | | 1,000,000 | |
| |
| West Memphis, AR Industrial Development Revenue Bonds, S-B Power Tool, Series 2000A, 0.38%1 | | | 1/7/16 | | | | 1/7/16 | | | | 7,200,000 | | | | 7,200,000 | |
| |
| Yavapai Cnty., AR Industrial Development Authority Revenue Bonds, Drake Cemet LLC Project, Series 2015, 0.25%1 | | | 1/7/16 | | | | 1/7/16 | | | | 16,625,000 | | | | 16,625,000 | |
| | | | | | | | | | | | | | | | |
| | | | | | | | | | | | | | | 138,435,000 | |
| | | | | | | | | | | | | | | | |
| |
Oil, Gas & Consumable Fuels—4.8% | | | | | | | | | | | | | | | | |
| ExxonMobil Corp.: | | | | | | | | | | | | | | | | |
| 0.133% | | | 1/4/16 | | | | 1/4/16 | | | | 35,600,000 | | | | 35,599,607 | |
| 0.26% | | | 1/28/16 | | | | 1/28/16 | | | | 30,000,000 | | | | 29,994,150 | |
| 0.27% | | | 1/5/16 | | | | 1/5/16 | | | | 40,000,000 | | | | 39,998,800 | |
| 0.30% | | | 1/6/16 | | | | 1/6/16 | | | | 23,400,000 | | | | 23,399,025 | |
| | | | | | | | | | | | | | | | |
| | | | | | | | | | | | | | | 128,991,582 | |
| | | | | | | | | | | | | | | | |
| |
Personal Products—0.7% | | | | | | | | | | | | | | | | |
| Reckitt Benckiser Treasury Services plc: | | | | | | | | | | | | | | | | |
| 0.30%3 | | | 1/12/16 | | | | 1/12/16 | | | | 9,850,000 | | | | 9,849,097 | |
| 0.431%3 | | | 2/2/16 | | | | 2/2/16 | | | | 8,000,000 | | | | 7,996,942 | |
| | | | | | | | | | | | | | | | |
| | | | | | | | | | | | | | | 17,846,039 | |
| | | | | | | | | | | | | | | | |
| |
Pharmaceuticals—4.6% | | | | | | | | | | | | | | | | |
| Johnson & Johnson, 0.10%3 | | | 1/8/16 | | | | 1/8/16 | | | | 63,000,000 | | | | 62,998,775 | |
| |
| Novartis Finance Corp., 0.277%3 | | | 1/4/16 | | | | 1/4/16 | | | | 59,200,000 | | | | 59,198,633 | |
| | | | | | | | | | | | | | | | |
| | | | | | | | | | | | | | | 122,197,408 | |
| | | | | | | | | | | | | | | | |
| |
Real Estate Management and Development—0.1% | | | | | | | | | | | | | | | | |
| Tennis for Charity, Inc. Bonds, Series 2004, 0.38%1 | | | 1/7/16 | | | | 1/7/16 | | | | 3,010,000 | | | | 3,010,000 | |
| |
Receivables Finance—11.8% | | | | | | | | | | | | | | | | |
| Chariot Funding LLC: | | | | | | | | | | | | | | | | |
| 0.10%3 | | | 1/4/16 | | | | 1/4/16 | | | | 27,332,000 | | | | 27,331,772 | |
| 0.142%3 | | | 1/5/16 | | | | 1/5/16 | | | | 17,600,000 | | | | 17,599,722 | |
| |
| Gotham Funding Corp.: | | | | | | | | | | | | | | | | |
| 0.47%3 | | | 1/12/16 | | | | 1/12/16 | | | | 5,000,000 | | | | 4,999,282 | |
| 0.50%3 | | | 1/26/16 | | | | 1/26/16 | | | | 50,000,000 | | | | 49,982,639 | |
| |
| Manhattan Asset Funding Co.: | | | | | | | | | | | | | | | | |
| 0.42%3 | | | 1/5/16 | | | | 1/5/16 | | | | 1,000,000 | | | | 999,953 | |
| 0.42%3 | | | 1/7/16 | | | | 1/7/16 | | | | 20,000,000 | | | | 19,998,600 | |
| 0.48%3 | | | 2/10/16 | | | | 2/10/16 | | | | 1,200,000 | | | | 1,199,360 | |
| 0.50%3 | | | 1/21/16 | | | | 1/21/16 | | | | 5,400,000 | | | | 5,398,500 | |
| 0.53%3 | | | 2/8/16 | | | | 2/8/16 | | | | 25,000,000 | | | | 24,986,014 | |
| |
| Nieuw Amsterdam Receivables Corp., 0.55% | | | 2/16/16 | | | | 2/16/16 | | | | 11,000,000 | | | | 10,992,270 | |
| |
| Old Line Funding Corp.: | | | | | | | | | | | | | | | | |
| 0.15%3 | | | 1/4/16 | | | | 1/4/16 | | | | 14,201,000 | | | | 14,200,823 | |
| 0.28%3 | | | 1/29/16 | | | | 1/29/16 | | | | 10,000,000 | | | | 9,997,822 | |
| |
| Sheffield Receivables Corp.: | | | | | | | | | | | | | | | | |
| 0.30%3 | | | 1/7/16 | | | | 1/7/16 | | | | 26,000,000 | | | | 25,998,700 | |
| 0.55%3 | | | 1/15/16 | | | | 1/15/16 | | | | 30,000,000 | | | | 29,993,583 | |
| |
| Starbird Funding Corp., 0.36%3 | | | 2/17/16 | | | | 2/17/16 | | | | 15,000,000 | | | | 14,992,950 | |
| |
| Thunder Bay Funding LLC, 0.461%3 | | | 1/13/16 | | | | 1/13/16 | | | | 7,611,000 | | | | 7,609,833 | |
| |
| Victory Receivables Corp.: | | | | | | | | | | | | | | | | |
| 0.37%3 | | | 1/8/16 | | | | 1/8/16 | | | | 20,000,000 | | | | 19,998,561 | |
| 0.50%3 | | | 1/19/16 | | | | 1/19/16 | | | | 28,010,000 | | | | 28,002,997 | |
| | | | | | | | | | | | | | | | |
| | | | | | | | | | | | | | | 314,283,381 | |
| | | | | | | | | | | | | | | | |
| |
Special Purpose Financial—14.7% | | | | | | | | | | | | | | | | |
| Anglesea Funding LLC: | | | | | | | | | | | | | | | | |
| 0.36%2 | | | 1/4/16 | | | | 1/4/16 | | | | 40,000,000 | | | | 39,998,800 | |
| 0.36%2 | | | 1/5/16 | | | | 1/5/16 | | | | 45,000,000 | | | | 44,998,200 | |
| 0.36%2 | | | 1/6/16 | | | | 1/6/16 | | | | 7,000,000 | | | | 6,999,650 | |
| 0.44%2 | | | 1/15/16 | | | | 1/15/16 | | | | 4,000,000 | | | | 3,999,316 | |
| 0.46%2 | | | 1/20/16 | | | | 1/20/16 | | | | 28,000,000 | | | | 27,993,202 | |
| |
| Bennington Stark Capital Co., 0.45%3 | | | 1/6/16 | | | | 1/6/16 | | | | 22,000,000 | | | | 21,998,625 | |
| |
| Concord Minutemen Cap. Co. LLC: | | | | | | | | | | | | | | | | |
| 0.317% | | | 1/14/16 | | | | 1/14/16 | | | | 30,700,000 | | | | 30,696,491 | |
| 0.42% | | | 1/12/16 | | | | 1/12/16 | | | | 48,000,000 | | | | 47,993,840 | |
| |
| Crown Point Capital Co., 0.36% | | | 1/4/16 | | | | 1/4/16 | | | | 44,000,000 | | | | 43,998,680 | |
6 OPPENHEIMER MONEY FUND/VA
| | | | | | | | | | | | | | | | |
| | | Maturity Date* | | | Final Legal Maturity Date** | | | Principal Amount | | | Value | |
| |
Special Purpose Financial (Continued) | | | | | | | | | | | | | | | | |
| |
Lexington Parker Capital Co. LLC: | | | | | | | | | | | | | | | | |
0.29%3 | | | 1/12/16 | | | | 1/12/16 | | | $ | 7,500,000 | | | $ | 7,499,335 | |
0.31%3 | | | 1/15/16 | | | | 1/15/16 | | | | 35,000,000 | | | | 34,995,781 | |
0.42%3 | | | 1/13/16 | | | | 1/13/16 | | | | 43,000,000 | | | | 42,993,980 | |
| |
Ridgefield Funding Co. LLC, 0.45% | | | 2/16/16 | | | | 2/16/16 | | | | 35,000,000 | | | | 34,979,875 | |
| | | | | | | | | | | | | | | | |
| | | | | | | | | | | | | | | 389,145,775 | |
| | | | | | | | | | | | | | | | |
| |
U.S. Government Agencies-FFC—0.7% | | | | | | | | | | | | | | | | |
General Secretariat of the Organization of American States (The), Series A1 | | | 1/7/16 | | | | 1/7/16 | | | | 19,540,000 | | | | 19,540,000 | |
Total Short-Term Notes/Commercial Paper
(Cost $1,209,431,554) | | | | | | | | | | | | | | | 1,209,431,554 | |
| |
Investment Company—5.0% | | | | | | | | | | | | | | | | |
| |
Oppenheimer Institutional Money Market Fund, Cl. E,
0.30%4,5 (Cost $131,359,385) | | | | | | | | | | | 131,359,385 | | | | 131,359,385 | |
| |
Total Investments, at Value (Cost $2,041,667,055) | | | | | | | | | | | 77.1 | % | | | 2,041,667,055 | |
| |
Net Other Assets (Liabilities) | | | | | | | | | | | 22.9 | | | | 606,968,994 | |
| | | | | | | | | | | | |
Net Assets | | | | | | | | | | | 100.0 | % | | $ | 2,648,636,049 | |
| | | | | | | | | | | | |
Footnotes to Statement of Investments
Short-term notes and direct bank obligations are generally traded on a discount basis; the interest rate shown is the discount rate received by the Fund at the time of purchase. Other securities normally bear interest at the rates shown.
* The Maturity Date represents the date used to calculate the Fund’s weighted average maturity as determined under Rule 2a-7.
** If different from the Maturity Date, the Final Legal Maturity Date includes any maturity date extensions which may be affected at the option of the issuer or unconditional payments of principal by the issuer which may be affected at the option of the Fund, and represents the date used to calculate the Fund’s weighted average life as determined under Rule 2a-7.
1. Represents the current interest rate for a variable or increasing rate security.
2. Represents securities sold under Rule 144A, which are exempt from registration under the Securities Act of 1933, as amended. These securities have been determined to be liquid under guidelines established by the Board of Trustees. These securities amount to $145,089,168 or 5.48% of the Fund’s net assets at period end.
3. Security issued in an exempt transaction without registration under the Securities Act of 1933. Such securities amount to $634,803,779 or 23.97% of the Fund’s net assets, and have been determined to be liquid pursuant to guidelines adopted by the Board of Trustees.
4. Rate shown is the 7-day yield at period end.
5. Is or was an affiliate, as defined in the Investment Company Act of 1940, as amended, at or during the reporting period, by virtue of the Fund owning at least 5% of the voting securities of the issuer or as a result of the Fund and the issuer having the same investment adviser. Transactions during the reporting period in which the issuer was an affiliate are as follows:
| | | | | | | | | | | | | | | | |
| | | Shares December 31, 2014 | | | Gross Additions | | | Gross Reductions | | | Shares December 31, 2015 | |
| |
Oppenheimer Institutional Money Market Fund, Cl. E | | | 23,255,744 | | | | 191,335,641 | | | | 83,232,000 | | | | 131,359,385 | |
| | | | |
| | | | | | | | | Value | | | Income | |
| |
Oppenheimer Institutional Money Market Fund, Cl. E | | | | | | | | | | $ | 131,359,385 | | | $ | 101,834 | |
See accompanying Notes to Financial Statements.
7 OPPENHEIMER MONEY FUND/VA
STATEMENT OF ASSETS AND LIABILITIES December 31, 2015
| | | | |
| |
Assets | | | | |
Investments, at value—see accompanying statement of investments: | | | | |
Unaffiliated companies (cost $1,910,307,670) | | $ | 1,910,307,670 | |
Affiliated companies (cost $131,359,385) | | | 131,359,385 | |
| | | | |
| | | 2,041,667,055 | |
| |
Cash | | | 591,669,600 | |
| |
Receivables and other assets: | | | | |
Shares of beneficial interest sold | | | 15,190,695 | |
Interest | | | 167,881 | |
Other | | | 38,653 | |
| | | | |
Total assets | | | 2,648,733,884 | |
| |
Liabilities | | | | |
Payables and other liabilities: | | | | |
Shares of beneficial interest redeemed | | | 37,405 | |
Legal, auditing and other professional fees | | | 22,050 | |
Trustees’ compensation | | | 21,706 | |
Dividends | | | 8,097 | |
Shareholder communications | | | 7,371 | |
Other | | | 1,206 | |
| | | | |
Total liabilities | | | 97,835 | |
| |
Net Assets | | $ | 2,648,636,049 | |
| | | | |
| | | | |
| |
Composition of Net Assets | | | | |
Par value of shares of beneficial interest | | $ | 2,648,604 | |
| |
Additional paid-in capital | | | 2,645,961,790 | |
| |
Accumulated net investment income | | | 25,655 | |
| | | | |
Net Assets - applicable to 2,648,603,696 shares of beneficial interest outstanding | | $ | 2,648,636,049 | |
| | | | |
| | | | |
| |
Net Asset Value, Redemption Price Per Share and Offering Price Per Share | | | $1.00 | |
See accompanying Notes to Financial Statements.
8 OPPENHEIMER MONEY FUND/VA
STATEMENT OF OPERATIONS For the Year Ended December 31, 2015
| | | | |
Investment Income | | | | |
Interest | | $ | 2,210,561 | |
| |
Dividends from affiliated companies | | | 101,834 | |
| | | | |
Total investment income | | | 2,312,395 | |
| |
Expenses | | | | |
Management fees | | | 4,723,202 | |
| |
Transfer and shareholder servicing agent fees | | | 1,136,635 | |
| |
Shareholder communications | | | 30,520 | |
| |
Trustees’ compensation | | | 48,886 | |
| |
Custodian fees and expenses | | | 4,935 | |
| |
Other | | | 84,441 | |
| | | | |
Total expenses | | | 6,028,619 | |
Less reduction to custodian expenses | | | (1,840) | |
Less waivers and reimbursements of expenses | | | (3,828,838) | |
| | | | |
Net expenses | | | 2,197,941 | |
| |
Net Investment Income | | | 114,454 | |
| |
Realized Gain | | | 22,016 | |
| |
Net Increase in Net Assets Resulting from Operations | | $ | 136,470 | |
| | | | |
See accompanying Notes to Financial Statements.
9 OPPENHEIMER MONEY FUND/VA
STATEMENTS OF CHANGES IN NET ASSETS
| | | | | | | | |
| | | Year Ended | | | Year Ended | |
| | | December 31, 2015 | | | December 31, 2014 | |
| |
Operations | | | | | | | | |
Net investment income | | $ | 114,454 | | | $ | 32,855 | |
| |
Net realized gain | | | 22,016 | | | | 11,471 | |
| | | | | | | | |
Net increase in net assets resulting from operations | | | 136,470 | | | | 44,326 | |
| |
Dividends and/or Distributions to Shareholders | | | | | | | | |
Dividends from net investment income | | | (119,146) | | | | (34,163) | |
| | |
| | | | | | | | |
| |
Beneficial Interest Transactions | | | | | | | | |
Net increase in net assets resulting from beneficial interest transactions | | | 2,133,322,061 | | | | 338,260,098 | |
| | | | | | | | |
| |
Net Assets | | | | | | | | |
Total increase | | | 2,133,339,385 | | | | 338,270,261 | |
| |
Beginning of period | | | 515,296,664 | | | | 177,026,403 | |
| | | | | | | | |
End of period (including accumulated net investment income of $ 25,655 and $ 8,607, respectively) | | $ | 2,648,636,049 | | | $ | 515,296,664 | |
| | | | |
See accompanying Notes to Financial Statements.
10 OPPENHEIMER MONEY FUND/VA
FINANCIAL HIGHLIGHTS
| | | | | | | | | | | | | | | | | | | | |
| | | Year | | | Year | | | Year | | | Year | | | Year | |
| | | Ended | | | Ended | | | Ended | | | Ended | | | Ended | |
| | | December | | | December | | | December | | | December | | | December | |
| | | 31, 2015 | | | 31, 2014 | | | 31, 2013 | | | 31, 2012 | | | 30, 20111 | |
| |
Per Share Operating Data | | | | | | | | | | | | | | | | | | | | |
| Net asset value, beginning of period | | $ | 1.00 | | | $ | 1.00 | | | $ | 1.00 | | | $ | 1.00 | | | $ | 1.00 | |
| |
| Income (loss) from investment operations - net investment income and net realized gain2 | | | 0.003 | | | | 0.003 | | | | 0.003 | | | | 0.003 | | | | 0.003 | |
| |
| Dividends and/or distributions to shareholders: | | | | | | | | | | | | | | | | | | | | |
| Dividends from net investment income | | | 0.003 | | | | 0.003 | | | | 0.003 | | | | 0.003 | | | | 0.003 | |
| |
| Net asset value, end of period | | $ | 1.00 | | | $ | 1.00 | | | $ | 1.00 | | | $ | 1.00 | | | $ | 1.00 | |
| | | | |
| | | | | | | | | | | | | | | | | | | | |
| |
| Total Return, at Net Asset Value4 | | | 0.01% | | | | 0.01% | | | | 0.01% | | | | 0.01% | | | | 0.01% | |
| | | | | | | | | | | | | | | | | | | | |
| |
| Ratios/Supplemental Data | | | | | | | | | | | | | | | | | | | | |
| Net assets, end of period (in thousands) | | $ | 2,648,636 | | | $ | 515,297 | | | $ | 177,026 | | | $ | 174,428 | | | $ | 163,973 | |
| |
| Average net assets (in thousands) | | $ | 1,144,581 | | | $ | 329,045 | | | $ | 178,263 | | | $ | 164,276 | | | $ | 156,127 | |
| |
| Ratios to average net assets:5 | | | | | | | | | | | | | | | | | | | | |
| Net investment income | | | 0.01% | | | | 0.01% | | | | 0.01% | | | | 0.01% | | | | 0.01% | |
| Total expenses6 | | | 0.53% | | | | 0.57% | | | | 0.61% | | | | 0.62% | | | | 0.61% | |
| Expenses after payments, waivers and/or reimbursements and reduction to custodian expenses | | | 0.19% | | | | 0.15% | | | | 0.22% | | | | 0.30% | | | | 0.29% | |
1. December 30, 2011 represents the last business day of the Fund’s reporting period.
2. Per share amounts calculated based on the average shares outstanding during the period.
3. Less than $0.005 per share.
4. Assumes an initial investment on the business day before the first day of the fiscal period, with all dividends and distributions reinvested in additional shares on the reinvestment date, and redemption at the net asset value calculated on the last business day of the fiscal period. Total returns are not annualized for periods less than one full year. Total return information does not reflect expenses that apply at the separate account level or to related insurance products. Inclusion of these charges would reduce the total return figures for all periods shown. Returns do not reflect the deduction of taxes that a shareholder would pay on fund distributions or the redemption of fund shares.
5. Annualized for periods less than one full year.
6. Total expenses including indirect expenses from affiliated fund fees and expenses were as follows:
| | | | |
Year Ended December 31, 2015 | | 0.53% | | |
Year Ended December 31, 2014 | | 0.57% | |
See accompanying Notes to Financial Statements.
11 OPPENHEIMER MONEY FUND/VA
NOTES TO FINANCIAL STATEMENTS December 31, 2015
1. Organization
Oppenheimer Money Fund/VA (the “Fund”), a separate series of Oppenheimer Variable Account Funds, is a diversified open-end management investment company registered under the Investment Company Act of 1940 (“1940 Act”), as amended. The Fund’s investment objective is to seek income consistent with stability of principal. The Fund’s investment adviser is OFI Global Asset Management, Inc. (“OFI Global” or the “Manager”), a wholly-owned subsidiary of OppenheimerFunds, Inc. (“OFI” or the “Sub-Adviser”). The Manager has entered into a sub-advisory agreement with OFI. Shares of the Fund are sold only to separate accounts of life insurance companies.
The following is a summary of significant accounting policies followed in the Fund’s preparation of financial statements in accordance with accounting principles generally accepted in the United States (“U.S. GAAP”).
2. Significant Accounting Policies
Security Valuation. All investments in securities are recorded at their estimated fair value, as described in Note 3.
Reporting Period End Date. The last day of the Fund’s reporting period is the last day the New York Stock Exchange was open for trading during the period. The Fund’s financial statements have been presented through that date to maintain consistency with the Fund’s net asset value calculations used for shareholder transactions.
Dividends and Distributions to Shareholders. Dividends and distributions to shareholders, which are determined in accordance with income tax regulations and may differ from U.S. GAAP, are recorded on the ex-dividend date. Income distributions, if any, are declared daily and paid monthly. Capital gain distributions, if any, are declared and paid annually but may be paid at other times to maintain the net asset value per share at $1.00.
Investment Income. Interest income is recognized on an accrual basis. Discount and premium, which are included in interest income on the Statement of Operations, are amortized or accreted daily.
Custodian Fees. “Custodian fees and expenses” in the Statement of Operations may include interest expense incurred by the Fund on any cash overdrafts of its custodian account during the period. Such cash overdrafts may result from the effects of failed trades in portfolio securities and from cash outflows resulting from unanticipated shareholder redemption activity. The Fund pays interest to its custodian on such cash overdrafts, to the extent they are not offset by positive cash balances maintained by the Fund, at a rate equal to the Federal Funds Rate plus 0.50%. The “Reduction to custodian expenses” line item, if applicable, represents earnings on cash balances maintained by the Fund during the period. Such interest expense and other custodian fees may be paid with these earnings.
Security Transactions. Security transactions are recorded on the trade date. Realized gains and losses on securities sold are determined on the basis of identified cost.
Indemnifications. The Fund’s organizational documents provide current and former Trustees and officers with a limited indemnification against liabilities arising in connection with the performance of their duties to the Fund. In the normal course of business, the Fund may also enter into contracts that provide general indemnifications. The Fund’s maximum exposure under these arrangements is unknown as this would be dependent on future claims that may be made against the Fund. The risk of material loss from such claims is considered remote.
Federal Taxes. The Fund intends to comply with provisions of the Internal Revenue Code applicable to regulated investment companies and to distribute substantially all of its investment company taxable income to shareholders. Therefore, no federal income or excise tax provision is required. The Fund files income tax returns in U.S. federal and applicable state jurisdictions. The statute of limitations on the Fund’s tax return filings generally remains open for the three preceding fiscal reporting period ends.
The tax components of capital shown in the following table represent distribution requirements the Fund must satisfy under the income tax regulations, losses the Fund may be able to offset against income and gains realized in future years for federal income tax purposes.
| | | | | | | | |
Undistributed Net Investment Income | | Undistributed
Long-Term
Gain | | | Accumulated
Loss
Carryforward | |
| |
$58,090 | | | $— | | | | $— | |
Net investment income (loss) and net realized gain (loss) may differ for financial statement and tax purposes. The character of dividends and distributions made during the fiscal year from net investment income or net realized gains are determined in accordance with federal income tax requirements, which may differ from the character of net investment income or net realized gains presented in those financial statements in accordance with U.S. GAAP. Also, due to timing of dividends and distributions, the fiscal year in which amounts are distributed may differ from the fiscal year in which the income or net realized gain was recorded by the Fund.
Accordingly, the following amounts have been reclassified for the reporting period. Net assets of the Fund were unaffected by the reclassifications.
12 OPPENHEIMER MONEY FUND/VA
2. Significant Accounting Policies (Continued)
| | | | | | | | |
Increase to Paid-in Capital | | Increase
to Accumulated
Net Investment
Income | | | Reduction
to Accumulated Net
Realized Gain
on Investments | |
| |
$276 | | | $21,740 | | | | $22,016 | |
The tax character of distributions paid during the reporting periods:
| | | | | | | | |
| | | Year Ended
December 31, 2015 | | | Year Ended
December 31, 2014 | |
Distributions paid from: | | | | | | | | |
Ordinary income | | $ | 119,146 | | | $ | 34,163 | |
Use of Estimates. The preparation of financial statements in conformity with U.S. GAAP requires management to make estimates and assumptions that affect the reported amounts of assets and liabilities and disclosure of contingent assets and liabilities at the date of the financial statements and the reported amounts of increases and decreases in net assets from operations during the reporting period. Actual results could differ from those estimates.
Money Market Fund Reform. In analyzing the Reform Rules, adopted by the Securities and Exchange Commission (SEC) in July 2014, the Fund’s name will change from Oppenheimer Money Fund/VA to Oppenheimer Government Money Fund/VA on or around April 29, 2016. Additionally the Board of Trustees approved the adoption of a new non-fundamental investment policy requiring each Fund to invest 99.5% or more of its total assets in cash, government securities, and/or repurchase agreements that are collateralized fully by cash and/or government securities.
3. Securities Valuation
The Fund calculates the net asset value of its shares as of the close of the New York Stock Exchange (the “Exchange”), normally 4:00 P.M. Eastern time, on each day the Exchange is open for trading, except in the case of a scheduled early closing of the Exchange, in which case the Fund will calculate net asset value of the shares as of the scheduled early closing time of the Exchange.
The Fund’s Board has adopted procedures for the valuation of the Fund’s securities and has delegated the day-to-day responsibility for valuation determinations under those procedures to the Manager. The Manager has established a Valuation Committee which is responsible for determining a “fair valuation” for any security for which market quotations are not “readily available.” The Valuation Committee’s fair valuation determinations are subject to review, approval and ratification by the Fund’s Board at its next regularly scheduled meeting covering the calendar quarter in which the fair valuation was determined.
Valuation Methods and Inputs
Securities are valued at cost adjusted by the amortization of discount or premium to maturity (amortized cost), which approximates market value. If amortized cost is determined not to approximate market value, the fair value of the portfolio securities will be determined under procedures approved by the Fund’s Board of Trustees.
If a market value or price cannot be determined for a security using the methodologies described above, or if, in the “good faith” opinion of the Manager, the market value or price obtained does not constitute a “readily available market quotation,” or a significant event has occurred that would materially affect the value of the security, the security is fair valued either (i) by a standardized fair valuation methodology applicable to the security type or the significant event as previously approved by the Valuation Committee and the Fund’s Board or (ii) as determined in good faith by the Manager’s Valuation Committee. The Valuation Committee considers all relevant facts that are reasonably available, through either public information or information available to the Manager, when determining the fair value of a security. Fair value determinations by the Manager are subject to review, approval and ratification by the Fund’s Board at its next regularly scheduled meeting covering the calendar quarter in which the fair valuation was determined. Those fair valuation standardized methodologies include, but are not limited to, valuing securities at the last sale price or initially at cost and subsequently adjusting the value based on: changes in company specific fundamentals, changes in an appropriate securities index, or changes in the value of similar securities which may be further adjusted for any discounts related to security-specific resale restrictions. When possible, such methodologies use observable market inputs such as unadjusted quoted prices of similar securities, observable interest rates, currency rates and yield curves. The methodologies used for valuing securities are not necessarily an indication of the risks associated with investing in those securities nor can it be assured that the Fund can obtain the fair value assigned to a security if it were to sell the security.
To assess the continuing appropriateness of security valuations, the Manager, or its third party service provider who is subject to oversight by the Manager, regularly compares prior day prices, prices on comparable securities, and sale prices to the current day prices and challenges those prices exceeding certain tolerance levels with the third party pricing service or broker source. For those securities valued by fair valuations, whether through a standardized fair valuation methodology or a fair valuation determination, the Valuation Committee reviews and affirms the reasonableness of the valuations based on such methodologies and fair valuation determinations on a regular basis after considering all relevant information that is reasonably available.
Classifications
Each investment asset or liability of the Fund is assigned a level at measurement date based on the significance and source of the inputs to its valuation. Various data inputs are used in determining the value of each of the Fund’s investments as of the reporting period end. These data inputs are categorized in the following hierarchy under applicable financial accounting standards:
13 OPPENHEIMER MONEY FUND/VA
NOTES TO FINANCIAL STATEMENTS Continued
3. Securities Valuation (Continued)
1) Level 1-unadjusted quoted prices in active markets for identical assets or liabilities (including securities actively traded on a securities exchange)
2) Level 2-inputs other than unadjusted quoted prices that are observable for the asset or liability (such as unadjusted quoted prices for similar assets and market corroborated inputs such as interest rates, prepayment speeds, credit risks, etc.)
3) Level 3-significant unobservable inputs (including the Manager’s own judgments about assumptions that market participants would use in pricing the asset or liability).
The inputs used for valuing securities are not necessarily an indication of the risks associated with investing in those securities.
The table below categorizes amounts that are included in the Fund’s Statement of Assets and Liabilities at period end based on valuation input level:
| | | | | | | | | | | | | | | | |
| | | Level 1—
Unadjusted
Quoted Prices | | | Level 2— Other Significant
Observable Inputs | | | Level 3—
Significant
Unobservable
Inputs | | | Value | |
| |
Investments, at Value: | | | | | | | | | | | | | | | | |
Assets Table | | | | | | | | | | | | | | | | |
Certificates of Deposit | | $ | — | | | $ | 468,100,727 | | | $ | — | | | $ | 468,100,727 | |
Direct Bank Obligations | | | — | | | | 232,775,389 | | | | — | | | | 232,775,389 | |
Short-Term Notes/Commercial Paper | | | — | | | | 1,209,431,554 | | | | — | | | | 1,209,431,554 | |
Investment Company | | | 131,359,385 | | | | — | | | | — | | | | 131,359,385 | |
| | | | |
Total Assets | | $ | 131,359,385 | | | $ | 1,910,307,670 | | | $ | — | | | $ | 2,041,667,055 | |
| | | | |
4. Investments and Risk
Investments in Affiliated Funds. The Fund is permitted to invest in other mutual funds advised by the Manager (“Affiliated Funds”). Affiliated Funds are open-end management investment companies registered under the 1940 Act, as amended. The Manager is the investment adviser of, and the Sub-Adviser provides investment and related advisory services to, the Affiliated Funds. When applicable, the Fund’s investments in Affiliated Funds are included in the Statement of Investments. Shares of Affiliated Funds are valued at their net asset value per share. As a shareholder, the Fund is subject to its proportional share of the Affiliated Funds’ expenses, including their management fee. The Manager will waive fees and/or reimburse Fund expenses in an amount equal to the indirect management fees incurred through the Fund’s investment in the Affiliated Funds.
Each of the Affiliated Funds in which the Fund invests has its own investment risks, and those risks can affect the value of the Fund’s investments and therefore the value of the Fund’s shares. To the extent that the Fund invests more of its assets in one Affiliated Fund than in another, the Fund will have greater exposure to the risks of that Affiliated Fund.
Investment in Oppenheimer Institutional Money Market Fund. The Fund is permitted to invest daily available cash balances in a money market Affiliated Fund. The Fund may invest the available cash in Class E shares of Oppenheimer Institutional Money Market Fund (“IMMF”) to seek current income while preserving liquidity or for defensive purposes. IMMF is regulated as a money market fund under the Investment Company Act of 1940, as amended.
Shareholder Concentration. At period end, one shareholder owned 20% or more of the Fund’s total outstanding shares comprising 96.13% of the Fund.
5. Market Risk Factors
The Fund’s investments in securities and/or financial derivatives may expose the fund to various market risk factors:
Commodity Risk. Commodity risk relates to the change in value of commodities or commodity indexes as they relate to increases or decreases in the commodities market. Commodities are physical assets that have tangible properties. Examples of these types of assets are crude oil, heating oil, metals, livestock, and agricultural products.
Credit Risk. Credit risk relates to the ability of the issuer of debt to meet interest and principal payments, or both, as they come due. In general, lower-grade, higher-yield debt securities are subject to credit risk to a greater extent than lower-yield, higher-quality securities.
Equity Risk. Equity risk relates to the change in value of equity securities as they relate to increases or decreases in the general market.
Foreign Exchange Rate Risk. Foreign exchange rate risk relates to the change in the U.S. dollar value of a security held that is denominated in a foreign currency. The U.S. dollar value of a foreign currency denominated security will decrease as the dollar appreciates against the currency, while the U.S. dollar value will increase as the dollar depreciates against the currency.
Interest Rate Risk. Interest rate risk refers to the fluctuations in value of fixed-income securities resulting from the inverse relationship between price and yield. For example, an increase in general interest rates will tend to reduce the market value of already issued fixed-income investments, and a decline in general interest rates will tend to increase their value. In addition, debt securities with longer maturities, which tend to have higher yields, are subject to potentially greater fluctuations in value from changes in interest rates than obligations with shorter maturities.
Volatility Risk. Volatility risk refers to the magnitude of the movement, but not the direction of the movement, in a financial instrument’s price over a defined time period. Large increases or decreases in a financial instrument’s price over a relative time period typically indicate greater volatility risk, while small increases or decreases in its price typically indicate lower volatility risk.
14 OPPENHEIMER MONEY FUND/VA
6. Shares of Beneficial Interest
The Fund has authorized an unlimited number of $0.001 par value shares of beneficial interest. Transactions in shares of beneficial interest were as follows:
| | | | | | | | | | | | | | | | |
| | | Year Ended December 31, 2015 | | | Year Ended December 31, 2014 | |
| | | Shares | | | Amount | | | Shares | | | Amount | |
| |
Sold | | | 3,416,245,044 | | | $ | 3,416,245,044 | | | | 1,568,851,985 | | | $ | 1,568,851,985 | |
Dividends and/or distributions reinvested | | | 112,387 | | | | 112,387 | | | | 34,163 | | | | 34,163 | |
Redeemed | | | (1,283,035,370 | ) | | | (1,283,035,370) | | | | (1,230,626,050 | ) | | | (1,230,626,050) | |
| | | | |
Net increase | | | 2,133,322,061 | | | $ | 2,133,322,061 | | | | 338,260,098 | | | $ | 338,260,098 | |
| | | | |
7. Fees and Other Transactions with Affiliates
Management Fees. Under the investment advisory agreement, the Fund pays the Manager a management fee based on the daily net assets of the Fund at an annual rate as shown in the following table:
| | | | |
Fee Schedule | | | | |
| |
Up to $500 million | | | 0.450% | |
Next $500 million | | | 0.425 | |
Next $500 million | | | 0.400 | |
Over $1.5 billion | | | 0.375 | |
The Fund’s effective management fee for the reporting period was 0.41% of average annual net assets before any applicable waivers.
Sub-Adviser Fees. The Manager has retained the Sub-Adviser to provide the day-to-day portfolio management of the Fund. Under the Sub-Advisory Agreement, the Manager pays the Sub-Adviser an annual fee in monthly installments, equal to a percentage of the investment management fee collected by the Manager from the Fund, which shall be calculated after any investment management fee waivers. The fee paid to the Sub-Adviser is paid by the Manager, not by the Fund.
Transfer Agent Fees. OFI Global (the “Transfer Agent”) serves as the transfer and shareholder servicing agent for the Fund. The Fund pays the Transfer Agent a fee based on annual net assets. Fees incurred and average net assets with respect to these services are detailed in the Statement of Operations and Financial Highlights, respectively.
Sub-Transfer Agent Fees. The Transfer Agent has retained Shareholder Services, Inc., a wholly-owned subsidiary of OFI (the “Sub-Transfer Agent”), to provide the day-to-day transfer agent and shareholder servicing of the Fund. Under the Sub-Transfer Agency Agreement, the Transfer Agent pays the Sub-Transfer Agent an annual fee in monthly installments, equal to a percentage of the transfer agent fee collected by the Transfer Agent from the Fund, which shall be calculated after any applicable fee waivers. The fee paid to the Sub-Transfer Agent is paid by the Transfer Agent, not by the Fund.
Trustees’ Compensation. The Fund’s Board of Trustees (“Board”) has adopted a compensation deferral plan for Independent Trustees that enables Trustees to elect to defer receipt of all or a portion of the annual compensation they are entitled to receive from the Fund. For purposes of determining the amount owed to the Trustees under the plan, deferred amounts are treated as though equal dollar amounts had been invested in shares of the Fund or in other Oppenheimer funds selected by the Trustees. The Fund purchases shares of the funds selected for deferral by the Trustees in amounts equal to his or her deemed investment, resulting in a Fund asset equal to the deferred compensation liability. Such assets are included as a component of “Other” within the asset section of the Statement of Assets and Liabilities. Deferral of Trustees’ fees under the plan will not affect the net assets of the Fund and will not materially affect the Fund’s assets, liabilities or net investment income per share. Amounts will be deferred until distributed in accordance with the compensation deferral plan.
Waivers and Reimbursements of Expenses. The Manager has voluntarily undertaken to waive fees and/or reimburse expenses to the extent necessary to assist the Fund in attempting to maintain a positive yield. There is no guarantee that the Fund will maintain a positive yield. During the reporting period, the Manager waived fees and/or reimbursed the Fund $3,467,322.
The Manager has contractually agreed to limit the Fund’s expenses after payments, waivers and/or reimbursements and reduction to custodian expenses, excluding expenses incurred directly or indirectly by the Fund as a result of investments in other investment companies, wholly-owned subsidiaries and pooled investment vehicles; so that those expenses, as percentages of daily net assets, will not exceed the annual rate of 0.50%. As a result of this limitation, the Manager waived $305,715 for the reporting period.
The Manager is permitted to recapture previously waived and/or reimbursed fees in any given fiscal year if the recapture would not: 1) cause the Fund to generate a negative daily yield, and 2) exceed amounts previously waived and/or reimbursed under this arrangement during the current and prior three fiscal years. The reimbursement to the Manager of such previous waivers and reimbursements would not include any portion of distribution and/or service fees. At period end, the following waived and/or reimbursed amounts are eligible for recapture:
| | | | |
Expiration Date | | | | |
| |
December 31, 2016 | | $ | 486,156 | |
December 31, 2017 | | | 1,378,598 | |
December 31, 2018 | | | 3,773,037 | |
15 OPPENHEIMER MONEY FUND/VA
NOTES TO FINANCIAL STATEMENTS Continued
7. Fees and Other Transactions with Affiliates (Continued)
The Manager has not recaptured any previously waived and/or reimbursed amounts during the reporting period.
The Manager will waive fees and/or reimburse Fund expenses in an amount equal to the indirect management fees incurred through the Fund’s investment in IMMF. During the reporting period, the Manager waived fees and/or reimbursed the Fund $55,801 for IMMF management fees.
Waivers and/or reimbursements may be modified or terminated as set forth according to the terms in the prospectus.
8. Pending Litigation
In 2009, several putative class action lawsuits were filed and later consolidated before the U.S. District Court for the District of Colorado against OppenheimerFunds, Inc. (“OFI”), OppenheimerFunds Distributor, Inc. (“OFDI”), and Oppenheimer Rochester California Municipal Fund, a fund advised by OFI Global Asset Management, Inc. and distributed by the Distributor (the “California Fund”), in connection with the California Fund’s investment performance. The plaintiffs asserted claims against OFI, OFDI and certain present and former trustees and officers of the California Fund under the federal securities laws, alleging, among other things, that the disclosure documents of the California Fund contained misrepresentations and omissions and the investment policies of the California Fund were not followed. Plaintiffs in the suit filed an amended complaint and defendants filed a motion to dismiss. In 2011, the court issued an order which granted in part and denied in part the defendants’ motion to dismiss. In 2012, plaintiffs filed a motion, which defendants opposed, to certify a class and appoint class representatives and class counsel. In March 2015, the court granted plaintiffs’ motion for class certification. In May 2015, the U.S. Court of Appeals for the Tenth Circuit vacated the class certification order and remanded the matter to the district court for further proceedings. In October 2015, the district court reaffirmed its order and determined that the suit will proceed as a class action. In December 2015, the Tenth Circuit denied defendants’ petition to appeal the district court’s reaffirmed class certification order.
OFI and OFDI believe the suit is without merit; that it is premature to render any opinion as to the likelihood of an outcome unfavorable to them in the suit; and that no estimate can yet be made as to the amount or range of any potential loss. Furthermore, OFI believes that the suit should not impair the ability of OFI or OFDI to perform their respective duties to the Fund and that the outcome of the suit should not have any material effect on the operations of any of the Oppenheimer funds.
16 OPPENHEIMER MONEY FUND/VA
REPORT OF INDEPENDENT REGISTERED PUBLIC ACCOUNTING FIRM
The Board of Trustees and Shareholders of Oppenheimer Variable Account Funds:
We have audited the accompanying statement of assets and liabilities of Oppenheimer Money Fund/VA (a separate series of Oppenheimer Variable Account Funds), including the statement of investments, as of December 31, 2015, and the related statement of operations for the year then ended, the statements of changes in net assets for each of the years in the two-year period then ended, and the financial highlights for each of the years in the five-year period then ended. These financial statements and financial highlights are the responsibility of the Fund’s management. Our responsibility is to express an opinion on these financial statements and financial highlights based on our audits.
We conducted our audits in accordance with the standards of the Public Company Accounting Oversight Board (United States). Those standards require that we plan and perform the audit to obtain reasonable assurance about whether the financial statements and financial highlights are free of material misstatement. An audit includes examining, on a test basis, evidence supporting the amounts and disclosures in the financial statements. Our procedures included confirmation of securities owned as of December 31, 2015, by correspondence with the custodian and transfer agent. An audit also includes assessing the accounting principles used and significant estimates made by management, as well as evaluating the overall financial statement presentation. We believe that our audits provide a reasonable basis for our opinion.
In our opinion, the financial statements and financial highlights referred to above present fairly, in all material respects, the financial position of Oppenheimer Money Fund/VA as of December 31, 2015, the results of its operations for the year then ended, the changes in its net assets for each of the years in the two-year period then ended, and the financial highlights for each of the years in the five-year period then ended, in conformity with U.S. generally accepted accounting principles.
KPMG LLP
Denver, Colorado
February 12, 2016
17 OPPENHEIMER MONEY FUND/VA
FEDERAL INCOME TAX INFORMATION Unaudited
In early 2016, if applicable, shareholders of record received information regarding all dividends and distributions paid to them by the Fund during calendar year 2015.
The foregoing information is presented to assist shareholders in reporting distributions received from the Fund to the Internal Revenue Service. Because of the complexity of the federal regulations which may affect your individual tax return and the many variations in state and local tax regulations, we recommend that you consult your tax advisor for specific guidance.
18 OPPENHEIMER MONEY FUND/VA
BOARD APPROVAL OF THE FUND’S INVESTMENT ADVISORY AND SUB-ADVISORY AGREEMENTS Unaudited
The Fund has entered into an investment advisory agreement with OFI Global Asset Management, Inc. (“OFI Global” or the “Adviser”), a wholly-owned subsidiary of OppenheimerFunds, Inc. (“OFI” or the “Sub-Adviser”) (“OFI Global” and “OFI” together the “Managers”) and OFI Global has entered into a sub-advisory agreement with OFI whereby OFI provides investment sub-advisory services to the Fund (collectively, the “Agreements”). Each year, the Board of Trustees (the “Board”), including a majority of the independent Trustees, is required to determine whether to approve the terms of the Agreements and the renewal thereof. The Investment Company Act of 1940, as amended, requires that the Board request and evaluate, and that the Managers provide, such information as may be reasonably necessary to evaluate the terms of the Agreements. The Board employs an independent consultant to prepare a report that provides information, including comparative information that the Board requests for that purpose. In addition to in-person meetings focused on this evaluation, the Board receives information throughout the year regarding Fund services, fees, expenses and performance.
The Adviser, Sub-Adviser and the independent consultant provided information to the Board on the following factors: (i) the nature, quality and extent of the Managers’ services, (ii) the comparative investment performance of the Fund and the Managers, (iii) the fees and expenses of the Fund, including comparative fee and expense information, (iv) the profitability of the Managers and their affiliates, including an analysis of the cost of providing services, (v) whether economies of scale are realized as the Fund grows and whether fee levels reflect these economies of scale for Fund investors and (vi) other benefits to the Managers from their relationship with the Fund. The Board was aware that there are alternatives to retaining the Managers.
Outlined below is a summary of the principal information considered by the Board as well as the Board’s conclusions.
Nature, Quality and Extent of Services. The Board considered information about the nature, quality and extent of the services provided to the Fund and information regarding the Managers’ key personnel who provide such services. The Managers’ duties include providing the Fund with the services of the portfolio managers and the Sub-Adviser’s investment team, who provide research, analysis and other advisory services in regard to the Fund’s investments; and securities trading services. OFI Global is responsible for oversight of third-party service providers; monitoring compliance with applicable Fund policies and procedures and adherence to the Fund’s investment restrictions; risk management; and oversight of the Sub-Adviser. OFI Global is also responsible for providing certain administrative services to the Fund as well. Those services include providing and supervising all administrative and clerical personnel who are necessary in order to provide effective corporate administration for the Fund; compiling and maintaining records with respect to the Fund’s operations; preparing and filing reports required by the U.S. Securities and Exchange Commission; preparing periodic reports regarding the operations of the Fund for its shareholders; preparing proxy materials for shareholder meetings; and preparing the registration statements required by federal and state securities laws for the sale of the Fund’s shares. OFI Global also provides the Fund with office space, facilities and equipment.
The Board also considered the quality of the services provided and the quality of the Managers’ resources that are available to the Fund. The Board took account of the fact that the Sub-Adviser has had over fifty years of experience as an investment adviser and that its assets under management rank it among the top mutual fund managers in the United States. The Board evaluated the Managers’ advisory, administrative, accounting, legal, compliance services and risk management, and information the Board has received regarding the experience and professional qualifications of the Managers’ key personnel and the size and functions of its staff. In its evaluation of the quality of the portfolio management services provided, the Board considered the experience of Christopher Proctor and Adam Wilde, the portfolio managers for the Fund, and the Sub-Adviser’s investment team and analysts. The Board members also considered the totality of their experiences with the Managers as directors or trustees of the Fund and other funds advised by the Managers. The Board considered information regarding the quality of services provided by affiliates of the Managers, which the Board members have become knowledgeable about through their experiences with the Managers and in connection with the renewal of the Fund’s service agreements. The Board concluded, in light of the Managers’ experience, reputation, personnel, operations and resources that the Fund benefits from the services provided under the Agreements.
Investment Performance of the Managers and the Fund. Throughout the year, the Managers provided information on the investment performance of the Fund, including comparative performance information. The Board also reviewed information, prepared by the Managers and by the independent consultant, comparing the Fund’s historical performance to relevant market indices and to the performance of other money market tax-free funds underlying variable insurance products. The Board considered that the Fund outperformed its performance category median during the one-, three-, five-, and ten-year periods. The Board also considered that the Fund performed in the first quintile of its performance category for the one- and ten-year periods and performed in the second quintile for the three- and five-year periods.
Fees and Expenses of the Fund. The Board reviewed the fees paid to the Adviser and the other expenses borne by the Fund. The Board noted that the Adviser, not the Fund, pays the Sub-Adviser’s fee under the sub-advisory agreement. The independent consultant provided comparative data in regard to the fees and expenses of the Fund and other money market tax-free funds underlying variable insurance products. In reviewing the fees and expenses charged to the VA funds, the Board considered the Adviser’s assertion that, because there is much greater disparity in the fees and services that may be provided by a manager to a VA fund as opposed to a retail fund, when comparing the expenses of the various VA funds to those of retail funds, it is most appropriate to focus on total expenses (rather than on the management fees). Accordingly, while the Board reviewed and considered all expenses, it focused on total expenses. The Board considered that the Fund’s total expenses, after waivers, were equal to its peer group median and lower than its category median. The Board also considered that the Fund’s contractual management fee was equal to its peer group median and lower than its category median. Within the total asset range of $250 million to $500 million, the Fund’s effective management fee rate was higher than its peer group median and category median. The Board noted that the Adviser has contractually agreed to limit the Fund’s total annual operating expenses so that those expenses, as a percentage of daily net assets, will not exceed the annual rate of 0.50%. This contractual expense limitation may not be amended or withdrawn until one year after the date of the Fund’s prospectus, unless approved by the Board. The Board also considered that the Adviser voluntarily agreed to waive fees to the extent necessary to help to attempt to maintain a positive yield, although there is no guarantee that the Fund will maintain a positive yield. This voluntary fee waiver may be amended or withdrawn at any time without prior notice to shareholders.
19 OPPENHEIMER MONEY FUND/VA
BOARD APPROVAL OF THE FUND’S INVESTMENT ADVISORY AND SUB-ADIVSORY
AGREEMENTS Unaudited / Continued
Economies of Scale and Profits Realized by the Managers. The Board considered information regarding the Managers’ costs in serving as the Fund’s investment adviser and sub-adviser, including the costs associated with the personnel and systems necessary to manage the Fund, and information regarding the Managers’ profitability from their relationship with the Fund. The Board reviewed whether the Managers may realize economies of scale in managing and supporting the Fund. The Board noted that the Fund currently has management fee breakpoints, which are intended to share with Fund shareholders economies of scale that may exist as the Fund’s assets grow.
Other Benefits to the Managers. In addition to considering the profits realized by the Managers, the Board considered information that was provided regarding the direct and indirect benefits the Managers receive as a result of their relationship with the Fund, including compensation paid to the Managers’ affiliates.
Conclusions. These factors were also considered by the independent Trustees meeting separately from the full Board, assisted by experienced counsel to the Fund and to the independent Trustees. Fund counsel and the independent Trustees’ counsel are independent of the Managers within the meaning and intent of the Securities and Exchange Commission Rules.
Based on its review of the information it received and its evaluations described above, the Board, including a majority of the independent Trustees, decided to continue the Agreements through August 31, 2016. In arriving at its decision, the Board did not identify any factor or factors as being more important than others, but considered all of the above information, and considered the terms and conditions of the Agreements, including the management fees, in light of all the surrounding circumstances.
20 OPPENHEIMER MONEY FUND/VA
PORTFOLIO PROXY VOTING POLICIES AND PROCEDURES; UPDATES TO STATEMENTS OF
INVESTMENTS Unaudited
The Fund has adopted Portfolio Proxy Voting Policies and Procedures under which the Fund votes proxies relating to securities (“portfolio proxies”) held by the Fund. A description of the Fund’s Portfolio Proxy Voting Policies and Procedures is available (i) without charge, upon request, by calling the Fund toll-free at 1.800.525.7048, (ii) on the Fund’s website at www.oppenheimerfunds.com, and (iii) on the SEC’s website at www.sec.gov. In addition, the Fund is required to file Form N-PX, with its complete proxy voting record for the 12 months ended June 30th, no later than August 31st of each year. The Fund’s voting record is available (i) without charge, upon request, by calling the Fund toll-free at 1.800.525.7048, and (ii) in the Form N-PX filing on the SEC’s website at www.sec.gov.
The Fund files its complete schedule of portfolio holdings with the SEC for the first quarter and the third quarter of each fiscal year on Form N-Q. The Fund’s Form N-Q filings are available on the SEC’s website at www.sec.gov. Those forms may be reviewed and copied at the SEC’s Public Reference Room in Washington, D.C. Information on the operation of the Public Reference Room may be obtained by calling 1-800-SEC-0330.
21 OPPENHEIMER MONEY FUND/VA
DISTRIBUTION SOURCES Unaudited
For any distribution that took place over the last six months of the Fund’s reporting period, the table below details, on a per-share basis, the percentage of the Fund’s total distribution payment amount that was derived from the following sources: net income, net profit from the sale of securities, and other capital sources. This information is based upon income and capital gains using generally accepted accounting principles as of the date of each distribution. Because the Fund is actively managed, the relative amount of the Fund’s total distributions derived from various sources over the calendar year may change. Please note that this information should not be used for tax reporting purposes as the tax character of distributable income may differ from the amounts used for this notification. You will receive IRS tax forms in the first quarter of each calendar year detailing the actual amount of the taxable and non-taxable portion of distributions paid to you during the tax year.
For the most current information, please go to oppenheimerfunds.com. Select your Fund, then the ’Detailed’ tab; where ‘Dividends’ are shown, the Fund’s latest pay date will be followed by the sources of any distribution, updated daily.
| | | | | | | | | | | | | | | | |
| Fund Name | | Pay Date | | | Net Income | | | Net Profit
from Sale | | | Other Capital
Sources | |
| |
Oppenheimer Money Fund/VA | | | 7/17/15 | | | | 95.9% | | | | 0.0 | % | | | 4.1% | |
| |
Oppenheimer Money Fund/VA | | | 8/21/15 | | | | 95.9% | | | | 0.0 | % | | | 4.1% | |
| |
Oppenheimer Money Fund/VA | | | 9/18/15 | | | | 95.9% | | | | 0.0 | % | | | 4.1% | �� |
| |
Oppenheimer Money Fund/VA | | | 10/16/15 | | | | 95.9% | | | | 0.3 | % | | | 3.8% | |
| |
Oppenheimer Money Fund/VA | | | 11/20/15 | | | | 95.9% | | | | 4.1 | % | | | 0.0% | |
| |
Oppenheimer Money Fund/VA | | | 12/18/15 | | | | 97.1% | | | | 1.8 | % | | | 1.1% | |
| |
22 OPPENHEIMER MONEY FUND/VA
TRUSTEES AND OFFICERS Unaudited
| | |
| Name, Position(s) Held with the Fund, Length of Service, Age | | Principal Occupation(s) During the Past 5 Years; Other Trusteeships/Directorships Held; Number of Portfolios in the Fund Complex Currently Overseen |
| |
| INDEPENDENT TRUSTEES | | The address of each Trustee in the chart below is 6803 S. Tucson Way, Centennial, Colorado 80112-3924. Each Trustee serves for an indefinite term, or until his or her resignation, retirement, death or removal. |
| |
Sam Freedman, Chairman of the Board of Trustees (since 2013) and Trustee (since 1996) Year of Birth: 1940 | | Director of Colorado UpLIFT (charitable organization) (since September 1984). Mr. Freedman held several positions with the Sub- Adviser and with subsidiary or affiliated companies of the Sub-Adviser (until October 1994). Oversees 47 portfolios in the OppenheimerFunds complex. Mr. Freedman has served on the Boards of certain Oppenheimer funds since 1996, during which time he has become familiar with the Fund’s (and other Oppenheimer funds’) financial, accounting, regulatory and investment matters and has contributed to the Boards’ deliberations. |
| |
Jon S. Fossel, Trustee (since 1990) Year of Birth: 1942 | | Chairman of the Board of Jack Creek Preserve Foundation (non-profit organization) (since 2005); Chairman of the Board (2006- December 2011) and Director (June 2002-December 2011) of UNUMProvident (insurance company); Director of Northwestern Energy Corp. (public utility corporation) (November 2004-December 2009); Director of P.R. Pharmaceuticals (October 1999- October 2003); Director of Rocky Mountain Elk Foundation (non-profit organization) (February 1998-February 2003 and February 2005-February 2007); Chairman and Director (until October 1996) and President and Chief Executive Officer (until October 1995) of the Sub-Adviser; President, Chief Executive Officer and Director of the following: Oppenheimer Acquisition Corp. (“OAC”) (parent holding company of the Sub-Adviser), Shareholders Services, Inc. and Shareholder Financial Services, Inc. (until October 1995). Oversees 47 portfolios in the OppenheimerFunds complex. Mr. Fossel has served on the Boards of certain Oppenheimer funds since 1990, during which time he has become familiar with the Fund’s (and other Oppenheimer funds’) financial, accounting, regulatory and investment matters and has contributed to the Boards’ deliberations. |
| |
Richard F. Grabish, Trustee (since 2012) Year of Birth: 1948 | | Formerly Senior Vice President and Assistant Director of Sales and Marketing (March 1997-December 2007), Director (March 1987-December 2007) and Manager of Private Client Services (June 1985-June 2005) of A.G. Edwards & Sons, Inc. (broker/dealer and investment firm); Chairman and Chief Executive Officer of A.G. Edwards Trust Company, FSB (March 2001-December 2007); President and Vice Chairman of A.G. Edwards Trust Company, FSB (investment adviser) (April 1987-March 2001); President of A.G. Edwards Trust Company, FSB (investment adviser) (June 2005-December 2007). Oversees 47 portfolios in the OppenheimerFunds complex. Mr. Grabish has served on the Boards of certain Oppenheimer funds since 2001, during which time he has become familiar with the Fund’s (and other Oppenheimer funds’) financial, accounting, regulatory and investment matters and has contributed to the Boards’ deliberations. |
| |
Beverly L. Hamilton, Trustee (since 2002) Year of Birth: 1946 | | Trustee of Monterey Institute for International Studies (educational organization) (since February 2000); Board Member of Middlebury College (educational organization) (December 2005-June 2011); Chairman (since 2010) of American Funds’ Emerging Markets Growth Fund, Inc. (mutual fund); Director of The California Endowment (philanthropic organization) (April 2002-April 2008); Director (February 2002-2005) and Chairman of Trustees (2006-2007) of the Community Hospital of Monterey Peninsula; Director (October 1991-2005); Vice Chairman (2006-2009) of American Funds’ Emerging Markets Growth Fund, Inc. (mutual fund); President of ARCO Investment Management Company (February 1991-April 2000); Member of the investment committees of The Rockefeller Foundation (2001-2006) and The University of Michigan (since 2000); Advisor at Credit Suisse First Boston’s Sprout venture capital unit (venture capital fund) (1994-January 2005); Trustee of MassMutual Institutional Funds (investment company) (1996-June 2004); Trustee of MML Series Investment Fund (investment company) (April 1989-June 2004); Member of the investment committee of Hartford Hospital (2000-2003); and Advisor to Unilever (Holland) pension fund (2000-2003). Oversees 47 portfolios in the OppenheimerFunds complex. Ms. Hamilton has served on the Boards of certain Oppenheimer funds since 2002, during which time she has become familiar with the Fund’s (and other Oppenheimer funds’) financial, accounting, regulatory and investment matters and has contributed to the Boards’ deliberations. |
| |
Victoria J. Herget, Trustee (since 2012) Year of Birth:1951 | | Board Chair (2008-Present) and Director (2004-Present), United Educators (insurance company); Trustee (since 2000) and Chair (since 2010), Newberry Library (independent research library); Trustee, Mather LifeWays (senior living organization) (since 2001); Independent Director of the First American Funds (mutual fund family) (2003-2011); former Managing Director (1993-2001), Principal (1985-1993), Vice President (1978-1985) and Assistant Vice President (1973-1978) of Zurich Scudder Investments (investment adviser) (and its predecessor firms); Trustee (1992-2007), Chair of the Board of Trustees (1999-2007), Investment Committee Chair (1994-1999) and Investment Committee member (2007-2010) of Wellesley College; Trustee, BoardSource (non-profit organization) (2006-2009) and Chicago City Day School (K-8 School) (1994-2005). Oversees 47 portfolios in the OppenheimerFunds complex. Ms. Herget has served on the Boards of certain Oppenheimer funds since 2012, during which time she has become familiar with the Fund’s (and other Oppenheimer funds’) financial, accounting, regulatory and investment matters and has contributed to the Boards’ deliberations. |
| |
Robert J. Malone, Trustee (since 2002) Year of Birth: 1944 | | Chairman - Colorado Market of MidFirst Bank (since January 2015); Chairman of the Board (since 2012) and Director (since August 2005) of Jones International University (educational organization); Trustee of the Gallagher Family Foundation (non-profit organization) (2000-2015); Chairman, Chief Executive Officer and Director of Steele Street Bank Trust (commercial banking) (August 2003-January 2015); Board of Directors of Opera Colorado Foundation (non-profit organization) (2008-2012); Director of Colorado UpLIFT (charitable organization) (1986-2010); Director of Jones Knowledge, Inc. (2006-2010); Former Chairman of U.S. Bank-Colorado (subsidiary of U.S. Bancorp and formerly Colorado National Bank) (July 1996-April 1999); Director of Commercial Assets, Inc. (real estate investment trust) (1993-2000); Director of U.S. Exploration, Inc. (oil and gas exploration) (1997-February 2004); Chairman of the Board (1991-1994) and Trustee (1985-1994) of Regis University; and Chairman of the Board (1990-1991 and Trustee (1984-1999) of Young Presidents Organization. Oversees 47 portfolios in the OppenheimerFunds complex. Mr. Malone has served on the Boards of certain Oppenheimer funds since 2002, during which time he has become familiar with the Fund’s (and other Oppenheimer funds’) financial, accounting, regulatory and investment matters and has contributed to the Boards’ deliberations. |
23 OPPENHEIMER MONEY FUND/VA
TRUSTEES AND OFFICERS Unaudited / Continued
| | |
F. William Marshall, Jr., Trustee (since 2000) Year of Birth: 1942 | | Trustee Emeritus of Worcester Polytech Institute (WPI) (private university) (since 2009); Trustee of MassMutual Select Funds (formerly MassMutual Institutional Funds) (investment company) (since 1996), MML Series Investment Fund (investment company) (since 1996) and Mass Mutual Premier Funds (investment company) (since January 2012); President and Treasurer of the SIS Funds (private charitable fund) (January 1999-March 2011); Former Trustee of WPI (1985-2008); Former Chairman of the Board (2004-2006) and Former Chairman of the Investment Committee of WPI (1994-2008); Chairman of SIS Family Bank, F.S.B. (formerly SIS Bank) (commercial bank) (January 1999-July 1999); Executive Vice President of Peoples Heritage Financial Group, Inc. (commercial bank) (January 1999-July 1999); and Former President and Chief Executive Officer of SIS Bancorp. (1993-1999). Oversees 47 portfolios in the OppenheimerFunds complex. Mr. Marshall has served on the Boards of certain Oppenheimer funds since 2000, during which time he has become familiar with the Fund’s (and other Oppenheimer funds’) financial, accounting, regulatory and investment matters and has contributed to the Boards’ deliberations. |
| |
Karen L. Stuckey, Trustee (since 2012) Year of Birth: 1953 | | Partner (1990-2012) of PricewaterhouseCoopers LLP (professional services firm) (held various positions 1975-1990); Trustee (1992-2006) and member of Executive, Nominating and Audit Committees and Chair of Finance Committee of Lehigh University; and member, Women’s Investment Management Forum (professional organization) since inception. Oversees 47 portfolios in the OppenheimerFunds complex. Ms. Stuckey has served on the Boards of certain Oppenheimer funds since 2012, during which time she has become familiar with the Fund’s (and other Oppenheimer funds’) financial, accounting, regulatory and investment matters and has contributed to the Boards’ deliberations. |
| |
James D. Vaughn, Trustee (since 2012) Year of Birth: 1945 | | Retired; former managing partner (1994-2001) of Denver office of Deloitte & Touche LLP, (held various positions 1969-1993); Trustee and Chairman of the Audit Committee of Schroder Funds (2003-2012); Board member and Chairman of Audit Committee of AMG National Trust Bank (since 2005); Trustee, Investment Committee member, University of South Dakota Foundation (since 1996); Board member, Audit Committee Member and past Board Chair, Junior Achievement (since 1993); former Board member, Mile High United Way, Boys and Girls Clubs, Boy Scouts, Colorado Business Committee for the Arts, Economic Club of Colorado and Metro Denver Network. Oversees 47 portfolios in the OppenheimerFunds complex. Mr. Vaughn has served on the Boards of certain Oppenheimer funds since 2012, during which time he has become familiar with the Fund’s (and other Oppenheimer funds’) financial, accounting, regulatory and investment matters and has contributed to the Boards’ deliberations. |
| | |
| INTERESTED TRUSTEE AND OFFICER | | Mr. Steinmetz is an “Interested Trustee” because he is affiliated with the Manager and the Sub-Adviser by virtue of his positions as Chairman and director of the Sub-Adviser and officer and director of the Manager. Both as a Trustee and as an officer, Mr. Steinmetz serves for an indefinite term, or until his resignation, retirement, death or removal. Mr. Steinmetz’s address is 225 Liberty Street, New York, New York 10281-1008. |
| |
Arthur P. Steinmetz Trustee (Since 2015), President and Principal Executive Officer (since 2014) Year of Birth: 1958 | | Chairman of the Sub-Adviser (since January 2015); CEO and Chairman of the Manager (since July 2014), President of the Manager (since May 2013), a Director of the Manager (since January 2013), Director of the Sub-Adviser (since July 2014), President, Management Director and CEO of Oppenheimer Acquisition Corp. (the Sub-Adviser’s parent holding company) (since July 2014), and President and Director of OFI SteelPath, Inc. (since January 2013). Chief Investment Officer of the OppenheimerFunds advisory entities from (January 2013-December 2013); Executive Vice President of the Manager (January 2013-May 2013); Chief Investment Officer of the Sub-Adviser (October 2010-December 2012); Chief Investment Officer, Fixed- Income, of the Sub-Adviser (April 2009-October 2010); Executive Vice President of the Sub-Adviser (October 2009-December 2012); Director of Fixed Income of the Sub-Adviser (January 2009-April 2009); and a Senior Vice President of the Sub-Adviser (March 1993-September 2009). An officer of 101 portfolios in the OppenheimerFunds complex. |
| | |
| OTHER OFFICERS OF THE FUND | | The addresses of the Officers in the chart below are as follows: for Messrs. Gabinet, Mss. Sexton and Picciotto, 225 Liberty Street, New York, New York 10281-1008, for Messrs. Proctor, Wilde and Wixted, 6803 S. Tucson Way, Centennial, Colorado 80112-3924. Each Officer serves for an indefinite term or until his or her resignation, retirement, death or removal. |
| |
Christopher Proctor, Vice President (since 2010) Year of Birth: 1968 | | Head of the Cash Strategies Team (since July 2013); Senior Vice President of the Sub-Adviser (since July 2013) and Senior Portfolio Manager of the Sub-Adviser (since January 2010). Vice President of the Sub-Adviser (August 2008-July 2013). Vice President at Calamos Asset Management (January 2007-March 2008) and Scudder-Kemper Investments (1999-2002). Managing Director and Co-Founder of Elmhurst Capital Management (June 2004-January 2007); Senior Manager of Research for Etrade Global Asset Management (2002-2004). A portfolio manager and officer of other portfolios in the OppenheimerFunds complex. |
| |
Adam S. Wilde, Vice President (since 2013) Year of Birth: 1978 | | Vice President of the Sub-Adviser (since May 2011) and a Portfolio Manager of the Sub-Adviser (since July 2013). He served as the head of credit research for the cash strategies team of the Sub-Adviser (from 2011 to 2013), and as an Assistant Vice President and senior research analyst of the Sub-Adviser (from 2008 to 2011). Mr. Wilde served as an intermediate research analyst of the Sub-Adviser (from 2007 to 2008) and served in other analyst roles of the Sub-Adviser (since 2002). Mr. Wilde joined the Sub-Adviser in 2001. A portfolio manager and officer of other portfolios in the OppenheimerFunds complex. |
| |
Arthur S. Gabinet, Secretary and Chief Legal Officer (since 2011) Year of Birth: 1958 | | Executive Vice President, Secretary and General Counsel of the Manager (since January 2013); General Counsel OFI SteelPath, Inc. (since January 2013); Executive Vice President (May 2010-December 2012) and General Counsel (since January 2011) of the Sub-Adviser; General Counsel of the Distributor (since January 2011); General Counsel of Centennial Asset Management Corporation (January 2011-December 2012); Executive Vice President (January 2011-December 2012) and General Counsel of HarbourView Asset Management Corporation (since January 2011); Assistant Secretary (since January 2011) and Director (since January 2011) of OppenheimerFunds International Ltd. and OppenheimerFunds plc; Director of Oppenheimer Real Asset Management, Inc. (January 2011-December 2012) and General Counsel (since January 2011); Executive Vice President (January 2011-December 2011) and General Counsel of Shareholder Financial Services, Inc. and Shareholder Services, Inc. (since January 2011); Executive Vice President (January 2011-December 2012) and General Counsel of OFI Private Investments Inc. (since January 2011); Vice President of OppenheimerFunds Legacy Program (January 2011-December 2011); Executive Vice President |
24 OPPENHEIMER MONEY FUND/VA
| | |
Arthur S. Gabinet, Continued | | (January 2011-December 2012) and General Counsel of OFI Institutional Asset Management, Inc. (since January 2011); General Counsel, Asset Management of the Sub-Adviser (May 2010-December 2010); Principal, The Vanguard Group (November 2005- April 2010); District Administrator, U.S. Securities and Exchange Commission (January 2003-October 2005). An officer of 101 Portfolios in the OppenheimerFunds complex. |
| |
Jennifer Sexton, Vice President and Chief Business Officer (since 2014) Year of Birth: 1969 | | Senior Vice President of OppenheimerFunds Distributor, Inc. (since June 2014); Vice President of OppenheimerFunds Distributor, Inc. (April 2006-June 2014); Vice President of the Sub-Adviser (January 1998-March 2006); Assistant Vice President of the Sub- Adviser (October 1991-December 1998). An officer of 101 Portfolios in the OppenheimerFunds complex. |
| |
Mary Ann Picciotto, Chief Compliance Officer and Chief Anti-Money Laundering Officer (since 2014) Year of Birth: 1973 | | Senior Vice President and Chief Compliance Officer of the Manager (since March 2014); Chief Compliance Officer of the Sub- Adviser, OFI SteelPath, Inc., OFI Global Trust Company, OFI Global Institutional, Inc., Oppenheimer Real Asset Management, Inc., OFI Private Investments, Inc., Harborview Asset Management Corporation, Trinity Investment Management Corporation, and Shareholder Services, Inc. (since March 2014); Managing Director of Morgan Stanley Investment Management Inc. and certain of its various affiliated entities; Chief Compliance Officer of various Morgan Stanley Funds (May 2010-January 2014); Chief Compliance Officer of Morgan Stanley Investment Management Inc. (April 2007-January 2014). An officer of 101 Portfolios in the OppenheimerFunds complex. |
| |
Brian W. Wixted, Treasurer and Principal Financial & Accounting Officer (since 1999) Year of Birth: 1959 | | Senior Vice President of the Manager (since January 2013); Treasurer of the Sub-Adviser, HarbourView Asset Management Corporation, Shareholder Financial Services, Inc., Shareholder Services, Inc., and Oppenheimer Real Asset Management, Inc. (March 1999-June 2008), OFI Private Investments, Inc. (March 2000-June 2008), OppenheimerFunds International Ltd. and OppenheimerFunds plc (since May 2000), OFI Institutional Asset Management, Inc. (November 2000-June 2008), and OppenheimerFunds Legacy Program (charitable trust program established by the Sub-Adviser) (June 2003-December 2011); Treasurer and Chief Financial Officer of OFI Trust Company (since May 2000); Assistant Treasurer of Oppenheimer Acquisition Corporation (March 1999-June 2008). An officer of 101 Portfolios in the OppenheimerFunds complex. |
The Fund’s Statement of Additional Information contains additional information about the Fund’s Trustees and Officers and is available without charge, upon request, by calling 1.800.988.8287.
25 OPPENHEIMER MONEY FUND/VA
THIS PAGE INTENTIONALLY LEFT BLANK.
26 OPPENHEIMER MONEY FUND/VA
THIS PAGE INTENTIONALLY LEFT BLANK.
27 OPPENHEIMER MONEY FUND/VA
OPPENHEIMER MONEY FUND/VA
A Series of Oppenheimer Variable Account Funds
| | |
| Manager | | OFI Global Asset Management, Inc. |
| |
| Sub-Adviser | | OppenheimerFunds, Inc. |
| |
| Distributor | | OppenheimerFunds Distributor, Inc. |
| |
| Transfer and | | OFI Global Asset Management, Inc. |
| Shareholder | | |
| Servicing Agent | | |
| |
| Sub-Transfer Agent | | Shareholder Services, Inc. |
| | DBA OppenheimerFunds Services |
| |
| Independent | | KPMGLLP |
| Registered | | |
| Public | | |
| Accounting | | |
| Firm | | |
| |
| Counsel | | Ropes & Gray LLP |
| |
| | Before investing in any of the Oppenheimer funds, investors should carefully consider a fund’s investment objectives, risks, charges and expenses. Fund prospectuses and summary prospectuses contain this and other information about the funds, and may be obtained by asking your financial advisor, or calling us at 1.800.988.8287. Read prospectuses and summary prospectuses carefully before investing. |
| |
| | © 2016 OppenheimerFunds, Inc. All rights reserved. Oppenheimer funds are distributed by OppenheimerFunds Distributor, Inc. |

| | |
| | 
|
| | December 31, 2015 |

|
| | ANNUAL REPORT Listing of Top Holdings Fund Performance Discussion Financial Statements |
PORTFOLIO MANAGERS: Hemant Baijal, Michael Mata and Krishna Memani
AVERAGE ANNUAL TOTAL RETURNS FOR THE PERIODS ENDED 12/31/15
| | | | | | | | | | | | | | |
| | | Inception Date | | 1-Year | | | 5-Year | | | 10-Year | |
Non-Service Shares | | 5/3/93 | | | -2.26 | % | | | 2.82 | % | | | 4.74 | % |
Service Shares | | 3/19/01 | | | -2.49 | | | | 2.55 | | | | 4.47 | |
Barclays U.S. Aggregate Bond Index | | | | | 0.55 | | | | 3.25 | | | | 4.51 | |
Citigroup World Government Bond Index | | | | | -3.57 | | | | -0.08 | | | | 3.44 | |
Citigroup Non U.S. World Government Bond Index | | | | | -5.54 | | | | -1.30 | | | | 3.05 | |
J.P. Morgan Domestic High Yield Index | | | | | -4.99 | | | | 5.33 | | | | 7.06 | |
Reference Index | | | | | -3.46 | | | | 2.10 | | | | 4.80 | |
Performance data quoted represents past performance, which does not guarantee future results. The investment return and principal value of an investment in the Fund will fluctuate so that an investor’s shares, when redeemed, may be worth more or less than their original cost. Current performance and expense ratios may be lower or higher than the data quoted. For performance data current to the most recent month end, call us at 1.800.988.8287. The Fund’s total returns should not be expected to be the same as the returns of other funds, whether or not both funds have the same portfolio managers and/or similar names. The Fund’s total returns include changes in share price and reinvested distributions but do not include the charges associated with the separate account products that offer this Fund. Such performance would have been lower if such charges were taken into account.
2 OPPENHEIMER GLOBAL STRATEGIC INCOME FUND/VA
TOP HOLDINGS AND ALLOCATIONS
PORTFOLIO ALLOCATION
| | |
|
Non-Convertible Corporate Bonds and Notes | | 52.9% |
|
Mortgage-Backed Obligations | | |
Government Agency | | 4.9 |
Non-Agency | | 8.9 |
|
Investment Companies | | |
Oppenheimer Institutional Money Market Fund | | 5.1 |
Oppenheimer Master Event-Linked Bond Fund, LLC | | 2.6 |
Oppenheimer Master Loan Fund, LLC | | 5.1 |
|
Foreign Government Obligations | | 9.5 |
|
Asset-Backed Securities | | 5.8 |
|
U.S. Government Obligations | | 1.8 |
|
Short-Term Notes | | 1.6 |
|
Corporate Loans | | 0.9 |
|
Structured Securities | | 0.6 |
|
Over-the-Counter Options Purchased | | 0.1 |
|
Over-the-Counter Interest Rate Swaptions Purchased | | 0.1 |
|
Common Stocks | | 0.1 |
|
Rights, Warrants and Certificates | | — |
|
Portfolio holdings and allocations are subject to change. Percentages are as of December 31, 2015, and are based on the total market value of investments.
| | | | | |
CREDIT RATING BREAKDOWN | | NRSRO ONLY TOTAL |
AAA | | | | 15.1 | % |
AA | | | | 2.6 | |
A | | | | 7.2 | |
BBB | | | | 23.4 | |
BB | | | | 21.6 | |
B | | | | 16.3 | |
CCC | | | | 3.4 | |
CC | | | | 0.0 | |
C | | | | 0.0 | |
D | | | | 1.4 | |
Unrated | | | | 9.0 | |
Total | | | | 100.0 | % |
The percentages above are based on the market value of the Fund’s securities as of December 31, 2015, and are subject to change. Except for securities labeled and “Unrated,” and except for certain securities issued or guaranteed by a foreign sovereign, all securities have been rated by at least one Nationally Recognized Statistical Rating Organization (“NRSRO”), such as Standard & Poor’s (“S&P”). For securities rated only by an NRSRO other than S&P, OppenheimerFunds, Inc. (the “Sub-Adviser”) converts that rating to the equivalent S&P rating. If two or more NRSROs have assigned a rating to a security, the highest S&P equivalent rating is used. Unrated securities issued or guaranteed by a foreign sovereign are assigned a credit rating equal to the highest NRSRO rating assigned to that foreign sovereign. For securities not rated by an NRSRO, the Sub-Adviser uses its own credit analysis to assign ratings in categories similar to those of S&P. The use of similar categories is not an indication that the Sub-Adviser’s credit analysis process is consistent or comparable with any NRSRO’s process were that NRSRO to rate the same security. Fund assets invested in Oppenheimer Institutional Money Market Fund are assigned that fund’s S&P rating, which is currently AAA. For the purposes of this table, “investment-grade” securities are securities rated within the NRSROs’ four highest rating categories (AAA, AA, A and BBB). Unrated securities do not necessarily indicate low credit quality, and may or may not be the equivalent of investment-grade. Please consult the Fund’s prospectus and Statement of Additional Information for further information.
3 OPPENHEIMER GLOBAL STRATEGIC INCOME FUND/VA
Fund Performance Discussion
In what was a volatile year for global fixed-income and equity markets, the Fund’s Non-Service shares returned -2.26%. In comparison, the Fund outperformed the -3.46% return of its Reference Index (the “Index”), which currently is composed of the following broad-based securities indices: 40% Citigroup Non-U.S. World Government Bond Index, 30% J.P. Morgan Domestic High Yield Index, and 30% Barclays U.S. Aggregate Bond Index.
MARKET OVERVIEW
2015 will go down as a year in which volatility returned to the financial markets following a multi-year hiatus. Global growth struggled to gain traction as many of the world’s largest economies expanded below their long-term trends. China’s industrial production slowed for the fifth consecutive year and weighed on the world’s exporters—especially commodity producers. In the United States, a strong dollar impaired the competitiveness of many American companies and proved to be a drag on corporate earnings. The Federal Reserve finally hiked interest rates 0.25% in December, which followed a somewhat underwhelming easing program by the European Central Bank (ECB) earlier in the month. The environment led to a turbulent environment for various asset classes.
FUND REVIEW
The Fund’s strongest performer relative to the Index was an underweight position in foreign currencies and a long position in the U.S. dollar. This benefited results due to the strong rally in the U.S. dollar during the year. An underweight position in developed markets also contributed positively to the Fund’s relative performance.
The primary detractor from performance this reporting period was the Fund’s allocation to emerging markets local debt. In this area, the significant increase in Brazilian and Asian yields drove the Fund’s underperformance. Also detracting from performance was our high yield and investment grade exposure. In high yield, the sharp drop in oil hurt our positions in the energy sector. We decreased our allocation to energy during the reporting period. Among investment grade debt, the primary detractor from performance this reporting period was a minimal exposure to U.S. Treasuries. However, investments in investment-grade corporate bonds and mortgages benefited results.
STRATEGY & OUTLOOK
We continue to believe that fixed income markets will remain volatile given both economic and policy uncertainty. We also believe that the U.S. economy should continue to perform well compared to most other regions.
Given our concern with global events and our belief that the U.S. dollar will generally continue to appreciate against most foreign currencies, the Fund has almost no foreign currency exposure. Compared to the Index, at the end of the reporting period, the Fund was underweight every foreign currency except the Japanese yen and Indian rupee, where the Fund maintained modest long positions based on the belief that Japan will benefit from flight to quality flows and the Indian economy will perform well relative to its peers.
While we believe defaults will rise in 2016 in some credit markets, market pricing appears to be discounting significant risk and our belief that certain sectors have the ability to absorb significant spread widening make the risk/reward trade-off appealing. Although cautious, the Fund maintains positions in corporate credit, but relative to the Index, remains underweight the energy and the metals and mining sectors against an overweight in industrials. Relative to the Index, the Fund is modestly overweight U.S. high yield, but significantly underweight U.S. investment-grade corporates. The Fund maintains its allocations to mortgages and levered loans. Outside the U.S., the Fund had a modest allocation to certain emerging market and developed market issuers at period end.
Investors should consider the Fund’s investment objective, risks, charges and expenses carefully before investing. The Fund’s prospectus and summary prospectus contain this and other information about the Fund, and may be obtained by asking your financial advisor or calling us at 1.800.988.8287. Read prospectuses and summary prospectuses carefully before investing.
Total returns include changes in share price and reinvestment of dividends and capital gains distributions in a hypothetical investment for the periods shown.
The Fund’s investment strategy and focus can change over time. The mention of specific fund holdings does not constitute a recommendation by OppenheimerFunds, Inc. or its affiliates.
4 OPPENHEIMER GLOBAL STRATEGIC INCOME FUND/VA
Shares of Oppenheimer funds are not deposits or obligations of any bank, are not guaranteed by any bank, are not insured by the FDIC or any other agency, and involve investment risks, including the possible loss of the principal amount invested.
Comparing the Fund’s Performance to the Market. The graphs that follow show the performance of a hypothetical $10,000 investment in each share class of the Fund held until December 31, 2015. Performance is measured over a ten-fiscal-year period for both Classes. Performance information does not reflect charges that apply to separate accounts investing in the Fund. If these charges were taken into account, performance would be lower. The graphs assume that all dividends and capital gains distributions were reinvested in additional shares.
The Fund’s performance is compared to the performance of the Barclays U.S. Aggregate Bond Index, the Citigroup World Government Bond Index, the Citigroup Non-U.S. World Government Bond Index, the J.P. Morgan Domestic High Yield Index and the Fund’s Reference Index. The Barclays U.S. Aggregate Bond Index is an index of U.S. Government and corporate bonds. The Citigroup World Government Bond Index is an index of debt securities of major foreign government bond markets. The Citigroup Non-U.S. World Government Bond Index is an index of fixed rate government bonds with a maturity of one year or longer and amounts outstanding of at least U.S. $25 million. The J.P. Morgan Domestic High Yield Index is an unmanaged index of high yield fixed income securities issued by U.S. companies. The Fund’s Reference Index is a customized weighted index currently comprised of the following underlying broad-based security indices: 40% Citigroup Non-U.S. World Government Bond Index, 30% J.P. Morgan Domestic High Yield Index, and 30% Barclays U.S. Aggregate Bond Index. The indices are unmanaged and cannot be purchased directly by investors. While index comparisons may be useful to provide a benchmark for the Fund’s performance, it must be noted that the Fund’s investments are not limited to the investments comprising the indices. Index performance includes reinvestment of income, but does not reflect transaction costs, fees, expenses or taxes. Index performance is shown for illustrative purposes only as a benchmark for the Fund’s performance, and does not predict or depict performance of the Fund. The Fund’s performance reflects the effects of the Fund’s business and operating expenses.
5 OPPENHEIMER GLOBAL STRATEGIC INCOME FUND/VA
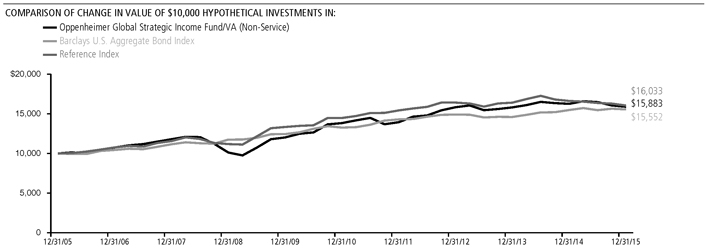
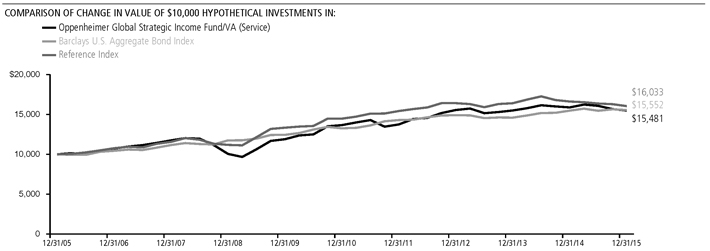
Performance data quoted represents past performance, which does not guarantee future results. The investment return and principal value of an investment in the Fund will fluctuate so that an investor’s shares, when redeemed, may be worth more or less than their original cost. Current performance may be lower or higher than the performance quoted. For performance data current to the most recent month end, call us at 1.800.988.8287. The Fund’s total returns should not be expected to be the same as the returns of other funds, whether or not both funds have the same portfolio managers and/or similar names. The Fund’s total returns include changes in share price and reinvested distributions but do not include the charges associated with the separate account products that offer this Fund. Such performance would have been lower if such charges were taken into account.
6 OPPENHEIMER GLOBAL STRATEGIC INCOME FUND/VA
Fund Expenses
Fund Expenses. As a shareholder of the Fund, you incur two types of costs: (1) transaction costs and (2) ongoing costs, including management fees; distribution and service fees; and other Fund expenses. These examples are intended to help you understand your ongoing costs (in dollars) of investing in the Fund and to compare these costs with the ongoing costs of investing in other mutual funds.
The examples are based on an investment of $1,000.00 invested at the beginning of the period and held for the entire 6-month period ended December 31, 2015.
Actual Expenses. The first section of the table provides information about actual account values and actual expenses. You may use the information in this section for the class of shares you hold, together with the amount you invested, to estimate the expense that you paid over the period. Simply divide your account value by $1,000.00 (for example, an $8,600.00 account value divided by $1,000.00 = 8.60), then multiply the result by the number in the first section under the heading entitled “Expenses Paid During 6 Months Ended December 31, 2015” to estimate the expenses you paid on your account during this period.
Hypothetical Example for Comparison Purposes.
The second section of the table provides information about hypothetical account values and hypothetical expenses based on the Fund’s actual expense ratio for each class of shares, and an assumed rate of return of 5% per year for each class before expenses, which is not the actual return. The hypothetical account values and expenses may not be used to estimate the actual ending account balance or expenses you paid for the period. You may use this information to compare the ongoing costs of investing in the Fund and other funds. To do so, compare this 5% hypothetical example for the class of shares you hold with the 5% hypothetical examples that appear in the shareholder reports of the other funds.
Please note that the expenses shown in the table are meant to highlight your ongoing costs only and do not reflect any charges associated with the separate accounts that offer this Fund. Therefore, the “hypothetical” lines of the table are useful in comparing ongoing costs only, and will not help you determine the relative total costs of owning different funds. In addition, if these separate account charges were included your costs would have been higher.
| | | | | | | | | | | | | | |
| Actual | | Beginning
Account Value
July 1, 2015 | | | Ending Account Value
December 31, 2015 | | | Expenses Paid During 6 Months Ended
December 31, 2015 | | | |
Non-Service shares | | $ | 1,000.00 | | | $ | 964.40 | | | $ | 3.67 | | | |
Service shares | | | 1,000.00 | | | | 963.40 | | | | 4.91 | | | |
| | | | |
Hypothetical (5% return before expenses) | | | | | | | | | | | |
Non-Service shares | | | 1,000.00 | | | | 1,021.48 | | | | 3.78 | | | |
Service shares | | | 1,000.00 | | | | 1,020.21 | | | | 5.05 | | | |
Expenses are equal to the Fund’s annualized expense ratio for that class, multiplied by the average account value over the period, multiplied by 184/365 (to reflect the one-half year period). Those annualized expense ratios, excluding indirect expenses from affiliated funds, based on the 6-month period ended December 31, 2015 are as follows:
| | | | |
| Class | | Expense Ratios | |
Non-Service shares | | | 0.74% | |
Service shares | | | 0.99 | |
The expense ratios reflect voluntary and/or contractual waivers and/or reimbursements of expenses by the Fund’s Manager. Some of these undertakings may be modified or terminated at any time, as indicated in the Fund’s prospectus. The “Financial Highlights” tables in the Fund’s financial statements, included in this report, also show the gross expense ratios, without such waivers or reimbursements and reduction to custodian expenses, if applicable.
7 OPPENHEIMER GLOBAL STRATEGIC INCOME FUND/VA
CONSOLIDATED STATEMENT OF INVESTMENTS December 31, 2015
| | | | | | | | | | |
| | | | | Principal Amount | | | Value | | |
| Asset-Backed Securities—5.9% | | |
| American Credit Acceptance Receivables Trust: | | |
| Series 2014-2, Cl. B, 2.26%, 3/10/201 | | | | $ | 3,042,940 | | | $ 3,043,933 | | |
| Series 2014-3, Cl. B, 2.43%, 6/10/201 | | | | | 655,000 | | | 650,983 | | |
| Series 2014-4, Cl. B, 2.60%, 10/12/201 | | | | | 205,000 | | | 202,857 | | |
| Series 2015-1, Cl. B, 2.85%, 2/12/211 | | | | | 665,000 | | | 655,080 | | |
| Series 2015-2, Cl. B, 2.97%, 5/12/211 | | | | | 625,000 | | | 614,775 | | |
| Series 2015-3, Cl. B, 3.56%, 10/12/212 | | | | | 525,000 | | | 521,522 | | |
| | |
| AmeriCredit Automobile Receivables Trust: | | |
| Series 2012-2, Cl. E, 4.85%, 8/8/191 | | | | | 470,000 | | | 476,837 | | |
| Series 2012-3, Cl. E, 4.46%, 11/8/191 | | | | | 360,000 | | | 364,991 | | |
| Series 2012-4, Cl. D, 2.68%, 10/9/18 | | | | | 315,000 | | | 317,471 | | |
| Series 2013-2, Cl. E, 3.41%, 10/8/201 | | | | | 560,000 | | | 564,423 | | |
| Series 2013-3, Cl. D, 3.00%, 7/8/19 | | | | | 440,000 | | | 445,497 | | |
| Series 2013-3, Cl. E, 3.74%, 12/8/201 | | | | | 250,000 | | | 250,028 | | |
| Series 2013-4, Cl. D, 3.31%, 10/8/19 | | | | | 1,955,000 | | | 1,987,802 | | |
| Series 2013-5, Cl. D, 2.86%, 12/9/19 | | | | | 860,000 | | | 865,648 | | |
| Series 2014-1, Cl. C, 2.15%, 3/9/20 | | | | | 655,000 | | | 652,842 | | |
| Series 2014-1, Cl. D, 2.54%, 6/8/20 | | | | | 460,000 | | | 459,539 | | |
| Series 2014-1, Cl. E, 3.58%, 8/9/21 | | | | | 550,000 | | | 547,650 | | |
| Series 2014-2, Cl. C, 2.18%, 6/8/20 | | | | | 990,000 | | | 987,874 | | |
| Series 2014-2, Cl. D, 2.57%, 7/8/20 | | | | | 715,000 | | | 708,256 | | |
| Series 2014-2, Cl. E, 3.37%, 11/8/21 | | | | | 390,000 | | | 384,365 | | |
| Series 2014-3, Cl. D, 3.13%, 10/8/20 | | | | | 625,000 | | | 624,986 | | |
| Series 2014-4, Cl. D, 3.07%, 11/9/20 | | | | | 305,000 | | | 303,829 | | |
| Series 2015-2, Cl. C, 2.40%, 1/8/21 | | | | | 235,000 | | | 232,155 | | |
| Series 2015-2, Cl. D, 3.00%, 6/8/21 | | | | | 290,000 | | | 286,443 | | |
| Series 2015-3, Cl. D, 3.34%, 8/8/21 | | | | | 305,000 | | | 302,121 | | |
| Series 2015-4, Cl. D, 3.72%, 12/8/21 | | | | | 350,000 | | | 349,406 | | |
| | |
| Bancaja Fondo de Titulizacion, Series 10, Cl. A2, 0.028%, 5/22/503 | | EUR | | | 975,351 | | | 1,013,142 | | |
| | |
| California Republic Auto Receivables Trust: | | |
| Series 2013-2, Cl. C, 3.32%, 8/17/20 | | | | | 365,000 | | | 368,879 | | |
| Series 2014-2, Cl. C, 3.29%, 3/15/21 | | | | | 130,000 | | | 128,557 | | |
| Series 2014-4, Cl. C, 3.56%, 9/15/21 | | | | | 145,000 | | | 143,386 | | |
| | |
| Capital Auto Receivables Asset Trust: | | |
| Series 2013-1, Cl. D, 2.19%, 9/20/21 | | | | | 275,000 | | | 274,284 | | |
| Series 2013-4, Cl. D, 3.22%, 5/20/19 | | | | | 170,000 | | | 172,729 | | |
| Series 2014-1, Cl. D, 3.39%, 7/22/19 | | | | | 685,000 | | | 696,014 | | |
| Series 2014-3, Cl. D, 3.14%, 2/20/20 | | | | | 255,000 | | | 254,116 | | |
| Series 2015-2, Cl. C, 2.67%, 8/20/20 | | | | | 270,000 | | | 267,433 | | |
| Series 2015-4, Cl. D, 3.62%, 5/20/21 | | | | | 470,000 | | | 464,086 | | |
| | |
| CarFinance Capital Auto Trust: | | |
| Series 2013-2A, Cl. B, 3.15%, 8/15/191 | | | | | 155,000 | | | 155,814 | | |
| Series 2015-1A, Cl. A, 1.75%, 6/15/211 | | | | | 2,940,882 | | | 2,923,489 | | |
| | |
| CarMax Auto Owner Trust: | | |
| Series 2012-2, Cl. D, 3.02%, 12/17/18 | | | | | 1,615,000 | | | 1,625,134 | | |
| Series 2014-2, Cl. D, 2.58%, 11/16/20 | | | | | 450,000 | | | 448,021 | | |
| Series 2015-2, Cl. D, 3.04%, 11/15/21 | | | | | 175,000 | | | 173,683 | | |
| Series 2015-3, Cl. D, 3.27%, 3/15/22 | | | | | 305,000 | | | 304,303 | | |
| | |
| Chrysler Capital Auto Receivables Trust: | | |
| Series 2013-BA, Cl. B, 1.78%, 6/17/191 | | | | | 1,185,000 | | | 1,177,370 | | |
| Series 2013-BA, Cl. C, 2.24%, 9/16/191 | | | | | 1,065,000 | | | 1,055,483 | | |
| Series 2014-AA, Cl. B, 1.76%, 8/15/191 | | | | | 1,305,000 | | | 1,291,225 | | |
| Series 2014-AA, Cl. C, 2.28%, 11/15/191 | | | | | 1,430,000 | | | 1,422,284 | | |
| | |
| CLI Funding V LLC, Series 2014-2A, Cl. A, 3.38%, 10/18/291 | | | | | 309,093 | | | 300,023 | | |
| | |
| CPS Auto Receivables Trust, Series 2014- C, Cl. A, 1.31%, 2/15/191 | | | | | 256,273 | | | 254,423 | | |
| | |
| CPS Auto Trust, Series 2012-C, Cl. A, 1.82%, 12/16/191 | | | | | 49,388 | | | 49,192 | | |
| | |
| Credit Acceptance Auto Loan Trust: | | |
| Series 2014-1A, Cl. B, 2.29%, 4/15/221 | | | | | 765,000 | | | 762,459 | | |
| Series 2015-2A, Cl. B, 3.04%, 8/15/231 | | | | | 555,000 | | | 552,791 | | |
| | |
| Cronos Containers Program I Ltd., Series 2014-2A, Cl. A, 3.27%, 11/18/291 | | | | | 285,880 | | | 279,216 | | |
| | |
| Drive Auto Receivables Trust: | | |
| Series 2015-AA, Cl. B, 2.28%, 6/17/191 | | | | | 955,000 | | | 961,905 | | |
| Series 2015-AA, Cl. C, 3.06%, 5/17/211 | | | | | 1,710,000 | | | 1,712,956 | | |
| Series 2015-BA, Cl. C, 2.76%, 7/15/211 | | | | | 2,370,000 | | | 2,354,973 | | |
| Series 2015-CA, Cl. B, 2.23%, 9/16/191 | | | | | 1,240,000 | | | 1,235,907 | | |
| Series 2015-DA, Cl. C, 3.38%, 11/15/211 | | | | | 415,000 | | | 413,344 | | |
| | | | | | | | | | |
| | | | | Principal Amount | | | Value | |
| Asset-Backed Securities (Continued) | | | | |
| DT Auto Owner Trust: | |
| Series 2012-2A, Cl. D, 4.35%, 3/15/191 | | | | $ | 211,404 | | | $ | 211,480 | |
| Series 2013-1A, Cl. D, 3.74%, 5/15/201 | | | | | 1,505,000 | | | | 1,511,179 | |
| Series 2013-2A, Cl. D, 4.18%, 6/15/201 | | | | | 2,935,000 | | | | 2,953,957 | |
| Series 2014-1A, Cl. D, 3.98%, 1/15/211 | | | | | 580,000 | | | | 579,834 | |
| Series 2014-3A, Cl. D, 4.47%, 11/15/211 | | | | | 290,000 | | | | 290,334 | |
| Series 2015-1A, Cl. C, 2.87%, 11/16/201 | | | | | 305,000 | | | | 303,881 | |
| |
| Element Rail Leasing I LLC, Series 2014-1A, Cl. A1, 2.299%, 4/19/441 | | | | | 309,234 | | | | 304,525 | |
| |
| Exeter Automobile Receivables Trust: | |
| Series 2013-2A, Cl. C, 4.35%, 1/15/191 | | | | | 500,000 | | | | 504,737 | |
| Series 2014-1A, Cl. B, 2.42%, 1/15/191 | | | | | 370,000 | | | | 370,018 | |
| Series 2014-1A, Cl. C, 3.57%, 7/15/191 | | | | | 860,000 | | | | 860,869 | |
| Series 2014-2A, Cl. A, 1.06%, 8/15/181 | | | | | 41,088 | | | | 40,978 | |
| Series 2014-2A, Cl. C, 3.26%, 12/16/191 | | | | | 180,000 | | | | 177,369 | |
| |
| First Investors Auto Owner Trust: | |
| Series 2012-1A, Cl. D, 5.65%, 4/15/181 | | | | | 285,000 | | | | 285,363 | |
| Series 2013-3A, Cl. C, 2.91%, 1/15/201 | | | | | 265,000 | | | | 265,597 | |
| Series 2013-3A, Cl. D, 3.67%, 5/15/201 | | | | | 195,000 | | | | 195,280 | |
| Series 2014-3A, Cl. D, 3.85%, 2/15/221 | | | | | 210,000 | | | | 210,210 | |
| |
| Flagship Credit Auto Trust: | |
| Series 2014-2, Cl. A, 1.43%, 12/16/191 | | | | | 253,872 | | | | 252,302 | |
| Series 2015-3, Cl. A, 2.38%, 10/15/201 | | | | | 3,638,052 | | | | 3,621,346 | |
| |
| GM Financial Automobile Leasing Trust, Series 2015-1, Cl. D, 3.01%, 3/20/20 | | | | | 415,000 | | | | 410,754 | |
| |
| GO Financial Auto Securitization Trust, Series 2015-1, Cl. A, 1.81%, 3/15/181 | | | | | 191,161 | | | | 190,892 | |
| |
| ICE EM CLO: | |
| Series 2007-1A, Cl. B, 2.219%, 8/15/221,3 | | | | | 7,870,000 | | | | 7,530,803 | |
| Series 2007-1A, Cl. C, 3.519%, 8/15/221,3 | | | | | 5,270,000 | | | | 5,001,230 | |
| Series 2007-1A, Cl. D, 5.519%, 8/15/221,3 | | | | | 4,757,343 | | | | 4,459,533 | |
| |
| Lusitano Mortgages plc, Series 3, Cl. A, 0.211%, 10/16/473 | | EUR | | | 486,930 | | | | 464,898 | |
| |
| Magellan Mortgages No. 3 plc, Series 3, Cl. A, 0.179%, 5/15/583 | | EUR | | | 445,531 | | | | 415,913 | |
| |
| Navistar Financial Dealer Note Master Trust, Series 2014-1, Cl. D, 2.722%, 10/25/191,3 | | | | | 180,000 | | | | 178,974 | |
| |
| Santander Drive Auto Receivables Trust: | |
| Series 2012-AA, Cl. D, 2.46%, 12/17/181 | | | | | 2,430,000 | | | | 2,443,734 | |
| Series 2013-1, Cl. D, 2.27%, 1/15/19 | | | | | 2,800,000 | | | | 2,801,362 | |
| Series 2013-3, Cl. D, 2.42%, 4/15/19 | | | | | 230,000 | | | | 229,540 | |
| Series 2013-4, Cl. D, 3.92%, 1/15/20 | | | | | 740,000 | | | | 757,274 | |
| Series 2013-4, Cl. E, 4.67%, 1/15/201 | | | | | 520,000 | | | | 533,727 | |
| Series 2013-5, Cl. D, 2.73%, 10/15/19 | | | | | 955,000 | | | | 958,452 | |
| Series 2013-A, Cl. D, 3.78%, 10/15/191 | | | | | 705,000 | | | | 717,584 | |
| Series 2013-A, Cl. E, 4.71%, 1/15/211 | | | | | 405,000 | | | | 414,348 | |
| Series 2014-1, Cl. D, 2.91%, 4/15/20 | | | | | 800,000 | | | | 804,087 | |
| Series 2014-2, Cl. C, 2.33%, 11/15/19 | | | | | 3,475,000 | | | | 3,481,509 | |
| Series 2014-2, Cl. D, 2.76%, 2/18/20 | | | | | 625,000 | | | | 622,562 | |
| Series 2014-3, Cl. B, 1.45%, 5/15/19 | | | | | 3,615,000 | | | | 3,609,438 | |
| Series 2014-3, Cl. D, 2.65%, 8/17/20 | | | | | 635,000 | | | | 632,314 | |
| Series 2014-4, Cl. B, 1.82%, 5/15/19 | | | | | 1,675,000 | | | | 1,676,916 | |
| Series 2014-4, Cl. C, 2.60%, 11/16/20 | | | | | 1,265,000 | | | | 1,267,768 | |
| Series 2014-4, Cl. D, 3.10%, 11/16/20 | | | | | 965,000 | | | | 965,559 | |
| Series 2014-5, Cl. D, 3.21%, 1/15/21 | | | | | 605,000 | | | | 606,700 | |
| Series 2015-1, Cl. C, 2.57%, 4/15/21 | | | | | 870,000 | | | | 865,483 | |
| Series 2015-1, Cl. D, 3.24%, 4/15/21 | | | | | 445,000 | | | | 444,558 | |
| Series 2015-2, Cl. D, 3.02%, 4/15/21 | | | | | 470,000 | | | | 462,897 | |
| Series 2015-3, Cl. D, 3.49%, 5/17/21 | | | | | 580,000 | | | | 575,468 | |
| Series 2015-4, Cl. D, 3.53%, 8/16/21 | | | | | 450,000 | | | | 446,435 | |
| Series 2015-5, Cl. C, 2.74%, 12/15/21 | | | | | 365,000 | | | | 362,291 | |
| |
| SNAAC Auto Receivables Trust: | |
| Series 2013-1A, Cl. C, 3.07%, 8/15/181 | | | | | 196,609 | | | | 197,436 | |
| Series 2014-1A, Cl. D, 2.88%, 1/15/201 | | | | | 905,000 | | | | 906,202 | |
| |
| TCF Auto Receivables Owner Trust, Series 2015-1A, Cl. D, 3.53%, 3/15/221 | | | | | 285,000 | | | | 281,551 | |
|
| 8 OPPENHEIMER GLOBAL STRATEGIC INCOME FUND/VA |
| | | | | | | | | | |
| | | | | Principal Amount | | | Value | | |
| Asset-Backed Securities (Continued) | | |
| TDA CAM 7 Fondo de Titulizacion de Activos, Series 7, Cl. A2, 0.036%, 2/26/493 | | EUR | | | 2,375,614 | | | $ 2,424,287 | | |
| | |
| TDA IBERCAJA 2 Fondo de Titulizacion de Activos, Series 2, Cl. A, 0.057%, 10/26/423 | | EUR | | | 340,028 | | | 353,199 | | |
| | |
| TDA IBERCAJA 6 Fondo de Titulizacion de Activos, Series 6, Cl. A, 0.201%, 11/25/513 | | EUR | | | 558,953 | | | 562,335 | | |
| | |
| Trip Rail Master Funding LLC, Series 2014-1A, Cl. A1, 2.863%, 4/15/441 | | | | | 132,268 | | | 132,455 | | |
| | |
| United Auto Credit Securitization Trust, Series 2015-1, Cl. D, 2.92%, 6/17/191 | | | | | 385,000 | | | 382,260 | | |
| | |
| Westlake Automobile Receivables Trust: | | |
| Series 2014-1A, Cl. D, 2.20%, 2/15/211 | | | | | 245,000 | | | 242,313 | | |
| Series 2014-2A, Cl. D, 2.86%, 7/15/211 | | | | | 245,000 | | | 241,084 | | |
| Series 2015-1A, Cl. C, 2.29%, 11/16/201 | | | | | 2,720,000 | | | 2,696,087 | | |
| Series 2015-2A, Cl. C, 2.45%, 1/15/211 | | | | | 365,000 | | | 360,522 | | |
| | | | | | | | | | |
Total Asset-Backed Securities (Cost $107,047,754) | | | | | | | | 106,089,927 | | |
| Mortgage-Backed Obligations—13.9% | | |
| Government Agency—5.0% | | |
| | |
| FHLMC/FNMA/FHLB/Sponsored—2.7% | | |
| | |
| Federal Home Loan Mortgage Corp. Gold Pool: | | |
| 5.00%, 9/1/33 | | | | | 400,644 | | | 443,351 | | |
| 5.50%, 9/1/39 | | | | | 501,630 | | | 555,300 | | |
| 6.00%, 5/1/18-11/1/21 | | | | | 105,104 | | | 116,610 | | |
| 6.50%, 3/1/18-8/1/32 | | | | | 447,520 | | | 511,701 | | |
| 7.00%, 10/1/31-10/1/37 | | | | | 98,227 | | | 110,256 | | |
| 7.50%, 1/1/32 | | | | | 330,906 | | | 399,220 | | |
| | |
| Federal Home Loan Mortgage Corp., Interest-Only Stripped Mtg.-Backed Security: | | |
| Series 192,Cl. IO, 5.38%, 2/1/284 | | | | | 8,280 | | | 1,787 | | |
| Series 205,Cl. IO, 11.509%, 9/1/294 | | | | | 49,532 | | | 11,897 | | |
| Series 243,Cl. 6, 0.619%, 12/15/324 | | | | | 107,022 | | | 21,007 | | |
| | |
| Federal Home Loan Mortgage Corp., Real Estate Mtg. Investment Conduit Multiclass Pass-Through Certificates: | | |
| Series 1360,Cl. PZ, 7.50%, 9/15/22 | | | | | 346,831 | | | 382,361 | | |
| Series 151,Cl. F, 9.00%, 5/15/21 | | | | | 5,801 | | | 6,403 | | |
| Series 1674,Cl. Z, 6.75%, 2/15/24 | | | | | 193,124 | | | 212,132 | | |
| Series 1897,Cl. K, 7.00%, 9/15/26 | | | | | 623,217 | | | 694,794 | | |
| Series 2043,Cl. ZP, 6.50%, 4/15/28 | | | | | 239,257 | | | 264,427 | | |
| Series 2106,Cl. FG, 0.781%, 12/15/283 | | | | | 421,261 | | | 426,070 | | |
| Series 2122,Cl. F, 0.781%, 2/15/293 | | | | | 10,973 | | | 11,097 | | |
| Series 2148,Cl. ZA, 6.00%, 4/15/29 | | | | | 260,793 | | | 297,105 | | |
| Series 2195,Cl. LH, 6.50%, 10/15/29 | | | | | 165,615 | | | 188,808 | | |
| Series 2326,Cl. ZP, 6.50%, 6/15/31 | | | | | 23,392 | | | 25,956 | | |
| Series 2344,Cl. FP, 1.281%, 8/15/313 | | | | | 108,287 | | | 111,523 | | |
| Series 2368,Cl. PR, 6.50%, 10/15/31 | | | | | 80,823 | | | 89,617 | | |
| Series 2412,Cl. GF, 1.281%, 2/15/323 | | | | | 163,435 | | | 168,428 | | |
| Series 2449,Cl. FL, 0.881%, 1/15/323 | | | | | 125,852 | | | 127,836 | | |
| Series 2451,Cl. FD, 1.331%, 3/15/323 | | | | | 62,653 | | | 64,678 | | |
| Series 2453,Cl. BD, 6.00%, 5/15/17 | | | | | 8,815 | | | 9,057 | | |
| Series 2461,Cl. PZ, 6.50%, 6/15/32 | | | | | 302,682 | | | 344,432 | | |
| Series 2464,Cl. FI, 1.331%, 2/15/323 | | | | | 55,401 | | | 56,866 | | |
| Series 2470,Cl. AF, 1.331%, 3/15/323 | | | | | 107,497 | | | 110,972 | | |
| Series 2470,Cl. LF, 1.331%, 2/15/323 | | | | | 56,695 | | | 58,194 | | |
| Series 2477,Cl. FZ, 0.881%, 6/15/313 | | | | | 232,086 | | | 235,537 | | |
| Series 2517,Cl. GF, 1.331%, 2/15/323 | | | | | 49,293 | | | 50,597 | | |
| Series 2635,Cl. AG, 3.50%, 5/15/32 | | | | | 74,741 | | | 77,525 | | |
| Series 2668,Cl. AZ, 4.00%, 9/15/18 | | | | | 27,288 | | | 27,974 | | |
| Series 2676,Cl. KY, 5.00%, 9/15/23 | | | | | 926,119 | | | 992,019 | | |
| Series 2707,Cl. QE, 4.50%, 11/15/18 | | | | | 105,955 | | | 109,712 | | |
| Series 2770,Cl. TW, 4.50%, 3/15/19 | | | | | 14,877 | | | 15,455 | | |
| Series 3025,Cl. SJ, 23.538%, 8/15/353 | | | | | 143,824 | | | 225,921 | | |
| Series 3741,Cl. PA, 2.15%, 2/15/35 | | | | | 597,089 | | | 603,018 | | |
| Series 3815,Cl. BD, 3.00%, 10/15/20 | | | | | 16,281 | | | 16,575 | | |
| Series 3840,Cl. CA, 2.00%, 9/15/18 | | | | | 12,208 | | | 12,311 | | |
| Series 3848,Cl. WL, 4.00%, 4/15/40 | | | | | 275,958 | | | 289,129 | | |
| Series 3857,Cl. GL, 3.00%, 5/15/40 | | | | | 11,445 | | | 11,791 | | |
| | | | | | | | | | |
| | | | | | | | | | |
| | | | | | | | | | |
| | | | | | | | | | |
| | | | | | | | |
| | | Principal Amount | | | Value | |
| |
| FHLMC/FNMA/FHLB/Sponsored (Continued) | |
| |
| Federal Home Loan Mortgage Corp., Real Estate Mtg. Investment Conduit Multiclass Pass-Through Certificates: (Continued) | |
| Series 3917,Cl. BA, 4.00%, 6/15/38 | | $ | 158,667 | | | $ | 164,546 | |
| Series 4221,Cl. HJ, 1.50%, 7/15/23 | | | 336,078 | | | | 334,239 | |
| |
| Federal Home Loan Mortgage Corp., Real Estate Mtg. Investment Conduit Multiclass Pass-Through Certificates, Interest-Only Stripped Mtg.-Backed Security: | |
| Series 2074,Cl. S, 50.228%, 7/17/284 | | | 13,185 | | | | 2,500 | |
| Series 2079,Cl. S, 0.00%, 7/17/284,5 | | | 23,339 | | | | 4,653 | |
| Series 2136,Cl. SG, 61.90%, 3/15/294 | | | 598,428 | | | | 131,928 | |
| Series 2399,Cl. SG, 52.145%, 12/15/264 | | | 341,182 | | | | 73,307 | |
| Series 2437,Cl. SB, 65.294%, 4/15/324 | | | 1,118,709 | | | | 272,459 | |
| Series 2526,Cl. SE, 24.025%, 6/15/294 | | | 22,235 | | | | 5,029 | |
| Series 2682,Cl. TQ, 99.999%, 10/15/334 | | | 226,999 | | | | 54,427 | |
| Series 2795,Cl. SH, 6.355%, 3/15/244 | | | 476,368 | | | | 61,316 | |
| Series 2920,Cl. S, 45.119%, 1/15/354 | | | 236,643 | | | | 43,406 | |
| Series 2922,Cl. SE, 4.431%, 2/15/354 | | | 40,069 | | | | 7,157 | |
| Series 2981,Cl. AS, 0.00%, 5/15/354,5 | | | 392,844 | | | | 77,091 | |
| Series 2981,Cl. BS, 99.999%, 5/15/354 | | | 443,574 | | | | 91,334 | |
| Series 3201,Cl. SG, 2.148%, 8/15/364 | | | 207,844 | | | | 39,108 | |
| Series 3397,Cl. GS, 12.378%, 12/15/374 | | | 165,373 | | | | 30,830 | |
| Series 3424,Cl. EI, 8.188%, 4/15/384 | | | 68,615 | | | | 8,105 | |
| Series 3450,Cl. BI, 6.50%, 5/15/384 | | | 269,540 | | | | 42,576 | |
| Series 3606,Cl. SN, 0.00%, 12/15/394,5 | | | 83,066 | | | | 14,548 | |
| Series 3659,Cl. IE, 0.00%, 3/15/194,5 | | | 282,416 | | | | 14,890 | |
| Series 3685,Cl. EI, 0.00%, 3/15/194,5 | | | 180,667 | | | | 7,699 | |
| |
| Federal National Mortgage Assn.: | |
| 3.00%, 1/1/316 | | | 9,260,000 | | | | 9,538,191 | |
| 3.50%, 1/15/466 | | | 345,000 | | | | 355,859 | |
| 4.00%, 1/1/466 | | | 11,300,000 | | | | 11,955,272 | |
| 6.00%, 1/1/466 | | | 2,140,000 | | | | 2,418,050 | |
| |
| Federal National Mortgage Assn. Pool: | |
| 3.50%, 12/1/20-2/1/22 | | | 499,590 | | | | 523,490 | |
| 5.00%, 2/1/18-7/1/33 | | | 1,157,753 | | | | 1,231,012 | |
| 5.50%, 4/1/21-5/1/36 | | | 275,024 | | | | 305,836 | |
| 6.00%, 10/1/16-1/1/19 | | | 35,794 | | | | 36,437 | |
| 6.50%, 4/1/17-1/1/34 | | | 736,230 | | | | 840,433 | |
| 7.00%, 11/1/17-6/1/34 | | | 879,463 | | | | 1,030,787 | |
| 7.50%, 2/1/27-3/1/33 | | | 1,117,257 | | | | 1,346,037 | |
| 8.50%, 7/1/32 | | | 1,569 | | | | 1,695 | |
| |
| Federal National Mortgage Assn., Interest-Only Stripped Mtg.-Backed Security: | |
| Series 214,Cl. 2, 35.779%, 3/25/234 | | | 133,432 | | | | 15,796 | |
| Series 221,Cl. 2, 39.237%, 5/25/234 | | | 16,202 | | | | 3,239 | |
| Series 254,Cl. 2, 29.422%, 1/25/244 | | | 272,934 | | | | 32,135 | |
| Series 301,Cl. 2, 0.00%, 4/25/294,5 | | | 51,614 | | | | 11,166 | |
| Series 313,Cl. 2, 3.261%, 6/25/314 | | | 510,990 | | | | 110,513 | |
| Series 319,Cl. 2, 0.00%, 2/25/324,5 | | | 237,652 | | | | 50,898 | |
| Series 321,Cl. 2, 1.993%, 4/25/324 | | | 69,697 | | | | 14,857 | |
| Series 324,Cl. 2, 0.00%, 7/25/324,5 | | | 73,311 | | | | 17,083 | |
| Series 328,Cl. 2, 0.00%, 12/25/324,5 | | | 144,164 | | | | 27,651 | |
| Series 331,Cl. 5, 0.00%, 2/25/334,5 | | | 273,866 | | | | 55,710 | |
| Series 332,Cl. 2, 0.00%, 3/25/334,5 | | | 1,134,232 | | | | 222,232 | |
| Series 334,Cl. 12, 0.00%, 3/25/334,5 | | | 220,992 | | | | 53,084 | |
| Series 339,Cl. 15, 4.611%, 10/25/334 | | | 680,495 | | | | 153,721 | |
| Series 345,Cl. 9, 0.00%, 1/25/344,5 | | | 197,488 | | | | 40,743 | |
| Series 351,Cl. 10, 0.00%, 4/25/344,5 | | | 128,563 | | | | 24,324 | |
| Series 351,Cl. 8, 0.00%, 4/25/344,5 | | | 223,759 | | | | 42,893 | |
| Series 356,Cl. 10, 0.00%, 6/25/354,5 | | | 162,935 | | | | 32,740 | |
| Series 356,Cl. 12, 0.00%, 2/25/354,5 | | | 79,959 | | | | 16,348 | |
| Series 362,Cl. 13, 0.00%, 8/25/354,5 | | | 105,194 | | | | 22,481 | |
| |
| Federal National Mortgage Assn., Real Estate Mtg. Investment Conduit Multiclass Pass-Through Certificates: | |
| Series 1999-54,Cl. LH, 6.50%, 11/25/29 | | | 143,860 | | | | 163,260 | |
| Series 2001-80,Cl. ZB, 6.00%, 1/25/32 | | | 134,115 | | | | 152,349 | |
| Series 2002-12,Cl. PG, 6.00%, 3/25/17 | | | 22,026 | | | | 22,509 | |
| Series 2002-29,Cl. F, 1.422%, 4/25/323 | | | 60,146 | | | | 61,823 | |
| Series 2002-64,Cl. FJ, 1.422%, 4/25/323 | | | 18,521 | | | | 19,037 | |
| Series 2002-68,Cl. FH, 0.86%, 10/18/323 | | | 42,368 | | | | 42,970 | |
| Series 2002-84,Cl. FB, 1.422%, 12/25/323 | | | 269,007 | | | | 276,280 | |
| Series 2002-9,Cl. PC, 6.00%, 3/25/17 | | | 20,785 | | | | 21,270 | |
| Series 2002-9,Cl. PR, 6.00%, 3/25/17 | | | 25,450 | | | | 26,022 | |
| Series 2002-90,Cl. FH, 0.922%, 9/25/323 | | | 150,509 | | | | 152,502 | |
|
| 9 OPPENHEIMER GLOBAL STRATEGIC INCOME FUND/VA |
CONSOLIDATED STATEMENT OF INVESTMENTS Continued
| | | | | | | | | | |
| | | | | Principal Amount | | | Value | | |
| | |
| FHLMC/FNMA/FHLB/Sponsored (Continued) | | |
| | |
| Federal National Mortgage Assn., Real Estate Mtg. Investment Conduit Multiclass Pass-Through Certificates: (Continued) | | |
| Series 2003-100,Cl. PA, 5.00%, 10/25/18 | | | | $ | 175,311 | | | $ 181,990 | | |
| Series 2003-11,Cl. FA, 1.422%, 9/25/323 | | | | | 269,013 | | | 276,287 | | |
| Series 2003-112,Cl. AN, 4.00%, 11/25/18 | | | | | 59,530 | | | 61,022 | | |
| Series 2003-116,Cl. FA, 0.822%, 11/25/333 | | | | | 27,303 | | | 27,484 | | |
| Series 2003-84,Cl. GE, 4.50%, 9/25/18 | | | | | 24,711 | | | 25,557 | | |
| Series 2004-101,Cl. BG, 5.00%, 1/25/20 | | | | | 93,925 | | | 95,316 | | |
| Series 2004-25,Cl. PC, 5.50%, 1/25/34 | | | | | 57,132 | | | 59,660 | | |
| Series 2005-109,Cl. AH, 5.50%, 12/25/25 | | | | | 1,197,562 | | | 1,293,763 | | |
| Series 2005-31,Cl. PB, 5.50%, 4/25/35 | | | | | 560,000 | | | 648,500 | | |
| Series 2005-71,Cl. DB, 4.50%, 8/25/25 | | | | | 172,933 | | | 183,108 | | |
| Series 2006-11,Cl. PS, 23.021%, 3/25/363 | | | | | 123,978 | | | 192,060 | | |
| Series 2006-46,Cl. SW, 22.653%, 6/25/363 | | | | | 201,258 | | | 267,164 | | |
| Series 2008-75,Cl. DB, 4.50%, 9/25/23 | | | | | 84,226 | | | 86,868 | | |
| Series 2009-113,Cl. DB, 3.00%, 12/25/20 | | | | | 249,990 | | | 254,688 | | |
| Series 2009-36,Cl. FA, 1.362%, 6/25/373 | | | | | 62,192 | | | 63,859 | | |
| Series 2009-70,Cl. TL, 4.00%, 8/25/19 | | | | | 300,532 | | | 307,200 | | |
| Series 2010-43,Cl. KG, 3.00%, 1/25/21 | | | | | 125,001 | | | 127,735 | | |
| Series 2011-122,Cl. EC, 1.50%, 1/25/20 | | | | | 154,619 | | | 155,005 | | |
| Series 2011-15,Cl. DA, 4.00%, 3/25/41 | | | | | 132,751 | | | 137,773 | | |
| Series 2011-3,Cl. EL, 3.00%, 5/25/20 | | | | | 413,687 | | | 421,467 | | |
| Series 2011-3,Cl. KA, 5.00%, 4/25/40 | | | | | 266,544 | | | 289,276 | | |
| Series 2011-38,Cl. AH, 2.75%, 5/25/20 | | | | | 13,170 | | | 13,378 | | |
| Series 2011-6,Cl. BA, 2.75%, 6/25/20 | | | | | 172,900 | | | 175,327 | | |
| Series 2011-69,Cl. EA, 3.00%, 11/25/29 | | | | | 119,464 | | | 120,835 | | |
| Series 2011-82,Cl. AD, 4.00%, 8/25/26 | | | | | 247,800 | | | 254,819 | | |
| Series 2012-20,Cl. FD, 0.822%, 3/25/423 | | | | | 393,350 | | | 395,372 | | |
| | |
| Federal National Mortgage Assn., Real Estate Mtg. Investment Conduit Multiclass Pass-Through Certificates, Interest-Only Stripped Mtg.-Backed Security: | | |
| Series 2001-61,Cl. SH, 20.774%, 11/18/314 | | | | | 69,080 | | | 14,565 | | |
| Series 2001-63,Cl. SD, 24.505%, 12/18/314 | | | | | 18,669 | | | 3,871 | | |
| Series 2001-68,Cl. SC, 16.283%, 11/25/314 | | | | | 12,001 | | | 2,680 | | |
| Series 2001-81,Cl. S, 16.581%, 1/25/324 | | | | | 15,180 | | | 4,243 | | |
| Series 2002-28,Cl. SA, 26.445%, 4/25/324 | | | | | 10,597 | | | 2,440 | | |
| Series 2002-38,Cl. SO, 40.311%, 4/25/324 | | | | | 66,053 | | | 12,858 | | |
| Series 2002-48,Cl. S, 22.354%, 7/25/324 | | | | | 16,635 | | | 3,891 | | |
| Series 2002-52,Cl. SL, 25.087%, 9/25/324 | | | | | 10,649 | | | 2,472 | | |
| Series 2002-56,Cl. SN, 23.841%, 7/25/324 | | | | | 22,858 | | | 5,260 | | |
| Series 2002-77,Cl. IS, 36.675%, 12/18/324 | | | | | 112,534 | | | 25,232 | | |
| Series 2002-77,Cl. SH, 26.412%, 12/18/324 | | | | | 22,782 | | | 4,822 | | |
| Series 2002-9,Cl. MS, 18.997%, 3/25/324 | | | | | 19,863 | | | 4,530 | | |
| Series 2003-13,Cl. IO, 7.809%, 3/25/334 | | | | | 209,389 | | | 34,560 | | |
| Series 2003-26,Cl. DI, 9.408%, 4/25/334 | | | | | 169,512 | | | 41,208 | | |
| Series 2003-33,Cl. SP, 22.94%, 5/25/334 | | | | | 121,255 | | | 27,328 | | |
| Series 2003-38,Cl. SA, 0.00%, 3/25/234,5 | | | | | 61,029 | | | 2,442 | | |
| Series 2003-4,Cl. S, 24.642%, 2/25/334 | | | | | 34,643 | | | 8,895 | | |
| Series 2004-56,Cl. SE, 8.903%, 10/25/334 | | | | | 570,058 | | | 122,446 | | |
| Series 2005-12,Cl. SC, 7.109%, 3/25/354 | | | | | 18,935 | | | 3,671 | | |
| Series 2005-14,Cl. SE, 28.533%, 3/25/354 | | | | | 691,503 | | | 107,840 | | |
| Series 2005-40,Cl. SA, 42.427%, 5/25/354 | | | | | 587,848 | | | 104,637 | | |
| Series 2005-40,Cl. SB, 55.595%, 5/25/354 | | | | | 917,352 | | | 158,224 | | |
| Series 2005-52,Cl. JH, 0.18%, 5/25/354 | | | | | 352,196 | | | 63,048 | | |
| Series 2005-63,Cl. SA, 39.072%, 10/25/314 | | | | | 32,910 | | | 6,956 | | |
| Series 2006-90,Cl. SX, 99.999%, 9/25/364 | | | | | 615,603 | | | 110,904 | | |
| Series 2007-88,Cl. XI, 26.508%, 6/25/374 | | | | | 738,792 | | | 124,773 | | |
| Series 2008-55,Cl. SA, 0.00%, 7/25/384,5 | | | | | 59,406 | | | 7,820 | | |
| Series 2009-8,Cl. BS, 0.00%, 2/25/244,5 | | | | | 60,926 | | | 2,710 | | |
| Series 2010-95,Cl. DI, 0.00%, 11/25/204,5 | | | | | 390,849 | | | 21,546 | | |
| Series 2011-96,Cl. SA, 4.685%, 10/25/414 | | | | | 187,168 | | | 32,528 | | |
| Series 2012-134,Cl. SA, 10.761%, 12/25/424 | | | | | 714,104 | | | 172,698 | | |
| Series 2012-40,Cl. PI, 0.00%, 4/25/414,5 | | | | | 1,316,761 | | | 179,077 | | |
| | |
| Federal National Mortgage Assn., Stripped Mtg.-Backed Security, Series 302, Cl. 2, 6%, 5/1/29 | | | | | 3 | | | — | | |
| | | | | | | | | | |
| | | | | | | | 48,975,020 | | |
| | |
GNMA/Guaranteed—2.3% | | | | | | | | | | |
| | |
| Government National Mortgage Assn. I Pool: | | |
| 7.00%, 4/15/28-7/15/28 | | | | | 74,558 | | | 81,681 | | |
| 7.50%, 2/15/27 | | | | | 4,775 | | | 4,922 | | |
| 8.00%, 5/15/26 | | | | | 9,896 | | | 10,029 | | |
| | | | | | | | | | |
| | | | | Principal Amount | | | Value | |
| |
| GNMA/Guaranteed (Continued) | |
| |
| Government National Mortgage Assn. II Pool: | |
| 1.625%, 11/20/253 | | | | $ | 3,099 | | | $ | 3,213 | |
| 3.50%, 1/15/466 | | | | | 29,710,000 | | | | 30,963,546 | |
| 4.00%, 1/20/466 | | | | | 7,100,000 | | | | 7,538,543 | |
| |
| Government National Mortgage Assn., Interest-Only Stripped Mtg.-Backed Security: | |
| Series 2007-17,Cl. AI, 17.788%, 4/16/374 | | | | | 302,795 | | | | 60,331 | |
| Series 2011-52,Cl. HS, 7.862%, 4/16/414 | | | | | 513,555 | | | | 95,263 | |
| |
| Government National Mortgage Assn., Real Estate Mtg. Investment Conduit Multiclass Pass-Through Certificates: | |
| Series 1999-32,Cl. ZB, 8.00%, 9/16/29 | | | | | 493,449 | | | | 577,350 | |
| Series 2000-12,Cl. ZA, 8.00%, 2/16/30 | | | | | 1,062,998 | | | | 1,225,940 | |
| | | | | | | | | | |
| | | | | | | | | 40,560,818 | |
| |
Non-Agency—8.9% | | | | | | | | | | |
| |
Commercial—7.9% | | | | | | | | | | |
| |
| Banc of America Funding Trust: | |
| Series 2006-G,Cl. 2A4, 0.692%, 7/20/363 | | | | | 1,091,445 | | | | 1,026,280 | |
| Series 2014-R7,Cl. 3A1, 2.763%, 3/26/362,3 | | | | | 140,094 | | | | 142,168 | |
| |
| BCAP LLC Trust: | |
| Series 2011-R11,Cl. 18A5, 2.43%, 9/26/351,3 | | | | | 177,124 | | | | 179,082 | |
| Series 2012-RR2,Cl. 6A3, 2.848%, 9/26/351,3 | | | | | 287,702 | | | | 288,008 | |
| Series 2012-RR6,Cl. RR6, 2.404%, 11/26/361 | | | | | 265,900 | | | | 265,183 | |
| Series 2013-RR2,Cl. 5A2, 2.667%, 3/26/361,3 | | | | | 7,322,828 | | | | 6,273,185 | |
| |
| Bear Stearns ARM Trust, Series 2005-2, Cl. A1, 2.68%, 3/25/353 | | | | | 157,965 | | | | 158,674 | |
| |
| Chase Mortgage Finance Trust, Series 2005-A2, Cl. 1A3, 2.544%, 1/25/363 | | | | | 21,302 | | | | 19,949 | |
| |
| CHL Mortgage Pass-Through Trust, Series 2005-17, Cl. 1A8, 5.50%, 9/25/35 | | | | | 1,101,062 | | | | 1,089,708 | |
| |
| Citigroup Commercial Mortgage Trust, Series 2013-GC11, Cl. D, 4.457%, 4/10/461,3 | | | | | 245,000 | | | | 222,749 | |
| |
| Citigroup Mortgage Loan Trust, Inc.: | |
| Series 2006-AR1,Cl. 1A1, 2.57%, 10/25/353 | | | | | 11,736 | | | | 11,650 | |
| Series 2009-8,Cl. 7A2, 2.763%, 3/25/361,3 | | | | | 10,431,939 | | | | 9,369,346 | |
| Series 2012-8,Cl. 1A1, 2.842%, 10/25/351,3 | | | | | 524,925 | | | | 527,414 | |
| Series 2014-8,Cl. 1A2, 0.692%, 7/20/361,3 | | | | | 3,400,000 | | | | 2,647,762 | |
| |
| COMM Mortgage Trust: | |
| Series 2012-CR4,Cl. D, 4.574%, 10/15/451,3 | | | | | 70,000 | | | | 65,734 | |
| Series 2012-CR5,Cl. E, 4.337%, 12/10/451,3 | | | | | 605,000 | | | | 561,670 | |
| Series 2013-CR7,Cl. D, 4.352%, 3/10/461,3 | | | | | 3,270,000 | | | | 2,956,620 | |
| Series 2013-CR9,Cl. D, 4.257%, 7/10/451,3 | | | | | 2,685,000 | | | | 2,423,727 | |
| Series 2014-UBS3,Cl. D, 4.814%, 6/10/471,3 | | | | | 8,895,000 | | | | 7,693,875 | |
| |
| COMM Mortgage Trust, Interest-Only Stripped Mtg.-Backed Security, Series 2012-CR5, Cl. XA, 0.00%, 12/10/454,5 | | | | | 3,342,856 | | | | 261,302 | |
| |
| Connecticut Avenue Securities: | |
| Series 2014-C03,Cl. 2M2, 3.322%, 7/25/243 | | | | | 4,495,000 | | | | 4,106,619 | |
| Series 2015-C01,Cl. 1M2, 4.722%, 2/25/253 | | | | | 2,500,000 | | | | 2,426,110 | |
| Series 2015-C03,Cl. 1M2, 5.422%, 7/25/253 | | | | | 4,490,000 | | | | 4,472,507 | |
| |
| CSMC, Series 2009-13R, Cl. 4A1, 2.747%, 9/26/361,3 | | | | | 24,417 | | | | 24,515 | |
| |
| DBUBS Mortgage Trust, Series 2011-LC1A, Cl. E, 5.663%, 11/10/461,3 | | | | | 100,000 | | | | 105,753 | |
| |
| Deutsche Alt-B Securities, Inc. Mortgage Loan Trust, Series 2006-AB2, Cl. A1, 5.888%, 6/25/363 | | | | | 77,542 | | | | 65,350 | |
| |
| Deutsche Mortgage Securities, Inc., Series 2013-RS1, Cl. 1A2, 0.622%, 7/22/361,3 | | | | | 5,060,144 | | | | 4,411,669 | |
| |
| EMF-UK plc, Series 2008-1X, Cl. A1A, 1.565%, 3/13/463 | | | | | 2,609,714 | | | | 3,723,805 | |
| |
| FREMF Mortgage Trust: | |
| Series 2012-K20,Cl. C, 3.869%, 5/25/451,3 | | | | | 3,725,000 | | | | 3,653,858 | |
| Series 2012-K501,Cl. C, 3.397%, 11/25/461,3 | | | | | 40,000 | | | | 40,136 | |
| Series 2013-K25,Cl. C, 3.618%, 11/25/451,3 | | | | | 135,000 | | | | 128,481 | |
| Series 2013-K26,Cl. C, 3.599%, 12/25/451,3 | | | | | 95,000 | | | | 92,111 | |
| Series 2013-K27,Cl. C, 3.496%, 1/25/461,3 | | | | | 150,000 | | | | 140,380 | |
| Series 2013-K28,Cl. C, 3.494%, 6/25/461,3 | | | | | 2,330,000 | | | | 2,182,819 | |
| Series 2013-K502,Cl. C, 3.18%, 3/25/451,3 | | | | | 220,000 | | | | 221,917 | |
| Series 2013-K712,Cl. C, 3.371%, 5/25/451,3 | | | | | 265,000 | | | | 262,936 | |
| Series 2013-K713,Cl. C, 3.165%, 4/25/461,3 | | | | | 535,000 | | | | 516,852 | |
|
| 10 OPPENHEIMER GLOBAL STRATEGIC INCOME FUND/VA |
| | | | | | | | | | |
| | | | | Principal Amount | | | Value | | |
| | |
| Commercial (Continued) | | |
| | |
| FREMF Mortgage Trust: (Continued) | | |
| Series 2014-K41,Cl. B, 3.831%, 11/25/471,3 | | | | $ | 2,365,000 | | | $ 2,158,610 | | |
| Series 2015-K44,Cl. B, 3.685%, 1/25/481,3 | | | | | 3,990,000 | | | 3,582,176 | | |
| Series 2015-K45,Cl. B, 3.591%, 4/25/481,3 | | | | | 3,011,000 | | | 2,702,956 | | |
| | |
| GAMMA Sociedade de Titularizacao de Creditos SA/Atlantes Mortgage plc, Series 2, Cl. A, 0.197%, 9/18/603 | | | | | 1,647,665 | | | 1,540,019 | | |
| | |
| GS Mortgage Securities Trust, Series 2014- GC22, Cl. D, 4.646%, 6/10/471,3 | | | | | 1,515,000 | | | 1,250,059 | | |
| | |
| GSR Mortgage Loan Trust, Series 2005-AR4, Cl. 6A1, 2.863%, 7/25/353 | | | | | 24,459 | | | 24,215 | | |
| | |
| JP Morgan Chase Commercial Mortgage Securities Corp., Series 2012-LC9, Cl. E, 4.42%, 12/15/471,3 | | | | | 500,000 | | | 462,043 | | |
| | |
| JP Morgan Chase Commercial Mortgage Securities Trust: | | |
| Series 2006-LDP8,Cl. AJ, 5.48%, 5/15/453 | | | | | 645,000 | | | 656,205 | | |
| Series 2013-C10,Cl. D, 4.156%, 12/15/473 | | | | | 4,527,000 | | | 4,021,249 | | |
| | |
| JP Morgan Mortgage Trust, Series 2007-A1, Cl. 5A1, 2.726%, 7/25/353 | | | | | 99,056 | | | 99,490 | | |
| | |
| JP Morgan Resecuritization Trust: | | |
| Series 2009-11,Cl. 5A1, 2.747%, 9/26/361,3 | | | | | 92,556 | | | 92,670 | | |
| Series 2009-5,Cl. 1A2, 2.738%, 7/26/361,3 | | | | | 5,123,253 | | | 4,588,605 | | |
| | |
| JPMBB Commercial Mortgage Securities Trust: | | |
| Series 2013-C14,Cl. D, 4.562%, 8/15/461,3 | | | | | 2,500,000 | | | 2,264,277 | | |
| Series 2013-C15,Cl. D, 5.081%, 11/15/451,3 | | | | | 1,245,000 | | | 1,151,212 | | |
| Series 2014-C21,Cl. D, 4.661%, 8/15/471,3 | | | | | 4,953,000 | | | 4,151,499 | | |
| Series 2014-C25,Cl. AS, 4.065%, 11/15/47 | | | | | 1,215,000 | | | 1,255,374 | | |
| Series 2014-C26,Cl. AS, 3.80%, 1/15/48 | | | | | 1,225,000 | | | 1,234,053 | | |
| | |
| Mansard Mortgages plc, Series 2006-1X, Cl. B1, 1.679%, 10/15/483 | | | | | 618,039 | | | 792,912 | | |
| | |
| Morgan Stanley Bank of America Merrill Lynch Trust: | | |
| Series 2012-C6,Cl. E, 4.657%, 11/15/451,3 | | | | | 705,000 | | | 677,769 | | |
| Series 2013-C12,Cl. D, 4.766%, 10/15/461,3 | | | | | 2,370,000 | | | 2,230,087 | | |
| Series 2013-C13,Cl. D, 4.894%, 11/15/461,3 | | | | | 570,000 | | | 538,554 | | |
| Series 2013-C7,Cl. D, 4.297%, 2/15/461,3 | | | | | 435,000 | | | 403,035 | | |
| Series 2013-C8,Cl. D, 4.169%, 12/15/481,3 | | | | | 185,000 | | | 170,436 | | |
| Series 2014-C14,Cl. B, 4.642%, 2/15/473 | | | | | 240,000 | | | 254,578 | | |
| Series 2014-C14,Cl. D, 4.832%, 2/15/471,3 | | | | | 5,060,000 | | | 4,738,646 | | |
| | |
| Morgan Stanley Capital I Trust, Series 2007- IQ13, Cl. AM, 5.406%, 3/15/44 | | | | | 695,000 | | | 713,975 | | |
| | |
| Morgan Stanley Re-Remic Trust, Series 2012-R3, Cl. 1A, 2.176%, 11/26/361,3 | | | | | 26,365 | | | 26,313 | | |
| | |
| Morgan Stanley Resecuritization Trust, Series 2013-R9, Cl. 3A, 2.402%, 6/26/461,3 | | | | | 251,236 | | | 252,459 | | |
| | |
| RALI Trust, Series 2005-QA4, Cl. A32, 3.156%, 4/25/353 | | | | | 23,961 | | | 2,227 | | |
| | |
| Structured Adjustable Rate Mortgage Loan Trust, Series 2004-10, Cl. 2A, 2.446%, 8/25/343 | | | | | 4,589,014 | | | 4,615,251 | | |
| | |
| Structured Agency Credit Risk Debt Nts.: | | |
| Series 2014-DN1,Cl. M2, 2.622%, 2/25/243 | | | | | 25,000 | | | 24,935 | | |
| Series 2014-DN4,Cl. M3, 4.972%, 10/25/243 | | | | | 4,980,000 | | | 4,946,561 | | |
| Series 2014-HQ2,Cl. M3, 4.172%, 9/25/243 | | | | | 5,430,000 | | | 5,047,257 | | |
| Series 2015-DN1,Cl. M3, 4.572%, 1/25/253 | | | | | 3,975,000 | | | 3,923,643 | | |
| Series 2015-DNA2,Cl. M2, 3.022%, 12/25/273 | | | | | 10,000 | | | 9,953 | | |
| Series 2015-DNA3,Cl. M3, 5.122%, 4/25/283 | | | | | 3,815,000 | | | 3,783,614 | | |
| | |
| UBS-Barclays Commercial Mortgage Trust: | | |
| Series 2012-C2,Cl. E, 4.888%, 5/10/631,3 | | | | | 1,025,000 | | | 994,442 | | |
| Series 2013-C5,Cl. D, 4.089%, 3/10/461,3 | | | | | 4,200,000 | | | 3,773,373 | | |
| | |
| WaMu Mortgage Pass-Through Certificates Trust, Series 2005-AR16, Cl. 1A1, 2.568%, 12/25/353 | | | | | 14,795 | | | 14,111 | | |
| | |
| Washington Mutual Mortgage Pass-Through Certificates Trust, Series 2007-OA3, Cl. 5A, 1.901%, 4/25/473 | | | | | 474,713 | | | 364,816 | | |
| | |
| Wells Fargo Mortgage-Backed Securities Trust: | | |
| Series 2005-AR1,Cl. 1A1, 2.662%, 2/25/353 | | | | | 1,825,004 | | | 1,831,635 | | |
| Series 2005-AR10,Cl. 1A1, 2.74%, 6/25/353 | | | | | 832,128 | | | 851,562 | | |
| Series 2005-AR15,Cl. 1A6, 2.736%, 9/25/353 | | | | | 3,593,273 | | | 3,434,042 | | |
| Series 2006-AR7,Cl. 2A4, 2.738%, 5/25/363 | | | | | 1,598,200 | | | 1,525,826 | | |
| Series 2007-AR3,Cl. A4, 5.809%, 4/25/373 | | | | | 925,771 | | | 902,012 | | |
| | | | | | | | |
| | | | | Principal Amount | | | Value |
|
| Commercial (Continued) |
|
| WF-RBS Commercial Mortgage Trust: |
| Series 2012-C10,Cl. D, 4.454%, 12/15/451,3 | | | | $ | 115,000 | | | $ 107,593 |
| Series 2012-C7,Cl. E, 4.838%, 6/15/451,3 | | | | | 180,000 | | | 174,510 |
| Series 2012-C8,Cl. E, 4.875%, 8/15/451,3 | | | | | 710,000 | | | 688,891 |
| Series 2013-C11,Cl. D, 4.179%, 3/15/451,3 | | | | | 441,000 | | | 410,127 |
|
| WF-RBS Commercial Mortgage Trust, Interest- Only Commercial Mtg. Pass-Through Certificates, Series 2011-C3, Cl. XA, 0.00%, 3/15/441,4,5 | | | | | 4,825,874 | | | 220,728 |
| | | | | | | | |
| | | | | | | | 142,440,489 |
|
| Multi-Family—0.2% | | | | | | | | |
|
| Wells Fargo Mortgage-Backed Securities Trust: |
| Series 2005-AR15,Cl. 1A2, 2.736%, 9/25/353 | | | | | 290,869 | | | 284,471 |
| Series 2006-AR2,Cl. 2A3, 2.763%, 3/25/363 | | | | | 3,103,828 | | | 3,066,415 |
| | | | | | | | |
| | | | | | | | 3,350,886 |
|
| Residential—0.8% | | | | | | | | |
|
| Alba plc, Series 2007-1, Cl. C, 0.875%, 3/17/393 | | | | | 2,305,000 | | | 2,894,001 |
|
| Bear Stearns ARM Trust, Series 2006-1, Cl. A1, 2.58%, 2/25/363 | | | | | 91,423 | | | 90,786 |
|
| CHL Mortgage Pass-Through Trust, Series 2005- J4, Cl. A7, 5.50%, 11/25/35 | | | | | 991,369 | | | 986,748 |
|
| Citigroup Mortgage Loan Trust, Inc.: |
| Series 2005-2,Cl. 1A3, 2.80%, 5/25/353 | | | | | 1,373,399 | | | 1,369,705 |
| Series 2005-3,Cl. 2A4, 2.80%, 8/25/353 | | | | | 2,324,897 | | | 1,979,978 |
|
| CWHEQ Revolving Home Equity Loan Trust: |
| Series 2005-G,Cl. 2A, 0.561%, 12/15/353 | | | | | 65,565 | | | 57,349 |
| Series 2006-H,Cl. 2A1A, 0.481%, 11/15/363 | | | | | 34,110 | | | 24,848 |
|
| Home Equity Mortgage Trust, Series 2005-1, Cl. M6, 5.863%, 6/25/353 | | | | | 496,555 | | | 504,161 |
|
| HomeBanc Mortgage Trust, Series 2005-3, Cl. A2, 0.732%, 7/25/353 | | | | | 11,356 | | | 10,678 |
|
| MASTR Asset Backed Securities Trust, Series 2006-WMC3, Cl. A3, 0.522%, 8/25/363 | | | | | 974,316 | | | 427,923 |
|
| NC Finance Trust, Series 1999-I, Cl. D, 8.75%, 1/25/292,7 | | | | | 66,744 | | | 16,686 |
|
| Paragon Secured Finance No 1 plc, Series 1, Cl. A, 0.973%, 11/15/353 | | | | | 1,545,528 | | | 2,211,063 |
|
| RALI Trust, Series 2006-QS13, Cl. 1A8, 6%, 9/25/36 | | | | | 21,290 | | | 17,186 |
|
| Residential Asset Securitization Trust, Series 2005-A6CB, Cl. A7, 6%, 6/25/35 | | | | | 2,703,098 | | | 2,597,956 |
|
| WaMu Mortgage Pass-Through Certificates Trust, Series 2003-AR10, Cl. A7, 2.535%, 10/25/333 | | | | | 110,035 | | | 112,630 |
|
| Wells Fargo Mortgage Backed Securities Trust: |
| Series 2005-AR13,Cl. 1A5, 2.74%, 5/25/353 | | | | | 331,180 | | | 333,545 |
| Series 2006-AR10,Cl. 5A5, 2.738%, 7/25/363 | | | | | 630,425 | | | 613,652 |
|
| Wells Fargo Mortgage-Backed Securities Trust: |
| Series 2005-AR4,Cl. 2A2, 2.683%, 4/25/353 | | | | | 16,959 | | | 17,078 |
| Series 2006-AR14,Cl. 1A2, 5.851%, 10/25/363 | | | | | 1,328,532 | | | 1,290,543 |
| Series 2006-AR8,Cl. 2A1, 2.744%, 4/25/363 | | | | | 6,232 | | | 6,105 |
| | | | | | | | |
| | | | | | | | 15,562,621 |
| | | | | | | | |
Total Mortgage-Backed Obligations (Cost $249,368,308) | | | | | | | | 250,889,834 |
| U.S. Government Obligations—1.8% |
| Federal Home Loan Mortgage Corp. Nts., 1%, 12/15/17 | | | | | 5,553,000 | | | 5,540,145 |
|
| United States Treasury Nts.: |
| 0.75%, 10/31/178 | | | | | 14,078,000 | | | 14,005,541 |
| 0.875%, 7/15/17 | | | | | 1,535,000 | | | 1,532,716 |
| 2.00%, 9/30/208,9,16 | | | | | 9,509,000 | | | 9,616,556 |
| 2.50%, 8/15/238 | | | | | 735,000 | | | 754,217 |
|
| United States Treasury Nts. Strips, 6.16%, 2/15/16 | | | | | 2,116,000 | | | 2,115,594 |
| | | | | | | | |
| Total U.S. Government Obligations (Cost $33,433,611) | | | | | | | | 33,564,769 |
11 OPPENHEIMER GLOBAL STRATEGIC INCOME FUND/VA
CONSOLIDATED STATEMENT OF INVESTMENTS Continued
| | | | | | | | | | | | |
| | | | | | Principal Amount | | | Value | | |
| Foreign Government Obligations—9.6% | | |
| Angola—0.0% | | | | | | | | | | | | |
| Republic of Angola Sr. Unsec. Bonds, 9.50%, 11/12/251 | | | | | | | $ 620,000 | | | $ 578,150 | | |
| |
| | |
| Brazil—0.6% | | | | | | | | | | | | |
| Brazil Minas SPE via State of Minas Gerais Sec. Bonds, 5.333%, 2/15/281 | | | | | | | 825,000 | | | 624,937 | | |
| | |
| Federative Republic of Brazil Nota Do Tesouro Nacional Unsec. Nts., 10%, 1/1/25 | | | BRL | | | | 50,975,000 | | | 9,212,189 | | |
| | | | | | | | | | | | |
| | | | | | | | | | 9,837,126 | | |
| |
| | |
| Colombia—0.4% | | | | | | | | | | | | |
| Republic of Colombia Sr. Unsec. Bonds: | | |
| 5.00%, 6/15/45 | | | | | | | 315,000 | | | 264,600 | | |
| 6.125%, 1/18/41 | | | | | | | 1,930,000 | | | 1,872,100 | | |
| Series B, 10.00%, 7/24/24 | | | COP | | | | 11,670,000,000 | | | 4,063,564 | | |
| | | | | | | | | | | | |
| | | | | | | | | | 6,200,264 | | |
| |
| | |
| Costa Rica—0.0% | | | | | | | | | | | | |
| Republic of Costa Rica Sr. Unsec. Bonds: | | |
| 4.25%, 1/26/231 | | | | | | | 500,000 | | | 440,000 | | |
| 7.158%, 3/12/451 | | | | | | | 350,000 | | | 294,437 | | |
| | | | | | | | | | | | |
| | | | | | | | | | 734,437 | | |
| |
| | |
| Croatia—0.2% | | | | | | | | | | | | |
| Republic of Croatia Sr. Unsec. Bonds: | | |
| 3.00%, 3/11/25 | | | EUR | | | | 770,000 | | | 764,359 | | |
| 6.00%, 1/26/241 | | | | | | | 1,160,000 | | | 1,211,261 | | |
| 6.75%, 11/5/191 | | | | | | | 775,000 | | | 832,079 | | |
| | |
| Republic of Croatia Sr. Unsec. Nts., 3.875%, 5/30/22 | | | EUR | | | | 1,235,000 | | | 1,348,011 | | |
| | | | | | | | | | | | |
| | | | | | | | | | 4,155,710 | | |
| |
| | |
| Dominican Republic—0.1% | | | | | |
| Banco de Reservas de la Republica Dominicana Sub. Nts., 7%, 2/1/231 | | | | | | | 605,000 | | | 596,370 | | |
| | |
| Dominican Republic Sr. Unsec. Bonds: | | |
| 5.50%, 1/27/251 | | | | | | | 400,000 | | | 387,000 | | |
| 5.875%, 4/18/241 | | | | | | | 155,000 | | | 155,000 | | |
| 6.60%, 1/28/241 | | | | | | | 445,000 | | | 465,025 | | |
| 6.85%, 1/27/451 | | | | | | | 995,000 | | | 942,762 | | |
| | | | | | | | | | | | |
| | | | | | | | | | 2,546,157 | | |
| |
| | |
| Egypt—0.0% | | | | | | | | | | | | |
| Arab Republic of Egypt Sr. Unsec. Bonds, 6.875%, 4/30/401 | | | | | | | 220,000 | | | 179,588 | | |
| |
| | |
| Hungary—0.7% | | | | | | | | | | | | |
| Hungary Sr. Unsec. Bonds: | | |
| 5.375%, 2/21/23 | | | | | | | 1,165,000 | | | 1,273,007 | | |
| 5.75%, 11/22/23 | | | | | | | 1,550,000 | | | 1,738,069 | | |
| | |
| Hungary Unsec. Bonds: | | | | | |
| Series 20/A, 7.50%, 11/12/20 | | | HUF | | | | 1,612,000,000 | | | 6,758,297 | | |
| Series 23/A, 6.00%, 11/24/23 | | | HUF | | | | 512,000,000 | | | 2,088,804 | | |
| | | | | | | | | | | | |
| | | | | | | | | | 11,858,177 | | |
| |
| | |
| India—1.8% | | | | | | | | | | | | |
| Indian Railway Finance Corp. Ltd. Sr. Unsec. Nts., 3.417%, 10/10/17 | | | | | | | 1,035,000 | | | 1,052,681 | | |
| | |
| Republic of India Sr. Unsec. Bonds, 8.40%, 7/28/24 | | | INR | | | | 1,219,000,000 | | | 19,031,095 | | |
| | |
| Republic of India Sr. Unsec. Nts., 8.27%, 6/9/20 | | | INR | | | | 839,000,000 | | | 13,003,931 | | |
| | | | | | | | | | | | |
| | | | | | | | | | 33,087,707 | | |
| |
| | |
| Indonesia—0.3% | | | | | | | | | | | | |
| Perusahaan Penerbit SBSN Indonesia III Sr. Unsec. Nts., 4%, 11/21/181 | | | | | | | 760,000 | | | 792,300 | | |
| | |
| Perusahaan Penerbit SBSN Indonesia III Unsec. Bonds, 4.35%, 9/10/241 | | | | | | | 500,000 | | | 480,460 | | |
| | | | | | | | | | | | |
| | | | | | Principal Amount | | | Value | |
| |
| Indonesia (Continued) | | | | | | | | | | | | |
| |
| Perusahaan Penerbit SBSN Indonesia III Unsec. Nts., 6.125%, 3/15/191 | | | | | | | $ 1,670,000 | | | | $ 1,828,650 | |
| |
| Republic of Indonesia Sr. Unsec. Bonds: | |
| 3.375%, 7/30/251 | | | EUR | | | | 250,000 | | | | 257,083 | |
| 4.125%, 1/15/251 | | | | | | | 315,000 | | | | 302,712 | |
| 5.125%, 1/15/451 | | | | | | | 1,575,000 | | | | 1,427,733 | |
| 5.875%, 3/13/201 | | | | | | | 315,000 | | | | 342,229 | |
| 5.95%, 1/8/461 | | | | | | | 310,000 | | | | 306,769 | |
| | | | | | | | | | | | |
| | | | | | | | | | | 5,737,936 | |
|
| |
| Iraq—0.0% | | | | | | | | | | | | |
| Republic of Iraq Unsec. Bonds, 5.80%, 1/15/281 | | | | | | | 385,000 | | | | 260,841 | |
|
| |
| Ivory Coast—0.1% | | | | | | | | | | | | |
| Republic of Cote d’Ivoire Sr. Unsec. Bonds: | |
| 5.75%, 12/31/323 | | | | | | | 1,490,000 | | | | 1,331,942 | |
| 6.375%, 3/3/281 | | | | | | | 715,000 | | | | 654,197 | |
| | | | | | | | | | | | |
| | | | | | | | | | | 1,986,139 | |
|
| |
| Jamaica—0.1% | | | | | | | | | | | | |
| Commonwealth of Jamaica Sr. Unsec. Bonds, 7.875%, 7/28/45 | | | | | | | 800,000 | | | | 780,000 | |
|
| |
| Kazakhstan—0.1% | | | | | | | | | | | | |
| Republic of Kazakhstan Sr. Unsec. Bonds, 4.875%, 10/14/441 | | | | | | | 2,740,000 | | | | 2,297,394 | |
|
| |
| Malaysia—0.0% | | | | | | | | | | | | |
| SSG Resources Ltd. Sr. Sec. Nts., 4.25%, 10/4/22 | | | | | | | 235,000 | | | | 235,109 | |
|
| |
| Mexico—2.1% | | | | | | | | | | | | |
| Banco Nacional de Comercio Exterior SNC Sr. Unsec. Nts., 4.375%, 10/14/251 | | | | | | | 610,000 | | | | 603,900 | |
| |
| United Mexican States Sr. Unsec. Bonds: | |
| 3.00%, 3/6/45 | | | EUR | | | | 1,135,000 | | | | 1,075,778 | |
| 4.00%, 10/2/23 | | | | | | | 1,295,000 | | | | 1,315,073 | |
| 4.00%, 3/15/2115 | | | EUR | | | | 750,000 | | | | 682,392 | |
| 10.00%, 12/5/24 | | | MXN | | | | 93,360,000 | | | | 6,832,758 | |
| |
| United Mexican States Unsec. Bonds, Series M20, 4.75%, 3/8/44 | | | | | | | 1,540,000 | | | | 1,406,790 | |
| |
| United Mexican States Unsec. Nts., Series M, 5%, 12/11/19 | | | MXN | | | | 446,600,000 | | | | 25,670,800 | |
| | | | | | | | | | | | |
| | | | | | | | | | | 37,587,491 | |
|
| |
| Morocco—0.1% | | | | | | | | | | | | |
| Kingdom of Morocco Sr. Unsec. Bonds: | |
| 4.25%, 12/11/221 | | | | | | | 960,000 | | | | 953,040 | |
| 5.50%, 12/11/421 | | | | | | | 1,065,000 | | | | 1,029,045 | |
| | | | | | | | | | | | |
| | | | | | | | | | | 1,982,085 | |
|
| |
| Namibia—0.1% | | | | | | | | | | | | |
| Republic of Namibia Sr. Unsec. Bonds, 5.25%, 10/29/251 | | | | | | | 1,260,000 | | | | 1,176,424 | |
|
| |
| Nigeria—0.0% | | | | | | | | | | | | |
| Federal Republic of Nigeria Sr. Unsec. Bonds, 6.75%, 1/28/211 | | | | | | | 230,000 | | | | 214,763 | |
| |
| Federal Republic of Nigeria Sr. Unsec. Nts., 5.125%, 7/12/181 | | | | | | | 385,000 | | | | 368,156 | |
| | | | | | | | | | | | |
| | | | | | | | | | | 582,919 | |
|
| |
| Panama—0.5% | | | | | | | | | | | | |
| Republic of Panama Sr. Unsec. Bonds: | |
| 3.75%, 3/16/25 | | | | | | | 1,765,000 | | | | 1,734,113 | |
| 4.00%, 9/22/24 | | | | | | | 840,000 | | | | 844,200 | |
| 5.20%, 1/30/20 | | | | | | | 3,490,000 | | | | 3,795,375 | |
| 6.70%, 1/26/36 | | | | | | | 850,000 | | | | 1,013,625 | |
| 9.375%, 4/1/29 | | | | | | | 800,000 | | | | 1,156,000 | |
| | | | | | | | | | | | |
| | | | | | | | | | | 8,543,313 | |
12 OPPENHEIMER GLOBAL STRATEGIC INCOME FUND/VA
| | | | | | | | | | | | |
| | | | | | Principal Amount | | | Value | | |
| Paraguay—0.1% | | |
| Republic of Paraguay Sr. Unsec. Bonds: | | |
| 4.625%, 1/25/231 | | | | | | | $ 1,640,000 | | | $ 1,599,000 | | |
| 6.10%, 8/11/441 | | | | | | | 780,000 | | | 748,800 | | |
| | | | | | | | | | | | |
| | | | | | | | | | 2,347,800 | | |
| |
| | |
| Peru—0.2% | | | | | | | | | | | | |
| Republic of Peru Sr. Unsec. Bonds: | | |
| 2.75%, 1/30/26 | | | EUR | | | | 1,135,000 | | | 1,227,294 | | |
| 4.125%, 8/25/27 | | | | | | | 740,000 | | | 728,900 | | |
| 5.625%, 11/18/50 | | | | | | | 785,000 | | | 802,662 | | |
| | | | | | | | | | | | |
| | | | | | | | | | 2,758,856 | | |
| |
| | |
| Romania—0.8% | | | | | | | | | | | | |
| Romania Sr. Unsec. Bonds: | | |
| 2.75%, 10/29/251 | | | EUR | | | | 3,320,000 | | | 3,664,078 | | |
| 3.875%, 10/29/351 | | | EUR | | | | 2,630,000 | | | 2,902,405 | | |
| 4.375%, 8/22/231 | | | | | | | 3,320,000 | | | 3,463,092 | | |
| 4.875%, 1/22/241 | | | | | | | 1,315,000 | | | 1,414,809 | | |
| 6.125%, 1/22/441 | | | | | | | 1,915,000 | | | 2,245,338 | | |
| | | | | | | | | | | | |
| | | | | | | | | | 13,689,722 | | |
| |
| | |
| Serbia—0.1% | | | | | | | | | | | | |
| Republic of Serbia Sr. Unsec. Nts., 5.25%, 11/21/171 | | | | | | | 565,000 | | | 587,851 | | |
| | |
| Republic of Serbia Unsec. Nts., 5.875%, 12/3/181 | | | | | | | 1,190,000 | | | 1,255,153 | | |
| | | | | | | | | | | | |
| | | | | | | | | | 1,843,004 | | |
| |
| | |
| South Africa—0.6% | | | | | | | | | | | | |
| Republic of South Africa Sr. Unsec. Bonds, Series R208, 6.75%, 3/31/21 | | | ZAR | | | | 61,300,000 | | | 3,553,993 | | |
| | |
| Republic of South Africa Unsec. Bonds: | | |
| Series 2023, 7.75%, 2/28/23 | | | ZAR | | | | 50,000,000 | | | 2,938,121 | | |
| Series R186, 10.50%, 12/21/26 | | | ZAR | | | | 66,200,000 | | | 4,526,766 | | |
| | | | | | | | | | | | |
| | | | | | | | | | 11,018,880 | | |
| |
| | |
| Sri Lanka—0.1% | | | | | | | | | | | | |
| Democratic Socialist Republic of Sri Lanka Sr. Unsec. Bonds: | | |
| 5.875%, 7/25/221 | | | | | | | 800,000 | | | 732,795 | | |
| 6.25%, 10/4/201 | | | | | | | 175,000 | | | 169,574 | | |
| 6.85%, 11/3/251 | | | | | | | 385,000 | | | 364,105 | | |
| | |
Democratic Socialist Republic of Sri Lanka Sr. Unsec. Nts., 6%, 1/14/191 | | | | | | | 425,000 | | | 418,012 | | |
| | | | | | | | | | | | |
| | | | | | | | | | 1,684,486 | | |
| |
| | |
| Ukraine—0.2% | | | | | | | | | | | | |
| Ukraine Unsec. Nts., 7.75%, 9/1/1915 | | | | | | | 4,000,000 | | | 3,722,320 | | |
| |
| | |
| United Arab Emirates—0.0% | | | | | |
| Emirate of Dubai Sr. Unsec. International Bonds, 5.25%, 1/30/43 | | | | | | | 505,000 | | | 428,452 | | |
| |
| | |
| Uruguay—0.2% | | | | | | | | | | | | |
| Oriental Republic of Uruguay Sr. Unsec. Bonds, 5.10%, 6/18/50 | | | | | | | 4,705,000 | | | 4,069,825 | | |
| |
| | |
| Vietnam—0.1% | | | | | | | | | | | | |
| Socialist Republic of Vietnam Sr. Unsec. Bonds, 4.80%, 11/19/241 | | | | | | | 1,400,000 | | | 1,353,282 | | |
| | | | | | | | | | | | |
Total Foreign Government Obligations (Cost $190,659,559) | | | | | | | | | | 173,263,594 | | |
| Corporate Loans—0.9% | | |
| Affinion Group, Inc., Sr. Sec. Credit Facilities 1st Lien Term Loan, 6.75%, 4/30/183 | | | | | | | 789,316 | | | 731,104 | | |
| | |
| Asurion LLC, Sr. Sec. Credit Facilities 2nd Lien Term Loan, 8.50%, 3/3/213 | | | | | | | 3,645,247 | | | 3,128,078 | | |
| | |
| Caesars Entertainment Operating Co., Inc., Sr. Sec. Credit Facilities 1st Lien Term Loan, 9.75%, 1/29/183,17 | | | | | | | 1,084,550 | | | 906,955 | | |
| | | | | | | | | | | | |
| | | | | | | | | | | | |
| | | | | | | | | | | | |
| | | | | | | | | | | | |
| | | | | | | | | | | | |
| | | | | | | | | | | | |
| | | | | | | | | | | | |
| | | | | | | | | | | | |
| | | | | | | | | | | | |
| | | | | | | | | | | | |
| | | | | | | | | | | | |
| | | | | | | | | | | | |
| | | | | | Principal Amount | | | Value | |
| |
| Corporate Loans (Continued) | |
| |
| Caesars Entertainment Resort Properties LLC, Sr. Sec. Credit Facilities 1st Lien Term Loan, 7.00%, 10/11/203,6 | | | | | | | $ 950,711 | | | | $ 865,741 | |
| |
| Caesars Growth Properties Holdings LLC, Sr. Sec. Credit Facilities 1st Lien Term Loan, 6.25%, 5/10/213,6 | | | | | | | 2,665 | | | | 2,354 | |
| |
| Clear Channel Communications, Inc., Extended Sr. Sec. Credit Facilities 1st Lien Term Loan, 7.174%, 1/30/193 | | | | | | | 4,873,532 | | | | 3,435,840 | |
| |
| Clear Channel Communications, Inc., Sr. Sec. Credit Facilities 1st Lien Term Loan, 7.924%, 7/30/193 | | | | | | | 926,326 | | | | 653,832 | |
| |
| Deluxe Entertainment Services, Sr. Sec. Credit Facilities 1st Lien Term Loan, 6.50%, 2/26/203 | | | | | | | 271,576 | | | | 259,355 | |
| |
| Entegra TC LLC, Sr. Sec. Credit Facilities Exit 3rd Lien Term Loan, 8.973%, 10/3/203,10 | | | | | | | 1,730,270 | | | | 1,706,478 | |
| |
| iStar Financial, Inc., Sr. Sec. Credit Facilities 1st Lien Term Loan, 7.00%, 3/19/173 | | | | | | | 790,589 | | | | 794,542 | |
| |
| NTELOS, Inc., Sr. Sec. Credit Facilities 1st Lien Term Loan, 5.75%, 11/9/193 | | | | | | | 236,062 | | | | 234,881 | |
| |
| Orchard Acquisition Co. LLC, Sr. Sec. Credit Facilities 1st Lien Term Loan, 7.00%, 2/8/193 | | | | | | | 300,970 | | | | 224,222 | |
| |
| Quicksilver Resources, Inc., Sr. Sec. Credit Facilities 2nd Lien Term Loan, 7.00%, 6/21/193,7 | | | | | | | 4,151,000 | | | | 1,037,750 | |
| |
| Revel Entertainment, Inc., Sr. Sec. Credit Facilities 2nd Lien Exit Term Loan, 14.50%, 5/20/183,7,10 | | | | | | | 1,490,134 | | | | 7,452 | |
| |
| Sabine Oil & Gas Corp., Sr. Sec. Credit Facilities 2nd Lien Term Loan, 8.75%, 12/31/183,7 | | | | | | | 1,485,000 | | | | 37,125 | |
| |
| TWCC Holding Corp., Sr. Sec. Credit Facilities 2nd Lien Term Loan, 7.00%, 6/26/203 | | | | | | | 1,950,000 | | | | 1,946,954 | |
| | | | | | | | | | | | |
Total Corporate Loans (Cost $24,172,776) | | | | | | | | | | | 15,972,663 | |
| |
| Corporate Bonds and Notes—53.4% | |
| |
| Consumer Discretionary—10.3% | | | | | |
| |
| Auto Components—1.3% | | | | | |
| |
| Affinia Group, Inc., 7.75% Sr. Unsec. Nts., 5/1/21 | | | | | | | 1,970,000 | | | | 2,014,916 | |
| |
| BorgWarner, Inc., 4.375% Sr. Unsec. Nts., 3/15/45 | | | | | | | 192,000 | | | | 171,925 | |
| |
| Gates Global LLC/Gates Global Co., 6% Sr. Unsec. Nts., 7/15/221 | | | | | | | 3,805,000 | | | | 2,758,625 | |
| |
| GKN Holdings plc: | |
| 5.375% Sr. Unsec. Nts., 9/19/22 | | | GBP | | | | 970,000 | | | | 1,566,661 | |
| 6.75% Sr. Unsec. Nts., 10/28/19 | | | GBP | | | | 1,780,000 | | | | 2,968,134 | |
| |
| Goodyear Tire & Rubber Co. (The): | |
| 5.125% Sr. Unsec. Nts., 11/15/23 | | | | | | | 1,815,000 | | | | 1,869,450 | |
| 7.00% Sr. Unsec. Nts., 5/15/22 | | | | | | | 745,000 | | | | 800,875 | |
| |
| Icahn Enterprises LP/Icahn Enterprises Finance Corp., 5.875% Sr. Unsec. Nts., 2/1/22 | | | | | | | 4,035,000 | | | | 3,959,344 | |
| |
| Lear Corp., 4.75% Sr. Unsec. Nts., 1/15/23 | | | | | | | 2,925,000 | | | | 2,954,250 | |
| |
| MPG Holdco I, Inc., 7.375% Sr. Unsec. Nts., 10/15/22 | | | | | | | 3,675,000 | | | | 3,730,125 | |
| |
| Schaeffler Finance BV, 4.75% Sr. Sec. Nts., 5/15/231 | | | | | | | 135,000 | | | | 132,975 | |
| | | | | | | | | | | | |
| | | | | | | | | | | 22,927,280 | |
| |
| Automobiles—0.5% | | | | | |
| |
| Daimler Finance North America LLC: | |
| 3.875% Sr. Unsec. Nts., 9/15/21 | | | | | | | 110,000 | | | | 114,357 | |
| 8.50% Sr. Unsec. Unsub. Nts., 1/18/31 | | | | | | | 322,000 | | | | 467,653 | |
13 OPPENHEIMER GLOBAL STRATEGIC INCOME FUND/VA
CONSOLIDATED STATEMENT OF INVESTMENTS Continued
| | | | | | | | | | | | |
| | | | | | Principal Amount | | | Value | | |
| Automobiles (Continued) | | | | | |
| Ford Motor Co., 4.75% Sr. Unsec. Nts., 1/15/43 | | | | | | | $ 1,871,000 | | | $ 1,770,134 | | |
| | |
| Ford Motor Credit Co. LLC, 3.664% Sr. Unsec. Nts., 9/8/24 | | | | | | | 1,358,000 | | | 1,323,985 | | |
| | |
| General Motors Co.: | | |
| 5.00% Sr. Unsec. Nts., 4/1/35 | | | | | | | 2,265,000 | | | 2,117,598 | | |
| 6.25% Sr. Unsec. Nts., 10/2/43 | | | | | | | 615,000 | | | 651,102 | | |
| | |
| General Motors Financial Co., Inc., 3% Sr. Unsec. Nts., 9/25/17 | | | | | | | 616,000 | | | 618,605 | | |
| | |
| Harley-Davidson, Inc., 4.625% Sr. Unsec. Nts., 7/28/45 | | | | | | | 155,000 | | | 152,337 | | |
| | |
| Hyundai Capital America, 2.40% Sr. Unsec. Nts., 10/30/181 | | | | | | | 624,000 | | | 622,373 | | |
| | |
| Jaguar Land Rover Automotive plc, 5.625% Sr. Unsec. Nts., 2/1/231 | | | | | | | 220,000 | | | 223,025 | | |
| | |
| ZF North America Capital, Inc., 4.50% Sr. Unsec. Nts., 4/29/221 | | | | | | | 1,095,000 | | | 1,074,469 | | |
| | | | | | | | | | | | |
| | | | | | | | | | 9,135,638 | | |
| | |
| Distributors—0.1% | | |
| | |
LKQ Corp., 4.75% Sr. Unsec. Nts., 5/15/23 | | | | | | | 2,172,000 | | | 2,047,110 | | |
| | |
| Hotels, Restaurants & Leisure—2.2% | | |
| | |
| 1011778 B.C. ULC/New Red Finance, Inc., 6% Sec. Nts., 4/1/221 | | | | | | | 2,285,000 | | | 2,359,262 | | |
| | |
| Boyd Gaming Corp., 6.875% Sr. Unsec. Nts., 5/15/23 | | | | | | | 1,400,000 | | | 1,445,500 | | |
| | |
| Caesars Entertainment Resort Properties LLC, 11% Sec. Nts., 10/1/21 | | | | | | | 1,725,000 | | | 1,569,750 | | |
| | |
| Caesars Growth Properties Holdings LLC/Caesars Growth Properties Finance, Inc., 9.375% Sec. Nts., 5/1/22 | | | | | | | 830,000 | | | 684,750 | | |
| | |
| Carnival Corp., 1.20% Sr. Unsec. Nts., 2/5/16 | | | | | | | 524,000 | | | 524,173 | | |
| | |
| Churchill Downs, Inc., 5.375% Sr. Unsec. Nts., 12/15/21 | | | | | | | 1,650,000 | | | 1,662,375 | | |
| | |
| Greektown Holdings LLC/Greektown Mothership Corp., 8.875% Sr. Sec. Nts., 3/15/191 | | | | | | | 3,150,000 | | | 3,197,250 | | |
| | |
| International Game Technology plc, 6.25% Sr. Sec. Nts., 2/15/221 | | | | | | | 2,100,000 | | | 1,974,000 | | |
| | |
| Isle of Capri Casinos, Inc., 5.875% Sr. Unsec. Nts., 3/15/21 | | | | | | | 970,000 | | | 994,250 | | |
| | |
| Landry’s, Inc., 9.375% Sr. Unsec. Nts., 5/1/201 | | | | | | | 4,315,000 | | | 4,563,112 | | |
| | |
| Marriott International, Inc.: | | |
| 3.25% Sr. Unsec. Nts., 9/15/22 | | | | | | | 388,000 | | | 384,297 | | |
| 6.375% Sr. Unsec. Nts., 6/15/17 | | | | | | | 561,000 | | | 599,844 | | |
| | |
| McDonald’s Corp.: | | |
| 2.75% Sr. Unsec. Nts., 12/9/20 | | | | | | | 274,000 | | | 274,178 | | |
| 4.875% Sr. Unsec. Nts., 12/9/45 | | | | | | | 1,104,000 | | | 1,114,282 | | |
| | |
| MCE Finance Ltd., 5% Sr. Unsec. Nts., 2/15/211 | | | | | | | 2,465,000 | | | 2,255,475 | | |
| | |
| Merlin Entertainments plc, 2.75% Sr. Unsec. Nts., 3/15/221 | | | EUR | | | | 2,215,000 | | | 2,359,360 | | |
| | |
| MGM Resorts International: | | |
| 6.00% Sr. Unsec. Nts., 3/15/23 | | | | | | | 1,250,000 | | | 1,243,750 | | |
| 6.625% Sr. Unsec. Nts., 12/15/21 | | | | | | | 2,100,000 | | | 2,160,375 | | |
| 6.75% Sr. Unsec. Nts., 10/1/20 | | | | | | | 1,650,000 | | | 1,703,625 | | |
| | |
| NCL Corp. Ltd., 5.25% Sr. Unsec. Nts., 11/15/191 | | | | | | | 1,030,000 | | | 1,050,600 | | |
| | |
| PF Chang’s China Bistro, Inc., 10.25% Sr. Unsec. Nts., 6/30/201 | | | | | | | 1,340,000 | | | 1,105,500 | | |
| | |
| Pinnacle Entertainment, Inc., 6.375% Sr. Unsec. Nts., 8/1/21 | | | | | | | 1,670,000 | | | 1,763,938 | | |
| | |
| Premier Cruises Ltd., 11% Sr. Unsec. Nts., 3/15/082,7 | | | | | | | 250,000 | | | — | | |
| | | | | | | | | | | | |
| | | | | | Principal Amount | | | Value | |
| |
| Hotels, Restaurants & Leisure (Continued) | |
| |
| Sugarhouse HSP Gaming Prop Mezz LP/Sugarhouse HSP Gaming Finance Corp., 6.375% Sr. Sec. Nts., 6/1/211 | | | | | | | $ 1,250,000 | | | | $ 1,168,750 | |
| |
| Viking Cruises Ltd., 8.50% Sr. Unsec. Nts., 10/15/221 | | | | | | | 2,135,000 | | | | 2,033,588 | |
| |
| Wyndham Worldwide Corp., 2.95% Sr. Unsec. Nts., 3/1/17 | | | | | | | 590,000 | | | | 593,761 | |
| | | | | | | | | | | | |
| | | | | | | | | | | 38,785,745 | |
| |
| Household Durables—0.6% | |
| |
| Arcelik AS, 5% Sr. Unsec. Nts., 4/3/231 | | | | | | | 435,000 | | | | 397,953 | |
| |
| Jarden Corp.: | |
| 5.00% Sr. Unsec. Nts., 11/15/231 | | | | | | | 853,000 | | | | 876,457 | |
| 6.125% Sr. Unsec. Nts., 11/15/22 | | | | | | | 1,080,000 | | | | 1,115,775 | |
| |
| KB Home: | |
| 7.00% Sr. Unsec. Nts., 12/15/21 | | | | | | | 1,965,000 | | | | 1,947,806 | |
| 7.625% Sr. Unsec. Nts., 5/15/23 | | | | | | | 2,805,000 | | | | 2,783,963 | |
| |
| Lennar Corp.: | |
| 4.75% Sr. Unsec. Nts., 11/15/22 | | | | | | | 400,000 | | | | 398,600 | |
| 4.75% Sr. Unsec. Nts., 5/30/25 | | | | | | | 1,808,000 | | | | 1,776,360 | |
| |
| Meritage Homes Corp., 7.15% Sr. Unsec. Nts., 4/15/20 | | | | | | | 770,000 | | | | 814,275 | |
| |
| Newell Rubbermaid, Inc., 2.15% Sr. Unsec. Nts., 10/15/18 | | | | | | | 386,000 | | | | 373,880 | |
| |
| Toll Brothers Finance Corp., 4.375% Sr. Unsec. Nts., 4/15/23 | | | | | | | 589,000 | | | | 574,275 | |
| |
| Whirlpool Corp., 1.65% Sr. Unsec. Nts., 11/1/17 | | | | | | | 280,000 | | | | 278,671 | |
| | | | | | | | | | | | |
| | | | | | | | | | | 11,338,015 | |
| |
| Leisure Equipment & Products—0.0% | |
| |
Mattel, Inc., 1.70% Sr. Unsec. Nts., 3/15/18 | | | | | | | 647,000 | | | | 638,848 | |
| |
| Media—3.6% | |
| |
| 21st Century Fox America, Inc., 6.15% Sr. Unsec. Nts., 2/15/41 | | | | | | | 223,000 | | | | 251,545 | |
| |
| Altice Financing SA, 6.50% Sec. Nts., 1/15/221 | | | | | | | 4,035,000 | | | | 4,004,737 | |
| |
| Altice Finco SA, 8.125% Sec. Nts., 1/15/241 | | | | | | | 1,490,000 | | | | 1,445,300 | |
| |
| Altice Luxembourg SA, 7.25% Sr. Sec. Nts., 5/15/221 | | | EUR | | | | 3,980,000 | | | | 4,059,780 | |
| |
| Belo Corp., 7.75% Sr. Unsec. Nts., 6/1/27 | | | | | | | 2,802,000 | | | | 2,970,120 | |
| |
| CCO Safari II LLC: | |
| 4.908% Sr. Sec. Nts., 7/23/251 | | | | | | | 1,677,000 | | | | 1,677,884 | |
| 6.484% Sr. Sec. Nts., 10/23/451 | | | | | | | 1,502,000 | | | | 1,506,464 | |
| |
| CCOH Safari LLC, 5.75% Sr. Unsec. Nts., 2/15/261 | | | | | | | 1,135,000 | | | | 1,140,675 | |
| |
| Comcast Corp., 4.65% Sr. Unsec. Unsub. Nts., 7/15/42 | | | | | | | 376,000 | | | | 383,471 | |
| |
| DISH DBS Corp.: | |
| 5.875% Sr. Unsec. Nts., 11/15/24 | | | | | | | 5,915,000 | | | | 5,279,137 | |
| 6.75% Sr. Unsec. Nts., 6/1/21 | | | | | | | 925,000 | | | | 934,250 | |
| |
| DreamWorks Animation SKG, Inc., 6.875% Sr. Unsec. Nts., 8/15/201 | | | | | | | 1,260,000 | | | | 1,247,400 | |
| |
| Entercom Radio LLC, 10.50% Sr. Unsec. Nts., 12/1/19 | | | | | | | 1,125,000 | | | | 1,170,000 | |
| |
| Gannett Co., Inc., 5.50% Sr. Unsec. Nts., 9/15/241 | | | | | | | 1,680,000 | | | | 1,684,200 | |
| |
| Gray Television, Inc., 7.50% Sr. Unsec. Nts., 10/1/20 | | | | | | | 570,000 | | | | 587,812 | |
| |
| iHeartCommunications, Inc., 9% Sr. Sec. Nts., 12/15/19 | | | | | | | 875,000 | | | | 650,781 | |
| |
| Interpublic Group of Cos., Inc. (The), 4.20% Sr. Unsec. Nts., 4/15/24 | | | | | | | 296,000 | | | | 293,834 | |
| |
| LIN Television Corp., 6.375% Sr. Unsec. Nts., 1/15/21 | | | | | | | 2,245,000 | | | | 2,360,056 | |
14 OPPENHEIMER GLOBAL STRATEGIC INCOME FUND/VA
| | | | | | | | | | |
| | | | | Principal Amount | | | Value | |
| |
| Media (Continued) | | | | | | | | | | |
| |
| Nexstar Broadcasting, Inc.: | | | | | |
| 6.125% Sr. Unsec. Nts., 2/15/221 | | | | $ | 1,280,000 | | | $ | 1,257,600 | |
| 6.875% Sr. Unsec. Nts., 11/15/20 | | | | | 1,310,000 | | | | 1,344,387 | |
| |
| Numericable SFR SAS, 6% Sr. Sec. Nts., 5/15/221 | | | | | 4,220,000 | | | | 4,103,950 | |
| |
| Scripps Networks Interactive, Inc., 2.70% Sr. Unsec. Nts., 12/15/16 | | | | | 591,000 | | | | 595,352 | |
| |
| Sinclair Television Group, Inc.: | | | | | |
| 5.625% Sr. Unsec. Nts., 8/1/241 | | | | | 2,330,000 | | | | 2,274,663 | |
| 6.125% Sr. Unsec. Nts., 10/1/22 | | | | | 2,410,000 | | | | 2,470,250 | |
| |
| Sky plc, 3.75% Sr. Unsec. Nts., 9/16/241 | | | | | 321,000 | | | | 314,270 | |
| |
| Thomson Reuters Corp., 1.65% Sr. Unsec. Nts., 9/29/17 | | | | | 628,000 | | | | 625,070 | |
| |
| Time Warner Cable, Inc., 4.50% Sr. Unsec. Unsub. Nts., 9/15/42 | | | | | 438,000 | | | | 344,913 | |
| |
| Time Warner, Inc., 4.65% Sr. Unsec. Nts., 6/1/44 | | | | | 2,334,000 | | | | 2,148,935 | |
| |
| Tribune Media Co., 5.875% Sr. Unsec. Nts., 7/15/221 | | | | | 965,000 | | | | 967,413 | |
| |
| Univision Communications, Inc., 5.125% Sr. Sec. Nts., 2/15/251 | | | | | 1,135,000 | | | | 1,081,088 | |
| |
| UPC Holding BV, 6.75% Sr. Unsec. Nts., 3/15/231 | | EUR | | | 3,890,000 | | | | 4,570,469 | |
| |
| UPCB Finance VI Ltd., 6.875% Sr. Sec. Nts., 1/15/221 | | | | | 1,552,500 | | | | 1,647,591 | |
| |
| Viacom, Inc., 3.50% Sr. Unsec. Nts., 4/1/17 | | | | | 248,000 | | | | 252,488 | |
| |
| Virgin Media Finance plc, 7% Sr. Unsec. Nts., 4/15/23 | | GBP | | | 1,390,000 | | | | 2,163,648 | |
| |
| Virgin Media Secured Finance plc: | | | | | |
| 5.25% Sr. Sec. Nts., 1/15/261 | | | | | 625,000 | | | | 609,375 | |
| 6.00% Sr. Sec. Nts., 4/15/21 | | GBP | | | 3,712,500 | | | | 5,678,751 | |
| |
| VTR Finance BV, 6.875% Sr. Sec. Nts., 1/15/241 | | | | | 405,000 | | | | 373,613 | |
| | | | | | | | | | |
| | | | | | | | | 64,471,272 | |
| |
| Multiline Retail—0.3% | | | | | |
| |
| Dollar Tree, Inc., 5.75% Sr. Sec. Nts., 3/1/231 | | | | | 4,400,000 | | | | 4,609,000 | |
| |
| Kohl’s Corp., 5.55% Sr. Unsec. Nts., 7/17/45 | | | | | 187,000 | | | | 174,657 | |
| |
| Neiman Marcus Group Ltd., Inc., 8.75% Sr. Unsec. Nts., 10/15/211,10 | | | | | 1,325,000 | | | | 828,125 | |
| | | | | | | | | | |
| | | | | | | | | 5,611,782 | |
| |
| Specialty Retail—1.1% | | | | | | | | |
| |
| Apex Tool Group LLC, 7% Sr. Unsec. Nts., 2/1/211 | | | | | 4,035,000 | | | | 3,127,125 | |
| |
| Best Buy Co., Inc., 5.50% Sr. Unsec. Nts., 3/15/21 | | | | | 601,000 | | | | 622,786 | |
| |
| CST Brands, Inc., 5% Sr. Unsec. Nts., 5/1/23 | | | | | 1,255,000 | | | | 1,248,725 | |
| |
| GameStop Corp., 5.50% Sr. Unsec. Nts., 10/1/191 | | | | | 2,540,000 | | | | 2,511,425 | |
| |
| Home Depot, Inc. (The), 4.875% Sr. Unsec. Nts., 2/15/44 | | | | | 197,000 | | | | 217,465 | |
| |
| L Brands, Inc.: | | | | | | | | | | |
| 6.625% Sr. Unsec. Nts., 4/1/21 | | | | | 2,705,000 | | | | 3,009,313 | |
| 6.875% Sr. Unsec. Nts., 11/1/351 | | | | | 1,595,000 | | | | 1,644,844 | |
| |
| Lowe’s Cos, Inc., 4.375% Sr. Unsec. Nts., 9/15/45 | | | | | 1,616,000 | | | | 1,665,147 | |
| |
| Men’s Wearhouse, Inc. (The), 7% Sr. Unsec. Nts., 7/1/22 | | | | | 580,000 | | | | 417,600 | |
| |
| Michaels Stores, Inc., 5.875% Sr. Sub. Nts., 12/15/201 | | | | | 1,255,000 | | | | 1,298,925 | |
| |
| Ross Stores, Inc., 3.375% Sr. Unsec. Nts., 9/15/24 | | | | | 555,000 | | | | 547,336 | |
| |
| Sally Holdings LLC/Sally Capital, Inc., 5.75% Sr. Unsec. Nts., 6/1/22 | | | | | 2,760,000 | | | | 2,870,400 | |
| | | | | | | | | | |
| | | | | Principal Amount | | | Value | |
| |
| Specialty Retail (Continued) | |
| |
| Signet UK Finance plc, 4.70% Sr. Unsec. Nts., 6/15/24 | | | | $ | 290,000 | | | $ | 286,211 | |
| |
| Toys R US Property Co. II LLC, 8.50% Sr. Sec. Nts., 12/1/17 | | | | | 660,000 | | | | 570,900 | |
| | | | | | | | | | |
| | | | | | | | | 20,038,202 | |
| |
| Textiles, Apparel & Luxury Goods—0.6% | |
| |
| Levi Strauss & Co.: | | | | | | | | |
| 5.00% Sr. Unsec. Nts., 5/1/25 | | | | | 2,090,000 | | | | 2,090,000 | |
| 6.875% Sr. Unsec. Nts., 5/1/22 | | | | | 465,000 | | | | 499,875 | |
| |
| New Look Secured Issuer plc, 6.50% Sr. Sec. Nts., 7/1/221 | | GBP | | | 1,525,000 | | | | 2,236,941 | |
| |
| PVH Corp., 4.50% Sr. Unsec. Unsub. Nts., 12/15/22 | | | | | 2,199,000 | | | | 2,160,517 | |
| |
| Springs Industries, Inc., 6.25% Sr. Sec. Nts., 6/1/21 | | | | | 3,060,000 | | | | 3,044,700 | |
| |
| William Carter Co., 5.25% Sr. Unsec. Nts., 8/15/21 | | | | | 825,000 | | | | 851,813 | |
| | | | | | | | | | |
| | | | | | | | | 10,883,846 | |
| |
Consumer Staples—2.0% | | | | | |
| |
| Beverages—0.2% | | | | | |
| |
| Anheuser-Busch InBev Worldwide, Inc., 8.20% Sr. Unsec. Unsub. Nts., 1/15/39 | | | | | 390,000 | | | | 562,824 | |
| |
| Beam Suntory, Inc., 1.875% Sr. Unsec. Nts., 5/15/17 | | | | | 305,000 | | | | 305,428 | |
| |
| Constellation Brands, Inc., 4.75% Sr. Unsec. Nts., 11/15/24 | | | | | 1,660,000 | | | | 1,697,350 | |
| |
| Pernod Ricard SA, 4.25% Sr. Unsec. Nts., 7/15/221 | | | | | 387,000 | | | | 398,097 | |
| | | | | | | | | | |
| | | | | | | | | 2,963,699 | |
| |
| Food & Staples Retailing—0.7% | | | | | |
| |
| Cencosud SA, 5.15% Sr. Unsec. Nts., 2/12/251 | | | | | 1,380,000 | | | | 1,285,217 | |
| |
| CVS Health Corp.: | | | | | | | | | | |
| 5.125% Sr. Unsec. Nts., 7/20/45 | | | | | 1,845,000 | | | | 1,951,080 | |
| 5.30% Sr. Unsec. Nts., 12/5/43 | | | | | 146,000 | | | | 158,724 | |
| |
| Delhaize Group: | | | | | | | | | | |
| 5.70% Sr. Unsec. Nts., 10/1/40 | | | | | 261,000 | | | | 269,243 | |
| 6.50% Sr. Unsec. Nts., 6/15/17 | | | | | 70,000 | | | | 74,054 | |
| |
| Ingles Markets, Inc., 5.75% Sr. Unsec. Nts., 6/15/23 | | | | | 2,055,000 | | | | 2,060,138 | |
| |
| Kroger Co. (The): | | | | | | | | | | |
| 6.40% Sr. Unsec. Nts., 8/15/17 | | | | | 559,000 | | | | 600,523 | |
| 6.90% Sr. Unsec. Nts., 4/15/38 | | | | | 150,000 | | | | 185,915 | |
| |
| Omnicare, Inc., 4.75% Sr. Unsec. Nts., 12/1/22 | | | | | 1,765,000 | | | | 1,894,136 | |
| |
| Rite Aid Corp.: | | | | | | | | | | |
| 6.125% Sr. Unsec. Nts., 4/1/231 | | | | | 2,100,000 | | | | 2,181,375 | |
| 6.75% Sr. Unsec. Nts., 6/15/21 | | | | | 1,835,000 | | | | 1,926,750 | |
| |
| Wal-Mart Stores, Inc., 4.30% Sr. Unsec. Nts., 4/22/44 | | | | | 479,000 | | | | 489,581 | |
| | | | | | | | | | |
| | | | | | | | | 13,076,736 | |
| |
| Food Products—0.7% | | | | | | | | |
| |
| Bunge Ltd. Finance Corp.: | |
| 3.20% Sr. Unsec. Nts., 6/15/17 | | | | | 615,000 | | | | 621,269 | |
| 8.50% Sr. Unsec. Nts., 6/15/19 | | | | | 400,000 | | | | 463,725 | |
| |
| Chiquita Brands International, Inc./Chiquita Brands LLC, 7.875% Sr. Sec. Nts., 2/1/21 | | | | | 1,029,000 | | | | 1,081,736 | |
| |
| ConAgra Foods, Inc., 4.65% Sr. Unsec. Nts., 1/25/43 | | | | | 196,000 | | | | 175,464 | |
| |
| Dean Foods Co., 6.50% Sr. Unsec. Nts., 3/15/231 | | | | | 1,920,000 | | | | 2,001,600 | |
| |
| Ingredion, Inc., 1.80% Sr. Unsec. Nts., 9/25/17 | | | | | 635,000 | | | | 629,510 | |
15 OPPENHEIMER GLOBAL STRATEGIC INCOME FUND/VA
CONSOLIDATED STATEMENT OF INVESTMENTS Continued
| | | | | | | | |
| | | | | Principal Amount | | Value | | |
| | |
| Food Products (Continued) | | | | |
| | |
| JM Smucker Co. (The), 1.75% Sr. Unsec. Nts., 3/15/18 | | | | $ 498,000 | | $ 495,953 | | |
| | |
| Kraft Foods Group, Inc., 5% Sr. Unsec. Nts., 6/4/42 | | | | 147,000 | | 148,551 | | |
| | |
Kraft Heinz Foods Co.: | | |
| 3.95% Sr. Unsec. Nts., 7/15/251 | | | | 316,000 | | 319,676 | | |
| 5.20% Sr. Unsec. Nts., 7/15/451 | | | | 234,000 | | 245,272 | | |
| | |
| Marfrig Holdings Europe BV, 6.875% Sr. Unsec. Nts., 6/24/191 | | | | 380,000 | | 340,100 | | |
| | |
| Minerva Luxembourg SA, 7.75% Sr. Unsec. Nts., 1/31/231 | | | | 655,000 | | 618,975 | | |
| | |
| Pilgrim’s Pride Corp., 5.75% Sr. Unsec. Nts., 3/15/251 | | | | 910,000 | | 887,250 | | |
| | |
| Post Holdings, Inc.: | | | | |
| 6.75% Sr. Unsec. Nts., 12/1/211 | | | | 830,000 | | 848,675 | | |
| 7.375% Sr. Unsec. Nts., 2/15/22 | | | | 2,265,000 | | 2,369,756 | | |
| | |
| TreeHouse Foods, Inc., 4.875% Sr. Unsec. Nts., 3/15/22 | | | | 572,000 | | 546,260 | | |
| | |
| Tyson Foods, Inc., 4.875% Sr. Unsec. Nts., 8/15/34 | | | | 195,000 | | 199,487 | | |
| | |
| WhiteWave Foods Co., 5.375% Sr. Unsec. Nts., 10/1/22 | | | | 625,000 | | 662,500 | | |
| | | | | | | | |
| | | | | | 12,655,759 | | |
| | |
| Household Products—0.1% | | | | |
| | |
Spectrum Brands, Inc.: | | |
| 6.125% Sr. Unsec. Nts., 12/15/241 | | | | 330,000 | | 344,850 | | |
| 6.375% Sr. Unsec. Nts., 11/15/20 | | | | 1,610,000 | | 1,718,675 | | |
| | | | | | | | |
| | | | | | 2,063,525 | | |
| | |
| Personal Products—0.1% | | | | |
| | |
Revlon Consumer Products Corp., 5.75% Sr. Unsec. Nts., 2/15/21 | | | | 2,080,000 | | 2,022,800 | | |
| | |
| Tobacco—0.2% | | | | |
| | |
| Altria Group, Inc., 10.20% Sr. Unsec. Nts., 2/6/39 | | | | 341,000 | | 560,822 | | |
| | |
| Imperial Tobacco Finance plc, 2.05% Sr. Unsec. Nts., 7/20/181 | | | | 596,000 | | 593,167 | | |
| | |
| Reynolds American, Inc.: | | | | |
| 5.85% Sr. Unsec. Nts., 8/15/45 | | | | 440,000 | | 490,640 | | |
| 6.75% Sr. Unsec. Nts., 6/15/17 | | | | 461,000 | | 492,310 | | |
| | |
| Vector Group Ltd., 7.75% Sr. Sec. Nts., 2/15/21 | | | | 1,925,000 | | 2,038,094 | | |
| | | | | | | | |
| | | | | | 4,175,033 | | |
| | |
| Energy—5.1% | | | | | | | | |
| | |
| Energy Equipment & Services—0.7% | | | | |
| | |
| Eletson Holdings, Inc., 9.625% Sr. Sec. Nts., 1/15/221 | | | | 2,095,000 | | 1,875,025 | | |
| | |
| Endeavor Energy Resources LP/EER Finance, Inc., 7% Sr. Unsec. Nts., 8/15/211 | | | | 980,000 | | 877,100 | | |
| | |
| Halliburton Co., 5% Sr. Unsec. Nts., 11/15/45 | | | | 1,535,000 | | 1,519,813 | | |
| | |
| Helmerich & Payne International Drilling Co., 4.65% Sr. Unsec. Nts., 3/15/25 | | | | 247,000 | | 247,707 | | |
| | |
| Hornbeck Offshore Services, Inc., 5.875% Sr. Unsec. Nts., 4/1/20 | | | | 1,395,000 | | 969,525 | | |
| | |
| Nabors Industries, Inc., 2.35% Sr. Unsec. Nts., 9/15/16 | | | | 466,000 | | 463,779 | | |
| | |
| Pertamina Persero PT, 5.625% Sr. Unsec. Nts., 5/20/431 | | | | 2,612,000 | | 2,057,324 | | |
| | |
| Precision Drilling Corp., 6.625% Sr. Unsec. Nts., 11/15/20 | | | | 1,395,000 | | 1,095,075 | | |
| | |
| Schlumberger Holdings Corp.: | | |
| 1.90% Sr. Unsec. Nts., 12/21/171 | | | | 659,000 | | 656,846 | | |
| 4.00% Sr. Unsec. Nts., 12/21/251 | | | | 1,147,000 | | 1,134,748 | | |
| | | | |
| | | Principal Amount | | Value |
|
| Energy Equipment & Services (Continued) |
|
| Sinopec Group Overseas Development 2014 Ltd., 1.75% Sr. Unsec. Nts., 4/10/171 | | $ 637,000 | | $ 635,100 |
|
| Sinopec Group Overseas Development 2015 Ltd., 2.50% Sr. Unsec. Nts., 4/28/201 | | 860,000 | | 847,746 |
| | | | |
| | | | 12,379,788 |
|
| Oil, Gas & Consumable Fuels—4.4% | | |
|
| Anadarko Petroleum Corp.: |
| 4.50% Sr. Unsec. Nts., 7/15/44 | | 2,033,000 | | 1,561,938 |
| 6.20% Sr. Unsec. Nts., 3/15/40 | | 337,000 | | 310,969 |
|
| Antero Resources Corp., 6% Sr. Unsec. Nts., 12/1/20 | | 1,705,000 | | 1,432,200 |
|
| Apache Corp., 4.75% Sr. Unsec. Nts., 4/15/43 | | 178,000 | | 153,459 |
|
| Bharat Petroleum Corp. Ltd., 4% Sr. Unsec. Nts., 5/8/25 | | 1,445,000 | | 1,408,978 |
|
| Bill Barrett Corp., 7.625% Sr. Unsec. Nts., 10/1/19 | | 895,000 | | 630,975 |
|
| Boardwalk Pipelines LP, 4.95% Sr. Unsec. Nts., 12/15/24 | | 350,000 | | 304,994 |
|
| Buckeye Partners LP, 6.05% Sr. Unsec. Nts., 1/15/18 | | 280,000 | | 290,815 |
|
| California Resources Corp.: |
| 5.50% Sr. Unsec. Nts., 9/15/21 | | 645,000 | | 206,400 |
| 8.00% Sec. Nts., 12/15/221 | | 1,728,000 | | 913,680 |
|
| Canadian Natural Resources Ltd.: |
| 1.75% Sr. Unsec. Nts., 1/15/18 | | 247,000 | | 240,392 |
| 5.90% Sr. Unsec. Nts., 2/1/18 | | 277,000 | | 288,556 |
|
| Carrizo Oil & Gas, Inc., 6.25% Sr. Unsec. Nts., 4/15/23 | | 1,650,000 | | 1,344,750 |
|
| Cenovus Energy, Inc., 5.20% Sr. Unsec. Nts., 9/15/43 | | 174,000 | | 136,642 |
|
| Chaparral Energy, Inc., 7.625% Sr. Unsec. Nts., 11/15/22 | | 545,000 | | 128,075 |
|
| Chesapeake Energy Corp., 8% Sec. Nts., 12/15/221 | | 785,000 | | 388,575 |
|
| Cimarex Energy Co., 4.375% Sr. Unsec. Nts., 6/1/24 | | 337,000 | | 299,604 |
|
| Cloud Peak Energy Resources LLC/Cloud Peak Energy Finance Corp., 8.50% Sr. Unsec. Nts., 12/15/19 | | 2,020,000 | | 1,020,100 |
|
| CNOOC Finance 2011 Ltd., 4.25% Sr. Unsec. Nts., 1/26/211 | | 1,250,000 | | 1,303,152 |
|
| CNOOC Nexen Finance 2014 ULC, 1.625% Sr. Unsec. Nts., 4/30/17 | | 546,000 | | 543,196 |
|
| Columbia Pipeline Group, Inc., 4.50% Sr. Unsec. Nts., 6/1/251 | | 336,000 | | 305,113 |
|
| Concho Resources, Inc., 5.50% Sr. Unsec. Unsub. Nts., 4/1/23 | | 1,465,000 | | 1,362,450 |
|
| CONSOL Energy, Inc., 5.875% Sr. Unsec. Nts., 4/15/22 | | 1,440,000 | | 900,000 |
|
| Cosan Luxembourg SA, 5% Sr. Unsec. Nts., 3/14/231 | | 1,180,000 | | 974,975 |
|
| Delek & Avner Tamar Bond Ltd., 5.082% Sr. Sec. Nts., 12/30/231 | | 500,000 | | 504,375 |
|
| Denbury Resources, Inc., 4.625% Sr. Sub. Nts., 7/15/23 | | 1,465,000 | | 478,879 |
|
| Devon Energy Corp., 4.75% Sr. Unsec. Nts., 5/15/42 | | 2,061,000 | | 1,466,793 |
|
| Energy Transfer Equity LP: | | |
| 5.875% Sr. Sec. Nts., 1/15/24 | | 1,175,000 | | 963,500 |
| 7.50% Sr. Sec. Nts., 10/15/20 | | 1,975,000 | | 1,836,750 |
|
| Energy XXI Gulf Coast, Inc., 11% Sec. Nts., 3/15/201 | | 1,165,000 | | 410,662 |
|
| EnLink Midstream Partners LP, 2.70% Sr. Unsec. Nts., 4/1/19 | | 508,000 | | 463,846 |
16 OPPENHEIMER GLOBAL STRATEGIC INCOME FUND/VA
| | | | | | | | | | |
| | | | | Principal Amount | | | Value | |
| |
| Oil, Gas & Consumable Fuels (Continued) | | | | | |
| |
| Enterprise Products Operating LLC: | |
| 4.85% Sr. Unsec. Nts., 8/15/42 | | | | $ | 174,000 | | | $ | 139,590 | |
| 4.90% Sr. Unsec. Nts., 5/15/46 | | | | | 62,000 | | | | 50,832 | |
| |
| EP Energy LLC/Everest Acquisition Finance, Inc., 7.75% Sr. Unsec. Nts., 9/1/22 | | | | | 1,460,000 | | | | 751,900 | |
| |
| Gazprom OAO Via Gaz Capital SA: | |
| 4.95% Sr. Unsec. Nts., 7/19/221 | | | | | 1,925,000 | | | | 1,808,994 | |
| 7.288% Sr. Unsec. Nts., 8/16/371 | | | | | 1,160,000 | | | | 1,158,695 | |
| |
| Genesis Energy LP/Genesis Energy Finance Corp., 5.75% Sr. Unsec. Nts., 2/15/21 | | | | | 1,720,000 | | | | 1,462,000 | |
| |
| Halcon Resources Corp., 12% Sec. Nts., 2/15/221 | | | | | 274,000 | | | | 207,256 | |
| |
| Husky Energy, Inc., 6.20% Sr. Unsec. Nts., 9/15/17 | | | | | 352,000 | | | | 367,170 | |
| |
| Indian Oil Corp. Ltd.: | |
| 5.625% Sr. Unsec. Nts., 8/2/21 | | | | | 490,000 | | | | 531,175 | |
| 5.75% Sr. Unsec. Nts., 8/1/23 | | | | | 1,555,000 | | | | 1,691,890 | |
| |
| KazMunayGas National Co. JSC: | |
| 6.375% Sr. Unsec. Nts., 4/9/211 | | | | | 1,550,000 | | | | 1,601,499 | |
| 7.00% Sr. Unsec. Nts., 5/5/201 | | | | | 1,675,000 | | | | 1,778,304 | |
| |
| Kinder Morgan, Inc., 5.55% Sr. Unsec. Nts., 6/1/45 | | | | | 441,000 | | | | 345,466 | |
| |
| Laredo Petroleum, Inc., 5.625% Sr. Unsec. Nts., 1/15/22 | | | | | 1,305,000 | | | | 1,141,875 | |
| |
| LBC Tank Terminals Holding Netherlands BV, 6.875% Sr. Unsec. Nts., 5/15/232 | | | | | 1,530,000 | | | | 1,522,350 | |
| |
| Linn Energy LLC/Linn Energy Finance Corp., 7.75% Sr. Unsec. Nts., 2/1/21 | | | | | 1,555,000 | | | | 233,250 | |
| |
| MEG Energy Corp., 6.50% Sr. Unsec. Nts., 3/15/211 | | | | | 3,100,000 | | | | 2,185,500 | |
| |
| Memorial Production Partners LP/Memorial Production Finance Corp., 7.625% Sr. Unsec. Nts., 5/1/21 | | | | | 880,000 | | | | 268,400 | |
| |
| MPLX LP: | |
| 4.875% Sr. Unsec. Nts., 12/1/241 | | | | | 1,760,000 | | | | 1,588,400 | |
| 4.875% Sr. Unsec. Nts., 6/1/251 | | | | | 695,000 | | | | 625,500 | |
| |
| Murray Energy Corp., 11.25% Sec. Nts., 4/15/211 | | | | | 860,000 | | | | 161,250 | |
| |
| Navios Maritime Acquisition Corp./Navios Acquisition Finance US, Inc., 8.125% Sr. Sec. Nts., 11/15/211 | | | | | 945,000 | | | | 828,056 | |
| |
| Newfield Exploration Co., 5.625% Sr. Unsec. Nts., 7/1/24 | | | | | 2,025,000 | | | | 1,736,437 | |
| |
| Noble Energy, Inc., 5.625% Sr. Unsec. Nts., 5/1/21 | | | | | 1,525,000 | | | | 1,493,425 | |
| |
| Novatek OAO via Novatek Finance Ltd., 4.422% Sr. Unsec. Nts., 12/13/221 | | | | | 720,000 | | | | 639,900 | |
| |
| Oasis Petroleum, Inc., 6.875% Sr. Unsec. Nts., 1/15/23 | | | | | 765,000 | | | | 478,125 | |
| |
| ONEOK, Inc., 7.50% Sr. Unsec. Nts., 9/1/23 | | | | | 1,360,000 | | | | 1,135,600 | |
| |
| Origin Energy Finance Ltd.: | |
| 3.50% Sr. Unsec. Nts., 10/9/181 | | | | | 2,144,000 | | | | 2,092,308 | |
| 5.45% Sr. Unsec. Nts., 10/14/211 | | | | | 1,082,000 | | | | 1,054,709 | |
| |
| Pacific Exploration & Production Corp., 5.625% Sr. Unsec. Nts., 1/19/251 | | | | | 1,135,000 | | | | 232,675 | |
| |
| Peabody Energy Corp., 6% Sr. Unsec. Nts., 11/15/18 | | | | | 2,410,000 | | | | 457,900 | |
| |
| Petrobras Global Finance BV: | |
| 4.375% Sr. Unsec. Nts., 5/20/23 | | | | | 310,000 | | | | 205,375 | |
| 4.875% Sr. Unsec. Nts., 3/17/20 | | | | | 1,000,000 | | | | 752,500 | |
| 5.75% Sr. Unsec. Nts., 1/20/20 | | | | | 75,000 | | | | 59,062 | |
| |
| Petroleos Mexicanos: | |
| 3.75% Sr. Unsec. Nts., 4/16/26 | | EUR | | | 1,030,000 | | | | 946,030 | |
| 5.50% Sr. Unsec. Nts., 6/27/441 | | | | | 1,045,000 | | | | 791,420 | |
| 5.50% Sr. Unsec. Nts., 6/27/44 | | | | | 1,835,000 | | | | 1,389,719 | |
| |
| Phillips 66 Partners LP, 3.605% Sr. Unsec. Nts., 2/15/25 | | | | | 48,000 | | | | 42,229 | |
| | | | | | | | | | |
| | | | | Principal Amount | | | Value | |
| |
| Oil, Gas & Consumable Fuels (Continued) | | | | | |
| |
| Pioneer Natural Resources Co., 6.65% Sr. Unsec. Nts., 3/15/17 | | | | $ | 237,000 | | | $ | 244,772 | |
| |
| Range Resources Corp.: | |
| 5.00% Sr. Sub. Nts., 8/15/22 | | | | | 1,735,000 | | | | 1,305,587 | |
| 5.00% Sr. Sub. Nts., 3/15/23 | | | | | 325,000 | | | | 243,750 | |
| |
| Regency Energy Partners LP/Regency Energy Finance Corp., 5% Sr. Unsec. Nts., 10/1/22 | | | | | 410,000 | | | | 363,871 | |
| |
| Reliance Industries Ltd., 4.125% Sr. Unsec. Nts., 1/28/251 | | | | | 1,855,000 | | | | 1,821,825 | |
| |
| Reliance Industries Ltd., 5.875% Sr. Unsec. Perpetual Bonds1,11 | | | | | 85,000 | | | | 83,619 | |
| |
| Rice Energy, Inc., 6.25% Sr. Unsec. Nts., 5/1/22 | | | | | 1,565,000 | | | | 1,134,625 | |
| |
| Sabine Pass Liquefaction LLC: | |
| 5.625% Sr. Sec. Nts., 4/15/23 | | | | | 1,250,000 | | | | 1,103,125 | |
| 5.75% Sr. Sec. Nts., 5/15/24 | | | | | 575,000 | | | | 503,125 | |
| |
| Sanchez Energy Corp.: | |
| 6.125% Sr. Unsec. Nts., 1/15/23 | | | | | 825,000 | | | | 449,625 | |
| 7.75% Sr. Unsec. Nts., 6/15/21 | | | | | 405,000 | | | | 249,075 | |
| |
| SandRidge Energy, Inc., 8.75% Sec. Nts., 6/1/201 | | | | | 815,000 | | | | 248,575 | |
| |
| SM Energy Co., 6.50% Sr. Unsec. Nts., 1/1/23 | | | | | 1,550,000 | | | | 1,147,000 | |
| |
| Spectra Energy Partners LP, 4.75% Sr. Unsec. Nts., 3/15/24 | | | | | 486,000 | | | | 471,785 | |
| |
| Summit Midstream Holdings LLC/Summit Midstream Finance Corp., 5.50% Sr. Unsec. Nts., 8/15/22 | | | | | 1,420,000 | | | | 1,057,900 | |
| |
| Suncor Energy, Inc., 6.10% Sr. Unsec. Nts., 6/1/18 | | | | | 564,000 | | | | 607,020 | |
| |
| Targa Resources Partners LP/Targa Resources Partners Finance Corp.: | |
| 4.125% Sr. Unsec. Nts., 11/15/19 | | | | | 745,000 | | | | 623,938 | |
| 5.00% Sr. Unsec. Nts., 1/15/181 | | | | | 1,160,000 | | | | 1,078,800 | |
| |
| Tesoro Logistics LP/Tesoro Logistics Finance Corp.: | |
| 5.875% Sr. Unsec. Nts., 10/1/20 | | | | | 1,154,000 | | | | 1,107,840 | |
| 6.25% Sr. Unsec. Nts., 10/15/221 | | | | | 935,000 | | | | 890,588 | |
| |
| Thai Oil PCL, 4.875% Sr. Unsec. Nts., 1/23/431 | | | | | 195,000 | | | | 183,623 | |
| |
| TOTAL SA, 2.25% Jr. Sub. Perpetual Bonds3,11 | | EUR | | | 2,185,000 | | | | 2,198,583 | |
| |
| Tullow Oil plc, 6% Sr. Unsec. Nts., 11/1/201 | | | | | 1,681,000 | | | | 1,176,700 | |
| |
| Western Gas Partners LP, 4% Sr. Unsec. Nts., 7/1/22 | | | | | 408,000 | | | | 361,510 | |
| |
| Whiting Petroleum Corp., 5.75% Sr. Unsec. Nts., 3/15/21 | | | | | 1,640,000 | | | | 1,203,760 | |
| |
| Williams Partners LP/ACMP Finance Corp., 6.125% Sr. Unsec. Nts., 7/15/22 | | | | | 1,390,000 | | | | 1,317,017 | |
| |
| Woodside Finance Ltd., 4.60% Sr. Unsec. Unsub. Nts., 5/10/211 | | | | | 474,000 | | | | 481,358 | |
| |
| WPX Energy, Inc.: | |
| 5.25% Sr. Unsec. Nts., 9/15/24 | | | | | 945,000 | | | | 628,425 | |
| 6.00% Sr. Unsec. Nts., 1/15/22 | | | | | 305,000 | | | | 215,025 | |
| |
| Zhaikmunai LLP, 6.375% Sr. Unsec. Nts., 2/14/191 | | | | | 60,000 | | | | 47,247 | |
| | | | | | | | | | |
| | | | | | | | | 79,081,252 | |
| |
| Financials—12.3% | | | | | |
| |
| Capital Markets—1.4% | | | | | |
| |
| Apollo Management Holdings LP, 4% Sr. Unsec. Nts., 5/30/241 | | | | | 464,000 | | | | 459,059 | |
| |
| Blackstone Holdings Finance Co. LLC, 4.45% Sr. Unsec. Nts., 7/15/451 | | | | | 632,000 | | | | 594,115 | |
| |
| Credit Suisse AG, New York, 3.625% Sr. Unsec. Nts., 9/9/24 | | | | | 757,000 | | | | 764,070 | |
| |
| Credit Suisse Group AG, 7.50% Jr. Sub. Perpetual Bonds3,11 | | | | | 2,070,000 | | | | 2,181,838 | |
17 OPPENHEIMER GLOBAL STRATEGIC INCOME FUND/VA
CONSOLIDATED STATEMENT OF INVESTMENTS Continued
| | | | | | | | | | |
| | | | | Principal Amount | | | Value | |
| |
| Capital Markets (Continued) | | | | | |
| |
| Deutsche Bank AG: | |
| 4.50% Sub. Nts., 4/1/25 | | | | $ | 513,000 | | | $ | 472,841 | |
| 7.50% Jr. Sub. Perpetual Bonds3,11 | | | | | 774,749 | | | | 721,668 | |
| |
| Drawbridge Special Opportunities Fund LP/Drawbridge Special Opportunities Finance Corp., 5% Sr. Unsec. Nts., 8/1/211 | | | | | 3,145,000 | | | | 3,058,512 | |
| |
| First Data Corp.: | |
| 5.00% Sr. Sec. Nts., 1/15/241 | | | | | 1,935,000 | | | | 1,930,162 | |
| 5.75% Sec. Nts., 1/15/241 | | | | | 910,000 | | | | 898,625 | |
| 7.00% Sr. Unsec. Nts., 12/1/231 | | | | | 3,055,000 | | | | 3,062,637 | |
| |
| Goldman Sachs Group, Inc. (The): | |
| 4.75% Sr. Unsec. Nts., 10/21/45 | | | | | 1,738,000 | | | | 1,732,883 | |
| 5.15% Sub. Nts., 5/22/45 | | | | | 452,000 | | | | 440,393 | |
| |
| ICBCIL Finance Co. Ltd., 3.20% Sr. Unsec. Nts., 11/10/201 | | | | | 380,000 | | | | 375,254 | |
| |
| KCG Holdings, Inc., 6.875% Sr. Sec. Nts., 3/15/201 | | | | | 3,970,000 | | | | 3,592,850 | |
| |
| KKR Group Finance Co. III LLC, 5.125% Sr. Unsec. Nts., 6/1/441 | | | | | 530,000 | | | | 520,223 | |
| |
| Lazard Group LLC, 3.75% Sr. Unsec. Nts., 2/13/25 | | | | | 470,000 | | | | 434,504 | |
| |
| Morgan Stanley: | | | | | | | | |
| 4.30% Sr. Unsec. Nts., 1/27/45 | | | | | 375,000 | | | | 359,004 | |
| 5.00% Sub. Nts., 11/24/25 | | | | | 578,000 | | | | 615,134 | |
| |
| Nomura Holdings, Inc., 2% Sr. Unsec. Nts., 9/13/16 | | | | | 626,000 | | | | 628,606 | |
| |
| Schaeffler Finance BV, 3.25% Sr. Sec. Nts., 5/15/251 | | EUR | | | 670,000 | | | | 709,822 | |
| |
| UBS Preferred Funding Trust V, 6.243% Jr. Sub. Perpetual Bonds, Series 13,11 | | | | | 824,000 | | | | 828,120 | |
| | | | | | | | | | |
| | | | | | | | | 24,380,320 | |
| |
| Commercial Banks—6.2% | |
| |
| ABN AMRO Bank NV, 4.75% Sub. Nts., 7/28/251 | | | | | 7,284,000 | | | | 7,274,167 | |
| |
| Allied Irish Banks plc, 4.125% Sub. Nts., 11/26/253,15 | | EUR | | | 750,000 | | | | 821,175 | |
| |
| Altice Luxembourg SA, 6.25% Sr. Unsec. Nts., 2/15/251 | | EUR | | | 1,270,000 | | | | 1,169,151 | |
| |
| Astana Finance JSC, 9.16% Sr. Unsec. Nts., 3/14/127 | | | | | 315,159 | | | | — | |
| |
| Banco ABC Brasil SA, 7.875% Sub. Nts., 4/8/201 | | | | | 125,000 | | | | 114,219 | |
| |
| Banco Bilbao Vizcaya Argentaria Colombia SA, 4.875% Sub. Nts., 4/21/251 | | | | | 595,000 | | | | 571,200 | |
| |
| Banco Bilbao Vizcaya Argentaria SA, 7% Jr. Sub. Perpetual Bonds3,11 | | EUR | | | 5,105,000 | | | | 5,456,996 | |
| |
| Banco Continental SA via Continental Senior Trustees Cayman Ltd., 5.50% Sr. Unsec. Nts., 11/18/201 | | | | | 1,200,000 | | | | 1,293,000 | |
| |
| Bank of America Corp.: | |
| 3.875% Sr. Unsec. Nts., 8/1/25 | | | | | 1,241,000 | | | | 1,262,402 | |
| 7.75% Jr. Sub. Nts., 5/14/38 | | | | | 455,000 | | | | 618,805 | |
| |
| Bank of China Hong Kong Ltd., 5.55% Sub. Nts., 2/11/201 | | | | | 630,000 | | | | 686,650 | |
| |
| Bank of Ireland: | |
| 4.25% Sub. Nts., 6/11/243 | | EUR | | | 1,955,000 | | | | 2,205,465 | |
| 10.00% Sub. Nts., 12/19/22 | | EUR | | | 1,865,000 | | | | 2,719,363 | |
| |
| Barclays plc: | |
| 3.65% Sr. Unsec. Nts., 3/16/25 | | | | | 530,000 | | | | 510,323 | |
| 7.00% Jr. Sub. Perpetual Bonds3,11 | | GBP | | | 2,230,000 | | | | 3,233,285 | |
| 8.00% Jr. Sub. Perpetual Bonds3,11 | | EUR | | | 2,720,000 | | | | 3,213,350 | |
| |
| BNP Paribas SA: | |
| 4.375% Sub. Nts., 9/28/251 | | | | | 582,000 | | | | 571,175 | |
| 5.945% Jr. Sub. Perpetual Bonds3,11 | | GBP | | | 4,075,000 | | | | 5,969,819 | |
| 7.375% Jr. Sub. Perpetual Bonds1,3,11 | | | | | 2,250,000 | | | | 2,311,875 | |
| |
| BPCE SA, 2.75% Sub. Nts., 7/8/263 | | EUR | | | 2,520,000 | | | | 2,779,675 | |
| | | | | | | | | | |
| | | | | Principal Amount | | | Value | |
| |
| Commercial Banks (Continued) | | | | | |
| |
| Brazil Loan Trust 1, 5.477% Sec. Nts., 7/24/232 | | | | $ | 521,561 | | | $ | 451,802 | |
| |
| CIT Group, Inc.: | |
| 4.25% Sr. Unsec. Nts., 8/15/17 | | | | | 575,000 | | | | 589,375 | |
| 5.00% Sr. Unsec. Nts., 8/15/22 | | | | | 3,205,000 | | | | 3,299,163 | |
| |
| Citigroup, Inc.: | |
| 4.45% Sub. Nts., 9/29/27 | | | | | 2,299,000 | | | | 2,290,494 | |
| 4.65% Sr. Unsec. Nts., 7/30/45 | | | | | 480,000 | | | | 487,440 | |
| 6.675% Sub. Nts., 9/13/43 | | | | | 296,000 | | | | 364,194 | |
| |
| Citizens Financial Group, Inc., 5.50% Jr. Sub. Perpetual Bonds1,3,11 | | | | | 286,000 | | | | 282,282 | |
| |
| Commerzbank AG, 8.125% Sub. Nts., 9/19/231 | | | | | 2,900,000 | | | | 3,339,234 | |
| |
| Constellis Holdings LLC/Constellis Finance Corp., 9.75% Sr. Sec. Nts., 5/15/201 | | | | | 2,095,000 | | | | 1,728,375 | |
| |
| Cooperatieve Centrale Raiffeisen- Boerenleenbank BA (Netherlands), 4.375% Sub. Nts., 8/4/25 | | | | | 2,797,000 | | | | 2,850,602 | |
| |
| Corp. Financiera de Desarrollo SA, 4.75% Sr. Unsec. Nts., 2/8/221 | | | | | 365,000 | | | | 372,300 | |
| |
| Corpbanca SA, 3.875% Sr. Unsec. Nts., 9/22/191 | | | | | 1,345,000 | | | | 1,335,925 | |
| |
| CorpGroup Banking SA, 6.75% Sr. Unsec. Nts., 3/15/231 | | | | | 750,000 | | | | 696,563 | |
| |
| Credit Agricole SA, 8.375% Jr. Sub. Perpetual Bonds1,3,11 | | | | | 520,000 | | | | 585,000 | |
| |
| Danske Bank AS, 5.684% Jr. Sub. Perpetual Bonds3,11 | | GBP | | | 2,965,000 | | | | 4,444,545 | |
| |
| Export-Import Bank of India: | |
| 9.50% Sr. Unsec. Nts., 10/9/18 | | INR | | | 42,000,000 | | | | 665,442 | |
| 9.70% Sr. Unsec. Nts., 11/21/18 | | INR | | | 50,000,000 | | | | 797,231 | |
| |
| FirstMerit Corp., 4.35% Sub. Nts., 2/4/23 | | | | | 660,000 | | | | 669,705 | |
| |
| Grupo Aval Ltd., 4.75% Sr. Unsec. Nts., 9/26/221 | | | | | 1,790,000 | | | | 1,685,965 | |
| |
| ICICI Bank Ltd., 6.375% Jr. Sub. Nts., 4/30/221,3 | | | | | 730,000 | | | | 750,614 | |
| |
| ICICI Bank Ltd. (Dubai), 4.75% Sr. Unsec. Nts., 11/25/161 | | | | | 1,105,000 | | | | 1,131,780 | |
| |
| Intesa Sanpaolo SpA, 5.017% Sub. Nts., 6/26/241 | | | | | 3,375,000 | | | | 3,327,834 | |
| |
| JPMorgan Chase & Co.: | | | | | | | | | | |
| 4.25% Sub. Nts., 10/1/27 | | | | | 2,300,000 | | | | 2,301,992 | |
| 6.75% Jr. Sub. Perpetual Bonds, Series S3,11 | | | | | 520,000 | | | | 567,450 | |
| |
| Krung Thai Bank PCL (Cayman Islands), 5.20% Sub. Nts., 12/26/243 | | | | | 345,000 | | | | 353,122 | |
| |
| Lloyds Banking Group plc: | |
| 6.375% Jr. Sub. Perpetual Bonds3,11 | | EUR | | | 1,875,000 | | | | 2,154,832 | |
| 6.413% Jr. Sub. Perpetual Bonds1,3,11 | | | | | 566,000 | | | | 636,750 | |
| 7.50% Jr. Sub. Perpetual Bonds3,11 | | | | | 1,520,000 | | | | 1,622,600 | |
| |
| NABARD, 8.19% Sr. Unsec. Nts., 6/8/18 | | INR | | | 20,000,000 | | | | 304,479 | |
| |
| NN Group NV, 4.625% Sub. Nts., 4/8/443 | | EUR | | | 2,835,000 | | | | 3,211,978 | |
| |
| OPE KAG Finance Sub, Inc., 7.875% Sr. Unsec. Nts., 7/31/231 | | | | | 1,660,000 | | | | 1,653,775 | |
| |
| Rabobank Capital Funding Trust IV, 5.556% Jr. Sub. Perpetual Bonds1,3,11 | | GBP | | | 150,000 | | | | 231,308 | |
| |
| Regions Bank, Birmingham AL, 2.25% Sr. Unsec. Nts., 9/14/18 | | | | | 477,000 | | | | 476,849 | |
| |
| Regions Financial Corp., 7.375% Sub. Nts., 12/10/37 | | | | | 232,000 | | | | 291,937 | |
| |
| Royal Bank of Scotland Group plc: | |
| 7.50% Jr. Sub. Perpetual Bonds3,11 | | | | | 1,680,000 | | | | 1,753,500 | |
| 8.00% Jr. Sub. Perpetual Bonds3,11 | | | | | 1,680,000 | | | | 1,780,800 | |
| 7.64% Jr. Sub. Perpetual Bonds, Series U3,11 | | | | | 600,000 | | | | 630,000 | |
| |
| Santander UK Group Holdings plc, 4.75% Sub. Nts., 9/15/251 | | | | | 3,475,000 | | | | 3,445,946 | |
18 OPPENHEIMER GLOBAL STRATEGIC INCOME FUND/VA
| | | | | | | | | | |
| | | | | Principal Amount | | | Value | |
| |
| Commercial Banks (Continued) | |
| |
| Sberbank of Russia Via SB Capital SA, 5.50% Sub. Nts., 2/26/241,3 | | | | $ | 1,165,000 | | | $ | 1,028,113 | |
| |
| Societe Generale SA: | |
| 5.922% Jr. Sub. Perpetual Bonds1,3,11 | | | | | 550,000 | | | | 560,313 | |
| 8.00% Jr. Sub. Perpetual Bonds1,3,11 | | | | | 4,515,000 | | | | 4,608,817 | |
| |
| SPCM SA, 2.875% Sr. Unsec. Nts., 6/15/231 | | EUR | | | 1,645,000 | | | | 1,715,759 | |
| |
| SumitG Guaranteed Secured Obligation Issuer Designated Activity Co., 2.251% Sr. Sec. Nts., 11/2/201 | | | | | 3,900,000 | | | | 3,842,966 | |
| |
| SunTrust Banks, Inc., 3.50% Sr. Unsec. Nts., 1/20/17 | | | | | 364,000 | | | | 370,379 | |
| |
| Turkiye Vakiflar Bankasi TAO, 6.875% Sub. Nts., 2/3/251,3 | | | | | 995,000 | | | | 967,935 | |
| |
| Wells Fargo & Co.: | |
| 4.90% Sub. Nts., 11/17/45 | | | | | 1,739,000 | | | | 1,759,318 | |
| 5.90% Jr. Sub. Perpetual Bonds, Series S3,11 | | | | | 485,000 | | | | 490,456 | |
| | | | | | | | | | |
| | | | | | | | | 111,689,334 | |
| |
| Consumer Finance—0.5% | |
| |
| Ahern Rentals, Inc., 7.375% Sec. Nts., 5/15/231 | | | | | 2,090,000 | | | | 1,698,125 | |
| |
| Ally Financial, Inc.: | |
| 4.625% Sr. Unsec. Nts., 5/19/22 | | | | | 1,000,000 | | | | 1,007,500 | |
| 5.75% Sub. Nts., 11/20/25 | | | | | 680,000 | | | | 690,200 | |
| 8.00% Sr. Unsec. Nts., 11/1/31 | | | | | 497,000 | | | | 575,899 | |
| |
| Capital One Financial Corp., 3.20% Sr. Unsec. Nts., 2/5/25 | | | | | 514,000 | | | | 498,108 | |
| |
| Cash America International, Inc., 5.75% Sr. Unsec. Nts., 5/15/18 | | | | | 1,045,000 | | | | 1,051,531 | |
| |
| Discover Financial Services, 3.75% Sr. Unsec. Nts., 3/4/25 | | | | | 980,000 | | | | 943,404 | |
| |
| Speedy Cash Intermediate Holdings Corp., 10.75% Sec. Nts., 5/15/181 | | | | | 1,735,000 | | | | 893,525 | |
| |
| Synchrony Financial: | | | | | | | | |
| 4.25% Sr. Unsec. Nts., 8/15/24 | | | | | 155,000 | | | | 153,192 | |
| 4.50% Sr. Unsec. Nts., 7/23/25 | | | | | 465,000 | | | | 465,042 | |
| |
| TMX Finance LLC/TitleMax Finance Corp., 8.50% Sr. Sec. Nts., 9/15/181 | | | | | 2,285,000 | | | | 1,713,750 | |
| | | | | | | | | | |
| | | | | | | | | 9,690,276 | |
| |
| Diversified Financial Services—0.8% | |
| |
| Baggot Securities Ltd., 10.24% Jr. Sub. Perpetual Bonds1,11 | | EUR | | | 3,020,000 | | | | 3,290,055 | |
| |
| Berkshire Hathaway, Inc., 1.625% Sr. Unsec. Nts., 3/16/35 | | EUR | | | 1,090,000 | | | | 995,830 | |
| |
| Corp. Financiera de Desarrollo SA, 5.25% Sub. Nts., 7/15/291,3 | | | | | 500,000 | | | | 492,500 | |
| |
| Global Bank Corp., 5.125% Sr. Unsec. Nts., 10/30/191 | | | | | 1,760,000 | | | | 1,746,800 | |
| |
| Interactive Data Corp., 5.875% Sr. Unsec. Nts., 4/15/191 | | | | | 1,795,000 | | | | 1,830,900 | |
| |
| Jefferies LoanCore LLC/JLC Finance Corp., 6.875% Sr. Unsec. Nts., 6/1/201 | | | | | 1,470,000 | | | | 1,411,200 | |
| |
| JPMorgan Hipotecaria su Casita, 6.47% Sec. Nts., 8/26/352,12 | | MXN | | | 5,808,600 | | | | 29,996 | |
| |
| McGraw Hill Financial, Inc., 2.50% Sr. Unsec. Nts., 8/15/18 | | | | | 151,000 | | | | 152,051 | |
| |
| National Savings Bank, 8.875% Sr. Unsec. Nts., 9/18/181 | | | | | 525,000 | | | | 541,433 | |
| |
| Nationwide Building Society, 3.90% Sr. Unsec. Nts., 7/21/251 | | | | | 596,000 | | | | 615,780 | |
| |
| Peachtree Corners Funding Trust, 3.976% Sr. Unsec. Nts., 2/15/251 | | | | | 331,000 | | | | 329,263 | |
| |
| Power Finance Corp. Ltd., 8.29% Sr. Unsec. Nts., 6/13/18 | | INR | | | 40,000,000 | | | | 607,352 | |
| |
| Rural Electrification Corp. Ltd., 9.04% Sr. Unsec. Nts., 10/12/19 | | INR | | | 60,000,000 | | | | 939,812 | |
| | | | | | | | | | |
| | | | | Principal Amount | | | Value | |
| |
| Diversified Financial Services (Continued) | |
| |
| Suntory Holdings Ltd., 1.65% Sr. Unsec. Nts., 9/29/171 | | | | $ | 327,000 | | | $ | 324,888 | |
| |
| Voya Financial, Inc., 5.65% Jr. Sub. Nts., 5/15/533 | | | | | 595,000 | | | | 589,050 | |
| | | | | | | | | | |
| | | | | | | | | 13,896,910 | |
| |
| Insurance—1.4% | |
| |
| ACE INA Holdings, Inc.: | |
| 3.35% Sr. Unsec. Nts., 5/3/26 | | | | | 322,000 | | | | 321,489 | |
| 4.35% Sr. Unsec. Nts., 11/3/45 | | | | | 258,000 | | | | 262,843 | |
| |
| Assicurazioni Generali SpA, 7.75% Sub. Nts., 12/12/423 | | EUR | | | 1,750,000 | | | | 2,324,776 | |
| |
| Aviva plc: | | | | | | | | | | |
| 5.902% Jr. Sub. Perpetual Bonds3,11 | | GBP | | | 750,000 | | | | 1,137,904 | |
| 6.125% Jr. Sub. Perpetual Bonds3,11 | | GBP | | | 2,930,000 | | | | 4,494,765 | |
| |
| AXIS Specialty Finance plc, 5.15% Sr. Unsec. Nts., 4/1/45 | | | | | 480,000 | | | | 472,517 | |
| |
| CNO Financial Group, Inc., 4.50% Sr. Unsec. Nts., 5/30/20 | | | | | 2,195,000 | | | | 2,244,387 | |
| |
| Five Corners Funding Trust, 4.419% Unsec. Nts., 11/15/231 | | | | | 467,000 | | | | 488,403 | |
| |
| HUB International Ltd., 7.875% Sr. Unsec. Nts., 10/1/211 | | | | | 1,545,000 | | | | 1,394,362 | |
| |
| Liberty Mutual Group, Inc.: | | | | | |
| 4.25% Sr. Unsec. Nts., 6/15/231 | | | | | 550,000 | | | | 560,130 | |
| 4.85% Sr. Unsec. Nts., 8/1/441 | | | | | 359,000 | | | | 333,775 | |
| |
| MetLife, Inc., 5.25% Jr. Sub. Perpetual Bonds3,11 | | | | | 446,000 | | | | 454,920 | |
| |
| National Financial Partners Corp., 9% Sr. Unsec. Nts., 7/15/211 | | | | | 2,065,000 | | | | 1,897,219 | |
| |
| Prudential Financial, Inc., 5.375% Jr. Sub. Nts., 5/15/453 | | | | | 505,000 | | | | 505,000 | |
| |
| Sogecap SA, 4.125% Sub. Perpetual Bonds3,11 | | EUR | | | 2,300,000 | | | | 2,373,751 | |
| |
| Swiss Reinsurance Co. via ELM BV, 6.302% Sub. Perpetual Bonds3,11 | | GBP | | | 2,745,000 | | | | 4,306,848 | |
| |
| TIAA Asset Management Finance Co. LLC, 4.125% Sr. Unsec. Nts., 11/1/241 | | | | | 573,000 | | | | 576,317 | |
| |
| Unum Group, 7.125% Sr. Unsec. Nts., 9/30/16 | | | | | 535,000 | | | | 556,249 | |
| |
| XLIT Ltd., 6.50% Jr. Sub. Perpetual Bonds3,11 | | | | | 360,000 | | | | 262,350 | |
| | | | | | | | | | |
| | | | | | | | | 24,968,005 | |
| |
| Real Estate Investment Trusts (REITs)—1.1% | |
| |
| American Tower Corp.: | |
| 2.80% Sr. Unsec. Nts., 6/1/20 | | | | | 275,000 | | | | 272,179 | |
| 5.90% Sr. Unsec. Nts., 11/1/21 | | | | | 279,000 | | | | 311,189 | |
| |
| Banco Invex SA/Hipotecaria Credito y Casa SA de CV, 6.45% Sec. Nts., 3/13/347,12 | | MXN | | | 4,830,531 | | | | — | |
| |
| Boston Properties LP, 3.70% Sr. Unsec. Nts., 11/15/18 | | | | | 593,000 | | | | 614,757 | |
| |
| Communications Sales & Leasing, Inc./CSL Capital LLC, 8.25% Sr. Unsec. Nts., 10/15/23 | | | | | 2,320,000 | | | | 1,989,400 | |
| |
| Corrections Corp. of America, 4.625% Sr. Unsec. Nts., 5/1/23 | | | | | 635,000 | | | | 615,950 | |
| |
| CTR Partnership LP/CareTrust Capital Corp., 5.875% Sr. Unsec. Nts., 6/1/21 | | | | | 1,645,000 | | | | 1,667,619 | |
| |
| DuPont Fabros Technology LP, 5.875% Sr. Unsec. Nts., 9/15/21 | | | | | 1,535,000 | | | | 1,604,075 | |
| |
| Equinix, Inc.: | | | | | | | | | | |
| 5.375% Sr. Unsec. Nts., 1/1/22 | | | | | 2,200,000 | | | | 2,266,000 | |
| 5.875% Sr. Unsec. Nts., 1/15/26 | | | | | 1,135,000 | | | | 1,171,887 | |
| |
| First Industrial LP, 7.50% Sr. Unsec. Nts., 12/1/17 | | | | | 540,000 | | | | 590,769 | |
| |
| HCP, Inc., 5.625% Sr. Unsec. Nts., 5/1/17 | | | | | 332,000 | | | | 347,377 | |
19 OPPENHEIMER GLOBAL STRATEGIC INCOME FUND/VA
CONSOLIDATED STATEMENT OF INVESTMENTS Continued
| | | | | | | | | | |
| | | | | Principal Amount | | | Value | |
| |
| Real Estate Investment Trusts (REITs) (Continued) | |
| |
| Highwoods Realty LP, 7.50% Sr. Unsec. Nts., 4/15/18 | | $ | 542,000 | | | $ | 599,354 | |
| |
| Host Hotels & Resorts LP, 3.75% Sr. Unsec. Nts., 10/15/23 | | | 357,000 | | | | 344,797 | |
| |
| Iron Mountain, Inc., 6% Sr. Unsec. Nts., 10/1/201 | | | 685,000 | | | | 724,388 | |
| |
| iStar, Inc., 4.875% Sr. Unsec. Nts., 7/1/18 | | | 2,145,000 | | | | 2,110,144 | |
| |
| Kimco Realty Corp., 4.30% Sr. Unsec. Nts., 2/1/18 | | | 530,000 | | | | 552,937 | |
| |
| Outfront Media Capital LLC/Outfront Media Capital Corp., 5.875% Sr. Unsec. Nts., 3/15/25 | | | 2,040,000 | | | | 2,078,250 | |
| |
| PLA Administradora Industrial S de RL de CV, 5.25% Sr. Unsec. Nts., 11/10/221 | | | 880,000 | | | | 856,900 | |
| |
| Prologis LP, 4% Sr. Unsec. Nts., 1/15/18 | | | 325,000 | | | | 336,166 | |
| |
| Regency Centers LP, 5.875% Sr. Unsec. Nts., 6/15/17 | | | 53,000 | | | | 55,912 | |
| |
| Trust F/1401, 5.25% Sr. Unsec. Nts., 1/30/261 | | | 1,010,000 | | | | 987,275 | |
| |
| WEA Finance LLC/Westfield UK & Europe Finance plc, 1.75% Sr. Unsec. Nts., 9/15/171 | | | 434,000 | | | | 430,475 | |
| |
| Welltower, Inc., 2.25% Sr. Unsec. Nts., 3/15/18 | | | 130,000 | | | | 129,954 | |
| | | | | | | | | | |
| | | | | | | | | 20,657,754 | |
| |
| Real Estate Management & Development—0.4% | |
| |
| Brookfield Asset Management, Inc., 4% Sr. Unsec. Nts., 1/15/25 | | | | | 453,000 | | | | 443,364 | |
| |
| Brookfield Residential Properties, Inc., 6.50% Sr. Unsec. Nts., 12/15/201 | | | | | 2,025,000 | | | | 1,961,719 | |
| |
| China Overseas Finance Cayman III Ltd., 6.375% Sr. Unsec. Nts., 10/29/43 | | | | | 160,000 | | | | 168,558 | |
| |
| EMG SUKUK Ltd., 4.564% Sr. Unsec. Nts., 6/18/24 | | | | | 1,155,000 | | | | 1,168,018 | |
| |
| Realogy Group LLC/Realogy Co.-Issuer Corp., 5.25% Sr. Unsec. Nts., 12/1/211 | | | | | 1,605,000 | | | | 1,651,144 | |
| |
| Techem GmbH, 6.125% Sr. Sec. Nts., 10/1/191 | | EUR | | | 1,025,000 | | | | 1,170,810 | |
| | | | | | | | | | |
| | | | | | | | | 6,563,613 | |
| |
| Thrifts & Mortgage Finance—0.5% | |
| |
| Housing Development Finance Corp. Ltd.: | |
| 8.70% Sr. Sec. Nts., 4/26/18 | | INR | | | 60,000,000 | | | | 909,910 | |
| 8.95% Sec. Nts., 10/19/20 | | INR | | | 31,000,000 | | | | 483,174 | |
| |
| Jefferies Finance LLC/JFIN Co.-Issuer Corp.: | |
| 6.875% Sr. Unsec. Nts., 4/15/221 | | | | | 500,000 | | | | 422,500 | |
| 7.375% Sr. Unsec. Nts., 4/1/201 | | | | | 1,015,000 | | | | 905,887 | |
| |
| Quicken Loans, Inc., 5.75% Sr. Unsec. Nts., 5/1/251 | | | | | 2,135,000 | | | | 2,041,594 | |
| |
| Radian Group, Inc., 5.25% Sr. Unsec. Nts., 6/15/20 | | | | | 3,515,000 | | | | 3,408,496 | |
| |
| Walter Investment Management Corp., 7.875% Sr. Unsec. Nts., 12/15/21 | | | | | 2,030,000 | | | | 1,613,850 | |
| | | | | | | | | | |
| | | | | | | | | 9,785,411 | |
| |
| Health Care—3.5% | |
| |
| Biotechnology—0.1% | | | | | | | | |
| |
| AbbVie, Inc.: | |
3.60% Sr. Unsec. Nts., 5/14/25 4.70% Sr. Unsec. Nts., 5/14/45 | | | 313,000 | | | | 309,559 | |
| | | 125,000 | | | | 122,723 | |
| |
| Biogen, Inc., 5.20% Sr. Unsec. Nts., 9/15/45 | | | 160,000 | | | | 160,645 | |
| |
| Celgene Corp.: | |
| 3.875% Sr. Unsec. Nts., 8/15/25 | | | | | 300,000 | | | | 299,642 | |
| 5.00% Sr. Unsec. Nts., 8/15/45 | | | | | 81,000 | | | | 81,622 | |
| |
| Gilead Sciences, Inc., 4.75% Sr. Unsec. Nts., 3/1/46 | | | 258,000 | | | | 261,556 | |
| | | | | | | | | | |
| | | | | Principal Amount | | | Value | |
| |
| Biotechnology (Continued) | |
| |
| Universal Hospital Services, Inc., 7.625% Sec. Nts., 8/15/20 | | | | $ | 725,000 | | | $ | 684,219 | |
| | | | | | | | | | |
| | | | | | | | | 1,919,966 | |
| |
| Health Care Equipment & Supplies—0.3% | | | | | |
| |
| Becton Dickinson & Co., 3.875% Sr. Unsec. Nts., 5/15/24 | | | | | 264,000 | | | | 268,091 | |
| |
| DJO Finco, Inc./DJO Finance LLC/DJO Finance Corp., 8.125% Sec. Nts., 6/15/211 | | | | | 1,400,000 | | | | 1,246,000 | |
| |
| Hill-Rom Holdings, Inc., 5.75% Sr. Unsec. Nts., 9/1/231 | | | | | 680,000 | | | | 697,000 | |
| |
| Hologic, Inc., 5.25% Sr. Unsec. Nts., 7/15/221 | | | | | 2,405,000 | | | | 2,462,119 | |
| |
| Jaguar Holding Co. II/Pharmaceutical Product Development LLC, 6.375% Sr. Unsec. Nts., 8/1/231 | | | | | 910,000 | | | | 889,525 | |
| |
| Zimmer Biomet Holdings, Inc., 3.55% Sr. Unsec. Nts., 4/1/25 | | | | | 193,000 | | | | 188,010 | |
| | | | | | | | | | |
| | | | | | | | | 5,750,745 | |
| |
| Health Care Providers & Services—2.2% | | | | | |
| |
| Acadia Healthcare Co., Inc., 5.625% Sr. Unsec. Nts., 2/15/23 | | | | | 930,000 | | | | 883,500 | |
| |
| Amsurg Corp.: | |
| 5.625% Sr. Unsec. Nts., 11/30/20 | | | | | 375,000 | | | | 382,500 | |
| 5.625% Sr. Unsec. Nts., 7/15/22 | | | | | 945,000 | | | | 939,094 | |
| |
| Cardinal Health, Inc., 3.50% Sr. Unsec. Nts., 11/15/24 | | | | | 297,000 | | | | 298,057 | |
| |
| Centene Corp., 4.75% Sr. Unsec. Nts., 5/15/22 | | | | | 2,790,000 | | | | 2,713,275 | |
| |
| CHS/Community Health Systems, Inc., 6.875% Sr. Unsec. Nts., 2/1/22 | | | | | 4,290,000 | | | | 4,091,587 | |
| |
| DaVita HealthCare Partners, Inc.: | |
| 5.00% Sr. Unsec. Nts., 5/1/25 | | | | | 1,160,000 | | | | 1,122,300 | |
| 5.125% Sr. Unsec. Nts., 7/15/24 | | | | | 3,455,000 | | | | 3,461,478 | |
| |
| Envision Healthcare Corp., 5.125% Sr. Unsec. Nts., 7/1/221 | | | | | 1,830,000 | | | | 1,802,550 | |
| |
| FGI Operating Co. LLC/FGI Finance, Inc., 7.875% Sec. Nts., 5/1/20 | | | | | 1,510,000 | | | | 1,094,750 | |
| |
| Fresenius Medical Care US Finance II, Inc.: | |
| 4.75% Sr. Unsec. Nts., 10/15/241 | | | | | 1,290,000 | | | | 1,264,200 | |
| 5.875% Sr. Unsec. Nts., 1/31/221 | | | | | 921,000 | | | | 990,075 | |
| |
| HCA, Inc.: | |
| 5.375% Sr. Unsec. Nts., 2/1/25 | | | | | 700,000 | | | | 692,125 | |
| 5.875% Sr. Unsec. Nts., 5/1/23 | | | | | 3,480,000 | | | | 3,584,400 | |
| 7.50% Sr. Unsec. Nts., 2/15/22 | | | | | 2,695,000 | | | | 2,998,188 | |
| |
| HealthSouth Corp.: | |
| 5.75% Sr. Unsec. Nts., 11/1/24 | | | | | 1,970,000 | | | | 1,888,738 | |
| 5.75% Sr. Unsec. Nts., 11/1/241 | | | | | 1,040,000 | | | | 997,100 | |
| |
| Kindred Healthcare, Inc., 6.375% Sr. Unsec. Nts., 4/15/22 | | | | | 1,395,000 | | | | 1,163,081 | |
| |
| Laboratory Corp. of America Holdings, 3.60% Sr. Unsec. Nts., 2/1/25 | | | | | 907,000 | | | | 876,949 | |
| |
| LifePoint Health, Inc., 5.50% Sr. Unsec. Nts., 12/1/21 | | | | | 1,435,000 | | | | 1,463,700 | |
| |
| McKesson Corp., 4.883% Sr. Unsec. Nts., 3/15/44 | | | | | 259,000 | | | | 259,980 | |
| |
| Medco Health Solutions, Inc., 7.125% Sr. Unsec. Nts., 3/15/18 | | | | | 261,000 | | | | 288,687 | |
| |
| OCP SA, 4.50% Sr. Unsec. Nts., 10/22/251 | | | | | 740,000 | | | | 691,947 | |
| |
| Select Medical Corp., 6.375% Sr. Unsec. Nts., 6/1/21 | | | | | 1,750,000 | | | | 1,540,000 | |
| |
| Tenet Healthcare Corp.: | |
| 6.75% Sr. Unsec. Nts., 6/15/23 | | | | | 2,370,000 | | | | 2,202,619 | |
| 8.125% Sr. Unsec. Nts., 4/1/22 | | | | | 1,445,000 | | | | 1,448,613 | |
20 OPPENHEIMER GLOBAL STRATEGIC INCOME FUND/VA
| | | | | | | | | | |
| | | | | Principal Amount | | | Value | |
| |
| Health Care Providers & Services (Continued) | |
| |
| Universal Health Services, Inc., 4.75% Sr. Sec. Nts., 8/1/221 | | $ | 1,000,000 | | | $ | 1,012,500 | |
| | | | | | | | | | |
| | | | | | | | | 40,151,993 | |
| |
| Life Sciences Tools & Services—0.1% | |
| |
| Quintiles Transnational Corp., 4.875% Sr. Unsec. Nts., 5/15/231 | | | 1,627,000 | | | | 1,643,270 | |
| |
| Thermo Fisher Scientific, Inc.: | |
| 2.15% Sr. Unsec. Nts., 12/14/18 | | | | | 247,000 | | | | 247,041 | |
| 4.15% Sr. Unsec. Nts., 2/1/24 | | | | | 229,000 | | | | 238,387 | |
| 5.30% Sr. Unsec. Nts., 2/1/44 | | | | | 54,000 | | | | 57,863 | |
| | | | | | | | | | |
| | | | | | | | | 2,186,561 | |
| |
| Pharmaceuticals—0.8% | |
| |
| Actavis Funding SCS: | | | | | | | | | | |
| 1.85% Sr. Unsec. Nts., 3/1/17 | | | | | 645,000 | | | | 646,361 | |
| 3.80% Sr. Unsec. Nts., 3/15/25 | | | | | 420,000 | | | | 418,698 | |
| 4.75% Sr. Unsec. Nts., 3/15/45 | | | | | 206,000 | | | | 201,603 | |
| |
| Almirall SA, 4.625% Sr. Unsec. Nts., 4/1/21 | | EUR | | | 2,055,000 | | | | 2,329,900 | |
| |
| Concordia Healthcare Corp., 7% Sr. Unsec. Nts., 4/15/231 | | | | | 1,625,000 | | | | 1,417,812 | |
| |
| Endo Finance LLC/Endo Finco, Inc., 5.875% Sr. Unsec. Nts., 1/15/231 | | | | | 2,500,000 | | | | 2,462,500 | |
| |
| Endo Finance LLC/Endo Ltd./Endo Finco, Inc.: | |
| 6.00% Sr. Unsec. Nts., 7/15/231 | | | | | 1,205,000 | | | | 1,205,000 | |
| 6.00% Sr. Unsec. Nts., 2/1/251 | | | | | 210,000 | | | | 207,900 | |
| |
| Mallinckrodt International Finance SA/Mallinckrodt CB LLC: | |
| 4.875% Sr. Unsec. Nts., 4/15/201 | | | | | 220,000 | | | | 212,850 | |
| 5.50% Sr. Unsec. Nts., 4/15/251 | | | | | 1,160,000 | | | | 1,073,000 | |
| 5.75% Sr. Unsec. Nts., 8/1/221 | | | | | 930,000 | | | | 897,450 | |
| |
| Valeant Pharmaceuticals International, Inc.: | |
| 5.50% Sr. Unsec. Nts., 3/1/231 | | | | | 2,330,000 | | | | 2,062,050 | |
| 5.875% Sr. Unsec. Nts., 5/15/231 | | | | | 555,000 | | | | 498,113 | |
| | | | | | | | | | |
| | | | | | | | | 13,633,237 | |
| |
| Industrials—6.5% | |
| |
| Aerospace & Defense—1.1% | |
| |
| Aerojet Rocketdyne Holdings, Inc., 7.125% Sec. Nts., 3/15/21 | | | | | 3,980,000 | | | | 4,159,100 | |
| |
| BAE Systems Holdings, Inc., 3.85% Sr. Unsec. Nts., 12/15/251 | | | | | 462,000 | | | | 458,582 | |
| |
| CBC Ammo LLC/CBC FinCo, Inc., 7.25% Sr. Unsec. Nts., 11/15/211 | | | | | 3,455,000 | | | | 2,869,378 | |
| |
| DigitalGlobe, Inc., 5.25% Sr. Unsec. Nts., 2/1/211 | | | | | 910,000 | | | | 768,950 | |
| |
| Erickson, Inc., 8.25% Sec. Nts., 5/1/20 | | | | | 3,057,000 | | | | 1,887,698 | |
| |
| KLX, Inc., 5.875% Sr. Unsec. Nts., 12/1/221 | | | | | 1,200,000 | | | | 1,146,000 | |
| |
| Kratos Defense & Security Solutions, Inc., 7% Sr. Sec. Nts., 5/15/19 | | | | | 1,657,000 | | | | 1,137,116 | |
| |
| L-3 Communications Corp.: | |
| 1.50% Sr. Unsec. Nts., 5/28/17 | | | | | 173,000 | | | | 170,912 | |
| 3.95% Sr. Unsec. Nts., 11/15/16 | | | | | 211,000 | | | | 214,224 | |
| |
| LMI Aerospace, Inc., 7.375% Sec. Nts., 7/15/19 | | | | | 1,555,000 | | | | 1,547,225 | |
| |
| Lockheed Martin Corp.: | | | | | | | | | | |
| 3.55% Sr. Unsec. Nts., 1/15/26 | | | | | 335,000 | | | | 337,412 | |
| 4.70% Sr. Unsec. Nts., 5/15/46 | | | | | 1,246,000 | | | | 1,287,352 | |
| |
| Northrop Grumman Corp., 4.75% Sr. Unsec. Nts., 6/1/43 | | | | | 320,000 | | | | 330,608 | |
| |
| Spirit AeroSystems, Inc., 5.25% Sr. Unsec. Nts., 3/15/22 | | | | | 1,315,000 | | | | 1,348,690 | |
| |
| Textron, Inc., 4.30% Sr. Unsec. Nts., 3/1/24 | | | | | 293,000 | | | | 299,046 | |
| |
| Triumph Group, Inc., 5.25% Sr. Unsec. Nts., 6/1/22 | | | | | 1,975,000 | | | | 1,599,750 | |
| | | | | | | | | | |
| | | | | | | | | 19,562,043 | |
| | | | | | | | | | |
| | | | | Principal Amount | | | Value | |
| |
| Air Freight & Couriers—0.5% | |
| |
| CEVA Group plc, 7% Sr. Sec. Nts., 3/1/211 | | | | $ | 3,665,000 | | | $ | 3,060,275 | |
| |
| FedEx Corp., 4.75% Sr. Unsec. Nts., 11/15/45 | | | | | 1,887,000 | | | | 1,875,705 | |
| |
| Pelabuhan Indonesia II PT, 4.25% Sr. Unsec. Nts., 5/5/251 | | | | | 260,000 | | | | 231,621 | |
| |
| SPL Logistics Escrow LLC/SPL Logistics Finance Corp., 8.875% Sr. Sec. Nts., 8/1/201 | | | | | 2,560,000 | | | | 2,508,800 | |
| |
| XPO Logistics, Inc., 7.875% Sr. Unsec. Nts., 9/1/191 | | | | | 1,870,000 | | | | 1,908,372 | |
| | | | | | | | | | |
| | | | | | | | | 9,584,773 | |
| |
| Airlines—0.3% | |
| |
| Air Canada, 6.75% Sr. Sec. Nts., 10/1/191 | | | | | 3,540,000 | | | | 3,683,813 | |
| |
| Air Medical Merger Sub Corp., 6.375% Sr. Unsec. Nts., 5/15/231 | | | | | 1,160,000 | | | | 1,038,200 | |
| | | | | | | | | | |
| | | | | | | | | 4,722,013 | |
| |
| Building Products—0.4% | |
| |
| Building Materials Corp. of America, 5.375% Sr. Unsec. Nts., 11/15/241 | | | | | 1,860,000 | | | | 1,864,650 | |
| |
| Nortek, Inc., 8.50% Sr. Unsec. Nts., 4/15/21 | | | | | 3,340,000 | | | | 3,482,284 | |
| |
| Owens Corning, 4.20% Sr. Unsec. Nts., 12/15/22 | | | | | 530,000 | | | | 531,436 | |
| |
| USG Corp., 5.50% Sr. Unsec. Nts., 3/1/251 | | | | | 2,000,000 | | | | 2,037,500 | |
| | | | | | | | | | |
| | | | | | | | | 7,915,870 | |
| |
| Commercial Services & Supplies—1.0% | |
| |
| ADT Corp. (The), 5.25% Sr. Unsec. Nts., 3/15/20 | | | | | 3,135,000 | | | | 3,307,425 | |
| |
| Affinion Group, Inc., 7.875% Sr. Unsec. Nts., 12/15/18 | | | | | 3,020,000 | | | | 1,963,000 | |
| |
| Cenveo Corp.: | |
| 6.00% Sr. Sec. Nts., 8/1/191 | | | | | 1,730,000 | | | | 1,228,300 | |
| 8.50% Sec. Nts., 9/15/221 | | | | | 475,000 | | | | 258,875 | |
| |
| Monitronics International, Inc., 9.125% Sr. Unsec. Nts., 4/1/20 | | | | | 3,090,000 | | | | 2,464,275 | |
| |
| Pitney Bowes, Inc., 4.625% Sr. Unsec. Nts., 3/15/24 | | | | | 739,000 | | | | 725,514 | |
| |
| Quad/Graphics, Inc., 7% Sr. Unsec. Nts., 5/1/22 | | | | | 2,380,000 | | | | 1,505,350 | |
| |
| R.R. Donnelley & Sons Co., 7.875% Sr. Unsec. Nts., 3/15/21 | | | | | 2,165,000 | | | | 2,246,729 | |
| |
| Tyco International Finance SA, 5.125% Sr. Unsec. Nts., 9/14/45 | | | | | 1,733,000 | | | | 1,804,924 | |
| |
| West Corp., 5.375% Sr. Unsec. Nts., 7/15/221 | | | | | 3,280,000 | | | | 2,841,300 | |
| | | | | | | | | | |
| | | | | | | | | 18,345,692 | |
| |
| Construction & Engineering—0.0% | |
| |
China Overseas Finance Cayman V Ltd., 3.95% Sr. Unsec. Nts., 11/15/22 | | | | | 315,000 | | | | 313,250 | |
| |
| Electrical Equipment—0.4% | |
| |
| EnerSys, 5% Sr. Unsec. Nts., 4/30/231 | | | | | 2,090,000 | | | | 2,090,000 | |
| |
| General Cable Corp., 5.75% Sr. Unsec. Nts., 10/1/22 | | | | | 2,615,000 | | | | 2,026,625 | |
| |
| Sensata Technologies BV: | |
| 4.875% Sr. Unsec. Nts., 10/15/231 | | | | | 329,000 | | | | 321,186 | |
| 5.625% Sr. Unsec. Nts., 11/1/241 | | | | | 2,400,000 | | | | 2,463,000 | |
| | | | | | | | | | |
| | | | | | | | | 6,900,811 | |
| |
| Industrial Conglomerates—0.1% | |
| |
| CITIC Ltd.: | |
| 6.80% Sr. Unsec. Nts., 1/17/23 | | | | | 470,000 | | | | 543,198 | |
| 7.875% Sub. Perpetual Bonds3,11 | | | | | 345,000 | | | | 350,558 | |
21 OPPENHEIMER GLOBAL STRATEGIC INCOME FUND/VA
CONSOLIDATED STATEMENT OF INVESTMENTS Continued
| | | | | | | | | | |
| | | | | Principal Amount | | | Value | |
| |
| Industrial Conglomerates (Continued) | |
| |
| Roper Technologies, Inc., 3.85% Sr. Unsec. Nts., 12/15/25 | | | | $ | 305,000 | | | $ | 304,286 | |
| | | | | | | | | | |
| | | | | | | | | 1,198,042 | |
| |
| Machinery—1.1% | |
| |
| Amsted Industries, Inc., 5% Sr. Unsec. Nts., 3/15/221 | | | | | 2,410,000 | | | | 2,422,050 | |
| |
| Cleaver-Brooks, Inc., 8.75% Sr. Sec. Nts., 12/15/191 | | | | | 2,870,000 | | | | 2,783,900 | |
| |
| Crane Co., 4.45% Sr. Unsec. Nts., 12/15/23 | | | | | 139,000 | | | | 143,405 | |
| |
| EnPro Industries, Inc., 5.875% Sr. Unsec. Nts., 9/15/22 | | | | | 1,890,000 | | | | 1,880,550 | |
| |
| Ingersoll-Rand Global Holding Co. Ltd., 4.25% Sr. Unsec. Nts., 6/15/23 | | | | | 764,000 | | | | 788,206 | |
| |
| KION Finance SA, 6.75% Sr. Sec. Nts., 2/15/201 | | EUR | | | 1,650,000 | | | | 1,871,340 | |
| |
| Meritor, Inc., 6.25% Sr. Unsec. Nts., 2/15/24 | | | | | 3,585,000 | | | | 3,083,100 | |
| |
| Navistar International Corp., 8.25% Sr. Unsec. Nts., 11/1/21 | | | | | 2,410,000 | | | | 1,662,900 | |
| |
| SKF AB, 2.375% Sr. Unsec. Nts., 10/29/20 | | EUR | | | 270,000 | | | | 309,741 | |
| |
| Stanley Black & Decker, Inc., 2.451% Sub. Nts., 11/17/18 | | | | | 585,000 | | | | 587,697 | |
| |
| Terex Corp., 6% Sr. Unsec. Nts., 5/15/21 | | | | | 1,840,000 | | | | 1,702,000 | |
| |
| Xerium Technologies, Inc., 8.875% Sr. Unsec. Nts., 6/15/18 | | | | | 1,335,000 | | | | 1,310,970 | |
| |
| Xylem, Inc., 3.55% Sr. Unsec. Nts., 9/20/16 | | | | | 553,000 | | | | 560,656 | |
| | | | | | | | | | |
| | | | | | | | | 19,106,515 | |
| |
| Marine—0.0% | |
| |
| AP Moeller-Maersk AS, 3.875% Unsec. Nts., 9/28/251 | | | | | 63,000 | | | | 60,885 | |
| |
| Navios Maritime Holdings, Inc./Navios Maritime Finance II US, Inc., 7.375% Sr. Nts., 1/15/221 | | | | | 1,330,000 | | | | 669,987 | |
| | | | | | | | | | |
| | | | | | | | | 730,872 | |
| |
| Professional Services—0.3% | |
| |
| FTI Consulting, Inc., 6% Sr. Unsec. Nts., 11/15/22 | | | | | 2,740,000 | | | | 2,880,425 | |
| |
| Nielsen Finance LLC/Nielsen Finance Co., 5% Sr. Unsec. Nts., 4/15/221 | | | | | 2,415,000 | | | | 2,393,869 | |
| | | | | | | | | | |
| | | | | | | | | 5,274,294 | |
| |
| Road & Rail—0.3% | |
| |
| Avis Budget Car Rental LLC/Avis Budget Finance, Inc., 5.25% Sr. Unsec. Nts., 3/15/251 | | | | | 2,100,000 | | | | 1,997,625 | |
| |
| Canadian Pacific Railway Co., 4.80% Sr. Unsec. Nts., 9/15/35 | | | | | 111,000 | | | | 109,954 | |
| |
| ERAC USA Finance LLC, 4.50% Sr. Unsec. Nts., 2/15/451 | | | | | 187,000 | | | | 174,463 | |
| |
| Kansas City Southern, 3% Sr. Unsec. Nts., 5/15/231 | | | | | 186,000 | | | | 176,331 | |
| |
| Norfolk Southern Corp., 4.65% Sr. Unsec. Nts., 1/15/46 | | | | | 197,000 | | | | 188,981 | |
| |
| Penske Truck Leasing Co. LP/PTL Finance Corp.: | | | | | |
| 2.50% Sr. Unsec. Nts., 3/15/161 | | | | | 261,000 | | | | 261,466 | |
| 3.75% Sr. Unsec. Nts., 5/11/171 | | | | | 354,000 | | | | 361,258 | |
| 4.25% Sr. Unsec. Nts., 1/17/231 | | | | | 294,000 | | | | 296,384 | |
| |
| Transnet SOC Ltd., 4% Sr. Unsec. Nts., 7/26/221 | | | | | 1,725,000 | | | | 1,530,834 | |
| | | | | | | | | | |
| | | | | | | | | 5,097,296 | |
| | | | | | | | | | |
| | | | | Principal Amount | | | Value | |
| |
| Trading Companies & Distributors—0.9% | |
| |
| Air Lease Corp., 3.875% Sr. Unsec. Nts., 4/1/21 | | | | $ | 615,000 | | | $ | 619,612 | |
| |
| American Builders & Contractors Supply Co., Inc., 5.75% Sr. Unsec. Nts., 12/15/231 | | | | | 340,000 | | | | 343,400 | |
| |
| Building Materials Corp. of America, 6% Sr. Unsec. Nts., 10/15/251 | | | | | 1,710,000 | | | | 1,752,750 | |
| |
| Fly Leasing Ltd.: | |
| 6.375% Sr. Unsec. Nts., 10/15/21 | | | | | 1,845,000 | | | | 1,842,694 | |
| 6.75% Sr. Unsec. Nts., 12/15/20 | | | | | 3,035,000 | | | | 3,121,801 | |
| |
| HD Supply, Inc., 5.25% Sr. Sec. Nts., 12/15/211 | | | | | 4,230,000 | | | | 4,330,463 | |
| |
| Jurassic Holdings III, Inc., 6.875% Sec. Nts., 2/15/211 | | | | | 3,780,000 | | | | 2,286,900 | |
| |
| United Rentals North America, Inc., 4.625% Sr. Sec. Nts., 7/15/23 | | | | | 2,100,000 | | | | 2,102,625 | |
| | | | | | | | | | |
| | | | | | | | | 16,400,245 | |
| |
| Transportation Infrastructure—0.1% | |
| |
| DP World Ltd., 6.85% Sr. Unsec. Nts., 7/2/371 | | | | | 1,745,000 | | | | 1,723,188 | |
| |
| Sydney Airport Finance Co. Pty Ltd., 3.375% Sr. Sec. Nts., 4/30/251 | | | | | 900,000 | | | | 845,835 | |
| | | | | | | | | | |
| | | | | | | | | 2,569,023 | |
| |
| Information Technology—2.4% | |
| |
| Communications Equipment—0.5% | |
| |
| Alcatel-Lucent USA, Inc., 6.75% Sr. Unsec. Nts., 11/15/201 | | | | | 1,679,000 | | | | 1,775,542 | |
| |
| Avaya, Inc., 7% Sr. Sec. Nts., 4/1/191 | | | | | 2,240,000 | | | | 1,680,000 | |
| |
| Blue Coat Holdings, Inc., 8.375% Sr. Unsec. Nts., 6/1/231 | | | | | 1,335,000 | | | | 1,348,350 | |
| |
| CommScope Technologies Finance LLC, 6% Sr. Unsec. Nts., 6/15/251 | | | | | 975,000 | | | | 940,875 | |
| |
| Infor US, Inc.: | |
| 5.75% Sr. Sec. Nts., 8/15/201 | | | | | 340,000 | | | | 343,400 | |
| 6.50% Sr. Unsec. Nts., 5/15/221 | | | | | 1,355,000 | | | | 1,148,363 | |
| |
| Plantronics, Inc., 5.50% Sr. Unsec. Nts., 5/31/231 | | | | | 730,000 | | | | 728,175 | |
| |
| Riverbed Technology, Inc., 8.875% Sr. Unsec. Nts., 3/1/231 | | | | | 910,000 | | | | 845,163 | |
| |
| ViaSat, Inc., 6.875% Sr. Unsec. Nts., 6/15/20 | | | | | 971,000 | | | | 1,008,626 | |
| | | | | | | | | | |
| | | | | | | | | 9,818,494 | |
| |
| Electronic Equipment, Instruments, & Components—0.3% | |
| |
| Arrow Electronics, Inc., 3.50% Sr. Unsec. Nts., 4/1/22 | | | | | 650,000 | | | | 627,008 | |
| |
| Avnet, Inc., 4.875% Sr. Unsec. Unsub. Nts., 12/1/22 | | | | | 166,000 | | | | 170,216 | |
| |
| Belden, Inc., 5.50% Sr. Sub. Nts., 9/1/221 | | | | | 2,065,000 | | | | 1,997,887 | |
| |
| CDW LLC/CDW Finance Corp., 5% Sr. Unsec. Nts., 9/1/23 | | | | | 700,000 | | | | 712,250 | |
| |
| Flextronics International Ltd., 4.75% Sr. Unsec. Nts., 6/15/251 | | | | | 495,000 | | | | 483,244 | |
| |
| Zebra Technologies Corp., 7.25% Sr. Unsec. Nts., 10/15/22 | | | | | 1,955,000 | | | | 2,047,863 | |
| | | | | | | | | | |
| | | | | | | | | 6,038,468 | |
| |
| Internet Software & Services—0.3% | |
| |
| Baidu, Inc., 4.125% Sr. Unsec. Nts., 6/30/25 | | | | | 725,000 | | | | 722,110 | |
| |
| Cerved Group SpA, 6.375% Sr. Sec. Nts., 1/15/201 | | EUR | | | 2,290,000 | | | | 2,577,632 | |
| |
| EarthLink Holdings Corp., 7.375% Sr. Sec. Nts., 6/1/20 | | | | | 1,445,000 | | | | 1,477,512 | |
| | | | | | | | | | |
| | | | | | | | | 4,777,254 | |
22 OPPENHEIMER GLOBAL STRATEGIC INCOME FUND/VA
| | | | | | | | | | |
| | | | | Principal Amount | | | Value | |
| |
| IT Services—0.3% | |
| |
| Fidelity National Information Services, Inc., 2.85% Sr. Unsec. Nts., 10/15/18 | | | | $ | 626,000 | | | $ | 628,637 | |
| |
| Harland Clarke Holdings Corp., 6.875% Sr. Sec. Nts., 3/1/201 | | | | | 1,880,000 | | | | 1,569,800 | |
| |
| Sabre GLBL, Inc., 5.25% Sr. Sec. Nts., 11/15/231 | | | | | 1,585,000 | | | | 1,575,094 | |
| |
| Total System Services, Inc., 2.375% Sr. Unsec. Nts., 6/1/18 | | | | | 506,000 | | | | 501,068 | |
| |
| Visa, Inc., 4.30% Sr. Unsec. Nts., 12/14/45 | | | | | 223,000 | | | | 226,597 | |
| |
| Xerox Corp.: | |
| 2.95% Sr. Unsec. Nts., 3/15/17 | | | | | 222,000 | | | | 223,722 | |
| 6.75% Sr. Unsec. Nts., 2/1/17 | | | | | 111,000 | | | | 116,348 | |
| | | | | | | | | | |
| | | | | | | | | 4,841,266 | |
| |
| Semiconductors & Semiconductor Equipment—0.5% | |
| |
| Freescale Semiconductor, Inc., 6% Sr. Sec. Nts., 1/15/221 | | | | | 4,455,000 | | | | 4,677,750 | |
| |
| Intel Corp., 4.90% Sr. Unsec. Nts., 7/29/45 | | | | | 156,000 | | | | 165,299 | |
| |
| Micron Technology, Inc.: | |
| 5.25% Sr. Unsec. Nts., 8/1/231 | | | | | 2,055,000 | | | | 1,854,638 | |
| 5.875% Sr. Unsec. Nts., 2/15/22 | | | | | 1,385,000 | | | | 1,352,106 | |
| | | | | | | | | | |
| | | | | | | | | 8,049,793 | |
| |
| Software—0.2% | |
| |
| Autodesk, Inc.: | |
| 1.95% Sr. Unsec. Nts., 12/15/17 | | | | | 459,000 | | | | 457,710 | |
| 4.375% Sr. Unsec. Nts., 6/15/25 | | | | | 185,000 | | | | 182,161 | |
| |
| BMC Software Finance, Inc., 8.125% Sr. Unsec. Nts., 7/15/211 | | | | | 775,000 | | | | 518,281 | |
| |
| Informatica LLC, 7.125% Sr. Unsec. Nts., 7/15/231 | | | | | 595,000 | | | | 541,450 | |
| |
| Open Text Corp., 5.625% Sr. Unsec. Nts., 1/15/231 | | | | | 401,000 | | | | 397,992 | |
| |
| Oracle Corp., 3.40% Sr. Unsec. Nts., 7/8/24 | | | | | 437,000 | | | | 444,467 | |
| |
| TIBCO Software, Inc., 11.375% Sr. Unsec. Nts., 12/1/211 | | | | | 780,000 | | | | 655,200 | |
| | | | | | | | | | |
| | | | | | | | | 3,197,261 | |
| |
| Technology Hardware, Storage & Peripherals—0.3% | |
| |
| Apple, Inc., 4.375% Sr. Unsec. Nts., 5/13/45 | | | | | 452,000 | | | | 457,181 | |
| |
| Denali Borrower LLC/Denali Finance Corp., 5.625% Sr. Sec. Nts., 10/15/201 | | | | | 2,760,000 | | | | 2,898,000 | |
| |
| Hewlett Packard Enterprise Co.: | |
| 2.45% Sr. Unsec. Nts., 10/5/171 | | | | | 621,000 | | | | 620,768 | |
| 6.35% Sr. Unsec. Nts., 10/15/451 | | | | | 2,150,000 | | | | 2,047,583 | |
| | | | | | | | | | |
| | | | | | | | | 6,023,532 | |
| |
| Materials—4.3% | |
| |
| Chemicals—1.2% | |
| |
| ADS Waste Holdings, Inc., 8.25% Sr. Unsec. Nts., 10/1/20 | | | | | 1,075,000 | | | | 1,088,438 | |
| |
| Agrium, Inc.: | |
| 3.375% Sr. Unsec. Nts., 3/15/25 | | | | | 258,000 | | | | 235,979 | |
| 4.125% Sr. Unsec. Nts., 3/15/35 | | | | | 129,000 | | | | 110,073 | |
| |
| Arkema SA, 4.75% Jr. Sub. Perpetual Bonds3,11 | | EUR | | | 2,535,000 | | | | 2,726,863 | |
| |
| Blue Cube Spinco, Inc., 9.75% Sr. Unsec. Nts., 10/15/231 | | | | | 1,140,000 | | | | 1,235,475 | |
| |
| Braskem Finance Ltd.: | |
| 5.375% Sr. Unsec. Nts., 5/2/221 | | | | | 355,000 | | | | 296,425 | |
| 6.45% Sr. Unsec. Nts., 2/3/24 | | | | | 240,000 | | | | 207,600 | |
| |
| Chemours Co. (The): | |
| 6.625% Sr. Unsec. Nts., 5/15/231 | | | | | 1,160,000 | | | | 817,800 | |
| 7.00% Sr. Unsec. Nts., 5/15/251 | | | | | 660,000 | | | | 452,100 | |
| |
| Eastman Chemical Co., 4.65% Sr. Unsec. Nts., 10/15/44 | | | | | 187,000 | | | | 166,513 | |
| | | | | | | | | | |
| | | | | Principal Amount | | | Value | |
| |
| Chemicals (Continued) | |
| |
| Hexion, Inc., 6.625% Sr. Sec. Nts., 4/15/20 | | | | $ | 2,125,000 | | | $ | 1,673,438 | |
| |
| Huntsman International LLC, 5.125% Sr. Unsec. Nts., 11/15/221 | | | | | 2,245,000 | | | | 2,031,725 | |
| |
| INEOS Group Holdings SA, 5.875% Sec. Nts., 2/15/191 | | | | | 780,000 | | | | 759,525 | |
| |
| LYB International Finance BV, 5.25% Sr. Unsec. Nts., 7/15/43 | | | | | 175,000 | | | | 168,505 | |
| |
| Methanex Corp., 4.25% Sr. Unsec. Nts., 12/1/24 | | | | | 350,000 | | | | 311,093 | |
| |
| Mexichem SAB de CV, 5.875% Sr. Unsec. Nts., 9/17/441 | | | | | 1,915,000 | | | | 1,613,388 | |
| |
| Momentive Performance Materials, Inc., 3.88% Sr. Sec. Nts., 10/24/21 | | | | | 1,250,000 | | | | 868,750 | |
| |
| ONGC Videsh Ltd.: | |
| 2.75% Sr. Unsec. Nts., 7/15/21 | | EUR | | | 815,000 | | | | 901,298 | |
| 4.625% Sr. Unsec. Nts., 7/15/24 | | | | | 1,890,000 | | | | 1,926,672 | |
| |
| Platform Specialty Products Corp., 6.50% Sr. Unsec. Nts., 2/1/221 | | | | | 955,000 | | | | 830,850 | |
| |
| Techniplas LLC, 10% Sr. Sec. Nts., 5/1/201 | | | | | 2,325,000 | | | | 1,674,000 | |
| |
| Tronox Finance LLC, 6.375% Sr. Unsec. Nts., 8/15/20 | | | | | 2,015,000 | | | | 1,222,702 | |
| |
| Valspar Corp. (The), 3.95% Sr. Unsec. Nts., 1/15/26 | | | | | 418,000 | | | | 416,362 | |
| | | | | | | | | | |
| | | | | | | | | 21,735,574 | |
| |
| Construction Materials—0.3% | |
| |
| Cemex SAB de CV: | |
| 4.375% Sr. Sec. Nts., 3/5/231 | | EUR | | | 75,000 | | | | 74,191 | |
| 4.75% Sr. Sec. Nts., 1/11/221 | | EUR | | | 250,000 | | | | 254,034 | |
| 5.70% Sr. Sec. Nts., 1/11/251 | | | | | 125,000 | | | | 104,844 | |
| |
| CRH America, Inc.: | |
| 5.125% Sr. Unsec. Nts., 5/18/451 | | | | | 409,000 | | | | 410,773 | |
| 6.00% Sr. Unsec. Nts., 9/30/16 | | | | | 299,000 | | | | 307,936 | |
| |
| Globo Comunicacao e Participacoes SA, 4.843% Sr. Unsec. Nts., 6/8/251,3 | | | | | 765,000 | | | | 692,325 | |
| |
| HeidelbergCement Finance Luxembourg SA: | |
| 3.25% Sr. Unsec. Nts., 10/21/21 | | EUR | | | 625,000 | | | | 722,887 | |
| 7.50% Sr. Unsec. Nts., 4/3/20 | | EUR | | | 570,000 | | | | 760,056 | |
| 8.00% Sr. Unsec. Nts., 1/31/17 | | EUR | | | 655,000 | | | | 766,710 | |
| |
| James Hardie International Finance Ltd., 5.875% Sr. Unsec. Nts., 2/15/231 | | | | | 582,000 | | | | 596,550 | |
| |
| Lafarge SA, 4.75% Sr. Unsec. Nts., 9/30/20 | | EUR | | | 930,000 | | | | 1,176,099 | |
| |
| Union Andina de Cementos SAA, 5.875% Sr. Unsec. Nts., 10/30/211 | | | | | 400,000 | | | | 387,000 | |
| | | | | | | | | | |
| | | | | | | | | 6,253,405 | |
| |
| Containers & Packaging—1.2% | |
| |
| Ball Corp., 5% Sr. Unsec. Nts., 3/15/22 | | | | | 1,225,000 | | | | 1,255,625 | |
| |
| Berry Plastics Corp., 5.125% Sec. Nts., 7/15/23 | | | | | 2,200,000 | | | | 2,145,000 | |
| |
| Coveris Holdings SA, 7.875% Sr. Unsec. Nts., 11/1/191 | | | | | 1,880,000 | | | | 1,649,700 | |
| |
| Crown Americas LLC/Crown Americas Capital Corp. IV, 4.50% Sr. Unsec. Nts., 1/15/23 | | | | | 2,120,000 | | | | 2,082,900 | |
| |
| Klabin Finance SA, 5.25% Sr. Unsec. Nts., 7/16/241 | | | | | 1,110,000 | | | | 990,675 | |
| |
| Owens-Brockway Glass Container, Inc., 5% Sr. Unsec. Nts., 1/15/221 | | | | | 1,245,000 | | | | 1,221,656 | |
| |
| Packaging Corp. of America, 4.50% Sr. Unsec. Nts., 11/1/23 | | | | | 660,000 | | | | 694,459 | |
| |
| Reynolds Group Issuer, Inc./Reynolds Group Issuer LLC/Reynolds Group Issuer Luxembourg SA, 5.75% Sr. Sec. Nts., 10/15/20 | | | | | 4,170,000 | | | | 4,252,107 | |
|
| 23 OPPENHEIMER GLOBAL STRATEGIC INCOME FUND/VA |
CONSOLIDATED STATEMENT OF INVESTMENTS Continued
| | | | | | | | | | |
| | | | | Principal Amount | | | Value | |
| |
| Containers & Packaging (Continued) | |
| |
| Sealed Air Corp.: | | | | | | | | | | |
| 4.875% Sr. Unsec. Nts., 12/1/221 | | | | $ | 1,150,000 | | | $ | 1,157,188 | |
| 5.125% Sr. Unsec. Nts., 12/1/241 | | | | | 1,150,000 | | | | 1,155,750 | |
| 6.50% Sr. Unsec. Nts., 12/1/201 | | | | | 1,080,000 | | | | 1,196,100 | |
| |
| Smurfit Kappa Acquisitions, 4.875% Sr. Sec. Nts., 9/15/181 | | | | | 3,175,000 | | | | 3,286,125 | |
| | | | | | | | | | |
| | | | | | | | | 21,087,285 | |
| |
| Metals & Mining—1.4% | | | | | | | | | | |
| |
| ABJA Investment Co. Pte Ltd.: | |
| 4.95% Sr. Unsec. Nts., 5/3/23 | | SGD | | | 250,000 | | | | 154,924 | |
| 5.95% Sr. Unsec. Nts., 7/31/24 | | | | | 300,000 | | | | 251,501 | |
| |
| Alcoa, Inc., 5.125% Sr. Unsec. Nts., 10/1/24 | | | | | 1,960,000 | | | | 1,793,400 | |
| |
| Aleris International, Inc.: | |
| 7.625% Sr. Unsec. Nts., 2/15/18 | | | | | 2,498,000 | | | | 2,135,790 | |
| 7.875% Sr. Unsec. Nts., 11/1/20 | | | | | 1,682,000 | | | | 1,290,094 | |
| |
| ArcelorMittal: | | | | | | | | | | |
| 2.875% Sr. Unsec. Nts., 7/6/20 | | EUR | | | 2,000,000 | | | | 1,765,199 | |
| 5.50% Sr. Unsec. Nts., 2/25/17 | | | | | 3,355,000 | | | | 3,257,370 | |
| 6.125% Sr. Unsec. Nts., 6/1/25 | | | | | 730,000 | | | | 534,725 | |
| |
| Constellium NV, 5.75% Sr. Unsec. Nts., 5/15/241 | | | | | 2,420,000 | | | | 1,657,700 | |
| |
| First Quantum Minerals Ltd., 7.25% Sr. Unsec. Nts., 5/15/221 | | | | | 2,050,000 | | | | 1,291,500 | |
| |
| Glencore Finance Canada Ltd.: | |
| 3.60% Sr. Unsec. Nts., 1/15/171 | | | | | 509,000 | | | | 491,815 | |
| 4.95% Sr. Unsec. Nts., 11/15/211 | | | | | 1,615,000 | | | | 1,301,648 | |
| |
| Glencore Funding LLC: | | | | | | | | | | |
| 4.125% Sr. Unsec. Nts., 5/30/231 | | | | | 2,805,000 | | | | 2,071,815 | |
| 4.625% Sr. Unsec. Nts., 4/29/241 | | | | | 113,000 | | | | 82,624 | |
| |
| Goldcorp, Inc., 5.45% Sr. Unsec. Nts., 6/9/44 | | | | | 173,000 | | | | 139,428 | |
| |
| Metalloinvest Finance Ltd., 5.625% Unsec. Nts., 4/17/201 | | | | | 260,000 | | | | 250,684 | |
| |
| Novelis, Inc., 8.75% Sr. Unsec. Nts., 12/15/20 | | | | | 1,285,000 | | | | 1,185,413 | |
| |
| Southern Copper Corp., 5.875% Sr. Unsec. Nts., 4/23/45 | | | | | 2,260,000 | | | | 1,739,743 | |
| |
| Teck Resources Ltd., 3.15% Sr. Unsec. Nts., 1/15/17 | | | | | 2,330,000 | | | | 2,108,650 | |
| |
| Thompson Creek Metals Co., Inc., 7.375% Sr. Unsec. Nts., 6/1/18 | | | | | 1,095,000 | | | | 219,000 | |
| |
| Wise Metals Group LLC/Wise Alloys Finance Corp., 8.75% Sr. Sec. Nts., 12/15/181 | | | | | 1,300,000 | | | | 991,250 | |
| | | | | | | | | | |
| | | | | | | | | 24,714,273 | |
| |
| Paper & Forest Products—0.2% | | | | | |
| |
| International Paper Co.: | |
| 4.80% Sr. Unsec. Nts., 6/15/44 | | | | | 378,000 | | | | 344,888 | |
| 5.15% Sr. Unsec. Nts., 5/15/46 | | | | | 1,922,000 | | | | 1,835,333 | |
| |
| Inversiones CMPC SA, 6.125% Sr. Unsec. Nts., 11/5/191 | | | | | 205,000 | | | | 219,495 | |
| |
| Metsa Board OYJ, 4% Sr. Unsec. Nts., 3/13/19 | | EUR | | | 300,000 | | | | 352,840 | |
| |
| PaperWorks Industries, Inc., 9.50% Sr. Sec. Nts., 8/15/191 | | | | | 415,000 | | | | 381,800 | |
| | | | | | | | | | |
| | | | | | | | | 3,134,356 | |
| |
| Telecommunication Services—3.6% | |
| |
| Diversified Telecommunication Services—2.5% | |
| |
| AT&T, Inc., 4.35% Sr. Unsec. Nts., 6/15/45 | | | | | 925,000 | | | | 798,029 | |
| |
| British Telecommunications plc, 9.625% Sr. Unsec. Nts., 12/15/30 | | | | | 415,000 | | | | 607,574 | |
| |
| CenturyLink, Inc., Series S, 6.45% Sr. Unsec. Nts., 6/15/21 | | | | | 1,940,000 | | | | 1,901,200 | |
| | | | | | | | | | |
| | | | | Principal Amount | | | Value | |
| |
| Diversified Telecommunication Services (Continued) | |
| |
| Cequel Communications Holdings I LLC/Cequel Capital Corp., 6.375% Sr. Unsec. Nts., 9/15/201 | | | | $ | 5,510,000 | | | $ | 5,406,687 | |
| |
| Colombia Telecomunicaciones SA ESP: 5.375% Sr. Unsec. Nts., 9/27/221 | | | | | 370,000 | | | | 334,850 | |
| 8.50% Sub. Perpetual Bonds1,3,11 | | | | | 55,000 | | | | 47,437 | |
| |
| Deutsche Telekom International Finance BV, 5.75% Sr. Unsec. Nts., 3/23/16 | | | | | 599,000 | | | | 604,564 | |
| |
| DIRECTV Holdings LLC/DIRECTV Financing Co., Inc., 5.15% Sr. Unsec. Nts., 3/15/42 | | | | | 2,065,000 | | | | 1,930,589 | |
| |
| FairPoint Communications, Inc., 8.75% Sr. Sec. Nts., 8/15/191 | | | | | 3,600,000 | | | | 3,559,500 | |
| |
| Frontier Communications Corp.: | |
| 7.125% Sr. Unsec. Nts., 1/15/23 | | | | | 2,190,000 | | | | 1,899,825 | |
| 10.50% Sr. Unsec. Nts., 9/15/221 | | | | | 1,595,000 | | | | 1,589,019 | |
| |
| Intelsat Luxembourg SA, 7.75% Sr. Unsec. Nts., 6/1/21 | | | | | 1,380,000 | | | | 648,600 | |
| |
| Koninklijke KPN NV, 8.375% Sr. Unsec. Nts., 10/1/30 | | | | | 2,710,000 | | | | 3,559,390 | |
| |
| Level 3 Financing, Inc.: | | | | | |
| 5.375% Sr. Unsec. Nts., 8/15/22 | | | | | 130,000 | | | | 132,438 | |
| 5.625% Sr. Unsec. Nts., 2/1/23 | | | | | 1,930,000 | | | | 1,975,837 | |
| |
| Orange SA, 2.75% Sr. Unsec. Nts., 9/14/16 | | | | | 165,000 | | | | 166,878 | |
| |
| Telecom Italia Capital SA, 7.721% Sr. Unsec. Unsub. Nts., 6/4/38 | | | | | 6,517,000 | | | | 6,826,558 | |
| |
| Telefonica Emisiones SAU: | | | | | |
| 3.192% Sr. Unsec. Nts., 4/27/18 | | | | | 577,000 | | | | 588,586 | |
| 7.045% Sr. Unsec. Unsub. Nts., 6/20/36 | | | | | 228,000 | | | | 274,857 | |
| |
| T-Mobile USA, Inc., 6.25% Sr. Unsec. Nts., 4/1/21 | | | | | 2,670,000 | | | | 2,763,450 | |
| |
| Verizon Communications, Inc.: | |
| 3.50% Sr. Unsec. Nts., 11/1/24 | | | | | 250,000 | | | | 247,512 | |
| 4.50% Sr. Unsec. Nts., 9/15/20 | | | | | 1,071,000 | | | | 1,152,070 | |
| 4.522% Sr. Unsec. Nts., 9/15/48 | | | | | 3,358,000 | | | | 3,014,869 | |
| 5.012% Sr. Unsec. Nts., 8/21/54 | | | | | 146,000 | | | | 134,191 | |
| |
| Windstream Services LLC: | | | | | | | | | | |
| 6.375% Sr. Unsec. Nts., 8/1/23 | | | | | 1,155,000 | | | | 835,931 | |
| 7.75% Sr. Unsec. Nts., 10/1/21 | | | | | 2,180,000 | | | | 1,726,288 | |
| |
| Zayo Group LLC/Zayo Capital, Inc., 6% Sr. Unsec. Nts., 4/1/23 | | | | | 2,095,000 | | | | 1,990,250 | |
| | | | | | | | | | |
| | | | | | | | | 44,716,979 | |
| |
| Wireless Telecommunication Services—1.1% | |
| |
| Bharti Airtel International Netherlands BV: | |
| 5.125% Sr. Unsec. Nts., 3/11/231 | | | | | 780,000 | | | | 809,243 | |
| 5.35% Sr. Unsec. Nts., 5/20/241 | | | | | 390,000 | | | | 410,796 | |
| |
| Digicel Group Ltd., 7.125% Sr. Unsec. Nts., 4/1/221 | | | | | 360,000 | | | | 271,800 | |
| |
| Digicel Ltd., 6.75% Sr. Unsec. Nts., 3/1/231 | | | | | 2,425,000 | | | | 2,037,000 | |
| |
| Empresa Nacional de Telecomunicaciones SA, 4.75% Sr. Unsec. Nts., 8/1/261 | | | | | 730,000 | | | | 685,736 | |
| |
| Millicom International Cellular SA, 6% Sr. Unsec. Nts., 3/15/251 | | | | | 580,000 | | | | 495,900 | |
| |
| Mobile Telesystems OJSC via MTS International Funding Ltd., 5% Sr. Unsec. Nts., 5/30/231 | | | | | 750,000 | | | | 695,625 | |
| |
| Rogers Communications, Inc., 3.625% Sr. Unsec. Nts., 12/15/25 | | | | | 122,000 | | | | 120,261 | |
| |
| Sprint Corp., 7.875% Sr. Unsec. Nts., 9/15/23 | | | | | 4,070,000 | | | | 3,066,745 | |
| |
| Telefonica Europe BV, 6.75% Jr. Sub. Perpetual Bonds3,11 | | GBP | | | 4,065,000 | | | | 6,158,864 | |
| |
| Telekom Austria AG, 5.625% Jr. Sub. Perpetual Bonds3,11 | | EUR | | | 1,815,000 | | | | 2,057,710 | |
| |
| Turkcell Iletisim Hizmetleri AS, 5.75% Unsec. Nts., 10/15/251 | | | | | 310,000 | | | | 300,220 | |
24 OPPENHEIMER GLOBAL STRATEGIC INCOME FUND/VA
| | | | | | | | | | |
| | | | | Principal Amount | | | Value | |
| |
| Wireless Telecommunication Services (Continued) | |
| |
| Wind Acquisition Finance SA, 4% Sr. Sec. Nts., 7/15/201 | | EUR | | | 2,225,000 | | | $ | 2,417,501 | |
| | | | | | | | | | |
| | | | | | | | | 19,527,401 | |
| |
| Utilities—3.4% | | | | | | | | | | |
| |
| Electric Utilities—1.6% | | | | | | | | | | |
| |
| AEP Texas Central Co., 3.85% Sr. Unsec. Nts., 10/1/251 | | | | | 291,000 | | | | 294,883 | |
| |
| American Transmission Systems, Inc., 5% Sr. Unsec. Nts., 9/1/441 | | | | | 157,000 | | | | 157,929 | |
| |
| EDP Finance BV: | | | | | |
| 5.25% Sr. Unsec. Nts., 1/14/211 | | | | | 5,066,000 | | | | 5,248,857 | |
| 6.00% Sr. Unsec. Nts., 2/2/181 | | | | | 755,000 | | | | 795,108 | |
| |
| Electricite de France SA: | | | | | |
| 5.25% Jr. Sub. Perpetual Bonds1,3,11 | | | | | 2,247,000 | | | | 2,120,606 | |
| 5.625% Jr. Sub. Perpetual Bonds1,3,11 | | | | | 1,135,000 | | | | 1,083,641 | |
| 6.00% Jr. Sub. Perpetual Bonds3,11 | | GBP | | | 1,015,000 | | | | 1,438,932 | |
| |
| Enel Finance International NV, 6.25% Sr. Unsec. Nts., 9/15/171 | | | | | 574,000 | | | | 611,894 | |
| |
| Enel SpA, 5% Jr. Sub. Nts., 1/15/753 | | EUR | | | 3,915,000 | | | | 4,457,627 | |
| |
| Eskom Holdings SOC Ltd., 6.75% Sr. Unsec. Nts., 8/6/231 | | | | | 655,000 | | | | 571,487 | |
| |
| Israel Electric Corp. Ltd.: | | | | | |
| 6.875% Sr. Sec. Nts., 6/21/231 | | | | | 865,000 | | | | 991,204 | |
| 7.25% Sr. Sec. Nts., 1/15/191 | | | | | 2,520,000 | | | | 2,802,396 | |
| |
| ITC Holdings Corp., 5.30% Sr. Unsec. Nts., 7/1/43 | | | | | 348,000 | | | | 357,622 | |
| |
| MMC Energy. Inc., 8.875% Sr. Unsec. Nts., 10/15/207,18 | | | | | 896,916 | | | | 1 | |
| |
| National Power Corp., 5.875% Sr. Unsec. Nts., 12/19/16 | | PHP | | | 109,600,000 | | | | 2,379,635 | |
| |
| NextEra Energy Capital Holdings, Inc., 1.586% Sr. Unsec. Nts., 6/1/17 | | | | | 629,000 | | | | 626,953 | |
| |
| Perusahaan Listrik Negara PT, 5.50% Sr. Unsec. Nts., 11/22/211 | | | | | 1,345,000 | | | | 1,373,581 | |
| |
| Power Grid Corp. of India Ltd., 8.70% Sec. Nts., 7/15/18 | | INR | | | 30,000,000 | | | | 457,267 | |
| |
| PPL Capital Funding, Inc., 4.20% Sr. Sec. Nts., 6/15/22 | | | | | 533,000 | | | | 555,651 | |
| |
| PPL WEM Ltd./Western Power Distribution Ltd., 5.375% Sr. Unsec. Unsub. Nts., 5/1/211 | | | | | 620,000 | | | | 677,304 | |
| |
| Public Service Co. of New Mexico, 7.95% Sr. Unsec. Nts., 5/15/18 | | | | | 523,000 | | | | 585,644 | |
| |
| Southern Power Co., 1.85% Sr. Unsec. Nts., 12/1/17 | | | | | 596,000 | | | | 596,005 | |
| |
| Trans-Allegheny Interstate Line Co., 3.85% Sr. Unsec. Nts., 6/1/251 | | | | | 389,000 | | | | 389,827 | |
| | | | | | | | | | |
| | | | | | | | | 28,574,054 | |
| |
| Gas Utilities—0.2% | | | | | | | | | | |
| |
| AmeriGas Finance LLC/AmeriGas Finance Corp., 6.75% Sr. Unsec. Nts., 5/20/20 | | | | | 975,000 | | | | 953,063 | |
| |
| ENN Energy Holdings Ltd., 6% Sr. Unsec. Nts., 5/13/211 | | | | | 625,000 | | | | 681,643 | |
| |
| Ferrellgas LP/Ferrellgas Finance Corp., 6.50% Sr. Unsec. Nts., 5/1/21 | | | | | 1,285,000 | | | | 1,098,675 | |
| |
| Gas Natural de Lima y Callao SA, 4.375% Sr. Unsec. Nts., 4/1/231 | | | | | 990,000 | | | | 972,675 | |
| | | | | | | | | | |
| | | | | | | | | 3,706,056 | |
| |
| Independent Power and Renewable Electricity Producers—0.9% | |
| |
| AES Corp., 7.375% Sr. Unsec. Nts., 7/1/21 | | | | | 1,045,000 | | | | 1,071,125 | |
| |
| AES Gener SA, 5% Sr. Unsec. Nts., 7/14/251 | | | | | 465,000 | | | | 445,911 | |
| |
| Calpine Corp.: | | | | | | | | |
| 5.375% Sr. Unsec. Nts., 1/15/23 | | | | | 2,365,000 | | | | 2,134,412 | |
| 7.875% Sr. Sec. Nts., 1/15/231 | | | | | 638,000 | | | | 682,660 | |
| | | | | | | | |
| | | | | Principal Amount | | | Value |
|
| Independent Power and Renewable Electricity Producers (Continued) |
|
| Comision Federal de Electricidad, 4.875% Sr. Unsec. Nts., 1/15/241 | | | | $ | 2,250,000 | | | $ 2,227,500 |
|
| Dynegy, Inc.: | | | | | | | | |
| 5.875% Sr. Unsec. Nts., 6/1/23 | | | | | 420,000 | | | 339,150 |
| 7.375% Sr. Unsec. Nts., 11/1/22 | | | | | 1,580,000 | | | 1,382,500 |
|
| Energy Future Intermediate Holding Co. LLC/EFIH Finance, Inc., 11.75% Sec. Nts., 3/1/221,7 | | | | | 1,487,674 | | | 1,588,092 |
|
| GenOn Energy, Inc., 9.50% Sr. Unsec. Nts., 10/15/18 | | | | | 1,765,000 | | | 1,434,645 |
|
| Hero Asia Investment Ltd., 2.875% Sr. Unsec. Nts., 10/3/17 | | | | | 345,000 | | | 345,690 |
|
| Infinis plc, 7% Sr. Sec. Nts., 2/15/19 | | GBP | | | 1,745,000 | | | 2,649,653 |
|
| Miran Mid-Atlantic Trust, 10.06% Sec. Pass-Through Certificates, Series C, 12/30/28 | | | | | 1,573,485 | | | 1,528,248 |
|
| NRG Energy, Inc., 6.625% Sr. Unsec. Nts., 3/15/23 | | | | | 1,455,000 | | | 1,269,488 |
| | | | | | | | |
| | | | | | | | 17,099,074 |
|
| Multi-Utilities—0.7% | | | | | | | | |
|
| Centrica plc, 3% Jr. Sub. Nts., 4/10/763 | | EUR | | | 3,295,000 | | | 3,302,144 |
|
| CMS Energy Corp., 3.875% Sr. Unsec. Nts., 3/1/24 | | | | | 740,000 | | | 752,849 |
|
| Dominion Gas Holdings LLC, 4.60% Sr. Unsec. Nts., 12/15/44 | | | | | 248,000 | | | 231,226 |
|
| Empresa Electrica Guacolda SA, 4.56% Sr. Unsec. Nts., 4/30/251 | | | | | 325,000 | | | 300,126 |
|
| InterGen NV, 7% Sr. Sec. Nts., 6/30/231 | | | | | 3,185,000 | | | 2,540,038 |
|
| NGG Finance plc, 4.25% Sub. Nts., 6/18/763 | | EUR | | | 4,005,000 | | | 4,557,795 |
|
| NiSource Finance Corp., 4.80% Sr. Unsec. Nts., 2/15/44 | | | | | 261,000 | | | 266,103 |
|
| Puget Energy, Inc., 3.65% Sec. Nts., 5/15/25 | | | | | 312,000 | | | 303,051 |
|
| TECO Finance, Inc., 6.572% Sr. Unsec. Nts., 11/1/17 | | | | | 513,000 | | | 553,031 |
| | | | | | | | |
| | | | | | | | 12,806,363 |
| | | | | | | | |
| Total Corporate Bonds and Notes (Cost $1,049,016,490) | | | | | | | | 963,392,082 |
| | | | | Shares | | | |
| Common Stocks—0.1% | | | | | | | | |
| Arco Capital Corp. Ltd.2,13,18 | | | | | 690,638 | | | — |
|
| Entegra Etc.13 | | | | | 5,233 | | | 1,255,920 |
|
| JP Morgan International, GDR13 | | | | | 446,838 | | | — |
|
| Kaiser Aluminum Corp. | | | | | 205 | | | 17,150 |
|
| Nortek, Inc.13 | | | | | 24,095 | | | 1,051,024 |
|
| Premier Holdings Ltd.13 | | | | | 18,514 | | | — |
|
| Revel Entertainment, Inc.13 | | | | | 16,153 | | | — |
|
| Wallace Theater Holdings, Inc.2,13 | | | | | 1,525 | | | 15 |
| | | | | | | | |
| Total Common Stocks (Cost $4,777,077) | | | | | | | | 2,324,109 |
| | | | | Units | | | |
| Rights, Warrants and Certificates—0.0% |
| MediaNews Group, Inc. Wts., Strike Price $48.72, Exp. 3/19/1713 (Cost $6,331,150) | | | | | 22,685 | | | — |
| | | | | Principal Amount | | | |
| Structured Securities—0.6% |
| Credit Suisse First Boston International, Moitk Total Return Linked Nts., 21%, 3/30/117 | | RUB | | | 53,910,000 | | | — |
|
| Credit Suisse First Boston, Inc. (Nassau Branch), Russian Specialized Construction & Installation Administration Total Return Linked Nts., 13%, 5/24/107 | | RUB | | | 97,250,000 | | | — |
|
Deutsche Bank AG, Coriolanus Ltd. Sec. Credit Linked Bonds: |
| 3.01% Sr. Sec. Nts., 4/30/251,14 | | | | | 1,288,712 | | | 758,213 |
|
| 25 OPPENHEIMER GLOBAL STRATEGIC INCOME FUND/VA |
CONSOLIDATED STATEMENT OF INVESTMENTS Continued
| | | | | | | | | | | | | | |
| | | | | | Principal Amount | | | Value | | | |
| | | |
| Structured Securities (Continued) | | | |
| | | |
| Deutsche Bank AG, Coriolanus Ltd. Sec. Credit Linked Bonds: (Continued) | | | |
| 3.138% Sr. Sec. Nts., 4/30/251,14 | | | | | | $ | 1,267,173 | | | $ | 745,541 | | | |
| 3.191% Sr. Sec. Nts., 4/30/251,14 | | | | | | | 1,577,733 | | | | 928,259 | | | |
| 3.242% Sr. Sec. Nts., 4/30/251,14 | | | | | | | 1,800,742 | | | | 1,059,466 | | | |
| 3.269% Sr. Sec. Nts., 4/30/251,14 | | | | | | | 1,438,582 | | | | 846,390 | | | |
| 3.346% Sr. Sec. Nts., 4/30/251,14 | | | | | | | 1,352,207 | | | | 795,570 | | | |
| 3.905% Sr. Sec. Nts., 4/30/251,14 | | | | | | | 1,642,017 | | | | 966,080 | | | |
| 4.005% Sr. Sec. Nts., 4/30/251,14 | | | | | | | 1,417,619 | | | | 834,056 | | | |
| 43.009% Sr. Sec. Nts., 12/31/172,12 | | | BRL | | | | 7,710,000 | | | | 4,220,484 | | | |
| | | |
| LB Peru Trust II Certificates, Series 1998-A, 3.796%, 2/28/167,14 | | | | | | | 2,994 | | | | — | | | |
| | | |
| Morgan Stanley, Russian Federation Total Return Linked Bonds, Series 007, Cl. VR, 5%, 8/22/34 | | | RUB | | | | 36,224,043 | | | | 219,071 | | | |
| | | | | | | | | | | | | | |
| Total Structured Securities (Cost $19,091,641) | | | | 11,373,130 | | | |
| | | | | | | | |
| | | Principal Amount | | | Value | |
| |
| Short-Term Note—1.6% | |
| |
| United States Treasury Bills, 0.066%, 3/31/168,14 (Cost $29,995,125) | | $ | 30,000,000 | | | $ | 29,987,850 | |
| | |
| | | Shares | | | | |
| |
| Investment Companies—12.9% | |
| |
| Oppenheimer Institutional Money Market Fund, Cl. E, 0.30%19,20 | | | 92,728,261 | | | | 92,728,261 | |
| |
| Oppenheimer Master Event-Linked Bond Fund, LLC19 | | | 3,158,849 | | | | 47,444,391 | |
| |
| Oppenheimer Master Loan Fund, LLC19 | | | 6,443,877 | | | | 92,131,666 | |
| | | | | | | | |
| Total Investment Companies (Cost $242,292,258) | | | | | | | 232,304,318 | |
| | | | | | | | | | | | | | | | | | | | | | | | | | | | | | | | |
| | | Counterparty | | | | | | Exercise Price | | | | | | Expiration Date | | | | | | Contracts | | | | |
| |
| Over-the-Counter Options Purchased—0.1% | | | | | | | | | | | | | | | | | | | | | |
| |
| AUD Currency Put13 | | | BNP | | | | USD | | | | 0.693 | | | | | | | | 3/31/16 | | | | AUD | | | | 27,000,000 | | | | 168,345 | |
| |
| EUR Currency Put13 | | | DEU | | | | USD | | | | 1.075 | | | | | | | | 3/17/16 | | | | EUR | | | | 37,540,000 | | | | 523,645 | |
| |
| KRW Currency Put13 | | | JPM | | | | KRW | | | | 1150.000 | | | | | | | | 1/25/16 | | | | KRW | | | | 21,430,000,000 | | | | 450,030 | |
| |
| MXN Currency Call13 | | | JPM | | | | MXN | | | | 15.060 | | | | | | | | 4/11/16 | | | | MXN | | | | 187,800,000 | | | | 1,127 | |
| |
| TRY Currency Put13 | | | CITNA-B | | | | TRY | | | | 2.973 | | | | | | | | 1/18/16 | | | | TRY | | | | 55,565,000 | | | | 96,739 | |
| | | | | | | | | | | | | | | | | | | | | | | | | | | | | | | | |
| Total Over-the-Counter Options Purchased (Cost $1,926,697) | | | | 1,239,886 | |
| | | | | | | |
| | | Counterparty | | | Pay / Receive Floating Rate | | | Floating Rate | | | Fixed Rate | | | Expiration Date | | | Notional Amount (000’s) | | | | |
| |
| Over-the-Counter Interest Rate Swaptions Purchased—0.1% | |
| |
| Interest Rate Swap maturing 2/2/21 Call13 | | | GSG | | | | Receive | | |
| Three-Month USD
BBA LIBOR |
| | | 1.610% | | | | 1/29/16 | | | | USD | | | | 99,269 | | | | 801,174 | |
| |
| | | | | | | | | |
| If the “FRO 2” is less
than 0.40% at Fixing
Date then the
Floating Rate will be
calculated as
MAX[0;(FRO 1-Strike
Swap Rate)]
|
| | | | | | | | | | | | | | | | | | | | |
| Interest Rate Swap maturing 4/26/18 Call13 | | | DEU | | | | Receive | | | | | 0.800 | | | | 4/24/18 | | | | EUR | | | | 52,600 | | | | 263,434 | |
| |
| Interest Rate Swap maturing 5/30/33 Put13 | | | BAC | | | | Receive | | |
| Six-Month GBP BBA
LIBOR |
| | | 3.990 | | | | 5/30/23 | | | | GBP | | | | 1,235 | | | | 65,015 | |
| |
| Interest Rate Swap maturing 1/2/17 Call13 | | | BOA | | | | Pay | | | | BZDI | | | | 12.545 | | | | 1/4/16 | | | | BRL | | | | 31,000 | | | | — | |
| |
| Interest Rate Swap maturing 1/2/19 Call13 | | | BOA | | | | Pay | | | | BZDI | | | | 11.420 | | | | 1/4/16 | | | | BRL | | | | 31,000 | | | | — | |
| |
| Interest Rate Swap maturing 1/4/21 Call13 | | | BOA | | | | Pay | | | | BZDI | | | | 11.380 | | | | 1/4/16 | | | | BRL | | | | 28,160 | | | | — | |
| | | | | | | | | | | | | | | | | | | | | | | | | | | | | | | | |
| Total Over-the-Counter Interest Rate Swaptions Purchased (Cost $1,131,433) | | | | 1,129,623 | |
|
| |
| Total Investments, at Value (Cost $1,959,243,879) | | | | 100.9% | | | | 1,821,531,785 | |
| |
| Net Other Assets (Liabilities) | | | | | | | | | | | | | | | | (0.9) | | | | (16,679,099) | |
| | | | | | | | | | | | | | | | | | | | | | | | | | | | |
| Net Assets | | | | | | | | | | | | | | | | | | | | | | | | | | | 100.0% | | | $ | 1,804,852,686 | |
| | | | | | | | | | | | | | | | | | | | | | | | | | | | |
Footnotes to Consolidated Statement of Investments
1. Represents securities sold under Rule 144A, which are exempt from registration under the Securities Act of 1933, as amended. These securities have been determined to be liquid under guidelines established by the Board of Trustees. These securities amount to $602,267,339 or 33.37% of the Fund’s net assets at period end.
2. Restricted security. The aggregate value of restricted securities at period end was $6,905,023, which represents 0.38% of the Fund’s net assets. See Note 4 of the accompanying Consolidated Notes. Information concerning restricted securities is as follows:
| | | | | | | | | | | | | | | | | | | | | | |
| Security | | Acquisition Dates | | | | | Cost | | | | | Value | | | | | Unrealized Appreciation/ (Depreciation) | |
| |
| American Credit Acceptance Receivables Trust, Series 2015-3, Cl. B, 3.56%, 10/12/21 | | | 9/30/15 | | | $ | | | 524,947 | | | $ | | | 521,522 | | | $ | | | (3,425) | |
| Arco Capital Corp. Ltd. | | | 6/28/13 | | | | | | — | | | | | | — | | | | | | — | |
| Banc of America Funding Trust, Series 2014-R7, Cl. 3A1, 2.763%, 3/26/36 | | | 3/6/15 | | | | | | 142,885 | | | | | | 142,168 | | | | | | (717) | |
| Brazil Loan Trust 1, 5.477% Sec. Nts., 7/24/23 | | | 7/25/13 - 7/25/14 | | | | | | 533,390 | | | | | | 451,802 | | | | | | (81,588) | |
| Deutsche Bank AG, Coriolanus Ltd. Sec. Credit Linked Bonds, 43.009% Sr. Sec. Nts., 12/31/17 | | | 9/19/07 | | | | | | 3,782,847 | | | | | | 4,220,484 | | | | | | 437,637 | |
| JPMorgan Hipotecaria su Casita, 6.47% Sec. Nts., 8/26/35 | | | 3/21/07 | | | | | | 528,929 | | | | | | 29,996 | | | | | | (498,933) | |
26 OPPENHEIMER GLOBAL STRATEGIC INCOME FUND/VA
| | |
Footnotes to Consolidated Statement of Investments (Continued) |
| | | | | | | | | | | | | | | | | | |
| Security | | Acquisition
Dates | | | Cost | | | Value | | | | | | Unrealized
Appreciation/
(Depreciation) |
|
| LBC Tank Terminals Holding Netherlands BV, 6.875% Sr. Unsec. Nts., 5/15/23 | | | 5/8/13 - 4/17/14 | | | $ | 1,578,310 | | | $ | 1,522,350 | | | | | | | $ (55,960) |
| NC Finance Trust, Series 1999-I, Cl. D, 8.75%, 1/25/29 | | | 8/10/10 | | | | 66,025 | | | | 16,686 | | | | | | | (49,339) |
| Premier Cruises Ltd., 11% Sr. Unsec. Nts., 3/15/08 | | | 3/6/98 | | | | 242,675 | | | | — | | | | | | | (242,675) |
| Wallace Theater Holdings, Inc. | | | 3/28/13 | | | | 15 | | | | 15 | | | | | | | — |
| | | | | | | |
| | | | | | $ | 7,400,023 | | | $ | 6,905,023 | | | | | | | $ (495,000) |
| | | | | | | |
3. Represents the current interest rate for a variable or increasing rate security.
4. Interest-Only Strips represent the right to receive the monthly interest payments on an underlying pool of mortgage loans. These securities typically decline in price as interest rates decline. Most other fixed income securities increase in price when interest rates decline. The principal amount of the underlying pool represents the notional amount on which current interest is calculated. The price of these securities is typically more sensitive to changes in prepayment rates than traditional mortgage-backed securities (for example, GNMA pass-throughs). Interest rates disclosed represent current yields based upon the current cost basis and estimated timing and amount of future cash flows. These securities amount to $4,022,467 or 0.23% of the Fund’s net assets at period end.
5. Interest rate is less than 0.0005%.
6. All or a portion of the security position is when-issued or delayed delivery to be delivered and settled after period end. See Note 4 of the accompanying Consolidated Notes.
7. This security is not accruing income because the issuer has missed an interest payment on it and/or is not anticipated to make future interest and or principal payments. The rate shown is the contractual interest rate. See Note 4 of the accompanying Notes.
8. All or a portion of the security position is held in segregated accounts and pledged to cover margin requirements under certain derivative contracts. The aggregate market value of such securities is $5,711,665. See Note 6 of the accompanying Consolidated Notes.
9. All or a portion of the security position is held in accounts at a futures clearing merchant and pledged to cover margin requirements on open futures contracts and written options on futures, if applicable. The aggregate market value of such securities is $1,306,614. See Note 6 of the accompanying Consolidated Notes.
10. Interest or dividend is paid-in-kind, when applicable.
11. This bond has no contractual maturity date, is not redeemable and contractually pays an indefinite stream of interest.
12. Denotes an inflation-indexed security: coupon or principal are indexed to a consumer price index.
13. Non-income producing security.
14. Zero coupon bond reflects effective yield on the date of purchase.
15. All or a portion of this security is owned by the subsidiary. See Note 2 of the accompanying Consolidated Notes.
16. All or a portion of the security position has been pledged for collateral in association with forward roll transactions. See Note 4 of the accompanying Notes to Financial Statements.
17. Subject to a forbearance agreement. Rate shown is the contractual interest rate. See Note 4 of the accompanying Consolidated Notes.
18. Security received as the result of issuer reorganization.
19. Is or was an affiliate, as defined in the Investment Company Act of 1940, as amended, at or during the reporting period, by virtue of the Fund owning at least 5% of the voting securities of the issuer or as a result of the Fund and the issuer having the same investment adviser. Transactions during the reporting period in which the issuer was an affiliate are as follows:
| | | | | | | | | | | | | | | | |
| | | Shares
December 31, 2014 | | | Gross Additions | | | Gross Reductions | | | Shares
December 31, 2015 | |
| |
| Oppenheimer Institutional Money Market Fund, Cl. E | | | 55,210,591 | | | | 772,496,980 | | | | 734,979,310 | | | | 92,728,261 | |
| Oppenheimer Master Event-Linked Bond Fund, LLC | | | 3,158,849 | | | | — | | | | — | | | | 3,158,849 | |
| Oppenheimer Master Loan Fund, LLC | | | 8,486,824 | | | | — | | | | 2,042,947 | | | | 6,443,877 | |
| Oppenheimer Ultra-Short Duration Fund, Cl. Y | | | 4,508,180 | | | | 8,196 | | | | 4,516,376 | | | | — | |
| | | | |
| | | | | | Value | | | Income | | | Realized Gain (Loss) | |
| |
| Oppenheimer Institutional Money Market Fund, Cl. E | | | | | | $ | 92,728,261 | | | $ | 129,468 | | | $ | — | |
| Oppenheimer Master Event-Linked Bond Fund, LLC | | | | | | | 47,444,391 | | | | 2,616,928 a | | | | 670,947 a | |
| Oppenheimer Master Loan Fund, LLC | | | | | | | 92,131,666 | | | | 5,711,861 b | | | | (1,753,240)b | |
| Oppenheimer Ultra-Short Duration Fund, Cl. Y | | | | | | | — | | | | 82,578 | | | | (33,274) | |
| | | | | | | | |
| Total | | | | | | $ | 232,304,318 | | | $ | 8,540,835 | | | $ | (1,115,567) | |
| | | | | | | | |
a. Represents the amount allocated to the Fund from Oppenheimer Master Event-Linked Bond Fund, LLC.
b. Represents the amount allocated to the Fund from Oppenheimer Master Loan Fund, LLC.
20. Rate shown is the 7-day yield at period end.
| | | | | | | | | | | | | | |
| Distribution of investments representing geographic holdings, as a percentage of total investments at value, is as follows: | | | |
| Geographic Holdings (Unaudited) | | Value | | | | | | Percent | | | |
|
| United States | | $ | 1,231,493,631 | | | | | | | | 67.6 | % | | |
| United Kingdom | | | 69,442,684 | | | | | | | | 3.8 | | | |
| India | | | 51,312,102 | | | | | | | | 2.8 | | | |
| Mexico | | | 46,863,914 | | | | | | | | 2.6 | | | |
| France | | | 36,889,835 | | | | | | | | 2.0 | | | |
| Netherlands | | | 31,100,497 | | | | | | | | 1.7 | | | |
| Ireland | | | 22,991,513 | | | | | | | | 1.3 | | | |
| Italy | | | 22,543,822 | | | | | | | | 1.2 | | | |
| Canada | | | 20,912,905 | | | | | | | | 1.2 | | | |
| Brazil | | | 19,761,644 | | | | | | | | 1.1 | | | |
| Spain | | | 19,162,167 | | | | | | | | 1.1 | | | |
| Supranational | | | 16,991,566 | | | | | | | | 0.9 | | | |
| Luxembourg | | | 15,885,644 | | | | | | | | 0.9 | | | |
| Peru | | | 14,949,650 | | | | | | | | 0.8 | | | |
| Germany | | | 14,579,097 | | | | | | | | 0.8 | | | |
| Romania | | | 13,689,722 | | | | | | | | 0.8 | | | |
| South Africa | | | 13,121,202 | | | | | | | | 0.7 | | | |
27 OPPENHEIMER GLOBAL STRATEGIC INCOME FUND/VA
CONSOLIDATED STATEMENT OF INVESTMENTS Continued
| | | | | | | | | | | | |
| Geographic Holdings (Unaudited / Continued) | | Value | | | | | Percent | | | |
|
Hungary | | $ | 11,858,177 | | | | | | 0.7 | % | | |
Switzerland | | | 10,727,129 | | | | | | 0.6 | | | |
Panama | | | 10,290,112 | | | | | | 0.6 | | | |
China | | | 9,771,583 | | | | | | 0.5 | | | |
Israel | | | 9,748,012 | | | | | | 0.5 | | | |
Colombia | | | 9,568,292 | | | | | | 0.5 | | | |
Indonesia | | | 9,400,462 | | | | | | 0.5 | | | |
Portugal | | | 7,583,985 | | | | | | 0.4 | | | |
Russia | | | 5,801,081 | | | | | | 0.3 | | | |
Kazakhstan | | | 5,724,444 | | | | | | 0.3 | | | |
Australia | | | 5,669,580 | | | | | | 0.3 | | | |
Chile | | | 5,342,586 | | | | | | 0.3 | | | |
Denmark | | | 4,505,430 | | | | | | 0.3 | | | |
Croatia | | | 4,155,710 | | | | | | 0.2 | | | |
Uruguay | | | 4,069,825 | | | | | | 0.2 | | | |
Ukraine | | | 3,722,320 | | | | | | 0.2 | | | |
United Arab Emirates | | | 3,319,658 | | | | | | 0.2 | | | |
Jamaica | | | 3,088,800 | | | | | | 0.2 | | | |
Morocco | | | 2,674,032 | | | | | | 0.2 | | | |
Dominican Republic | | | 2,546,157 | | | | | | 0.1 | | | |
Belgium | | | 2,428,471 | | | | | | 0.1 | | | |
Philippines | | | 2,379,635 | | | | | | 0.1 | | | |
Paraguay | | | 2,347,800 | | | | | | 0.1 | | | |
Sri Lanka | | | 2,225,918 | | | | | | 0.1 | | | |
Austria | | | 2,057,710 | | | | | | 0.1 | | | |
Ivory Coast | | | 1,986,139 | | | | | | 0.1 | | | |
Jersey, Channel Islands | | | 1,974,000 | | | | | | 0.1 | | | |
Greece | | | 1,875,025 | | | | | | 0.1 | | | |
Serbia | | | 1,843,004 | | | | | | 0.1 | | | |
Turkey | | | 1,762,846 | | | | | | 0.1 | | | |
Vietnam | | | 1,353,282 | | | | | | 0.1 | | | |
Namibia | | | 1,176,424 | | | | | | 0.1 | | | |
South Korea | | | 1,072,403 | | | | | | 0.1 | | | |
Japan | | | 953,494 | | | | | | 0.1 | | | |
Eurozone | | | 787,079 | | | | | | 0.1 | | | |
Costa Rica | | | 734,437 | | | | | | 0.1 | | | |
Nigeria | | | 582,919 | | | | | | 0.0 | | | |
Angola | | | 578,150 | | | | | | 0.0 | | | |
Thailand | | | 536,745 | | | | | | 0.0 | | | |
Finland | | | 352,840 | | | | | | 0.0 | | | |
Sweden | | | 309,741 | | | | | | 0.0 | | | |
Bermuda | | | 279,216 | | | | | | 0.0 | | | |
Iraq | | | 260,841 | | | | | | 0.0 | | | |
Malaysia | | | 235,109 | | | | | | 0.0 | | | |
Egypt | | | 179,587 | | | | | | 0.0 | | | |
| | | |
Total | | $ | 1,821,531,785 | | | | | | 100.0 | % | | |
| | | |
|
|
| Forward Currency Exchange Contracts as of December 31, 2015 |
| | | | | | | | | | | | | | | | | | | | | | | | | | | | | | | | |
| Counterparty | | Settlement Month(s) | | | Currency Purchased (000’s) | | | Currency Sold (000’s) | | | | | Unrealized
Appreciation | | | | | Unrealized
Depreciation |
|
BAC | | | 02/2016 | | | INR | | | | | 623,160 | | | USD | | | | | | | 9,293 | | | | | $ | 51,043 | | | | | $ – |
BNP | | | 01/2016 | | | USD | | | | | 7,322 | | | KRW | | | | | | | 8,497,000 | | | | | | 95,772 | | | | | – |
BOA | | | 01/2016 | | | BRL | | | | | 11,770 | | | USD | | | | | | | 3,034 | | | | | | – | | | | | 59,213 |
BOA | | | 01/2016 - 02/2016 | | | INR | | | | | 3,585,840 | | | USD | | | | | | | 53,251 | | | | | | 590,817 | | | | | – |
BOA | | | 01/2016 | | | KRW | | | | | 8,623,000 | | | USD | | | | | | | 7,342 | | | | | | – | | | | | 8,494 |
BOA | | | 01/2016 | | | RUB | | | | | 619,400 | | | USD | | | | | | | 8,768 | | | | | | – | | | | | 331,543 |
BOA | | | 01/2016 | | | TRY | | | | | 21,420 | | | USD | | | | | | | 7,348 | | | | | | – | | | | | 36,201 |
BOA | | | 01/2016 | | | USD | | | | | 3,014 | | | BRL | | | | | | | 11,770 | | | | | | 39,199 | | | | | – |
BOA | | | 03/2016 | | | USD | | | | | 1,004 | | | COP | | | | | | | 3,248,000 | | | | | | – | | | | | 12,999 |
BOA | | | 05/2016 | | | USD | | | | | 68,315 | | | EUR | | | | | | | 63,195 | | | | | | – | | | | | 635,488 |
BOA | | | 05/2016 | | | USD | | | | | 62,984 | | | GBP | | | | | | | 41,415 | | | | | | 1,907,250 | | | | | – |
BOA | | | 01/2016 - 03/2016 | | | USD | | | | | 58,532 | | | INR | | | | | | | 3,978,000 | | | | | | – | | | | | 1,132,562 |
BOA | | | 01/2016 - 02/2016 | | | USD | | | | | 18,601 | | | KRW | | | | | | | 21,641,000 | | | | | | 198,816 | | | | | – |
BOA | | | 06/2016 | | | USD | | | | | 2,373 | | | PHP | | | | | | | 113,000 | | | | | | – | | | | | 2,122 |
CITNA-B | | | 05/2016 | | | USD | | | | | 8,856 | | | CAD | | | | | | | 12,270 | | | | | | – | | | | | 15,912 |
CITNA-B | | | 05/2016 | | | USD | | | | | 9,456 | | | EUR | | | | | | | 8,890 | | | | | | – | | | | | 243,128 |
CITNA-B | | | 01/2016 | | | USD | | | | | 9,080 | | | KRW | | | | | | | 10,677,000 | | | | | | – | | | | | 306 |
CITNA-B | | | 01/2016 | | | USD | | | | | 9,271 | | | RUB | | | | | | | 683,380 | | | | | | – | | | | | 37,135 |
CITNA-B | | | 03/2016 | | | USD | | | | | 10,280 | | | ZAR | | | | | | | 150,040 | | | | | | 681,745 | | | | | – |
DEU | | | 01/2016 | | | JPY | | | | | 1,136,000 | | | USD | | | | | | | 9,227 | | | | | | 227,502 | | | | | – |
DEU | | | 01/2016 | | | USD | | | | | 8,924 | | | JPY | | | | | | | 1,082,000 | | | | | | – | | | | | 80,954 |
DEU | | | 01/2016 | | | USD | | | | | 7,323 | | | TRY | | | | | | | 21,420 | | | | | | 10,890 | | | | | – |
28 OPPENHEIMER GLOBAL STRATEGIC INCOME FUND/VA
| | | | | | | | | | | | | | | | | | | | | | | | | | | | | | | | | | |
|
| Forward Currency Exchange Contracts (Continued) |
| Counterparty | | Settlement Month(s) | | | Currency Purchased (000’s) | | | Currency Sold (000’s) | | | | | Unrealized
Appreciation | | | | | Unrealized
Depreciation |
|
GSCO-OT | | | 01/2016 | | | BRL | | | | | | | 20,990 | | | USD | | | | | | | 5,375 | | | | | $ | – | | | | | $ 69,906 |
GSCO-OT | | | 01/2016 | | | USD | | | | | | | 5,573 | | | BRL | | | | | | | 20,990 | | | | | | 267,481 | | | | | – |
GSCO-OT | | | 01/2016 | | | USD | | | | | | | 846 | | | ZAR | | | | | | | 12,830 | | | | | | 16,639 | | | | | – |
HSBC | | | 01/2016 | | | INR | | | | | | | 615,000 | | | USD | | | | | | | 9,198 | | | | | | 97,849 | | | | | – |
HSBC | | | 05/2016 | | | SGD | | | | | | | 230 | | | USD | | | | | | | 161 | | | | | | 178 | | | | | – |
HSBC | | | 05/2016 | | | USD | | | | | | | 2,266 | | | EUR | | | | | | | 2,085 | | | | | | 5,427 | | | | | 14,357 |
HSBC | | | 01/2016 | | | USD | | | | | | | 9,272 | | | INR | | | | | | | 615,000 | | | | | | – | | | | | 23,792 |
HSBC | | | 05/2016 | | | USD | | | | | | | 322 | | | SGD | | | | | | | 460 | | | | | | – | | | | | 825 |
JPM | | | 01/2016 | | | CNH | | | | | | | 55,600 | | | USD | | | | | | | 9,041 | | | | | | – | | | | | 590,348 |
JPM | | | 05/2016 | | | EUR | | | | | | | 11,180 | | | USD | | | | | | | 12,154 | | | | | | 49,187 | | | | | 6,294 |
JPM | | | 01/2016 | | | JPY | | | | | | | 1,142,000 | | | USD | | | | | | | 9,327 | | | | | | 177,078 | | | | | – |
JPM | | | 01/2016 | | | KRW | | | | | | | 21,226,000 | | | USD | | | | | | | 18,102 | | | | | | 16,396 | | | | | 66,957 |
JPM | | | 01/2016 | | | RUB | | | | | | | 1,058,700 | | | USD | | | | | | | 15,019 | | | | | | – | | | | | 579,865 |
JPM | | | 01/2016 | | | USD | | | | | | | 8,825 | | | CNH | | | | | | | 55,600 | | | | | | 374,359 | | | | | – |
JPM | | | 01/2016 - 05/2016 | | | USD | | | | | | | 15,170 | | | EUR | | | | | | | 13,880 | | | | | | 110,952 | | | | | 49,831 |
JPM | | | 02/2016 - 05/2016 | | | USD | | | | | | | 44,682 | | | INR | | | | | | | 3,009,000 | | | | | | 173,546 | | | | | 413,172 |
JPM | | | 01/2016 - 04/2016 | | | USD | | | | | | | 5,142 | | | RUB | | | | | | | 363,800 | | | | | | 173,261 | | | | | – |
JPM | | | 01/2016 | | | USD | | | | | | | 9,163 | | | SGD | | | | | | | 12,870 | | | | | | 88,712 | | | | | – |
JPM | | | 01/2016 | | | USD | | | | | | | 9,035 | | | TWD | | | | | | | 299,000 | | | | | | – | | | | | 32,280 |
JPM | | | 01/2016 | | | USD | | | | | | | 766 | | | ZAR | | | | | | | 11,740 | | | | | | 6,785 | | | | | – |
MSCO | | | 01/2016 | | | EUR | | | | | | | 8,385 | | | USD | | | | | | | 9,201 | | | | | | – | | | | | 87,036 |
MSCO | | | 01/2016 | | | MXN | | | | | | | 186,000 | | | USD | | | | | | | 11,155 | | | | | | – | | | | | 373,436 |
MSCO | | | 02/2016 | | | USD | | | | | | | 4,785 | | | COP | | | | | | | 14,517,000 | | | | | | 232,850 | | | | | – |
MSCO | | | 05/2016 | | | USD | | | | | | | 3,016 | | | EUR | | | | | | | 2,770 | | | | | | 13,171 | | | | | 18,908 |
MSCO | | | 01/2016 - 04/2016 | | | USD | | | | | | | 46,182 | | | MXN | | | | | | | 769,300 | | | | | | 1,738,899 | | | | | – |
NOM | | | 05/2016 | | | GBP | | | | | | | 1,425 | | | USD | | | | | | | 2,168 | | | | | | – | | | | | 66,351 |
TDB | | | 01/2016 | | | BRL | | | | | | | 35,220 | | | USD | | | | | | | 8,817 | | | | | | 85,579 | | | | | – |
TDB | | | 01/2016 - 02/2016 | | | USD | | | | | | | 25,542 | | | BRL | | | | | | | 95,760 | | | | | | 1,581,415 | | | | | 89,192 |
TDB | | | 05/2016 | | | USD | | | | | | | 28,141 | | | EUR | | | | | | | 26,075 | | | | | | – | | | | | 305,845 |
TDB | | | 05/2016 | | | USD | | | | | | | 851 | | | GBP | | | | | | | 560 | | | | | | 25,316 | | | | | – |
TDB | | | 03/2016 | | | USD | | | | | | | 8,716 | | | HUF | | | | | | | 2,565,000 | | | | | | – | | | | | 113,661 |
TDB | | | 04/2016 | | | USD | | | | | | | 18,281 | | | INR | | | | | | | 1,238,000 | | | | | | – | | | | | 119,495 |
TDB | | | 02/2016 | | | USD | | | | | | | 9,856 | | | KRW | | | | | | | 11,297,000 | | | | | | 250,968 | | | | | – |
TDB | | | 03/2016 | | | USD | | | | | | | 1,902 | | | ZAR | | | | | | | 30,750 | | | | | | – | | | | | 65,431 |
| | | | | | | | | | | | | | | | | | | | | | | | | | |
| Total Unrealized Appreciation and Depreciation | | | | | | $9,289,082 | | | | | $5,683,039 |
| | | | | | | | | | | | | | | | | | | | | | | | | | |
|
|
| Futures Contracts as of December 31, 2015 |
| | | | | | | | | | | | | | | | | | | | | | | | | | |
| Description | | Exchange | | | | | | Buy/Sell | | | Expiration Date | | | Number of Contracts | | | Value | | | Unrealized Appreciation
(Depreciation) |
|
| Euro-Bundesobligation | | | EUX | | | | | | | | Sell | | | | 3/08/16 | | | | 11 | | | $ | 1,887,815 | | | $ 7,639 |
| United States Treasury Long Bonds | | | CBT | | | | | | | | Sell | | | | 3/21/16 | | | | 278 | | | | 42,742,500 | | | 99,416 |
| United States Treasury Long Bonds | | | CBT | | | | | | | | Buy | | | | 3/21/16 | | | | 35 | | | | 5,381,250 | | | (9,553) |
| United States Treasury Nts., 2 yr. | | | CBT | | | | | | | | Sell | | | | 3/31/16 | | | | 123 | | | | 26,719,828 | | | 42,317 |
| United States Treasury Nts., 2 yr. | | | CBT | | | | | | | | Buy | | | | 3/31/16 | �� | | | 329 | | | | 71,470,109 | | | (121,797) |
| United States Treasury Nts., 5 yr. | | | CBT | | | | | | | | Buy | | | | 3/31/16 | | | | 17 | | | | 2,011,445 | | | (6,394) |
| United States Treasury Nts., 10 yr. | | | CBT | | | | | | | | Sell | | | | 3/21/16 | | | | 707 | | | | 89,015,719 | | | 296,810 |
| United States Ultra Bonds | | | CBT | | | | | | | | Buy | | | | 3/21/16 | | | | 197 | | | | 31,261,438 | | | 104,326 |
| | | | | | | | | | | | | | | | | | | | | | | | | | |
| | | | | | | | | | | | | | | | | | | | | | | | | | $ 412,764 |
| | | | | | | | | | | | | | | | | | | | | | | | | | |
|
|
| Over-the-Counter Options Written at December 31, 2015 |
| | | | | | | | | | | | | | | | | | | | | | | | | | | | | | |
| Description | | Counterparty | | | | | | Exercise Price | | | Expiration Date | | | | | | Number of Contracts | | | Premiums Received | | | Value |
|
AUD Currency Put | | | BNP | | | | USD | | | | 0.660 | | | | 3/31/16 | | | | AUD | | | | (28,250,000) | | | $ | 74,015 | | | $ (44,692) |
|
BRL Currency Put | | | GSG | | | | BRL | | | | 25.000 | | | | 9/12/16 | | | | BRL | | | | (25,000,000) | | | | 383,214 | | | (282,765) |
|
COP Currency Put | | | CITNA-B | | | | COP | | | | 3250.000 | | | | 3/2/16 | | | | COP | | | | (9,720,000,000) | | | | 86,552 | | | (97,200) |
|
COP Currency Put | | | GSG | | | | COP | | | | 3230.000 | | | | 3/1/16 | | | | COP | | | | (12,080,000,000) | | | | 90,918 | | | (132,880) |
|
EUR Currency Call | | | DEU | | | | USD | | | | 1.133 | | | | 3/17/16 | | | | EUR | | | | (37,540,000) | | | | 203,467 | | | (180,192) |
|
EUR Currency Put | | | DEU | | | | USD | | | | 1.040 | | | | 3/17/16 | | | | EUR | | | | (37,540,000) | | | | 251,518 | | | (193,368) |
|
EUR Currency Call1 | | | GSG | | | | MXN | | | | 18.000 | | | | 7/20/16 | | | | EUR | | | | (9,375,000) | | | | 345,255 | | | (728,333) |
|
KRW Currency Call | | | JPM | | | | KRW | | | | 1090.000 | | | | 1/25/16 | | | | KRW | | | | (20,310,000,000) | | | | 131,356 | | | – |
|
KRW Currency Put | | | JPM | | | | KRW | | | | 1200.000 | | | | 1/25/16 | | | | KRW | | | | (22,360,000,000) | | | | 138,848 | | | (67,080) |
|
TRY Currency Put | | | CITNA-B | | | | TRY | | | | 3.094 | | | | 1/18/16 | | | | TRY | | | | (57,810,000) | | | | 127,075 | | | (11,157) |
|
ZAR Currency Put | | | BOA | | | | ZAR | | | | 17.000 | | | | 9/14/16 | | | | ZAR | | | | (105,000,000) | | | | 228,814 | | | (284,445) |
| | | | | | | | | | | | | | | | | | | | | | | | | | | |
| Total of Over-the-Counter Options Written | | | $ | 2,061,032 | | | $ (2,022,112) |
| | | | | | | | | | | | | | | | | | | | | | | | | | | |
1. Knock-out option becomes ineligible for exercise if at any time spot rates are less than or equal to 16.5 MXN per 1 EUR.
29 OPPENHEIMER GLOBAL STRATEGIC INCOME FUND/VA
CONSOLIDATED STATEMENT OF INVESTMENTS Continued
|
|
| Centrally Cleared Credit Default Swaps at December 31, 2015 |
| | | | | | | | | | | | | | | | | | | | | | | | | | | | | | | | |
| Reference Asset | | | | | Buy/Sell Protection | | | Fixed Rate | | | Maturity Date | | | | | | Notional Amount (000’s) | | | Premiums Received/(Paid) | | | Value | |
| |
XOVER 24 | | | | | | | Sell | | | | 5.000% | | | | 12/20/20 | | | | EUR | | | | 8,750 | | | $ | (884,467) | | | $ | 753,273 | |
| | | | | | | | | | | | | | | | | | | | | | | | | | | | | | | | |
| |
| Over-the-Counter Credit Default Swaps at December 31, 2015 | |
| Reference Asset | | Counterparty | | | Buy/Sell Protection | | | Fixed Rate | | | Maturity Date | | | | | | Notional Amount (000’s) | | | Premiums Received/(Paid) | | | Value | |
| |
Alpha Bank AE | | | BAC | | | | Buy | | | | 5.000% | | | | 3/20/17 | | | | EUR | | | | 1,165 | | | $ | (136,737) | | | $ | 188,290 | |
| |
| Banco Bilbao Vizcaya Argentaria Sociedad Anonima | | | UBS | | | | Sell | | | | 3.000 | | | | 12/20/17 | | | | EUR | | | | 125 | | | | (60) | | | | 5,580 | |
| |
| Banco Bilbao Vizcaya Argentaria Sociedad Anonima | | | UBS | | | | Sell | | | | 3.000 | | | | 12/20/17 | | | | EUR | | | | 125 | | | | (60) | | | | 5,580 | |
| |
Banco Santander SA | | | UBS | | | | Sell | | | | 3.000 | | | | 9/20/17 | | | | EUR | | | | 250 | | | | (997) | | | | 9,680 | |
| |
Hellenic Republic | | | BAC | | | | Sell | | | | 1.000 | | | | 3/20/20 | | | | USD | | | | 475 | | | | 180,526 | | | | (145,750) | |
| |
Hellenic Republic | | | BAC | | | | Sell | | | | 1.000 | | | | 3/20/20 | | | | USD | | | | 475 | | | | 168,652 | | | | (145,750) | |
| |
Malaysia | | | BNP | | | | Buy | | | | 1.000 | | | | 12/20/20 | | | | USD | | | | 765 | | | | (40,897) | | | | 30,094 | |
| |
Malaysia | | | MOS | | | | Buy | | | | 1.000 | | | | 12/20/20 | | | | USD | | | | 765 | | | | (48,374) | | | | 30,094 | |
| |
| Penerbangan Malaysia Bhd | | | BNP | | | | Buy | | | | 1.000 | | | | 12/20/20 | | | | USD | | | | 1,306 | | | | (67,735) | | | | 51,377 | |
| |
| Penerbangan Malaysia Bhd | | | BOA | | | | Buy | | | | 1.000 | | | | 12/20/20 | | | | USD | | | | 385 | | | | (26,693) | | | | 15,145 | |
| |
| Penerbangan Malaysia Bhd | | | BOA | | | | Buy | | | | 1.000 | | | | 12/20/20 | | | | USD | | | | 1,740 | | | | (91,024) | | | | 68,450 | |
| |
| Penerbangan Malaysia Bhd | | | JPM | | | | Buy | | | | 1.000 | | | | 12/20/20 | | | | USD | | | | 1,320 | | | | (55,715) | | | | 51,927 | |
| |
Republic of Colombia | | | BOA | | | | Buy | | | | 1.000 | | | | 9/20/20 | | | | USD | | | | 2,115 | | | | (85,092) | | | | 144,442 | |
| |
Republic of Colombia | | | BOA | | | | Sell | | | | 1.000 | | | | 12/20/20 | | | | USD | | | | 1,524 | | | | 81,521 | | | | (112,884) | |
| |
Russian Federation | | | BNP | | | | Buy | | | | 1.000 | | | | 12/20/20 | | | | USD | | | | 765 | | | | (81,669) | | | | 73,151 | |
| |
State Bank of India | | | BNP | | | | Sell | | | | 1.000 | | | | 9/20/19 | | | | USD | | | | 1,740 | | | | 71,791 | | | | (14,724) | |
| | | | | | | | | | | | | | | | | | | | | | | | | | | | |
Total Over-the-Counter Credit Default Swaps | | | | | | | | | | | $ | (132,563) | | | $ | 254,702 | |
| | | | | | | | | | | | | | | | | | | | | | | | | | | | |
| | | | | | | | | | | | | | | | |
Type of Reference Asset on which the Fund Sold Protection | | Total Maximum Potential Payments for Selling Credit Protection (Undiscounted) | | | | | Amount Recoverable* | | | | | Reference Asset Rating Range** | |
| |
| Investment Grade Single Name Corporate Debt | | | $ 1,740,000 | | | | | | $ — | | | | | | BBB- | |
| Investment Grade Sovereign Debt | | | 1,524,000 | | | | | | 2,115,000 | | | | | | BBB | |
| Investment Grade Single Name Corporate Debt | | | 500,000 | | | EUR | | | — | | | EUR | | | BBB- to BBB | |
| Non-Investment Grade Corporate Debt Indexes | | | 8,750,000 | | | EUR | | | — | | | EUR | | | B- | |
| Non-Investment Grade Sovereign Debt | | | 950,000 | | | | | | — | | | | | | CCC+ | |
| | | | | | | | | | | | | | | | |
Total | | | $ 4,214,000 | | | | | | $ 2,115,000 | | | | | | | |
| | | | | | | | | | | | | | | | |
Total EUR | | | 9,250,000 | | | EUR | | | — | | | EUR | | | | |
| | | | | | | | | | | | | | | | |
* Amounts recoverable includes potential payments from related purchased protection for instances where the Fund is the seller of protection. In addition, the Fund has no recourse provisions under the credit derivatives and holds no collateral which can offset or reduce potential payments under a triggering event.
** The period end reference asset security ratings, as rated by any rating organization, are included in the equivalent Standard & Poor’s rating category. The reference asset rating represents the likelihood of a potential credit event on the reference asset which would result in a related payment by the Fund.
| | | | | | | | | | | | | | | | | | | | | | | | | | | | | | | | |
| |
| Over-the-Counter Currency Swaps at December 31, 2015 | |
| Counterparty | | Pay/Receive Floating Rate | | | Floating Rate | | | Fixed Rate | | | Maturity Date | | | Notional Amount Currency Received (000’s) | | | Notional Amount Currency Delivered (000’s) | | | Value | |
| |
BOA | | | Pay | | |
| Six-Month USD
BBA LIBOR |
| | | 6.330% | | | | 3/31/20 | | | INR
| | | 145,780 | | | INR
| | | 2,329 | | | $ | (157,513) | |
| |
BOA | | | Pay | | |
| Six-Month USD
BBA LIBOR |
| | | 6.250 | | | | 3/25/20 | | | INR | | | 145,508 | | | INR | | | 2,336 | | | | (174,546) | |
| |
GSG | | | Pay | | |
| Six-Month USD
BBA LIBOR |
| | | 6.300 | | | | 4/9/18 | | | INR | | | 582,000 | | | INR | | | 9,342 | | | | (492,757) | |
| |
GSG | | | Pay | | |
| Six-Month USD
BBA LIBOR |
| | | 6.450 | | | | 3/27/18 | | | INR | | | 905,460 | | | INR | | | 14,529 | | | | (688,090) | |
| | | | | | | | | | | | | | | | | | | | | | | | | | | | | | | | |
| Total Over-the-Counter Currency Swaps | | | | | | | | | | | | | | | | | | | $ | (1,512,906) | |
| | | | | | | | | | | | | | | | | | | | | | | | | | | | | | | | |
| | | | | | | | | | | | | | | | | | | | | | | | | | | | |
| |
| Centrally Cleared Interest Rate Swaps at December 31, 2015 | |
| Counterparty | | Pay/Receive Floating Rate | | | Floating Rate | | | Fixed Rate | | | Maturity Date | | | | | | Notional Amount (000’s) | | | Value | |
| |
DEU | | | Receive | | | | Six-Month HUF BUBOR | | | | 1.800% | | | | 11/6/20 | | | | HUF | | | | 746,700 | | | $ | 18,955 | |
| |
DEU | | | Pay | | | | Six-Month PLN WIBOR WIBO | | | | 2.320 | | | | 10/29/25 | | | | PLN | | | | 5,330 | | | | (13,303) | |
| |
DEU | | | Receive | | | | Six-Month PLN WIBOR WIBO | | | | 1.825 | | | | 10/29/20 | | | | PLN | | | | 10,040 | | | | 17,198 | |
| |
DEU | | | Pay | | | | Six-Month HUF BUBOR | | | | 2.670 | | | | 11/6/25 | | | | HUF | | | | 401,600 | | | | (21,493) | |
| |
GSG | | | Pay | | | | Six-Month PLN WIBOR WIBO | | | | 2.145 | | | | 6/29/18 | | | | PLN | | | | 61,525 | | | | 347,588 | |
| |
JPM | | | Pay | | | | Six-Month PLN WIBOR WIBO | | | | 2.500 | | | | 12/14/25 | | | | PLN | | | | 11,100 | | | | 13,486 | |
| |
JPM | | | Receive | | | | Three-Month HUF BUBOR | | | | 1.910 | | | | 7/8/17 | | | | HUF | | | | 3,550,000 | | | | (58,850) | |
| |
JPM | | | Receive | | | | Three-Month HUF BUBOR | | | | 1.775 | | | | 7/18/17 | | | | HUF | | | | 3,490,000 | | | | (41,081) | |
| | | | | | | | | | | | | | | | | | | | | | | | | | | | |
| Total Centrally Cleared Interest Rate Swaps | | | | | | | | | | | | | | | $ | 262,500 | |
| | | | | | | | | | | | | | | | | | | | | | | | | | | | |
30 OPPENHEIMER GLOBAL STRATEGIC INCOME FUND/VA
| | | | | | | | | | | | | | | | | | | | | | | | | | |
| Over-the-Counter Interest Rate Swaps at December 31, 2015 |
| Counterparty | | Pay/Receive Floating Rate | | | Floating Rate | | | Fixed Rate | | | Maturity Date | | | | | | Notional Amount (000’s) | | | Value |
|
BAC | | | Pay | | | | MXN TIIE BANXICO | | | | 3.860% | | | | 11/17/16 | | | | MXN | | | | 210,000 | | | $1,553 |
|
BAC | | | Pay | | | | MXN TIIE BANXICO | | | | 3.900 | | | | 12/16/16 | | | | MXN | | | | 213,825 | | | 2,791 |
|
BAC | | | Pay | | | | MXN TIIE BANXICO | | | | 4.310 | | | | 12/15/17 | | | | MXN | | | | 108,750 | | | (7,726) |
|
BOA | | | Pay | | |
| Six-Month INR MIBOR OIS
COMPOUND |
| | | 6.980 | | | | 7/30/20 | | | | INR | | | | 460,000 | | | 5,315 |
|
BOA | | | Receive | | |
| One-Time INR MIBOR OIS
COMPOUND |
| | | 7.360 | | | | 7/30/16 | | | | INR | | | | 2,020,000 | | | (90,953) |
|
BOA | | | Pay | | | | BZDI | | | | 13.975 | | | | 1/2/18 | | | | BRL | | | | 40,900 | | | (352,548) |
|
BOA | | | Pay | | | | Three-Month MYR KLIBOR BNM | | | | 4.060 | | | | 7/24/20 | | | | MYR | | | | 20,230 | | | 17,828 |
|
BOA | | | Pay | | |
| Six-Month INR FBIL MIBOR OIS
COMPOUND |
| | | 6.820 | | | | 11/26/20 | | | | INR | | | | 200,000 | | | (17,366) |
|
BOA | | | Pay | | |
| One-Time INR MIBOR OIS
COMPOUND |
| | | 7.015 | | | | 11/26/16 | | | | INR | | | | 850,000 | | | (6,579) |
|
BOA | | | Receive | | | | Three-Month MYR KLIBOR BNM | | | | 3.730 | | | | 7/24/16 | | | | MYR | | | | 94,415 | | | 18,697 |
|
DEU | | | Pay | | | | MXN TIIE BANXICO | | | | 4.330 | | | | 11/3/17 | | | | MXN | | | | 210,400 | | | 6,411 |
|
DEU | | | Pay | | | | Three-Month ILS TELBOR01 | | | | 1.170 | | | | 11/20/19 | | | | ILS | | | | 24,375 | | | (15,655) |
|
GSG | | | Pay | | | | MXN TIIE BANXICO | | | | 3.900 | | | | 12/15/16 | | | | MXN | | | | 216,300 | | | 3,252 |
|
GSG | | | Pay | | | | Three-Month MYR KLIBOR BNM | | | | 4.440 | | | | 3/16/25 | | | | MYR | | | | 30,000 | | | (63,718) |
|
GSG | | | Pay | | | | Six-Month CLP TNA | | | | 4.170 | | | | 5/27/20 | | | | CLP | | | | 810,000 | | | 9,251 |
|
GSG | | | Pay | | | | BZDI | | | | 13.145 | | | | 1/2/17 | | | | BRL | | | | 38,450 | | | (273,845) |
|
GSG | | | Pay | | | | Six-Month CLP TNA | | | | 4.107 | | | | 5/28/20 | | | | CLP | | | | 2,500,000 | | | 19,839 |
|
GSG | | | Pay | | | | MXN TIIE BANXICO | | | | 4.745 | | | | 12/15/17 | | | | MXN | | | | 223,750 | | | (18,193) |
|
HSBC | | | Pay | | | | Six-Month HUF BUBOR | | | | 2.735 | | | | 11/9/25 | | | | HUF | | | | 410,000 | | | (13,953) |
|
HSBC | | | Receive | | | | Six-Month HUF BUBOR | | | | 1.865 | | | | 11/9/20 | | | | HUF | | | | 765,000 | | | 11,316 |
|
| | | | | | | Three-Month CNY | | | | | | | | | | | | | | | | | | | |
JPM | | | Receive | | | | CNREPOFIX=CFXS | | | | 2.630 | | | | 6/26/20 | | | | CNY | | | | 40,605 | | | (23,697) |
| | | | | | | | | | | | | | | | | | | | | | | | | | |
Total Over-the-Counter Interest Rate Swaps | | | $ (787,980) |
| | | | | | | | | | | | | | | | | | | | | | | | | | |
| | | | | | | | | | | | | | | | | | | | | | | | | | | | | | | | | | |
| Over-the-Counter Interest Rate Swaptions Written at December 31, 2015 |
| Description | | Counterparty | | | Pay/Receive
Floating Rate | | | Floating Rate | | | Fixed Rate | | | Expiration Date | | | Notional | | | Amount (000’s) | | | Premiums Received | | | Value |
|
| Interest Rate Swap maturing 1/4/21 Call | | | BOA | | | | Pay | | | | BZDI | | | | 12.580% | | | | 1/4/16 | | | | BRL | | | | 28,160 | | | $ | 54,034 | | | $(699,043) |
|
| Interest Rate Swap maturing 1/2/18 Call | | | BOA | | | | Pay | | | | BZDI | | | | 12.900 | | | | 1/4/16 | | | | BRL | | | | 36,800 | | | | 77,002 | | | (464,553) |
|
| Interest Rate Swap maturing 1/2/19 Call | | | BOA | | | | Pay | | | | BZDI | | | | 14.750 | | | | 1/4/16 | | | | BRL | | | | 31,000 | | | | 34,727 | | | (265,831) |
|
| Interest Rate Swap maturing 1/2/17 Call | | | BOA | | | | Pay | | | | BZDI | | | | 14.320 | | | | 1/4/16 | | | | BRL | | | | 31,000 | | | | 21,449 | | | (93,183) |
|
| Interest Rate Swap maturing 2/2/21 Call | | | GSG | | | | Pay | | |
| Three-Month
USD BBA
LIBOR |
| | | 1.810 | | | | 1/29/16 | | | | USD | | | | 198,537 | | | | 779,259 | | | (521,395) |
|
| Interest Rate Swap maturing 1/2/18 Call | | | JPM | | | | Pay | | | | BZDI | | | | 12.900 | | | | 1/4/16 | | | | BRL | | | | 36,800 | | | | 77,003 | | | (464,554) |
| | | | | | | | | | | | | | | | | | | | | | | | | | | | | | | |
Total Over-the-Counter Interest Rate Swaptions Written | | | $ | 1,043,474 | | | $ (2,508,559) |
| | | | | | | | | | | | | | | | | | | | | | | | | | | | | | | |
| | |
| Glossary: | | |
| Counterparty Abbreviations | | |
| BAC | | Barclays Bank plc |
| BNP | | BNP Paribas |
| BOA | | Bank of America NA |
| CITNA-B | | Citibank NA |
| DEU | | Deutsche Bank AG |
| GSCO-OT | | Goldman Sachs Bank USA |
| GSG | | Goldman Sachs Group, Inc. (The) |
| HSBC | | HSBC Bank USA NA |
| JPM | | JPMorgan Chase Bank NA |
| MOS | | Morgan Stanley & Co., Inc. |
| MSCO | | Morgan Stanley Capital Services, Inc. |
| NOM | | Nomura Global Financial Products, Inc. |
| TDB | | Toronto Dominion Bank |
| UBS | | UBS AG |
|
| Currency abbreviations indicate amounts reporting in currencies |
| AUD | | Australian Dollar |
| BRL | | Brazilian Real |
| CAD | | Canadian Dollar |
| CLP | | Chilean Peso |
| CNH | | Offshore Chinese Renminbi |
| CNY | | Chinese Renminbi |
| COP | | Colombian Peso |
| EUR | | Euro |
| GBP | | British Pound Sterling |
| HUF | | Hungarian Forint |
| ILS | | Israeli Shekel |
| INR | | Indian Rupee |
31 OPPENHEIMER GLOBAL STRATEGIC INCOME FUND/VA
CONSOLIDATED STATEMENT OF INVESTMENTS Continued
| | |
Currency abbreviations (Continued) |
| JPY | | Japanese Yen |
| KRW | | South Korean Won |
| MXN | | Mexican Nuevo Peso |
| MYR | | Malaysian Ringgit |
| PHP | | Philippine Peso |
| PLN | | Polish Zloty |
| RUB | | Russian Ruble |
| SGD | | Singapore Dollar |
| TRY | | New Turkish Lira |
| TWD | | New Taiwan Dollar |
| ZAR | | South African Rand |
|
| Definitions |
| BANXICO | | Banco de Mexico |
| BBA LIBOR | | British Bankers’ Association London - Interbank Offered Rate |
| BNM | | Bank Negra Malaysia |
| BUBOR | | Budapest Interbank Offered Rate |
| BZDI | | Brazil Interbank Deposit Rate |
| CNREPOFIX=CFXS | | Repurchase Fixing Rates |
| FBIL | | Financial Benchmarks India Private Ltd. |
| FRO 1 | | Floating Rate Option 30 yr. Rate |
| FRO 2 | | Floating Rate Option 10 yr. Rate |
| KLIBOR | | Kuala Lumpur Interbank Offered Rate |
| MIBOR | | Mumbai Interbank Offered Rate |
| OIS | | Overnight Index Swap |
| Teleboro1 | | Tel Aviv Interbank Offered Rate 1 Month |
| TIIE | | Interbank Equilibrium Interest Rate |
| TNA | | Non-Deliverable CLP Camara |
| WIBOR WIBO | | Poland Warsaw Interbank Offer Bid Rate |
| XOVER 24 | | iTraxx Europe Crossover Series 24 Version 1 |
|
| Exchange Abbreviations |
| CBT | | Chicago Board of Trade |
| EUX | | European Stock Exchange |
See accompanying Consolidated Notes to Financial Statements.
32 OPPENHEIMER GLOBAL STRATEGIC INCOME FUND/VA
CONSOLIDATED STATEMENT OF ASSETS AND LIABILITIES December 31, 2015
| | |
|
| Assets | | |
Investments, at value—see accompanying statement of investments: | | |
Unaffiliated companies (cost $1,716,951,621) | | $ 1,589,227,467 |
Affiliated companies (cost $242,292,258) | | 232,304,318 |
| | |
| | 1,821,531,785 |
|
Cash | | 19,140,599 |
|
Cash—foreign currencies (cost $3,706,848) | | 3,734,406 |
|
Unrealized appreciation on forward currency exchange contracts | | 9,289,082 |
|
Swaps, at value (premiums paid $635,053) | | 770,063 |
|
Centrally cleared swaps, at value (premiums paid $884,467) | | 1,150,500 |
|
Receivables and other assets: | | |
Interest, dividends and principal paydowns | | 20,658,118 |
Shares of beneficial interest sold | | 7,148,179 |
Investments sold (including $5,184,951 sold on a when-issued or delayed delivery basis) | | 6,152,083 |
Variation margin receivable | | 209,718 |
Other | | 168,940 |
| | |
Total assets | | 1,889,953,473 |
|
|
| Liabilities | | |
Centrally cleared swap collateral due | | 331,775 |
|
Unrealized depreciation on forward currency exchange contracts | | 5,683,039 |
|
Options written, at value (premiums received $2,061,032) | | 2,022,112 |
|
Swaps, at value (premiums received $502,490) | | 2,816,247 |
|
Centrally cleared swaps, at value | | 134,727 |
|
Swaptions written, at value (premiums received $1,043,474) | | 2,508,559 |
|
Payables and other liabilities: | | |
Investments purchased (including $66,019,166 purchased on a when-issued or delayed delivery basis) | | 69,953,647 |
Shares of beneficial interest redeemed | | 645,625 |
Variation margin payable | | 340,363 |
Distribution and service plan fees | | 293,727 |
Shareholder communications | | 130,226 |
Trustees’ compensation | | 84,047 |
Other | | 156,693 |
| | |
Total liabilities | | 85,110,787 |
|
Net Assets | | $ 1,804,852,686 |
| | |
|
|
| Composition of Net Assets | | |
Par value of shares of beneficial interest | | $ 363,270 |
|
Additional paid-in capital | | 1,973,367,776 |
|
Accumulated net investment income | | 90,272,009 |
|
Accumulated net realized loss on investments and foreign currency transactions | | (121,879,025) |
|
Net unrealized depreciation on investments and translation of assets and liabilities denominated in foreign currencies | | (137,271,344) |
| | |
Net Assets | | $ 1,804,852,686 |
| | |
|
|
| Net Asset Value Per Share | | |
Non-Service Shares: | | |
| Net asset value, redemption price per share and offering price per share (based on net assets of $429,709,418 and 88,128,855 shares of beneficial interest outstanding) | | $4.88 |
Service Shares: | | |
| Net asset value, redemption price per share and offering price per share (based on net assets of $1,375,143,268 and 275,141,543 shares of beneficial interest outstanding) | | $5.00 |
See accompanying Consolidated Notes to Financial Statements.
33 OPPENHEIMER GLOBAL STRATEGIC INCOME FUND/VA
CONSOLIDATED STATEMENT OF OPERATIONS For the Year Ended December 31, 2015
| | |
|
| Allocation of Income and Expenses from Master Funds1 | | |
Net investment income allocated from Oppenheimer Master Event-Linked Bond Fund, LLC: | | |
Interest | | $ 2,615,823 |
Dividends | | 1,105 |
Expenses | | (202,815) |
| | |
Net investment income allocated from Oppenheimer Master Event-Linked Bond Fund, LLC | | 2,414,113 |
|
Net investment income allocated from Oppenheimer Master Loan Fund, LLC: | | |
Interest | | 5,676,560 |
Dividends | | 35,301 |
Expenses | | (365,144) |
| | |
Net investment income allocated from Oppenheimer Master Loan Fund, LLC | | 5,346,717 |
| | |
Total allocation of net investment income from master funds | | 7,760,830 |
|
|
| Investment Income | | |
Interest - unaffiliated companies (net of foreign withholding taxes of $457,746) | | 94,869,500 |
|
Fee income on when-issued securities | | 1,643,898 |
|
Dividends: | | |
Unaffiliated companies | | 146,602 |
Affiliated companies | | 212,046 |
| | |
Total investment income | | 96,872,046 |
|
|
| Expenses | | |
Management fees | | 11,920,333 |
|
Distribution and service plan fees: | | |
Service shares | | 3,741,988 |
|
Transfer and shareholder servicing agent fees: | | |
Non-Service shares | | 510,995 |
Service shares | | 1,497,072 |
|
Shareholder communications: | | |
Non-Service shares | | 46,194 |
Service shares | | 140,565 |
|
Custodian fees and expenses | | 227,307 |
|
Trustees’ compensation | | 65,873 |
|
Borrowing fees | | 14,243 |
|
Other | | 312,391 |
| | |
Total expenses | | 18,476,961 |
Less reduction to custodian expenses | | (6,041) |
Less waivers and reimbursements of expenses | | (688,473) |
| | |
Net expenses | | 17,782,447 |
| |
| | |
Net Investment Income | | 86,850,429 |
34 OPPENHEIMER GLOBAL STRATEGIC INCOME FUND/VA
| | |
|
| Realized and Unrealized Gain (Loss) | | |
Net realized gain (loss) on: | | |
Investments from: | | |
Unaffiliated companies (including premiums on options and swaptions exercised) (net of foreign capital gains tax of $84,516) | | $ (57,016,935) |
Affiliated companies | | (33,274) |
Closing and expiration of option contracts written | | 1,219,964 |
Closing and expiration of futures contracts | | (2,672,293) |
Foreign currency transactions | | 7,302,944 |
Swap contracts | | (2,952,858) |
Swaption contracts | | 1,801,787 |
|
Net realized gain (loss) allocated from: | | |
Oppenheimer Master Event-Linked Bond Fund, LLC | | 670,947 |
Oppenheimer Master Loan Fund, LLC | | (1,753,240) |
| | |
Net realized loss | | (53,432,958) |
|
Net change in unrealized appreciation/depreciation on: | | |
Investments | | (55,426,457) |
Translation of assets and liabilities denominated in foreign currencies | | (10,908,001) |
Futures contracts | | (436,856) |
Option contracts written | | 20,956 |
Swap contracts | | (2,705,741) |
Swaption contracts | | (209,992) |
|
Net change in unrealized appreciation/depreciation allocated from: | | |
Oppenheimer Master Event-Linked Bond Fund, LLC | | (1,604,634) |
Oppenheimer Master Loan Fund, LLC | | (4,267,689) |
| | |
Net change in unrealized appreciation/depreciation | | (75,538,414) |
|
|
Net Decrease in Net Assets Resulting from Operations | | $ (42,120,943) |
| | |
1. The Fund invests in certain affiliated mutual funds that expect to be treated as partnerships for tax purposes. See Note 4 of the accompanying Consolidated Notes.
See accompanying Consolidated Notes to Financial Statements.
35 OPPENHEIMER GLOBAL STRATEGIC INCOME FUND/VA
CONSOLIDATED STATEMENTS OF CHANGES IN NET ASSETS
| | | | |
| | | Year Ended
December 31, 2015 | | Year Ended
December 31, 2014 |
|
| Operations | | | | |
Net investment income | | $ 86,850,429 | | $ 107,224,322 |
|
Net realized loss | | (53,432,958) | | (5,459,632) |
|
Net change in unrealized appreciation/depreciation | | (75,538,414) | | (36,151,836) |
| | | | |
Net increase (decrease) in net assets resulting from operations | | (42,120,943) | | 65,612,854 |
|
|
| Dividends and/or Distributions to Shareholders | | | | |
Dividends from net investment income: | | | | |
Non-Service shares | | (29,479,205) | | (31,299,751) |
Service shares | | (81,704,570) | | (63,703,194) |
| | |
| | (111,183,775) | | (95,002,945) |
|
|
| Beneficial Interest Transactions | | | | |
Net increase (decrease) in net assets resulting from beneficial interest transactions: | | | | |
Non-Service shares | | (120,101,219) | | (142,634,078) |
Service shares | | (59,939,490) | | (144,544,896) |
| | | | |
| | (180,040,709) | | (287,178,974) |
|
|
| Net Assets | | | | |
Total decrease | | (333,345,427) | | (316,569,065) |
|
Beginning of period | | 2,138,198,113 | | 2,454,767,178 |
| | | | |
| | |
| End of period (including accumulated net investment income of $90,272,009 and $104,708,911, respectively) | | $ 1,804,852,686 | | $ 2,138,198,113 |
| | |
See accompanying Consolidated Notes to Financial Statements.
36 OPPENHEIMER GLOBAL STRATEGIC INCOME FUND/VA
CONSOLIDATED FINANCIAL HIGHLIGHTS
| | | | | | | | | | | | | | | | | | | | |
| Non-Service Shares | | Year Ended
December 31,
2015 | | | Year Ended
December 31,
2014 | | | Year Ended
December 31,
2013 | | | Year Ended
December 31,
2012 | | | Year Ended
December 30,
20111 | |
| |
Per Share Operating Data | | | | | | | | | | | | | | | | | | | | |
Net asset value, beginning of period | | $ | 5.30 | | | $ | 5.38 | | | $ | 5.67 | | | $ | 5.38 | | | $ | 5.58 | |
| |
Income (loss) from investment operations: | | | | | | | | | | | | | | | | | | | | |
Net investment income2 | | | 0.23 | | | | 0.26 | | | | 0.28 | | | | 0.33 | | | | 0.36 | |
Net realized and unrealized gain (loss) | | | (0.34) | | | | (0.11) | | | | (0.29) | | | | 0.36 | | | | (0.31) | |
| | | | |
Total from investment operations | | | (0.11) | | | | 0.15 | | | | (0.01) | | | | 0.69 | | | | 0.05 | |
| |
Dividends and/or distributions to shareholders: | | | | | | | | | | | | | | | | | | | | |
Dividends from net investment income | | | (0.31) | | | | (0.23) | | | | (0.28) | | | | (0.34) | | | | (0.18) | |
Distributions from net realized gain | | | 0.00 | | | | 0.00 | | | | 0.00 | | | | (0.06) | | | | (0.07) | |
| | | | |
Total dividends and distributions to shareholders | | | (0.31) | | | | (0.23) | | | | (0.28) | | | | (0.40) | | | | (0.25) | |
| |
Net asset value, end of period | | $ | 4.88 | | | $ | 5.30 | | | $ | 5.38 | | | $ | 5.67 | | | $ | 5.38 | |
| | | | |
|
| |
Total Return, at Net Asset Value3 | | | (2.26)% | | | | 2.84% | | | | (0.13)% | | | | 13.53% | | | | 0.85% | |
|
| |
Ratios/Supplemental Data | | | | | | | | | | | | | | | | | | | | |
Net assets, end of period (in thousands) | | $ | 429,710 | | | $ | 586,951 | | | $ | 738,741 | | | $ | 741,996 | | | $ | 648,084 | |
| |
Average net assets (in thousands) | | $ | 510,765 | | | $ | 707,673 | | | $ | 734,707 | | | $ | 690,351 | | | $ | 694,868 | |
| |
Ratios to average net assets:4,5 | | | | | | | | | | | | | | | | | | | | |
Net investment income | | | 4.51% | | | | 4.73% | | | | 5.12% | | | | 6.01% | | | | 6.50% | |
Expenses excluding interest and fees from borrowings | | | 0.76% | | | | 0.74% | | | | 0.74% | | | | 0.77% | | | | 0.77% | |
Interest and fees from borrowings | | | 0.00%6 | | | | 0.00% | | | | 0.00% | | | | 0.00% | | | | 0.00% | |
| | | | |
Total expenses7 | | | 0.76% | | | | 0.74% | | | | 0.74% | | | | 0.77% | | | | 0.77% | |
| Expenses after payments, waivers and/or reimbursements and reduction to custodian expenses | | | 0.73% | | | | 0.71% | | | | 0.72% | | | | 0.71% | | | | 0.71% | |
| |
Portfolio turnover rate8 | | | 79% | | | | 93% | | | | 107% | | | | 78% | | | | 49% | |
1. December 30, 2011 represents the last business day of the Fund’s reporting period. See Note 2 of the accompanying Notes.
2. Per share amounts calculated based on the average shares outstanding during the period.
3. Assumes an initial investment on the business day before the first day of the fiscal period, with all dividends and distributions reinvested in additional shares on the reinvestment date, and redemption at the net asset value calculated on the last business day of the fiscal period. Total returns are not annualized for periods less than one full year. Total return information does not reflect expenses that apply at the separate account level or to related insurance products. Inclusion of these charges would reduce the total return figures for all periods shown. Returns do not reflect the deduction of taxes that a shareholder would pay on fund distributions or the redemption of fund shares.
4. Annualized for periods less than one full year.
5. Includes the Fund’s share of the allocated expenses and/or net investment income from the master funds.
6. Less than 0.005%.
7. Total expenses including indirect expenses from affiliated fund fees and expenses were as follows:
| | | | |
Year Ended December 31, 2015 | | | 0.77 | % |
Year Ended December 31, 2014 | | | 0.75 | % |
Year Ended December 31, 2013 | | | 0.74 | % |
Year Ended December 31, 2012 | | | 0.77 | % |
Year Ended December 30, 2011 | | | 0.77 | % |
8. The portfolio turnover rate excludes purchase and sale transactions of To Be Announced (TBA) mortgage-related securities as follows:
| | | | | | | | | | |
| | | | | Purchase Transactions | | | Sale Transactions | |
| | | |
| | Year Ended December 31, 2015 | | | $1,225,140,927 | | | | $1,266,426,777 | |
| | Year Ended December 31, 2014 | | | $1,348,552,640 | | | | $1,337,346,996 | |
| | Year Ended December 31, 2013 | | | $4,294,357,677 | | | | $4,679,296,373 | |
| | Year Ended December 31, 2012 | | | $3,862,820,437 | | | | $3,466,796,233 | |
| | Year Ended December 30, 2011 | | | $1,050,654,783 | | | | $1,039,506,614 | |
See accompanying Consolidated Notes to Financial Statements.
37 OPPENHEIMER GLOBAL STRATEGIC INCOME FUND/VA
CONSOLIDATED FINANCIAL HIGHLIGHTS Continued
| | | | | | | | | | | | | | | | | | | | |
| Service Shares | | Year Ended
December 31,
2015 | | | Year Ended
December 31,
2014 | | | Year Ended
December 31,
2013 | | | Year Ended
December 31,
2012 | | | Year Ended
December 30,
20111 | |
| |
Per Share Operating Data | | | | | | | | | | | | | | | | | | | | |
Net asset value, beginning of period | | $ | 5.42 | | | $ | 5.50 | | | $ | 5.79 | | | $ | 5.49 | | | $ | 5.68 | |
| |
Income (loss) from investment operations: | | | | | | | | | | | | | | | | | | | | |
Net investment income2 | | | 0.23 | | | | 0.25 | | | | 0.27 | | | | 0.33 | | | | 0.35 | |
Net realized and unrealized gain (loss) | | | (0.35) | | | | (0.11) | | | | (0.29) | | | | 0.36 | | | | (0.31) | |
| | | | |
Total from investment operations | | | (0.12) | | | | 0.14 | | | | (0.02) | | | | 0.69 | | | | 0.04 | |
| |
Dividends and/or distributions to shareholders: | | | | | | | | | | | | | | | | | | | | |
Dividends from net investment income | | | (0.30) | | | | (0.22) | | | | (0.27) | | | | (0.33) | | | | (0.16) | |
Distributions from net realized gain | | | 0.00 | | | | 0.00 | | | | 0.00 | | | | (0.06) | | | | (0.07) | |
| | | | |
Total dividends and distributions to shareholders | | | (0.30) | | | | (0.22) | | | | (0.27) | | | | (0.39) | | | | (0.23) | |
| |
Net asset value, end of period | | $ | 5.00 | | | $ | 5.42 | | | $ | 5.50 | | | $ | 5.79 | | | $ | 5.49 | |
| | | | |
|
| |
Total Return, at Net Asset Value3 | | | (2.49)% | | | | 2.49% | | | | (0.37)% | | | | 13.15% | | | | 0.65% | |
|
| |
Ratios/Supplemental Data | | | | | | | | | | | | | | | | | | | | |
Net assets, end of period (in thousands) | | $ | 1,375,143 | | | $ | 1,551,247 | | | $ | 1,716,026 | | | $ | 1,840,721 | | | $ | 1,604,906 | |
| |
Average net assets (in thousands) | | $ | 1,496,350 | | | $ | 1,646,615 | | | $ | 1,794,640 | | | $ | 1,715,995 | | | $ | 1,673,715 | |
| |
Ratios to average net assets:4,5 | | | | | | | | | | | | | | | | | | | | |
Net investment income | | | 4.26% | | | | 4.48% | | | | 4.88% | | | | 5.76% | | | | 6.25% | |
Expenses excluding interest and fees from borrowings | | | 1.01% | | | | 0.99% | | | | 0.99% | | | | 1.02% | | | | 1.02% | |
Interest and fees from borrowings | | | 0.00%6 | | | | 0.00% | | | | 0.00% | | | | 0.00% | | | | 0.00% | |
| | | | |
Total expenses7 | | | 1.01% | | | | 0.99% | | | | 0.99% | | | | 1.02% | | | | 1.02% | |
| Expenses after payments, waivers and/or reimbursements and reduction to custodian expenses | | | 0.98% | | | | 0.96% | | | | 0.97% | | | | 0.96% | | | | 0.96% | |
| |
Portfolio turnover rate8 | | | 79% | | | | 93% | | | | 107% | | | | 78% | | | | 49% | |
1. December 30, 2011 represents the last business day of the Fund’s reporting period. See Note 2 of the accompanying Notes.
2. Per share amounts calculated based on the average shares outstanding during the period.
3. Assumes an initial investment on the business day before the first day of the fiscal period, with all dividends and distributions reinvested in additional shares on the reinvestment date, and redemption at the net asset value calculated on the last business day of the fiscal period. Total returns are not annualized for periods less than one full year. Total return information does not reflect expenses that apply at the separate account level or to related insurance products. Inclusion of these charges would reduce the total return figures for all periods shown. Returns do not reflect the deduction of taxes that a shareholder would pay on fund distributions or the redemption of fund shares.
4. Annualized for periods less than one full year.
5. Includes the Fund’s share of the allocated expenses and/or net investment income from the master funds.
6. Less than 0.005%.
7. Total expenses including indirect expenses from affiliated fund fees and expenses were as follows:
| | | | |
Year Ended December 31, 2015 | | | 1.02 | % |
Year Ended December 31, 2014 | | | 1.00 | % |
Year Ended December 31, 2013 | | | 0.99 | % |
Year Ended December 31, 2012 | | | 1.02 | % |
Year Ended December 30, 2011 | | | 1.02 | % |
8. The portfolio turnover rate excludes purchase and sale transactions of To Be Announced (TBA) mortgage-related securities as follows:
| | | | | | | | | | |
| | | | | Purchase Transactions | | | Sale Transactions | |
| | | |
| | Year Ended December 31, 2015 | | | $1,225,140,927 | | | | $1,266,426,777 | |
| | Year Ended December 31, 2014 | | | $1,348,552,640 | | | | $1,337,346,996 | |
| | Year Ended December 31, 2013 | | | $4,294,357,677 | | | | $4,679,296,373 | |
| | Year Ended December 31, 2012 | | | $3,862,820,437 | | | | $3,466,796,233 | |
| | Year Ended December 30, 2011 | | | $1,050,654,783 | | | | $1,039,506,614 | |
See accompanying Consolidated Notes to Financial Statements.
38 OPPENHEIMER GLOBAL STRATEGIC INCOME FUND/VA
NOTES TO CONSOLIDATED FINANCIAL STATEMENTS December 31, 2015
1. Organization
Oppenheimer Global Strategic Income Fund/VA (the “Fund”), a separate series of Oppenheimer Variable Account Funds, is a diversified open-end management investment company registered under the Investment Company Act of 1940 (“1940 Act”), as amended. The Fund’s main investment objective is to seek total return. The Fund’s investment adviser is OFI Global Asset Management, Inc. (“OFI Global” or the “Manager”), a wholly-owned subsidiary of OppenheimerFunds, Inc. (“OFI” or the “Sub-Adviser”). The Manager has entered into a sub-advisory agreement with OFI. Shares of the Fund are sold only to separate accounts of life insurance companies.
The Fund offers two classes of shares. Both classes are sold at their offering price, which is the net asset value per share, to separate investment accounts of participating insurance companies as an underlying investment for variable life insurance policies, variable annuity contracts or other investment products. The class of shares designated as Service shares is subject to a distribution and service plan. Both classes of shares have identical rights and voting privileges with respect to the Fund in general and exclusive voting rights on matters that affect that class alone. Earnings, net assets and net asset value per share may differ due to each class having its own expenses, such as transfer and shareholder servicing agent fees and shareholder communications, directly attributable to that class.
The following is a summary of significant accounting policies followed in the Fund’s preparation of financial statements in accordance with accounting principles generally accepted in the United States (“U.S. GAAP”).
2. Significant Accounting Policies
Security Valuation. All investments in securities are recorded at their estimated fair value, as described in Note 3.
Basis for Consolidation. The Fund has established a Cayman Islands exempted company, Oppenheimer Global Strategic Income Fund (Cayman) Ltd., which is wholly-owned and controlled by the Fund (the “Subsidiary”). The Fund and Subsidiary are both managed by the Manager. The Fund may invest up to 25% of its total assets in the Subsidiary. The Subsidiary invests primarily in commodity-linked derivatives (including commodity futures, financial futures, options and swap contracts) and exchange traded funds related to gold or other special minerals (“Gold ETFs”). The Subsidiary is subject to the same investment restrictions and guidelines, and follows the same compliance policies and procedures, as the Fund.
The financial statements have been consolidated and include accounts of the Fund and the Subsidiary. Accordingly, all inter-company transactions and balances have been eliminated. At period end, the Fund owned 139,825 shares with net assets of $11,944,412 in the Subsidiary.
Other financial information at period end:
| | | | |
Total market value of investments | | $ | 4,543,495 | |
Net assets | | $ | 11,944,412 | |
Net income (loss) | | $ | (22,110) | |
Net realized gain (loss) | | $ | (173,977) | |
Net change in unrealized appreciation/depreciation | | $ | (187,860) | |
Foreign Currency Translation. The Fund’s accounting records are maintained in U.S. dollars. The values of securities denominated in foreign currencies and amounts related to the purchase and sale of foreign securities and foreign investment income are translated into U.S. dollars as of the close of the New York Stock Exchange (the “Exchange”), normally 4:00 P.M. Eastern time, on each day the Exchange is open for trading. Foreign exchange rates may be valued primarily using a reliable bank, dealer or service authorized by the Board of Trustees.
Reported net realized gains and losses from foreign currency transactions arise from sales of portfolio securities, sales and maturities of short-term securities, sales of foreign currencies, exchange rate fluctuations between the trade and settlement dates on securities transactions, and the difference between the amounts of dividends, interest, and foreign withholding taxes recorded on the Fund’s books and the U.S. dollar equivalent of the amounts actually received or paid. Net unrealized appreciation and depreciation on the translation of assets and liabilities denominated in foreign currencies arise from changes in the values of assets and liabilities, including investments in securities at fiscal period end, resulting from changes in exchange rates.
The effect of changes in foreign currency exchange rates on investments is separately identified from the fluctuations arising from changes in market values of securities held and reported with all other foreign currency gains and losses in the Fund’s Consolidated Statement of Operations.
Allocation of Income, Expenses, Gains and Losses. Income, expenses (other than those attributable to a specific class), gains and losses are allocated on a daily basis to each class of shares based upon the relative proportion of net assets represented by such class. Operating expenses directly attributable to a specific class are charged against the operations of that class.
Dividends and Distributions to Shareholders. Dividends and distributions to shareholders, which are determined in accordance with income tax regulations and may differ from U.S. GAAP, are recorded on the ex-dividend date. Income and capital gain distributions, if any, are declared and paid annually or at other times as deemed necessary by the Manager.
Investment Income. Dividend income is recorded on the ex-dividend date or upon ex-dividend notification in the case of certain foreign dividends where the ex-dividend date may have passed. Non-cash dividends included in dividend income, if any, are recorded at the fair market value of the securities received. Interest income is recognized on an accrual basis. Discount and premium, which are included in interest income on the Consolidated Statement of Operations, are amortized or accreted daily.
39 OPPENHEIMER GLOBAL STRATEGIC INCOME FUND/VA
NOTES TO CONSOLIDATED FINANCIAL STATEMENTS Continued
2. Significant Accounting Policies (Continued)
Custodian Fees. “Custodian fees and expenses” in the Consolidated Statement of Operations may include interest expense incurred by the Fund on any cash overdrafts of its custodian account during the period. Such cash overdrafts may result from the effects of failed trades in portfolio securities and from cash outflows resulting from unanticipated shareholder redemption activity. The Fund pays interest to its custodian on such cash overdrafts, to the extent they are not offset by positive cash balances maintained by the Fund, at a rate equal to the Federal Funds Rate plus 0.50%. The “Reduction to custodian expenses” line item, if applicable, represents earnings on cash balances maintained by the Fund during the period. Such interest expense and other custodian fees may be paid with these earnings.
Security Transactions. Security transactions are recorded on the trade date. Realized gains and losses on securities sold are determined on the basis of identified cost.
Indemnifications. The Fund’s organizational documents provide current and former Trustees and officers with a limited indemnification against liabilities arising in connection with the performance of their duties to the Fund. In the normal course of business, the Fund may also enter into contracts that provide general indemnifications. The Fund’s maximum exposure under these arrangements is unknown as this would be dependent on future claims that may be made against the Fund. The risk of material loss from such claims is considered remote.
Federal Taxes. The Fund intends to comply with provisions of the Internal Revenue Code applicable to regulated investment companies and to distribute substantially all of its investment company taxable income, including any net realized gain on investments not offset by capital loss carryforwards, if any, to shareholders. Therefore, no federal income or excise tax provision is required. The Fund files income tax returns in U.S. federal and applicable state jurisdictions. The statute of limitations on the Fund’s tax return filings generally remains open for the three preceding fiscal reporting period ends.
Subchapter M requires, among other things, that at least 90% of the Fund’s gross income be derived from securities or derived with respect to its business of investing in securities (typically referred to as “qualifying income”). Income from commodity-linked derivatives may not be treated as “qualifying income” for purposes of the 90% gross income requirement. The Internal Revenue Service (IRS) has previously issued a number of private letter rulings which conclude that income derived from commodity index-linked notes and investments in a wholly-owned subsidiary will be “qualifying income.” As a result, the Fund will gain exposure to commodities through commodity-linked notes and its wholly-owned subsidiary.
The IRS has suspended the granting of private letter rulings pending further review. As a result, there can be no assurance that the IRS will not change its position with respect to commodity-linked notes and wholly-owned subsidiaries. In addition, future legislation and guidance from the Treasury and the IRS may adversely affect the fund’s ability to gain exposure to commodities through commodity-linked notes and its wholly-owned subsidiary.
The Fund is required to include in income for federal income tax purposes all of the subsidiary’s net income and gains whether or not such income is distributed by the subsidiary. Net income and gains from the subsidiary are generally treated as ordinary income by the Fund, regardless of the character of the subsidiary’s underlying income. Net losses from the subsidiary do not pass through to the Fund for federal income tax purposes.
The tax components of capital shown in the following table represent distribution requirements the Fund must satisfy under the income tax regulations, losses the Fund may be able to offset against income and gains realized in future years and unrealized appreciation or depreciation of securities and other investments for federal income tax purposes.
| | | | | | | | | | | | |
Undistributed Net Investment Income | | Undistributed
Long-Term
Gain | | | Accumulated Loss
Carryforward1,2,3,4,5 | | | Net Unrealized
Depreciation
Based on cost of
Securities and
Other Investments
for Federal Income
Tax Purposes | |
| |
$81,686,441 | | | $— | | | | $112,354,690 | | | | $137,433,590 | |
1. At period end, the Fund had $112,171,105 of net capital loss carryforward available to offset future realized capital gains, if any, and thereby reduce future taxable gain distributions. Details of the capital loss carryforwards are included in the table below. Capital loss carryovers with no expiration, if any, must be utilized prior to those with expiration dates.
| | | | |
| Expiring | | | |
| |
2016 | | $ | 3,339,490 | |
No expiration | | | 108,831,615 | |
| | | | |
Total | | $ | 112,171,105 | |
| | | | |
$3,339,490 of the capital loss carryforward is due to merger activity and is subject to annual Sec. 382 limits of $3,339,490 per year.
2. The Fund had $183,585 of straddle losses which were deferred.
3. During the reporting period, the Fund did not utilize any capital loss carryforward.
4. During the previous reporting period, the Fund utilized $11,497,573 of capital loss carryforward to offset capital gains realized in that fiscal year.
5. During the reporting period, $5,751,368 of unused capital loss carryforward expired.
Net investment income (loss) and net realized gain (loss) may differ for financial statement and tax purposes. The character of dividends and distributions made during the fiscal year from net investment income or net realized gains are determined in accordance with federal income tax requirements, which may differ from the character of net investment income or net realized gains presented in those financial statements in accordance with U. S. GAAP.
40 OPPENHEIMER GLOBAL STRATEGIC INCOME FUND/VA
2. Significant Accounting Policies (Continued)
Also, due to timing of dividends and distributions, the fiscal year in which amounts are distributed may differ from the fiscal year in which the income or net realized gain was recorded by the Fund.
Accordingly, the following amounts have been reclassified for the reporting period. Net assets of the Fund were unaffected by the reclassifications.
| | | | | | | | |
Reduction to Paid-in Capital | | Increase
to Accumulated
Net Investment
Income | | | Increase
to Accumulated Net
Realized Loss on Investments | |
| |
$5,751,971 | | | $9,896,444 | | | | $4,144,473 | |
The tax character of distributions paid during the reporting periods:
| | | | | | | | |
| | | Year Ended
December 31, 2015 | | | Year Ended
December 31, 2014 | |
| |
Distributions paid from: | | | | | | | | |
Ordinary income | | | $ 111,183,775 | | | | $ 95,002,945 | |
The aggregate cost of securities and other investments and the composition of unrealized appreciation and depreciation of securities and other investments for federal income tax purposes at period end are noted in the following table. The primary difference between book and tax appreciation or depreciation of securities and other investments, if applicable, is attributable to the tax deferral of losses or tax realization of financial statement unrealized gain or loss.
| | | | |
Federal tax cost of securities | | $ | 1,956,345,007 | |
Federal tax cost of other investments | | | (45,973,894) | |
| | | | |
Total federal tax cost | | $ | 1,910,371,113 | |
| | | | |
Gross unrealized appreciation | | $ | 46,984,778 | |
Gross unrealized depreciation | | | (184,418,368) | |
| | | | |
Net unrealized depreciation | | $ | (137,433,590) | |
| | | | |
Recent Accounting Pronouncement. In May 2015, Financial Accounting Standards Board (“FASB”) issued Accounting Standards Update (“ASU”), ASU 2015-07. This is an update to Fair Value Measurement Topic 820. Under the amendments in this ASU, investments for which fair value is measured at net asset value per share (or its equivalent) using the practical expedient should not be categorized in the fair value hierarchy. ASU 2015-17 is effective for financial statements issued for fiscal years beginning after December 15, 2015, and interim periods within those fiscal years. At period end, the Manager does not believe the adoption of the ASU will have a material effect on the financial statements or disclosures.
Use of Estimates. The preparation of financial statements in conformity with U.S. GAAP requires management to make estimates and assumptions that affect the reported amounts of assets and liabilities and disclosure of contingent assets and liabilities at the date of the financial statements and the reported amounts of increases and decreases in net assets from operations during the reporting period. Actual results could differ from those estimates.
3. Securities Valuation
The Fund calculates the net asset value of its shares as of the close of the New York Stock Exchange (the “Exchange”), normally 4:00 P.M. Eastern time, on each day the Exchange is open for trading, except in the case of a scheduled early closing of the Exchange, in which case the Fund will calculate net asset value of the shares as of the scheduled early closing time of the Exchange.
The Fund’s Board has adopted procedures for the valuation of the Fund’s securities and has delegated the day-to-day responsibility for valuation determinations under those procedures to the Manager. The Manager has established a Valuation Committee which is responsible for determining a “fair valuation” for any security for which market quotations are not “readily available.” The Valuation Committee’s fair valuation determinations are subject to review, approval and ratification by the Fund’s Board at its next regularly scheduled meeting covering the calendar quarter in which the fair valuation was determined.
Valuation Methods and Inputs
Securities are valued using unadjusted quoted market prices, when available, as supplied primarily by third party pricing services or dealers.
The following methodologies are used to determine the market value or the fair value of the types of securities described below:
Securities traded on a registered U.S. securities exchange (including exchange-traded derivatives other than futures and futures options) are valued based on the last sale price of the security reported on the principal exchange on which it is traded, prior to the time when the Fund’s assets are valued. In the absence of a sale, the security is valued at the mean between the bid and asked price on the principal exchange or, if not available from the principal exchange, obtained from two dealers. If bid and asked prices are not available from either the exchange or two dealers, the security is valued by using one of the following methodologies (listed in order of priority): (1) a bid from the principal exchange, (2) the mean between the bid and asked price as provided by a single dealer, or (3) a bid from a single dealer. A security of a foreign issuer traded on a foreign exchange, but not listed on a registered U.S. securities exchange, is valued based on the last sale price on the principal exchange on which the security is traded, as identified by the third party pricing service used by the Manager, prior to the time when the Fund’s assets are valued. If the last sale price is unavailable, the security is valued at the
41 OPPENHEIMER GLOBAL STRATEGIC INCOME FUND/VA
NOTES TO CONSOLIDATED FINANCIAL STATEMENTS Continued
3. Securities Valuation (Continued)
most recent official closing price on the principal exchange on which it is traded. If the last sales price or official closing price for a foreign security is not available, the security is valued at the mean between the bid and asked price per the exchange or, if not available from the exchange, obtained from two dealers. If bid and asked prices are not available from either the exchange or two dealers, the security is valued by using one of the following methodologies (listed in order of priority): (1) a bid from the exchange, (2) the mean between the bid and asked price as provided by a single dealer, or (3) a bid from a single dealer.
Shares of a registered investment company that are not traded on an exchange are valued at that investment company’s net asset value per share.
Corporate and government debt securities (of U.S. or foreign issuers) and municipal debt securities, event-linked bonds, loans, mortgage-backed securities, collateralized mortgage obligations, and asset-backed securities are valued at the mean between the “bid” and “asked” prices utilizing evaluated prices obtained from third party pricing services or broker-dealers who may use matrix pricing methods to determine the evaluated prices.
Short-term money market type debt securities with a remaining maturity of sixty days or less are valued at cost adjusted by the amortization of discount or premium to maturity (amortized cost), which approximates market value. Short-term debt securities with a remaining maturity in excess of sixty days are valued at the mean between the “bid” and “asked” prices utilizing evaluated prices obtained from third party pricing services or broker-dealers.
Structured securities, swaps, swaptions, and other over-the-counter derivatives are valued utilizing evaluated prices obtained from third party pricing services or broker-dealers.
Forward foreign currency exchange contracts are valued utilizing current and forward currency rates obtained from third party pricing services. When the settlement date of a contract is an interim date for which a quotation is not available, interpolated values are derived using the nearest dated forward currency rate.
Futures contracts and futures options traded on a commodities or futures exchange will be valued at the final settlement price or official closing price on the principal exchange as reported by such principal exchange at its trading session ending at, or most recently prior to, the time when the Fund’s assets are valued.
A description of the standard inputs that may generally be considered by the third party pricing vendors in determining their evaluated prices is provided below.
| | |
| Security Type | | Standard inputs generally considered by third-party pricing vendors |
|
| Corporate debt, government debt, municipal, mortgage-backed and asset-backed securities | | Reported trade data, broker-dealer price quotations, benchmark yields, issuer spreads on comparable securities, the credit quality, yield, maturity, and other appropriate factors. |
|
| Loans | | Information obtained from market participants regarding reported trade data and broker-dealer price quotations. |
|
| Event-linked bonds | | Information obtained from market participants regarding reported trade data and broker-dealer price quotations. |
|
| Structured securities | | Relevant market information such as the price of underlying financial instruments, stock market indices, foreign currencies, interest rate spreads, commodities, or the occurrence of other specific events. |
|
| Swaps | | Relevant market information, including underlying reference assets such as credit spreads, credit event probabilities, index values, individual security values, forward interest rates, variable interest rates, volatility measures, and forward currency rates. |
If a market value or price cannot be determined for a security using the methodologies described above, or if, in the “good faith” opinion of the Manager, the market value or price obtained does not constitute a “readily available market quotation,” or a significant event has occurred that would materially affect the value of the security, the security is fair valued either (i) by a standardized fair valuation methodology applicable to the security type or the significant event as previously approved by the Valuation Committee and the Fund’s Board or (ii) as determined in good faith by the Manager’s Valuation Committee. The Valuation Committee considers all relevant facts that are reasonably available, through either public information or information available to the Manager, when determining the fair value of a security. Fair value determinations by the Manager are subject to review, approval and ratification by the Fund’s Board at its next regularly scheduled meeting covering the calendar quarter in which the fair valuation was determined. Those fair valuation standardized methodologies include, but are not limited to, valuing securities at the last sale price or initially at cost and subsequently adjusting the value based on: changes in company specific fundamentals, changes in an appropriate securities index, or changes in the value of similar securities which may be further adjusted for any discounts related to security-specific resale restrictions. When possible, such methodologies use observable market inputs such as unadjusted quoted prices of similar securities, observable interest rates, currency rates and yield curves. The methodologies used for valuing securities are not necessarily an indication of the risks associated with investing in those securities nor can it be assured that the Fund can obtain the fair value assigned to a security if it were to sell the security.
To assess the continuing appropriateness of security valuations, the Manager, or its third party service provider who is subject to oversight by the Manager, regularly compares prior day prices, prices on comparable securities, and sale prices to the current day prices and challenges those prices exceeding certain tolerance levels with the third party pricing service or broker source. For those securities valued by fair valuations, whether through a standardized fair valuation methodology or a fair valuation determination, the Valuation Committee reviews and affirms the reasonableness of the valuations based on such methodologies and fair valuation determinations on a regular basis after considering all relevant information that is reasonably available.
Classifications
Each investment asset or liability of the Fund is assigned a level at measurement date based on the significance and source of the inputs to its valuation. Various data inputs are used in determining the value of each of the Fund’s investments as of the reporting period end. These data inputs are categorized in the following hierarchy under applicable financial accounting standards:
42 OPPENHEIMER GLOBAL STRATEGIC INCOME FUND/VA
3. Securities Valuation (Continued)
1) Level 1-unadjusted quoted prices in active markets for identical assets or liabilities (including securities actively traded on a securities exchange)
2) Level 2-inputs other than unadjusted quoted prices that are observable for the asset or liability (such as unadjusted quoted prices for similar assets and market corroborated inputs such as interest rates, prepayment speeds, credit risks, etc.)
3) Level 3-significant unobservable inputs (including the Manager’s own judgments about assumptions that market participants would use in pricing the asset or liability).
The inputs used for valuing securities are not necessarily an indication of the risks associated with investing in those securities.
The table below categorizes amounts that are included in the Fund’s Consolidated Statement of Assets and Liabilities at period end based on valuation input level:
| | | | | | | | | | | | | | | | |
| | | Level 1— Unadjusted Quoted Prices | | | Level 2— Other Significant
Observable Inputs | | | Level 3— Significant
Unobservable Inputs | | | Value | |
| |
Assets Table | | | | | | | | | | | | | | | | |
Investments, at Value: | | | | | | | | | | | | | | | | |
Asset-Backed Securities | | $ | — | | | $ | 89,098,361 | | | $ | 16,991,566 | | | $ | 106,089,927 | |
Mortgage-Backed Obligations | | | — | | | | 250,873,148 | | | | 16,686 | | | | 250,889,834 | |
U.S. Government Obligations | | | — | | | | 33,564,769 | | | | — | | | | 33,564,769 | |
Foreign Government Obligations | | | — | | | | 173,263,594 | | | | — | | | | 173,263,594 | |
Corporate Loans | | | — | | | | 15,965,211 | | | | 7,452 | | | | 15,972,663 | |
Corporate Bonds and Notes | | | — | | | | 963,362,085 | | | | 29,997 | | | | 963,392,082 | |
Common Stocks | | | 1,068,174 | | | | — | | | | 1,255,935 | | | | 2,324,109 | |
Rights, Warrants and Certificates | | | — | | | | — | | | | — | | | | — | |
Structured Securities | | | — | | | | 6,933,575 | | | | 4,439,555 | | | | 11,373,130 | |
Short-Term Note | | | — | | | | 29,987,850 | | | | — | | | | 29,987,850 | |
Investment Companies | | | 92,728,261 | | | | 139,576,057 | | | | — | | | | 232,304,318 | |
Over-the-Counter Options Purchased | | | — | | | | 1,239,886 | | | | — | | | | 1,239,886 | |
| Over-the-Counter Interest Rate Swaptions Purchased | | | — | | | | 1,129,623 | | | | — | | | | 1,129,623 | |
| | | | |
Total Investments, at Value | | | 93,796,435 | | | | 1,704,994,159 | | | | 22,741,191 | | | | 1,821,531,785 | |
Other Financial Instruments: | | | | | | | | | | | | | | | | |
Swaps, at value | | | — | | | | 770,063 | | | | — | | | | 770,063 | |
Centrally cleared swaps, at value | | | — | | | | 1,150,500 | | | | — | | | | 1,150,500 | |
Futures contracts | | | 550,508 | | | | — | | | | — | | | | 550,508 | |
Forward currency exchange contracts | | | — | | | | 9,289,082 | | | | — | | | | 9,289,082 | |
| | | | |
Total Assets | | $ | 94,346,943 | | | $ | 1,716,203,804 | | | $ | 22,741,191 | | | $ | 1,833,291,938 | |
| | | | |
| | | | |
Liabilities Table | | | | | | | | | | | | | | | | |
Other Financial Instruments: | | | | | | | | | | | | | | | | |
Swaps, at value | | $ | — | | | $ | (2,816,247) | | | $ | — | | | $ | (2,816,247) | |
Centrally cleared swaps, at value | | | — | | | | (134,727) | | | | — | | | | (134,727) | |
Options written, at value | | | — | | | | (2,022,112) | | | | — | | | | (2,022,112) | |
Futures contracts | | | (137,744) | | | | — | | | | — | | | | (137,744) | |
Forward currency exchange contracts | | | — | | | | (5,683,039) | | | | — | | | | (5,683,039) | |
Swaptions written, at value | | | — | | | | (2,508,559) | | | | — | | | | (2,508,559) | |
| | | | |
Total Liabilities | | $ | (137,744) | | | $ | (13,164,684) | | | $ | — | | | $ | (13,302,428) | |
| | | | |
Forward currency exchange contracts and futures contracts, if any, are reported at their unrealized appreciation/depreciation at measurement date, which represents the change in the contract’s value from trade date. All additional assets and liabilities included in the above table are reported at their market value at measurement date.
The table below shows the transfers between Level 2 and Level 3. The Fund’s policy is to recognize transfers in and transfers out as of the beginning of the reporting period.
| | | | | | | | | | | | | | | | |
| | | Transfers into Level 2* | | | Transfers out of Level 2** | | | Transfers into Level 3** | | | Transfers out of Level 3* | |
| |
| Assets Table | | | | | | | | | | | | | | | | |
| Investments, at Value: | | | | | | | | | | | | | | | | |
| Mortgage-Backed Obligations | | $ | 2,832,625 | | | $ | – | | | $ | – | | | $ | (2,832,625) | |
| Corporate Bonds and Notes | | | 2,578,016 | | | | (39,746) | | | | 39,746 | | | | (2,578,016) | |
| Common Stocks | | | – | | | | (1,491,405) | | | | 1,491,405 | | | | – | |
| | | | |
| Total Assets | | $ | 5,410,641 | | | $ | (1,531,151) | | | $ | 1,531,151 | | | $ | (5,410,641) | |
| | | | |
* Transferred from Level 3 to Level 2 due to the availability of market data for this security.
** Transferred from Level 2 to Level 3 because of the lack of observable market data.
The following is a reconciliation of assets in which significant unobservable inputs (level 3) were used in determining fair value:
43 OPPENHEIMER GLOBAL STRATEGIC INCOME FUND/VA
NOTES TO CONSOLIDATED FINANCIAL STATEMENTS Continued
3. Securities Valuation (Continued)
| | | | | | | | | | | | | | | | |
| | | Value as of
December 31, 2014 | | | Realized gain (loss) | | | Change in unrealized
appreciation/
depreciation | | | Accretion/
(amortization) of premium/ discounta | |
| |
Assets Table | | | | | | | | | | | | | | | | |
Investments, at Value: | | | | | | | | | | | | | | | | |
Asset-Backed Securities | | $ | 17,141,305 | | | $ | — | | | $ | (280,930) | | | $ | 131,191 | |
Mortgage-Backed Obligations | | | 2,842,770 | | | | — | | | | 6,541 | | | | — | |
Corporate Loans | | | 7,452 | | | | — | | | | — | | | | — | |
Corporate Bonds and Notes | | | 2,992,241 | | | | (5,309,043) | | | | 6,776,070 | | | | (44) | |
Common Stocks | | | 15 | | | | — | | | | (235,485) | | | | — | |
Structured Securities | | | 8,042,066 | | | | (1,453,748) | | | | (1,368,722) | | | | 82,747 | |
| | | | |
Total Assets | | $ | 31,025,849 | | | $ | (6,762,791) | | | $ | 4,897,474 | | | $ | 213,894 | |
| | | | |
a. Included in net investment income. | | | | | | | | | | | | | | | | |
| | | Sales | | | Transfers into Level 3 | | | Transfers out of Level 3 | | | Value as of
December 31, 2015 | |
| |
Assets Table (Continued) | | | | | | | | | | | | | | | | |
Investments, at Value: | | | | | | | | | | | | | | | | |
Asset-Backed Securities | | $ | — | | | $ | — | | | $ | — | | | $ | 16,991,566 | |
Mortgage-Backed Obligations | | | — | | | | — | | | | (2,832,625) | | | | 16,686 | |
Corporate Loans | | | — | | | | — | | | | — | | | | 7,452 | |
Corporate Bonds and Notes | | | (1,890,957) | | | | 39,746 | | | | (2,578,016) | | | | 29,997 | |
Common Stocks | | | — | | | | 1,491,405 | | | | — | | | | 1,255,935 | |
Structured Securities | | | (862,788) | | | | — | | | | — | | | | 4,439,555 | |
| | | | |
Total Assets | | $ | (2,753,745) | | | $ | 1,531,151 | | | $ | (5,410,641) | | | $ | 22,741,191 | |
| | | | |
The total change in unrealized appreciation/depreciation included in the Consolidated Statement of Operations attributable to Level 3 investments still held at period end:
| | | | |
| | | Change in unrealized appreciation/ depreciation | |
| |
Asset-Backed Securities | | $ | (280,930) | |
Mortgage-Backed Obligations | | | 6,541 | |
Corporate Bonds and Notes | | | (9,930) | |
Common Stocks | | | (235,485) | |
Structured Securities | | | (893,231) | |
| | | | |
Total Assets | | $ | (1,413,035) | |
| | | | |
The following table summarizes the valuation techniques and significant unobservable inputs used in determining fair value measurements for those investments classified as Level 3 at period end:
| | | | | | | | | | | | | | |
| | | Value as of December 31, 2015 | | | Valuation Technique | | Unobservable input | | Range of
Unobservable Inputs | | Unobservable
Input Used | | |
|
Assets Table | | | | | | | | | | | | | | |
Investments, at Value: | | | | | | | | | | | | | | |
| Asset-Backed Securities | | $ | 16,991,566 | | | Broker quotes | | N/A | | N/A | | N/A | | (a) |
| Mortgage-Backed Obligations | | | 16,686 | | | Broker quotes | | N/A | | N/A | | N/A | | (a) |
| Corporate Loans | | | 7,452 | | | Pricing service | | N/A | | N/A | | N/A | | (a) |
| Corporate Bonds and Notes | | | 29,996 | | | Broker quotes | | N/A | | N/A | | N/A | | (a) |
| Corporate Bonds and Notes | | | 1 | | | Estimated Recovery proceeds | | Nominal Value | | N/A | | 0.01% of par | | (b) |
| Common Stocks | | | 15 | | | Estimated Recovery proceeds | | Nominal Value | | N/A | | $0.01/share | | (c) |
| Common Stocks | | | 1,255,920 | | | Pricing service | | N/A | | N/A | | N/A | | (a) |
| Structured Securities | | | 4,439,555 | | | Broker quotes | | N/A | | N/A | | N/A | | (a) |
| | | | | | | | | | | | | | |
| Total | | $ | 22,741,191 | | | | | | | | | | | |
| | | | | | | | | | | | | | |
(a) Securities classified as Level 3 whose unadjusted values were provided by a pricing service or broker-dealer for which such inputs are unobservable. The Manager periodically reviews pricing vendor and broker methodologies and inputs to confirm they are determined using unobservable inputs and have been appropriately classified. Such securities’ fair valuations could change significantly based on changes in unobservable inputs used by the pricing service or broker.
(b) The Fund fair values certain corporate bonds and notes received from a bond restructuring using a nominal value per share to reflect the low probability of future value. The Manager monitors such investments for additional market information or the occurrence of a significant event which would warrant a re-evaluation of the security’s fair valuation.
(c) The Fund fair values certain common stocks held at a nominal value to reflect the low probability of receipt of future payments to be received as a result of a merger. The Manager monitors such investments for additional market information or the occurrence of a significant event which would warrant a re-evaluation of the security’s fair valuation. A significant increase (decrease) in the future distribution amount, or a significant increase (decrease) to the probability of payment rate, will result in a significant increase (decrease) to the fair value of the investment.
44 OPPENHEIMER GLOBAL STRATEGIC INCOME FUND/VA
4. Investments and Risks
Risks of Foreign Investing. The Fund may invest in foreign securities which are subject to special risks. Securities traded in foreign markets may be less liquid and more volatile than those traded in U.S. markets. Foreign issuers are usually not subject to the same accounting and disclosure requirements that U.S. companies are subject to, which may make it difficult for the Fund to evaluate a foreign company’s operations or financial condition. A change in the value of a foreign currency against the U.S. dollar will result in a change in the U.S. dollar value of investments denominated in that foreign currency and in the value of any income or distributions the Fund may receive on those investments. The value of foreign investments may be affected by exchange control regulations, foreign taxes, higher transaction and other costs, delays in the settlement of transactions, changes in economic or monetary policy in the United States or abroad, expropriation or nationalization of a company’s assets, or other political and economic factors. In addition, due to the inter-relationship of global economies and financial markets, changes in political and economic factors in one country or region could adversely affect conditions in another country or region. Investments in foreign securities may also expose the Fund to time-zone arbitrage risk. Foreign securities may trade on weekends or other days when the Fund does not price its shares. At times, the Fund may emphasize investments in a particular country or region and may be subject to greater risks from adverse events that occur in that country or region. Foreign securities and foreign currencies held in foreign banks and securities depositories may be subject to limited or no regulatory oversight.
Investments in Affiliated Funds. The Fund is permitted to invest in other mutual funds advised by the Manager (“Affiliated Funds”). Affiliated Funds are open-end management investment companies registered under the 1940 Act, as amended. The Manager is the investment adviser of, and the Sub-Adviser provides investment and related advisory services to, the Affiliated Funds. When applicable, the Fund’s investments in Affiliated Funds are included in the Consolidated Statement of Investments. Shares of Affiliated Funds are valued at their net asset value per share. As a shareholder, the Fund is subject to its proportional share of the Affiliated Funds’ expenses, including their management fee. The Manager will waive fees and/or reimburse Fund expenses in an amount equal to the indirect management fees incurred through the Fund’s investment in the Affiliated Funds.
Each of the Affiliated Funds in which the Fund invests has its own investment risks, and those risks can affect the value of the Fund’s investments and therefore the value of the Fund’s shares. To the extent that the Fund invests more of its assets in one Affiliated Fund than in another, the Fund will have greater exposure to the risks of that Affiliated Fund.
Investment in Oppenheimer Institutional Money Market Fund. The Fund is permitted to invest daily available cash balances in a money market Affiliated Fund. The Fund may invest the available cash in Class E shares of Oppenheimer Institutional Money Market Fund (“IMMF”) to seek current income while preserving liquidity or for defensive purposes. IMMF is regulated as a money market fund under the Investment Company Act of 1940, as amended.
Investment in Oppenheimer Master Funds. The Fund is permitted to invest in entities sponsored and/or advised by the Manager or an affiliate. Certain of these entities in which the Fund invests are mutual funds registered under the Investment Company Act of 1940 that expect to be treated as partnerships for tax purposes, specifically Oppenheimer Master Loan Fund, LLC (“Master Loan”) and Oppenheimer Master Event-Linked Bond Fund, LLC (“Master Event-Linked Bond”) (the “Master Funds”). Each Master Fund has its own investment risks, and those risks can affect the value of the Fund’s investments and therefore the value of the Fund’s shares. To the extent that the Fund invests more of its assets in one Master Fund than in another, the Fund will have greater exposure to the risks of that Master Fund.
The investment objective of Master Loan is to seek income. The investment objective of Master Event-Linked Bond is to seek total return. The Fund’s investments in the Master Funds are included in the Consolidated Statement of Investments. The Fund recognizes income and gain/(loss) on its investments in each Master Fund according to its allocated pro-rata share, based on its relative proportion of total outstanding Master Fund shares held, of the total net income earned and the net gain/(loss) realized on investments sold by the Master Funds. As a shareholder, the Fund is subject to its proportional share of the Master Funds’ expenses, including their management fee. The Manager will waive fees and/or reimburse Fund expenses in an amount equal to the indirect management fees incurred through the Fund’s investment in the Master Funds. The Fund owns 8.2% of Master Loan and 15.6% of Master Event-Linked Bond at period end.
Structured Securities. The Fund invests in structured securities whose market values, interest rates and/or redemption prices are linked to the performance of underlying foreign currencies, interest rate spreads, stock market indices, prices of individual securities, commodities or other financial instruments or the occurrence of other specific events. The structured securities are often leveraged, increasing the volatility of each note’s market value relative to the change in the underlying linked financial element or event. Fluctuations in value of these securities are recorded as unrealized gains and losses in the accompanying Consolidated Statement of Operations. The Fund records a realized gain or loss when a structured security is sold or matures.
Loans. The Fund invests in loans made to U.S. and foreign borrowers that are corporations, partnerships or other business entities. The Fund will do so directly as an original lender or by assignment or indirectly through participation agreements or certain derivative instruments. While many of these loans will be collateralized, the Fund can also invest in uncollateralized loans. Loans are often issued in connection with recapitalizations, acquisitions, leveraged buyouts, and refinancing of borrowers. The loans often pay interest at rates that float above (or are adjusted periodically based on) a benchmark that reflects current interest rates although the Fund can also invest in loans with fixed interest rates.
45 OPPENHEIMER GLOBAL STRATEGIC INCOME FUND/VA
NOTES TO CONSOLIDATED FINANCIAL STATEMENTS Continued
4. Investments and Risks (Continued)
Securities on a When-Issued or Delayed Delivery Basis. The Fund may purchase securities on a “when-issued” basis, and may purchase or sell securities on a “delayed delivery” basis. “When-issued” or “delayed delivery” refers to securities whose terms and indenture are available and for which a market exists, but which are not available for immediate delivery. Delivery and payment for securities that have been purchased by the Fund on a when-issued basis normally takes place within six months and possibly as long as two years or more after the trade date. During this period, such securities do not earn interest, are subject to market fluctuation and may increase or decrease in value prior to their delivery. The purchase of securities on a when-issued basis may increase the volatility of the Fund’s net asset value to the extent the Fund executes such transactions while remaining substantially fully invested. When the Fund engages in when-issued or delayed delivery transactions, it relies on the buyer or seller, as the case may be, to complete the transaction. Their failure to do so may cause the Fund to lose the opportunity to obtain or dispose of the security at a price and yield it considers advantageous. The Fund may also sell securities that it purchased on a when-issued basis or forward commitment prior to settlement of the original purchase.
At period end, the Fund had purchased securities issued on a when-issued or delayed delivery basis and sold securities issued on a delayed delivery basis as follows:
| | | | |
| | | When-Issued or Delayed Delivery Basis Transactions | |
| |
Purchased securities | | | $66,019,166 | |
Sold securities | | | 5,184,951 | |
The Fund may enter into “forward roll” transactions with respect to mortgage-related securities. In this type of transaction, the Fund sells a mortgage-related security to a buyer and simultaneously agrees to repurchase a similar security (same type, coupon and maturity) at a later date at a set price. During the period between the sale and the repurchase, the Fund will not be entitled to receive interest and principal payments on the securities that have been sold. The Fund records the incremental difference between the forward purchase and sale of each forward roll as realized gain (loss) on investments or as fee income in the case of such transactions that have an associated fee in lieu of a difference in the forward purchase and sale price.
Forward roll transactions may be deemed to entail embedded leverage since the Fund purchases mortgage-related securities with extended settlement dates rather than paying for the securities under a normal settlement cycle. This embedded leverage increases the Fund’s market value of investments relative to its net assets which can incrementally increase the volatility of the Fund’s performance. Forward roll transactions can be replicated over multiple settlement periods.
Risks of entering into forward roll transactions include the potential inability of the counterparty to meet the terms of the agreement; the potential of the Fund to receive inferior securities at redelivery as compared to the securities sold to the counterparty; and counterparty credit risk.
At period end, the Fund pledged $21,238 of collateral to the counterparty for forward roll transactions.
Restricted Securities. At period end, investments in securities included issues that are restricted. A restricted security may have a contractual restriction on its resale and is valued under methods approved by the Board of Trustees as reflecting fair value. Securities that are restricted are marked with an applicable footnote on the Consolidated Statement of Investments. Restricted securities are reported on a schedule following the Consolidated Statement of Investments.
Equity Security Risk. Stocks and other equity securities fluctuate in price. The value of the Fund’s portfolio may be affected by changes in the equity markets generally. Equity markets may experience significant short-term volatility and may fall sharply at times. Different markets may behave differently from each other and U.S. equity markets may move in the opposite direction from one or more foreign stock markets. Adverse events in any part of the equity or fixed-income markets may have unexpected negative effects on other market segments.
The prices of individual equity securities generally do not all move in the same direction at the same time and a variety of factors can affect the price of a particular company’s securities. These factors may include, but are not limited to, poor earnings reports, a loss of customers, litigation against the company, general unfavorable performance of the company’s sector or industry, or changes in government regulations affecting the company or its industry.
Credit Risk. The Fund invests in high-yield, non-investment-grade bonds, which may be subject to a greater degree of credit risk. Credit risk relates to the ability of the issuer to meet interest or principal payments or both as they become due. The Fund may acquire securities that have missed an interest payment, and is not obligated to dispose of securities whose issuers or underlying obligors subsequently miss an interest payment.
Information concerning securities not accruing interest at period end is as follows:
| | | | |
Cost | | | $15,675,558 | |
Market Value | | | $2,687,106 | |
Market Value as % of Net Assets | | | 0.15% | |
The Fund has entered into forbearance agreements with certain obligors under which the Fund has agreed to temporarily forego receipt of the original principal or coupon interest rates. At period end, securities with an aggregate market value of $906,955, representing 0.05% of the Fund’s net assets, were subject to these forbearance agreements.
46 OPPENHEIMER GLOBAL STRATEGIC INCOME FUND/VA
4. Investments and Risks (Continued)
Sovereign Debt Risk. The Fund invests in sovereign debt securities, which are subject to certain special risks. These risks include, but are not limited to, the risk that a governmental entity may delay or refuse, or otherwise be unable, to pay interest or repay the principal on its sovereign debt. There may also be no legal process for collecting sovereign debt that a government does not pay or bankruptcy proceedings through which all or part of such sovereign debt may be collected. In addition, a restructuring or default of sovereign debt may also cause additional impacts to the financial markets, such as downgrades to credit ratings, reduced liquidity and increased volatility, among others.
Shareholder Concentration. At period end, two shareholders each owned 20% or more of the Fund’s total outstanding shares comprising 46.49% of the Fund.
5. Market Risk Factors
The Fund’s investments in securities and/or financial derivatives may expose the fund to various market risk factors:
Commodity Risk. Commodity risk relates to the change in value of commodities or commodity indexes as they relate to increases or decreases in the commodities market. Commodities are physical assets that have tangible properties. Examples of these types of assets are crude oil, heating oil, metals, livestock, and agricultural products.
Credit Risk. Credit risk relates to the ability of the issuer of debt to meet interest and principal payments, or both, as they come due. In general, lower-grade, higher-yield debt securities are subject to credit risk to a greater extent than lower-yield, higher-quality securities.
Equity Risk. Equity risk relates to the change in value of equity securities as they relate to increases or decreases in the general market.
Foreign Exchange Rate Risk. Foreign exchange rate risk relates to the change in the U.S. dollar value of a security held that is denominated in a foreign currency. The U.S. dollar value of a foreign currency denominated security will decrease as the dollar appreciates against the currency, while the U.S. dollar value will increase as the dollar depreciates against the currency.
Interest Rate Risk. Interest rate risk refers to the fluctuations in value of fixed-income securities resulting from the inverse relationship between price and yield. For example, an increase in general interest rates will tend to reduce the market value of already issued fixed-income investments, and a decline in general interest rates will tend to increase their value. In addition, debt securities with longer maturities, which tend to have higher yields, are subject to potentially greater fluctuations in value from changes in interest rates than obligations with shorter maturities.
Volatility Risk. Volatility risk refers to the magnitude of the movement, but not the direction of the movement, in a financial instrument’s price over a defined time period. Large increases or decreases in a financial instrument’s price over a relative time period typically indicate greater volatility risk, while small increases or decreases in its price typically indicate lower volatility risk.
6. Use of Derivatives
The Fund’s investment objective not only permits the Fund to purchase investment securities, it also allows the Fund to enter into various types of derivatives contracts, including, but not limited to, futures contracts, forward currency exchange contracts, credit default swaps, interest rate swaps, total return swaps, variance swaps and purchased and written options. In doing so, the Fund will employ strategies in differing combinations to permit it to increase, decrease, or change the level or types of exposure to market risk factors. These instruments may allow the Fund to pursue its objectives more quickly and efficiently than if it were to make direct purchases or sales of securities capable of effecting a similar response to market factors. Such contracts may be entered into through a bilateral over-the-counter (“OTC”) transaction, or through a securities or futures exchange and cleared through a clearinghouse.
Derivatives may have little or no initial cash investment relative to their market value exposure and therefore can produce significant gains or losses in excess of their cost due to unanticipated changes in the market risk factors and the overall market. This use of embedded leverage allows the Fund to increase its market value exposure relative to its net assets and can substantially increase the volatility of the Fund’s performance. In instances where the Fund is using derivatives to decrease, or hedge, exposures to market risk factors for securities held by the Fund, there are also risks that those derivatives may not perform as expected resulting in losses for the combined or hedged positions. Some derivatives have the potential for unlimited loss, regardless of the size of the Fund’s initial investment.
Additional associated risks from investing in derivatives also exist and potentially could have significant effects on the valuation of the derivative and the Fund. Typically, the associated risks are not the risks that the Fund is attempting to increase or decrease exposure to, per its investment objectives, but are the additional risks from investing in derivatives. Examples of these associated risks are liquidity risk, which is the risk that the Fund will not be able to sell the derivative in the open market in a timely manner, and counterparty credit risk, which is the risk that the counterparty will not fulfill its obligation to the Fund.
The Fund’s actual exposures to these market risk factors and associated risks during the period are discussed in further detail, by derivative type, below.
Forward Currency Exchange Contracts
The Fund may enter into forward currency exchange contracts (“forward contracts”) for the purchase or sale of a foreign currency at a negotiated rate at a future date. Such contracts are traded in the OTC inter-bank currency dealer market.
Forward contracts are reported on a schedule following the Consolidated Statement of Investments. The unrealized appreciation (depreciation) is reported in the Consolidated Statement of Assets and Liabilities as a receivable (or payable) and in the Consolidated Statement of Operations within the change in unrealized appreciation (depreciation). At contract close, the difference between the original cost of the contract and the value at the close date is recorded as a realized gain (loss) in the Consolidated Statement of Operations.
47 OPPENHEIMER GLOBAL STRATEGIC INCOME FUND/VA
NOTES TO CONSOLIDATED FINANCIAL STATEMENTS Continued
6. Use of Derivatives (Continued)
The Fund has entered into forward contracts with the obligation to purchase specified foreign currencies in the future at a currently negotiated forward rate in order to take a positive investment perspective on the related currency. These forward contracts seek to increase exposure to foreign exchange rate risk.
The Fund has entered into forward contracts with the obligation to purchase specified foreign currencies in the future at a currently negotiated forward rate in order to decrease exposure to foreign exchange rate risk associated with foreign currency denominated securities held by the Fund.
The Fund has entered into forward contracts with the obligation to sell specified foreign currencies in the future at a currently negotiated forward rate in order to take a negative investment perspective on the related currency. These forward contracts seek to increase exposure to foreign exchange rate risk.
The Fund has entered into forward contracts with the obligation to sell specified foreign currencies in the future at a currently negotiated forward rate in order to decrease exposure to foreign exchange rate risk associated with foreign currency denominated securities held by the Fund.
During the reporting period, the Fund had daily average contract amounts on forward contracts to buy and sell of $345,200,524 and $704,895,494, respectively.
Additional associated risk to the Fund includes counterparty credit risk. Counterparty credit risk arises from the possibility that the counterparty to a forward contract will default and fail to perform its obligations to the Fund.
Futures Contracts
A futures contract is a commitment to buy or sell a specific amount of a commodity, financial instrument or currency at a negotiated price on a stipulated future date. The Fund may buy and sell futures contracts and may also buy or write put or call options on these futures contracts. Futures contracts and options thereon are generally entered into on a regulated futures exchange and cleared through a clearinghouse associated with the exchange.
Upon entering into a futures contract, the Fund is required to deposit either cash or securities (initial margin) in an amount equal to a certain percentage of the contract value in an account registered in the futures commission merchant’s name. Subsequent payments (variation margin) are paid to or from the futures commission merchant each day equal to the daily changes in the contract value. Such payments are recorded as unrealized gains and losses. Should the Fund fail to make requested variation margin payments, the futures commission merchant can gain access to the initial margin to satisfy the Fund’s payment obligations.
Futures contracts are reported on a schedule following the Consolidated Statement of Investments. Securities held by a futures commission merchant to cover initial margin requirements on open futures contracts are noted in the Consolidated Statement of Investments. Cash held by a futures commission merchant to cover initial margin requirements on open futures contracts and the receivable and/or payable for the daily mark to market for the variation margin are noted in the Consolidated Statement of Assets and Liabilities. The net change in unrealized appreciation and depreciation is reported in the Consolidated Statement of Operations. Realized gains (losses) are reported in the Consolidated Statement of Operations at the closing or expiration of futures contracts.
The Fund has purchased futures contracts on various bonds and notes to increase exposure to interest rate risk.
The Fund has sold futures contracts on various bonds and notes to decrease exposure to interest rate risk.
During the reporting period, the Fund had an ending monthly average market value of $128,433,853 and $117,100,266 on futures contracts purchased and sold, respectively.
Additional associated risks of entering into futures contracts (and related options) include the possibility that there may be an illiquid market where the Fund is unable to liquidate the contract or enter into an offsetting position and, if used for hedging purposes, the risk that the price of the contract will correlate imperfectly with the prices of the Fund’s securities.
Option Activity
The Fund may buy and sell put and call options, or write put and call options. When an option is written, the Fund receives a premium and becomes obligated to sell or purchase the underlying security, currency or other underlying financial instrument at a fixed price, upon exercise of the option.
Options can be traded through an exchange or through a privately negotiated arrangement with a dealer in an OTC transaction. Options traded through an exchange are generally cleared through a clearinghouse (such as The Options Clearing Corporation). The difference between the premium received or paid, and market value of the option, is recorded as unrealized appreciation or depreciation. The net change in unrealized appreciation or depreciation is reported in the Consolidated Statement of Operations. When an option is exercised, the cost of the security purchased or the proceeds of the security sale are adjusted by the amount of premium received or paid. Upon the expiration or closing of the option transaction, a gain or loss is reported in the Consolidated Statement of Operations.
The Fund has purchased call options on currencies to increase exposure to foreign exchange rate risk. A purchased call option becomes more valuable as the price of the underlying financial instrument appreciates relative to the strike price.
The Fund has purchased put options on currencies to decrease exposure to foreign exchange rate risk. A purchased put option becomes more valuable as the price of the underlying financial instrument depreciates relative to the strike price.
The Fund has purchased call options on individual equity securities and/or equity indexes to increase exposure to equity risk. A purchased call option becomes more valuable as the price of the underlying financial instrument appreciates relative to the strike price.
During the reporting period, the Fund had an ending monthly average market value of $1,318,355 and $1,129,794 on purchased call options and purchased put options, respectively.
Options written, if any, are reported in a schedule following the Consolidated Statement of Investments and as a liability in the Consolidated Statement of Assets and Liabilities. Securities held in collateral accounts to cover potential obligations with respect to outstanding written options are noted in the Consolidated Statement of Investments.
48 OPPENHEIMER GLOBAL STRATEGIC INCOME FUND/VA
6. Use of Derivatives (Continued)
The risk in writing a call option is that the market price of the security increases and if the option is exercised, the Fund must either purchase the security at a higher price for delivery or, if the Fund owns the underlying security, give up the opportunity for profit. The risk in writing a put option is that the Fund may incur a loss if the market price of the security decreases and the option is exercised. The risk in buying an option is that the Fund pays a premium whether or not the option is exercised. The Fund also has the additional risk that there may be an illiquid market where the Fund is unable to close the contract.
The Fund has written put options on currencies to increase exposure to foreign exchange rate risk. A written put option becomes more valuable as the price of the underlying financial instrument appreciates relative to the strike price.
The Fund has written call options on currencies to decrease exposure to foreign exchange rate risk. A written call option becomes more valuable as the price of the underlying financial instrument depreciates relative to the strike price.
The Fund has written put options on treasury and/or euro futures to increase exposure to interest rate risk. A written put option becomes more valuable as the price of the underlying financial instrument appreciates relative to the strike price.
The Fund has written put options on individual equity securities and/or equity indexes to increase exposure to equity risk. A written put option becomes more valuable as the price of the underlying financial instrument appreciates relative to the strike price.
The Fund has written call options on individual equity securities and/or equity indexes to decrease exposure to equity risk. A written call option becomes more valuable as the price of the underlying financial instrument depreciates relative to the strike price.
During the reporting period, the Fund had an ending monthly average market value of $1,182,786 and $2,748,794 on written call options and written put options, respectively.
Additional associated risks to the Fund include counterparty credit risk and liquidity risk.
Written option activity for the reporting period was as follows:
| | | | | | | | |
| | | Number of Contracts | | | Amount of Premiums | |
| |
Options outstanding as of December 31, 2014 | | | 108,580,000 | | | $ | 600,824 | |
| | |
Options written | | | 317,148,739,131 | | | | 26,720,126 | |
Options closed or expired | | | (3,923,016,873) | | | | (1,219,964) | |
Options exercised | | | (248,563,787,258) | | | | (24,039,954) | |
| | | | |
Options outstanding as of December 31, 2015 | | | 64,770,515,000 | | | $ | 2,061,032 | |
| | | | |
Swap Contracts
The Fund may enter into swap contract agreements with a counterparty to exchange a series of cash flows based on either specified reference rates, the price or volatility of asset or non-asset references, or the occurrence of a credit event, over a specified period. Swaps can be executed in a bi-lateral privately negotiated arrangement with a dealer in an OTC transaction (“OTC swaps”) or executed on a regulated market. Certain swaps, regardless of the venue of their execution, are required to be cleared through a clearinghouse (“centrally cleared swaps”). Swap contracts may include interest rate, equity, debt, index, total return, credit default, currency, and volatility swaps.
Swap contracts are reported on a schedule following the Consolidated Statement of Investments. The values of centrally cleared swap and OTC swap contracts are aggregated by positive and negative values and disclosed separately on the Consolidated Statement of Assets and Liabilities. The unrealized appreciation (depreciation) related to the change in the valuation of the notional amount of the swap is combined with the accrued interest due to (owed by) the Fund, if any, at termination or settlement. The net change in this amount during the period is included on the Consolidated Statement of Operations. The Fund also records any periodic payments received from (paid to) the counterparty, including at termination, under such contracts as realized gain (loss) on the Consolidated Statement of Operations.
Swap contract agreements are exposed to the market risk factor of the specific underlying reference rate or asset. Swap contracts are typically more attractively priced compared to similar investments in related cash securities because they isolate the risk to one market risk factor and eliminate the other market risk factors. Investments in cash securities (for instance bonds) have exposure to multiple risk factors (credit and interest rate risk). Because swaps have embedded leverage, they can expose the Fund to substantial risk in the isolated market risk factor.
Credit Default Swap Contracts. A credit default swap is a contract that enables an investor to buy or sell protection against a defined-issuer credit event, such as the issuer’s failure to make timely payments of interest or principal on a debt security, bankruptcy or restructuring. The Fund may enter into credit default swaps either by buying or selling protection on a corporate issuer, sovereign issuer, or a basket or index of issuers (the “reference asset”).
The buyer of protection pays a periodic fee to the seller of protection based on the notional amount of the swap contract. The seller of protection agrees to compensate the buyer of protection for future potential losses as a result of a credit event on the reference asset. The contract effectively transfers the credit event risk of the reference asset from the buyer of protection to the seller of protection.
The ongoing value of the contract will fluctuate throughout the term of the contract based primarily on the credit risk of the reference asset. If the credit quality of the reference asset improves relative to the credit quality at contract initiation, the buyer of protection may have an unrealized loss greater than the anticipated periodic fee owed. This unrealized loss would be the result of current credit protection being cheaper than the cost of credit protection at contract initiation. If the buyer elects to terminate the contract prior to its maturity, and there has been no credit event, this unrealized loss will become realized. If the contract is held to maturity, and there has been no credit event, the realized loss will be equal to the periodic fee paid over the life of the contract.
If there is a credit event, the buyer of protection can exercise its rights under the contract and receive a payment from the seller of protection equal to the notional amount of the swap less the market value of specified debt securities issued by the reference asset. Upon exercise of the contract the
49 OPPENHEIMER GLOBAL STRATEGIC INCOME FUND/VA
NOTES TO CONSOLIDATED FINANCIAL STATEMENTS Continued
6. Use of Derivatives (Continued)
difference between such value and the notional amount is recorded as realized gain (loss) and is included on the Consolidated Statement of Operations.
The Fund has sold credit protection through credit default swaps to increase exposure to the credit risk of individual issuers and/or indexes of issuers that are either unavailable or considered to be less attractive in the bond market.
The Fund has purchased credit protection through credit default swaps to decrease exposure to the credit risk of individual issuers and/or indexes of issuers.
The Fund has engaged in spread curve trades by simultaneously purchasing and selling protection through credit default swaps referenced to the same reference asset but with different maturities. Spread curve trades attempt to gain exposure to credit risk on a forward basis by realizing gains on the expected differences in spreads.
For the reporting period, the Fund had ending monthly average notional amounts of $34,013,025 and $32,095,294 on credit default swaps to buy protection and credit default swaps to sell protection, respectively.
Additional associated risks to the Fund include counterparty credit risk and liquidity risk.
Currency Swap Contracts. A currency swap contract is an agreement between counterparties to exchange different currencies at contract inception that are equivalent to a notional value. The exchange at contract inception is made at the current spot rate. The contract also includes an agreement to reverse the exchange of the same notional values of those currencies at contract termination. The re-exchange at contract termination may take place at the same exchange rate, a specified rate or the then current spot rate. Certain currency swap contracts provide for exchanging the currencies only at contract termination and can provide for only a net payment in the settlement currency, typically USD. A currency swap contract may also include the exchange of periodic payments, between the counterparties, that are based on interest rates available in the respective currencies at contract inception. Other currency swap contracts may not provide for exchanging the different currencies at all, and only for exchanging interest cash flows based on the notional value in the contract.
The Fund has entered into currency swap contracts with the obligation to pay an interest rate on the dollar notional amount and receive an interest rate on the various foreign currency notional amounts. These currency swap contracts increase exposure to, or decrease exposure away from, foreign exchange and interest rate risk.
For the reporting period, the Fund had ending monthly average notional amounts of $1,881,444 and $58,859,389 on currency swaps which pay a fixed rate and which receive a fixed rate, respectively.
Additional associated risks to the Fund include counterparty credit risk and liquidity risk.
Interest Rate Swap Contracts. An interest rate swap is an agreement between counterparties to exchange periodic payments based on interest rates. One cash flow stream will typically be a floating rate payment based upon a specified floating interest rate while the other is typically a fixed interest rate.
The Fund has entered into interest rate swaps in which it pays a floating interest rate and receives a fixed interest rate in order to increase exposure to interest rate risk. Typically, if relative interest rates rise, payments made by the Fund under a swap agreement will be greater than the payments received by the Fund.
The Fund has entered into interest rate swaps in which it pays a fixed interest rate and receives a floating interest rate in order to decrease exposure to interest rate risk. Typically, if relative interest rates rise, payments received by the Fund under the swap agreement will be greater than the payments made by the Fund.
For the reporting period, the Fund had ending monthly average notional amounts of $103,512,171 and $119,631,519 on interest rate swaps which pay a fixed rate and interest rate swaps which receive a fixed rate, respectively.
Additional associated risks to the Fund include counterparty credit risk and liquidity risk.
Swaption Transactions
The Fund may enter into a swaption contract which grants the purchaser the right, but not the obligation, to enter into a swap transaction at preset terms detailed in the underlying agreement within a specified period of time. The purchaser pays a premium to the swaption writer who bears the risk of unfavorable changes in the preset terms on the underlying swap.
Purchased swaptions are reported as a component of investments in the Consolidated Statement of Investments and the Consolidated Statement of Assets and Liabilities. Written swaptions are reported on a schedule following the Consolidated Statement of Investments and their value is reported as a separate asset or liability line item in the Consolidated Statement of Assets and Liabilities. The net change in unrealized appreciation or depreciation on written swaptions is separately reported in the Consolidated Statement of Operations. When a swaption is exercised, the cost of the swap is adjusted by the amount of premium paid or received. Upon the expiration or closing of an unexercised swaption contract, a gain or loss is reported in the Consolidated Statement of Operations for the amount of the premium paid or received.
The Fund generally will incur a greater risk when it writes a swaption than when it purchases a swaption. When the Fund writes a swaption it will become obligated, upon exercise of the swaption, according to the terms of the underlying agreement. Swaption contracts written by the Fund do not give rise to counterparty credit risk prior to exercise as they obligate the Fund, not its counterparty, to perform. When the Fund purchases a swaption it only risks losing the amount of the premium it paid if the swaption expires unexercised. However, when the Fund exercises a purchased swaption there is a risk that the counterparty will fail to perform or otherwise default on its obligations under the swaption contract.
The Fund has purchased swaptions which gives it the option to enter into an interest rate swap in which it pays a floating interest rate and receives a fixed interest rate in order to increase exposure to interest rate risk. A purchased swaption of this type becomes more valuable as the reference interest rate decreases relative to the preset interest rate.
50 OPPENHEIMER GLOBAL STRATEGIC INCOME FUND/VA
6. Use of Derivatives (Continued)
The Fund has purchased swaptions which gives it the option to enter into an interest rate swap in which it pays a fixed interest rate and receives a floating interest rate in order to decrease exposure to interest rate risk. A purchased swaption of this type becomes more valuable as the reference interest rate increases relative to the preset interest rate.
The Fund has purchased swaptions which gives it the option to sell credit protection through credit default swaps in order to increase exposure to the credit risk of individual issuers and/ or indexes of issuers. A purchased swaption of this type becomes more valuable as the likelihood of a credit event on the reference asset decreases.
The Fund has written swaptions which gives it the obligation, if exercised by the purchaser, to enter into an interest rate swap in which it pays a floating interest rate and receives a fixed interest rate in order to increase exposure to interest rate risk. A written swaption of this type becomes more valuable as the reference interest rate decreases relative to the preset interest rate.
The Fund has written swaptions which gives it the obligation, if exercised by the purchaser, to enter into an interest rate swap in which it pays a fixed interest rate and receives a floating interest rate in order to decrease exposure to interest rate risk. A written swaption of this type becomes more valuable as the reference interest rate increases relative to the preset interest rate.
The Fund has written swaptions which give it the obligation, if exercised by the purchaser, to sell credit protection through credit default swaps in order to increase exposure to the credit risk of individual issuers and/or indexes of issuers. A written swaption of this type becomes more valuable as the likelihood of a credit event on the reference asset decreases.
The Fund has written swaptions which give it the obligation, if exercised by the purchaser, to buy credit protection through credit default swaps in order to decrease exposure to the credit risk of individual issuers and/or, indexes of issuers. A written swaption of this type becomes more valuable as the likelihood of a credit event on the reference asset increases.
The Fund has written swaptions which gives it the obligation, if exercised by the purchaser, to enter into an currency swap contracts with the obligation to receive an interest rate on the dollar notional amount and pay an interest rate on the various foreign currency notional amounts in order to take a positive investment perspective on the related currencies for which the Fund receives a payment. These currency swap contracts increase exposure to foreign exchange rate risk.
During the reporting period, the Fund had an ending monthly average market value of $2,199,847 and $3,078,636 on purchased and written swaptions, respectively.
Written swaption activity for the reporting period was as follows:
| | | | | | | | |
| | | Notional Amount | | | Amount of Premiums | |
| |
Swaptions outstanding as of December 31, 2014 | | $ | 65,040,000 | | | $ | 710,481 | |
Swaptions written | | | 3,815,985,557 | | | | 15,600,358 | |
Swaptions closed or expired | | | (843,634,116) | | | | (1,801,786) | |
Swaptions exercised | | | (2,675,094,000) | | | | (13,465,579) | |
| | | | |
Swaptions outstanding as of December 31, 2015 | | $ | 362,297,441 | | | $ | 1,043,474 | |
| | | | |
Counterparty Credit Risk. Derivative positions are subject to the risk that the counterparty will not fulfill its obligation to the Fund. The Fund intends to enter into derivative transactions with counterparties that the Manager believes to be creditworthy at the time of the transaction.
The Fund’s risk of loss from counterparty credit risk on OTC derivatives is generally limited to the aggregate unrealized gain netted against any collateral held by the Fund. For OTC options purchased, the Fund bears the risk of loss of the amount of the premiums paid plus the positive change in market values net of any collateral held by the Fund should the counterparty fail to perform under the contracts. Options written by the Fund do not typically give rise to counterparty credit risk, as options written generally obligate the Fund and not the counterparty to perform.
To reduce counterparty risk with respect to OTC transactions, the Fund has entered into master netting arrangements, established within the Fund’s International Swap and Derivatives Association, Inc. (“ISDA”) master agreements, which allow the Fund to make (or to have an entitlement to receive) a single net payment in the event of default (close-out netting) for outstanding payables and receivables with respect to certain OTC positions in swaps, options, swaptions, and forward currency exchange contracts for each individual counterparty. In addition, the Fund may require that certain counterparties post cash and/or securities in collateral accounts to cover their net payment obligations for those derivative contracts subject to ISDA master agreements. If the counterparty fails to perform under these contracts and agreements, the cash and/or securities will be made available to the Fund.
At period end, the Fund has required certain counterparties to post collateral of $3,193,030.
ISDA master agreements include credit related contingent features which allow counterparties to OTC derivatives to terminate derivative contracts prior to maturity in the event that, for example, the Fund’s net assets decline by a stated percentage or the Fund fails to meet the terms of its ISDA master agreements, which would cause the Fund to accelerate payment of any net liability owed to the counterparty.
For financial reporting purposes, the Fund does not offset derivative assets and derivative liabilities that are subject to netting arrangements in the Consolidated Statement of Assets and Liabilities. Bankruptcy or insolvency laws of a particular jurisdiction may impose restrictions on or prohibitions against the right of offset in bankruptcy, insolvency or other events.
The Fund’s risk of loss from counterparty credit risk on exchange-traded derivatives cleared through a clearinghouse and for centrally cleared swaps is generally considered lower than as compared to OTC derivatives. However, counterparty credit risk exists with respect to initial and variation margin deposited/paid by the Fund that is held in futures commission merchant, broker and/or clearinghouse accounts for such exchange-traded derivatives and for centrally cleared swaps.
With respect to centrally cleared swaps, such transactions will be submitted for clearing, and if cleared, will be held in accounts at futures commission merchants or brokers that are members of clearinghouses. While brokers, futures commission merchants and clearinghouses are required to segregate
51 OPPENHEIMER GLOBAL STRATEGIC INCOME FUND/VA
NOTES TO CONSOLIDATED FINANCIAL STATEMENTS Continued
6. Use of Derivatives (Continued)
customer margin from their own assets, in the event that a broker, futures commission merchant or clearinghouse becomes insolvent or goes into bankruptcy and at that time there is a shortfall in the aggregate amount of margin held by the broker, futures commission merchant or clearinghouse for all its customers, U.S. bankruptcy laws will typically allocate that shortfall on a pro-rata basis across all the broker’s, futures commission merchant’s or clearinghouse’s customers, potentially resulting in losses to the Fund.
There is the risk that a broker, futures commission merchant or clearinghouse will decline to clear a transaction on the Fund’s behalf, and the Fund may be required to pay a termination fee to the executing broker with whom the Fund initially enters into the transaction. Clearinghouses may also be permitted to terminate centrally cleared swaps at any time. The Fund is also subject to the risk that the broker or futures commission merchant will improperly use the Fund’s assets deposited/paid as initial or variation margin to satisfy payment obligations of another customer. In the event of a default by another customer of the broker or futures commission merchant, the Fund might not receive its variation margin payments from the clearinghouse, due to the manner in which variation margin payments are aggregated for all customers of the broker/futures commission merchant.
Collateral and margin requirements differ by type of derivative. Margin requirements are established by the broker, futures commission merchant or clearinghouse for exchange-traded and cleared derivatives, including centrally cleared swaps. Brokers, futures commission merchants and clearinghouses can ask for margin in excess of the regulatory minimum, or increase the margin amount, in certain circumstances.
Collateral terms are contract specific for OTC derivatives. For derivatives traded under an ISDA master agreement, the collateral requirements are typically calculated by netting the mark to market amount for each transaction under such agreement and comparing that amount to the value of any collateral currently pledged by the Fund or the counterparty.
For financial reporting purposes, cash collateral that has been pledged to cover obligations of the Fund, if any, is reported separately on the Consolidated Statement of Assets and Liabilities as cash pledged as collateral. Non-cash collateral pledged by the Fund, if any, is noted in the Consolidated Statement of Investments. Generally, the amount of collateral due from or to a party must exceed a minimum transfer amount threshold (e.g. $250,000) before a transfer has to be made. To the extent amounts due to the Fund from its counterparties are not fully collateralized, contractually or otherwise, the Fund bears the risk of loss from counterparty nonperformance.
The following table presents by counterparty the Fund’s OTC derivative assets net of the related collateral pledged by the Fund at period end:
| | | | | | | | | | | | | | | | | | | | |
| | | | | | Gross Amounts Not Offset in the | | | | |
| | | | | | Consolidated Statement of Assets & Liabilities | | | | |
| Counterparty | | Gross Amounts Not Offset in the Consolidated Statement of Assets & Liabilities* | | | Financial Instruments Available for Offset | | | Financial Instruments Collateral Received** | | | Cash Collateral Received** | | | Net Amount | |
| |
| Bank of America NA | | $ | 3,005,959 | | | $ | (3,005,959) | | | $ | — | | | $ | — | | | $ | — | |
| Barclays Bank plc | | | 308,692 | | | | (299,226) | | | | — | | | | — | | | | 9,466 | |
| BNP Paribas | | | 418,739 | | | | (59,416) | | | | (359,323) | | | | — | | | | — | |
| Citibank NA | | | 778,484 | | | | (404,838) | | | | (256,748) | | | | — | | | | 116,898 | |
| Deutsche Bank Securities, Inc. | | | 1,031,882 | | | | (470,169) | | | | — | | | | (420,000) | | | | 141,713 | |
| Goldman Sachs Bank USA | | | 284,120 | | | | (69,906) | | | | — | | | | — | | | | 214,214 | |
| Goldman Sachs Group, Inc. (The) | | | 833,516 | | | | (833,516) | | | | — | | | | — | | | | — | |
| HSBC Bank USA NA | | | 114,770 | | | | (52,927) | | | | (40,818) | | | | — | | | | 21,025 | |
| JPMorgan Chase Bank NA | | | 1,673,360 | | | | (1,673,360) | | | | — | | | | — | | | | — | |
| Morgan Stanley & Co., Inc. | | | 30,094 | | | | — | | | | — | | | | — | | | | 30,094 | |
| Morgan Stanley Capital Services, Inc. | | | 1,984,920 | | | | (479,380) | | | | — | | | | (1,505,540) | | | | — | |
| Toronto Dominion Bank | | | 1,943,278 | | | | (693,624) | | | | (428,457) | | | | — | | | | 821,197 | |
| UBS AG | | | 20,840 | | | | — | | | | (20,840) | | | | — | | | | — | |
| | | | |
| | $ | 12,428,654 | | | $ | (8,042,321) | | | $ | (1,106,186) | | | $ | (1,925,540) | | | $ | 1,354,607 | |
| | | | |
*OTC derivatives are reported gross on the Consolidated Statement of Assets and Liabilities. Exchange traded options and margin related to centrally cleared swaps and futures are excluded from these reported amounts.
**Reported collateral posted for the benefit of the Fund within this table is limited to the net outstanding amount due from an individual counterparty. The collateral posted for the benefit of the Fund may exceed these amounts.
The following table presents by counterparty the Fund’s OTC derivative liabilities net of the related collateral pledged by the Fund at December 31, 2015:
| | | | | | | | | | | | | | | | | | | | |
| | | | | | Gross Amounts Not Offset in the | | | | |
| | | | | | Consolidated Statement of Assets & Liabilities | | | | |
| Counterparty | | Gross Amounts Not Offset in the Consolidated Statement of Assets & Liabilities* | | | Financial Instruments Available for Offset | | | Financial Instruments Collateral Pledged** | | | Cash Collateral Pledged** | | | Net Amount | |
| |
| Bank of America NA | | $ | (4,938,066) | | | $ | 3,005,959 | | | $ | 1,932,107 | | | $ | — | | | $ | — | |
| Barclays Bank plc | | | (299,226) | | | | 299,226 | | | | — | | | | — | | | | — | |
| BNP Paribas | | | (59,416) | | | | 59,416 | | | | — | | | | — | | | | — | |
| Citibank NA | | | (404,838) | | | | 404,838 | | | | — | | | | — | | | | — | |
| Deutsche Bank Securities, Inc. | | | (470,169) | | | | 470,169 | | | | — | | | | — | | | | — | |
| Goldman Sachs Bank USA | | | (69,906) | | | | 69,906 | | | | — | | | | — | | | | — | |
| Goldman Sachs Group, Inc. (The) | | | (3,201,976) | | | | 833,516 | | | | 1,778,743 | | | | — | | | | (589,717) | |
| HSBC Bank USA NA | | | (52,927) | | | | 52,927 | | | | — | | | | — | | | | — | |
| JPMorgan Chase Bank NA | | | (2,294,078) | | | | 1,673,360 | | | | 569,358 | | | | — | | | | (51,360) | |
| Morgan Stanley Capital Services, Inc. | | | (479,380) | | | | 479,380 | | | | — | | | | — | | | | — | |
| Nomura Global Financial Products, Inc. | | | (66,351) | | | | — | | | | — | | | | — | | | | (66,351) | |
52 OPPENHEIMER GLOBAL STRATEGIC INCOME FUND/VA
6. Use of Derivatives (Continued)
| | | | | | | | | | | | | | | | | | | | |
| | | | | | Gross Amounts Not Offset in the | | | | |
| | | | | | Consolidated Statement of Assets & Liabilities (Continued) | | | | |
| Counterparty | | Gross Amounts Not Offset in the Consolidated
Statement of Assets & Liabilities* | | | Financial Instruments Available for Offset | | | Financial Instruments Collateral Pledged** | | | Cash Collateral Pledged** | | | Net Amount | |
| |
Toronto Dominion Bank | | $ | (693,624) | | | $ | 693,624 | | | $ | — | | | $ | — | | | $ | — | |
| | | | |
| | $ | (13,029,957) | | | $ | 8,042,321 | | | $ | 4,280,208 | | | $ | — | | | $ | (707,428) | |
| | | | |
*OTC derivatives are reported gross on the Consolidated Statement of Assets and Liabilities. Exchange traded options and margin related to centrally cleared swaps and futures are excluded from these reported amounts.
**Reported collateral pledged within this table is limited to the net outstanding amount due from the Fund. The securities pledged as collateral by the Fund as reported on the Consolidated Statements of Investments may exceed these amounts.
The following table presents the valuations of derivative instruments by risk exposure as reported within the Consolidated Statement of Assets and Liabilities at period end:
| | | | | | | | | | | | |
| | | Asset Derivatives | | | Liability Derivatives | |
Derivatives Not
Accounted for | | Consolidated Statement of Assets | | | | | Consolidated Statement of Assets | | | |
| as Hedging Instruments | | and Liabilities Location | | Value | | | and Liabilities Location | | Value | |
| |
Credit contracts | | Swaps, at value | | $ | 673,810 | | | Swaps, at value | | $ | 419,108 | |
| Forward currency exchange contracts | | | | | | | | Swaps, at value | | | 1,512,906 | |
Interest rate contracts | | Swaps, at value | | | 96,253 | | | Swaps, at value | | | 884,233 | |
Credit contracts | | Centrally cleared swaps, at value | | | 753,273 | | | | | | | |
Interest rate contracts | | Centrally cleared swaps, at value | | | 397,227 | | | Centrally cleared swaps, at value | | | 134,727 | |
Interest rate contracts | | Variation margin receivable | | | 209,718 * | | | Variation margin payable | | | 340,363 * | |
| Forward currency exchange contracts | | Unrealized appreciation on forward currency exchange contracts | | | 9,289,082 | | | Unrealized depreciation on foreign currency exchange contracts | | | 5,683,039 | |
| Forward currency exchange contracts | | | | | | | | Options written, at value | | | 2,022,112 | |
Interest rate contracts | | | | | | | | Swaptions written, at value | | | 2,508,559 | |
| Foreign exchange contracts | | Investments, at value | | | 1,239,886 ** | | | | | | | |
Interest rate contracts | | Investments, at value | | | 1,129,623 ** | | | | | | | |
| | | | | | | | | | | | |
Total | | | | $ | 13,788,872 | | | | | $ | 13,505,047 | |
| | | | | | | | | | | | |
*Includes only the current day’s variation margin. Prior variation margin movements have been reflected in cash on the Consolidated Statement of Assets and Liabilities upon receipt or payment.
**Amounts relate to purchased option contracts and purchased swaption contracts.
The effect of derivative instruments on the Consolidated Statement of Operations is as follows:
| | | | | | | | | | | | | | | | | | | | | | | | | | | | |
| | | Amount of Realized Gain or (Loss) Recognized on Derivatives | | | | |
| |
Derivatives Not
Accounted for as Hedging Instruments | | Investment from unaffiliated companies | | | Closing and expiration of swaption
contracts written | | | Closing and expiration of option
contracts
written | | | Closing and expiration of futures contracts | | | Foreign currency transactions | | | Swap contracts | | | Total | |
| |
Credit contracts | | $ | 145,257 | | | $ | 239,020 | | | $ | — | | | $ | — | | | $ | — | | | $ | (662,512) | | | $ | (278,235) | |
Equity contracts | | | (787,450) | | | | — | | | | 56,111 | | | | — | | | | — | | | | — | | | | (731,339) | |
| Forward currency exchange contracts | | | 3,781,051 | | | | 59,473 | | | | 1,163,853 | | | | — | | | | 52,381,145 | | | | 333,807 | | | | 57,719,329 | |
Interest rate contracts | | | (3,768,750) | | | | 1,503,294 | | | | — | | | | (2,672,293) | | | | — | | | | (2,624,153) | | | | (7,561,902) | |
| | | | |
Total | | $ | (629,892) | | | $ | 1,801,787 | | | $ | 1,219,964 | | | $ | (2,672,293) | | | $ | 52,381,145 | | | $ | (2,952,858) | | | $ | 49,147,853 | |
| | | | |
* Includes purchased options contracts, purchased swaption contracts, written options contracts exercised and written swaption contracts exercised, if any.
| | | | | | | | | | | | | | | | | | | | | | | | | | | | |
| | | Amount of Change in Unrealized Gain or (Loss) Recognized on Derivatives | | | | |
| |
Derivatives Not Accounted for as Hedging Instruments | | Investments* | | | Option
contracts
written | | | Swaption
contracts
written | | | Futures
contracts | | | Translation of assets and liabilities denominated in foreign currencies | | | Swap contracts | | | Total | |
| |
Credit contracts | | $ | — | | | $ | — | | | $ | — | | | $ | — | | | $ | — | | | $ | (1,446,263) | | | $ | (1,446,263) | |
Equity contracts | | | (185,371) | | | | — | | | | — | | | | — | | | | — | | | | — | | | | (185,371) | |
| Forward currency exchange contracts | | | (609,333) | | | | 63,839 | | | | — | | | | — | | | | (11,869,416) | | | | (1,512,906) | | | | (13,927,816) | |
Interest rate contracts | | | 1,665,681 | | | | (42,883) | | | | (209,992) | | | | (436,856) | | | | — | | | | 253,428 | | | | 1,229,378 | |
| | | | |
Total | | $ | 870,977 | | | $ | 20,956 | | | $ | (209,992) | | | $ | (436,856) | | | $ | (11,869,416) | | | $ | (2,705,741) | | | $ | (14,330,072) | |
| | | | |
*Includes purchased option contracts and purchased swaption contracts, if any.
7. Shares of Beneficial Interest
The Fund has authorized an unlimited number of $0.001 par value shares of beneficial interest of each class. Transactions in shares of beneficial interest were as follows:
53 OPPENHEIMER GLOBAL STRATEGIC INCOME FUND/VA
NOTES TO CONSOLIDATED FINANCIAL STATEMENTS Continued
7. Shares of Beneficial Interest (Continued)
| | | | | | | | | | | | | | | | |
| | | Year Ended December 31, 2015 | | | Year Ended December 31, 2014 | |
| | | Shares | | | Amount | | | Shares | | | Amount | |
| |
Non-Service Shares | | | | | | | | | | | | | | | | |
Sold | | | 4,671,962 | | | $ | 23,990,179 | | | | 9,006,106 | | | $ | 48,748,110 | |
Dividends and/or distributions reinvested | | | 5,825,930 | | | | 29,479,205 | | | | 5,850,421 | | | | 31,299,751 | |
Redeemed | | | (33,212,336) | | | | (173,570,603) | | | | (41,379,216) | | | | (222,681,939) | |
| | | | |
Net decrease | | | (22,714,444) | | | $ | (120,101,219) | | | | (26,522,689) | | | $ | (142,634,078) | |
| | | | |
| | | | |
Service Shares | | | | | | | | | | | | | | | | |
Sold | | | 13,496,560 | | | $ | 71,281,913 | | | | 11,185,648 | | | $ | 61,790,733 | |
Dividends and/or distributions reinvested | | | 15,712,417 | | | | 81,704,570 | | | | 11,624,671 | | | | 63,703,194 | |
Redeemed | | | (40,362,328) | | | | (212,925,973) | | | | (48,724,577) | | | | (270,038,823) | |
| | | | |
Net decrease | | | (11,153,351) | | | $ | (59,939,490) | | | | (25,914,258) | | | $ | (144,544,896) | |
| | | | |
8. Purchases and Sales of Securities
The aggregate cost of purchases and proceeds from sales of securities, other than short-term obligations and investments in IMMF, for the reporting period were as follows:
| | | | | | | | | | | | |
| | | Purchases | | | | | | Sales | |
| |
Investment securities | | | $1,383,893,591 | | | | | | | | $1,591,953,126 | |
U.S. government and government agency obligations | | | 70,629,311 | | | | | | | | 74,135,243 | |
To Be Announced (TBA) mortgage-related securities | | | 1,225,140,927 | | | | | | | | 1,266,426,777 | |
9. Fees and Other Transactions with Affiliates
Management Fees. Under the investment advisory agreement, the Fund pays the Manager a management fee based on the daily net assets of the Fund at an annual rate as shown in the following table:
| | | | |
| Fee Schedule | | | |
| |
Up to $200 million | | | 0.75% | |
Next $200 million | | | 0.72 | |
Next $200 million | | | 0.69 | |
Next $200 million | | | 0.66 | |
Next $200 million | | | 0.60 | |
Next $4 billion | | | 0.50 | |
Over $5 billion | | | 0.48 | |
The Manager also provides investment management related services to the Subsidiary. The Subsidiary pays the Manager a monthly management fee at an annual rate according to the above schedule. The Subsidiary also pays certain other expenses including custody and directors’ fees.
The Fund’s effective management fee for the reporting period was 0.59% of average annual net assets before any Subsidiary management fees or any applicable waivers.
Sub-Adviser Fees. The Manager has retained the Sub-Adviser to provide the day-to-day portfolio management of the Fund. Under the Sub-Advisory Agreement, the Manager pays the Sub-Adviser an annual fee in monthly installments, equal to a percentage of the investment management fee collected by the Manager from the Fund, which shall be calculated after any investment management fee waivers. The fee paid to the Sub-Adviser is paid by the Manager, not by the Fund.
Transfer Agent Fees. OFI Global (the “Transfer Agent”) serves as the transfer and shareholder servicing agent for the Fund. The Fund pays the Transfer Agent a fee based on annual net assets. Fees incurred and average net assets for each class with respect to these services are detailed in the Consolidated Statement of Operations and Consolidated Financial Highlights, respectively.
Sub-Transfer Agent Fees. The Transfer Agent has retained Shareholder Services, Inc., a wholly-owned subsidiary of OFI (the “Sub-Transfer Agent”), to provide the day-to-day transfer agent and shareholder servicing of the Fund. Under the Sub-Transfer Agency Agreement, the Transfer Agent pays the Sub-Transfer Agent an annual fee in monthly installments, equal to a percentage of the transfer agent fee collected by the Transfer Agent from the Fund, which shall be calculated after any applicable fee waivers. The fee paid to the Sub-Transfer Agent is paid by the Transfer Agent, not by the Fund.
Distribution and Service Plan for Service Shares. The Fund has adopted a Distribution and Service Plan (the “Plan”) pursuant to Rule 12b-1 under the 1940 Act for Service shares to pay OppenheimerFunds Distributor, Inc. (the “Distributor”), for distribution related services, personal service and account maintenance for the Fund’s Service shares. Under the Plan, payments are made periodically at an annual rate of 0.25% of the daily net assets of Service shares of the Fund. The Distributor currently uses all of those fees to compensate sponsors of the insurance product that offers Fund shares, for providing personal service and maintenance of accounts of their variable contract owners that hold Service shares. These fees are paid out of the Fund’s assets on an on-going basis and increase operating expenses of the Service shares, which results in lower performance compared to the Fund’s shares that are not subject to a service fee. Fees incurred by the Fund under the Plan are detailed in the Consolidated Statement of Operations.
54 OPPENHEIMER GLOBAL STRATEGIC INCOME FUND/VA
9. Fees and Other Transactions with Affiliates (Continued)
Waivers and Reimbursements of Expenses. The Manager has voluntarily agreed to limit the Fund’s expenses after payments, waivers and/or reimbursements and reduction to custodian expenses, excluding expenses incurred directly or indirectly by the Fund as a result of investments in other investment companies, wholly-owned subsidiaries and pooled investment vehicles; so that those expenses, as percentages of daily net assets, will not exceed the annual rate of 0.75% for Non-Service shares and 1.00% for Service shares. The expense limitations do not include interest and fees from borrowing, and other expenses not incurred in the ordinary course of the Fund’s business.
The Manager has contractually agreed to waive the management fee it receives from the Fund in an amount equal to the management fee it receives from the Subsidiary. During the reporting period, the Manager waived $39,777.
The Manager will waive fees and/or reimburse Fund expenses in an amount equal to the indirect management fees incurred through the Fund’s investments in underlying funds managed by the Manager or its affiliates. During the reporting period, the Manager waived fees and/or reimbursed the Fund $648,696 for management fees.
Waivers and/or reimbursements may be modified or terminated as set forth according to the terms in the prospectus.
Cross-Trades. The Fund is permitted to purchase and sell securities from and to other Funds managed by the Manager (“cross-trade”) pursuant to “Cross-Trading” Procedures adopted by the Fund’s Board of Trustees. These procedures are designed to ensure that any cross-trade of securities by the Fund from or to another fund that is or could be considered an affiliate of the Fund under certain limited circumstances by virtue of having a common investment adviser, common Officer, or common Trustee complies with Rule 17a-7 of the 1940 Act. Further, as defined under these procedures, each cross-trade is effected at the current market price to save costs where allowed.
During the period the Fund had $27,302,541 in purchases and $43,175,914 in sales considered cross-trades.
10. Borrowings and Other Financing
Joint Credit Facility. A number of mutual funds managed by the Manager participate in a $1.28 billion revolving credit facility (the “Facility”) intended to provide short-term financing, if necessary, subject to certain restrictions in connection with atypical redemption activity. Expenses and fees related to the Facility are paid by the participating funds and are disclosed separately or as other expenses on the Consolidated Statement of Operations. The Fund did not utilize the Facility during the reporting period.
11. Pending Litigation
In 2009, several putative class action lawsuits were filed and later consolidated before the U.S. District Court for the District of Colorado against OppenheimerFunds, Inc. (“OFI”), OppenheimerFunds Distributor, Inc. (“OFDI”), and Oppenheimer Rochester California Municipal Fund, a fund advised by OFI Global Asset Management, Inc. and distributed by the Distributor (the “California Fund”), in connection with the California Fund’s investment performance. The plaintiffs asserted claims against OFI, OFDI and certain present and former trustees and officers of the California Fund under the federal securities laws, alleging, among other things, that the disclosure documents of the California Fund contained misrepresentations and omissions and the investment policies of the California Fund were not followed. Plaintiffs in the suit filed an amended complaint and defendants filed a motion to dismiss. In 2011, the court issued an order which granted in part and denied in part the defendants’ motion to dismiss. In 2012, plaintiffs filed a motion, which defendants opposed, to certify a class and appoint class representatives and class counsel. In March 2015, the court granted plaintiffs’ motion for class certification. In May 2015, the U.S. Court of Appeals for the Tenth Circuit vacated the class certification order and remanded the matter to the district court for further proceedings. In October 2015, the district court reaffirmed its order granting plaintiffs’ motion for class certification. In December 2015, the Tenth Circuit denied defendants’ petition to appeal the district court’s reaffirmed class certification order.
OFI and OFDI believe the suit is without merit; that it is premature to render any opinion as to the likelihood of an outcome unfavorable to them in the suit; and that no estimate can yet be made as to the amount or range of any potential loss. Furthermore, OFI believes that the suit should not impair the ability of OFI or OFDI to perform their respective duties to the Fund and that the outcome of the suit should not have any material effect on the operations of any of the Oppenheimer funds.
55 OPPENHEIMER GLOBAL STRATEGIC INCOME FUND/VA
REPORT OF INDEPENDENT REGISTERED PUBLIC ACCOUNTING FIRM
The Board of Trustees and Shareholders of Oppenheimer Variable Account Funds:
We have audited the accompanying consolidated statement of assets and liabilities of Oppenheimer Global Strategic Income Fund/VA (a separate series of Oppenheimer Variable Account Funds) and subsidiary, including the consolidated statement of investments, as of December 31, 2015, and the related consolidated statement of operations for the year then ended, the consolidated statements of changes in net assets for each of the years in the two-year period then ended, and the consolidated financial highlights for each of the years in the five-year period then ended. These consolidated financial statements and consolidated financial highlights are the responsibility of the Fund’s management. Our responsibility is to express an opinion on these consolidated financial statements and consolidated financial highlights based on our audits.
We conducted our audits in accordance with the standards of the Public Company Accounting Oversight Board (United States). Those standards require that we plan and perform the audit to obtain reasonable assurance about whether the financial statements and financial highlights are free of material misstatement. An audit includes examining, on a test basis, evidence supporting the amounts and disclosures in the financial statements. Our procedures included confirmation of securities owned as of December 31, 2015, by correspondence with the custodian, transfer agent and brokers, or by other appropriate auditing procedures where replies from brokers were not received. An audit also includes assessing the accounting principles used and significant estimates made by management, as well as evaluating the overall financial statement presentation. We believe that our audits provide a reasonable basis for our opinion.
In our opinion, the consolidated financial statements and consolidated financial highlights referred to above present fairly, in all material respects, the financial position of Oppenheimer Global Strategic Income Fund/VA and subsidiary as of December 31, 2015, the results of their operations for the year then ended, the changes in their net assets for each of the years in the two-year period then ended, and the consolidated financial highlights for each of the years in the five-year period then ended, in conformity with U.S. generally accepted accounting principles.
KPMG LLP
Denver, Colorado
February 16, 2016
56 OPPENHEIMER GLOBAL STRATEGIC INCOME FUND/VA
FEDERAL INCOME TAX INFORMATION Unaudited
In early 2016, if applicable, shareholders of record received information regarding all dividends and distributions paid to them by the Fund during calendar year 2015.
Dividends, if any, paid by the Fund during the reporting period which are not designated as capital gain distributions should be multiplied by the maximum amount allowable but not less than 0.17% to arrive at the amount eligible for the corporate dividend-received deduction.
The foregoing information is presented to assist shareholders in reporting distributions received from the Fund to the Internal Revenue Service. Because of the complexity of the federal regulations which may affect your individual tax return and the many variations in state and local tax regulations, we recommend that you consult your tax advisor for specific guidance.
57 OPPENHEIMER GLOBAL STRATEGIC INCOME FUND/VA
BOARD APPROVAL OF THE FUND’S INVESTMENT ADVISORY AND SUB-ADVISORY AGREEMENTS Unaudited
The Fund has entered into an investment advisory agreement with OFI Global Asset Management, Inc. (“OFI Global” or the “Adviser”), a wholly-owned subsidiary of OppenheimerFunds, Inc. (“OFI” or the “Sub-Adviser”) (“OFI Global” and “OFI” together the “Managers”) and OFI Global has entered into a sub-advisory agreement with OFI whereby OFI provides investment sub-advisory services to the Fund (collectively, the “Agreements”). Each year, the Board of Trustees (the “Board”), including a majority of the independent Trustees, is required to determine whether to approve the terms of the Agreements and the renewal thereof. The Investment Company Act of 1940, as amended, requires that the Board request and evaluate, and that the Managers provide, such information as may be reasonably necessary to evaluate the terms of the Agreements. The Board employs an independent consultant to prepare a report that provides information, including comparative information that the Board requests for that purpose. In addition to in-person meetings focused on this evaluation, the Board receives information throughout the year regarding Fund services, fees, expenses and performance.
The Adviser, Sub-Adviser and the independent consultant provided information to the Board on the following factors: (i) the nature, quality and extent of the Managers’ services, (ii) the comparative investment performance of the Fund and the Managers, (iii) the fees and expenses of the Fund, including comparative fee and expense information, (iv) the profitability of the Managers and their affiliates, including an analysis of the cost of providing services, (v) whether economies of scale are realized as the Fund grows and whether fee levels reflect these economies of scale for Fund investors and (vi) other benefits to the Managers from their relationship with the Fund. The Board was aware that there are alternatives to retaining the Managers.
Outlined below is a summary of the principal information considered by the Board as well as the Board’s conclusions.
Nature, Quality and Extent of Services. The Board considered information about the nature, quality and extent of the services provided to the Fund and information regarding the Managers’ key personnel who provide such services. The Managers’ duties include providing the Fund with the services of the portfolio managers and the Sub-Adviser’s investment team, who provide research, analysis and other advisory services in regard to the Fund’s investments; and securities trading services. OFI Global is responsible for oversight of third-party service providers; monitoring compliance with applicable Fund policies and procedures and adherence to the Fund’s investment restrictions; risk management; and oversight of the Sub-Adviser. OFI Global is also responsible for providing certain administrative services to the Fund as well. Those services include providing and supervising all administrative and clerical personnel who are necessary in order to provide effective corporate administration for the Fund; compiling and maintaining records with respect to the Fund’s operations; preparing and filing reports required by the U.S. Securities and Exchange Commission; preparing periodic reports regarding the operations of the Fund for its shareholders; preparing proxy materials for shareholder meetings; and preparing the registration statements required by federal and state securities laws for the sale of the Fund’s shares. OFI Global also provides the Fund with office space, facilities and equipment.
The Board also considered the quality of the services provided and the quality of the Managers’ resources that are available to the Fund. The Board took account of the fact that the Sub-Adviser has had over fifty years of experience as an investment adviser and that its assets under management rank it among the top mutual fund managers in the United States. The Board evaluated the Managers’ advisory, administrative, accounting, legal, compliance services and risk management, and information the Board has received regarding the experience and professional qualifications of the Managers’ key personnel and the size and functions of its staff. In its evaluation of the quality of the portfolio management services provided, the Board considered the experience of Michael Mata, Krishna Memani, and Hemant Baijal, the portfolio managers for the Fund, and the Sub-Adviser’s investment team and analysts. The Board members also considered the totality of their experiences with the Managers as directors or trustees of the Fund and other funds advised by the Managers. The Board considered information regarding the quality of services provided by affiliates of the Managers, which the Board members have become knowledgeable about through their experiences with the Managers and in connection with the renewal of the Fund’s service agreements. The Board concluded, in light of the Managers’ experience, reputation, personnel, operations and resources that the Fund benefits from the services provided under the Agreements.
Investment Performance of the Managers and the Fund. Throughout the year, the Managers provided information on the investment performance of the Fund, including comparative performance information. The Board also reviewed information, prepared by the Managers and by the independent consultant, comparing the Fund’s historical performance to relevant market indices and to the performance of other multisector bond funds underlying variable insurance products. The Board considered that the Fund outperformed its category median during the five-year period, but underperformed its category median during the one-, three- and ten-year periods. The Board took into account the Adviser’s assertion that the Fund underperformed its performance category for the one- and three-year periods due to several asset allocation decisions relative to peer funds, including the Fund’s position in emerging market local debt for the one-year period, as well as security selection in high yield bonds. The Board also considered the Adviser’s assertion that the Fund outperformed its benchmark and ranked in the 25th percentile for the year-to-date period ended April 30, 2015. The Board took into account recent changes to the Fund, including that Hemant Baijal was appointed as a new portfolio manager for the Fund effective as of March 31, 2015.
Fees and Expenses of the Fund. The Board reviewed the fees paid to the Adviser and the other expenses borne by the Fund. The Board noted that the Adviser, not the Fund, pays the Sub-Adviser’s fee under the sub-advisory agreement. The independent consultant provided comparative data in regard to the fees and expenses of the Fund and other multisector bond funds underlying variable insurance products. In reviewing the fees and expenses charged to the VA funds, the Board considered the Adviser’s assertion that, because there is much greater disparity in the fees and services that may be provided by a manager to a VA fund as opposed to a retail fund, when comparing the expenses of the various VA funds to those of retail funds, it is most appropriate to focus on total expenses (rather than on the management fees). Accordingly, while the Board reviewed and considered all expenses, it focused on total expenses. The Board considered that the Fund’s total expenses, after waivers, were lower than its peer group median and category median. The Board also considered that the Fund’s contractual management fee was lower than its peer group median and category median. Within the total asset range of $2 billion to $5 billion, the Fund’s effective management fee rate was lower than its peer group median and category median. The Board noted that the Adviser has voluntarily agreed to limit the Fund’s total annual operating expenses so that those expenses, as percentages of daily net assets, will not exceed the annual rate of 0.75% for Non-Service Shares and 1.00% for Service Shares. This voluntary expense limitation may be amended or withdrawn at any time without prior notice to shareholders.
58 OPPENHEIMER GLOBAL STRATEGIC INCOME FUND/VA
Economies of Scale and Profits Realized by the Managers. The Board considered information regarding the Managers’ costs in serving as the Fund’s investment adviser and sub-adviser, including the costs associated with the personnel and systems necessary to manage the Fund, and information regarding the Managers’ profitability from their relationship with the Fund. The Board reviewed whether the Managers may realize economies of scale in managing and supporting the Fund. The Board noted that the Fund currently has management fee breakpoints, which are intended to share with Fund shareholders economies of scale that may exist as the Fund’s assets grow.
Other Benefits to the Managers. In addition to considering the profits realized by the Managers, the Board considered information that was provided regarding the direct and indirect benefits the Managers receive as a result of their relationship with the Fund, including compensation paid to the Managers’ affiliates.
Conclusions. These factors were also considered by the independent Trustees meeting separately from the full Board, assisted by experienced counsel to the Fund and to the independent Trustees. Fund counsel and the independent Trustees’ counsel are independent of the Managers within the meaning and intent of the Securities and Exchange Commission Rules.
Based on its review of the information it received and its evaluations described above, the Board, including a majority of the independent Trustees, decided to continue the Agreements through August 31, 2016. In arriving at its decision, the Board did not identify any factor or factors as being more important than others, but considered all of the above information, and considered the terms and conditions of the Agreements, including the management fees, in light of all the surrounding circumstances.
59 OPPENHEIMER GLOBAL STRATEGIC INCOME FUND/VA
PORTFOLIO PROXY VOTING POLICIES AND PROCEDURES; UPDATES TO STATEMENTS OF INVESTMENTS Unaudited
The Fund has adopted Portfolio Proxy Voting Policies and Procedures under which the Fund votes proxies relating to securities (“portfolio proxies”) held by the Fund. A description of the Fund’s Portfolio Proxy Voting Policies and Procedures is available (i) without charge, upon request, by calling the Fund toll-free at 1.800.525.7048, (ii) on the Fund’s website at www.oppenheimerfunds.com, and (iii) on the SEC’s website at www.sec.gov. In addition, the Fund is required to file Form N-PX, with its complete proxy voting record for the 12 months ended June 30th, no later than August 31st of each year. The Fund’s voting record is available (i) without charge, upon request, by calling the Fund toll-free at 1.800.525.7048, and (ii) in the Form N-PX filing on the SEC’s website at www.sec.gov.
The Fund files its complete schedule of portfolio holdings with the SEC for the first quarter and the third quarter of each fiscal year on Form N-Q. The Fund’s Form N-Q filings are available on the SEC’s website at www.sec.gov. Those forms may be reviewed and copied at the SEC’s Public Reference Room in Washington, D.C. Information on the operation of the Public Reference Room may be obtained by calling 1-800-SEC-0330.
60 OPPENHEIMER GLOBAL STRATEGIC INCOME FUND/VA
TRUSTEES AND OFFICERS Unaudited
| | |
|
| |
| Name, Position(s) Held with the Fund, Length of Service, Year of Birth | | Principal Occupation(s) During the Past 5 Years; Other Trusteeships/Directorships Held; Number of Portfolios in the Fund Complex Currently Overseen |
| |
| INDEPENDENT TRUSTEES | | The address of each Trustee in the chart below is 6803 S. Tucson Way, Centennial, Colorado 80112-3924. Each Trustee serves for an indefinite term, or until his or her resignation, retirement, death or removal. |
| |
Sam Freedman, Chairman of the Board of Trustees (since 2013) and Trustee (since 1996) Year of Birth: 1940 | | Director of Colorado UpLIFT (charitable organization) (since September 1984). Mr. Freedman held several positions with the Sub-Adviser and with subsidiary or affiliated companies of the Sub-Adviser (until October 1994). Oversees 47 portfolios in the OppenheimerFunds complex. Mr. Freedman has served on the Boards of certain Oppenheimer funds since 1996, during which time he has become familiar with the Fund’s (and other Oppenheimer funds’) financial, accounting, regulatory and investment matters and has contributed to the Boards’ deliberations. |
| |
Jon S. Fossel, Trustee (since 1990) Year of Birth: 1942 | | Chairman of the Board of Jack Creek Preserve Foundation (non-profit organization) (since 2005); Chairman of the Board (2006-December 2011) and Director (June 2002-December 2011) of UNUMProvident (insurance company); Director of Northwestern Energy Corp. (public utility corporation) (November 2004-December 2009); Director of P.R. Pharmaceuticals (October 1999-October 2003); Director of Rocky Mountain Elk Foundation (non-profit organization) (February 1998-February 2003 and February 2005-February 2007); Chairman and Director (until October 1996) and President and Chief Executive Officer (until October 1995) of the Sub-Adviser; President, Chief Executive Officer and Director of the following: Oppenheimer Acquisition Corp. (“OAC”) (parent holding company of the Sub-Adviser), Shareholders Services, Inc. and Shareholder Financial Services, Inc. (until October 1995). Oversees 47 portfolios in the OppenheimerFunds complex. Mr. Fossel has served on the Boards of certain Oppenheimer funds since 1990, during which time he has become familiar with the Fund’s (and other Oppenheimer funds’) financial, accounting, regulatory and investment matters and has contributed to the Boards’ deliberations. |
| |
Richard F. Grabish, Trustee (since 2012) Year of Birth: 194 | | Formerly Senior Vice President and Assistant Director of Sales and Marketing (March 1997-December 2007), Director (March 1987-December 2007) and Manager of Private Client Services (June 1985-June 2005) of A.G. Edwards & Sons, Inc. (broker/dealer and investment firm); Chairman and Chief Executive Officer of A.G. Edwards Trust Company, FSB (March 2001-December 2007); President and Vice Chairman of A.G. Edwards Trust Company, FSB (investment adviser) (April 1987-March 2001); President of A.G. Edwards Trust Company, FSB (investment adviser) (June 2005-December 2007). Oversees 47 portfolios in the OppenheimerFunds complex. Mr. Grabish has served on the Boards of certain Oppenheimer funds since 2001, during which time he has become familiar with the Fund’s (and other Oppenheimer funds’) financial, accounting, regulatory and investment matters and has contributed to the Boards’ deliberations. |
| |
Beverly L. Hamilton, Trustee (since 2002) Year of Birth: 1946 | | Trustee of Monterey Institute for International Studies (educational organization) (since February 2000); Board Member of Middlebury College (educational organization) (December 2005-June 2011); Chairman (since 2010) of American Funds’ Emerging Markets Growth Fund, Inc. (mutual fund); Director of The California Endowment (philanthropic organization) (April 2002-April 2008); Director (February 2002-2005) and Chairman of Trustees (2006-2007) of the Community Hospital of Monterey Peninsula; Director (October 1991-2005); Vice Chairman (2006-2009) of American Funds’ Emerging Markets Growth Fund, Inc. (mutual fund); President of ARCO Investment Management Company (February 1991-April 2000); Member of the investment committees of The Rockefeller Foundation (2001-2006) and The University of Michigan (since 2000); Advisor at Credit Suisse First Boston’s Sprout venture capital unit (venture capital fund) (1994-January 2005); Trustee of MassMutual Institutional Funds (investment company) (1996-June 2004); Trustee of MML Series Investment Fund (investment company) (April 1989-June 2004); Member of the investment committee of Hartford Hospital (2000-2003); and Advisor to Unilever (Holland) pension fund (2000-2003). Oversees 47 portfolios in the OppenheimerFunds complex. Ms. Hamilton has served on the Boards of certain Oppenheimer funds since 2002, during which time she has become familiar with the Fund’s (and other Oppenheimer funds’) financial, accounting, regulatory and investment matters and has contributed to the Boards’ deliberations. |
| |
Victoria J. Herget, Trustee (since 2012) Year of Birth: 1951 | | Board Chair (2008-Present) and Director (2004-Present), United Educators (insurance company); Trustee (since 2000) and Chair (since 2010), Newberry Library (independent research library); Trustee, Mather LifeWays (senior living organization) (since 2001); Independent Director of the First American Funds (mutual fund family) (2003-2011); former Managing Director (1993-2001), Principal (1985-1993), Vice President (1978-1985) and Assistant Vice President (1973-1978) of Zurich Scudder Investments (investment adviser) (and its predecessor firms); Trustee (1992-2007), Chair of the Board of Trustees (1999-2007), Investment Committee Chair (1994-1999) and Investment Committee member (2007-2010) of Wellesley College; Trustee, BoardSource (non-profit organization) (2006-2009) and Chicago City Day School (K-8 School) (1994-2005). Oversees 47 portfolios in the OppenheimerFunds complex. Ms. Herget has served on the Boards of certain Oppenheimer funds since 2012, during which time she has become familiar with the Fund’s (and other Oppenheimer funds’) financial, accounting, regulatory and investment matters and has contributed to the Boards’ deliberations. |
| |
Robert J. Malone, Trustee (since 2002) Year of Birth: 1944 | | Chairman - Colorado Market of MidFirst Bank (since January 2015); Chairman of the Board (since 2012) and Director (since August 2005) of Jones International University (educational organization); Trustee of the Gallagher Family Foundation (non-profit organization) (2000-2015); Chairman, Chief Executive Officer and Director of Steele Street Bank Trust (commercial banking) (August 2003-January 2015); Board of Directors of Opera Colorado Foundation (non-profit organization) (2008-2012); Director of Colorado UpLIFT (charitable organization) (1986-2010); Director of Jones Knowledge, Inc. (2006-2010); Former Chairman of U.S. Bank-Colorado (subsidiary of U.S. Bancorp and formerly Colorado National Bank) (July 1996-April 1999); Director of Commercial Assets, Inc. (real estate investment trust) (1993-2000); Director of U.S. Exploration, Inc. (oil and gas exploration) (1997-February 2004); Chairman of the Board (1991-1994) and Trustee (1985-1994) of Regis University; and Chairman of the Board (1990-1991 and Trustee (1984-1999) of Young Presidents Organization. Oversees 47 portfolios in the OppenheimerFunds complex. Mr. Malone has served on the Boards of certain Oppenheimer funds since 2002, during which time he has become familiar with the Fund’s (and other Oppenheimer funds’) financial, accounting, regulatory and investment matters and has contributed to the Boards’ deliberations. |
61 OPPENHEIMER GLOBAL STRATEGIC INCOME FUND/VA
TRUSTEES AND OFFICERS Unaudited / Continued
| | |
F. William Marshall, Jr., Trustee (since 2000) Year of Birth: 1942 | | Trustee Emeritus of Worcester Polytech Institute (WPI) (private university) (since 2009); Trustee of MassMutual Select Funds (formerly MassMutual Institutional Funds) (investment company) (since 1996), MML Series Investment Fund (investment company) (since 1996) and Mass Mutual Premier Funds (investment company) (since January 2012); President and Treasurer of the SIS Funds (private charitable fund) (January 1999-March 2011); Former Trustee of WPI (1985-2008); Former Chairman of the Board (2004-2006) and Former Chairman of the Investment Committee of WPI (1994-2008); Chairman of SIS Family Bank, F.S.B. (formerly SIS Bank) (commercial bank) (January 1999-July 1999); Executive Vice President of Peoples Heritage Financial Group, Inc. (commercial bank) (January 1999-July 1999); and Former President and Chief Executive Officer of SIS Bancorp. (1993-1999). Oversees 47 portfolios in the OppenheimerFunds complex. Mr. Marshall has served on the Boards of certain Oppenheimer funds since 2000, during which time he has become familiar with the Fund’s (and other Oppenheimer funds’) financial, accounting, regulatory and investment matters and has contributed to the Boards’ deliberations. |
| |
Karen L. Stuckey, Trustee (since 2012) Year of Birth: 1953 | | Partner (1990-2012) of PricewaterhouseCoopers LLP (professional services firm) (held various positions 1975-1990); Trustee (1992-2006) and member of Executive, Nominating and Audit Committees and Chair of Finance Committee of Lehigh University; and member, Women’s Investment Management Forum (professional organization) since inception. Oversees 47 portfolios in the OppenheimerFunds complex. Ms. Stuckey has served on the Boards of certain Oppenheimer funds since 2012, during which time she has become familiar with the Fund’s (and other Oppenheimer funds’) financial, accounting, regulatory and investment matters and has contributed to the Boards’ deliberations. |
| |
James D. Vaughn, Trustee (since 2012) Year of Birth:1945 | | Retired; former managing partner (1994-2001) of Denver office of Deloitte & Touche LLP, (held various positions 1969-1993); Trustee and Chairman of the Audit Committee of Schroder Funds (2003-2012); Board member and Chairman of Audit Committee of AMG National Trust Bank (since 2005); Trustee, Investment Committee member, University of South Dakota Foundation (since 1996); Board member, Audit Committee Member and past Board Chair, Junior Achievement (since 1993); former Board member, Mile High United Way, Boys and Girls Clubs, Boy Scouts, Colorado Business Committee for the Arts, Economic Club of Colorado and Metro Denver Network. Oversees 47 portfolios in the OppenheimerFunds complex. Mr. Vaughn has served on the Boards of certain Oppenheimer funds since 2012, during which time he has become familiar with the Fund’s (and other Oppenheimer funds’) financial, accounting, regulatory and investment matters and has contributed to the Boards’ deliberations. |
|
| |
| INTERESTED TRUSTEE | | Mr. Steinmetz is an “Interested Trustee” because he is affiliated with the Manager and the Sub-Adviser by virtue of his positions as Chairman and director of the Sub-Adviser and officer and director of the Manager. Both as a Trustee and as an officer, Mr. Steinmetz serves for an indefinite term, or until his resignation, retirement, death or removal. Mr. Steinmetz’s address is 225 Liberty Street, New York, New York 10281-1008. |
| |
Arthur P. Steinmetz Trustee (Since 2015), President and Principal Executive Officer (since 2014) Year of Birth: 1958 | | Chairman of the Sub-Adviser (since January 2015); CEO and Chairman of the Manager (since July 2014), President of the Manager (since May 2013), a Director of the Manager (since January 2013), Director of the Sub-Adviser (since July 2014), President, Management Director and CEO of Oppenheimer Acquisition Corp. (the Sub-Adviser’s parent holding company) (since July 2014), and President and Director of OFI SteelPath, Inc. (since January 2013). Chief Investment Officer of the OppenheimerFunds advisory entities from (January 2013-December 2013); Executive Vice President of the Manager (January 2013-May 2013); Chief Investment Officer of the Sub-Adviser (October 2010-December 2012); Chief Investment Officer, Fixed-Income, of the Sub-Adviser (April 2009-October 2010); Executive Vice President of the Sub-Adviser (October 2009-December 2012); Director of Fixed Income of the Sub-Adviser (January 2009-April 2009); and a Senior Vice President of the Sub-Adviser (March 1993-September 2009). An officer of 101 portfolios in the OppenheimerFunds complex. |
|
| |
| OTHER OFFICERS OF THE FUND | | The addresses of the Officers in the chart below are as follows: for Messrs. Baijal, Mata, Memani, Gabinet, Mss. Sexton and Picciotto, 225 Liberty Street, New York, New York 10281-1008, for Messrs. Brown and Wixted, 6803 S. Tucson Way, Centennial, Colorado 80112-3924. Each Officer serves for an indefinite term or until his or her resignation, retirement, death or removal. |
| |
Hemant Baijal Vice President (Since 2015) Year of Birth: 1962 | | Vice President and Senior Portfolio Manager of the Sub-Adviser (since July 2011) and Co-Head of the Global Debt Team (since January 2015). Co-founder, Partner and Portfolio Manager of Six Seasons Global Asset Management (January 2009-December 2010). Partner and Portfolio Manager of Aravali Partners, LLC (September 2006-December 2008); Partner and Portfolio Manager at Havell Capital Management, LLC (November 1996-August 2006). A portfolio manager and an officer of other portfolios in the OppenheimerFunds complex. |
| |
Michael Mata, Vice President (since 2014) Year of Birth: 1963 | | Senior Vice President of the Sub-Adviser and the Head of Multi-Sector Fixed Income (since July 2014). Portfolio manager with ING Investment Management and Head of Multi-Sector Fixed-Income (August 2004-December 2013), managing the Global Bond and Core Plus strategies and the macro and quantitative research teams, along with the emerging markets sovereign team. Senior Vice President and Senior Risk Manager at Putnam Investments (March 2000-August 2004) and a Vice President and Risk Manager for Fixed Income Trading at Lehman Brothers (September 1994-March 2000). A portfolio manager and an officer of other portfolios in the OppenheimerFunds complex. |
| |
Krishna Memani, Vice President (since 2009) Year of Birth: 1960 | | President of the Sub-Adviser (since January 2013); Executive Vice President of the Manager (since January 2014) and Chief Investment Officer of the OppenheimerFunds advisory entities (since January 2014). Chief Investment Officer, Fixed Income of the Sub-Adviser (January 2013-December 2013); Head of the Investment Grade Fixed Income Team of the Sub-Adviser (March 2009-January 2014); Director of Fixed Income of the Sub-Adviser (October 2010-December 2012); Senior Vice President of the Sub-Adviser (March 2009-December 2012) and Senior Vice President of OFI Global Institutional, Inc. (April 2009-December 2012). Managing Director and Head of the U.S. and European Credit Analyst Team at Deutsche Bank Securities (June 2006-January 2009). Chief Credit Strategist at Credit Suisse Securities (August 2002-March 2006). Managing Director and Senior Portfolio Manager at Putnam Investments (September 1998-June 2002). A portfolio manager and an officer of other portfolios in the OppenheimerFunds complex. |
62 OPPENHEIMER GLOBAL STRATEGIC INCOME FUND/VA
| | |
Arthur S. Gabinet, Secretary and Chief Legal Officer (since 2011) Year of Birth: 1958 | | Executive Vice President, Secretary and General Counsel of the Manager (since January 2013); General Counsel OFI SteelPath, Inc. (since January 2013); Executive Vice President (May 2010-December 2012) and General Counsel (since January 2011) of the Sub-Adviser; General Counsel of the Distributor (since January 2011); General Counsel of Centennial Asset Management Corporation (January 2011-December 2012); Executive Vice President (January 2011-December 2012) and General Counsel of HarbourView Asset Management Corporation (since January 2011); Assistant Secretary (since January 2011) and Director (since January 2011) of OppenheimerFunds International Ltd. and OppenheimerFunds plc; Director of Oppenheimer Real Asset Management, Inc. (January 2011-December 2012) and General Counsel (since January 2011); Executive Vice President (January 2011-December 2011) and General Counsel of Shareholder Financial Services, Inc. and Shareholder Services, Inc. (since January 2011); Executive Vice President (January 2011-December 2012) and General Counsel of OFI Private Investments Inc. (since January 2011); Vice President of OppenheimerFunds Legacy Program (January 2011-December 2011); Executive Vice President (January 2011-December 2012) and General Counsel of OFI Institutional Asset Management, Inc. (since January 2011); General Counsel, Asset Management of the Sub-Adviser (May 2010-December 2010); Principal, The Vanguard Group (November 2005-April 2010); District Administrator, U.S. Securities and Exchange Commission (January 2003-October 2005). An officer of 101 portfolios in the OppenheimerFunds complex. |
| |
Jennifer Sexton, Vice President and Chief Business Officer (since 2014) Year of Birth: 1969 | | Senior Vice President of OppenheimerFunds Distributor, Inc. (since June 2014); Vice President of OppenheimerFunds Distributor, Inc. (April 2006-June 2014); Vice President of the Sub-Adviser (January 1998-March 2006); Assistant Vice President of the Sub-Adviser (October 1991-December 1998). An officer of 101 portfolios in the OppenheimerFunds complex. |
| |
Mary Ann Picciotto, Chief Compliance Officer and Chief Anti-Money Laundering Officer (since 2014) Year of Birth: 1973 | | Senior Vice President and Chief Compliance Officer of the Manager (since March 2014); Chief Compliance Officer of the Sub-Adviser, OFI SteelPath, Inc., OFI Global Trust Company, OFI Global Institutional, Inc., Oppenheimer Real Asset Management, Inc., OFI Private Investments, Inc., Harborview Asset Management Corporation, Trinity Investment Management Corporation, and Shareholder Services, Inc. (since March 2014); Managing Director of Morgan Stanley Investment Management Inc. and certain of its various affiliated entities; Chief Compliance Officer of various Morgan Stanley Funds (May 2010-January 2014); Chief Compliance Officer of Morgan Stanley Investment Management Inc. (April 2007-January 2014). An officer of 101 portfolios in the OppenheimerFunds complex. |
| |
Brian W. Wixted, Treasurer and Principal Financial & Accounting Officer (since 1999) Year of Birth: 1959 | | Senior Vice President of the Manager (since January 2013); Treasurer of the Sub-Adviser, HarbourView Asset Management Corporation, Shareholder Financial Services, Inc., Shareholder Services, Inc., and Oppenheimer Real Asset Management, Inc. (March 1999-June 2008), OFI Private Investments, Inc. (March 2000-June 2008), OppenheimerFunds International Ltd. and OppenheimerFunds plc (since May 2000), OFI Institutional Asset Management, Inc. (November 2000-June 2008), and OppenheimerFunds Legacy Program (charitable trust program established by the Sub-Adviser) (June 2003-December 2011); Treasurer and Chief Financial Officer of OFI Trust Company (since May 2000); Assistant Treasurer of Oppenheimer Acquisition Corporation (March 1999-June 2008). An officer of 101 portfolios in the OppenheimerFunds complex. |
The Fund’s Statement of Additional Information contains additional information about the Fund’s Trustees and Officers and is available without charge, upon request, by calling 1.800.988.8287.
63 OPPENHEIMER GLOBAL STRATEGIC INCOME FUND/VA
OPPENHEIMER GLOBAL STRATEGIC INCOME FUND/VA
A Series of Oppenheimer Variable Account Funds
| | | | |
| Manager | | | | OFI Global Asset Management, Inc. |
| | |
| Sub-Adviser | | | | OppenheimerFunds, Inc. |
| | |
| Distributor | | | | OppenheimerFunds Distributor, Inc. |
| | |
| Transfer and Shareholder Servicing Agent | | | | OFI Global Asset Management, Inc. |
| | |
| Sub-Transfer Agent | | | | Shareholder Services, Inc. |
| | | | DBA OppenheimerFunds Services |
| | |
| Independent Registered Public Accounting Firm | | | | KPMG LLP |
| | |
| Counsel | | | | Ropes & Gray LLP |
| | |
| | | | Before investing in any of the Oppenheimer funds, investors should carefully consider a fund’s investment objectives, risks, charges and expenses. Fund prospectuses and summary prospectuses contain this and other information about the funds, and may be obtained by asking your financial advisor, or calling us at 1.800.988.8287. Read prospectuses and summary prospectuses carefully before investing. |
| | |
| | | | © 2016 OppenheimerFunds, Inc. All rights reserved. Oppenheimer funds are distributed by OppenheimerFunds Distributor, Inc. |


PORTFOLIO MANAGER: Michael S. Levine, CFA
AVERAGE ANNUAL TOTAL RETURNS FOR THE PERIODS ENDED 12/31/15
| | | | | | | | | | | | | | | | |
| | | Inception Date | | | 1-Year | | | 5-Year | | | 10-Year | |
Non-Service Shares | | | 1/2/03 | | | | -9.58 | % | | | 7.40 | % | | | 6.58 | % |
Service Shares | | | 9/18/06 | | | | -9.82 | | | | 6.78 | | | | 3.63 | * |
Russell 1000 Value Index | | | | | | | -3.83 | | | | 11.27 | | | | 6.16 | |
| *Shows | performance since inception. |
Performance data quoted represents past performance, which does not guarantee future results. The investment return and principal value of an investment in the Fund will fluctuate so that an investor’s shares, when redeemed, may be worth more or less than their original cost. Current performance may be lower or higher than the performance quoted. For performance data current to the most recent month end, call us at 1.800.988.8287. The Fund’s total returns should not be expected to be the same as the returns of other funds, whether or not both funds have the same portfolio managers and/or similar names. The Fund’s total returns include changes in share price and reinvested distributions but do not include the charges associated with the separate account products that offer this Fund. Such performance would have been lower if such charges were taken into account.
TOP HOLDINGS AND ALLOCATIONS
TOP TEN COMMON STOCK HOLDINGS
| | | | |
Citigroup, Inc. | | | 5.6% | |
JPMorgan Chase & Co. | | | 4.7 | |
Assured Guaranty Ltd. | | | 2.9 | |
Merck & Co., Inc. | | | 2.6 | |
Ford Motor Co. | | | 2.6 | |
MetLife, Inc. | | | 2.5 | |
General Motors Co. | | | 2.2 | |
Wells Fargo & Co. | | | 2.1 | |
Apple, Inc. | | | 2.0 | |
AT&T, Inc. | | | 1.9 | |
Portfolio holdings and allocations are subject to change. Percentages are as of December 31, 2015, and are based on net assets. For more current Fund holdings, please visit oppenheimerfunds.com.
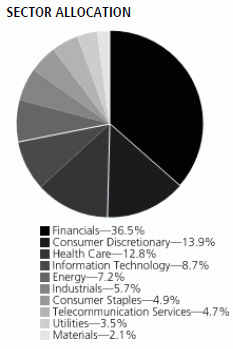
Portfolio holdings and allocations are subject to change. Percentages are as of December 31, 2015, and are based on the total market value of common stocks.
2 OPPENHEIMER EQUITY INCOME FUND/VA
Fund Performance Discussion
The Fund’s Non-Service shares returned -9.58% during the reporting period. In comparison, the Fund underperformed the Russell 1000 Value Index (the “Index”), which returned -3.83%. The Fund’s declines occurred over the second half of the reporting period amid increased market volatility. The Fund underperformed the Index due largely to stock selection in the industrials, financials and energy sectors. The Fund outperformed the Index within the consumer staples and consumer discretionary sectors, as a result of stronger relative stock selection.
MARKET OVERVIEW
2015 will go down as a year in which volatility returned to the financial markets following a multi-year hiatus. Global growth struggled to gain traction as many of the world’s largest economies expanded below their long-term trends. China’s industrial production slowed for the fifth consecutive year and weighed on the world’s exporters—especially commodity producers. In the United States, a strong dollar impaired the competitiveness of many American companies and proved to be a drag on corporate earnings.
The generally disappointing performance of global equity markets was marked by pockets of significant weakness in the energy sector and many emerging markets. U.S. equities generally outperformed their counterparts in other regions in 2015, though with tempered results and only after a market correction in August that tested investors’ nerves. Interest rates globally remained low, even as investors spent most of the year contemplating the first U.S. interest-rate hike by the Federal Reserve (the “Fed”) in almost a decade. The Fed did not raise interest rates until late in the year at its December 16 meeting, when the benchmark federal funds rate was raised by 0.25%.
TOP INDIVIDUAL CONTRIBUTORS
Top contributors to performance this period included Lear Corp., Microsoft Corp. and JPMorgan Chase & Co. Lear provides seating and electronic products to the auto industry. Strong global auto sales (ex-Europe) and improving margins helped drive the company’s strong performance during the reporting period. We have trimmed our position slightly, but we continue to like the stock due to an attractive valuation, strong U.S. results and nascent signs of improvement in Europe. Microsoft performed well during 2015 as a new management team refocused the company on faster growing segments of the market. Specifically, growth in Microsoft’s cloud business benefited the company during the past year. While we continue to like Microsoft, we did trim our position modestly after its strong performance in 2015. JPMorgan Chase & Co. is one of the largest money center banks. Banks in general performed well late in the year in anticipation of the Fed increasing interest rates. Higher rates should help bank net interest margins going forward. JPMorgan also benefits from a reasonable valuation and attractive dividend yield.
TOP INDIVIDUAL DETRACTORS
The top detractors from performance included Navistar International Corp., Kinder Morgan, Inc. and Micron Technology, Inc. Navistar International is a leading truck manufacturer. Navistar has rebounded from a failed new engine product strategy earlier this decade. While it has taken longer to recapture share and improve results than we originally anticipated, we do believe that Navistar is on its way to better market share and financial results in the next few years. While the company reported solid quarterly results late in the year and had an encouraging 2016 outlook, both the stock and the convertibles performed poorly as concerns about a weakening U.S. economy and a peak in the heavy duty truck market overwhelmed its favorable outlook. While we continue to hold a position in Navistar convertible bonds, our concerns about the macro environment led us to reduce our position.
Kinder Morgan is a leading energy infrastructure company. While Kinder is a C-corp, it trades in line with the master limited partnership (MLP) space and has been valued on its distribution yield and the expected growth rate of that distribution. Kinder’s stock price has been declining since the middle of 2015 in conjunction with the sharp decline in commodity prices. This weakness has made raising equity to fund its large backlog more expensive. Furthermore, Kinder Morgan miscalculated during the reporting period and made a small acquisition that threatened its investment grade rating. A higher cost of equity and the risk of higher debt costs put the company in a bind and Kinder elected to cut its distribution during the reporting period to fund its backlog and improve its credit metrics. We still maintain a modest position in Kinder’s convertible preferred stock as we enter the New Year. If commodity prices stabilize, we believe Kinder and the entire space will rebound, but the distribution cut was greater than we anticipated.
Micron Technology is a leading manufacturer of memory (DRAM and NAND) for the technology industry. Historically, the memory business has been characterized by commodity pricing and boom/bust cycles. We believe that industry consolidation has fundamentally changed the dynamics of the memory market. In our opinion, the dominant three players should be able to limit capacity growth to better match demand and ultimately lead to better pricing and more consistent profitability. While this is true, demand was weaker than we anticipated during the past year due to softer PC demand. We believe the
3 OPPENHEIMER EQUITY INCOME FUND/VA
supply/demand dynamics will improve in calendar year 2016, which can result in better stock price performance. Most of our position in Micron is in its 3% convertible bond, which we believe has an attractive risk/reward profile.
STRATEGY & OUTLOOK
The economic and market environment remain very cloudy as we enter 2016. While the employment data suggest a very healthy consumer, the manufacturing data paint a very different picture. Industrial America is having a very tough time, to a large extent due to a strong dollar and weak commodity prices. Furthermore, the Fed has started to raise interest rates and seems eager to continue along this path, despite the conflicting economic signs. We expect continued high levels of volatility during the beginning of the year. That being said, we expect energy prices to begin to stabilize during the next few months as supply cutbacks materialize. We believe stable commodity prices will help to calm the markets. While value stocks have significantly underperformed the market during the past few years, we continue to believe that the Fund is well positioned to benefit when value investing begins to outperform again. Furthermore, we continue to target an above average dividend yield.
Investors should consider the Fund’s investment objective, risks, charges and expenses carefully before investing. The Fund’s prospectus and summary prospectus contain this and other information about the Fund, and may be obtained by asking your financial advisor or calling us at 1.800.988.8287. Read prospectuses and summary prospectuses carefully before investing.
Total returns include changes in share price and reinvestment of dividends and capital gains distributions in a hypothetical investment for the periods shown.
The Fund’s investment strategy and focus can change over time. The mention of specific fund holdings does not constitute a recommendation by OppenheimerFunds, Inc. or its affiliates.
Shares of Oppenheimer funds are not deposits or obligations of any bank, are not guaranteed by any bank, are not insured by the FDIC or any other agency, and involve investment risks, including the possible loss of the principal amount invested.
Comparing the Fund’s Performance to the Market. The graphs that follow show the performance of a hypothetical $10,000 investment in each share class of the Fund held until December 31, 2015. In the case of Non-Service shares, performance is measured over a ten-fiscal-year period. In the case of Service shares, performance is measured from inception of the Class on September 18, 2006. Performance information does not reflect charges that apply to separate accounts investing in the Fund. If these charges were taken into account, performance would be lower. The graphs assume that all dividends and capital gains distributions were reinvested in additional shares.
The Fund’s performance is compared to the performance of the Russell 1000 Value Index. The Russell 1000 Value Index measures the performance of the large-cap value segment of the U.S. equity universe. It includes those Russell 1000 companies with lower price-to-book ratios and lower expected growth values. The Index is unmanaged and cannot be purchased directly by investors. While index comparisons may be useful to provide a benchmark for the Fund’s performance, it must be noted that the Fund’s investments are not limited to the investments comprising the Index. Index performance includes reinvestment of income, but does not reflect transaction costs, fees, expenses or taxes. Index performance is shown for illustrative purposes only as a benchmark for the Fund’s performance, and does not predict or depict performance of the Fund. The Fund’s performance reflects the effects of the Fund’s business and operating expenses.
4 OPPENHEIMER EQUITY INCOME FUND/VA
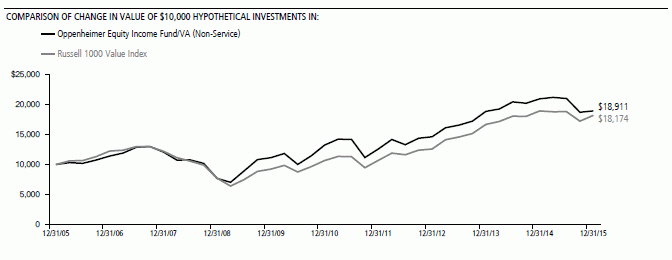
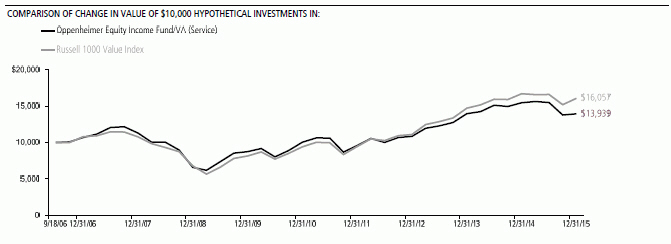
Performance data quoted represents past performance, which does not guarantee future results. The investment return and principal value of an investment in the Fund will fluctuate so that an investor’s shares, when redeemed, may be worth more or less than their original cost. Current performance may be lower or higher than the performance quoted. For performance data current to the most recent month end, call us at 1.800.988.8287. The Fund’s total returns should not be expected to be the same as the returns of other funds, whether or not both funds have the same portfolio managers and/or similar names. The Fund's total returns include changes in share price and reinvested distributions but do not include the charges associated with the separate account products that offer this Fund. Such performance would have been lower if such charges were taken into account.
5 OPPENHEIMER EQUITY INCOME FUND/VA
Fund Expenses
Fund Expenses. As a shareholder of the Fund, you incur two types of costs: (1) transaction costs and (2) ongoing costs, including management fees; distribution and service fees; and other Fund expenses. These examples are intended to help you understand your ongoing costs (in dollars) of investing in the Fund and to compare these costs with the ongoing costs of investing in other mutual funds.
The examples are based on an investment of $1,000.00 invested at the beginning of the period and held for the entire 6-month period ended December 31, 2015.
Actual Expenses. The first section of the table provides information about actual account values and actual expenses. You may use the information in this section for the class of shares you hold, together with the amount you invested, to estimate the expense that you paid over the period. Simply divide your account value by $1,000.00 (for example, an $8,600.00 account value divided by $1,000.00 = 8.60), then multiply the result by the number in the first section under the heading entitled “Expenses Paid During 6 Months Ended December 31, 2015” to estimate the expenses you paid on your account during this period.
Hypothetical Example for Comparison Purposes.
The second section of the table provides information about hypothetical account values and hypothetical expenses based on the Fund’s actual expense ratio for each class of shares, and an assumed rate of return of 5% per year for each class before expenses, which is not the actual return. The hypothetical account values and expenses may not be used to estimate the actual ending account balance or expenses you paid for the period. You may use this information to compare the ongoing costs of investing in the Fund and other funds. To do so, compare this 5% hypothetical example for the class of shares you hold with the 5% hypothetical examples that appear in the shareholder reports of the other funds.
Please note that the expenses shown in the table are meant to highlight your ongoing fund costs only and do not reflect any charges associated with the separate accounts that offer this Fund. Therefore, the “hypothetical” lines of the table are useful in comparing ongoing fund costs only, and will not help you determine the relative total costs of owning different funds. In addition, if these separate account charges were included your costs would have been higher.
| | | | | | | | | | | | |
| Actual | | Beginning
Account Value July 1, 2015 | | | Ending Account Value
December 31, 2015 | | | Expenses Paid During
6 Months Ended
December 31, 2015 | |
Non-Service shares | | $ | 1,000.00 | | | $ | 901.70 | | | $ | 3.84 | |
Service shares | | | 1,000.00 | | | | 900.20 | | | | 5.04 | |
| | | |
Hypothetical | | | | | | | | | | | | |
(5% return before expenses) | | | | | | | | | | | | |
Non-Service shares | | | 1,000.00 | | | | 1,021.17 | | | | 4.08 | |
Service shares | | | 1,000.00 | | | | 1,019.91 | | | | 5.36 | |
Expenses are equal to the Fund’s annualized expense ratio for that class, multiplied by the average account value over the period, multiplied by 184/365 (to reflect the one-half year period). Those annualized expense ratios, excluding indirect expenses from affiliated funds, based on the 6-month period ended December 31, 2015 are as follows:
| | | | |
| Class | | Expense Ratios | |
Non-Service shares | | | 0.80% | |
Service shares | | | 1.05 | |
The expense ratios reflect voluntary and/or contractual waivers and/or reimbursements of expenses by the Fund’s Manager. Some of these undertakings may be modified or terminated at any time, as indicated in the Fund’s prospectus. The “Financial Highlights” tables in the Fund’s financial statements, included in this report, also show the gross expense ratios, without such waivers or reimbursements and reduction to custodian expenses, if applicable.
6 OPPENHEIMER EQUITY INCOME FUND/VA
STATEMENT OF INVESTMENTS December 31, 2015
| | | | | | | | |
| | | Shares | | | Value | |
Common Stocks—83.7% | | | | | | | | |
| |
Consumer Discretionary—11.7% | |
| |
Auto Components—0.7% | | | | | | | | |
| |
Lear Corp. | | | 500 | | | $ | 61,415 | |
|
| |
Automobiles—4.8% | | | | | | | | |
| |
Ford Motor Co.1 | | | 15,500 | | | | 218,395 | |
| |
General Motors Co. | | | 5,525 | | | | 187,905 | |
| | | | | | | | |
| | | | | | | 406,300 | |
|
| |
Hotels, Restaurants & Leisure—0.6% | |
| |
Extended Stay America, Inc. | | | 3,385 | | | | 53,821 | |
|
| |
Household Durables—2.8% | |
| |
Beazer Homes USA, Inc.2 | | | 4,060 | | | | 46,649 | |
| |
CalAtlantic Group, Inc. | | | 2,106 | | | | 79,852 | |
| |
MDC Holdings, Inc. | | | 3,885 | | | | 99,184 | |
| |
PulteGroup, Inc. | | | 530 | | | | 9,445 | |
| | | | | | | | |
| | | | | | | 235,130 | |
|
| |
Media—0.0% | | | | | | | | |
| |
Comcast Corp., Cl. A | | | 50 | | | | 2,821 | |
|
| |
Multiline Retail—1.2% | | | | | | | | |
| |
J.C. Penney Co., Inc.2 | | | 3,240 | | | | 21,579 | |
| |
Kohl’s Corp. | | | 1,575 | | | | 75,017 | |
| | | | | | | | |
| | | | | | | 96,596 | |
|
| |
Specialty Retail—1.6% | | | | | | | | |
| |
Best Buy Co., Inc. | | | 4,200 | | | | 127,890 | |
| |
Staples, Inc. | | | 863 | | | | 8,173 | |
| | | | | | | | |
| | | | | | | 136,063 | |
|
| |
Consumer Staples—4.1% | | | | | | | | |
| |
Beverages—0.7% | | | | | | | | |
| |
Coca-Cola Co. (The) | | | 155 | | | | 6,659 | |
| |
Molson Coors Brewing Co., Cl. B | | | 550 | | | | 51,656 | |
| | | | | | | | |
| | | | | | | 58,315 | |
|
| |
Food & Staples Retailing—1.0% | |
| |
Wal-Mart Stores, Inc. | | | 1,460 | | | | 89,498 | |
|
| |
Food Products—0.9% | | | | | | | | |
| |
Kraft Heinz Co. (The) | | | 855 | | | | 62,210 | |
| |
Pinnacle Foods, Inc. | | | 345 | | | | 14,649 | |
| | | | | | | | |
| | | | | | | 76,859 | |
|
| |
Household Products—0.4% | | | | | | | | |
| |
Procter & Gamble Co. (The) | | | 440 | | | | 34,940 | |
|
| |
Tobacco—1.1% | | | | | | | | |
| |
Philip Morris International, Inc. | | | 1,055 | | | | 92,745 | |
|
| |
Energy—6.0% | | | | | | | | |
| |
Oil, Gas & Consumable Fuels—6.0% | |
| |
BP plc, Sponsored ADR | | | 2,688 | | | | 84,027 | |
| |
Chevron Corp. | | | 1,605 | | | | 144,386 | |
| |
Exxon Mobil Corp. | | | 1,100 | | | | 85,745 | |
| |
Marathon Oil Corp. | | | 1,825 | | | | 22,977 | |
| |
| Royal Dutch Shell plc, Cl. A, Sponsored ADR | | | 2,575 | | | | 117,909 | |
| |
Williams Cos., Inc. (The) | | | 2,225 | | | | 57,182 | |
| | | | | | | | |
| | | | | | | 512,226 | |
|
| |
Financials—30.6% | | | | | | | | |
| |
Capital Markets—4.1% | | | | | | | | |
| |
Goldman Sachs Group, Inc. (The) | | | 830 | | | | 149,591 | |
| |
KKR & Co. LP3 | | | 5,175 | | | | 80,678 | |
| |
Morgan Stanley | | | 3,750 | | | | 119,288 | |
| | | | | | | | |
| | | | | | | 349,557 | |
|
| |
Commercial Banks—13.2% | | | | | | | | |
| |
Bank of America Corp. | | | 3,640 | | | | 61,261 | |
| |
Citigroup, Inc.1 | | | 9,225 | | | | 477,394 | |
| |
JPMorgan Chase & Co. | | | 6,100 | | | | 402,783 | |
| | | | | | | | |
| | | Shares | | | Value | |
| |
Commercial Banks (Continued) | | | | | | | | |
| |
Wells Fargo & Co. | | | 3,355 | | | $ | 182,378 | |
| | | | | | | | |
| | | | | | | 1,123,816 | |
|
| |
Insurance—7.4% | | | | | | | | |
| |
ACE Ltd. | | | 70 | | | | 8,180 | |
| |
American International Group, Inc. | | | 1,140 | | | | 70,646 | |
| |
Assured Guaranty Ltd. | | | 9,440 | | | | 249,499 | |
| |
MBIA, Inc.2 | | | 14,225 | | | | 92,178 | |
| |
MetLife, Inc. | | | 4,425 | | | | 213,329 | |
| | | | | | | | |
| | | | | | | 633,832 | |
|
| |
Real Estate Investment Trusts (REITs)—5.5% | |
| |
| Apollo Commercial Real Estate Finance, Inc. | | | 2,820 | | | | 48,588 | |
| |
Ashford Hospitality Trust, Inc. | | | 1,500 | | | | 9,465 | |
| |
Blackstone Mortgage Trust, Inc., Cl. A | | | 1,800 | | | | 48,168 | |
| |
Colony Capital, Inc., Cl. A | | | 4,688 | | | | 91,322 | |
| |
Communications Sales & Leasing, Inc. | | | 2,625 | | | | 49,061 | |
| |
iStar, Inc.2 | | | 4,115 | | | | 48,269 | |
| |
NorthStar Realty Finance Corp. | | | 1,400 | | | | 23,842 | |
| |
Starwood Property Trust, Inc. | | | 4,950 | | | | 101,772 | |
| |
Two Harbors Investment Corp. | | | 5,576 | | | | 45,166 | |
| | | | | | | | |
| | | | | | | 465,653 | |
|
| |
Thrifts & Mortgage Finance—0.4% | |
| |
MGIC Investment Corp.2 | | | 3,775 | | | | 33,333 | |
|
| |
Health Care—10.7% | | | | | | | | |
| |
Biotechnology—0.9% | | | | | | | | |
| |
AbbVie, Inc. | | | 1,270 | | | | 75,235 | |
|
| |
Health Care Equipment & Supplies—1.4% | |
| |
Medtronic plc | | | 1,601 | | | | 123,149 | |
|
| |
Health Care Providers & Services—0.1% | |
| |
UnitedHealth Group, Inc. | | | 55 | | | | 6,470 | |
|
| |
Pharmaceuticals—8.3% | | | | | | | | |
| |
Allergan plc2 | | | 170 | | | | 53,125 | |
| |
GlaxoSmithKline plc, Sponsored ADR | | | 1,000 | | | | 40,350 | |
| |
Johnson & Johnson | | | 870 | | | | 89,366 | |
| |
Merck & Co., Inc. | | | 4,150 | | | | 219,203 | |
| |
Pfizer, Inc.1 | | | 4,970 | | | | 160,432 | |
| |
Roche Holding AG, Sponsored ADR | | | 2,165 | | | | 74,627 | |
| |
| Teva Pharmaceutical Industries Ltd., Sponsored ADR | | | 1,025 | | | | 67,281 | |
| | | | | | | | |
| | | | | | | 704,384 | |
|
| |
Industrials—4.8% | | | | | | | | |
| |
Aerospace & Defense—0.1% | | | | | | | | |
| |
United Technologies Corp. | | | 30 | | | | 2,882 | |
| |
Airlines—1.7% | | | | | | | | |
| |
United Continental Holdings, Inc.2 | | | 2,560 | | | | 146,688 | |
| |
Commercial Services & Supplies—0.9% | |
| |
R.R. Donnelley & Sons Co. | | | 5,306 | | | | 78,104 | |
| |
Electrical Equipment—0.5% | | | | | | | | |
| |
Eaton Corp. plc | | | 585 | | | | 30,443 | |
| |
General Cable Corp. | | | 930 | | | | 12,490 | |
| | | | | | | | |
| | | | | | | 42,933 | |
|
| |
Industrial Conglomerates—1.4% | | | | | | | | |
| |
General Electric Co.1 | | | 3,869 | | | | 120,520 | |
|
| |
Road & Rail—0.2% | | | | | | | | |
| |
CSX Corp. | | | 640 | | | | 16,608 | |
|
| |
Information Technology—7.2% | | | | | | | | |
| |
Communications Equipment—1.3% | | | | | | | | |
| |
Cisco Systems, Inc. | | | 2,500 | | | | 67,888 | |
| |
QUALCOMM, Inc. | | | 870 | | | | 43,487 | |
| | | | | | | | |
| | | | | | | 111,375 | |
7 OPPENHEIMER EQUITY INCOME FUND/VA
STATEMENT OF INVESTMENTS Continued
| | | | | | | | |
| | | Shares | | | Value | |
| |
Internet Software & Services—0.8% | |
| |
Alphabet, Inc., Cl. C2 | | | 90 | | | $ | 68,299 | |
| |
Semiconductors & Semiconductor Equipment—0.3% | |
| |
Applied Materials, Inc. | | | 400 | | | | 7,468 | |
| |
Cypress Semiconductor Corp.2 | | | 1,850 | | | | 18,149 | |
| | | | | | | | |
| | | | | | | 25,617 | |
|
| |
Software—2.0% | | | | | | | | |
| |
Microsoft Corp.1 | | | 2,780 | | | | 154,234 | |
| |
Oracle Corp. | | | 460 | | | | 16,804 | |
| | | | | | | | |
| | | | | | | 171,038 | |
|
| |
Technology Hardware, Storage & Peripherals—2.8% | |
| |
Apple, Inc. | | | 1,615 | | | | 169,995 | |
| |
EMC Corp. | | | 1,305 | | | | 33,512 | |
| |
Hewlett Packard Enterprise Co. | | | 775 | | | | 11,780 | |
| |
HP, Inc. | | | 750 | | | | 8,880 | |
| |
Seagate Technology plc | | | 450 | | | | 16,497 | |
| | | | | | | | |
| | | | | | | 240,664 | |
|
| |
Materials—1.8% | | | | | | | | |
| |
Chemicals—0.4% | | | | | | | | |
| |
LyondellBasell Industries NV, Cl. A | | | 450 | | | | 39,105 | |
|
| |
Metals & Mining—0.1% | | | | | | | | |
| |
Allegheny Technologies, Inc. | | | 500 | | | | 5,625 | |
|
| |
Paper & Forest Products—1.3% | | | | | | | | |
| |
Domtar Corp. | | | 1,490 | | | | 55,055 | |
| |
International Paper Co. | | | 1,415 | | | | 53,346 | |
| | | | | | | | |
| | | | | | | 108,401 | |
|
| |
Telecommunication Services—3.9% | |
| |
Diversified Telecommunication Services—3.9% | |
| |
AT&T, Inc. | | | 4,670 | | | | 160,695 | |
| |
CenturyLink, Inc. | | | 3,425 | | | | 86,173 | |
| |
Frontier Communications Corp. | | | 15,500 | | | | 72,385 | |
| |
Windstream Holdings, Inc. | | | 2,500 | | | | 16,100 | |
| | | | | | | | |
| | | | | | | 335,353 | |
|
| |
Utilities—2.9% | | | | | | | | |
| |
Electric Utilities—2.6% | | | | | | | | |
| |
American Electric Power Co., Inc. | | | 1,176 | | | | 68,526 | |
| |
Edison International | | | 1,088 | | | | 64,420 | |
| |
PPL Corp. | | | 2,558 | | | | 87,305 | |
| | | | | | | | |
| | | | | | | 220,251 | |
|
| |
Independent Power and Renewable Electricity Producers—0.3% | |
| |
| NRG Energy, Inc. | | | 2,325 | | | | 27,364 | |
| | | | | | | | |
Total Common Stocks (Cost $6,708,632) | | | | | | | 7,132,985 | |
|
| |
| Preferred Stocks—7.0% | | | | | | | | |
| |
| Allergan plc, 5.50% Cv., Series A | | | 65 | | | | 66,962 | |
| |
| American Homes 4 Rent, 5% Cum., Series A, Non-Vtg. | | | 1,000 | | | | 25,700 | |
| |
| American Homes 4 Rent, 5% Cum., Series B, Non-Vtg. | | | 1,300 | | | | 33,943 | |
| |
Dominion Resources, Inc., 6.375% Cv. | | | 435 | | | | 20,915 | |
| |
| Exelon Corp., 6.50% Cv. | | | 950 | | | | 38,446 | |
| |
| Frontier Communications Corp., 11.125% Cv., Series A, Non-Vtg. | | | 1,065 | | | | 97,533 | |
| |
| iStar, Inc., 4.50% Cv., Non-Vtg. | | | 1,965 | | | | 98,152 | |
| |
| Kinder Morgan, Inc., 9.75% Cv., Series A, Non-Vtg.2 | | | 805 | | | | 32,441 | |
| |
| Post Holdings, Inc., 5.25% Cv. | | | 1,080 | | | | 126,635 | |
| |
| Teva Pharmaceutical Industries Ltd., 7% Cv., Non- Vtg.2 | | | 55 | | | | 55,955 | |
| | | | | | | | |
| Total Preferred Stocks (Cost $603,891) | | | | | | | 596,682 | |
|
| |
| Rights, Warrants and Certificates—0.0% | |
| |
| Kinder Morgan, Inc. Wts., Strike Price $40, Exp. | | | | | | | | |
| 5/25/17, 0%2 (Cost $14,648) | | | 4,065 | | | | 244 | |
| | | | | | | | |
| | | Principal
Amount | | | Value | |
| |
Non-Convertible Corporate Bonds and Notes—0.4% | |
| |
J.C. Penney Corp., Inc.: | | | | | | | | |
5.65% Sr. Unsec. Nts., 6/1/20 | | $ | 39,000 | | | $ | 31,395 | |
5.75% Sr. Unsec. Nts., 2/15/18 | | | 4,000 | | | | 3,690 | |
| | | | | | | | |
| Total Non-Convertible Corporate Bonds and Notes (Cost $35,408) | | | | | | | 35,085 | |
|
| |
Convertible Corporate Bonds and Notes—7.7% | |
| |
| General Cable Corp., 4.50% Cv. Unsec. Sub. Nts., 11/15/294 | | | 122,000 | | | | 75,259 | |
| |
| iStar, Inc., 3% Cv. Sr. Unsec. Nts., 11/15/16 | | | 14,000 | | | | 15,094 | |
| |
| MGIC Investment Corp.: | | | | | | | | |
| 2.00% Cv. Sr. Unsec. Nts., 4/1/20 | | | 34,000 | | | | 47,430 | |
| 9.00% Cv. Jr. Sub. Nts., 4/1/635 | | | 185,000 | | | | 217,375 | |
| |
| Micron Technology, Inc., 3% Cv. Sr. Unsec. Nts., 11/15/43 | | | 132,000 | | | | 110,385 | |
| |
| Navistar International Corp.: | | | | | | | | |
| 4.50% Cv. Sr. Sub. Nts., 10/15/18 | | | 77,000 | | | | 38,356 | |
| 4.75% Cv. Sr. Sub. Nts., 4/15/19 | | | 133,000 | | | | 64,172 | |
| |
| Radian Group, Inc., 2.25% Cv. Sr. Unsec. Nts., 3/1/191 | | | 65,000 | | | | 84,053 | |
| | | | | | | | |
| Total Convertible Corporate Bonds and Notes (Cost $799,579) | | | | | | | 652,124 | |
| | |
| | | Shares | | | | |
| |
Structured Securities—0.8% | | | | | | | | |
| |
| Barclays Bank plc, Alcoa, Inc. Equity Linked Nts., 10/4/17 | | | 450 | | | | 15,478 | |
| |
| Credit Suisse AG (New York Branch), Standard Pacific Corp. Equity Linked Nts., 1/15/16 | | | 2,732 | | | | 21,017 | |
| |
| UBS AG (London Branch), Standard Pacific Corp. Equity Linked Nts., 3/31/165 | | | 1,913 | | | | 15,006 | |
| |
| UBS AG (London Branch), Standard Pacific Corp. Equity Linked Nts., 3/8/165 | | | 2,217 | | | | 16,944 | |
| | | | | | | | |
Total Structured Securities
(Cost $77,451) | | | | | | | 68,445 | |
|
| |
Investment Company—0.7% | | | | | | | | |
| |
Oppenheimer Institutional Money Market Fund, Cl. E, 0.30%6,7
(Cost $60,375) | | | 60,375 | | | | 60,375 | |
| | | | | | | | | | | | | | | | |
| | | | |
| | | Exercise Price | | | Expiration Date | | | Contracts | | | | |
| |
Exchange-Traded Options Purchased—0.0% | |
| |
| Abbvie, Inc. Put2 | | | USD 55.000 | | | | 1/15/16 USD | | | | 5 | | | | 130 | |
| |
| Edison International Put2 | | | USD 52.500 | | | | 1/15/16 USD | | | | 7 | | | | 35 | |
| |
| Kraft Heinz Co. (The) Put2 | | | USD 65.000 | | | | 1/15/16 USD | | | | 6 | | | | 30 | |
| |
| Oracle Corp. Put2 | | | USD 34.000 | | | | 1/15/16 USD | | | | 11 | | | | 99 | |
| |
| Wal-Mart Stores, Inc. Put2 | | | USD 55.000 | | | | 1/15/16 USD | | | | 6 | | | | 36 | |
| | | | | | | | | | | | | | | | |
Total Exchange-Traded Options Purchased (Cost $1,583) | | | | | | | | 330 | |
| |
| Total Investments, at Value (Cost $8,301,567) | | | | | | | | 100.3 | % | | | 8,546,270 | |
| |
| Net Other Assets (Liabilities) | | | | | | | | (0 .3 | ) | | | (26,415) | |
| | | | | | | | | | | | |
| Net Assets | | | | | | | | | | | 100.0 | % | | $ | 8,519,855 | |
| | | | | | | | | | | | |
8 OPPENHEIMER EQUITY INCOME FUND/VA
Footnotes to Statement of Investments
1. All or a portion of the security position is held in segregated accounts and pledged to cover margin requirements with respect to outstanding written options. The aggregate market value of such securities is $234,502. See Note 6 of the accompanying Notes.
2. Non-income producing security.
3. Security is a Master Limited Partnership.
4. Represents the current interest rate for a variable or increasing rate security.
5. Represents securities sold under Rule 144A, which are exempt from registration under the Securities Act of 1933, as amended. These securities have been determined to be liquid under guidelines established by the Board of Trustees. These securities amount to $249,325 or 2.93% of the Fund’s net assets at period end.
6. Rate shown is the 7-day yield at period end.
7. Is or was an affiliate, as defined in the Investment Company Act of 1940, as amended, at or during the reporting period, by virtue of the Fund owning at least 5% of the voting securities of the issuer or as a result of the Fund and the issuer having the same investment adviser. Transactions during the reporting period in which the issuer was an affiliate are as follows:
| | | | | | | | | | | | | | | | |
| | | Shares
December 31, 2014 | | | Gross
Additions | | | Gross Reductions | | | Shares
December 31, 2015 | |
| |
Oppenheimer Institutional Money Market Fund, Cl. E | | | 96,193 | | | | 1,917,888 | | | | 1,953,706 | | | | 60,375 | |
| | | | |
| | | | | | | | | Value | | | Income | |
| |
Oppenheimer Institutional Money Market Fund, Cl. E | | | | | | | | | | $ | 60,375 | | | $ | 59 | |
| | | | | | | | | | | | | | | | | | | | | | | | | | | | |
Exchange-Traded Options Written at December 31, 2015 | | | | | | | | | | | | | |
| Description | | | | | Exercise Price | | | Expiration Date | | | | | | Number of Contracts | | | Premiums Received | | | Value | |
| |
Abbvie, Inc. Put | | | USD | | | | 60.000 | | | | 1/15/16 | | | | USD | | | | (5 | ) | | $ | 1,695 | | | $ | (895) | |
| |
Allstate Corp. Put | | | USD | | | | 65.000 | | | | 1/15/16 | | | | USD | | | | (4 | ) | | | 2,918 | | | | (1,112) | |
| |
Edison International Put | | | USD | | | | 60.000 | | | | 1/15/16 | | | | USD | | | | (5 | ) | | | 720 | | | | (663) | |
| |
Edison International Put | | | USD | | | | 57.500 | | | | 1/15/16 | | | | USD | | | | (5 | ) | | | 685 | | | | (250) | |
| |
General Electric Co. Call | | | USD | | | | 32.000 | | | | 1/15/16 | | | | USD | | | | (5 | ) | | | 77 | | | | (55) | |
| |
Kraft Heinz Co. (The) Put | | | USD | | | | 70.000 | | | | 1/15/16 | | | | USD | | | | (5 | ) | | | 1,072 | | | | (150) | |
| |
Molson Coors Brewing Co. Call | | | USD | | | | 95.000 | | | | 1/15/16 | | | | USD | | | | (5 | ) | | | 502 | | | | (500) | |
| |
Oracle Corp. Put | | | USD | | | | 37.000 | | | | 1/15/16 | | | | USD | | | | (10 | ) | | | 883 | | | | (840) | |
| |
Wal-Mart Stores, Inc. Put | | | USD | | | | 60.000 | | | | 1/15/16 | | | | USD | | | | (5 | ) | | | 935 | | | | (160) | |
| | | | | | | | | | | | | | | | | | | | | | | | |
Total of Exchange-Traded Options Written | | | | | | | $ | 9,487 | | | $ | (4,625) | |
| | | | | | | | | | | | | | | | | | | | | | | | |
See accompanying Notes to Financial Statements.
9 OPPENHEIMER EQUITY INCOME FUND/VA
STATEMENT OF ASSETS AND LIABILITIES December 31, 2015
| | | | |
Assets | | | | |
Investments, at value—see accompanying statement of investments: | | | | |
Unaffiliated companies (cost $8,241,192) | | $ | 8,485,895 | |
Affiliated companies (cost $60,375) | | | 60,375 | |
| | | 8,546,270 | |
Cash | | | 6,608 | |
Receivables and other assets: | | | | |
Interest and dividends | | | 27,822 | |
Investments sold | | | 2,605 | |
Shares of beneficial interest sold | | | 654 | |
Other | | | 9,792 | |
Total assets | | | 8,593,751 | |
Liabilities | | | | |
Options written, at value (premiums received $9,487) | | | 4,625 | |
Payables and other liabilities: | | | | |
Legal, auditing and other professional fees | | | 28,204 | |
Investments purchased | | | 18,675 | |
Trustees’ compensation | | | 9,465 | |
Shareholder communications | | | 6,557 | |
Shares of beneficial interest redeemed | | | 4,001 | |
Distribution and service plan fees | | | 1,772 | |
Other | | | 597 | |
Total liabilities | | | 73,896 | |
Net Assets | | $ | 8,519,855 | |
| |
| | | | |
Composition of Net Assets | | | | |
Par value of shares of beneficial interest | | $ | 727 | |
Additional paid-in capital | | | 8,334,228 | |
Accumulated net investment income | | | 226,680 | |
Accumulated net realized loss on investments | | | (291,345) | |
Net unrealized appreciation on investments | | | 249,565 | |
Net Assets | | $ | 8,519,855 | |
| | | | |
Net Asset Value Per Share | | | | |
| |
Non-Service Shares: | | | | |
| Net asset value, redemption price per share and offering price per share (based on net assets of $324,690 and 33,420 shares of beneficial interest outstanding) | | | $9.72 | |
Service Shares: | | | | |
| Net asset value, redemption price per share and offering price per share (based on net assets of $8,195,165 and 693,936 shares of beneficial interest outstanding) | | | $11.81 | |
See accompanying Notes to Financial Statements.
10 OPPENHEIMER EQUITY INCOME FUND/VA
STATEMENT OF OPERATIONS For the Year Ended December 31, 2015
| | | | |
Investment Income | | | | |
Dividends: | | | | |
Unaffiliated companies (net of foreign withholding taxes of $ 1,434) | | $ | 337,475 | |
Affiliated companies | | | 59 | |
Interest | | | 30,520 | |
Total investment income | | | 368,054 | |
Expenses | | | | |
Management fees | | | 79,485 | |
Distribution and service plan fees - Service shares | | | 25,698 | |
Transfer and shareholder servicing agent fees: | | | | |
Non-Service shares | | | 318 | |
Service shares | | | 10,280 | |
Shareholder communications: | | | | |
Non-Service shares | | | 311 | |
Service shares | | | 9,898 | |
Borrowing fees | | | 75 | |
Custodian fees and expenses | | | 1,486 | |
Trustees’ compensation | | | 9,531 | |
Legal, auditing and other professional fees | | | 44,014 | |
Other | | | 4,461 | |
Total expenses | | | 185,557 | |
Less reduction to custodian expenses | | | (2) | |
Less waivers and reimbursements of expenses | | | (74,854) | |
Net expenses | | | 110,701 | |
Net Investment Income | | | 257,353 | |
Realized and Unrealized Gain (Loss) | | | | |
Net realized gain (loss) on: | | | | |
Investments from unaffiliated companies (including premiums on options exercised) | | | (210,527) | |
Closing and expiration of option contracts written | | | 58,817 | |
Net realized loss | | | (151,710) | |
Net change in unrealized appreciation/depreciation on: | | | | |
Investments | | | (1,097,642) | |
Option contracts written | | | 2,990 | |
Net change in unrealized appreciation/depreciation | | | (1,094,652) | |
Net Decrease in Net Assets Resulting from Operations | | $ | (989,009) | |
See accompanying Notes to Financial Statements.
11 OPPENHEIMER EQUITY INCOME FUND/VA
STATEMENTS OF CHANGES IN NET ASSETS
| | | | | | | | |
| | | Year Ended
December 31, 2015 | | | Year Ended
December 31, 2014 | |
Operations | | | | | | | | |
Net investment income | | $ | 257,353 | | | $ | 206,461 | |
Net realized gain (loss) | | | (151,710) | | | | 877,321 | |
Net change in unrealized appreciation/depreciation | | | (1,094,652) | | | | 78,166 | |
Net increase (decrease) in net assets resulting from operations | | | (989,009) | | | | 1,161,948 | |
Dividends and/or Distributions to Shareholders | | | | | | | | |
Dividends from net investment income: | | | | | | | | |
Non-Service shares | | | (10,233) | | | | (4,861) | |
Service shares | | | (287,911) | | | | (162,231) | |
| | | | (298,144) | | | | (167,092) | |
Distributions from net realized gain: | | | | | | | | |
Non-Service shares | | | (25,987) | | | | (12,986) | |
Service shares | | | (746,892) | | | | (451,817) | |
| | | (772,879) | | | | (464,803) | |
Beneficial Interest Transactions | | | | | | | | |
Net increase (decrease) in net assets resulting from beneficial interest transactions: | | | | | | | | |
Non-Service shares | | | 91,789 | | | | 64,450 | |
Service shares | | | (1,019,497) | | | | (175,637) | |
| | | (927,708) | | | | (111,187) | |
Net Assets | | | | | | | | |
Total increase (decrease) | | | (2,987,740) | | | | 418,866 | |
Beginning of period | | | 11,507,595 | | | | 11,088,729 | |
| End of period (including accumulated net investment income of $226,680 and $217,214, respectively) | | $ | 8,519,855 | | | $ | 11,507,595 | |
See accompanying Notes to Financial Statements.
12 OPPENHEIMER EQUITY INCOME FUND/VA
FINANCIAL HIGHLIGHTS
| | | | | | | | | | | | | | | | | | | | |
| Non-Service Shares | | Year Ended
December 31, 2015 | | | Year Ended
December
31, 2014 | | | Year Ended
December 31, 2013 | | | Year Ended
December
31, 2012 | | | Year Ended
December
30, 20111 | |
Per Share Operating Data | | | | | | | | | | | | | | | | | | | | |
Net asset value, beginning of period | | $ | 12.09 | | | $ | 11.64 | | | $ | 9.15 | | | $ | 8.00 | | | $ | 8.49 | |
Income (loss) from investment operations: | | | | | | | | | | | | | | | | | | | | |
Net investment income2 | | | 0.29 | | | | 0.25 | | | | 0.21 | | | | 0.16 | | | | 0.15 | |
Net realized and unrealized gain (loss) | | | (1.28) | | | | 1.01 | | | | 2.42 | | | | 1.11 | | | | (0.56) | |
Total from investment operations | | | (0.99) | | | | 1.26 | | | | 2.63 | | | | 1.27 | | | | (0.41) | |
Dividends and/or distributions to shareholders: | | | | | | | | | | | | | | | | | | | | |
Dividends from net investment income | | | (0.39) | | | | (0.22) | | | | (0.14) | | | | (0.12) | | | | (0.08) | |
Distributions from net realized gain | | | (0.99) | | | | (0.59) | | | | 0.00 | | | | 0.00 | | | | 0.00 | |
Total dividends and/or distributions to shareholders | | | (1.38) | | | | (0 .81) | | | | (0.14) | | | | (0.12) | | | | (0.08) | |
Net asset value, end of period | | $ | 9.72 | | | $ | 12.09 | | | $ | 11.64 | | | $ | 9.15 | | | $ | 8.00 | |
| | | | | | | | | | | | | | | | | | | | |
Total Return, at Net Asset Value3 | | | (9.58)% | | | | 11.08% | | | | 28.93% | | | | 16.08% | | | | (4.93)% | |
| | | | | | | | | | | | | | | | | | | | |
Ratios/Supplemental Data | | | | | | | | | | | | | | | | | | | | |
Net assets, end of period (in thousands) | | $ | 325 | | | $ | 302 | | | $ | 227 | | | $ | 154 | | | $ | 104 | |
Average net assets (in thousands) | | $ | 318 | | | $ | 266 | | | $ | 195 | | | $ | 132 | | | $ | 101 | |
Ratios to average net assets:4 | | | | | | | | | | | | | | | | | | | | |
Net investment income | | | 2.64% | | | | 2.08% | | | | 2.00% | | | | 1.82% | | | | 1.78% | |
Expenses excluding interest and fees from borrowings | | | 1.52% | | | | 1.42% | | | | 1.64% | | | | 1.75% | | | | 1.83% | |
| Interest and fees from borrowings | | | 0.00%5 | | | | 0.00% | | | | 0.00% | | | | 0.00% | | | | 0.00% | |
Total expenses6 | | | 1.52% | | | | 1.42% | | | | 1.64% | | | | 1.75% | | | | 1.83% | |
| Expenses after payments, waivers and/or reimbursements and reduction to custodian expenses | | | 0.80% | | | | 0.80% | | | | 0.80% | | | | 0.80% | | | | 0.80% | |
| |
Portfolio turnover rate | | | 44% | | | | 40% | | | | 159% | | | | 87% | | | | 86% | |
1. December 30, 2011 represents the last business day of the Fund’s reporting period. See Note 2 of the accompanying Notes.
2. Per share amounts calculated based on the average shares outstanding during the period.
3. Assumes an initial investment on the business day before the first day of the fiscal period, with all dividends and distributions reinvested in additional shares on the reinvestment date, and redemption at the net asset value calculated on the last business day of the fiscal period. Total returns are not annualized for periods less than one full year. Total return information does not reflect expenses that apply at the separate account level or to related insurance products. Inclusion of these charges would reduce the total return figures for all periods shown. Returns do not reflect the deduction of taxes that a shareholder would pay on fund distributions or the redemption of fund shares.
4. Annualized for periods less than one full year.
5. Less than 0.005%.
6. Total expenses including indirect expenses from affiliated fund fees and expenses were as follows:
| | | | |
Year Ended December 31, 2015 | | | 1.52 | % |
Year Ended December 31, 2014 | | | 1.42 | % |
Year Ended December 31, 2013 | | | 1.64 | % |
Year Ended December 31, 2012 | | | 1.75 | % |
Year Ended December 30, 2011 | | | 1.83 | % |
See accompanying Notes to Financial Statements.
13 OPPENHEIMER EQUITY INCOME FUND/VA
FINANCIAL HIGHLIGHTS Continued
| | | | | | | | | | | | | | | | | | | | |
| Service Shares | | Year Ended
December
31, 2015 | | | Year Ended
December
31, 2014 | | | Year Ended
December
31, 2013 | | | Year Ended
December
31, 2012 | | | Year Ended
December
30, 20111 | |
Per Share Operating Data | | | | | | | | | | | | | | | | | | | | |
Net asset value, beginning of period | | $ | 14.43 | | | $ | 13.78 | | | $ | 10.83 | | | $ | 9.69 | | | $ | 10.23 | |
Income (loss) from investment operations: | | | | | | | | | | | | | | | | | | | | |
Net investment income2 | | | 0.33 | | | | 0.26 | | | | 0.22 | | | | 0.13 | | | | 0.11 | |
Net realized and unrealized gain (loss) | | | (1.58) | | | | 1.19 | | | | 2.87 | | | | 1.13 | | | | (0.56) | |
Total from investment operations | | | (1.25) | | | | 1.45 | | | | 3.09 | | | | 1.26 | | | | (0.45) | |
Dividends and/or distributions to shareholders: | | | | | | | | | | | | | | | | | | | | |
Dividends from net investment income | | | (0.38) | | | | (0.21) | | | | (0.14) | | | | (0.12) | | | | (0.09) | |
Distributions from net realized gain | | | (0.99) | | | | (0.59) | | | | 0.00 | | | | 0.00 | | | | 0.00 | |
Total dividends and/or distributions to shareholders | | | (1.37) | | | | (0.80) | | | | (0.14) | | | | (0.12) | | | | (0.09) | |
Net asset value, end of period | | $ | 11.81 | | | $ | 14.43 | | | $ | 13.78 | | | $ | 10.83 | | | $ | 9 .69 | |
| | | | | | | | | | | | | | | | | | | | |
Total Return, at Net Asset Value3 | | | (9.82)% | | | | 10.73% | | | | 28.70% | | | | 13.09% | | | | (4.48)% | |
| | | | | | | | | | | | | | | | | | | | |
Ratios/Supplemental Data | | | | | | | | | | | | | | | | | | | | |
Net assets, end of period (in thousands) | | $ | 8,195 | | | $ | 11,206 | | | $ | 10,862 | | | $ | 6,897 | | | $ | 6,885 | |
Average net assets (in thousands) | | $ | 10,265 | | | $ | 11,020 | | | $ | 8,549 | | | $ | 7,095 | | | $ | 7,449 | |
Ratios to average net assets:4 | | | | | | | | | | | | | | | | | | | | |
Net investment income | | | 2.43% | | | | 1.82% | | | | 1.78% | | | | 1.26% | | | | 1.08% | |
Expenses excluding interest and fees from borrowings | | | 1.76% | | | | 1.67% | | | | 1.89% | | | | 1.93% | | | | 1.90% | |
Interest and fees from borrowings | | | 0.00%5 | | | | 0.00% | | | | 0.00% | | | | 0.00% | | | | 0.00% | |
Total expenses6 | | | 1.76% | | | | 1.67% | | | | 1.89% | | | | 1.93% | | | | 1.90% | |
| Expenses after payments, waivers and/or reimbursements and reduction to custodian expenses | | | 1.05% | | | | 1.05% | | | | 1.05% | | | | 1.04% | | | | 1.05% | |
Portfolio turnover rate | | | 44% | | | | 40% | | | | 159% | | | | 87% | | | | 86% | |
1. December 30, 2011 represents the last business day of the Fund’s reporting period. See Note 2 of the accompanying Notes.
2. Per share amounts calculated based on the average shares outstanding during the period.
3. Assumes an initial investment on the business day before the first day of the fiscal period, with all dividends and distributions reinvested in additional shares on the reinvestment date, and redemption at the net asset value calculated on the last business day of the fiscal period. Total returns are not annualized for periods less than one full year. Total return information does not reflect expenses that apply at the separate account level or to related insurance products. Inclusion of these charges would reduce the total return figures for all periods shown. Returns do not reflect the deduction of taxes that a shareholder would pay on fund distributions or the redemption of fund shares.
4. Annualized for periods less than one full year.
5. Less than 0.005%.
6. Total expenses including indirect expenses from affiliated fund fees and expenses were as follows:
| | | | |
Year Ended December 31, 2015 | | | 1.76 | % |
Year Ended December 31, 2014 | | | 1.67 | % |
Year Ended December 31, 2013 | | | 1.89 | % |
Year Ended December 31, 2012 | | | 1.93 | % |
Year Ended December 30, 2011 | | | 1.90 | % |
See accompanying Notes to Financial Statements.
14 OPPENHEIMER EQUITY INCOME FUND/VA
NOTES TO FINANCIAL STATEMENTS December 31, 2015
1. Organization
Oppenheimer Equity Income Fund/VA (the “Fund”), is a separate series of Oppenheimer Variable Account Funds, a diversified open-end management investment company registered under the Investment Company Act of 1940 (“1940 Act”), as amended. The Fund’s investment objective is to seek total return. The Fund’s investment adviser is OFI Global Asset Management, Inc. (“OFI Global” or the “Manager”), a wholly-owned subsidiary of OppenheimerFunds, Inc. (“OFI” or the “Sub-Adviser”). The Manager has entered into a sub-advisory agreement with OFI. Shares of the Fund are sold only to separate accounts of life insurance companies.
The Fund offers two classes of shares. Both classes are sold at their offering price, which is the net asset value per share, to separate investment accounts of participating insurance companies as an underlying investment for variable life insurance policies, variable annuity contracts or other investment products. The class of shares designated as Service shares is subject to a distribution and service plan. Both classes of shares have identical rights and voting privileges with respect to the Fund in general and exclusive voting rights on matters that affect that class alone. Earnings, net assets and net asset value per share may differ due to each class having its own expenses, such as transfer and shareholder servicing agent fees and shareholder communications, directly attributable to that class.
The following is a summary of significant accounting policies followed in the Fund’s preparation of financial statements in accordance with accounting principles generally accepted in the United States (“U.S. GAAP”).
2. Significant Accounting Policies
Security Valuation. All investments in securities are recorded at their estimated fair value, as described in Note 3.
Reporting Period End Date. The last day of the Fund’s reporting period is the last day the New York Stock Exchange was open for trading during the period. The Fund’s financial statements have been presented through that date to maintain consistency with the Fund’s net asset value calculations used for shareholder transactions.
Allocation of Income, Expenses, Gains and Losses. Income, expenses (other than those attributable to a specific class), gains and losses are allocated on a daily basis to each class of shares based upon the relative proportion of net assets represented by such class. Operating expenses directly attributable to a specific class are charged against the operations of that class.
Dividends and Distributions to Shareholders. Dividends and distributions to shareholders, which are determined in accordance with income tax regulations and may differ from U.S. GAAP, are recorded on the ex-dividend date. Income and capital gain distributions, if any, are declared and paid annually or at other times as deemed necessary by the Manager.
Investment Income. Dividend income is recorded on the ex-dividend date or upon ex-dividend notification in the case of certain foreign dividends where the ex-dividend date may have passed. Non-cash dividends included in dividend income, if any, are recorded at the fair market value of the securities received. Interest income is recognized on an accrual basis. Discount and premium, which are included in interest income on the Statement of Operations, are amortized or accreted daily.
Return of Capital Estimates. Distributions received from the Fund’s investments in Master Limited Partnerships (MLPs) and Real Estate Investments Trusts (REITs), generally are comprised of income and return of capital. The Fund records investment income and return of capital based on estimates. Such estimates are based on historical information available from each MLP, REIT and other industry sources. These estimates may subsequently be revised based on information received from MLPs and REITs after their tax reporting periods are concluded.
Custodian Fees. “Custodian fees and expenses” in the Statement of Operations may include interest expense incurred by the Fund on any cash overdrafts of its custodian account during the period. Such cash overdrafts may result from the effects of failed trades in portfolio securities and from cash outflows resulting from unanticipated shareholder redemption activity. The Fund pays interest to its custodian on such cash overdrafts, to the extent they are not offset by positive cash balances maintained by the Fund, at a rate equal to the Federal Funds Rate plus 0.50%. The “Reduction to custodian expenses” line item, if applicable, represents earnings on cash balances maintained by the Fund during the period. Such interest expense and other custodian fees may be paid with these earnings.
Security Transactions. Security transactions are recorded on the trade date. Realized gains and losses on securities sold are determined on the basis of identified cost.
Indemnifications. The Fund’s organizational documents provide current and former Trustees and officers with a limited indemnification against liabilities arising in connection with the performance of their duties to the Fund. In the normal course of business, the Fund may also enter into contracts that provide general indemnifications. The Fund’s maximum exposure under these arrangements is unknown as this would be dependent on future claims that may be made against the Fund. The risk of material loss from such claims is considered remote.
Federal Taxes. The Fund intends to comply with provisions of the Internal Revenue Code applicable to regulated investment companies and to distribute substantially all of its investment company taxable income, including any net realized gain on investments not offset by capital loss carryforwards, if any, to shareholders. Therefore, no federal income or excise tax provision is required. The Fund files income tax returns in U.S. federal
15 OPPENHEIMER EQUITY INCOME FUND/VA
|
NOTES TO FINANCIAL STATEMENTS Continued |
| 2. Significant Accounting Policies (Continued) |
and applicable state jurisdictions. The statute of limitations on the Fund’s tax return filings generally remains open for the three preceding fiscal reporting period ends.
The tax components of capital shown in the following table represent distribution requirements the Fund must satisfy under the income tax regulations, losses the Fund may be able to offset against income and gains realized in future years and unrealized appreciation or depreciation of securities and other investments for federal income tax purposes.
| | | | | | | | | | | | |
Undistributed Net Investment Income | | Undistributed Long-Term Gain | | | Accumulated Loss Carryforward1,2,3 | | | Net Unrealized Depreciation Based on cost of Securities and Other Investments for Federal Income Tax Purposes | |
$412,247 | | | $— | | | | $204,205 | | | | $13,679 | |
1. At period end, the Fund had $204,205 of net capital loss carryforward available to offset future realized capital gains, if any, and thereby reduce future taxable gain distributions. Details of the capital loss carryforwards are included in the table below. Capital loss carryovers with no expiration, if any, must be utilized prior to those with expiration dates.
| | | | |
| Expiring | | | |
No expiration | | $ | 204,205 | |
2. During the reporting period, the Fund did not utilize any capital loss carryforward.
3. During the previous reporting period, the Fund did not utilize any capital loss carryforward.
Net investment income (loss) and net realized gain (loss) may differ for financial statement and tax purposes. The character of dividends and distributions made during the fiscal year from net investment income or net realized gains are determined in accordance with federal income tax requirements, which may differ from the character of net investment income or net realized gains presented in those financial statements in accordance with U.S. GAAP. Also, due to timing of dividends and distributions, the fiscal year in which amounts are distributed may differ from the fiscal year in which the income or net realized gain was recorded by the Fund.
Accordingly, the following amounts have been reclassified for the reporting period. Net assets of the Fund were unaffected by the reclassifications.
| | | | | | | | |
Increase to Paid-in Capital | | Increase
to Accumulated
Net Investment
Income | | | Increase
to Accumulated Net
Realized Loss on
Investments | |
$95 | | | $50,257 | | | | $50,352 | |
The tax character of distributions paid during the reporting periods:
| | | | | | | | |
| | | Year Ended
December 31, 2015 | | | Year Ended
December 31, 2014 | |
Distributions paid from: | | | | | | | | |
Ordinary income | | $ | 636,899 | | | $ | 167,092 | |
Long-term capital gain | | | 434,124 | | | | 464,803 | |
| | | | |
Total | | $ | 1,071,023 | | | $ | 631,895 | |
| | | | |
The aggregate cost of securities and other investments and the composition of unrealized appreciation and depreciation of securities and other investments for federal income tax purposes at period end are noted in the following table. The primary difference between book and tax appreciation or depreciation of securities and other investments, if applicable, is attributable to the tax deferral of losses or tax realization of financial statement unrealized gain or loss.
| | | | |
Federal tax cost of securities | | $ | 8,559,565 | |
Federal tax cost of other investments | | | (4,241) | |
| | | | |
Total federal tax cost | | $ | 8,555,324 | |
| | | | |
Gross unrealized appreciation | | $ | 723,714 | |
Gross unrealized depreciation | | | (737,393) | |
| | | | |
Net unrealized depreciation | | $ | (13,679) | |
| | | | |
Use of Estimates. The preparation of financial statements in conformity with U.S. GAAP requires management to make estimates and assumptions that affect the reported amounts of assets and liabilities and disclosure of contingent assets and liabilities at the date of the financial statements and the reported amounts of increases and decreases in net assets from operations during the reporting period. Actual results could differ from those estimates.
3. Securities Valuation
The Fund calculates the net asset value of its shares as of the close of the New York Stock Exchange (the “Exchange”), normally 4:00 P.M. Eastern time, on each day the Exchange is open for trading, except in the case of a scheduled early closing of the Exchange, in which case the Fund will calculate net asset value of the shares as of the scheduled early closing time of the Exchange.
16 OPPENHEIMER EQUITY INCOME FUND/VA
|
|
| 3. Securities Valuation (Continued) |
The Fund’s Board has adopted procedures for the valuation of the Fund’s securities and has delegated the day-to-day responsibility for valuation determinations under those procedures to the Manager. The Manager has established a Valuation Committee which is responsible for determining a “fair valuation” for any security for which market quotations are not “readily available.” The Valuation Committee’s fair valuation determinations are subject to review, approval and ratification by the Fund’s Board at its next regularly scheduled meeting covering the calendar quarter in which the fair valuation was determined.
Valuation Methods and Inputs
Securities are valued using unadjusted quoted market prices, when available, as supplied primarily by third party pricing services or dealers.
The following methodologies are used to determine the market value or the fair value of the types of securities described below:
Securities traded on a registered U.S. securities exchange (including exchange-traded derivatives other than futures and futures options) are valued based on the last sale price of the security reported on the principal exchange on which it is traded, prior to the time when the Fund’s assets are valued. In the absence of a sale, the security is valued at the mean between the bid and asked price on the principal exchange or, if not available from the principal exchange, obtained from two dealers. If bid and asked prices are not available from either the exchange or two dealers, the security is valued by using one of the following methodologies (listed in order of priority): (1) a bid from the principal exchange, (2) the mean between the bid and asked price as provided by a single dealer, or (3) a bid from a single dealer. A security of a foreign issuer traded on a foreign exchange, but not listed on a registered U.S. securities exchange, is valued based on the last sale price on the principal exchange on which the security is traded, as identified by the third party pricing service used by the Manager, prior to the time when the Fund’s assets are valued. If the last sale price is unavailable, the security is valued at the most recent official closing price on the principal exchange on which it is traded. If the last sales price or official closing price for a foreign security is not available, the security is valued at the mean between the bid and asked price per the exchange or, if not available from the exchange, obtained from two dealers. If bid and asked prices are not available from either the exchange or two dealers, the security is valued by using one of the following methodologies (listed in order of priority): (1) a bid from the exchange, (2) the mean between the bid and asked price as provided by a single dealer, or (3) a bid from a single dealer.
Shares of a registered investment company that are not traded on an exchange are valued at that investment company’s net asset value per share.
Corporate and government debt securities (of U.S. or foreign issuers) and municipal debt securities, event-linked bonds, loans, mortgage-backed securities, collateralized mortgage obligations, and asset-backed securities are valued at the mean between the “bid” and “asked” prices utilizing evaluated prices obtained from third party pricing services or broker-dealers who may use matrix pricing methods to determine the evaluated prices.
Short-term money market type debt securities with a remaining maturity of sixty days or less are valued at cost adjusted by the amortization of discount or premium to maturity (amortized cost), which approximates market value. Short-term debt securities with a remaining maturity in excess of sixty days are valued at the mean between the “bid” and “asked” prices utilizing evaluated prices obtained from third party pricing services or broker-dealers.
Structured securities, swaps, swaptions, and other over-the-counter derivatives are valued utilizing evaluated prices obtained from third party pricing services or broker-dealers.
A description of the standard inputs that may generally be considered by the third party pricing vendors in determining their evaluated prices is provided below.
| | |
| Security Type | | Standard inputs generally considered by third-party pricing vendors |
| Corporate debt, government debt, municipal, mortgage-backed and asset-backed securities | | Reported trade data, broker-dealer price quotations, benchmark yields, issuer spreads on comparable securities, the credit quality, yield, maturity, and other appropriate factors. |
Loans | | Information obtained from market participants regarding reported trade data and broker-dealer price quotations. |
Event-linked bonds | | Information obtained from market participants regarding reported trade data and broker-dealer price quotations. |
Structured securities | | Relevant market information such as the price of underlying financial instruments, stock market indices, foreign currencies, interest rate spreads, commodities, or the occurrence of other specific events. |
Swaps | | Relevant market information, including underlying reference assets such as credit spreads, credit event probabilities, index values, individual security values, forward interest rates, variable interest rates, volatility measures, and forward currency rates. |
If a market value or price cannot be determined for a security using the methodologies described above, or if, in the “good faith” opinion of the Manager, the market value or price obtained does not constitute a “readily available market quotation,” or a significant event has occurred that would materially affect the value of the security, the security is fair valued either (i) by a standardized fair valuation methodology applicable to the security type or the significant event as previously approved by the Valuation Committee and the Fund’s Board or (ii) as determined in good faith by the Manager’s Valuation Committee. The Valuation Committee considers all relevant facts that are reasonably available, through either public information or information available to the Manager, when determining the fair value of a security. Fair value determinations by the Manager are subject to review, approval and ratification by the Fund’s Board at its next regularly scheduled meeting covering the calendar quarter in which the fair valuation was determined. Those fair valuation standardized methodologies include, but are not limited to, valuing securities at the last sale price or initially at cost and subsequently adjusting the value based on: changes in company specific fundamentals, changes in an appropriate securities index, or changes in the value of similar securities which may be further adjusted for any discounts related to security-specific resale restrictions. When possible, such methodologies use observable market inputs such as unadjusted quoted prices of similar securities, observable interest rates, currency rates and yield curves. The methodologies used for valuing securities are not necessarily an indication of the risks associated with investing in those securities nor can it be assured that the Fund can obtain the fair value assigned to a security if it were to sell the security.
17 OPPENHEIMER EQUITY INCOME FUND/VA
|
NOTES TO FINANCIAL STATEMENTS Continued |
3. Securities Valuation (Continued)
To assess the continuing appropriateness of security valuations, the Manager, or its third party service provider who is subject to oversight by the Manager, regularly compares prior day prices, prices on comparable securities, and sale prices to the current day prices and challenges those prices exceeding certain tolerance levels with the third party pricing service or broker source. For those securities valued by fair valuations, whether through a standardized fair valuation methodology or a fair valuation determination, the Valuation Committee reviews and affirms the reasonableness of the valuations based on such methodologies and fair valuation determinations on a regular basis after considering all relevant information that is reasonably available.
Classifications
Each investment asset or liability of the Fund is assigned a level at measurement date based on the significance and source of the inputs to its valuation. Various data inputs are used in determining the value of each of the Fund’s investments as of the reporting period end. These data inputs are categorized in the following hierarchy under applicable financial accounting standards:
1) Level 1-unadjusted quoted prices in active markets for identical assets or liabilities (including securities actively traded on a securities exchange)
2) Level 2-inputs other than unadjusted quoted prices that are observable for the asset or liability (such as unadjusted quoted prices for similar assets and market corroborated inputs such as interest rates, prepayment speeds, credit risks, etc.)
3) Level 3-significant unobservable inputs (including the Manager’s own judgments about assumptions that market participants would use in pricing the asset or liability).
The inputs used for valuing securities are not necessarily an indication of the risks associated with investing in those securities.
The table below categorizes amounts that are included in the Fund’s Statement of Assets and Liabilities at period end based on valuation input level:
| | | | | | | | | | | | | | | | |
| | | Level 1—
Unadjusted
Quoted Prices | | | Level 2—
Other Significant
Observable Inputs | | | Level 3—
Significant
Unobservable
Inputs | | | Value | |
Assets Table | | | | | | | | | | | | | | | | |
Investments, at Value: | | | | | | | | | | | | | | | | |
Common Stocks | | | | | | | | | | | | | | | | |
Consumer Discretionary | | $ | 992,146 | | | $ | — | | | $ | — | | | $ | 992,146 | |
Consumer Staples | | | 352,357 | | | | — | | | | — | | | | 352,357 | |
Energy | | | 512,226 | | | | — | | | | — | | | | 512,226 | |
Financials | | | 2,606,191 | | | | — | | | | — | | | | 2,606,191 | |
Health Care | | | 909,238 | | | | — | | | | — | | | | 909,238 | |
Industrials | | | 407,735 | | | | — | | | | — | | | | 407,735 | |
Information Technology | | | 616,993 | | | | — | | | | — | | | | 616,993 | |
Materials | | | 153,131 | | | | — | | | | — | | | | 153,131 | |
Telecommunication Services | | | 335,353 | | | | — | | | | — | | | | 335,353 | |
Utilities | | | 247,615 | | | | — | | | | — | | | | 247,615 | |
Preferred Stocks | | | 371,895 | | | | 224,787 | | | | — | | | | 596,682 | |
Rights, Warrants and Certificates | | | 244 | | | | — | | | | — | | | | 244 | |
Non-Convertible Corporate Bonds and Notes | | | — | | | | 35,085 | | | | — | | | | 35,085 | |
Convertible Corporate Bonds and Notes | | | — | | | | 652,124 | | | | — | | | | 652,124 | |
Structured Securities | | | — | | | | 68,445 | | | | — | | | | 68,445 | |
Investment Company | | | 60,375 | | | | — | | | | — | | | | 60,375 | |
Exchange-Traded Options Purchased | | | 330 | | | | — | | | | — | | | | 330 | |
Total Assets | | $ | 7,565,829 | | | $ | 980,441 | | | $ | — | | | $ | 8,546,270 | |
| | | | |
Liabilities Table | | | | | | | | | | | | | | | | |
Other Financial Instruments: | | | | | | | | | | | | | | | | |
Options written, at value | | $ | (4,625 | ) | | $ | — | | | $ | — | | | $ | (4,625 | ) |
Total Liabilities | | $ | (4,625 | ) | | $ | — | | | $ | — | | | $ | (4,625 | ) |
Forward currency exchange contracts and futures contracts, if any, are reported at their unrealized appreciation/depreciation at measurement date, which represents the change in the contract’s value from trade date. All additional assets and liabilities included in the above table are reported at their market value at measurement date.
4. Investments and Risks
Investments in Affiliated Funds. The Fund is permitted to invest in other mutual funds advised by the Manager (“Affiliated Funds”). Affiliated Funds are open-end management investment companies registered under the 1940 Act, as amended. The Manager is the investment adviser of, and the Sub-Adviser provides investment and related advisory services to, the Affiliated Funds. When applicable, the Fund’s investments in Affiliated Funds are included in the Statement of Investments. Shares of Affiliated Funds are valued at their net asset value per share. As a shareholder, the Fund is subject to its proportional share of the Affiliated Funds’ expenses, including their management fee. The Manager will waive fees and/or reimburse Fund expenses in an amount equal to the indirect management fees incurred through the Fund’s investment in the Affiliated Funds.
18 OPPENHEIMER EQUITY INCOME FUND/VA
4. Investments and Risks (Continued)
Each of the Affiliated Funds in which the Fund invests has its own investment risks, and those risks can affect the value of the Fund’s investments and therefore the value of the Fund’s shares. To the extent that the Fund invests more of its assets in one Affiliated Fund than in another, the Fund will have greater exposure to the risks of that Affiliated Fund.
Investment in Oppenheimer Institutional Money Market Fund. The Fund is permitted to invest daily available cash balances in a money market Affiliated Fund. The Fund may invest the available cash in Class E shares of Oppenheimer Institutional Money Market Fund (“IMMF”) to seek current income while preserving liquidity or for defensive purposes. IMMF is regulated as a money market fund under the Investment Company Act of 1940, as amended.
Master Limited Partnerships (“MLPs”). MLPs issue common units that represent an equity ownership interest in a partnership and provide limited voting rights. MLP common units are registered with the Securities and Exchange Commission (“SEC”), and are freely tradable on securities exchanges such as the NYSE and the NASDAQ Stock Market (“NASDAQ”), or in the over-the-counter (“OTC”) market. An MLP consists of one or more general partners, who conduct the business, and one or more limited partners, who contribute capital. MLP common unit holders have a limited role in the partnership’s operations and management. The Fund, as a limited partner, normally would not be liable for the debts of the MLP beyond the amounts the Fund has contributed, but would not be shielded to the same extent that a shareholder of a corporation would be. In certain circumstances creditors of an MLP would have the right to seek return of capital distributed to a limited partner. This right of an MLP’s creditors would continue after the Fund sold its investment in the MLP.
Structured Securities. The Fund invests in structured securities whose market values, interest rates and/or redemption prices are linked to the performance of underlying foreign currencies, interest rate spreads, stock market indices, prices of individual securities, commodities or other financial instruments or the occurrence of other specific events. The structured securities are often leveraged, increasing the volatility of each note’s market value relative to the change in the underlying linked financial element or event. Fluctuations in value of these securities are recorded as unrealized gains and losses in the accompanying Statement of Operations. The Fund records a realized gain or loss when a structured security is sold or matures.
Equity Security Risk. Stocks and other equity securities fluctuate in price. The value of the Fund’s portfolio may be affected by changes in the equity markets generally. Equity markets may experience significant short-term volatility and may fall sharply at times. Different markets may behave differently from each other and U.S. equity markets may move in the opposite direction from one or more foreign stock markets. Adverse events in any part of the equity or fixed-income markets may have unexpected negative effects on other market segments.
The prices of individual equity securities generally do not all move in the same direction at the same time and a variety of factors can affect the price of a particular company’s securities. These factors may include, but are not limited to, poor earnings reports, a loss of customers, litigation against the company, general unfavorable performance of the company’s sector or industry, or changes in government regulations affecting the company or its industry.
Shareholder Concentration. At period end, two shareholders each owned 20% or more of the Fund’s total outstanding shares comprising 91.34% of the Fund.
5. Market Risk Factors
The Fund’s investments in securities and/or financial derivatives may expose the fund to various market risk factors:
Commodity Risk. Commodity risk relates to the change in value of commodities or commodity indexes as they relate to increases or decreases in the commodities market. Commodities are physical assets that have tangible properties. Examples of these types of assets are crude oil, heating oil, metals, livestock, and agricultural products.
Credit Risk. Credit risk relates to the ability of the issuer of debt to meet interest and principal payments, or both, as they come due. In general, lower-grade, higher-yield debt securities are subject to credit risk to a greater extent than lower-yield, higher-quality securities.
Equity Risk. Equity risk relates to the change in value of equity securities as they relate to increases or decreases in the general market.
Foreign Exchange Rate Risk. Foreign exchange rate risk relates to the change in the U.S. dollar value of a security held that is denominated in a foreign currency. The U.S. dollar value of a foreign currency denominated security will decrease as the dollar appreciates against the currency, while the U.S. dollar value will increase as the dollar depreciates against the currency.
Interest Rate Risk. Interest rate risk refers to the fluctuations in value of fixed-income securities resulting from the inverse relationship between price and yield. For example, an increase in general interest rates will tend to reduce the market value of already issued fixed-income investments, and a decline in general interest rates will tend to increase their value. In addition, debt securities with longer maturities, which tend to have higher yields, are subject to potentially greater fluctuations in value from changes in interest rates than obligations with shorter maturities.
Volatility Risk. Volatility risk refers to the magnitude of the movement, but not the direction of the movement, in a financial instrument’s price over a defined time period. Large increases or decreases in a financial instrument’s price over a relative time period typically indicate greater volatility risk, while small increases or decreases in its price typically indicate lower volatility risk.
19 OPPENHEIMER EQUITY INCOME FUND/VA
NOTES TO FINANCIAL STATEMENTS Continued
6. Use of Derivatives
The Fund’s investment objective not only permits the Fund to purchase investment securities, it also allows the Fund to enter into various types of derivatives contracts, including, but not limited to, futures contracts, forward currency exchange contracts, credit default swaps, interest rate swaps, total return swaps, variance swaps and purchased and written options. In doing so, the Fund will employ strategies in differing combinations to permit it to increase, decrease, or change the level or types of exposure to market risk factors. These instruments may allow the Fund to pursue its objectives more quickly and efficiently than if it were to make direct purchases or sales of securities capable of effecting a similar response to market factors. Such contracts may be entered into through a bilateral over-the-counter (“OTC”) transaction, or through a securities or futures exchange and cleared through a clearinghouse.
Derivatives may have little or no initial cash investment relative to their market value exposure and therefore can produce significant gains or losses in excess of their cost due to unanticipated changes in the market risk factors and the overall market. This use of embedded leverage allows the Fund to increase its market value exposure relative to its net assets and can substantially increase the volatility of the Fund’s performance. In instances where the Fund is using derivatives to decrease, or hedge, exposures to market risk factors for securities held by the Fund, there are also risks that those derivatives may not perform as expected resulting in losses for the combined or hedged positions. Some derivatives have the potential for unlimited loss, regardless of the size of the Fund’s initial investment.
Additional associated risks from investing in derivatives also exist and potentially could have significant effects on the valuation of the derivative and the Fund. Typically, the associated risks are not the risks that the Fund is attempting to increase or decrease exposure to, per its investment objectives, but are the additional risks from investing in derivatives. Examples of these associated risks are liquidity risk, which is the risk that the Fund will not be able to sell the derivative in the open market in a timely manner, and counterparty credit risk, which is the risk that the counterparty will not fulfill its obligation to the Fund.
The Fund’s actual exposures to these market risk factors and associated risks during the period are discussed in further detail, by derivative type, below.
Option Activity
The Fund may buy and sell put and call options, or write put and call options. When an option is written, the Fund receives a premium and becomes obligated to sell or purchase the underlying security, currency or other underlying financial instrument at a fixed price, upon exercise of the option.
Options can be traded through an exchange or through a privately negotiated arrangement with a dealer in an OTC transaction. Options traded through an exchange are generally cleared through a clearinghouse (such as The Options Clearing Corporation). The difference between the premium received or paid, and market value of the option, is recorded as unrealized appreciation or depreciation. The net change in unrealized appreciation or depreciation is reported in the Statement of Operations. When an option is exercised, the cost of the security purchased or the proceeds of the security sale are adjusted by the amount of premium received or paid. Upon the expiration or closing of the option transaction, a gain or loss is reported in the Statement of Operations.
The Fund has purchased call options on individual equity securities and/or equity indexes to increase exposure to equity risk. A purchased call option becomes more valuable as the price of the underlying financial instrument appreciates relative to the strike price.
The Fund has purchased put options on individual equity securities and/or equity indexes to decrease exposure to equity risk. A purchased put option becomes more valuable as the price of the underlying financial instrument depreciates relative to the strike price.
During the reporting period, the Fund had an ending monthly average market value of $8 and $768 on purchased call options and purchased put options, respectively.
Options written, if any, are reported in a schedule following the Statement of Investments and as a liability in the Statement of Assets and Liabilities. Securities held in collateral accounts to cover potential obligations with respect to outstanding written options are noted in the Statement of Investments.
The risk in writing a call option is that the market price of the security increases and if the option is exercised, the Fund must either purchase the security at a higher price for delivery or, if the Fund owns the underlying security, give up the opportunity for profit. The risk in writing a put option is that the Fund may incur a loss if the market price of the security decreases and the option is exercised. The risk in buying an option is that the Fund pays a premium whether or not the option is exercised. The Fund also has the additional risk that there may be an illiquid market where the Fund is unable to close the contract.
The Fund has written put options on individual equity securities and/or equity indexes to increase exposure to equity risk. A written put option becomes more valuable as the price of the underlying financial instrument appreciates relative to the strike price.
The Fund has written call options on individual equity securities and/or equity indexes to decrease exposure to equity risk. A written call option becomes more valuable as the price of the underlying financial instrument depreciates relative to the strike price.
During the reporting period, the Fund had an ending monthly average market value of $2,069 and $14,577 on written call options and written put options, respectively.
Additional associated risks to the Fund include counterparty credit risk and liquidity risk.
Written option activity for the reporting period was as follows:
| | | | | | | | |
| | | Number of Contracts | | | Amount of Premiums | |
| |
Options outstanding as of December 31, 2014 | | | 60 | | | | $ 7,445 | |
Options written | | | 985 | | | | 136,417 | |
Options closed or expired | | | (572) | | | | (58,817) | |
Options exercised | | | (424) | | | | (75,558) | |
| | | | |
Options outstanding as of December 31, 2015 | | | 49 | | | | $ 9,487 | |
| | | | |
20 OPPENHEIMER EQUITY INCOME FUND/VA
6. Use of Derivatives (Continued)
Counterparty Credit Risk. Derivative positions are subject to the risk that the counterparty will not fulfill its obligation to the Fund. The Fund intends to enter into derivative transactions with counterparties that the Manager believes to be creditworthy at the time of the transaction.
The Fund’s risk of loss from counterparty credit risk on OTC derivatives is generally limited to the aggregate unrealized gain netted against any collateral held by the Fund. For OTC options purchased, the Fund bears the risk of loss of the amount of the premiums paid plus the positive change in market values net of any collateral held by the Fund should the counterparty fail to perform under the contracts. Options written by the Fund do not typically give rise to counterparty credit risk, as options written generally obligate the Fund and not the counterparty to perform.
To reduce counterparty risk with respect to OTC transactions, the Fund has entered into master netting arrangements, established within the Fund’s International Swap and Derivatives Association, Inc. (“ISDA”) master agreements, which allow the Fund to make (or to have an entitlement to receive) a single net payment in the event of default (close-out netting) for outstanding payables and receivables with respect to certain OTC positions in swaps, options, swaptions, and forward currency exchange contracts for each individual counterparty. In addition, the Fund may require that certain counterparties post cash and/or securities in collateral accounts to cover their net payment obligations for those derivative contracts subject to ISDA master agreements. If the counterparty fails to perform under these contracts and agreements, the cash and/or securities will be made available to the Fund.
ISDA master agreements include credit related contingent features which allow counterparties to OTC derivatives to terminate derivative contracts prior to maturity in the event that, for example, the Fund’s net assets decline by a stated percentage or the Fund fails to meet the terms of its ISDA master agreements, which would cause the Fund to accelerate payment of any net liability owed to the counterparty.
For financial reporting purposes, the Fund does not offset derivative assets and derivative liabilities that are subject to netting arrangements in the Statement of Assets and Liabilities. Bankruptcy or insolvency laws of a particular jurisdiction may impose restrictions on or prohibitions against the right of offset in bankruptcy, insolvency or other events.
The Fund’s risk of loss from counterparty credit risk on exchange-traded derivatives cleared through a clearinghouse and for centrally cleared swaps is generally considered lower than as compared to OTC derivatives. However, counterparty credit risk exists with respect to initial and variation margin deposited/paid by the Fund that is held in futures commission merchant, broker and/or clearinghouse accounts for such exchange-traded derivatives and for centrally cleared swaps.
With respect to centrally cleared swaps, such transactions will be submitted for clearing, and if cleared, will be held in accounts at futures commission merchants or brokers that are members of clearinghouses. While brokers, futures commission merchants and clearinghouses are required to segregate customer margin from their own assets, in the event that a broker, futures commission merchant or clearinghouse becomes insolvent or goes into bankruptcy and at that time there is a shortfall in the aggregate amount of margin held by the broker, futures commission merchant or clearinghouse for all its customers, U.S. bankruptcy laws will typically allocate that shortfall on a pro-rata basis across all the broker’s, futures commission merchant’s or clearinghouse’s customers, potentially resulting in losses to the Fund.
There is the risk that a broker, futures commission merchant or clearinghouse will decline to clear a transaction on the Fund’s behalf, and the Fund may be required to pay a termination fee to the executing broker with whom the Fund initially enters into the transaction. Clearinghouses may also be permitted to terminate centrally cleared swaps at any time. The Fund is also subject to the risk that the broker or futures commission merchant will improperly use the Fund’s assets deposited/paid as initial or variation margin to satisfy payment obligations of another customer. In the event of a default by another customer of the broker or futures commission merchant, the Fund might not receive its variation margin payments from the clearinghouse, due to the manner in which variation margin payments are aggregated for all customers of the broker/futures commission merchant.
Collateral and margin requirements differ by type of derivative. Margin requirements are established by the broker, futures commission merchant or clearinghouse for exchange-traded and cleared derivatives, including centrally cleared swaps. Brokers, futures commission merchants and clearinghouses can ask for margin in excess of the regulatory minimum, or increase the margin amount, in certain circumstances.
Collateral terms are contract specific for OTC derivatives. For derivatives traded under an ISDA master agreement, the collateral requirements are typically calculated by netting the mark to market amount for each transaction under such agreement and comparing that amount to the value of any collateral currently pledged by the Fund or the counterparty.
For financial reporting purposes, cash collateral that has been pledged to cover obligations of the Fund, if any, is reported separately on the Statement of Assets and Liabilities as cash pledged as collateral. Non-cash collateral pledged by the Fund, if any, is noted in the Statement of Investments. Generally, the amount of collateral due from or to a party must exceed a minimum transfer amount threshold (e.g. $250,000) before a transfer has to be made. To the extent amounts due to the Fund from its counterparties are not fully collateralized, contractually or otherwise, the Fund bears the risk of loss from counterparty nonperformance.
The following table presents the valuations of derivative instruments by risk exposure as reported within the Statement of Assets and Liabilities at period end:
| | | | | | | | | | | | |
| | | Asset Derivatives | | | Liability Derivatives | |
Derivatives Not Accounted for as Hedging Instruments | | Statement of Assets and Liabilities Location | | Value | | | Statement of Assets and Liabilities Location | | Value | |
Equity contracts | | Investments, at value | | $ | 330 | * | | Options written, at value | | $ | 4,625 | |
*Amounts relate to purchased option contracts and purchased swaption contracts.
The effect of derivative instruments on the Statement of Operations is as follows:
21 OPPENHEIMER EQUITY INCOME FUND/VA
NOTES TO FINANCIAL STATEMENTS Continued
6. Use of Derivatives (Continued)
| | | | | | | | | | | | |
| Amount of Realized Gain or (Loss) Recognized on Derivatives | |
| |
Derivatives Not Accounted for as Hedging Instruments | | Investment from unaffiliated
companies* | | | Closing and expiration of option
contracts written | | | Total | |
| |
Equity contracts | | | $ (9,190) | | | | $ 58,817 | | | | $ 49,627 | |
*Includes purchased option contracts and purchased swaption contracts and written option contracts exercised, if any. | |
| Amount of Change in Unrealized Gain or (Loss) Recognized on Derivatives | |
| |
Derivatives Not Accounted for as Hedging Instruments | | Investments* | | | Option contracts written | | | Total | |
| |
Equity contracts | | | $ (1,216) | | | | $ 2,990 | | | | $ 1,774 | |
*Includes purchased option contracts and purchased swaption contracts, if any.
7. Shares of Beneficial Interest
The Fund has authorized an unlimited number of $0.001 par value shares of beneficial interest of each class. Transactions in shares of beneficial interest were as follows:
| | | | | | | | | | | | | | | | |
| | | Year Ended December 31, 2015 | | | Year Ended December 31, 2014 | |
| | | Shares | | | Amount | | | Shares | | | Amount | |
Non-Service Shares | | | | | | | | | | | | | | | | |
Sold | | | 6,593 | | | $ | 71,817 | | | | 6,123 | | | $ | 72,670 | |
Dividends and/or distributions reinvested | | | 3,275 | | | | 36,220 | | | | 1,525 | | | | 17,847 | |
Redeemed | | | (1,387) | | | | (16,248) | | | | (2,228) | | | | (26,067) | |
Net increase | | | 8,481 | | | $ | 91,789 | | | | 5,420 | | | $ | 64,450 | |
| | | | | | | | | | | | | | | | | |
Service Shares | | | | | | | | | | | | | | | | |
Sold | | | 73,064 | | | $ | 1,015,107 | | | | 91,016 | | | $ | 1,284,880 | |
Dividends and/or distributions reinvested | | | 76,880 | | | | 1,034,803 | | | | 43,892 | | | | 614,048 | |
Redeemed | | | (232,573) | | | | (3,069,407) | | | | (146,710) | | | | (2,074,565) | |
Net decrease | | | (82,629) | | | $ | (1,019,497) | | | | (11,802) | | | $ | (175,637) | |
| | | | | | | | | | | | | | | | |
8. Purchases and Sales of Securities
The aggregate cost of purchases and proceeds from sales of securities, other than short-term obligations and investments in IMMF, for the reporting period were as follows:
| | | | | | | | |
| | | Purchases | | | Sales | |
Investment securities | | | $4,615,598 | | | | $6,196,148 | |
9. Fees and Other Transactions with Affiliates
Management Fees. Under the investment advisory agreement, the Fund pays the Manager a management fee based on the daily net assets of the Fund at an annual rate as shown in the following table:
| | | | |
| Fee Schedule | | | |
Up to $200 million | | | 0.75% | |
Next $200 million | | | 0.72 | |
Next $200 million | | | 0.69 | |
Next $200 million | | | 0.66 | |
Over $800 million | | | 0.60 | |
The Fund’s effective management fee for the reporting period was 0.75% of average annual net assets before any applicable waivers.
Sub-Adviser Fees. The Manager has retained the Sub-Adviser to provide the day-to-day portfolio management of the Fund. Under the Sub-Advisory Agreement, the Manager pays the Sub-Adviser an annual fee in monthly installments, equal to a percentage of the investment management fee collected by the Manager from the Fund, which shall be calculated after any investment management fee waivers. The fee paid to the Sub-Adviser is paid by the Manager, not by the Fund.
Transfer Agent Fees. OFI Global (the “Transfer Agent”) serves as the transfer and shareholder servicing agent for the Fund. The Fund pays the Transfer Agent a fee based on annual net assets. Fees incurred and average net assets for each class with respect to these services are detailed in the Statement of Operations and Financial Highlights, respectively.
22 OPPENHEIMER EQUITY INCOME FUND/VA
9. Fees and Other Transactions with Affiliates (Continued)
Sub-Transfer Agent Fees. The Transfer Agent has retained Shareholder Services, Inc., a wholly-owned subsidiary of OFI (the “Sub-Transfer Agent”), to provide the day-to-day transfer agent and shareholder servicing of the Fund. Under the Sub-Transfer Agency Agreement, the Transfer Agent pays the Sub-Transfer Agent an annual fee in monthly installments, equal to a percentage of the transfer agent fee collected by the Transfer Agent from the Fund, which shall be calculated after any applicable fee waivers. The fee paid to the Sub-Transfer Agent is paid by the Transfer Agent, not by the Fund.
Trustees’ Compensation. The Fund’s Board of Trustees (“Board”) has adopted a compensation deferral plan for Independent Trustees that enables Trustees to elect to defer receipt of all or a portion of the annual compensation they are entitled to receive from the Fund. For purposes of determining the amount owed to the Trustees under the plan, deferred amounts are treated as though equal dollar amounts had been invested in shares of the Fund or in other Oppenheimer funds selected by the Trustees. The Fund purchases shares of the funds selected for deferral by the Trustees in amounts equal to his or her deemed investment, resulting in a Fund asset equal to the deferred compensation liability. Such assets are included as a component of “Other” within the asset section of the Statement of Assets and Liabilities. Deferral of Trustees’ fees under the plan will not affect the net assets of the Fund and will not materially affect the Fund’s assets, liabilities or net investment income per share. Amounts will be deferred until distributed in accordance with the compensation deferral plan.
Distribution and Service Plan for Service Shares. The Fund has adopted a Distribution and Service Plan (the “Plan”) pursuant to Rule 12b-1 under the 1940 Act for Service shares to pay OppenheimerFunds Distributor, Inc. (the “Distributor”), for distribution related services, personal service and account maintenance for the Fund’s Service shares. Under the Plan, payments are made periodically at an annual rate of 0.25% of the daily net assets of Service shares of the Fund. The Distributor currently uses all of those fees to compensate sponsors of the insurance product that offers Fund shares, for providing personal service and maintenance of accounts of their variable contract owners that hold Service shares. These fees are paid out of the Fund’s assets on an on-going basis and increase operating expenses of the Service shares, which results in lower performance compared to the Fund’s shares that are not subject to a service fee. Fees incurred by the Fund under the Plan are detailed in the Statement of Operations.
Waivers and Reimbursements of Expenses. The Manager has contractually agreed to limit the Fund’s expenses after payments, waivers and/or reimbursements and reduction to custodian expenses, excluding expenses incurred directly or indirectly by the Fund as a result of investments in other investment companies, wholly-owned subsidiaries and pooled investment vehicles; so that those expenses, as percentages of daily net assets, will not exceed the annual rate of 0.80% for Non-Service shares and 1.05% for Service shares. The expense limitations do not include interest and fees from borrowing, and other expenses not incurred in the ordinary course of the Fund’s business. During the reporting period, the Manager waived fees and/or reimbursed the Fund $2,293 and $72,512 for Non-Service and Service shares, respectively.
The Manager will waive fees and/or reimburse Fund expenses in an amount equal to the indirect management fees incurred through the Fund’s investment in IMMF. During the reporting period, the Manager waived fees and/or reimbursed the Fund $49 for IMMF management fees.
Waivers and/or reimbursements may be modified or terminated as set forth according to the terms in the prospectus.
10. Borrowing and Other Financing
Joint Credit Facility. A number of mutual funds managed by the Manager participate in a $1.28 billion revolving credit facility (the “Facility”) intended to provide short-term financing, if necessary, subject to certain restrictions in connection with atypical redemption activity. Expenses and fees related to the Facility are paid by the participating funds and are disclosed separately or as other expenses on the Statement of Operations. The Fund did not utilize the Facility during the reporting period.
11. Pending Litigation
In 2009, several putative class action lawsuits were filed and later consolidated before the U.S. District Court for the District of Colorado against OppenheimerFunds, Inc. (“OFI”), OppenheimerFunds Distributor, Inc. (“OFDI”), and Oppenheimer Rochester California Municipal Fund, a fund advised by OFI Global Asset Management, Inc. and distributed by the Distributor (the “California Fund”), in connection with the California Fund’s investment performance. The plaintiffs asserted claims against OFI, OFDI and certain present and former trustees and officers of the California Fund under the federal securities laws, alleging, among other things, that the disclosure documents of the California Fund contained misrepresentations and omissions and the investment policies of the California Fund were not followed. Plaintiffs in the suit filed an amended complaint and defendants filed a motion to dismiss. In 2011, the court issued an order which granted in part and denied in part the defendants’ motion to dismiss. In 2012, plaintiffs filed a motion, which defendants opposed, to certify a class and appoint class representatives and class counsel. In March 2015, the court granted plaintiffs’ motion for class certification. In May 2015, the U.S. Court of Appeals for the Tenth Circuit vacated the class certification order and remanded the matter to the district court for further proceedings. In October 2015, the district court reaffirmed its order and determined that the suit will proceed as a class action. In December 2015, the Tenth Circuit denied defendants’ petition to appeal the district court’s reaffirmed class certification order.
OFI and OFDI believe the suit is without merit; that it is premature to render any opinion as to the likelihood of an outcome unfavorable to them in the suit; and that no estimate can yet be made as to the amount or range of any potential loss. Furthermore, OFI believes that the suit should not impair the ability of OFI or OFDI to perform their respective duties to the Fund and that the outcome of the suit should not have any material effect on the operations of any of the Oppenheimer funds.
23 OPPENHEIMER EQUITY INCOME FUND/VA
REPORT OF INDEPENDENT REGISTERED PUBLIC ACCOUNTING FIRM
The Board of Trustees and Shareholders of Oppenheimer Variable Account Funds:
We have audited the accompanying statement of assets and liabilities of Oppenheimer Equity Income Fund/VA (a separate series of Oppenheimer Variable Account Funds), including the statement of investments, as of December 31, 2015, and the related statement of operations for the year then ended, the statements of changes in net assets for each of the years in the two-year period then ended, and the financial highlights for each of the years in the five-year period then ended. These financial statements and financial highlights are the responsibility of the Fund’s management. Our responsibility is to express an opinion on these financial statements and financial highlights based on our audits.
We conducted our audits in accordance with the standards of the Public Company Accounting Oversight Board (United States). Those standards require that we plan and perform the audit to obtain reasonable assurance about whether the financial statements and financial highlights are free of material misstatement. An audit includes examining, on a test basis, evidence supporting the amounts and disclosures in the financial statements. Our procedures included confirmation of securities owned as of December 31, 2015, by correspondence with the custodian, transfer agent and brokers, or by other appropriate auditing procedures where replies from brokers were not received. An audit also includes assessing the accounting principles used and significant estimates made by management, as well as evaluating the overall financial statement presentation. We believe that our audits provide a reasonable basis for our opinion.
In our opinion, the financial statements and financial highlights referred to above present fairly, in all material respects, the financial position of Oppenheimer Equity Income Fund/VA as of December 31, 2015, the results of its operations for the year then ended, the changes in its net assets for each of the years in the two-year period then ended, and the financial highlights for each of the years in the five-year period then ended, in conformity with U.S. generally accepted accounting principles.
KPMGLLP
Denver, Colorado
February 12, 2016
24 OPPENHEIMER EQUITY INCOME FUND/VA
FEDERAL INCOME TAX INFORMATION Unaudited
In early 2016, if applicable, shareholders of record received information regarding all dividends and distributions paid to them by the Fund during calendar year 2015.
Capital gain distributions of $0.55581 per share were paid to Non-Service and Service shareholders, respectively, on June 16, 2015. Whether received in stock or in cash, the capital gain distribution should be treated by shareholders as a gain from the sale of the capital assets held for more than one year (long-term capital gains).
Dividends, if any, paid by the Fund during the reporting period which are not designated as capital gain distributions should be multiplied by the maximum amount allowable but not less than 54.38% to arrive at the amount eligible for the corporate dividend-received deduction.
The foregoing information is presented to assist shareholders in reporting distributions received from the Fund to the Internal Revenue Service. Because of the complexity of the federal regulations which may affect your individual tax return and the many variations in state and local tax regulations, we recommend that you consult your tax advisor for specific guidance.
25 OPPENHEIMER EQUITY INCOME FUND/VA
BOARD APPROVAL OF THE FUND’S INVESTMENT ADVISORY AND SUB-ADVISORY AGREEMENTS Unaudited
The Fund has entered into an investment advisory agreement with OFI Global Asset Management, Inc. (“OFI Global” or the “Adviser”), a wholly-owned subsidiary of OppenheimerFunds, Inc. (“OFI” or the “Sub-Adviser”) (“OFI Global” and “OFI” together the “Managers”) and OFI Global has entered into a sub-advisory agreement with OFI whereby OFI provides investment sub-advisory services to the Fund (collectively, the “Agreements”). Each year, the Board of Trustees (the “Board”), including a majority of the independent Trustees, is required to determine whether to approve the terms of the Agreements and the renewal thereof. The Investment Company Act of 1940, as amended, requires that the Board request and evaluate, and that the Managers provide, such information as may be reasonably necessary to evaluate the terms of the Agreements. The Board employs an independent consultant to prepare a report that provides information, including comparative information that the Board requests for that purpose. In addition to in-person meetings focused on this evaluation, the Board receives information throughout the year regarding Fund services, fees, expenses and performance.
The Adviser, Sub-Adviser and the independent consultant provided information to the Board on the following factors: (i) the nature, quality and extent of the Managers’ services, (ii) the comparative investment performance of the Fund and the Managers, (iii) the fees and expenses of the Fund, including comparative fee and expense information, (iv) the profitability of the Managers and their affiliates, including an analysis of the cost of providing services, (v) whether economies of scale are realized as the Fund grows and whether fee levels reflect these economies of scale for Fund investors and (vi) other benefits to the Managers from their relationship with the Fund. The Board was aware that there are alternatives to retaining the Managers.
Outlined below is a summary of the principal information considered by the Board as well as the Board’s conclusions.
Nature, Quality and Extent of Services. The Board considered information about the nature, quality and extent of the services provided to the Fund and information regarding the Managers’ key personnel who provide such services. The Managers’ duties include providing the Fund with the services of the portfolio manager and the Sub-Adviser’s investment team, who provide research, analysis and other advisory services in regard to the Fund’s investments; and securities trading services. OFI Global is responsible for oversight of third-party service providers; monitoring compliance with applicable Fund policies and procedures and adherence to the Fund’s investment restrictions; risk management; and oversight of the Sub-Adviser. OFI Global is also responsible for providing certain administrative services to the Fund as well. Those services include providing and supervising all administrative and clerical personnel who are necessary in order to provide effective corporate administration for the Fund; compiling and maintaining records with respect to the Fund’s operations; preparing and filing reports required by the U.S. Securities and Exchange Commission; preparing periodic reports regarding the operations of the Fund for its shareholders; preparing proxy materials for shareholder meetings; and preparing the registration statements required by federal and state securities laws for the sale of the Fund’s shares. OFI Global also provides the Fund with office space, facilities and equipment.
The Board also considered the quality of the services provided and the quality of the Managers’ resources that are available to the Fund. The Board took account of the fact that the Sub-Adviser has had over fifty years of experience as an investment adviser and that its assets under management rank it among the top mutual fund managers in the United States. The Board evaluated the Managers’ advisory, administrative, accounting, legal, compliance services and risk management, and information the Board has received regarding the experience and professional qualifications of the Managers’ key personnel and the size and functions of its staff. In its evaluation of the quality of the portfolio management services provided, the Board considered the experience of Michael Levine, the portfolio manager for the Fund, and the Sub-Adviser’s investment team and analysts. The Board members also considered the totality of their experiences with the Managers as directors or trustees of the Fund and other funds advised by the Managers. The Board considered information regarding the quality of services provided by affiliates of the Managers, which the Board members have become knowledgeable about through their experiences with the Managers and in connection with the renewal of the Fund’s service agreements. The Board concluded, in light of the Managers’ experience, reputation, personnel, operations and resources that the Fund benefits from the services provided under the Agreements.
Investment Performance of the Managers and the Fund. Throughout the year, the Managers provided information on the investment performance of the Fund, including comparative performance information. The Board also reviewed information, prepared by the Managers and by the independent consultant, comparing the Fund’s historical performance to relevant market indices and to the performance of other large value funds underlying variable insurance products. The Board considered that the Fund underperformed its performance category median during the three- and five-year periods, but outperformed its performance category median during the one- and ten-year periods. The Board also considered that the Fund performed in the first quintile of its performance category for the ten-year period. The Board noted that on April 30, 2013 the Fund changed its name and investment strategy to Oppenheimer Equity Income Fund/VA from Oppenheimer Value Fund/VA and, on that same date, Michael Levine took over as portfolio manager of the Fund. Accordingly, the Board noted that performance prior to April 30, 2013 is reflective of a different investment strategy and different portfolio managers.
Fees and Expenses of the Fund. The Board reviewed the fees paid to the Adviser and the other expenses borne by the Fund. The Board noted that the Adviser, not the Fund, pays the Sub-Adviser’s fee under the sub-advisory agreement. The independent consultant provided comparative data in regard to the fees and expenses of the Fund and other large value funds underlying variable insurance products. In reviewing the fees and expenses charged to the VA funds, the Board considered the Adviser’s assertion that, because there is much greater disparity in the fees and services that may be provided by a manager to a VA fund as opposed to a retail fund, when comparing the expenses of the various VA funds to those of retail funds, it is most appropriate to focus on total expenses (rather than on the management fees). Accordingly, while the Board reviewed and considered all expenses, it focused on total expenses. The Board considered that the Fund’s total expenses, after waivers, were equal to its peer group median and higher than its category median. The Board also considered that the Fund’s contractual management fee was higher than both its peer group median and its category median. Within the total asset range of $0 to $50 million, the Fund’s effective management fee rate was higher than its peer group median and category median. The Board further noted that the Adviser has contractually agreed to limit the Fund’s total annual operating expenses so that those expenses, as percentages of daily net assets, will not exceed the annual rate of 0.80% for Non-Service Shares and 1.05% for Service Shares. This contractual expense limitation may not be amended or withdrawn until one year after the date of the Fund’s prospectus, unless approved by the Board.
26 OPPENHEIMER EQUITY INCOME FUND/VA
Economies of Scale and Profits Realized by the Managers. The Board considered information regarding the Managers’ costs in serving as the Fund’s investment adviser and sub-adviser, including the costs associated with the personnel and systems necessary to manage the Fund, and information regarding the Managers’ profitability from their relationship with the Fund. The Board reviewed whether the Managers may realize economies of scale in managing and supporting the Fund. The Board noted that the Fund currently has management fee breakpoints, which are intended to share with Fund shareholders economies of scale that may exist as the Fund’s assets grow.
Other Benefits to the Managers. In addition to considering the profits realized by the Managers, the Board considered information that was provided regarding the direct and indirect benefits the Managers receive as a result of their relationship with the Fund, including compensation paid to the Managers’ affiliates and research provided to the Adviser in connection with permissible brokerage arrangements (soft dollar arrangements).
Conclusions. These factors were also considered by the independent Trustees meeting separately from the full Board, assisted by experienced counsel to the Fund and to the independent Trustees. Fund counsel and the independent Trustees’ counsel are independent of the Managers within the meaning and intent of the Securities and Exchange Commission Rules.
Based on its review of the information it received and its evaluations described above, the Board, including a majority of the independent Trustees, decided to continue the Agreements through August 31, 2016. In arriving at its decision, the Board did not identify any factor or factors as being more important than others, but considered all of the above information, and considered the terms and conditions of the Agreements, including the management fees, in light of all the surrounding circumstances.
27 OPPENHEIMER EQUITY INCOME FUND/VA
PORTFOLIO PROXY VOTING POLICIES AND PROCEDURES; UPDATES TO STATEMENTS OF INVESTMENTS Unaudited
The Fund has adopted Portfolio Proxy Voting Policies and Procedures under which the Fund votes proxies relating to securities (“portfolio proxies”) held by the Fund. A description of the Fund’s Portfolio Proxy Voting Policies and Procedures is available (i) without charge, upon request, by calling the Fund toll-free at 1.800.525.7048, (ii) on the Fund’s website at www.oppenheimerfunds.com, and (iii) on the SEC’s website at www.sec.gov. In addition, the Fund is required to file Form N-PX, with its complete proxy voting record for the 12 months ended June 30th, no later than August 31st of each year. The Fund’s voting record is available (i) without charge, upon request, by calling the Fund toll-free at 1.800.525.7048, and (ii) in the Form N-PX filing on the SEC’s website at www.sec.gov.
The Fund files its complete schedule of portfolio holdings with the SEC for the first quarter and the third quarter of each fiscal year on Form N-Q. The Fund’s Form N-Q filings are available on the SEC’s website at www.sec.gov. Those forms may be reviewed and copied at the SEC’s Public Reference Room in Washington, D.C. Information on the operation of the Public Reference Room may be obtained by calling 1-800-SEC-0330.
28 OPPENHEIMER EQUITY INCOME FUND/VA
TRUSTEES AND OFFICERS Unaudited
| | |
| |
| Name, Position(s) Held with the Fund, Length of Service, Age | | Principal Occupation(s) During the Past 5 Years; Other Trusteeships/Directorships Held; Number of Portfolios in the Fund Complex Currently Overseen |
| |
| INDEPENDENT TRUSTEES | | The address of each Trustee in the chart below is 6803 S. Tucson Way, Centennial, Colorado 80112-3924. Each Trustee serves for an indefinite term, or until his or her resignation, retirement, death or removal. |
| |
Sam Freedman, Chairman of the Board of Trustees (since 2013) and Trustee (since 1996) Year of Birth: 1940 | | Director of Colorado UpLIFT (charitable organization) (since September 1984). Mr. Freedman held several positions with the Sub-Adviser and with subsidiary or affiliated companies of the Sub-Adviser (until October 1994). Oversees 47 portfolios in the OppenheimerFunds complex. Mr. Freedman has served on the Boards of certain Oppenheimer funds since 1996, during which time he has become familiar with the Fund’s (and other Oppenheimer funds’) financial, accounting, regulatory and investment matters and has contributed to the Boards’ deliberations. |
| |
Jon S. Fossel, Trustee (since 1990) Year of Birth: 1942 | | Chairman of the Board of Jack Creek Preserve Foundation (non-profit organization) (since 2005); Chairman of the Board (2006-December 2011) and Director (June 2002-December 2011) of UNUMProvident (insurance company); Director of Northwestern Energy Corp. (public utility corporation) (November 2004-December 2009); Director of P.R. Pharmaceuticals (October 1999-October 2003); Director of Rocky Mountain Elk Foundation (non-profit organization) (February 1998-February 2003 and February 2005-February 2007); Chairman and Director (until October 1996) and President and Chief Executive Officer (until October 1995) of the Sub-Adviser; President, Chief Executive Officer and Director of the following: Oppenheimer Acquisition Corp. (“OAC”) (parent holding company of the Sub-Adviser), Shareholders Services, Inc. and Shareholder Financial Services, Inc. (until October 1995). Oversees 47 portfolios in the OppenheimerFunds complex. Mr. Fossel has served on the Boards of certain Oppenheimer funds since 1990, during which time he has become familiar with the Fund’s (and other Oppenheimer funds’) financial, accounting, regulatory and investment matters and has contributed to the Boards’ deliberations. |
| |
Richard F. Grabish, Trustee (since 2012) Year of Birth: 1948 | | Formerly Senior Vice President and Assistant Director of Sales and Marketing (March 1997-December 2007), Director (March 1987-December 2007) and Manager of Private Client Services (June 1985-June 2005) of A.G. Edwards & Sons, Inc. (broker/dealer and investment firm); Chairman and Chief Executive Officer of A.G. Edwards Trust Company, FSB (March 2001- December 2007); President and Vice Chairman of A.G. Edwards Trust Company, FSB (investment adviser) (April 1987-March 2001); President of A.G. Edwards Trust Company, FSB (investment adviser) (June 2005-December 2007). Oversees 47 portfolios in the OppenheimerFunds complex. Mr. Grabish has served on the Boards of certain Oppenheimer funds since 2001, during which time he has become familiar with the Fund’s (and other Oppenheimer funds’) financial, accounting, regulatory and investment matters and has contributed to the Boards’ deliberations. |
| |
Beverly L. Hamilton, Trustee (since 2002) Year of Birth: 1946 | | Trustee of Monterey Institute for International Studies (educational organization) (since February 2000); Board Member of Middlebury College (educational organization) (December 2005-June 2011); Chairman (since 2010) of American Funds’ Emerging Markets Growth Fund, Inc. (mutual fund); Director of The California Endowment (philanthropic organization) (April 2002-April 2008); Director (February 2002-2005) and Chairman of Trustees (2006-2007) of the Community Hospital of Monterey Peninsula; Director (October 1991-2005); Vice Chairman (2006-2009) of American Funds’ Emerging Markets Growth Fund, Inc. (mutual fund); President of ARCO Investment Management Company (February 1991-April 2000); Member of the investment committees of The Rockefeller Foundation (2001-2006) and The University of Michigan (since 2000); Advisor at Credit Suisse First Boston’s Sprout venture capital unit (venture capital fund) (1994-January 2005); Trustee of MassMutual Institutional Funds (investment company) (1996-June 2004); Trustee of MML Series Investment Fund (investment company) (April 1989-June 2004); Member of the investment committee of Hartford Hospital (2000-2003); and Advisor to Unilever (Holland) pension fund (2000-2003). Oversees 47 portfolios in the OppenheimerFunds complex. Ms. Hamilton has served on the Boards of certain Oppenheimer funds since 2002, during which time she has become familiar with the Fund’s (and other Oppenheimer funds’) financial, accounting, regulatory and investment matters and has contributed to the Boards’ deliberations. |
| |
Victoria J. Herget, Trustee (since 2012) Year of Birth:1951 | | Board Chair (2008-Present) and Director (2004-Present), United Educators (insurance company); Trustee (since 2000) and Chair (since 2010), Newberry Library (independent research library); Trustee, Mather LifeWays (senior living organization) (since 2001); Independent Director of the First American Funds (mutual fund family) (2003-2011); former Managing Director (1993-2001), Principal (1985-1993), Vice President (1978-1985) and Assistant Vice President (1973-1978) of Zurich Scudder Investments (investment adviser) (and its predecessor firms); Trustee (1992-2007), Chair of the Board of Trustees (1999- 2007), Investment Committee Chair (1994-1999) and Investment Committee member (2007-2010) of Wellesley College; Trustee, BoardSource (non-profit organization) (2006-2009) and Chicago City Day School (K-8 School) (1994-2005). Oversees 47 portfolios in the OppenheimerFunds complex. Ms. Herget has served on the Boards of certain Oppenheimer funds since 2012, during which time she has become familiar with the Fund’s (and other Oppenheimer funds’) financial, accounting, regulatory and investment matters and has contributed to the Boards’ deliberations. |
| |
Robert J. Malone, Trustee (since 2002) Year of Birth: 1944 | | Chairman - Colorado Market of MidFirst Bank (since January 2015); Chairman of the Board (since 2012) and Director (since August 2005) of Jones International University (educational organization); Trustee of the Gallagher Family Foundation (non-profit organization) (2000-2015); Chairman, Chief Executive Officer and Director of Steele Street Bank Trust (commercial banking) (August 2003-January 2015); Board of Directors of Opera Colorado Foundation (non-profit organization) (2008- 2012); Director of Colorado UpLIFT (charitable organization) (1986-2010); Director of Jones Knowledge, Inc. (2006-2010); Former Chairman of U.S. Bank-Colorado (subsidiary of U.S. Bancorp and formerly Colorado National Bank) (July 1996-April 1999); Director of Commercial Assets, Inc. (real estate investment trust) (1993-2000); Director of U.S. Exploration, Inc. (oil and gas exploration) (1997-February 2004); Chairman of the Board (1991-1994) and Trustee (1985-1994) of Regis University; and Chairman of the Board (1990-1991 and Trustee (1984-1999) of Young Presidents Organization. Oversees 47 portfolios in the |
29 OPPENHEIMER EQUITY INCOME FUND/VA
|
TRUSTEES AND OFFICERS Unaudited / Continued |
| | |
Robert J. Malone, Continued | | OppenheimerFunds complex. Mr. Malone has served on the Boards of certain Oppenheimer funds since 2002, during which time he has become familiar with the Fund’s (and other Oppenheimer funds’) financial, accounting, regulatory and investment matters and has contributed to the Boards’ deliberations. |
| |
F. William Marshall, Jr., Trustee (since 2000) Year of Birth: 1942 | | Trustee Emeritus of Worcester Polytech Institute (WPI) (private university) (since 2009); Trustee of MassMutual Select Funds (formerly MassMutual Institutional Funds) (investment company) (since 1996), MML Series Investment Fund (investment company) (since 1996) and Mass Mutual Premier Funds (investment company) (since January 2012); President and Treasurer of the SIS Funds (private charitable fund) (January 1999-March 2011); Former Trustee of WPI (1985-2008); Former Chairman of the Board (2004-2006) and Former Chairman of the Investment Committee of WPI (1994-2008); Chairman of SIS Family Bank, F.S.B. (formerly SIS Bank) (commercial bank) (January 1999-July 1999); Executive Vice President of Peoples Heritage Financial Group, Inc. (commercial bank) (January 1999-July 1999); and Former President and Chief Executive Officer of SIS Bancorp. (1993-1999). Oversees 47 portfolios in the OppenheimerFunds complex. Mr. Marshall has served on the Boards of certain Oppenheimer funds since 2000, during which time he has become familiar with the Fund’s (and other Oppenheimer funds’) financial, accounting, regulatory and investment matters and has contributed to the Boards’ deliberations. |
| |
Karen L. Stuckey, Trustee (since 2012) Year of Birth: 1953 | | Partner (1990-2012) of PricewaterhouseCoopers LLP (professional services firm) (held various positions 1975-1990); Trustee (1992-2006) and member of Executive, Nominating and Audit Committees and Chair of Finance Committee of Lehigh University; and member, Women’s Investment Management Forum (professional organization) since inception. Oversees 47 portfolios in the OppenheimerFunds complex. Ms. Stuckey has served on the Boards of certain Oppenheimer funds since 2012, during which time she has become familiar with the Fund’s (and other Oppenheimer funds’) financial, accounting, regulatory and investment matters and has contributed to the Boards’ deliberations. |
| |
James D. Vaughn, Trustee (since 2012) Year of Birth:1945 | | Retired; former managing partner (1994-2001) of Denver office of Deloitte & Touche LLP, (held various positions 1969-1993); Trustee and Chairman of the Audit Committee of Schroder Funds (2003-2012); Board member and Chairman of Audit Committee of AMG National Trust Bank (since 2005); Trustee, Investment Committee member, University of South Dakota Foundation (since 1996); Board member, Audit Committee Member and past Board Chair, Junior Achievement (since 1993); former Board member, Mile High United Way, Boys and Girls Clubs, Boy Scouts, Colorado Business Committee for the Arts, Economic Club of Colorado and Metro Denver Network. Oversees 47 portfolios in the OppenheimerFunds complex. Mr. Vaughn has served on the Boards of certain Oppenheimer funds since 2012, during which time he has become familiar with the Fund’s (and other Oppenheimer funds’) financial, accounting, regulatory and investment matters and has contributed to the Boards’ deliberations. |
| |
| INTERESTED TRUSTEE AND OFFICER | | Mr. Steinmetz is an “Interested Trustee” because he is affiliated with the Manager and the Sub-Adviser by virtue of his positions as Chairman and director of the Sub-Adviser and officer and director of the Manager. Both as a Trustee and as an officer, Mr. Steinmetz serves for an indefinite term, or until his resignation, retirement, death or removal. Mr. Steinmetz’s address is 225 Liberty Street, New York, New York 10281-1008. |
| |
Arthur P. Steinmetz Trustee (Since 2015), President and Principal Executive Officer (since 2014) Year of Birth: 1958 | | Chairman of the Sub-Adviser (since January 2015); CEO and Chairman of the Manager (since July 2014), President of the Manager (since May 2013), a Director of the Manager (since January 2013), Director of the Sub-Adviser (since July 2014), President, Management Director and CEO of Oppenheimer Acquisition Corp. (the Sub-Adviser’s parent holding company) (since July 2014), and President and Director of OFI SteelPath, Inc. (since January 2013). Chief Investment Officer of the OppenheimerFunds advisory entities from (January 2013-December 2013); Executive Vice President of the Manager (January 2013-May 2013); Chief Investment Officer of the Sub-Adviser (October 2010-December 2012); Chief Investment Officer, Fixed- Income, of the Sub-Adviser (April 2009-October 2010); Executive Vice President of the Sub-Adviser (October 2009-December 2012); Director of Fixed Income of the Sub-Adviser (January 2009-April 2009); and a Senior Vice President of the Sub-Adviser (March 1993-September 2009). An officer of 101 portfolios in the OppenheimerFunds complex. |
| |
| OTHER OFFICERS OF THE FUND | | The addresses of the Officers in the chart below are as follows: for Messrs. Levine, Gabinet, Mss. Sexton and Picciotto, 225 Liberty Street, New York, New York 10281-1008, for Mr. Wixted, 6803 S. Tucson Way, Centennial, Colorado 80112-3924. Each Officer serves for an indefinite term or until his or her resignation, retirement, death or removal. |
| |
Michael S. Levine, Vice President (since 2013) Year of Birth: 1965 | | Vice President of the Sub-Adviser (since June 1998) and Senior Portfolio Manager of the Sub-Adviser (since September 2000). A portfolio manager and an officer of other portfolios in the OppenheimerFunds complex. |
| |
Arthur S. Gabinet, Secretary and Chief Legal Officer (since 2011) Year of Birth: 1958 | | Executive Vice President, Secretary and General Counsel of the Manager (since January 2013); General Counsel OFI SteelPath, Inc. (since January 2013); Executive Vice President (May 2010-December 2012) and General Counsel (since January 2011) of the Sub-Adviser; General Counsel of the Distributor (since January 2011); General Counsel of Centennial Asset Management Corporation (January 2011-December 2012); Executive Vice President (January 2011-December 2012) and General Counsel of HarbourView Asset Management Corporation (since January 2011); Assistant Secretary (since January 2011) and Director (since January 2011) of OppenheimerFunds International Ltd. and OppenheimerFunds plc; Director of Oppenheimer Real Asset Management, Inc. (January 2011-December 2012) and General Counsel (since January 2011); Executive Vice President (January 2011-December 2011) and General Counsel of Shareholder Financial Services, Inc. and Shareholder Services, Inc. (since January 2011); Executive Vice President (January 2011-December 2012) and General Counsel of OFI Private Investments Inc. (since January 2011); Vice President of OppenheimerFunds Legacy Program (January 2011-December 2011); Executive Vice President (January 2011-December 2012) and General Counsel of OFI Institutional Asset Management, Inc. (since January 2011); General Counsel, Asset Management of the Sub-Adviser (May 2010-December 2010); Principal, The Vanguard Group (November 2005-April 2010); District Administrator, U.S. Securities and Exchange Commission (January 2003-October 2005). An officer of 101 Portfolios in the OppenheimerFunds complex. |
30 OPPENHEIMER EQUITY INCOME FUND/VA
| | |
| |
Jennifer Sexton, Vice President and Chief Business Officer (since 2014) Year of Birth: 1969 | | Senior Vice President of OppenheimerFunds Distributor, Inc. (since June 2014); Vice President of OppenheimerFunds Distributor, Inc. (April 2006-June 2014); Vice President of the Sub-Adviser (January 1998-March 2006); Assistant Vice President of the Sub-Adviser (October 1991-December 1998). An officer of 101 Portfolios in the OppenheimerFunds complex. |
| |
Mary Ann Picciotto, Chief Compliance Officer and Chief Anti-Money Laundering Officer (since 2014) Year of Birth: 1973 | | Senior Vice President and Chief Compliance Officer of the Manager (since March 2014); Chief Compliance Officer of the Sub- Adviser, OFI SteelPath, Inc., OFI Global Trust Company, OFI Global Institutional, Inc., Oppenheimer Real Asset Management, Inc., OFI Private Investments, Inc., Harborview Asset Management Corporation, Trinity Investment Management Corporation, and Shareholder Services, Inc. (since March 2014); Managing Director of Morgan Stanley Investment Management Inc. and certain of its various affiliated entities; Chief Compliance Officer of various Morgan Stanley Funds (May 2010-January 2014); Chief Compliance Officer of Morgan Stanley Investment Management Inc. (April 2007-January 2014). An officer of 101 Portfolios in the OppenheimerFunds complex. |
| |
Brian W. Wixted, Treasurer and Principal Financial & Accounting Officer (since 2002) Year of Birth: 1959 | | Senior Vice President of the Manager (since January 2013); Treasurer of the Sub-Adviser, HarbourView Asset Management Corporation, Shareholder Financial Services, Inc., Shareholder Services, Inc., and Oppenheimer Real Asset Management, Inc. (March 1999-June 2008), OFI Private Investments, Inc. (March 2000-June 2008), OppenheimerFunds International Ltd. and OppenheimerFunds plc (since May 2000), OFI Institutional Asset Management, Inc. (November 2000-June 2008), and OppenheimerFunds Legacy Program (charitable trust program established by the Sub-Adviser) (June 2003-December 2011); Treasurer and Chief Financial Officer of OFI Trust Company (since May 2000); Assistant Treasurer of Oppenheimer Acquisition Corporation (March 1999-June 2008). An officer of 101 Portfolios in the OppenheimerFunds complex. |
The Fund’s Statement of Additional Information contains additional information about the Fund’s Trustees and Officers and is available without charge, upon request, by calling 1.800.988.8287.
31 OPPENHEIMER EQUITY INCOME FUND/VA
OPPENHEIMER EQUITY INCOME FUND/VA
A Series of Oppenheimer Variable Account Funds
| | |
| Manager | | OFI Global Asset Management, Inc. |
| |
| Sub-Adviser | | OppenheimerFunds, Inc. |
| |
| Distributor | | OppenheimerFunds Distributor, Inc. |
| |
| Transfer and | | OFI Global Asset Management, Inc. |
| Shareholder | | |
| Servicing Agent | | |
| |
Sub-Transfer Agent | | Shareholder Services, Inc. DBA OppenheimerFunds Services |
| |
Independent Registered Public Accounting Firm | | KPMGLLP |
| |
| Counsel | | Ropes & Gray LLP |
| |
| | Before investing in any of the Oppenheimer funds, investors should carefully consider a fund’s investment objectives, risks, charges and expenses. Fund prospectuses and summary prospectuses contain this and other information about the funds, and may be obtained by asking your financial advisor, or calling us at 1.800.988.8287. Read prospectuses and summary prospectuses carefully before investing. |
| |
| | © 2016 OppenheimerFunds, Inc. All rights reserved. Oppenheimer funds are distributed by OppenheimerFunds Distributor, Inc. |


| | | | |
| December 31, 2015 | | |
| | | Oppenheimer Global Multi-Alternatives Fund/VA A Series of Oppenheimer Variable Account Funds | | Annual Report |
| | |
| | ANNUAL REPORT Listing of Top Holdings Fund Performance Discussion Financial Statements | | |
PORTFOLIO MANAGERS: Mark Hamilton; David Wharmby, CFA; Brian Watson, CFA; Benjamin Rockmuller, CFA; and Dokyoung Lee, CFA
AVERAGE ANNUAL TOTAL RETURNS FOR THE PERIODS ENDED 12/31/15
| | | | | | | | | | | | |
| | | Inception Date | | | 1-Year | | | Since Inception | |
Non-Service Shares | | | 11/14/13 | | | | -3.45 | % | | | 0.78 | % |
Service Shares | | | 11/14/13 | | | | -3.68 | | | | 0.59 | |
Bank of America Merrill Lynch 3-Month U.S. Treasury Bill Index | | | | | | | 0.05 | | | | 0.05 | |
Performance data quoted represents past performance, which does not guarantee future results. The investment return and principal value of an investment in the Fund will fluctuate so that an investor’s shares, when redeemed, may be worth more or less than their original cost. Current performance may be lower or higher than the performance quoted. For performance data current to the most recent month end, call us at 1.800.988.8287. The Fund’s total returns should not be expected to be the same as the returns of other funds, whether or not both funds have the same portfolio managers and/or similar names. The Fund’s total returns include changes in share price and reinvested distributions but do not include the charges associated with the separate account products that offer this Fund. Such performance would have been lower if such charges were taken into account.
TOP HOLDINGS AND ALLOCATIONS
TOP TEN COMMON STOCK HOLDINGS
| | |
| Alphabet, Inc., Cl. A | | 0.7% |
| Honeywell International, Inc. | | 0.7 |
| Lockheed Martin Corp. | | 0.6 |
| Starwood Property Trust, Inc. | | 0.6 |
| UnitedHealth Group, Inc. | | 0.6 |
| ACE Ltd. | | 0.5 |
| AT&T, Inc. | | 0.5 |
| Altria Group, Inc. | | 0.4 |
| Juniper Networks, Inc. | | 0.4 |
| Magellan Midstream Partners LP | | 0.4 |
Portfolio holdings and allocations are subject to change. Percentages are as of December 31, 2015, and are based on net assets. For more current Fund holdings, please visit oppenheimerfunds.com.
SECTOR ALLOCATION
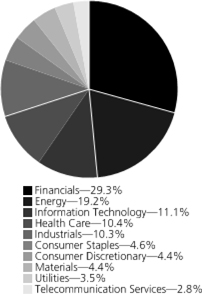
Portfolio holdings and allocations are subject to change. Percentages are as of December 31, 2015, and are based on the total market value of common stocks.
2 OPPENHEIMER GLOBAL MULTI-ALTERNATIVES FUND/VA
| | |
Fund Performance Discussion |
In what was a volatile reporting period, the Fund’s Non-Service shares returned -3.45%. On a relative basis, the Fund underperformed the Bank of America Merrill Lynch 3-Month U.S. Treasury Bill Index (the “Index”), which returned 0.05% during the same period. The Fund underperformed the Index in an environment where the alternative strategies and assets the Fund invests in generally underperformed the muted performance of short-term U.S. Government debt.
MARKET OVERVIEW
2015 will go down as a year in which volatility returned to the financial markets following a multi-year hiatus. Global growth struggled to gain traction as many of the world’s largest economies expanded below their long-term trends. China’s industrial production slowed for the fifth consecutive year and weighed on the world’s exporters—especially commodity producers. In the United States, a strong dollar impaired the competitiveness of many American companies and proved to be a drag on corporate earnings. The Federal Reserve finally hiked interest rates 0.25% in December, which followed a somewhat underwhelming easing program by the European Central Bank (ECB) earlier in the month. The environment led to a turbulent environment for various asset classes.
FUND REVIEW
During the reporting period, top performers for the Fund included its fundamental alpha-oriented alternative strategy and its exposure to event-linked bonds. The fundamental alpha-oriented alternative strategy offers the flexibility often associated with hedge fund-like strategies, while providing daily liquidity and transparency. The strategy seeks to provide investors with strong risk-adjusted returns that have low sensitivity to traditional market factors over the long-term. The investment process has an underlying value philosophy that combines bottom-up and top-down fundamental analysis for security selection and portfolio construction. The strategy is able to invest both long and short across three distinct alternative investment strategies including Long/Short Equity, Long/Short Credit, and Long/Short other assets (which can include currencies, rates, sovereigns, and commodities). In particular the Long/Short Equity strategy had strong performance across a number of short positions in the energy sector. This sector continued to be troubled throughout the period with falling oil prices. Event-linked securities transfer a specified set of catastrophe risks like hurricane, earthquakes and windstorms from a sponsor to investors. This strategy is an income alternative that acts as an effective diversifier to the portfolio because of its floating rate coupon structure and lack of correlation with traditional financial assets. Event-linked securities had a strong reporting period, outperforming more credit-sensitive assets and other risk assets like equities. This strategy performed strongly this reporting period and demonstrated its positive diversification characteristics. The Fund also received positive results from its exposure to global real estate and its currency alpha strategy this reporting period.
Top detractors from performance this reporting period included the Fund’s exposure to energy infrastructure master limited partnerships (“MLPs”) and its quantitative-driven alternative investment strategies. Our MLP strategy seeks to invest in U.S. midstream MLPs that the investment team believes have attractive risk and reward characteristics. The asset class experienced a difficult reporting period as energy market volatility increased, and in some cases accelerated negative price momentum across this alternative asset class. While we have little certainty on when markets will normalize, we believe that when the negative price sentiment fades fundamentals will eventually come back into focus. In our view, the midstream MLP business model has become increasingly fee-based and if production declines persist, prices will have to go higher to meet global demand. Also, given the relatively low yield environment we are facing, over the long-term we believe investor interest in income generating asset classes will remain strong, and that MLPs are positioned to benefit.
The Fund’s quantitative-driven alternative investment strategies leverages four key strategies that seek to generate attractive risk-adjusted returns that exhibit low correlation to traditional stocks and bonds. The largest detractor was the Global Macro strategy, which involves tactical positioning in broad asset and/or sector classes.
STRATEGY & OUTLOOK
The Fund is comprised of a flexible blend of alternative strategies and assets and is designed to be a turnkey alternative solution that improves the risk/reward tradeoff of a traditional balanced portfolio. We classify alternatives into three categories: Alpha alternatives, such as Global Multi Strategies, Fundamental Alpha Strategies, and the Currency Alpha Strategy, rely less on the direction of major markets and economic factors to generate returns. Income alternatives (e.g., MLPs, loans, and event-linked bonds) provide exposure to relatively stable income producing assets with less interest rate sensitivity than traditional fixed income allocations. Real asset alternatives, like Commodities and Global Real Estate, could help guard against inflation over the long-term. We combine these strategies and assets to provide a core, alternative exposure that can potentially offset some of the risk from equity drawdowns, rising interest rates and inflationary shocks.
Despite a decline in valuations due to the equity market selloff in the third quarter of 2015, many equity markets are still rich relative to history and have not yet fallen to attractive levels. Against the weakening picture in credit fundamentals, we believe the best strategy in this space is to reduce some credit exposure and
3 OPPENHEIMER GLOBAL MULTI-ALTERNATIVES FUND/VA
take a more cautious stance. In terms of the macro environment, we are seeing an unsynchronized and relatively weaker economic picture that is counterbalanced by supportive monetary policy. It is worth noting, however, that financial conditions have started to diverge significantly across regions.
As we look ahead, we expect a continuation of this year’s seesaw behavior, in which global markets alternate between risk-on and risk-off. Our view is informed by the divergence in policy across the world’s major economies, as the U.S. looks to increase interest rates, while Europe and China maintain and may even expand stimulative policy measures. This muted growth outlook coupled with lack of consistent direction is causing a high degree of financial market uncertainty that may persist for some time. In such an environment, further diversifying in alternatives can improve the risk /reward profile for investors. Thus we believe that diversifying risk, controlling volatility and managing the downside will be a winning strategy going forward. Because the Fund is comprised of a number of different alternative assets and strategies, with diversifying properties as well as the potential to generate attractive total returns, we believe it can play a particularly valuable role in investors’ portfolios.
Investors should consider the Fund’s investment objective, risks, charges and expenses carefully before investing. The Fund’s prospectus and summary prospectus contain this and other information about the Fund, and may be obtained by asking your financial advisor or calling us at 1.800.988.8287. Read prospectuses and summary prospectuses carefully before investing.
Total returns include changes in share price and reinvestment of dividends and capital gains distributions in a hypothetical investment for the periods shown.
The Fund’s investment strategy and focus can change over time. The mention of specific fund holdings does not constitute a recommendation by OppenheimerFunds, Inc. or its affiliates.
Shares of Oppenheimer funds are not deposits or obligations of any bank, are not guaranteed by any bank, are not insured by the FDIC or any other agency, and involve investment risks, including the possible loss of the principal amount invested.
Comparing the Fund’s Performance to the Market. The graphs that follow show the performance of a hypothetical $10,000 investment in each share class of the Fund held until December 31, 2015. Performance is measured from the inception of both Classes on November 14, 2013. Performance information does not reflect charges that apply to separate accounts investing in the Fund. If these charges were taken into account, performance would be lower. The graphs assume that all dividends and capital gains distributions were reinvested in additional shares.
The Fund’s performance is compared to the performance of the Bank of America Merrill Lynch 3-Month U.S. Treasury Bill Index. The Bank of America Merrill Lynch 3-month U.S. Treasury Bill Index is an index of short-term U.S. Government securities with a remaining term to final maturity of less than three months. The Bank of America (BofA) Merrill Lynch 3-month U.S. Treasury Bill Index is an index of short-term U.S. Government securities with a remaining term to final maturity of less than three months. The index is unmanaged, includes the reinvestment of dividends and cannot be purchased directly by investors. While index comparisons may be useful to provide a benchmark for the Fund’s performance, it must be noted that the Fund’s investments are not limited to the investments comprising the indices. Index performance includes reinvestment of income, but does not reflect transaction costs, fees, expenses or taxes. Index performance is shown for illustrative purposes only as a benchmark for the Fund’s performance, and does not predict or depict performance of the Fund. The Fund’s performance reflects the effects of the Fund’s business and operating expenses.
4 OPPENHEIMER GLOBAL MULTI-ALTERNATIVES FUND/VA
COMPARISON OF CHANGE IN VALUE OF $10,000 HYPOTHETICAL INVESTMENTS IN:

COMPARISON OF CHANGE IN VALUE OF $10,000 HYPOTHETICAL INVESTMENTS IN:
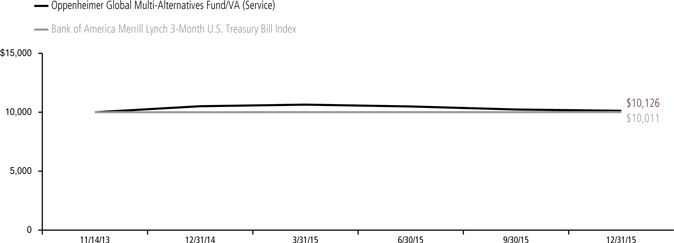
Performance data quoted represents past performance, which does not guarantee future results. The investment return and principal value of an investment in the Fund will fluctuate so that an investor’s shares, when redeemed, may be worth more or less than their original cost. Current performance may be lower or higher than the performance quoted. For performance data current to the most recent month end, call us at 1.800.988.8287. The Fund’s total returns should not be expected to be the same as the returns of other funds, whether or not both funds have the same portfolio managers and/or similar names. The Fund’s total returns include changes in share price and reinvested distributions but do not include the charges associated with the separate account products that offer this Fund. Such performance would have been lower if such charges were taken into account.
5 OPPENHEIMER GLOBAL MULTI-ALTERNATIVES FUND/VA
Fund Expenses. As a shareholder of the Fund, you incur two types of costs: (1) transaction costs and (2) ongoing costs, including management fees; distribution and service fees; and other Fund expenses. These examples are intended to help you understand your ongoing costs (in dollars) of investing in the Fund and to compare these costs with the ongoing costs of investing in other mutual funds.
The examples are based on an investment of $1,000.00 invested at the beginning of the period and held for the entire 6-month period ended December 31, 2015.
Actual Expenses. The first section of the table provides information about actual account values and actual expenses. You may use the information in this section for the class of shares you hold, together with the amount you invested, to estimate the expense that you paid over the period. Simply divide your account value by $1,000.00 (for example, an $8,600.00 account value divided by $1,000.00 = 8.60), then multiply the result by the number in the first section under the heading entitled “Expenses Paid During 6 Months Ended December 31, 2015” to estimate the expenses you paid on your account during this period.
Hypothetical Example for Comparison Purposes.
The second section of the table provides information about hypothetical account values and hypothetical expenses based on the Fund’s actual expense ratio for each class of shares, and an assumed rate of return of 5% per year for each class before expenses, which is not the actual return. The hypothetical account values and expenses may not be used to estimate the actual ending account balance or expenses you paid for the period. You may use this information to compare the ongoing costs of investing in the Fund and other funds. To do so, compare this 5% hypothetical example for the class of shares you hold with the 5% hypothetical examples that appear in the shareholder reports of the other funds.
Please note that the expenses shown in the table are meant to highlight your ongoing costs only and do not reflect any charges associated with the separate accounts that offer this Fund. Therefore, the “hypothetical” lines of the table are useful in comparing ongoing costs only, and will not help you determine the relative total costs of owning different funds. In addition, if these separate account charges were included your costs would have been higher.
| | | | | | | | | | | | | | | | | | |
| Actual | | Beginning
Account
Value
July 1, 2015 | | | | | Ending Account Value
December 31, 2015 | | | | | Expenses Paid During 6 Months Ended December 31, 2015 | | | |
Non-Service shares | | $ | 1,000.00 | | | | | $ | 966.50 | | | | | $ | 7.11 | | | |
Service shares | | | 1,000.00 | | | | | | 965.10 | | | | | | 8.36 | | | |
| | | | | | |
Hypothetical | | | | | | | | | | | | | | | | | | |
(5% return before expenses) | | | | | | | | | | | | | | | | | | |
Non-Service shares | | | 1,000.00 | | | | | | 1,018.00 | | | | | | 7.30 | | | |
Service shares | | | 1,000.00 | | | | | | 1,016.74 | | | | | | 8.58 | | | |
Expenses are equal to the Fund’s annualized expense ratio for that class, multiplied by the average account value over the period, multiplied by 184/365 (to reflect the one-half year period). Those annualized expense ratios, excluding indirect expenses from affiliated funds, based on the 6-month period ended December 31, 2015 are as follows:
| | | | | | |
| Class | | Expense Ratios | | | |
Non-Service shares | | | 1.43% | | | |
Service shares | | | 1.68 | | | |
The expense ratios reflect voluntary and/or contractual waivers and/or reimbursements of expenses by the Fund’s Manager. Some of these undertakings may be modified or terminated at any time, as indicated in the Fund’s prospectus. The “Financial Highlights” tables in the Fund’s financial statements, included in this report, also show the gross expense ratios, without such waivers or reimbursements and reduction to custodian expenses, if applicable.
6 OPPENHEIMER GLOBAL MULTI-ALTERNATIVES FUND/VA
CONSOLIDATED STATEMENT OF INVESTMENTS December 31, 2015
| | | | | | | | | | |
| | | Shares | | | Value | | | |
| Common Stocks—29.3% | | | | | | | | | | |
| Consumer Discretionary—1.3% | | | | | | | | | | |
| Hotels, Restaurants & Leisure—0.4% | | | |
| Brinker International, Inc.1 | | | 24,735 | | | $ | 1,186,043 | | | |
| Fujita Kanko, Inc. | | | 24,000 | | | | 120,694 | | | |
| Hilton Worldwide Holdings, Inc. | | | 10,890 | | | | 233,046 | | | |
| | | | | | | 1,539,783 | | | |
| | | | | | | | | | | |
| Household Durables—0.1% | | | | | | | | | | |
| Sekisui House SI Residential Investment Corp. | | | 233 | | | | 208,654 | | | |
| | | | | | | | | | | |
| Media—0.4% | | | | | | | | | | |
| Cablevision Systems Corp., Cl. A | | | 11,392 | | | | 363,405 | | | |
| DISH Network Corp., Cl. A2 | | | 15,573 | | | | 890,464 | | | |
| Journal Media Group, Inc. | | | 33,300 | | | | 400,266 | | | |
| | | | | | | 1,654,135 | | | |
| | | | | | | | | | | |
| Multiline Retail—0.3% | | | | | | | | | | |
| Target Corp.1 | | | 18,815 | | | | 1,366,157 | | | |
| | | | | | | | | | | |
| Specialty Retail—0.1% | | | | | | | | | | |
Pep Boys-Manny Moe & Jack
(The)2 | | | 26,719 | | | | 491,897 | | | |
| | | | | | | | | | | |
| Consumer Staples—1.3% | | | | | | | | | | |
| Beverages—0.2% | | | | | | | | | | |
| Coca-Cola Co. (The)1 | | | 23,020 | | | | 988,940 | | | |
| | | | | | | | | | | |
| Food & Staples Retailing—0.2% | | | | | | | | | | |
| Liberator Medical Holdings, Inc. | | | 120,789 | | | | 403,435 | | | |
| Rite Aid Corp.2 | | | 44,532 | | | | 349,131 | | | |
| | | | | | | 752,566 | | | |
| | | | | | | | | | | |
| Food Products—0.2% | | | | | | | | | | |
| Boulder Brands, Inc.2 | | | 36,663 | | | | 402,560 | | | |
| Keurig Green Mountain, Inc. | | | 4,330 | | | | 389,613 | | | |
| | | | | | | 792,173 | | | |
| | | | | | | | | | | |
| Tobacco—0.7% | | | | | | | | | | |
| Altria Group, Inc.1 | | | 31,522 | | | | 1,834,896 | | | |
| Philip Morris International, Inc. | | | 13,150 | | | | 1,156,016 | | | |
| | | | | | | 2,990,912 | | | |
| | | | | | | | | | | |
| Energy—5.6% | | | | | | | | | | |
| Energy Equipment & Services—0.1% | | | |
| Schlumberger Ltd. | | | 8,365 | | | | 583,459 | | | |
| Seadrill Partners LLC3 | | | 22,191 | | | | 80,997 | | | |
| | | | | | | 664,456 | | | |
| | | | | | | | | | | |
| Oil, Gas & Consumable Fuels—5.5% | | | |
| Buckeye Partners LP1,3 | | | 14,430 | | | | 951,803 | | | |
| Canadian Natural Resources Ltd. | | | 13,332 | | | | 291,171 | | | |
| Chevron Corp. | | | 7,175 | | | | 645,463 | | | |
| ConocoPhillips | | | 16,543 | | | | 772,393 | | | |
| Energy Transfer Equity LP3 | | | 82,590 | | | | 1,134,787 | | | |
| Energy Transfer Partners LP3 | | | 41,561 | | | | 1,401,853 | | | |
| Enterprise Products Partners LP1,3 | | | 67,425 | | | | 1,724,731 | | | |
| EOG Resources, Inc. | | | 8,515 | | | | 602,777 | | | |
| EQT Midstream Partners LP3 | | | 10,640 | | | | 802,894 | | | |
| Genesis Energy LP3 | | | 18,005 | | | | 661,504 | | | |
| Magellan Midstream Partners LP3 | | | 26,025 | | | | 1,767,618 | | | |
| MPLX LP3 | | | 18,262 | | | | 718,244 | | | |
| NGL Energy Partners LP3 | | | 27,545 | | | | 304,097 | | | |
| Noble Energy, Inc.1 | | | 32,413 | | | | 1,067,360 | | | |
| NuStar Energy LP3 | | | 1,105 | | | | 44,310 | | | |
| NuStar GP Holdings LLC1,3 | | | 16,675 | | | | 352,676 | | | |
| Occidental Petroleum Corp. | | | 10,140 | | | | 685,565 | | | |
| Plains All American Pipeline LP1,3 | | | 26,550 | | | | 613,305 | | | |
| Plains GP Holdings LP, Cl. A | | | 17,500 | | | | 165,375 | | | |
| Shell Midstream Partners LP3 | | | 4,828 | | | | 200,459 | | | |
| Sunoco Logistics Partners LP1,3 | | | 55,275 | | | | 1,420,567 | | | |
| Tallgrass Energy GP LP, Cl. A | | | 25,727 | | | | 410,860 | | | |
| Tallgrass Energy Partners LP3 | | | 13,100 | | | | 539,851 | | | |
| | | | | | | | |
| | | Shares | | | Value | |
Oil, Gas & Consumable Fuels (Continued) | |
| Targa Resources Corp. | | | 6,630 | | | $ | 179,408 | |
| Targa Resources Partners LP1,3 | | | 18,229 | | | | 301,325 | |
| TC PipeLines LP3 | | | 27,460 | | | | 1,365,037 | |
| Tesoro Logistics LP3 | | | 14,665 | | | | 737,943 | |
| TransMontaigne Partners LP3 | | | 7,900 | | | | 211,404 | |
| Valero Energy Corp. | | | 6,350 | | | | 449,009 | |
| Western Gas Partners LP3 | | | 7,925 | | | | 376,675 | |
| Williams Cos., Inc. (The) | | | 24,810 | | | | 637,617 | |
Williams Partners LP3 | | | 29,917 | | | | 833,188 | |
| | | | | | | 22,371,269 | |
| | | | | | | | | |
Financials—8.6% | |
Capital Markets—0.0% | |
| Goldman Sachs Group, Inc. (The) | | | 668 | | | | 120,394 | |
| | | | | | | | | |
Commercial Banks—0.8% | |
| Banner Corp. | | | 419 | | | | 19,215 | |
| Camden National Corp. | | | 95 | | | | 4,189 | |
| Citigroup, Inc.1 | | | 18,080 | | | | 935,640 | |
| JPMorgan Chase & Co. | | | 17,525 | | | | 1,157,176 | |
| M&T Bank Corp. | | | 7,485 | | | | 907,032 | |
Wells Fargo & Co. | | | 6,950 | | | | 377,802 | |
| | | | | | | 3,401,054 | |
| | | | | | | | | |
Diversified Financial Services—0.0% | |
Tiptree Financial, Inc., Cl. A | | | 617 | | | | 3,788 | |
| | | | | | | | | |
Insurance—1.5% | |
| ACE Ltd. | | | 18,485 | | | | 2,159,972 | |
| Allstate Corp. (The)1 | | | 10,960 | | | | 680,507 | |
| Enstar Group Ltd.2 | | | 284 | | | | 42,611 | |
| Fidelity & Guaranty Life | | | 15,120 | | | | 383,594 | |
| Phoenix Cos., Inc. (The)2 | | | 10,536 | | | | 390,254 | |
| StanCorp Financial Group, Inc. | | | 3,316 | | | | 377,626 | |
| Symetra Financial Corp. | | | 12,445 | | | | 395,378 | |
Unum Group | | | 42,900 | | | | 1,428,141 | |
| | | | | | | 5,858,083 | |
| | | | | | | | | |
Real Estate Investment Trusts (REITs)—5.3% | |
| Acadia Realty Trust | | | 8,610 | | | | 285,422 | |
| American Assets Trust, Inc. | | | 11,605 | | | | 445,052 | |
| AvalonBay Communities, Inc. | | | 2,807 | | | | 516,853 | |
| BioMed Realty Trust, Inc. | | | 16,615 | | | | 393,609 | |
| Blackstone Mortgage Trust, Inc., Cl. A | | | 47,895 | | | | 1,281,670 | |
| Boston Properties, Inc. | | | 4,150 | | | | 529,291 | |
| Champion REIT | | | 193,000 | | | | 95,993 | |
| Chatham Lodging Trust | | | 4,250 | | | | 87,040 | |
| Chesapeake Lodging Trust | | | 10,950 | | | | 275,502 | |
| Comforia Residential REIT, Inc. | | | 74 | | | | 140,108 | |
| Derwent London plc | | | 5,970 | | | | 322,517 | |
| Digital Realty Trust, Inc. | | | 4,110 | | | | 310,798 | |
| Duke Realty Corp. | | | 13,610 | | | | 286,082 | |
| Equinix, Inc. | | | 960 | | | | 290,304 | |
| Equity Residential | | | 8,410 | | | | 686,172 | |
| Essex Property Trust, Inc. | | | 2,110 | | | | 505,155 | |
| Eurocommercial Properties NV | | | 3,438 | | | | 148,199 | |
| Extra Space Storage, Inc. | | | 7,050 | | | | 621,881 | |
| FelCor Lodging Trust, Inc. | | | 29,070 | | | | 212,211 | |
| Fortune Real Estate Investment Trust | | | 237,000 | | | | 242,866 | |
| Frasers Centrepoint Trust | | | 92,000 | | | | 119,593 | |
| GLP J-Reit | | | 164 | | | | 158,662 | |
| Goodman Group | | | 97,200 | | | | 440,067 | |
| GPT Group (The) | | | 27,500 | | | | 95,054 | |
| Great Portland Estates plc | | | 26,130 | | | | 318,516 | |
| Hammerson plc | | | 26,490 | | | | 234,119 | |
| Highwoods Properties, Inc. | | | 5,980 | | | | 260,728 | |
| Host Hotels & Resorts, Inc. | | | 11,962 | | | | 183,497 | |
| Inland Real Estate Corp. | | | 24,756 | | | | 262,909 | |
| Invincible Investment Corp. | | | 190 | | | | 110,290 | |
| Japan Retail Fund Investment Corp. | | | 52 | | | | 99,856 | |
7 OPPENHEIMER GLOBAL MULTI-ALTERNATIVES FUND/VA
CONSOLIDATED STATEMENT OF INVESTMENTS Continued
| | | | | | | | | | |
| | | Shares | | | Value | | | |
Real Estate Investment Trusts (REITs) (Continued) | | | |
| Kilroy Realty Corp. | | | 6,090 | | | $ | 385,375 | | | |
| Kimco Realty Corp. | | | 12,690 | | | | 335,777 | | | |
| Klepierre | | | 8,580 | | | | 380,491 | | | |
| Land Securities Group plc | | | 26,370 | | | | 457,178 | | | |
| Macerich Co. (The) | | | 12,105 | | | | 976,752 | | | |
| Paramount Group, Inc. | | | 19,080 | | | | 345,348 | | | |
| Physicians Realty Trust | | | 9,290 | | | | 156,629 | | | |
| Prologis, Inc. | | | 12,360 | | | | 530,491 | | | |
| Public Storage | | | 3,270 | | | | 809,979 | | | |
| Regency Centers Corp. | | | 7,290 | | | | 496,595 | | | |
| Simon Property Group, Inc. | | | 6,780 | | | | 1,318,303 | | | |
| Starwood Property Trust, Inc. | | | 120,950 | | | | 2,486,732 | | | |
| Tanger Factory Outlet Centers, Inc. | | | 6,710 | | | | 219,417 | | | |
| Taubman Centers, Inc. | | | 4,960 | | | | 380,531 | | | |
| UDR, Inc. | | | 11,280 | | | | 423,790 | | | |
| Unibail-Rodamco SE | | | 2,370 | | | | 600,923 | | | |
| Vastned Retail NV | | | 2,323 | | | | 106,779 | | | |
| Ventas, Inc. | | | 3,240 | | | | 182,833 | | | |
| Vicinity Centres | | | 103,300 | | | | 209,341 | | | |
| Welltower, Inc. | | | 7,340 | | | | 499,340 | | | |
Westfield Corp. | | | 71,907 | | | | 494,684 | | | |
| | | | | | | 21,757,304 | | | |
| | | | | | | | | | | |
Real Estate Management & Development—1.0% | | | |
| CapitaLand Ltd. | | | 103,000 | | | | 241,738 | | | |
| Cheung Kong Property Holdings Ltd. | | | 26,000 | | | | 168,895 | | | |
| City Developments Ltd. | | | 16,000 | | | | 86,058 | | | |
| Daiwa House Industry Co. Ltd. | | | 7,400 | | | | 212,162 | | | |
| Hang Lung Properties Ltd. | | | 75,000 | | | | 170,106 | | | |
| Helical Bar plc | | | 27,090 | | | | 189,477 | | | |
| Hongkong Land Holdings Ltd. | | | 29,000 | | | | 202,234 | | | |
| Hufvudstaden AB, Cl. A | | | 10,086 | | | | 142,818 | | | |
| Mitsubishi Estate Co. Ltd. | | | 20,100 | | | | 416,612 | | | |
| Mitsui Fudosan Co. Ltd. | | | 22,000 | | | | 551,264 | | | |
| St. Modwen Properties plc | | | 26,190 | | | | 159,747 | | | |
| Sumitomo Realty & Development Co. Ltd. | | | 8,600 | | | | 245,039 | | | |
| Sun Hung Kai Properties Ltd. | | | 33,000 | | | | 396,696 | | | |
| Swire Properties Ltd. | | | 70,200 | | | | 201,322 | | | |
| Unite Group plc (The) | | | 23,240 | | | | 224,387 | | | |
Vonovia SE | | | 10,293 | | | | 318,823 | | | |
| | | | | | | 3,927,378 | | | |
| | | | | | | | | | | |
Thrifts & Mortgage Finance—0.0% | | | |
Essent Group Ltd.2 | | | 1,908 | | | | 41,766 | | | |
| | | | | | | | | | | |
Health Care—3.1% | | | |
Biotechnology—0.4% | | | |
| Baxalta, Inc. | | | 20,115 | | | | 785,088 | | | |
| Chelsea Therapeutics, Inc.2,5 | | | 10,531 | | | | — | | | |
| Dyax Corp.2 | | | 10,770 | | | | 405,167 | | | |
Ocata Therapeutics, Inc.2 | | | 47,544 | | | | 400,321 | | | |
| | | | | | | 1,590,576 | | | |
| | | | | | | | | | | |
Health Care Equipment & Supplies—0.1% | | | |
Medtronic plc | | | 7,022 | | | | 540,132 | | | |
| | | | | | | | | | | |
Health Care Providers & Services—1.0% | | | |
| Express Scripts Holding Co.2 | | | 7,080 | | | | 618,863 | | | |
| HCA Holdings, Inc.2 | | | 3,765 | | | | 254,627 | | | |
| UnitedHealth Group, Inc.1 | | | 19,275 | | | | 2,267,511 | | | |
Universal Health Services, Inc., Cl. B | | | 6,385 | | | | 762,944 | | | |
| | | | | | | 3,903,945 | | | |
| | | | | | | | | | | |
Health Care Technology—0.1% | | | |
MedAssets, Inc.2 | | | 12,813 | | | | 396,434 | | | |
| | | | | | | | | | | |
Pharmaceuticals—1.5% | | | |
| Allergan plc1,2 | | | 4,470 | | | | 1,396,875 | | | |
| Ambit Biosciences Corp.2,5 | | | 10,347 | | | | 6,208 | | | |
Durata Therapeutics2,5 | | | 6,530 | | | | — | | | |
| | | | | | | | | | |
| | | | | | | | | | |
| | | | | | | | | | |
| | | | | | | | |
| | | Shares | | | Value | |
Pharmaceuticals (Continued) | |
| Furiex Pharmaceuticals, Inc.2,5 | | | 636 | | | $ | 3,107 | |
| Merck & Co., Inc. | | | 27,045 | | | | 1,428,517 | |
| Novartis AG, ADR | | | 17,690 | | | | 1,522,048 | |
| Roche Holding AG | | | 6,091 | | | | 1,678,607 | |
Teva Pharmaceutical Industries Ltd.2 | | | 10 | | | | — | |
| | | | | | | 6,035,362 | |
| | | | | | | | | |
Industrials—3.0% | |
Aerospace & Defense—1.8% | |
| Honeywell International, Inc. | | | 28,400 | | | | 2,941,388 | |
| Lockheed Martin Corp. | | | 12,035 | | | | 2,613,400 | |
| Northrop Grumman Corp. | | | 7,170 | | | | 1,353,768 | |
Precision Castparts Corp. | | | 1,717 | | | | 398,361 | |
| | | | | | | 7,306,917 | |
| | | | | | | | | |
Air Freight & Couriers—0.1% | |
UTi Worldwide, Inc.2 | | | 56,368 | | | | 396,267 | |
| | | | | | | | | |
Airlines—0.1% | |
United Continental Holdings, Inc.2 | | | 7,720 | | | | 442,356 | |
| | | | | | | | | |
Building Products—0.0% | |
Griffon Corp. | | | 669 | | | | 11,908 | |
| | | | | | | | | |
Commercial Services & Supplies—0.6% | |
| Republic Services, Inc., Cl. A | | | 37,040 | | | | 1,629,390 | |
Tyco International plc1 | | | 20,095 | | | | 640,829 | |
| | | | | | | 2,270,219 | |
| | | | | | | | | |
Machinery—0.2% | |
| Blount International, Inc.2 | | | 40,031 | | | | 392,704 | |
Flowserve Corp. | | | 15,370 | | | | 646,770 | |
| | | | | | | 1,039,474 | |
| | | | | | | | | |
Road & Rail—0.1% | |
Union Pacific Corp. | | | 7,100 | | | | 555,220 | |
| | | | | | | | | |
Trading Companies & Distributors—0.1% | |
AerCap Holdings NV2 | | | 7,560 | | | | 326,290 | |
| | | | | | | | | |
Information Technology—3.3% | |
Communications Equipment—0.9% | |
| Juniper Networks, Inc. | | | 65,880 | | | | 1,818,288 | |
| QUALCOMM, Inc. | | | 27,090 | | | | 1,354,094 | |
Telefonaktiebolaget LM Ericsson, Cl. B | | | 44,743 | | | | 433,412 | |
| | | | | | | 3,605,794 | |
| | | | | | | | | |
Electronic Equipment, Instruments, & Components—0.1% | |
RealD, Inc.2 | | | 36,959 | | | | 389,917 | |
| | | | | | | | | |
Internet Software & Services—0.8% | |
| Alphabet, Inc., Cl. A2 | | | 3,796 | | | | 2,953,326 | |
| Benefitfocus, Inc.2 | | | 332 | | | | 12,082 | |
| Constant Contact, Inc.2 | | | 12,552 | | | | 367,020 | |
| Endurance International Group Holdings, Inc.2 | | | 1,824 | | | | 19,936 | |
Limelight Networks, Inc.2 | | | 2,605 | | | | 3,803 | |
| | | | | | | 3,356,167 | |
| | | | | | | | | |
IT Services—0.0% | |
MoneyGram International, Inc.2 | | | 892 | | | | 5,593 | |
| | | | | | | | | |
Semiconductors & Semiconductor Equipment—0.6% | |
| Fairchild Semiconductor International, Inc., Cl. A2 | | | 20,131 | | | | 416,913 | |
| Mattson Technology, Inc.2 | | | 106,486 | | | | 375,896 | |
| PMC-Sierra, Inc.2 | | | 38,076 | | | | 442,443 | |
Xilinx, Inc. | | | 28,865 | | | | 1,355,789 | |
| | | | | | | 2,591,041 | |
| | | | | | | | | |
Software—0.4% | |
| King Digital Entertainment plc | | | 22,404 | | | | 400,583 | |
| SolarWinds, Inc.2 | | | 6,647 | | | | 391,508 | |
| Solera Holdings, Inc. | | | 7,125 | | | | 390,664 | |
8 OPPENHEIMER GLOBAL MULTI-ALTERNATIVES FUND/VA
| | | | | | | | | | |
| | | |
| | | Shares | | | Value | | | |
Software (Continued) | | | | | | | | | | |
| TeleCommunication Systems, Inc., Cl. A2 | | | 80,915 | | | $ | 402,148 | | | |
| | | | | | | 1,584,903 | | | |
| | | | | | | | | | | |
Technology Hardware, Storage & Peripherals—0.5% | | | |
| Apple, Inc. | | | 13,270 | | | | 1,396,800 | | | |
| Hutchinson Technology, Inc.2 | | | 111,713 | | | | 401,050 | | | |
| | | | | | | 1,797,850 | | | |
| | | | |
Materials—1.3% | | | |
Chemicals—0.8% | | | |
| Airgas, Inc. | | | 2,812 | | | | 388,956 | | | |
| Celanese Corp. | | | 15,370 | | | | 1,034,862 | | | |
| LyondellBasell Industries NV, Cl. A | | | 10,208 | | | | 887,075 | | | |
| Methanex Corp. | | | 28,305 | | | | 934,348 | | | |
| Westlake Chemical Partners LP3 | | | 9,718 | | | | 215,545 | | | |
| | | | | | | 3,460,786 | | | |
| | | | | | | | | | | |
Containers & Packaging—0.4% | | | |
| Packaging Corp. of America | | | 8,690 | | | | 547,904 | | | |
| Sonoco Products Co. | | | 21,850 | | | | 893,010 | | | |
| | | | | | | 1,440,914 | | | |
| | | | | | | | | | | |
Paper & Forest Products—0.1% | | | |
| Wausau Paper Corp. | | | 38,804 | | | | 396,965 | | | |
| | | | | | | | | | | |
Telecommunication Services—0.8% | | | |
Diversified Telecommunication Services—0.7% | | | |
| AT&T, Inc. | | | 55,470 | | | | 1,908,723 | | | |
| BCE, Inc.1 | | | 24,855 | | | | 959,900 | | | |
| | | | | | | 2,868,623 | | | |
| | | | | | | | | | | |
Wireless Telecommunication Services—0.1% | | | |
| NII Holdings, Inc.2 | | | 605 | | | | 3,055 | | | |
| NTELOS Holdings Corp.2 | | | 43,762 | | | | 399,985 | | | |
| | | | | | | 403,040 | | | |
| | | | | | | | | | | |
Utilities—1.0% | | | |
Electric Utilities—0.6% | | | |
| Edison International | | | 23,175 | | | | 1,372,192 | | | |
| PPL Corp. | | | 36,065 | | | | 1,230,898 | | | |
| | | | | | | 2,603,090 | | | |
| | | | | | | | | | | |
Gas Utilities—0.2% | | | |
| AGL Resources, Inc. | | | 6,007 | | | | 383,307 | | | |
| Piedmont Natural Gas Co., Inc. | | | 6,529 | | | | 372,284 | | | |
| | | | | | | 755,591 | | | |
| | | | | | | | | | | |
Independent Power and Renewable Electricity
Producers—0.0% | | | |
| EME Reorganization Trust | | | 52,072 | | | | 521 | | | |
| NRG Energy, Inc. | | | 171 | | | | 2,015 | | | |
| | | | | | | 2,536 | | | |
| | | | | | | | | | | |
Multi-Utilities—0.2% | | | |
| CMS Energy Corp. | | | 10,970 | | | | 395,798 | | | |
| TECO Energy, Inc. | | | 14,356 | | | | 382,587 | | | |
| | | | | | | 778,385 | | | |
| Total Common Stocks (Cost $127,224,979) | | | | 119,787,004 | | | |
| | | | |
| Preferred Stocks—0.9% | | | |
| M&T Bank Corp., 6.375% Cum., Series A, Non- Vtg. | | | 340 | | | | 346,800 | | | |
| M&T Bank Corp., 6.375% Cum., Series C, Non- Vtg. | | | 475 | | | | 484,500 | | | |
| U.S. Bancorp, 6% Non-Cum., Series G, Non-Vtg.6 | | | 99,700 | | | | 2,673,954 | | | |
Total Preferred Stocks
(Cost $3,536,667) | | | | | | | 3,505,254 | | | |
| | | |
| | | Principal
Amount | | | | | | |
| Asset-Backed Securities—4.5% | | | |
| Aircraft Lease Securitisation Ltd., Series 2007-1A, Cl. G3, 0.529%, 5/10/326,7 | | $ | 514,437 | | | | 508,007 | | | |
| | | | | | | | | | |
| | | | | | | | | | |
| | | | | | | | | | |
| | | | | | | | | | |
| | | | | | | | | | |
| | | | | | | | | | |
| | | | | | | | | | |
| | | | | | | | | | |
| | | | | | | | | | |
| | | | | | | | | | |
| | | | | | | | | | |
| | | | | | | | |
| | | Principal Amount | | | Value | |
Asset-Backed Securities (Continued) | |
| Airspeed Ltd., Series 2007-1A, Cl. G1, 0.601%, 6/15/326,7 | | $ | 4,433,499 | | | $ | 3,591,134 | |
| Bear Stearns Structured Products Trust, Series 2007-EMX1, Cl. A2, 1.722%, 3/25/376,8 | | | 1,600,000 | | | | 1,477,695 | |
| Blade Engine Securitization Ltd., Series 2006-1AW, Cl. A1, 0.631%, 9/15/416,7 | | | 1,949,726 | | | | 1,394,054 | |
| GSAMP Trust, Series 2005-HE4, Cl. M3, 0.942%, 7/25/456 | | | 1,400,000 | | | | 1,157,860 | |
| JP Morgan Mortgage Acquisition Corp., Series 2005-OPT2, Cl. M2, 0.872%, 12/25/356 | | | 1,836,000 | | | | 1,651,914 | |
| Morgan Stanley ABS Capital I, Inc. Trust, Series 2006-NC1, Cl. M1, 0.802%, 12/25/356 | | | 1,780,000 | | | | 1,508,364 | |
| New Century Home Equity Loan Trust, Series 2005-1, Cl. M2, 1.142%, 3/25/356 | | | 1,103,568 | | | | 966,251 | |
| Raspro Trust, Series 2005-1A, Cl. G, 0.97%, 3/23/246,7 | | | 2,692,368 | | | | 2,557,750 | |
| SG Mortgage Securities Trust, Series 2005- OPT1, Cl. M2, 0.872%, 10/25/356 | | | 4,250,000 | | | | 3,541,151 | |
| Total Asset-Backed Securities (Cost $18,805,466) | | | | | | | 18,354,180 | |
| | | | | | |
| Mortgage-Backed Obligation—0.5% | |
| RAMP Trust, Series 2005-RS6, Cl. M4, 1.072%, 6/25/356 (Cost $2,039,982) | | | 2,300,000 | | | | 2,009,863 | |
| | | | | | |
| Foreign Government Obligations—5.5% | |
| Brazil—3.2% | | | | | | | | |
| Federative Republic of Brazil Unsec. Bonds: | | | | | | | | |
| 13.493%, 4/1/1611 | | BRL | 22,900,000 | | | | 5,597,423 | |
| 13.495%, 7/1/1611 | | BRL | 32,000,000 | | | | 7,545,691 | |
| | | | | | | 13,143,114 | |
| | | | | | | | | |
| Japan—2.3% | | | | | | | | |
| Japan Sr. Unsec. Bonds, 0.10%, 1/15/16 | | JPY | 1,109,000,000 | | | | 9,227,061 | |
Total Foreign Government Obligations
(Cost $24,438,595) | | | | | | | 22,370,175 | |
| | | | | | |
| Non-Convertible Corporate Bonds and Notes—8.1% | |
| Activision Blizzard, Inc., 5.625% Sr. Unsec. Nts., 9/15/218 | | | 350,000 | | | | 367,500 | |
| Aeropuertos Argentina 2000 SA, 10.75% Sr. Sec. Nts., 12/1/208 | | | 140,000 | | | | 148,050 | |
| Alcatel-Lucent USA, Inc., 6.45% Sr. Unsec. Nts., 3/15/29 | | | 300,000 | | | | 304,875 | |
| Alcoa, Inc., 5.40% Sr. Unsec. Nts., 4/15/21 | | | 300,000 | | | | 292,875 | |
| Algeco Scotsman Global Finance plc, 8.50% Sr. Sec. Nts., 10/15/188 | | | 200,000 | | | | 168,500 | |
| Ally Financial, Inc., 8% Sr. Unsec. Nts., 11/1/31 | | | 350,000 | | | | 405,562 | |
| ALROSA Finance SA, 7.75% Sr. Unsec. Nts., 11/3/208 | | | 200,000 | | | | 211,175 | |
| ArcelorMittal, 6.50% Sr. Unsec. Nts., 3/1/21 | | | 300,000 | | | | 242,967 | |
| Arch Coal, Inc., 7.25% Sr. Unsec. Nts., 6/15/21 | | | 300,000 | | | | 2,940 | |
| Audatex North America, Inc., 6% Sr. Unsec. Nts., 6/15/218 | | | 350,000 | | | | 353,937 | |
| Avaya, Inc., 10.50% Sec. Nts., 3/1/218 | | | 200,000 | | | | 69,000 | |
| Banco ABC Brasil SA, 7.875% Sub. Nts., 4/8/208 | | | 200,000 | | | | 182,750 | |
| Banco BMG SA, 8.875% Sub. Nts., 8/5/208 | | | 200,000 | | | | 172,000 | |
| Banco Pan SA, 8.50% Sub. Nts., 4/23/208 | | | 100,000 | | | | 79,250 | |
9 OPPENHEIMER GLOBAL MULTI-ALTERNATIVES FUND/VA
CONSOLIDATED STATEMENT OF INVESTMENTS Continued
| | | | | | | | | | |
| | | Principal
Amount | | | Value | | | |
Non-Convertible Corporate Bonds and Notes (Continued) | | | |
| Bancolombia SA, 5.125% Unsec. Sub. Nts., 9/11/22 | | $ | 600,000 | | | $ | 578,100 | | | |
| BMC Software Finance, Inc., 8.125% Sr. Unsec. Nts., 7/15/218 | | | 350,000 | | | | 234,062 | | | |
| Bombardier, Inc., 6.125% Sr. Unsec. Nts., 1/15/238 | | | 350,000 | | | | 243,250 | | | |
| Caesars Entertainment Operating Co., Inc., 10% Sec. Nts., 12/15/184 | | | 50,000 | | | | 15,125 | | | |
| Case New Holland Industrial, Inc., 7.875% Sr. Unsec. Nts., 12/1/17 | | | 350,000 | | | | 371,875 | | | |
| CCO Holdings LLC/CCO Holdings Capital Corp.: | | | | | | | | | | |
| 5.125% Sr. Unsec. Nts., 5/1/238 | | | 200,000 | | | | 200,750 | | | |
| 6.50% Sr. Unsec. Nts., 4/30/21 | | | 250,000 | | | | 260,469 | | | |
| Cemex Finance LLC, 6% Sr. Sec. Nts., 4/1/248 | | | 550,000 | | | | 473,000 | | | |
| CenturyLink, Inc., 5.80% Sr. Unsec. Nts., 3/15/22 | | | 350,000 | | | | 322,087 | | | |
| Cequel Communications Holdings I LLC/Cequel Capital Corp., 6.375% Sr. Unsec. Nts., 9/15/208 | | | 250,000 | | | | 245,312 | | | |
| CHC Helicopter SA, 9.25% Sr. Sec. Nts., 10/15/20 | | | 90,000 | | | | 43,650 | | | |
| CHS/Community Health Systems, Inc., 8% Sr. Unsec. Nts., 11/15/19 | | | 350,000 | | | | 354,375 | | | |
| CIT Group, Inc., 4.25% Sr. Unsec. Nts., 8/15/17 | | | 400,000 | | | | 410,000 | | | |
| Claire’s Stores, Inc., 9% Sr. Sec. Nts., 3/15/198 | | | 200,000 | | | | 122,000 | | | |
| Clear Channel Worldwide Holdings, Inc., 6.50% Sr. Unsec. Nts., 11/15/22 | | | 300,000 | | | | 293,625 | | | |
| Colombia Telecomunicaciones SA ESP: | | | | | | | | | | |
| 5.375% Sr. Unsec. Nts., 9/27/228 | | | 250,000 | | | | 226,250 | | | |
| 8.50% Sub. Perpetual Bonds6,8,9 | | | 500,000 | | | | 431,250 | | | |
| Columbus International, Inc., 7.375% Sr. Unsec. Nts., 3/30/218 | | | 400,000 | | | | 397,500 | | | |
| Concho Resources, Inc., 5.50% Sr. Unsec. Unsub. Nts., 4/1/23 | | | 300,000 | | | | 279,000 | | | |
| CONSOL Energy, Inc., 5.875% Sr. Unsec. Nts., 4/15/22 | | | 350,000 | | | | 218,750 | | | |
| CorpGroup Banking SA, 6.75% Sr. Unsec. Nts., 3/15/238 | | | 250,000 | | | | 232,187 | | | |
| Cosan Luxembourg SA, 5% Sr. Unsec. Nts., 3/14/238 | | | 250,000 | | | | 206,562 | | | |
| Country Garden Holdings Co. Ltd., 7.875% Sr. Unsec. Nts., 5/27/198 | | | 200,000 | | | | 215,183 | | | |
| Crimson Merger Sub, Inc., 6.625% Sr. Unsec. Nts., 5/15/228 | | | 400,000 | | | | 275,000 | | | |
| Crown Castle International Corp., 5.25% Sr. Unsec. Nts., 1/15/23 | | | 350,000 | | | | 369,250 | | | |
| CSN Resources SA, 6.50% Sr. Unsec. Nts., 7/21/208 | | | 300,000 | | | | 149,250 | | | |
| DaVita HealthCare Partners, Inc.: | | | | | | | | | | |
| 5.125% Sr. Unsec. Nts., 7/15/24 | | | 550,000 | | | | 551,031 | | | |
| 5.75% Sr. Unsec. Nts., 8/15/22 | | | 200,000 | | | | 206,750 | | | |
| Denali Borrower LLC/Denali Finance Corp., 5.625% Sr. Sec. Nts., 10/15/208 | | | 250,000 | | | | 262,500 | | | |
| Denbury Resources, Inc.: | | | | | | | | | | |
| 4.625% Sr. Sub. Nts., 7/15/23 | | | 100,000 | | | | 32,688 | | | |
| 5.50% Sr. Sub. Nts., 5/1/22 | | | 100,000 | | | | 33,698 | | | |
| Digicel Group Ltd., 8.25% Sr. Unsec. Nts., 9/30/208 | | | 200,000 | | | | 166,000 | | | |
| DISH DBS Corp., 5.875% Sr. Unsec. Nts., 7/15/22 | | | 350,000 | | | | 327,250 | | | |
| Dynegy, Inc., 6.75% Sr. Unsec. Nts., 11/1/19 | | | 250,000 | | | | 236,250 | | | |
| Elementia SAB de CV, 5.50% Sr. Unsec. Nts., 1/15/258 | | | 250,000 | | | | 230,000 | | | |
| Energy Transfer Equity LP, 7.50% Sr. Sec. Nts., 10/15/20 | | | 350,000 | | | | 325,500 | | | |
| | | | | | | | |
| | | Principal
Amount | | | Value | |
Non-Convertible Corporate Bonds and Notes (Continued) | |
| EP Energy LLC/Everest Acquisition Finance, Inc., 9.375% Sr. Unsec. Nts., 5/1/20 | | $ | 350,000 | | | $ | 224,875 | |
| Evergrande Real Estate Group Ltd., 8.75% Sr. Unsec. Nts., 10/30/188 | | | 200,000 | | | | 203,600 | |
| Evraz Group SA, 6.50% Sr. Unsec. Nts., 4/22/208 | | | 250,000 | | | | 235,000 | |
| First Quantum Minerals Ltd.: | | | | | | | | |
| 6.75% Sr. Unsec. Nts., 2/15/208 | | | 28,000 | | | | 18,200 | |
| 7.00% Sr. Unsec. Nts., 2/15/218 | | | 128,000 | | | | 80,960 | |
| FirstEnergy Corp., 7.375% Sr. Unsec. Nts., 11/15/31 | | | 250,000 | | | | 305,243 | |
| FMG Resources August 2006 Pty Ltd., 8.25% Sr. Unsec. Nts., 11/1/198 | | | 300,000 | | | | 239,250 | |
| Frontier Communications Corp., 8.50% Sr. Unsec. Nts., 4/15/20 | | | 250,000 | | | | 251,250 | |
| Gazprom OAO Via Gaz Capital SA, 4.95% Sr. Unsec. Nts., 7/19/228 | | | 250,000 | | | | 234,934 | |
| Goldman Sachs Capital II, 4% Jr. Sub. Perpetual Bonds6,9 | | | 166,000 | | | | 117,445 | |
| Halcon Resources Corp., 8.875% Sr. Unsec. Nts., 5/15/21 | | | 350,000 | | | | 103,250 | |
| HD Supply, Inc., 7.50% Sr. Unsec. Nts., | | | | | | | | |
| 7/15/20 | | | 200,000 | | | | 209,000 | |
| Hexion, Inc., 8.875% Sr. Sec. Nts., 2/1/18 | | | 300,000 | | | | 213,000 | |
Hilton Worldwide Finance LLC/Hilton Worldwide Finance Corp., 5.625% Sr. Unsec.
Nts., 10/15/21 | | | 250,000 | | | | 260,312 | |
HUB International Ltd., 7.875% Sr. Unsec.
Nts., 10/1/218 | | | 250,000 | | | | 225,625 | |
| Icahn Enterprises LP/Icahn Enterprises Finance Corp., 5.875% Sr. Unsec. Nts., 2/1/22 | | | 350,000 | | | | 343,438 | |
| ICICI Bank Ltd., 6.375% Jr. Sub. Nts., 4/30/226,8 | | | 200,000 | | | | 205,648 | |
iHeartCommunications, Inc., 9% Sr. Sec.
Nts., 3/1/21 | | | 350,000 | | | | 245,437 | |
| Intelsat Jackson Holdings SA, 7.25% Sr. Unsec. Nts., 10/15/20 | | | 300,000 | | | | 262,500 | |
| Intercorp Peru Ltd., 5.875% Sr. Unsec. Nts., 2/12/258 | | | 250,000 | | | | 238,750 | |
| International Game Technology plc, 6.25% Sr. Sec. Nts., 2/15/228 | | | 300,000 | | | | 282,000 | |
| International Lease Finance Corp., 8.75% Sr. Unsec. Nts., 3/15/17 | | | 300,000 | | | | 320,250 | |
| Intesa Sanpaolo SpA, 5.017% Sub. Nts., 6/26/248 | | | 300,000 | | | | 295,808 | |
| Kaisa Group Holdings Ltd., 8.875% Sr. Unsec. Nts., 3/19/184,8 | | | 200,000 | | | | 138,750 | |
| Kinetic Concepts, Inc./KCI USA, Inc., 10.50% Sec. Nts., 11/1/18 | | | 400,000 | | | | 391,000 | |
| Laureate Education, Inc., 9.25% Sr. Unsec. Nts., 9/1/198 | | | 400,000 | | | | 249,500 | |
| Linn Energy LLC/Linn Energy Finance Corp., 8.625% Sr. Unsec. Nts., 4/15/20 | | | 250,000 | | | | 44,063 | |
| Lukoil International Finance BV, 6.125% Sr. Unsec. Nts., 11/9/208 | | | 904,000 | | | | 921,989 | |
| Marfrig Holdings Europe BV, 6.875% Sr. Unsec. Nts., 6/24/198 | | | 200,000 | | | | 179,000 | |
| MGM Resorts International, 7.75% Sr. | | | | | | | | |
| Unsec. Nts., 3/15/22 | | | 250,000 | | | | 266,563 | |
| MHP SA, 8.25% Sr. Unsec. Nts., 4/2/208 | | | 200,000 | | | | 174,000 | |
| Millicom International Cellular SA, 6% Sr. Unsec. Nts., 3/15/258 | | | 250,000 | | | | 213,750 | |
| Minerva Luxembourg SA, 7.75% Sr. Unsec. Nts., 1/31/238 | | | 250,000 | | | | 236,250 | |
| MMC Energy. Inc., 8.875% Sr. Unsec. Nts., 10/15/204,5 | | | 100,000 | | | | 0 | |
10 OPPENHEIMER GLOBAL MULTI-ALTERNATIVES FUND/VA
| | | | | | | | | | |
| | | Principal
Amount | | | Value | | | |
Non-Convertible Corporate Bonds and Notes (Continued) | | | |
| Mobile Telesystems OJSC via MTS International Funding Ltd., 5% Sr. Unsec. Nts., 5/30/238 | | $ | 200,000 | | | $ | 185,500 | | | |
| Momentive Performance Materials, Inc., 3.88% Sr. Sec. Nts., 10/24/21 | | | 200,000 | | | | 139,000 | | | |
| Moon Wise Global Ltd., 9% Sub. Perpetual Bonds6,9 | | | 250,000 | | | | 270,793 | | | |
| Navient Corp., 8.45% Sr. Unsec. Nts., 6/15/18 | | | 250,000 | | | | 263,750 | | | |
| Navistar International Corp., 8.25% Sr. Unsec. Nts., 11/1/21 | | | 250,000 | | | | 172,500 | | | |
| NGPL PipeCo LLC, 7.119% Sr. Sec. Nts., 12/15/178 | | | 350,000 | | | | 327,250 | | | |
| Nielsen Finance LLC/Nielsen Finance Co., 5% Sr. Unsec. Nts., 4/15/228 | | | 350,000 | | | | 346,938 | | | |
| Nord Gold NV, 6.375% Sr. Unsec. Nts., 5/7/188 | | | 250,000 | | | | 252,262 | | | |
| Novelis, Inc., 8.75% Sr. Unsec. Nts., 12/15/20 | | | 350,000 | | | | 322,875 | | | |
| Numericable SFR SAS, 6% Sr. Sec. Nts., 5/15/228 | | | 400,000 | | | | 389,000 | | | |
| OAS Financial Ltd., 8% Sr. Unsec. Nts., 7/2/214,8 | | | 200,000 | | | | 11,000 | | | |
| Offshore Group Investment Ltd., 7.50% Sr. Sec. Nts., 11/1/194 | | | 250,000 | | | | 56,250 | | | |
| Pacific Exploration & Production Corp., 5.375% Sr. Unsec. Nts., 1/26/198 | | | 400,000 | | | | 78,000 | | | |
| Petrobras Global Finance BV, 5.375% Sr. Unsec. Nts., 1/27/21 | | | 100,000 | | | | 74,750 | | | |
| Petroleos de Venezuela SA, 12.75% Sr. Unsec. Nts., 2/17/228 | | | 200,000 | | | | 91,000 | | | |
| Post Holdings, Inc., 7.375% Sr. Unsec. Nts., 2/15/22 | | | 400,000 | | | | 418,500 | | | |
| Reynolds Group Issuer, Inc./Reynolds Group Issuer LLC/Reynolds Group Issuer Luxembourg SA, 5.75% Sr. Sec. Nts., 10/15/20 | | | 350,000 | | | | 356,892 | | | |
| Royal Bank of Scotland Group plc, 6.125% Sub. Nts., 12/15/22 | | | 250,000 | | | | 272,565 | | | |
| Sabine Pass Liquefaction LLC, 5.625% Sr. Sec. Nts., 2/1/21 | | | 300,000 | | | | 277,500 | | | |
| Samson Investment Co., 9.75% Sr. Unsec. Nts., 2/15/204 | | | 300,000 | | | | 675 | | | |
| SandRidge Energy, Inc., 7.51% Sr. Unsec. Nts., 3/15/21 | | | 500,000 | | | | 55,000 | | | |
| Scientific Games International, Inc., 10% Sr. Unsec. Nts., 12/1/22 | | | 250,000 | | | | 178,750 | | | |
| Sirius XM Radio, Inc., 6% Sr. Unsec. Nts., 7/15/248 | | | 350,000 | | | | 366,625 | | | |
| Sistema JSFC via Sistema International Funding SA, 6.95% Sr. Unsec. Nts., 5/17/198 | | | 200,000 | | | | 202,900 | | | |
| SoftBank Group Corp., 4.50% Sr. Unsec. Nts., 4/15/208 | | | 200,000 | | | | 199,500 | | | |
| Springleaf Finance Corp., 6.90% Sr. Unsec. Nts., 12/15/17 | | | 400,000 | | | | 415,000 | | | |
| Sprint Corp., 7.875% Sr. Unsec. Nts., 9/15/23 | | | 350,000 | | | | 263,725 | | | |
| Suzano Trading Ltd., 5.875% Sr. Unsec. Nts., 1/23/218 | | | 250,000 | | | | 243,125 | | | |
| Talen Energy Supply LLC, 5.125% Sr. Unsec. Nts., 7/15/198 | | | 250,000 | | | | 188,750 | | | |
| Tenet Healthcare Corp., 8.125% Sr. Unsec. Nts., 4/1/22 | | | 400,000 | | | | 401,000 | | | |
| T-Mobile USA, Inc., 6.625% Sr. Unsec. Nts., 4/1/23 | | | 350,000 | | | | 357,875 | | | |
TransDigm, Inc., 6.50% Sr. Sub. Nts., 7/15/24 | | | 350,000 | | | | 349,825 | | | |
| | | | | | | | | | |
| | | | | | | | | | |
| | | | | | | | | | |
| | | | | | | | | | |
| | | | | | | | | | |
| | | | | | | | | | |
| | | | | | | | | | |
| | | | | | | | | | |
| | | | | | | | |
| | | Principal
Amount | | | Value | |
Non-Convertible Corporate Bonds and Notes (Continued) | |
| Turk Telekomunikasyon AS, 4.875% Sr. Unsec. Nts., 6/19/248 | | $ | 200,000 | | | $ | 189,872 | |
| Turkiye Sise ve Cam Fabrikalari AS, 4.25% Sr. Unsec. Nts., 5/9/208 | | | 200,000 | | | | 192,500 | |
| United Rentals North America, Inc., 7.625% Sr. Unsec. Nts., 4/15/22 | | | 400,000 | | | | 429,480 | |
| Valeant Pharmaceuticals International, Inc., 6.375% Sr. Unsec. Nts., 10/15/208 | | | 400,000 | | | | 388,000 | |
| Vedanta Resources plc, 6% Sr. Unsec. Nts., 1/31/198 | | | 200,000 | | | | 127,587 | |
| VimpelCom Holdings BV, 7.504% Sr. Unsec. Nts., 3/1/228 | | | 350,000 | | | | 351,750 | |
| VTR Finance BV, 6.875% Sr. Sec. Nts., 1/15/248 | | | 400,000 | | | | 369,000 | |
| Wachovia Capital Trust III, 5.57% Jr. Sub. Perpetual Bonds6,9 | | | 1,667,000 | | | | 1,607,822 | |
| Williams Cos., Inc. (The), 4.55% Sr. Unsec. Nts., 6/24/24 | | | 350,000 | | | | 243,614 | |
| Williams Partners LP/ACMP Finance Corp., 4.875% Sr. Unsec. Nts., 5/15/23 | | | 350,000 | | | | 284,178 | |
| Wind Acquisition Finance SA, 7.375% Sec. Nts., 4/23/218 | | | 400,000 | | | | 379,000 | |
| Wynn Macau Ltd., 5.25% Sr. Unsec. Nts., 10/15/218 | | | 200,000 | | | | 177,000 | |
| Yapi ve Kredi Bankasi AS, 6.75% Sr. Unsec. Nts., 2/8/178 | | | 200,000 | | | | 207,592 | |
| YPF SA, 8.50% Sr. Unsec. Nts., 7/28/258 | | | 250,000 | | | | 239,375 | |
Total Non-Convertible Corporate Bonds and Notes
(Cost $38,217,227) | | | | | | | 33,187,395 | |
| | | | | | | |
Convertible Corporate Bonds and Notes—0.5% | |
| Clearwire Communications LLC/Clearwire Finance, Inc., 8.25% Cv. Sr. Unsec. Nts., 12/1/408 | | | 1,750,000 | | | | 1,754,375 | |
| SEACOR Holdings, Inc., 2.50% Cv. Sr. Unsec. Nts., 12/15/27 | | | 434,000 | | | | 411,215 | |
Total Convertible Corporate Bonds and Notes (Cost $2,319,586) | | | | | | | 2,165,590 | |
| | | | | | | |
Corporate Loans—5.2% | |
| AZ Chem US, Inc., Sr. Sec. Credit Facilities 1st Lien Term Loan, 4.50%, 6/10/216 | | | 3,936,778 | | | | 3,932,676 | |
| Celanese US Holdings LLC, Sr. Sec. Credit Facilities 1st Lien Term Loan, 2.449%, 10/31/186 | | | 1,209,688 | | | | 1,213,972 | |
| Dynegy, Inc., Sr. Sec. Credit Facilities 1st Lien Term Loan, 4.00%, 4/23/206 | | | 4,035,499 | | | | 3,911,912 | |
| Energy Future Intermediate Holding Co. LLC, Sr. Sec. Credit Facilities 1st Lien Term Loan, Debtor in Possession, 4.25%, 6/20/166 | | | 4,200,000 | | | | 4,192,780 | |
| Intelsat Jackson Holdings SA, Sr. Sec. Credit Facilities 1st Lien Term Loan, 3.75%, 6/30/196 | | | 4,000,000 | | | | 3,794,000 | |
| International Lease Finance Corp., Sr. Sec. Credit Facilities Term Loan, 3.50%, 2/26/216 | | | 4,030,000 | | | | 4,020,429 | |
| Total Corporate Loans (Cost $21,448,211) | | | | | | | 21,065,769 | |
| | | | | | | |
Event-Linked Bonds—14.1% | |
| Earthquake—3.6% | | | | | | | | |
| Acorn Re Ltd. Catastrophe Linked Nts., 3.663%, 7/17/186,7 | | | 750,000 | | | | 758,587 | |
| Azzurro RE I Ltd. Catastrophe Linked Nts., 2.15%, 1/16/196,8 | | EUR | 800,000 | | | | 868,878 | |
| Bosphorus Ltd. Catastrophe Linked Nts., 3.735%, 8/17/186,7 | | | 500,000 | | | | 492,525 | |
| Bosphorus Re Ltd. Catastrophe Linked Nts., 2.653%, 5/3/166,8 | | | 650,000 | | | | 647,611 | |
11 OPPENHEIMER GLOBAL MULTI-ALTERNATIVES FUND/VA
CONSOLIDATED STATEMENT OF INVESTMENTS Continued
| | | | | | | | | | |
| | | Principal | | | | | | |
| | | Amount | | | Value | | | |
Earthquake (Continued) | | | |
| Golden State RE II Ltd. Catastrophe Linked Nts., 2.353%, 1/8/196,8 | | $ | 1,000,000 | | | $ | 996,550 | | | |
| Kilimanjaro Re Ltd. Catastrophe Linked Nts., 3.908%, 11/25/196,8 | | | 250,000 | | | | 248,612 | | | |
| Kizuna Re II Ltd. Catastrophe Linked Nts.: | | | | | | | | | | |
| 2.00%, 4/5/196,7 | | | JPY 127,500,000 | | | | 1,063,269 | | | |
| 2.408%, 4/6/186,8 | | | 950,000 | | | | 954,607 | | | |
| 2.658%, 4/6/186,7 | | | 750,000 | | | | 754,837 | | | |
| Lakeside Re III Ltd. Catastrophe Linked Nts., 8.158%, 1/8/166,8 | | | 250,000 | | | | 250,681 | | | |
| Merna Re V Ltd. Catastrophe Linked Nts., 2.153%, 4/7/176,8 | | | 750,000 | | | | 751,162 | | | |
| Merna Reinsurance IV Ltd. Catastrophe Linked Nts., 2.653%, 4/8/166,7 | | | 750,000 | | | | 752,119 | | | |
| Merna Reinsurance Ltd. Catastrophe Linked Nts., 2.153%, 4/9/186,8 | | | 500,000 | | | | 500,175 | | | |
| Nakama Re Ltd. Catastrophe Linked Nts.: | | | | | | | | | | |
| 2.278%, 1/16/196,7 | | | 750,000 | | | | 749,063 | | | |
| 2.403%, 4/13/186,7 | | | 500,000 | | | | 498,825 | | | |
| 2.653%, 4/13/186,8 | | | 750,000 | | | | 747,638 | | | |
| 2.903%, 9/29/166,8 | | | 750,000 | | | | 752,794 | | | |
| 3.028%, 1/16/206,7 | | | 500,000 | | | | 498,875 | | | |
| 3.028%, 1/14/216,8 | | | 250,000 | | | | 250,000 | | | |
| 3.403%, 1/14/216,8 | | | 250,000 | | | | 250,025 | | | |
| Tramline Re II Ltd. Catastrophe Linked Nts., 3.403%, 7/7/176,8 | | | 250,000 | | | | 248,038 | | | |
| Ursa Re Ltd. Catastrophe Linked Nts.: | | | | | | | | | | |
| 3.50%, 12/7/176,8 | | | 750,000 | | | | 744,863 | | | |
| 5.00%, 12/7/17-9/21/186,7 | | | 750,000 | | | | 750,788 | | | |
| | | | | | | 14,530,522 | | | |
Longevity—0.2% | | | | | | | |
| Vita Capital V Ltd. Catastrophe Linked Nts., 3.563%, 1/15/176,8 | | | 750,000 | | | | 758,813 | | | |
| Vita Capital VI Ltd. Catastrophe Linked Nts., 2.90%, 1/8/216,8 | | | 250,000 | | | | 250,325 | | | |
| | | | | | | 1,009,138 | | | |
Multiple Event—5.4% | | | | | | | |
| Atlas IX Capital DAC Catastrophe Linked Nts., 8.08%, 1/8/206,8,10 | | | 250,000 | | | | 250,025 | | | |
| Atlas IX Capital Ltd. Catastrophe Linked Nts.: | | | | | | | | | | |
| 3.802%, 1/17/196,8 | | | 500,000 | | | | 510,925 | | | |
| 7.447%, 1/7/196,8 | | | 250,000 | | | | 250,887 | | | |
| Atlas Reinsurance VII Ltd. Catastrophe Linked Nts., 8.202%, 1/7/166,8 | | | 250,000 | | | | 250,631 | | | |
| Blue Danube II Ltd. Catastrophe Linked | | | | | | | | | | |
| Nts., 4.562%, 5/23/166,8 | | | 900,000 | | | | 900,382 | | | |
| Caelus Re 2013 Ltd. Catastrophe Linked Nts.: | | | | | | | | | | |
| 5.403%, 3/7/166,8 | | | 250,000 | | | | 250,681 | | | |
| 7.003%, 4/7/176,8 | | | 500,000 | | | | 513,225 | | | |
| Citrus Re Ltd. Catastrophe Linked Nts.: | | | | | | | | | | |
| 4.438%, 4/24/176,8 | | | 750,000 | | | | 752,812 | | | |
| 4.618%, 4/18/176,8 | | | 750,000 | | | | 750,487 | | | |
| Cranberry Re Ltd. Catastrophe Linked Nts., 3.958%, 7/6/186,8 | | | 500,000 | | | | 508,875 | | | |
| East Lane Re VI Ltd. Catastrophe Linked Nts.: | | | | | | | | | | |
| 2.903%, 3/14/186,8 | | | 750,000 | | | | 744,037 | | | |
| 3.903%, 3/13/206,8 | | | 500,000 | | | | 500,725 | | | |
| Galileo Re Ltd. Catastrophe Linked Nts.: | | | | | | | | | | |
| 7.553%, 1/9/176,8 | | | 250,000 | | | | 252,687 | | | |
| 13.653%, 1/8/186,8 | | | 500,000 | | | | 517,125 | | | |
| Kilimanjaro Re Ltd. Catastrophe Linked Nts.: | | | | | | | | | | |
| 4.658%, 4/30/186,8 | | | 500,000 | | | | 495,275 | | | |
| 4.908%, 4/30/186,8 | | | 500,000 | | | | 498,825 | | | |
| 9.408%, 12/6/196,8 | | | 750,000 | | | | 755,737 | | | |
| Loma Reinsurance Ltd. Catastrophe Linked Nts.: | | | | | | | | | | |
| 10.718%, 1/8/186,8 | | | 200,000 | | | | 207,110 | | | |
| 16.648%, 1/8/186,8 | | | 500,000 | | | | 522,175 | | | |
| | | | | | | | |
| | | Principal | | | | |
| | | Amount | | | Value | |
Multiple Event (Continued) | |
| Longpoint Re Ltd. III Catastrophe Linked Nts., 3.75%, 5/23/186,8 | | $ | 500,000 | | | $ | 506,925 | |
| Mythen Re Ltd. Catastrophe Linked Nts., 9.033%, 1/5/176,8 | | | 250,000 | | | | 257,962 | |
| PennUnion Re Ltd. Catastrophe Linked Nts., 4.663%, 12/7/186,8 | | | 500,000 | | | | 499,775 | |
| Queen Street VII Re Ltd. Catastrophe Linked Nts., 8.758%, 4/8/166,8 | | | 250,000 | | | | 251,931 | |
| Residential Reinsurance 2012 Ltd. Catastrophe Linked Nts.: | | | | | | | | |
| 4.653%, 12/6/166,8 | | | 1,499,000 | | | | 1,513,465 | |
| 5.903%, 12/6/166,8 | | | 250,000 | | | | 254,212 | |
| 8.153%, 6/6/166,8 | | | 500,000 | | | | 511,075 | |
| 12.903%, 12/6/166,8 | | | 250,000 | | | | 261,762 | |
| 19.153%, 12/6/166,8 | | | 250,000 | | | | 266,263 | |
| 22.153%, 6/6/166,8 | | | 250,000 | | | | 266,406 | |
| Residential Reinsurance 2013 Ltd. Catastrophe Linked Nts.: | | | | | | | | |
| 5.403%, 12/6/176,8 | | | 500,000 | | | | 498,875 | |
| 8.153%, 6/6/176,8 | | | 250,000 | | | | 259,763 | |
| 20.153%, 12/6/176,8 | | | 250,000 | | | | 258,038 | |
| Residential Reinsurance 2014 Ltd. Catastrophe Linked Nts.: | | | | | | | | |
| 3.653%, 6/6/186,8 | | | 500,000 | | | | 502,525 | |
| 4.953%, 12/6/186,8 | | | 250,000 | | | | 245,313 | |
| 15.153%, 6/6/186,8 | | | 500,000 | | | | 509,775 | |
| Residential Reinsurance 2015 Ltd. Catastrophe Linked Nts.: | | | | | | | | |
| 7.403%, 12/6/196,8 | | | 250,000 | | | | 249,813 | |
| 11.153%, 6/6/196,8 | | | 250,000 | | | | 253,038 | |
| Riverfront Re Ltd. Catastrophe Linked Nts., 4.153%, 1/6/176,8 | | | 500,000 | | | | 496,325 | |
| Sanders Re Ltd. Catastrophe Linked Nts.: | | | | | | | | |
| 3.153%, 5/25/186,8 | | | 250,000 | | | | 245,088 | |
| 3.393%, 5/25/186,8 | | | 750,000 | | | | 734,138 | |
| 3.993%, 6/7/176,8 | | | 250,000 | | | | 250,288 | |
| 4.013%, 5/28/196,8 | | | 500,000 | | | | 487,825 | |
| Tradewynd Re Ltd. Catastrophe Linked Nts.: | | | | | | | | |
| 5.00%, 1/8/186,8 | | | 500,000 | | | | 502,275 | |
| 6.133%, 1/9/176,8 | | | 500,000 | | | | 507,125 | |
| 6.693%, 1/9/176,8 | | | 250,000 | | | | 253,963 | |
| 7.00%, 1/8/186,8 | | | 250,000 | | | | 254,288 | |
| 9.013%, 7/9/186,8 | | | 250,000 | | | | 274,013 | |
| Tramline Re II Ltd. Catastrophe Linked Nts., 9.903%, 1/4/196,8 | | | 400,000 | | | | 409,060 | |
| VenTerra Re Ltd. Catastrophe Linked Nts., 3.903%, 1/9/176,8 | | | 750,000 | | | | 751,688 | |
| | | | | | | 21,965,618 | |
Other—0.4% | | | | | | | | |
| Benu Capital Ltd. Catastrophe Linked Nts.: | | | | | | | | |
| 2.55%, 1/8/206,8 | | EUR | 250,000 | | | | 272,774 | |
| 3.35%, 1/8/206,8 | | EUR | 500,000 | | | | 545,983 | |
| Vitality Re IV Ltd. Catastrophe Linked Nts., 3.903%, 1/9/176,8 | | | 250,000 | | | | 254,437 | |
| Vitality Re V Ltd. Catastrophe Linked Nts., 2.653%, 1/7/196,7 | | | 250,000 | | | | 252,288 | |
| Vitality Re VI Ltd. Catastrophe Linked Nts., 2.253%, 1/8/186,7 | | | 250,000 | | | | 250,338 | |
| | | | | | | 1,575,820 | |
Windstorm—4.5% | | | | | | | | |
| Akibare II Ltd. Catastrophe Linked Nts., 3.903%, 4/13/166,8 | | | 1,125,000 | | | | 1,132,116 | |
| Alamo Re Ltd. Catastrophe Linked Nts.: | | | | | | | | |
| 4.753%, 6/7/196,8 | | | 750,000 | | | | 769,462 | |
| 5.393%, 6/7/176,8 | | | 500,000 | | | | 511,825 | |
| 6.053%, 6/7/186,8 | | | 500,000 | | | | 513,925 | |
| Aozora Re Ltd. Catastrophe Linked Nts., 2.163%, 4/7/176,8 | | JPY | 91,000,000 | | | | 753,393 | |
| Armor Re Ltd. Catastrophe Linked Nts., 4.233%, 12/15/166,8 | | | 1,000,000 | | | | 1,001,025 | |
| Atlas Reinsurance VII Ltd. Catastrophe Linked Nts., 3.65%, 1/7/166,8 | | EUR | 250,000 | | | | 271,497 | |
12 OPPENHEIMER GLOBAL MULTI-ALTERNATIVES FUND/VA
| | | | | | | | | | |
| | | Principal | | | | | | |
| | | Amount | | | Value | | | |
Windstorm (Continued) | | | |
| Calypso Capital II Ltd. Catastrophe Linked Nts., 2.60%, 1/9/176,8 | | EUR | 500,000 | | | $ | 545,494 | | | |
| Citrus Re Ltd. Catastrophe Linked Nts.: | | | | | | | | | | |
| 5.048%, 4/9/186,8 | | | 500,000 | | | | 501,375 | | | |
| 9.638%, 4/9/186,8 | | | 250,000 | | | | 254,587 | | | |
| East Lane Re V Ltd. Catastrophe Linked Nts., 10.903%, 3/16/166,8 | | | 250,000 | | | | 254,631 | | | |
| Eurus Ltd. Catastrophe Linked Nts., 3.75%, 4/7/166,8 | | EUR | 250,000 | | | | 271,171 | | | |
| Everglades Re II Ltd. Catastrophe Linked Nts., 5.303%, 5/3/186,8 | | | 750,000 | | | | 761,212 | | | |
| Everglades Re Ltd. Catastrophe Linked Nts.: | | | | | | | | | | |
| 7.603%, 4/28/176,8 | | | 750,000 | | | | 772,837 | | | |
| 9.633%, 3/28/166,8 | | | 625,000 | | | | 637,281 | | | |
| Gator Re Ltd. Catastrophe Linked Nts., 6.833%, 1/9/176,8 | | | 1,000,000 | | | | 965,150 | | | |
| Green Fields II Capital Ltd. Catastrophe Linked Nts., 2.75%, 1/9/176,8 | | EUR | 750,000 | | | | 818,078 | | | |
| Ibis Re II Ltd. Catastrophe Linked Nts., 4.153%, 6/28/166,8 | | | 270,000 | | | | 272,572 | | | |
| Lion I Re Ltd. Catastrophe Linked Nts., 2.36%, 4/28/176,8 | | EUR | 750,000 | | | | 815,062 | | | |
| Longpoint Re Ltd. III Catastrophe Linked Nts., 4.358%, 5/18/166,8 | | | 500,000 | | | | 503,862 | | | |
| Manatee Re Ltd. Catastrophe Linked Nts., 5.158%, 12/22/176,8 | | | 750,000 | | | | 753,263 | | | |
| MetroCat Re Ltd. Catastrophe Linked Nts., 4.653%, 8/5/166,8 | | | 500,000 | | | | 508,363 | | | |
| MultiCat Mexico Ltd. 2012-I Catastrophe Linked Nts., 7.653%, 2/4/166,7 | | | 750,000 | | | | 159,844 | | | |
| Mythen Re Ltd. Catastrophe Linked Nts., 12.263%, 11/10/166,8 | | | 500,000 | | | | 514,313 | | | |
| Pelican III Re Ltd. Catastrophe Linked Nts., 6.163%, 4/16/186,8 | | | 750,000 | | | | 754,988 | | | |
| Pelican Re Ltd. Catastrophe Linked Nts., 6.163%, 5/15/176,8 | | | 500,000 | | | | 513,925 | | | |
| Queen City Re Catastrophe Linked Nts., 3.658%, 1/6/176,8 | | | 1,000,000 | | | | 991,850 | | | |
| Queen Street IX Re Ltd. Catastrophe Linked Nts., 5.658%, 6/8/176,8 | | | 250,000 | | | | 248,638 | | | |
| Queen Street VIII Re Ltd. Catastrophe Linked Nts., 6.658%, 6/8/166,8 | | | 500,000 | | | | 499,463 | | | |
| Queen Street X RE Ltd. Catastrophe Linked Nts., 5.908%, 6/8/186,8 | | | 250,000 | | | | 249,263 | | | |
| Queen Street XI RE Dac Catastrophe Linked Nts., 6.308%, 6/7/196,8 | | | 250,000 | | | | 250,125 | | | |
| | | | | | | | |
| | | Principal | | | | |
| | | Amount | | | Value | |
Windstorm (Continued) | |
| Tar Heel Re Ltd. Catastrophe Linked Nts., 8.653%, 5/9/166,8 | | $ | 500,000 | | | $ | 512,325 | |
| | | | | | | 18,282,915 | |
Total Event-Linked Bonds (Cost $58,430,554) | | | | | | | 57,364,013 | |
| | |
| | | Shares | | | | |
Structured Security—0.2% | |
| Merrill Lynch International & Co. CV, Macy’s, Inc. Equity Linked Nts., 2/10/168 (Cost $910,019) | | | 19,449 | | | | 688,365 | |
| | |
| | | Principal | | | | |
| | | Amount | | | | |
Short-Term Notes—21.1% | |
France—1.5% | | | | | | | | |
| French Republic Treasury Bills, -0.188%, 8/18/1611 | | EUR | 5,600,000 | | | | 6,100,996 | |
| | | | | | | |
Italy—2.6% | | | | | | | | |
| Italian Republic Buoni Ordinari del Tesoro BOT: | | | | | | | | |
| -0.038%, 10/14/1611 | | EUR | 5,500,000 | | | | 5,976,258 | |
| -0.001%, 9/14/1611 | | EUR | 4,400,000 | | | | 4,780,418 | |
| | | | | | | 10,756,676 | |
| | | | | | | |
Mexico—1.3% | | | | | | | | |
| United Mexican States Treasury Bills, | | | | | | | | |
| 3.31%, 1/7/1611 | | MXN | 90,300,000 | | | | 5,236,706 | |
| | | | | | | |
Sweden—2.1% | | | | | | | | |
| Kingdom of Sweden Treasury Bills, -0.55%, | | | | | | | | |
| 2/17/1611 | | SEK | 74,000,000 | | | | 8,772,567 | |
| | | | | | | |
United States—13.6% | | | | | | | | |
| United States Treasury Bills, 0.185%, 3/10/1611,12,13 | | USD | 55,450,000 | | | | 55,438,633 | |
| Total Short-Term Notes (Cost $87,324,865) | | | | | | | 86,305,578 | |
| | | Shares | | | | |
Investment Companies—6.5% | |
| Oppenheimer Institutional Money Market Fund, Cl. E, 0.30%14,15,16 | | | 23,203,584 | | | | 23,203,584 | |
| SPDR Gold Trust Exchange Traded Fund2,16 | | | 30,981 | | | | 3,143,332 | |
| Total Investment Companies (Cost $26,808,376) | | | | | | | 26,346,916 | |
| | | | | | | | | | | | | | | | | | | | | | | | | | | | |
| | | | | | | | | Exercise Price | | | Expiration
Date | | | | | | Contracts | | | | |
Exchange-Traded Options Purchased—0.0% | | | | | |
| PowerShares Senior Loan Exchange Traded Fund Put2 | | | | USD | | | | 22.000 | | | | 2/19/16 | | | | USD | | | | 3,810 | | | | 104,775 | |
| S&P 500 Index Call2 | | | | USD | | | | 2,090.000 | | | | 1/15/16 | | | | USD | | | | 94 | | | | 45,590 | |
| Total Exchange-Traded Options Purchased (Cost $380,625) | | | | | | | | | | | | | | | | | | | | | | | | 150,365 | |
| | | | | | | |
| | | Counterparty | | | | | | | | | | | | | | | | | | | |
Over-the-Counter Options Purchased—0.3% | | | | | |
AUD Currency Call2,17 | | | BOA | | | | NZD | | | | 1.080 | | | | 1/22/16 | | | | AUD | | | | 45,500,000 | | | | 82,194 | |
CHF Currency Put2,18 | | | BOA | | | | JPY | | | | 110.000 | | | | 11/24/16 | | | | CHF | | | | 906,600 | | | | 101,011 | |
CNH Currency Put2 | | | GSG | | | | CNH | | | | 6.388 | | | | 7/13/16 | | | | CNH | | | | 32,500,000 | | | | 267,670 | |
JPY Currency Call2 | | | GSG | | | | KRW | | | | 9.500 | | | | 1/20/16 | | | | JPY | | | | 2,700,000,000 | | | | 683,112 | |
SEK Currency Call2,19 | | | CITNA-B | | | | SEK | | | | 8.250 | | | | 2/1/16 | | | | SEK | | | | 453,600 | | | | 106,875 | |
SX5E Index Call2 | | | GSG | | | | EUR | | | | 3550.000 | | | | 1/15/16 | | | | EUR | | | | 587 | | | | 3,291 | |
Total Over-the-Counter Options Purchased (Cost $1,323,311) | | | | | | | | 1,244,153 | |
13 OPPENHEIMER GLOBAL MULTI-ALTERNATIVES FUND/VA
| | |
CONSOLIDATED STATEMENT OF INVESTMENTS Continued |
| | | | | | | | | | | | | | | | | | | | | | | | | | | | | | |
| | | | Counterparty | | |
| Pay /Receive
Floating Rate |
| | Floating Rate | | | Fixed Rate | | |
| Expiration
Date |
| | | Notional Amount (000’s) | | | | Value | |
Over-the-Counter Interest Rate Swaptions Purchased—0.1% | | | | | | | | | | | | | | | | | | | | |
Interest Rate Swap maturing | | | | | | | | | | Six-Month JPY BBA | | | | | | | | | | | | | | | | | | | | |
11/2/27 Call2 | | | GSG | | | | Receive | | | LIBOR | | | 1.070 | | | | 11/20/17 | | | | JPY | | | | 560,000 | | | $ | 34,559 | |
Interest Rate Swap maturing | | | | | | | | | | Six-Month JPY BBA | | | | | | | | | | | | | | | | | | | | |
11/22/27 Call2 | | | GSG | | | | Receive | | | LIBOR | | | 1.070 | | | | 11/20/17 | | | | JPY | | | | 424,000 | | | | 26,250 | |
Interest Rate Swap maturing | | | | | | | | | | Three-Month USD | | | | | | | | | | | | | | | | | | | | |
3/21/28 Call2 | | | GSG | | | | Receive | | | BBA LIBOR | | | 2.580 | | | | 3/19/18 | | | | USD | | | | 1,100 | | | | 45,999 | |
Interest Rate Swap maturing | | | | | | | | | | Three-Month USD | | | | | | | | | | | | | | | | | | | | |
4/18/28 Call2 | | | GSG | | | | Receive | | | BBA LIBOR | | | 2.505 | | | | 4/16/18 | | | | USD | | | | 2,200 | | | | 100,352 | |
Interest Rate Swap maturing | | | | | | | | | | Three-Month USD | | | | | | | | | | | | | | | | | | | | |
4/18/28 Call2 | | | GSG | | | | Receive | | | BBA LIBOR | | | 2.505 | | | | 4/16/18 | | | | USD | | | | 3,750 | | | | 171,055 | |
Interest Rate Swap maturing | | | | | | | | | | Six-Month JPY BBA | | | | | | | | | | | | | | | | | | | | |
7/25/28 Call2 | | | GSG | | | | Receive | | | LIBOR | | | 1.050 | | | | 7/23/18 | | | | JPY | | | | 630,000 | | | | 65,168 | |
Total Over-the-Counter Interest Rate Swaptions Purchased (Cost $745,745) | | | | | | | | 443,383 | |
Total Investments, at Value (Cost $413,954,208) | | | | 96 .8% | | | | 394,988,003 | |
Net Other Assets (Liabilities) | | | | | | | | | | | | 3 .2 | | | | 13,143,316 | |
Net Assets | | | | | | | | | | | | 100 .0% | | | $ | 408,131,319 | |
Footnotes to Consolidated Statement of Investments
1. All or portion of the security position is held in segregated accounts and pledged to cover margin requirements with respect to securities sold short. The aggregate market value of such securities is $1,677,540. See Note 10 of accompanying Consolidated Notes.
2. Non-income producing security.
3. Security is a Master Limited Partnership.
4. This security is not accruing income because the issuer has missed an interest payment on it and/or is not anticipated to make future interest and or principal payments. The rate shown is the contractual interest rate. See Note 4 of the accompanying Consolidated Notes.
5. Security received as the result of issuer reorganization.
6. Represents the current interest rate for a variable or increasing rate security.
7. Restricted security. The aggregate value of restricted securities at period end was $15,032,303, which represents 3.68% of the Fund’s net assets. See Note 4 of the accompanying Consolidated Notes. Information concerning restricted securities is as follows:
| | | | | | | | | | | | | | | | |
| Security | | Acquisition Dates | | | Cost | | | Value | | | Unrealized Appreciation/ (Depreciation) | |
Acorn Re Ltd. Catastrophe Linked Nts., 3.663%, 7/17/18 | | | 7/2/15 | | | $ | 750,000 | | | $ | 758,587 | | | $ | 8,587 | |
Aircraft Lease Securitisation Ltd., Series 2007-1A, Cl. G3, 0.529%, 5/10/32 | | | 1/9/15 | | | | 509,293 | | | | 508,007 | | | | (1,286) | |
Airspeed Ltd., Series 2007-1A, Cl. G1, 0.601%, 6/15/32 | | | 7/24/14-4/15/15 | | | | 3,804,378 | | | | 3,591,134 | | | | (213,244) | |
Blade Engine Securitization Ltd., Series 2006-1AW, Cl. A1, 0.631%, 9/15/41 | | | 7/25/14-8/28/14 | | | | 1,590,638 | | | | 1,394,054 | | | | (196,584) | |
Bosphorus Ltd. Catastrophe Linked Nts., 3.735%, 8/17/18 | | | 8/11/15 | | | | 500,000 | | | | 492,525 | | | | (7,475) | |
Kizuna Re II Ltd. Catastrophe Linked Nts., 2%, 4/5/19 | | | 3/20/15-10/9/15 | | | | 1,050,444 | | | | 1,063,269 | | | | 12,825 | |
Kizuna Re II Ltd. Catastrophe Linked Nts., 2.658%, 4/6/18 | | | 5/2/14-5/5/15 | | | | 753,449 | | | | 754,837 | | | | 1,388 | |
Merna Reinsurance IV Ltd. Catastrophe Linked Nts., 2.653%, 4/8/16 | | | 10/7/14-6/5/15 | | | | 751,076 | | | | 752,119 | | | | 1,043 | |
MultiCat Mexico Ltd. 2012-I Catastrophe Linked Nts., 7.653%, 2/4/16 | | | 5/4/15-6/3/15 | | | | 749,881 | | | | 159,844 | | | | (590,037) | |
Nakama Re Ltd. Catastrophe Linked Nts., 2.278%, 1/16/19 | | | 12/12/14-11/10/15 | | | | 750,218 | | | | 749,063 | | | | (1,155) | |
Nakama Re Ltd. Catastrophe Linked Nts., 2.403%, 4/13/18 | | | 7/13/15 | | | | 500,629 | | | | 498,825 | | | | (1,804) | |
Nakama Re Ltd. Catastrophe Linked Nts., 3.028%, 1/16/20 | | | 12/12/14-10/9/15 | | | | 500,953 | | | | 498,875 | | | | (2,078) | |
Raspro Trust, Series 2005-1A, Cl. G, 0.97%, 3/23/24 | | | 7/7/15 | | | | 2,638,071 | | | | 2,557,750 | | | | (80,321) | |
Ursa Re Ltd. Catastrophe Linked Nts., 5%, 12/7/17 | | | 11/14/14-4/22/15 | | | | 500,657 | | | | 500,375 | | | | (282) | |
Ursa Re Ltd. Catastrophe Linked Nts., 5%, 9/21/18 | | | 12/16/15 | | | | 249,700 | | | | 250,413 | | | | 713 | |
Vitality Re V Ltd. Catastrophe Linked Nts., 2.653%, 1/7/19 | | | 4/29/15 | | | | 253,614 | | | | 252,288 | | | | (1,326) | |
Vitality Re VI Ltd. Catastrophe Linked Nts., 2.253%, 1/8/18 | | | 1/21/15 | | | | 250,000 | | | | 250,338 | | | | 338 | |
| | | | | | $ | 16,103,001 | | | $ | 15,032,303 | | | | $ (1,070,698) | |
8. Represents securities sold under Rule 144A, which are exempt from registration under the Securities Act of 1933, as amended. These securities have been determined to be liquid under guidelines established by the Board of Trustees. These securities amount to $70,241,848 or 17.21% of the Fund’s net assets at period end.
9. This bond has no contractual maturity date, is not redeemable and contractually pays an indefinite stream of interest.
14 OPPENHEIMER GLOBAL MULTI-ALTERNATIVES FUND/VA
Footnotes to Consolidated Statement of Investments (Continued)
10. All or a portion of the security position is when-issued or delayed delivery to be delivered and settled after period end. See Note 4 of the accompanying Consolidated Notes.
11. Zero coupon bond reflects effective yield on the date of purchase.
12. All or a portion of the security position is held in accounts at a futures clearing merchant and pledged to cover margin requirements on open futures contracts and written options on futures, if applicable. The aggregate market value of such securities is $7,712,419. See Note 6 of the accompanying Consolidated Notes.
13. All or a portion of the security position is held in segregated accounts and pledged to cover margin requirements under certain derivative contracts. The aggregate market value of such securities is $1,640,664. See Note 6 of the accompanying Consolidated Notes.
14. Is or was an affiliate, as defined in the Investment Company Act of 1940, as amended, at or during the reporting period, by virtue of the Fund owning at least 5% of the voting securities of the issuer or as a result of the Fund and the issuer having the same investment adviser. Transactions during the reporting period in which the issuer was an affiliate are as follows:
| | | | | | | | | | | | | | | | |
| | | Shares December 31, 2014 | | | Gross
Additions | | | Gross Reductions | | | Shares December 31, 2015 | |
Oppenheimer Institutional Money Market Fund, Cl. E | | | 40,325,799 | | | | 493,509,006 | | | | 510,631,221 | | | | 23,203,584 | |
| | | | |
| | | | | | | | | Value | | | Income | |
Oppenheimer Institutional Money Market Fund, Cl. E | | | | | | | $ | 23,203,584 | | | $ | 58,788 | |
| 15. | Rate shown is the 7-day yield at period end. |
| 16. | All or a portion of this security is owned by the subsidiary. See Note 2 of the accompanying Consolidated Notes. |
17. Knock-out option becomes ineligible for exercise if at any time spot rates are greater than or equal to 1.13 NZD per 1 AUD.
18. Digital option becomes eligible for exercise if at any time spot rates are less than or equal to 110 JPY per CHF.
19. One-Touch Binary option becomes eligible for exercise if at any time spot rates are less than or equal to 8.25 SEK per 1 USD.
Distribution of investments representing geographic holdings, as a percentage of total investments at value, is as follows:
| | | | | | | | | | |
| Geographic Holdings (Unaudited) | | Value | | | Percent | | | |
|
United States | | $ | 271,901,506 | | | | 68.8 | % | | |
Japan | | | 20,156,796 | | | | 5.1 | | | |
Brazil | | | 14,677,051 | | | | 3.7 | | | |
Italy | | | 11,431,484 | | | | 2.9 | | | |
Sweden | | | 9,455,672 | | | | 2.4 | | | |
France | | | 9,108,245 | | | | 2.3 | | | |
Supranational | | | 8,901,331 | | | | 2.3 | | | |
Mexico | | | 6,099,550 | | | | 1.5 | | | |
Bermuda | | | 5,932,285 | | | | 1.5 | | | |
Switzerland | | | 5,461,639 | | | | 1.4 | | | |
Cayman Islands | | | 5,175,941 | | | | 1.3 | | | |
Luxembourg | | | 4,080,617 | | | | 1.0 | | | |
Russia | | | 2,595,509 | | | | 0.7 | | | |
Canada | | | 2,527,829 | | | | 0.6 | | | |
Eurozone | | | 2,503,898 | | | | 0.6 | | | |
United Kingdom | | | 2,428,003 | | | | 0.6 | | | |
Australia | | | 1,560,590 | | | | 0.4 | | | |
Colombia | | | 1,527,350 | | | | 0.4 | | | |
Hong Kong | | | 1,478,111 | | | | 0.4 | | | |
Netherlands | | | 1,468,342 | | | | 0.4 | | | |
Turkey | | | 1,082,489 | | | | 0.3 | | | |
China | | | 828,326 | | | | 0.2 | | | |
India | | | 656,110 | | | | 0.2 | | | |
Chile | | | 601,188 | | | | 0.2 | | | |
Singapore | | | 447,389 | | | | 0.1 | | | |
Ireland | | | 400,584 | | | | 0.1 | | | |
Barbados | | | 397,500 | | | | 0.1 | | | |
Argentina | | | 387,425 | | | | 0.1 | | | |
Germany | | | 318,823 | | | | 0.1 | | | |
Jersey, Channel Islands | | | 282,000 | | | | 0.1 | | | |
China Offshore | | | 267,670 | | | | 0.1 | | | |
Peru | | | 238,750 | | | | 0.1 | | | |
Macau | | | 177,000 | | | | 0.0 | | | |
Ukraine | | | 174,000 | | | | 0.0 | | | |
Jamaica | | | 166,000 | | | | 0.0 | | | |
Venezuela | | | 91,000 | | | | 0.0 | | | |
| | | |
Total | | $ | 394,988,003 | | | | 100.0 | % | | |
| | | |
| | | | | | | | |
| | | Shares Sold Short | | | Value | |
Securities Sold Short—(7.8)% | | | | | | | | |
Common Stock Securities Sold Short—(7.8)% | | | | | | | | |
AGCO Corp. | | | (21,650) | | | | $ (982,693 | ) |
Air Lease Corp., Cl. A | | | (62,585) | | | | (2,095,346 | ) |
Aircastle Ltd. | | | (20,455) | | | | (427,305 | ) |
Aker Solutions ASA | | | (61,769) | | | | (211,230 | ) |
Assurant, Inc. | | | (5,880) | | | | (473,575 | ) |
athenahealth, Inc. | | | (3,620) | | | | (582,711 | ) |
BHP Billiton Ltd., Sponsored ADR | | | (26,890) | | | | (692,686 | ) |
15 OPPENHEIMER GLOBAL MULTI-ALTERNATIVES FUND/VA
| | |
CONSOLIDATED STATEMENT OF INVESTMENTS Continued |
| | | | | | | | |
| | | Shares Sold Short | | | Value | |
| |
Common Stock Securities Sold Short (Continued) | | | | | | | | |
Boeing Co. (The) | | | (10,150) | | | $ | (1,467,589) | |
Camden Property Trust | | | (13,020) | | | | (999,415) | |
Caterpillar, Inc. | | | (19,124) | | | | (1,299,667) | |
CBL & Associates Properties, Inc. | | | (46,030) | | | | (569,391) | |
Charter Communications, Inc., Cl. A | | | (4,570) | | | | (836,767) | |
Cheniere Energy, Inc. | | | (21,900) | | | | (815,775) | |
Cie Financiere Richemont SA | | | (11,280) | | | | (810,280) | |
ClubCorp Holdings, Inc. | | | (66,655) | | | | (1,217,787) | |
CNH Industrial NV | | | (61,570) | | | | (421,139) | |
Colgate-Palmolive Co. | | | (17,830) | | | | (1,187,835) | |
Comcast Corp., Cl. A | | | (20,750) | | | | (1,170,922) | |
Comerica, Inc. | | | (16,822) | | | | (703,664) | |
Commerce Bancshares, Inc. | | | (16,582) | | | | (705,398) | |
Deere & Co. | | | (15,380) | | | | (1,173,033) | |
Ensco plc, Cl. A | | | (56,670) | | | | (872,151) | |
FirstMerit Corp. | | | (33,600) | | | | (626,640) | |
Gulfmark Offshore, Inc., Cl. A | | | (47,470) | | | | (221,685) | |
Nasdaq, Inc. | | | (8,685) | | | | (505,206) | |
Nationstar Mortgage Holdings, Inc. | | | (21,680) | | | | (289,862) | |
Oracle Corp. | | | (24,475) | | | | (894,072) | |
Pennsylvania Real Estate Investment Trust | | | (80,560) | | | | (1,761,847) | |
Rio Tinto plc, Sponsored ADR | | | (15,420) | | | | (449,030) | |
RLJ Lodging Trust | | | (32,890) | | | | (711,411) | |
Rouse Properties, Inc. | | | (44,080) | | | | (641,805) | |
Southern Copper Corp. | | | (42,880) | | | | (1,120,026) | |
Subsea 7 SA | | | (93,237) | | | | (655,771) | |
Tidewater, Inc. | | | (51,320) | | | | (357,187) | |
Tiffany & Co. | | | (13,650) | | | | (1,041,359) | |
Time Warner, Inc. | | | (13,720) | | | | (887,272) | |
Transocean Ltd. | | | (10,408) | | | | (128,851) | |
Weingarten Realty Investors | | | (42,700) | | | | (1,476,566) | |
Zions Bancorporation | | | (16,450) | | | | (449,086) | |
| | | | | | | | |
Total Securities Sold Short (Proceeds $37,377,607) | | | | | | $ | (31,934,035) | |
| | | | | | | | |
| | | | | | | | | | | | | | | | | | |
Forward Currency Exchange Contracts as of December 31, 2015 | |
| Counterparty | | Settlement Month(s) | | Currency Purchased (000’s) | | Currency Sold (000’s) | | Unrealized Appreciation | | | Unrealized Depreciation | |
BNP | | 01/2016 | | BRL | | 8,000 | | USD | | 1,997 | | $ | 25,262 | | | $ | – | |
BNP | | 01/2016 | | USD | | 2,049 | | BRL | | 8,000 | | | 26,644 | | | | – | |
BNP | | 01/2016 | | USD | | 1,317 | | NOK | | 10,950 | | | 80,470 | | | | – | |
BOA | | 01/2016 | | BRL | | 9,880 | | USD | | 2,530 | | | – | | | | 32,905 | |
BOA | | 01/2016 | | KRW | | 4,046,000 | | USD | | 3,442 | | | 2,236 | | | | 3,740 | |
BOA | | 01/2016 | | MXN | | 43,200 | | USD | | 2,566 | | | – | | | | 60,853 | |
BOA | | 01/2016 | | NOK | | 21,410 | | USD | | 2,656 | | | – | | | | 237,175 | |
BOA | | 01/2016 | | USD | | 1,279 | | AUD | | 1,800 | | | – | | | | 32,019 | |
BOA | | 01/2016 | | USD | | 2,470 | | BRL | | 9,880 | | | – | | | | 26,923 | |
BOA | | 02/2016 | | USD | | 1,532 | | CHF | | 1,540 | | | – | | | | 8,393 | |
BOA | | 02/2016 | | USD | | 2,993 | | EUR | | 2,792 | | | – | | | | 45,060 | |
BOA | | 01/2016 - 02/2016 | | USD | | 3,193 | | JPY | | 392,400 | | | – | | | | 73,334 | |
BOA | | 01/2016 | | USD | | 2,575 | | MXN | | 43,700 | | | 41,028 | | | | – | |
BOA | | 02/2016 | | USD | | 1,380 | | THB | | 50,000 | | | – | | | | 8,250 | |
CITNA-B | | 01/2016 | | AUD | | 7,250 | | USD | | 5,218 | | | 63,332 | | | | – | |
CITNA-B | | 01/2016 - 04/2016 | | BRL | | 9,000 | | USD | | 2,288 | | | 6,179 | | | | 26,644 | |
CITNA-B | | 01/2016 | | CAD | | 3,395 | | USD | | 2,624 | | | – | | | | 170,894 | |
CITNA-B | | 01/2016 | | CHF | | 2,550 | | USD | | 2,630 | | | – | | | | 82,955 | |
CITNA-B | | 01/2016 | | GBP | | 1,695 | | USD | | 2,621 | | | – | | | | 122,393 | |
CITNA-B | | 01/2016 | | HUF | | 721,000 | | USD | | 2,592 | | | – | | | | 107,796 | |
CITNA-B | | 01/2016 | | JPY | | 312,000 | | USD | | 2,576 | | | 20,407 | | | | – | |
CITNA-B | | 01/2016 | | MXN | | 87,100 | | USD | | 5,205 | | | – | | | | 153,816 | |
CITNA-B | | 01/2016 | | NZD | | 3,790 | | USD | | 2,559 | | | 31,512 | | | | – | |
CITNA-B | | 01/2016 | | TRY | | 7,560 | | USD | | 2,450 | | | 136,118 | | | | – | |
CITNA-B | | 01/2016 | | USD | | 2,710 | | BRL | | 8,000 | | | 687,727 | | | | – | |
CITNA-B | | 01/2016 | | USD | | 2,612 | | CAD | | 3,490 | | | 89,451 | | | | – | |
CITNA-B | | 01/2016 | | USD | | 2,621 | | CHF | | 2,495 | | | 128,964 | | | | – | |
CITNA-B | | 01/2016 | | USD | | 1,310 | | HUF | | 362,000 | | | 62,757 | | | | – | |
CITNA-B | | 01/2016 - 01/2016 | | USD | | 11,056 | | MXN | | 178,800 | | | 710,195 | | | | 24,371 | |
CITNA-B | | 01/2016 | | USD | | 3,742 | | TRY | | 11,330 | | | – | | | | 133,736 | |
DEU | | 01/2016 | | HUF | | 739,000 | | USD | | 2,564 | | | – | | | | 17,482 | |
DEU | | 01/2016 | | NZD | | 3,935 | | USD | | 2,631 | | | 59,072 | | | | – | |
16 OPPENHEIMER GLOBAL MULTI-ALTERNATIVES FUND/VA
| | | | | | | | | | | | | | | | | | |
Forward Currency Exchange Contracts (Continued) | |
| Counterparty | | Settlement Month(s) | | Currency Purchased (000’s) | | Currency Sold (000’s) | | Unrealized Appreciation | | | Unrealized Depreciation | |
DEU | | 01/2016 | | SEK | | 21,900 | | USD | | 2,616 | | $ | – | | | $ | 21,467 | |
DEU | | 01/2016 | | USD | | 5,141 | | AUD | | 7,225 | | | – | | | | 122,118 | |
DEU | | 01/2016 | | USD | | 2,576 | | HUF | | 726,000 | | | 74,017 | | | | – | |
DEU | | 02/2016 | | USD | | 409 | | SEK | | 3,550 | | | – | | | | 12,118 | |
DEU | | 01/2016 | | USD | | 1,227 | | ZAR | | 16,930 | | | 133,904 | | | | – | |
DEU | | 01/2016 | | ZAR | | 34,670 | | USD | | 2,498 | | | – | | | | 259,603 | |
GSCO-OT | | 01/2016 - 01/2016 | | BRL | | 20,830 | | USD | | 5,840 | | | – | | | | 574,680 | |
GSCO-OT | | 01/2016 | | KRW | | 4,673,000 | | USD | | 3,933 | | | 41,428 | | | | – | |
GSCO-OT | | 01/2016 - 04/2016 | | USD | | 10,467 | | BRL | | 38,030 | | | 1,050,205 | | | | 63,895 | |
GSCO-OT | | 02/2016 | | USD | | 8,717 | | SEK | | 74,000 | | | – | | | | 60,998 | |
HSBC | | 01/2016 | | JPY | | 158,000 | | USD | | 1,317 | | | – | | | | 1,938 | |
HSBC | | 09/2016 | | USD | | 5,031 | | EUR | | 4,400 | | | 209,739 | | | | – | |
HSBC | | 01/2016 | | USD | | 1,294 | | GBP | | 850 | | | 40,791 | | | | – | |
JPM | | 01/2016 | | AUD | | 3,545 | | USD | | 2,574 | | | 8,626 | | | | – | |
JPM | | 01/2016 | | CAD | | 3,495 | | USD | | 2,612 | | | – | | | | 85,731 | |
JPM | | 01/2016 | | KRW | | 3,058,000 | | USD | | 2,623 | | | – | | | | 21,827 | |
JPM | | 02/2016 | | NOK | | 2,460 | | USD | | 283 | | | – | | | | 5,030 | |
JPM | | 01/2016 | | SEK | | 10,670 | | USD | | 1,297 | | | – | | | | 33,130 | |
JPM | | 01/2016 | | TRY | | 7,510 | | USD | | 2,568 | | | 944 | | | | – | |
JPM | | 02/2016 | | USD | | 1,781 | | AUD | | 2,525 | | | – | | | | 54,643 | |
JPM | | 07/2016 | | USD | | 9,061 | | BRL | | 32,000 | | | 1,443,949 | | | | – | |
JPM | | 01/2016 | | USD | | 3,894 | | CAD | | 5,145 | | | 176,063 | | | | – | |
JPM | | 01/2016 - 10/2016 | | USD | | 8,560 | | EUR | | 7,790 | | | 110,706 | | | | 73,153 | |
JPM | | 01/2016 | | USD | | 5,195 | | GBP | | 3,450 | | | 108,881 | | | | – | |
JPM | | 01/2016 - 01/2016 | | USD | | 6,276 | | JPY | | 758,000 | | | – | | | | 32,547 | |
JPM | | 01/2016 | | USD | | 3,876 | | KRW | | 4,541,000 | | | 24,625 | | | | 10,549 | |
JPM | | 01/2016 | | USD | | 2,547 | | NOK | | 21,340 | | | 136,139 | | | | – | |
JPM | | 01/2016 | | USD | | 1,309 | | NZD | | 2,015 | | | – | | | | 67,972 | |
JPM | | 01/2016 | | USD | | 2,560 | | SEK | | 21,730 | | | – | | | | 15,033 | |
JPM | | 01/2016 | | USD | | 2,553 | | ZAR | | 35,530 | | | 258,381 | | | | – | |
MSCO | | 01/2016 | | EUR | | 1,145 | | USD | | 1,292 | | | – | | | | 47,470 | |
MSCO | | 01/2016 | | JPY | | 1,100,000 | | USD | | 9,292 | | | – | | | | 137,716 | |
MSCO | | 01/2016 | | MXN | | 30,000 | | USD | | 1,915 | | | – | | | | 174,096 | |
MSCO | | 02/2016 | | USD | | 2,007 | | CAD | | 2,675 | | | 73,663 | | | | – | |
MSCO | | 01/2016 | | USD | | 1,343 | | CHF | | 1,295 | | | 49,968 | | | | – | |
MSCO | | 01/2016 - 08/2016 | | USD | | 10,911 | | EUR | | 9,665 | | | 363,129 | | | | – | |
MSCO | | 01/2016 - 01/2016 | | USD | | 21,189 | | JPY | | 2,490,000 | | | 481,269 | | | | 13,857 | |
MSCO | | 01/2016 | | USD | | 3,247 | | MXN | | 50,300 | | | 328,445 | | | | – | |
MSCO | | 01/2016 | | USD | | 2,574 | | NZD | | 3,820 | | | – | | | | 37,558 | |
RBS | | 01/2016 - 01/2016 | | USD | | 1,736 | | JPY | | 212,000 | | | 253 | | | | 28,910 | |
TDB | | 01/2016 | | BRL | | 5,050 | | USD | | 1,269 | | | 7,617 | | | | – | |
TDB | | 01/2016 | | GBP | | 1,735 | | USD | | 2,628 | | | – | | | | 69,749 | |
TDB | | 01/2016 - 04/2016 | | USD | | 4,431 | | BRL | | 16,800 | | | 256,868 | | | | 8,108 | |
| | | | | | | | | | | | | | |
Total Unrealized Appreciation and Depreciation | | $ | 7,550,964 | | | $ | 3,402,635 | |
| | | | | | | | | | | | | | |
| | | | | | | | | | | | | | | | |
Futures Contracts as of December 31, 2015 | |
| Description | | Exchange | | Buy/Sell | | Expiration Date | | Number of Contracts | | Value | | | Unrealized Appreciation (Depreciation) | |
| |
CAC 40 10 Index | | PAR | | Sell | | 1/15/16 | | 307 | | | 15,475,532 | | | $ | (130,514) | |
CBOE Volatility Index | | CBE | | Sell | | 2/17/16 | | 99 | | | 1,868,625 | | | | (76,968) | |
Coffee “C”* | | NYB | | Sell | | 3/18/16 | | 16 | | | 760,200 | | | | (27,365) | |
Cotton No. 2* | | NYB | | Buy | | 3/08/16 | | 24 | | | 759,360 | | | | 8,430 | |
Euro-BTP | | EUX | | Sell | | 3/08/16 | | 7 | | | 1,049,192 | | | | 10,800 | |
FTSE 100 Index | | LIF | | Sell | | 3/18/16 | | 166 | | | 15,167,572 | | | | (572,885) | |
Gas Oil* | | NYM | | Buy | | 1/29/16 | | 13 | | | 693,966 | | | | (46,042) | |
Gold (100 oz.) * | | CMX | | Sell | | 2/25/16 | | 8 | | | 848,160 | | | | (6,839) | |
Lean Hogs* | | CME | | Buy | | 2/12/16 | | 33 | | | 789,360 | | | | 5,803 | |
Live Cattle* | | CME | | Sell | | 2/29/16 | | 14 | | | 766,080 | | | | (26,651) | |
Natural Gas* | | NYM | | Sell | | 1/27/16 | | 32 | | | 747,840 | | | | (18,586) | |
Primary Aluminum* | | LME | | Sell | | 1/19/16 | | 20 | | | 752,750 | | | | (22,314) | |
Russell 2000 Mini Index | | NYF | | Sell | | 3/18/16 | | 248 | | | 28,061,200 | | | | (594,949) | |
S&P 500 E-Mini Index | | CME | | Buy | | 3/18/16 | | 356 | | | 36,230,120 | | | | 233,596 | |
S&P/TSX 60 Index | | MON | | Sell | | 3/17/16 | | 27 | | | 2,969,473 | | | | (63,156) | |
Silver* | | CMX | | Buy | | 3/29/16 | | 11 | | | 759,165 | | | | (1,686) | |
Soybean* | | CBT | | Buy | | 3/14/16 | | 17 | | | 734,613 | | | | (1,961) | |
SPI 200 Index | | SFE | | Sell | | 3/17/16 | | 37 | | | 3,543,467 | | | | (239,351) | |
17 OPPENHEIMER GLOBAL MULTI-ALTERNATIVES FUND/VA
| | |
CONSOLIDATED STATEMENT OF INVESTMENTS Continued |
| | | | | | | | | | | | | | | | | | | | | | | | |
Futures Contracts (Continued) | | | | | | | | | | | | | | | | | | | | | |
| | | | | | | | | | | | | | | | | | | | | | | Unrealized Appreciation | |
Description | | | Exchange | | | | Buy/Sell | | | | Expiration Date | | | | Number of Contracts | | | | Value | | | | (Depreciation | ) |
United States Treasury Long Bonds | | | CBT | | | | Buy | | | | 3/21/16 | | | | 42 | | | | 6,457,500 | | | $ | 7,882 | |
United States Treasury Nts., 10 yr. | | | CBT | | | | Sell | | | | 3/21/16 | | | | 115 | | | | 14,479,219 | | | | 19,586 | |
WTI Crude Oil* | | | NYM | | | | Sell | | | | 1/20/16 | | | | 20 | | | | 740,800 | | | | (1,427 | ) |
Zinc* | | | LME | | | | Sell | | | | 1/18/16 | | | | 19 | | | | 760,000 | | | | (22,861 | ) |
| | | | | | | | | | | | | | | | | | | | | | $ | (1,567,458 | ) |
* All or a portion of this security is owned by the subsidiary. See Note 1 of the accompanying Consolidated Notes.
| | | | | | | | | | | | | | | | | | | | | | | | | | |
Exchange-Traded Options Written at December 31, 2015 | |
| Description | | | | Exercise Price | | | Expiration Date | | | Number of Contracts | | | Premiums Received | | | Value | |
Power Shares Senior Loan Exchange Traded Fund Call | | | | | USD | | | | 22.000 | | | | 2/19/16 | | | | USD (3,810 | ) | | $ | 186,531 | | | $ | (238,125) | |
| | | | | | | | | | | | | | | | | | | | | | | | | | | | |
Over-the-Counter Options Written at December 31, 2015 | |
Description | | | Counterparty | | | | | | | | Exercise Price | | | | Expiration Date | | | | Number of Contracts | | | | Premiums Received | | | | Value | |
JPY Currency Call | | | GSG | | | | KRW | | | | 10.000 | | | | 1/20/16 | | | | JPY (5,400,000,000 | ) | | $ | 422,850 | | | $ | (141,233) | |
| | | | | | | | | | | | | | | | | | | | | | | | | | | | | | | | |
Centrally Cleared Credit Default Swaps at December 31, 2015 | | | | | | | | | | | | | | | | | | | | | |
Reference Asset | | | | | |
| Buy/Sell
Protection |
| | | Fixed Rate | | | | Maturity Date | | | | | | |
| Notional Amount
(000’s) |
| | | Premiums Received/(Paid) | | | | Value | |
CDX.HY.24 | | | | | | | Buy | | | | 5.000% | | | | 6/20/20 | | | | USD | | | | 183 | | | $ | 11,763 | | | $ | (6,988) | |
CDX.HY.24 | | | | | | | Buy | | | | 5.000 | | | | 6/20/20 | | | | USD | | | | 896 | | | | 64,036 | | | | (34,183) | |
CDX.HY.24 | | | | | | | Buy | | | | 5.000 | | | | 6/20/20 | | | | USD | | | | 108 | | | | 5,551 | | | | (4,117) | |
CDX.HY.24 | | | | | | | Buy | | | | 5.000 | | | | 6/20/20 | | | | USD | | | | 1,881 | | | | 145,487 | | | | (71,766) | |
CDX.HY.24 | | | | | | | Buy | | | | 5.000 | | | | 6/20/20 | | | | USD | | | | 217 | | | | 13,274 | | | | (8,272) | |
CDX.HY.25 | | | | | | | Buy | | | | 5.000 | | | | 12/20/20 | | | | USD | | | | 12,756 | | | | (26,221) | | | | (165,756) | |
CDX.HY.25 | | | | | | | Buy | | | | 5.000 | | | | 12/20/20 | | | | USD | | | | 11,436 | | | | 283,009 | | | | (148,603) | |
CDX.IG.25 | | | | | | | Sell | | | | 1.000 | | | | 12/20/20 | | | | USD | | | | 8,555 | | | | (67,182) | | | | 49,142 | |
iTraxx.Main.24 | | | | | | | Buy | | | | 1.000 | | | | 12/20/20 | | | | EUR | | | | 7,860 | | | | 105,210 | | | | (91,762) | |
Total of Cleared Credit Default Swaps | | | | | | | | | | | | | | | | | | | | | | | | | | $ | 534,927 | | | $ | (482,305) | |
| | | | | | | | | | | | | | | | | | | | | | | | | | | | | | | | |
Over-the-Counter Credit Default Swaps at December 31, 2015 | | | | | | | | | | | | | | | | | | | | | |
Reference Asset | | | Counterparty | | |
| Buy/Sell
Protection |
| | | Fixed Rate | | | | Maturity Date | | | | | | |
| Notional Amount
(000’s) |
| | | Premiums Received/(Paid) | | | | Value | |
Italy Government International | | | BAC | | | | Buy | | | | 1.000% | | | | 12/20/20 | | | | USD | | | | 5,133 | | | $ | 5,513 | | | $ | 1,038 | |
Kingdom of Spain Bond | | | BAC | | | | Buy | | | | 1.000 | | | | 12/20/20 | | | | USD | | | | 4,278 | | | | 30,105 | | | | (15,682) | |
Malaysia | | | MOS-A | | | | Buy | | | | 1.000 | | | | 12/20/20 | | | | USD | | | | 1,700 | | | | (85,394) | | | | 66,876 | |
Penerbangan Malaysia Bhd | | | BNP | | | | Buy | | | | 1.000 | | | | 12/20/20 | | | | USD | | | | 1,700 | | | | (110,693) | | | | 66,876 | |
Portuguese Republic | | | BAC | | | | Buy | | | | 1.000 | | | | 12/20/20 | | | | USD | | | | 2,567 | | | | (96,674) | | | | 89,067 | |
Republic of Austria Bond | | | BAC | | | | Buy | | | | 1.000 | | | | 12/20/20 | | | | USD | | | | 1,454 | | | | 55,320 | | | | (54,221) | |
Total of Over-the-Counter Credit Default Swaps | | | | | | | | | | | | | | | | | | | | | | | | | | $ | (201,823) | | | $ | 153,954 | |
The table that follows shows the undiscounted maximum potential payment by the Fund related to selling credit protection in credit default swaps:
| | | | | | | | | | | | |
| | | Total Maximum Potential | | | | | | | |
| | | Payments for Selling Credit | | | | | | Reference Asset | |
| Type of Reference Asset on which the Fund Sold Protection | | Protection (Undiscounted) | | | Amount Recoverable* | | | Rating Range** | |
Investment Grade Corporate Debt Indexes | | | $ 8,555,000 | | | | $ — | | | | BBB+ | |
* The Fund has no amounts recoverable from related purchased protection. In addition, the Fund has no recourse provisions under the credit derivatives and holds no collateral which can offset or reduce potential payments under a triggering event.
** The period end reference asset security ratings, as rated by any rating organization, are included in the equivalent Standard & Poor’s rating category. The reference asset rating represents the likelihood of a potential credit event on the reference asset which would result in a related payment by the Fund.
| | | | | | | | | | | | | | | | | | | | | | | | | | | | | | | | |
Centrally Cleared Interest Rate Swaps at December 31, 2015 | | | | | | | | | | | | | | | | | | | | | |
| | | Pay/Receive | | | | | | | | | | | | | | | | | | | | Premiums | | | | | |
Counterparty | | | Floating Rate | | | | Floating Rate | | | | Fixed Rate | | | | Maturity Date | | | | Notional Amount (000’s) | | | | Received / (Paid) | | | | Value | |
| | | | | | | | Three-Month SEK | | | | | | | | | | | | | | | | | | | | | | | | | |
BAC | | | Pay | | | | STIBOR SIDE | | | | 1.365% | | | | 8/10/25 | | | | SEK | | | | 7,965 | | | $ | — | | | $ | (11,822) | |
| | | | | | | | Three-Month SEK | | | | | | | | | | | | | | | | | | | | | | | | | |
BAC | | | Pay | | | | STIBOR SIDE | | | | 1.418 | | | | 11/12/25 | | | | SEK | | | | 1,840 | | | | — | | | | (3,237) | |
| | | | | | | | Three-Month SEK | | | | | | | | | | | | | | | | | | | | | | | | | |
BAC | | | Pay | | | | STIBOR SIDE | | | | 1.501 | | | | 12/9/25 | | | | SEK | | | | 5,120 | | | | — | | | | (5,580) | |
| | | | | | | | Three-Month SEK | | | | | | | | | | | | | | | | | | | | | | | | | |
BAC | | | Pay | | | | STIBOR SIDE | | | | 1.630 | | | | 7/3/25 | | | | SEK | | | | 70,140 | | | | 20,342 | | | | 129,713 | |
| | | | | | | | Six-Month AUD | | | | | | | | | | | | | | | | | | | | | | | | | |
BOA | | | Receive | | | | BBR BBSW | | | | 3.105 | | | | 12/7/25 | | | | AUD | | | | 13,430 | | | | — | | | | (33,923) | |
| | | | | | | | Three-Month USD | | | | | | | | | | | | | | | | | | | | | | | | | |
CITNA-B | | | Pay | | | | BBA LIBOR | | | | 2.318 | | | | 8/10/25 | | | | USD | | | | 450 | | | | (10) | | | | 10,362 | |
| | | | | | | | Three-Month USD | | | | | | | | | | | | | | | | | | | | | | | | | |
DEU | | | Pay | | | | BBA LIBOR | | | | 2.518 | | | | 10/23/45 | | | | USD | | | | 3,158 | | | | — | | | | (53,276) | |
18 OPPENHEIMER GLOBAL MULTI-ALTERNATIVES FUND/VA
| | | | | | | | | | | | | | | | | | | | | | | | | | | | | | | | |
Centrally Cleared Interest Rate Swaps (Continued) | | | | | | | | | | | | | | | | | | | | | |
Counterparty | |
| Pay/Receive
Floating Rate |
| | | Floating Rate | | | | Fixed Rate | | | | Maturity Date | | | | Notional Amount (000’s) | | |
| Premiums
Received / (Paid) |
| | | Value | |
| | | | | | | Three-Month USD | | | | | | | | | | | | | | | | | | | | | | | | | |
GSG | | | Pay | | | | BBA LIBOR | | | | 2.197% | | | | 11/12/25 | | | | USD | | | | 145 | | | $ | — | | | $ | 555 | |
| | | | | | | Six-Month JPY | | | | | | | | | | | | | | | | | | | | | | | | | |
GSG | | | Receive | | | | BBA LIBOR | | | | 0.468 | | | | 11/12/25 | | | | JPY | | | | 23,000 | | | | — | | | | (935) | |
| | | | | | | Six-Month JPY | | | | | | | | | | | | | | | | | | | | | | | | | |
JPM | | | Receive | | | | BBA LIBOR | | | | 0.461 | | | | 12/9/25 | | | | JPY | | | | 28,000 | | | | — | | | | (936) | |
| | | | | | | Three-Month USD | | | | | | | | | | | | | | | | | | | | | | | | | |
JPM | | | Receive | | | | BBA LIBOR | | | | 2.350 | | | | 7/10/25 | | | | USD | | | | 9,170 | | | | (2,532) | | | | 256,753 | |
| | | | | | | Six-Month JPY | | | | | | | | | | | | | | | | | | | | | | | | | |
JPM | | | Receive | | | | BBA LIBOR | | | | 0.593 | | | | 7/10/25 | | | | JPY | | | | 1,082,000 | | | | — | | | | (187,178) | |
| | | | | | | Six-Month JPY | | | | | | | | | | | | | | | | | | | | | | | | | |
JPM | | | Receive | | | | BBA LIBOR | | | | 0.595 | | | | 8/11/25 | | | | JPY | | | | 60,000 | | | | — | | | | (9,729) | |
| | | | | | | Six-Month JPY | | | | | | | | | | | | | | | | | | | | | | | | | |
JPM | | | Receive | | | | BBA LIBOR | | | | 0.566 | | | | 8/6/25 | | | | JPY | | | | 13,000 | | | | — | | | | (1,818) | |
| | | | | | | | | | | | | | | | | | | | | | | | | | | | |
Total of Centrally Cleared Interest Rate Swaps | | | | | | | | | | | | | | | | | | | $ | 17,800 | | | $ | 88,949 | |
| | | | | | | | | | | | | | | | | | | | | | | | | | | | |
| | | | | | | | | | | | | | | | | | | | | | | | | | | | |
Over-the-Counter Interest Rate Swaps at December 31, 2015 | | | | | | | | | | | | | | | | | |
Counterparty | |
| Pay/Receive
Floating Rate |
| | | Floating Rate | | | | Fixed Rate | | | | Maturity Date | | | | | | |
| Notional
Amount (000’s) |
| | | Value | |
| | | | | | | Three-Month CNY | | | | | | | | | | | | | | | | | | | | | |
BOA | | | Pay | | | | CNREPOFIX =CFXS | | | | 2.900% | | | | 7/24/20 | | | | CNY | | | | 14,000 | | | $ | 13,352 | |
| | | | | | | Three-Month CNY | | | | | | | | | | | | | | | | | | | | | |
GSG | | | Pay | | | | CNREPOFIX =CFXS | | | | 2.830 | | | | 8/14/20 | | | | CNY | | | | 3,250 | | | | 1,938 | |
| | | | | | | | | | | | | | | | | | | | | | | | | | | | |
Total of Over-the-Counter Interest Rate Swaps | | | | | | | | | | | | | | | $ | 15,290 | |
| | | | | | | | | | | | | | | | | | | | | | | | | | | | |
| | | | | | | | | | | | | | | | | | | | | | | | | | |
Over-the-Counter Total Return Swaps at December 31, 2015 | | | | | | | | | | | | | | | | |
Reference Asset | | | Counterparty | | |
| Pay/Receive
Total Return* |
| | Floating Rate | | | Maturity Date | | | | | | |
| Notional
Amount (000’s) |
| | | Value | |
| Blackstone Group LP (The) | | | GSG | | | | Receive | | | Twelve-Month USD BBA LIBOR plus 70 basis points | | | 1/13/17 | | | | USD | | | | 1,294 | | | $ | (43,235 | ) |
CGAUOPAU Custom Basket | | | CITNA-B | | | | Receive | | | One-Month AUD BBR BBSW plus 50 basis points | | | 3/10/16 | | | | AUD | | | | 8,465 | | | | 167,141 | |
CGCNOCAD Custom Basket | | | CITNA-B | | | | Receive | | | One-Month CAD BA CDOR plus 50 basis points | | | 4/7/16 | | | | CAD | | | | 8,443 | | | | (44,314 | ) |
GSEHOPHK Custom Basket | | | GSG | | | | Receive | | | One-Month HKD HIBOR HKAB plus 40 basis points | | | 12/12/16 | | | | HKD | | | | 48,563 | | | | (95,615 | ) |
GSOPRUSS Custom Basket | | | GSG | | | | Receive | | | One-Month USD BBA LIBOR plus 50 basis points | | | 12/7/16 | | | | USD | | | | 29,769 | | | | (1,545,042 | ) |
GSOPSPS3 Custom Basket | | | GSG | | | | Receive | | | One-Month USD BBA LIBOR plus 35 basis points | | | 11/8/16 | | | | USD | | | | 22,910 | | | | (430,083 | ) |
| HIF6 Index | | | GSG | | | | Pay | | | No Floating Rate | | | 2/5/16 | | | | HKD | | | | 57,250 | | | | 36,655 | |
IBXXLLTR Index | | | JPM | | | | Pay | | | USD BBA LIBOR | | | 3/28/16 | | | | USD | | | | 60,102 | | | | (2,121,975 | ) |
IBXXLLTR Index | | | JPM | | | | Pay | | | USD BBA LIBOR | | | 6/24/16 | | | | USD | | | | 875 | | | | (289 | ) |
IBXXLLTR Index | | | JPM | | | | Pay | | | USD BBA LIBOR | | | 6/24/16 | | | | USD | | | | 875 | | | | 459 | |
IBXXLLTR Index | | | JPM | | | | Pay | | | USD BBA LIBOR | | | 6/24/16 | | | | USD | | | | 1,750 | | | | 2,390 | |
IBXXLLTR Index | | | JPM | | | | Pay | | | USD BBA LIBOR | | | 6/24/16 | | | | USD | | | | 1,750 | | | | 2,092 | |
JPCMOLNG Index | | | JPM | | | | Receive | | | One-Month USD BBA LIBOR | | | 6/7/16 | | | | USD | | | | 9,432 | | | | (180,888 | ) |
JPCMOSHR Index | | | JPM | | | | Pay | | | One-Month USD BBA LIBOR | | | 6/7/16 | | | | USD | | | | 9,460 | | | | 233,199 | |
| MLTROPFR Custom Basket | | | BOA | | | | Receive | | | One-Month EUR EURIBOR plus 29 basis points | | | 10/6/16 | | | | EUR | | | | 14,510 | | | | (95,079 | ) |
MLTROPUK Custom Basket | | | BOA | | | | Receive | | | One-Month GBP BBA LIBOR plus 34 basis points | | | 10/6/16 | | | | GBP | | | | 10,321 | | | | (63,678 | ) |
OEX Index | | | GSG | | | | Pay | | | One-Month USD BBA LIBOR minus 35 basis points | | | 5/6/16 | | | | USD | | | | 6,273 | | | | 160,487 | |
OEX Index | | | GSG | | | | Pay | | | One-Month USD BBA LIBOR minus 35 basis points | | | 4/15/16 | | | | USD | | | | 779 | | | | 3,909 | |
| OEX Index | | | GSG | | | | Pay | | | One-Month USD BBA LIBOR minus 35 basis points | | | 4/7/16 | | | | USD | | | | 11,903 | | | | 304,511 | |
OEX Index | | | GSG | | | | Pay | | | One-Month USD BBA LIBOR minus 35 basis points | | | 10/7/16 | | | | USD | | | | 1,179 | | | | 30,171 | |
OEX Index | | | GSG | | | | Pay | | | One-Month USD BBA LIBOR minus 35 basis points | | | 7/8/16 | | | | USD | | | | 2,449 | | | | 62,642 | |
OEX Index | | | GSG | | | | Pay | | | One-Month USD BBA LIBOR minus 35 basis points | | | 6/16/16 | | | | USD | | | | 1,011 | | | | 5,073 | |
Total of Over-the-Counter Total Return Swaps | | | | | | | | | | | | | | | $ (3,611,469) | |
* Fund will pay or receive the total return of the reference asset depending on whether the return is positive or negative. For contracts where the Fund has elected to receive the total return of the reference asset if positive, it will be responsible for paying the floating rate and the total return of the reference asset if negative. If the Fund has elected to pay the total return of the reference asset if positive, it will receive the floating rate and the total return of the reference asset if negative.
19 OPPENHEIMER GLOBAL MULTI-ALTERNATIVES FUND/VA
| | |
CONSOLIDATED STATEMENT OF INVESTMENTS Continued |
| | | | | | | | | | | | | | | | | | | | | | | | | | |
Over-the-Counter Volatility Swaps at December 31, 2015 | | | | | | | | | | | | | | | | |
Reference Asset | | | Counterparty | | |
| Pay/Receive
Volatility* |
| | Strike Price | | | Maturity Date | | | | | | | | Notional Amount | | | | Value | |
CAD/CHF spot exchange rate | | | DEU | | | | Receive | | | 10 .000 | | | 1/11/16 | | | | CAD | | | | 6,600 | | | $ | 4,865 | |
EUR/CAD spot exchange rate | | | DEU | | | | Receive | | | 10 .000 | | | 1/7/16 | | | | EUR | | | | 4,500 | | | | 3,814 | |
EUR/CHF spot exchange rate | | | CITNA-B | | | | Pay | | | 5 .350 | | | 1/29/16 | | | | EUR | | | | 4,500 | | | | (3,179) | |
EUR/CHF spot exchange rate | | | BOA | | | | Pay | | | 5 .600 | | | 1/28/16 | | | | EUR | | | | 4,500 | | | | (1,369) | |
EUR/CHF spot exchange rate | | | CITNA-B | | | | Pay | | | 5 .500 | | | 1/22/16 | | | | EUR | | | | 4,500 | | | | 49 | |
EUR/CHF spot exchange rate | | | BOA | | | | Pay | | | 5 .500 | | | 1/25/16 | | | | EUR | | | | 4,500 | | | | (147) | |
EUR/CHF spot exchange rate | | | BOA | | | | Pay | | | 5 .700 | | | 1/25/16 | | | | EUR | | | | 4,500 | | | | 342 | |
GBP/NZD spot exchange rate | | | DEU | | | | Receive | | | 11 .500 | | | 1/19/16 | | | | GBP | | | | 3,300 | | | | (7,151) | |
GBP/NZD spot exchange rate | | | HSBC | | | | Receive | | | 11 .700 | | | 1/19/16 | | | | GBP | | | | 3,200 | | | | (7,029) | |
GBP/SEK spot exchange rate | | | JPM | | | | Receive | | | 10 .000 | | | 1/29/16 | | | | GBP | | | | 3,300 | | | | (7,249) | |
GBP/SEK spot exchange rate | | | DEU | | | | Receive | | | 9 .000 | | | 2/5/16 | | | | GBP | | | | 3,300 | | | | (632) | |
GBP/SEK spot exchange rate | | | BOA | | | | Receive | | | 10 .200 | | | 2/4/16 | | | | GBP | | | | 3,300 | | | | (6,957) | |
iShares MSCI Emerging Markets | | | GSG | | | | Pay | | | 1090 .980 | | | 1/7/16 | | | | USD | | | | 428 | | | | 147,930 | |
iShares MSCI Emerging Markets | | | GSG | | | | Pay | | | 879 .122 | | | 1/7/16 | | | | USD | | | | 476 | | | | 298,105 | |
iShares MSCI Emerging Markets | | | GSG | | | | Receive | | | 918 .090 | | | 1/7/16 | | | | USD | | | | 466 | | | | (240,507) | |
iShares MSCI Emerging Markets | | | GSG | | | | Receive | | | 1117 .560 | | | 1/7/16 | | | | USD | | | | 423 | | | | (297,674) | |
NZD/CHF spot exchange rate | | | DEU | | | | Receive | | | 13 .000 | | | 1/15/16 | | | | NZD | | | | 7,300 | | | | (13,131) | |
NZD/CHF spot exchange rate | | | HSBC | | | | Receive | | | 12 .150 | | | 1/11/16 | | | | NZD | | | | 7,400 | | | | (9,262) | |
NZD/CHF spot exchange rate | | | DEU | | | | Receive | | | 13 .000 | | | 1/14/16 | | | | NZD | | | | 7,200 | | | | (12,311) | |
NZD/CHF spot exchange rate | | | BOA | | | | Receive | | | 14 .050 | | | 1/11/16 | | | | NZD | | | | 7,400 | | | | (19,081) | |
NZD/CHF spot exchange rate | | | JPM | | | | Receive | | | 12 .750 | | | 1/8/16 | | | | NZD | | | | 7,300 | | | | (9,337) | |
NZD/JPY spot exchange rate | | | BOA | | | | Pay | | | 12 .400 | | | 2/9/16 | | | | NZD | | | | 7,200 | | | | (2,955) | |
Total of Over-the-Counter Volatility Swaps | | | | | | | | | | | | | | | | | $ | (182,866) | |
* Fund will pay or receive the volatility of the reference asset depending on whether the realized volatility of the reference asset exceeds or is less than the strike price. For contracts where the Fund has elected to receive the volatility of the reference asset, it will receive a net payment of the difference between the realized volatility and the strike price multiplied by the notional amount if the realized volatility exceeds the strike price; the Fund will make a net payment of the absolute value of the difference of the realized volatility and the strike price multiplied by the notional amount if the realized volatility is less than the strike price. For contracts where the Fund has elected to pay the volatility of the reference asset, it will make a net payment of the difference between the realized volatility and the strike price multiplied by the notional amount if the realized volatility exceeds the strike price; the Fund will receive a net payment of the absolute value of the difference of the realized and the strike price multiplied by the notional amount if the realized volatility is less than the strike price.
| | |
| Glossary: | | |
| Counterparty Abbreviations | | |
BAC | | Barclays Bank plc |
BNP | | BNP Paribas |
BOA | | Bank of America NA |
CITNA-B | | Citibank NA |
DEU | | Deutsche Bank AG |
GSCO-OT | | Goldman Sachs Bank USA |
GSG | | Goldman Sachs Group, Inc. (The) |
HSBC | | HSBC Bank USA NA |
JPM | | JPMorgan Chase Bank NA |
MOS-A | | Morgan Stanley |
MSCO | | Morgan Stanley Capital Services, Inc. |
RBS | | Royal Bank of Scotland plc (The) |
TDB | | Toronto Dominion Bank |
|
Currency abbreviations indicate amounts reporting in currencies |
AUD | | Australian Dollar |
BRL | | Brazilian Real |
CAD | | Canadian Dollar |
CHF | | Swiss Franc |
CNH | | Offshore Chinese Renminbi |
CNY | | Chinese Renminbi |
EUR | | Euro |
GBP | | British Pound Sterling |
HKD | | Hong Kong Dollar |
HUF | | Hungarian Forint |
JPY | | Japanese Yen |
KRW | | South Korean Won |
MXN | | Mexican Nuevo Peso |
NOK | | Norwegian Krone |
NZD | | New Zealand Dollar |
SEK | | Swedish Krona |
THB | | Thailand Baht |
TRY | | New Turkish Lira |
ZAR | | South African Rand |
20 OPPENHEIMER GLOBAL MULTI-ALTERNATIVES FUND/VA
| | |
Definitions | | |
BA CDOR | | Canada Bankers Acceptances Deposit Offering Rate |
BBA LIBOR | | British Bankers’ Association London - Interbank Offered Rate |
BBR | | Bank Bill Rate |
BBSW | | Bank Bill Swap Reference Rate (Australian Financial Market) |
CDX.HY.24 | | Merkit CDX High Yield Index |
CDX.HY.25 | | Markit CDX High Yield Index |
CDX.IG.25 | | Markit CDX Investment Grade Index |
CGAUOPAU | | Custom Basket of Securities |
CGCNOCAD | | Custom Basket of Securities |
CNREPOFIX=CFXS | | Repurchase Fixing Rates |
EURIBOR | | Euro Interbank Offered Rate |
GSEHOPHK | | Custom Basket of Securities |
GSOPRUSS | | Custom Basket of Securities |
GSOPSPS3 | | Custom Basket of Securities |
HIBOR | | Hong Kong Interbank Offered Rate |
HIF6 | | The Hang Seng Index Futures |
HKAB | | Hong Kong Association of Banks |
IBXXLLTR | | IBOXX USD Liquid Leveraged Loans Index Series 1 Version 1 |
iTraxx.Main.24 | | Credit Default Swap Trading Index for a Specific Basket of Securities |
JPCMOLNG | | Custom Basket of Securities |
JPCMOSHR | | Custom Basket of Securities |
MLTROPFR | | Custom Basket of Securities |
MLTROPUK | | Custom Basket of Securities |
MSCI | | Morgan Stanley Capital International |
OEX | | S&P 100 Index |
SX5E | | The EURO STOXX 50 Index |
STIBOR SIDE | | Stockholm Interbank Offered Rate |
| |
Exchange Abbreviations | | |
CBE | | Chicago Board Options Exchange |
CBT | | Chicago Board of Trade |
CME | | Chicago Mercantile Exchanges |
CMX | | Commodity Exchange, Inc. |
EUX | | European Stock Exchange |
LIF | | London International Financial Futures and Options Exchange |
LME | | London Metal Exchange |
MON | | Montreal Exchange |
NYB | | New York Board of Trade |
NYF | | New York Futures Exchange |
NYM | | New York Mercantile Exchange |
PAR | | Paris Stock Exchange |
SFE | | Sydney Futures Exchange |
See accompanying Notes to Consolidated Financial Statements.
21 OPPENHEIMER GLOBAL MULTI-ALTERNATIVES FUND/VA
| | |
CONSOLIDATED STATEMENT OF ASSETS AND LIABILITIES December 31, 2015 |
| | | | |
Assets | | | | |
Investments, at value—see accompanying statement of investments: | | | | |
Unaffiliated companies (cost $390,750,624) | | $ | 371,784,419 | |
Affiliated companies (cost $23,203,584) | | | 23,203,584 | |
| | | | 394,988,003 | |
Cash | | | 1,727,021 | |
Cash used for collateral on futures | | | 756,000 | |
Cash used for collateral on centrally cleared swaps | | | 2,591,380 | |
Deposits with broker for securities sold short | | | 37,550,031 | |
Deposits with broker for foreign securities sold short (cost $1,817,390) | | | 1,795,950 | |
Unrealized appreciation on forward currency exchange contracts | | | 7,550,964 | |
Swaps, at value (net premiums paid $287,248) | | | 1,702,981 | |
Centrally cleared swaps, at value (net premiums paid $49,382) | | | 446,525 | |
Receivables and other assets: | | | | |
Interest and dividends | | | 1,374,458 | |
Investments sold | | | 1,064,147 | |
Variation margin receivable | | | 549,955 | |
Shares of beneficial interest sold | | | 4,013 | |
Other | | | 7,141 | |
Total assets | | | 452,108,569 | |
Liabilities | | | | |
Securities sold short, at value (proceeds $37,377,607) - see accompanying statement of investments | | | 31,934,035 | |
Unrealized depreciation on forward currency exchange contracts | | | 3,402,635 | |
Options written, at value (premiums received $609,381) | | | 379,358 | |
Swaps, at value (premiums received $85,425) | | | 5,328,072 | |
Centrally cleared swaps, at value (net premiums received $602,109) | | | 839,881 | |
Payables and other liabilities: | | | | |
Investments purchased (including $250,000 purchased on a when-issued or delayed delivery basis) | | | 1,357,017 | |
Variation margin payable | | | 556,755 | |
Dividends | | | 61,377 | |
Shareholder communications | | | 3,504 | |
Trustees’ compensation | | | 2,669 | |
Distribution and service plan fees | | | 390 | |
Shares of beneficial interest redeemed | | | 82 | |
Other | | | 111,475 | |
Total liabilities | | | 43,977,250 | |
Net Assets | | $ | 408,131,319 | |
| | | | |
Composition of Net Assets | | | | |
Par value of shares of beneficial interest | | $ | 42,245 | |
Additional paid-in capital | | | 433,237,288 | |
Accumulated net investment loss | | | (5,872,282) | |
Accumulated net realized loss on investments and foreign currency transactions | | | (4,833,859) | |
| Net unrealized depreciation on investments and translation of assets and liabilities denominated in foreign currencies | | | (14,442,073) | |
Net Assets | | $ | 408,131,319 | |
| | | | |
Net Asset Value Per Share | | | | |
Non-Service Shares: | | | | |
| Net asset value, redemption price per share and offering price per share (based on net assets of $406,286,596 and 42,054,272 shares of beneficial interest outstanding) | | | $9.66 | |
Service Shares: | | | | |
| Net asset value, redemption price per share and offering price per share (based on net assets of $1,844,723 and 191,189 shares of beneficial interest outstanding) | | | $9.65 | |
See accompanying Notes to Consolidated Financial Statements.
22 OPPENHEIMER GLOBAL MULTI-ALTERNATIVES FUND/VA
| | |
CONSOLIDATED STATEMENT OF OPERATIONS For the Year Ended December 31, 2015 |
| | | | |
Investment Income | | | | |
Interest (net of foreign withholding taxes of $8,610) | | $ | 6,576,329 | |
Dividends: | | | | |
Unaffiliated companies (net of foreign withholding taxes of $34,382) | | | 1,892,579 | |
Affiliated companies | | | 58,788 | |
Total investment income | | | 8,527,696 | |
Expenses | | | | |
Management fees | | | 3,780,674 | |
Distribution and service plan fees - Service shares | | | 4,230 | |
Transfer and shareholder servicing agent fees: | | | | |
Non-Service shares | | | 363,624 | |
Service shares | | | 1,693 | |
Shareholder communications: | | | | |
Non-Service shares | | | 12,057 | |
Service shares | | | 58 | |
Borrowing fees | | | 3,035 | |
Financing expense from short sales | | | 177,885 | |
Custodian fees and expenses | | | 145,084 | |
Dividends on short sales | | | 606,613 | |
Trustees’ compensation | | | 28,923 | |
Other | | | 208,147 | |
Total expenses | | | 5,332,023 | |
Less reduction to custodian expenses | | | (606) | |
Less waivers and reimbursements of expenses | | | (172,937) | |
Net expenses | | | 5,158,480 | |
Net Investment Income | | | 3,369,216 | |
Realized and Unrealized Gain (Loss) | | | | |
Net realized gain (loss) on: | | | | |
Investments from unaffiliated companies (including premiums on options exercised) | | | (4,337,579) | |
Closing and expiration of option contracts written | | | 5,579,412 | |
Closing and expiration of futures contracts | | | 4,859,600 | |
Foreign currency transactions | | | 13,895,133 | |
Short Positions | | | 1,439,256 | |
Swap contracts | | | (25,920,793) | |
Net realized loss | | | (4,484,971) | |
Net change in unrealized appreciation/depreciation on: | | | | |
Investments | | | (13,834,044) | |
Translation of assets and liabilities denominated in foreign currencies | | | (973,580) | |
Futures contracts | | | (946,887) | |
Option contracts written | | | 99,467 | |
Short positions | | | 4,516,098 | |
Swap contracts | | | (3,798,573) | |
Net change in unrealized appreciation/depreciation | | | (14,937,519) | |
Net Decrease in Net Assets Resulting from Operations | | $ | (16,053,274) | |
See accompanying Notes to Consolidated Financial Statements.
23 OPPENHEIMER GLOBAL MULTI-ALTERNATIVES FUND/VA
| | |
CONSOLIDATED STATEMENTS OF CHANGES IN NET ASSETS |
| | | | | | | | |
| | | Year Ended | | | Year Ended | |
| | | December 31, 2015 | | | December 31, 2014 | |
Operations | | | | | | | | |
Net investment income | | $ | 3,369,216 | | | $ | 1,249,537 | |
Net realized gain (loss) | | | (4,484,971) | | | | 1,924,432 | |
Net change in unrealized appreciation/depreciation | | | (14,937,519) | | | | 505,516 | |
Net increase (decrease) in net assets resulting from operations | | | (16,053,274) | | | | 3,679,485 | |
Dividends and/or Distributions to Shareholders | | | | | | | | |
Dividends from net investment income: | | | | | | | | |
Non-Service shares | | | (1,416,586) | | | | (6,230,727) | |
Service shares | | | (1,965) | | | | (30,926) | |
| | | | (1,418,551) | | | | (6,261,653) | |
Distributions from net realized gain: | | | | | | | | |
Non-Service shares | | | — | | | | (5,294,823) | |
Service shares | | | — | | | | (26,494) | |
| | | | — | | | | (5,321,317) | |
Tax return of capital distribution: | | | | | | | | |
Non-Service shares | | | — | | | | (430,129) | |
Service shares | | | — | | | | (2,135) | |
| | | — | | | | (432,264) | |
Beneficial Interest Transactions | | | | | | | | |
Net increase in net assets resulting from beneficial interest transactions: | | | | | | | | |
Non-Service shares | | | 161,111,575 | | | | 260,906,037 | |
Service shares | | | 587,007 | | | | 1,391,583 | |
| | | 161,698,582 | | | | 262,297,620 | |
Net Assets | | | | | | | | |
Total increase | | | 144,226,757 | | | | 253,961,871 | |
Beginning of period | | | 263,904,562 | | | | 9,942,691 | |
| | |
End of period (including accumulated net investment loss of $5,872,282 and $5,239,862, respectively) | | $ | 408,131,319 | | | $ | 263,904,562 | |
See accompanying Notes to Consolidated Financial Statements.
24 OPPENHEIMER GLOBAL MULTI-ALTERNATIVES FUND/VA
| | |
CONSOLIDATED FINANCIAL HIGHLIGHTS |
| | | | | | | | | | | | |
| | | Year Ended | | | Year Ended | | | Period Ended | |
| | | December 31, | | | December 31, | | | December 31, | |
| Non-Service Shares | | 2015 | | | 2014 | | | 20131 | |
Per Share Operating Data | | | | | | | | | | | | |
Net asset value, beginning of period | | $ | 10.04 | | | $ | 9.92 | | | $ | 10.00 | |
Income (loss) from investment operations: | | | | | | | | | | | | |
Net investment income (loss)2 | | | 0.09 | | | | 0.08 | | | | (0.02) | |
Net realized and unrealized gain (loss) | | | (0.44) | | | | 0.52 | | | | (0.05) | |
Total from investment operations | | | (0.35) | | | | 0.60 | | | | (0.07) | |
Dividends and/or distributions to shareholders: | | | | | | | | | | | | |
Dividends from net investment income | | | (0.03) | | | | (0.25) | | | | (0.01) | |
Distributions from net realized gain | | | 0.00 | | | | (0.21) | | | | 0.00 | |
Tax return of capital distribution | | | 0.00 | | | | (0.02) | | | | 0.00 | |
Total dividends and/or distributions to shareholders | | | (0.03) | | | | (0.48) | | | | (0.01) | |
Net asset value, end of period | | $ | 9.66 | | | $ | 10.04 | | | $ | 9.92 | |
| | | | | | | | | | | | |
Total Return, at Net Asset Value3 | | | (3.45)% | | | | 6.02% | | | | (0.69)% | |
| | | | | | | | | | | | |
Ratios/Supplemental Data | | | | | | | | | | | | |
Net assets, end of period (in thousands) | | $ | 406,286 | | | $ | 262,573 | | | $ | 9,917 | |
Average net assets (in thousands) | | $ | 363,975 | | | $ | 161,988 | | | $ | 9,827 | |
Ratios to average net assets:4 | | | | | | | | | | | | |
Net investment income (loss) | | | 0.92% | | | | 0.77%5 | | | | (1.85)%5 | |
Expenses excluding specific expenses listed below | | | 1.24% | | | | 1.33% | | | | 7.16% | |
Dividend and/or interest expenses on securities sold short | | | 0.17% | | | | 0.08% | | | | 0.00% | |
Borrowing expenses on securities sold short | | | 0.05% | | | | 0.02% | | | | 0.00% | |
Interest and fees from borrowings | | | 0.00%6 | | | | 0.00% | | | | 0.00% | |
Total expenses7 | | | 1.46% | | | | 1.43%5 | | | | 7.16%5 | |
Expenses after payments, waivers and/or reimbursements and reduction to custodian expenses | | | 1.41% | | | | 1.31%5 | | | | 3.33%5 | |
Portfolio turnover rate | | | 67% | | | | 147% | | | | 11% | |
1. For the period from November 14, 2013 (inception of offering) to December 31, 2013.
2. Per share amounts calculated based on the average shares outstanding during the period.
3. Assumes an initial investment on the business day before the first day of the fiscal period, with all dividends and distributions reinvested in additional shares on the reinvestment date, and redemption at the net asset value calculated on the last business day of the fiscal period. Total returns are not annualized for periods less than one full year. Total return information does not reflect expenses that apply at the separate account level or to related insurance products. Inclusion of these charges would reduce the total return figures for all periods shown. Returns do not reflect the deduction of taxes that a shareholder would pay on fund distributions or the redemption of fund shares.
4. Annualized for periods less than one full year.
5. Includes the Fund’s shares of the allocated expenses and/or net investment income from the master funds.
6. Less than 0.005%.
7. Total expenses including indirect expenses from affiliated fund fees and expenses were as follows:
| | | | |
Year Ended December 31, 2015 | | | 1.47 | % |
Year Ended December 31, 2014 | | | 1.45 | % |
Period Ended December 31, 2013 | | | 7.18 | % |
See accompanying Notes to Consolidated Financial Statements.
25 OPPENHEIMER GLOBAL MULTI-ALTERNATIVES FUND/VA
| | |
CONSOLIDATED FINANCIAL HIGHLIGHTS Continued |
| | | | | | | | | | | | |
| | | Year Ended | | | Year Ended | | | Period Ended | |
| | | December 31, | | | December 31, | | | December 31, | |
| Service Shares | | 2015 | | | 2014 | | | 20131 | |
Per Share Operating Data | | | | | | | | | | | | |
Net asset value, beginning of period | | $ | 10.03 | | | $ | 9.92 | | | $ | 10.00 | |
Income (loss) from investment operations: | | | | | | | | | | | | |
Net investment income (loss)2 | | | 0.07 | | | | 0.08 | | | | (0.03) | |
Net realized and unrealized gain (loss) | | | (0.44) | | | | 0.50 | | | | (0.04) | |
Total from investment operations | | | (0.37) | | | | 0.58 | | | | (0.07) | |
Dividends and/or distributions to shareholders: | | | | | | | | | | | | |
Dividends from net investment income | | | (0.01) | | | | (0.25) | | | | (0.01) | |
Distributions from net realized gain | | | 0.00 | | | | (0.21) | | | | 0.00 | |
Tax return of capital distribution | | | 0.00 | | | | (0.01) | | | | 0.00 | |
Total dividends and/or distributions to shareholders | | | (0.01) | | | | (0.47) | | | | (0.01) | |
Net asset value, end of period | | $ | 9.65 | | | $ | 10.03 | | | $ | 9.92 | |
| | | | | | | | | | | | |
Total Return, at Net Asset Value3 | | | (3.68 | )% | | | 5.90 | % | | | (0.72 | )% |
| | | | | | | | | | | | |
Ratios/Supplemental Data | | | | | | | | | | | | |
Net assets, end of period (in thousands) | | $ | 1,845 | | | $ | 1,332 | | | $ | 10 | |
Average net assets (in thousands) | | $ | 1,695 | | | $ | 335 | | | $ | 10 | |
Ratios to average net assets:4 | | | | | | | | | | | | |
Net investment income (loss) | | | 0.66% | | | | 0.77%5 | | | | (2.12)%5 | |
Expenses excluding specific expenses listed below | | | 1.48% | | | | 1.68% | | | | 7.43% | |
Dividend and/or interest expenses on securities sold short | | | 0.17% | | | | 0.08% | | | | 0.00% | |
Borrowing expenses on securities sold short | | | 0.05% | | | | 0.02% | | | | 0.00% | |
Interest and fees from borrowings | | | 0.00%6 | | | | 0.00% | | | | 0.00% | |
Total expenses7 | | | 1.70% | | | | 1.78%5 | | | | 7.43%5 | |
Expenses after payments, waivers and/or reimbursements and reduction to custodian expenses | | | 1.65% | | | | 1.67%5 | | | | 3.50%5 | |
Portfolio turnover rate | | | 67% | | | | 147% | | | | 11% | |
1. For the period from November 14, 2013 (inception of offering) to December 31, 2013.
2. Per share amounts calculated based on the average shares outstanding during the period.
3. Assumes an initial investment on the business day before the first day of the fiscal period, with all dividends and distributions reinvested in additional shares on the reinvestment date, and redemption at the net asset value calculated on the last business day of the fiscal period. Total returns are not annualized for periods less than one full year. Total return information does not reflect expenses that apply at the separate account level or to related insurance products. Inclusion of these charges would reduce the total return figures for all periods shown. Returns do not reflect the deduction of taxes that a shareholder would pay on fund distributions or the redemption of fund shares.
4. Annualized for periods less than one full year.
5. Includes the Fund’s shares of the allocated expenses and/or net investment income from the master funds.
6. Less than 0.005%.
7. Total expenses including indirect expenses from affiliated fund fees and expenses were as follows:
| | | | |
Year Ended December 31, 2015 | | | 1.71 | % |
Year Ended December 31, 2014 | | | 1.80 | % |
Period Ended December 31, 2013 | | | 7.45 | % |
See accompanying Notes to Consolidated Financial Statements.
26 OPPENHEIMER GLOBAL MULTI-ALTERNATIVES FUND/VA
| | |
NOTES TO CONSOLIDATED FINANCIAL STATEMENTS December 31, 2015 |
1. Organization
Oppenheimer Global Multi-Alternatives Fund/VA (the “Fund”), formerly known as Oppenheimer Diversified Alternatives Fund/VA, is a separate series of Oppenheimer Variable Account Funds, a diversified open-end management investment company registered under the Investment Company Act of 1940, as amended. The Fund’s investment objective is to seek total return. The Fund’s investment adviser is OFI Global Asset Management, Inc. (“OFI Global” or the “Manager”), a wholly-owned subsidiary of OppenheimerFunds, Inc. (“OFI” or the “Sub-Adviser”). The Manager has entered into a sub-advisory agreement with OFI. The Sub-Adviser has entered into a sub-sub-advisory agreement with Cornerstone Real Estate Advisers LLC and OFI SteelPath, Inc. (collectively, the “Sub-Sub-Advisers”). Shares of the Fund are sold only to separate accounts of life insurance companies.
The Fund offers two classes of shares. Both classes are sold at their offering price, which is the net asset value per share, to separate investment accounts of participating insurance companies as an underlying investment for variable life insurance policies, variable annuity contracts or other investment products. The class of shares designated as Service shares is subject to a distribution and service plan. Both classes of shares have identical rights and voting privileges with respect to the Fund in general and exclusive voting rights on matters that affect that class alone. Earnings, net assets and net asset value per share may differ due to each class having its own expenses, such as transfer and shareholder servicing agent fees and shareholder communications, directly attributable to that class.
The following is a summary of significant accounting policies followed in the Fund’s preparation of financial statements in accordance with accounting principles generally accepted in the United States (“U.S. GAAP”).
2. Significant Accounting Policies
Security Valuation. All investments in securities are recorded at their estimated fair value, as described in Note 3.
Reporting Period End Date. The last day of the Fund’s reporting period is the last day the New York Stock Exchange was open for trading during the period. The Fund’s financial statements have been presented through that date to maintain consistency with the Fund’s net asset value calculations used for shareholder transactions.
Basis for Consolidation. The Fund has established a Cayman Islands exempted company, Oppenheimer Global Multi-Alternatives Fund/VA (Cayman) Ltd., formerly known as Oppenheimer Diversified Alternatives Fund/VA (Cayman) Ltd., which is wholly-owned and controlled by the Fund (the “Subsidiary”). The Fund and Subsidiary are both managed by the Manager. The Fund may invest up to 25% of its total assets in the Subsidiary. The Subsidiary invests primarily in commodity-linked derivatives (including commodity futures, financial futures, options and swap contracts) and certain fixed-income securities and other investments that may serve as margin or collateral for its derivatives positions. Investments in the Subsidiary are expected to provide the Fund with exposure to commodities markets within the limitations of the federal tax requirements that apply to the Fund. The Subsidiary is subject to the same investment restrictions and guidelines, and follows the same compliance policies and procedures, as the Fund.
The financial statements have been consolidated and include accounts of the Fund and the Subsidiary. Accordingly, all inter-company transactions and balances have been eliminated. At period end, the Fund owned 20,788 shares with net assets of $10,504,038 in the Subsidiary.
Other financial information at period end:
| | | | |
Total market value of investments | | $ | 9,923,428 | |
Net assets | | $ | 10,504,038 | |
Net income (loss) | | $ | (173,204 | ) |
Net realized gain (loss) | | $ | (1,352,667 | ) |
Net change in unrealized appreciation/depreciation | | $ | (182,632 | ) |
Foreign Currency Translation. The Fund’s accounting records are maintained in U.S. dollars. The values of securities denominated in foreign currencies and amounts related to the purchase and sale of foreign securities and foreign investment income are translated into U.S. dollars as of the close of the New York Stock Exchange (the “Exchange”), normally 4:00 P.M. Eastern time, on each day the Exchange is open for trading. Foreign exchange rates may be valued primarily using a reliable bank, dealer or service authorized by the Board of Trustees.
Reported net realized gains and losses from foreign currency transactions arise from sales of portfolio securities, sales and maturities of short-term securities, sales of foreign currencies, exchange rate fluctuations between the trade and settlement dates on securities transactions, and the difference between the amounts of dividends, interest, and foreign withholding taxes recorded on the Fund’s books and the U.S. dollar equivalent of the amounts actually received or paid. Net unrealized appreciation and depreciation on the translation of assets and liabilities denominated in foreign currencies arise from changes in the values of assets and liabilities, including investments in securities at fiscal period end, resulting from changes in exchange rates.
The effect of changes in foreign currency exchange rates on investments is separately identified from the fluctuations arising from changes in market values of securities held and reported with all other foreign currency gains and losses in the Fund’s Consolidated Statement of Operations.
Allocation of Income, Expenses, Gains and Losses. Income, expenses (other than those attributable to a specific class), gains and losses are allocated on a daily basis to each class of shares based upon the relative proportion of net assets represented by such class. Operating expenses directly attributable to a specific class are charged against the operations of that class.
Dividends and Distributions to Shareholders. Dividends and distributions to shareholders, which are determined in accordance with income tax regulations and may differ from U.S. GAAP, are recorded on the ex-dividend date. Income and capital gain distributions, if any, are declared and paid annually or at other times as deemed necessary by the Manager.
27 OPPENHEIMER GLOBAL MULTI-ALTERNATIVES FUND/VA
| | |
NOTES TO CONSOLIDATED FINANCIAL STATEMENTS Continued |
2. Significant Accounting Policies (Continued)
Investment Income. Dividend income is recorded on the ex-dividend date or upon ex-dividend notification in the case of certain foreign dividends where the ex-dividend date may have passed. Non-cash dividends included in dividend income, if any, are recorded at the fair market value of the securities received. Interest income is recognized on an accrual basis. Discount and premium, which are included in interest income on the Consolidated Statement of Operations, are amortized or accreted daily.
Return of Capital Estimates. Distributions received from the Fund’s investments in Master Limited Partnerships (MLPs) and Real Estate Investments Trusts (REITs), generally are comprised of income and return of capital. The Fund records investment income and return of capital based on estimates. Such estimates are based on historical information available from each MLP, REIT and other industry sources. These estimates may subsequently be revised based on information received from MLPs and REITs after their tax reporting periods are concluded.
Custodian Fees. “Custodian fees and expenses” in the Consolidated Statement of Operations may include interest expense incurred by the Fund on any cash overdrafts of its custodian account during the period. Such cash overdrafts may result from the effects of failed trades in portfolio securities and from cash outflows resulting from unanticipated shareholder redemption activity. The Fund pays interest to its custodian on such cash overdrafts, to the extent they are not offset by positive cash balances maintained by the Fund, at a rate equal to the Federal Funds Rate plus 0.50%. The “Reduction to custodian expenses” line item, if applicable, represents earnings on cash balances maintained by the Fund during the period. Such interest expense and other custodian fees may be paid with these earnings.
Security Transactions. Security transactions are recorded on the trade date. Realized gains and losses on securities sold are determined on the basis of identified cost.
Indemnifications. The Fund’s organizational documents provide current and former Trustees and officers with a limited indemnification against liabilities arising in connection with the performance of their duties to the Fund. In the normal course of business, the Fund may also enter into contracts that provide general indemnifications. The Fund’s maximum exposure under these arrangements is unknown as this would be dependent on future claims that may be made against the Fund. The risk of material loss from such claims is considered remote.
Federal Taxes. The Fund intends to comply with provisions of the Internal Revenue Code applicable to regulated investment companies and to distribute substantially all of its investment company taxable income, including any net realized gain on investments not offset by capital loss carryforwards, if any, to shareholders. Therefore, no federal income or excise tax provision is required. The Fund files income tax returns in U.S. federal and applicable state jurisdictions. The statute of limitations on the Fund’s tax return filings generally remains open for the three preceding fiscal reporting period ends.
Subchapter M requires, among other things, that at least 90% of the Fund’s gross income be derived from securities or derived with respect to its business of investing in securities (typically referred to as “qualifying income”). Income from commodity-linked derivatives may not be treated as “qualifying income” for purposes of the 90% gross income requirement. The Internal Revenue Service (IRS) has previously issued a number of private letter rulings which conclude that income derived from commodity index-linked notes and investments in a wholly-owned subsidiary will be “qualifying income.” As a result, the Fund will gain exposure to commodities through commodity-linked notes and its wholly-owned subsidiary.
The IRS has suspended the granting of private letter rulings pending further review. As a result, there can be no assurance that the IRS will not change its position with respect to commodity-linked notes and wholly-owned subsidiaries. In addition, future legislation and guidance from the Treasury and the IRS may adversely affect the fund’s ability to gain exposure to commodities through commodity-linked notes and its wholly-owned subsidiary.
The Fund is required to include in income for federal income tax purposes all of the subsidiary’s net income and gains whether or not such income is distributed by the subsidiary. Net income and gains from the subsidiary are generally treated as ordinary income by the Fund, regardless of the character of the subsidiary’s underlying income. Net losses from the subsidiary do not pass through to the Fund for federal income tax purposes.
The tax components of capital shown in the following table represent distribution requirements the Fund must satisfy under the income tax regulations, losses the Fund may be able to offset against income and gains realized in future years and unrealized appreciation or depreciation of securities and other investments for federal income tax purposes.
| | | | | | | | | | | | |
Undistributed Net Investment Income | | Undistributed
Long-Term
Gain | | | Accumulated
Loss
Carryforward1,2,3,4,5 | | | Net Unrealized
Depreciation
Based on cost of
Securities and
Other Investments
for Federal Income
Tax Purposes | |
$— | | | $— | | | | $2,241,634 | | | | $19,625,715 | |
1. At period end, the Fund had $2,102,249 net capital loss carryforward available to offset future realized capital gains, if any, and thereby reduce future taxable gain distributions. Details of the capital loss carryforwards are included in the table below. Capital loss carryovers with no expiration, if any, must be utilized prior to those with expiration dates.
28 OPPENHEIMER GLOBAL MULTI-ALTERNATIVES FUND/VA
2. Significant Accounting Policies (Continued)
| | | | |
| Expiring | | | |
No expiration | | $ | 2,102,249 | |
| 2 | The Fund had $131,091 of post-October foreign currency losses which were deferred. |
3. The Fund had $8,294 of straddle losses which were deferred.
4. During the reporting period, the Fund did not utilize any capital loss carryforward.
5. During the previous reporting period, the Fund utilized $4,521 of capital loss carryforward to offset capital gains realized in that fiscal year.
Net investment income (loss) and net realized gain (loss) may differ for financial statement and tax purposes. The character of dividends and distributions made during the fiscal year from net investment income or net realized gains are determined in accordance with federal income tax requirements, which may differ from the character of net investment income or net realized gains presented in those financial statements in accordance with U.S. GAAP. Also, due to timing of dividends and distributions, the fiscal year in which amounts are distributed may differ from the fiscal year in which the income or net realized gain was recorded by the Fund.
Accordingly, the following amounts have been reclassified for the reporting period. Net assets of the Fund were unaffected by the reclassifications.
| | | | | | | | |
Reduction to Paid-in Capital | | Increase
to Accumulated
Net Investment
Loss | | | Reduction
to Accumulated Net
Realized Loss on
Investments | |
$564,132 | | | $2,583,085 | | | | $3,147,217 | |
The tax character of distributions paid during the reporting periods:
| | | | | | | | |
| | | Year Ended | | | Year Ended | |
| | | December 31, 2015 | | | December 31, 2014 | |
Distributions paid from: | | | | | | | | |
Ordinary income | | $ | 1,418,551 | | | $ | 11,293,164 | |
Long-term capital gain | | | — | | | | 289,806 | |
Return of capital | | | — | | | | 432,264 | |
| | | | |
Total | | $ | 1,418,551 | | | $ | 12,015,234 | |
| | | | |
The aggregate cost of securities and other investments and the composition of unrealized appreciation and depreciation of securities and other investments for federal income tax purposes at period end are noted in the following table. The primary difference between book and tax appreciation or depreciation of securities and other investments, if applicable, is attributable to the tax deferral of losses or tax realization of financial statement unrealized gain or loss.
| | | | |
Federal tax cost of securities | | $ | 415,872,066 | |
Federal tax cost of other investments | | | (73,253,286) | |
| | | | |
Total federal tax cost | | $ | 342,618,780 | |
| | | | |
Gross unrealized appreciation | | $ | 16,629,842 | |
Gross unrealized depreciation | | | (36,255,557) | |
| | | | |
Net unrealized depreciation | | $ | (19,625,715) | |
| | | | |
Certain foreign countries impose a tax on capital gains which is accrued by the Fund based on unrealized appreciation, if any, on affected securities. The tax is paid when the gain is realized.
Use of Estimates. The preparation of financial statements in conformity with U.S. GAAP requires management to make estimates and assumptions that affect the reported amounts of assets and liabilities and disclosure of contingent assets and liabilities at the date of the financial statements and the reported amounts of increases and decreases in net assets from operations during the reporting period. Actual results could differ from those estimates.
3. Securities Valuation
The Fund calculates the net asset value of its shares as of the close of the New York Stock Exchange (the “Exchange”), normally 4:00 P.M. Eastern time, on each day the Exchange is open for trading, except in the case of a scheduled early closing of the Exchange, in which case the Fund will calculate net asset value of the shares as of the scheduled early closing time of the Exchange.
The Fund’s Board has adopted procedures for the valuation of the Fund’s securities and has delegated the day-to-day responsibility for valuation determinations under those procedures to the Manager. The Manager has established a Valuation Committee which is responsible for determining a “fair valuation” for any security for which market quotations are not “readily available.” The Valuation Committee’s fair valuation determinations are subject to review, approval and ratification by the Fund’s Board at its next regularly scheduled meeting covering the calendar quarter in which the fair valuation was determined.
Valuation Methods and Inputs
Securities are valued using unadjusted quoted market prices, when available, as supplied primarily by third party pricing services or dealers.
The following methodologies are used to determine the market value or the fair value of the types of securities described below:
29 OPPENHEIMER GLOBAL MULTI-ALTERNATIVES FUND/VA
| | |
NOTES TO CONSOLIDATED FINANCIAL STATEMENTS Continued |
3. Securities Valuation (Continued)
Securities traded on a registered U.S. securities exchange (including exchange-traded derivatives other than futures and futures options) are valued based on the last sale price of the security reported on the principal exchange on which it is traded, prior to the time when the Fund’s assets are valued. In the absence of a sale, the security is valued at the mean between the bid and asked price on the principal exchange or, if not available from the principal exchange, obtained from two dealers. If bid and asked prices are not available from either the exchange or two dealers, the security is valued by using one of the following methodologies (listed in order of priority): (1) a bid from the principal exchange, (2) the mean between the bid and asked price as provided by a single dealer, or (3) a bid from a single dealer. A security of a foreign issuer traded on a foreign exchange, but not listed on a registered U.S. securities exchange, is valued based on the last sale price on the principal exchange on which the security is traded, as identified by the third party pricing service used by the Manager, prior to the time when the Fund’s assets are valued. If the last sale price is unavailable, the security is valued at the most recent official closing price on the principal exchange on which it is traded. If the last sales price or official closing price for a foreign security is not available, the security is valued at the mean between the bid and asked price per the exchange or, if not available from the exchange, obtained from two dealers. If bid and asked prices are not available from either the exchange or two dealers, the security is valued by using one of the following methodologies (listed in order of priority): (1) a bid from the exchange, (2) the mean between the bid and asked price as provided by a single dealer, or (3) a bid from a single dealer.
Shares of a registered investment company that are not traded on an exchange are valued at that investment company’s net asset value per share. Corporate and government debt securities (of U.S. or foreign issuers) and municipal debt securities, event-linked bonds, loans, mortgage-backed securities, collateralized mortgage obligations, and asset-backed securities are valued at the mean between the “bid” and “asked” prices utilizing evaluated prices obtained from third party pricing services or broker-dealers who may use matrix pricing methods to determine the evaluated prices. Short-term money market type debt securities with a remaining maturity of sixty days or less are valued at cost adjusted by the amortization of discount or premium to maturity (amortized cost), which approximates market value. Short-term debt securities with a remaining maturity in excess of sixty days are valued at the mean between the “bid” and “asked” prices utilizing evaluated prices obtained from third party pricing services or broker-dealers.
Structured securities, swaps, swaptions, and other over-the-counter derivatives are valued utilizing evaluated prices obtained from third party pricing services or broker-dealers.
Forward foreign currency exchange contracts are valued utilizing current and forward currency rates obtained from third party pricing services. When the settlement date of a contract is an interim date for which a quotation is not available, interpolated values are derived using the nearest dated forward currency rate.
Futures contracts and futures options traded on a commodities or futures exchange will be valued at the final settlement price or official closing price on the principal exchange as reported by such principal exchange at its trading session ending at, or most recently prior to, the time when the Fund’s assets are valued.
A description of the standard inputs that may generally be considered by the third party pricing vendors in determining their evaluated prices is provided below.
| | |
Security Type | | Standard inputs generally considered by third-party pricing vendors |
Corporate debt, government debt, municipal, mortgage- backed and asset-backed securities | | Reported trade data, broker-dealer price quotations, benchmark yields, issuer spreads on comparable securities, the credit quality, yield, maturity, and other appropriate factors. |
Loans | | Information obtained from market participants regarding reported trade data and broker-dealer price quotations. |
Event-linked bonds | | Information obtained from market participants regarding reported trade data and broker-dealer price quotations. |
Structured securities | | Relevant market information such as the price of underlying financial instruments, stock market indices, foreign currencies, interest rate spreads, commodities, or the occurrence of other specific events. |
Swaps | | Relevant market information, including underlying reference assets such as credit spreads, credit event probabilities, index values, individual security values, forward interest rates, variable interest rates, volatility measures, and forward currency rates. |
If a market value or price cannot be determined for a security using the methodologies described above, or if, in the “good faith” opinion of the Manager, the market value or price obtained does not constitute a “readily available market quotation,” or a significant event has occurred that would materially affect the value of the security, the security is fair valued either (i) by a standardized fair valuation methodology applicable to the security type or the significant event as previously approved by the Valuation Committee and the Fund’s Board or (ii) as determined in good faith by the Manager’s Valuation Committee. The Valuation Committee considers all relevant facts that are reasonably available, through either public information or information available to the Manager, when determining the fair value of a security. Fair value determinations by the Manager are subject to review, approval and ratification by the Fund’s Board at its next regularly scheduled meeting covering the calendar quarter in which the fair valuation was determined. Those fair valuation standardized methodologies include, but are not limited to, valuing securities at the last sale price or initially at cost and subsequently adjusting the value based on: changes in company specific fundamentals, changes in an appropriate securities index, or changes in the value of similar securities which may be further adjusted for any discounts related to security-specific resale restrictions. When possible, such methodologies use observable market inputs such as unadjusted quoted prices of similar securities, observable interest rates, currency rates and yield curves. The methodologies used for valuing securities are not necessarily an indication of the risks associated with investing in those securities nor can it be assured that the Fund can obtain the fair value assigned to a security if it were to sell the security.
30 OPPENHEIMER GLOBAL MULTI-ALTERNATIVES FUND/VA
3. Securities Valuation (Continued)
To assess the continuing appropriateness of security valuations, the Manager, or its third party service provider who is subject to oversight by the Manager, regularly compares prior day prices, prices on comparable securities, and sale prices to the current day prices and challenges those prices exceeding certain tolerance levels with the third party pricing service or broker source. For those securities valued by fair valuations, whether through a standardized fair valuation methodology or a fair valuation determination, the Valuation Committee reviews and affirms the reasonableness of the valuations based on such methodologies and fair valuation determinations on a regular basis after considering all relevant information that is reasonably available.
Classifications
Each investment asset or liability of the Fund is assigned a level at measurement date based on the significance and source of the inputs to its valuation. Various data inputs are used in determining the value of each of the Fund’s investments as of the reporting period end. These data inputs are categorized in the following hierarchy under applicable financial accounting standards:
1) Level 1-unadjusted quoted prices in active markets for identical assets or liabilities (including securities actively traded on a securities exchange)
2) Level 2-inputs other than unadjusted quoted prices that are observable for the asset or liability (such as unadjusted quoted prices for similar assets and market corroborated inputs such as interest rates, prepayment speeds, credit risks, etc.)
3) Level 3-significant unobservable inputs (including the Manager’s own judgments about assumptions that market participants would use in pricing the asset or liability).
The inputs used for valuing securities are not necessarily an indication of the risks associated with investing in those securities.
The table below categorizes amounts that are included in the Fund’s Consolidated Statement of Assets and Liabilities at period end based on valuation input level:
| | | | | | | | | | | | | | | | |
| | | Level 1—
Unadjusted
Quoted Prices | | | Level 2— Other Significant
Observable Inputs | | | Level 3—
Significant
Unobservable
Inputs | | | Value | |
Assets Table | | | | | | | | | | | | | | | | |
Investments, at Value: | | | | | | | | | | | | | | | | |
Common Stocks | | | | | | | | | | | | | | | | |
Consumer Discretionary | | $ | 4,931,278 | | | $ | 329,348 | | | $ | — | | | $ | 5,260,626 | |
Consumer Staples | | | 5,524,591 | | | | — | | | | — | | | | 5,524,591 | |
Energy | | | 23,035,725 | | | | — | | | | — | | | | 23,035,725 | |
Financials | | | 26,407,153 | | | | 8,702,614 | | | | — | | | | 35,109,767 | |
Health Care | | | 10,778,527 | | | | 1,678,607 | | | | 9,315 | | | | 12,466,449 | |
Industrials | | | 12,348,651 | | | | — | | | | — | | | | 12,348,651 | |
Information Technology | | | 12,897,853 | | | | 433,412 | | | | — | | | | 13,331,265 | |
Materials | | | 5,298,665 | | | | — | | | | — | | | | 5,298,665 | |
Telecommunication Services | | | 3,271,663 | | | | — | | | | — | | | | 3,271,663 | |
Utilities | | | 4,139,602 | | | | — | | | | — | | | | 4,139,602 | |
Preferred Stocks | | | 2,673,954 | | | | 831,300 | | | | — | | | | 3,505,254 | |
Asset-Backed Securities | | | — | | | | 16,960,126 | | | | 1,394,054 | | | | 18,354,180 | |
Mortgage-Backed Obligation | | | — | | | | 2,009,863 | | | | — | | | | 2,009,863 | |
Foreign Government Obligations | | | — | | | | 22,370,175 | | | | — | | | | 22,370,175 | |
Non-Convertible Corporate Bonds and Notes | | | — | | | | 33,187,395 | | | | — | | | | 33,187,395 | |
Convertible Corporate Bonds and Notes | | | — | | | | 2,165,590 | | | | — | | | | 2,165,590 | |
Corporate Loans | | | — | | | | 21,065,769 | | | | — | | | | 21,065,769 | |
Event-Linked Bonds | | | — | | | | 57,364,013 | | | | — | | | | 57,364,013 | |
Structured Security | | | — | | | | 688,365 | | | | — | | | | 688,365 | |
Short-Term Notes | | | — | | | | 86,305,578 | | | | — | | | | 86,305,578 | |
Investment Companies | | | 26,346,916 | | | | — | | | | — | | | | 26,346,916 | |
Exchange-Traded Options Purchased | | | 150,365 | | | | — | | | | — | | | | 150,365 | |
Over-the-Counter Options Purchased | | | — | | | | 1,244,153 | | | | — | | | | 1,244,153 | |
Over-the-Counter Interest Rate Swaptions Purchased | | | — | | | | 443,383 | | | | — | | | | 443,383 | |
| | | | |
Total Investments, at Value | | | 137,804,943 | | | | 255,779,691 | | | | 1,403,369 | | | | 394,988,003 | |
Other Financial Instruments: | | | | | | | | | | | | | | | | |
Forward currency exchange contracts | | | — | | | | 7,550,964 | | | | — | | | | 7,550,964 | |
Futures contracts | | | 286,097 | | | | — | | | | — | | | | 286,097 | |
Centrally cleared swaps, at value | | | — | | | | 446,525 | | | | — | | | | 446,525 | |
Swaps, at value | | | — | | | | 1,702,981 | | | | — | | | | 1,702,981 | |
| | | | |
Total Assets | | $ | 138,091,040 | | | $ | 265,480,161 | | | $ | 1,403,369 | | | $ | 404,974,570 | |
| | | | |
| | | | |
Liabilities Table | | | | | | | | | | | | | | | | |
Other Financial Instruments: | | | | | | | | | | | | | | | | |
Common Stock Securities Sold Short | | $ | (30,256,754 | ) | | $ | (1,677,281 | ) | | $ | — | | | $ | (31,934,035) | |
Forward currency exchange contracts | | | — | | | | (3,402,635 | ) | | | — | | | | (3,402,635) | |
Futures contracts | | | (1,853,555 | ) | | | — | | | | — | | | | (1,853,555) | |
Options written, at value | | | (238,125 | ) | | | (141,233 | ) | | | — | | | | (379,358) | |
Centrally cleared swaps, at value | | | — | | | | (839,881 | ) | | | — | | | | (839,881) | |
Swaps, at value | | | — | | | | (5,328,072 | ) | | | — | | | | (5,328,072) | |
| | | | |
Total Liabilities | | $ | (32,348,434 | ) | | $ | (11,389,102 | ) | | $ | — | | | $ | (43,737,536) | |
| | | | |
31 OPPENHEIMER GLOBAL MULTI-ALTERNATIVES FUND/VA
| | |
NOTES TO CONSOLIDATED FINANCIAL STATEMENTS Continued |
3. Securities Valuation (Continued)
Forward currency exchange contracts and futures contracts, if any, are reported at their unrealized appreciation/depreciation at measurement date, which represents the change in the contract’s value from trade date. All additional assets and liabilities included in the above table are reported at their market value at measurement date.
The table below shows the transfers between Level 1 and Level 2. The Fund’s policy is to recognize transfers in and transfers out as of the beginning of the reporting period.
| | | | | | | | |
| | | Transfers into Level 1* | | | Transfers out of Level 2* | |
| |
Assets Table | | | | | | | | |
Investments, at Value: | | | | | | | | |
Preferred Stocks | | $ | 507,144 | | | $ | (507,144) | |
| | | | |
Total Assets | | $ | 507,144 | | | $ | (507,144) | |
| | | | |
* Transfers from Level 2 to Level 1 are a result of the availability of quoted prices from an active market which were not available and have become available.
4. Investments and Risks
Risks of Foreign Investing. The Fund may invest in foreign securities which are subject to special risks. Securities traded in foreign markets may be less liquid and more volatile than those traded in U.S. markets. Foreign issuers are usually not subject to the same accounting and disclosure requirements that U.S. companies are subject to, which may make it difficult for the Fund to evaluate a foreign company’s operations or financial condition. A change in the value of a foreign currency against the U.S. dollar will result in a change in the U.S. dollar value of investments denominated in that foreign currency and in the value of any income or distributions the Fund may receive on those investments. The value of foreign investments may be affected by exchange control regulations, foreign taxes, higher transaction and other costs, delays in the settlement of transactions, changes in economic or monetary policy in the United States or abroad, expropriation or nationalization of a company’s assets, or other political and economic factors. In addition, due to the inter-relationship of global economies and financial markets, changes in political and economic factors in one country or region could adversely affect conditions in another country or region. Investments in foreign securities may also expose the Fund to time-zone arbitrage risk. Foreign securities may trade on weekends or other days when the Fund does not price its shares. At times, the Fund may emphasize investments in a particular country or region and may be subject to greater risks from adverse events that occur in that country or region. Foreign securities and foreign currencies held in foreign banks and securities depositories may be subject to limited or no regulatory oversight.
Investments in Affiliated Funds. The Fund is permitted to invest in other mutual funds advised by the Manager (“Affiliated Funds”). Affiliated Funds are open-end management investment companies registered under the 1940 Act, as amended. The Manager is the investment adviser of, and the Sub-Adviser provides investment and related advisory services to, the Affiliated Funds. When applicable, the Fund’s investments in Affiliated Funds are included in the Consolidated Statement of Investments. Shares of Affiliated Funds are valued at their net asset value per share. As a shareholder, the Fund is subject to its proportional share of the Affiliated Funds’ expenses, including their management fee. The Manager will waive fees and/or reimburse Fund expenses in an amount equal to the indirect management fees incurred through the Fund’s investment in the Affiliated Funds.
Each of the Affiliated Funds in which the Fund invests has its own investment risks, and those risks can affect the value of the Fund’s investments and therefore the value of the Fund’s shares. To the extent that the Fund invests more of its assets in one Affiliated Fund than in another, the Fund will have greater exposure to the risks of that Affiliated Fund.
Investment in Oppenheimer Institutional Money Market Fund. The Fund is permitted to invest daily available cash balances in a money market Affiliated Fund. The Fund may invest the available cash in Class E shares of Oppenheimer Institutional Money Market Fund (“IMMF”) to seek current income while preserving liquidity or for defensive purposes. IMMF is regulated as a money market fund under the Investment Company Act of 1940, as amended.
Master Limited Partnerships (“MLPs”). MLPs issue common units that represent an equity ownership interest in a partnership and provide limited voting rights. MLP common units are registered with the Securities and Exchange Commission (“SEC”), and are freely tradable on securities exchanges such as the NYSE and the NASDAQ Stock Market (“NASDAQ”), or in the over-the-counter (“OTC”) market. An MLP consists of one or more general partners, who conduct the business, and one or more limited partners, who contribute capital. MLP common unit holders have a limited role in the partnership’s operations and management. The Fund, as a limited partner, normally would not be liable for the debts of the MLP beyond the amounts the Fund has contributed, but would not be shielded to the same extent that a shareholder of a corporation would be. In certain circumstances creditors of an MLP would have the right to seek return of capital distributed to a limited partner. This right of an MLP’s creditors would continue after the Fund sold its investment in the MLP.
Structured Securities. The Fund invests in structured securities whose market values, interest rates and/or redemption prices are linked to the performance of underlying foreign currencies, interest rate spreads, stock market indices, prices of individual securities, commodities or other financial instruments or the occurrence of other specific events. The structured securities are often leveraged, increasing the volatility of each note’s market value relative to the change in the underlying linked financial element or event. Fluctuations in value of these securities are recorded as unrealized gains and losses in the accompanying Consolidated Statement of Operations. The Fund records a realized gain or loss when a structured security is sold or matures.
Event-Linked Bonds. The Fund may invest in “event-linked” bonds. Event-linked bonds, which are sometimes referred to as “catastrophe” bonds, are fixed income securities for which the return of principal and payment of interest is contingent on the non-occurrence of a specific trigger event, such as a
32 OPPENHEIMER GLOBAL MULTI-ALTERNATIVES FUND/VA
4. Investments and Risks (Continued
hurricane, earthquake, or other occurrence that leads to physical or economic loss. If the trigger event occurs prior to maturity, the Fund may lose all or a portion of its principal in addition to interest otherwise due from the security. Event-linked bonds may expose the Fund to certain other risks, including issuer default, adverse regulatory or jurisdictional interpretations, liquidity risk and adverse tax consequences. The Fund records the net change in market value of event-linked bonds on the Consolidated Statement of Operations as a change in unrealized appreciation or depreciation on investments. The Fund records a realized gain or loss on the Consolidated Statement of Operations upon the sale or maturity of such securities.
Loans. The Fund invests in loans made to U.S. and foreign borrowers that are corporations, partnerships or other business entities. The Fund will do so directly as an original lender or by assignment or indirectly through participation agreements or certain derivative instruments. While many of these loans will be collateralized, the Fund can also invest in uncollateralized loans. Loans are often issued in connection with recapitalizations, acquisitions, leveraged buyouts, and refinancing of borrowers. The loans often pay interest at rates that float above (or are adjusted periodically based on) a benchmark that reflects current interest rates although the Fund can also invest in loans with fixed interest rates.
Securities on a When-Issued or Delayed Delivery Basis. The Fund may purchase securities on a “when-issued” basis, and may purchase or sell securities on a “delayed delivery” basis. “When-issued” or “delayed delivery” refers to securities whose terms and indenture are available and for which a market exists, but which are not available for immediate delivery. Delivery and payment for securities that have been purchased by the Fund on a when-issued basis normally takes place within six months and possibly as long as two years or more after the trade date. During this period, such securities do not earn interest, are subject to market fluctuation and may increase or decrease in value prior to their delivery. The purchase of securities on a when-issued basis may increase the volatility of the Fund’s net asset value to the extent the Fund executes such transactions while remaining substantially fully invested. When the Fund engages in when-issued or delayed delivery transactions, it relies on the buyer or seller, as the case may be, to complete the transaction. Their failure to do so may cause the Fund to lose the opportunity to obtain or dispose of the security at a price and yield it considers advantageous. The Fund may also sell securities that it purchased on a when-issued basis or forward commitment prior to settlement of the original purchase.
At period end, the Fund had purchased securities issued on a when-issued or delayed delivery basis as follows:
| | | | |
| | | When-Issued or | |
| | | Delayed Delivery | |
| | | Basis Transactions | |
Purchased securities | | | $250,000 | |
Restricted Securities. At period end, investments in securities included issues that are restricted. A restricted security may have a contractual restriction on its resale and is valued under methods approved by the Board of Trustees as reflecting fair value. Securities that are restricted are marked with an applicable footnote on the Consolidated Statement of Investments. Restricted securities are reported on a schedule following the Consolidated Statement of Investments.
Equity Security Risk. Stocks and other equity securities fluctuate in price. The value of the Fund’s portfolio may be affected by changes in the equity markets generally. Equity markets may experience significant short-term volatility and may fall sharply at times. Different markets may behave differently from each other and U.S. equity markets may move in the opposite direction from one or more foreign stock markets. Adverse events in any part of the equity or fixed-income markets may have unexpected negative effects on other market segments.
The prices of individual equity securities generally do not all move in the same direction at the same time and a variety of factors can affect the price of a particular company’s securities. These factors may include, but are not limited to, poor earnings reports, a loss of customers, litigation against the company, general unfavorable performance of the company’s sector or industry, or changes in government regulations affecting the company or its industry.
Credit Risk. The Fund invests in high-yield, non-investment-grade bonds, which may be subject to a greater degree of credit risk. Credit risk relates to the ability of the issuer to meet interest or principal payments or both as they become due. The Fund may acquire securities that have missed an interest payment, and is not obligated to dispose of securities whose issuers or underlying obligors subsequently miss an interest payment.
Information concerning securities not accruing interest at period end is as follows:
| | | | |
Cost | | | $880,429 | |
Market Value | | | $221,800 | |
Market Value as % of Net Assets | | | 0.05% | |
Sovereign Debt Risk. The Fund invests in sovereign debt securities, which are subject to certain special risks. These risks include, but are not limited to, the risk that a governmental entity may delay or refuse, or otherwise be unable, to pay interest or repay the principal on its sovereign debt. There may also be no legal process for collecting sovereign debt that a government does not pay or bankruptcy proceedings through which all or part of such sovereign debt may be collected. In addition, a restructuring or default of sovereign debt may also cause additional impacts to the financial markets, such as downgrades to credit ratings, reduced liquidity and increased volatility, among others.
33 OPPENHEIMER GLOBAL MULTI-ALTERNATIVES FUND/VA
| | |
NOTES TO CONSOLIDATED FINANCIAL STATEMENTS Continued |
4. Investments and Risks (Continued)
Shareholder Concentration. At period end, two shareholders each owned 20% or more of the Fund’s total outstanding shares comprising 77.08% of the Fund. The shareholders are related parties of the Fund. Related parties may include, but are not limited to, the investment manager and its affiliates, affiliated broker dealers, fund of funds, and directors or employees.
5. Market Risk Factors
The Fund’s investments in securities and/or financial derivatives may expose the fund to various market risk factors:
Commodity Risk. Commodity risk relates to the change in value of commodities or commodity indexes as they relate to increases or decreases in the commodities market. Commodities are physical assets that have tangible properties. Examples of these types of assets are crude oil, heating oil, metals, livestock, and agricultural products.
Credit Risk. Credit risk relates to the ability of the issuer of debt to meet interest and principal payments, or both, as they come due. In general, lower-grade, higher-yield debt securities are subject to credit risk to a greater extent than lower-yield, higher-quality securities.
Equity Risk. Equity risk relates to the change in value of equity securities as they relate to increases or decreases in the general market.
Foreign Exchange Rate Risk. Foreign exchange rate risk relates to the change in the U.S. dollar value of a security held that is denominated in a foreign currency. The U.S. dollar value of a foreign currency denominated security will decrease as the dollar appreciates against the currency, while the U.S. dollar value will increase as the dollar depreciates against the currency.
Interest Rate Risk. Interest rate risk refers to the fluctuations in value of fixed-income securities resulting from the inverse relationship between price and yield. For example, an increase in general interest rates will tend to reduce the market value of already issued fixed-income investments, and a decline in general interest rates will tend to increase their value. In addition, debt securities with longer maturities, which tend to have higher yields, are subject to potentially greater fluctuations in value from changes in interest rates than obligations with shorter maturities.
Volatility Risk. Volatility risk refers to the magnitude of the movement, but not the direction of the movement, in a financial instrument’s price over a defined time period. Large increases or decreases in a financial instrument’s price over a relative time period typically indicate greater volatility risk, while small increases or decreases in its price typically indicate lower volatility risk.
6. Use of Derivatives
The Fund’s investment objective not only permits the Fund to purchase investment securities, it also allows the Fund to enter into various types of derivatives contracts, including, but not limited to, futures contracts, forward currency exchange contracts, credit default swaps, interest rate swaps, total return swaps, variance swaps and purchased and written options. In doing so, the Fund will employ strategies in differing combinations to permit it to increase, decrease, or change the level or types of exposure to market risk factors. These instruments may allow the Fund to pursue its objectives more quickly and efficiently than if it were to make direct purchases or sales of securities capable of effecting a similar response to market factors. Such contracts may be entered into through a bilateral over-the-counter (“OTC”) transaction, or through a securities or futures exchange and cleared through a clearinghouse.
Derivatives may have little or no initial cash investment relative to their market value exposure and therefore can produce significant gains or losses in excess of their cost due to unanticipated changes in the market risk factors and the overall market. This use of embedded leverage allows the Fund to increase its market value exposure relative to its net assets and can substantially increase the volatility of the Fund’s performance. In instances where the Fund is using derivatives to decrease, or hedge, exposures to market risk factors for securities held by the Fund, there are also risks that those derivatives may not perform as expected resulting in losses for the combined or hedged positions. Some derivatives have the potential for unlimited loss, regardless of the size of the Fund’s initial investment.
Additional associated risks from investing in derivatives also exist and potentially could have significant effects on the valuation of the derivative and the Fund. Typically, the associated risks are not the risks that the Fund is attempting to increase or decrease exposure to, per its investment objectives, but are the additional risks from investing in derivatives. Examples of these associated risks are liquidity risk, which is the risk that the Fund will not be able to sell the derivative in the open market in a timely manner, and counterparty credit risk, which is the risk that the counterparty will not fulfill its obligation to the Fund.
The Fund’s actual exposures to these market risk factors and associated risks during the period are discussed in further detail, by derivative type, below.
Forward Currency Exchange Contracts
The Fund may enter into forward currency exchange contracts (“forward contracts”) for the purchase or sale of a foreign currency at a negotiated rate at a future date. Such contracts are traded in the OTC inter-bank currency dealer market.
Forward contracts are reported on a schedule following the Consolidated Statement of Investments. The unrealized appreciation (depreciation) is reported in the Consolidated Statement of Assets and Liabilities as a receivable (or payable) and in the Consolidated Statement of Operations within the change in unrealized appreciation (depreciation). At contract close, the difference between the original cost of the contract and the value at the close date is recorded as a realized gain (loss) in the Consolidated Statement of Operations.
The Fund has entered into forward contracts with the obligation to purchase specified foreign currencies in the future at a currently negotiated forward rate in order to take a positive investment perspective on the related currency. These forward contracts seek to increase exposure to foreign exchange rate risk.
The Fund has entered into forward contracts with the obligation to purchase specified foreign currencies in the future at a currently negotiated forward rate in order to decrease exposure to foreign exchange rate risk associated with foreign currency denominated securities held by the Fund.
34 OPPENHEIMER GLOBAL MULTI-ALTERNATIVES FUND/VA
6. Use of Derivatives (Continued)
The Fund has entered into forward contracts with the obligation to sell specified foreign currencies in the future at a currently negotiated forward rate in order to take a negative investment perspective on the related currency. These forward contracts seek to increase exposure to foreign exchange rate risk.
The Fund has entered into forward contracts with the obligation to sell specified foreign currencies in the future at a currently negotiated forward rate in order to decrease exposure to foreign exchange rate risk associated with foreign currency denominated securities held by the Fund.
During the reporting period, the Fund had daily average contract amounts on forward contracts to buy and sell of $157,702,109 and $238,612,894, respectively.
Additional associated risk to the Fund includes counterparty credit risk. Counterparty credit risk arises from the possibility that the counterparty to a forward contract will default and fail to perform its obligations to the Fund.
Futures Contracts
A futures contract is a commitment to buy or sell a specific amount of a commodity, financial instrument or currency at a negotiated price on a stipulated future date. The Fund may buy and sell futures contracts and may also buy or write put or call options on these futures contracts. Futures contracts and options thereon are generally entered into on a regulated futures exchange and cleared through a clearinghouse associated with the exchange.
Upon entering into a futures contract, the Fund is required to deposit either cash or securities (initial margin) in an amount equal to a certain percentage of the contract value in an account registered in the futures commission merchant’s name. Subsequent payments (variation margin) are paid to or from the futures commission merchant each day equal to the daily changes in the contract value. Such payments are recorded as unrealized gains and losses. Should the Fund fail to make requested variation margin payments, the futures commission merchant can gain access to the initial margin to satisfy the Fund’s payment obligations.
Futures contracts are reported on a schedule following the Consolidated Statement of Investments. Securities held by a futures commission merchant to cover initial margin requirements on open futures contracts are noted in the Consolidated Statement of Investments. Cash held by a futures commission merchant to cover initial margin requirements on open futures contracts and the receivable and/or payable for the daily mark to market for the variation margin are noted in the Consolidated Statement of Assets and Liabilities. The net change in unrealized appreciation and depreciation is reported in the Consolidated Statement of Operations. Realized gains (losses) are reported in the Consolidated Statement of Operations at the closing or expiration of futures contracts.
The Fund has purchased futures contracts on various bonds and notes to increase exposure to interest rate risk.
The Fund has sold futures contracts on various bonds and notes to decrease exposure to interest rate risk.
The Fund has purchased futures contracts on various equity indexes to increase exposure to equity risk.
The Fund has sold futures contracts on various equity indexes to decrease exposure to equity risk.
The Fund has purchased futures contracts, which have values that are linked to the price movement of the related volatility indexes, in order to increase exposure to volatility risk.
The Fund has sold futures contracts, which have values that are linked to the price movement of the related volatility indexes, in order to decrease exposure to volatility risk.
The Fund has purchased futures contracts, which have values that are linked to the price movement of the related commodities, in order to increase exposure to commodity risk.
The Fund has sold futures contracts, which have values that are linked to the price movement of the related commodities, in order to decrease exposure to commodity risk.
During the reporting period, the Fund had an ending monthly average market value of $31,787,851 and $60,869,790 on futures contracts purchased and sold, respectively.
Additional associated risks of entering into futures contracts (and related options) include the possibility that there may be an illiquid market where the Fund is unable to liquidate the contract or enter into an offsetting position and, if used for hedging purposes, the risk that the price of the contract will correlate imperfectly with the prices of the Fund’s securities.
Option Activity
The Fund may buy and sell put and call options, or write put and call options. When an option is written, the Fund receives a premium and becomes obligated to sell or purchase the underlying security, currency or other underlying financial instrument at a fixed price, upon exercise of the option.
Options can be traded through an exchange or through a privately negotiated arrangement with a dealer in an OTC transaction. Options traded through an exchange are generally cleared through a clearinghouse (such as The Options Clearing Corporation). The difference between the premium received or paid, and market value of the option, is recorded as unrealized appreciation or depreciation. The net change in unrealized appreciation or depreciation is reported in the Consolidated Statement of Operations. When an option is exercised, the cost of the security purchased or the proceeds of the security sale are adjusted by the amount of premium received or paid. Upon the expiration or closing of the option transaction, a gain or loss is reported in the Consolidated Statement of Operations.
The Fund has purchased call options on currencies to increase exposure to foreign exchange rate risk. A purchased call option becomes more valuable as the price of the underlying financial instrument appreciates relative to the strike price.
The Fund has purchased put options on currencies to decrease exposure to foreign exchange rate risk. A purchased put option becomes more valuable as the price of the underlying financial instrument depreciates relative to the strike price.
The Fund has purchased call options on treasury and/or euro futures to increase exposure to interest rate risk. A purchased call option becomes more valuable as the price of the underlying financial instrument appreciates relative to the strike price.
35 OPPENHEIMER GLOBAL MULTI-ALTERNATIVES FUND/VA
| | |
NOTES TO CONSOLIDATED FINANCIAL STATEMENTS Continued |
6. Use of Derivatives (Continued)
The Fund has purchased put options on treasury and/or euro futures to decrease exposure to interest rate risk. A purchased put option becomes more valuable as the price of the underlying financial instrument depreciates relative to the strike price.
The Fund has purchased call options on individual equity securities and/or equity indexes to increase exposure to equity risk. A purchased call option becomes more valuable as the price of the underlying financial instrument appreciates relative to the strike price.
During the reporting period, the Fund had an ending monthly average market value of $956,849 and $864,359 on purchased call options and purchased put options, respectively.
Options written, if any, are reported in a schedule following the Consolidated Statement of Investments and as a liability in the Consolidated Statement of Assets and Liabilities. Securities held in collateral accounts to cover potential obligations with respect to outstanding written options are noted in the Consolidated Statement of Investments.
The risk in writing a call option is that the market price of the security increases and if the option is exercised, the Fund must either purchase the security at a higher price for delivery or, if the Fund owns the underlying security, give up the opportunity for profit. The risk in writing a put option is that the Fund may incur a loss if the market price of the security decreases and the option is exercised. The risk in buying an option is that the Fund pays a premium whether or not the option is exercised. The Fund also has the additional risk that there may be an illiquid market where the Fund is unable to close the contract.
The Fund has written put options on currencies to increase exposure to foreign exchange rate risk. A written put option becomes more valuable as the price of the underlying financial instrument appreciates relative to the strike price.
The Fund has written call options on currencies to decrease exposure to foreign exchange rate risk. A written call option becomes more valuable as the price of the underlying financial instrument depreciates relative to the strike price.
The Fund has written put options on individual equity securities and/or equity indexes to increase exposure to equity risk. A written put option becomes more valuable as the price of the underlying financial instrument appreciates relative to the strike price.
The Fund has written call options on individual equity securities and/or equity indexes to decrease exposure to equity risk. A written call option becomes more valuable as the price of the underlying financial instrument depreciates relative to the strike price.
During the reporting period, the Fund had an ending monthly average market value of $748,932 and $692,743 on written call options and written put options, respectively.
Additional associated risks to the Fund include counterparty credit risk and liquidity risk.
Written option activity for the reporting period was as follows:
| | | | | | | | |
| | | Number of Contracts | | | Amount of Premiums | |
Options outstanding as of December 31, 2014 | | | 420,522,917 | | | $ | 1,274,794 | |
Options written | | | 48,222,239,113 | | | | 16,239,222 | |
Options closed or expired | | | (17,046,723,426) | | | | (5,579,412) | |
Options exercised | | | (26,196,034,794) | | | | (11,325,223) | |
| | | | |
Options outstanding as of December 31, 2015 | | | 5,400,003,810 | | | $ | 609,381 | |
| | | | |
Swap Contracts
The Fund may enter into swap contract agreements with a counterparty to exchange a series of cash flows based on either specified reference rates, the price or volatility of asset or non-asset references, or the occurrence of a credit event, over a specified period. Swaps can be executed in a bi-lateral privately negotiated arrangement with a dealer in an OTC transaction (“OTC swaps”) or executed on a regulated market. Certain swaps, regardless of the venue of their execution, are required to be cleared through a clearinghouse (“centrally cleared swaps”). Swap contracts may include interest rate, equity, debt, index, total return, credit default, currency, and volatility swaps.
Swap contracts are reported on a schedule following the Consolidated Statement of Investments. The values of centrally cleared swap and OTC swap contracts are aggregated by positive and negative values and disclosed separately on the Consolidated Statement of Assets and Liabilities. The unrealized appreciation (depreciation) related to the change in the valuation of the notional amount of the swap is combined with the accrued interest due to (owed by) the Fund, if any, at termination or settlement. The net change in this amount during the period is included on the Consolidated Statement of Operations. The Fund also records any periodic payments received from (paid to) the counterparty, including at termination, under such contracts as realized gain (loss) on the Consolidated Statement of Operations.
Swap contract agreements are exposed to the market risk factor of the specific underlying reference rate or asset. Swap contracts are typically more attractively priced compared to similar investments in related cash securities because they isolate the risk to one market risk factor and eliminate the other market risk factors. Investments in cash securities (for instance bonds) have exposure to multiple risk factors (credit and interest rate risk). Because swaps have embedded leverage, they can expose the Fund to substantial risk in the isolated market risk factor.
Credit Default Swap Contracts. A credit default swap is a contract that enables an investor to buy or sell protection against a defined-issuer credit event, such as the issuer’s failure to make timely payments of interest or principal on a debt security, bankruptcy or restructuring. The Fund may enter into credit default swaps either by buying or selling protection on a corporate issuer, sovereign issuer, or a basket or index of issuers (the “reference asset”).
The buyer of protection pays a periodic fee to the seller of protection based on the notional amount of the swap contract. The seller of protection agrees to compensate the buyer of protection for future potential losses as a result of a credit event on the reference asset. The contract effectively transfers the credit event risk of the reference asset from the buyer of protection to the seller of protection.
The ongoing value of the contract will fluctuate throughout the term of the contract based primarily on the credit risk of the reference asset. If the credit quality of the reference asset improves relative to the credit quality at contract initiation, the buyer of protection may have an unrealized loss
36 OPPENHEIMER GLOBAL MULTI-ALTERNATIVES FUND/VA
6. Use of Derivatives (Continued)
greater than the anticipated periodic fee owed. This unrealized loss would be the result of current credit protection being cheaper than the cost of credit protection at contract initiation. If the buyer elects to terminate the contract prior to its maturity, and there has been no credit event, this unrealized loss will become realized. If the contract is held to maturity, and there has been no credit event, the realized loss will be equal to the periodic fee paid over the life of the contract.
If there is a credit event, the buyer of protection can exercise its rights under the contract and receive a payment from the seller of protection equal to the notional amount of the swap less the market value of specified debt securities issued by the reference asset. Upon exercise of the contract the difference between such value and the notional amount is recorded as realized gain (loss) and is included on the Consolidated Statement of Operations.
The Fund has sold credit protection through credit default swaps to increase exposure to the credit risk of individual issuers and/or indexes of issuers that are either unavailable or considered to be less attractive in the bond market.
The Fund has purchased credit protection through credit default swaps to decrease exposure to the credit risk of individual issuers and/or indexes of issuers.
For the reporting period, the Fund had ending monthly average notional amounts of $48,130,170 and $22,771,923 on credit default swaps to buy protection and credit default swaps to sell protection, respectively.
Additional associated risks to the Fund include counterparty credit risk and liquidity risk.
Interest Rate Swap Contracts. An interest rate swap is an agreement between counterparties to exchange periodic payments based on interest rates. One cash flow stream will typically be a floating rate payment based upon a specified floating interest rate while the other is typically a fixed interest rate.
The Fund has entered into interest rate swaps in which it pays a floating interest rate and receives a fixed interest rate in order to increase exposure to interest rate risk. Typically, if relative interest rates rise, payments made by the Fund under a swap agreement will be greater than the payments received by the Fund.
The Fund has entered into interest rate swaps in which it pays a fixed interest rate and receives a floating interest rate in order to decrease exposure to interest rate risk. Typically, if relative interest rates rise, payments received by the Fund under the swap agreement will be greater than the payments made by the Fund.
For the reporting period, the Fund had ending monthly average notional amounts of $14,946,161 and $21,107,460 on interest rate swaps which pay a fixed rate and interest rate swaps which receive a fixed rate, respectively.
Additional associated risks to the Fund include counterparty credit risk and liquidity risk.
Total Return Swap Contracts. A total return swap is an agreement between counterparties to exchange periodic payments based on the value of asset or non-asset references. One cash flow is typically based on a non-asset reference (such as an interest rate) and the other on the total return of a reference asset (such as a security or a basket of securities or securities index). The total return of the reference asset typically includes appreciation or depreciation on the reference asset, plus any interest or dividend payments.
Total return swap contracts are exposed to the market risk factor of the specific underlying financial instrument or index. Total return swaps are less standard in structure than other types of swaps and can isolate and/or include multiple types of market risk factors including equity risk, credit risk, and interest rate risk.
The Fund has entered into total return swaps on various equity securities or indexes to increase exposure to equity risk. These equity risk related total return swaps require the Fund to pay a floating reference interest rate, and an amount equal to the negative price movement of securities or an index (expressed as a percentage) multiplied by the notional amount of the contract. The Fund will receive payments equal to the positive price movement of the same securities or index (expressed as a percentage) multiplied by the notional amount of the contract and, in some cases, dividends paid on the securities.
The Fund has entered into total return swaps on various equity securities or indexes to decrease exposure to equity risk. These equity risk related total return swaps require the Fund to pay an amount equal to the positive price movement of securities or an index (expressed as a percentage) multiplied by the notional amount of the contract and, in some cases, dividends paid on the securities. The Fund will receive payments of a floating reference interest rate and an amount equal to the negative price movement of the same securities or index (expressed as a percentage) multiplied by the notional amount of the contract.
The Fund has entered into total return swaps to increase exposure to the credit risk of various indexes or basket of securities. These credit risk related total return swaps require the Fund to pay to, or receive payments from, the counterparty based on the movement of credit spreads of the related indexes or securities.
The Fund has entered into total return swaps on various commodity indexes to increase exposure to commodity risk. These commodity risk related total return swaps require the Fund to pay a fixed or a floating reference interest rate, and an amount equal to the negative price movement of an index (expressed as a percentage) multiplied by the notional amount of the contract. The Fund will receive payments equal to the positive price movement of the same index (expressed as a percentage) multiplied by the notional amount of the contract.
For the reporting period, the Fund had ending monthly average notional amounts of $124,453,122 and $28,069,144 on total return swaps which are long the reference asset and total return swaps which are short the reference asset, respectively.
Additional associated risks to the Fund include counterparty credit risk and liquidity risk.
Volatility Swap Contracts. A volatility swap is an agreement between counterparties to exchange periodic payments based on the measured volatility of a reference security, index, currency or other reference investment over a specified time frame. One cash flow is typically based on the realized volatility of the reference investment as measured by changes in its price or level over the specified time period while the other cash flow is based on a specified rate representing expected volatility for the reference investment at the time the swap is executed, or the measured volatility of a
37 OPPENHEIMER GLOBAL MULTI-ALTERNATIVES FUND/VA
| | |
NOTES TO CONSOLIDATED FINANCIAL STATEMENTS Continued |
6. Use of Derivatives (Continued)
different reference investment over the specified time period. The appreciation or depreciation on a volatility swap will typically depend on the magnitude of the reference investment’s volatility, or size of the movements in its price, over the specified time period, rather than general directional increases or decreases in its price.
Volatility swaps are less standard in structure than other types of swaps and provide pure, or isolated, exposure to volatility risk of the specific underlying reference investment. Volatility swaps are typically used to speculate on future volatility levels, to trade the spread between realized and expected volatility, or to decrease the volatility exposure of investments held by the Fund.
Variance swaps are a type of volatility swap where counterparties agree to exchange periodic payments based on the measured variance (or the volatility squared) of a reference security, index, or other reference investment over a specified time period. At payment date, a net cash flow will be exchanged based on the difference between the realized variance of the reference investment over the specified time period and the specified rate representing expected variance for the reference investment at the time the swap is executed multiplied by the notional amount of the contract.
The Fund has entered into volatility swaps to increase exposure to the volatility risk of various reference investments. These types of volatility swaps require the Fund to pay the measured volatility and receive a fixed rate payment. If the measured volatility of the related reference investment increases over the period, the swaps will depreciate in value. Conversely, if the measured volatility of the related reference investment decreases over the period, the swaps will appreciate in value.
The Fund has entered into volatility swaps to decrease exposure to the volatility risk of various reference investments. These types of volatility swaps require the Fund to pay a fixed rate payment and receive the measured volatility. If the measured volatility of the related reference investment increases over the period, the swaps will appreciate in value. Conversely, if the measured volatility of the related reference investment decreases over the period, the swaps will depreciate in value.
The Fund has entered into variance swaps to increase exposure to the volatility risk of various reference investments. These types of volatility swaps require the Fund to make a payment if the measured price variance of the reference investment exceeds the specified fixed rate. If the measured variance of the related reference investment increases over the period, the swaps will depreciate in value. Conversely, if the measured variance of the related reference investment decreases over the period, the swaps will appreciate in value.
The Fund has entered into variance swaps to decrease exposure to the volatility risk of various reference investments. These types of volatility swaps require the Fund to make a payment if the measured price variance of the reference asset is less than the specified fixed rate. If the measured variance of the related reference investment increases over the period, the swaps will appreciate in value. Conversely, if the measured variance of the related reference investment decreases over the period, the swaps will depreciate in value.
For the reporting period, the Fund had ending monthly average notional amounts of $38,064 and $27,276 on volatility swaps which pay measured volatility/variance and volatility swaps which receive measured volatility/variance, respectively.
Additional associated risks to the Fund include counterparty credit risk and liquidity risk.
Swaption Transactions
The Fund may enter into a swaption contract which grants the purchaser the right, but not the obligation, to enter into a swap transaction at preset terms detailed in the underlying agreement within a specified period of time. The purchaser pays a premium to the swaption writer who bears the risk of unfavorable changes in the preset terms on the underlying swap.
Purchased swaptions are reported as a component of investments in the Consolidated Statement of Investments and the Consolidated Statement of Assets and Liabilities. Written swaptions are reported on a schedule following the Consolidated Statement of Investments and their value is reported as a separate asset or liability line item in the Consolidated Statement of Assets and Liabilities. The net change in unrealized appreciation or depreciation on written swaptions is separately reported in the Consolidated Statement of Operations. When a swaption is exercised, the cost of the swap is adjusted by the amount of premium paid or received. Upon the expiration or closing of an unexercised swaption contract, a gain or loss is reported in the Consolidated Statement of Operations for the amount of the premium paid or received.
The Fund generally will incur a greater risk when it writes a swaption than when it purchases a swaption. When the Fund writes a swaption it will become obligated, upon exercise of the swaption, according to the terms of the underlying agreement. Swaption contracts written by the Fund do not give rise to counterparty credit risk prior to exercise as they obligate the Fund, not its counterparty, to perform. When the Fund purchases a swaption it only risks losing the amount of the premium it paid if the swaption expires unexercised. However, when the Fund exercises a purchased swaption there is a risk that the counterparty will fail to perform or otherwise default on its obligations under the swaption contract.
The Fund has purchased swaptions which gives it the option to enter into an interest rate swap in which it pays a floating interest rate and receives a fixed interest rate in order to increase exposure to interest rate risk. A purchased swaption of this type becomes more valuable as the reference interest rate decreases relative to the preset interest rate.
The Fund has purchased swaptions which gives it the option to enter into an interest rate swap in which it pays a fixed interest rate and receives a floating interest rate in order to decrease exposure to interest rate risk. A purchased swaption of this type becomes more valuable as the reference interest rate increases relative to the preset interest rate.
During the reporting period, the Fund had an ending monthly average market value of $431,237 on purchased swaptions.
Counterparty Credit Risk. Derivative positions are subject to the risk that the counterparty will not fulfill its obligation to the Fund. The Fund intends to enter into derivative transactions with counterparties that the Manager believes to be creditworthy at the time of the transaction.
The Fund’s risk of loss from counterparty credit risk on OTC derivatives is generally limited to the aggregate unrealized gain netted against any collateral held by the Fund. For OTC options purchased, the Fund bears the risk of loss of the amount of the premiums paid plus the positive change in market values net of any collateral held by the Fund should the counterparty fail to perform under the contracts. Options written by the Fund do not typically give rise to counterparty credit risk, as options written generally obligate the Fund and not the counterparty to perform.
38 OPPENHEIMER GLOBAL MULTI-ALTERNATIVES FUND/VA
6. Use of Derivatives (Continued)
To reduce counterparty risk with respect to OTC transactions, the Fund has entered into master netting arrangements, established within the Fund’s International Swap and Derivatives Association, Inc. (“ISDA”) master agreements, which allow the Fund to make (or to have an entitlement to receive) a single net payment in the event of default (close-out netting) for outstanding payables and receivables with respect to certain OTC positions in swaps, options, swaptions, and forward currency exchange contracts for each individual counterparty. In addition, the Fund may require that certain counterparties post cash and/or securities in collateral accounts to cover their net payment obligations for those derivative contracts subject to ISDA master agreements. If the counterparty fails to perform under these contracts and agreements, the cash and/or securities will be made available to the Fund.
At period end, the Fund has required certain counterparties to post collateral of $3,638,191.
ISDA master agreements include credit related contingent features which allow counterparties to OTC derivatives to terminate derivative contracts prior to maturity in the event that, for example, the Fund’s net assets decline by a stated percentage or the Fund fails to meet the terms of its ISDA master agreements, which would cause the Fund to accelerate payment of any net liability owed to the counterparty.
For financial reporting purposes, the Fund does not offset derivative assets and derivative liabilities that are subject to netting arrangements in the Consolidated Statement of Assets and Liabilities. Bankruptcy or insolvency laws of a particular jurisdiction may impose restrictions on or prohibitions against the right of offset in bankruptcy, insolvency or other events.
The Fund’s risk of loss from counterparty credit risk on exchange-traded derivatives cleared through a clearinghouse and for centrally cleared swaps is generally considered lower than as compared to OTC derivatives. However, counterparty credit risk exists with respect to initial and variation margin deposited/paid by the Fund that is held in futures commission merchant, broker and/or clearinghouse accounts for such exchange-traded derivatives and for centrally cleared swaps.
With respect to centrally cleared swaps, such transactions will be submitted for clearing, and if cleared, will be held in accounts at futures commission merchants or brokers that are members of clearinghouses. While brokers, futures commission merchants and clearinghouses are required to segregate customer margin from their own assets, in the event that a broker, futures commission merchant or clearinghouse becomes insolvent or goes into bankruptcy and at that time there is a shortfall in the aggregate amount of margin held by the broker, futures commission merchant or clearinghouse for all its customers, U.S. bankruptcy laws will typically allocate that shortfall on a pro-rata basis across all the broker’s, futures commission merchant’s or clearinghouse’s customers, potentially resulting in losses to the Fund.
There is the risk that a broker, futures commission merchant or clearinghouse will decline to clear a transaction on the Fund’s behalf, and the Fund may be required to pay a termination fee to the executing broker with whom the Fund initially enters into the transaction. Clearinghouses may also be permitted to terminate centrally cleared swaps at any time. The Fund is also subject to the risk that the broker or futures commission merchant will improperly use the Fund’s assets deposited/paid as initial or variation margin to satisfy payment obligations of another customer. In the event of a default by another customer of the broker or futures commission merchant, the Fund might not receive its variation margin payments from the clearinghouse, due to the manner in which variation margin payments are aggregated for all customers of the broker/futures commission merchant.
Collateral and margin requirements differ by type of derivative. Margin requirements are established by the broker, futures commission merchant or clearinghouse for exchange-traded and cleared derivatives, including centrally cleared swaps. Brokers, futures commission merchants and clearinghouses can ask for margin in excess of the regulatory minimum, or increase the margin amount, in certain circumstances.
Collateral terms are contract specific for OTC derivatives. For derivatives traded under an ISDA master agreement, the collateral requirements are typically calculated by netting the mark to market amount for each transaction under such agreement and comparing that amount to the value of any collateral currently pledged by the Fund or the counterparty.
For financial reporting purposes, cash collateral that has been pledged to cover obligations of the Fund, if any, is reported separately on the Consolidated Statement of Assets and Liabilities as cash pledged as collateral. Non-cash collateral pledged by the Fund, if any, is noted in the Consolidated Statement of Investments. Generally, the amount of collateral due from or to a party must exceed a minimum transfer amount threshold (e.g. $250,000) before a transfer has to be made. To the extent amounts due to the Fund from its counterparties are not fully collateralized, contractually or otherwise, the Fund bears the risk of loss from counterparty nonperformance.
The following table presents by counterparty the Fund’s OTC derivative assets net of the related collateral pledged by the Fund at period end:
| | | | | | | | | | | | | | | | | | | | |
| | | | | | Gross Amounts Not Offset in the Consolidated Statement of Assets &
Liabilities | |
| Counterparty | | Gross Amounts Not
Offset in the
Consolidated Statement
of Assets & Liabilities* | | | Financial Instruments
Available for Offset | | | Financial Instruments
Collateral Received** | | | Cash Collateral
Received** | | | Net Amount | |
Bank of America NA | | $ | 240,163 | | | $ | (240,163 | ) | | $ | — | | | $ | — | | | $ | — | |
Barclays Bank plc | | | 90,105 | | | | (69,903 | ) | | | — | | | | — | | | | 20,202 | |
BNP Paribas | | | 199,252 | | | | — | | | | (90,523 | ) | | | — | | | | 108,729 | |
Citibank NA | | | 2,210,707 | | | | (870,098 | ) | | | (1,340,609 | ) | | | — | | | | — | |
Deutsche Bank AG | | | 275,672�� | | | | (275,672 | ) | | | — | | | | — | | | | — | |
Goldman Sachs Bank USA | | | 1,091,633 | | | | (699,573 | ) | | | (392,060 | ) | | | — | | | | — | |
Goldman Sachs Group, Inc. (The) | | | 2,448,877 | | | | (2,448,877 | ) | | | — | | | | — | | | | — | |
HSBC Bank USA NA | | | 250,530 | | | | (18,229 | ) | | | (232,301 | ) | | | — | | | | — | |
JPMorgan Chase Bank NA | | | 2,506,454 | | | | (2,506,454 | ) | | | — | | | | — | | | | — | |
Morgan Stanley | | | 66,876 | | | | — | | | | — | | | | — | | | | 66,876 | |
Morgan Stanley Capital Services, Inc. | | | 1,296,474 | | | | (410,697 | ) | | | — | | | | (885,777 | ) | | | — | |
Royal Bank of Scotland plc (The) | | | 253 | | | | (253 | ) | | | — | | | | — | | | | — | |
Toronto Dominion Bank | | | 264,485 | | | | (77,857 | ) | | | — | | | | — | | | | 186,628 | |
| | | | |
| | $ | 10,941,481 | | | $ | (7,617,776 | ) | | $ | (2,055,493 | ) | | $ | (885,777 | ) | | $ | 382,435 | |
| | | | |
39 OPPENHEIMER GLOBAL MULTI-ALTERNATIVES FUND/VA
| | |
NOTES TO CONSOLIDATED FINANCIAL STATEMENTS Continued |
6. Use of Derivatives (Continued)
*OTC derivatives are reported gross on the Consolidated Statement of Assets and Liabilities. Exchange traded options and margin related to centrally cleared swaps and futures are excluded from these reported amounts.
**Reported collateral posted for the benefit of the Fund within this table is limited to the net outstanding amount due from an individual counterparty. The collateral posted for the benefit of the Fund may exceed these amounts.
The following table presents by counterparty the Fund’s OTC derivative liabilities net of the related collateral pledged by the Fund at December 31, 2015:
| | | | | | | | | | | | | | | | | | | | |
| | | | | | Gross Amounts Not Offset in the Consolidated Statement of Assets &
Liabilities | | | | |
| Counterparty | | Gross Amounts Not
Offset in the
Consolidated Statement
of Assets & Liabilities* | | | Financial Instruments
Available for Offset | | | Financial Instruments
Collateral Pledged** | | | Cash Collateral
Pledged** | | | Net Amount | |
| |
Bank of America NA | | $ | (717,918) | | | $ | 240,163 | | | $ | 171,965 | | | $ | — | | | $ | (305,790) | |
Barclays Bank plc | | | (69,903) | | | | 69,903 | | | | — | | | | — | | | | — | |
Citibank NA | | | (870,098) | | | | 870,098 | | | | — | | | | — | | | | — | |
Deutsche Bank AG | | | (466,013) | | | | 275,672 | | | | 190,341 | | | | — | | | | — | |
Goldman Sachs Bank USA | | | (699,573) | | | | 699,573 | | | | — | | | | — | | | | — | |
Goldman Sachs Group, Inc. (The) | | | (2,793,389) | | | | 2,448,877 | | | | 344,512 | | | | — | | | | — | |
HSBC Bank USA NA | | | (18,229) | | | | 18,229 | | | | — | | | | — | | | | — | |
JPMorgan Chase Bank NA | | | (2,719,353) | | | | 2,506,454 | | | | 212,899 | | | | — | | | | — | |
Morgan Stanley Capital Services, Inc. | | | (410,697) | | | | 410,697 | | | | — | | | | — | | | | — | |
Royal Bank of Scotland plc (The) | | | (28,910) | | | | 253 | | | | — | | | | — | | | | (28,657) | |
Toronto Dominion Bank | | | (77,857) | | | | 77,857 | | | | — | | | | — | | | | — | |
| | | | |
| | $ | (8,871,940 | ) | | $ | 7,617,776 | | | $ | 919,717 | | | $ | — | | | | $ (334,447) | |
| | | | |
*OTC derivatives are reported gross on the Consolidated Statement of Assets and Liabilities. Exchange traded options and margin related to centrally cleared swaps and futures are excluded from these reported amounts.
**Reported collateral pledged within this table is limited to the net outstanding amount due from the Fund. The securities pledged as collateral by the Fund as reported on the Consolidated Statements of Investments may exceed these amounts.
The following table presents the valuations of derivative instruments by risk exposure as reported within the Consolidated Statement of Assets and Liabilities at period end:
| | | | | | | | | | | | |
| | | Asset Derivatives | | | Liability Derivatives | |
Derivatives Not Accounted
for as Hedging Instruments | | Consolidated Statement of Assets and
Liabilities Location | | Value | | | Consolidated Statement of Assets and
Liabilities Location | | Value | |
Credit contracts | | Swaps, at value | | $ | 228,798 | | | Swaps, at value | | $ | 2,192,167 | |
Equity contracts | | Swaps, at value | | | 1,003,788 | | | Swaps, at value | | | 2,497,934 | |
Interest rate contracts | | Swaps, at value | | | 15,290 | | | | | | | |
Volatility contracts | | Swaps, at value | | | 455,105 | | | Swaps, at value | | | 637,971 | |
Credit contracts | | Centrally cleared swaps, at value | | | 49,142 | | | Centrally cleared swaps, at value | | | 531,447 | |
Interest rate contracts | | Centrally cleared swaps, at value | | | 397,383 | | | Centrally cleared swaps, at value | | | 308,434 | |
Commodity contracts | | Variation margin receivable | | | 15,290* | | | Variation margin payable | | | 183,766* | |
Equity contracts | | Variation margin receivable | | | 534,665* | | | Variation margin payable | | | 323,713* | |
Interest rate contracts | | | | | | | | Variation margin payable | | | 39,376* | |
Volatility contracts | | | | | | | | Variation margin payable | | | 9,900* | |
Foreign exchange contracts | | Unrealized appreciation on foreign currency exchange contracts | | | 7,550,964 | | | Unrealized depreciation on foreign currency exchange contracts | | | 3,402,635 | |
Foreign exchange contracts | | | | | | | | Options written, at value | | | 141,233 | |
Interest rate contracts | | | | | | | | Options written, at value | | | 238,125 | |
Equity contracts | | Investments, at value | | | 48,881** | | | Investments, at value | | | | |
Foreign exchange contracts | | Investments, at value | | | 1,240,862** | | | Investments, at value | | | | |
Interest rate contracts | | Investments, at value | | | 548,158** | | | Investments, at value | | | | |
| | | | | | | | | | | | |
Total | | | | $ | 12,088,326 | | | | | $ | 10,506,701 | |
| | | | | | | | | | | | |
*Includes only the current day’s variation margin. Prior variation margin movements have been reflected in cash on the Consolidated Statement of Assets and Liabilities upon receipt or payment.
**Amounts relate to purchased option contracts and purchased swaption contracts.
The effect of derivative instruments on the Consolidated Statement of Operations is as follows:
| | | | | | | | | | | | | | | | | | | | | | | | |
Amount of Realized Gain or (Loss) Recognized on Derivatives | |
Derivatives Not Accounted
for as Hedging Instruments | | Investment from
unaffiliated
companies (including
premiums on
options exercised)* | | | Closing and
expiration of option
contracts written | | | Closing and
expiration of futures
contracts | | | Foreign currency
transactions | | | Swap contracts | | | Total | |
Commodity contracts | | $ | — | | | $ | — | | | $ | 376,408 | | | $ | — | | | $ | (1,737,450) | | | $ | (1,361,042) | |
Credit contracts | | | — | | | | — | | | | — | | | | — | | | | (2,538,700) | | | | (2,538,700) | |
Equity contracts | | | (825,564) | | | | — | | | | 4,684,800 | | | | — | | | | (2,915,625) | | | | 943,611 | |
Foreign exchange contracts | | | (568,876) | | | | 5,579,412 | | | | — | | | | 5,970,375 | | | | — | | | | 10,980,911 | |
40 OPPENHEIMER GLOBAL MULTI-ALTERNATIVES FUND/VA
6. Use of Derivatives (Continued)
| | | | | | | | | | | | | | | | | | | | | | | | |
| Amount of Realized Gain or (Loss) Recognized on Derivatives (Continued) | |
| |
Derivatives Not Accounted
for as Hedging Instruments | | Investment from
unaffiliated
companies (including
premiums on options exercised)* | | | Closing and
expiration of option
contracts written | | | Closing and
expiration of futures
contracts | | | Foreign currency
transactions | | | Swap contracts | | | Total | |
| |
Interest rate contracts | | | (177,453 | ) | | | — | | | | (160,787) | | | | — | | | | (247,290) | | | | (585,530) | |
Volatility contracts | | | — | | | | — | | | | (40,821) | | | | — | | | | (18,481,728) | | | | (18,522,549) | |
| | | | |
Total | | $ | (1,571,893 | ) | | $ | 5,579,412 | | | $ | 4,859,600 | | | $ | 5,970,375 | | | $ | (25,920,793) | | | $ | (11,083,299) | |
| | | | |
*Includes purchased option contacts, purchased swaption contracts, written option contracts exercised and written swaption contracts exercised, if any.
| | | | | | | | | | | | | | | | | | | | | | | | |
| Amount of Change in Unrealized Gain or (Loss) Recognized on Derivatives | |
| |
Derivatives Not Accounted for
as Hedging Instruments | | Investments* | | | Option contracts
written | | | Futures contracts | | | Translation of assets and
liabilities denominated
in foreign currencies | | | Swap contracts | | | Total | |
| |
Commodity contracts | | $ | — | | | $ | — | | | $ | (87,705) | | | $ | — | | | $ | 280,052 | | | $ | 192,347 | |
Credit contracts | | | — | | | | — | | | | — | | | | — | | | | (2,267,451) | | | | (2,267,451) | |
Equity contracts | | | (537,821) | | | | (112,941) | | | | (868,619) | | | | — | | | | (1,756,669) | | | | (3,276,050) | |
Foreign exchange contracts | | | 550,936 | | | | 264,002 | | | | — | | | | (2,486,130) | | | | — | | | | (1,671,192) | |
Interest rate contracts | | | (229,025) | | | | (51,594) | | | | 19,560 | | | | — | | | | 102,015 | | | | (159,044) | |
Volatility contracts | | | — | | | | — | | | | (10,123) | | | | — | | | | (156,520) | | | | (166,643) | |
| | | | |
Total | | $ | (215,910) | | | $ | 99,467 | | | $ | (946,887) | | | $ | (2,486,130) | | | $ | (3,798,573) | | | $ | (7,348,033) | |
| | | | |
*Includes purchased option contracts and purchased swaption contracts, if any.
7. Shares of Beneficial Interest
The Fund has authorized an unlimited number of $0.001 par value shares of beneficial interest of each class. Transactions in shares of beneficial interest were as follows:
| | | | | | | | | | | | | | | | |
| | | Year Ended December 31, 2015 | | | Year Ended December 31, 2014 | |
| | | Shares | | | Amount | | | Shares | | | Amount | |
| |
Non-Service Shares | | | | | | | | | | | | | | | | |
Sold | | | 15,762,717 | | | $ | 159,728,797 | | | | 24,008,256 | | | $ | 249,427,902 | |
Dividends and/or distributions reinvested | | | 143,442 | | | | 1,382,778 | | | | 1,139,749 | | | | 11,478,135 | |
Redeemed | | | — | | | | — | | | | — | | | | — | |
| | | | |
Net increase | | | 15,906,159 | | | $ | 161,111,575 | | | | 25,148,005 | | | $ | 260,906,037 | |
| | | | |
| | | | | | | | | | | | | | | | |
| |
Service Shares | | | | | | | | | | | | | | | | |
Sold | | | 145,309 | | | $ | 1,456,569 | | | | 143,042 | | | $ | 1,512,896 | |
Dividends and/or distributions reinvested | | | 203 | | | | 1,954 | | | | 5,873 | | | | 59,078 | |
Redeemed | | | (87,055) | | | | (871,516) | | | | (17,184) | | | | (180,391) | |
| | | | |
Net increase | | | 58,457 | | | $ | 587,007 | | | | 131,731 | | | $ | 1,391,583 | |
| | | | |
8. Purchases and Sales of Securities
The aggregate cost of purchases and proceeds from sales of securities, other than short-term obligations and investments in IMMF, for the reporting period were as follows:
| | | | | | | | | | |
| | | Purchases | | | | | Sales | |
Investment securities | | $ | 247,083,277 | | | | | $ | 121,735,358 | |
9. Fees and Other Transactions with Affiliates
Management Fees. Under the investment advisory agreement, the Fund pays the Manager a management fee based on the daily net assets of the Fund at an annual rate as shown in the following table:
| | | | |
Fee Schedule | |
Up to $500 million | | | 1.00% | |
Next $500 million | | | 0.95 | |
Next $4 billion | | | 0.90 | |
Over $5 billion | | | 0.88 | |
The Manager also provides investment management related services to the Subsidiary. The Subsidiary pays the Manager a monthly management fee at an annual rate according to the above schedule. The Subsidiary also pays certain other expenses including custody and directors’ fees.
The Fund’s effective management fee for the reporting period was 1.00% of average annual net assets before any Subsidiary management fees or any applicable waivers.
41 OPPENHEIMER GLOBAL MULTI-ALTERNATIVES FUND/VA
| | |
NOTES TO CONSOLIDATED FINANCIAL STATEMENTS Continued |
9. Fees and Other Transactions with Affiliates (Continued)
Sub-Adviser Fees. The Manager has retained the Sub-Adviser to provide the day-to-day portfolio management of the Fund and the Subsidiary. Under the Sub-Advisory Agreement, the Manager pays the Sub-Adviser an annual fee in monthly installments, equal to a percentage of the investment management fee collected by the Manager from the Fund and the Subsidiary, which shall be calculated after any investment management fee waivers. The fee paid to the Sub-Adviser is paid by the Manager, not by the Fund.
Sub-Sub-Adviser Fees. The Sub-Adviser retains the Sub-Sub-Adviser to provide the day-today portfolio management of the Fund. Under the Sub-Sub-Advisory Agreement, the Sub-Adviser pays the Sub-Sub-Adviser an annual fee in monthly installments, based on the average daily net assets of the Fund. The fee paid to the Sub-Sub-Adviser under the Sub-Sub-Advisory agreement is paid by the Sub-Adviser, not by the Fund.
Transfer Agent Fees. OFI Global (the “Transfer Agent”) serves as the transfer and shareholder servicing agent for the Fund. The Fund pays the Transfer Agent a fee based on annual net assets. Fees incurred and average net assets for each class with respect to these services are detailed in the Consolidated Statement of Operations and Consolidated Financial Highlights, respectively.
Sub-Transfer Agent Fees. The Transfer Agent has retained Shareholder Services, Inc., a wholly-owned subsidiary of OFI (the “Sub-Transfer Agent”), to provide the day-to-day transfer agent and shareholder servicing of the Fund. Under the Sub-Transfer Agency Agreement, the Transfer Agent pays the Sub-Transfer Agent an annual fee in monthly installments, equal to a percentage of the transfer agent fee collected by the Transfer Agent from the Fund, which shall be calculated after any applicable fee waivers. The fee paid to the Sub-Transfer Agent is paid by the Transfer Agent, not by the Fund.
Trustees’ Compensation. The Fund’s Board of Trustees (“Board”) has adopted a compensation deferral plan for Independent Trustees that enables Trustees to elect to defer receipt of all or a portion of the annual compensation they are entitled to receive from the Fund. For purposes of determining the amount owed to the Trustees under the plan, deferred amounts are treated as though equal dollar amounts had been invested in shares of the Fund or in other Oppenheimer funds selected by the Trustees. The Fund purchases shares of the funds selected for deferral by the Trustees in amounts equal to his or her deemed investment, resulting in a Fund asset equal to the deferred compensation liability. Such assets are included as a component of “Other” within the asset section of the Consolidated Statement of Assets and Liabilities. Deferral of Trustees’ fees under the plan will not affect the net assets of the Fund and will not materially affect the Fund’s assets, liabilities or net investment income per share. Amounts will be deferred until distributed in accordance with the compensation deferral plan.
Distribution and Service Plan for Service Shares. The Fund has adopted a Distribution and Service Plan (the “Plan”) pursuant to Rule 12b-1 under the 1940 Act for Service shares to pay OppenheimerFunds Distributor, Inc. (the “Distributor”), for distribution related services, personal service and account maintenance for the Fund’s Service shares. Under the Plan, payments are made periodically at an annual rate of 0.25% of the daily net assets of Service shares of the Fund. The Distributor currently uses all of those fees to compensate sponsors of the insurance product that offers Fund shares, for providing personal service and maintenance of accounts of their variable contract owners that hold Service shares. These fees are paid out of the Fund’s assets on an on-going basis and increase operating expenses of the Service shares, which results in lower performance compared to the Fund’s shares that are not subject to a service fee. Fees incurred by the Fund under the Plan are detailed in the Consolidated Statement of Operations.
Waivers and Reimbursements of Expenses. The Manager has contractually agreed to waive fees and/or reimburse expenses to limit the Fund’s “Expenses after payments, waivers and/or reimbursements and reduction to custodian expenses” (excluding any applicable dividends tied to short sales expense, taxes, interest and fees from borrowing, any subsidiary expenses, Acquired Fund Fees and Expenses, brokerage commissions and certain other Fund expenses) so that, as percentages of average daily net assets, those expenses will not exceed the annual rate of 1.20% for Non-Service shares and 1.45% for Service shares. During the reporting period, the Manager waived fees and/or reimbursed the Fund $3,505 and $25 for Non-Service and Service shares, respectively.
The Manager has contractually agreed to waive the management fee it receives from the Fund in an amount equal to the management fee it receives from the Subsidiary. During the reporting period, the Manager waived $127,233.
The Manager will waive fees and/or reimburse Fund expenses in an amount equal to the indirect management fees incurred through the Fund’s investment in IMMF. During the reporting period, the Manager waived fees and/or reimbursed the Fund $42,174 for IMMF management fees.
Waivers and/or reimbursements may be modified or terminated as set forth according to the terms in the prospectus.
10. Borrowings and Other Financing
Securities Sold Short. The Fund sells securities that it does not own, and it will therefore be obligated to purchase such securities at a future date. Upon entering into a short position, the Fund is required to segregate cash or securities at its custodian which are pledged for the benefit of the lending broker and/or to deposit and pledge cash directly at the lending broker, with a value equal to a certain percentage, exceeding 100%, of the value of the securities that it sold short. Cash that has been segregated and pledged for this purpose will be disclosed on the Consolidated Statement of Assets and Liabilities; securities that have been segregated and pledged for this purpose are disclosed as such in the Consolidated Statement of Investments. The aggregate market value of such cash and securities at period end is $41,023,521. The value of the open short position is recorded as a liability, and the Fund records an unrealized gain or loss to the extent of the difference between the proceeds received and the change in value of the open short position. The Fund records a realized gain or loss when the short position is closed out. By entering into short sales, the Fund bears the market risk of increases in value of the security sold short in excess of the proceeds received. Until the security is replaced, the Fund is required to pay the lender any dividend or interest earned. Dividend expense on short sales is treated as an expense in the Consolidated Statement of Operations.
42 OPPENHEIMER GLOBAL MULTI-ALTERNATIVES FUND/VA
10. Borrowings and Other Financing (Continued)
Joint Credit Facility. A number of mutual funds managed by the Manager participate in a $1.28 billion revolving credit facility (the “Facility”) intended to provide short-term financing, if necessary, subject to certain restrictions in connection with atypical redemption activity. Expenses and fees related to the Facility are paid by the participating funds and are disclosed separately or as other expenses on the Consolidated Statement of Operations. The Fund did not utilize the Facility during the reporting period.
11. Pending Litigation
In 2009, several putative class action lawsuits were filed and later consolidated before the U.S. District Court for the District of Colorado against OppenheimerFunds, Inc. (“OFI”), OppenheimerFunds Distributor, Inc. (“OFDI”), and Oppenheimer Rochester California Municipal Fund, a fund advised by OFI Global Asset Management, Inc. and distributed by the Distributor (the “California Fund”), in connection with the California Fund’s investment performance. The plaintiffs asserted claims against OFI, OFDI and certain present and former trustees and officers of the California Fund under the federal securities laws, alleging, among other things, that the disclosure documents of the California Fund contained misrepresentations and omissions and the investment policies of the California Fund were not followed. Plaintiffs in the suit filed an amended complaint and defendants filed a motion to dismiss. In 2011, the court issued an order which granted in part and denied in part the defendants’ motion to dismiss. In 2012, plaintiffs filed a motion, which defendants opposed, to certify a class and appoint class representatives and class counsel. In March 2015, the court granted plaintiffs’ motion for class certification. In May 2015, the U.S. Court of Appeals for the Tenth Circuit vacated the class certification order and remanded the matter to the district court for further proceedings. In October 2015, the district court reaffirmed its order granting plaintiffs’ motion for class certification. In December 2015, the Tenth Circuit denied defendants’ petition to appeal the district court’s reaffirmed class certification order.
OFI and OFDI believe the suit is without merit; that it is premature to render any opinion as to the likelihood of an outcome unfavorable to them in the suit; and that no estimate can yet be made as to the amount or range of any potential loss. Furthermore, OFI believes that the suit should not impair the ability of OFI or OFDI to perform their respective duties to the Fund and that the outcome of the suit should not have any material effect on the operations of any of the Oppenheimer funds.
43 OPPENHEIMER GLOBAL MULTI-ALTERNATIVES FUND/VA
REPORT OF INDEPENDENT REGISTERED PUBLIC ACCOUNTING FIRM
The Board of Trustees and Shareholders of Oppenheimer Variable Account Funds:
We have audited the accompanying consolidated statement of assets and liabilities of Oppenheimer Global Multi-Alternatives Fund/VA, formerly Oppenheimer Diversified Alternatives Fund/VA, (a separate series of Oppenheimer Variable Account Funds) and subsidiary, including the consolidated statement of investments, as of December 31, 2015, and the related consolidated statement of operations for the year then ended, the consolidated statements of changes in net assets for each of the years in the two-year period then ended, and the consolidated financial highlights for each of the years or periods in the three-year period then ended. These consolidated financial statements and consolidated financial highlights are the responsibility of the Fund’s management. Our responsibility is to express an opinion on these consolidated financial statements and consolidated financial highlights based on our audits.
We conducted our audits in accordance with the standards of the Public Company Accounting Oversight Board (United States). Those standards require that we plan and perform the audit to obtain reasonable assurance about whether the financial statements and financial highlights are free of material misstatement. An audit includes examining, on a test basis, evidence supporting the amounts and disclosures in the financial statements. Our procedures included confirmation of securities owned as of December 31, 2015, by correspondence with the custodian, transfer agent and brokers, or by other appropriate auditing procedures where replies from brokers were not received. An audit also includes assessing the accounting principles used and significant estimates made by management, as well as evaluating the overall financial statement presentation. We believe that our audits provide a reasonable basis for our opinion.
In our opinion, the consolidated financial statements and consolidated financial highlights referred to above present fairly, in all material respects, the financial position of Oppenheimer Global Multi-Alternatives Fund/VA and subsidiary as of December 31, 2015, the results of their operations for the year then ended, the changes in their net assets for each of the years in the two-year period then ended, and the consolidated financial highlights for each of the years or periods in the three-year period then ended, in conformity with U.S. generally accepted accounting principles.
KPMGLLP
Denver, Colorado
February 16, 2016
44 OPPENHEIMER GLOBAL MULTI-ALTERNATIVES FUND/VA
FEDERAL INCOME TAX INFORMATION Unaudited
In early 2016, if applicable, shareholders of record received information regarding all dividends and distributions paid to them by the Fund during calendar year 2015.
Dividends, if any, paid by the Fund during the reporting period which are not designated as capital gain distributions should be multiplied by the maximum amount allowable but not less than 77.76% to arrive at the amount eligible for the corporate dividend-received deduction.
The foregoing information is presented to assist shareholders in reporting distributions received from the Fund to the Internal Revenue Service. Because of the complexity of the federal regulations which may affect your individual tax return and the many variations in state and local tax regulations, we recommend that you consult your tax advisor for specific guidance.
45 OPPENHEIMER GLOBAL MULTI-ALTERNATIVES FUND/VA
BOARD APPROVAL OF THE FUND’S INVESTMENT ADVISORY, SUB-ADVISORY AND SUB-SUB-ADVISORY AGREEMENTS Unaudited
The Fund has entered into an investment advisory agreement with OFI Global Asset Management, Inc. (“OFI Global” or the “Adviser”), a wholly-owned subsidiary of OppenheimerFunds, Inc. (“OFI” or the “Sub-Adviser”). OFI Global has entered into a sub-advisory agreement with OFI whereby OFI provides investment sub-advisory services to the Fund, and OFI has entered into sub-sub-advisory agreements with Cornerstone Real Estate Advisers LLC (“Cornerstone”) and OFI SteelPath, Inc., (“OFI SteelPath”) (jointly the “Sub-Sub-Advisers”) whereby OFI SteelPath and Cornerstone provide investment sub-sub-advisory services to the fund (collectively, all the investment advisory agreements are referred to as the “Agreements”, and “OFI Global”, “OFI”, “OFI SteelPath”, and “Cornerstone” are referred to as the “Managers”). Each year, the Board of Trustees (the “Board”), including a majority of the independent Trustees, is required to determine whether to approve the terms of the Agreements and the renewal thereof. The Investment Company Act of 1940, as amended, requires that the Board request and evaluate, and that the Managers provide, such information as may be reasonably necessary to evaluate the terms of the Agreements. The Board employs an independent consultant to prepare a report that provides information, including comparative information that the Board requests for that purpose. In addition to in-person meetings focused on this evaluation, the Board receives information throughout the year regarding Fund services, fees, expenses and performance.
The Managers and the independent consultant provided information to the Board on the following factors: (i) the nature, quality and extent of the Managers’ services, (ii) the comparative investment performance of the Fund and the Managers, (iii) the fees and expenses of the Fund, including comparative fee and expense information, (iv) the profitability of the Managers and their affiliates, including an analysis of the cost of providing services, (v) whether economies of scale are realized as the Fund grows and whether fee levels reflect these economies of scale for Fund investors and (vi) other benefits to the Managers from their relationship with the Fund. The Board was aware that there are alternatives to retaining the Managers.
Outlined below is a summary of the principal information considered by the Board as well as the Board’s conclusions.
Nature, Quality and Extent of Services. The Board considered information about the nature, quality and extent of the services provided to the Fund and information regarding the Managers’ key personnel who provide such services. The Managers’ duties include providing the Fund with the services of the portfolio managers and the Sub-Sub-Advisers’ investment team, who provide research, analysis and other advisory services in regard to the Fund’s investments; and securities trading services. OFI Global is responsible for oversight of third-party service providers; monitoring compliance with applicable Fund policies and procedures and adherence to the Fund’s investment restrictions; and risk management. OFI Global is also responsible for providing certain administrative services to the Fund as well. Those services include providing and supervising all administrative and clerical personnel who are necessary in order to provide effective corporate administration for the Fund; compiling and maintaining records with respect to the Fund’s operations; preparing and filing reports required by the U.S. Securities and Exchange Commission; preparing periodic reports regarding the operations of the Fund for its shareholders; preparing proxy materials for shareholder meetings; and preparing the registration statements required by federal and state securities laws for the sale of the Fund’s shares. OFI Global also provides the Fund with office space, facilities and equipment.
The Board also considered the quality of the services provided and the quality of the Managers’ resources that are available to the Fund. The Board took account of the fact that the Sub-Adviser has had over fifty years of experience as an investment adviser and that its assets under management rank it among the top mutual fund managers in the United States. The Board evaluated the Managers’ advisory, administrative, accounting, legal, compliance services and risk management, and information the Board has received regarding the experience and professional qualifications of the Managers’ key personnel and the size and functions of its staff. In its evaluation of the quality of the portfolio management services provided, the Board considered the experience of Mark Hamilton, Benjamin Rockmuller, Dokyoung Lee, David Wharmby and Brian Watson, the portfolio managers for the Fund, and the Sub-Sub-Advisers’ investment team and analysts. The Board members also considered the totality of their experiences with the Managers as directors or trustees of the Fund and other funds advised by the Managers. The Board considered information regarding the quality of services provided by affiliates of the Managers, which the Board members have become knowledgeable about through their experiences with the Managers and in connection with the renewal of the Fund’s service agreements. The Board concluded, in light of the Managers’ experience, reputation, personnel, operations and resources that the Fund benefits from the services provided under the Agreements.
Investment Performance of the Managers and the Fund. Throughout the year, the Managers provided information on the investment performance of the Fund, including comparative performance information. The Board also reviewed information, prepared by the Managers and by the independent consultant, comparing the Fund’s historical performance to relevant market indices and to the performance of other multialternative funds underlying variable insurance products. The Board considered that the Fund outperformed its performance category median for the one-year period and ranked in the first quintile for the one-year period. The Board also considered that the Fund was launched on November 14, 2013.
Fees and Expenses of the Fund. The Board reviewed the fees paid to the Adviser and the other expenses borne by the Fund. The Board noted that the Adviser, not the Fund, pays the Sub-Adviser’s fee under the sub-advisory agreement and the Sub-Adviser pays the Sub-Sub-Advisers’ fees under the sub-sub-advisory agreements. The independent consultant provided comparative data in regard to the fees and expenses of the Fund and other retail multialternative funds underlying variable insurance products. In reviewing the fees and expenses charged to the Fund, the Board considered the Adviser’s assertion that, because there is much greater disparity in the fees and services that may be provided by a manager to a VA fund as opposed to a retail fund, when comparing the expenses of the Fund to those of retail funds, it is most appropriate to focus on total expenses (rather than on the management fees). Accordingly, while the Board reviewed and considered all expenses, it focused on total expenses. The Board considered that the Fund’s total expenses, after waivers, were equal to its peer group median and lower than its category median and that its contractual management fees were lower than their peer group median and category median. Within the total asset range of $100 million to $250 million, the Fund’s effective management fee rate was lower than its category median and equal to its peer group median. The Board further considered that the Adviser has contractually agreed to limit the Fund’s total annual operating expenses so that those expenses, as percentages of daily net assets, will not exceed the annual rate of 1.20% for Non-Service Shares and 1.45% for Service Shares. This waiver and/or reimbursement may not be amended or withdrawn for one year from the date of the Fund’s prospectus, unless approved by the Board.
46 OPPENHEIMER GLOBAL MULTI-ALTERNATIVES FUND/VA
Economies of Scale and Profits Realized by the Managers. The Board considered information regarding the Managers’ costs in serving as the Fund’s investment adviser, sub-adviser and sub-sub-advisers, including the costs associated with the personnel and systems necessary to manage the Fund, and information regarding the Managers’ profitability from their relationship with the Fund. The Board reviewed whether the Managers may realize economies of scale in managing and supporting the Fund. The Board noted that the Fund has management fee breakpoints, which are intended to share with Fund shareholders economies of scale that may exist as the Fund’s assets grow.
Other Benefits to the Managers. In addition to considering the profits realized by the Managers, the Board considered information that was provided regarding the direct and indirect benefits the Managers receive as a result of their relationship with the Fund, including compensation paid to the Managers’ affiliates and research provided to the Adviser in connection with permissible brokerage arrangements (soft dollar arrangements).
Conclusions. These factors were also considered by the independent Trustees meeting separately from the full Board, assisted by experienced counsel to the Fund and to the independent Trustees. Fund counsel and the independent Trustees’ counsel are independent of the Managers within the meaning and intent of the Securities and Exchange Commission Rules.
Based on its review of the information it received and its evaluations described above, the Board, including a majority of the independent Trustees, decided to continue the Agreements through August 31, 2016. In arriving at its decision, the Board did not identify any factor or factors as being more important than others, but considered all of the above information, and considered the terms and conditions of the Agreements, including the management fees, in light of all the surrounding circumstances.
47 OPPENHEIMER GLOBAL MULTI-ALTERNATIVES FUND/VA
PORTFOLIO PROXY VOTING POLICIES AND PROCEDURES; UPDATES TO STATEMENTS OF INVESTMENTS Unaudited
The Fund has adopted Portfolio Proxy Voting Policies and Procedures under which the Fund votes proxies relating to securities (“portfolio proxies”) held by the Fund. A description of the Fund’s Portfolio Proxy Voting Policies and Procedures is available (i) without charge, upon request, by calling the Fund toll-free at 1.800.525.7048, (ii) on the Fund’s website at www.oppenheimerfunds.com, and (iii) on the SEC’s website at www.sec.gov. In addition, the Fund is required to file Form N-PX, with its complete proxy voting record for the 12 months ended June 30th, no later than August 31st of each year. The Fund’s voting record is available (i) without charge, upon request, by calling the Fund toll-free at 1.800.525.7048, and (ii) in the Form N-PX filing on the SEC’s website at www.sec.gov.
The Fund files its complete schedule of portfolio holdings with the SEC for the first quarter and the third quarter of each fiscal year on Form N-Q. The Fund’s Form N-Q filings are available on the SEC’s website at www.sec.gov. Those forms may be reviewed and copied at the SEC’s Public Reference Room in Washington, D.C. Information on the operation of the Public Reference Room may be obtained by calling 1-800-SEC-0330.
48 OPPENHEIMER GLOBAL MULTI-ALTERNATIVES FUND/VA
TRUSTEES AND OFFICERS Unaudited
| | |
| |
Name, Position(s) Held with the Fund, Length of
Service, Year of Birth | | Principal Occupation(s) During the Past 5 Years; Other Trusteeships/Directorships Held;
Number of Portfolios in the Fund Complex Currently Overseen |
| |
| INDEPENDENT TRUSTEES | | The address of each Trustee in the chart below is 6803 S. Tucson Way, Centennial, Colorado 80112-3924. Each Trustee serves for an indefinite term, or until his or her resignation, retirement, death or removal. |
| |
Sam Freedman, Chairman of the Board of Trustees and Trustee (since 2013) and Trustee (since 1996) Year of Birth: 1940 | | Director of Colorado UpLIFT (charitable organization) (since September 1984). Mr. Freedman held several positions with the Sub-Adviser and with subsidiary or affiliated companies of the Sub-Adviser (until October 1994). Oversees 47 portfolios in the OppenheimerFunds complex. Mr. Freedman has served on the Boards of certain Oppenheimer funds since 1996, during which time he has become familiar with the Fund’s (and other Oppenheimer funds’) financial, accounting, regulatory and investment matters and has contributed to the Boards’ deliberations. |
| |
Jon S. Fossel, Trustee (since 1990) Year of Birth: 1942 | | Chairman of the Board of Jack Creek Preserve Foundation (non-profit organization) (since 2005); Chairman of the Board (2006-December 2011) and Director (June 2002-December 2011) of UNUMProvident (insurance company); Director of Northwestern Energy Corp. (public utility corporation) (November 2004-December 2009); Director of P.R. Pharmaceuticals (October 1999- October 2003); Director of Rocky Mountain Elk Foundation (non-profit organization) (February 1998-February 2003 and February 2005-February 2007); Chairman and Director (until October 1996) and President and Chief Executive Officer (until October 1995) of the Sub-Adviser; President, Chief Executive Officer and Director of the following: Oppenheimer Acquisition Corp. (“OAC”) (parent holding company of the Sub-Adviser), Shareholders Services, Inc. and Shareholder Financial Services, Inc. (until October 1995). Oversees 47 portfolios in the OppenheimerFunds complex. Mr. Fossel has served on the Boards of certain Oppenheimer funds since 1990, during which time he has become familiar with the Fund’s (and other Oppenheimer funds’) financial, accounting, regulatory and investment matters and has contributed to the Boards’ deliberations. |
| |
Richard F. Grabish, Trustee (since 2012) Year of Birth: 1948 | | Formerly Senior Vice President and Assistant Director of Sales and Marketing (March 1997-December 2007), Director (March 1987-December 2007) and Manager of Private Client Services (June 1985-June 2005) of A.G. Edwards & Sons, Inc. (broker/dealer and investment firm); Chairman and Chief Executive Officer of A.G. Edwards Trust Company, FSB (March 2001-December 2007); President and Vice Chairman of A.G. Edwards Trust Company, FSB (investment adviser) (April 1987-March 2001); President of A.G. Edwards Trust Company, FSB (investment adviser) (June 2005-December 2007). Oversees 47 portfolios in the OppenheimerFunds complex. Mr. Grabish has served on the Boards of certain Oppenheimer funds since 2001, during which time he has become familiar with the Fund’s (and other Oppenheimer funds’) financial, accounting, regulatory and investment matters and has contributed to the Boards’ deliberations. |
| |
Beverly L. Hamilton, Trustee (since 2002) Year of Birth: 1946 | | Trustee of Monterey Institute for International Studies (educational organization) (since February 2000); Board Member of Middlebury College (educational organization) (December 2005-June 2011); Chairman (since 2010) of American Funds’ Emerging Markets Growth Fund, Inc. (mutual fund); Director of The California Endowment (philanthropic organization) (April 2002-April 2008); Director (February 2002-2005) and Chairman of Trustees (2006-2007) of the Community Hospital of Monterey Peninsula; Director (October 1991-2005); Vice Chairman (2006-2009) of American Funds’ Emerging Markets Growth Fund, Inc. (mutual fund); President of ARCO Investment Management Company (February 1991-April 2000); Member of the investment committees of The Rockefeller Foundation (2001-2006) and The University of Michigan (since 2000); Advisor at Credit Suisse First Boston’s Sprout venture capital unit (venture capital fund) (1994-January 2005); Trustee of MassMutual Institutional Funds (investment company) (1996-June 2004); Trustee of MML Series Investment Fund (investment company) (April 1989-June 2004); Member of the investment committee of Hartford Hospital (2000-2003); and Advisor to Unilever (Holland) pension fund (2000-2003). Oversees 47 portfolios in the OppenheimerFunds complex. Ms. Hamilton has served on the Boards of certain Oppenheimer funds since 2002, during which time she has become familiar with the Fund’s (and other Oppenheimer funds’) financial, accounting, regulatory and investment matters and has contributed to the Boards’ deliberations. |
| |
Victoria J. Herget, Trustee (since 2012) Year of Birth: 1951 | | Board Chair (2008-Present) and Director (2004-Present), United Educators (insurance company); Trustee (since 2000) and Chair (since 2010), Newberry Library (independent research library); Trustee, Mather LifeWays (senior living organization) (since 2001); Independent Director of the First American Funds (mutual fund family) (2003-2011); former Managing Director (1993-2001), Principal (1985-1993), Vice President (1978-1985) and Assistant Vice President (1973-1978) of Zurich Scudder Investments (investment adviser) (and its predecessor firms); Trustee (1992-2007), Chair of the Board of Trustees (1999-2007), Investment Committee Chair (1994-1999) and Investment Committee member (2007-2010) of Wellesley College; Trustee, BoardSource (non-profit organization) (2006-2009) and Chicago City Day School (K-8 School) (1994-2005). Oversees 47 portfolios in the OppenheimerFunds complex. Ms. Herget has served on the Boards of certain Oppenheimer funds since 2012, during which time she has become familiar with the Fund’s (and other Oppenheimer funds’) financial, accounting, regulatory and investment matters and has contributed to the Boards’ deliberations. |
| |
Robert J. Malone, Trustee (since 2002) Year of Birth: 1944 | | Chairman - Colorado Market of MidFirst Bank (since January 2015); Chairman of the Board (since 2012) and Director (since August 2005) of Jones International University (educational organization); Trustee of the Gallagher Family Foundation (non-profit organization) (2000-2015); Chairman, Chief Executive Officer and Director of Steele Street Bank Trust (commercial banking) (August 2003-January 2015); Board of Directors of Opera Colorado Foundation (non-profit organization) (2008-2012); Director of Colorado UpLIFT (charitable organization) (1986-2010); Director of Jones Knowledge, Inc. (2006-2010); Former Chairman of U.S. Bank-Colorado (subsidiary of U.S. Bancorp and formerly Colorado National Bank) (July 1996-April 1999); Director of Commercial Assets, Inc. (real estate investment trust) (1993-2000); Director of U.S. Exploration, Inc. (oil and gas exploration) (1997-February 2004); Chairman of the Board (1991-1994) and Trustee (1985-1994) of Regis University; and Chairman of the Board (1990-1991 and Trustee (1984-1999) of Young Presidents Organization. Oversees 47 portfolios in the OppenheimerFunds complex. Mr. Malone has served on the Boards of certain Oppenheimer funds since 2002, during which time he has become familiar with the Fund’s (and other Oppenheimer funds’) financial, accounting, regulatory and investment matters and has contributed to the Boards’ deliberations. |
49 OPPENHEIMER GLOBAL MULTI-ALTERNATIVES FUND/VA
| | |
TRUSTEES AND OFFICERS Unaudited / Continued |
| | |
F. William Marshall, Jr., Trustee (since 2000) Year of Birth: 1942 | | Trustee Emeritus of Worcester Polytech Institute (WPI) (private university) (since 2009); Trustee of MassMutual Select Funds (formerly MassMutual Institutional Funds) (investment company) (since 1996), MML Series Investment Fund (investment company) (since 1996) and Mass Mutual Premier Funds (investment company) (since January 2012); President and Treasurer of the SIS Funds (private charitable fund) (January 1999-March 2011); Former Trustee of WPI (1985-2008); Former Chairman of the Board (2004-2006) and Former Chairman of the Investment Committee of WPI (1994-2008); Chairman of SIS Family Bank, F.S.B. (formerly SIS Bank) (commercial bank) (January 1999-July 1999); Executive Vice President of Peoples Heritage Financial Group, Inc. (commercial bank) (January 1999-July 1999); and Former President and Chief Executive Officer of SIS Bancorp. (1993-1999). Oversees 47 portfolios in the OppenheimerFunds complex. Mr. Marshall has served on the Boards of certain Oppenheimer funds since 2000, during which time he has become familiar with the Fund’s (and other Oppenheimer funds’) financial, accounting, regulatory and investment matters and has contributed to the Boards’ deliberations. |
| |
Karen L. Stuckey, Trustee (since 2012) Year of Birth: 1953 | | Partner (1990-2012) of PricewaterhouseCoopers LLP (professional services firm) (held various positions 1975-1990); Trustee (1992-2006) and member of Executive, Nominating and Audit Committees and Chair of Finance Committee of Lehigh University; and member, Women’s Investment Management Forum (professional organization) since inception. Oversees 47 portfolios in the OppenheimerFunds complex. Ms. Stuckey has served on the Boards of certain Oppenheimer funds since 2012, during which time she has become familiar with the Fund’s (and other Oppenheimer funds’) financial, accounting, regulatory and investment matters and has contributed to the Boards’ deliberations. |
| |
James D. Vaughn, Trustee (since 2012) Year of Birth: 1945 | | Retired; former managing partner (1994-2001) of Denver office of Deloitte & Touche LLP, (held various positions 1969-1993); Trustee and Chairman of the Audit Committee of Schroder Funds (2003-2012); Board member and Chairman of Audit Committee of AMG National Trust Bank (since 2005); Trustee, Investment Committee member, University of South Dakota Foundation (since 1996); Board member, Audit Committee Member and past Board Chair, Junior Achievement (since 1993); former Board member, Mile High United Way, Boys and Girls Clubs, Boy Scouts, Colorado Business Committee for the Arts, Economic Club of Colorado and Metro Denver Network. Oversees 47 portfolios in the OppenheimerFunds complex. Mr. Vaughn has served on the Boards of certain Oppenheimer funds since 2012, during which time he has become familiar with the Fund’s (and other Oppenheimer funds’) financial, accounting, regulatory and investment matters and has contributed to the Boards’ deliberations. |
| | | |
| |
| INTERESTED TRUSTEE AND OFFICER | | Mr. Steinmetz is an “Interested Trustee” because he is affiliated with the Manager and the Sub-Adviser by virtue of his positions as Chairman and director of the Sub-Adviser and officer and director of the Manager. Both as a Trustee and as an officer, Mr. Steinmetz serves for an indefinite term, or until his resignation, retirement, death or removal. Mr. Steinmetz’s address is 225 Liberty Street, New York, New York 10281-1008. |
| |
Arthur P. Steinmetz Trustee (Since 2015), President and Principal Executive Officer (since 2014) Year of Birth: 1958 | | Chairman of the Sub-Adviser (since January 2015); CEO and Chairman of the Manager (since July 2014), President of the Manager (since May 2013), a Director of the Manager (since January 2013), Director of the Sub-Adviser (since July 2014), President, Management Director and CEO of Oppenheimer Acquisition Corp. (the Sub-Adviser’s parent holding company) (since July 2014), and President and Director of OFI SteelPath, Inc. (since January 2013). Chief Investment Officer of the OppenheimerFunds advisory entities from (January 2013-December 2013); Executive Vice President of the Manager (January 2013-May 2013); Chief Investment Officer of the Sub-Adviser (October 2010-December 2012); Chief Investment Officer, Fixed-Income, of the Sub-Adviser (April 2009-October 2010); Executive Vice President of the Sub-Adviser (October 2009-December 2012); Director of Fixed Income of the Sub-Adviser (January 2009-April 2009); and a Senior Vice President of the Sub-Adviser (March 1993-September 2009). An officer of 101 portfolios in the OppenheimerFunds complex. |
| | | |
| |
| OTHER OFFICERS OF THE FUND | | The addresses of the Officers in the chart below are as follows: for Messrs. Hamilton, Lee, Rockmuller, Gabinet, Mss. Sexton and Picciotto, 225 Liberty Street, New York, New York 10281-1008, for Mr. Wixted, 6803 S. Tucson Way, Centennial, Colorado 80112-3924. Each Officer serves for an indefinite term or until his or her resignation, retirement, death or removal. |
| |
Mark Hamilton Vice President (since 2013) Year of Birth: 1965 | | Chief Investment Officer, Asset Allocation of the Sub-Adviser (since April 2013) and a Senior Vice President of the Sub-Adviser (since April 2013). Mr. Hamilton served at AllianceBernstein L.P. (from 1994-2013), as an Investment Director of Dynamic Asset Allocation (from 2010-2013), Head of North American Blend Team (from 2009-2010), and Senior Portfolio Manager of Blend Strategies (from 2006-2010). A portfolio manager and officer of other portfolios in the OppenheimerFunds complex. |
| |
Dokyoung Lee, Vice President (since 2014) Year of Birth: 1965 | | Director of Research, Global Multi-Asset Group (since October 2013) and a Senior Vice President of the Sub-Adviser (since October 2013). Mr. Lee served at Alliance Bernstein L.P. (1994-2013): Director of Research for Strategic Asset Allocation (2011-2013), Director of Research for Blend Strategies (2008-2011), Head of Asia Pacific Blend Strategies (2005-2008), Head of Quantitative Research and Senior Portfolio Manager for Japan Value Equities (2001-2005), Portfolio Manager for Emerging Markets Value Equities (1997-2001), and Quantitative Analyst for US Value Equities (1994-1997). A portfolio manager and officer of other portfolios in the OppenheimerFunds complex. |
| |
Benjamin H. Rockmuller, Vice President (since 2014) Year of Birth: 1979 | | Vice President of the Sub-Adviser (since September 2010); Assistant Vice President of the Sub-Adviser (January 2010-August 2010); Portfolio Manager of the Sub-Adviser (since July 2010); Senior Analyst of the Sub-Adviser for the Global Debt Team (January 2010-July 2010); Intermediate Analyst of the Sub-Adviser for the Global Debt Team (January 2007-January 2010); Junior Analyst of the Sub-Adviser for the Global Debt Team (April 2004-January 2007) and Junior Analyst of the Sub-Adviser for the High Yield Team (June 2003-April 2004). A portfolio manager and an officer in the OppenheimerFunds complex. |
50 OPPENHEIMER GLOBAL MULTI-ALTERNATIVES FUND/VA
| | |
Arthur S. Gabinet, Secretary and Chief Legal Officer (since 2013) Year of Birth: 1958 | | Executive Vice President, Secretary and General Counsel of the Manager (since January 2013); General Counsel OFI SteelPath, Inc. (since January 2013); Executive Vice President (May 2010-December 2012) and General Counsel (since January 2011) of the Sub-Adviser; General Counsel of the Distributor (since January 2011); General Counsel of Centennial Asset Management Corporation (January 2011-December 2012); Executive Vice President (January 2011-December 2012) and General Counsel of HarbourView Asset Management Corporation (since January 2011); Assistant Secretary (since January 2011) and Director (since January 2011) of OppenheimerFunds International Ltd. and OppenheimerFunds plc; Director of Oppenheimer Real Asset Management, Inc. (January 2011-December 2012) and General Counsel (since January 2011); Executive Vice President (January 2011-December 2011) and General Counsel of Shareholder Financial Services, Inc. and Shareholder Services, Inc. (since January 2011); Executive Vice President (January 2011-December 2012) and General Counsel of OFI Private Investments Inc. (since January 2011); Vice President of OppenheimerFunds Legacy Program (January 2011-December 2011); Executive Vice President (January 2011- December 2012) and General Counsel of OFI Institutional Asset Management, Inc. (since January 2011); General Counsel, Asset Management of the Sub-Adviser (May 2010-December 2010); Principal, The Vanguard Group (November 2005-April 2010); District Administrator, U.S. Securities and Exchange Commission (January 2003-October 2005). An officer of 101 portfolios in the OppenheimerFunds complex. |
| |
Jennifer Sexton, Vice President and Chief Business Officer (since 2014) Year of Birth: 1969 | | Senior Vice President of OppenheimerFunds Distributor, Inc. (since June 2014); Vice President of OppenheimerFunds Distributor, Inc. (April 2006-June 2014); Vice President of the Sub-Adviser (January 1998-March 2006); Assistant Vice President of the Sub-Adviser (October 1991-December 1998). An officer of 101 portfolios in the OppenheimerFunds complex. |
| |
Mary Ann Picciotto, Chief Compliance Officer and Chief Anti-Money Laundering Officer (since 2014) Year of Birth: 1973 | | Senior Vice President and Chief Compliance Officer of the Manager (since March 2014); Chief Compliance Officer of the Sub-Adviser, OFI SteelPath, Inc., OFI Global Trust Company, OFI Global Institutional, Inc., Oppenheimer Real Asset Management, Inc., OFI Private Investments, Inc., Harborview Asset Management Corporation, Trinity Investment Management Corporation, and Shareholder Services, Inc. (since March 2014); Managing Director of Morgan Stanley Investment Management Inc. and certain of its various affiliated entities; Chief Compliance Officer of various Morgan Stanley Funds (May 2010-January 2014); Chief Compliance Officer of Morgan Stanley Investment Management Inc. (April 2007-January 2014). An officer of 101 portfolios in the OppenheimerFunds complex. |
| |
Brian W. Wixted, Treasurer and Principal Financial & Accounting Officer (since 2013) Year of Birth: 1959 | | Senior Vice President of the Manager (since January 2013); Treasurer of the Sub-Adviser, HarbourView Asset Management Corporation, Shareholder Financial Services, Inc., Shareholder Services, Inc., and Oppenheimer Real Asset Management, Inc. (March 1999-June 2008), OFI Private Investments, Inc. (March 2000-June 2008), OppenheimerFunds International Ltd. and OppenheimerFunds plc (since May 2000), OFI Institutional Asset Management, Inc. (November 2000-June 2008), and OppenheimerFunds Legacy Program (charitable trust program established by the Sub-Adviser) (June 2003-December 2011); Treasurer and Chief Financial Officer of OFI Trust Company (since May 2000); Assistant Treasurer of Oppenheimer Acquisition Corporation (March 1999-June 2008). An officer of 101 portfolios in the OppenheimerFunds complex. |
The Fund’s Statement of Additional Information contains additional information about the Fund’s Trustees and Officers and is available without charge, upon request, by calling 1.800.988.8287.
51 OPPENHEIMER GLOBAL MULTI-ALTERNATIVES FUND/VA
OPPENHEIMERL GLOBAL MULTI-ALTERNATIVES FUND/VA
A Series of Oppenheimer Variable Account Funds
| | |
| Manager | | OFI Global Asset Management, Inc. |
| |
| Sub-Adviser | | OppenheimerFunds, Inc. |
| |
| Sub-Sub-Advisers | | Cornerstone Real Estate Advisers LLC OFI SteelPath, Inc. |
| |
| Distributor | | OppenheimerFunds Distributor, Inc. |
| |
| Transfer and Shareholder Servicing Agent | | OFI Global Asset Management, Inc. |
| |
| Sub-Transfer Agent | | Shareholder Services, Inc. OppenheimerFunds Services |
| |
Independent Registered Public Accounting Firm | | KPMGLLP |
| |
| Counsel | | Ropes & Gray LLP |
| |
| | Before investing in any of the Oppenheimer funds, investors should carefully consider a fund’s investment objectives, risks, charges and expenses. Fund prospectuses and summary prospectuses contain this and other information about the funds, and may be obtained by asking your financial advisor, or calling us at 1.800.988.8287. Read prospectuses and summary prospectuses carefully before investing. |
| |
| | © 2016 OppenheimerFunds, Inc. All rights reserved. Oppenheimer funds are distributed by OppenheimerFunds Distributor, Inc. |


PORTFOLIO MANAGERS: George R. Evans, CFA, and Robert B. Dunphy, CFA
AVERAGE ANNUAL TOTAL RETURNS FOR THE PERIODS ENDED 12/31/15
| | | | | | | | | | | | | | |
| | | Inception
Date | | 1-Year | | | 5-Year | | | 10-Year | |
Non-Service Shares | | 5/13/92 | | | 3.43 | % | | | 6.51 | % | | | 6.35 | % |
Service Shares | | 3/19/01 | | | 3.11 | | | | 6.23 | | | | 6.01 | |
MSCI AC World ex-U.S. Index | | | | | -5.66 | | | | 1.06 | | | | 2.92 | |
Performance data quoted represents past performance, which does not guarantee future results. The investment return and principal value of an investment in the Fund will fluctuate so that an investor’s shares, when redeemed, may be worth more or less than their original cost. Current performance and expense ratios may be lower or higher than the data quoted. For performance data current to the most recent month end, call us at 1.800.988.8287. The Fund’s total returns should not be expected to be the same as the returns of other funds, whether or not both funds have the same portfolio managers and/or similar names. The Fund’s total returns include changes in share price and reinvested distributions but do not include the charges associated with the separate account products that offer this Fund. Such performance would have been lower if such charges were taken into account.
TOP HOLDINGS AND ALLOCATIONS
| | |
| TOP TEN COMMON STOCK HOLDINGS | | REGIONAL ALLOCATION |
| | | | |
Continental AG | | | 1.8% | |
Infineon Technologies AG | | | 1.7 | |
Dollarama, Inc. | | | 1.6 | |
Novo Nordisk AS, Cl. B | | | 1.6 | |
Nippon Telegraph & Telephone Corp. | | | 1.6 | |
Carnival Corp. | | | 1.5 | |
Valeo SA | | | 1.5 | |
Aalberts Industries NV | | | 1.4 | |
Vodafone Group plc | | | 1.4 | |
Heineken NV | | | 1.4 | |
Portfolio holdings and allocations are subject to change. Percentages are as of December 31, 2015, and are based on net assets. For more current Fund holdings, please visit oppenheimerfunds.com.
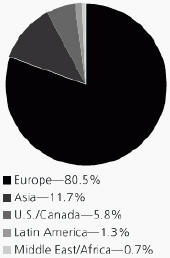
Portfolio holdings and allocations are subject to change. Percentages are as of December 31, 2015, and are based on the total market value of investments.
2 OPPENHEIMER INTERNATIONAL GROWTH FUND/VA
Fund Performance Discussion
The Fund’s Non-Service shares produced a total return of 3.43% during the reporting period. In comparison, the Fund’s benchmark, the MSCI AC World ex-U.S. Index (the “Index”), returned -5.66% during the same period. The Fund was able to outperform the Index in a volatile period for global equities. Although past performance cannot guarantee future results, the fact that we seek to invest in high-quality companies has the potential to lead to outperformance during periods of sharp downward volatility. As investors seek safety, they are more drawn to companies with the pricing power, steady growth potential, low cyclicality and strong balance sheets that characterize the businesses in which we invest.
On a sector basis, the Fund outperformed the Index in eight out of ten sectors during the reporting period, led by stock selection in materials, consumer discretionary and information technology. The Fund underperformed the Index within the consumer staples and industrials sectors due to stock selection.
MARKET OVERVIEW
2015 will go down as a year in which volatility returned to the financial markets following a multi-year hiatus. Global growth struggled to gain traction as many of the world’s largest economies expanded below their long-term trends. China’s industrial production slowed for the fifth consecutive year and weighed on the world’s exporters—especially commodity producers. In the United States, a strong dollar impaired the competitiveness of many American companies and proved to be a drag on corporate earnings.
The generally disappointing performance of global equity markets was marked by pockets of significant weakness in the energy sector and many emerging markets. U.S. equities generally outperformed their counterparts in other regions in 2015, though with tempered results and only after a market correction in August that tested investors’ nerves. Interest rates globally remained low, even as investors spent most of the year contemplating the first U.S. interest-rate hike by the Federal Reserve (the “Fed”) in almost a decade. The Fed did not raise interest rates until late in the year at its December 16 meeting, when the benchmark federal funds rate was raised by 0.25%.
TOP INDIVIDUAL CONTRIBUTORS
Top contributors to performance this period included Nippon Telegraph and Telephone Corp., Galenica AG and Infineon Technologies AG. Nippon Telegraph and Telephone’s stock price benefited as the company continued to improve its operational performance and return more capital to shareholders. Galenica is a Swiss health care company that develops, manufactures and markets pharmaceutical products, and runs pharmacies. We are interested in the pharmaceutical arm, Vifor. It has an injectable iron drug with “broad label” application approval and a patent life until 2027. The drug has been taken up by the medical community in Switzerland for treating many conditions, including anemia. Vifor is now targeting the U.S., and we believe that the addressable market offers significant growth potential for the company’s earnings. During the reporting period, Galenica announced that it intends to strengthen Vifor’s pipeline, through acquisitions and partnerships, with an eye to spinning it off over the next few years; this affected the stock price positively. Infineon is a German semiconductor manufacturer whose chips are widely used in three main areas: power management and control, automobiles and chip cards and security. In our opinion, these areas will drive secular demand for chips for some time, and Infineon is one of the best placed companies to benefit from this growth in demand and pricing power. During the reporting period, the stock price rose when the company announced earnings that were ahead of analyst expectations.
TOP INDIVIDUAL DETRACTORS
Top individual detractors from performance included Aryzta AG, Hudson’s Bay Co. and Rolls-Royce Holdings plc. Aryzta is a Swiss manufacturer of baked goods. During the reporting period, the company announced a 49% acquisition of Picard, a French frozen food company. This was a surprise, as the company had not signaled the possibility of a large scale investment, or the possibility that they would diversify outside of baked goods. Investors reacted negatively to this news. The other near-term challenge for Aryzta has been sluggish trends in the fast food industry, where it is a supplier to some of the biggest players. We believe the Picard investment, though not an obvious fit, holds some promise. Aryzta’s management also has a good track record of allocating capital. Hudson’s Bay is the Toronto-based owner of Saks Fifth Avenue. In addition to Saks Fifth Avenue, Hudson’s Bay’s portfolio of retailers includes its namesake chain in Canada; Saks OFF 5th; Lord & Taylor; and Galeria Kaufhof, a high-end German retailer that it recently acquired. In most cases, Hudson’s Bay also owns the buildings in which its stores operate, and the land upon which they stand. Over the past year, Hudson’s Bay has been taking advantage of relatively low interest rates to monetize their properties. It’s a classic case of financial restructuring. Put simply, Hudson’s Bay is monetizing assets to cover the cost of upgrading and expanding its operations. Its goal is to widen margins by increasing sales per square foot, and by taking better advantage of scale. To accomplish this, the company is renovating its 10 largest stores by sales volume for each retail chain and investing in digital infrastructure across its entire fleet of stores. After reaching record highs, the stock pulled back significantly when the company announced disappointing earnings for the third quarter when it, and many other retailers, such as
3 OPPENHEIMER INTERNATIONAL GROWTH FUND/VA
Nordstrom’s suffered from weak demand. Rolls-Royce Holdings, based in the U.K. is one of the world’s largest aircraft engine makers. Rolls-Royce’s share price fell sharply in November 2015 after the company issued its fifth profit warning in less than two years.
STRATEGY & OUTLOOK
As we look ahead, we expect that the adjustments necessitated by China’s rebalancing will continue to cause market volatility. However, we are fairly sanguine on the outlook for overall world growth, albeit slow. In our opinion, this economic cycle is likely to be very long, with slightly higher—but still relatively low—interest rates and subdued inflation. In this environment, properly managed growth companies can perform well and support higher than average valuations. The U.S. has largely recovered. The outlook for European companies is relatively positive—despite the muted macroeconomy—due to their earnings momentum, improved operating leverage, and the liquidity the European Central Bank continues to inject into the system. That said, we simply do not try to right-size the portfolio for any particular macroeconomic environment. Our discipline is long-term investment in companies that can monetize secular growth trends to create wealth for their shareholders.
As we have often said before, volatility is our friend. We understand that it is uncomfortable for investors, so we attempt to dampen it in the portfolio by investing in a large number of companies in relatively equal amounts. But down markets give us the opportunity to buy stocks at prices that we could not get when sentiment is optimistic. As the market has pulled back, we have bought more shares in companies we already own and taken the opportunity to acquire some new ones that we have coveted for some time.
Investors should consider the Fund’s investment objective, risks, charges and expenses carefully before investing. The Fund’s prospectus and summary prospectus contain this and other information about the Fund, and may be obtained by asking your financial advisor or calling us at 1.800.988.8287. Read prospectuses and summary prospectuses carefully before investing.
Total returns include changes in share price and reinvestment of dividends and capital gains distributions in a hypothetical investment for the periods shown.
The Fund’s investment strategy and focus can change over time. The mention of specific Fund holdings does not constitute a recommendation by OppenheimerFunds, Inc. or its affiliates.
Shares of Oppenheimer funds are not deposits or obligations of any bank, are not guaranteed by any bank, are not insured by the FDIC or any other agency, and involve investment risks, including the possible loss of the principal amount invested.
Comparing the Fund’s Performance to the Market. The graphs that follow show the performance of a hypothetical $10,000 investment in each share class of the Fund held until December 31, 2015. Performance is measured over a ten-fiscal-year period for both Classes. Performance information does not reflect charges that apply to separate accounts investing in the Fund. If these charges were taken into account, performance would be lower. The graphs assume that all dividends and capital gains distributions were reinvested in additional shares.
The Fund’s performance is compared to the performance of the MSCI AC World ex-U.S. Index. The MSCI AC World ex-U.S. Index is designed to measure the equity market performance of developed and emerging markets and excludes the U.S. The Index is unmanaged and cannot be purchased directly by investors. While index comparisons may be useful to provide a benchmark for the Fund’s performance, it must be noted that the Fund’s investments are not limited to the investments comprising the Index. Index performance includes reinvestment of income, but does not reflect transaction costs, fees, expenses or taxes. Index performance is shown for illustrative purposes only as a benchmark for the Fund’s performance, and does not predict or depict performance of the Fund. The Fund’s performance reflects the effects of the Fund’s business and operating expenses.
4 OPPENHEIMER INTERNATIONAL GROWTH FUND/VA
COMPARISON OF CHANGE IN VALUE OF $10,000 HYPOTHETICAL INVESTMENTS IN:
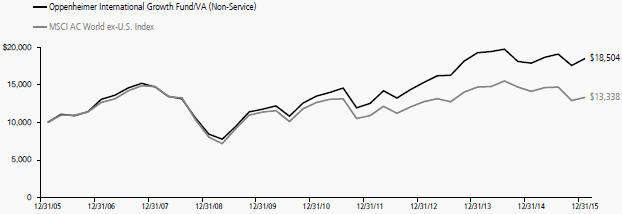
COMPARISON OF CHANGE IN VALUE OF $10,000 HYPOTHETICAL INVESTMENTS IN:
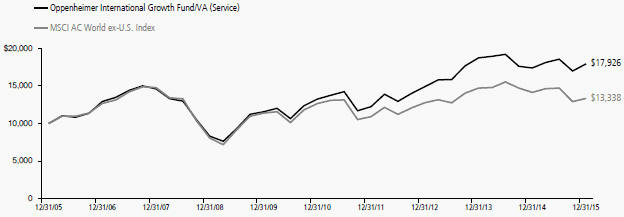
Performance data quoted represents past performance, which does not guarantee future results. The investment return and principal value of an investment in the Fund will fluctuate so that an investor’s shares, when redeemed, may be worth more or less than their original cost. Current performance may be lower or higher than the performance quoted. For performance data current to the most recent month end, call us at 1.800.988.8287. The Fund’s total returns should not be expected to be the same as the returns of other funds, whether or not both funds have the same portfolio managers and/or similar names. The Fund’s total returns include changes in share price and reinvested distributions but do not include the charges associated with the separate account products that offer this Fund. Such performance would have been lower if such charges were taken into account.
5 OPPENHEIMER INTERNATIONAL GROWTH FUND/VA
Fund Expenses
Fund Expenses. As a shareholder of the Fund, you incur two types of costs: (1) transaction costs and (2) ongoing costs, including management fees; distribution and service fees; and other Fund expenses. These examples are intended to help you understand your ongoing costs (in dollars) of investing in the Fund and to compare these costs with the ongoing costs of investing in other mutual funds.
The examples are based on an investment of $1,000.00 invested at the beginning of the period and held for the entire 6-month period ended December 31, 2015.
Actual Expenses. The first section of the table provides information about actual account values and actual expenses. You may use the information in this section for the class of shares you hold, together with the amount you invested, to estimate the expense that you paid over the period. Simply divide your account value by $1,000.00 (for example, an $8,600.00 account value divided by $1,000.00 = 8.60), then multiply the result by the number in the first section under the heading entitled “Expenses Paid During 6 months Ended December 31, 2015” to estimate the expenses you paid on your account during this period.
Hypothetical Example for Comparison Purposes.
The second section of the table provides information about hypothetical account values and hypothetical expenses based on the Fund’s actual expense ratio for each class of shares, and an assumed rate of return of 5% per year for each class before expenses, which is not the actual return. The hypothetical account values and expenses may not be used to estimate the actual ending account balance or expenses you paid for the period. You may use this information to compare the ongoing costs of investing in the Fund and other funds. To do so, compare this 5% hypothetical example for the class of shares you hold with the 5% hypothetical examples that appear in the shareholder reports of the other funds.
Please note that the expenses shown in the table are meant to highlight your ongoing fund costs only and do not reflect any charges associated with the separate accounts that offer this Fund. Therefore, the “hypothetical” lines of the table are useful in comparing ongoing fund costs only, and will not help you determine the relative total costs of owning different funds. In addition, if these separate account charges were included your costs would have been higher.
| | | | | | | | | | | | |
| Actual | | Beginning
Account
Value
July 1, 2015 | | | Ending Account Value
December 31, 2015 | | | Expenses Paid During 6 Months Ended
December 31, 2015 | |
Non-Service shares | | $ | 1,000.00 | | | $ | 969.20 | | | $ | 4.98 | |
Service shares | | | 1,000.00 | | | | 966.20 | | | | 6.21 | |
| | | |
Hypothetical (5% return before expenses) | | | | | | | | | |
Non-Service shares | | | 1,000.00 | | | | 1,020.16 | | | | 5.10 | |
Service shares | | | 1,000.00 | | | | 1,018.90 | | | | 6.38 | |
Expenses are equal to the Fund’s annualized expense ratio for that class, multiplied by the average account value over the period, multiplied by 184/365 (to reflect the one-half year period). Those annualized expense ratios, excluding indirect expenses from affiliated funds, based on the 6-month period ended December 31, 2015 are as follows:
| | | | |
| Class | | Expense Ratios | |
Non-Service shares | | | 1.00% | |
Service shares | | | 1.25 | |
The expense ratios reflect voluntary and/or contractual waivers and/or reimbursements of expenses by the Fund’s Manager. Some of these undertakings may be modified or terminated at any time, as indicated in the Fund’s prospectus. The “Financial Highlights” tables in the Fund’s financial statements, included in this report, also show the gross expense ratios, without such waivers or reimbursements and reduction to custodian expenses, if applicable.
6 OPPENHEIMER INTERNATIONAL GROWTH FUND/VA
STATEMENT OF INVESTMENTS December 31, 2015
| | | | | | | | |
| | | Shares | | | Value | |
Common Stocks—99.2% | |
Consumer Discretionary—22.6% | |
Auto Components—3.3% | |
Continental AG | | | 36,089 | | | $ | 8,759,364 | |
Valeo SA | | | 47,321 | | | | 7,305,645 | |
| | | | | | | 16,065,009 | |
| | | | | | | | | |
Automobiles—1.8% | |
| Bayerische Motoren Werke AG | | | 37,294 | | | | 3,927,749 | |
Hero MotoCorp Ltd. | | | 123,994 | | | | 5,020,519 | |
| | | | | | | 8,948,268 | |
| | | | | | | | | |
Diversified Consumer Services—0.9% | |
Dignity plc | | | 108,987 | | | | 4,084,698 | |
| | | | | | | | | |
Hotels, Restaurants & Leisure—4.0% | |
Carnival Corp. | | | 136,500 | | | | 7,436,520 | |
Domino’s Pizza Group plc | | | 376,558 | | | | 5,831,699 | |
William Hill plc | | | 1,075,797 | | | | 6,277,835 | |
| | | | | | | 19,546,054 | |
| | | | | | | | |
Household Durables—1.1% | |
SEB SA | | | 52,340 | | | | 5,371,010 | |
| | | | | | | | | |
Media—3.7% | | | | | | | | |
| Grupo Televisa SAB, Sponsored ADR | | | 135,130 | | | | 3,676,887 | |
ProSiebenSat.1 Media SE | | | 110,217 | | | | 5,575,219 | |
SES SA | | | 129,540 | | | | 3,590,781 | |
Sky plc | | | 316,738 | | | | 5,182,132 | |
| | | | | | | 18,025,019 | |
| | | | | | | | | |
Multiline Retail—2.5% | | | | | | | | |
Dollarama, Inc. | | | 135,619 | | | | 7,835,067 | |
Hudson’s Bay Co. | | | 338,368 | | | | 4,426,148 | |
| | | | | | | 12,261,215 | |
| | | | | | | | | |
Specialty Retail—0.9% | |
Industria de Diseno Textil SA | | | 126,502 | | | | 4,341,076 | |
Textiles, Apparel & Luxury Goods—4.4% | |
Burberry Group plc | | | 249,401 | | | | 4,386,687 | |
Cie Financiere Richemont SA | | | 64,510 | | | | 4,633,971 | |
Hermes International | | | 13,266 | | | | 4,472,791 | |
| LVMH Moet Hennessy Louis Vuitton SE | | | 28,410 | | | | 4,441,241 | |
Swatch Group AG (The) | | | 9,671 | | | | 3,374,946 | |
| | | | | | | 21,309,636 | |
| | | | | | | | | |
Consumer Staples—10.6% | | | | | | | | |
Beverages—2.6% | | | | | | | | |
Diageo plc | | | 94,048 | | | | 2,564,735 | |
Heineken NV | | | 78,063 | | | | 6,662,556 | |
Pernod Ricard SA | | | 30,160 | | | | 3,428,921 | |
| | | | | | | 12,656,212 | |
| | | | | | | | | |
Food & Staples Retailing—1.6% | |
CP ALL PCL | | | 3,949,800 | | | | 4,283,583 | |
Spar Group Ltd. (The) | | | 311,065 | | | | 3,696,209 | |
| | | | | | | 7,979,792 | |
| | | | | | | | | |
Food Products—4.6% | |
Aryzta AG1 | | | 101,738 | | | | 5,147,537 | |
Barry Callebaut AG1 | | | 4,106 | | | | 4,478,118 | |
Danone SA | | | 51,136 | | | | 3,451,035 | |
Saputo, Inc. | | | 196,754 | | | | 4,706,625 | |
Unilever plc | | | 108,345 | | | | 4,639,092 | |
| | | | | | | 22,422,407 | |
| | | | | | | | | |
Household Products—1.2% | | | | | | | | |
Reckitt Benckiser Group plc | | | 61,430 | | | | 5,654,566 | |
Tobacco—0.6% | | | | | | | | |
Swedish Match AB | | | 84,892 | | | | 3,003,440 | |
| | | | | | | | |
| | | Shares | | | Value | |
Energy—1.2% | | | | | | | | |
Energy Equipment & Services—0.3% | |
Technip SA | | | 34,880 | | | $ | 1,722,934 | |
| | | | | | | | | |
Oil, Gas & Consumable Fuels—0.9% | |
Koninklijke Vopak NV | | | 101,661 | | | | 4,371,876 | |
| | | | | | | | | |
Financials—4.0% | | | | | | | | |
Capital Markets—2.4% | | | | | | | | |
ICAP plc | | | 840,907 | | | | 6,312,633 | |
Tullett Prebon plc | | | 278,544 | | | | 1,524,898 | |
UBS Group AG | | | 212,841 | | | | 4,095,891 | |
| | | | | | | 11,933,422 | |
| | | | | | | | | |
Commercial Banks—0.6% | | | | | | | | |
| ICICI Bank Ltd., Sponsored ADR | | | 360,915 | | | | 2,825,965 | |
| | | | | | | | | |
Insurance—1.0% | | | | | | | | |
Prudential plc | | | 212,727 | | | | 4,762,512 | |
| | | | | | | | | |
Health Care—11.4% | | | | | | | | |
Biotechnology—2.5% | | | | | | | | |
CSL Ltd. | | | 75,900 | | | | 5,786,847 | |
Grifols SA | | | 135,398 | | | | 6,233,158 | |
| | | | | | | 12,020,005 | |
| | | | | | | | | |
Health Care Equipment & Supplies—3.4% | |
Coloplast AS, Cl. B | | | 62,482 | | | | 5,043,333 | |
Essilor International SA | | | 31,100 | | | | 3,876,801 | |
Sonova Holding AG | | | 33,477 | | | | 4,249,781 | |
William Demant Holding AS1 | | | 37,120 | | | | 3,525,235 | |
| | | | | | | 16,695,150 | |
| | | | | | | | | |
Health Care Providers & Services—0.3% | |
Sonic Healthcare Ltd. | | | 133,525 | | | | 1,730,129 | |
| | | | | | | | | |
Life Sciences Tools & Services—1.0% | |
Lonza Group AG1 | | | 29,350 | | | | 4,771,543 | |
| | | | | | | | | |
Pharmaceuticals—4.2% | | | | | | | | |
Galenica AG | | | 3,776 | | | | 5,887,271 | |
Novo Nordisk AS, Cl. B | | | 136,065 | | | | 7,821,069 | |
Roche Holding AG | | | 23,966 | | | | 6,604,745 | |
| | | | | | | 20,313,085 | |
| | | | | | | | | |
Industrials—20.0% | | | | | | | | |
Aerospace & Defense—2.6% | | | | | | | | |
Airbus Group SE | | | 98,940 | | | | 6,643,176 | |
Embraer SA | | | 334,126 | | | | 2,472,488 | |
Rolls-Royce Holdings plc1 | | | 436,456 | | | | 3,694,368 | |
| | | | | | | 12,810,032 | |
| | | | | | | | | |
Air Freight & Couriers—1.0% | | | | | |
Royal Mail plc | | | 718,415 | | | | 4,674,863 | |
| | | | | | | | | |
Commercial Services & Supplies—2.1% | | | | | |
Aggreko plc | | | 173,687 | | | | 2,336,243 | |
Edenred | | | 217,644 | | | | 4,100,634 | |
Prosegur Cia de Seguridad SA | | | 804,658 | | | | 3,715,051 | |
| | | | | | | 10,151,928 | |
| | | | | | | | |
Construction & Engineering—1.2% | | | | | |
Boskalis Westminster | | | 77,699 | | | | 3,165,252 | |
CIMIC Group Ltd. | | | 142,785 | | | | 2,506,184 | |
| | | | | | | 5,671,436 | |
| | | | | | | | | |
Electrical Equipment—3.3% | | | | | |
ABB Ltd.1 | | | 105,324 | | | | 1,869,506 | |
Legrand SA | | | 80,120 | | | | 4,522,041 | |
Nidec Corp. | | | 84,600 | | | | 6,123,549 | |
Schneider Electric SE | | | 60,040 | | | | 3,418,430 | |
| | | | | | | 15,933,526 | |
7 OPPENHEIMER INTERNATIONAL GROWTH FUND/VA
STATEMENT OF INVESTMENTS Continued
| | | | | | | | |
| | | Shares | | | Value | |
Machinery—2.6% | | | | | | | | |
Aalberts Industries NV | | | 197,431 | | | $ | 6,789,885 | |
Atlas Copco AB, Cl. A | | | 193,729 | | | | 4,719,558 | |
Weir Group plc (The) | | | 88,529 | | | | 1,302,176 | |
| | | | | | | 12,811,619 | |
| | | | | | | | | |
Professional Services—2.7% | | | | | | | | |
Experian plc | | | 269,590 | | | | 4,763,788 | |
Intertek Group plc | | | 130,230 | | | | 5,325,998 | |
SGS SA | | | 1,637 | | | | 3,118,634 | |
| | | | | | | 13,208,420 | |
| | | | | | | | | |
Trading Companies & Distributors—4.5% | | | | | |
Brenntag AG | | | 97,599 | | | | 5,093,917 | |
Bunzl plc | | | 231,362 | | | | 6,391,097 | |
Travis Perkins plc | | | 186,387 | | | | 5,385,379 | |
Wolseley plc | | | 92,133 | | | | 5,008,244 | |
| | | | | | | 21,878,637 | |
| | | | | | | | | |
Information Technology—17.4% | |
Communications Equipment—2.1% | |
Nokia OYJ | | | 748,280 | | | | 5,327,029 | |
| Telefonaktiebolaget LM Ericsson, Cl. B | | | 519,113 | | | | 5,028,494 | |
| | | | | | | 10,355,523 | |
| | | | | | | | | |
Electronic Equipment, Instruments, & Components—2.8% | |
Hoya Corp. | | | 135,293 | | | | 5,515,719 | |
Keyence Corp. | | | 9,906 | | | | 5,436,863 | |
Spectris plc | | | 100,138 | | | | 2,653,947 | |
| | | | | | | 13,606,529 | |
| | | | | | | | | |
Internet Software & Services—1.8% | | | | | |
United Internet AG | | | 82,386 | | | | 4,530,506 | |
Yahoo Japan Corp. | | | 1,052,900 | | | | 4,279,052 | |
| | | | | | | 8,809,558 | |
| | | | | | | | | |
IT Services—1.3% | | | | | | | | |
Amadeus IT Holding SA, Cl. A | | | 146,249 | | | | 6,439,823 | |
| | | | | | | | | |
Semiconductors & Semiconductor Equipment—3.7% | |
ARM Holdings plc | | | 268,670 | | | | 4,057,087 | |
ASML Holding NV | | | 61,899 | | | | 5,516,218 | |
Infineon Technologies AG | | | 581,814 | | | | 8,514,161 | |
| | | | | | | 18,087,466 | |
| | | | | | | | | |
Software—4.8% | | | | | | | | |
AVEVA Group plc | | | 69,124 | | | | 1,639,506 | |
Dassault Systemes | | | 68,366 | | | | 5,469,871 | |
Gemalto NV | | | 75,212 | | | | 4,494,142 | |
SAP SE | | | 72,234 | | | | 5,753,526 | |
Temenos Group AG1 | | | 111,776 | | | | 5,774,124 | |
| | | | | | | 23,131,169 | |
| | | | | | | | |
| | | Shares | | | Value | |
Technology Hardware, Storage & Peripherals—0.9% | |
Lenovo Group Ltd. | | | 4,160,000 | | | $ | 4,191,959 | |
| | | | | | | | | |
Materials—5.5% | | | | | | | | |
Chemicals—4.4% | | | | | | | | |
Essentra plc | | | 462,566 | | | | 5,617,617 | |
Novozymes AS, Cl. B | | | 105,004 | | | | 5,028,087 | |
Sika AG | | | 1,188 | | | | 4,258,804 | |
Syngenta AG | | | 16,429 | | | | 6,448,449 | |
| | | | | | | 21,352,957 | |
| | | | | | | | | |
Construction Materials—1.1% | | | | | |
James Hardie Industries plc | | | 431,200 | | | | 5,439,610 | |
| | | | | | | | | |
Telecommunication Services—6.5% | |
| Diversified Telecommunication Services—5.1% | |
BT Group plc, Cl. A | | | 901,433 | | | | 6,229,991 | |
Iliad SA | | | 21,030 | | | | 5,017,343 | |
Inmarsat plc | | | 249,960 | | | | 4,164,718 | |
| Nippon Telegraph & Telephone Corp. | | | 196,600 | | | | 7,805,380 | |
Telstra Corp. Ltd. | | | 366,500 | | | | 1,487,085 | |
| | | | | | | 24,704,517 | |
| | | | | | | | | |
Wireless Telecommunication Services—1.4% | |
Vodafone Group plc | | | 2,088,059 | | | | 6,753,878 | |
Total Common Stocks (Cost $345,780,370) | | | | 482,828,473 | |
Preferred Stock—0.0% | | | | | | | | |
Zee Entertainment Enterprises Ltd., 6% Cum. Non-Cv.
(Cost $12,273) | | | 5,995,416 | | | | 81,563 | |
| | |
| | | Units | | | | |
Rights, Warrants and Certificates—0.0% | | | | | |
MEI Pharma, Inc. Wts., Strike Price $1.19, Exp. 5/10/171
(Cost $35,548) | | | 151,358 | | | | 14,576 | |
| | |
| | | Shares | | | | |
Investment Company—0.8% | | | | | |
Oppenheimer Institutional Money Market Fund, Cl. E, 0.30%2,3
(Cost $4,009,537) | | | 4,009,537 | | | | 4,009,537 | |
| | | | | | | | | |
Total Investments, at Value
(Cost $349,837,728) | | | 100.0% | | | | 486,934,149 | |
Net Other Assets (Liabilities) | | | 0.0 | | | | (94,797) | |
Net Assets | | | 100.0% | | | $ | 486,839,352 | |
| | | | | | | | |
Footnotes to Statement of Investments
1. Non-income producing security.
2. Rate shown is the 7-day yield at period end.
3. Is or was an affiliate, as defined in the Investment Company Act of 1940, as amended, at or during the reporting period, by virtue of the Fund owning at least 5% of the voting securities of the issuer or as a result of the Fund and the issuer having the same investment adviser. Transactions during the reporting period in which the issuer was an affiliate are as follows:
| | | | | | | | | | | | | | | | |
| | | Shares
December 31, 2014 | | | Gross Additions | | | Gross Reductions | | | Shares December 31, 2015 | |
Oppenheimer Institutional Money Market Fund, Cl. E | | | 13,876,000 | | | | 122,165,899 | | | | 132,032,362 | | | | 4,009,537 | |
| | | | |
| | | | | | | | | Value | | | Income | |
Oppenheimer Institutional Money Market Fund, Cl. E | | | | | | | | | | $ | 4,009,537 | | | $ | 11,129 | |
8 OPPENHEIMER INTERNATIONAL GROWTH FUND/VA
| | | | | | | | |
| Distribution of investments representing geographic holdings, as a percentage of total investments at value, is as follows: | |
| Geographic Holdings | | Value | | | Percent | |
United Kingdom | | $ | 121,220,386 | | | | 24.9% | |
Switzerland | | | 64,713,319 | | | | 13.3 | |
France | | | 60,189,480 | | | | 12.4 | |
Germany | | | 42,154,441 | | | | 8.7 | |
Netherlands | | | 37,643,106 | | | | 7.7 | |
Japan | | | 29,160,564 | | | | 6.0 | |
Denmark | | | 21,417,723 | | | | 4.4 | |
Spain | | | 20,729,108 | | | | 4.2 | |
Canada | | | 16,967,841 | | | | 3.5 | |
Sweden | | | 12,751,492 | | | | 2.6 | |
Australia | | | 11,510,245 | | | | 2.4 | |
United States | | | 11,460,633 | | | | 2.3 | |
India | �� | | 7,928,046 | | | | 1.6 | |
Ireland | | | 5,439,610 | | | | 1.1 | |
Finland | | | 5,327,029 | | | | 1.1 | |
Thailand | | | 4,283,583 | | | | 0.9 | |
China | | | 4,191,959 | | | | 0.9 | |
South Africa | | | 3,696,209 | | | | 0.8 | |
Mexico | | | 3,676,887 | | | | 0.7 | |
Brazil | | | 2,472,488 | | | | 0.5 | |
Total | | $ | 486,934,149 | | | | 100.0% | |
| | | | | | | | |
See accompanying Notes to Financial Statements.
9 OPPENHEIMER INTERNATIONAL GROWTH FUND/VA
STATEMENT OF ASSETS AND LIABILITIES December 31, 2015
| | | | |
Assets | | | | |
Investments, at value—see accompanying statement of investments: | | | | |
Unaffiliated companies (cost $345,828,191) | | $ | 482,924,612 | |
Affiliated companies (cost $4,009,537) | | | 4,009,537 | |
| | | | 486,934,149 | |
Cash | | | 553,639 | |
Receivables and other assets: | | | | |
Dividends | | | 1,261,523 | |
Shares of beneficial interest sold | | | 928,575 | |
Other | | | 25,066 | |
Total assets | | | 489,702,952 | |
Liabilities | | | | |
Bank overdraft-foreign | | | 19 | |
Payables and other liabilities: | | | | |
Investments purchased | | | 2,104,696 | |
Shares of beneficial interest redeemed | | | 583,336 | |
Foreign capital gains tax | | | 69,636 | |
Distribution and service plan fees | | | 35,824 | |
Trustees’ compensation | | | 18,500 | |
Shareholder communications | | | 8,722 | |
Other | | | 42,867 | |
Total liabilities | | | 2,863,600 | |
Net Assets | | $ | 486,839,352 | |
| | | | |
| | | | | |
Composition of Net Assets | | | | |
Par value of shares of beneficial interest | | $ | 218,418 | |
Additional paid-in capital | | | 340,879,743 | |
Accumulated net investment income | | | 4,495,293 | |
Accumulated net realized gain on investments and foreign currency transactions | | | 4,300,218 | |
Net unrealized appreciation on investments and translation of assets and liabilities denominated in foreign currencies | | | 136,945,680 | |
Net Assets | | $ | 486,839,352 | |
| | | | |
| | | | | |
Net Asset Value Per Share | | | | |
Non-Service Shares: | | | | |
Net asset value, redemption price per share and offering price per share (based on net assets of $317,547,606 and 144,410,249 shares of beneficial interest outstanding) | | | $2.20 | |
Service Shares: | | | | |
Net asset value, redemption price per share and offering price per share (based on net assets of $169,291,746 and 74,008,232 shares of beneficial interest outstanding) | | | $2.29 | |
See accompanying Notes to Financial Statements.
10 OPPENHEIMER INTERNATIONAL GROWTH FUND/VA
STATEMENT OF OPERATIONS For the Year Ended December 31, 2015
| | | | |
Investment Income | | | | |
Dividends: | | | | |
Unaffiliated companies (net of foreign withholding taxes of $796,033) | | $ | 10,508,684 | |
Affiliated companies | | | 11,129 | |
Portfolio lending fees | | | 808 | |
Total investment income | | | 10,520,621 | |
Expenses | | | | |
Management fees | | | 4,823,454 | |
Distribution and service plan fees—Service shares | | | 413,180 | |
Transfer and shareholder servicing agent fees: | | | | |
Non-Service shares | | | 343,592 | |
Service shares | | | 165,349 | |
Shareholder communications: | | | | |
Non-Service shares | | | 11,321 | |
Service shares | | | 5,388 | |
Custodian fees and expenses | | | 52,211 | |
Trustees’ compensation | | | 20,029 | |
Borrowing fees | | | 3,684 | |
Other | | | 74,439 | |
Total expenses | | | 5,912,647 | |
Less reduction to custodian expenses | | | (238 | ) |
Less waivers and reimbursements of expenses | | | (404,978 | ) |
Net expenses | | | 5,507,431 | |
Net Investment Income | | | 5,013,190 | |
Realized and Unrealized Gain (Loss) | | | | |
Net realized gain (loss) on: | | | | |
Investments from unaffiliated companies (net of foreign capital gains tax of $27,508) | | | 12,467,262 | |
Foreign currency transactions | | | (117,933 | ) |
Net realized gain | | | 12,349,329 | |
Net change in unrealized appreciation/depreciation on: | | | | |
Investments | | | 10,203,977 | |
Translation of assets and liabilities denominated in foreign currencies | | | (12,363,943 | ) |
Net change in unrealized appreciation/depreciation | | | (2,159,966 | ) |
Net Increase in Net Assets Resulting from Operations | | $ | 15,202,553 | |
| | | | |
See accompanying Notes to Financial Statements.
11 OPPENHEIMER INTERNATIONAL GROWTH FUND/VA
STATEMENTS OF CHANGES IN NET ASSETS
| | | | | | | | | | |
| | | Year Ended December 31, 2015 | | | | | Year Ended December 31, 2014 | |
Operations | | | | | | | | | | |
Net investment income | | $ | 5,013,190 | | | | | $ | 5,611,200 | |
Net realized gain | | | 12,349,329 | | | | | | 40,631,908 | |
Net change in unrealized appreciation/depreciation | | | (2,159,966 | ) | | | | | (85,421,482 | ) |
| | | | | | | | | | |
Net increase (decrease) in net assets resulting from operations | | | 15,202,553 | | | | | | (39,178,374 | ) |
Dividends and/or Distributions to Shareholders | | | | | | | | | | |
Dividends from net investment income: | | | | | | | | | | |
Non-Service shares | | | (4,005,137 | ) | | | | | (4,718,842 | ) |
Service shares | | | (1,505,303 | ) | | | | | (1,168,525 | ) |
| | | | | | | | | | |
| | | (5,510,440 | ) | | | | | (5,887,367 | ) |
Distributions from net realized gain: | | | | | | | | | | |
Non-Service shares | | | (24,445,588 | ) | | | | | (8,305,904 | ) |
Service shares | | | (11,368,323 | ) | | | | | (2,491,854 | ) |
| | | | | | | | | | |
| | | (35,813,911 | ) | | | | | (10,797,758 | ) |
Beneficial Interest Transactions | | | | | | | | | | |
Net increase (decrease) in net assets resulting from beneficial interest transactions: | | | | | | | | | | |
Non-Service shares | | | (24,199,401 | ) | | | | | (57,258,810 | ) |
Service shares | | | 32,889,329 | | | | | | 41,295,796 | |
| | | | | | | | | | |
| | | 8,689,928 | | | | | | (15,963,014 | ) |
Net Assets | | | | | | | | | | |
Total decrease | | | (17,431,870 | ) | | | | | (71,826,513 | ) |
Beginning of period | | | 504,271,222 | | | | | | 576,097,735 | |
| | | | | | | | | | |
| | | |
End of period (including accumulated net investment income of $4,495,293 and $5,143,744, respectively) | | $ | 486,839,352 | | | | | $ | 504,271,222 | |
| | | | |
See accompanying Notes to Financial Statements.
12 OPPENHEIMER INTERNATIONAL GROWTH FUND/VA
FINANCIAL HIGHLIGHTS
| | | | | | | | | | | | | | | | | | | | |
| Non-Service Shares | | Year Ended
December
31, 2015 | | | Year Ended
December
31, 2014 | | | Year Ended
December
31, 2013 | | | Year Ended
December
31, 2012 | | | Year Ended
December
30, 20111 | |
Per Share Operating Data | | | | | | | | | | | | | | | | | | | | |
Net asset value, beginning of period | | $ | 2.31 | | | $ | 2.57 | | | $ | 2.07 | | | $ | 1.72 | | | $ | 1.87 | |
Income (loss) from investment operations: | | | | | | | | | | | | | | | | | | | | |
Net investment income2 | | | 0.03 | | | | 0.03 | | | | 0.03 | | | | 0.03 | | | | 0.02 | |
Net realized and unrealized gain (loss) | | | 0.06 | | | | (0.21) | | | | 0.50 | | | | 0.35 | | | | (0.15) | |
Total from investment operations | | | 0.09 | | | | (0.18) | | | | 0.53 | | | | 0.38 | | | | (0.13) | |
Dividends and/or distributions to shareholders: | | | | | | | | | | | | | | | | | | | | |
Dividends from net investment income | | | (0.03) | | | | (0.03) | | | | (0.03) | | | | (0.03) | | | | (0.02) | |
Distributions from net realized gain | | | (0.17) | | | | (0.05) | | | | 0.00 | | | | 0.00 | | | | 0.00 | |
Total dividends and/or distributions to shareholders | | | (0.20) | | | | (0.08) | | | | (0.03) | | | | (0.03) | | | | (0.02) | |
Net asset value, end of period | | $ | 2.20 | | | $ | 2.31 | | | $ | 2.57 | | | $ | 2.07 | | | $ | 1.72 | |
| | | | |
| | | | |
| | | | |
| | | | | | | | | | | | | | | | | | | | |
Total Return, at Net Asset Value3 | | | 3.43% | | | | (7.22)% | | | | 25.87% | | | | 22.22% | | | | (7.16)% | |
| | | | | | | | | | | | | | | | | | | | |
Ratios/Supplemental Data | | | | | | | | | | | | | | | | | | | | |
Net assets, end of period (in thousands) | | $ | 317,547 | | | $ | 358,756 | | | $ | 458,038 | | | $ | 348,449 | | | $ | 364,221 | |
Average net assets (in thousands) | | $ | 343,347 | | | $ | 400,556 | | | $ | 404,859 | | | $ | 332,018 | | | $ | 406,974 | |
Ratios to average net assets:4 | | | | | | | | | | | | | | | | | | | | |
Net investment income | | | 1.08% | | | | 1.13% | | | | 1.24% | | | | 1.68% | | | | 1.21% | |
Expenses excluding interest and fees from borrowings | | | 1.08% | | | | 1.07% | | | | 1.09% | | | | 1.13% | | | | 1.09% | |
Interest and fees from borrowings | | | 0.00% | 5 | | | 0.00% | | | | 0.00% | | | | 0.00% | | | | 0.00% | |
Total expenses6 | | | 1.08% | | | | 1.07% | | | | 1.09% | | | | 1.13% | | | | 1.09% | |
| Expenses after payments, waivers and/or reimbursements and reduction to custodian expenses | | | 1.00% | | | | 1.00% | | | | 1.00% | | | | 1.00% | | | | 1.00% | |
Portfolio turnover rate | | | 24% | | | | 41% | | | | 32% | | | | 22% | | | | 25% | |
1. December 30, 2011 represents the last business day of the Fund’s reporting period. See Note 2 of the accompanying Notes.
2. Per share amounts calculated based on the average shares outstanding during the period.
3. Assumes an initial investment on the business day before the first day of the fiscal period, with all dividends and distributions reinvested in additional shares on the reinvestment date, and redemption at the net asset value calculated on the last business day of the fiscal period. Total returns are not annualized for periods less than one full year. Total return information does not reflect expenses that apply at the separate account level or to related insurance products. Inclusion of these charges would reduce the total return figures for all periods shown. Returns do not reflect the deduction of taxes that a shareholder would pay on fund distributions or the redemption of fund shares.
4. Annualized for periods less than one full year.
5. Less than 0.005%.
6. Total expenses including indirect expenses from affiliated fund fees and expenses were as follows:
| | | | | | | | |
| | Year Ended December 31, 2015 | | | 1.08 | % | | |
| | Year Ended December 31, 2014 | | | 1.07 | % | | |
| | Year Ended December 31, 2013 | | | 1.09 | % | | |
| | Year Ended December 31, 2012 | | | 1.13 | % | | |
| | Year Ended December 30, 2011 | | | 1.09 | % | | |
See accompanying Notes to Financial Statements.
13 OPPENHEIMER INTERNATIONAL GROWTH FUND/VA
FINANCIAL HIGHLIGHTS Continued
| | | | | | | | | | | | | | | | | | | | |
| Service Shares | | Year Ended
December
31, 2015 | | | Year Ended
December
31, 2014 | | | Year Ended
December
31, 2013 | | | Year Ended
December
31, 2012 | | | Year Ended
December
30, 20111 | |
Per Share Operating Data | | | | | | | | | | | | | | | | | | | | |
Net asset value, beginning of period | | $ | 2.40 | | | $ | 2.66 | | | $ | 2.14 | | | $ | 1.78 | | | $ | 1.94 | |
Income (loss) from investment operations: | | | | | | | | | | | | | | | | | | | | |
Net investment income2 | | | 0.02 | | | | 0.02 | | | | 0.02 | | | | 0.03 | | | | 0.02 | |
Net realized and unrealized gain (loss) | | | 0.06 | | | | (0.21) | | | | 0.53 | | | | 0.35 | | | | (0.17) | |
Total from investment operations | | | 0.08 | | | | (0.19) | | | | 0.55 | | | | 0.38 | | | | (0.15) | |
Dividends and/or distributions to shareholders: | | | | | | | | | | | | | | | | | | | | |
Dividends from net investment income | | | (0.02) | | | | (0.02) | | | | (0.03) | | | | (0.02) | | | | (0.01) | |
Distributions from net realized gain | | | (0.17) | | | | (0.05) | | | | 0.00 | | | | 0.00 | | | | 0.00 | |
Total dividends and/or distributions to shareholders | | | (0.19) | | | | (0.07) | | | | (0.03) | | | | (0.02) | | | | (0.01) | |
Net asset value, end of period | | $ | 2.29 | | | $ | 2.40 | | | $ | 2.66 | | | $ | 2.14 | | | $ | 1.78 | |
| | | | |
| | | | |
Total Return, at Net Asset Value3 | | | 3.11% | | | | (7.15)% | | | | 25.71% | | | | 21.68% | | | | (7.61)% | |
| | | | | | | | | | | | | | | | | | | | |
Ratios/Supplemental Data | | | | | | | | | | | | | | | | | | | | |
Net assets, end of period (in thousands) | | $ | 169,292 | | | $ | 145,515 | | | $ | 118,060 | | | $ | 68,997 | | | $ | 57,276 | |
Average net assets (in thousands) | | $ | 165,226 | | | $ | 128,694 | | | $ | 88,647 | | | $ | 63,118 | | | $ | 62,359 | |
Ratios to average net assets:4 | | | | | | | | | | | | | | | | | | | | |
Net investment income | | | 0.79% | | | | 0.85% | | | | 0.89% | | | | 1.43% | | | | 0.96% | |
Expenses excluding interest and fees from borrowings | | | 1.33% | | | | 1.32% | | | | 1.34% | | | | 1.38% | | | | 1.34% | |
Interest and fees from borrowings | | | 0.00% | 5 | | | 0.00% | | | | 0.00% | | | | 0.00% | | | | 0.00% | |
Total expenses6 | | | 1.33% | | | | 1.32% | | | | 1.34% | | | | 1.38% | | | | 1.34% | |
| Expenses after payments, waivers and/or reimbursements and reduction to custodian expenses | | | 1.25% | | | | 1.25% | | | | 1.25% | | | | 1.25% | | | | 1.25% | |
Portfolio turnover rate | | | 24% | | | | 41% | | | | 32% | | | | 22% | | | | 25% | |
1. December 30, 2011 represents the last business day of the Fund’s reporting period. See Note 2 of the accompanying Notes.
2. Per share amounts calculated based on the average shares outstanding during the period.
3. Assumes an initial investment on the business day before the first day of the fiscal period, with all dividends and distributions reinvested in additional shares on the reinvestment date, and redemption at the net asset value calculated on the last business day of the fiscal period. Total returns are not annualized for periods less than one full year. Total return information does not reflect expenses that apply at the separate account level or to related insurance products. Inclusion of these charges would reduce the total return figures for all periods shown. Returns do not reflect the deduction of taxes that a shareholder would pay on fund distributions or the redemption of fund shares.
4. Annualized for periods less than one full year.
5. Less than 0.005%.
6. Total expenses including indirect expenses from affiliated fund fees and expenses were as follows:
| | | | | | | | |
| | Year Ended December 31, 2015 | | | 1.33 | % | | |
| | Year Ended December 31, 2014 | | | 1.32 | % | | |
| | Year Ended December 31, 2013 | | | 1.34 | % | | |
| | Year Ended December 31, 2012 | | | 1.38 | % | | |
| | Year Ended December 30, 2011 | | | 1.34 | % | | |
See accompanying Notes to Financial Statements.
14 OPPENHEIMER INTERNATIONAL GROWTH FUND/VA
NOTES TO FINANCIAL STATEMENTS December 31, 2015
1. Organization
Oppenheimer International Growth Fund/VA (the “Fund”), is a separate series of Oppenheimer Variable Account Funds, which is registered under the Investment Company Act of 1940 (“1940 Act”), as amended, as a diversified open-end management investment company. The Fund’s investment objective is to seek capital appreciation. The Fund’s investment adviser is OFI Global Asset Management, Inc. (“OFI Global” or the “Manager”), a wholly-owned subsidiary of OppenheimerFunds, Inc. (“OFI” or the “Sub-Adviser”). The Manager has entered into a sub-advisory agreement with OFI. Shares of the Fund are sold only to separate accounts of life insurance companies.
The Fund offers two classes of shares. Both classes are sold at their offering price, which is the net asset value per share, to separate investment accounts of participating insurance companies as an underlying investment for variable life insurance policies, variable annuity contracts or other investment products. The class of shares designated as Service shares is subject to a distribution and service plan. Both classes of shares have identical rights and voting privileges with respect to the Fund in general and exclusive voting rights on matters that affect that class alone. Earnings, net assets and net asset value per share may differ due to each class having its own expenses, such as transfer and shareholder servicing agent fees and shareholder communications, directly attributable to that class.
The following is a summary of significant accounting policies followed in the Fund’s preparation of financial statements in accordance with accounting principles generally accepted in the United States (“U.S. GAAP”).
2. Significant Accounting Policies
Security Valuation. All investments in securities are recorded at their estimated fair value, as described in Note 3.
Reporting Period End Date. The last day of the Fund’s reporting period is the last day the New York Stock Exchange was open for trading during the period. The Fund’s financial statements have been presented through that date to maintain consistency with the Fund’s net asset value calculations used for shareholder transactions.
Foreign Currency Translation. The Fund’s accounting records are maintained in U.S. dollars. The values of securities denominated in foreign currencies and amounts related to the purchase and sale of foreign securities and foreign investment income are translated into U.S. dollars as of the close of the New York Stock Exchange (the “Exchange”), normally 4:00 P.M. Eastern time, on each day the Exchange is open for trading. Foreign exchange rates may be valued primarily using a reliable bank, dealer or service authorized by the Board of Trustees.
Reported net realized gains and losses from foreign currency transactions arise from sales of portfolio securities, sales and maturities of short-term securities, sales of foreign currencies, exchange rate fluctuations between the trade and settlement dates on securities transactions, and the difference between the amounts of dividends, interest, and foreign withholding taxes recorded on the Fund’s books and the U.S. dollar equivalent of the amounts actually received or paid. Net unrealized appreciation and depreciation on the translation of assets and liabilities denominated in foreign currencies arise from changes in the values of assets and liabilities, including investments in securities at fiscal period end, resulting from changes in exchange rates.
The effect of changes in foreign currency exchange rates on investments is separately identified from the fluctuations arising from changes in market values of securities held and reported with all other foreign currency gains and losses in the Fund’s Statement of Operations.
Allocation of Income, Expenses, Gains and Losses. Income, expenses (other than those attributable to a specific class), gains and losses are allocated on a daily basis to each class of shares based upon the relative proportion of net assets represented by such class. Operating expenses directly attributable to a specific class are charged against the operations of that class.
Dividends and Distributions to Shareholders. Dividends and distributions to shareholders, which are determined in accordance with income tax regulations and may differ from U.S. GAAP, are recorded on the ex-dividend date. Income and capital gain distributions, if any, are declared and paid annually or at other times as deemed necessary by the Manager.
Investment Income. Dividend income is recorded on the ex-dividend date or upon ex-dividend notification in the case of certain foreign dividends where the ex-dividend date may have passed. Non-cash dividends included in dividend income, if any, are recorded at the fair market value of the securities received. Interest income is recognized on an accrual basis. Discount and premium, which are included in interest income on the Statement of Operations, are amortized or accreted daily.
Custodian Fees. “Custodian fees and expenses” in the Statement of Operations may include interest expense incurred by the Fund on any cash overdrafts of its custodian account during the period. Such cash overdrafts may result from the effects of failed trades in portfolio securities and from cash outflows resulting from unanticipated shareholder redemption activity. The Fund pays interest to its custodian on such cash overdrafts, to the extent they are not offset by positive cash balances maintained by the Fund, at a rate equal to the Federal Funds Rate plus 0.50%. The “Reduction to custodian expenses” line item, if applicable, represents earnings on cash balances maintained by the Fund during the period. Such interest expense and other custodian fees may be paid with these earnings.
Security Transactions. Security transactions are recorded on the trade date. Realized gains and losses on securities sold are determined on the basis of identified cost.
Indemnifications. The Fund’s organizational documents provide current and former Trustees and officers with a limited indemnification against liabilities arising in connection with the performance of their duties to the Fund. In the normal course of business, the Fund may also enter into contracts
15 OPPENHEIMER INTERNATIONAL GROWTH FUND/VA
|
NOTES TO FINANCIAL STATEMENTS Continued |
2. Significant Accounting Policies (Continued)
that provide general indemnifications. The Fund’s maximum exposure under these arrangements is unknown as this would be dependent on future claims that may be made against the Fund. The risk of material loss from such claims is considered remote.
Federal Taxes. The Fund intends to comply with provisions of the Internal Revenue Code applicable to regulated investment companies and to distribute substantially all of its investment company taxable income, including any net realized gain on investments not offset by capital loss carryforwards, if any, to shareholders. Therefore, no federal income or excise tax provision is required. The Fund files income tax returns in U.S. federal and applicable state jurisdictions. The statute of limitations on the Fund’s tax return filings generally remains open for the three preceding fiscal reporting period ends.
The tax components of capital shown in the following table represent distribution requirements the Fund must satisfy under the income tax regulations, losses the Fund may be able to offset against income and gains realized in future years and unrealized appreciation or depreciation of securities and other investments for federal income tax purposes.
| | | | | | | | | | | | |
Undistributed Net Investment Income | | Undistributed Long-Term Gain | | | Accumulated Loss Carryforward | | | Net Unrealized Appreciation
Based on cost of Securities and
Other Investments
for Federal Income Tax Purposes | |
$4,833,390 | | | $11,105,584 | | | | $— | | | | $129,820,716 | |
Net investment income (loss) and net realized gain (loss) may differ for financial statement and tax purposes. The character of dividends and distributions made during the fiscal year from net investment income or net realized gains are determined in accordance with federal income tax requirements, which may differ from the character of net investment income or net realized gains presented in those financial statements in accordance with U.S. GAAP. Also, due to timing of dividends and distributions, the fiscal year in which amounts are distributed may differ from the fiscal year in which the income or net realized gain was recorded by the Fund.
Accordingly, the following amounts have been reclassified for the reporting period. Net assets of the Fund were unaffected by the reclassifications.
| | | | | | | | |
Increase to Paid-in Capital | | Reduction to Accumulated
Net Investment
Income | | | Reduction to Accumulated Net
Realized Gain on Investments1 | |
$1,447,049 | | | $151,201 | | | | $1,295,848 | |
1. $1,447,049, all of which was long-term capital gain, was distributed in connection with Fund share redemptions.
The tax character of distributions paid during the reporting periods:
| | | | | | | | |
| | | Year Ended
December 31, 2015 | | | Year Ended
December 31, 2014 | |
Distributions paid from: | | | | | | | | |
Ordinary income | | $ | 6,531,547 | | | $ | 5,887,367 | |
Long-term capital gain | | | 34,792,804 | | | | 10,797,758 | |
| | | | |
Total | | $ | 41,324,351 | | | $ | 16,685,125 | |
| | | | |
The aggregate cost of securities and other investments and the composition of unrealized appreciation and depreciation of securities and other investments for federal income tax purposes at period end are noted in the following table. The primary difference between book and tax appreciation or depreciation of securities and other investments, if applicable, is attributable to the tax deferral of losses or tax realization of financial statement unrealized gain or loss.
| | | | |
Federal tax cost of securities | | $ | 356,962,692 | |
Federal tax cost of other investments | | | 328 | |
| | | | |
Total federal tax cost | | $ | 356,963,020 | |
| | | | |
Gross unrealized appreciation | | $ | 175,558,757 | |
Gross unrealized depreciation | | | (45,738,041) | |
| | | | |
Net unrealized appreciation | | $ | 129,820,716 | |
| | | | |
Certain foreign countries impose a tax on capital gains which is accrued by the Fund based on unrealized appreciation, if any, on affected securities. The tax is paid when the gain is realized.
Use of Estimates. The preparation of financial statements in conformity with U.S. GAAP requires management to make estimates and assumptions that affect the reported amounts of assets and liabilities and disclosure of contingent assets and liabilities at the date of the financial statements and the reported amounts of increases and decreases in net assets from operations during the reporting period. Actual results could differ from those estimates.
16 OPPENHEIMER INTERNATIONAL GROWTH FUND/VA
3. Securities Valuation
The Fund calculates the net asset value of its shares as of the close of the New York Stock Exchange (the “Exchange”), normally 4:00 P.M. Eastern time, on each day the Exchange is open for trading, except in the case of a scheduled early closing of the Exchange, in which case the Fund will calculate net asset value of the shares as of the scheduled early closing time of the Exchange.
The Fund’s Board has adopted procedures for the valuation of the Fund’s securities and has delegated the day-to-day responsibility for valuation determinations under those procedures to the Manager. The Manager has established a Valuation Committee which is responsible for determining a “fair valuation” for any security for which market quotations are not “readily available.” The Valuation Committee’s fair valuation determinations are subject to review, approval and ratification by the Fund’s Board at its next regularly scheduled meeting covering the calendar quarter in which the fair valuation was determined.
Valuation Methods and Inputs
Securities are valued using unadjusted quoted market prices, when available, as supplied primarily by third party pricing services or dealers.
The following methodologies are used to determine the market value or the fair value of the types of securities described below:
Securities traded on a registered U.S. securities exchange (including exchange-traded derivatives other than futures and futures options) are valued based on the last sale price of the security reported on the principal exchange on which it is traded, prior to the time when the Fund’s assets are valued. In the absence of a sale, the security is valued at the mean between the bid and asked price on the principal exchange or, if not available from the principal exchange, obtained from two dealers. If bid and asked prices are not available from either the exchange or two dealers, the security is valued by using one of the following methodologies (listed in order of priority): (1) a bid from the principal exchange, (2) the mean between the bid and asked price as provided by a single dealer, or (3) a bid from a single dealer. A security of a foreign issuer traded on a foreign exchange, but not listed on a registered U.S. securities exchange, is valued based on the last sale price on the principal exchange on which the security is traded, as identified by the third party pricing service used by the Manager, prior to the time when the Fund’s assets are valued. If the last sale price is unavailable, the security is valued at the most recent official closing price on the principal exchange on which it is traded. If the last sales price or official closing price for a foreign security is not available, the security is valued at the mean between the bid and asked price per the exchange or, if not available from the exchange, obtained from two dealers. If bid and asked prices are not available from either the exchange or two dealers, the security is valued by using one of the following methodologies (listed in order of priority): (1) a bid from the exchange, (2) the mean between the bid and asked price as provided by a single dealer, or (3) a bid from a single dealer.
Shares of a registered investment company that are not traded on an exchange are valued at that investment company’s net asset value per share.
Corporate and government debt securities (of U.S. or foreign issuers) and municipal debt securities, event-linked bonds, loans, mortgage-backed securities, collateralized mortgage obligations, and asset-backed securities are valued at the mean between the “bid” and “asked” prices utilizing evaluated prices obtained from third party pricing services or broker-dealers who may use matrix pricing methods to determine the evaluated prices.
Short-term money market type debt securities with a remaining maturity of sixty days or less are valued at cost adjusted by the amortization of discount or premium to maturity (amortized cost), which approximates market value. Short-term debt securities with a remaining maturity in excess of sixty days are valued at the mean between the “bid” and “asked” prices utilizing evaluated prices obtained from third party pricing services or broker-dealers.
A description of the standard inputs that may generally be considered by the third party pricing vendors in determining their evaluated prices is provided below.
| | |
| Security Type | | Standard inputs generally considered by third-party pricing vendors |
| Corporate debt, government debt, municipal, mortgage-backed and asset-backed securities | | Reported trade data, broker-dealer price quotations, benchmark yields, issuer spreads on comparable securities, the credit quality, yield, maturity, and other appropriate factors. |
| Loans | | Information obtained from market participants regarding reported trade data and broker-dealer price quotations. |
Event-linked bonds | | Information obtained from market participants regarding reported trade data and broker-dealer price quotations. |
If a market value or price cannot be determined for a security using the methodologies described above, or if, in the “good faith” opinion of the Manager, the market value or price obtained does not constitute a “readily available market quotation,” or a significant event has occurred that would materially affect the value of the security, the security is fair valued either (i) by a standardized fair valuation methodology applicable to the security type or the significant event as previously approved by the Valuation Committee and the Fund’s Board or (ii) as determined in good faith by the Manager’s Valuation Committee. The Valuation Committee considers all relevant facts that are reasonably available, through either public information or information available to the Manager, when determining the fair value of a security. Fair value determinations by the Manager are subject to review, approval and ratification by the Fund’s Board at its next regularly scheduled meeting covering the calendar quarter in which the fair valuation was determined. Those fair valuation standardized methodologies include, but are not limited to, valuing securities at the last sale price or initially at cost and subsequently adjusting the value based on: changes in company specific fundamentals, changes in an appropriate securities index, or changes in the value of similar securities which may be further adjusted for any discounts related to security-specific resale restrictions. When possible, such methodologies use observable market inputs such as unadjusted quoted prices of similar securities, observable interest rates, currency rates and yield curves. The methodologies used for valuing securities are not necessarily an indication of the risks associated with investing in those securities nor can it be assured that the Fund can obtain the fair value assigned to a security if it were to sell the security.
17 OPPENHEIMER INTERNATIONAL GROWTH FUND/VA
|
NOTES TO FINANCIAL STATEMENTS Continued |
3. Securities Valuation (Continued)
To assess the continuing appropriateness of security valuations, the Manager, or its third party service provider who is subject to oversight by the Manager, regularly compares prior day prices, prices on comparable securities, and sale prices to the current day prices and challenges those prices exceeding certain tolerance levels with the third party pricing service or broker source. For those securities valued by fair valuations, whether through a standardized fair valuation methodology or a fair valuation determination, the Valuation Committee reviews and affirms the reasonableness of the valuations based on such methodologies and fair valuation determinations on a regular basis after considering all relevant information that is reasonably available.
Classifications
Each investment asset or liability of the Fund is assigned a level at measurement date based on the significance and source of the inputs to its valuation. Various data inputs are used in determining the value of each of the Fund’s investments as of the reporting period end. These data inputs are categorized in the following hierarchy under applicable financial accounting standards:
1) Level 1-unadjusted quoted prices in active markets for identical assets or liabilities (including securities actively traded on a securities exchange)
2) Level 2-inputs other than unadjusted quoted prices that are observable for the asset or liability (such as unadjusted quoted prices for similar assets and market corroborated inputs such as interest rates, prepayment speeds, credit risks, etc.)
3) Level 3-significant unobservable inputs (including the Manager’s own judgments about assumptions that market participants would use in pricing the asset or liability).
The inputs used for valuing securities are not necessarily an indication of the risks associated with investing in those securities.
The table below categorizes amounts that are included in the Fund’s Statement of Assets and Liabilities at period end based on valuation input level:
| | | | | | | | | | | | | | | | |
| | | Level 1— Unadjusted Quoted Prices | | | Level 2— Other Significant
Observable Inputs | | | Level 3— Significant Unobservable Inputs | | | Value | |
Assets Table | | | | | | | | | | | | | | | | |
Investments, at Value: | | | | | | | | | | | | | | | | |
Common Stocks | | | | | | | | | | | | | | | | |
Consumer Discretionary | | $ | 23,374,622 | | | $ | 86,577,363 | | | $ | — | | | $ | 109,951,985 | |
Consumer Staples | | | 4,706,625 | | | | 47,009,792 | | | | — | | | | 51,716,417 | |
Energy | | | — | | | | 6,094,810 | | | | — | | | | 6,094,810 | |
Financials | | | 2,825,965 | | | | 16,695,934 | | | | — | | | | 19,521,899 | |
Health Care | | | — | | | | 55,529,912 | | | | — | | | | 55,529,912 | |
Industrials | | | — | | | | 97,140,461 | | | | — | | | | 97,140,461 | |
Information Technology | | | — | | | | 84,622,027 | | | | — | | | | 84,622,027 | |
Materials | | | — | | | | 26,792,567 | | | | — | | | | 26,792,567 | |
Telecommunication Services | | | — | | | | 31,458,395 | | | | — | | | | 31,458,395 | |
Preferred Stock | | | 81,563 | | | | — | | | | — | | | | 81,563 | |
Rights, Warrants and Certificates | | | — | | | | 14,576 | | | | — | | | | 14,576 | |
Investment Company | | | 4,009,537 | | | | — | | | | — | | | | 4,009,537 | |
Total Assets | | $ | 34,998,312 | | | $ | 451,935,837 | | | $ | — | | | $ | 486,934,149 | |
Forward currency exchange contracts and futures contracts, if any, are reported at their unrealized appreciation/depreciation at measurement date, which represents the change in the contract’s value from trade date. All additional assets and liabilities included in the above table are reported at their market value at measurement date.
The table below shows the transfers between Level 1 and Level 2. The Fund’s policy is to recognize transfers in and transfers out as of the beginning of the reporting period.
| | | | | | | | |
| | | Transfers out of Level 1* | | | Transfers into Level 2* | |
Assets Table | | | | | | | | |
Investments, at Value: | | | | | | | | |
Common Stocks | | | | | | | | |
Financials | | $ | (4,280,253 | ) | | $ | 4,280,253 | |
| | | | |
Total Assets | | $ | (4,280,253 | ) | | $ | 4,280,253 | |
| | | | |
* Transfers from Level 1 to Level 2 are a result of a change from the use of an exchange traded price to a valuation received from a third-party pricing service or a fair valuation determined based on observable market information other than quoted prices from an active market.
4. Investments and Risks
Risks of Foreign Investing. The Fund may invest in foreign securities which are subject to special risks. Securities traded in foreign markets may be less liquid and more volatile than those traded in U.S. markets. Foreign issuers are usually not subject to the same accounting and disclosure requirements that U.S. companies are subject to, which may make it difficult for the Fund to evaluate a foreign company’s operations or financial condition. A change in the value of a foreign currency against the U.S. dollar will result in a change in the U.S. dollar value of investments denominated in that foreign currency and in the value of any income or distributions the Fund may receive on those investments. The value of foreign investments may be affected by exchange control regulations, foreign taxes, higher transaction and other costs, delays in the settlement of transactions, changes in
18 OPPENHEIMER INTERNATIONAL GROWTH FUND/VA
4. Investments and Risks (Continued)
economic or monetary policy in the United States or abroad, expropriation or nationalization of a company’s assets, or other political and economic factors. In addition, due to the inter-relationship of global economies and financial markets, changes in political and economic factors in one country or region could adversely affect conditions in another country or region. Investments in foreign securities may also expose the Fund to time-zone arbitrage risk. Foreign securities may trade on weekends or other days when the Fund does not price its shares. At times, the Fund may emphasize investments in a particular country or region and may be subject to greater risks from adverse events that occur in that country or region. Foreign securities and foreign currencies held in foreign banks and securities depositories may be subject to limited or no regulatory oversight.
Investments in Affiliated Funds. The Fund is permitted to invest in other mutual funds advised by the Manager (“Affiliated Funds”). Affiliated Funds are open-end management investment companies registered under the 1940 Act, as amended. The Manager is the investment adviser of, and the Sub-Adviser provides investment and related advisory services to, the Affiliated Funds. When applicable, the Fund’s investments in Affiliated Funds are included in the Statement of Investments. Shares of Affiliated Funds are valued at their net asset value per share. As a shareholder, the Fund is subject to its proportional share of the Affiliated Funds’ expenses, including their management fee. The Manager will waive fees and/or reimburse Fund expenses in an amount equal to the indirect management fees incurred through the Fund’s investment in the Affiliated Funds.
Each of the Affiliated Funds in which the Fund invests has its own investment risks, and those risks can affect the value of the Fund’s investments and therefore the value of the Fund’s shares. To the extent that the Fund invests more of its assets in one Affiliated Fund than in another, the Fund will have greater exposure to the risks of that Affiliated Fund.
Investment in Oppenheimer Institutional Money Market Fund. The Fund is permitted to invest daily available cash balances in a money market Affiliated Fund. The Fund may invest the available cash in Class E shares of Oppenheimer Institutional Money Market Fund (“IMMF”) to seek current income while preserving liquidity or for defensive purposes. IMMF is regulated as a money market fund under the Investment Company Act of 1940, as amended.
Equity Security Risk. Stocks and other equity securities fluctuate in price. The value of the Fund’s portfolio may be affected by changes in the equity markets generally. Equity markets may experience significant short-term volatility and may fall sharply at times. Different markets may behave differently from each other and U.S. equity markets may move in the opposite direction from one or more foreign stock markets. Adverse events in any part of the equity or fixed-income markets may have unexpected negative effects on other market segments.
The prices of individual equity securities generally do not all move in the same direction at the same time and a variety of factors can affect the price of a particular company’s securities. These factors may include, but are not limited to, poor earnings reports, a loss of customers, litigation against the company, general unfavorable performance of the company’s sector or industry, or changes in government regulations affecting the company or its industry.
5. Market Risk Factors
The Fund’s investments in securities and/or financial derivatives may expose the fund to various market risk factors:
Commodity Risk. Commodity risk relates to the change in value of commodities or commodity indexes as they relate to increases or decreases in the commodities market. Commodities are physical assets that have tangible properties. Examples of these types of assets are crude oil, heating oil, metals, livestock, and agricultural products.
Credit Risk. Credit risk relates to the ability of the issuer of debt to meet interest and principal payments, or both, as they come due. In general, lower-grade, higher-yield debt securities are subject to credit risk to a greater extent than lower-yield, higher-quality securities.
Equity Risk. Equity risk relates to the change in value of equity securities as they relate to increases or decreases in the general market.
Foreign Exchange Rate Risk. Foreign exchange rate risk relates to the change in the U.S. dollar value of a security held that is denominated in a foreign currency. The U.S. dollar value of a foreign currency denominated security will decrease as the dollar appreciates against the currency, while the U.S. dollar value will increase as the dollar depreciates against the currency.
Interest Rate Risk. Interest rate risk refers to the fluctuations in value of fixed-income securities resulting from the inverse relationship between price and yield. For example, an increase in general interest rates will tend to reduce the market value of already issued fixed-income investments, and a decline in general interest rates will tend to increase their value. In addition, debt securities with longer maturities, which tend to have higher yields, are subject to potentially greater fluctuations in value from changes in interest rates than obligations with shorter maturities.
Volatility Risk. Volatility risk refers to the magnitude of the movement, but not the direction of the movement, in a financial instrument’s price over a defined time period. Large increases or decreases in a financial instrument’s price over a relative time period typically indicate greater volatility risk, while small increases or decreases in its price typically indicate lower volatility risk.
6. Shares of Beneficial Interest
The Fund has authorized an unlimited number of $0.001 par value shares of beneficial interest of each class. Transactions in shares of beneficial interest were as follows:
19 OPPENHEIMER INTERNATIONAL GROWTH FUND/VA
|
NOTES TO FINANCIAL STATEMENTS Continued |
6. Shares of Beneficial Interest (Continued)
| | | | | | | | | | | | | | | | |
| | | Year Ended December 31, 2015 | | | Year Ended December 31, 2014 | |
| | | Shares | | | Amount | | | Shares | | | Amount | |
Non-Service Shares | | | | | | | | | | | | | | | | |
Sold | | | 25,785,184 | | | $ | 60,862,122 | | | | 25,443,453 | | | $ | 62,992,150 | |
Dividends and/or distributions reinvested | | | 12,263,244 | | | | 28,450,725 | | | | 5,127,853 | | | | 13,024,746 | |
Redeemed | | | (48,734,993 | ) | | | (113,512,248 | ) | | | (53,834,052 | ) | | | (133,275,706) | |
Net decrease | | | (10,686,565 | ) | | $ | (24,199,401 | ) | | | (23,262,746 | ) | | $ | (57,258,810) | |
| | | | | | | | | | | | | | | | |
| | | | | | | | | | | | | | | | | |
Service Shares | | | | | | | | | | | | | | | | |
Sold | | | 20,290,959 | | | $ | 49,094,495 | | | | 19,806,037 | | | $ | 50,102,878 | |
Dividends and/or distributions reinvested | | | 5,341,754 | | | | 12,873,626 | | | | 1,386,507 | | | | 3,660,379 | |
Redeemed | | | (12,264,866 | ) | | | (29,078,792 | ) | | | (4,889,729 | ) | | | (12,467,461) | |
Net increase | | | 13,367,847 | | | $ | 32,889,329 | | | | 16,302,815 | | | $ | 41,295,796 | |
| | | | | | | | | | | | | | | | |
7. Purchases and Sales of Securities
The aggregate cost of purchases and proceeds from sales of securities, other than short-term obligations and investments in IMMF, for the reporting period were as follows:
| | | | | | | | |
| | | Purchases | | | Sales | |
Investment securities | | $ | 118,246,145 | | | $ | 132,590,794 | |
8. Fees and Other Transactions with Affiliates
Management Fees. Under the investment advisory agreement, the Fund pays the Manager a management fee based on the daily net assets of the Fund at an annual rate as shown in the following table:
| | | | |
| Fee Schedule Through October 31, 2015 | | | |
Up to $250 million | | | 1.00 | % |
Next $250 million | | | 0.90 | |
Over $500 million | | | 0.85 | |
| | | | |
| Fee Schedule Effective November 1, 2015 | | | |
Up to $250 million | | | 1.00 | % |
Next $250 million | | | 0.90 | |
Next $500 million | | | 0.85 | |
Over $1 billion | | | 0.82 | |
The Fund’s effective management fee for the reporting period was 0.95% of average annual net assets before any applicable waivers.
Sub-Adviser Fees. The Manager has retained the Sub-Adviser to provide the day-to-day portfolio management of the Fund. Under the Sub-Advisory Agreement, the Manager pays the Sub-Adviser an annual fee in monthly installments, equal to a percentage of the investment management fee collected by the Manager from the Fund, which shall be calculated after any investment management fee waivers. The fee paid to the Sub-Adviser is paid by the Manager, not by the Fund.
Transfer Agent Fees. OFI Global (the “Transfer Agent”) serves as the transfer and shareholder servicing agent for the Fund. The Fund pays the Transfer Agent a fee based on annual net assets. Fees incurred and average net assets for each class with respect to these services are detailed in the Statement of Operations and Financial Highlights, respectively.
Sub-Transfer Agent Fees. The Transfer Agent has retained Shareholder Services, Inc., a wholly-owned subsidiary of OFI (the “Sub-Transfer Agent”), to provide the day-to-day transfer agent and shareholder servicing of the Fund. Under the Sub-Transfer Agency Agreement, the Transfer Agent pays the Sub-Transfer Agent an annual fee in monthly installments, equal to a percentage of the transfer agent fee collected by the Transfer Agent from the Fund, which shall be calculated after any applicable fee waivers. The fee paid to the Sub-Transfer Agent is paid by the Transfer Agent, not by the Fund.
Trustees’ Compensation. The Fund’s Board of Trustees (“Board”) has adopted a compensation deferral plan for Independent Trustees that enables Trustees to elect to defer receipt of all or a portion of the annual compensation they are entitled to receive from the Fund. For purposes of determining the amount owed to the Trustees under the plan, deferred amounts are treated as though equal dollar amounts had been invested in shares of the Fund or in other Oppenheimer funds selected by the Trustees. The Fund purchases shares of the funds selected for deferral by the Trustees in amounts equal to his or her deemed investment, resulting in a Fund asset equal to the deferred compensation liability. Such assets are included as a component of “Other” within the asset section of the Statement of Assets and Liabilities. Deferral of Trustees’ fees under the plan will not affect the net assets of the Fund and will not materially affect the Fund’s assets, liabilities or net investment income per share. Amounts will be deferred until distributed in accordance with the compensation deferral plan.
Distribution and Service Plan for Service Shares. The Fund has adopted a Distribution and Service Plan (the “Plan”) pursuant to Rule 12b-1 under the 1940 Act for Service shares to pay OppenheimerFunds Distributor, Inc. (the “Distributor”), for distribution related services, personal service and account maintenance for the Fund’s Service shares. Under the Plan, payments are made periodically at an annual rate of 0.25% of the daily net assets of Service shares of the Fund. The Distributor currently uses all of those fees to compensate sponsors of the insurance product that offers Fund shares, for providing personal service and maintenance of accounts of their variable contract owners that hold Service shares. These fees are paid out of the Fund’s
20 OPPENHEIMER INTERNATIONAL GROWTH FUND/VA
8. Fees and Other Transactions with Affiliates (Continued)
assets on an on-going basis and increase operating expenses of the Service shares, which results in lower performance compared to the Fund’s shares that are not subject to a service fee. Fees incurred by the Fund under the Plan are detailed in the Statement of Operations.
Waivers and Reimbursements of Expenses. The Manager has contractually agreed to limit the Fund’s expenses after payments, waivers and/or reimbursements and reduction to custodian expenses, excluding expenses incurred directly or indirectly by the Fund as a result of investments in other investment companies, wholly-owned subsidiaries and pooled investment vehicles; so that those expenses, as percentages of daily net assets, will not exceed the annual rate of 1.00% for Non-Service shares and 1.25% for Service shares. The expense limitations do not include interest and fees from borrowing, and other expenses not incurred in the ordinary course of the Fund’s business. During the reporting period, the Manager waived fees and/or reimbursed the Fund $266,718 and $130,584 for Non-Service and Service shares, respectively.
The Manager will waive fees and/or reimburse Fund expenses in an amount equal to the indirect management fees incurred through the Fund’s investment in IMMF. During the reporting period, the Manager waived fees and/or reimbursed the Fund $7,676 for IMMF management fees.
Waivers and/or reimbursements may be modified or terminated as set forth according to the terms in the prospectus.
9. Borrowings and Other Financing
Joint Credit Facility. A number of mutual funds managed by the Manager participate in a $1.28 billion revolving credit facility (the “Facility”) intended to provide short-term financing, if necessary, subject to certain restrictions in connection with atypical redemption activity. Expenses and fees related to the Facility are paid by the participating funds and are disclosed separately or as other expenses on the Statement of Operations. The Fund did not utilize the Facility during the reporting period.
Securities Lending. The Fund lends portfolio securities from time to time in order to earn additional income in the form of fees, or interest on cash or securities received as collateral. The loans are secured by collateral (either securities, letters of credit, or cash) in an amount of at least 102% of the market value of the loaned U.S. securities, and at least 105% of the market value of loaned foreign securities during the period of the loan. The market value of the loaned securities is determined at the close of each business day and any additional required collateral is delivered to the Fund on the next business day. If the borrower defaults on its obligation to return the securities loaned because of insolvency or other reasons, the Fund could experience delays and cost in recovering the securities loaned or in gaining access to the collateral. The Fund continues to receive the economic benefit of interest or dividends paid on the securities loaned in the form of a substitute payment received from the borrower and recognizes the change in the fair value of the securities loaned that may occur during the term of the loan. The Fund has the right under the lending agreement to recover the securities from the borrower on demand. At period end, the Fund had no securities on loan.
10. Pending Litigation
In 2009, several putative class action lawsuits were filed and later consolidated before the U.S. District Court for the District of Colorado against OppenheimerFunds, Inc. (“OFI”), OppenheimerFunds Distributor, Inc. (“OFDI”), and Oppenheimer Rochester California Municipal Fund, a fund advised by OFI Global Asset Management, Inc. and distributed by the Distributor (the “California Fund”), in connection with the California Fund’s investment performance. The plaintiffs asserted claims against OFI, OFDI and certain present and former trustees and officers of the California Fund under the federal securities laws, alleging, among other things, that the disclosure documents of the California Fund contained misrepresentations and omissions and the investment policies of the California Fund were not followed. Plaintiffs in the suit filed an amended complaint and defendants filed a motion to dismiss. In 2011, the court issued an order which granted in part and denied in part the defendants’ motion to dismiss. In 2012, plaintiffs filed a motion, which defendants opposed, to certify a class and appoint class representatives and class counsel. In March 2015, the court granted plaintiffs’ motion for class certification. In May 2015, the U.S. Court of Appeals for the Tenth Circuit vacated the class certification order and remanded the matter to the district court for further proceedings. In October 2015, the district court reaffirmed its order and determined that the suit will proceed as a class action. In December 2015, the Tenth Circuit denied defendants’ petition to appeal the district court’s reaffirmed class certification order.
OFI and OFDI believe the suit is without merit; that it is premature to render any opinion as to the likelihood of an outcome unfavorable to them in the suit; and that no estimate can yet be made as to the amount or range of any potential loss. Furthermore, OFI believes that the suit should not impair the ability of OFI or OFDI to perform their respective duties to the Fund and that the outcome of the suit should not have any material effect on the operations of any of the Oppenheimer funds.
21 OPPENHEIMER INTERNATIONAL GROWTH FUND/VA
|
REPORT OF INDEPENDENT REGISTERED PUBLIC ACCOUNTING FIRM |
The Board of Trustees and Shareholders of Oppenheimer Variable Account Funds:
We have audited the accompanying statement of assets and liabilities of Oppenheimer International Growth Fund/VA (a separate series of Oppenheimer Variable Account Funds), including the statement of investments, as of December 31, 2015, and the related statement of operations for the year then ended, the statements of changes in net assets for each of the years in the two-year period then ended, and the financial highlights for each of the years in the five-year period then ended. These financial statements and financial highlights are the responsibility of the Fund’s management. Our responsibility is to express an opinion on these financial statements and financial highlights based on our audits.
We conducted our audits in accordance with the standards of the Public Company Accounting Oversight Board (United States). Those standards require that we plan and perform the audit to obtain reasonable assurance about whether the financial statements and financial highlights are free of material misstatement. An audit includes examining, on a test basis, evidence supporting the amounts and disclosures in the financial statements. Our procedures included confirmation of securities owned as of December 31, 2015, by correspondence with the custodian, transfer agent and brokers, or by other appropriate auditing procedures where replies from brokers were not received. An audit also includes assessing the accounting principles used and significant estimates made by management, as well as evaluating the overall financial statement presentation. We believe that our audits provide a reasonable basis for our opinion.
In our opinion, the financial statements and financial highlights referred to above present fairly, in all material respects, the financial position of Oppenheimer International Growth Fund/VA as of December 31, 2015, the results of its operations for the year then ended, the changes in its net assets for each of the years in the two-year period then ended, and the financial highlights for each of the years in the five-year period then ended, in conformity with U.S. generally accepted accounting principles.
KPMG LLP
Denver, Colorado
February 12, 2016
22 OPPENHEIMER INTERNATIONAL GROWTH FUND/VA
|
FEDERAL INCOME TAX INFORMATION Unaudited |
In early 2016, if applicable, shareholders of record received information regarding all dividends and distributions paid to them by the Fund during calendar year 2015.
Capital gain distributions of $0.16662 per share were paid to Non-Service and Service shareholders, respectively, on June 16, 2015. Whether received in stock or in cash, the capital gain distribution should be treated by shareholders as a gain from the sale of the capital assets held for more than one year (long-term capital gains).
None of the dividends paid by the Fund during the reporting period are eligible for the corporate dividend-received deduction.
The foregoing information is presented to assist shareholders in reporting distributions received from the Fund to the Internal Revenue Service. Because of the complexity of the federal regulations which may affect your individual tax return and the many variations in state and local tax regulations, we recommend that you consult your tax advisor for specific guidance.
23 OPPENHEIMER INTERNATIONAL GROWTH FUND/VA
BOARD APPROVAL OF THE FUND’S INVESTMENT ADVISORY AND SUB-ADVISORY AGREEMENTS Unaudited
The Fund has entered into an investment advisory agreement with OFI Global Asset Management, Inc. (“OFI Global” or the “Adviser”), a wholly-owned subsidiary of OppenheimerFunds, Inc. (“OFI” or the “Sub-Adviser”) (“OFI Global” and “OFI” together the “Managers”) and OFI Global has entered into a sub-advisory agreement with OFI whereby OFI provides investment sub-advisory services to the Fund (collectively, the “Agreements”). Each year, the Board of Trustees (the “Board”), including a majority of the independent Trustees, is required to determine whether to approve the terms of the Agreements and the renewal thereof. The Investment Company Act of 1940, as amended, requires that the Board request and evaluate, and that the Managers provide, such information as may be reasonably necessary to evaluate the terms of the Agreements. The Board employs an independent consultant to prepare a report that provides information, including comparative information that the Board requests for that purpose. In addition to in-person meetings focused on this evaluation, the Board receives information throughout the year regarding Fund services, fees, expenses and performance.
The Adviser, Sub-Adviser and the independent consultant provided information to the Board on the following factors: (i) the nature, quality and extent of the Managers’ services, (ii) the comparative investment performance of the Fund and the Managers, (iii) the fees and expenses of the Fund, including comparative fee and expense information, (iv) the profitability of the Managers and their affiliates, including an analysis of the cost of providing services, (v) whether economies of scale are realized as the Fund grows and whether fee levels reflect these economies of scale for Fund investors and (vi) other benefits to the Managers from their relationship with the Fund. The Board was aware that there are alternatives to retaining the Managers.
Outlined below is a summary of the principal information considered by the Board as well as the Board’s conclusions.
Nature, Quality and Extent of Services. The Board considered information about the nature, quality and extent of the services provided to the Fund and information regarding the Managers’ key personnel who provide such services. The Managers’ duties include providing the Fund with the services of the portfolio managers and the Sub-Adviser’s investment team, who provide research, analysis and other advisory services in regard to the Fund’s investments; and securities trading services. OFI Global is responsible for oversight of third-party service providers; monitoring compliance with applicable Fund policies and procedures and adherence to the Fund’s investment restrictions; risk management; and oversight of the Sub-Adviser. OFI Global is also responsible for providing certain administrative services to the Fund as well. Those services include providing and supervising all administrative and clerical personnel who are necessary in order to provide effective corporate administration for the Fund; compiling and maintaining records with respect to the Fund’s operations; preparing and filing reports required by the U.S. Securities and Exchange Commission; preparing periodic reports regarding the operations of the Fund for its shareholders; preparing proxy materials for shareholder meetings; and preparing the registration statements required by federal and state securities laws for the sale of the Fund’s shares. OFI Global also provides the Fund with office space, facilities and equipment.
The Board also considered the quality of the services provided and the quality of the Managers’ resources that are available to the Fund. The Board took account of the fact that the Sub-Adviser has had over fifty years of experience as an investment adviser and that its assets under management rank it among the top mutual fund managers in the United States. The Board evaluated the Managers’ advisory, administrative, accounting, legal, compliance services and risk management, and information the Board has received regarding the experience and professional qualifications of the Managers’ key personnel and the size and functions of its staff. In its evaluation of the quality of the portfolio management services provided, the Board considered the experience of George Evans and Robert Dunphy, the portfolio managers for the Fund, and the Sub-Adviser’s investment team and analysts. The Board members also considered the totality of their experiences with the Managers as directors or trustees of the Fund and other funds advised by the Managers. The Board considered information regarding the quality of services provided by affiliates of the Managers, which the Board members have become knowledgeable about through their experiences with the Managers and in connection with the renewal of the Fund’s service agreements. The Board concluded, in light of the Managers’ experience, reputation, personnel, operations and resources that the Fund benefits from the services provided under the Agreements.
Investment Performance of the Managers and the Fund. Throughout the year, the Managers provided information on the investment performance of the Fund, including comparative performance information. The Board also reviewed information, prepared by the Managers and by the independent consultant, comparing the Fund’s historical performance to relevant market indices and to the performance of other foreign large growth funds underlying variable insurance products. The Board noted that the Fund outperformed its performance category median during each of the three-, five- and ten-year periods, but underperformed its performance category median during the one-year period. The Board also noted that the Fund performed in the first quintile of its performance category for each of the five- and ten-year periods and in the second quintile of its performance category for the three-year period.
Fees and Expenses of the Fund. The Board reviewed the fees paid to the Adviser and the other expenses borne by the Fund. The Board noted that the Adviser, not the Fund, pays the Sub-Adviser’s fee under the sub-advisory agreement. The independent consultant provided comparative data in regard to the fees and expenses of the Fund and other foreign large growth funds underlying variable insurance products. In reviewing the fees and expenses charged to the VA funds, the Board considered the Adviser’s assertion that, because there is much greater disparity in the fees and services that may be provided by a manager to a VA fund as opposed to a retail fund, when comparing the expenses of the various VA funds to those of retail funds, it is most appropriate to focus on total expenses (rather than on the management fees). Accordingly, while the Board reviewed and considered all expenses, it focused on total expenses. The Board considered that the Fund’s total expenses, after waivers, were lower than its peer group median and higher than its category median. The Board also considered that the Fund’s contractual management fee was equal to its peer group median and higher than its category median. Within the total asset range of $500 million to $1 billion, the Fund’s effective management fee rate was higher than its peer group median and category median. The Board noted that the Adviser has contractually agreed to limit the Fund’s total annual operating expenses so that those expenses, as percentages of daily net assets, will not exceed the annual rate of 1.00% for Non-Service Shares and 1.25% for Service Shares. This contractual expense limitation may not be amended or withdrawn until one year from the date of the Fund’s prospectus, unless approved by the Board. The Board considered that the Adviser proposed an additional management fee breakpoint at 0.82% for annual net assets in excess of $1 billion, which took effect on November 1, 2015.
24 OPPENHEIMER INTERNATIONAL GROWTH FUND/VA
Economies of Scale and Profits Realized by the Managers. The Board considered information regarding the Managers’ costs in serving as the Fund’s investment adviser and sub-adviser, including the costs associated with the personnel and systems necessary to manage the Fund, and information regarding the Managers’ profitability from their relationship with the Fund. The Board reviewed whether the Managers may realize economies of scale in managing and supporting the Fund. The Board noted that the Fund currently has management fee breakpoints, which are intended to share with Fund shareholders economies of scale that may exist as the Fund’s assets grow.
Other Benefits to the Managers. In addition to considering the profits realized by the Managers, the Board considered information that was provided regarding the direct and indirect benefits the Managers receive as a result of their relationship with the Fund, including compensation paid to the Managers’ affiliates and research provided to the Adviser in connection with permissible brokerage arrangements (soft dollar arrangements).
Conclusions. These factors were also considered by the independent Trustees meeting separately from the full Board, assisted by experienced counsel to the Fund and to the independent Trustees. Fund counsel and the independent Trustees’ counsel are independent of the Managers within the meaning and intent of the Securities and Exchange Commission Rules.
Based on its review of the information it received and its evaluations described above, the Board, including a majority of the independent Trustees, decided to continue the Agreements through August 31, 2016. In arriving at its decision, the Board did not identify any factor or factors as being more important than others, but considered all of the above information, and considered the terms and conditions of the Agreements, including the management fees, in light of all the surrounding circumstances.
25 OPPENHEIMER INTERNATIONAL GROWTH FUND/VA
PORTFOLIO PROXY VOTING POLICIES AND PROCEDURES; UPDATES TO STATEMENT OF INVESTMENTS Unaudited
The Fund has adopted Portfolio Proxy Voting Policies and Procedures under which the Fund votes proxies relating to securities (“portfolio proxies”) held by the Fund. A description of the Fund’s Portfolio Proxy Voting Policies and Procedures is available (i) without charge, upon request, by calling the Fund toll-free at 1.800.525.7048, (ii) on the Fund’s website at www.oppenheimerfunds.com, and (iii) on the SEC’s website at www.sec.gov. In addition, the Fund is required to file Form N-PX, with its complete proxy voting record for the 12 months ended June 30th, no later than August 31st of each year. The Fund’s voting record is available (i) without charge, upon request, by calling the Fund toll-free at 1.800.525.7048, and (ii) in the Form N-PX filing on the SEC’s website at www.sec.gov.
The Fund files its complete schedule of portfolio holdings with the SEC for the first quarter and the third quarter of each fiscal year on Form N-Q. The Fund’s Form N-Q filings are available on the SEC’s website at www.sec.gov. Those forms may be reviewed and copied at the SEC’s Public Reference Room in Washington, D.C. Information on the operation of the Public Reference Room may be obtained by calling 1-800-SEC-0330.
26 OPPENHEIMER INTERNATIONAL GROWTH FUND/VA
TRUSTEES AND OFFICERS Unaudited
| | |
Name, Position(s) Held with the Fund, Length of
Service, Age | | Principal Occupation(s) During the Past 5 Years; Other Trusteeships/Directorships
Held; Number of Portfolios in the Fund Complex Currently Overseen |
| |
| INDEPENDENT TRUSTEES | | The address of each Director in the chart below is 6803 S. Tucson Way, Centennial, Colorado 80112-3924. Each Director serves for an indefinite term, or until his or her resignation, retirement, death or removal. |
| |
Sam Freedman, Chairman of the Board of Trustees (since 2013) and Trustee (since 1996) Year of Birth: 1940 | | Director of Colorado UpLIFT (charitable organization) (since September 1984). Mr. Freedman held several positions with the Sub- Adviser and with subsidiary or affiliated companies of the Sub-Adviser (until October 1994). Oversees 47 portfolios in the OppenheimerFunds complex. Mr. Freedman has served on the Boards of certain Oppenheimer funds since 1996, during which time he has become familiar with the Fund’s (and other Oppenheimer funds’) financial, accounting, regulatory and investment matters and has contributed to the Boards’ deliberations. |
| |
Jon S. Fossel, Trustee (since 1990) Year of Birth: 1942 | | Chairman of the Board of Jack Creek Preserve Foundation (non-profit organization) (since 2005); Chairman of the Board (2006-December 2011) and Director (June 2002-December 2011) of UNUMProvident (insurance company); Director of Northwestern Energy Corp. (public utility corporation) (November 2004-December 2009); Director of P.R. Pharmaceuticals (October 1999-October 2003); Director of Rocky Mountain Elk Foundation (non-profit organization) (February 1998-February 2003 and February 2005-February 2007); Chairman and Director (until October 1996) and President and Chief Executive Officer (until October 1995) of the Sub-Adviser; President, Chief Executive Officer and Director of the following: Oppenheimer Acquisition Corp. (“OAC”) (parent holding company of the Sub-Adviser), Shareholders Services, Inc. and Shareholder Financial Services, Inc. (until October 1995). Oversees 47 portfolios in the OppenheimerFunds complex. Mr. Fossel has served on the Boards of certain Oppenheimer funds since 1990, during which time he has become familiar with the Fund’s (and other Oppenheimer funds’) financial, accounting, regulatory and investment matters and has contributed to the Boards’ deliberations. |
| |
Richard F. Grabish, Trustee (since 2012) Year of Birth: 1948 | | Formerly Senior Vice President and Assistant Director of Sales and Marketing (March 1997-December 2007), Director (March 1987-December 2007) and Manager of Private Client Services (June 1985-June 2005) of A.G. Edwards & Sons, Inc. (broker/dealer and investment firm); Chairman and Chief Executive Officer of A.G. Edwards Trust Company, FSB (March 2001-December 2007); President and Vice Chairman of A.G. Edwards Trust Company, FSB (investment adviser) (April 1987-March 2001); President of A.G. Edwards Trust Company, FSB (investment adviser) (June 2005-December 2007). Oversees 47 portfolios in the OppenheimerFunds complex. Mr. Grabish has served on the Boards of certain Oppenheimer funds since 2001, during which time he has become familiar with the Fund’s (and other Oppenheimer funds’) financial, accounting, regulatory and investment matters and has contributed to the Boards’ deliberations. |
| |
Beverly L. Hamilton, Trustee (since 2002) Year of Birth: 1946 | | Trustee of Monterey Institute for International Studies (educational organization) (since February 2000); Board Member of Middlebury College (educational organization) (December 2005-June 2011); Chairman (since 2010) of American Funds’ Emerging Markets Growth Fund, Inc. (mutual fund); Director of The California Endowment (philanthropic organization) (April 2002-April 2008); Director (February 2002-2005) and Chairman of Trustees (2006-2007) of the Community Hospital of Monterey Peninsula; Director (October 1991-2005); Vice Chairman (2006-2009) of American Funds’ Emerging Markets Growth Fund, Inc. (mutual fund); President of ARCO Investment Management Company (February 1991-April 2000); Member of the investment committees of The Rockefeller Foundation (2001-2006) and The University of Michigan (since 2000); Advisor at Credit Suisse First Boston’s Sprout venture capital unit (venture capital fund) (1994-January 2005); Trustee of MassMutual Institutional Funds (investment company) (1996-June 2004); Trustee of MML Series Investment Fund (investment company) (April 1989-June 2004); Member of the investment committee of Hartford Hospital (2000-2003); and Advisor to Unilever (Holland) pension fund (2000-2003). Oversees 47 portfolios in the OppenheimerFunds complex. Ms. Hamilton has served on the Boards of certain Oppenheimer funds since 2002, during which time she has become familiar with the Fund’s (and other Oppenheimer funds’) financial, accounting, regulatory and investment matters and has contributed to the Boards’ deliberations. |
| |
Victoria J. Herget, Trustee (since 2012) Year of Birth:1951 | | Board Chair (2008-Present) and Director (2004-Present), United Educators (insurance company); Trustee (since 2000) and Chair (since 2010), Newberry Library (independent research library); Trustee, Mather LifeWays (senior living organization) (since 2001); Independent Director of the First American Funds (mutual fund family) (2003-2011); former Managing Director (1993-2001), Principal (1985-1993), Vice President (1978-1985) and Assistant Vice President (1973-1978) of Zurich Scudder Investments (investment adviser) (and its predecessor firms); Trustee (1992-2007), Chair of the Board of Trustees (1999-2007), Investment Committee Chair (1994-1999) and Investment Committee member (2007-2010) of Wellesley College; Trustee, BoardSource (non-profit organization) (2006-2009) and Chicago City Day School (K-8 School) (1994-2005). Oversees 47 portfolios in the OppenheimerFunds complex. Ms. Herget has served on the Boards of certain Oppenheimer funds since 2012, during which time she has become familiar with the Fund’s (and other Oppenheimer funds’) financial, accounting, regulatory and investment matters and has contributed to the Boards’ deliberations. |
| |
Robert J. Malone, Trustee (since 2002) Year of Birth: 1944 | | Chairman - Colorado Market of MidFirst Bank (since January 2015); Chairman of the Board (since 2012) and Director (since August 2005) of Jones International University (educational organization); Trustee of the Gallagher Family Foundation (non-profit organization) (2000-2015); Chairman, Chief Executive Officer and Director of Steele Street Bank Trust (commercial banking) (August 2003-January 2015); Board of Directors of Opera Colorado Foundation (non-profit organization) (2008-2012); Director of Colorado UpLIFT (charitable organization) (1986-2010); Director of Jones Knowledge, Inc. (2006-2010); Former Chairman of U.S. Bank-Colorado (subsidiary of U.S. Bancorp and formerly Colorado National Bank) (July 1996-April 1999); Director of Commercial Assets, Inc. (real estate investment trust) (1993-2000); Director of U.S. Exploration, Inc. (oil and gas exploration) (1997-February 2004); Chairman of the Board (1991-1994) and Trustee (1985-1994) of Regis University; and Chairman of the Board (1990-1991 and Trustee (1984-1999) of Young Presidents Organization. Oversees 47 portfolios in the OppenheimerFunds complex. Mr. Malone has served on the Boards of certain Oppenheimer funds since 2002, during which time he has become familiar with the Fund’s (and other Oppenheimer funds’) financial, accounting, regulatory and investment matters and has contributed to the Boards’ deliberations. |
27 OPPENHEIMER INTERNATIONAL GROWTH FUND/VA
TRUSTEES AND OFFICERS Unaudited / Continued
| | |
F. William Marshall, Jr., Trustee (since 2000) Year of Birth: 1942 | | Trustee Emeritus of Worcester Polytech Institute (WPI) (private university) (since 2009); Trustee of MassMutual Select Funds (formerly MassMutual Institutional Funds) (investment company) (since 1996), MML Series Investment Fund (investment company) (since 1996) and Mass Mutual Premier Funds (investment company) (since January 2012); President and Treasurer of the SIS Funds (private charitable fund) (January 1999-March 2011); Former Trustee of WPI (1985-2008); Former Chairman of the Board (2004-2006) and Former Chairman of the Investment Committee of WPI (1994-2008); Chairman of SIS Family Bank, F.S.B. (formerly SIS Bank) (commercial bank) (January 1999-July 1999); Executive Vice President of Peoples Heritage Financial Group, Inc. (commercial bank) (January 1999-July 1999); and Former President and Chief Executive Officer of SIS Bancorp. (1993-1999). Oversees 47 portfolios in the OppenheimerFunds complex. Mr. Marshall has served on the Boards of certain Oppenheimer funds since 2000, during which time he has become familiar with the Fund’s (and other Oppenheimer funds’) financial, accounting, regulatory and investment matters and has contributed to the Boards’ deliberations. |
| |
Karen L. Stuckey, Trustee (since 2012) Year of Birth: 1953 | | Partner (1990-2012) of PricewaterhouseCoopers LLP (professional services firm) (held various positions 1975-1990); Trustee (1992-2006) and member of Executive, Nominating and Audit Committees and Chair of Finance Committee of Lehigh University; and member, Women’s Investment Management Forum (professional organization) since inception. Oversees 47 portfolios in the OppenheimerFunds complex. Ms. Stuckey has served on the Boards of certain Oppenheimer funds since 2012, during which time she has become familiar with the Fund’s (and other Oppenheimer funds’) financial, accounting, regulatory and investment matters and has contributed to the Boards’ deliberations. |
| |
James D. Vaughn, Trustee (since 2012) Year of Birth: 1945 | | Retired; former managing partner (1994-2001) of Denver office of Deloitte & Touche LLP, (held various positions 1969-1993); Trustee and Chairman of the Audit Committee of Schroder Funds (2003-2012); Board member and Chairman of Audit Committee of AMG National Trust Bank (since 2005); Trustee, Investment Committee member, University of South Dakota Foundation (since 1996); Board member, Audit Committee Member and past Board Chair, Junior Achievement (since 1993); former Board member, Mile High United Way, Boys and Girls Clubs, Boy Scouts, Colorado Business Committee for the Arts, Economic Club of Colorado and Metro Denver Network. Oversees 47 portfolios in the OppenheimerFunds complex. Mr. Vaughn has served on the Boards of certain Oppenheimer funds since 2012, during which time he has become familiar with the Fund’s (and other Oppenheimer funds’) financial, accounting, regulatory and investment matters and has contributed to the Boards’ deliberations. |
| |
INTERESTED TRUSTEE AND OFFICER | | Mr. Steinmetz is an “Interested Trustee” because he is affiliated with the Manager and the Sub-Adviser by virtue of his positions as Chairman and director of the Sub-Adviser and officer and director of the Manager. Both as a Trustee and as an officer, Mr. Steinmetz serves for an indefinite term, or until his resignation, retirement, death or removal. Mr. Steinmetz’s address is 225 Liberty Street, New York, New York 10281-1008. |
| |
Arthur P. Steinmetz Trustee (Since 2015), President and Principal Executive Officer (since 2014) Year of Birth: 1958 | | Chairman of the Sub-Adviser (since January 2015); CEO and Chairman of the Manager (since July 2014), President of the Manager (since May 2013), a Director of the Manager (since January 2013), Director of the Sub-Adviser (since July 2014), President, Management Director and CEO of Oppenheimer Acquisition Corp. (the Sub-Adviser’s parent holding company) (since July 2014), and President and Director of OFI SteelPath, Inc. (since January 2013). Chief Investment Officer of the OppenheimerFunds advisory entities from (January 2013-December 2013); Executive Vice President of the Manager (January 2013-May 2013); Chief Investment Officer of the Sub-Adviser (October 2010-December 2012); Chief Investment Officer, Fixed- Income, of the Sub-Adviser (April 2009-October 2010); Executive Vice President of the Sub-Adviser (October 2009-December 2012); Director of Fixed Income of the Sub-Adviser (January 2009-April 2009); and a Senior Vice President of the Sub-Adviser (March 1993-September 2009). An officer of 101 portfolios in the OppenheimerFunds complex. |
| |
OTHER OFFICERS OF THE FUND | | The addresses of the Officers in the chart below are as follows: for Messrs. Evans, Dunphy, Gabinet, Mss. Sexton and Picciotto, 225 Liberty Street, New York, New York 10281-1008, for Mr. Wixted, 6803 S. Tucson Way, Centennial, Colorado 80112-3924. Each Officer serves for an indefinite term or until his or her resignation, retirement, death or removal. |
| |
George R. Evans, Vice President (since 1999) Year of Birth: 1959 | | CIO Equities of the Sub-Adviser (since January 2013); Senior Vice President of the Sub-Adviser (since July 2004). Director of International Equities of the Sub-Adviser (since July 2004); Director of Equities of the Sub-Adviser (October 2010-December 2012); Vice President of HarbourView Asset Management Corporation (July 1994-November 2001) and Vice President of the Sub-Adviser (October 1993-July 2004). A portfolio manager and officer of other portfolios in the OppenheimerFunds complex. |
| |
Robert B. Dunphy, Vice President (since 2012) Year of Birth: 1979 | | Vice President of the Sub-Adviser (since January 2011); Senior Portfolio Manager (since May 2011); Senior Research Analyst and Assistant Vice President of the Sub-Adviser (May 2009-January 2011), and an Intermediate Research Analyst of the Sub-Adviser (January 2006-May 2009). A portfolio manager of other portfolios in the OppenheimerFunds complex. |
| |
Arthur S. Gabinet, Secretary and Chief Legal Officer (since 2011) Year of Birth: 1958 | | Executive Vice President, Secretary and General Counsel of the Manager (since January 2013); General Counsel OFI SteelPath, Inc. (since January 2013); Executive Vice President (May 2010-December 2012) and General Counsel (since January 2011) of the Sub-Adviser; General Counsel of the Distributor (since January 2011); General Counsel of Centennial Asset Management Corporation (January 2011-December 2012); Executive Vice President (January 2011-December 2012) and General Counsel of HarbourView Asset Management Corporation (since January 2011); Assistant Secretary (since January 2011) and Director (since January 2011) of OppenheimerFunds International Ltd. and OppenheimerFunds plc; Director of Oppenheimer Real Asset Management, Inc. (January 2011-December 2012) and General Counsel (since January 2011); Executive Vice President (January 2011-December 2011) and General Counsel of Shareholder Financial Services, Inc. and Shareholder Services, Inc. (since January 2011); Executive Vice President (January 2011-December 2012) and General Counsel of OFI Private Investments Inc. (since January 2011); Vice President of OppenheimerFunds Legacy Program (January 2011-December 2011); Executive Vice President (January 2011-December 2012) and General Counsel of OFI Institutional Asset Management, Inc. (since January 2011); General Counsel, Asset Management of the Sub-Adviser (May 2010-December 2010); Principal, The Vanguard Group (November 2005- April 2010); District Administrator, U.S. Securities and Exchange Commission (January 2003-October 2005). An officer of 101 Portfolios in the OppenheimerFunds complex. |
28 OPPENHEIMER INTERNATIONAL GROWTH FUND/VA
| | |
Jennifer Sexton, Vice President and Chief Business Officer (since 2014) Year of Birth: 1969 | | Senior Vice President of OppenheimerFunds Distributor, Inc. (since June 2014); Vice President of OppenheimerFunds Distributor, Inc. (April 2006-June 2014); Vice President of the Sub-Adviser (January 1998-March 2006); Assistant Vice President of the Sub- Adviser (October 1991-December 1998). An officer of 101 Portfolios in the OppenheimerFunds complex. |
| |
Mary Ann Picciotto, Chief Compliance Officer and Chief Anti-Money Laundering Officer (since 2014) Year of Birth: 1973 | | Senior Vice President and Chief Compliance Officer of the Manager (since March 2014); Chief Compliance Officer of the Sub-Adviser, OFI SteelPath, Inc., OFI Global Trust Company, OFI Global Institutional, Inc., Oppenheimer Real Asset Management, Inc., OFI Private Investments, Inc., Harborview Asset Management Corporation, Trinity Investment Management Corporation, and Shareholder Services, Inc. (since March 2014); Managing Director of Morgan Stanley Investment Management Inc. and certain of its various affiliated entities; Chief Compliance Officer of various Morgan Stanley Funds (May 2010-January 2014); Chief Compliance Officer of Morgan Stanley Investment Management Inc. (April 2007-January 2014). An officer of 101 Portfolios in the OppenheimerFunds complex. |
| |
Brian W. Wixted, Treasurer and Principal Financial & Accounting Officer (since 1999) Year of Birth: 1959 | | Senior Vice President of the Manager (since January 2013); Treasurer of the Sub-Adviser, HarbourView Asset Management Corporation, Shareholder Financial Services, Inc., Shareholder Services, Inc., and Oppenheimer Real Asset Management, Inc. (March 1999-June 2008), OFI Private Investments, Inc. (March 2000-June 2008), OppenheimerFunds International Ltd. and OppenheimerFunds plc (since May 2000), OFI Institutional Asset Management, Inc. (November 2000-June 2008), and OppenheimerFunds Legacy Program (charitable trust program established by the Sub-Adviser) (June 2003-December 2011); Treasurer and Chief Financial Officer of OFI Trust Company (since May 2000); Assistant Treasurer of Oppenheimer Acquisition Corporation (March 1999-June 2008). An officer of 101 Portfolios in the OppenheimerFunds complex. |
The Fund’s Statement of Additional Information contains additional information about the Fund’s Directors and Officers and is available without charge, upon request, by calling 1.800.988.8287.
29 OPPENHEIMER INTERNATIONAL GROWTH FUND/VA
THIS PAGE INTENTIONALLY LEFT BLANK.
30 OPPENHEIMER INTERNATIONAL GROWTH FUND/VA
THIS PAGE INTENTIONALLY LEFT BLANK.
31 OPPENHEIMER INTERNATIONAL GROWTH FUND/VA
OPPENHEIMER INTERNATIONAL GROWTH FUND/VA
A Series of Oppenheimer Variable Account Funds
| | |
| Manager | | OFI Global Asset Management, Inc. |
| |
| Sub-Adviser | | OppenheimerFunds, Inc. |
| |
| Distributor | | OppenheimerFunds Distributor, Inc. |
| |
Transfer and Shareholder Servicing Agent | | OFI Global Asset Management, Inc. |
| |
| Sub-Transfer Agent | | Shareholder Services, Inc. DBA OppenheimerFunds Services |
| |
Independent Registered Public Accounting Firm | | KPMGLLP |
| |
| Counsel | | Ropes & Gray LLP |
| |
| | Before investing in any of the Oppenheimer funds, investors should carefully consider a fund’s investment objectives, risks, charges and expenses. Fund prospectuses and summary prospectuses contain this and other information about the funds, and may be obtained by asking your financial advisor, or calling us at 1.800.988.8287. Read prospectuses and summary prospectuses carefully before investing. |
| |
| | © 2016 OppenheimerFunds, Inc. All rights reserved. Oppenheimer funds are distributed by OppenheimerFunds Distributor, Inc. |

Item 2. Code of Ethics.
The registrant has adopted a code of ethics that applies to the registrant’s principal executive officer, principal financial officer, principal accounting officer or controller or persons performing similar functions.
Item 3. Audit Committee Financial Expert.
The Board of Trustees of the registrant has determined that F. William Marshall, Jr., the Chairman of the Board’s Audit Committee, is the audit committee financial expert and that Mr. Marshall is “independent” for purposes of this Item 3.
Item 4. Principal Accountant Fees and Services.
The principal accountant for the audit of the registrant’s annual financial statements billed $438,300 in fiscal 2015 and $369,600 in fiscal 2014.
The principal accountant for the audit of the registrant’s annual financial statements billed no such fees in fiscal 2015 and no such fees in fiscal 2014.
The principal accountant for the audit of the registrant’s annual financial statements billed $621,859 in fiscal 2015 and $1,012,359 in fiscal 2014 to the registrant’s investment adviser or any entity controlling, controlled by, or under common control with the adviser that provides ongoing services to the registrant.
Such services include: Internal control reviews, GIPS attestation procedures, reorganization, system conversion testing, audit overages, and audit scope changes.
The principal accountant for the audit of the registrant’s annual financial statements billed $28,745 in fiscal 2015 and $19,329 in fiscal 2014.
The principal accountant for the audit of the registrant’s annual financial statements billed $720,026 in fiscal 2015 and $477,069 in fiscal 2014 to the registrant’s investment adviser or any entity controlling, controlled by, or under common control with the adviser that provides ongoing services to the registrant.
Such services include: tax compliance, tax planning and tax advice. Tax compliance generally involves preparation of original and amended tax returns, claims for a refund and tax payment-planning services. Tax planning and tax advice includes assistance with tax audits and appeals, tax advice related to mergers and acquisitions and requests for rulings or technical advice from taxing authorities.
The principal accountant for the audit of the registrant’s annual financial statements billed no such fees in fiscal 2015 and no such fees in fiscal 2014.
The principal accountant for the audit of the registrant’s annual financial statements billed no such fees in fiscal 2015 and no such fees in fiscal 2014 to the registrant’s investment adviser or any entity controlling, controlled by, or under common control with the adviser that provides ongoing services to the registrant.
Such fees would include the cost to the principal accountant of attending audit committee meetings and consultations regarding the registrant’s retirement plan with respect to its Trustees.
| (e) | (1) During its regularly scheduled periodic meetings, the registrant’s audit committee will pre-approve all audit, audit-related, tax and other services to be provided by the principal accountants of the registrant. |
The audit committee has delegated pre-approval authority to its Chairman for any subsequent new engagements that arise between regularly scheduled meeting dates provided that any fees such pre-approved are presented to the audit committee at its next regularly scheduled meeting.
Under applicable laws, pre-approval of non-audit services may be waived provided that: 1) the aggregate amount of all such services provided constitutes no more than five percent of the total amount of fees paid by the registrant to its principal accountant during the fiscal year in which services are provided 2) such services were not recognized by the registrant at the time of engagement as non-audit services and 3) such services are promptly brought to the attention of the audit committee of the registrant and approved prior to the completion of the audit.
(2) 0%
| (f) | Not applicable as less than 50%. |
| (g) | The principal accountant for the audit of the registrant’s annual financial statements billed $16,131,365 in fiscal 2015 and $17,892,465 in fiscal 2014 to the registrant and the registrant’s investment adviser or any entity controlling, controlled by, or under common control with the adviser that provides ongoing services to the registrant related to non-audit fees. Those billings did not include any prohibited non-audit services as defined by the Securities Exchange Act of 1934. |
| (h) | The registrant’s audit committee of the board of Trustees has considered whether the provision of non-audit services that were rendered to the registrant’s investment adviser, and any entity controlling, controlled by, or under common control with the investment adviser that provides ongoing services to the registrant that were not pre-approved pursuant to paragraph (c)(7)(ii) of Rule 2-01 of Regulation S-X is compatible with maintaining the principal accountant’s independence. No such services were rendered. |
Item 5. Audit Committee of Listed Registrants
Not applicable.
Item 6. Schedule of Investments.
a) Not applicable. The complete schedule of investments is included in Item 1 of this Form N-CSR.
b) Not applicable.
Item 7. Disclosure of Proxy Voting Policies and Procedures for Closed-End Management Investment Companies.
Not applicable.
Item 8. Portfolio Managers of Closed-End Management Investment Companies.
Not applicable.
Item 9. Purchases of Equity Securities by Closed-End Management Investment Company and Affiliated Purchasers.
Not applicable.
Item 10. Submission of Matters to a Vote of Security Holders.
The Fund’s Governance Committee Provisions with Respect to Nominations of Directors/Trustees to the Respective Boards
None
Item 11. Controls and Procedures.
Based on their evaluation of the registrant’s disclosure controls and procedures (as defined in rule 30a-3(c) under the Investment Company Act of 1940 (17 CFR 270.30a-3(c)) as of 12/31/2015, the registrant’s principal executive officer and principal financial officer found the registrant’s disclosure controls and procedures to provide reasonable assurances that information required to be disclosed by the registrant in the reports that it files under the Securities Exchange Act of 1934 (a) is accumulated and communicated to registrant’s management, including its principal executive officer and principal financial officer, to allow timely decisions regarding required disclosure, and (b) is recorded, processed, summarized and reported, within the time periods specified in the rules and forms adopted by the U.S. Securities and Exchange Commission.
There have been no changes in the registrant’s internal controls over financial reporting that occurred during the registrant’s second fiscal quarter of the period covered by this report that have materially affected, or are reasonably likely to materially affect, the registrant’s internal control over financial reporting.
Item 12. Exhibits.
| (a) | (1) Exhibit attached hereto. |
(2) Exhibits attached hereto.
(3) Not applicable.
| (b) | Exhibit attached hereto. |
SIGNATURES
Pursuant to the requirements of the Securities Exchange Act of 1934 and the Investment Company Act of 1940, the registrant has duly caused this report to be signed on its behalf by the undersigned, thereunto duly authorized.
Oppenheimer Variable Account Funds
| | |
| By: | | /s/ Arthur P. Steinmetz |
| | Arthur P. Steinmetz |
| | Principal Executive Officer |
| Date: | | 2/16/2016 |
Pursuant to the requirements of the Securities Exchange Act of 1934 and the Investment Company Act of 1940, this report has been signed below by the following persons on behalf of the registrant and in the capacities and on the dates indicated.
| | |
| By: | | /s/ Arthur P. Steinmetz |
| | Arthur P. Steinmetz |
| | Principal Executive Officer |
| Date: | | 2/16/2016 |
| | |
| By: | | /s/ Brian W. Wixted |
| | Brian W. Wixted |
| | Principal Financial Officer |
| Date: | | 2/16/2016 |