UNITED STATES
SECURITIES AND EXCHANGE COMMISSION
WASHINGTON, D.C. 20549
FORMN-CSR
CERTIFIED SHAREHOLDER REPORT OF REGISTERED MANAGEMENT
INVESTMENT COMPANIES
Investment Company Act file number811-4108
Oppenheimer Variable Account Funds
(Exact name of registrant as specified in charter)
6803 South Tucson Way, Centennial, Colorado 80112-3924
(Address of principal executive offices) (Zip code)
Cynthia Lo Bessette
OFI Global Asset Management, Inc.
225 Liberty Street, New York, New York 10281-1008
(Name and address of agent for service)
Registrant’s telephone number, including area code:(303)768-3200
Date of fiscal year end:December 31
Date of reporting period:12/31/2018
| Item 1. | Reports to Stockholders. |
| | | | |
| | 
| | |
| | |
| | | December 31, 2018 | | |
| | Oppenheimer | | |
| | Discovery Mid Cap Growth Fund/VA | | Annual Report |
| | A Series of Oppenheimer Variable Account Funds | | |
| | | |
| | ANNUAL REPORT | | |
| | |
| | Listing of Top Holdings | | |
| | |
| | Fund Performance Discussion | | |
| | |
| | Financial Statements | | |
PORTFOLIO MANAGERS: Ronald J. Zibelli, Jr., CFA and Justin Livengood, CFA
AVERAGE ANNUAL TOTAL RETURNS FOR THE PERIODS ENDED 12/31/18
| | | | | | | | | | | | | | |
| | | Inception Date | | 1-Year | | | 5-Year | | | 10-Year | |
Non-Service Shares | | 8/15/86 | | | -6.08% | | | | 6.90% | | | | 14.21 | % |
Service Shares | | 10/16/00 | | | -6.31 | | | | 6.63 | | | | 13.93 | |
Russell Midcap Growth Index | | | | | -4.75 | | | | 7.42 | | | | 15.12 | |
Performance data quoted represents past performance, which does not guarantee future results. The investment return and principal value of an investment in the Fund will fluctuate so that an investor’s shares, when redeemed, may be worth more or less than their original cost. Current performance may be lower or higher than the performance quoted. For performance data current to the most recent month end, call us at 1.800.988.8287. The Fund’s total returns should not be expected to be the same as the returns of other funds, whether or not both funds have the same portfolio managers and/or similar names. The Fund’s total returns include changes in share price and reinvested distributions but do not include the charges associated with the separate account products that offer this Fund. Such performance would have been lower if such charges were taken into account. Returns for periods of less than one year are cumulative and not annualized. See Fund prospectuses and summary prospectuses for more information on share classes and sales charges.
TOP HOLDINGS AND ALLOCATIONS
TOP TEN COMMON STOCK HOLDINGS
| | |
Total System Services, Inc. | | 2.5% |
CoStar Group, Inc. | | 2.3 |
Waste Connections, Inc. | | 2.3 |
Roper Technologies, Inc. | | 2.1 |
Lamb Weston Holdings, Inc. | | 2.1 |
O’Reilly Automotive, Inc. | | 2.0 |
CDW Corp. | | 1.9 |
IDEX Corp. | | 1.9 |
WellCare Health Plans, Inc. | | 1.9 |
Progressive Corp. (The) | | 1.9 |
Portfolio holdings and allocations are subject to change. Percentages are as of December 31, 2018, and are based on net assets.
SECTOR ALLOCATION
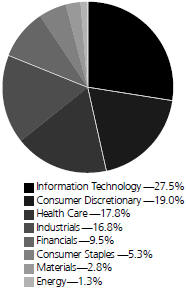
Portfolio holdings and allocations are subject to change. Percentages are as of December 31, 2018, and are based on the total market value of common stocks.
For more current Fund holdings, please visit oppenheimerfunds.com.
2 OPPENHEIMER DISCOVERY MID CAP GROWTH FUND/VA
Fund Performance Discussion
The Fund’sNon-Service shares produced a return of-6.08% during the reporting period, underperforming the Russell Midcap Growth Index’s (the “Index”) return of-4.75%. The Fund underperformed the Index within the Industrials and Energy sectors due to stock selection, and in the Information Technology Sector due to an underweight position. Stock selection in the Health Care, Financials, and Communication Services sectors provided favorable performance.
MARKET OVERVIEW
After markets closed 2017 with strong performance, volatility made a comeback in 2018 due to a combination of the U.S. Administration’s trade wars with other nations, a slowing of global economic activity, and the prospect of rising interest rates interrupting the upward march of the equity markets. During the fourth quarter of 2018, equity market volatility spiked and all major equity indices across the world had substantially negative performance.
TOP INDIVIDUAL CONTRIBUTORS
Top performing stocks for the Fund this reporting period included ABIOMED, Atlassian, and ServiceNow.
ABIOMED Inc. is a medical device manufacturer focused on heart pumps. Their Impella pumps provide better outcomes for many patients undergoing heart procedures, and the momentum in using Impella to treat patients remains strong. ABIOMED is an example of our Medical Technology theme.
Atlassian Corp. is an enterprise software company specializing in collaboration, communication, and service management. The company’s JIRA Service Desk is the fastest growing product within their portfolio. The share price continues to increase as the company reports quarter after quarter of impressive growth in revenue and earnings. Atlassian is an example of ourSoftware-as-a-Service (SaaS) theme.
ServiceNow, Inc. is an enterprise software company with a focus on corporate IT service management (ITSM). The company dominates in the ITSM space while also expanding into the operations management functions such as HR and Security. ServiceNow is also an example of our SaaS theme.
TOP INDIVIDUAL DETRACTORS
Detractors from performance this reporting period included Continental Resources, WEX, and GrubHub.
Continental is an exploration and production (E&P) company that produces oil and natural gas. They are mostly focused on drilling in the Bakken Shale in North Dakota and the Woodford Shale in Oklahoma. Continental reported solid financial results during the year, however their oil & natural gas is unhedged unlike some peers. As a result, the stock underperformed due to the significant decline in oil prices in the second half of the period. We continue to own this security.
WEX is a payment processing company. Their primary business is a global fuel card network that allows operators of fleets of trucks to track and manage gasoline purchases. A portion of Wex’s revenue in this business is linked to the price of gasoline, which declined substantially in the second half of the period and led to underperformance. We remain positive on Wex’s overall business.
GrubHub is an online and mobile food ordering company that connects localtake-out restaurants with its online platform. After reaching anall-time high in September, the share price faced downward pressure from investors skeptical of the company’s accelerated buildout of their nationwide delivery network. We maintain a constructive view on the company’s growth potential.
STRATEGY & OUTLOOK
Our long-term investment process remains the same. We seek dynamic companies with above-average and sustainable revenue and earnings growth that we believe are positioned to outperform. This includes leading firms in structurally attractive industries with committed management teams that have proven records of performance.
Looking forward, we expect the growth rate of the U.S. economy to moderate from a solid 2018, while remaining stronger than many other economies around the world. Tighter monetary policy, waning benefit from fiscal stimulus, and trade war fallout are the primary reasons for this slowdown. We believe moderating economic growth and the anniversary of corporate tax cuts will combine to materially slow the pace of earnings growth. The equity markets have started to reflect this scenario with lower valuations and that process could continue in 2019, along with elevated market volatility. We believe that companies with strong secular growth profiles will outperform those in cyclical industries over the intermediate future.
3 OPPENHEIMER DISCOVERY MID CAP GROWTH FUND/VA
Our opportunity set remains compelling and we expect stock selection to continue to drive our relative performance over the long term. Our holdings growth trajectory remains superior to the current corporate profit environment, with earnings per share (EPS) growth in the most recent quarter of more than 30% in the Fund.
Investors should consider the Fund’s investment objective, risks, charges and expenses carefully before investing. The Fund’s prospectus and summary prospectus contain this and other information about the Fund, and may be obtained by asking your financial advisor or calling us at 1.800.988.8287. Read prospectuses and summary prospectuses carefully before investing.
Total returns include changes in share price and reinvestment of dividends and capital gains distributions in a hypothetical investment for the periods shown, but do not include the charges associated with the separate account products that offer this Fund.
The views in the Fund Performance Discussion represent the opinions of this Fund’s portfolio managers and are not intended as investment advice or to predict or depict the performance of any investment. These views are as of the close of business on December 31, 2018, and are subject to change based on subsequent developments. The Fund’s portfolio and strategies are subject to change.
Shares of Oppenheimer funds are not deposits or obligations of any bank, are not guaranteed by any bank, are not insured by the FDIC or any other agency, and involve investment risks, including the possible loss of the principal amount invested.
Comparing the Fund’s Performance to the Market.The graphs that follow show the performance of a hypothetical $10,000 investment in each share class of the Fund held until December 31, 2018. Performance is measured over aten-fiscal-year period for both Classes. Performance information does not reflect charges that apply to separate accounts investing in the Fund. If these charges were taken into account, performance would be lower. The graphs assume that all dividends and capital gains distributions were reinvested in additional shares.
The Fund’s performance is compared to the performance of the Russell Midcap Growth Index. The Russell Midcap Growth Index measures the performance of themid-cap growth segment of the U.S. equity universe. It includes those Russell Midcap Index companies with higherprice-to-book ratios and higher forecasted growth values. The Index isunmanaged and cannot be purchased directly by investors. While index comparisons may be useful to provide a benchmark for the Fund’s performance, it must be noted that the Fund’s investments are not limited to the investments comprising theIndex. Index performance includes reinvestment of income, but does not reflect transaction costs, fees, expenses or taxes. Index performance is shown for illustrative purposes only as a benchmark for the Fund’s performance, and does not predict or depict performance of the Fund. The Fund’s performance reflects the effects of the Fund’s business and operating expenses.
4 OPPENHEIMER DISCOVERY MID CAP GROWTH FUND/VA
COMPARISON OF CHANGE IN VALUE OF $10,000 HYPOTHETICAL INVESTMENTS IN:
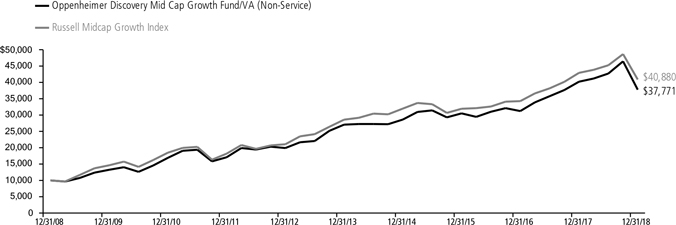
Average Annual Total Returns ofNon-Service Shares of the Fund at 12/31/18
1-Year -6.08% 5-Year 6.90% 10-Year14.21%
COMPARISON OF CHANGE IN VALUE OF $10,000 HYPOTHETICAL INVESTMENTS IN:
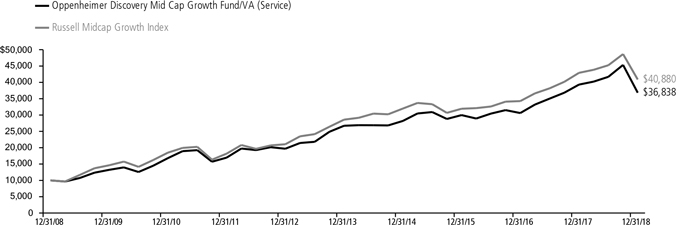
Average Annual Total Returns of Service Shares of the Fund at 12/31/18
1-Year -6.31% 5-Year 6.63% 10-Year13.93%
Performance data quoted represents past performance, which does not guarantee future results. The investment return and principal value of an investment in the Fund will fluctuate so that an investor’s shares, when redeemed, may be worth more or less than their original cost. Current performance may be lower or higher than the performance quoted. For performance data current to the most recent month end, call us at 1.800.988.8287. The Fund’s total returns should not be expected to be the same as the returns of other funds, whether or not both funds have the same portfolio managers and/or similar names. The Fund’s total returns include changes in share price and reinvested distributions but do not include the charges associated with the separate account products that offer this Fund. Such performance would have been lower if such charges were taken into account.
5 OPPENHEIMER DISCOVERY MID CAP GROWTH FUND/VA
Fund Expenses
Fund Expenses.As a shareholder of the Fund, you incur two types of costs: (1) transaction costs and (2) ongoing costs, including management fees; distribution and service fees; and other Fund expenses. These examples are intended to help you understand your ongoing costs (in dollars) of investing in the Fund and to compare these costs with the ongoing costs of investing in other mutual funds.
The examples are based on an investment of $1,000.00 invested at the beginning of the period and held for the entire6-month period ended December 31, 2018.
Actual Expenses. The first section of the table provides information about actual account values and actual expenses. You may use the information in this section for the class of shares you hold, together with the amount you invested, to estimate the expense that you paid over the period. Simply divide your account value by $1,000.00 (for example, an $8,600.00 account value divided by $1,000.00 = 8.60), then multiply the result by the number in the first section under the heading entitled “Expenses Paid During 6 Months Ended December 31, 2018” to estimate the expenses you paid on your account during this period.
Hypothetical Example for Comparison Purposes.
The second section of the table provides information about hypothetical account values and hypothetical expenses based on the Fund’s actual expense ratio for each class of shares, and an assumed rate of return of 5% per year for each class before expenses, which is not the actual return. The hypothetical account values and expenses may not be used to estimate the actual ending account balance or expenses you paid for the period. You may use this information to compare the ongoing costs of investing in the Fund and other funds. To do so, compare this 5% hypothetical example for the class of shares you hold with the 5% hypothetical examples that appear in the shareholder reports of the other funds.
Please note that the expenses shown in the table are meant to highlight your ongoing costs only and do not reflect any charges associated with the separate accounts that offer this Fund. Therefore, the “hypothetical” lines of the table are useful in comparing ongoing costs only, and will not help you determine the relative total costs of owning different funds. In addition, if these separate account charges were included your costs would have been higher.
| | | | | | | | | | | | | | | | |
| Actual | | Beginning
Account
Value July 1, 2018 | | | Ending
Account
Value
December 31, 2018 | | | Expenses
Paid During
6 Months Ended
December 31, 2018 | |
Non-Service shares | | $ | 1,000.00 | | | $ | 884.40 | | | $ | 3.81 | | | | | |
Service shares | | | 1,000.00 | | | | 883.40 | | | | 5.00 | | | | | |
| |
| Hypothetical | | | | |
| (5% return before expenses) | | | | | | | | | | | | |
Non-Service shares | | | 1,000.00 | | | | 1,021.17 | | | | 4.08 | | | | | |
Service shares | | | 1,000.00 | | | | 1,019.91 | | | | 5.36 | | | | | |
Expenses are equal to the Fund’s annualized expense ratio for that class, multiplied by the average account value over the period, multiplied by 184/365 (to reflect theone-half year period). Those annualized expense ratios, excluding indirect expenses from affiliated funds, based on the6-month period ended December 31, 2018 are as follows:
| | | | | | | | |
| Class | | Expense Ratios | | | | |
Non-Service shares | | | 0.80% | | | | | |
Service shares | | | 1.05 | | | | | |
The expense ratios reflect voluntary and/or contractual waivers and/or reimbursements of expenses by the Fund’s Manager. Some of these undertakings may be modified or terminated at any time, as indicated in the Fund’s prospectus. The “Financial Highlights” tables in the Fund’s financial statements, included in this report, also show the gross expense ratios, without such waivers or reimbursements and reduction to custodian expenses, if applicable.
6 OPPENHEIMER DISCOVERY MID CAP GROWTH FUND/VA
STATEMENT OF INVESTMENTSDecember 31, 2018
| | | | | | | | |
| | | Shares | | | Value | |
| |
| Common Stocks—94.9% | | | | | |
| |
| Consumer Discretionary—18.0% | | | | | |
| |
| Distributors—1.5% | | | | | |
| |
| Pool Corp. | | | 62,310 | | | $ | 9,262,382 | |
|
| |
| Diversified Consumer Services—1.5% | | | | | |
| |
Bright Horizons Family Solutions, Inc.1 | | | 85,780 | | | | 9,560,181 | |
|
| |
Entertainment—0.5% | | | | | | | | |
| |
Live Nation Entertainment, Inc.1 | | | 60,220 | | | | 2,965,835 | |
|
| |
Hotels, Restaurants & Leisure—4.7% | | | | | |
| |
Chipotle Mexican Grill, Inc., Cl. A1 | | | 10,340 | | | | 4,464,709 | |
| |
Domino’s Pizza, Inc. | | | 41,350 | | | | 10,254,386 | |
| |
Planet Fitness, Inc., Cl. A1 | | | 132,410 | | | | 7,099,824 | |
| |
Vail Resorts, Inc. | | | 33,690 | | | | 7,102,526 | |
| | | | | | | | |
| | | | | | | 28,921,445 | |
|
| |
Interactive Media & Services—1.3% | | | | | |
| |
IAC/InterActiveCorp1 | | | 45,370 | | | | 8,304,525 | |
|
| |
Internet & Catalog Retail—0.5% | | | | | |
| |
GrubHub, Inc.1 | | | 43,820 | | | | 3,365,814 | |
|
| |
Multiline Retail—0.9% | | | | | | | | |
| |
Ollie’s Bargain Outlet Holdings, Inc.1 | | | 86,110 | | | | 5,727,176 | |
|
| |
Specialty Retail—5.2% | | | | | | | | |
| |
Burlington Stores, Inc.1 | | | 65,550 | | | | 10,663,018 | |
| |
O’Reilly Automotive, Inc.1 | | | 35,800 | | | | 12,327,014 | |
| |
Tractor Supply Co. | | | 53,940 | | | | 4,500,754 | |
| |
Ulta Beauty, Inc.1 | | | 19,490 | | | | 4,771,932 | |
| | | | | | | | |
| | | | | | | 32,262,718 | |
|
| |
Textiles, Apparel & Luxury Goods—1.9% | | | | | |
| |
Canada Goose Holdings, Inc.1 | | | 57,570 | | | | 2,516,960 | |
| |
lululemon athletica, Inc.1 | | | 74,670 | | | | 9,080,619 | |
| | | | | | | | |
| | | | | | | 11,597,579 | |
|
| |
Consumer Staples—5.1% | | | | | | | | |
| |
Beverages—0.6% | | | | | | | | |
| |
Keurig Dr Pepper, Inc. | | | 149,320 | | | | 3,828,565 | |
|
| |
Food Products—3.4% | | | | | | | | |
| |
Lamb Weston Holdings, Inc. | | | 176,860 | | | | 13,009,821 | |
| |
McCormick & Co., Inc. | | | 55,650 | | | | 7,748,706 | |
| | | | | | | | |
| | | | | | | 20,758,527 | |
|
| |
Household Products—1.1% | | | | | | | | |
| |
Church & Dwight Co., Inc. | | | 102,250 | | | | 6,723,960 | |
|
| |
Energy—1.2% | | | | | | | | |
| |
Oil, Gas & Consumable Fuels—1.2% | | | | | |
| |
Continental Resources, Inc.1 | | | 81,580 | | | | 3,278,700 | |
| |
Diamondback Energy, Inc. | | | 45,103 | | | | 4,181,048 | |
| | | | | | | | |
| | | | | | | 7,459,748 | |
|
| |
Financials—9.0% | | | | | | | | |
| |
Capital Markets—3.3% | | | | | | | | |
| |
E*TRADE Financial Corp. | | | 54,150 | | | | 2,376,102 | |
| |
KKR & Co., Inc., Cl. A | | | 219,630 | | | | 4,311,337 | |
| |
MSCI, Inc., Cl. A | | | 71,410 | | | | 10,527,976 | |
| |
Raymond James Financial, Inc. | | | 46,850 | | | | 3,486,109 | |
| | | | | | | | |
| | | | | | | 20,701,524 | |
|
| |
Commercial Banks—0.5% | | | | | | | | |
| |
SVB Financial Group1 | | | 16,440 | | | | 3,122,285 | |
|
| |
Insurance—3.3% | | | | | | | | |
| |
Arthur J. Gallagher & Co. | | | 119,630 | | | | 8,816,731 | |
| |
Progressive Corp. (The) | | | 191,470 | | | | 11,551,385 | |
| | | | | | | | |
| | | | | | | 20,368,116 | |
|
| |
Real Estate Investment Trusts (REITs)—1.0% | | | | | |
| |
Alexandria Real Estate Equities, Inc. | | | 26,920 | | | | 3,102,261 | |
| |
SBA Communications Corp., Cl. A1 | | | 18,870 | | | | 3,054,864 | |
| | | | | | | | |
| | | | | | | 6,157,125 | |
| | | | | | | | |
| | | Shares | | | Value | |
| |
Real Estate Management & Development—0.9% | | | | | |
| |
CBRE Group, Inc., Cl. A1 | | | 142,190 | | | $ | 5,693,287 | |
|
| |
Health Care—16.9% | | | | | | | | |
| |
Biotechnology—0.8% | | | | | | | | |
| |
Neurocrine Biosciences, Inc.1 | | | 31,150 | | | | 2,224,421 | |
| |
Sarepta Therapeutics, Inc.1 | | | 22,760 | | | | 2,483,799 | |
| | | | | | | | |
| | | | | | | 4,708,220 | |
|
| |
Health Care Equipment & Supplies—8.2% | | | | | |
| |
ABIOMED, Inc.1 | | | 13,660 | | | | 4,440,047 | |
| |
Cooper Cos., Inc. (The) | | | 31,470 | | | | 8,009,115 | |
| |
DexCom, Inc.1 | | | 42,460 | | | | 5,086,708 | |
| |
Edwards Lifesciences Corp.1 | | | 38,660 | | | | 5,921,552 | |
| |
ICU Medical, Inc.1 | | | 24,520 | | | | 5,630,528 | |
| |
IDEXX Laboratories, Inc.1 | | | 38,860 | | | | 7,228,737 | |
| |
Insulet Corp.1 | | | 109,360 | | | | 8,674,435 | |
| |
STERIS plc | | | 21,820 | | | | 2,331,467 | |
| |
West Pharmaceutical Services, Inc. | | | 34,130 | | | | 3,345,764 | |
| | | | | | | | |
| | | | | | | 50,668,353 | |
|
| |
Health Care Providers & Services—3.2% | | | | | |
| |
Encompass Health Corp. | | | 56,180 | | | | 3,466,306 | |
| |
Henry Schein, Inc.1 | | | 60,190 | | | | 4,726,119 | |
| |
WellCare Health Plans, Inc.1 | | | 50,380 | | | | 11,894,214 | |
| | | | | | | | |
| | | | | | | 20,086,639 | |
|
| |
Life Sciences Tools & Services—4.7% | | | | | |
| |
Agilent Technologies, Inc. | | | 130,570 | | | | 8,808,252 | |
| |
Bio-Rad Laboratories, Inc., Cl. A1 | | | 20,570 | | | | 4,776,765 | |
| |
ICON plc1 | | | 74,660 | | | | 9,646,819 | |
| |
IQVIA Holdings, Inc.1 | | | 54,230 | | | | 6,299,899 | |
| | | | | | | | |
| | | | | | | 29,531,735 | |
|
| |
Industrials—15.9% | | | | | | | | |
| |
Aerospace & Defense—0.8% | | | | | | | | |
| |
HEICO Corp. | | | 61,580 | | | | 4,771,218 | |
|
| |
Airlines—0.8% | | | | | | | | |
| |
United Continental Holdings, Inc.1 | | | 55,880 | | | | 4,678,832 | |
|
| |
Building Products—0.5% | | | | | | | | |
| |
Lennox International, Inc. | | | 14,400 | | | | 3,151,584 | |
|
| |
Commercial Services & Supplies—4.5% | | | | | |
| |
Cintas Corp. | | | 46,930 | | | | 7,883,771 | |
| |
Copart, Inc.1 | | | 33,260 | | | | 1,589,163 | |
| |
Republic Services, Inc., Cl. A | | | 63,210 | | | | 4,556,809 | |
| |
Waste Connections, Inc. | | | 189,365 | | | | 14,060,351 | |
| | | | | | | | |
| | | | | | | 28,090,094 | |
|
| |
Industrial Conglomerates—2.1% | | | | | |
| |
Roper Technologies, Inc. | | | 50,140 | | | | 13,363,313 | |
|
| |
Machinery—1.9% | | | | | | | | |
| |
IDEX Corp. | | | 94,330 | | | | 11,910,106 | |
|
| |
Professional Services—5.3% | | | | | |
| |
CoStar Group, Inc.1 | | | 42,070 | | | | 14,191,894 | |
| |
IHS Markit Ltd.1 | | | 210,380 | | | | 10,091,929 | |
| |
TransUnion | | | 154,140 | | | | 8,755,152 | |
| | | | | | | | |
| | | | | | | 33,038,975 | |
|
| |
Information Technology—26.1% | | | | | |
| |
Communications Equipment—1.0% | | | | | |
| |
Motorola Solutions, Inc. | | | 53,450 | | | | 6,148,888 | |
|
| |
Electronic Equipment, Instruments, & Components—3.2% | |
| |
CDW Corp. | | | 149,890 | | | | 12,148,584 | |
| |
FLIR Systems, Inc. | | | 55,640 | | | | 2,422,566 | |
| |
Keysight Technologies, Inc.1 | | | 86,490 | | | | 5,369,299 | |
| | | | | | | | |
| | | | | | | 19,940,449 | |
|
| |
IT Services—9.6% | | | | | | | | |
| |
| Booz Allen Hamilton Holding Corp., Cl. A | | | 110,990 | | | | 5,002,319 | |
| |
Broadridge Financial Solutions, Inc. | | | 79,520 | | | | 7,653,800 | |
7 OPPENHEIMER DISCOVERY MID CAP GROWTH FUND/VA
STATEMENT OF INVESTMENTSContinued
| | | | | | | | |
| | | Shares | | | Value | |
IT Services (Continued) | | | | | | | | |
Euronet Worldwide, Inc.1 | | | 37,730 | | | $ | 3,862,797 | |
Fiserv, Inc.1 | | | 109,500 | | | | 8,047,155 | |
Global Payments, Inc. | | | 97,850 | | | | 10,091,271 | |
Total System Services, Inc. | | | 189,940 | | | | 15,440,223 | |
Twilio, Inc., Cl. A1 | | | 50,580 | | | | 4,516,794 | |
WEX, Inc.1 | | | 37,680 | | | | 5,277,461 | |
| | | | | | | | |
| | | | | | | | 59,891,820 | |
Semiconductors & Semiconductor Equipment—2.7% | |
Advanced Micro Devices, Inc.1 | | | 65,310 | | | | 1,205,623 | |
Monolithic Power Systems, Inc. | | | 76,630 | | | | 8,908,237 | |
Xilinx, Inc. | | | 76,480 | | | | 6,513,802 | |
| | | | | | | | |
| | | | | | | | 16,627,662 | |
Software—9.6% | | | | | | | | |
Atlassian Corp. plc, Cl. A1 | | | 75,810 | | | | 6,745,574 | |
Fair Isaac Corp.1 | | | 31,550 | | | | 5,899,850 | |
PTC, Inc.1 | | | 37,220 | | | | 3,085,538 | |
RealPage, Inc.1 | | | 64,410 | | | | 3,103,918 | |
RingCentral, Inc., Cl. A1 | | | 112,750 | | | | 9,295,110 | |
ServiceNow, Inc.1 | | | 55,224 | | | | 9,832,633 | |
Splunk, Inc.1 | | | 39,120 | | | | 4,101,732 | |
Synopsys, Inc.1 | | | 118,880 | | | | 10,014,451 | |
| | | | | | | | |
| | | Shares | | | Value | |
Software (Continued) | | | | | | | | |
Ultimate Software Group, Inc. (The)1 | | | 13,520 | | | $ | 3,310,643 | |
Zendesk, Inc.1 | | | 71,190 | | | | 4,155,360 | |
| | | | | | | | |
| | | | | | | | 59,544,809 | |
Materials—2.7% | | | | | | | | |
Chemicals—1.2% | | | | | | | | |
Ashland Global Holdings, Inc. | | | 52,080 | | | | 3,695,597 | |
Ingevity Corp.1 | | | 43,430 | | | | 3,634,657 | |
| | | | | | | | |
| | | | | | | | 7,330,254 | |
Containers & Packaging—1.5% | | | | | |
Avery Dennison Corp. | | | 44,750 | | | | 4,019,892 | |
Ball Corp. | | | 116,310 | | | | 5,347,934 | |
| | | | | | | | |
| | | | | | | 9,367,826 | |
| | | | | | | | |
Total Common Stocks (Cost $553,159,769) | | | | 589,631,569 | |
| Investment Company—4.2% | | | | | |
| Oppenheimer Institutional Government Money Market Fund, Cl. E, 2.35%2,3(Cost $25,869,936) | | | 25,869,936 | | | | 25,869,936 | |
| Total Investments, at Value (Cost $579,029,705) | | | 99.1% | | | | 615,501,505 | |
| | | | |
Net Other Assets (Liabilities) | | | 0.9 | | | | 5,825,404 | |
| | | | |
Net Assets | | | 100.0% | | | $ | 621,326,909 | |
| | | | |
Footnotes to Statement of Investments
1.Non-income producing security.
2. Rate shown is the7-day yield at period end.
3. Is or was an affiliate, as defined in the Investment Company Act of 1940, as amended, at or during the reporting period, by virtue of the Fund owning at least 5% of the voting securities of the issuer or as a result of the Fund and the issuer having the same investment adviser. Transactions during the reporting period in which the issuer was an affiliate are as follows:
| | | | | | | | | | | | | | | | |
| | | Shares
December 31, 2017 | | | Gross
Additions | | | Gross
Reductions | | | Shares
December 31, 2018 | |
| |
Investment Company | | | | | | | | | | | | | | | | |
| Oppenheimer Institutional Government Money Market Fund, Cl. E | | | 7,573,590 | | | | 344,720,474 | | | | 326,424,128 | | | | 25,869,936 | |
| | | | |
| | | Value | | | Income | | | Realized
Gain (Loss) | | | Change in Unrealized
Gain (Loss) | |
| |
Investment Company | | | | | | | | | | | | | | | | |
| Oppenheimer Institutional Government Money Market Fund, Cl. E | | $ | 25,869,936 | | | $ | 329,540 | | | $ | — | | | $ | — | |
See accompanying Notes to Financial Statements.
8 OPPENHEIMER DISCOVERY MID CAP GROWTH FUND/VA
STATEMENT OF ASSETS AND LIABILITIESDecember 31, 2018
| | | | |
Assets | | | | |
Investments, at value—see accompanying statement of investments: | | | | |
Unaffiliated companies (cost $553,159,769) | | $ | 589,631,569 | |
Affiliated companies (cost $25,869,936) | | | 25,869,936 | |
| | | | |
| | | 615,501,505 | |
| |
Cash | | | 556,156 | |
| |
Receivables and other assets: | | | | |
Shares of beneficial interest sold | | | 4,900,896 | |
Investments sold | | | 1,621,336 | |
Dividends | | | 343,713 | |
Other | | | 79,460 | |
| | | | |
Total assets | | | 623,003,066 | |
| |
Liabilities | | | | |
Payables and other liabilities: | | | | |
Investments purchased | | | 1,238,425 | |
Shares of beneficial interest redeemed | | | 315,051 | |
Trustees’ compensation | | | 66,322 | |
Shareholder communications | | | 16,389 | |
Distribution and service plan fees | | | 7,890 | |
Other | | | 32,080 | |
| | | | |
Total liabilities | | | 1,676,157 | |
| |
Net Assets | | $ | 621,326,909 | |
| | | | |
|
| |
Composition of Net Assets | | | | |
Par value of shares of beneficial interest | | $ | 9,084 | |
| |
Additionalpaid-in capital | | | 497,886,928 | |
| |
Total distributable earnings | | | 123,430,897 | |
| | | | |
Net Assets | | $ | 621,326,909 | |
| | | | |
|
| |
Net Asset Value Per Share | | | | |
Non-Service Shares: | | | | |
| Net asset value, redemption price per share and offering price per share (based on net assets of $586,272,572 and 8,539,969 shares of beneficial interest outstanding) | | | $68.65 | |
| |
| |
Service Shares: | | | | |
| |
| Net asset value, redemption price per share and offering price per share (based on net assets of $35,054,337 and 544,259 shares of beneficial interest outstanding) | | | $64.41 | |
See accompanying Notes to Financial Statements.
9 OPPENHEIMER DISCOVERY MID CAP GROWTH FUND/VA
STATEMENT OF OPERATIONSFor the Year Ended December 31, 2018
| | | | |
Investment Income | |
Dividends: | | | | |
Unaffiliated companies (net of foreign withholding taxes of $15,634) | | $ | 3,866,172 | |
Affiliated companies | | | 329,540 | |
| | | | |
Total investment income | | | 4,195,712 | |
|
| |
Expenses | | | | |
Management fees | | | 5,190,248 | |
| |
Distribution and service plan fees -Service shares | | | 102,109 | |
| |
Transfer and shareholder servicing agent fees: | | | | |
Non-Service shares | | | 829,224 | |
| |
Service shares | | | 49,012 | |
| |
Shareholder communications: | | | | |
Non-Service shares | | | 63,456 | |
Service shares | | | 3,801 | |
| |
Trustees’ compensation | | | 26,082 | |
| |
Borrowing fees | | | 23,299 | |
| |
Custodian fees and expenses | | | 5,200 | |
| |
Other | | | 68,973 | |
| | | | |
Total expenses | | | 6,361,404 | |
| |
Less reduction to custodian expenses | | | (511) | |
| |
Less waivers and reimbursements of expenses | | | (380,557) | |
| | | | |
Net expenses | | | 5,980,336 | |
|
| |
Net Investment Loss | | | (1,784,624) | |
|
| |
Realized and Unrealized Gain (Loss) | | | | |
Net realized gain on investment transactions in unaffiliated companies | | | 95,224,298 | |
| |
Net change in unrealized appreciation/(depreciation) on investment transactions in unaffiliated companies | | | (128,898,713) | |
| |
Net Decrease in Net Assets Resulting from Operations | | | $ (35,459,039) | |
| | | | |
See accompanying Notes to Financial Statements.
10 OPPENHEIMER DISCOVERY MID CAP GROWTH FUND/VA
STATEMENTS OF CHANGES IN NET ASSETS
| | | | | | | | |
| | | Year Ended
December 31, 2018 | | | Year Ended
December 31, 20171 | |
| |
Operations | | | | | | | | |
Net investment loss | | $ | (1,784,624) | | | $ | (936,874) | |
| |
Net realized gain | | | 95,224,298 | | | | 111,170,933 | |
| |
Net change in unrealized appreciation/(depreciation) | | | (128,898,713) | | | | 64,493,500 | |
| | | | |
Net increase (decrease) in net assets resulting from operations | | | (35,459,039) | | | | 174,727,559 | |
|
| |
Dividends and/or Distributions to Shareholders | | | | | | | | |
Dividends and distributions declared: | | | | | | | | |
Non-Service shares | | | (95,656,703) | | | | (66,743,996) | |
Service shares | | | (5,963,052) | | | | (3,695,269) | |
| | | | |
| | |
Total dividends and distributions declared | | | (101,619,755) | | | | (70,439,265) | |
|
| |
Beneficial Interest Transactions | | | | | | | | |
Net increase (decrease) in net assets resulting from beneficial interest transactions: | | | | | | | | |
| | |
Non-Service shares | | | 20,283,999 | | | | (8,172,895) | |
| | |
Service shares | | | 3,848,119 | | | | 2,197,994 | |
| | | | |
| | |
Total beneficial interest transactions | | | 24,132,118 | | | | (5,974,901) | |
|
| |
Net Assets | | | | | | | | |
Total increase (decrease) | | | (112,946,676) | | | | 98,313,393 | |
| |
Beginning of period | | | 734,273,585 | | | | 635,960,192 | |
| | | | |
End of period | | $ | 621,326,909 | | | $ | 734,273,585 | |
| | | | |
1. Prior period amounts have been conformed to current year presentation. See Notes to Financial Statements, Note 2 – New Accounting Pronouncements for further details.
See accompanying Notes to Financial Statements.
11 OPPENHEIMER DISCOVERY MID CAP GROWTH FUND/VA
FINANCIAL HIGHLIGHTS
| | | | | | | | | | | | | | | | | | | | |
| Non-Service Shares | | Year Ended
December 31,
2018 | | | Year Ended
December 31,
2017 | | | Year Ended
December 31,
2016 | | | Year Ended
December 31,
2015 | | | Year Ended
December 31,
2014 | |
| |
Per Share Operating Data | | | | | | | | | | | | | | | | | | | | |
Net asset value, beginning of period | | | $84.21 | | | | $72.65 | | | | $76.85 | | | | $78.82 | | | | $74.51 | |
| |
Income (loss) from investment operations: | | | | | | | | | | | | | | | | | | | | |
Net investment income (loss)1 | | | (0.19) | | | | (0.10) | | | | 0.03 | | | | (0.19) | | | | (0.29) | |
Net realized and unrealized gain (loss) | | | (3.07) | | | | 20.08 | | | | 1.69 | | | | 5.67 | | | | 4.60 | |
| | | | |
Total from investment operations | | | (3.26) | | | | 19.98 | | | | 1.72 | | | | 5.48 | | | | 4.31 | |
| |
Dividends and/or distributions to shareholders: | | | | | | | | | | | | | | | | | | | | |
Dividends from net investment income | | | 0.00 | | | | (0.03) | | | | 0.00 | | | | 0.00 | | | | 0.00 | |
Distributions from net realized gain | | | (12.30) | | | | (8.39) | | | | (5.92) | | | | (7.45) | | | | 0.00 | |
| | | | |
Total dividends and/or distributions to shareholders | | | (12.30) | | | | (8.42) | | | | (5.92) | | | | (7.45) | | | | 0.00 | |
| |
Net asset value, end of period | | | $68.65 | | | | $84.21 | | | | $72.65 | | | | $76.85 | | | | $78.82 | |
| | | | |
| | | | |
| |
Total Return, at Net Asset Value2 | | | (6.08)% | | | | 28.79% | | | | 2.34% | | | | 6.61% | | | | 5.78% | |
| | | | | | | | | | | | | | | | | | | | |
| |
Ratios/Supplemental Data | | | | | | | | | | | | | | | | | | | | |
Net assets, end of period (in thousands) | | | $586,273 | | | | $694,675 | | | | $603,708 | | | | $660,450 | | | | $682,515 | |
| |
Average net assets (in thousands) | | | $690,497 | | | | $661,192 | | | | $621,110 | | | | $695,736 | | | | $688,259 | |
| |
Ratios to average net assets:3 | | | | | | | | | | | | | | | | | | | | |
Net investment income (loss) | | | (0.23)% | | | | (0.12)% | | | | 0.04% | | | | (0.24)% | | | | (0.39)% | |
Expenses excluding specific expenses listed below | | | 0.86% | | | | 0.84% | | | | 0.84% | | | | 0.83% | | | | 0.83% | |
Interest and fees from borrowings | | | 0.00%4 | | | | 0.00%4 | | | | 0.00%4 | | | | 0.00%4 | | | | 0.00% | |
| | | | |
Total expenses5 | | | 0.86% | | | | 0.84% | | | | 0.84% | | | | 0.83% | | | | 0.83% | |
| Expenses after payments, waivers and/or reimbursements and reduction to custodian expenses | | | 0.80% | | | | 0.80% | | | | 0.80% | | | | 0.80% | | | | 0.80% | |
| |
Portfolio turnover rate | | | 104% | | | | 105% | | | | 141% | | | | 81% | | | | 113% | |
1. Per share amounts calculated based on the average shares outstanding during the period.
2. Assumes an initial investment on the business day before the first day of the fiscal period, with all dividends and distributions reinvested in additional shares on the reinvestment date, and redemption at the net asset value calculated on the last business day of the fiscal period. Total returns are not annualized for periods less than one full year. Total return information does not reflect expenses that apply at the separate account level or to related insurance products. Inclusion of these charges would reduce the total return figures for all periods shown. Returns do not reflect the deduction of taxes that a shareholder would pay on fund distributions or the redemption of fund shares.
3. Annualized for periods less than one full year.
4. Less than 0.005%.
5. Total expenses including indirect expenses from affiliated fund fees and expenses were as follows:
| | | | | | |
| | Year Ended December 31, 2018 | | | 0.86 | % |
| | Year Ended December 31, 2017 | | | 0.84 | % |
| | Year Ended December 31, 2016 | | | 0.84 | % |
| | Year Ended December 31, 2015 | | | 0.83 | % |
| | Year Ended December 31, 2014 | | | 0.83 | % |
See accompanying Notes to Financial Statements.
12 OPPENHEIMER DISCOVERY MID CAP GROWTH FUND/VA
| | | | | | | | | | | | | | | | | | | | |
| Service Shares | | Year Ended
December 31,
2018 | | | Year Ended
December 31,
2017 | | | Year Ended
December 31,
2016 | | | Year Ended
December 31,
2015 | | | Year Ended
December 31,
2014 | |
| |
Per Share Operating Data | | | | | | | | | | | | | | | | | | | | |
Net asset value, beginning of period | | | $79.87 | | | | $69.43 | | | | $73.88 | | | | $76.21 | | | | $72.22 | |
| |
Income (loss) from investment operations: | | | | | | | | | | | | | | | | | | | | |
Net investment loss1 | | | (0.37) | | | | (0.28) | | | | (0.15) | | | | (0.38) | | | | (0.46) | |
Net realized and unrealized gain (loss) | | | (2.79) | | | | 19.11 | | | | 1.62 | | | | 5.50 | | | | 4.45 | |
| | | | |
Total from investment operations | | | (3.16) | | | | 18.83 | | | | 1.47 | | | | 5.12 | | | | 3.99 | |
| |
Dividends and/or distributions to shareholders: | | | | | | | | | | | | | | | | | | | | |
Dividends from net investment income | | | 0.00 | | | | 0.00 | | | | 0.00 | | | | 0.00 | | | | 0.00 | |
Distributions from net realized gain | | | (12.30) | | | | (8.39) | | | | (5.92) | | | | (7.45) | | | | 0.00 | |
| | | | |
Total dividends and/or distributions to shareholders | | | (12.30) | | | | (8.39) | | | | (5.92) | | | | (7.45) | | | | 0.00 | |
| |
Net asset value, end of period | | | $64.41 | | | | $79.87 | | | | $69.43 | | | | $73.88 | | | | $76.21 | |
| | | | |
|
| |
Total Return, at Net Asset Value2 | | | (6.31)% | | | | 28.46% | | | | 2.08% | | | | 6.35% | | | | 5.53% | |
| | | | | | | | | | | | | | | | | | | | |
| |
Ratios/Supplemental Data | | | | | | | | | | | | | | | | | | | | |
Net assets, end of period (in thousands) | | | $35,054 | | | | $39,599 | | | | $32,252 | | | | $37,029 | | | | $30,964 | |
| |
Average net assets (in thousands) | | | $40,815 | | | | $35,753 | | | | $33,797 | | | | $32,812 | | | | $32,927 | |
| |
Ratios to average net assets:3 | | | | | | | | | | | | | | | | | | | | |
Net investment loss | | | (0.48)% | | | | (0.37)% | | | | (0.21)% | | | | (0.49)% | | | | (0.64)% | |
Expenses excluding specific expenses listed below | | | 1.11% | | | | 1.09% | | | | 1.09% | | | | 1.08% | | | | 1.08% | |
Interest and fees from borrowings | | | 0.00%4 | | | | 0.00%4 | | | | 0.00%4 | | | | 0.00%4 | | | | 0.00% | |
| | | | |
Total expenses5 | | | 1.11% | | | | 1.09% | | | | 1.09% | | | | 1.08% | | | | 1.08% | |
| Expenses after payments, waivers and/or reimbursements and reduction to custodian expenses | | | 1.05% | | | | 1.05% | | | | 1.05% | | | | 1.05% | | | | 1.05% | |
| |
Portfolio turnover rate | | | 104% | | | | 105% | | | | 141% | | | | 81% | | | | 113% | |
1. Per share amounts calculated based on the average shares outstanding during the period.
2. Assumes an initial investment on the business day before the first day of the fiscal period, with all dividends and distributions reinvested in additional shares on the reinvestment date, and redemption at the net asset value calculated on the last business day of the fiscal period. Total returns are not annualized for periods less than one full year. Total return information does not reflect expenses that apply at the separate account level or to related insurance products. Inclusion of these charges would reduce the total return figures for all periods shown. Returns do not reflect the deduction of taxes that a shareholder would pay on fund distributions or the redemption of fund shares.
3. Annualized for periods less than one full year.
4. Less than 0.005%.
5. Total expenses including indirect expenses from affiliated fund fees and expenses were as follows:
| | | | | | |
| | Year Ended December 31, 2018 | | | 1.11 | % |
| | Year Ended December 31, 2017 | | | 1.09 | % |
| | Year Ended December 31, 2016 | | | 1.09 | % |
| | Year Ended December 31, 2015 | | | 1.08 | % |
| | Year Ended December 31, 2014 | | | 1.08 | % |
See accompanying Notes to Financial Statements.
13 OPPENHEIMER DISCOVERY MID CAP GROWTH FUND/VA
NOTES TO FINANCIAL STATEMENTSDecember 31, 2018
1. Organization
Oppenheimer Discovery Mid Cap Growth Fund/VA (the “Fund”), a separate series of Oppenheimer Variable Account Funds, is a diversifiedopen-end management investment company registered under the Investment Company Act of 1940 (“1940 Act”), as amended. The Fund’s investment objective is to seek capital appreciation. The Fund’s investment adviser is OFI Global Asset Management, Inc. (“OFI Global” or the “Manager”), a wholly-owned subsidiary of OppenheimerFunds, Inc. (“OFI” or the“Sub-Adviser”). The Manager has entered into asub-advisory agreement with OFI. Shares of the Fund are sold only to separate accounts of life insurance companies.
The Fund offers two classes of shares. Both classes are sold at their offering price, which is the net asset value per share, to separate investment accounts of participating insurance companies as an underlying investment for variable life insurance policies, variable annuity contracts or other investment products. The class of shares designated as Service shares is subject to a distribution and service plan. Both classes of shares have identical rights and voting privileges with respect to the Fund in general and exclusive voting rights on matters that affect that class alone. Earnings, net assets and net asset value per share may differ due to each class having its own expenses, such as transfer and shareholder servicing agent fees and shareholder communications, directly attributable to that class.
The following is a summary of significant accounting policies followed in the Fund’s preparation of financial statements in accordance with accounting principles generally accepted in the United States (“U.S. GAAP”).
2. Significant Accounting Policies
Security Valuation.All investments in securities are recorded at their estimated fair value, as described in Note 3.
Allocation of Income, Expenses, Gains and Losses.Income, expenses (other than those attributable to a specific class), gains and losses are allocated on a daily basis to each class of shares based upon the relative proportion of net assets represented by such class. Operating expenses directly attributable to a specific class are charged against the operations of that class.
Dividends and Distributions to Shareholders. Dividends and distributions to shareholders, which are determined in accordance with income tax regulations and may differ from U.S. GAAP, are recorded on theex-dividend date. Income and capital gain distributions, if any, are declared and paid annually or at other times as determined necessary by the Manager.
Investment Income.Dividend income is recorded on theex-dividend date or uponex-dividend notification in the case of certain foreign dividends where theex-dividend date may have passed.Non-cash dividends included in dividend income, if any, are recorded at the fair value of the securities received. Withholding taxes on foreign dividends, if any, and capital gains taxes on foreign investments, if any, have been provided for in accordance with the Fund’s understanding of the applicable tax rules and regulations. Interest income, if any, is recognized on an accrual basis. Discount and premium, which are included in interest income on the Statement of Operations, are amortized or accreted daily.
Return of Capital Estimates.Distributions received from the Fund’s investments in Real Estate Investments Trusts (REITs), generally are comprised of income and return of capital. Any return of capital estimates in excess of cost basis are classified as realized gain. The Fund records investment income and return of capital based on estimates. Such estimates are based on historical information available from each REIT and other industry sources. These estimates may subsequently be revised based on information received from REITs after their tax reporting periods are concluded.
Custodian Fees. “Custodian fees and expenses” in the Statement of Operations may include interest expense incurred by the Fund on any cash overdrafts of its custodian account during the period. Such cash overdrafts may result from the effects of failed trades in portfolio securities and from cash outflows resulting from unanticipated shareholder redemption activity. The Fund pays interest to its custodian on such cash overdrafts, to the extent they are not offset by positive cash balances maintained by the Fund, at a rate equal to the Federal Funds Rate plus 2.00%. The “Reduction to custodian expenses” line item, if applicable, represents earnings on cash balances maintained by the Fund during the period. Such interest expense and other custodian fees may be paid with these earnings.
Security Transactions. Security transactions are recorded on the trade date. Realized gains and losses on securities sold are determined on the basis of identified cost.
Indemnifications.The Fund’s organizational documents provide current and former Trustees and officers with a limited indemnification against liabilities arising in connection with the performance of their duties to the Fund. In the normal course of business, the Fund may also enter into contracts that provide general indemnifications. The Fund’s maximum exposure under these arrangements is unknown as this would be dependent on future claims that may be made against the Fund. The risk of material loss from such claims is considered remote.
Federal Taxes.The Fund intends to comply with provisions of the Internal Revenue Code applicable to regulated investment companies and to distribute substantially all of its investment company taxable income, including any net realized gain on investments not offset by capital loss carryforwards, if any, to shareholders. Therefore, no federal income or excise tax provision is required. The Fund files income tax returns in U.S. federal and applicable state jurisdictions. The statute of limitations on the Fund’s tax return filings generally remains open for the three preceding fiscal reporting period ends. The Fund has analyzed its tax positions for the fiscal year ended December 31, 2018, including open tax years, and does not believe there are any uncertain tax positions requiring recognition in the Fund’s financial statements.
14 OPPENHEIMER DISCOVERY MID CAP GROWTH FUND/VA
2. Significant Accounting Policies (Continued)
The tax components of capital shown in the following table represent distribution requirements the Fund must satisfy under the income tax regulations, losses the Fund may be able to offset against income and gains realized in future years and unrealized appreciation or depreciation of securities and other investments for federal income tax purposes.
| | | | | | | | | | | | |
Undistributed
Net Investment
Income | | Undistributed
Long-Term
Gain | | | Accumulated
Loss
Carryforward1,2
| | | Net Unrealized
Appreciation
Based on cost of
Securities and
Other Investments
for Federal Income
Tax Purposes | |
| |
$— | | | $89,184,532 | | | | $— | | | | $34,312,678 | |
1. During the reporting period, the Fund did not utilize any capital loss carryforward.
2.During the previous reporting period, the Fund did not utilize any capital loss carryforward.
Net investment income (loss) and net realized gain (loss) may differ for financial statement and tax purposes. The character of dividends and distributions made during the fiscal year from net investment income or net realized gains are determined in accordance with federal income tax requirements, which may differ from the character of net investment income or net realized gains presented in those financial statements in accordance with U.S. GAAP. Also, due to timing of dividends and distributions, the fiscal year in which amounts are distributed may differ from the fiscal year in which the income or net realized gain was recorded by the Fund.
Accordingly, the following amounts have been reclassified for the reporting period. Net assets of the Fund were unaffected by the reclassifications.
| | | | |
Increase
toPaid-in Capital | | Reduction
to Accumulated
Net Earnings3 | |
| |
$5,426,486 | | | $5,426,486 | |
3. $7,202,635, all of which was long-term capital gain, was distributed in connection with Fund share redemptions.
The tax character of distributions paid during the reporting periods:
| | | | | | | | |
| | | Year Ended
December 31, 2018 | | | Year Ended
December 31, 2017 | |
| |
Distributions paid from: | | | | | | | | |
Ordinary income | | $ | 23,521,359 | | | $ | 202,565 | |
Long-term capital gain | | | 78,098,396 | | | | 70,236,700 | |
| | | | |
Total | | $ | 101,619,755 | | | $ | 70,439,265 | |
| | | | |
The aggregate cost of securities and other investments and the composition of unrealized appreciation and depreciation of securities and other investments for federal income tax purposes at period end are noted in the following table. The primary difference between book and tax appreciation or depreciation of securities and other investments, if applicable, is attributable to the tax deferral of losses or tax realization of financial statement unrealized gain or loss.
| | | | |
Federal tax cost of securities | | $ | 581,188,827 | |
| | | | |
Gross unrealized appreciation | | $ | 61,686,080 | |
| |
Gross unrealized depreciation | | | (27,373,402) | |
| | | | |
Net unrealized appreciation | | $ | 34,312,678 | |
| | | | |
Use of Estimates. The preparation of financial statements in conformity with U.S. GAAP requires management to make estimates and assumptions that affect the reported amounts of assets and liabilities and disclosure of contingent assets and liabilities at the date of the financial statements and the reported amounts of increases and decreases in net assets from operations during the reporting period. Actual results could differ from those estimates.
New Accounting Pronouncements. In March 2017, Financial Accounting Standards Board (“FASB”) issued Accounting Standards Update (“ASU”), ASU2017-08. This provides guidance related to the amortization period for certain purchased callable debt securities held at a premium. The ASU is effective for annual periods beginning after December 15, 2018, and interim periods within those annual periods. The Manager has evaluated the impacts of these changes on the financial statements and there are no material impacts.
During August 2018, the Securities and Exchange Commission (the “SEC”) issued Final Rule ReleaseNo. 33-10532 (the “Rule”), Disclosure Update and Simplification. The rule amends certain financial statement disclosure requirements to conform to U.S. GAAP. The amendments to Rule6-04.17 of RegulationS-X (balance sheet) remove the requirement to separately state the book basis components of net assets: undistributed (over-distribution of) net investment income (“UNII”), accumulated undistributed net realized gains (losses), and net unrealized appreciation (depreciation) at the balance sheet date. Instead, consistent with U.S. GAAP, funds will be required to disclose total distributable earnings. The amendments to Rule6-09 of RegulationS-X (statement of changes in net assets) remove the requirement to separately state the sources of distributions paid. Instead, consistent with U.S. GAAP, funds will be required to disclose the total amount of distributions paid, except that any tax return of capital must be separately disclosed.
15 OPPENHEIMER DISCOVERY MID CAP GROWTH FUND/VA
NOTES TO FINANCIAL STATEMENTSContinued
2. Significant Accounting Policies (Continued)
The amendments also remove the requirement to parenthetically state the book basis amount of UNII on the statement of changes in net assets. The requirements of the Rule are effective November 5, 2018, and the Funds’ Statement of Assets and Liabilities and Statement of Changes in Net Assets for the current reporting period have been modified accordingly. In addition, certain amounts within each Fund’s Statement of Changes in Net Assets for the prior fiscal period have been modified to conform to the Rule.
3. Securities Valuation
The Fund calculates the net asset value of its shares as of 4:00 P.M. Eastern Time, on each day the New York Stock Exchange (the “Exchange” or “NYSE”) is open for trading, except in the case of a scheduled early closing of the Exchange, in which case the Fund will calculate net asset value of the shares as of the scheduled early closing time of the Exchange.
The Fund’s Board has adopted procedures for the valuation of the Fund’s securities and has delegated theday-to-day responsibility for valuation determinations under those procedures to the Manager. The Manager has established a Valuation Committee which is responsible for determining a fair valuation for any security for which market quotations are not readily available. The Valuation Committee’s fair valuation determinations are subject to review, approval and ratification by the Fund’s Board at least quarterly or more frequently, if necessary.
Valuation Methods and Inputs
Securities are valued primarily using unadjusted quoted market prices, when available, as supplied by third party pricing services or broker-dealers.
The following methodologies are used to determine the market value or the fair value of the types of securities described below:
Equity securities traded on a securities exchange (including exchange-traded derivatives other than futures and futures options) are valued based on the official closing price on the principal exchange on which the security is traded, as identified by the Manager, prior to the time when the Fund’s assets are valued. If the official closing price is unavailable, the security is valued at the last sale price on the principal exchange on which it is traded, or if no sales occurred, the security is valued at the mean between the quoted bid and asked prices.Over-the-counter equity securities are valued at the last published sale price, or if no sales occurred, at the mean between the quoted bid and asked prices. Events occurring after the close of trading on foreign exchanges may result in adjustments to the valuation of foreign securities to more accurately reflect their fair value as of the time when the Fund’s assets are valued.
Shares of a registered investment company that are not traded on an exchange are valued at that investment company’s net asset value per share.
Securities for which market quotations are not readily available, or when a significant event has occurred that would materially affect the value of the security, are fair valued either (i) by a standardized fair valuation methodology applicable to the security type or the significant event as previously approved by the Valuation Committee and the Fund’s Board or (ii) as determined in good faith by the Manager’s Valuation Committee. The Valuation Committee considers all relevant facts that are reasonably available, through either public information or information available to the Manager, when determining the fair value of a security. Those standardized fair valuation methodologies include, but are not limited to, valuing securities at the last sale price or initially at cost and subsequently adjusting the value based on: changes in company specific fundamentals, changes in an appropriate securities index, or changes in the value of similar securities which may be further adjusted for any discounts related to security-specific resale restrictions. When possible, such methodologies use observable market inputs such as unadjusted quoted prices of similar securities, observable interest rates, currency rates and yield curves. The methodologies used for valuing securities are not necessarily an indication of the risks associated with investing in those securities nor can it be assured that the Fund can obtain the fair value assigned to a security if it were to sell the security.
Classifications
Each investment asset or liability of the Fund is assigned a level at measurement date based on the significance and source of the inputs to its valuation. Various data inputs may be used in determining the value of each of the Fund’s investments as of the reporting period end. These data inputs are categorized in the following hierarchy under applicable financial accounting standards:
1) Level1-unadjusted quoted prices in active markets for identical assets or liabilities (including securities actively traded on a securities exchange)
2) Level2-inputs other than unadjusted quoted prices that are observable for the asset or liability (such as unadjusted quoted prices for similar assets and market corroborated inputs such as interest rates, prepayment speeds, credit risks, etc.)
3) Level3-significant unobservable inputs (including the Manager’s own judgments about assumptions that market participants would use in pricing the asset or liability).
The inputs used for valuing securities are not necessarily an indication of the risks associated with investing in those securities.
The Fund classifies each of its investments in investment companies which are publicly offered as Level 1. Investment companies that are not publicly offered, if any, are classified as Level 2 in the fair value hierarchy.
The table below categorizes amounts that are included in the Fund’s Statement of Assets and Liabilities at period end based on valuation input level:
16 OPPENHEIMER DISCOVERY MID CAP GROWTH FUND/VA
3. Securities Valuation (Continued)
| | | | | | | | | | | | | | | | |
| | | Level 1— Unadjusted Quoted Prices | | | Level 2—
Other Significant
Observable Inputs | | | Level 3—
Significant
Unobservable
Inputs | | | Value | |
| |
Assets Table | | | | | | | | | | | | | | | | |
Investments, at Value: | | | | | | | | | | | | | | | | |
Common Stocks | | | | | | | | | | | | | | | | |
Consumer Discretionary | | $ | 111,967,655 | | | $ | — | | | $ | — | | | $ | 111,967,655 | |
Consumer Staples | | | 31,311,052 | | | | — | | | | — | | | | 31,311,052 | |
Energy | | | 7,459,748 | | | | — | | | | — | | | | 7,459,748 | |
Financials | | | 56,042,337 | | | | — | | | | — | | | | 56,042,337 | |
Health Care | | | 104,994,947 | | | | — | | | | — | | | | 104,994,947 | |
Industrials | | | 99,004,122 | | | | — | | | | — | | | | 99,004,122 | |
Information Technology | | | 162,153,628 | | | | — | | | | — | | | | 162,153,628 | |
Materials | | | 16,698,080 | | | | — | | | | — | | | | 16,698,080 | |
Investment Company | | | 25,869,936 | | | | — | | | | — | | | | 25,869,936 | |
| | | | |
Total Assets | | $ | 615,501,505 | | | $ | — | | | $ | — | | | $ | 615,501,505 | |
| | | | |
Forward currency exchange contracts and futures contracts, if any, are reported at their unrealized appreciation/depreciation at measurement date, which represents the change in the contract’s value from trade date. All additional assets and liabilities included in the above table are reported at their market value at measurement date.
For the reporting period, there were no transfers between levels.
4. Investments and Risks
Investments in Affiliated Funds. The Fund is permitted to invest in other mutual funds advised by the Manager (“Affiliated Funds”). Affiliated Funds are management investment companies registered under the 1940 Act, as amended. The Manager is the investment adviser of, and theSub-Adviser provides investment and related advisory services to, the Affiliated Funds. When applicable, the Fund’s investments in Affiliated Funds are included in the Statement of Investments. Shares of Affiliated Funds are valued at their net asset value per share. As a shareholder, the Fund is subject to its proportional share of the Affiliated Funds’ expenses, including their management fee. The Manager will waive fees and/or reimburse Fund expenses in an amount equal to the indirect management fees incurred through the Fund’s investment in the Affiliated Funds.
Each of the Affiliated Funds in which the Fund invests has its own investment risks, and those risks can affect the value of the Fund’s investments and therefore the value of the Fund’s shares. To the extent that the Fund invests more of its assets in one Affiliated Fund than in another, the Fund will have greater exposure to the risks of that Affiliated Fund.
Investments in Money Market Instruments.The Fund is permitted to invest its free cash balances in money market instruments to provide liquidity or for defensive purposes. The Fund may invest in money market instruments by investing in Class E shares of Oppenheimer Institutional Government Money Market Fund (“IGMMF”), which is an Affiliated Fund. IGMMF is regulated as a money market fund under the 1940 Act, as amended. The Fund may also invest in money market instruments directly or in other affiliated or unaffiliated money market funds.
Equity Security Risk.Stocks and other equity securities fluctuate in price. The value of the Fund’s portfolio may be affected by changes in the equity markets generally. Equity markets may experience significant short-term volatility and may fall sharply at times. Different markets may behave differently from each other and U.S. equity markets may move in the opposite direction from one or more foreign stock markets. Adverse events in any part of the equity or fixed-income markets may have unexpected negative effects on other market segments.
The prices of individual equity securities generally do not all move in the same direction at the same time and a variety of factors can affect the price of a particular company’s securities. These factors may include, but are not limited to, poor earnings reports, a loss of customers, litigation against the company, general unfavorable performance of the company’s sector or industry, or changes in government regulations affecting the company or its industry.
Shareholder Concentration.At period end, one shareholder owned 20% or more of the Fund’s total outstanding shares.
The shareholder is a related party of the Fund. Related parties may include, but are not limited to, the investment manager and its affiliates, affiliated broker dealers, fund of funds, and directors or employees. The related party owned 67% of the Fund’s total outstanding shares at period end.
5. Market Risk Factors
The Fund’s investments in securities and/or financial derivatives may expose the Fund to various market risk factors:
Commodity Risk. Commodity risk relates to the change in value of commodities or commodity indexes as they relate to increases or decreases in the commodities market. Commodities are physical assets that have tangible properties. Examples of these types of assets are crude oil, heating oil, metals, livestock, and agricultural products.
Credit Risk.Credit risk relates to the ability of the issuer of debt to meet interest and principal payments, or both, as they come due. In general, lower-grade, higher-yield debt securities are subject to credit risk to a greater extent than lower-yield, higher-quality securities.
17 OPPENHEIMER DISCOVERY MID CAP GROWTH FUND/VA
NOTES TO FINANCIAL STATEMENTSContinued
5. Market Risk Factors (Continued)
Equity Risk. Equity risk relates to the change in value of equity securities as they relate to increases or decreases in the general market.
Foreign Exchange Rate Risk. Foreign exchange rate risk relates to the change in the U.S. dollar value of a security held that is denominated in a foreign currency. The U.S. dollar value of a foreign currency denominated security will decrease as the dollar appreciates against the currency, while the U.S. dollar value will increase as the dollar depreciates against the currency.
Interest Rate Risk.Interest rate risk refers to the fluctuations in value of fixed-income securities resulting from the inverse relationship between price and yield. For example, an increase in general interest rates will tend to reduce the market value of already issued fixed-income investments, and a decline in general interest rates will tend to increase their value. In addition, debt securities with longer maturities, which tend to have higher yields, are subject to potentially greater fluctuations in value from changes in interest rates than obligations with shorter maturities.
Volatility Risk.Volatility risk refers to the magnitude of the movement, but not the direction of the movement, in a financial instrument’s price over a defined time period. Large increases or decreases in a financial instrument’s price over a relative time period typically indicate greater volatility risk, while small increases or decreases in its price typically indicate lower volatility risk.
6. Shares of Beneficial Interest
The Fund has authorized an unlimited number of $0.001 par value shares of beneficial interest of each class. Transactions in shares of beneficial interest were as follows:
| | | | | | | | | | | | | | | | |
| | | Year Ended December 31, 2018 | | | Year Ended December 31, 2017 | |
| | | Shares | | | | Amount | | | | Shares | | | | Amount | |
| |
Non-Service Shares | | | | | | | | | | | | | | | | |
Sold | | | 349,932 | | | $ | 26,834,584 | | | | 235,884 | | | $ | 18,341,538 | |
Dividends and/or distributions reinvested | | | 1,182,843 | | | | 95,656,703 | | | | 881,558 | | | | 66,743,996 | |
Redeemed | | | (1,242,422) | | | | (102,207,288) | | | | (1,177,553) | | | | (93,258,429) | |
| | | | |
Net increase (decrease) | | | 290,353 | | | $ | 20,283,999 | | | | (60,111) | | | $ | (8,172,895) | |
| | | | |
|
| |
Service Shares | | | | | | | | | | | | | | | | |
Sold | | | 110,486 | | | $ | 8,346,786 | | | | 69,577 | | | $ | 5,232,152 | |
Dividends and/or distributions reinvested | | | 78,492 | | | | 5,963,052 | | | | 51,387 | | | | 3,695,269 | |
Redeemed | | | (140,477) | | | | (10,461,719) | | | | (89,745) | | | | (6,729,427) | |
| | | | |
Net increase | | | 48,501 | | | $ | 3,848,119 | | | | 31,219 | | | $ | 2,197,994 | |
| | | | |
7. Purchases and Sales of Securities
The aggregate cost of purchases and proceeds from sales of securities, other than short-term obligations and investments in IGMMF, for the reporting period were as follows:
| | | | | | | | |
| | | Purchases | | | Sales | |
| |
Investment securities | | $ | 739,476,589 | | | | $840,524,844 | |
8. Fees and Other Transactions with Affiliates
Management Fees.Under the investment advisory agreement, the Fund pays the Manager a management fee based on the daily net assets of the Fund at an annual rate as shown in the following table:
| | |
| Fee Schedule |
|
Up to $200 million | | 0.75% |
Next $200 million | | 0.72 |
Next $200 million | | 0.69 |
Next $200 million | | 0.66 |
Next $700 million | | 0.60 |
Over $1.5 billion | | 0.58 |
The Fund’s effective management fee for the reporting period was 0.71% of average annual net assets before any applicable waivers.
Sub-Adviser Fees.The Manager has retained theSub-Adviser to provide theday-to-day portfolio management of the Fund. Under theSub-Advisory Agreement, the Manager pays theSub-Adviser an annual fee in monthly installments, equal to a percentage of the investment management fee collected by the Manager from the Fund, which shall be calculated after any investment management fee waivers. The fee paid to theSub-Adviser is paid by the Manager, not by the Fund.
Transfer Agent Fees.OFI Global (the “Transfer Agent”) serves as the transfer and shareholder servicing agent for the Fund. The Fund pays the Transfer Agent a fee based on annual net assets. Fees incurred and average net assets for each class with respect to these services are detailed in the Statement of Operations and Financial Highlights, respectively.
Sub-Transfer Agent Fees.The Transfer Agent has retained Shareholder Services, Inc., a wholly-owned subsidiary of OFI (the“Sub-Transfer Agent”),
18 OPPENHEIMER DISCOVERY MID CAP GROWTH FUND/VA
8. Fees and Other Transactions with Affiliates (Continued)
to provide theday-to-day transfer agent and shareholder servicing of the Fund. Under theSub-Transfer Agency Agreement, the Transfer Agent pays theSub-Transfer Agent an annual fee in monthly installments, equal to a percentage of the transfer agent fee collected by the Transfer Agent from the Fund, which shall be calculated after any applicable fee waivers. The fee paid to theSub-Transfer Agent is paid by the Transfer Agent, not by the Fund.
Trustees’ Compensation. The Fund’s Board of Trustees (“Board”) has adopted a compensation deferral plan for Independent Trustees that enables Trustees to elect to defer receipt of all or a portion of the annual compensation they are entitled to receive from the Fund. For purposes of determining the amount owed to the Trustees under the plan, deferred amounts are treated as though equal dollar amounts had been invested in shares of the Fund or in other Oppenheimer funds selected by the Trustees. The Fund purchases shares of the funds selected for deferral by the Trustees in amounts equal to his or her deemed investment, resulting in a Fund asset equal to the deferred compensation liability. Such assets are included as a component of “Other” within the asset section of the Statement of Assets and Liabilities. Deferral of Trustees’ fees under the plan will not affect the net assets of the Fund and will not materially affect the Fund’s assets, liabilities or net investment income per share. Amounts will be deferred until distributed in accordance with the compensation deferral plan.
Distribution and Service Plan for Service Shares.The Fund has adopted a Distribution and Service Plan (the “Plan”) pursuant to Rule12b-1 under the 1940 Act for Service shares to pay OppenheimerFunds Distributor, Inc. (the “Distributor”), for distribution related services, personal service and account maintenance for the Fund’s Service shares. Under the Plan, payments are made periodically at an annual rate of 0.25% of the daily net assets of Service shares of the Fund. The Distributor currently uses all of those fees to compensate sponsors of the insurance product that offers Fund shares, for providing personal service and maintenance of accounts of their variable contract owners that hold Service shares. These fees are paid out of the Fund’s assets on anon-going basis and increase operating expenses of the Service shares, which results in lower performance compared to the Fund’s shares that are not subject to a service fee. Fees incurred by the Fund under the Plan are detailed in the Statement of Operations.
Waivers and Reimbursements of Expenses.The Manager has contractually agreed to limit the Fund’s expenses after payments, waivers and/or reimbursements and reduction to custodian expenses, excluding any applicable dividend expense, taxes, interest and fees from borrowing, any subsidiary expenses, Acquired Fund Fees and Expenses, brokerage commissions, unusual and infrequent expenses and certain other Fund expenses; so that those expenses, as percentages of daily net assets, will not exceed the annual rate of 0.80% forNon-Service shares and 1.05% for Service shares.
During the reporting period, the Manager waived fees and/or reimbursed the Fund as follows:
| | | | |
Non-Service Shares | | $ | 342,812 | |
Service Shares | | | 20,376 | |
This fee waiver and/or expense reimbursement may not be amended or withdrawn for one year from the date of the Fund’s prospectus, unless approved by the Board.
The Manager will waive fees and/or reimburse Fund expenses in an amount equal to the indirect management fees incurred through the Fund’s investment in IGMMF. During the reporting period, the Manager waived fees and/or reimbursed the Fund $17,369 for IGMMF management fees.
9. Borrowings and Other Financing
Joint Credit Facility.A number of mutual funds managed by the Manager participate in a $1.95 billion revolving credit facility (the “Facility”) intended to provide short-term financing, if necessary, subject to certain restrictions in connection with atypical redemption activity. Expenses and fees related to the Facility are paid by the participating funds and are disclosed separately or as other expenses on the Statement of Operations. The Fund did not utilize the Facility during the reporting period.
10. Pending Acquisition
On October 18, 2018, Massachusetts Mutual Life Insurance Company, an indirect corporate parent of theSub-Adviser and the Manager, announced that it has entered into an agreement whereby Invesco Ltd. (“Invesco”), a global investment management company, will acquire theSub-Adviser (the “Transaction”). In connection with the Transaction, on January 11, 2019, the Fund’s Board unanimously approved an Agreement and Plan of Reorganization (the “Agreement”), which provides for the transfer of the assets and liabilities of the Fund to a corresponding, newly formed fund (the “Acquiring Fund”) in the Invesco family of funds (the “Reorganization”) in exchange for shares of the corresponding Acquiring Fund of equal value to the value of the shares of the Fund as of the close of business on the closing date. Although the Acquiring Fund will be managed by Invesco Advisers, Inc., the Acquiring Fund will, as of the closing date, have the same investment objective and substantially similar principal investment strategies and risks as the Fund. After the Reorganization, Invesco Advisers, Inc. will be the investment adviser to the Acquiring Fund, and the Fund will be liquidated and dissolved under applicable law and terminate its registration under the Investment Company Act of 1940, as amended. The Reorganization is expected to be atax-free reorganization for U.S. federal income tax purposes.
The Reorganization is subject to the approval of shareholders of the Fund. Shareholders of record of the Fund on January 14, 2019 will be entitled to vote on the Reorganization and will receive a combined prospectus and proxy statement describing the Reorganization, the shareholder meeting, and a discussion of the factors the Fund’s Board considered in approving the Agreement. The combined prospectus and proxy statement is expected to be distributed to shareholders of record on or about February 28, 2019. The anticipated date of the shareholder meeting is on or about April 12, 2019.
19 OPPENHEIMER DISCOVERY MID CAP GROWTH FUND/VA
NOTES TO FINANCIAL STATEMENTSContinued
10. Pending Acquisition (Continued)
If shareholders approve the Agreement and certain other closing conditions are satisfied or waived, the Reorganization is expected to close during the second quarter of 2019, or as soon as practicable thereafter. This is subject to change.
20 OPPENHEIMER DISCOVERY MID CAP GROWTH FUND/VA
REPORT OF INDEPENDENT REGISTERED PUBLIC ACCOUNTING FIRM
To the Shareholders and Board of Trustees
Oppenheimer Variable Account Funds:
Opinion on the Financial Statements
We have audited the accompanying statement of assets and liabilities of Oppenheimer Discovery Mid Cap Growth Fund/VA, a separate series of Oppenheimer Variable Account Funds, (the “Fund”), including the statement of investments, as of December 31, 2018, the related statement of operations for the year then ended, the statements of changes in net assets for each of the years in the two year period then ended, and the related notes (collectively, the “financial statements”) and the financial highlights for each of the years in the five year period then ended. In our opinion, the financial statements and financial highlights present fairly, in all material respects, the financial position of the Fund as of December 31, 2018, the results of its operations for the year then ended, the changes in its net assets for each of the years in the two year period then ended, and the financial highlights for each of the years in the five year period then ended, in conformity with U.S. generally accepted accounting principles.
Basis for Opinion
These financial statements and financial highlights are the responsibility of the Fund’s management. Our responsibility is to express an opinion on these financial statements and financial highlights based on our audits. We are a public accounting firm registered with the Public Company Accounting Oversight Board (United States) (“PCAOB”) and are required to be independent with respect to the Fund in accordance with the U.S. federal securities laws and the applicable rules and regulations of the Securities and Exchange Commission and the PCAOB.
We conducted our audits in accordance with the standards of the PCAOB. Those standards require that we plan and perform the audit to obtain reasonable assurance about whether the financial statements and financial highlights are free of material misstatement, whether due to error or fraud. Our audits included performing procedures to assess the risks of material misstatement of the financial statements and financial highlights, whether due to error or fraud, and performing procedures that respond to those risks. Such procedures included examining, on a test basis, evidence regarding the amounts and disclosures in the financial statements and financial highlights. Such procedures also included confirmation of securities owned as of December 31, 2018, by correspondence with the custodian, brokers and the transfer agent, or by other appropriate auditing procedures. Our audits also included evaluating the accounting principles used and significant estimates made by management, as well as evaluating the overall presentation of the financial statements and financial highlights. We believe that our audits provide a reasonable basis for our opinion.
KPMGLLP
We have not been able to determine the specific year that we began serving as the auditor of one or more Oppenheimer Funds investment companies, however we are aware that we have served as the auditor of one or more Oppenheimer Funds investment companies since at least 1969.
Denver, Colorado
February 14, 2019
21 OPPENHEIMER DISCOVERY MID CAP GROWTH FUND/VA
FEDERAL INCOME TAX INFORMATIONUnaudited
In early 2019, if applicable, shareholders of record received information regarding all dividends and distributions paid to them by the Fund during calendar year 2018.
Capital gain distributions of $9.45019 per share were paid toNon-Service and Service shareholders, respectively, on June 19, 2018. Whether received in stock or in cash, the capital gain distribution should be treated by shareholders as a gain from the sale of the capital assets held for more than one year (long-term capital gains).
None of the dividends paid by the Fund during the reporting period are eligible for the corporate dividend-received deduction.
Dividends, if any, paid by the Fund during the reporting period which are not designated as capital gain distributions, may be eligible for lower individual income tax rates to the extent that the Fund has received qualified dividend income as stipulated by recent tax legislation. In early 2019, shareholders of record received information regarding the percentage of distributions that are eligible for lower individual income tax rates. The amount will be the maximum amount allowed.
The foregoing information is presented to assist shareholders in reporting distributions received from the Fund to the Internal Revenue Service. Because of the complexity of the federal regulations which may affect your individual tax return and the many variations in state and local tax regulations, we recommend that you consult your tax advisor for specific guidance.
22 OPPENHEIMER DISCOVERY MID CAP GROWTH FUND/VA
BOARD APPROVAL OF THE FUND’S INVESTMENT ADVISORY ANDSUB-ADVISORY AGREEMENTSUnaudited
The Fund has entered into an investment advisory agreement with OFI Global Asset Management, Inc. (“OFI Global” or the “Adviser”), a wholly-owned subsidiary of OppenheimerFunds, Inc. (“OFI” or the“Sub-Adviser”) (“OFI Global” and “OFI” together the “Managers”) and OFI Global has entered into asub-advisory agreement with OFI whereby OFI provides investmentsub-advisory services to the Fund (collectively, the “Agreements”). Each year, the Board of Trustees (the “Board”), including a majority of the independent Trustees, is required to determine whether to approve the terms of the Agreements and the renewal thereof. The Investment Company Act of 1940, as amended, requires that the Board request and evaluate, and that the Managers provide, such information as may be reasonably necessary to evaluate the terms of the Agreements. The Board employs an independent consultant to prepare a report that provides information, including comparative information that the Board requests for that purpose. In addition toin-person meetings focused on this evaluation, the Board receives information throughout the year regarding Fund services, fees, expenses and performance.
The Managers and the independent consultant provided information to the Board on the following factors: (i) the nature, quality and extent of the Managers’ services, (ii) the comparative investment performance of the Fund and the Managers, (iii) the fees and expenses of the Fund, including comparative fee and expense information, (iv) the profitability of the Managers and their affiliates, including an analysis of the cost of providing services, (v) whether economies of scale are realized as the Fund grows and whether fee levels reflect these economies of scale for Fund investors and (vi) other benefits to the Managers from their relationship with the Fund. The Board was aware that there are alternatives to retaining the Managers.
Outlined below is a summary of the principal information considered by the Board as well as the Board’s conclusions.
Nature, Quality and Extent of Services. The Board considered information about the nature, quality and extent of the services provided to the Fund and information regarding the Managers’ key personnel who provide such services. The Managers’ duties include providing the Fund with the services of theSub-Adviser’s portfolio managers and investment team, who provide research, analysis and other advisory services in regard to the Fund’s investments; and securities trading services. OFI Global is responsible for oversight of third-party service providers; monitoring compliance with applicable Fund policies and procedures and adherence to the Fund’s investment restrictions; risk management; and oversight of theSub-Adviser. OFI Global is also responsible for providing certain administrative services to the Fund. Those services include providing and supervising all administrative and clerical personnel who are necessary in order to provide effective corporate administration for the Fund; compiling and maintaining records with respect to the Fund’s operations; preparing and filing reports required by the U.S. Securities and Exchange Commission; preparing periodic reports regarding the operations of the Fund for its shareholders; preparing proxy materials for shareholder meetings; and preparing the registration statements required by federal and state securities laws for the sale of the Fund’s shares. OFI Global also provides the Fund with office space, facilities and equipment.
The Board also considered the quality of the services provided and the quality of the Managers’ resources that are available to the Fund. The Board took account of the fact that theSub-Adviser has over fifty years of experience as an investment adviser and that its assets under management rank it among the top mutual fund managers in the United States. The Board evaluated the Managers’ advisory, administrative, accounting, legal, compliance and risk management services, among other services, and information the Board has received regarding the experience and professional qualifications of the Managers’ key personnel and the size and functions of their staff. In its evaluation of the quality of the portfolio management services provided, the Board considered the experience of Ronald J. Zibelli, Jr. and Justin Livengood, the portfolio managers for the Fund, and theSub-Adviser’s investment team and analysts. The Board members also considered the totality of their experiences with the Managers as directors or trustees of the Fund and other funds advised by the Managers. The Board considered information regarding the quality of services provided by affiliates of the Managers, which the Board members have become knowledgeable about through their experiences with the Managers and in connection with the review or renewal of the Fund’s service agreements or service providers. The Board concluded, in light of the Managers’ experience, reputation, personnel, operations and resources that the Fund benefits from the services provided under the Agreements.
Investment Performance of the Managers and the Fund. Throughout the year, the Managers provided information on the investment performance of the Fund, the Adviser and theSub-Adviser, including comparative performance information. The Board also reviewed information, prepared by the Managers and by the independent consultant, comparing the Fund’s historical performance to relevant market indices and to the performance of othermid-cap growth funds underlying variable insurance products. The Board considered that the Fund outperformed its category median for theone-, three- and five-year periods, though it underperformed its category median for theten-year period.
Fees and Expenses of the Fund. The Board reviewed the fees paid to the Adviser and the other expenses borne by the Fund. The Board noted that the Adviser, not the Fund, pays theSub-Adviser’s fee under thesub-advisory agreement. The independent consultant provided comparative data in regard to the fees and expenses of the Fund and othermid-cap growth funds underlying variable insurance products. In reviewing the fees and expenses charged to the VA funds, the Board considered the Adviser’s assertion that, because there is much greater disparity in the fees and services that may be provided by a manager to a VA fund as opposed to a retail fund, when comparing the expenses of the various VA funds to those of retail funds, it is most appropriate to focus on total expenses (rather than on the management fees). The Board considered that the Fund’s contractual management fees were lower than their peer group median and category median and that total expenses were lower than their category median and equal to their peer group median. The Board noted that the Adviser has contractually agreed to waive fees and/or reimburse certain expenses so that the Fund’s total annual operating expenses, as percentages of daily net assets, will not exceed the annual rate of 0.80% forNon-Service Shares and 1.05% for Service Shares. This contractual fee waiver and/or expense reimbursement may not be amended or withdrawn for one year from the date of the Fund’s prospectus, unless approved by the Board. The Board further noted that the Adviser has agreed to waive fees and/or reimburse Fund expenses in an amount equal to the management fees incurred indirectly through the Fund’s investments in funds managed by the Adviser or its affiliates.
Economies of Scale and Profits Realized by the Managers. The Board considered information regarding the Managers’ costs in serving as the Fund’s investment adviser andsub-adviser, including the costs associated with the personnel and systems necessary to manage the Fund, and information regarding the Managers’ profitability from their relationship with the Fund. The Board also considered that the Managers must be able to pay and retain experienced professional personnel at competitive rates to provide quality services to the Fund. The Board reviewed whether the Managers may realize economies of scale in managing and supporting the Fund. The Board noted that the Fund currently has management fee
23 OPPENHEIMER DISCOVERY MID CAP GROWTH FUND/VA
BOARD APPROVAL OF THE FUND’S INVESTMENT ADVISORY ANDSUB-ADVISORY AGREEMENTSUnaudited / Continued
breakpoints, which are intended to share with Fund shareholders economies of scale that may exist as the Fund’s assets grow.
Other Benefits to the Managers. In addition to considering the profits realized by the Managers, the Board considered information that was provided regarding the direct and indirect benefits the Managers receive as a result of their relationship with the Fund, including compensation paid to the Managers’ affiliates and research provided to the Adviser in connection with permissible brokerage arrangements (soft dollar arrangements).
Conclusions. These factors were also considered by the independent Trustees meeting separately from the full Board, assisted by experienced counsel to the Fund and to the independent Trustees. Fund counsel and the independent Trustees’ counsel are independent of the Managers within the meaning and intent of the Securities and Exchange Commission Rules.
Based on its review of the information it received and its evaluations described above, the Board, including a majority of the independent Trustees, decided to continue the Agreements through August 31, 2019. In arriving at its decision, the Board did not identify any factor or factors as being more important than others, but considered all of the above information, and considered the terms and conditions of the Agreements, including the management fees, in light of all the surrounding circumstances.
24 OPPENHEIMER DISCOVERY MID CAP GROWTH FUND/VA
PORTFOLIO PROXY VOTING POLICIES AND GUIDELINES; UPDATES TO STATEMENT OF INVESTMENTSUnaudited
The Fund has adopted Portfolio Proxy Voting Policies and Guidelines under which the Fund votes proxies relating to securities (“portfolio proxies”) held by the Fund. A description of the Fund’s Portfolio Proxy Voting Policies and Guidelines is available (i) without charge, upon request, by calling the Fund toll-free at 1.800.CALL OPP (225.5677), (ii) on the Fund’s website at www.oppenheimerfunds.com, and (iii) on the SEC’s website at www.sec.gov. In addition, the Fund is required to file FormN-PX, with its complete proxy voting record for the 12 months ended June 30th, no later than August 31st of each year. The Fund’s voting record is available (i) without charge, upon request, by calling the Fund toll-free at 1.800.CALL OPP (225.5677), and (ii) in the FormN-PX filing on the SEC’s website at www.sec.gov.
The Fund files its complete schedule of portfolio holdings with the SEC for the first quarter and the third quarter of each fiscal year on FormN-Q. The Fund’s FormN-Q filings are available on the SEC’s website at www.sec.gov.
25 OPPENHEIMER DISCOVERY MID CAP GROWTH FUND/VA
TRUSTEES AND OFFICERSUnaudited
| | |
Name, Position(s) Held with the Fund, Length of
Service, Year of Birth | | Principal Occupation(s) During the Past 5 Years; Other Trusteeships/Directorships
Held; Number of Portfolios in the Fund Complex Currently Overseen |
| |
| INDEPENDENT TRUSTEES | | The address of each Trustee in the chart below is 6803 S. Tucson Way, Centennial, Colorado 80112-3924. Each Trustee serves for an indefinite term, or until his or her resignation, retirement, death or removal. Each of the Trustees in the chart below oversees 58 portfolios in the OppenheimerFunds complex. |
| |
Robert J. Malone, Chairman of the Board of Trustees (since 2016), Trustee (since 2002) Year of Birth: 1944 | | Chairman - Colorado Market of MidFirst Bank (since January 2015); Chairman of the Board (2012-2016) and Director (August 2005-January 2016) of Jones International University (educational organization); Trustee of the Gallagher Family Foundation(non-profit organization) (2000-2016); Chairman, Chief Executive Officer and Director of Steele Street Bank Trust (commercial banking) (August 2003-January 2015); Director of Opera Colorado Foundation(non-profit organization) (2008-2012); Director of Colorado UpLIFT (charitable organization) (1986-2010); Director of Jones Knowledge, Inc. (2006-2010); Former Chairman of U.S. Bank-Colorado (subsidiary of U.S. Bancorp and formerly Colorado National Bank) (July 1996-April 1999); Director of Commercial Assets, Inc. (real estate investment trust) (1993-2000); Director of U.S. Exploration, Inc. (oil and gas exploration) (1997-February 2004); Chairman of the Board (1991-1994) and Trustee (1985-1994) of Regis University; and Chairman of the Board (1990-1991) and Member (1984-1999) of Young Presidents Organization. Mr. Malone has served on the Boards of certain Oppenheimer funds since 2002, during which time he has become familiar with the Fund’s (and other Oppenheimer funds’) financial, accounting, regulatory and investment matters and has contributed to the Board’s deliberations. |
| |
Andrew J. Donohue, Trustee (since 2017) Year of Birth: 1950 | | Director, Mutual Fund Directors Forum (since February 2018); Of Counsel, Shearman & Sterling LLP (since September 2017); Chief of Staff of the U.S. Securities and Exchange Commission (regulator) (June 2015-February 2017); Managing Director and Investment Company General Counsel of Goldman Sachs (investment bank) (November2012-May 2015); Partner at Morgan Lewis & Bockius, LLP (law firm) (March 2011-October 2012); Director of the Division of Investment Management of U.S. Securities and Exchange Commission (regulator) (May 2006-November 2010); Global General Counsel of Merrill Lynch Investment Managers (investment firm) (May2003-May 2006); General Counsel (October 1991-November 2001) and Executive Vice President (January 1993-November 2001) of OppenheimerFunds, Inc. (investment firm) (June 1991-November 2001). Mr. Donohue has served on the Boards of certain Oppenheimer funds since 2017, during which time he has become familiar with the Fund’s (and other Oppenheimer funds’) financial, accounting, regulatory and investment matters and has contributed to the Board’s deliberations. |
| |
Richard F. Grabish, Trustee (since 2012) Year of Birth: 1948 | | Formerly Senior Vice President and Assistant Director of Sales and Marketing (March 1997-December 2007), Director (March 1987-December 2007) and Manager of Private Client Services (June 1985-June 2005) of A.G. Edwards & Sons, Inc. (broker/dealer and investment firm); Chairman and Chief Executive Officer of A.G. Edwards Trust Company, FSB (March 2001-December 2007); President and Vice Chairman of A.G. Edwards Trust Company, FSB (investment adviser) (April 1987-March 2001); President of A.G. Edwards Trust Company, FSB (investment adviser) (June 2005-December 2007). Mr. Grabish has served on the Boards of certain Oppenheimer funds since 2001, during which time he has become familiar with the Fund’s (and other Oppenheimer funds’) financial, accounting, regulatory and investment matters and has contributed to the Board’s deliberations. |
| |
Beverly L. Hamilton, Trustee (since 2002) Year of Birth: 1946 | | Trustee of Monterey Institute for International Studies (educational organization) (2000-2014); Board Member of Middlebury College (educational organization) (December 2005-June 2011); Director of the Board (1991-2016), Vice Chairman of the Board (2006-2009) and Chairman of the Board (2010-2013) of American Funds’ Emerging Markets Growth Fund, Inc. (mutual fund); Director of The California Endowment (philanthropic organization) (April 2002-April 2008); Director (February 2002-2005) and Chairman of Trustees (2006-2007) of the Community Hospital of Monterey Peninsula; President of ARCO Investment Management Company (February 1991-April 2000); Member of the investment committees of The Rockefeller Foundation (2001-2006) and The University of Michigan (since 2000); Advisor at Credit Suisse First Boston’s Sprout venture capital unit (venture capital fund) (1994-January 2005); Trustee of MassMutual Institutional Funds (investment company) (1996-June 2004); Trustee of MML Series Investment Fund (investment company) (April 1989-June 2004); Member of the investment committee of Hartford Hospital (2000-2003); and Advisor to Unilever (Holland) pension fund (2000-2003). Ms. Hamilton has served on the Boards of certain Oppenheimer funds since 2002, during which time she has become familiar with the Fund’s (and other Oppenheimer funds’) financial, accounting, regulatory and investment matters and has contributed to the Board’s deliberations. |
| |
Victoria J. Herget, Trustee (since 2012) Year of Birth: 1951 | | Board Chair (2008-2015) and Director (2004-Present) of United Educators (insurance company); Trustee (since 2000) and Chair (2010-2017) of Newberry Library (independent research library); Trustee, Mather LifeWays (senior living organization) (since 2001); Independent Director of the First American Funds (mutual fund family) (2003-2011); former Managing Director (1993-2001), Principal (1985-1993), Vice President (1978-1985) and Assistant Vice President (1973-1978) of Zurich Scudder Investments (investment adviser) (and its predecessor firms); Trustee (1992-2007), Chair of the Board of Trustees (1999-2007), Investment Committee Chair (1994-1999) and Investment Committee member (2007-2010) of Wellesley College; Trustee, BoardSource(non-profit organization) (2006-2009) and Chicago City Day School(K-8 School) (1994-2005). Ms. Herget has served on the Boards of certain Oppenheimer funds since 2012, during which time she has become familiar with the Fund’s (and other Oppenheimer funds’) financial, accounting, regulatory and investment matters and has contributed to the Board’s deliberations. |
| |
Karen L. Stuckey, Trustee (since 2012) Year of Birth: 1953 | | Member (since May 2015) of Desert Mountain Community Foundation Advisory Board(non-profit organization); Partner (1990-2012) of PricewaterhouseCoopers LLP (professional services firm) (held various positions 1975-1990); Trustee (1992- 2006); member of Executive, Nominating and Audit Committees and Chair of Finance Committee (1992-2006), and Emeritus Trustee (since 2006) of Lehigh University; member, Women’s Investment Management Forum (professional organization) (since inception) and Trustee of Jennies School for Little Children(non-profit) (2011-2014). Ms. Stuckey has served on the Boards of certain Oppenheimer funds since 2012, during which time she has become familiar with the Fund’s (and other Oppenheimer funds’) financial, accounting, regulatory and investment matters and has contributed to the Board’s deliberations. |
26 OPPENHEIMER DISCOVERY MID CAP GROWTH FUND/VA
| | |
James D. Vaughn, Trustee (since 2012) Year of Birth: 1945 | | Retired; former managing partner (1994-2001) of Denver office of Deloitte & Touche LLP, (held various positions in Denver and New York offices from 1969-1993); Trustee and Chairman of the Audit Committee of Schroder Funds (2003-2012); Board member and Chairman of Audit Committee of AMG National Trust Bank (since 2005); Trustee and Investment Committee member, University of South Dakota Foundation (since 1996); Board member, Audit Committee Member and past Board Chair, Junior Achievement (since 1993); former Board member, Mile High United Way, Boys and Girls Clubs, Boy Scouts, Colorado Business Committee for the Arts, Economic Club of Colorado and Metro Denver Network. Mr. Vaughn has served on the Boards of certain Oppenheimer funds since 2012, during which time he has become familiar with the Fund’s (and other Oppenheimer funds’) financial, accounting, regulatory and investment matters and has contributed to the Board’s deliberations. |
INTERESTED TRUSTEE AND OFFICER | | Mr. Steinmetz is an “Interested Trustee” because he is affiliated with the Manager and theSub-Adviser by virtue of his positions as Chairman and director of theSub-Adviser and officer and director of the Manager. Both as a Trustee and as an officer, Mr. Steinmetz serves for an indefinite term, or until his resignation, retirement, death or removal. Mr. Steinmetz’s address is 225 Liberty Street, New York, New York 10281- 1008. Mr. Steinmetz is an officer of 104 portfolios in the OppenheimerFunds complex. |
| |
Arthur P. Steinmetz, Trustee (since 2015), President and Principal Executive Officer (since 2014) Year of Birth: 1958 | | Chairman of OppenheimerFunds, Inc. (since January 2015); CEO and Chairman of OFI Global Asset Management, Inc. (since July 2014), President of OFI Global Asset Management, Inc. (since May 2013), a Director of OFI Global Asset Management, Inc. (since January 2013), Director of OppenheimerFunds, Inc. (since July 2014), President, Management Director and CEO of Oppenheimer Acquisition Corp. (OppenheimerFunds, Inc.‘s parent holding company) (since July 2014), and President and Director of OFI SteelPath, Inc. (since January 2013). Chief Investment Officer of the OppenheimerFunds advisory entities (January 2013-December 2013); Executive Vice President of OFI Global Asset Management, Inc. (January2013-May 2013); Chief Investment Officer of OppenheimerFunds, Inc. (October 2010-December 2012); Chief Investment Officer, Fixed- Income, of OppenheimerFunds, Inc. (April 2009-October 2010); Executive Vice President of OppenheimerFunds, Inc. (October 2009-December 2012); Director of Fixed Income of OppenheimerFunds, Inc. (January 2009-April 2009); and a Senior Vice President of OppenheimerFunds, Inc. (March 1993-September 2009). |
OTHER OFFICERS OF THE FUND | | The addresses of the Officers in the chart below are as follows: for Messrs. Zibelli, Jr., Livengood, Mss. Lo Bessette, Foxson and Picciotto, 225 Liberty Street, New York, New York 10281-1008, for Mr. Petersen, 6803 S. Tucson Way, Centennial, Colorado 80112-3924. Each Officer serves for an indefinite term or until his or her resignation, retirement, death or removal. |
| |
Ronald J. Zibelli, Jr., Vice President (since 2008) Year of Birth: 1959 | | Senior Vice President of theSub-Adviser (since January 2014); Senior Portfolio Manager of theSub-Adviser (since May 2006) and Vice President of theSub-Adviser (May 2006-January 2014). Prior to joining theSub-Adviser, he spent six years at Merrill Lynch Investment Managers, during which time he was a Managing Director and Small Cap Growth Team Leader, responsible for managing 11 portfolios. Prior to joining Merrill Lynch Investment Managers, Mr. Zibelli spent 12 years with Chase Manhattan Bank, including two years as Senior Portfolio Manager (U.S. Small Cap Equity) at Chase Asset Management. |
| |
Justin Livengood, Vice President (since 2014) Year of Birth: 1974 | | Vice President (since May 2006) and Senior Portfolio (since January 2014) of theSub-Adviser. Senior Research Analyst of theSub-Adviser (May 2006-January 2014), responsible for the health care, energy and financial services sectors formid- andsmall-cap growth accounts. Before joining theSub-Adviser in May 2006, Mr. Livengood was a vice president and fund analyst with Merrill Lynch Investment Managers, where he specialized in financial services, health care, energy and basic materials for the Merrill Lynch Small Cap Growth Fund. During his tenure at Merrill Lynch he also worked as an investment banking analyst in the Global Media Group and as an associate with Merrill Lynch Ventures. |
| |
Cynthia Lo Bessette, Secretary and Chief Legal Officer (since 2016) Year of Birth: 1969 | | Executive Vice President, General Counsel and Secretary of OFI Global Asset Management, Inc. (since February 2016); Senior Vice President and Deputy General Counsel of OFI Global Asset Management, Inc. (March 2015-February 2016); Chief Legal Officer of OppenheimerFunds, Inc. and OppenheimerFunds Distributor, Inc. (since February 2016); Vice President, General Counsel and Secretary of Oppenheimer Acquisition Corp. (since February 2016); General Counsel of OFI SteelPath, Inc., OFI Advisors, LLC and Index Management Solutions, LLC (since February 2016); Chief Legal Officer of OFI Global Institutional, Inc., HarbourView Asset Management Corporation, OFI Global Trust Company, Oppenheimer Real Asset Management, Inc., OFI Private Investments Inc., Shareholder Services, Inc. and Trinity Investment Management Corporation (since February 2016); Corporate Counsel (February 2012-March 2015) and Deputy Chief Legal Officer (April 2013-March 2015) of Jennison Associates LLC; Assistant General Counsel (April 2008-September 2009) and Deputy General Counsel (October 2009-February 2012) of Lord Abbett & Co. LLC. |
| |
Jennifer Foxson, Vice President and Chief Business Officer (since 2014) Year of Birth: 1969 | | Senior Vice President of OppenheimerFunds Distributor, Inc. (since June 2014); Vice President of OppenheimerFunds Distributor, Inc. (April 2006-June 2014); Vice President of OppenheimerFunds, Inc. (January 1998-March 2006); Assistant Vice President of OppenheimerFunds, Inc. (October 1991-December 1998). |
| |
Mary Ann Picciotto, Chief Compliance Officer and Chief Anti-Money Laundering Officer (since 2014) Year of Birth: 1973 | | Senior Vice President and Chief Compliance Officer of OFI Global Asset Management, Inc. (since March 2014); Chief Compliance Officer of OppenheimerFunds, Inc., OFI SteelPath, Inc., OFI Global Institutional, Inc., Oppenheimer Real Asset Management, Inc., OFI Private Investments Inc., Harborview Asset Management Corporation, Trinity Investment Management Corporation, and Shareholder Services, Inc. (since March 2014); Managing Director of Morgan Stanley Investment Management Inc. and certain of its various affiliated entities; Chief Compliance Officer of various Morgan Stanley Funds (May 2010-January 2014); Chief Compliance Officer of Morgan Stanley Investment Management Inc. (April 2007-January 2014). |
| |
Brian S. Petersen, Treasurer and Principal Financial & Accounting Officer (since 2016) Year of Birth: 1970 | | Senior Vice President of OFI Global Asset Management, Inc. (since January 2017); Vice President of OFI Global Asset Management, Inc. (January 2013-January 2017); Vice President of OppenheimerFunds, Inc. (February 2007-December 2012); Assistant Vice President of OppenheimerFunds, Inc. (August 2002-2007). |
The Fund’s Statement of Additional Information contains additional information about the Fund’s Trustees and Officers and is available without charge, upon request, by calling 1.800.988.8287.
27 OPPENHEIMER DISCOVERY MID CAP GROWTH FUND/VA
OPPENHEIMER DISCOVERY MID CAP GROWTH FUND/VA
A Series of Oppenheimer Variable Account Funds
| | |
Manager | | OFI Global Asset Management, Inc. |
| |
Sub-Adviser | | OppenheimerFunds, Inc. |
| |
Distributor | | OppenheimerFunds Distributor, Inc. |
| |
Transfer and | | OFI Global Asset Management, Inc. |
Shareholder | | |
Servicing Agent | | |
| |
Sub-Transfer Agent | | Shareholder Services, Inc. |
| | DBA OppenheimerFunds Services |
| |
Independent | | KPMG LLP |
Registered | | |
Public | | |
Accounting | | |
Firm | | |
| |
Legal Counsel | | Ropes & Gray LLP |
| |
| | Before investing in any of the Oppenheimer funds, investors should carefully consider a fund’s investment objectives, risks, charges and expenses. Fund prospectuses and summary prospectuses contain this and other information about the funds and may be obtained by asking your financial advisor, visiting oppenheimerfunds.com or calling us at 1.800.988.8287. Read prospectuses and summary prospectuses carefully before investing. |
| |
| | © 2019 OppenheimerFunds, Inc. All rights reserved. Oppenheimer funds are distributed by OppenheimerFunds Distributor, Inc. |

ANNUAL REPORT
Listing of Top Holdings
Fund Performance Discussion
Financial Statements
PORTFOLIO MANAGERS:Krishna Memani and Magnus Krantz
AVERAGE ANNUAL TOTAL RETURNS FOR THE PERIODS ENDED 12/31/18
| | | | | | | | | | | | | | | | |
| | | Inception | | | | | | | | | | |
| | | Date | | | 1-Year | | | 5-Year | | | 10-Year | |
Non-Service Shares | | | 2/9/87 | | | | -5.32% | | | | 3.50% | | | | 7.67% | |
Service Shares | | | 5/1/02 | | | | -5.53 | | | | 3.25 | | | | 7.40 | |
Russell 3000 Index | | | | | | | -5.24 | | | | 7.91 | | | | 13.18 | |
Bloomberg Barclays U.S. Aggregate Bond Index | | | | | | | 0.01 | | | | 2.52 | | | | 3.48 | |
Reference Index | | | | | | | -1.51 | | | | 4.63 | | | | 7.19 | |
Performance data quoted represents past performance, which does not guarantee future results. The investment return and principal value of an investment in the Fund will fluctuate so that an investor’s shares, when redeemed, may be worth more or less than their original cost. Current performance may be lower or higher than the performance quoted. For performance data current to the most recent month end, call us at 1.800.988.8287. The Fund’s total returns should not be expected to be the same as the returns of other funds, whether or not both funds have the same portfolio managers and/or similar names. The Fund’s total returns include changes in share price and reinvested distributions but do not include the charges associated with the separate account products that offer this Fund. Such performance would have been lower if such charges were taken into account. Returns for periods of less than one year are cumulative and not annualized. See Fund prospectuses and summary prospectuses for more information on share classes and sales charges.
TOP HOLDINGS AND ALLOCATIONS
TOP TEN COMMON STOCK HOLDINGS
| | | | |
Microsoft Corp. | | | 1.3% | |
Apple, Inc. | | | 1.2 | |
JPMorgan Chase & Co. | | | 1.1 | |
Amazon.com, Inc. | | | 0.9 | |
Lowe’s Cos., Inc. | | | 0.8 | |
Johnson & Johnson | | | 0.7 | |
Verizon Communications, Inc. | | | 0.7 | |
Mastercard, Inc., Cl. A | | | 0.7 | |
Facebook, Inc., Cl. A | | | 0.6 | |
Merck & Co., Inc. | | | 0.6 | |
Portfolio holdings and allocations are subject to change. Percentages are as of December 31, 2018, and are based on net assets.
PORTFOLIO ALLOCATION
| | | | |
Non-Convertible Corporate Bonds and Notes | | | 30.0 | % |
Mortgage-Backed Obligations | | | | |
Government Agency | | | 18.9 | |
Non-Agency | | | 9.5 | |
Common Stocks | | | 27.5 | |
Asset-Backed Securities | | | 11.4 | |
Investment Company | | | | |
Oppenheimer Institutional Government Money Market Fund | | | 2.5 | |
U.S. Government Obligations | | | 0.2 | |
Portfolio holdings and allocations are subject to change. Percentages are as of December 31, 2018, and are based on the total market value of investments.
For more current Fund holdings, please visit oppenheimerfunds.com.
2 OPPENHEIMER CONSERVATIVE BALANCED FUND/VA
Fund Performance Discussion
The Fund’sNon-Service shares produced a return of-5.32% during the reporting period. On a relative basis, the Fund’s Reference Index returned-1.51%. The Fund’s Reference Index is a customized weighted index currently comprised of the following underlying broad-based security indices: 65% of the Bloomberg Barclays U.S. Aggregate Bond Index and 35% of the Russell 3000 Index. Measured separately, the Bloomberg Barclays U.S. Aggregate Bond Index returned 0.01% and the Russell 3000 Index returned-5.24%.
MARKET OVERVIEW
Markets were volatile in 2018 and hit a wall in the last quarter of the year. Several shocks negatively affected market sentiment. The U.S. Federal Reserve (Fed) once again decided to hike interest rates, as was nearly universally expected, but the post-meeting conference was more hawkish than expected. Markets were expecting a clear message that the Fed might consider a pause in any future rate increases, but that was not initially communicated. Equity markets sold off, bonds rallied, and the U.S. dollar weakened. The sell-offs were sizable, which led some to think a recession might be imminent. It was not just the Fed making headlines, some key economic data was also weaker in December. In the U.S., regional surveys from the Fed and Institute for Supply Management (ISM) sentiment surveys decreased markedly, along with acool-off in housing. Politics were once again a factor because there was little clarity from the Trump Administration about the policies for tariffs on Chinese imports, and the U.S. Government shutdown did not help in an environment where the appetite for risk declined.
The U.S. economy continued to show strong growth momentum. As of the end of the reporting period, the tracking of fourth-quarter GDP data suggests the economy will finish the year at around 3% GDP growth. There are pockets of moderation, such as housing and investment expenditures that may have peaked in the second half of the year. Going forward, we believe investment should continue to support growth. With increasingly less slack in the economy, strong profits, and the corporate tax cuts, the environment for investment is healthy. Consumers so far do not seem to be affected by market jitters and politics. At period end, reports and anecdotes suggest that the holiday shopping period was good. Job growth is still strong, supporting both incomes and consumer confidence. Household finances are in good shape. If growth continues to be above trend as expected, the Fed may resume its hiking cycle, but for the time being, this may be the time for investors to take stock and observe the impact of the tightening delivered so far.
EQUITY STRATEGY REVIEW
In a volatile environment, the equity strategy produced negative absolute performance during the reporting period and underperformed the Russell 3000 Index. The largest underperforming sectors for the equity strategy were Consumer Staples, Communication Services, and Information Technology, due to stock selection. The equity strategy outperformed slightly in the Industrials sector, where stock selection benefited.
Holdings that contributed positively to performance included Palo Alto Networks and Mastercard.
Continued strong execution has enabled Palo Alto Networks to accelerate growth and consistently beat expectations on the top and bottom-line, despite market concerns that a product refresh cycle is nearing its end. While there weremid-year questions relating to the change in the CEO and COO (both from Google), the company has stated it remains committed to the same strategic path, and execution in the first two quarters post the change remained strong. We continue to view Palo Alto Networks as a good value, especially relative to pure software companies with similar growth profiles.
Mastercard’s performance was driven by strong core results reported over the second quarter of 2018, where revenues and earnings soundly beat expectations and organic revenue growth accelerated to over 20% year over year. While these results are unlikely sustainable, Mastercard has demonstrated an ability to grow at a faster pace than their largest competitor Visa driven by the strength of their services business, share gains in European processing, and some market share gains internationally. Notably, this reporting period, the company won Santander’s large UK debit business. More importantly, Mastercard continues to benefit from the long tail of revenue growth as the world transitions from cash and check to electronic forms of payment. The global ubiquity of acceptance at Visa and Mastercard make them both partners of choice for global card issuers.
Not owning Amazon over the first half of the period was the biggest relative detractor. We initiated a position in the company over the second half of the period. Also detracting from performance was British American Tobacco (BATS). Concerns about heightened regulatory pressures in the U.S. tobacco industry (40% of BATS profits) pressured the stock in the fourth quarter of 2018. The FDA, which has oversight over U.S. tobacco, signaled that they would propose a rule banning menthol from cigarettes. Menthol cigarettes comprise 60% of BATS U.S. business. Also, the FDA has used aggressive language to address the youth vaping issue and has reached concessions with some vaping companies, like Juul, to address underage use. Although BATS is the largest vaping company in the world, their
3 OPPENHEIMER CONSERVATIVE BALANCED FUND/VA
U.S. vaping business is minor to the overall enterprise. However, this serves as more evidence that the FDA is taking a more aggressive stance in forcing its policies.
FIXED-INCOME STRATEGY REVIEW
In a period where U.S. Treasuries outperformed credit, the fixed-income strategy’s underweight position in U.S. Treasuries and overweight exposure to investment grade credit were the top detractors to return, leading the fixed-income strategy to underperform the Bloomberg Barclays U.S. Aggregate Bond Index. The fixed-income strategy’s top contributors to return over the period were allocations to asset-backed securities (ABS) andnon-agency mortgage-backed securities (MBS).
Investors should consider the Fund’s investment objective, risks, charges and expenses carefully before investing. The Fund’s prospectus and summary prospectus contain this and other information about the Fund, and may be obtained by asking your financial advisor or calling us at 1.800.988.8287. Read prospectuses and summary prospectuses carefully before investing.
Total returns include changes in share price and reinvestment of dividends and capital gains distributions in a hypothetical investment for the periods shown, but do not include the charges associated with the separate account products that offer this Fund.
The views in the Fund Performance Discussion represent the opinions of this Fund’s portfolio managers and are not intended as investment advice or to predict or depict the performance of any investment. These views are as of the close of business on December 31, 2018, and are subject to change based on subsequent developments. The Fund’s portfolio and strategies are subject to change.
Shares of Oppenheimer funds are not deposits or obligations of any bank, are not guaranteed by any bank, are not insured by the FDIC or any other agency, and involve investment risks, including the possible loss of the principal amount invested.
Comparing the Fund’s Performance to the Market.The graphs that follow show the performance of a hypothetical $10,000 investment in each share class of the Fund held until December 31, 2018. Performance is measured over aten-fiscal-year period for both Classes. Performance information does not reflect charges that apply to separate accounts investing in the Fund. If these charges were taken into account, performance would be lower.
The graphs assume that all dividends and capital gains distributions were reinvested in additional shares. The Fund’s performance is compared to the performance of the Russell 3000 Index, the Bloomberg Barclays U.S. Aggregate Bond Index and the Fund’s Reference Index. The Russell 3000 Index measures the performance of the largest 3,000 U.S. companies, representing approximately 98% of the investable U.S. equity market. The Bloomberg Barclays U.S. Aggregate Bond Index is an index of U.S dollar-denominated, investment-grade U.S. corporate government and mortgage-backed securities. The Fund’s Reference Index is a customized weighted index currently comprised of 65% of the Bloomberg Barclays U.S. Aggregate Bond Index and 35% of the Russell 3000 Index. The indices areunmanaged and cannot be purchased directly by investors. While index comparisons may be useful to provide a benchmark for the Fund’s performance, it must be noted that the Fund’s investments are not limited to the investments comprising theindices. Index performance includes reinvestment of income, but does not reflect transaction costs, fees, expenses or taxes. Index performance is shown for illustrative purposes only as a benchmark for the Fund’s performance, and does not predict or depict performance of the Fund. The Fund’s performance reflects the effects of the Fund’s business and operating expenses.
4 OPPENHEIMER CONSERVATIVE BALANCED FUND/VA
COMPARISON OF CHANGE IN VALUE OF $10,000 HYPOTHETICAL INVESTMENTS IN:
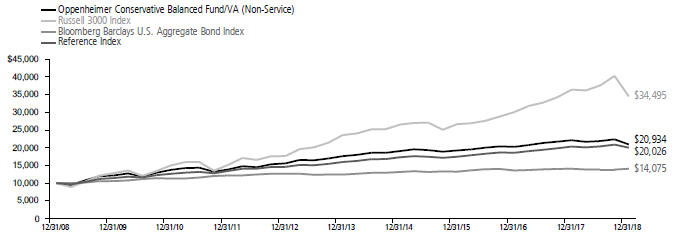
Average Annual Total Returns ofNon-Service Shares of the Fund at 12/31/18
1-Year -5.32% 5-Year 3.50% 10-Year7.67%
COMPARISON OF CHANGE IN VALUE OF $10,000 HYPOTHETICAL INVESTMENTS IN:
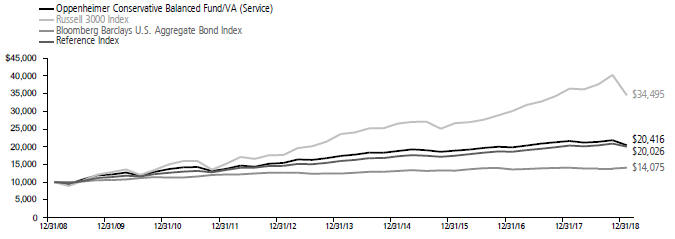
Average Annual Total Returns of Service Shares of the Fund at 12/31/18
1-Year -5.53% 5-Year 3.25% 10-Year 7.40%
Performance data quoted represents past performance, which does not guarantee future results.The investment return and principal value of an investment in the Fund will fluctuate so that an investor’s shares, when redeemed, may be worth more or less than their original cost. Current performance may be lower or higher than the performance quoted. For performance data current to the most recent month end, call us at 1.800.988.8287. The Fund’s total returns should not be expected to be the same as the returns of other funds, whether or not both funds have the same portfolio managers and/or similar names. The Fund’s total returns include changes in share price and reinvested distributions but do not include the charges associated with the separate account products that offer this Fund. Such performance would have been lower if such charges were taken into account.
5 OPPENHEIMER CONSERVATIVE BALANCED FUND/VA
Fund Expenses
Fund Expenses.As a shareholder of the Fund, you incur two types of costs: (1) transaction costs and (2) ongoing costs, including management fees; distribution and service fees; and other Fund expenses. These examples are intended to help you understand your ongoing costs (in dollars) of investing in the Fund and to compare these costs with the ongoing costs of investing in other mutual funds.
The examples are based on an investment of $1,000.00 invested at the beginning of the period and held for the entire6-month period ended December 31, 2018.
Actual Expenses. The first section of the table provides information about actual account values and actual expenses. You may use the information in this section for the class of shares you hold, together with the amount you invested, to estimate the expense that you paid over the period. Simply divide your account value by $1,000.00 (for example, an $8,600.00 account value divided by $1,000.00 = 8.60), then multiply the result by the number in the first section under the heading entitled “Expenses Paid During 6 Months Ended December 31, 2018” to estimate the expenses you paid on your account during this period.
Hypothetical Example for Comparison Purposes.
The second section of the table provides information about hypothetical account values and hypothetical expenses based on the Fund’s actual expense ratio for each class of shares, and an assumed rate of return of 5% per year for each class before expenses, which is not the actual return. The hypothetical account values and expenses may not be used to estimate the actual ending account balance or expenses you paid for the period. You may use this information to compare the ongoing costs of investing in the Fund and other funds. To do so, compare this 5% hypothetical example for the class of shares you hold with the 5% hypothetical examples that appear in the shareholder reports of the other funds.
Please note that the expenses shown in the table are meant to highlight your ongoing costs only and do not reflect any charges associated with the separate accounts that offer this Fund. Therefore, the “hypothetical” lines of the table are useful in comparing ongoing costs only, and will not help you determine the relative total costs of owning different funds. In addition, if these separate account charges were included your costs would have been higher.
| | | | | | | | | | | | |
| Actual | | Beginning Account Value July 1, 2018 | | | Ending Account Value
December 31, 2018 | | | Expenses Paid During 6 Months Ended
December 31, 2018 | |
Non-Service shares | | | $ 1,000.00 | | | | $ 956.30 | | | | $ 3.31 | |
Service shares | | | 1,000.00 | | | | 955.10 | | | | 4.54 | |
| | | |
| Hypothetical | | | | | | | | | |
(5% return before expenses) | | | | | | | | | |
Non-Service shares | | | 1,000.00 | | | | 1,021.83 | | | | 3.42 | |
Service shares | | | 1,000.00 | | | | 1,020.57 | | | | 4.70 | |
Expenses are equal to the Fund’s annualized expense ratio for that class, multiplied by the average account value over the period, multiplied by 184/365 (to reflect theone-half year period). Those annualized expense ratios, excluding indirect expenses from affiliated funds, based on the6-month period ended December 31, 2018 are as follows:
| | | | |
| Class | | Expense Ratios | |
Non-Service shares | | | 0.67% | |
Service shares | | | 0.92 | |
The expense ratios reflect voluntary and/or contractual waivers and/or reimbursements of expenses by the Fund’s Manager. Some of these undertakings may be modified or terminated at any time, as indicated in the Fund’s prospectus. The “Financial Highlights” tables in the Fund’s financial statements, included in this report, also show the gross expense ratios, without such waivers or reimbursements and reduction to custodian expenses, if applicable.
6 OPPENHEIMER CONSERVATIVE BALANCED FUND/VA
STATEMENT OF INVESTMENTSDecember 31, 2018
| | | | | | | | |
| | | Shares | | | Value | |
| |
Common Stocks—32.5% | | | | | | | | |
| |
Consumer Discretionary—5.6% | | | | | | | | |
| |
Auto Components—0.2% | | | | | | | | |
| |
| Visteon Corp.1 | | | 4,382 | | | $ | 264,147 | |
|
| |
Diversified Consumer Services—0.0% | | | | | | | | |
| |
| Houghton Mifflin Harcourt Co.1 | | | 2,021 | | | | 17,906 | |
| |
| Weight Watchers International, Inc.1 | | | 85 | | | | 3,277 | |
| | | | | | | | |
| | | | | | | 21,183 | |
|
| |
Entertainment—0.9% | | | | | | | | |
| |
| Activision Blizzard, Inc. | | | 11,430 | | | | 532,295 | |
| |
| Netflix, Inc.1 | | | 2,656 | | | | 710,905 | |
| |
| Zynga, Inc., Cl. A1 | | | 110,959 | | | | 436,069 | |
| | | | | | | | |
| | | | | | | 1,679,269 | |
|
| |
Hotels, Restaurants & Leisure—0.7% | | | | | | | | |
| |
| Cedar Fair LP2 | | | 5,485 | | | | 259,440 | |
| |
| Chipotle Mexican Grill, Inc., Cl. A1 | | | 24 | | | | 10,363 | |
| |
| McDonald’s Corp. | | | 5,926 | | | | 1,052,280 | |
| | | | | | | | |
| | | | | | | 1,322,083 | |
|
| |
Household Durables—0.0% | | | | | | | | |
| |
| Newell Brands, Inc. | | | 654 | | | | 12,158 | |
| |
| Tupperware Brands Corp. | | | 246 | | | | 7,766 | |
| | | | | | | | |
| | | | | | | 19,924 | |
|
| |
Interactive Media & Services—0.8% | | | | | | | | |
| |
| Alphabet, Inc., Cl. C1 | | | 10 | | | | 10,356 | |
| |
| Facebook, Inc., Cl. A1 | | | 8,433 | | | | 1,105,482 | |
| |
| Snap, Inc., Cl. A1 | | | 48,245 | | | | 265,830 | |
| | | | | | | | |
| | | | | | | 1,381,668 | |
|
| |
Internet & Catalog Retail—1.2% | | | | | | | | |
| |
| Amazon.com, Inc.1 | | | 1,126 | | | | 1,691,218 | |
| |
| Booking Holdings, Inc.1 | | | 5 | | | | 8,612 | |
| |
| eBay, Inc.1 | | | 16,193 | | | | 454,538 | |
| |
| Groupon, Inc., Cl. A1 | | | 4,861 | | | | 15,555 | |
| | | | | | | | |
| | | | | | | 2,169,923 | |
|
| |
Leisure Products—0.0% | | | | | | | | |
| |
| American Outdoor Brands Corp.1 | | | 1,079 | | | | 13,876 | |
| |
| Vista Outdoor, Inc.1 | | | 1,278 | | | | 14,505 | |
| | | | | | | | |
| | | | | | | 28,381 | |
|
| |
Multiline Retail—0.0% | | | | | | | | |
| |
| Big Lots, Inc. | | | 171 | | | | 4,945 | |
| |
| Dollar Tree, Inc.1 | | | 206 | | | | 18,606 | |
| | | | | | | | |
| | | | | | | 23,551 | |
|
| |
Specialty Retail—1.3% | | | | | | | | |
| |
| Bed Bath & Beyond, Inc. | | | 395 | | | | 4,471 | |
| |
| Burlington Stores, Inc.1 | | | 2,116 | | | | 344,210 | |
| |
| CarMax, Inc.1 | | | 9,248 | | | | 580,127 | |
| |
| GameStop Corp., Cl. A | | | 750 | | | | 9,465 | |
| |
| Lowe’s Cos., Inc. | | | 15,166 | | | | 1,400,732 | |
| |
| Office Depot, Inc. | | | 4,029 | | | | 10,395 | |
| |
| Sally Beauty Holdings, Inc.1 | | | 721 | | | | 12,293 | |
| |
| Sportsman’s Warehouse Holdings, Inc.1 | | | 1,985 | | | | 8,694 | |
| | | | | | | | |
| | | | | | | 2,370,387 | |
|
| |
Textiles, Apparel & Luxury Goods—0.5% | | | | | | | | |
| |
| NIKE, Inc., Cl. B | | | 12,733 | | | | 944,025 | |
|
| |
Consumer Staples—1.0% | | | | | | | | |
| |
Beverages—0.0% | | | | | | | | |
| |
| Constellation Brands, Inc., Cl. A | | | 49 | | | | 7,880 | |
| |
| Molson Coors Brewing Co., Cl. B | | | 379 | | | | 21,285 | |
| | | | | | | | |
| | | | | | | 29,165 | |
|
| |
Food & Staples Retailing—0.0% | | | | | | | | |
| |
| Kroger Co. (The) | | | 710 | | | | 19,525 | |
| |
| Rite Aid Corp.1 | | | 10,543 | | | | 7,468 | |
| |
| Smart & Final Stores, Inc.1 | | | 1,926 | | | | 9,129 | |
| |
| SpartanNash Co. | | | 764 | | | | 13,126 | |
| |
| United Natural Foods, Inc.1 | | | 460 | | | | 4,871 | |
| | | | | | | | |
| | | Shares | | | Value | |
| |
Food & Staples Retailing (Continued) | | | | | | | | |
| |
| Walgreens Boots Alliance, Inc. | | | 204 | | | $ | 13,939 | |
| | | | | | | | |
| | | | | | | 68,058 | |
|
| |
Food Products—0.5% | | | | | | | | |
| |
| Campbell Soup Co. | | | 558 | | | | 18,408 | |
| |
| Conagra Brands, Inc. | | | 17,572 | | | | 375,338 | |
| |
| Dean Foods Co. | | | 2,150 | | | | 8,192 | |
| |
| General Mills, Inc. | | | 487 | | | | 18,964 | |
| |
| Kellogg Co. | | | 294 | | | | 16,761 | |
| |
| Kraft Heinz Co. (The) | | | 10,662 | | | | 458,893 | |
| |
| Seneca Foods Corp., Cl. A1 | | | 319 | | | | 9,002 | |
| |
| TreeHouse Foods, Inc.1 | | | 278 | | | | 14,097 | |
| | | | | | | | |
| | | | | | | 919,655 | |
|
| |
Household Products—0.2% | | | | | | | | |
| |
| Church & Dwight Co., Inc. | | | 240 | | | | 15,782 | |
| |
| Energizer Holdings, Inc. | | | 5,740 | | | | 259,161 | |
| | | | | | | | |
| | | | | | | 274,943 | |
|
| |
Personal Products—0.0% | | | | | | | | |
| |
| Avon Products, Inc.1 | | | 8,404 | | | | 12,774 | |
| |
| Coty, Inc., Cl. A | | | 2,115 | | | | 13,875 | |
| |
| Edgewell Personal Care Co.1 | | | 338 | | | | 12,624 | |
| | | | | | | | |
| | | | | | | 39,273 | |
|
| |
Tobacco—0.3% | | | | | | | | |
| |
| Altria Group, Inc. | | | 455 | | | | 22,472 | |
| |
| British American Tobacco plc | | | 14,470 | | | | 461,437 | |
| |
| British American Tobacco plc, | | | | | | | | |
| Sponsored ADR | | | 519 | | | | 16,535 | |
| |
| Philip Morris International, Inc. | | | 424 | | | | 28,306 | |
| |
| Vector Group Ltd. | | | 1,757 | | | | 17,096 | |
| | | | | | | | |
| | | | | | | 545,846 | |
|
| |
Energy—1.7% | | | | | | | | |
| |
Energy Equipment & Services—0.7% | | | | | | | | |
| |
| Baker Hughes a GE Co., Cl. A | | | 19,524 | | | | 419,766 | |
| |
| Schlumberger Ltd. | | | 24,576 | | | | 886,702 | |
| | | | | | | | |
| | | | | | | 1,306,468 | |
|
| |
Oil, Gas & Consumable Fuels—1.0% | | | | | | | | |
| |
| Devon Energy Corp. | | | 23,558 | | | | 530,997 | |
| |
| EQT Corp. | | | 37,992 | | | | 717,669 | |
| |
| Equitrans Midstream Corp.1 | | | 3 | | | | 60 | |
| |
| Matador Resources Co.1 | | | 192 | | | | 2,982 | |
| |
| Noble Energy, Inc. | | | 177 | | | | 3,321 | |
| |
| Range Resources Corp. | | | 464 | | | | 4,440 | |
| |
| Shell Midstream Partners LP2 | | | 29,695 | | | | 487,295 | |
| | | | | | | | |
| | | | | | | 1,746,764 | |
|
| |
Financials—5.8% | | | | | | | | |
| |
Capital Markets—0.5% | | | | | | | | |
| |
| Charles Schwab Corp. (The) | | | 186 | | | | 7,725 | |
| |
| Intercontinental Exchange, Inc. | | | 11,876 | | | | 894,619 | |
| | | | | | | | |
| | | | | | | 902,344 | |
|
| |
Commercial Banks—2.8% | | | | | | | | |
| |
| Citigroup, Inc. | | | 11,360 | | | | 591,402 | |
| |
| East West Bancorp, Inc. | | | 13,790 | | | | 600,279 | |
| |
| IBERIABANK Corp. | | | 7,010 | | | | 450,603 | |
| |
| JPMorgan Chase & Co. | | | 21,510 | | | | 2,099,806 | |
| |
| Signature Bank (New York) | | | 5,710 | | | | 587,045 | |
| |
| Wells Fargo & Co. | | | 18,430 | | | | 849,254 | |
| | | | | | | | |
| | | | | | | 5,178,389 | |
|
| |
Consumer Finance—0.4% | | | | | | | | |
| |
| Synchrony Financial | | | 25,510 | | | | 598,465 | |
|
| |
Insurance—1.1% | | | | | | | | |
| |
| American International Group, Inc. | | | 17,710 | | | | 697,951 | |
| |
| Arthur J. Gallagher & Co. | | | 7,639 | | | | 562,994 | |
| |
| Marsh & McLennan Cos., Inc. | | | 101 | | | | 8,055 | |
7 OPPENHEIMER CONSERVATIVE BALANCED FUND/VA
STATEMENT OF INVESTMENTSContinued
| | | | | | | | |
| | | Shares | | | Value | |
| |
Insurance (Continued) | | | | | | | | |
| |
| Progressive Corp. (The) | | | 12,625 | | | $ | 761,666 | |
| | | | | | | | |
| | | | | | | 2,030,666 | |
|
| |
Real Estate Investment Trusts (REITs)—1.0% | |
| |
| AGNC Investment Corp. | | | 826 | | | | 14,488 | |
| |
| Annaly Capital Management, Inc. | | | 1,408 | | | | 13,826 | |
| |
| EPR Properties | | | 8,940 | | | | 572,428 | |
| |
| Mid-America Apartment Communities, Inc. | | | 3,477 | | | | 332,749 | |
| |
| Prologis, Inc. | | | 15,494 | | | | 909,808 | |
| | | | | | | | |
| | | | | | | 1,843,299 | |
|
| |
Health Care—4.5% | | | | | | | | |
| |
Biotechnology—0.6% | | | | | | | | |
| |
| BioMarin Pharmaceutical, Inc.1 | | | 3,030 | | | | 258,005 | |
| |
| uniQure NV1 | | | 6,404 | | | | 184,563 | |
| |
| Vertex Pharmaceuticals, Inc.1 | | | 3,566 | | | | 590,922 | |
| | | | | | | | |
| | | | | | | 1,033,490 | |
|
| |
Health Care Equipment & Supplies—1.0% | | | | | |
| |
| ABIOMED, Inc.1 | | | 15 | | | | 4,875 | |
| |
| Align Technology, Inc.1 | | | 20 | | | | 4,189 | |
| |
| Becton Dickinson & Co. | | | 2,582 | | | | 581,776 | |
| |
| Boston Scientific Corp.1 | | | 353 | | | | 12,475 | |
| |
| CryoPort, Inc.1 | | | 16,840 | | | | 185,745 | |
| |
| IDEXX Laboratories, Inc.1 | | | 31 | | | | 5,767 | |
| |
| Insulet Corp.1 | | | 5,112 | | | | 405,484 | |
| |
| Intuitive Surgical, Inc.1 | | | 1,399 | | | | 670,009 | |
| | | | | | | | |
| | | | | | | 1,870,320 | |
|
| |
Health Care Providers & Services—0.7% | | | | | |
| |
| Anthem, Inc. | | | 3,110 | | | | 816,779 | |
| |
| CVS Health Corp. | | | 220 | | | | 14,414 | |
| |
| LHC Group, Inc.1 | | | 37 | | | | 3,474 | |
| |
| UnitedHealth Group, Inc. | | | 104 | | | | 25,909 | |
| |
| WellCare Health Plans, Inc.1 | | | 2,111 | | | | 498,386 | |
| | | | | | | | |
| | | | | | | 1,358,962 | |
|
| |
Health Care Technology—0.1% | | | | | | | | |
| |
Teladoc Health, Inc.1 | | | 5,418 | | | | 268,570 | |
| |
Life Sciences Tools & Services—0.4% | | | | | |
| |
| Agilent Technologies, Inc. | | | 10,201 | | | | 688,160 | |
| |
| Illumina, Inc.1 | | | 29 | | | | 8,698 | |
| | | | | | | 696,858 | |
|
| |
Pharmaceuticals—1.7% | | | | | | | | |
| |
| AstraZeneca plc, Sponsored ADR | | | 154 | | | | 5,849 | |
| |
| Bayer AG, Sponsored ADR | | | 28,927 | | | | 508,247 | |
| |
| GlaxoSmithKline plc, Sponsored ADR | | | 527 | | | | 20,137 | |
| |
| Johnson & Johnson | | | 10,160 | | | | 1,311,148 | |
| |
| Merck & Co., Inc. | | | 14,224 | | | | 1,086,856 | |
| |
| Nektar Therapeutics, Cl. A1 | | | 77 | | | | 2,531 | |
| |
| TherapeuticsMD, Inc.1 | | | 30,050 | | | | 114,490 | |
| | | | | | | | |
| | | | | | | 3,049,258 | |
|
| |
Industrials—3.9% | | | | | | | | |
| |
Aerospace & Defense—1.1% | | | | | | | | |
| |
| Boeing Co. (The) | | | 2,675 | | | | 862,687 | |
| |
| Lockheed Martin Corp. | | | 2,282 | | | | 597,519 | |
| |
| Spirit AeroSystems Holdings, Inc., Cl. A | | | 6,677 | | | | 481,345 | |
| | | | | | | | |
| | | | | | | 1,941,551 | |
|
| |
Air Freight & Couriers—0.2% | | | | | | | | |
| |
XPO Logistics, Inc.1 | | | 5,428 | | | | 309,613 | |
| |
Airlines—0.3% | | | | | | | | |
| |
Spirit Airlines, Inc.1 | | | 10,703 | | | | 619,918 | |
| |
Building Products—0.2% | | | | | | | | |
| |
| A.O. Smith Corp. | | | 105 | | | | 4,483 | |
| |
| Masco Corp. | | | 10,570 | | | | 309,067 | |
| | | | | | | | |
| | | | | | | 313,550 | |
| | | | | | | | |
| | | Shares | | | Value | |
| |
Commercial Services & Supplies—0.6% | | | | | |
| |
| ACCO Brands Corp. | | | 36,291 | | | $ | 246,053 | |
| |
| KAR Auction Services, Inc. | | | 11,722 | | | | 559,374 | |
| |
| Waste Connections, Inc. | | | 4,916 | | | | 365,013 | |
| | | | | | | | |
| | | | | | | 1,170,440 | |
|
| |
Construction & Engineering—0.1% | | | | | |
| |
| Dycom Industries, Inc.1 | | | 4,740 | | | | 256,150 | |
|
| |
Industrial Conglomerates—0.0% | | | | | |
| |
| General Electric Co. | | | 1,793 | | | | 13,573 | |
|
| |
Machinery—0.6% | | | | | | | | |
| |
| Illinois Tool Works, Inc. | | | 4,188 | | | | 530,578 | |
| |
| Stanley Black & Decker, Inc. | | | 4,176 | | | | 500,034 | |
| |
| Wabtec Corp. | | | 56 | | | | 3,934 | |
| | | | | | | | |
| | | | | | | 1,034,546 | |
|
| |
Professional Services—0.3% | | | | | | | | |
| |
| ASGN, Inc.1 | | | 127 | | | | 6,921 | |
| |
| Korn/Ferry International | | | 12,820 | | | | 506,903 | |
| |
| Nielsen Holdings plc | | | 463 | | | | 10,802 | |
| | | | | | | | |
| | | | | | | 524,626 | |
|
| |
Road & Rail—0.3% | | | | | | | | |
| |
| Canadian Pacific Railway Ltd. | | | 3,140 | | | | 557,727 | |
|
| |
Trading Companies & Distributors—0.2% | | | | | |
| |
| Fastenal Co. | | | 8,266 | | | | 432,229 | |
|
| |
Information Technology—6.9% | | | | | | | | |
| |
Communications Equipment—0.7% | | | | | |
| |
| Motorola Solutions, Inc. | | | 4,972 | | | | 571,979 | |
| |
| Palo Alto Networks, Inc.1 | | | 3,473 | | | | 654,139 | |
| | | | | | | | |
| | | | | | | 1,226,118 | |
|
| |
IT Services—1.6% | | | | | | | | |
| |
| CACI International, Inc., Cl. A1 | | | 35 | | | | 5,041 | |
| |
| DXC Technology Co. | | | 11,289 | | | | 600,236 | |
| |
| First Data Corp., Cl. A1 | | | 43,756 | | | | 739,914 | |
| |
| International Business Machines Corp. | | | 59 | | | | 6,707 | |
| |
| Mastercard, Inc., Cl. A | | | 6,297 | | | | 1,187,929 | |
| |
| PayPal Holdings, Inc.1 | | | 176 | | | | 14,800 | |
| |
| Perspecta, Inc. | | | 16,861 | | | | 290,346 | |
| |
| Total System Services, Inc. | | | 105 | | | | 8,535 | |
| | | | | | | | |
| | | | | | | 2,853,508 | |
|
| |
Semiconductors & Semiconductor Equipment—0.8% | |
| |
| Applied Materials, Inc. | | | 19,159 | | | | 627,266 | |
| |
| Broadcom, Inc. | | | 48 | | | | 12,205 | |
| |
| Microchip Technology, Inc. | | | 105 | | | | 7,552 | |
| |
| Texas Instruments, Inc. | | | 8,940 | | | | 844,830 | |
| | | | | | | | |
| | | | | | | 1,491,853 | |
|
| |
Software—2.4% | | | | | | | | |
| |
| Envestnet, Inc.1 | | | 96 | | | | 4,722 | |
| |
| Microsoft Corp. | | | 23,768 | | | | 2,414,116 | |
| |
| Pegasystems, Inc. | | | 6,567 | | | | 314,100 | |
| |
| PTC, Inc.1 | | | 68 | | | | 5,637 | |
| |
| Q2 Holdings, Inc.1 | | | 8,100 | | | | 401,355 | |
| |
| salesforce.com, Inc.1 | | | 4,560 | | | | 624,583 | |
| |
| ServiceNow, Inc.1 | | | 3,440 | | | | 612,492 | |
| | | | | | | | |
| | | | | | | 4,377,005 | |
|
| |
Technology Hardware, Storage & Peripherals—1.4% | |
| |
| Apple, Inc. | | | 14,387 | | | | 2,269,405 | |
| |
| Diebold Nixdorf, Inc. | | | 2,001 | | | | 4,983 | |
| |
| NCR Corp.1 | | | 573 | | | | 13,225 | |
| |
| Western Digital Corp. | | | 9,225 | | | | 341,048 | |
| | | | | | | | |
| | | | | | | 2,628,661 | |
|
| |
Materials—0.9% | | | | | | | | |
| |
Chemicals—0.2% | | | | | | | | |
| |
| ScottsMiracle-Gro Co. (The), Cl. A | | | 110 | | | | 6,761 | |
| |
| Valvoline, Inc. | | | 18,870 | | | | 365,134 | |
| | | | | | | | |
| | | | | | | 371,895 | |
8 OPPENHEIMER CONSERVATIVE BALANCED FUND/VA
| | | | | | | | |
| | | Shares | | | Value | |
| |
Containers & Packaging—0.3% | |
| |
| Sealed Air Corp. | | | 14,990 | | | $ | 522,252 | |
|
| |
Metals & Mining—0.4% | | | | | | | | |
| |
| Compass Minerals International, Inc. | | | 9,620 | | | | 401,058 | |
| |
| Kaiser Aluminum Corp. | | | 50 | | | | 4,464 | |
| |
| Osisko Gold Royalties Ltd. | | | 51,041 | | | | 447,525 | |
| | | | | | | | |
| | | | | | | 853,047 | |
|
| |
Telecommunication Services—1.1% | |
| |
Diversified Telecommunication Services—0.8% | |
| |
| AT&T, Inc. | | | 851 | | | | 24,288 | |
| |
| BT Group plc, Sponsored ADR | | | 1,142 | | | | 17,358 | |
| |
| ORBCOMM, Inc.1 | | | 375 | | | | 3,097 | |
| |
| Verizon Communications, Inc. | | | 23,060 | | | | 1,296,433 | |
| |
| Zayo Group Holdings, Inc.1 | | | 10,890 | | | | 248,728 | |
| | | | | | | | |
| | | | | | | 1,589,904 | |
|
| |
Wireless Telecommunication Services—0.3% | |
| |
| T-Mobile US, Inc.1 | | | 8,231 | | | | 523,574 | |
|
| |
Utilities—1.1% | | | | | | | | |
| |
Electric Utilities—0.3% | | | | | | | | |
| |
| Edison International | | | 343 | | | | 19,472 | |
| |
| PG&E Corp.1 | | | 18,266 | | | | 433,818 | |
| |
| PPL Corp. | | | 619 | | | | 17,536 | |
| |
| Southern Co. (The) | | | 321 | | | | 14,098 | |
| | | | | | | | |
| | | | | | | 484,924 | |
|
| |
Gas Utilities—0.2% | | | | | | | | |
| |
| AmeriGas Partners LP2 | | | 521 | | | | 13,181 | |
| |
| Suburban Propane Partners LP2 | | | 22,713 | | | | 437,680 | |
| | | | | | | | |
| | | | | | | 450,861 | |
|
| |
Multi-Utilities—0.6% | | | | | | | | |
| |
| Centrica plc, Sponsored ADR | | | 2,212 | | | | 15,197 | |
| |
| Dominion Energy, Inc. | | | 8,044 | | | | 574,824 | |
| |
| National Grid plc | | | 52,600 | | | | 508,672 | |
| |
| National Grid plc, Sponsored ADR | | | 380 | | | | 18,232 | |
| | | | | | | | |
| | | | | | | 1,116,925 | |
| | | | | | | | |
| Total Common Stocks (Cost $61,314,883) | | | | 59,649,784 | |
| | |
| | | Principal
Amount | | | | |
Asset-Backed Securities—13.4% | | | | | | | | |
| |
Auto Loan—9.2% | | | | | | | | |
| |
| American Credit Acceptance Receivables Trust: | | | | | |
| Series2015-3,Cl. D, 5.86%, 7/12/223 | | $ | 135,000 | | | | 135,617 | |
| Series2017-3,Cl. B, 2.25%, 1/11/213 | | | 29,185 | | | | 29,160 | |
| Series2017-4,Cl. B, 2.61%, 5/10/213 | | | 69,000 | | | | 68,898 | |
| Series2017-4,Cl. C, 2.94%, 1/10/243 | | | 195,000 | | | | 194,167 | |
| Series2017-4,Cl. D, 3.57%, 1/10/243 | | | 246,000 | | | | 244,596 | |
| Series2018-2,Cl. B, 3.46%, 8/10/223 | | | 275,000 | | | | 275,097 | |
| Series2018-2,Cl. C, 3.70%, 7/10/243 | | | 275,000 | | | | 275,504 | |
| Series2018-3,Cl. B, 3.49%, 6/13/223 | | | 80,000 | | | | 80,154 | |
| Series2018-4,Cl. C, 3.97%, 1/13/253 | | | 180,000 | | | | 180,839 | |
| |
| AmeriCredit Automobile Receivables Trust: | | | | | | | | |
| Series2017-2,Cl. D, 3.42%, 4/18/23 | | | 320,000 | | | | 319,644 | |
| Series2017-4,Cl. D, 3.08%, 12/18/23 | | | 205,000 | | | | 202,303 | |
| Series2018-3,Cl. C, 3.74%, 10/18/24 | | | 260,000 | | | | 264,209 | |
| |
| Cabela’s Credit Card Master Note | | | | | | | | |
| Trust, Series2015-2, Cl. A2, 3.125% | | | | | | | | |
| [US0001M+67], 7/17/234 | | | 475,000 | | | | 475,689 | |
| |
| Capital Auto Receivables Asset Trust: | | | | | | | | |
| Series2017-1,Cl. D, 3.15%, 2/20/253 | | | 40,000 | | | | 39,913 | |
| Series2018-2,Cl. B, 3.48%, 10/20/233 | | | 125,000 | | | | 125,691 | |
| Series2018-2,Cl. C, 3.69%, 12/20/233 | | | 120,000 | | | | 121,054 | |
| |
| CarMax Auto Owner Trust: | | | | | | | | |
| Series2015-2,Cl. D, 3.04%, 11/15/21 | | | 115,000 | | | | 114,773 | |
| Series2015-3,Cl. D, 3.27%, 3/15/22 | | | 330,000 | | | | 329,624 | |
| Series2016-1,Cl. D, 3.11%, 8/15/22 | | | 220,000 | | | | 218,483 | |
| Series2017-1,Cl. D, 3.43%, 7/17/23 | | | 245,000 | | | | 244,948 | |
| Series2017-4,Cl. D, 3.30%, 5/15/24 | | | 110,000 | | | | 109,627 | |
| | | | | | | | |
| | | Principal
Amount | | | Value | |
| |
Auto Loan (Continued) | |
| |
| CarMax Auto Owner Trust: (Continued) | | | | | | | | |
| Series2018-1, Cl. D, 3.37%, 7/15/24 | | $ | 75,000 | | | $ | 74,179 | |
| Series2018-4, Cl. C, 3.85%, 7/15/24 | | | 90,000 | | | | 91,849 | |
| |
| CIG Auto Receivables Trust, Series | | | | | | | | |
| 2017-1A, Cl. A, 2.71%, 5/15/233 | | | 63,635 | | | | 63,260 | |
| |
| CPS Auto Receivables Trust: | | | | | | | | |
| Series2017-C, Cl. A, 1.78%, 9/15/203 | | | 12,117 | | | | 12,099 | |
| Series2017-C, Cl. B, 2.30%, 7/15/213 | | | 105,000 | | | | 104,528 | |
| Series2017-D, Cl. B, 2.43%, 1/18/223 | | | 180,000 | | | | 178,713 | |
| Series2018-A, Cl. B, 2.77%, 4/18/223 | | | 145,000 | | | | 143,865 | |
| Series2018-B, Cl. B, 3.23%, 7/15/223 | | | 155,000 | | | | 154,925 | |
| |
| CPS Auto Trust, Series2017-A, Cl. B, | | | | | | | | |
| 2.68%, 5/17/213 | | | 35,000 | | | | 34,890 | |
| |
| Credit Acceptance Auto Loan Trust: | | | | | | | | |
| Series2017-3A, Cl. C, 3.48%, 10/15/263 | | | 220,000 | | | | 219,075 | |
| Series2018-1A, Cl. B, 3.60%, 4/15/273 | | | 135,000 | | | | 134,896 | |
| Series2018-1A, Cl. C, 3.77%, 6/15/273 | | | 190,000 | | | | 190,020 | |
| Series2018-2A, Cl. C, 4.16%, 9/15/273 | | | 115,000 | | | | 116,787 | |
| Series2018-3A, Cl. C, 4.04%, 12/15/273 | | | 220,000 | | | | 222,519 | |
| |
| Drive Auto Receivables Trust: | | | | | | | | |
| Series2015-BA, Cl. D, 3.84%, 7/15/213 | | | 13,899 | | | | 13,920 | |
| Series2016-CA, Cl. D, 4.18%, 3/15/243 | | | 170,000 | | | | 170,911 | |
| Series2017-1, Cl. D, 3.84%, 3/15/23 | | | 225,000 | | | | 225,898 | |
| Series2017-3, Cl. C, 2.80%, 7/15/22 | | | 120,000 | | | | 119,714 | |
| Series2017-BA, Cl. D, 3.72%, 10/17/223 | | | 235,000 | | | | 235,506 | |
| Series2018-1, Cl. D, 3.81%, 5/15/24 | | | 160,000 | | | | 160,338 | |
| Series2018-2, Cl. D, 4.14%, 8/15/24 | | | 315,000 | | | | 317,696 | |
| Series2018-3, Cl. C, 3.72%, 9/16/24 | | | 120,000 | | | | 120,341 | |
| Series2018-3, Cl. D, 4.30%, 9/16/24 | | | 215,000 | | | | 218,118 | |
| Series2018-4, Cl. B, 3.36%, 10/17/22 | | | 135,000 | | | | 134,780 | |
| Series2018-5, Cl. C, 3.99%, 1/15/25 | | | 210,000 | | | | 211,988 | |
| |
| DT Auto Owner Trust: | | | | | | | | |
| Series2016-4A, Cl. E, 6.49%, 9/15/233 | | | 75,000 | | | | 76,876 | |
| Series2017-1A, Cl. D, 3.55%, 11/15/223 | | | 150,000 | | | | 150,213 | |
| Series2017-1A, Cl. E, 5.79%, 2/15/243 | | | 250,000 | | | | 255,323 | |
| Series2017-2A, Cl. D, 3.89%, 1/15/233 | | | 180,000 | | | | 180,675 | |
| Series2017-3A, Cl. D, 3.58%, 5/15/233 | | | 75,000 | | | | 74,972 | |
| Series2017-3A, Cl. E, 5.60%, 8/15/243 | | | 155,000 | | | | 158,709 | |
| Series2017-4A, Cl. D, 3.47%, 7/17/233 | | | 205,000 | | | | 204,470 | |
| Series2017-4A, Cl. E, 5.15%, 11/15/243 | | | 150,000 | | | | 151,541 | |
| Series2018-1A, Cl. B, 3.04%, 1/18/223 | | | 155,000 | | | | 154,641 | |
| Series2018-2A, Cl. B, 3.43%, 5/16/223 | | | 80,000 | | | | 80,048 | |
| Series2018-3A, Cl. B, 3.56%, 9/15/223 | | | 270,000 | | | | 271,366 | |
| Series2018-3A, Cl. C, 3.79%, 7/15/243 | | | 105,000 | | | | 105,485 | |
| |
| Exeter Automobile Receivables Trust: | | | | | | | | |
| Series2018-1A, Cl. B, 2.75%, 4/15/223 | | | 155,000 | | | | 154,292 | |
| Series2018-4A, Cl. B, 3.64%, 11/15/223 | | | 220,000 | | | | 220,044 | |
| |
| Flagship Credit Auto Trust, Series 2016-1, Cl. C, 6.22%, 6/15/223 | | | 380,000 | | | | 393,007 | |
| |
| GLS Auto Receivables Trust: | | | | | | | | |
| Series2018-1A, Cl. A, 2.82%, 7/15/225 | | | 243,320 | | | | 242,498 | |
| Series2018-3A, Cl. A, 3.35%, 8/15/223 | | | 124,370 | | | | 124,443 | |
| |
| GM Financial Automobile Leasing Trust: | | | | | | | | |
| Series2017-3, Cl. C, 2.73%, 9/20/21 | | | 120,000 | | | | 119,139 | |
| Series2018-2, Cl. C, 3.50%, 4/20/22 | | | 145,000 | | | | 145,547 | |
| |
| GMF Floorplan Owner Revolving Trust: | | | | | | | | |
| Series2018-3, Cl. B, 3.49%, 9/15/223 | | | 250,000 | | | | 251,606 | |
| Series2018-3, Cl. C, 3.68%, 9/15/223 | | | 210,000 | | | | 211,347 | |
| Series2018-4, Cl. B, 3.68%, 9/15/233 | | | 210,000 | | | | 212,748 | |
| Series2018-4, Cl. C, 3.88%, 9/15/233 | | | 265,000 | | | | 268,508 | |
9 OPPENHEIMER CONSERVATIVE BALANCED FUND/VA
STATEMENT OF INVESTMENTSContinued
| | | | | | | | |
| | | Principal Amount | | | Value | |
| |
Auto Loan (Continued) | | | | | | | | |
| |
| Navistar Financial Dealer Note Master Owner Trust II: | |
| Series2017-1, Cl. C, 4.056% | | | | | | | | |
| [US0001M+155], 6/27/223,4 | | $ | 60,000 | | | $ | 60,147 | |
| Series2017-1, Cl. D, 4.806% | | | | | | | | |
| [US0001M+230], 6/27/223,4 | | | 75,000 | | | | 75,075 | |
| Series2018-1, Cl. A, 3.136% | | | | | | | | |
| [US0001M+63], 9/25/233,4 | | | 115,000 | | | | 115,005 | |
| Series2018-1, Cl. B, 3.306% | | | | | | | | |
| [US0001M+80], 9/25/233,4 | | | 135,000 | | | | 135,176 | |
| |
| Santander Drive Auto Receivables Trust: | |
| Series2016-2, Cl. D, 3.39%, 4/15/22 | | | 315,000 | | | | 315,593 | |
| Series2017-1, Cl. D, 3.17%, 4/17/23 | | | 175,000 | | | | 174,498 | |
| Series2017-1, Cl. E, 5.05%, 7/15/243 | | | 410,000 | | | | 420,315 | |
| Series2017-3, Cl. D, 3.20%, 11/15/23 | | | 295,000 | | | | 293,856 | |
| Series2018-1, Cl. D, 3.32%, 3/15/24 | | | 110,000 | | | | 109,310 | |
| Series2018-2, Cl. D, 3.88%, 2/15/24 | | | 170,000 | | | | 171,503 | |
| Series2018-3, Cl. C, 3.51%, 8/15/23 | | | 440,000 | | | | 440,545 | |
| Series2018-4, Cl. C, 3.56%, 7/15/24 | | | 300,000 | | | | 302,404 | |
| Series2018-5, Cl. C, 3.81%, 12/16/24 | | | 225,000 | | | | 226,665 | |
| |
| Santander Retail Auto Lease Trust, | |
| Series2017-A, Cl. C, 2.96%, 11/21/223 | | | 195,000 | | | | 193,760 | |
| |
| TCF Auto Receivables Owner Trust, | |
| Series2015-1A, Cl. D, 3.53%, 3/15/223 | | | 190,000 | | | | 189,415 | |
| |
| United Auto Credit Securitization Trust, | |
| Series2018-1, Cl. C, 3.05%, 9/10/213 | | | 285,000 | | | | 283,975 | |
| |
| Veros Automobile Receivables Trust, | |
| Series2017-1, Cl. A, 2.84%, 4/17/233 | | | 52,045 | | | | 51,895 | |
| Westlake Automobile Receivables Trust: | |
| Series2016-1A, Cl. E, 6.52%, 6/15/223 | | | 270,000 | | | | 272,137 | |
| Series2017-2A, Cl. E, 4.63%, 7/15/243 | | | 320,000 | | | | 320,384 | |
| Series2018-1A, Cl. C, 2.92%, 5/15/233 | | | 160,000 | | | | 158,560 | |
| Series2018-1A, Cl. D, 3.41%, 5/15/233 | | | 315,000 | | | | 312,898 | |
| Series2018-3A, Cl. B, 3.32%, 10/16/233 | | | 252,000 | | | | 252,625 | |
| | | | | | | | |
| | | | | | | 16,804,044 | |
|
| |
| Credit Card—3.8% | | | | | | | | |
| |
| Cabela’s Credit Card Master Note Trust: | |
| Series2015-1A, Cl. A2, 2.995% | | | | | | | | |
| [US0001M+54], 3/15/234 | | | 490,000 | | | | 491,899 | |
| Series2015-2, Cl. A1, 2.25%, 7/17/23 | | | 525,000 | | | | 518,889 | |
| Series2016-1, Cl. A1, 1.78%, 6/15/22 | | | 710,000 | | | | 705,949 | |
| Series2016-1, Cl. A2, 3.305% | | | | | | | | |
| [US0001M+85], 6/15/224 | | | 255,000 | | | | 255,722 | |
| Evergreen Credit Card Trust, Series | |
| 2018-2, Cl. A, 2.805% [US0001M+35], 7/15/223,4 | | | 410,000 | | | | 409,941 | |
| |
| GE Capital Credit Card Master Note Trust: | |
| Series2012-7, Cl. A, 1.76%, 9/15/22 | | | 225,000 | | | | 223,071 | |
| Series2012-7, Cl. B, 2.21%, 9/15/22 | | | 200,000 | | | | 198,739 | |
| |
| Synchrony Credit Card Master Note | | | | | | | | |
| Trust, Series2015-1, Cl. A, 2.37%, 3/15/23 | | | 630,000 | | | | 625,200 | |
| |
| World Financial Network Credit Card Master Trust: | |
| Series2012-D, Cl. A, 2.15%, 4/17/23 | | | 615,000 | | | | 612,437 | |
| Series2016-C, Cl. A, 1.72%, 8/15/23 | | | 665,000 | | | | 657,916 | |
| Series2017-A, Cl. A, 2.12%, 3/15/24 | | | 515,000 | | | | 508,170 | |
| Series2017-C, Cl. A, 2.31%, 8/15/24 | | | 430,000 | | | | 424,172 | |
| Series2018-A, Cl. A, 3.07%, 12/16/24 | | | 540,000 | | | | 538,681 | |
| Series2018-B, Cl. A, 3.46%, 7/15/25 | | | 245,000 | | | | 247,707 | |
| Series2018-C, Cl. A, 3.55%, 8/15/25 | | | 490,000 | | | | 496,570 | |
| | | | | | | | |
| | | | | | | 6,915,063 | |
|
| |
| Equipment—0.3% | | | | | | | | |
| |
| CCG Receivables Trust: | |
| Series2017-1, Cl. B, 2.75%, 11/14/233 | | | 250,000 | | | | 246,971 | |
| Series2018-1, Cl. B, 3.09%, 6/16/253 | | | 90,000 | | | | 89,687 | |
| Series2018-1, Cl. C, 3.42%, 6/16/253 | | | 25,000 | | | | 24,913 | |
| Series2018-2, Cl. C, 3.87%, 12/15/253 | | | 60,000 | | | | 60,526 | |
| | | | | | | | |
| |
| Principal
Amount |
| | | Value | |
| |
| Equipment (Continued) | | | | | | | | |
| |
| CNH Equipment Trust, Series2017-C, | | | | | | | | |
| Cl. B, 2.54%, 5/15/25 | | $ | 70,000 | | | $ | 69,140 | |
| |
| Dell Equipment Finance Trust, Series2018-1, Cl. B, 3.34%, 6/22/233 | | | 90,000 | | | | 90,285 | |
| FRS I LLC, Series2013-1A, Cl. A1, 1.80%, 4/15/433 | | | 4,473 | | | | 4,458 | |
| | | | | | | | |
| | | | | | | 585,980 | |
| |
| Loans: Other—0.1% | | | | | | | | |
| |
| Ameriquest Mortgage Securities, Inc. | |
| Asset-Backed Pass-Through Certificates, | |
| Series2005-R5, Cl. M2, 3.196% | | | | | | | | |
| [US0001M+69], 7/25/354 | | | 93,589 | | | | 93,895 | |
| |
| Dell Equipment Finance Trust, Series2017-2, Cl. B, 2.47%, 10/24/223 | | | 75,000 | | | | 74,356 | |
| |
| Element Rail Leasing I LLC, Series2014-1A, Cl. A1, 2.299%, 4/19/443 | | | 136,372 | | | | 135,268 | |
| | | | | | | 303,519 | |
| | | | | | | | |
| Total Asset-Backed Securities (Cost $24,586,118) | | | | | | | 24,608,606 | |
|
| |
| Mortgage-Backed Obligations—33.6% | | | | | |
| |
| Government Agency—22.3% | | | | | | | | |
| |
| FHLMC/FNMA/FHLB/Sponsored—19.5% | | | | | |
| |
| Federal Home Loan Mortgage Corp. Gold Pool: | | | | | |
| 5.00%, 12/1/34 | | | 1,857 | | | | 1,963 | |
| 5.50%, 9/1/39 | | | 213,898 | | | | 226,900 | |
| 6.50%,7/1/28-4/1/34 | | | 18,139 | | | | 19,707 | |
| 7.00%,10/1/31-10/1/37 | | | 54,951 | | | | 60,716 | |
| 9.00%,8/1/22-5/1/25 | | | 972 | | | | 1,037 | |
| |
| Federal Home Loan Mortgage Corp., Interest-Only Stripped Mtg.-Backed Security: | |
| Series 183, Cl. IO, 75.298%, 4/1/276 | | | 41,641 | | | | 9,228 | |
| Series 192, Cl. IO, 99.999%, 2/1/286 | | | 11,966 | | | | 2,392 | |
| Series 243, Cl. 6, 4.748%, 12/15/326 | | | 33,187 | | | | 6,320 | |
| Series 304, Cl. C47, 5.341%, 12/15/276 | | | 77,452 | | | | 6,785 | |
| |
| Federal Home Loan Mortgage Corp., | |
| Mtg.-Linked Amortizing Global Debt | |
| Securities, Series2012-1, Cl. A10, 2.06%, 1/15/22 | | | 117,275 | | | | 115,461 | |
| |
| Federal Home Loan Mortgage Corp., | |
| Multifamily Structured Pass-Through | |
| Certificates, Interest-Only Stripped | | | | | | | | |
| Mtg.-Backed Security, Series KC02, Cl. | | | | | | | | |
| X1, 0.00%, 3/25/246,7 | | | 4,866,292 | | | | 89,787 | |
| |
| Federal Home Loan Mortgage Corp., | |
| Principal-Only Stripped Mtg.-Backed | |
| Security, Series 176, Cl. PO, 4.198%, 6/1/268 | | | 12,827 | | | | 11,792 | |
| |
| Federal Home Loan Mortgage Corp., Real Estate Mtg. Investment Conduit Multiclass | |
| Pass-Through Certificates: | | | | | | | | |
| Series 2427, Cl. ZM, 6.50%, 3/15/32 | | | 77,577 | | | | 84,332 | |
| Series 2461, Cl. PZ, 6.50%, 6/15/32 | | | 30,801 | | | | 33,639 | |
| Series 2626, Cl. TB, 5.00%, 6/15/33 | | | 45,878 | | | | 47,507 | |
| Series 2635, Cl. AG, 3.50%, 5/15/32 | | | 25,817 | | | | 25,889 | |
| Series 2770, Cl. TW, 4.50%, 3/15/19 | | | 295 | | | | 295 | |
| Series 3010, Cl. WB, 4.50%, 7/15/20 | | | 3,527 | | | | 3,535 | |
| Series 3025, Cl. SJ, 15.748%[-3.667 x LIBOR01M+2,475], 8/15/354 | | | 11,158 | | | | 15,947 | |
| Series 3030, Cl. FL, 2.855% [LIBOR01M+40], 9/15/354 | | | 58,982 | | | | 59,242 | |
| Series 3815, Cl. BD, 3.00%, 10/15/20 | | | 11 | | | | 11 | |
| Series 3822, Cl. JA, 5.00%, 6/15/40 | | | 18,247 | | | | 18,598 | |
| Series 3848, Cl. WL, 4.00%, 4/15/40 | | | 53,338 | | | | 53,883 | |
| Series 3857, Cl. GL, 3.00%, 5/15/40 | | | 3,617 | | | | 3,659 | |
| Series 4221, Cl. HJ, 1.50%, 7/15/23 | | | 344,918 | | | | 336,766 | |
| |
| Federal Home Loan Mortgage Corp., Real Estate Mtg. Investment Conduit Multiclass | |
| Pass-Through Certificates, Interest-Only Stripped Mtg.-Backed Security: | | | | | |
| Series 2130, Cl. SC, 53.306%, 3/15/296 | | | 30,672 | | | | 3,961 | |
10 OPPENHEIMER CONSERVATIVE BALANCED FUND/VA
| | | | | | | | |
| | | Principal
Amount | | | Value | |
| |
| FHLMC/FNMA/FHLB/Sponsored (Continued) | | | | | |
| |
| Federal Home Loan Mortgage Corp., Real Estate Mtg. Investment Conduit Multiclass | |
| Pass-Through Certificates, Interest-Only Stripped Mtg.-Backed Security: (Continued) | |
| Series 2796, Cl. SD, 45.057%, 7/15/266 | | $ | 55,671 | | | $ | 6,361 | |
| Series 2920, Cl. S, 11.728%, 1/15/356 | | | 317,108 | | | | 44,761 | |
| Series 2922, Cl. SE, 16.20%, 2/15/356 | | | 18,803 | | | | 2,447 | |
| Series 2981, Cl. AS, 0.452%, 5/15/356 | | | 162,341 | | | | 19,514 | |
| Series 3397, Cl. GS, 0.00%, 12/15/376,7 | | | 20,730 | | | | 3,395 | |
| Series 3424, Cl. EI, 0.00%, 4/15/386,7 | | | 8,041 | | | | 715 | |
| Series 3450, Cl. BI, 7.453%, 5/15/386 | | | 56,083 | | | | 7,624 | |
| Series 3606, Cl. SN, 11.713%, 12/15/396 | | | 29,356 | | | | 3,562 | |
| Series 4057, Cl. QI, 4.996%, 6/15/276 | | | 541,377 | | | | 42,259 | |
| Series 4205, Cl. AI, 0.00%, 5/15/286,7 | | | 131,264 | | | | 9,963 | |
| Series 4818, Cl. BI, 0.00%, 3/15/456,7 | | | 205,535 | | | | 36,812 | |
| |
| Federal National Mortgage Assn.: | | | | | | | | |
| 2.50%, 1/1/349 | | | 1,690,000 | | | | 1,650,640 | |
| 3.00%,1/1/34-1/1/499 | | | 3,460,000 | | | | 3,407,992 | |
| 3.50%,1/1/34-1/1/499 | | | 10,665,000 | | | | 10,695,652 | |
| 4.00%,1/1/34-1/1/499 | | | 6,870,000 | | | | 7,010,706 | |
| 4.50%, 1/1/499 | | | 6,355,000 | | | | 6,584,715 | |
| 5.00%, 1/1/499 | | | 3,315,000 | | | | 3,473,931 | |
| |
| Federal National Mortgage Assn. Pool: | | | | | | | | |
| 5.00%, 3/1/21 | | | 370 | | | | 376 | |
| 5.50%, 9/1/20 | | | 725 | | | | 730 | |
| 6.00%, 3/1/37 | | | 100,836 | | | | 110,115 | |
| 7.00%, 10/1/35 | | | 3,070 | | | | 3,066 | |
| 7.50%, 1/1/33 | | | 44,495 | | | | 51,477 | |
| 8.50%, 7/1/32 | | | 1,402 | | | | 1,419 | |
| |
| Federal National Mortgage Assn., Interest-Only Stripped Mtg.-Backed Security: | |
| Series 222, Cl. 2, 99.999%, 6/25/236 | | | 76,237 | | | | 8,472 | |
| Series 233, Cl. 2, 64.328%, 8/25/236 | | | 46,737 | | | | 5,749 | |
| Series 252, Cl. 2, 99.999%, 11/25/236 | | | 64,046 | | | | 8,154 | |
| Series 319, Cl. 2, 19.886%, 2/25/326 | | | 19,535 | | | | 4,367 | |
| Series 320, Cl. 2, 57.111%, 4/25/326 | | | 7,220 | | | | 1,682 | |
| Series 321, Cl. 2, 26.176%, 4/25/326 | | | 70,788 | | | | 16,628 | |
| Series 331, Cl. 9, 19.547%, 2/25/336 | | | 82,913 | | | | 16,483 | |
| Series 334, Cl. 17, 29.608%, 2/25/336 | | | 45,132 | | | | 10,771 | |
| Series 339, Cl. 12, 0.00%, 6/25/336,7 | | | 60,814 | | | | 11,832 | |
| Series 339, Cl. 7, 0.00%, 11/25/336,7 | | | 171,953 | | | | 37,415 | |
| Series 343, Cl. 13, 0.00%, 9/25/336,7 | | | 63,832 | | | | 11,565 | |
| Series 345, Cl. 9, 0.00%, 1/25/346,7 | | | 58,899 | | | | 13,330 | |
| Series 351, Cl. 10, 0.00%, 4/25/346,7 | | | 7,784 | | | | 1,640 | |
| Series 351, Cl. 8, 0.00%, 4/25/346,7 | | | 27,693 | | | | 5,410 | |
| Series 356, Cl. 10, 0.00%, 6/25/356,7 | | | 18,843 | | | | 3,810 | |
| Series 356, Cl. 12, 0.00%, 2/25/356,7 | | | 10,152 | | | | 2,196 | |
| Series 362, Cl. 13, 0.00%, 8/25/356,7 | | | 72,021 | | | | 14,834 | |
| Series 364, Cl. 16, 0.00%, 9/25/356,7 | | | 52,157 | | | | 10,543 | |
| |
| Federal National Mortgage Assn., Real Estate Mtg. Investment Conduit Multiclass | |
| Pass-Through Certificates: | | | | | | | | |
| Series1998-61, Cl. PL, 6.00%, | | | | | | | | |
| 11/25/28 | | | 30,813 | | | | 33,456 | |
| Series2003-130, Cl. CS, 9.088%[-2 x | | | | | | | | |
| LIBOR01M+1,410], 12/25/334 | | | 1,910 | | | | 1,950 | |
| Series2004-25, Cl. PC, 5.50%, 1/25/34 | | | 5,615 | | | | 5,614 | |
| Series2005-104, Cl. MC, 5.50%, | | | | | | | | |
| 12/25/25 | | | 110,584 | | | | 114,720 | |
| Series2005-31, Cl. PB, 5.50%, 4/25/35 | | | 250,000 | | | | 273,700 | |
| Series2005-73, Cl. DF, 2.756% | | | | | | | | |
| [LIBOR01M+25], 8/25/354 | | | 48,613 | | | | 48,782 | |
| Series2006-11, Cl. PS, 15.377% | | | | | | | | |
| [-3.667 x LIBOR01M+2,456.67], | | | | | | | | |
| 3/25/364 | | | 46,706 | | | | 67,133 | |
| Series2006-46, Cl. SW, 15.01% | | | | | | | | |
| [-3.667 x LIBOR01M+2,419.92], | | | | | | | | |
| 6/25/364 | | | 31,000 | | | | 42,891 | |
| Series2006-50, Cl. KS, 15.01%[-3.667 | | | | | | | | |
| x LIBOR01M+2,420], 6/25/364 | | | 6,182 | | | | 8,727 | |
| Series2008-75, Cl. DB, 4.50%, 9/25/23 | | | 102 | | | | 102 | |
| | | | | | | | |
| | | Principal
Amount | | | Value | |
| |
FHLMC/FNMA/FHLB/Sponsored (Continued) | | | | | |
| |
| Federal National Mortgage Assn., Real Estate Mtg. Investment Conduit Multiclass | |
| Pass-Through Certificates: (Continued) | | | | | | | | |
| Series2009-113, Cl. DB, 3.00%, | | | | | | | | |
| 12/25/20 | | $ | 5,735 | | | $ | 5,709 | |
| Series2009-36, Cl. FA, 3.446% | | | | | | | | |
| [LIBOR01M+94], 6/25/374 | | | 24,894 | | | | 25,459 | |
| Series2009-70, Cl. TL, 4.00%, 8/25/19 | | | 506 | | | | 505 | |
| Series2010-43, Cl. KG, 3.00%, 1/25/21 | | | 6,274 | | | | 6,262 | |
| Series2011-15, Cl. DA, 4.00%, 3/25/41 | | | 12,972 | | | | 13,088 | |
| Series2011-3, Cl. EL, 3.00%, 5/25/20 | | | 5,583 | | | | 5,561 | |
| Series2011-3, Cl. KA, 5.00%, 4/25/40 | | | 86,797 | | | | 90,474 | |
| Series2011-38, Cl. AH, 2.75%, 5/25/20 | | | 3 | | | | 3 | |
| Series2011-82, Cl. AD, 4.00%, 8/25/26 | | | 25,628 | | | | 25,573 | |
| |
| Federal National Mortgage Assn., Real Estate Mtg. Investment Conduit Multiclass | |
| Pass-Through Certificates, Interest-Only Stripped Mtg.-Backed Security: | | | | | |
| Series2001-65, Cl. S, 8.421%, 11/25/316 | | | 74,431 | | | | 13,879 | |
| Series2001-81, Cl. S, 12.051%, 1/25/326 | | | 19,298 | | | | 3,355 | |
| Series2002-47, Cl. NS, 7.51%, 4/25/326 | | | 53,772 | | | | 9,792 | |
| Series2002-51, Cl. S, 7.831%, 8/25/326 | | | 49,376 | | | | 8,992 | |
| Series2002-52, Cl. SD, 35.553%, 9/25/326 | | | 77,543 | | | | 14,567 | |
| Series2002-77, Cl. SH, 22.70%, 12/18/326 | | | 27,323 | | | | 4,368 | |
| Series2002-84, Cl. SA, 4.574%, 12/25/326 | | | 71,100 | | | | 11,535 | |
| Series2002-9, Cl. MS, 11.752%, 3/25/326 | | | 20,463 | | | | 3,856 | |
| Series2003-33, Cl. SP, 7.462%, 5/25/336 | | | 77,459 | | | | 14,922 | |
| Series2003-4, Cl. S, 1.941%, 2/25/336 | | | 42,521 | | | | 7,745 | |
| Series2003-46, Cl. IH, 0.00%, 6/25/236,7 | | | 112,521 | | | | 9,538 | |
| Series2004-54, Cl. DS, 44.841%, 11/25/306 | | | 57,863 | | | | 8,267 | |
| Series2004-56, Cl. SE, 4.265%, 10/25/336 | | | 14,850 | | | | 2,448 | |
| Series2005-12, Cl. SC, 18.53%, 3/25/356 | | | 8,429 | | | | 1,153 | |
| Series2005-14, Cl. SE, 10.962%, 3/25/356 | | | 28,975 | | | | 3,558 | |
| Series2005-40, Cl. SA, 20.194%, 5/25/356 | | | 156,401 | | | | 23,120 | |
| Series2005-52, Cl. JH, 19.884%, 5/25/356 | | | 390,798 | | | | 49,767 | |
| Series2005-93, Cl. SI, 0.00%, 10/25/356,7 | | | 34,554 | | | | 4,715 | |
| Series2007-88, Cl. XI, 0.00%, 6/25/376,7 | | | 75,798 | | | | 11,529 | |
| Series2008-55, Cl. SA, 0.00%, 7/25/386,7 | | | 29,591 | | | | 2,997 | |
| Series2009-8, Cl. BS, 0.00%, 2/25/246,7 | | | 267 | | | | 14 | |
| Series2011-96, Cl. SA, 4.547%, 10/25/416 | | | 98,264 | | | | 14,654 | |
| Series2012-121, Cl. IB, 7.743%, 11/25/276 | | | 230,953 | | | | 19,397 | |
| Series2012-134, Cl. SA, 0.157%, 12/25/426 | | | 376,153 | | | | 67,769 | |
| Series2012-40, Cl. PI, 8.283%, 4/25/416 | | | 193,427 | | | | 29,236 | |
| Series2018-16, Cl. NI, 0.00%, 12/25/446,7 | | | 105,181 | | | | 17,196 | |
| Series2018-69, Cl. CI, 0.00%, 10/25/466,7 | | | 231,277 | | | | 31,534 | |
11 OPPENHEIMER CONSERVATIVE BALANCED FUND/VA
STATEMENT OF INVESTMENTSContinued
| | | | | | | | |
| | | Principal
Amount | | | Value | |
| |
| FHLMC/FNMA/FHLB/Sponsored (Continued) | | | | | |
| |
| Federal National Mortgage Assn., | | | | | | | | |
| Real Estate Mtg. Investment Conduit | | | | | | | | |
| Multiclass Pass-Through Certificates, | | | | | | | | |
| Principal-Only Stripped Mtg.-Backed | | | | | | | | |
| Security, Series1993-184, Cl. M, 5.343%, 9/25/238 | | $ | 27,773 | | | $ | 25,985 | |
| | | | | | | | |
| | | | | | | 35,778,062 | |
|
| |
| GNMA/Guaranteed—2.8% | | | | | | | | |
| |
| Federal Home Loan Mortgage Corp., | | | | | | | | |
| Series 2018-HQA2, Cl. M1, 3.256% | | | | | | | | |
| [US0001M+75], 10/25/483,4 | | | 395,000 | | | | 394,233 | |
| |
| Government National Mortgage Assn. I Pool: | | | | | |
| 7.00%, 1/15/24 | | | 9,439 | | | | 9,491 | |
| 7.50%,1/15/23-6/15/24 | | | 13,513 | | | | 13,731 | |
| 8.00%, 4/15/23 | | | 5,335 | | | | 5,534 | |
| |
| Government National Mortgage Assn. II | | | | | | | | |
| Pool, 3.50%, 1/1/499 | | | 4,465,000 | | | | 4,495,798 | |
| |
| Government National Mortgage Assn., Interest-Only Stripped Mtg.-Backed Security: | |
| Series2002-15, Cl. SM, 79.829%, 2/16/326 | | | 82,618 | | | | 773 | |
| Series2002-76, Cl. SY, 0.00%, 12/16/266,7 | | | 138,701 | | | | 302 | |
| Series2007-17, Cl. AI, 37.105%, 4/16/376 | | | 257,578 | | | | 35,810 | |
| Series2011-52, Cl. HS, 18.162%, 4/16/416 | | | 124,765 | | | | 17,324 | |
| Series2017-136, Cl. LI, 5.577%, 9/16/476 | | | 416,982 | | | | 86,730 | |
| | | | | | | | |
| | | | | | | 5,059,726 | |
|
| |
| Non-Agency—11.3% | | | | | | | | |
| |
| Commercial—5.9% | | | | | | | | |
| |
| BCAP LLC Trust, Series2011-R11, | | | | | | | | |
| Cl. 18A5, 4.79% [H15T1Y+210], 9/26/353,4 | | | 28,476 | | | | 28,545 | |
| |
| Benchmark Mortgage Trust, Interest-Only Commercial Mtg. Pass-Through | | | | | | | | |
| Certificates, Series2018-B1, Cl. XA, 0.00%, 1/15/516,7 | | | 2,193,564 | | | | 80,966 | |
| |
| CD Mortgage Trust, Interest-Only | | | | | | | | |
| Commercial Mtg. Pass-Through | | | | | | | | |
| Certificates, Series2017-CD6, Cl. XA, 0.00%, 11/13/506,7 | | | 881,886 | | | | 51,144 | |
| |
| Chase Mortgage Finance Trust, Series2005-A2, Cl. 1A3, 4.032%, 1/25/3610 | | | 103,493 | | | | 97,772 | |
| |
| Citigroup Commercial Mortgage Trust: | | | | | | | | |
| Series2012-GC8, Cl. AAB, 2.608%, 9/10/45 | | | 93,705 | | | | 92,980 | |
| Series 2014-GC21, Cl. AAB, 3.477%, 5/10/47 | | | 105,000 | | | | 106,496 | |
| |
| Citigroup Commercial Mortgage Trust, Interest-Only Commercial Mtg. Pass-Through Certificates: | |
| Series 2013-GC17, Cl. XA, 0.00%, 11/10/466,7 | | | 425,844 | | | | 18,188 | |
| Series2017-C4, Cl. XA, 11.937%, 10/12/506 | | | 2,355,328 | | | | 163,214 | |
| |
| COMM Mortgage Trust: | | | | | | | | |
| Series2013-CR6, Cl. AM, 3.147%, 3/10/463 | | | 255,000 | | | | 252,196 | |
| Series 2014-CR17, Cl. ASB, 3.598%, 5/10/47 | | | 255,000 | | | | 258,914 | |
| Series 2014-CR20, Cl. ASB, 3.305%, 11/10/47 | | | 70,000 | | | | 70,717 | |
| Series 2014-CR21, Cl. AM, 3.987%, 12/10/47 | | | 865,000 | | | | 875,750 | |
| Series 2014-LC15, Cl. AM, 4.198%, 4/10/47 | | | 140,000 | | | | 144,357 | |
| Series 2014-UBS6, Cl. AM, 4.048%, 12/10/47 | | | 495,000 | | | | 498,061 | |
| | | | | | | | |
| | | Principal
Amount | | | Value | |
| |
| Commercial (Continued) | | | | | | | | |
| COMM Mortgage Trust: (Continued) | | | | | | | | |
| Series 2015-CR22, Cl. A2, 2.856%, 3/10/48 | | $ | 125,000 | | | $ | 124,665 | |
| |
| COMM Mortgage Trust, Interest-Only | | | | | | | | |
| Stripped Mtg.-Backed Security, Series2012-CR5, Cl. XA, 0.00%, 12/10/456,7 | | | 321,685 | | | | 16,142 | |
| |
| CSMC Mortgage-Backed Trust, Series2006-6, Cl. 1A4, 6.00%, 7/25/36 | | | 125,670 | | | | 102,758 | |
| |
| First Horizon Alternative Mortgage | | | | | | | | |
| Securities Trust, Series2005-FA8, | | | | | | | | |
| Cl. 1A6, 3.156% [US0001M+65], 11/25/354 | | | 74,337 | | | | 55,545 | |
| |
| FREMF Mortgage Trust: | | | | | | | | |
| Series2010-K6, Cl. B, 5.367%, 12/25/463,10 | | | 60,000 | | | | 61,186 | |
| Series 2012-K710, Cl. B, 3.817%, 6/25/473,10 | | | 40,000 | | | | 39,975 | |
| Series 2012-K711, Cl. B, 3.558%, 8/25/453,10 | | | 15,000 | | | | 14,998 | |
| Series 2012-K711, Cl. C, 3.558%, 8/25/453,10 | | | 135,000 | | | | 134,841 | |
| Series2013-K25, Cl. C, 3.619%, 11/25/453,10 | | | 60,000 | | | | 58,995 | |
| Series2013-K26, Cl. C, 3.598%, 12/25/453,10 | | | 40,000 | | | | 39,287 | |
| Series2013-K27, Cl. C, 3.496%, 1/25/463,10 | | | 110,000 | | | | 107,569 | |
| Series2013-K28, Cl. C, 3.49%, 6/25/463,10 | | | 450,000 | | | | 439,746 | |
| Series 2013-K712, Cl. C, 3.358%, 5/25/453,10 | | | 75,000 | | | | 74,804 | |
| Series 2013-K713, Cl. C, 3.154%, 4/25/463,10 | | | 275,000 | | | | 273,956 | |
| Series 2014-K715, Cl. C, 4.124%, 2/25/463,10 | | | 180,000 | | | | 181,911 | |
| |
| GS Mortgage Securities Corp. Trust, | | | | | | | | |
| Series 2012-SHOP, Cl. A, 2.933%, 6/5/313 | | | 460,000 | | | | 459,109 | |
| |
| GS Mortgage Securities Trust: | | | | | | | | |
| Series2012-GC6, Cl. A3, 3.482%, 1/10/45 | | | 54,793 | | | | 55,402 | |
| Series 2013-GC12, Cl. AAB, 2.678%, 6/10/46 | | | 30,799 | | | | 30,488 | |
| Series 2013-GC16, Cl. AS, 4.649%, 11/10/46 | | | 65,000 | | | | 68,557 | |
| Series 2014-GC18, Cl. AAB, 3.648%, 1/10/47 | | | 90,000 | | | | 90,989 | |
| |
| GSMSC Pass-Through Trust, Series2009-3R, Cl. 1A2, 6.00%, 4/25/373,10 | | | 203,724 | | | | 193,105 | |
| |
| JP Morgan Chase Commercial Mortgage Securities Trust: | | | | | |
| Series2012-C6, Cl. ASB, 3.144%, 5/15/45 | | | 130,793 | | | | 130,369 | |
| Series2012-LC9, Cl. A4, 2.611%, 12/15/47 | | | 11,934 | | | | 11,900 | |
| Series2013-C10, Cl. AS, 3.372%, 12/15/47 | | | 325,000 | | | | 321,724 | |
| Series2013-C16, Cl. AS, 4.517%, 12/15/46 | | | 330,000 | | | | 341,577 | |
| Series 2013-LC11, Cl. AS, 3.216%, 4/15/46 | | | 78,000 | | | | 76,594 | |
| Series2014-C20, Cl. AS, 4.043%, 7/15/47 | | | 245,000 | | | | 247,325 | |
| Series2016-JP3, Cl. A2, 2.435%, 8/15/49 | | | 208,421 | | | | 204,260 | |
| |
| JP Morgan Mortgage Trust, Series2007-A1, Cl. 5A1, 4.327%, 7/25/3510 | | | 78,989 | | | | 81,136 | |
| |
| JP Morgan Resecuritization Trust, Series2009-5, Cl. 1A2, 4.434%, 7/26/363,10 | | | 105,761 | | | | 106,013 | |
12 OPPENHEIMER CONSERVATIVE BALANCED FUND/VA
| | | | | | | | |
| | | Principal
Amount | | | Value | |
| |
Commercial (Continued) | | | | | | | | |
| |
| JPMBB Commercial Mortgage Securities Trust: | | | | | |
| Series2013-C17,Cl. ASB, 3.705%, 1/15/47 | | $ | 72,756 | | | $ | 73,572 | |
| Series2014-C18,Cl. A2, 2.879%, 2/15/47 | | | 5,813 | | | | 5,805 | |
| Series2014-C18,Cl. A3, 3.578%, 2/15/47 | | | 115,000 | | | | 115,415 | |
| Series2014-C19,Cl. ASB, 3.584%, 4/15/47 | | | 45,000 | | | | 45,273 | |
| Series2014-C24,Cl. B, 4.116%, 11/15/4710 | | | 270,000 | | | | 268,350 | |
| Series2014-C25,Cl. AS, 4.065%, 11/15/47 | | | 105,000 | | | | 105,947 | |
| Series2014-C26,Cl. AS, 3.80%, 1/15/48 | | | 250,000 | | | | 248,797 | |
| |
| JPMBB Commercial Mortgage Securities Trust., Interest-Only Stripped Mtg.-Backed Security, Series2015-C27, Cl. XA, 0.00%, 2/15/486,7 | | | 2,936,804 | | | | 143,842 | |
| |
| MASTR Adjustable Rate Mortgages Trust, Series2004-13, Cl. 2A2, 4.67%, 4/21/3410 | | | 27,162 | | | | 27,815 | |
| |
| Morgan Stanley Bank of America Merrill Lynch Trust: | | | | | |
| Series2013-C7,Cl. AAB, 2.469%, 2/15/46 | | | 90,984 | | | | 89,909 | |
| Series2013-C9,Cl. AS, 3.456%, 5/15/46 | | | 240,000 | | | | 239,712 | |
| Series2014-C19,Cl. AS, 3.832%, 12/15/47 | | | 720,000 | | | | 724,157 | |
| |
| Morgan Stanley Capital I Trust: | | | | | | | | |
| Series2011-C1,Cl. A4, 5.033%, 9/15/473,10 | | | 45,593 | | | | 46,760 | |
| Series2011-C2,Cl. A4, 4.661%, 6/15/443 | | | 70,000 | | | | 72,306 | |
| |
| Morgan Stanley Capital I, Inc., Interest- Only Commercial Mtg. Pass-Through Certificates, Series2017-HR2, Cl. XA, 0.00%, 12/15/506,7 | | | 770,558 | | | | 43,057 | |
| |
| Morgan StanleyRe-Remic Trust, Series2012-R3, Cl. 1B, 3.667%, 11/26/363,10 | | | 243,309 | | | | 222,823 | |
| |
| Morgan Stanley Resecuritization Trust, Series2013-R9, Cl. 3A, 3.60%, 6/26/463,10 | | | 100,179 | | | | 99,976 | |
| |
| RBSSP Resecuritization Trust, Series2010-1, Cl. 2A1, 4.044%, 7/26/453,10 | | | 14,026 | | | | 14,360 | |
| |
| Structured Adjustable Rate Mortgage Loan Trust, Series2004-10, Cl. 2A, 4.30%, 8/25/3410 | | | 136,241 | | | | 136,214 | |
| |
| UBS Commercial Mortgage Trust, Interest-Only Commercial Mtg. Pass-Through Certificates, Series2017-C5, Cl. XA, 0.00%, 11/15/506,7 | | | 1,519,327 | | | | 95,545 | |
| |
| Wells Fargo Commercial Mortgage Trust, Series 2015-NXS1, Cl. ASB, 2.934%, 5/15/48 | | | 355,000 | | | | 352,926 | |
| |
| Wells Fargo Commercial Mortgage Trust, Interest-Only Commercial Mtg. Pass-Through Certificates, Series 2017-C42, Cl. XA, 0.00%, 12/15/506,7 | | | 1,075,771 | | | | 68,507 | |
| |
| WF-RBS Commercial Mortgage Trust: | | | | | | | | |
| Series2013-C14,Cl. AS, 3.488%, 6/15/46 | | | 155,000 | | | | 154,644 | |
| Series2014-C20,Cl. AS, 4.176%, 5/15/47 | | | 150,000 | | | | 154,932 | |
| Series2014-C22,Cl. A3, 3.528%, 9/15/57 | | | 45,000 | | | | 45,449 | |
| Series 2014-LC14,Cl. AS, 4.351%, 3/15/4710 | | | 165,000 | | | | 167,822 | |
| | | | | | | | |
| | | Principal
Amount | | | Value | |
| |
Commercial (Continued) | | | | | | | | |
| |
WF-RBS Commercial Mortgage Trust, Interest-Only Commercial Mtg. Pass- Through Certificates, Series2011-C3,
Cl. XA, 0.00%, 3/15/443,6,7 | | $ | 2,051,258 | | | $ | 51,435 | |
| | | | | | | | |
| | | | | | | 10,699,576 | |
|
| |
Multi-Family—0.2% | | | | | | | | |
| |
| Connecticut Avenue Securities: | | | | | | | | |
| Series2014-C02,Cl. 1M2, 5.106% [US0001M+260], 5/25/244 | | | 115,000 | | | | 120,579 | |
| Series2017-C04,Cl. 2M1, 3.356% [US0001M+85], 11/25/294 | | | 237,158 | | | | 237,227 | |
| | | | | | | | |
| | | | | | | 357,806 | |
|
| |
Residential—5.2% | | | | | | | | |
| |
| Alternative Loan Trust, Series 2005-29CB, Cl. A4, 5.00%, 7/25/35 | | | 197,048 | | | | 168,761 | |
| |
| Banc of America Funding Trust: | | | | | | | | |
| Series2007-1,Cl. 1A3, 6.00%, 1/25/37 | | | 42,471 | | | | 40,245 | |
| Series2007-C,Cl. 1A4, 4.173%, 5/20/3610 | | | 15,482 | | | | 14,931 | |
| Series2014-R7,Cl. 3A1, 4.607%, 3/26/363,10 | | | 58,853 | | | | 59,031 | |
| |
| Banc of America Mortgage Trust, Series2004-E, Cl. 2A6, 4.392%, 6/25/3410 | | | 46,424 | | | | 46,245 | |
| |
| Bear Stearns ARM Trust: | | | | | | | | |
| Series2005-9,Cl. A1, 4.73% [H15T1Y+230], 10/25/354 | | | 337,665 | | | | 341,059 | |
| Series2006-1,Cl. A1, 4.91% [H15T1Y+225], 2/25/364 | | | 122,623 | | | | 123,597 | |
| |
| CHL Mortgage Pass-Through Trust: | | | | | | | | |
| Series2005-26,Cl. 1A8, 5.50%, 11/25/35 | | | 57,565 | | | | 50,622 | |
| Series2006-6,Cl. A3, 6.00%, 4/25/36 | | | 34,827 | | | | 28,403 | |
| |
| Citigroup Mortgage Loan Trust, Inc., | | | | | | | | |
| Series2006-AR1, Cl. 1A1, 4.28% [H15T1Y+240], 10/25/354 | | | 326,908 | | | | 330,314 | |
| |
| Connecticut Avenue Securities: | | | | | | | | |
| Series2014-C03,Cl. 1M2, 5.506% [US0001M+300], 7/25/244 | | | 315,108 | | | | 331,581 | |
| Series2014-C03,Cl. 2M2, 5.406% [US0001M+290], 7/25/244 | | | 35,293 | | | | 36,931 | |
| Series2016-C03,Cl. 1M1, 4.506% [US0001M+200], 10/25/284 | | | 57,254 | | | | 57,723 | |
| Series2016-C07,Cl. 2M1, 3.806% [US0001M+130], 5/25/294 | | | 68,965 | | | | 69,048 | |
| Series2017-C02,Cl. 2M1, 3.656% [US0001M+115], 9/25/294 | | | 329,896 | | | | 330,730 | |
| Series2017-C03,Cl. 1M1, 3.456% [US0001M+95], 10/25/294 | | | 282,973 | | | | 283,298 | |
| Series2017-C06,Cl. 1M1, 3.256% [US0001M+75], 2/25/304 | | | 112,045 | | | | 111,964 | |
| Series2017-C07,Cl. 1M1, 3.156% [US0001M+65], 5/25/304 | | | 211,634 | | | | 211,218 | |
| Series2017-C07,Cl. 1M2, 4.906% [US0001M+240], 5/25/304 | | | 225,000 | | | | 226,940 | |
| Series2017-C07,Cl. 2M1, 3.156% [US0001M+65], 5/25/304 | | | 190,603 | | | | 190,311 | |
| Series2018-C01,Cl. 1M1, 3.106% [US0001M+60], 7/25/304 | | | 399,522 | | | | 398,265 | |
| Series2018-C02,Cl. 2M1, 3.156% [US0001M+65], 8/25/304 | | | 90,130 | | | | 90,050 | |
| Series2018-C03,Cl. 1M1, 3.186% [US0001M+68], 10/25/304 | | | 259,683 | | | | 259,121 | |
| Series2018-C04,Cl. 2M1, 3.256% [US0001M+75], 12/25/304 | | | 247,498 | | | | 247,371 | |
| Series2018-C05,Cl. 1M1, 3.226% [US0001M+72], 1/25/314 | | | 105,679 | | | | 105,468 | |
| Series2018-C06,Cl. 1M1, 3.056% [US0001M+55], 3/25/314 | | | 38,845 | | | | 38,736 | |
13 OPPENHEIMER CONSERVATIVE BALANCED FUND/VA
STATEMENT OF INVESTMENTSContinued
| | | | | | | | |
| | | Principal
Amount | | | Value |
| |
Residential (Continued) | | | | | | | | |
| |
| Connecticut Avenue Securities: (Continued) | | | | | |
| Series2018-C06,Cl. 2M1, 3.056% [US0001M+55], 3/25/314 | | $ | 48,312 | | | $ | 48,180 | |
| |
| GSR Mortgage Loan Trust, Series 2005-AR4, Cl. 6A1, 4.332%, 7/25/3510 | | | 17,450 | | | | 17,551 | |
| |
HomeBanc Mortgage Trust,
Series2005-3, Cl. A2, 2.816%
[US0001M+31], 7/25/354 | | | 19,948 | | | | 19,804 | |
| |
| RALI Trust, Series 2006-QS13, Cl. 1A8, 6.00%, 9/25/36 | | | 7,646 | | | | 6,724 | |
| |
| STACR Trust: | | | | | | | | |
| Series 2018-DNA2,Cl. M1, 3.306% [US0001M+80], 12/25/303,4 | | | 445,000 | | | | 444,679 | |
| Series 2018-DNA3,Cl. M1, 3.256% [US0001M+75], 9/25/483,4 | | | 75,000 | | | | 74,887 | |
| Series 2018-HRP2,Cl. M2, 3.756% [US0001M+125], 2/25/473,4 | | | 215,000 | | | | 215,173 | |
| |
| Structured Agency Credit Risk Debt Nts.: | | | | | |
| Series2013-DN2,Cl. M2, 6.756% [US0001M+425], 11/25/234 | | | 211,533 | | | | 230,538 | |
| Series2014-DN1,Cl. M2, 4.706% [US0001M+220], 2/25/244 | | | 40,960 | | | | 41,731 | |
| Series2014-DN1,Cl. M3, 7.006% [US0001M+450], 2/25/244 | | | 160,000 | | | | 179,575 | |
| Series2014-DN2,Cl. M3, 6.106% [US0001M+360], 4/25/244 | | | 185,000 | | | | 199,670 | |
| Series2014-HQ2,Cl. M3, 6.256% [US0001M+375], 9/25/244 | | | 335,000 | | | | 369,001 | |
| Series 2015-HQA2,Cl. M2, 5.306% [US0001M+280], 5/25/284 | | | 4,205 | | | | 4,289 | |
| Series 2016-DNA1,Cl. M2, 5.406% [US0001M+290], 7/25/284 | | | 32,747 | | | | 33,327 | |
| Series 2016-DNA4,Cl. M1, 3.306% [US0001M+80], 3/25/294 | | | 1,671 | | | | 1,671 | |
| Series 2016-DNA4,Cl. M3, 6.306% [US0001M+380], 3/25/294 | | | 355,000 | | | | 383,403 | |
| Series 2016-HQA3,Cl. M1, 3.306% [US0001M+80], 3/25/294 | | | 83,294 | | | | 83,315 | |
| Series 2016-HQA3,Cl. M3, 6.356% [US0001M+385], 3/25/294 | | | 120,000 | | | | 131,323 | |
| Series 2016-HQA4,Cl. M3, 6.406% [US0001M+390], 4/25/294 | | | 350,000 | | | | 383,849 | |
| Series 2017-HQA1,Cl. M1, 3.706% [US0001M+120], 8/25/294 | | | 433,390 | | | | 434,840 | |
| Series 2017-HQA2,Cl. M1, 3.306% [US0001M+80], 12/25/294 | | | 158,741 | | | | 158,684 | |
| Series 2018-DNA1,Cl. M1, 2.956% [US0001M+45], 7/25/304 | | | 599,400 | | | | 596,666 | |
| Series 2018-DNA1,Cl. M2, 4.306% [US0001M+180], 7/25/304 | | | 460,000 | | | | 442,671 | |
| |
| WaMu Mortgage Pass-Through Certificates Trust: | | | | | |
| Series 2003-AR10,Cl. A7, 4.487%, 10/25/3310 | | | 73,557 | | | | 74,500 | |
| Series 2005-AR14,Cl. 1A4, 4.215%, 12/25/3510 | | | 74,549 | | | | 73,768 | |
| Series 2005-AR16,Cl. 1A1, 4.28%, 12/25/3510 | | | 70,852 | | | | 70,865 | |
| |
| Wells Fargo Mortgage-Backed Securities Trust: | | | | | |
| Series2005-AR1,Cl. 1A1, 4.093%, 2/25/3510 | | | 12,436 | | | | 12,745 | |
| Series 2005-AR15,Cl. 1A2, 4.671%, 9/25/3510 | | | 82,021 | | | | 79,894 | |
| Series 2005-AR15,Cl. 1A6, 4.671%, 9/25/3510 | | | 157,188 | | | | 151,972 | |
| Series2005-AR4,Cl. 2A2, 4.252%, 4/25/3510 | | | 150,572 | | | | 151,748 | |
| Series 2006-AR10,Cl. 1A1, 4.309%, 7/25/3610 | | | 33,635 | | | | 32,916 | |
| | | | | | | | |
| | | Principal
Amount | | | Value | |
| |
Residential (Continued) | | | | | | | | |
| |
| Wells Fargo Mortgage-Backed Securities Trust: (Continued) | |
| Series 2006-AR10,Cl. 5A5, 4.434%, 7/25/3610 | | $ | 119,664 | | | $ | 119,618 | |
| Series2006-AR2,Cl. 2A3, 4.607%, 3/25/3610 | | | 15,136 | | | | 15,318 | |
| Series2006-AR7,Cl. 2A4, 4.334%, 5/25/3610 | | | 93,358 | | | | 95,645 | |
| Series2007-16,Cl. 1A1, 6.00%, 12/28/37 | | | 24,305 | | | | 24,091 | |
| | | | | | | | |
| | | | | | | 9,596,594 | |
| | | | | | | | |
| Total Mortgage-Backed Obligations (Cost $61,605,136) | | | | | | | 61,491,764 | |
|
| |
U.S. Government Obligation—0.3% | | | | | | | | |
| |
| United States Treasury Nts., 1.50%, 5/31/1911,12(Cost $552,305) | | | 552,000 | | | | 549,780 | |
|
| |
Non-Convertible Corporate Bonds and Notes—35.5% | |
| |
Consumer Discretionary—5.6% | | | | | | | | |
| |
Automobiles—1.3% | | | | | | | | |
| |
| Daimler Finance North America LLC, 3.75% Sr. Unsec. Nts., 11/5/213 | | | 279,000 | | | | 280,047 | |
| |
| General Motors Co., 6.25% Sr. Unsec. Nts., 10/2/43 | | | 82,000 | | | | 77,178 | |
| |
| General Motors Financial Co., Inc.: | | | | | | | | |
| 4.15% Sr. Unsec. Nts., 6/19/23 | | | 289,000 | | | | 281,858 | |
| 4.20% Sr. Unsec. Nts., 11/6/21 | | | 259,000 | | | | 259,039 | |
| |
| Harley-Davidson Financial Services, Inc., 2.40% Sr. Unsec. Nts., 6/15/203 | | | 337,000 | | | | 330,881 | |
| |
| Hyundai Capital America: | | | | | | | | |
| 1.75% Sr. Unsec. Nts., 9/27/193 | | | 260,000 | | | | 256,734 | |
| 4.125% Sr. Unsec. Nts., 6/8/233 | | | 336,000 | | | | 336,700 | |
| |
| Nissan Motor Acceptance Corp., 3.65% Sr. Unsec. Nts., 9/21/213 | | | 326,000 | | | | 324,532 | |
| |
| Volkswagen Group of America Finance LLC, 4.00% Sr. Unsec. Nts., 11/12/213 | | | 311,000 | | | | 311,832 | |
| | | | | | | | |
| | | | | | | 2,458,801 | |
|
| |
Diversified Consumer Services—0.2% | | | | | |
| |
| Service Corp. International, 4.625% Sr. Unsec. Nts., 12/15/27 | | | 322,000 | | | | 303,888 | |
|
| |
Entertainment—0.1% | | | | | | | | |
| |
| 21st Century Fox America, Inc., 4.75% Sr. Unsec. Nts., 11/15/46 | | | 125,000 | | | | 136,272 | |
| |
| Viacom, Inc., 4.375% Sr. Unsec. Nts., 3/15/43 | | | 105,000 | | | | 83,623 | |
| | | | | | | | |
| | | | | | | 219,895 | |
|
| |
Hotels, Restaurants & Leisure—0.3% | | | | | |
| |
| Aramark Services, Inc., 5.00% Sr. Unsec. Nts., 4/1/253 | | | 299,000 | | | | 293,020 | |
| |
| Royal Caribbean Cruises Ltd., 2.65% Sr. Unsec. Nts., 11/28/20 | | | 305,000 | | | | 299,482 | |
| | | | | | | | |
| | | | | | | 592,502 | |
|
| |
Household Durables—0.8% | | | | | | | | |
| |
| DR Horton, Inc., 2.55% Sr. Unsec. Nts., 12/1/20 | | | 334,000 | | | | 326,047 | |
| |
| Lennar Corp., 4.75% Sr. Unsec. Nts., 5/30/25 | | | 343,000 | | | | 322,849 | |
| |
| Newell Brands, Inc., 5.00% Sr. Unsec. Nts., 11/15/23 | | | 194,000 | | | | 197,514 | |
| |
| PulteGroup, Inc., 5.00% Sr. Unsec. Nts., 1/15/27 | | | 258,000 | | | | 234,457 | |
| |
| Toll Brothers Finance Corp.: | | | | | | | | |
| 4.375% Sr. Unsec. Nts., 4/15/23 | | | 298,000 | | | | 280,865 | |
| 4.875% Sr. Unsec. Nts., 3/15/27 | | | 45,000 | | | | 40,950 | |
| | | | | | | | |
| | | | | | | 1,402,682 | |
14 OPPENHEIMER CONSERVATIVE BALANCED FUND/VA
| | | | | | | | |
| | | Principal
Amount | | | Value | |
| |
Internet & Catalog Retail—0.4% | | | | | |
| |
| Amazon.com, Inc., 4.95% Sr. Unsec. Nts., 12/5/44 | | $ | 119,000 | | | $ | 132,399 | |
| |
| QVC, Inc., 4.45% Sr. Sec. Nts., 2/15/25 | | | 595,000 | | | | 549,271 | |
| | | | | | | | |
| | | | | | | 681,670 | |
|
| |
Media—1.3% | | | | | | | | |
| |
| Charter Communications Operating | | | | | | | | |
| LLC/Charter Communications Operating Capital, 5.375% Sr. Sec. Nts., 5/1/47 | | | 68,000 | | | | 61,908 | |
| |
| Comcast Cable Communications Holdings, Inc., 9.455% Sr. Unsec. Nts., 11/15/22 | | | 318,000 | | | | 386,526 | |
| |
| Comcast Corp.: | | | | | | | | |
| 3.95% Sr. Unsec. Nts., 10/15/25 | | | 220,000 | | | | 222,898 | |
| 4.00% Sr. Unsec. Nts., 3/1/48 | | | 176,000 | | | | 161,009 | |
| |
| Interpublic Group of Cos., Inc. (The): 3.75% Sr. Unsec. Nts., 10/1/21 | | | 265,000 | | | | 266,736 | |
| 4.20% Sr. Unsec. Nts., 4/15/24 | | | 330,000 | | | | 330,190 | |
| |
| Sky Ltd., 3.75% Sr. Unsec. Nts., 9/16/243 | | | 161,000 | | | | 160,602 | |
| |
| Time Warner Cable LLC, 4.50% Sr. Unsec. Unsub. Nts., 9/15/42 | | | 111,000 | | | | 89,636 | |
| |
| Virgin Media Secured Finance plc, 5.25% Sr. Sec. Nts., 1/15/263 | | | 318,000 | | | | 292,560 | |
| |
| WPP Finance 2010, 3.75% Sr. Unsec. Nts., 9/19/24 | | | 371,000 | | | | 347,122 | |
| | | | | | | | |
| | | | | | | 2,319,187 | |
|
| |
Specialty Retail—0.9% | | | | | |
| |
| AutoNation, Inc., 5.50% Sr. Unsec. Nts., 2/1/20 | | | 306,000 | | | | 312,765 | |
| |
| AutoZone, Inc., 1.625% Sr. Unsec. Nts., 4/21/19 | | | 68,000 | | | | 67,673 | |
| |
| Best Buy Co., Inc., 5.50% Sr. Unsec. Nts., 3/15/21 | | | 324,000 | | | | 334,229 | |
| |
| L Brands, Inc., 5.625% Sr. Unsec. Nts., 2/15/22 | | | 295,000 | | | | 295,000 | |
| |
| Ross Stores, Inc., 3.375% Sr. Unsec. Nts., 9/15/24 | | | 344,000 | | | | 338,197 | |
| |
| Signet UK Finance plc, 4.70% Sr. Unsec. Nts., 6/15/24 | | | 356,000 | | | | 315,950 | |
| | | | | | | | |
| | | | | | | 1,663,814 | |
|
| |
Textiles, Apparel & Luxury Goods—0.3% | | | | | |
| |
| Hanesbrands, Inc., 4.875% Sr. Unsec. Nts., 5/15/263 | | | 320,000 | | | | 290,000 | |
| |
| Levi Strauss & Co., 5.00% Sr. Unsec. Nts., 5/1/25 | | | 274,000 | | | | 269,205 | |
| | | | | | | | |
| | | | | | | 559,205 | |
|
| |
Consumer Staples—3.6% | | | | | | | | |
| |
Beverages—0.9% | | | | | | | | |
| |
| Anheuser-Busch Cos LLC/Anheuser- Busch InBev Worldwide, Inc., 3.65% Sr. Unsec. Nts., 2/1/263 | | | 57,000 | | | | 53,928 | |
| |
| Anheuser-Busch InBev Worldwide, Inc., 8.20% Sr. Unsec. Unsub. Nts., 1/15/39 | | | 197,000 | | | | 254,241 | |
| |
| Bacardi Ltd., 4.70% Sr. Unsec. Nts., 5/15/283 | | | 171,000 | | | | 164,731 | |
| |
| Keurig Dr Pepper, Inc.: | | | | | | | | |
| 4.057% Sr. Unsec. Nts., 5/25/233 | | | 305,000 | | | | 304,044 | |
| 4.597% Sr. Unsec. Nts., 5/25/283 | | | 172,000 | | | | 171,126 | |
| |
| Molson Coors Brewing Co., 2.10% Sr. Unsec. Nts., 7/15/21 | | | 324,000 | | | | 312,563 | |
| |
| Pernod Ricard SA, 4.25% Sr. Unsec. Nts., 7/15/223 | | | 325,000 | | | | 329,944 | |
| | | | | | | | |
| | | | | | | 1,590,577 | |
|
| |
Food & Staples Retailing—0.2% | | | | | | | | |
| |
| Alimentation Couche-Tard, Inc., 2.35% Sr. Unsec. Nts., 12/13/193 | | | 364,000 | | | | 360,694 | |
| | | | | | | | |
| | | Principal
Amount | | | Value | |
| |
Food & Staples Retailing (Continued) | |
| |
| Kroger Co. (The): | | | | | | | | |
| 2.00% Sr. Unsec. Nts., 1/15/19 | | $ | 9,000 | | | $ | 8,996 | |
| 4.45% Sr. Unsec. Nts., 2/1/47 | | | 93,000 | | | | 81,898 | |
| | | | | | | | |
| | | | | | | 451,588 | |
|
| |
Food Products—1.8% | | | | | | | | |
| |
| Bunge Ltd. Finance Corp.: | | | | | | | | |
| 3.25% Sr. Unsec. Nts., 8/15/26 | | | 232,000 | | | | 203,710 | |
| 3.50% Sr. Unsec. Nts., 11/24/20 | | | 333,000 | | | | 332,280 | |
| |
| Campbell Soup Co., 3.30% Sr. Unsec. Nts., 3/15/21 | | | 338,000 | | | | 336,408 | |
| |
| Conagra Brands, Inc.: | | | | | | | | |
| 3.80% Sr. Unsec. Nts., 10/22/21 | | | 252,000 | | | | 252,244 | |
| 4.60% Sr. Unsec. Nts., 11/1/25 | | | 317,000 | | | | 318,599 | |
| |
| Kraft Heinz Foods Co.: | | | | | | | | |
| 2.80% Sr. Unsec. Nts., 7/2/20 | | | 332,000 | | | | 329,189 | |
| 3.95% Sr. Unsec. Nts., 7/15/25 | | | 188,000 | | | | 182,277 | |
| |
| Lamb Weston Holdings, Inc., 4.875% Sr. Unsec. Nts., 11/1/263 | | | 306,000 | | | | 295,290 | |
| |
| Mondelez International Holdings Netherlands BV, 2.00% Sr. Unsec. Nts., 10/28/213 | | | 339,000 | | | | 325,013 | |
| |
| Smithfield Foods, Inc.: | | | | | | | | |
| 2.70% Sr. Unsec. Nts., 1/31/203 | | | 148,000 | | | | 146,018 | |
| 3.35% Sr. Unsec. Nts., 2/1/223 | | | 183,000 | | | | 175,126 | |
| |
| Tyson Foods, Inc.: | | | | | | | | |
| 3.55% Sr. Unsec. Nts., 6/2/27 | | | 182,000 | | | | 169,895 | |
| 3.90% Sr. Unsec. Nts., 9/28/23 | | | 271,000 | | | | 270,895 | |
| | | | | | | | |
| | | | | | | 3,336,944 | |
|
| |
Tobacco—0.7% | | | | | | | | |
| |
Altria Group, Inc., 4.00% Sr. Unsec.
Nts., 1/31/24 | | | 238,000 | | | | 234,143 | |
| |
| BAT Capital Corp.: | | | | | | | | |
| 2.297% Sr. Unsec. Nts., 8/14/20 | | | 351,000 | | | | 342,770 | |
| 3.557% Sr. Unsec. Nts., 8/15/27 | | | 177,000 | | | | 157,504 | |
| |
| Imperial Brands Finance plc, 3.75% Sr. Unsec. Nts., 7/21/223 | | | 328,000 | | | | 325,610 | |
| |
| Imperial Tobacco Finance plc, 2.95% Sr. Unsec. Nts., 7/21/203 | | | 230,000 | | | | 226,613 | |
| | | | | | | | |
| | | | | | | 1,286,640 | |
|
| |
Energy—2.7% | | | | | | | | |
| |
Energy Equipment & Services—0.3% | | | | | |
| |
| Halliburton Co., 5.00% Sr. Unsec. Nts., 11/15/45 | | | 75,000 | | | | 74,537 | |
| |
| Helmerich & Payne, Inc., 4.65% Sr. Unsec. Nts., 3/15/253 | | | 201,000 | | | | 205,298 | |
| |
| Schlumberger Holdings Corp., 4.00% Sr. Unsec. Nts., 12/21/253 | | | 196,000 | | | | 193,843 | |
| | | | | | | | |
| | | | | | | 473,678 | |
|
| |
Oil, Gas & Consumable Fuels—2.4% | | | | | |
| |
| Anadarko Petroleum Corp., 4.50% Sr. Unsec. Nts., 7/15/44 | | | 72,000 | | | | 61,305 | |
| |
| Andeavor Logistics LP/Tesoro Logistics Finance Corp., 4.25% Sr. Unsec. Nts., 12/1/27 | | | 177,000 | | | | 167,489 | |
| |
| Apache Corp., 4.375% Sr. Unsec. Nts., 10/15/28 | | | 251,000 | | | | 235,062 | |
| |
| Columbia Pipeline Group, Inc.: | | | | | | | | |
| 3.30% Sr. Unsec. Nts., 6/1/20 | | | 324,000 | | | | 322,948 | |
| 4.50% Sr. Unsec. Nts., 6/1/25 | | | 168,000 | | | | 169,507 | |
| |
| ConocoPhillips Co.: | | | | | | | | |
| 4.95% Sr. Unsec. Nts., 3/15/26 | | | 37,000 | | | | 39,649 | |
| 5.95% Sr. Unsec. Nts., 3/15/46 | | | 75,000 | | | | 91,702 | |
| |
| Devon Energy Corp., 4.75% Sr. Unsec. Nts., 5/15/42 | | | 79,000 | | | | 68,632 | |
| |
| Energy Transfer LP, 4.25% Sr. Sec. Nts., 3/15/23 | | | 260,000 | | | | 250,900 | |
15 OPPENHEIMER CONSERVATIVE BALANCED FUND/VA
STATEMENT OF INVESTMENTSContinued
| | | | | | | | |
| | | Principal
Amount | | | Value | |
| |
| Oil, Gas & Consumable Fuels (Continued) | |
| |
| Energy Transfer Operating LP, 5.30% Sr. Unsec. Nts., 4/15/47 | | $ | 100,000 | | | $ | 88,545 | |
| |
| Enterprise Products Operating LLC: | | | | | | | | |
| 4.85% Sr. Unsec. Nts., 8/15/42 | | | 80,000 | | | | 77,390 | |
| 4.90% Sr. Unsec. Nts., 5/15/46 | | | 32,000 | | | | 31,150 | |
| |
| EQT Corp., 2.50% Sr. Unsec. Nts., 10/1/20 | | | 353,000 | | | | 345,258 | |
| |
| Kinder Morgan Energy Partners LP, 5.80% Sr. Unsec. Nts., 3/1/21 | | | 132,000 | | | | 137,819 | |
| |
| Kinder Morgan, Inc.: | | | | | | | | |
| 5.20% Sr. Unsec. Nts., 3/1/48 | | | 86,000 | | | | 82,612 | |
| 5.55% Sr. Unsec. Nts., 6/1/45 | | | 147,000 | | | | 146,262 | |
| |
| Marathon Petroleum Corp., 3.80% Sr. Unsec. Nts., 4/1/285 | | | 283,000 | | | | 266,245 | |
| |
| ONEOK Partners LP, 8.625% Sr. Unsec. Nts., 3/1/19 | | | 203,000 | | | | 204,446 | |
| |
| Pioneer Natural Resources Co., 3.45% Sr. Unsec. Nts., 1/15/21 | | | 347,000 | | | | 346,116 | |
| |
| Sabine Pass Liquefaction LLC: | | | | | | | | |
| 4.20% Sr. Sec. Nts., 3/15/28 | | | 180,000 | | | | 172,598 | |
| 5.625% Sr. Sec. Nts., 2/1/21 | | | 260,000 | | | | 267,938 | |
| |
| Shell International Finance BV, 4.00% Sr. Unsec. Nts., 5/10/46 | | | 115,000 | | | | 111,485 | |
| |
| Sunoco Logistics Partners Operations LP, 4.00% Sr. Unsec. Nts., 10/1/27 | | | 207,000 | | | | 190,249 | |
| |
| TransCanada PipeLines Ltd., 7.625% Sr. Unsec. Nts., 1/15/39 | | | 76,000 | | | | 95,026 | |
| |
| Williams Cos., Inc. (The): | | | | | | | | |
| 3.70% Sr. Unsec. Unsub. Nts., 1/15/23 | | | 334,000 | | | | 326,224 | |
| 3.75% Sr. Unsec. Nts., 6/15/27 | | | 140,000 | | | | 132,971 | |
| | | | | | | | |
| | | | | | | 4,429,528 | |
Financials—9.4% | | | | | | | | |
| |
Capital Markets—1.8% | | | | | | | | |
| |
| Blackstone Holdings Finance Co. LLC, 3.15% Sr. Unsec. Nts., 10/2/273 | | | 127,000 | | | | 119,818 | |
| |
| Brookfield Asset Management, Inc., 4.00% Sr. Unsec. Nts., 1/15/25 | | | 269,000 | | | | 262,770 | |
| |
| Credit Suisse AG (New York), 3.625% | | | | | | | | |
| Sr. Unsec. Nts., 9/9/24 | | | 197,000 | | | | 193,427 | |
| |
| Credit Suisse Group Funding Guernsey | | | | | | | | |
| Ltd., 4.55% Sr. Unsec. Nts., 4/17/26 | | | 154,000 | | | | 152,781 | |
| |
| E*TRADE Financial Corp., 5.875% | | | | | | | | |
| [US0003M+443.5] Jr. Sub. Perpetual | | | | | | | | |
| Bonds4,13 | | | 327,000 | | | | 295,117 | |
| |
| Goldman Sachs Group, Inc. (The): | | | | | | | | |
| 3.50% Sr. Unsec. Nts., 11/16/26 | | | 180,000 | | | | 166,513 | |
| 3.75% Sr. Unsec. Nts., 2/25/26 | | | 178,000 | | | | 168,666 | |
| 3.814% [US0003M+115.8] Sr. Unsec. | | | | | | | | |
| Nts., 4/23/294 | | | 286,000 | | | | 267,485 | |
| 4.017% [US0003M+137.3] Sr. Unsec. | | | | | | | | |
| Nts., 10/31/384 | | | 144,000 | | | | 126,916 | |
| |
| Morgan Stanley: | | | | | | | | |
| 4.375% Sr. Unsec. Nts., 1/22/47 | | | 232,000 | | | | 220,399 | |
| 5.00% Sub. Nts., 11/24/25 | | | 276,000 | | | | 281,964 | |
| |
| MSCI, Inc., 4.75% Sr. Unsec. Nts., 8/1/263 | | | 307,000 | | | | 291,650 | |
| |
| Northern Trust Corp., 3.375% | | | | | | | | |
| [US0003M+113.1] Sub. Nts., 5/8/324 | | | 125,000 | | | | 116,462 | |
| |
| Raymond James Financial, Inc., 3.625% | | | | | | | | |
| Sr. Unsec. Nts., 9/15/26 | | | 165,000 | | | | 155,830 | |
| |
| TD Ameritrade Holding Corp., 3.30% | | | | | | | | |
| Sr. Unsec. Nts., 4/1/27 | | | 208,000 | | | | 199,267 | |
| |
| UBS Group Funding Switzerland AG: | | | | | | | | |
| 4.125% Sr. Unsec. Nts., 4/15/263 | | | 160,000 | | | | 159,196 | |
| 4.253% Sr. Unsec. Nts., 3/23/283 | | | 147,000 | | | | 145,175 | |
| | | | | | | | |
| | | | | | | 3,323,436 | |
| | | | | | | | |
| |
| Principal
Amount |
| | | Value | |
| |
Commercial Banks—4.7% | | | | | | | | |
| |
| ABN AMRO Bank NV, 4.40% | | | | | | | | |
| [USSW5+219.7] Sub. Nts., 3/27/284,14 | | $ | 329,000 | | | $ | 322,531 | |
| |
| Bank of America Corp.: | | | | | | | | |
| 3.248% Sr. Unsec. Nts., 10/21/27 | | | 277,000 | | | | 256,444 | |
| 3.366% [US0003M+81] Sr. Unsec. | | | | | | | | |
| Nts., 1/23/264 | | | 286,000 | | | | 273,780 | |
| 3.824% [US0003M+157.5] Sr. Unsec. | | | | | | | | |
| Nts., 1/20/284 | | | 191,000 | | | | 185,579 | |
| 4.271% [US0003M+131] Sr. Unsec. | | | | | | | | |
| Nts., 7/23/294 | | | 271,000 | | | | 270,207 | |
| 7.75% Jr. Sub. Nts., 5/14/38 | | | 239,000 | | | | 310,261 | |
| |
| Bank of Ireland Group plc, 4.50% Sr. | | | | | | | | |
| Unsec. Nts., 11/25/233 | | | 263,000 | | | | 257,923 | |
| |
| BNP Paribas SA, 4.625% Sub. Nts., 3/13/273 | | | 198,000 | | | | 192,615 | |
| |
| BPCE SA, 4.50% Sub. Nts., 3/15/253 | | | 199,000 | | | | 192,920 | |
| |
| Citigroup, Inc.: | | | | | | | | |
| 4.075% [US0003M+119.2] Sr. Unsec. | | | | | | | | |
| Nts., 4/23/294 | | | 269,000 | | | | 262,829 | |
| 4.281% [US0003M+183.9] Sr. Unsec. | | | | | | | | |
| Nts., 4/24/484 | | | 356,000 | | | | 330,642 | |
| |
| Citizens Bank NA (Providence RI), 2.65% Sr. Unsec. Nts., 5/26/22 | | | 68,000 | | | | 66,117 | |
| |
| Compass Bank, 2.875% Sr. Unsec. Nts., 6/29/22 | | | 308,000 | | | | 295,360 | |
| |
| Credit Agricole SA, 4.375% Sub. Nts., 3/17/253 | | | 333,000 | | | | 322,834 | |
| |
| Fifth Third Bank (Cincinnati OH), 3.85% | | | | | | | | |
| Sub. Nts., 3/15/26 | | | 176,000 | | | | 173,624 | |
| |
| First Republic Bank, 4.375% Sub. Nts., 8/1/46 | | | 137,000 | | | | 127,072 | |
| |
| HSBC Holdings plc: | | | | | | | | |
| 3.95% [US0003M+98.72] Sr. Unsec. | | | | | | | | |
| Nts., 5/18/244 | | | 109,000 | | | | 108,470 | |
| 4.041% [US0003M+154.6] Sr. Unsec. | | | | | | | | |
| Nts., 3/13/284 | | | 135,000 | | | | 129,364 | |
| 4.583% [US0003M+153.46] Sr. Unsec. | | | | | | | | |
| Nts., 6/19/294 | | | 183,000 | | | | 181,711 | |
| |
| Huntington Bancshares, Inc., 4.00% Sr. | | | | | | | | |
| Unsec. Nts., 5/15/25 | | | 334,000 | | | | 336,233 | |
| |
| JPMorgan Chase & Co.: | | | | | | | | |
| 3.54% [US0003M+138] Sr. Unsec. | | | | | | | | |
| Nts., 5/1/284 | | | 272,000 | | | | 259,776 | |
| 3.782% [US0003M+133.7] Sr. Unsec. | | | | | | | | |
| Nts., 2/1/284 | | | 498,000 | | | | 484,177 | |
| 3.797% [US0003M+89] Sr. Unsec. | | | | | | | | |
| Nts., 7/23/244 | | | 335,000 | | | | 335,793 | |
| |
| KeyCorp, 4.15% Sr. Unsec. Nts., 10/29/25 | | | 106,000 | | | | 107,828 | |
| |
| Lloyds Banking Group plc, 6.657% | | | | | | | | |
| [US0003M+127] Jr. Sub. Perpetual | | | | | | | | |
| Bonds3,4,13 | | | 400,000 | | | | 394,248 | |
| |
| Nordea Bank Abp, 4.625% | | | | | | | | |
| [USSW5+169] Sub. Nts., 9/13/333,4 | | | 118,000 | | | | 114,807 | |
| |
| PNC Bank NA, 4.05% Sub. Nts., 7/26/28 | | | 237,000 | | | | 238,503 | |
| |
| PNC Financial Services Group, Inc. | | | | | | | | |
| (The), 3.15% Sr. Unsec. Nts., 5/19/27 | | | 253,000 | | | | 241,825 | |
| |
| Regions Financial Corp., 2.75% Sr. | | | | | | | | |
| Unsec. Nts., 8/14/22 | | | 187,000 | | | | 180,558 | |
| |
| Royal Bank of Canada, 3.70% Sr. | | | | | | | | |
| Unsec. Nts., 10/5/23 | | | 290,000 | | | | 291,333 | |
| |
| SunTrust Bank (Atlanta GA): | | | | | | | | |
| 3.30% Sub. Nts., 5/15/26 | | | 118,000 | | | | 111,986 | |
| 4.05% Sr. Unsec. Nts., 11/3/25 | | | 141,000 | | | | 143,588 | |
| |
| Synovus Financial Corp., 3.125% Sr. | | | | | | | | |
| Unsec. Nts., 11/1/22 | | | 194,000 | | | | 183,328 | |
16 OPPENHEIMER CONSERVATIVE BALANCED FUND/VA
| | | | | | | | |
| | | Principal
Amount | | | Value | |
| |
Commercial Banks (Continued) | | | | | |
| |
| Toronto-Dominion Bank (The), 3.50% | | | | | |
| Sr. Unsec. Nts., 7/19/23 | | $ | 268,000 | | | $ | 269,997 | |
| |
| US Bancorp: | | | | | | | | |
| 3.10% Sub. Nts., 4/27/26 | | | 210,000 | | | | 199,139 | |
| 3.15% Sr. Unsec. Nts., 4/27/27 | | | 65,000 | | | | 62,371 | |
| |
| Wells Fargo & Co.: | | | | | | | | |
| 3.584% [US0003M+131] Sr. Unsec. | | | | | | | | |
| Nts., 5/22/284 | | | 277,000 | | | | 266,375 | |
| 4.75% Sub. Nts., 12/7/46 | | | 172,000 | | | | 166,209 | |
| | | | | | | | |
| | | | | | | 8,648,357 | |
| |
Consumer Finance—0.6% | | | | | | | | |
| |
| American Express Co., 2.50% Sr. | | | | | |
| Unsec. Nts., 8/1/22 | | | 111,000 | | | | 107,220 | |
| |
| American Express Credit Corp., 3.30% | | | | | | | | |
| Sr. Unsec. Nts., 5/3/27 | | | 209,000 | | | | 203,600 | |
| |
| Capital One Financial Corp., 3.75% Sr. | | | | | |
| Unsec. Nts., 3/9/27 | | | 111,000 | | | | 103,330 | |
| |
| Discover Bank: | | | | | | | | |
| 3.10% Sr. Unsec. Nts., 6/4/20 | | | 235,000 | | | | 233,436 | |
| 4.65% Sr. Unsec. Nts., 9/13/28 | | | 122,000 | | | | 119,149 | |
| |
| Discover Financial Services, 3.75% Sr. | | | | | |
| Unsec. Nts., 3/4/25 | | | 143,000 | | | | 136,993 | |
| |
| Electricite de France SA, 6.50% Sr. | | | | | | | | |
| Unsec. Nts., 1/26/193 | | | 259,000 | | | | 259,837 | |
| | | | | | | | |
| | | | | | | 1,163,565 | |
| |
Diversified Financial Services—0.3% | |
| |
| Berkshire Hathaway Energy Co., 3.80% | | | | | |
| Sr. Unsec. Nts., 7/15/48 | | | 81,000 | | | | 72,994 | |
| |
| Peachtree Corners Funding Trust, 3.976% Sr. Unsec. Nts., 2/15/253 | | | 126,000 | | | | 122,437 | |
| |
| Voya Financial, Inc., 5.65% | | | | | | | | |
| [US0003M+358] Jr. Sub. Nts., 5/15/534 | | | 325,000 | | | | 306,248 | |
| | | | | | | | |
| | | | | | | 501,679 | |
| |
Insurance—1.0% | | | | | | | | |
| |
| Aflac, Inc., 4.75% Sr. Unsec. Nts., 1/15/49 | | | 109,000 | | | | 111,517 | |
| |
| AXA Equitable Holdings, Inc., 4.35% Sr. | | | | | |
| Unsec. Nts., 4/20/283 | | | 181,000 | | | | 171,468 | |
| |
| AXIS Specialty Finance plc, 5.15% Sr. | | | | | |
| Unsec. Nts., 4/1/45 | | | 179,000 | | | | 172,494 | |
| |
| Boardwalk Pipelines LP, 4.95% Sr. | | | | | | | | |
| Unsec. Nts., 12/15/24 | | | 162,000 | | | | 164,469 | |
| |
| Brighthouse Financial, Inc., 3.70% Sr. | | | | | |
| Unsec. Nts., 6/22/27 | | | 68,000 | | | | 57,591 | |
| |
| CNA Financial Corp., 3.45% Sr. Unsec. | | | | | |
| Nts., 8/15/27 | | | 255,000 | | | | 237,823 | |
| |
| Hartford Financial Services Group, Inc. | | | | | |
| (The), 4.40% Sr. Unsec. Nts., 3/15/48 | | | 209,000 | | | | 195,979 | |
| |
| Lincoln National Corp., 3.80% Sr. | | | | | | | | |
| Unsec. Nts., 3/1/28 | | | 207,000 | | | | 201,267 | |
| |
| Manulife Financial Corp., 4.061% | | | | | | | | |
| [USISDA05+164.7] Sub. Nts., 2/24/324 | | | 208,000 | | | | 196,585 | |
| |
| Marsh & McLennan Cos., Inc., 4.35% | | | | | | | | |
| Sr. Unsec. Nts., 1/30/47 | | | 113,000 | | | | 105,939 | |
| |
| Prudential Financial, Inc., 5.20% | | | | | | | | |
| [US0003M+304] Jr. Sub. Nts., 3/15/444 | | | 256,000 | | | | 240,000 | |
| | | | | | | | |
| | | | | | | 1,855,132 | |
| |
Real Estate Investment Trusts (REITs)—1.0% | |
| |
| American Tower Corp.: | | | | | | | | |
| 2.80% Sr. Unsec. Nts., 6/1/20 | | | 234,000 | | | | 232,247 | |
| 3.00% Sr. Unsec. Nts., 6/15/23 | | | 274,000 | | | | 263,877 | |
| 4.00% Sr. Unsec. Nts., 6/1/25 | | | 169,000 | | | | 166,102 | |
| |
| Crown Castle International Corp., 3.65% Sr. Unsec. Nts., 9/1/27 | | | 176,000 | | | | 163,550 | |
| |
| Digital Realty Trust LP: | | | | | | | | |
| 3.40% Sr. Unsec. Nts., 10/1/20 | | | 30,000 | | | | 29,911 | |
| | | | | | | | |
| | | Principal
Amount | | | Value | |
| |
Real Estate Investment Trusts (REITs) (Continued) | |
| Digital Realty Trust LP: (Continued) 5.875% Sr. Unsec. Nts., 2/1/20 | | $ | 125,000 | | | $ | 127,546 | |
| |
| Lamar Media Corp., 5.75% Sr. Unsec. | | | | | |
| Nts., 2/1/26 | | | 288,000 | | | | 292,680 | |
| |
| VEREIT Operating Partnership LP: | | | | | |
| 3.00% Sr. Unsec. Nts., 2/6/19 | | | 134,000 | | | | 133,923 | |
| 4.625% Sr. Unsec. Nts., 11/1/25 | | | 325,000 | | | | 326,214 | |
| | | | | | | | |
| | | | | | | 1,736,050 | |
| |
Health Care—3.5% | | | | | | | | |
| |
Biotechnology—0.7% | | | | | | | | |
| |
| AbbVie, Inc.: | | | | | | | | |
| 3.75% Sr. Unsec. Nts., 11/14/23 | | | 329,000 | | | | 327,676 | |
| 4.25% Sr. Unsec. Nts., 11/14/28 | | | 244,000 | | | | 237,494 | |
| |
| Amgen, Inc., 4.563% Sr. Unsec. Nts., 6/15/48 | | | 87,000 | | | | 83,764 | |
| |
| Biogen, Inc., 5.20% Sr. Unsec. Nts., 9/15/45 | | | 82,000 | | | | 84,738 | |
| |
| Celgene Corp., 3.875% Sr. Unsec. Nts., 8/15/25 | | | 202,000 | | | | 194,826 | |
| |
| Gilead Sciences, Inc., 4.75% Sr. Unsec. | | | | | |
| Nts., 3/1/46 | | | 143,000 | | | | 142,382 | |
| |
| Shire Acquisitions Investments Ireland | | | | | |
| DAC, 2.40% Sr. Unsec. Nts., 9/23/21 | | | 342,000 | | | | 330,909 | |
| | | | | | | | |
| | | | | | | 1,401,789 | |
| |
Health Care Equipment & Supplies—0.3% | |
| |
| Becton Dickinson & Co.: | | | | | | | | |
| 2.404% Sr. Unsec. Nts., 6/5/20 | | | 226,000 | | | | 222,632 | |
| 3.70% Sr. Unsec. Nts., 6/6/27 | | | 268,000 | | | | 253,812 | |
| |
| Hologic, Inc., 4.375% Sr. Unsec. Nts., 10/15/253 | | | 15,000 | | | | 14,025 | |
| | | | | | | | |
| | | | | | | 490,469 | |
| |
Health Care Providers & Services—1.1% | |
| |
| Cigna Corp., 3.75% Sr. Sec. Nts., 7/15/233 | | | 255,000 | | | | 254,398 | |
| |
| Cigna Holding Co., 5.125% Sr. Unsec. | | | | | | | | |
| Nts., 6/15/20 | | | 303,000 | | | | 310,814 | |
| |
| CVS Health Corp.: | | | | | | | | |
| 2.125% Sr. Unsec. Nts., 6/1/21 | | | 356,000 | | | | 344,587 | |
| 5.05% Sr. Unsec. Nts., 3/25/48 | | | 308,000 | | | | 301,090 | |
| |
| Fresenius Medical Care US Finance II, | | | | | |
| Inc., 5.875% Sr. Unsec. Nts., 1/31/223 | | | 450,000 | | | | 469,470 | |
| |
| McKesson Corp., 3.65% Sr. Unsec. Nts., 11/30/20 | | | 286,000 | | | | 287,442 | |
| | | | | | | | |
| | | | | | | 1,967,801 | |
| |
Life Sciences Tools & Services—0.4% | |
| |
| IQVIA, Inc., 5.00% Sr. Unsec. Nts., 10/15/263 | | | 308,000 | | | | 295,295 | |
| |
| Life Technologies Corp., 6.00% Sr. | | | | | |
| Unsec. Nts., 3/1/20 | | | 259,000 | | | | 266,293 | |
| |
| Thermo Fisher Scientific, Inc., 4.15% Sr. | | | | | |
| Unsec. Nts., 2/1/24 | | | 132,000 | | | | 133,849 | |
| | | | | | | | |
| | | | | | | 695,437 | |
| |
Pharmaceuticals—1.0% | | | | | | | | |
| |
| Allergan Funding SCS, 3.00% Sr. Unsec. | | | | | |
| Nts., 3/12/20 | | | 348,000 | | | | 346,714 | |
| |
| Bayer US Finance II LLC: | | | | | | | | |
| 3.875% Sr. Unsec. Nts., 12/15/233 | | | 335,000 | | | | 329,267 | |
| 4.375% Sr. Unsec. Nts., 12/15/283 | | | 242,000 | | | | 231,652 | |
| |
| Elanco Animal Health, Inc., 4.90% Sr. | | | | | |
| Unsec. Nts., 8/28/283 | | | 145,000 | | | | 147,912 | |
| |
| Mylan NV, 3.15% Sr. Unsec. Nts., 6/15/21 | | | 319,000 | | | | 312,565 | |
| |
| Takeda Pharmaceutical Co. Ltd.: | | | | | | | | |
| 4.00% Sr. Unsec. Nts., 11/26/213 | | | 280,000 | | | | 283,994 | |
17 OPPENHEIMER CONSERVATIVE BALANCED FUND/VA
STATEMENT OF INVESTMENTSContinued
| | | | | | | | |
| | | Principal
Amount | | | Value | |
| |
Pharmaceuticals (Continued) | | | | | | | | |
| |
Takeda Pharmaceutical Co. Ltd.: (Continued)
5.00% Sr. Unsec. Nts., 11/26/283 $ 160,000 | | | $ | 163,827 | |
| | | | | | | | |
| | | | | | | 1,815,931 | |
| |
Industrials—2.4% | | | | | | | | |
| |
Aerospace & Defense—0.7% | | | | | | | | |
| |
| BAE Systems Holdings, Inc., 3.85% Sr. | | | | | | | | |
| Unsec. Nts., 12/15/253 | | | 270,000 | | | | 268,216 | |
| |
| Huntington Ingalls Industries, Inc., 3.483% Sr. Unsec. Nts., 12/1/27 | | | 190,000 | | | | 177,447 | |
| |
| L3 Technologies, Inc., 3.85% Sr. Unsec. | | | | | | | | |
| Nts., 6/15/23 | | | 335,000 | | | | 335,835 | |
| |
| Northrop Grumman Corp., 4.75% Sr. | | | | | | | | |
| Unsec. Nts., 6/1/43 | | | 190,000 | | | | 193,018 | |
| |
| United Technologies Corp.: | | | | | | | | |
| 3.35% Sr. Unsec. Nts., 8/16/21 | | | 82,000 | | | | 81,826 | |
| 3.95% Sr. Unsec. Nts., 8/16/25 | | | 205,000 | | | | 203,798 | |
| | | | | | | | |
| | | | | | | 1,260,140 | |
| |
Air Freight & Couriers—0.1% | | | | | | | | |
| |
| CH Robinson Worldwide, Inc., 4.20% | | | | | | | | |
| Sr. Unsec. Nts., 4/15/28 | | | 169,000 | | | | 169,890 | |
| |
Building Products—0.3% | | | | | | | | |
| |
| Allegion US Holding Co., Inc., 3.55% | | | | | | | | |
| Sec. Nts., 10/1/27 | | | 284,000 | | | | 264,533 | |
| |
| Fortune Brands Home & Security, Inc., 4.00% Sr. Unsec. Nts., 9/21/23 | | | 313,000 | | | | 309,992 | |
| | | | | | | | |
| | | | | | | 574,525 | |
| |
Electrical Equipment—0.2% | | | | | | | | |
| |
| Sensata Technologies BV, 4.875% Sr. | | | | | | | | |
| Unsec. Nts., 10/15/233 | | | 345,000 | | | | 336,806 | |
| |
Industrial Conglomerates—0.2% | | | | | | | | |
| |
| GE Capital International Funding Co. | | | | | | | | |
| Unlimited Co., 3.373% Sr. Unsec. Nts., 11/15/25 | | | 107,000 | | | | 95,235 | |
| |
| Roper Technologies, Inc., 3.65% Sr. | | | | | | | | |
| Unsec. Nts., 9/15/23 | | | 330,000 | | | | 330,572 | |
| | | | | | | | |
| | | | | | | 425,807 | |
| |
Machinery—0.1% | | | | | | | | |
| |
| Fortive Corp., 1.80% Sr. Unsec. Nts., 6/15/19 | | | 40,000 | | | | 39,526 | |
| |
| Nvent Finance Sarl, 4.55% Sr. Unsec. | | | | | | | | |
| Nts., 4/15/28 | | | 176,000 | | | | 172,862 | |
| | | | | | | | |
| | | | | | | 212,388 | |
| |
Professional Services—0.1% | | | | | | | | |
| |
| IHS Markit Ltd., 4.125% Sr. Unsec. Nts., 8/1/23 | | | 211,000 | | | | 209,112 | |
| |
Road & Rail—0.4% | | | | | | | | |
| |
| Penske Truck Leasing Co. LP/PTL | | | | | | | | |
| Finance Corp., 3.40% Sr. Unsec. Nts., 11/15/263 | | | 284,000 | | | | 266,009 | |
| |
| Ryder System, Inc.: | | | | | | | | |
| 3.50% Sr. Unsec. Nts., 6/1/21 | | | 79,000 | | | | 79,140 | |
| 3.75% Sr. Unsec. Nts., 6/9/23 | | | 335,000 | | | | 333,258 | |
| | | | | | | | |
| | | | | | | 678,407 | |
| |
Trading Companies & Distributors—0.3% | | | | | |
| |
| Air Lease Corp.: | | | | | | | | |
| 3.25% Sr. Unsec. Nts., 3/1/25 | | | 108,000 | | | | 99,597 | |
| 3.625% Sr. Unsec. Nts., 4/1/27 | | | 112,000 | | | | 100,400 | |
| |
| GATX Corp., 3.50% Sr. Unsec. Nts., 3/15/28 | | | 285,000 | | | | 262,375 | |
| |
| United Rentals North America, Inc., 4.625% Sr. Unsec. Nts., 10/15/25 | | | 178,000 | | | | 159,310 | |
| | | | | | | | |
| | | | | | | 621,682 | |
| | | | | | | | |
| | | Principal
Amount | | | Value | |
| |
Information Technology—2.3% | | | | | |
| |
Communications Equipment—0.2% | |
| |
| Motorola Solutions, Inc., 4.60% Sr. | | | | | | | | |
| Unsec. Nts., 2/23/28 | | $ | 256,000 | | | $ | 250,919 | |
| |
Electronic Equipment, Instruments, & Components—0.3% | |
| |
| Arrow Electronics, Inc., 3.875% Sr. | | | | | | | | |
| Unsec. Nts., 1/12/28 | | | 248,000 | | | | 226,460 | |
| |
| CDW LLC/CDW Finance Corp., 5.50% | | | | | | | | |
| Sr. Unsec. Nts., 12/1/24 | | | 58,000 | | | | 57,565 | |
| |
| Tech Data Corp., 4.95% Sr. Unsec. Nts., 2/15/27 | | | 271,000 | | | | 254,924 | |
| | | | | | | | |
| | | | | | | 538,949 | |
| |
IT Services—0.5% | | | | | | | | |
| |
| DXC Technology Co.: | | | | | | | | |
| 2.875% Sr. Unsec. Nts., 3/27/20 | | | 261,000 | | | | 258,788 | |
| 4.75% Sr. Unsec. Nts., 4/15/27 | | | 246,000 | | | | 247,403 | |
| |
| Fidelity National Information Services, | | | | | | | | |
| Inc., 4.25% Sr. Unsec. Nts., 5/15/28 | | | 171,000 | | | | 170,301 | |
| |
| VeriSign, Inc.: | | | | | | | | |
| 4.75% Sr. Unsec. Nts., 7/15/27 | | | 189,000 | | | | 177,953 | |
| 5.25% Sr. Unsec. Nts., 4/1/25 | | | 105,000 | | | | 104,344 | |
| | | | | | | | |
| | | | | | | 958,789 | |
| |
Semiconductors & Semiconductor Equipment—0.4% | |
| |
| Intel Corp., 3.734% Sr. Unsec. Nts., 12/8/47 | | | 99,000 | | | | 91,866 | |
| |
| Microchip Technology, Inc., 3.922% Sr. | | | | | | | | |
| Sec. Nts., 6/1/213 | | | 335,000 | | | | 332,492 | |
| |
| NXP BV/NXP Funding LLC, 4.125% Sr. | | | | | | | | |
| Unsec. Nts., 6/1/213 | | | 304,000 | | | | 300,960 | |
| | | | | | | | |
| | | | | | | 725,318 | |
| |
Software—0.6% | | | | | | | | |
| |
| Autodesk, Inc., 4.375% Sr. Unsec. Nts., 6/15/25 | | | 104,000 | | | | 105,272 | |
| |
| Dell International LLC/EMC Corp.: | | | | | | | | |
| 4.42% Sr. Sec. Nts., 6/15/213 | | | 283,000 | | | | 282,871 | |
| 6.02% Sr. Sec. Nts., 6/15/263 | | | 213,000 | | | | 214,369 | |
| |
| Open Text Corp., 5.625% Sr. Unsec. | | | | | | | | |
| Nts., 1/15/233 | | | 174,000 | | | | 174,000 | |
| |
| Oracle Corp., 2.95% Sr. Unsec. Nts., 5/15/25 | | | 211,000 | | | | 202,180 | |
| |
| VMware, Inc.: | | | | | | | | |
| 2.30% Sr. Unsec. Nts., 8/21/20 | | | 28,000 | | | | 27,431 | |
| 3.90% Sr. Unsec. Nts., 8/21/27 | | | 170,000 | | | | 151,146 | |
| | | | | | | | |
| | | | | | | 1,157,269 | |
| |
Technology Hardware, Storage & Peripherals—0.3% | |
| |
| Apple, Inc., 4.375% Sr. Unsec. Nts., 5/13/45 | | | 207,000 | | | | 211,009 | |
| |
| Hewlett Packard Enterprise Co., 3.60% | | | | | | | | |
| Sr. Unsec. Nts., 10/15/20 | | | 342,000 | | | | 342,965 | |
| | | | | | | | |
| | | | | | | 553,974 | |
| |
Materials—2.4% | | | | | | | | |
| |
Chemicals—1.2% | | | | | | | | |
| |
| Dow Chemical Co. (The), 4.55% Sr. | | | | | | | | |
| Unsec. Nts., 11/30/253 | | | 207,000 | | | | 210,984 | |
| |
| DowDuPont, Inc.: | | | | | | | | |
| 3.766% Sr. Unsec. Nts., 11/15/20 | | | 280,000 | | | | 282,754 | |
| 5.419% Sr. Unsec. Nts., 11/15/48 | | | 125,000 | | | | 130,525 | |
| |
| Eastman Chemical Co., 3.50% Sr. | | | | | | | | |
| Unsec. Nts., 12/1/21 | | | 130,000 | | | | 130,736 | |
| |
| LyondellBasell Industries NV, 5.00% Sr. | | | | | | | | |
| Unsec. Nts., 4/15/19 | | | 255,000 | | | | 255,283 | |
| |
| Nutrien Ltd.: | | | | | | | | |
| 3.375% Sr. Unsec. Nts., 3/15/25 | | | 294,000 | | | | 276,712 | |
| 4.875% Sr. Unsec. Nts., 3/30/20 | | | 40,000 | | | | 40,704 | |
| |
| PolyOne Corp., 5.25% Sr. Unsec. Nts., 3/15/23 | | | 308,000 | | | | 298,760 | |
18 OPPENHEIMER CONSERVATIVE BALANCED FUND/VA
| | | | | | | | |
| | | Principal
Amount | | | Value | |
| |
Chemicals (Continued) | | | | | | | | |
| |
| RPM International, Inc.: | | | | | | | | |
| 3.45% Sr. Unsec. Unsub. Nts., 11/15/22 | | $ | 304,000 | | | $ | 301,381 | |
| 6.125% Sr. Unsec. Nts., 10/15/19 | | | 159,000 | | | | 161,928 | |
| |
| Yara International ASA, 4.75% Sr. | | | | | | | | |
| Unsec. Nts., 6/1/283 | | | 165,000 | | | | 164,864 | |
| | | | | | | | |
| | | | | | | 2,254,631 | |
| |
Construction Materials—0.2% | | | | | |
| |
| James Hardie International Finance | | | | | | | | |
| DAC, 4.75% Sr. Unsec. Nts., 1/15/253 | | | 209,000 | | | | 190,974 | |
| |
| Martin Marietta Materials, Inc., 3.50% | | | | | | | | |
| Sr. Unsec. Nts., 12/15/27 | | | 171,000 | | | | 156,291 | |
| | | | | | | | |
| | | | | | | 347,265 | |
| |
Containers & Packaging—0.4% | |
| |
| Packaging Corp. of America: | | | | | | | | |
| 3.65% Sr. Unsec. Nts., 9/15/24 | | | 113,000 | | | | 111,173 | |
| 4.50% Sr. Unsec. Nts., 11/1/23 | | | 253,000 | | | | 259,593 | |
| |
| Silgan Holdings, Inc., 4.75% Sr. Unsec. | | | | | | | | |
| Nts., 3/15/25 | | | 290,000 | | | | 271,875 | |
| | | | | | | | |
| | | | | | | 642,641 | |
| |
Metals & Mining—0.5% | | | | | | | | |
| |
| Anglo American Capital plc: | | | | | | | | |
| 3.625% Sr. Unsec. Nts., 9/11/243 | | | 86,000 | | | | 81,246 | |
| 4.00% Sr. Unsec. Nts., 9/11/273 | | | 140,000 | | | | 126,638 | |
| |
| ArcelorMittal, 6.125% Sr. Unsec. Nts., 6/1/25 | | | 305,000 | | | | 319,665 | |
| |
| Goldcorp, Inc., 5.45% Sr. Unsec. Nts., 6/9/44 | | | 96,000 | | | | 95,614 | |
| |
| Steel Dynamics, Inc., 4.125% Sr. Unsec. | | | | | | | | |
| Nts., 9/15/25 | | | 238,000 | | | | 219,853 | |
| | | | | | | | |
| | | | | | | 843,016 | |
| |
Paper & Forest Products—0.1% | | | | | |
| |
| Georgia-Pacific LLC, 3.734% Sr. Unsec. | | | | | | | | |
| Nts., 7/15/233 | | | 65,000 | | | | 65,653 | |
| |
| Louisiana-Pacific Corp., 4.875% Sr. | | | | | | | | |
| Unsec. Nts., 9/15/24 | | | 199,000 | | | | 192,533 | |
| | | | | | | | |
| | | | | | | 258,186 | |
| |
Telecommunication Services—1.4% | |
| |
Diversified Telecommunication Services—1.1% | |
| |
| AT&T, Inc.: | | | | | | | | |
| 4.30% Sr. Unsec. Nts., 2/15/30 | | | 331,000 | | | | 313,681 | |
| 4.35% Sr. Unsec. Nts., 6/15/45 | | | 48,000 | | | | 40,764 | |
| 4.50% Sr. Unsec. Nts., 3/9/48 | | | 142,000 | | | | 122,893 | |
| |
| British Telecommunications plc: | | | | | | | | |
| 4.50% Sr. Unsec. Nts., 12/4/23 | | | 202,000 | | | | 204,945 | |
| 9.625% Sr. Unsec. Nts., 12/15/30 | | | 284,000 | | | | 384,854 | |
| |
| Deutsche Telekom International Finance | | | | | | | | |
| BV, 4.375% Sr. Unsec. Nts., 6/21/283 | | | 160,000 | | | | 157,935 | |
| |
| Telefonica Emisiones SA: | | | | | | | | |
| 4.103% Sr. Unsec. Nts., 3/8/27 | | | 98,000 | | | | 94,658 | |
| 5.213% Sr. Unsec. Nts., 3/8/47 | | | 123,000 | | | | 113,132 | |
| |
| T-Mobile USA, Inc., 6.50% Sr. Unsec. | | | | | | | | |
| Nts., 1/15/26 | | | 280,000 | | | | 286,300 | |
| |
| Verizon Communications, Inc.: | | | | | | | | |
| 4.125% Sr. Unsec. Nts., 8/15/46 | | | 140,000 | | | | 124,174 | |
| 4.522% Sr. Unsec. Nts., 9/15/48 | | | 196,000 | | | | 184,605 | |
| | | | | | | | |
| | | | | | | 2,027,941 | |
| |
Wireless Telecommunication Services—0.3% | |
| |
| Vodafone Group plc: | | | | | | | | |
| 3.75% Sr. Unsec. Nts., 1/16/24 | | | 332,000 | | | | 327,579 | |
| | | | | | | | |
| | | Principal
Amount | | | Value | |
| |
Wireless Telecommunication Services (Continued) | |
| |
| Vodafone Group plc: (Continued) 4.375% Sr. Unsec. Nts., 5/30/28 | | $ | 168,000 | | | $ | 163,379 | |
| | | | | | | | |
| | | | | | | 490,958 | |
| |
Utilities—2.2% | | | | | | | | |
| |
Electric Utilities—1.6% | | | | | | | | |
| |
| AEP Texas, Inc., 3.95% Sr. Unsec. Nts., 6/1/283 | | | 172,000 | | | | 172,688 | |
| |
| Duke Energy Corp.: | | | | | | | | |
| 3.15% Sr. Unsec. Nts., 8/15/27 | | | 176,000 | | | | 164,967 | |
| 3.75% Sr. Unsec. Nts., 9/1/46 | | | 69,000 | | | | 59,983 | |
| |
| Edison International: | | | | | | | | |
| 2.125% Sr. Unsec. Nts., 4/15/20 | | | 131,000 | | | | 127,544 | |
| 2.95% Sr. Unsec. Nts., 3/15/23 | | | 207,000 | | | | 195,717 | |
| |
| EDP Finance BV, 3.625% Sr. Unsec. | | | | | | | | |
| Nts., 7/15/243 | | | 231,000 | | | | 216,713 | |
| |
| Electricite de France SA, 4.50% Sr. | | | | | | | | |
| Unsec. Nts., 9/21/283 | | | 169,000 | | | | 164,091 | |
| |
| Emera US Finance LP, 2.70% Sr. Unsec. | | | | | | | | |
| Nts., 6/15/21 | | | 179,000 | | | | 174,476 | |
| |
| Eversource Energy, 4.25% Sr. Unsec. | | | | | | | | |
| Nts., 4/1/29 | | | 155,000 | | | | 158,218 | |
| |
| Exelon Corp.: | | | | | | | | |
| 2.45% Sr. Unsec. Nts., 4/15/21 | | | 165,000 | | | | 161,459 | |
| 4.45% Sr. Unsec. Nts., 4/15/46 | | | 87,000 | | | | 83,176 | |
| |
| FirstEnergy Corp., 3.90% Sr. Unsec. | | | | | | | | |
| Nts., 7/15/27 | | | 184,000 | | | | 178,630 | |
| |
| Indiana Michigan Power Co., 4.25% Sr. | | | | | | | | |
| Unsec. Nts., 8/15/48 | | | 79,000 | | | | 78,086 | |
| |
| Mid-Atlantic Interstate Transmission | | | | | | | | |
| LLC, 4.10% Sr. Unsec. Nts., 5/15/283 | | | 171,000 | | | | 170,212 | |
| |
| NextEra Energy Operating Partners LP, 4.25% Sr. Unsec. Nts., 9/15/243 | | | 29,000 | | | | 26,934 | |
| |
| Pennsylvania Electric Co., 5.20% Sr. | | | | | | | | |
| Unsec. Nts., 4/1/20 | | | 88,000 | | | | 90,216 | |
| |
| PPL WEM Ltd./Western Power | | | | | | | | |
| Distribution Ltd., 5.375% Sr. Unsec. | | | | | | | | |
| Unsub. Nts., 5/1/213 | | | 317,000 | | | | 327,473 | |
| |
| TECO Finance, Inc., 5.15% Sr. Unsec. | | | | | | | | |
| Nts., 3/15/20 | | | 161,000 | | | | 164,674 | |
| |
| Trans-Allegheny Interstate Line Co., 3.85% Sr. Unsec. Nts., 6/1/253 | | | 187,000 | | | | 186,553 | |
| | | | | | | | |
| | | | | | | 2,901,810 | |
| |
Multi-Utilities—0.6% | | | | | | | | |
| |
| CenterPoint Energy Resources Corp., 4.50% Sr. Unsec. Nts., 1/15/21 | | | 122,000 | | | | 124,502 | |
| |
| CenterPoint Energy, Inc.: | | | | | | | | |
| 3.60% Sr. Unsec. Nts., 11/1/21 | | | 203,000 | | | | 203,551 | |
| 4.25% Sr. Unsec. Nts., 11/1/28 | | | 147,000 | | | | 149,345 | |
| |
| Dominion Energy, Inc.: | | | | | | | | |
| 2.579% Jr. Sub. Nts., 7/1/20 | | | 285,000 | | | | 280,597 | |
| 4.90% Sr. Unsec. Nts., 8/1/41 | | | 123,000 | | | | 122,527 | |
| |
| Public Service Enterprise Group, Inc., 1.60% Sr. Unsec. Nts., 11/15/19 | | | 303,000 | | | | 298,835 | |
| | | | | | | | |
| | | | | | | 1,179,357 | |
| | | | | | | | |
| TotalNon-Convertible Corporate Bonds and Notes (Cost $66,613,633) | | | | | | | 64,990,025 | |
| | |
| | | Shares | | | | |
| |
Investment Company—2.9% | |
| |
| Oppenheimer Institutional Government | | | | | | | | |
| Money Market Fund, Cl. E, 2.35%15,16 (Cost $5,367,607) | | | 5,367,607 | | | | 5,367,607 | |
| |
Total Investments, at Value (Cost $220,039,682) | | | 118.2 | % | | | 216,657,566 | |
| Net Other Assets (Liabilities) | | | (18.2 | ) | | | (33,338,413 | ) |
| | | | |
Net Assets | | | 100.0 | % | | $ | 183,319,153 | |
| | | | |
19 OPPENHEIMER CONSERVATIVE BALANCED FUND/VA
STATEMENT OF INVESTMENTSContinued
Footnotes to Statement of Investments
1.Non-income producing security.
2. Security is a Master Limited Partnership.
3. Represents securities sold under Rule 144A, which are exempt from registration under the Securities Act of 1933, as amended. These securities have been determined to be liquid under guidelines established by the Board of Trustees. These securities amount to $31,134,224 or 16.98% of the Fund’s net assets at period end.
4. Represents the current interest rate for a variable or increasing rate security, determined as [Referenced Rate + Basis-point spread].
5. Restricted security. The aggregate value of restricted securities at period end was $508,743, which represents 0.28% of the Fund’s net assets. See Note 4 of the accompanying Notes.
Information concerning restricted securities is as follows:
| | | | | | | | | | | | | | | | |
| Security | | Acquisition
Dates | | | Cost | | | Value | | | Unrealized
Appreciation/
(Depreciation) | |
| |
| GLS Auto Receivables Trust, Series2018-1A, Cl. A, 2.82%, 7/15/22 | | | 1/30/18 | | | $ | 243,304 | | | $ | 242,498 | | | $ | (806) | |
| Marathon Petroleum Corp., 3.80% Sr. Unsec. Nts., 4/1/28 | | | 7/25/18 | | | | 269,790 | | | | 266,245 | | | | (3,545) | |
| | | | | | | | |
| | | | | | $ | 513,094 | | | $ | 508,743 | | | $ | (4,351) | |
| | | | | | | | |
6. Interest-Only Strips represent the right to receive the monthly interest payments on an underlying pool of mortgage loans. These securities typically decline in price as interest rates decline. Most other fixed income securities increase in price when interest rates decline. The principal amount of the underlying pool represents the notional amount on which current interest is calculated. The price of these securities is typically more sensitive to changes in prepayment rates than traditional mortgage-backed securities (for example, GNMA pass-throughs). Interest rates disclosed represent current yields based upon the current cost basis and estimated timing and amount of future cash flows. These securities amount to $1,743,649 or 0.95% of the Fund’s net assets at period end.
7. Interest rate is less than 0.0005%.
8. Principal-Only Strips represent the right to receive the monthly principal payments on an underlying pool of mortgage loans. The value of these securities generally increases as interest rates decline and prepayment rates rise. The price of these securities is typically more volatile than that of coupon-bearing bonds of the same maturity. Interest rates disclosed represent current yields based upon the current cost basis and estimated timing of future cash flows. These securities amount to $37,777 or 0.02% of the Fund’s net assets at period end.
9. All or a portion of the security position is when-issued or delayed delivery to be delivered and settled after period end. See Note 4 of the accompanying Notes.
10. This interest rate resets periodically. Interest rate shown reflects the rate in effect at period end. The rate on this variable rate security is not based on a published reference rate and spread but is determined by the issuer or agent based on current market conditions.
11. All or a portion of the security position is held in accounts at a futures clearing merchant and pledged to cover margin requirements on open futures contracts and written options on futures, if applicable. The aggregate market value of such securities is $141,429. See Note 6 of the accompanying Notes.
12. All or a portion of the security position has been pledged for collateral in association with forward roll transactions. See Note 4 of the accompanying Notes.
13. This bond has no contractual maturity date, is not redeemable and contractually pays an indefinite stream of interest.
14. Represents securities sold under Regulation S, which are exempt from registration under the Securities Act of 1933, as amended. These securities may not be offered or sold in the United States without and exemption from, or in a transaction not subject to, the registration requirements of the Securities Act of 1933. These securities amount to $322,531 or 0.18% of the Fund’s net assets at period end.
15. Rate shown is the7-day yield at period end.
16. Is or was an affiliate, as defined in the Investment Company Act of 1940, as amended, at or during the reporting period, by virtue of the Fund owning at least 5% of the voting securities of the issuer or as a result of the Fund and the issuer having the same investment adviser. Transactions during the reporting period in which the issuer was an affiliate are as follows:
| | | | | | | | | | | | | | | | | | | | |
| | | Shares
December 31, 2017 | | Gross Additions | | Gross
Reductions | | Shares
December 31, 2018 |
Investment Company | | | | | | | | | | | | | | | | | | | | |
| Oppenheimer Institutional Government Money Market Fund, Cl. E | | | | 5,367,607 | | | | | — | | | | | — | | | | | 5,367,607 | |
| | | | |
| | | Value | | Income | | Realized
Gain (Loss) | | Change in Unrealized Gain (Loss) |
Investment Company | | | | | | | | | | | | | | | | | | | | |
| Oppenheimer Institutional Government Money Market Fund, Cl. E | | | $ | 5,367,607 | | | | $ | 95,226 | | | | $ | — | | | | $ | — | |
| | | | | | | | | | | | | | | | | | | | | | | | | | | | |
| |
| Futures Contracts as of December 31, 2018 | |
| Description | | Buy/Sell | | | Expiration Date | | | Number of
Contracts | | | | | | Notional
Amount
(000’s) | | | Value | | | Unrealized
Appreciation/
(Depreciation) | |
| |
| United States Treasury Long Bonds | | | Sell | | | | 3/20/19 | | | | 3 | | | | USD | | | | 436 | | | $ | 438,000 | | | $ | (2,224 | ) |
| United States Treasury Nts., 10 yr. | | | Sell | | | | 3/20/19 | | | | 73 | | | | USD | | | | 8,849 | | | | 8,907,141 | | | | (57,855 | ) |
| United states Treasury Nts., 2 yr. | | | Sell | | | | 3/29/19 | | | | 59 | | | | USD | | | | 12,470 | | | | 12,526,438 | | | | (56,594 | ) |
| United States Treasury Nts., 5 yr. | | | Sell | | | | 3/29/19 | | | | 31 | | | | USD | | | | 3,497 | | | | 3,555,312 | | | | (58,670 | ) |
| United States Ultra Bonds | | | Buy | | | | 3/20/19 | | | | 62 | | | | USD | | | | 9,439 | | | | 9,960,688 | | | | 521,614 | |
| | | | | | | | | | | | | | | | | | | | | | | | | | | | |
| | | | | | | | | | | | | | | | | | | | | | | | | | $ | 346,271 | |
| | | | | | | | | | | | | | | | | | | | | | | | | | | | |
| | | | |
| Glossary: | | | | |
| Definitions | | | | |
| H15T1Y | | US Treasury Yield Curve Rate T Note Constant Maturity 1 Year | | |
| ICE LIBOR | | Intercontinental Exchange London Interbank Offered Rate | | |
| LIBOR01M | | ICE LIBOR USD 1 Month | | |
| US0001M | | ICE LIBOR USD 1 Month | | |
| US0003M | | ICE LIBOR USD 3 Month | | |
| USISDA05 | | USD ICE Swap Rate 11:00am NY 5 Year | | |
| USSW5 | | USD Swap Semi 30/360 5 Year | | |
| |
| See accompanying Notes to Financial Statements. | | |
20 OPPENHEIMER CONSERVATIVE BALANCED FUND/VA
STATEMENT OF ASSETS AND LIABILITIESDecember 31, 2018
| | | | |
Assets | | | | |
| Investments, at value—see accompanying statement of investments: | | | | |
| Unaffiliated companies (cost $214,672,075) | | $ | 211,289,959 | |
| Affiliated companies (cost $5,367,607) | | | 5,367,607 | |
| | | | |
| | | 216,657,566 | |
| |
| Cash | | | 2,476,073 | |
| |
| Cash used for collateral on futures | | | 277,000 | |
| |
| Receivables and other assets: | | | | |
| Investments sold (including $14,930,759 sold on a when-issued or delayed delivery basis) | | | 15,065,003 | |
| Interest, dividends and principal paydowns | | | 904,814 | |
| Shares of beneficial interest sold | | | 42,078 | |
| Variation margin receivable | | | 36,813 | |
| Other | | | 56,564 | |
| | | | |
| Total assets | | | 235,515,911 | |
| |
Liabilities | | | | |
| Payables and other liabilities: | | | | |
| Investments purchased on a when-issued or delayed delivery basis | | | 51,908,726 | |
| Shares of beneficial interest redeemed | | | 100,183 | |
| Trustees’ compensation | | | 48,816 | |
| Variation margin payable | | | 46,158 | |
| Shareholder communications | | | 15,039 | |
| Distribution and service plan fees | | | 9,253 | |
| Other | | | 68,583 | |
| | | | |
| Total liabilities | | | 52,196,758 | |
|
| |
Net Assets | | $ | 183,319,153 | |
| | | | |
| | | | |
|
| |
Composition of Net Assets | | | | |
| Par value of shares of beneficial interest | | $ | 12,748 | |
| |
| Additionalpaid-in capital | | | 179,725,456 | |
| |
| Total distributable earnings | | | 3,580,949 | |
| | | | |
Net Assets | | $ | 183,319,153 | |
| | | | |
|
| |
Net Asset Value Per Share | | | | |
| |
| Non-Service Shares: | | | | |
| |
Net asset value, redemption price per share and offering price per share (based on net assets of $140,290,100 and 9,725,180 shares of beneficial interest outstanding) | | | $14.43 | |
| |
| Service Shares: | | | | |
| |
| Net asset value, redemption price per share and offering price per share (based on net assets of $43,029,053 and 3,022,500 shares of beneficial interest outstanding) | | | $14.24 | |
See accompanying Notes to Financial Statements.
21 OPPENHEIMER CONSERVATIVE BALANCED FUND/VA
STATEMENT OF OPERATIONSFor the Year Ended December 31, 2018
| | | | |
Investment Income | | | | |
| Interest (net of foreign withholding taxes of $806) | | $ | 4,335,900 | |
| |
| Dividends: | | | | |
| Unaffiliated companies (net of foreign withholding taxes of $27,778) | | | 1,105,563 | |
| Affiliated companies | | | 95,226 | |
| | | | |
| Total investment income | | | 5,536,689 | |
|
| |
Expenses | | | | |
| Management fees | | | 1,522,921 | |
| |
| Distribution and service plan fees—service shares | | | 120,369 | |
| |
| Transfer and shareholder servicing agent fees: | | | | |
| Non-Service shares | | | 186,164 | |
| Service shares | | | 57,777 | |
| |
| Shareholder communications: | | | | |
| Non-Service shares | | | 50,565 | |
| Service shares | | | 15,634 | |
| |
| Custodian fees and expenses | | | 50,334 | |
| |
| Trustees’ compensation | | | 11,358 | |
| |
| Borrowing fees | | | 6,661 | |
| |
| Other | | | 81,302 | |
| | | | |
| Total expenses | | | 2,103,085 | |
| Less reduction to custodian expenses | | | (1,984) | |
| Less waivers and reimbursements of expenses | | | (610,602) | |
| | | | |
| Net expenses | | | 1,490,499 | |
| |
| Net Investment Income | | | 4,046,190 | |
| |
Realized and Unrealized Gain (Loss) | | | | |
| Net realized gain (loss) on: | | | | |
| Investment transactions in unaffiliated companies | | | 3,702,500 | |
| Futures contracts | | | (605,985) | |
| Foreign currency transactions | | | (2,402) | |
| Swap contracts | | | (3,222) | |
| Swaption contracts written | | | 9,030 | |
| | | | |
| Net realized gain | | | 3,099,921 | |
| |
| Net change in unrealized appreciation/(depreciation) on: | | | | |
| Investment transactions in unaffiliated companies | | | (18,004,162) | |
| Translation of assets and liabilities denominated in foreign currencies | | | 1,041 | |
| Futures contracts | | | 216,182 | |
| | | | |
| Net change in unrealized appreciation/(depreciation) | | | (17,786,939) | |
|
| |
Net Decrease in Net Assets Resulting from Operations | | $ | (10,640,828) | |
| | | | |
See accompanying Notes to Financial Statements.
22 OPPENHEIMER CONSERVATIVE BALANCED FUND/VA
STATEMENTS OF CHANGES IN NET ASSETS
| | | | | | | | |
| | | Year Ended December 31, 2018 | | | Year Ended December 31, 20171 | |
| |
Operations | | | | | | | | |
| Net investment income | | $ | 4,046,190 | | | $ | 3,732,264 | |
| |
| Net realized gain | | | 3,099,921 | | | | 11,757,536 | |
| |
| Net change in unrealized appreciation/(depreciation) | | | (17,786,939) | | | | 4,018,070 | |
| | | | |
| Net increase (decrease) in net assets resulting from operations | | | (10,640,828) | | | | 19,507,870 | |
|
| |
Dividends and/or Distributions to Shareholders | | | | | | | | |
| Dividends and distributions declared: | | | | | | | | |
| Non-Service shares | | | (6,688,120) | | | | (3,346,883) | |
| Service shares | | | (1,986,593) | | | | (889,490) | |
| | | | |
| Total dividends and distributions declared | | | (8,674,713) | | | | (4,236,373) | |
|
| |
Beneficial Interest Transactions | | | | | | | | |
| Net decrease in net assets resulting from beneficial interest transactions: | | | | | | | | |
| Non-Service shares | | | (10,990,551) | | | | (18,304,514) | |
| Service shares | | | (4,022,754) | | | | (3,634,518) | |
| | | | |
| Total beneficial interest transactions | | | (15,013,305) | | | | (21,939,032) | |
|
| |
Net Assets | | | | | | | | |
| Total decrease | | | (34,328,846) | | | | (6,667,535) | |
| |
| Beginning of period | | | 217,647,999 | | | | 224,315,534 | |
| | | | |
| End of period | | $ | 183,319,153 | | | $ | 217,647,999 | |
| | | | |
1. Prior period amounts have been conformed to current year presentation. See Notes to Financial Statements, Note 2– New Accounting Pronouncements for further details.
See accompanying Notes to Financial Statements.
23 OPPENHEIMER CONSERVATIVE BALANCED FUND/VA
FINANCIAL HIGHLIGHTS
| | | | | | | | | | | | | | | | | | | | |
| Non-Service Shares | | Year Ended December 31, 2018 | | | Year Ended December 31, 2017 | | | Year Ended December 31, 2016 | | | Year Ended
December 31,
2015 | | | Year Ended
December 31,
2014 | |
| |
Per Share Operating Data | | | | | | | | | | | | | | | | | | | | |
| Net asset value, beginning of period | | | $15.92 | | | | $14.86 | | | | $14.46 | | | | $14.67 | | | | $13.84 | |
| |
| Income (loss) from investment operations: | | | | | | | | | | | | | | | | | | | | |
| Net investment income1 | | | 0.32 | | | | 0.27 | | | | 0.26 | | | | 0.31 | | | | 0.29 | |
| Net realized and unrealized gain (loss) | | | (1.13) | | | | 1.09 | | | | 0.49 | | | | (0.18) | | | | 0.83 | |
| | | | |
| Total from investment operations | | | (0.81) | | | | 1.36 | | | | 0.75 | | | | 0.13 | | | | 1.12 | |
| |
| Dividends and/or distributions to shareholders: | | | | | | | | | | | | | | | | | | | | |
| Dividends from net investment income | | | (0.31) | | | | (0.30) | | | | (0.35) | | | | (0.34) | | | | (0.29) | |
| Distributions from net realized gain | | | (0.37) | | | | 0.00 | | | | 0.00 | | | | 0.00 | | | | 0.00 | |
| | | | |
| Total dividends and/or distributions to shareholders | | | (0.68) | | | | (0.30) | | | | (0.35) | | | | (0.34) | | | | (0.29) | |
| |
| Net asset value, end of period | | | $14.43 | | | | $15.92 | | | | $14.86 | | | | $14.46 | | | | $14.67 | |
| | | | |
|
| |
Total Return, at Net Asset Value2 | | | (5.32)% | | | | 9.25% | | | | 5.26% | | | | 0.83% | | | | 8.20% | |
| | | | | | | | | | | | | | | | |
| |
Ratios/Supplemental Data | | | | | | | | | | | | | | | | | | | | |
| Net assets, end of period (in thousands) | | | $140,290 | | | | $166,015 | | | | $172,573 | | | | $182,406 | | | | $203,684 | |
| |
| Average net assets (in thousands) | | | $155,024 | | | | $170,438 | | | | $177,368 | | | | $194,208 | | | | $208,556 | |
| |
| Ratios to average net assets:3 | | | | | | | | | | | | | | | | | | | | |
| Net investment income | | | 2.05% | | | | 1.74% | | | | 1.78% | | | | 2.09% | | | | 2.03% | |
| Expenses excluding specific expenses listed below | | | 0.98% | | | | 0.94% | | | | 0.94% | | | | 0.91% | | | | 0.90% | |
| Interest and fees from borrowings | | | 0.00%4 | | | | 0.00%4 | | | | 0.00%4 | | | | 0.00%4 | | | | 0.00% | |
| | | | |
| Total expenses5 | | | 0.98% | | | | 0.94% | | | | 0.94% | | | | 0.91% | | | | 0.90% | |
| Expenses after payments, waivers and/or reimbursements and reduction to custodian expenses | | | 0.67% | | | | 0.67% | | | | 0.67% | | | | 0.67% | | | | 0.67% | |
| |
| Portfolio turnover rate6 | | | 60% | | | | 76% | | | | 68% | | | | 68% | | | | 98% | |
1. Per share amounts calculated based on the average shares outstanding during the period.
2. Assumes an initial investment on the business day before the first day of the fiscal period, with all dividends and distributions reinvested in additional shares on the reinvestment date, and redemption at the net asset value calculated on the last business day of the fiscal period. Total returns are not annualized for periods less than one full year. Total return information does not reflect expenses that apply at the separate account level or to related insurance products. Inclusion of these charges would reduce the total return figures for all periods shown. Returns do not reflect the deduction of taxes that a shareholder would pay on fund distributions or the redemption of fund shares.
3. Annualized for periods less than one full year.
4. Less than 0.005%.
5. Total expenses including indirect expenses from affiliated fund fees and expenses were as follows:
| | | | | | |
| | | | | | |
Year Ended December 31, 2018 | | | 0.98 | % |
Year Ended December 31, 2017 | | | 0.94 | % |
Year Ended December 31, 2016 | | | 0.94 | % |
Year Ended December 31, 2015 | | | 0.91 | % |
Year Ended December 31, 2014 | | | 0.90 | % |
6.The portfolio turnover rate excludes purchase and sale transactions of To Be Announced (TBA) mortgage-related securities as follows:
| | | | | | | | |
| | | Purchase Transactions | | | Sale Transactions | |
| |
Year Ended December 31, 2018 | | | $685,887,902 | | | | $703,549,464 | |
Year Ended December 31, 2017 | | | $729,295,309 | | | | $711,803,922 | |
Year Ended December 31, 2016 | | | $737,550,642 | | | | $742,753,245 | |
Year Ended December 31, 2015 | | | $829,988,104 | | | | $849,696,153 | |
Year Ended December 31, 2014 | | | $697,503,637 | | | | $678,765,376 | |
See accompanying Notes to Financial Statements.
24 OPPENHEIMER CONSERVATIVE BALANCED FUND/VA
| | | | | | | | | | | | | | | | | | | | |
| Service Shares | | Year Ended December 31, 2018 | | | Year Ended December 31, 2017 | | | Year Ended December 31, 2016 | | | Year Ended December 31, 2015 | | | Year Ended December 31, 2014 | |
| |
Per Share Operating Data | | | | | | | | | | | | | | | | | | | | |
| Net asset value, beginning of period | | | $15.71 | | | | $14.67 | | | | $14.28 | | | | $14.49 | | | | $13.66 | |
| |
| Income (loss) from investment operations: | | | | | | | | | | | | | | | | | | | | |
| Net investment income1 | | | 0.27 | | | | 0.23 | | | | 0.22 | | | | 0.27 | | | | 0.25 | |
| Net realized and unrealized gain (loss) | | | (1.10) | | | | 1.07 | | | | 0.48 | | | | (0.18) | | | | 0.84 | |
| | | | |
| Total from investment operations | | | (0.83) | | | | 1.30 | | | | 0.70 | | | | 0.09 | | | | 1.09 | |
| |
| Dividends and/or distributions to shareholders: | | | | | | | | | | | | | | | | | | | | |
| Dividends from net investment income | | | (0.27) | | | | (0.26) | | | | (0.31) | | | | (0.30) | | | | (0.26) | |
| Distributions from net realized gain | | | (0.37) | | | | 0.00 | | | | 0.00 | | | | 0.00 | | | | 0.00 | |
| | | | |
| Total dividends and/or distributions to shareholders | | | (0.64) | | | | (0.26) | | | | (0.31) | | | | (0.30) | | | | (0.26) | |
| Net asset value, end of period | | | $14.24 | | | | $15.71 | | | | $14.67 | | | | $14.28 | | | | $14.49 | |
| | | | |
|
| |
Total Return, at Net Asset Value2 | | | (5.53)% | | | | 8.95% | | | | 4.96% | | | | 0.57% | | | | 8.02% | |
| | | | | | | | | | | | | | | | |
| |
Ratios/Supplemental Data | | | | | | | | | | | | | | | | | | | | |
| Net assets, end of period (in thousands) | | | $43,029 | | | | $51,633 | | | | $51,743 | | | | $52,226 | | | | $63,880 | |
| |
| Average net assets (in thousands) | | | $48,109 | | | | $51,345 | | | | $53,914 | | | | $59,085 | | | | $65,450 | |
| |
| Ratios to average net assets:3 | | | | | | | | | | | | | | | | | | | | |
| Net investment income | | | 1.80% | | | | 1.49% | | | | 1.53% | | | | 1.84% | | | | 1.78% | |
| Expenses excluding specific expenses listed below | | | 1.23% | | | | 1.19% | | | | 1.19% | | | | 1.16% | | | | 1.15% | |
| Interest and fees from borrowings | | | 0.00%4 | | | | 0.00%4 | | | | 0.00%4 | | | | 0.00%4 | | | | 0.00% | |
| | | | |
| Total expenses5 | | | 1.23% | | | | 1.19% | | | | 1.19% | | | | 1.16% | | | | 1.15% | |
| Expenses after payments, waivers and/or reimbursements and reduction to custodian expenses | | | 0.92% | | | | 0.92% | | | | 0.92% | | | | 0.92% | | | | 0.92% | |
| |
| Portfolio turnover rate6 | | | 60% | | | | 76% | | | | 68% | | | | 68% | | | | 98% | |
1.Per share amounts calculated based on the average shares outstanding during the period.
2.Assumes an initial investment on the business day before the first day of the fiscal period, with all dividends and distributions reinvested in additional shares on the reinvestment date, and
redemption at the net asset value calculated on the last business day of the fiscal period. Total returns are not annualized for periods less than one full year. Total return information does not
reflect expenses that apply at the separate account level or to related insurance products. Inclusion of these charges would reduce the total return figures for all periods shown. Returns do not
reflect the deduction of taxes that a shareholder would pay on fund distributions or the redemption of fund shares.
3.Annualized for periods less than one full year.
4.Less than 0.005%.
5.Total expenses including indirect expenses from affiliated fund fees and expenses were as follows:
| | | | | | |
| | | | | | |
Year Ended December 31, 2018 | | | 1.23 | % |
Year Ended December 31, 2017 | | | 1.19 | % |
Year Ended December 31, 2016 | | | 1.19 | % |
Year Ended December 31, 2015 | | | 1.16 | % |
Year Ended December 31, 2014 | | | 1.15 | % |
6.The portfolio turnover rate excludes purchase and sale transactions of To Be Announced (TBA) mortgage-related securities as follows:
| | | | | | | | |
| | | Purchase Transactions | | | Sale Transactions | |
| |
Year Ended December 31, 2018 | | | $685,887,902 | | | | $703,549,464 | |
Year Ended December 31, 2017 | | | $729,295,309 | | | | $711,803,922 | |
Year Ended December 31, 2016 | | | $737,550,642 | | | | $742,753,245 | |
Year Ended December 31, 2015 | | | $829,988,104 | | | | $849,696,153 | |
Year Ended December 31, 2014 | | | $697,503,637 | | | | $678,765,376 | |
See accompanying Notes to Financial Statements.
25 OPPENHEIMER CONSERVATIVE BALANCED FUND/VA
NOTES TO FINANCIAL STATEMENTSDecember 31, 2018
1. Organization
Oppenheimer Conservative Balanced Fund/VA (the “Fund”), a separate series of Oppenheimer Variable Account Funds, is a diversifiedopen-end management investment company registered under the Investment Company Act of 1940 (“1940 Act”), as amended. The Fund’s investment objective is to seek total return. The Fund’s investment adviser is OFI Global Asset Management, Inc. (“OFI Global” or the “Manager”), a wholly-owned subsidiary of OppenheimerFunds, Inc. (“OFI” or the“Sub-Adviser”). The Manager has entered into asub-advisory agreement with OFI.
Shares of the Fund are sold only to separate accounts of life insurance companies.
The Fund offers two classes of shares. Both classes are sold at their offering price, which is the net asset value per share, to separate investment accounts of participating insurance companies as an underlying investment for variable life insurance policies, variable annuity contracts or other investment products. The class of shares designated as Service shares is subject to a distribution and service plan. Both classes of shares have identical rights and voting privileges with respect to the Fund in general and exclusive voting rights on matters that affect that class alone. Earnings, net assets and net asset value per share may differ due to each class having its own expenses, such as transfer and shareholder servicing agent fees and shareholder communications, directly attributable to that class.
The following is a summary of significant accounting policies followed in the Fund’s preparation of financial statements in accordance with accounting principles generally accepted in the United States (“U.S. GAAP”).
2. Significant Accounting Policies
Security Valuation.All investments in securities are recorded at their estimated fair value, as described in Note 3.
Foreign Currency Translation.The books and records of the Fund are maintained in U.S. dollars. Any foreign currency amounts are translated into U.S. dollars on the following basis: (1) Value of investment securities, other assets and liabilities — at the exchange rates prevailing at market close as described in Note 3.
(2) Purchases and sales of investment securities, income and expenses — at the rates of exchange prevailing on the respective dates of such transactions.
Although the net assets and the values are presented at the foreign exchange rates at market close, the Fund does not isolate the portion of the results of operations resulting from changes in foreign exchange rates on investments from the fluctuations arising from changes in prices of securities held. Such fluctuations are included with the net realized and unrealized gains or losses from investments shown in the Statement of Operations.
For securities, which are subject to foreign withholding tax upon disposition, realized and unrealized gains or losses on such securities are recorded net of foreign withholding tax.
Reported net realized foreign exchange gains or losses arise from sales of foreign currencies, currency gains or losses realized between the trade and settlement dates on securities transactions, the difference between the amounts of dividends, interest, and foreign withholding tax reclaims recorded on the Fund’s books, and the U.S. dollar equivalent of the amounts actually received or paid. Net unrealized foreign exchange gains and losses arise from changes in the value of assets and liabilities other than investments in securities, resulting from changes in the exchange rate.
Allocation of Income, Expenses, Gains and Losses.Income, expenses (other than those attributable to a specific class), gains and losses are allocated on a daily basis to each class of shares based upon the relative proportion of net assets represented by such class. Operating expenses directly attributable to a specific class are charged against the operations of that class.
Dividends and Distributions to Shareholders. Dividends and distributions to shareholders, which are determined in accordance with income tax regulations and may differ from U.S. GAAP, are recorded on theex-dividend date. Income and capital gain distributions, if any, are declared and paid annually or at other times as determined necessary by the Manager.
Investment Income.Dividend income is recorded on theex-dividend date or uponex-dividend notification in the case of certain foreign dividends where theex-dividend date may have passed.Non-cash dividends included in dividend income, if any, are recorded at the fair value of the securities received. Withholding taxes on foreign dividends, if any, and capital gains taxes on foreign investments, if any, have been provided for in accordance with the Fund’s understanding of the applicable tax rules and regulations. Interest income, if any, is recognized on an accrual basis. Discount and premium, which are included in interest income on the Statement of Operations, are amortized or accreted daily.
Return of Capital Estimates.Distributions received from the Fund’s investments in Master Limited Partnerships (MLPs) and Real Estate Investments Trusts (REITs), generally are comprised of income and return of capital. Any return of capital estimates in excess of cost basis are classified as realized gain. The Fund records investment income and return of capital based on estimates. Such estimates are based on historical information available from each MLP, REIT and other industry sources. These estimates may subsequently be revised based on information received from MLPs and REITs after their tax reporting periods are concluded.
Custodian Fees. “Custodian fees and expenses” in the Statement of Operations may include interest expense incurred by the Fund on any cash overdrafts of its custodian account during the period. Such cash overdrafts may result from the effects of failed trades in portfolio securities and from cash outflows resulting from unanticipated shareholder redemption activity. The Fund pays interest to its custodian on such cash overdrafts, to the extent they are not offset by positive cash balances maintained by the Fund, at a rate equal to the Federal Funds Rate plus 2.00%. The “Reduction to custodian expenses” line item, if applicable, represents earnings on cash balances maintained by the Fund during the period. Such interest expense and other
26 OPPENHEIMER CONSERVATIVE BALANCED FUND/VA
2. Significant Accounting Policies (Continued)
custodian fees may be paid with these earnings.
Security Transactions. Security transactions are recorded on the trade date. Realized gains and losses on securities sold are determined on the basis of identified cost.
Indemnifications.The Fund’s organizational documents provide current and former Trustees and officers with a limited indemnification against liabilities arising in connection with the performance of their duties to the Fund. In the normal course of business, the Fund may also enter into contracts that provide general indemnifications. The Fund’s maximum exposure under these arrangements is unknown as this would be dependent on future claims that may be made against the Fund. The risk of material loss from such claims is considered remote.
Federal Taxes.The Fund intends to comply with provisions of the Internal Revenue Code applicable to regulated investment companies and to distribute substantially all of its investment company taxable income, including any net realized gain on investments not offset by capital loss carryforwards, if any, to shareholders. Therefore, no federal income or excise tax provision is required. The Fund files income tax returns in U.S. federal and applicable state jurisdictions. The statute of limitations on the Fund’s tax return filings generally remains open for the three preceding fiscal reporting period ends. The Fund has analyzed its tax positions for the fiscal year ended December 31, 2018, including open tax years, and does not believe there are any uncertain tax positions requiring recognition in the Fund’s financial statements.
The tax components of capital shown in the following table represent distribution requirements the Fund must satisfy under the income tax regulations, losses the Fund may be able to offset against income and gains realized in future years and unrealized appreciation or depreciation of securities and other investments for federal income tax purposes.
| | | | | | | | | | | | |
Undistributed Net Investment Income | | Undistributed Long-Term Gain | | | Accumulated Loss Carryforward1,2 | | | Net Unrealized Depreciation Based on cost of Securities and Other Investments for Federal Income
Tax Purposes | |
| |
$4,079,159 | | | $3,026,844 | | | | $— | | | | $3,476,243 | |
1. During the reporting period, the Fund did not utilize any capital loss carryforward.
2.During the previous reporting period, the Fund utilized $5,261,675 of capital loss carryforward to offset capital gains realized in that fiscal year.
Net investment income (loss) and net realized gain (loss) may differ for financial statement and tax purposes. The character of dividends and distributions made during the fiscal year from net investment income or net realized gains are determined in accordance with federal income tax requirements, which may differ from the character of net investment income or net realized gains presented in those financial statements in accordance with U.S. GAAP. Also, due to timing of dividends and distributions, the fiscal year in which amounts are distributed may differ from the fiscal year in which the income or net realized gain was recorded by the Fund.
Accordingly, the following amounts have been reclassified for the reporting period. Net assets of the Fund were unaffected by the reclassifications.
| | | | |
Increase toPaid-in Capital | | Reduction to Accumulated Net Earnings3 | |
| |
$216,995 | | $ | 216,995 | |
3.$216,504, all of which was long-term capital gain, was distributed in connection with Fund share redemptions.
The tax character of distributions paid during the reporting periods:
| | | | | | | | |
| | | Year Ended December 31, 2018 | | | Year Ended December 31, 2017 | |
| |
Distributions paid from: | | | | | | | | |
| Ordinary income | | $ | 3,901,246 | | | $ | 4,236,373 | |
| Long-term capital gain | | | 4,773,467 | | | | — | |
| | | | |
| Total | | $ | 8,674,713 | | | $ | 4,236,373 | |
| | | | |
The aggregate cost of securities and other investments and the composition of unrealized appreciation and depreciation of securities and other investments for federal income tax purposes at period end are noted in the following table. The primary difference between book and tax appreciation or depreciation of securities and other investments, if applicable, is attributable to the tax deferral of losses or tax realization of financial statement unrealized gain or loss.
27 OPPENHEIMER CONSERVATIVE BALANCED FUND/VA
NOTES TO FINANCIAL STATEMENTSContinued
2. Significant Accounting Policies (Continued)
| | | | |
Federal tax cost of securities | | $ | 220,133,274 | |
Federal tax cost of other investments | | | (15,466,203) | |
| | | | |
Total federal tax cost | | $ | 204,667,071 | |
| | | | |
Gross unrealized appreciation | | $ | 9,470,103 | |
Gross unrealized depreciation | | | (12,946,346) | |
| | | | |
Net unrealized depreciation | | $ | (3,476,243) | |
| | | | |
Use of Estimates. The preparation of financial statements in conformity with U.S. GAAP requires management to make estimates and assumptions that affect the reported amounts of assets and liabilities and disclosure of contingent assets and liabilities at the date of the financial statements and the reported amounts of increases and decreases in net assets from operations during the reporting period. Actual results could differ from those estimates.
New Accounting Pronouncements. In March 2017, Financial Accounting Standards Board (“FASB”) issued Accounting Standards Update (“ASU”), ASU2017-08. This provides guidance related to the amortization period for certain purchased callable debt securities held at a premium. The ASU is effective for annual periods beginning after December 15, 2018, and interim periods within those annual periods. The Manager has evaluated the impacts of these changes on the financial statements and there are no material impacts.
During August 2018, the Securities and Exchange Commission (the “SEC”) issued Final Rule ReleaseNo. 33-10532 (the “Rule”), Disclosure Update and Simplification. The rule amends certain financial statement disclosure requirements to conform to U.S. GAAP. The amendments to Rule6-04.17 of RegulationS-X (balance sheet) remove the requirement to separately state the book basis components of net assets: undistributed (over-distribution of) net investment income (“UNII”), accumulated undistributed net realized gains (losses), and net unrealized appreciation (depreciation) at the balance sheet date. Instead, consistent with U.S. GAAP, funds will be required to disclose total distributable earnings. The amendments to Rule6-09 of RegulationS-X (statement of changes in net assets) remove the requirement to separately state the sources of distributions paid. Instead, consistent with U.S. GAAP, funds will be required to disclose the total amount of distributions paid, except that any tax return of capital must be separately disclosed. The amendments also remove the requirement to parenthetically state the book basis amount of UNII on the statement of changes in net assets. The requirements of the Rule are effective November 5, 2018, and the Funds’ Statement of Assets and Liabilities and Statement of Changes in Net Assets for the current reporting period have been modified accordingly. In addition, certain amounts within each Fund’s Statement of Changes in Net Assets for the prior fiscal period have been modified to conform to the Rule.
3. Securities Valuation
The Fund calculates the net asset value of its shares as of 4:00 P.M. Eastern Time, on each day the New York Stock Exchange (the “Exchange” or “NYSE”) is open for trading, except in the case of a scheduled early closing of the Exchange, in which case the Fund will calculate net asset value of the shares as of the scheduled early closing time of the Exchange.
The Fund’s Board has adopted procedures for the valuation of the Fund’s securities and has delegated theday-to-day responsibility for valuation determinations under those procedures to the Manager. The Manager has established a Valuation Committee which is responsible for determining a fair valuation for any security for which market quotations are not readily available. The Valuation Committee’s fair valuation determinations are subject to review, approval and ratification by the Fund’s Board at least quarterly or more frequently, if necessary.
Valuation Methods and Inputs
Securities are valued primarily using unadjusted quoted market prices, when available, as supplied by third party pricing services or broker-dealers.
The following methodologies are used to determine the market value or the fair value of the types of securities described below:
Equity securities traded on a securities exchange (including exchange-traded derivatives other than futures and futures options) are valued based on the official closing price on the principal exchange on which the security is traded, as identified by the Manager, prior to the time when the Fund’s assets are valued. If the official closing price is unavailable, the security is valued at the last sale price on the principal exchange on which it is traded, or if no sales occurred, the security is valued at the mean between the quoted bid and asked prices.Over-the-counter equity securities are valued at the last published sale price, or if no sales occurred, at the mean between the quoted bid and asked prices. Events occurring after the close of trading on foreign exchanges may result in adjustments to the valuation of foreign securities to more accurately reflect their fair value as of the time when the Fund’s assets are valued.
Shares of a registered investment company that are not traded on an exchange are valued at that investment company’s net asset value per share.
Corporate and government debt securities (of U.S. or foreign issuers) and municipal debt securities, short-term notes, mortgage-backed securities, collateralized mortgage obligations, and asset-backed securities are valued at the mean between the bid and asked prices utilizing evaluated prices obtained from third party pricing services or broker-dealers who may use matrix pricing methods to determine the evaluated prices. Pricing services generally price debt securities assuming orderly transactions of an institutional “round lot” size, but some trades may occur in smaller, “odd lot” sizes, sometimes at lower prices than institutional round lot trades. Standard inputs generally considered by third-party pricing vendors include reported trade data, broker-dealer price quotations, benchmark yields, issuer spreads on comparable securities, the credit quality, yield, maturity, as well as other appropriate factors.
Futures contracts and futures options traded on a commodities or futures exchange will be valued at the final settlement price or official closing price on the principal exchange as reported by such principal exchange at its trading session ending at, or most recently prior to, the time when the Fund’s
28 OPPENHEIMER CONSERVATIVE BALANCED FUND/VA
3. Securities Valuation (Continued)
assets are valued.
Securities for which market quotations are not readily available, or when a significant event has occurred that would materially affect the value of the security, are fair valued either (i) by a standardized fair valuation methodology applicable to the security type or the significant event as previously approved by the Valuation Committee and the Fund’s Board or (ii) as determined in good faith by the Manager’s Valuation Committee. The Valuation Committee considers all relevant facts that are reasonably available, through either public information or information available to the Manager, when determining the fair value of a security. Those standardized fair valuation methodologies include, but are not limited to, valuing securities at the last sale price or initially at cost and subsequently adjusting the value based on: changes in company specific fundamentals, changes in an appropriate securities index, or changes in the value of similar securities which may be further adjusted for any discounts related to security-specific resale restrictions. When possible, such methodologies use observable market inputs such as unadjusted quoted prices of similar securities, observable interest rates, currency rates and yield curves. The methodologies used for valuing securities are not necessarily an indication of the risks associated with investing in those securities nor can it be assured that the Fund can obtain the fair value assigned to a security if it were to sell the security.
Classifications
Each investment asset or liability of the Fund is assigned a level at measurement date based on the significance and source of the inputs to its valuation. Various data inputs may be used in determining the value of each of the Fund’s investments as of the reporting period end. These data inputs are categorized in the following hierarchy under applicable financial accounting standards:
1) Level1-unadjusted quoted prices in active markets for identical assets or liabilities (including securities actively traded on a securities exchange)
2) Level2-inputs other than unadjusted quoted prices that are observable for the asset or liability (such as unadjusted quoted prices for similar assets and market corroborated inputs such as interest rates, prepayment speeds, credit risks, etc.)
3) Level3-significant unobservable inputs (including the Manager’s own judgments about assumptions that market participants would use in pricing the asset or liability).
The inputs used for valuing securities are not necessarily an indication of the risks associated with investing in those securities.
The Fund classifies each of its investments in investment companies which are publicly offered as Level 1. Investment companies that are not publicly offered, if any, are classified as Level 2 in the fair value hierarchy.
The table below categorizes amounts that are included in the Fund’s Statement of Assets and Liabilities at period end based on valuation input level:
| | | | | | | | | | | | | | | | |
| | | Level 1— Unadjusted Quoted Prices | | | Level 2— Other Significant Observable Inputs | | | Level 3— Significant Unobservable Inputs | | | Value | |
| |
Assets Table | | | | | | | | | | | | | | | | |
Investments, at Value: | | | | | | | | | | | | | | | | |
| Common Stocks | | | | | | | | | | | | | | | | |
Consumer Discretionary | | $ | 10,224,541 | | | $ | — | | | $ | — | | | $ | 10,224,541 | |
Consumer Staples | | | 1,415,503 | | | | 461,437 | | | | — | | | | 1,876,940 | |
Energy | | | 3,053,232 | | | | — | | | | — | | | | 3,053,232 | |
Financials | | | 10,553,163 | | | | — | | | | — | | | | 10,553,163 | |
Health Care | | | 8,277,458 | | | | — | | | | — | | | | 8,277,458 | |
Industrials | | | 7,173,923 | | | | — | | | | — | | | | 7,173,923 | |
Information Technology | | | 12,577,145 | | | | — | | | | — | | | | 12,577,145 | |
Materials | | | 1,747,194 | | | | — | | | | — | | | | 1,747,194 | |
Telecommunication Services | | | 2,113,478 | | | | — | | | | — | | | | 2,113,478 | |
Utilities | | | 1,544,038 | | | | 508,672 | | | | — | | | | 2,052,710 | |
| Asset-Backed Securities | | | — | | | | 24,608,606 | | | | — | | | | 24,608,606 | |
| Mortgage-Backed Obligations | | | — | | | | 61,491,764 | | | | — | | | | 61,491,764 | |
| U.S. Government Obligation | | | — | | | | 549,780 | | | | — | | | | 549,780 | |
Non-Convertible Corporate Bonds and Notes | | | — | | | | 64,990,025 | | | | — | | | | 64,990,025 | |
| Investment Company | | | 5,367,607 | | | | — | | | | — | | | | 5,367,607 | |
| | | | |
| Total Investments, at Value | | | 64,047,282 | | | | 152,610,284 | | | | — | | | | 216,657,566 | �� |
Other Financial Instruments: | | | | | | | | | | | | | | | | |
| Futures contracts | | | 521,614 | | | | — | | | | — | | | | 521,614 | |
| | | | |
Total Assets | | $ | 64,568,896 | | | $ | 152,610,284 | | | $ | — | | | $ | 217,179,180 | |
| | | | |
| | | | |
Liabilities Table Other Financial Instruments: | | | | | | | | | | | | | | | | |
| Futures contracts | | $ | (175,343 | ) | | $ | — | | | $ | — | | | $ | (175,343 | ) |
| | | | |
Total Liabilities | | $ | (175,343 | ) | | $ | — | | | $ | — | | | $ | (175,343 | ) |
| | | | |
Forward currency exchange contracts and futures contracts, if any, are reported at their unrealized appreciation/depreciation at measurement date, which represents the change in the contract’s value from trade date. All additional assets and liabilities included in the above table are reported at their market value at measurement date.
29 OPPENHEIMER CONSERVATIVE BALANCED FUND/VA
NOTES TO FINANCIAL STATEMENTSContinued
3. Securities Valuation (Continued)
The table below shows the transfers between Level 2 and Level 3. The Fund’s policy is to recognize transfers in and transfers out as of the beginning of the reporting period.
| | | | | | | | |
| | | Transfers into Level 2* | | | Transfers out of Level 3* | |
| |
Assets Table | | | | | | | | |
Investments, at Value: | | | | | | | | |
| Mortgage-Backed Obligations | | $ | 128,201 | | | $ | (128,201) | |
| | | | |
| Total Assets | | $ | 128,201 | | | $ | (128,201) | |
| | | | |
*Transferred from Level 3 to Level 2 due to the availability of market data for this security.
4. Investments and Risks
Investments in Affiliated Funds. The Fund is permitted to invest in other mutual funds advised by the Manager (“Affiliated Funds”). Affiliated Funds are management investment companies registered under the 1940 Act, as amended. The Manager is the investment adviser of, and theSub-Adviser provides investment and related advisory services to, the Affiliated Funds. When applicable, the Fund’s investments in Affiliated Funds are included in the Statement of Investments. Shares of Affiliated Funds are valued at their net asset value per share. As a shareholder, the Fund is subject to its proportional share of the Affiliated Funds’ expenses, including their management fee. The Manager will waive fees and/or reimburse Fund expenses in an amount equal to the indirect management fees incurred through the Fund’s investment in the Affiliated Funds.
Each of the Affiliated Funds in which the Fund invests has its own investment risks, and those risks can affect the value of the Fund’s investments and therefore the value of the Fund’s shares. To the extent that the Fund invests more of its assets in one Affiliated Fund than in another, the Fund will have greater exposure to the risks of that Affiliated Fund.
Investments in Money Market Instruments.The Fund is permitted to invest its free cash balances in money market instruments to provide liquidity or for defensive purposes. The Fund may invest in money market instruments by investing in Class E shares of Oppenheimer Institutional Government Money Market Fund (“IGMMF”), which is an Affiliated Fund. IGMMF is regulated as a money market fund under the 1940 Act, as amended. The Fund may also invest in money market instruments directly or in other affiliated or unaffiliated money market funds.
Master Limited Partnerships (“MLPs”).MLPs issue common units that represent an equity ownership interest in a partnership and provide limited voting rights. MLP common units are registered with the Securities and Exchange Commission (“SEC”), and are freely tradable on securities exchanges such as the NYSE and the NASDAQ Stock Market (“NASDAQ”), or in theover-the-counter (“OTC”) market. An MLP consists of one or more general partners, who conduct the business, and one or more limited partners, who contribute capital. MLP common unit holders have a limited role in the partnership’s operations and management. The Fund, as a limited partner, normally would not be liable for the debts of the MLP beyond the amounts the Fund has contributed, but would not be shielded to the same extent that a shareholder of a corporation would be. In certain circumstances creditors of an MLP would have the right to seek return of capital distributed to a limited partner. This right of an MLP’s creditors would continue after the Fund sold its investment in the MLP.
Securities on a When-Issued or Delayed Delivery Basis.The Fund may purchase securities on a “when-issued” basis, and may purchase or sell securities on a “delayed delivery” basis. “When-issued” or “delayed delivery” refers to securities whose terms and indenture are available and for which a market exists, but which are not available for immediate delivery. Delivery and payment for securities that have been purchased by the Fund on a when-issued basis normally takes place within six months and possibly as long as two years or more after the trade date. During this period, such securities do not earn interest, are subject to market fluctuation and may increase or decrease in value prior to their delivery. The purchase of securities on a when-issued basis may increase the volatility of the Fund’s net asset value to the extent the Fund executes such transactions while remaining substantially fully invested. When the Fund engages in when-issued or delayed delivery transactions, it relies on the buyer or seller, as the case may be, to complete the transaction. Their failure to do so may cause the Fund to lose the opportunity to obtain or dispose of the security at a price and yield it considers advantageous. The Fund may also sell securities that it purchased on a when-issued basis or forward commitment prior to settlement of the original purchase.
At period end, the Fund had purchased securities issued on a when-issued or delayed delivery basis and sold securities issued on a delayed delivery basis as follows:
| | | | |
| | | When-Issued or Delayed Delivery Basis Transactions | |
| |
Purchased securities | | | $51,908,726 | |
| Sold securities | | | 14,930,759 | |
The Fund may enter into “forward roll” transactions with respect to mortgage-related securities. In this type of transaction, the Fund sells a mortgage-related security to a buyer and simultaneously agrees to repurchase a similar security (same type, coupon and maturity) at a later date at a set price. During the period between the sale and the repurchase, the Fund will not be entitled to receive interest and principal payments on the securities that have been sold. The Fund records the incremental difference between the forward purchase and sale of each forward roll as realized gain (loss) on investments or as fee income in the case of such transactions that have an associated fee in lieu of a difference in the forward purchase and sale price.
30 OPPENHEIMER CONSERVATIVE BALANCED FUND/VA
4. Investments and Risks (Continued)
Forward roll transactions may be deemed to entail embedded leverage since the Fund purchases mortgage-related securities with extended settlement dates rather than paying for the securities under a normal settlement cycle. This embedded leverage increases the Fund’s market value of investments relative to its net assets which can incrementally increase the volatility of the Fund’s performance. Forward roll transactions can be replicated over multiple settlement periods.
Risks of entering into forward roll transactions include the potential inability of the counterparty to meet the terms of the agreement; the potential of the Fund to receive inferior securities at redelivery as compared to the securities sold to the counterparty; and counterparty credit risk.
At period end, the Fund pledged $32,867 of collateral to the counterparty for forward roll transactions.
Restricted Securities.At period end, investments in securities included issues that are restricted. A restricted security may have a contractual restriction on its resale and is valued under methods approved by the Board of Trustees as reflecting fair value. Securities that are restricted are marked with an applicable footnote on the Statement of Investments. Restricted securities are reported on a schedule following the Statement of Investments.
Equity Security Risk.Stocks and other equity securities fluctuate in price. The value of the Fund’s portfolio may be affected by changes in the equity markets generally. Equity markets may experience significant short-term volatility and may fall sharply at times. Different markets may behave differently from each other and U.S. equity markets may move in the opposite direction from one or more foreign stock markets. Adverse events in any part of the equity or fixed-income markets may have unexpected negative effects on other market segments.
The prices of individual equity securities generally do not all move in the same direction at the same time and a variety of factors can affect the price of a particular company’s securities. These factors may include, but are not limited to, poor earnings reports, a loss of customers, litigation against the company, general unfavorable performance of the company’s sector or industry, or changes in government regulations affecting the company or its industry.
Shareholder Concentration.At period end, one shareholder owned 20% or more of the Fund’s total outstanding shares.
The shareholder is a related partyof the Fund. Related parties may include, but are not limited to, the investment manager and its affiliates, affiliated broker dealers, fund of funds, and directors or employees.The related partyowned 43% of the Fund’s total outstanding shares at period end.
5. Market Risk Factors
The Fund’s investments in securities and/or financial derivatives may expose the Fund to various market risk factors:
Commodity Risk. Commodity risk relates to the change in value of commodities or commodity indexes as they relate to increases or decreases in the commodities market. Commodities are physical assets that have tangible properties. Examples of these types of assets are crude oil, heating oil, metals, livestock, and agricultural products.
Credit Risk.Credit risk relates to the ability of the issuer of debt to meet interest and principal payments, or both, as they come due. In general, lower-grade, higher-yield debt securities are subject to credit risk to a greater extent than lower-yield, higher-quality securities.
Equity Risk. Equity risk relates to the change in value of equity securities as they relate to increases or decreases in the general market.
Foreign Exchange Rate Risk. Foreign exchange rate risk relates to the change in the U.S. dollar value of a security held that is denominated in a foreign currency. The U.S. dollar value of a foreign currency denominated security will decrease as the dollar appreciates against the currency, while the U.S. dollar value will increase as the dollar depreciates against the currency.
Interest Rate Risk.Interest rate risk refers to the fluctuations in value of fixed-income securities resulting from the inverse relationship between price and yield. For example, an increase in general interest rates will tend to reduce the market value of already issued fixed-income investments, and a decline in general interest rates will tend to increase their value. In addition, debt securities with longer maturities, which tend to have higher yields, are subject to potentially greater fluctuations in value from changes in interest rates than obligations with shorter maturities.
Volatility Risk.Volatility risk refers to the magnitude of the movement, but not the direction of the movement, in a financial instrument’s price over a defined time period. Large increases or decreases in a financial instrument’s price over a relative time period typically indicate greater volatility risk, while small increases or decreases in its price typically indicate lower volatility risk.
6. Use of Derivatives
The Fund’s investment objective not only permits the Fund to purchase investment securities, it also allows the Fund to enter into various types of derivatives contracts, including, but not limited to, futures contracts, forward currency exchange contracts, credit default swaps, interest rate swaps, total return swaps, variance swaps and purchased and written options. In doing so, the Fund will employ strategies in differing combinations to permit it to increase, decrease, or change the level or types of exposure to market risk factors. These instruments may allow the Fund to pursue its objectives more quickly and efficiently than if it were to make direct purchases or sales of securities capable of effecting a similar response to market factors. Such contracts may be entered into through a bilateralover-the-counter (“OTC”) transaction, or through a securities or futures exchange and cleared through a clearinghouse.
Derivatives may have little or no initial cash investment relative to their market value exposure and therefore can produce significant gains or losses in excess of their cost due to changes in the market risk factors and the overall market. This use of embedded leverage allows the Fund to increase its market value exposure relative to its net assets and can substantially increase the volatility of the Fund’s performance. In instances where the Fund is using derivatives to decrease, or hedge, exposures to market risk factors for securities held by the Fund, there are also risks that those derivatives may
31 OPPENHEIMER CONSERVATIVE BALANCED FUND/VA
NOTES TO FINANCIAL STATEMENTSContinued
6. Use of Derivatives (Continued)
not perform as expected resulting in losses for the combined or hedged positions. Some derivatives have the potential for unlimited loss, regardless of the size of the Fund’s initial investment.
Additional associated risks from investing in derivatives also exist and potentially could have significant effects on the valuation of the derivative and the Fund. Typically, the associated risks are not the risks that the Fund is attempting to increase or decrease exposure to, per its investment objectives, but are the additional risks from investing in derivatives. Examples of these associated risks are liquidity risk, which is the risk that the Fund will not be able to sell the derivative in the open market in a timely manner, and counterparty credit risk, which is the risk that the counterparty will not fulfill its obligation to the Fund.
The Fund’s actual exposures to these market risk factors and associated risks during the period are discussed in further detail, by derivative type, below.
Futures Contracts
A futures contract is a commitment to buy or sell a specific amount of a commodity, financial instrument or currency at a negotiated price on a stipulated future date. The Fund may buy and sell futures contracts and may also buy or write put or call options on these futures contracts. Futures contracts and options thereon are generally entered into on a regulated futures exchange and cleared through a clearinghouse associated with the exchange.
Upon entering into a futures contract, the Fund is required to deposit either cash or securities (initial margin) in an amount equal to a certain percentage of the contract value in an account registered in the futures commission merchant’s name. Subsequent payments (variation margin) are paid to or from the futures commission merchant each day equal to the daily changes in the contract value. Such payments are recorded as unrealized gains and losses. Should the Fund fail to make requested variation margin payments, the futures commission merchant can gain access to the initial margin to satisfy the Fund’s payment obligations.
Futures contracts are reported on a schedule following the Statement of Investments. Securities held by a futures commission merchant to cover initial margin requirements on open futures contracts are noted in the Statement of Investments. Cash held by a futures commission merchant to cover initial margin requirements on open futures contracts and the receivable and/or payable for the daily mark to market for the variation margin are noted in the Statement of Assets and Liabilities. The net change in unrealized appreciation and depreciation is reported in the Statement of Operations. Realized gains (losses) are reported in the Statement of Operations at the closing or expiration of futures contracts.
The Fund may purchase and/or sell financial futures contracts and options on futures contracts to gain exposure to, or decrease exposure to interest rate risk, equity risk, foreign exchange rate risk, volatility risk, or commodity risk.
During the reporting period, the Fund had an ending monthly average market value of $10,112,181 and $56,863,341 on futures contracts purchased and sold, respectively.
Additional associated risks of entering into futures contracts (and related options) include the possibility that there may be an illiquid market where the Fund is unable to liquidate the contract or enter into an offsetting position and, if used for hedging purposes, the risk that the price of the contract will correlate imperfectly with the prices of the Fund’s securities.
Swap Contracts
The Fund may enter into swap contract agreements with a counterparty to exchange a series of cash flows based on either specified reference rates, the price or volatility of asset ornon-asset references, or the occurrence of a credit event, over a specified period. Swaps can be executed in abi-lateral privately negotiated arrangement with a dealer in an OTC transaction (“OTC swaps”) or executed on a regulated market. Certain swaps, regardless of the venue of their execution, are required to be cleared through a clearinghouse (“centrally cleared swaps”). Swap contracts may include interest rate, equity, debt, index, total return, credit default, currency, and volatility swaps.
Swap contracts are reported on a schedule following the Statement of Investments. The values of centrally cleared swap and OTC swap contracts are aggregated by positive and negative values and disclosed separately on the Statement of Assets and Liabilities. The unrealized appreciation (depreciation) related to the change in the valuation of the notional amount of the swap is combined with the accrued interest due to (owed by) the Fund, if any, at termination or settlement. The net change in this amount during the period is included on the Statement of Operations. The Fund also records any periodic payments received from (paid to) the counterparty, including at termination, under such contracts as realized gain (loss) on the Statement of Operations.
Swap contract agreements are exposed to the market risk factor of the specific underlying reference rate or asset. Swap contracts are typically more attractively priced compared to similar investments in related cash securities because they isolate the risk to one market risk factor and eliminate the other market risk factors. Investments in cash securities (for instance bonds) have exposure to multiple risk factors (credit and interest rate risk). Because swaps have embedded leverage, they can expose the Fund to substantial risk in the isolated market risk factor.
Credit Default Swap Contracts.A credit default swap is a contract that enables an investor to buy or sell protection against a defined-issuer credit event, such as the issuer’s failure to make timely payments of interest or principal on a debt security, bankruptcy or restructuring. The Fund may enter into credit default swaps either by buying or selling protection on a corporate issuer, sovereign issuer, or a basket or index of issuers (the “reference asset”).
The buyer of protection pays a periodic fee to the seller of protection based on the notional amount of the swap contract. The seller of protection agrees to compensate the buyer of protection for future potential losses as a result of a credit event on the reference asset. The contract effectively transfers the credit event risk of the reference asset from the buyer of protection to the seller of protection.
The ongoing value of the contract will fluctuate throughout the term of the contract based primarily on the credit risk of the reference asset. If the credit quality of the reference asset improves relative to the credit quality at contract initiation, the buyer of protection may have an unrealized
32 OPPENHEIMER CONSERVATIVE BALANCED FUND/VA
6. Use of Derivatives (Continued)
loss greater than the anticipated periodic fee owed. This unrealized loss would be the result of current credit protection being cheaper than the cost of credit protection at contract initiation. If the buyer elects to terminate the contract prior to its maturity, and there has been no credit event, this unrealized loss will become realized. If the contract is held to maturity, and there has been no credit event, the realized loss will be equal to the periodic fee paid over the life of the contract.
If there is a credit event, the buyer of protection can exercise its rights under the contract and receive a payment from the seller of protection equal to the notional amount of the swap less the market value of specified debt securities issued by the reference asset. Upon exercise of the contract the difference between such value and the notional amount is recorded as realized gain (loss) and is included on the Statement of Operations.
The Fund may purchase or sell credit protection through credit default swaps to increase or decrease exposure to the credit risk of individual issuers and/or indexes of issuers that are either unavailable or considered to be less attractive in the bond market.
For the reporting period, the Fund had ending monthly average notional amounts of $48,077 on credit default swaps to sell protection.
Additional associated risks to the Fund include counterparty credit risk and liquidity risk.
At period end, the Fund had no credit default swap agreements outstanding.
Swaption Transactions
The Fund may enter into a swaption contract which grants the purchaser the right, but not the obligation, to enter into a swap transaction at preset terms detailed in the underlying agreement within a specified period of time. The purchaser pays a premium to the swaption writer who bears the risk of unfavorable changes in the preset terms on the underlying swap.
Purchased swaptions are reported as a component of investments in the Statement of Investments and the Statement of Assets and Liabilities. Written swaptions are reported on a schedule following the Statement of Investments and their value is reported as a separate asset or liability line item in the Statement of Assets and Liabilities. The net change in unrealized appreciation or depreciation on written swaptions is separately reported in the Statement of Operations. When a swaption is exercised, the cost of the swap is adjusted by the amount of premium paid or received. Upon the expiration or closing of an unexercised swaption contract, a gain or loss is reported in the Statement of Operations for the amount of the premium paid or received.
The Fund generally will incur a greater risk when it writes a swaption than when it purchases a swaption. When the Fund writes a swaption it will become obligated, upon exercise of the swaption, according to the terms of the underlying agreement. Swaption contracts written by the Fund do not give rise to counterparty credit risk prior to exercise as they obligate the Fund, not its counterparty, to perform. When the Fund purchases a swaption it only risks losing the amount of the premium it paid if the swaption expires unexercised. However, when the Fund exercises a purchased swaption there is a risk that the counterparty will fail to perform or otherwise default on its obligations under the swaption contract.
The Fund may purchase swaptions which give it the option to buy or sell credit protection through credit default swaps in order to decrease or increase exposure to the credit risk of individual issuers and/ or indexes of issuers. A swaption selling protection becomes more valuable as the likelihood of a credit event on the reference asset decreases. A swaption buying protection becomes more valuable as the likelihood of a credit event on the reference asset increases.
At period end, the Fund had no purchased swaption contracts outstanding.
The Fund may write swaptions which give it the obligation, if exercised by the purchaser, to sell or buy credit protection through credit default swaps in order to increase or decrease exposure to the credit risk of individual issuers and/or indexes of issuers. A written swaption selling protection becomes more valuable as the likelihood of a credit event on the reference asset decreases. A written swaption buying protection becomes more valuable as the likelihood of a credit event on the reference asset increases.
During the reporting period, the Fund had an ending monthly average market value of $1,186 and $533 on purchased and written swaptions, respectively.
At period end, the Fund had no written swaption contracts outstanding.
Counterparty Credit Risk.Derivative positions are subject to the risk that the counterparty will not fulfill its obligation to the Fund. The Fund intends to enter into derivative transactions with counterparties that the Manager believes to be creditworthy at the time of the transaction.
The Fund’s risk of loss from counterparty credit risk on OTC derivatives is generally limited to the aggregate unrealized gain netted against any collateral held by the Fund. For OTC options purchased, the Fund bears the risk of loss of the amount of the premiums paid plus the positive change in market values net of any collateral held by the Fund should the counterparty fail to perform under the contracts. Options written by the Fund do not typically give rise to counterparty credit risk, as options written generally obligate the Fund and not the counterparty to perform.
To reduce counterparty risk with respect to OTC transactions, the Fund has entered into master netting arrangements, established within the Fund’s International Swap and Derivatives Association, Inc. (“ISDA”) master agreements, which allow the Fund to make (or to have an entitlement to receive) a single net payment in the event of default(close-out netting) for outstanding payables and receivables with respect to certain OTC positions in swaps, options, swaptions, and forward currency exchange contracts for each individual counterparty. In addition, the Fund may require that certain counterparties post cash and/or securities in collateral accounts to cover their net payment obligations for those derivative contracts subject to ISDA master agreements. If the counterparty fails to perform under these contracts and agreements, the cash and/or securities will be made available to the Fund.
ISDA master agreements include credit related contingent features which allow counterparties to OTC derivatives to terminate derivative contracts prior to maturity in the event that, for example, the Fund’s net assets decline by a stated percentage or the Fund fails to meet the terms of its ISDA master agreements, which would cause the Fund to accelerate payment of any net liability owed to the counterparty.
For financial reporting purposes, the Fund does not offset derivative assets and derivative liabilities that are subject to netting arrangements in the
33 OPPENHEIMER CONSERVATIVE BALANCED FUND/VA
NOTES TO FINANCIAL STATEMENTSContinued
6. Use of Derivatives (Continued)
Statement of Assets and Liabilities. Bankruptcy or insolvency laws of a particular jurisdiction may impose restrictions on or prohibitions against the right of offset in bankruptcy, insolvency or other events.
The Fund’s risk of loss from counterparty credit risk on exchange-traded derivatives cleared through a clearinghouse and for centrally cleared swaps is generally considered lower than as compared to OTC derivatives. However, counterparty credit risk exists with respect to initial and variation margin deposited/paid by the Fund that is held in futures commission merchant, broker and/or clearinghouse accounts for such exchange-traded derivatives and for centrally cleared swaps.
With respect to centrally cleared swaps, such transactions will be submitted for clearing, and if cleared, will be held in accounts at futures commission merchants or brokers that are members of clearinghouses. While brokers, futures commission merchants and clearinghouses are required to segregate customer margin from their own assets, in the event that a broker, futures commission merchant or clearinghouse becomes insolvent or goes into bankruptcy and at that time there is a shortfall in the aggregate amount of margin held by the broker, futures commission merchant or clearinghouse for all its customers, U.S. bankruptcy laws will typically allocate that shortfall on apro-rata basis across all the broker’s, futures commission merchant’s or clearinghouse’s customers, potentially resulting in losses to the Fund.
There is the risk that a broker, futures commission merchant or clearinghouse will decline to clear a transaction on the Fund’s behalf, and the Fund may be required to pay a termination fee to the executing broker with whom the Fund initially enters into the transaction. Clearinghouses may also be permitted to terminate centrally cleared swaps at any time. The Fund is also subject to the risk that the broker or futures commission merchant will improperly use the Fund’s assets deposited/paid as initial or variation margin to satisfy payment obligations of another customer. In the event of a default by another customer of the broker or futures commission merchant, the Fund might not receive its variation margin payments from the clearinghouse, due to the manner in which variation margin payments are aggregated for all customers of the broker/futures commission merchant.
Collateral and margin requirements differ by type of derivative. Margin requirements are established by the broker, futures commission merchant or clearinghouse for exchange-traded and cleared derivatives, including centrally cleared swaps. Brokers, futures commission merchants and clearinghouses can ask for margin in excess of the regulatory minimum, or increase the margin amount, in certain circumstances.
Collateral terms are contract specific for OTC derivatives. For derivatives traded under an ISDA master agreement, the collateral requirements are typically calculated by netting the mark to market amount for each transaction under such agreement and comparing that amount to the value of any collateral currently pledged by the Fund or the counterparty.
For financial reporting purposes, cash collateral that has been pledged to cover obligations of the Fund, if any, is reported separately on the Statement of Assets and Liabilities as cash pledged as collateral.Non-cash collateral pledged by the Fund, if any, is noted in the Statement of Investments. Generally, the amount of collateral due from or to a party must exceed a minimum transfer amount threshold (e.g., $250,000) before a transfer has to be made. To the extent amounts due to the Fund from its counterparties are not fully collateralized, contractually or otherwise, the Fund bears the risk of loss from counterparty nonperformance.
The following table presents the valuations of derivative instruments by risk exposure as reported within the Statement of Assets and Liabilities at period end:
| | | | | | | | | | | | |
| | | Asset Derivatives | | | Liability Derivatives | |
Derivatives Not Accounted for as Hedging Instruments | | Statement of Assets and Liabilities Location | | Value | | | Statement of Assets and Liabilities Location | | Value | |
| |
Interest rate contracts Variation margin receivable | | $ | 36,813* | | | Variation margin payable | | $ | 46,158* | |
*Includes only the current day’s variation margin. Prior variation margin movements have been reflected in cash on the Statement of Assets and Liabilities upon receipt or payment.
The effect of derivative instruments on the Statement of Operations is as follows:
| | | | | | | | | | | | | | | | | | | | |
Amount of Realized Gain or (Loss) Recognized on Derivatives | |
Derivatives Not Accounted for as Hedging Instruments | | Investment transactions in unaffiliated companies* | | | Swaption contracts written | | | Futures contracts | | | Swap contracts | | | Total | |
| |
| Credit contracts | | $ | (19,040 | ) | | $ | 9,030 | | | $ | — | | | $ | (3,222 | ) | | $ | (13,232 | ) |
| Interest rate contracts | | | — | | | | — | | | | (605,985 | ) | | | — | | | | (605,985 | ) |
| | | | |
| Total | | $ | (19,040 | ) | | $ | 9,030 | | | $ | (605,985 | ) | | $ | (3,222 | ) | | $ | (619,217 | ) |
| | | | |
* Includes purchased option contacts and purchased swaption contracts, if any.
| | | | |
Amount of Change in Unrealized Gain or (Loss) Recognized on Derivatives | |
Derivatives Not Accounted for as Hedging Instruments | | Futures
contracts | |
| |
| Interest rate contracts | | $ | 216,182 | |
34 OPPENHEIMER CONSERVATIVE BALANCED FUND/VA
7. Shares of Beneficial Interest
The Fund has authorized an unlimited number of $0.001 par value shares of beneficial interest of each class. Transactions in shares of beneficial interest were as follows:
| | | | | | | | | | | | | | | | | | | | | | | | |
| | | Year Ended December 31, 2018 | | | Year Ended December 31, 2017 | |
| | | Shares | | | Amount | | | Shares | | | Amount | |
| |
Non-Service Shares | | | | | | | | | | | | | | | | | | | | | | | | |
| Sold | | | 165,620 | | | | | | | $ | 2,527,555 | | | | 167,674 | | | | | | | $ | 2,587,806 | |
| Dividends and/or distributions reinvested | | | 439,719 | | | | | | | | 6,688,120 | | | | 217,048 | | | | | | | | 3,346,883 | |
| Redeemed | | | (1,310,778) | | | | | | | | (20,206,226) | | | | (1,568,489) | | | | | | | | (24,239,203) | |
| | | | |
Net decrease | | | (705,439) | | | | | | | $ | (10,990,551) | | | | (1,183,767) | | | | | | | $ | (18,304,514) | |
| | | | |
| | | | | | | | | | | | | | | | | | | | | | | | |
| |
Service Shares | | | | | | | | | | | | | | | | | | | | | | | | |
| Sold | | | 158,863 | | | | | | | $ | 2,411,795 | | | | 258,277 | | | | | | | $ | 3,974,804 | |
| Dividends and/or distributions reinvested | | | 132,175 | | | | | | | | 1,986,593 | | | | 58,365 | | | | | | | | 889,490 | |
| Redeemed | | | (554,938) | | | | | | | | (8,421,142) | | | | (557,584) | | | | | | | | (8,498,812) | |
| | | | |
Net decrease | | | (263,900) | | | | | | | $ | (4,022,754) | | | | (240,942) | | | | | | | $ | (3,634,518) | |
| | | | |
8. Purchases and Sales of Securities
The aggregate cost of purchases and proceeds from sales of securities, other than short-term obligations and investments in IGMMF, for the reporting period were as follows:
| | | | | | | | | | | | |
| | | Purchases | | | | | | Sales | |
| |
Investment securities | | | $113,417,540 | | | | | | | | $119,564,101 | |
U.S. government and government agency obligations | | | — | | | | | | | | 229,898 | |
To Be Announced (TBA) mortgage-related securities | | | 685,887,902 | | | | | | | | 703,549,464 | |
9. Fees and Other Transactions with Affiliates
Management Fees.Under the investment advisory agreement, the Fund pays the Manager a management fee based on the daily net assets of the Fund at an annual rate as shown in the following table:
| | | | |
Fee Schedule | |
Up to $200 million | | | 0.75% | |
Next $200 million | | | 0.72 | |
Next $200 million | | | 0.69 | |
Next $200 million | | | 0.66 | |
Over $800 million | | | 0.60 | |
The Fund’s effective management fee for the reporting period was 0.75% of average annual net assets before any applicable waivers.
Sub-Adviser Fees.The Manager has retained theSub-Adviser to provide theday-to-day portfolio management of the Fund. Under theSub-Advisory Agreement, the Manager pays theSub-Adviser an annual fee in monthly installments, equal to a percentage of the investment management fee collected by the Manager from the Fund, which shall be calculated after any investment management fee waivers. The fee paid to theSub-Adviser is paid by the Manager, not by the Fund.
Transfer Agent Fees.OFI Global (the “Transfer Agent”) serves as the transfer and shareholder servicing agent for the Fund. The Fund pays the Transfer Agent a fee based on annual net assets. Fees incurred and average net assets for each class with respect to these services are detailed in the Statement of Operations and Financial Highlights, respectively.
Sub-Transfer Agent Fees.The Transfer Agent has retained Shareholder Services, Inc., a wholly-owned subsidiary of OFI (the“Sub-Transfer Agent”), to provide theday-to-day transfer agent and shareholder servicing of the Fund. Under theSub-Transfer Agency Agreement, the Transfer Agent pays theSub-Transfer Agent an annual fee in monthly installments, equal to a percentage of the transfer agent fee collected by the Transfer Agent from the Fund, which shall be calculated after any applicable fee waivers. The fee paid to theSub-Transfer Agent is paid by the Transfer Agent, not by the Fund.
Trustees’ Compensation. The Fund’s Board of Trustees (“Board”) has adopted a compensation deferral plan for Independent Trustees that enables Trustees to elect to defer receipt of all or a portion of the annual compensation they are entitled to receive from the Fund. For purposes of determining the amount owed to the Trustees under the plan, deferred amounts are treated as though equal dollar amounts had been invested in shares of the Fund or in other Oppenheimer funds selected by the Trustees. The Fund purchases shares of the funds selected for deferral by the Trustees in amounts equal to his or her deemed investment, resulting in a Fund asset equal to the deferred compensation liability. Such assets are included as a component of “Other” within the asset section of the Statement of Assets and Liabilities. Deferral of Trustees’ fees under the plan will not affect the net assets of the Fund and will not materially affect the Fund’s assets, liabilities or net investment income per share. Amounts will be deferred until distributed in accordance with the compensation deferral plan.
35 OPPENHEIMER CONSERVATIVE BALANCED FUND/VA
NOTES TO FINANCIAL STATEMENTSContinued
9. Fees and Other Transactions with Affiliates (Continued)
Distribution and Service Plan for Service Shares.The Fund has adopted a Distribution and Service Plan (the “Plan”) pursuant to Rule12b-1 under the 1940 Act for Service shares to pay OppenheimerFunds Distributor, Inc. (the “Distributor”), for distribution related services, personal service and account maintenance for the Fund’s Service shares. Under the Plan, payments are made periodically at an annual rate of 0.25% of the daily net assets of Service shares of the Fund. The Distributor currently uses all of those fees to compensate sponsors of the insurance product that offers Fund shares, for providing personal service and maintenance of accounts of their variable contract owners that hold Service shares. These fees are paid out of the Fund’s assets on anon-going basis and increase operating expenses of the Service shares, which results in lower performance compared to the Fund’s shares that are not subject to a service fee. Fees incurred by the Fund under the Plan are detailed in the Statement of Operations.
Waivers and Reimbursements of Expenses.The Manager has contractually agreed to limit the Fund’s expenses after payments, waivers and/or reimbursements and reduction to custodian expenses, excluding any applicable dividend expense, taxes, interest and fees from borrowing, any subsidiary expenses, Acquired Fund Fees and Expenses, brokerage commissions, unusual and infrequent expenses and certain other Fund expenses; so that those expenses, as percentages of daily net assets, will not exceed the annual rate of 0.67% forNon-Service shares and 0.92% for Service shares as calculated on the daily net assets of the Fund.
During the reporting period, the Manager waived fees and/or reimbursed the Fund as follows:
| | | | |
Non-Service Shares | | $ | 461,970 | |
Service Shares | | | 143,262 | |
This fee waiver and/or expense reimbursement may not be amended or withdrawn for one year from the date of the Fund’s prospectus, unless approved by the Board.
The Manager will waive fees and/or reimburse Fund expenses in an amount equal to the indirect management fees incurred through the Fund’s investment in IGMMF. During the reporting period, the Manager waived fees and/or reimbursed the Fund $5,370 for IGMMF management fees.
10. Borrowings and Other Financing
Joint Credit Facility.A number of mutual funds managed by the Manager participate in a $1.95 billion revolving credit facility (the “Facility”) intended to provide short-term financing, if necessary, subject to certain restrictions in connection with atypical redemption activity. Expenses and fees related to the Facility are paid by the participating funds and are disclosed separately or as other expenses on the Statement of Operations. The Fund did not utilize the Facility during the reporting period.
11. Pending Acquisition
On October 18, 2018, Massachusetts Mutual Life Insurance Company, an indirect corporate parent of theSub-Adviser and the Manager, announced that it has entered into an agreement whereby Invesco Ltd. (“Invesco”), a global investment management company, will acquire theSub-Adviser (the “Transaction”). In connection with the Transaction, on January 11, 2019, the Fund’s Board unanimously approved an Agreement and Plan of Reorganization (the “Agreement”), which provides for the transfer of the assets and liabilities of the Fund to a corresponding, newly formed fund (the “Acquiring Fund”) in the Invesco family of funds (the “Reorganization”) in exchange for shares of the corresponding Acquiring Fund of equal value to the value of the shares of the Fund as of the close of business on the closing date. Although the Acquiring Fund will be managed by Invesco Advisers, Inc., the Acquiring Fund will, as of the closing date, have the same investment objective and substantially similar principal investment strategies and risks as the Fund. After the Reorganization, Invesco Advisers, Inc. will be the investment adviser to the Acquiring Fund, and the Fund will be liquidated and dissolved under applicable law and terminate its registration under the Investment Company Act of 1940, as amended. The Reorganization is expected to be atax-free reorganization for U.S. federal income tax purposes.
The Reorganization is subject to the approval of shareholders of the Fund. Shareholders of record of the Fund on January 14, 2019 will be entitled to vote on the Reorganization and will receive a combined prospectus and proxy statement describing the Reorganization, the shareholder meeting, and a discussion of the factors the Fund’s Board considered in approving the Agreement. The combined prospectus and proxy statement is expected to be distributed to shareholders of record on or about February 28, 2019. The anticipated date of the shareholder meeting is on or about April 12, 2019.
If shareholders approve the Agreement and certain other closing conditions are satisfied or waived, the Reorganization is expected to close during the second quarter of 2019, or as soon as practicable thereafter. This is subject to change.
36 OPPENHEIMER CONSERVATIVE BALANCED FUND/VA
REPORT OF INDEPENDENT REGISTERED PUBLIC ACCOUNTING FIRM
To the Shareholders and Board of Trustees
Oppenheimer Variable Account Funds:
Opinion on the Financial Statements
We have audited the accompanying statement of assets and liabilities of Oppenheimer Conservative Balanced Fund/VA, a separate series of Oppenheimer Variable Account Funds, (the “Fund”), including the statement of investments, as of December 31, 2018, the related statement of operations for the year then ended, the statements of changes in net assets for each of the years in the two year period then ended, and the related notes (collectively, the “financial statements”) and the financial highlights for each of the years in the five year period then ended. In our opinion, the financial statements and financial highlights present fairly, in all material respects, the financial position of the Fund as of December 31, 2018, the results of its operations for the year then ended, the changes in its net assets for each of the years in the two year period then ended, and the financial highlights for each of the years in the five year period then ended, in conformity with U.S. generally accepted accounting principles.
Basis for Opinion
These financial statements and financial highlights are the responsibility of the Fund’s management. Our responsibility is to express an opinion on these financial statements and financial highlights based on our audits. We are a public accounting firm registered with the Public Company Accounting Oversight Board (United States) (“PCAOB”) and are required to be independent with respect to the Fund in accordance with the U.S. federal securities laws and the applicable rules and regulations of the Securities and Exchange Commission and the PCAOB.
We conducted our audits in accordance with the standards of the PCAOB. Those standards require that we plan and perform the audit to obtain reasonable assurance about whether the financial statements and financial highlights are free of material misstatement, whether due to error or fraud. Our audits included performing procedures to assess the risks of material misstatement of the financial statements and financial highlights, whether due to error or fraud, and performing procedures that respond to those risks. Such procedures included examining, on a test basis, evidence regarding the amounts and disclosures in the financial statements and financial highlights. Such procedures also included confirmation of securities owned as of December 31, 2018, by correspondence with the custodian, brokers and the transfer agent, or by other appropriate auditing procedures. Our audits also included evaluating the accounting principles used and significant estimates made by management, as well as evaluating the overall presentation of the financial statements and financial highlights. We believe that our audits provide a reasonable basis for our opinion.
KPMG LLP
We have not been able to determine the specific year that we began serving as the auditor of one or more Oppenheimer Funds investment companies, however we are aware that we have served as the auditor of one or more Oppenheimer Funds investment companies since at least 1969.
Denver, Colorado
February 14, 2019
37 OPPENHEIMER CONSERVATIVE BALANCED FUND/VA
FEDERAL INCOME TAX INFORMATIONUnaudited
In early 2019, if applicable, shareholders of record received information regarding all dividends and distributions paid to them by the Fund during calendar year 2018.
Capital gain distributions of $0.3671 per share were paid toNon-Service and Service shareholders, respectively, on June 19, 2018. Whether received in stock or in cash, the capital gain distribution should be treated by shareholders as a gain from the sale of the capital assets held for more than one year (long-term capital gains).
Dividends, if any, paid by the Fund during the reporting period which are not designated as capital gain distributions should be multiplied by the maximum amount allowable but not less than 22.53% to arrive at the amount eligible for the corporate dividend-received deduction.
The foregoing information is presented to assist shareholders in reporting distributions received from the Fund to the Internal Revenue Service. Because of the complexity of the federal regulations which may affect your individual tax return and the many variations in state and local tax regulations, we recommend that you consult your tax advisor for specific guidance.
38 OPPENHEIMER CONSERVATIVE BALANCED FUND/VA
BOARD APPROVAL OF THE FUND’S INVESTMENT ADVISORY ANDSUB-ADVISORY AGREEMENTSUnaudited
The Fund has entered into an investment advisory agreement with OFI Global Asset Management, Inc. (“OFI Global” or the “Adviser”), a wholly-owned subsidiary of OppenheimerFunds, Inc. (“OFI” or the“Sub-Adviser”) (“OFI Global” and “OFI” together the “Managers”) and OFI Global has entered into asub-advisory agreement with OFI whereby OFI provides investmentsub-advisory services to the Fund (collectively, the “Agreements”). Each year, the Board of Trustees (the “Board”), including a majority of the independent Trustees, is required to determine whether to approve the terms of the Agreements and the renewal thereof. The Investment Company Act of 1940, as amended, requires that the Board request and evaluate, and that the Managers provide, such information as may be reasonably necessary to evaluate the terms of the Agreements. The Board employs an independent consultant to prepare a report that provides information, including comparative information that the Board requests for that purpose. In addition toin-person meetings focused on this evaluation, the Board receives information throughout the year regarding Fund services, fees, expenses and performance.
The Managers and the independent consultant provided information to the Board on the following factors: (i) the nature, quality and extent of the Managers’ services, (ii) the comparative investment performance of the Fund and the Managers, (iii) the fees and expenses of the Fund, including comparative fee and expense information, (iv) the profitability of the Managers and their affiliates, including an analysis of the cost of providing services, (v) whether economies of scale are realized as the Fund grows and whether fee levels reflect these economies of scale for Fund investors and (vi) other benefits to the Managers from their relationship with the Fund. The Board was aware that there are alternatives to retaining the Managers.
Outlined below is a summary of the principal information considered by the Board as well as the Board’s conclusions.
Nature, Quality and Extent of Services. The Board considered information about the nature, quality and extent of the services provided to the Fund and information regarding the Managers’ key personnel who provide such services. The Managers’ duties include providing the Fund with the services of theSub-Adviser’s portfolio managers and investment team, who provide research, analysis and other advisory services in regard to the Fund’s investments; and securities trading services. OFI Global is responsible for oversight of third-party service providers; monitoring compliance with applicable Fund policies and procedures and adherence to the Fund’s investment restrictions; risk management; and oversight of theSub-Adviser. OFI Global is also responsible for providing certain administrative services to the Fund. Those services include providing and supervising all administrative and clerical personnel who are necessary in order to provide effective corporate administration for the Fund; compiling and maintaining records with respect to the Fund’s operations; preparing and filing reports required by the U.S. Securities and Exchange Commission; preparing periodic reports regarding the operations of the Fund for its shareholders; preparing proxy materials for shareholder meetings; and preparing the registration statements required by federal and state securities laws for the sale of the Fund’s shares. OFI Global also provides the Fund with office space, facilities and equipment.
The Board also considered the quality of the services provided and the quality of the Managers’ resources that are available to the Fund. The Board took account of the fact that theSub-Adviser has over fifty years of experience as an investment adviser and that its assets under management rank it among the top mutual fund managers in the United States. The Board evaluated the Managers’ advisory, administrative, accounting, legal, compliance and risk management services, among other services, and information the Board has received regarding the experience and professional qualifications of the Managers’ key personnel and the size and functions of their staff. In its evaluation of the quality of the portfolio management services provided, the Board considered the experience of Krishna Memani and Magnus Krantz, the portfolio managers for the Fund, and theSub-Adviser’s investment team and analysts. The Board members also considered the totality of their experiences with the Managers as directors or trustees of the Fund and other funds advised by the Managers. The Board considered information regarding the quality of services provided by affiliates of the Managers, which the Board members have become knowledgeable about through their experiences with the Managers and in connection with the review or renewal of the Fund’s service agreements or service providers. The Board concluded, in light of the Managers’ experience, reputation, personnel, operations and resources that the Fund benefits from the services provided under the Agreements.
Investment Performance of the Managers and the Fund. Throughout the year, the Managers provided information on the investment performance of the Fund, the Adviser and theSub-Adviser, including comparative performance information. The Board also reviewed information, prepared by the Managers and by the independent consultant, comparing the Fund’s historical performance to relevant market indices and to the performance of other30%-50% equity allocation funds. The Board considered that the Fund outperformed its category median for the five-year period, but underperformed for the remaining periods. The Board further noted that the Fund’s recent underperformance occurred in 2016 and 2017. In that regard, the Board observed that the Fund ranked in the first or second quintile of its category in four of the last six calendar years.
Fees and Expenses of the Fund. The Board reviewed the fees paid to the Adviser and the other expenses borne by the Fund. The Board noted that the Adviser, not the Fund, pays theSub-Adviser’s fee under thesub-advisory agreement. The independent consultant provided comparative data in regard to the fees and expenses of the Fund and other30%-50% equity allocation funds. In reviewing the fees and expenses charged to the VA funds, the Board considered the Adviser’s assertion that, because there is much greater disparity in the fees and services that may be provided by a manager to a VA fund as opposed to a retail fund, when comparing the expenses of the various VA funds to those of retail funds, it is most appropriate to focus on total expenses (rather than on the management fees). The Board considered that the Fund’s total expenses were lower than its peer group median and category median. The Board also considered that the Fund’s contractual management fee was higher than its peer group median and its category median. The Board noted that the Adviser has contractually agreed to waive fees and/or reimburse certain expenses so that the Fund’s total annual operating expenses, as percentages of daily net assets, will not exceed the annual rate of 0.67% forNon-Service Shares and 0.92% for Service Shares. This contractual fee waiver and/or expense reimbursement may not be amended or withdrawn for one year after the date of the Fund’s prospectus, unless approved by the Board. The Board further considered that the Adviser has agreed to waive fees and/or reimburse Fund expenses in an amount equal to the management fees incurred indirectly through the Fund’s investments in funds managed by the Adviser or its affiliates.
Economies of Scale and Profits Realized by the Managers. The Board considered information regarding the Managers’ costs in serving as the Fund’s investment adviser andsub-adviser, including the costs associated with the personnel and systems necessary to manage the Fund, and information regarding the Managers’ profitability from their relationship with the Fund. The Board also considered that the Managers must be able to pay and retain experienced professional personnel at competitive rates to provide quality services to the Fund. The Board reviewed whether the
39 OPPENHEIMER CONSERVATIVE BALANCED FUND/VA
BOARD APPROVAL OF THE FUND’S INVESTMENT ADVISORY ANDSUB-ADVISORY AGREEMENTSUnaudited / Continued
Managers may realize economies of scale in managing and supporting the Fund. The Board noted that the Fund currently has management fee breakpoints, which are intended to share with Fund shareholders economies of scale that may exist as the Fund’s assets grow.
Other Benefits to the Managers. In addition to considering the profits realized by the Managers, the Board considered information that was provided regarding the direct and indirect benefits the Managers receive as a result of their relationship with the Fund, including compensation paid to the Managers’ affiliates and research provided to the Adviser in connection with permissible brokerage arrangements (soft dollar arrangements).
Conclusions. These factors were also considered by the independent Trustees meeting separately from the full Board, assisted by experienced counsel to the Fund and to the independent Trustees. Fund counsel and the independent Trustees’ counsel are independent of the Managers within the meaning and intent of the Securities and Exchange Commission Rules.
Based on its review of the information it received and its evaluations described above, the Board, including a majority of the independent Trustees, decided to continue the Agreements through August 31, 2019. In arriving at its decision, the Board did not identify any factor or factors as being more important than others, but considered all of the above information, and considered the terms and conditions of the Agreements, including the management fees, in light of all the surrounding circumstances.
40 OPPENHEIMER CONSERVATIVE BALANCED FUND/VA
PORTFOLIO PROXY VOTING POLICIES AND GUIDELINES; UPDATES TO STATEMENT OF INVESTMENTSUnaudited
The Fund has adopted Portfolio Proxy Voting Policies and Guidelines under which the Fund votes proxies relating to securities (“portfolio proxies”) held by the Fund. A description of the Fund’s Portfolio Proxy Voting Policies and Guidelines is available (i) without charge, upon request, by calling the Fund toll-free at 1.800.CALL OPP (225.5677), (ii) on the Fund’s website at www.oppenheimerfunds.com, and (iii) on the SEC’s website at www.sec.gov. In addition, the Fund is required to file FormN-PX, with its complete proxy voting record for the 12 months ended June 30th, no later than August 31st of each year. The Fund’s voting record is available (i) without charge, upon request, by calling the Fund toll-free at 1.800.CALL OPP (225.5677), and (ii) in the FormN-PX filing on the SEC’s website at www.sec.gov.
The Fund files its complete schedule of portfolio holdings with the SEC for the first quarter and the third quarter of each fiscal year on FormN-Q. The Fund’s FormN-Q filings are available on the SEC’s website at www.sec.gov.
41 OPPENHEIMER CONSERVATIVE BALANCED FUND/VA
TRUSTEES AND OFFICERSUnaudited
| | |
| Name, Position(s) Held with the Fund, Length of Service, Year of Birth | | Principal Occupation(s) During the Past 5 Years; Other Trusteeships/Directorships Held; Number of Portfolios in the Fund Complex Currently Overseen |
| |
| INDEPENDENT TRUSTEES | | The address of each Trustee in the chart below is 6803 S. Tucson Way, Centennial, Colorado 80112-3924. Each Trustee serves for an indefinite term, or until his or her resignation, retirement, death or removal. Each of the Trustees in the chart below oversees 58 portfolios in the OppenheimerFunds complex. |
| |
Robert J. Malone, Chairman of the Board of Trustees (since 2016), Trustee (since 2002) Year of Birth: 1944 | | Chairman - Colorado Market of MidFirst Bank (since January 2015); Chairman of the Board (2012-2016) and Director (August 2005-January 2016) of Jones International University (educational organization); Trustee of the Gallagher Family Foundation(non-profit organization) (2000-2016); Chairman, Chief Executive Officer and Director of Steele Street Bank Trust (commercial banking) (August 2003-January 2015); Director of Opera Colorado Foundation(non-profit organization) (2008-2012); Director of Colorado UpLIFT (charitable organization) (1986-2010); Director of Jones Knowledge, Inc. (2006-2010); Former Chairman of U.S. Bank-Colorado (subsidiary of U.S. Bancorp and formerly Colorado National Bank) (July 1996-April 1999); Director of Commercial Assets, Inc. (real estate investment trust) (1993-2000); Director of U.S. Exploration, Inc. (oil and gas exploration) (1997-February 2004); Chairman of the Board (1991-1994) and Trustee (1985-1994) of Regis University; and Chairman of the Board (1990-1991) and Member (1984-1999) of Young Presidents Organization. Mr. Malone has served on the Boards of certain Oppenheimer funds since 2002, during which time he has become familiar with the Fund’s (and other Oppenheimer funds’) financial, accounting, regulatory and investment matters and has contributed to the Board’s deliberations. |
| |
Andrew J. Donohue, Trustee (since 2017) Year of Birth: 1950 | | Director, Mutual Fund Directors Forum (since February 2018); Of Counsel, Shearman & Sterling LLP (since September 2017); Chief of Staff of the U.S. Securities and Exchange Commission (regulator) (June 2015-February 2017); Managing Director and Investment Company General Counsel of Goldman Sachs (investment bank) (November2012-May 2015); Partner at Morgan Lewis & Bockius, LLP (law firm) (March 2011-October 2012); Director of the Division of Investment Management of U.S. Securities and Exchange Commission (regulator) (May 2006-November 2010); Global General Counsel of Merrill Lynch Investment Managers (investment firm) (May2003-May 2006); General Counsel (October 1991-November 2001) and Executive Vice President (January 1993-November 2001) of OppenheimerFunds, Inc. (investment firm) (June 1991-November 2001). Mr. Donohue has served on the Boards of certain Oppenheimer funds since 2017, during which time he has become familiar with the Fund’s (and other Oppenheimer funds’) financial, accounting, regulatory and investment matters and has contributed to the Board’s deliberations. |
| |
Richard F. Grabish, Trustee (since 2012) Year of Birth: 1948 | | Formerly Senior Vice President and Assistant Director of Sales and Marketing (March 1997-December 2007), Director (March 1987-December 2007) and Manager of Private Client Services (June 1985-June 2005) of A.G. Edwards & Sons, Inc. (broker/dealer and investment firm); Chairman and Chief Executive Officer of A.G. Edwards Trust Company, FSB (March 2001-December 2007); President and Vice Chairman of A.G. Edwards Trust Company, FSB (investment adviser) (April 1987-March 2001); President of A.G. Edwards Trust Company, FSB (investment adviser) (June 2005-December 2007). Mr. Grabish has served on the Boards of certain Oppenheimer funds since 2001, during which time he has become familiar with the Fund’s (and other Oppenheimer funds’) financial, accounting, regulatory and investment matters and has contributed to the Board’s deliberations. |
| |
Beverly L. Hamilton, Trustee (since 2002) Year of Birth: 1946 | | Trustee of Monterey Institute for International Studies (educational organization) (2000-2014); Board Member of Middlebury College (educational organization) (December 2005-June 2011); Director of the Board (1991-2016), Vice Chairman of the Board (2006-2009) and Chairman of the Board (2010-2013) of American Funds’ Emerging Markets Growth Fund, Inc. (mutual fund); Director of The California Endowment (philanthropic organization) (April 2002-April 2008); Director (February 2002-2005) and Chairman of Trustees (2006-2007) of the Community Hospital of Monterey Peninsula; President of ARCO Investment Management Company (February 1991-April 2000); Member of the investment committees of The Rockefeller Foundation (2001-2006) and The University of Michigan (since 2000); Advisor at Credit Suisse First Boston’s Sprout venture capital unit (venture capital fund) (1994-January 2005); Trustee of MassMutual Institutional Funds (investment company) (1996-June 2004); Trustee of MML Series Investment Fund (investment company) (April 1989-June 2004); Member of the investment committee of Hartford Hospital (2000-2003); and Advisor to Unilever (Holland) pension fund (2000-2003). Ms. Hamilton has served on the Boards of certain Oppenheimer funds since 2002, during which time she has become familiar with the Fund’s (and other Oppenheimer funds’) financial, accounting, regulatory and investment matters and has contributed to the Board’s deliberations. |
| |
Victoria J. Herget, Trustee (since 2012) Year of Birth:1951 | | Board Chair (2008-2015) and Director (2004-Present) of United Educators (insurance company); Trustee (since 2000) and Chair (2010-2017) of Newberry Library (independent research library); Trustee, Mather LifeWays (senior living organization) (since 2001); Independent Director of the First American Funds (mutual fund family) (2003-2011); former Managing Director (1993-2001), Principal (1985-1993), Vice President (1978-1985) and Assistant Vice President (1973-1978) of Zurich Scudder Investments (investment adviser) (and its predecessor firms); Trustee (1992-2007), Chair of the Board of Trustees (1999-2007), Investment Committee Chair (1994-1999) and Investment Committee member (2007-2010) of Wellesley College; Trustee, BoardSource(non-profit organization) (2006-2009) and Chicago City Day School(K-8 School) (1994-2005). Ms. Herget has served on the Boards of certain Oppenheimer funds since 2012, during which time she has become familiar with the Fund’s (and other Oppenheimer funds’) financial, accounting, regulatory and investment matters and has contributed to the Board’s deliberations. |
| |
Karen L. Stuckey, Trustee (since 2012) Year of Birth: 1953 | | Member (since May 2015) of Desert Mountain Community Foundation Advisory Board(non-profit organization); Partner (1990-2012) of PricewaterhouseCoopers LLP (professional services firm) (held various positions 1975-1990); Trustee (1992- 2006); member of Executive, Nominating and Audit Committees and Chair of Finance Committee (1992-2006), and Emeritus Trustee (since 2006) of Lehigh University; member, Women’s Investment Management Forum (professional organization) (since inception) and Trustee of Jennies School for Little Children(non-profit) (2011-2014). Ms. Stuckey has served on the Boards of certain Oppenheimer funds since 2012, during which time she has become familiar with the Fund’s (and other Oppenheimer funds’) financial, accounting, regulatory and investment matters and has contributed to the Board’s deliberations. |
42 OPPENHEIMER CONSERVATIVE BALANCED FUND/VA
| | |
| |
James D. Vaughn, Trustee (since 2012) Year of Birth:1945 | | Retired; former managing partner (1994-2001) of Denver office of Deloitte & Touche LLP, (held various positions in Denver and New York offices from 1969-1993); Trustee and Chairman of the Audit Committee of Schroder Funds (2003-2012); Board member and Chairman of Audit Committee of AMG National Trust Bank (since 2005); Trustee and Investment Committee member, University of South Dakota Foundation (since 1996); Board member, Audit Committee Member and past Board Chair, Junior Achievement (since 1993); former Board member, Mile High United Way, Boys and Girls Clubs, Boy Scouts, Colorado Business Committee for the Arts, Economic Club of Colorado and Metro Denver Network. Mr. Vaughn has served on the Boards of certain Oppenheimer funds since 2012, during which time he has become familiar with the Fund’s (and other Oppenheimer funds’) financial, accounting, regulatory and investment matters and has contributed to the Board’s deliberations. |
|
| INTERESTED TRUSTEE AND OFFICER | | Mr. Steinmetz is an “Interested Trustee” because he is affiliated with the Manager and theSub-Adviser by virtue of his positions as Chairman and director of theSub-Adviser and officer and director of the Manager. Both as a Trustee and as an officer, Mr. Steinmetz serves for an indefinite term, or until his resignation, retirement, death or removal. Mr. Steinmetz’s address is 225 Liberty Street, New York, New York 10281- 1008. Mr. Steinmetz is an officer of 104 portfolios in the OppenheimerFunds complex. |
| |
Arthur P. Steinmetz, Trustee (since 2015), President and Principal Executive Officer (since 2014) Year of Birth: 1958 | | Chairman of OppenheimerFunds, Inc. (since January 2015); CEO and Chairman of OFI Global Asset Management, Inc. (since July 2014), President of OFI Global Asset Management, Inc. (since May 2013), a Director of OFI Global Asset Management, Inc. (since January 2013), Director of OppenheimerFunds, Inc. (since July 2014), President, Management Director and CEO of Oppenheimer Acquisition Corp. (OppenheimerFunds, Inc.‘s parent holding company) (since July 2014), and President and Director of OFI SteelPath, Inc. (since January 2013). Chief Investment Officer of the OppenheimerFunds advisory entities (January 2013-December 2013); Executive Vice President of OFI Global Asset Management, Inc. (January2013-May 2013); Chief Investment Officer of OppenheimerFunds, Inc. (October 2010-December 2012); Chief Investment Officer, Fixed- Income, of OppenheimerFunds, Inc. (April 2009-October 2010); Executive Vice President of OppenheimerFunds, Inc. (October 2009-December 2012); Director of Fixed Income of OppenheimerFunds, Inc. (January 2009-April 2009); and a Senior Vice President of OppenheimerFunds, Inc. (March 1993-September 2009). |
|
| OTHER OFFICERS OF THE FUND | | The addresses of the Officers in the chart below are as follows: for Messrs. Memani, Krantz, Mss. Lo Bessette, Foxson and Picciotto, 225 Liberty Street, New York, New York 10281-1008, for Mr. Petersen, 6803 S. Tucson Way, Centennial, Colorado 80112-3924. Each Officer serves for an indefinite term or until his or her resignation, retirement, death or removal. |
| |
Krishna Memani, Vice President (since 2009) Year of Birth: 1960 | | President of theSub-Adviser (since January 2013); Executive Vice President of the Manager (since January 2014) and Chief Investment Officer of the OppenheimerFunds advisory entities (since January 2014). Chief Investment Officer, Fixed Income of theSub-Adviser (January 2013-December 2013); Head of the Investment Grade Fixed Income Team of theSub-Adviser (March 2009-January 2014); Director of Fixed Income of theSub-Adviser (October 2010-December 2012); Senior Vice President of theSub-Adviser (March 2009-December 2012) and Senior Vice President of OFI Global Institutional, Inc. (April 2009-December 2012). Managing Director and Head of the U.S. and European Credit Analyst Team at Deutsche Bank Securities (June 2006-January 2009). Chief Credit Strategist at Credit Suisse Securities (August 2002-March 2006). Managing Director and Senior Portfolio Manager at Putnam Investments (September 1998-June 2002). |
| |
Magnus Krantz, Vice President (since 2013) Year of Birth: 1967 | | Vice President of theSub-Adviser (since May 2009) and a portfolio manager of theSub-Adviser (since November 2012); sector manager for technology for theSub-Adviser’s Main Street Investment Team (since May 2009). Prior to joining theSub-Adviser, Mr. Krantz was a sector manager at RS Investment and Guardian Life Insurance Company. Mr. Krantz joined Guardian Life Insurance Company in December 2005 and transitioned to RS Investments in October 2006 in connection with Guardian Life Insurance Company’s acquisition of an interest in RS Investments. Portfolio manager and analyst at Citigroup Asset Management (1998-2005) and as a consultant at Price Waterhouse (1997-1998). He also served as product development engineer at Newbridge Networks (1993-1996) and as a software engineer at Mitel Corporation (1990-1993). |
| |
Cynthia Lo Bessette, Secretary and Chief Legal Officer (since 2016) Year of Birth: 1969 | | Executive Vice President, General Counsel and Secretary of OFI Global Asset Management, Inc. (since February 2016); Senior Vice President and Deputy General Counsel of OFI Global Asset Management, Inc. (March 2015-February 2016); Chief Legal Officer of OppenheimerFunds, Inc. and OppenheimerFunds Distributor, Inc. (since February 2016); Vice President, General Counsel and Secretary of Oppenheimer Acquisition Corp. (since February 2016); General Counsel of OFI SteelPath, Inc., OFI Advisors, LLC and Index Management Solutions, LLC (since February 2016); Chief Legal Officer of OFI Global Institutional, Inc., HarbourView Asset Management Corporation, OFI Global Trust Company, Oppenheimer Real Asset Management, Inc., OFI Private Investments Inc., Shareholder Services, Inc. and Trinity Investment Management Corporation (since February 2016); Corporate Counsel (February 2012-March 2015) and Deputy Chief Legal Officer (April 2013-March 2015) of Jennison Associates LLC; Assistant General Counsel (April 2008-September 2009) and Deputy General Counsel (October 2009-February 2012) of Lord Abbett & Co. LLC. |
| |
Jennifer Foxson, Vice President and Chief Business Officer (since 2014) Year of Birth: 1969 | | Senior Vice President of OppenheimerFunds Distributor, Inc. (since June 2014); Vice President of OppenheimerFunds Distributor, Inc. (April 2006-June 2014); Vice President of OppenheimerFunds, Inc. (January 1998-March 2006); Assistant Vice President of OppenheimerFunds, Inc. (October 1991-December 1998). |
| |
Mary Ann Picciotto, Chief Compliance Officer and Chief Anti-Money Laundering Officer (since 2014) Year of Birth: 1973 | | Senior Vice President and Chief Compliance Officer of OFI Global Asset Management, Inc. (since March 2014); Chief Compliance Officer of OppenheimerFunds, Inc., OFI SteelPath, Inc., OFI Global Institutional, Inc., Oppenheimer Real Asset Management, Inc., OFI Private Investments Inc., Harborview Asset Management Corporation, Trinity Investment Management Corporation, and Shareholder Services, Inc. (since March 2014); Managing Director of Morgan Stanley Investment Management Inc. and certain of its various affiliated entities; Chief Compliance Officer of various Morgan Stanley Funds (May 2010-January 2014); Chief Compliance Officer of Morgan Stanley Investment Management Inc. (April 2007-January 2014). |
43 OPPENHEIMER CONSERVATIVE BALANCED FUND/VA
TRUSTEES AND OFFICERSUnaudited / Continued
| | |
| |
Brian S. Petersen, Treasurer and Principal Financial & Accounting Officer (since 2016) Year of Birth: 1970 | | Senior Vice President of OFI Global Asset Management, Inc. (since January 2017); Vice President of OFI Global Asset Management, Inc. (January 2013-January 2017); Vice President of OppenheimerFunds, Inc. (February 2007-December 2012); Assistant Vice President of OppenheimerFunds, Inc. (August 2002-2007). |
The Fund’s Statement of Additional Information contains additional information about the Fund’s Trustees and Officers and is available without charge, upon request, by calling 1.800.988.8287.
44 OPPENHEIMER CONSERVATIVE BALANCED FUND/VA
THIS PAGE INTENTIONALLY LEFT BLANK.
45 OPPENHEIMER CONSERVATIVE BALANCED FUND/VA
THIS PAGE INTENTIONALLY LEFT BLANK.
46 OPPENHEIMER CONSERVATIVE BALANCED FUND/VA
THIS PAGE INTENTIONALLY LEFT BLANK.
47 OPPENHEIMER CONSERVATIVE BALANCED FUND/VA
OPPENHEIMER CONSERVATIVE BALANCED FUND/VA
| | |
| A Series of Oppenheimer Variable Account Funds |
| |
| Manager | | OFI Global Asset Management, Inc. |
| |
| Sub-Adviser | | OppenheimerFunds, Inc. |
| |
| Distributor | | OppenheimerFunds Distributor, Inc. |
| |
Transfer and Shareholder Servicing Agent | | OFI Global Asset Management, Inc. |
| |
| Sub-Transfer Agent | | Shareholder Services, Inc. |
| | DBA OppenheimerFunds Services |
| |
Independent Registered Public Accounting Firm | | KPMG LLP |
| |
| Legal Counsel | | Ropes & Gray LLP |
| |
| | Before investing in any of the Oppenheimer funds, investors should carefully consider a fund’s investment objectives, risks, charges and expenses. Fund prospectuses and summary prospectuses contain this and other information about the funds, and may be obtained by asking your financial advisor, visiting oppenheimerfunds.com or calling us at 1.800.988.8287. Read prospectuses and summary prospectuses carefully before investing. |
| |
| | © 2019 OppenheimerFunds, Inc. All rights reserved. Oppenheimer funds are distributed by OppenheimerFunds Distributor, Inc. |

| | | | |
| | 
| | |
| | |
| | | December 31, 2018 | | |
| | | Oppenheimer | | |
| | Capital Appreciation Fund/VA | | Annual Report |
| | A Series of Oppenheimer Variable Account Funds | | |
| | | |
| | ANNUAL REPORT | | |
| | |
| | Listing of Top Holdings | | |
| | |
| | Fund Performance Discussion | | |
| | |
| | Financial Statements | | |
PORTFOLIO MANAGER: Paul Larson
AVERAGE ANNUAL TOTAL RETURNS FOR THE PERIODS ENDED 12/31/18
| | | | | | | | | | | | | | |
| | | Inception
Date | | 1-Year | | | 5-Year | | | 10-Year | |
Non-Service Shares | | 4/3/85 | | | -5.73 | % | | | 6.92 | % | | | 12.45 | % |
Service Shares | | 9/18/01 | | | -5.96 | | | | 6.66 | | | | 12.17 | |
S&P 500 Index | | | | | -4.38 | | | | 8.49 | | | | 13.12 | |
Russell 1000 Growth Index | | | | | -1.51 | | | | 10.40 | | | | 15.29 | |
Performance data quoted represents past performance, which does not guarantee future results. The investment return and principal value of an investment in the Fund will fluctuate so that an investor’s shares, when redeemed, may be worth more or less than their original cost. Current performance may be lower or higher than the performance quoted. For performance data current to the most recent month end, call us at 1.800.988.8287. The Fund’s total returns should not be expected to be the same as the returns of other funds, whether or not both funds have the same portfolio managers and/or similar names. The Fund’s total returns include changes in share price and reinvested distributions but do not include the charges associated with the separate account products that offer this Fund. Such performance would have been lower if such charges were taken into account. Returns for periods of less than one year are cumulative and not annualized. See Fund prospectuses and summary prospectuses for more information on share classes and sales charges.
TOP HOLDINGS AND ALLOCATIONS
TOP TEN COMMON STOCK HOLDINGS
| | | | |
| |
Microsoft Corp. | | | 7.6% | |
| |
Amazon.com, Inc. | | | 5.8 | |
| |
Apple, Inc. | | | 5.6 | |
| |
Alphabet, Inc., Cl. C | | | 5.0 | |
| |
Mastercard, Inc., Cl. A | | | 4.9 | |
| |
Facebook, Inc., Cl. A | | | 4.6 | |
| |
UnitedHealth Group, Inc. | | | 3.4 | |
| |
salesforce.com, Inc. | | | 3.1 | |
| |
Lowe’s Cos., Inc. | | | 3.0 | |
| |
Charles Schwab Corp. (The) | | | 2.2 | |
| |
Portfolio holdings and allocations are subject to change. Percentages are as of December 31, 2018, and are based on net assets.
SECTOR ALLOCATION
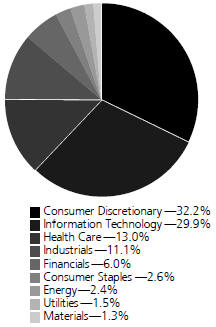
Portfolio holdings and allocations are subject to change. Percentages are as of December 31, 2018, and are based on the total market value of common stocks.
For more current Fund holdings, please visit oppenheimerfunds.com.
2 OPPENHEIMER CAPITAL APPRECIATION FUND/VA
Fund Performance Discussion
During a volatile year, the Fund’sNon-Service shares generated a total return of-5.73%. In comparison, the Fund underperformed the Russell 1000 Growth Index (the “Index”), which returned-1.51% for the same period. The Fund’s underperformance versus the Index for theone-year period ended December 31, 2018, stemmed largely from stock selection in the Health Care, Consumer Staples, and Communication Services sectors. The Fund outperformed in Industrials, Information Technology, and Financials sectors due to stock selection.
MARKET OVERVIEW
The U.S. economy continues to exhibit good economic growth, low unemployment and modest inflation. This is driven partly by tax cuts, technological innovation and falling regulatory hurdles. That said, the effects of the strain in the trading relationship with China have been a headwind to growth, but not nearly enough to offset the strong momentum in the economy.
This economic growth has been fairly broad-based across sectors. However, the stock price performance has not been as broad-based. Value stocks outperformed growth stocks during the fourth quarter of 2018, snapping a streak of seven consecutive quarters of the Russell 1000 Value Index underperforming the Russell 1000 Growth Index. This was helped by a rotation into defensive stocks and out of some of the high-flying technology names. However, growth stocks still significantly outperformed for the full calendar year.
We continue to focus on the fundamentals of each business to drive our investment decisions versus getting caught up in the temporary emotions of the market, always with the long-term welfare of our shareholders in mind. Our philosophy is to focus on companies we believe have sustainable competitive advantages that can outperform in most market environments. We combine this with our valuation discipline to seek a margin of safety, with downside protection ever an important consideration. That being said, we do have a history of underperforming ingo-go markets and outperforming in bear markets.
TOP INDIVIDUAL CONTRIBUTORS
Top contributors to the Fund’s relative performance this period included Mastercard, Spirit Airlines, and AutoZone.
Mastercard’s performance was driven by strong core results reported over the second quarter of 2018, where revenues and earnings soundly beat expectations and organic revenue growth accelerated to over 20% year over year. While these results are unlikely sustainable, Mastercard has demonstrated an ability to grow at a faster pace than their largest competitor Visa driven by the strength of their services business, share gains in European processing, and some market share gains internationally. Notably, this reporting period, the company won Santander’s large UK debit business. More importantly, Mastercard continues to benefit from the long tail of revenue growth as the world transitions from cash and check to electronic forms of payment. The global ubiquity of acceptance of Visa and Mastercard make them both partners of choice for global card issuers.
A confluence of positive events happened at Spirit Airlines during the last half of 2018. The company’s new pilot contract signed in early 2018, while expensive in absolute terms, allowed Spirit to greatly increase its efficiency. This helped the performance of its network (betteron-times, fewer cancellations, etc.) as well as allowed the company to lower unit costs. Moreover, weather (i.e. hurricanes) had a much more benign impact in 2018 versus 2017. Finally, and perhaps most importantly, competitive rivalry was muted in 2018 against the backdrop of a strong economy for consumers, allowing Spirit to raise fares at above-average rates. Though Spirit’s stock is not the deep bargain it was a year ago, it is still inexpensive (~9x forward consensus EPS), and we continue to like the business. The company is still growing at a robustmid-teens rate, has a significant cost advantage relative to peers (costs per seat-mileex-fuel are 40% below that of Southwest, and less than half that of the legacy Big 3 carriers), and the service level given to customers is much improved and still improving.
Auto parts retailer AutoZone saw an acceleration in same-store sales comparisons and commercial growth to a multi-quarter high. Beyond the better revenue, margins and earnings flow-through improved. In addition, fears about online competitors taking market share have not come to fruition in reality. We continue to like the competitive positioning of the business as well as the cash flow characteristics and large ongoing stock buyback.
TOP INDIVIDUAL DETRACTORS
Detractors from performance this reporting period included AmeriGas Partners, Facebook, and Compass Minerals International.
Amerigas is the largest propane distributor in the country. The recent selloff started soon after the company disclosed that it is considering changing the ownership structure between itself and its parent company UGI, including possibly getting rid of the incentive distributions UGI currently collects. As part of this exercise, Amerigas is hoping to improve its balance sheet, which could involve cutting distributions. Exacerbating this weakness, Amerigas was dropped in
3 OPPENHEIMER CAPITAL APPRECIATION FUND/VA
late December from the Alerian MLP Index, causing selling pressure from those funds that track the index. Finally, with the stock weak into the end of the year,tax-loss selling undoubtedly played a role. The Alerian andtax-loss situations do not reflect anything with the underlying business, and they are proving to be temporary effects. As far as the distributions are concerned, we view a modest cut as likely. But with the stock yielding in excess of 15% atyear-end, we view this as being more than priced in. We added to our position in the fourth quarter.
Facebook shares declined sharply post second-quarter financial results due to the company’s outlook for a material deceleration of revenue growth in the high single-digit percent range sequentially each quarter for the remainder of the year vs. the 42% year-over-year growth posted in the most recent quarter. Further, the company forecasted operating profit margins to decline to themid-30s over time vs. 44% posted in the most recent quarter. We continue to believe Facebook’s shares are an attractive investment given the company’s market leading position in the shift to digital advertising, and monetization opportunities across its four properties: Facebook, Instagram, Messenger and WhatsApp.
Compass Minerals produces minerals, including salt, sulfate of potash specialty fertilizer, and magnesium chloride. Shares of Compass were negatively impacted by ongoing production issues at its salt mine in Ontario, Canada.
STRATEGY & OUTLOOK
In the short term, we expect the U.S. economy to continue to show economic growth, albeit at slower rates than experienced in 2018 as the “sugar high” from tax cuts wears off. This will be driven by favorable ongoing consumer confidence, falling regulatory hurdles, as well as technological innovation. The biggest macro risks we see are trade tariffs and higher interest rates.
Speculation remains at an elevated level. Mania around cryptocurrency earlier in the year and cannabis stocks more recently are symptoms of these. We believe an equally big risk to stock prices is the stock market’s preference for so called “disruptors” and the potential for stocks with this perceived characteristic to become crowded trades and have valuations untethered to financial reality. While some of the high flyers lost altitude in the fourth quarter as the market corrected, a true capitulation point has not yet been reached.
Regarding trade tariffs, while concern has risen in recent weeks, the market continues to view bluster from D.C. as a negotiating tactic and is implying that all will end well. So far this has been borne out in trade negotiations between the U.S., Mexico and Canada. A true escalation could severely hamper global growth and thereby stock prices. Innovation, while a positive for the overall economy over the long term, creates short-term disruptions of which to be cognizant. Lastly, we are afraid companies have become addicted to low interest rates. If interest rates were to continue to rise materially, some companies’ historical decisions will look like a misallocation of capital and negatively impact their stock prices.
We believe a rise in interest rates and other monetary tightening will have profound implications for the equity markets. Due to the 2008 crisis, interest rates were driven to record lows and a flood of liquidity was unleashed. Short-term interest rates were at essentially zero and even longer rates were driven to around 2%. This was not just flash in the pan either, as the rates stayed at these levels for multiple years. When the cost of money became close to zero and its availability abundant, the equity market’s horizon became longer forstart-ups delivering profits. As a result, we have seen several companies focus on revenue growth through disruption without regard to profit generation.
We are afraid even established companies are addicted to low interest rates which is not sustainable for longer-term profitable growth. We believe that once this corrects, it will be healthy in the longer-term because it will drive companies to generate profits. “Profitable Revenue Growth” is better, tougher and more sustainable than mere “Revenue Growth”. Over time, companies that generate such profitable growth are likely to be more durable investments with better down-side protection even though they may look a little short in a speculative environment. As a famous investor once said, you don’t know who has been swimming naked until the tide rolls out. At the moment, the tide is lower than it was a few months ago, but still relatively high. We know this won’t be the situation in perpetuity.
We continue to maintain our discipline around valuation and focus on companies with competitive advantages and skilled management teams that areout-executing peers. Evidence of this in the companies we look for include high returns on invested capital, consistently strong pricing power, and/or rising market shares. During times of economic volatility such companies frequently widen their lead over weaker competitors. We seek to invest in companies characterized by these qualities at compelling valuations and believe this disciplined approach is essential to generating superior long-term performance, especially in down markets.
We fully believe that over a complete market cycle, the value of our strategy will become apparent again.
4 OPPENHEIMER CAPITAL APPRECIATION FUND/VA
Investors should consider the Fund’s investment objective, risks, charges and expenses carefully before investing. The Fund’s prospectus and summary prospectus contain this and other information about the Fund, and may be obtained by asking your financial advisor or calling us at 1.800.988.8287. Read prospectuses and summary prospectuses carefully before investing.
Total returns include changes in share price and reinvestment of dividends and capital gains distributions in a hypothetical investment for the periods shown, but do not include the charges associated with the separate account products that offer this Fund.
The views in the Fund Performance Discussion represent the opinions of this Fund’s portfolio managers and are not intended as investment advice or to predict or depict the performance of any investment. These views are as of the close of business on December 31, 2018, and are subject to change based on subsequent developments. The Fund’s portfolio and strategies are subject to change.
Shares of Oppenheimer funds are not deposits or obligations of any bank, are not guaranteed by any bank, are not insured by the FDIC or any other agency, and involve investment risks, including the possible loss of the principal amount invested.
Comparing the Fund’s Performance to the Market.The graphs that follow show the performance of a hypothetical $10,000 investment in each share class of the Fund held until December 31, 2018. Performance is measured over aten-fiscal-year period for both Classes. Performance information does not reflect charges that apply to separate accounts investing in the Fund. If these charges were taken into account, performance would be lower. The graphs assume that all dividends and capital gains distributions were reinvested in additional shares.
The Fund’s performance is compared to the performance of the S&P 500 Index and the Russell 1000 Growth Index. The S&P 500 Index is a capitalization-weighted index of 500 stocks intended to be a representative sample of leading companies in leading industries within the U.S. economy. The Russell 1000 Growth Index measures the performance of thelarge-cap growth segment of the U.S. equity universe. It includes those Russell 1000 companies with higherprice-to-book ratios and higher forecasted growth values. The indices areunmanaged and cannot be purchased directly by investors. While index comparisons may be useful to provide a benchmark for the Fund’s performance, it must be noted that the Fund’s investments are not limited to the investments comprising theindices. Index performance includes reinvestment of income, but does not reflect transaction costs, fees, expenses or taxes. Index performance is shown for illustrative purposes only as a benchmark for the Fund’s performance, and does not predict or depict performance of the Fund. The Fund’s performance reflects the effects of the Fund’s business and operating expenses.
5 OPPENHEIMER CAPITAL APPRECIATION FUND/VA
COMPARISON OF CHANGE IN VALUE OF $10,000 HYPOTHETICAL INVESTMENTS IN:
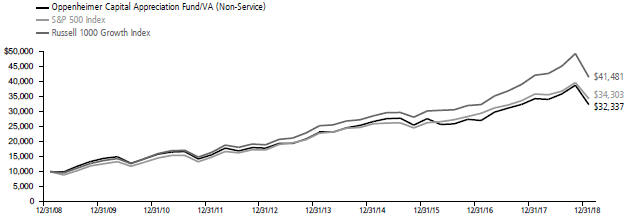
Average Annual Total Returns ofNon-Service Shares of the Fund at 12/31/18
1-Year -5.73% 5-Year 6.92% 10-Year12.45%
COMPARISON OF CHANGE IN VALUE OF $10,000 HYPOTHETICAL INVESTMENTS IN:
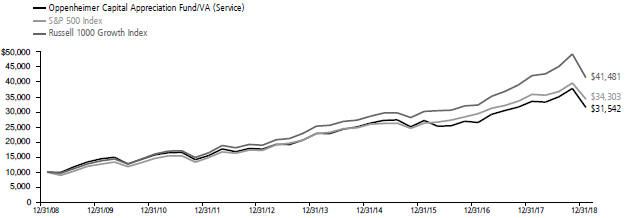
Average Annual Total Returns of Service Shares of the Fund at 12/31/18
1-Year -5.96% 5-Year 6.66% 10-Year 12.17%
Performance data quoted represents past performance, which does not guarantee future results.The investment return and principal value of an investment in the Fund will fluctuate so that an investor’s shares, when redeemed, may be worth more or less than their original cost. Current performance may be lower or higher than the performance quoted. For performance data current to the most recent month end, call us at 1.800.988.8287. The Fund’s total returns should not be expected to be the same as the returns of other funds, whether or not both funds have the same portfolio managers and/or similar names. The Fund’s total returns include changes in share price and reinvested distributions but do not include the charges associated with the separate account products that offer this Fund. Such performance would have been lower if such charges were taken into account.
6 OPPENHEIMER CAPITAL APPRECIATION FUND/VA
Fund Expenses
Fund Expenses.As a shareholder of the Fund, you incur two types of costs: (1) transaction costs and (2) ongoing costs, including management fees; distribution and service fees; and other Fund expenses. These examples are intended to help you understand your ongoing costs (in dollars) of investing in the Fund and to compare these costs with the ongoing costs of investing in other mutual funds.
The examples are based on an investment of $1,000.00 invested at the beginning of the period and held for the entire6-month period ended December 31, 2018.
Actual Expenses. The first section of the table provides information about actual account values and actual expenses. You may use the information in this section for the class of shares you hold, together with the amount you invested, to estimate the expense that you paid over the period. Simply divide your account value by $1,000.00 (for example, an $8,600.00 account value divided by $1,000.00 = 8.60), then multiply the result by the number in the first section under the heading entitled “Expenses Paid During 6 Months Ended December 31, 2018” to estimate the expenses you paid on your account during this period.
Hypothetical Example for Comparison Purposes.
The second section of the table provides information about hypothetical account values and hypothetical expenses based on the Fund’s actual expense ratio for each class of shares, and an assumed rate of return of 5% per year for each class before expenses, which is not the actual return. The hypothetical account values and expenses may not be used to estimate the actual ending account balance or expenses you paid for the period. You may use this information to compare the ongoing costs of investing in the Fund and other funds. To do so, compare this 5% hypothetical example for the class of shares you hold with the 5% hypothetical examples that appear in the shareholder reports of the other funds.
Please note that the expenses shown in the table are meant to highlight your ongoing costs only and do not reflect any charges associated with the separate accounts that offer this Fund. Therefore, the “hypothetical” lines of the table are useful in comparing ongoing costs only, and will not help you determine the relative total costs of owning different funds. In addition, if these separate account charges were included your costs would have been higher.
| | | | | | | | | | | | |
| Actual | | Beginning Account Value
July 1, 2018 | | | Ending Account Value
December 31, 2018 | | | Expenses Paid During 6 Months Ended
December 31, 2018 | |
Non-Service shares | | $ | 1,000.00 | | | $ | 900.50 | | | $ | 3.84 | |
Service shares | | | 1,000.00 | | | | 899.50 | | | | 5.04 | |
|
| Hypothetical | |
| (5% return before expenses) | | | | | | | | | |
Non-Service shares | | | 1,000.00 | | | | 1,021.17 | | | | 4.08 | |
Service shares | | | 1,000.00 | | | | 1,019.91 | | | | 5.36 | |
Expenses are equal to the Fund’s annualized expense ratio for that class, multiplied by the average account value over the period, multiplied by 184/365 (to reflect theone-half year period). Those annualized expense ratios, excluding indirect expenses from affiliated funds, based on the6-month period ended December 31, 2018 are as follows:
| | | | |
| Class | | Expense Ratios | |
Non-Service shares | | | 0.80% | |
Service shares | | | 1.05 | |
The expense ratios reflect voluntary and/or contractual waivers and/or reimbursements of expenses by the Fund’s Manager. Some of these undertakings may be modified or terminated at any time, as indicated in the Fund’s prospectus. The “Financial Highlights” tables in the Fund’s financial statements, included in this report, also show the gross expense ratios, without such waivers or reimbursements and reduction to custodian expenses, if applicable.
7 OPPENHEIMER CAPITAL APPRECIATION FUND/VA
STATEMENT OF INVESTMENTSDecember 31, 2018
| | | | | | | | | | | | |
| | | Shares | | | Value | | | | |
| | | | | |
Common Stocks—98.5% | | | | | |
| | | | | |
Consumer Discretionary—31.7% | | | | | | | | | | | | |
| | | | | |
Entertainment—1.0% | | | | | | | | | | | | |
| | | | | |
Activision Blizzard, Inc. | | | 134,283 | | | $ | 6,253,559 | | | | | |
| | | | | |
Hotels, Restaurants & Leisure—3.6% | | | | | | | | | | | | |
| | | | | |
Cedar Fair LP1 | | | 224,712 | | | | 10,628,878 | | | | | |
| | | | | |
Starbucks Corp. | | | 167,640 | | | | 10,796,016 | | | | | |
| | | | | | | | | | | | |
| | | | | | | 21,424,894 | | | | | |
| | | | | |
Interactive Media & Services—10.9% | | | | | | | | | | | | |
| | | | | |
Alphabet, Inc., Cl. C2 | | | 29,268 | | | | 30,310,233 | | | | | |
| | | | | |
Facebook, Inc., Cl. A2 | | | 213,158 | | | | 27,942,882 | | | | | |
| | | | | |
Snap, Inc., Cl. A2 | | | 163,873 | | | | 902,940 | | | | | |
| | | | | |
Tencent Holdings Ltd., ADR | | | 165,450 | | | | 6,530,312 | | | | | |
| | | | | | | | | | | | |
| | | | | | | 65,686,367 | | | | | |
| | | | | |
Internet & Catalog Retail—9.6% | | | | | | | | | | | | |
| | | | | |
Alibaba Group Holding Ltd., Sponsored | | | | | | | | | | | | |
ADR2 | | | 18,092 | | | | 2,479,871 | | | | | |
| | | | | |
Amazon.com, Inc.2 | | | 23,357 | | | | 35,081,513 | | | | | |
| | | | | |
Booking Holdings, Inc.2 | | | 7,138 | | | | 12,294,634 | | | | | |
| | | | | |
eBay, Inc.2 | | | 277,030 | | | | 7,776,232 | | | | | |
| | | | | | | | | | | | |
| | | | | | | 57,632,250 | | | | | |
| | | | | |
Specialty Retail—6.6% | | | | | | | | | | | | |
| | | | | |
AutoNation, Inc.2 | | | 215,220 | | | | 7,683,354 | | | | | |
| | | | | |
AutoZone, Inc.2 | | | 9,243 | | | | 7,748,777 | | | | | |
| | | | | |
CarMax, Inc.2 | | | 97,550 | | | | 6,119,311 | | | | | |
| | | | | |
Lowe’s Cos., Inc. | | | 198,380 | | | | 18,322,377 | | | | | |
| | | | | | | | | | | | |
| | | | | | | 39,873,819 | | | | | |
| | | | | |
Consumer Staples—2.6% | | | | | | | | | | | | |
| | | | | |
Food Products—1.4% | | | | | | | | | | | | |
| | | | | |
Kraft Heinz Co. (The) | | | 104,785 | | | | 4,509,946 | | | | | |
| | | | | |
Mondelez International, Inc., Cl. A | | | 96,588 | | | | 3,866,418 | | | | | |
| | | | | | | | | | | | |
| | | | | | | 8,376,364 | | | | | |
| | | | | |
Household Products—0.5% | | | | | | | | | | | | |
| | | | | |
Spectrum Brands Holdings, Inc. | | | 73,528 | | | | 3,106,558 | | | | | |
| | | | | |
Tobacco—0.7% | | | | | | | | | | | | |
| | | | | |
British American Tobacco plc | | | 126,040 | | | | 4,019,313 | | | | | |
| | | | | |
Energy—2.4% | | | | | | | | | | | | |
| | | | | |
Oil, Gas & Consumable Fuels—2.4% | | | | | | | | | | | | |
| | | | | |
Husky Energy, Inc. | | | 566,727 | | | | 5,857,397 | | | | | |
| | | | | |
Magellan Midstream Partners LP1 | | | 149,224 | | | | 8,514,721 | | | | | |
| | | | | | | | | | | | |
| | | | | | | 14,372,118 | | | | | |
| | | | | |
Financials—5.9% | | | | | | | | | | | | |
| | | | | |
Capital Markets—4.0% | | | | | | | | | | | | |
| | | | | |
Charles Schwab Corp. (The) | | | 324,293 | | | | 13,467,889 | | | | | |
| | | | | |
CME Group, Inc., Cl. A | | | 19,635 | | | | 3,693,736 | | | | | |
| | | | | |
Intercontinental Exchange, Inc. | | | 94,403 | | | | 7,111,378 | | | | | |
| | | | | | | | | | | | |
| | | | | | | 24,273,003 | | | | | |
| | | | | |
Diversified Financial Services—1.1% | | | | | | | | | | | | |
| | | | | |
Berkshire Hathaway, Inc., Cl. B2 | | | 32,185 | | | | 6,571,533 | | | | | |
| | | | | |
Insurance—0.8% | | | | | | | | | | | | |
| | | | | |
Progressive Corp. (The) | | | 80,360 | | | | 4,848,119 | | | | | |
| | | | | |
Health Care—12.8% | | | | | | | | | | | | |
| | | | | |
Biotechnology—5.2% | | | | | | | | | | | | |
| | | | | |
Biogen, Inc.2 | | | 26,740 | | | | 8,046,601 | | | | | |
| | | | | |
Celgene Corp.2 | | | 96,424 | | | | 6,179,814 | | | | | |
| | | | | |
Exact Sciences Corp.2 | | | 22,510 | | | | 1,420,381 | | | | | |
| | | | | |
Galapagos NV2 | | | 22,749 | | | | 2,087,946 | | | | | |
| | | | | |
Gilead Sciences, Inc. | | | 98,280 | | | | 6,147,414 | | | | | |
| | | | | |
Vertex Pharmaceuticals, Inc.2 | | | 45,760 | | | | 7,582,889 | | | | | |
| | | | | | | | | | | | |
| | | | | | | 31,465,045 | | | | | |
| | | | | |
Health Care Equipment & Supplies—1.2% | | | | | |
| | | | | |
Intuitive Surgical, Inc.2 | | | 14,683 | | | | 7,031,982 | | | | | |
| | | | | | | | |
| | | Shares | | | Value | |
| |
Health Care Providers & Services—4.8% | | | | | | | | |
Laboratory Corp. of America Holdings2 | | | 66,145 | | | $ | 8,358,082 | |
| |
UnitedHealth Group, Inc. | | | 83,030 | | | | 20,684,434 | |
| | | | | | | | |
| | | | | | | 29,042,516 | |
| |
Health Care Technology—0.7% | | | | | | | | |
| |
Cerner Corp.2 | | | 82,640 | | | | 4,333,642 | |
| |
Pharmaceuticals—0.9% | | | | | | | | |
| |
Allergan plc | | | 38,040 | | | | 5,084,426 | |
| |
Industrials—10.9% | | | | | | | | |
| |
Aerospace & Defense—2.3% | | | | | | | | |
| |
Lockheed Martin Corp. | | | 22,600 | | | | 5,917,584 | |
| |
Spirit AeroSystems Holdings, Inc., Cl. A | | | 112,970 | | | | 8,144,007 | |
| | | | | | | | |
| | | | | | | 14,061,591 | |
| |
Airlines—1.5% | | | | | | | | |
Spirit Airlines, Inc.2 | | | 155,920 | | | | 9,030,887 | |
| |
Commercial Services & Supplies—1.4% | | | | | | | | |
KAR Auction Services, Inc. | | | 182,560 | | | | 8,711,763 | |
| |
Machinery—2.5% | | | | | | | | |
| |
Deere & Co. | | | 41,573 | | | | 6,201,444 | |
| |
Stanley Black & Decker, Inc. | | | 34,390 | | | | 4,117,859 | |
| |
Wabtec Corp. | | | 64,520 | | | | 4,532,530 | |
| | | | | | | | |
| | | | | | | 14,851,833 | |
| |
Road & Rail—2.3% | | | | | | | | |
| |
Canadian Pacific Railway Ltd. | | | 16,590 | | | | 2,946,716 | |
| |
Union Pacific Corp. | | | 78,030 | | | | 10,786,087 | |
| | | | | | | | |
| | | | | | | 13,732,803 | |
| |
Trading Companies & Distributors—0.9% | | | | | | | | |
Fastenal Co. | | | 101,135 | | | | 5,288,349 | |
| |
Information Technology—29.4% | | | | | | | | |
| |
Communications Equipment—1.0% | | | | | | | | |
| |
Motorola Solutions, Inc. | | | 54,820 | | | | 6,306,493 | |
| |
IT Services—6.6% | | | | | | | | |
| |
First Data Corp., Cl. A2 | | | 284,300 | | | | 4,807,513 | |
| |
Mastercard, Inc., Cl. A | | | 155,168 | | | | 29,272,443 | |
| |
PayPal Holdings, Inc.2 | | | 68,275 | | | | 5,741,245 | |
| | | | | | | | |
| | | | | | | 39,821,201 | |
| |
Semiconductors & Semiconductor Equipment—3.6% | |
| |
Applied Materials, Inc. | | | 201,790 | | | | 6,606,604 | |
| |
NVIDIA Corp. | | | 37,650 | | | | 5,026,275 | |
| |
Texas Instruments, Inc. | | | 104,688 | | | | 9,893,016 | |
| | | | | | | | |
| | | | | | | 21,525,895 | |
| |
Software—12.6% | | | | | | | | |
| |
Microsoft Corp. | | | 448,183 | | | | 45,521,947 | |
| |
salesforce.com, Inc.2 | | | 138,200 | | | | 18,929,254 | |
| |
ServiceNow, Inc.2 | | | 65,610 | | | | 11,681,861 | |
| | | | | | | | |
| | | | | | | 76,133,062 | |
| |
Technology Hardware, Storage & Peripherals—5.6% | | | | | |
| |
Apple, Inc. | | | 213,643 | | | | 33,700,047 | |
| |
Materials—1.3% | | | | | | | | |
| |
Chemicals—0.5% | | | | | | | | |
| |
Albemarle Corp. | | | 38,363 | | | | 2,956,636 | |
| |
Metals & Mining—0.8% | | | | | | | | |
| |
Compass Minerals International, Inc. | | | 116,568 | | | | 4,859,720 | |
| |
Utilities—1.5% | | | | | | | | |
| |
Gas Utilities—1.5% | | | | | | | | |
| |
AmeriGas Partners LP1 | | | 348,855 | | | | 8,826,032 | |
| | | | | | | | |
Total Common Stocks (Cost $470,911,472) | | | | | | | 593,201,820 | |
8 OPPENHEIMER CAPITAL APPRECIATION FUND/VA
| | | | | | | | |
| | | Shares | | | Value | |
| |
Investment Company—0.3% | |
| Oppenheimer Institutional Government Money Market Fund, Cl. E, 2.35%3,4(Cost $2,094,243) | | | 2,094,243 | | | $ | 2,094,243 | |
| |
| Total Investments, at Value (Cost $473,005,715) | | | 98.8% | | | | 595,296,063 | |
| | | | |
| Net Other Assets (Liabilities) | | | 1.2 | | | | 7,201,692 | |
| | | | |
Net Assets | | | 100.0% | | | $ | 602,497,755 | |
| | | | |
Footnotes to Statement of Investments
1. Security is a Master Limited Partnership.
2.Non-income producing security.
3. Rate shown is the7-day yield at period end.
4. Is or was an affiliate, as defined in the Investment Company Act of 1940, as amended, at or during the reporting period, by virtue of the Fund owning at least 5% of the voting securities of the issuer or as a result of the Fund and the issuer having the same investment adviser. Transactions during the reporting period in which the issuer was an affiliate are as follows:
| | | | | | | | | | | | | | | | | | | | |
| | | Shares
December 31, 2017 | | | | | | Gross
Additions | | | Gross
Reductions | | | Shares
December 31, 2018 | |
| |
Investment Company | |
| Oppenheimer Institutional Government Money Market Fund, Cl. E | | | — | | | | | | | | 107,772,831 | | | | 105,678,588 | | | | 2,094,243 | |
| | | | | |
| | | Value | | | | | | Income | | | Realized
Gain (Loss) | | | Change in Unrealized
Gain (Loss) | |
| |
Investment Company | |
| Oppenheimer Institutional Government Money Market Fund, Cl. E | | $ | 2,094,243 | | | | | | | $ | 47,225 | | | $ | — | | | $ | — | |
See accompanying Notes to Financial Statements.
9 OPPENHEIMER CAPITAL APPRECIATION FUND/VA
STATEMENT OF ASSETS AND LIABILITIESDecember 31, 2018
| | | | |
| |
Assets | | | | |
Investments, at value—see accompanying statement of investments: | | | | |
Unaffiliated companies (cost $470,911,472) | | $ | 593,201,820 | |
Affiliated companies (cost $2,094,243) | | | 2,094,243 | |
| | | | |
| | | 595,296,063 | |
| |
Cash | | | 2,000,000 | |
| |
Receivables and other assets: | | | | |
Shares of beneficial interest sold | | | 5,707,906 | |
Dividends | | | 574,271 | |
Investments sold | | | 535,783 | |
Other | | | 108,761 | |
| | | | |
Total assets | | | 604,222,784 | |
| |
Liabilities | | | | |
Payables and other liabilities: | | | | |
Investments purchased | | | 1,077,969 | |
Shares of beneficial interest redeemed | | | 465,975 | |
Trustees’ compensation | | | 95,172 | |
Distribution and service plan fees | | | 31,373 | |
Shareholder communications | | | 20,965 | |
Other | | | 33,575 | |
| | | | |
Total liabilities | | | 1,725,029 | |
| |
Net Assets | | $ | 602,497,755 | |
| | | | |
|
| |
Composition of Net Assets | | | | |
Par value of shares of beneficial interest | | $ | 12,466 | |
| |
Additionalpaid-in capital | | | 415,578,282 | |
| |
Total distributable earnings | | | 186,907,007 | |
| | | | |
Net Assets | | $ | 602,497,755 | |
| | | | |
|
| |
Net Asset Value Per Share | | | | |
Non-Service Shares: | | | | |
| Net asset value, redemption price per share and offering price per share (based on net assets of $460,707,726 and 9,498,338 shares of beneficial interest outstanding) | | | $48.50 | |
| |
Service Shares: | | | | |
| Net asset value, redemption price per share and offering price per share (based on net assets of $141,790,029 and 2,967,549 shares of beneficial interest outstanding) | | | $47.78 | |
See accompanying Notes to Financial Statements.
10 OPPENHEIMER CAPITAL APPRECIATION FUND/VA
STATEMENT OF OPERATIONSFor the Year Ended December 31, 2018
| | | | |
| |
Investment Income | | | | |
Dividends: | | | | |
Unaffiliated companies (net of foreign withholding taxes of $37,879) | | $ | 7,463,612 | |
Affiliated companies | | | 47,225 | |
| | | | |
Total investment income | | | 7,510,837 | |
| |
Expenses | | | | |
Management fees | | | 5,472,543 | |
| |
Distribution and service plan fees — Service shares | | | 582,617 | |
| |
Transfer and shareholder servicing agent fees: | | | | |
Non-Service shares | | | 652,221 | |
Service shares | | | 279,656 | |
| |
Shareholder communications: | | | | |
Non-Service shares | | | 56,279 | |
Service shares | | | 21,357 | |
| |
Trustees’ compensation | | | 28,154 | |
| |
Borrowing fees | | | 25,852 | |
| |
Custodian fees and expenses | | | 12,487 | |
| |
Other | | | 74,799 | |
| | | | |
Total expenses | | | 7,205,965 | |
Less reduction to custodian expenses | | | (1,434) | |
Less waivers and reimbursements of expenses | | | (383,548) | |
| | | | |
Net expenses | | | 6,820,983 | |
| |
Net Investment Income | | | 689,854 | |
| |
Realized and Unrealized Gain (Loss) | | | | |
Net realized gain (loss) on: | | | | |
Investment transactions in unaffiliated companies | | | 77,508,584 | |
Foreign currency transactions | | | (5,269) | |
| | | | |
Net realized gain | | | 77,503,315 | |
| |
Net change in unrealized appreciation/(depreciation) on: | | | | |
Investment transactions in unaffiliated companies | | | (110,170,267) | |
Translation of assets and liabilities denominated in foreign currencies | | | (2,473) | |
| | | | |
Net change in unrealized appreciation/(depreciation) | | | (110,172,740) | |
| |
Net Decrease in Net Assets Resulting from Operations | | $ | (31,979,571) | |
| | | | |
See accompanying Notes to Financial Statements.
11 OPPENHEIMER CAPITAL APPRECIATION FUND/VA
STATEMENTS OF CHANGES IN NET ASSETS
| | | | | | | | |
| | | Year Ended
December 31, 2018 | | | Year Ended
December 31, 20171 | |
| |
Operations | | | | | | | | |
Net investment income | | $ | 689,854 | | | $ | 1,688,841 | |
| |
Net realized gain | | | 77,503,315 | | | | 62,736,493 | |
| |
Net change in unrealized appreciation/(depreciation) | | | (110,172,740) | | | | 136,373,539 | |
| | | | |
Net increase (decrease) in net assets resulting from operations | | | (31,979,571) | | | | 200,798,873 | |
| |
Dividends and/or Distributions to Shareholders | | | | | | | | |
Dividends and distributions declared: | | | | | | | | |
Non-Service shares | | | (43,131,733) | | | | (49,680,512) | |
Service shares | | | (16,387,466) | | | | (28,708,763) | |
| | | | |
Total dividends and distributions declared | | | (59,519,199) | | | | (78,389,275) | |
| |
Beneficial Interest Transactions | | | | | | | | |
Net decrease in net assets resulting from beneficial interest transactions: | | | | | | | | |
Non-Service shares | | | (28,802,499) | | | | (23,046,014) | |
Service shares | | | (150,292,452) | | | | (23,253,888) | |
| | | | |
Total beneficial interest transactions | | | (179,094,951) | | | | (46,299,902) | |
| |
Net Assets | | | | | | | | |
Total increase (decrease) | | | (270,593,721) | | | | 76,109,696 | |
| |
Beginning of period | | | 873,091,476 | | | | 796,981,780 | |
| | | | |
End of period | | $ | 602,497,755 | | | $ | 873,091,476 | |
| | | | |
1. Prior period amounts have been conformed to current year presentation. See Notes to Financial Statements, Note 2 – New Accounting Pronouncements for further details.
See accompanying Notes to Financial Statements.
12 OPPENHEIMER CAPITAL APPRECIATION FUND/VA
FINANCIAL HIGHLIGHTS
| | | | | | | | | | | | | | | | | | | | |
| Non-Service Shares | | Year Ended
December 31,
2018 | | | Year Ended
December 31,
2017 | | | Year Ended
December 31,
2016 | | | Year Ended
December 31,
2015 | | | Year Ended
December 31,
2014 | |
| |
Per Share Operating Data | | | | | | | | | | | | | | | | | | | | |
Net asset value, beginning of period | | | $55.70 | | | | $48.36 | | | | $55.49 | | | | $64.87 | | | | $57.88 | |
| |
Income (loss) from investment operations: | | | | | | | | | | | | | | | | | | | | |
Net investment income1 | | | 0.09 | | | | 0.15 | | | | 0.12 | | | | 0.22 | | | | 0.09 | |
Net realized and unrealized gain (loss) | | | (2.71) | | | | 12.33 | | | | (1.57) | | | | 2.25 | | | | 8.64 | |
| | | | |
Total from investment operations | | | (2.62) | | | | 12.48 | | | | (1.45) | | | | 2.47 | | | | 8.73 | |
| |
Dividends and/or distributions to shareholders: | | | | | | | | | | | | | | | | | | | | |
Dividends from net investment income | | | (0.19) | | | | (0.13) | | | | (0.22) | | | | (0.06) | | | | (0.27) | |
Distributions from net realized gain | | | (4.39) | | | | (5.01) | | | | (5.46) | | | | (11.79) | | | | (1.47) | |
| | | | |
Total dividends and/or distributions to shareholders | | | (4.58) | | | | (5.14) | | | | (5.68) | | | | (11.85) | | | | (1.74) | |
| |
Net asset value, end of period | | | $48.50 | | | | $55.70 | | | | $48.36 | | | | $55.49 | | | | $64.87 | |
| | | | |
| | | | |
| |
Total Return, at Net Asset Value2 | | | (5.73)% | | | | 26.83% | | | | (2.20)% | | | | 3.54% | | | | 15.41% | |
| |
| |
Ratios/Supplemental Data | | | | | | | | | | | | | | | | | | | | |
Net assets, end of period (in thousands) | | | $460,708 | | | | $556,227 | | | | $501,756 | | | | $564,514 | | | | $616,862 | |
| |
Average net assets (in thousands) | | | $542,971 | | | | $539,255 | | | | $514,525 | | | | $601,110 | | | | $614,272 | |
| |
Ratios to average net assets:3 | | | | | | | | | | | | | | | | | | | | |
Net investment income | | | 0.16% | | | | 0.29% | | | | 0.25% | | | | 0.36% | | | | 0.15% | |
Expenses excluding specific expenses listed below | | | 0.85% | | | | 0.82% | | | | 0.83% | | | | 0.81% | | | | 0.80% | |
Interest and fees from borrowings | | | 0.00%4 | | | | 0.00%4 | | | | 0.00%4 | | | | 0.00%4 | | | | 0.00% | |
| | | | |
Total expenses5 | | | 0.85% | | | | 0.82% | | | | 0.83% | | | | 0.81% | | | | 0.80% | |
| Expenses after payments, waivers and/or reimbursements and reduction to custodian expenses | | | 0.80% | | | | 0.80% | | | | 0.80% | | | | 0.80% | | | | 0.80%6 | |
| |
Portfolio turnover rate | | | 27% | | | | 26% | | | | 114% | | | | 60% | | | | 61% | |
1. Per share amounts calculated based on the average shares outstanding during the period.
2. Assumes an initial investment on the business day before the first day of the fiscal period, with all dividends and distributions reinvested in additional shares on the reinvestment date, and redemption at the net asset value calculated on the last business day of the fiscal period. Total returns are not annualized for periods less than one full year. Total return information does not reflect expenses that apply at the separate account level or to related insurance products. Inclusion of these charges would reduce the total return figures for all periods shown. Returns do not reflect the deduction of taxes that a shareholder would pay on fund distributions or the redemption of fund shares.
3. Annualized for periods less than one full year.
4. Less than 0.005%.
5. Total expenses including indirect expenses from affiliated fund fees and expenses were as follows:
| | |
Year Ended December 31, 2018 | | 0.85% |
Year Ended December 31, 2017 | | 0.82% |
Year Ended December 31, 2016 | | 0.83% |
Year Ended December 31, 2015 | | 0.81% |
Year Ended December 31, 2014 | | 0.80% |
6.Waiver less than 0.005%.
See accompanying Notes to Financial Statements.
13 OPPENHEIMER CAPITAL APPRECIATION FUND/VA
FINANCIAL HIGHLIGHTSContinued
| | | | | | | | | | | | | | | | | | | | |
| Service Shares | | Year Ended
December 31,
2018 | | | Year Ended
December 31,
2017 | | | Year Ended
December 31,
2016 | | | Year Ended
December 31,
2015 | | | Year Ended
December 31,
2014 | |
| |
Per Share Operating Data | | | | | | | | | | | | | | | | | | | | |
Net asset value, beginning of period | | | $54.89 | | | | $47.73 | | | | $54.80 | | | | $64.30 | | | | $57.37 | |
| |
Income (loss) from investment operations: | | | | | | | | | | | | | | | | | | | | |
Net investment income (loss)1 | | | (0.05) | | | | 0.02 | | | | 0.002 | | | | 0.07 | | | | (0.06) | |
Net realized and unrealized gain (loss) | | | (2.67) | | | | 12.16 | | | | (1.55) | | | | 2.22 | | | | 8.57 | |
| | | | |
Total from investment operations | | | (2.72) | | | | 12.18 | | | | (1.55) | | | | 2.29 | | | | 8.51 | |
Dividends and/or distributions to shareholders: | | | | | | | | | | | | | | | | | | | | |
Dividends from net investment income | | | 0.00 | | | | (0.01) | | | | (0.06) | | | | 0.00 | | | | (0.11) | |
Distributions from net realized gain | | | (4.39) | | | | (5.01) | | | | (5.46) | | | | (11.79) | | | | (1.47) | |
| | | | |
Total dividends and/or distributions to shareholders | | | (4.39) | | | | (5.02) | | | | (5.52) | | | | (11.79) | | | | (1.58) | |
| |
Net asset value, end of period | | | $47.78 | | | | $54.89 | | | | $47.73 | | | | $54.80 | | | | $64.30 | |
| | | | |
|
| |
Total Return, at Net Asset Value3 | | | (5.96)% | | | | 26.50% | | | | (2.43)% | | | | 3.27% | | | | 15.13% | |
|
| |
| |
Ratios/Supplemental Data | | | | | | | | | | | | | | | | | | | | |
Net assets, end of period (in thousands) | | | $141,790 | | | | $316,864 | | | | $295,226 | | | | $317,737 | | | | $337,318 | |
| |
Average net assets (in thousands) | | | $232,457 | | | | $314,506 | | | | $287,933 | | | | $332,468 | | | | $343,254 | |
| |
Ratios to average net assets:4 | | | | | | | | | | | | | | | | | | | | |
Net investment income (loss) | | | (0.09)% | | | | 0.04% | | | | 0.00%5 | | | | 0.12% | | | | (0.10)% | |
Expenses excluding specific expenses listed below | | | 1.10% | | | | 1.07% | | | | 1.08% | | | | 1.06% | | | | 1.05% | |
Interest and fees from borrowings | | | 0.00%5 | | | | 0.00%5 | | | | 0.00%5 | | | | 0.00%5 | | | | 0.00% | |
| | | | |
Total expenses6 | | | 1.10% | | | | 1.07% | | | | 1.08% | | | | 1.06% | | | | 1.05% | |
| Expenses after payments, waivers and/or reimbursements and reduction to custodian expenses | | | 1.05% | | | | 1.05% | | | | 1.05% | | | | 1.05% | | | | 1.05%7 | |
| |
Portfolio turnover rate | | | 27% | | | | 26% | | | | 114% | | | | 60% | | | | 61% | |
1. Per share amounts calculated based on the average shares outstanding during the period.
2. Less than $0.005 per share.
3. Assumes an initial investment on the business day before the first day of the fiscal period, with all dividends and distributions reinvested in additional shares on the reinvestment date, and redemption at the net asset value calculated on the last business day of the fiscal period. Total returns are not annualized for periods less than one full year. Total return information does not reflect expenses that apply at the separate account level or to related insurance products. Inclusion of these charges would reduce the total return figures for all periods shown. Returns do not reflect the deduction of taxes that a shareholder would pay on fund distributions or the redemption of fund shares.
4. Annualized for periods less than one full year.
5. Less than 0.005%.
6. Total expenses including indirect expenses from affiliated fund fees and expenses were as follows:
| | |
Year Ended December 31, 2018 | | 1.10% |
Year Ended December 31, 2017 | | 1.07% |
Year Ended December 31, 2016 | | 1.08% |
Year Ended December 31, 2015 | | 1.06% |
Year Ended December 31, 2014 | | 1.05% |
7.Waiver less than 0.005%.
See accompanying Notes to Financial Statements.
14 OPPENHEIMER CAPITAL APPRECIATION FUND/VA
NOTES TO FINANCIAL STATEMENTSDecember 31, 2018
1. Organization
Oppenheimer Capital Appreciation Fund/VA (the “Fund”), a separate series of Oppenheimer Variable Account Funds, is a diversifiedopen-end management investment company registered under the Investment Company Act of 1940 (“1940 Act”), as amended. The Fund’s investment objective is to seek capital appreciation. The Fund’s investment adviser is OFI Global Asset Management, Inc. (“OFI Global” or the “Manager”), a wholly-owned subsidiary of OppenheimerFunds, Inc. (“OFI” or the“Sub-Adviser”). The Manager has entered into asub-advisory agreement with OFI.
Shares of the Fund are sold only to separate accounts of life insurance companies.
The Fund offers two classes of shares. Both classes are sold at their offering price, which is the net asset value per share, to separate investment accounts of participating insurance companies as an underlying investment for variable life insurance policies, variable annuity contracts or other investment products. The class of shares designated as Service shares is subject to a distribution and service plan. Both classes of shares have identical rights and voting privileges with respect to the Fund in general and exclusive voting rights on matters that affect that class alone. Earnings, net assets and net asset value per share may differ due to each class having its own expenses, such as transfer and shareholder servicing agent fees and shareholder communications, directly attributable to that class.
The following is a summary of significant accounting policies followed in the Fund’s preparation of financial statements in accordance with accounting principles generally accepted in the United States (“U.S. GAAP”).
2. Significant Accounting Policies
Security Valuation.All investments in securities are recorded at their estimated fair value, as described in Note 3.
Foreign Currency Translation.The books and records of the Fund are maintained in U.S. dollars. Any foreign currency amounts are translated into U.S. dollars on the following basis:
(1) Value of investment securities, other assets and liabilities — at the exchange rates prevailing at market close as described in Note 3.
(2) Purchases and sales of investment securities, income and expenses — at the rates of exchange prevailing on the respective dates of such transactions.
Although the net assets and the values are presented at the foreign exchange rates at market close, the Fund does not isolate the portion of the results of operations resulting from changes in foreign exchange rates on investments from the fluctuations arising from changes in prices of securities held. Such fluctuations are included with the net realized and unrealized gains or losses from investments shown in the Statement of Operations.
For securities, which are subject to foreign withholding tax upon disposition, realized and unrealized gains or losses on such securities are recorded net of foreign withholding tax.
Reported net realized foreign exchange gains or losses arise from sales of foreign currencies, currency gains or losses realized between the trade and settlement dates on securities transactions, the difference between the amounts of dividends, interest, and foreign withholding tax reclaims recorded on the Fund’s books, and the U.S. dollar equivalent of the amounts actually received or paid. Net unrealized foreign exchange gains and losses arise from changes in the value of assets and liabilities other than investments in securities, resulting from changes in the exchange rate.
Allocation of Income, Expenses, Gains and Losses.Income, expenses (other than those attributable to a specific class), gains and losses are allocated on a daily basis to each class of shares based upon the relative proportion of net assets represented by such class. Operating expenses directly attributable to a specific class are charged against the operations of that class.
Dividends and Distributions to Shareholders. Dividends and distributions to shareholders, which are determined in accordance with income tax regulations and may differ from U.S. GAAP, are recorded on theex-dividend date. Income and capital gain distributions, if any, are declared and paid annually or at other times as determined necessary by the Manager.
Investment Income.Dividend income is recorded on theex-dividend date or uponex-dividend notification in the case of certain foreign dividends where theex-dividend date may have passed.Non-cash dividends included in dividend income, if any, are recorded at the fair value of the securities received. Withholding taxes on foreign dividends, if any, and capital gains taxes on foreign investments, if any, have been provided for in accordance with the Fund’s understanding of the applicable tax rules and regulations. Interest income, if any, is recognized on an accrual basis. Discount and premium, which are included in interest income on the Statement of Operations, are amortized or accreted daily.
Return of Capital Estimates.Distributions received from the Fund’s investments in Master Limited Partnerships (MLPs) and Real Estate Investments Trusts (REITs), generally are comprised of income and return of capital. Any return of capital estimates in excess of cost basis are classified as realized gain. The Fund records investment income and return of capital based on estimates. Such estimates are based on historical information available from each MLP, REIT and other industry sources. These estimates may subsequently be revised based on information received from MLPs and REITs after their tax reporting periods are concluded.
Custodian Fees. “Custodian fees and expenses” in the Statement of Operations may include interest expense incurred by the Fund on any cash overdrafts of its custodian account during the period. Such cash overdrafts may result from the effects of failed trades in portfolio securities and from cash outflows resulting from unanticipated shareholder redemption activity. The Fund pays interest to its custodian on such cash overdrafts, to the extent they are not offset by positive cash balances maintained by the Fund, at a rate equal to the Federal Funds Rate plus 2.00%. The “Reduction to custodian expenses” line item, if applicable, represents earnings on cash balances maintained by the Fund during the period. Such interest expense and other
15 OPPENHEIMER CAPITAL APPRECIATION FUND/VA
NOTES TO FINANCIAL STATEMENTSContinued
2. Significant Accounting Policies (Continued)
custodian fees may be paid with these earnings.
Security Transactions. Security transactions are recorded on the trade date. Realized gains and losses on securities sold are determined on the basis of identified cost.
Indemnifications.The Fund’s organizational documents provide current and former Trustees and officers with a limited indemnification against liabilities arising in connection with the performance of their duties to the Fund. In the normal course of business, the Fund may also enter into contracts that provide general indemnifications. The Fund’s maximum exposure under these arrangements is unknown as this would be dependent on future claims that may be made against the Fund. The risk of material loss from such claims is considered remote.
Federal Taxes.The Fund intends to comply with provisions of the Internal Revenue Code applicable to regulated investment companies and to distribute substantially all of its investment company taxable income, including any net realized gain on investments not offset by capital loss carryforwards, if any, to shareholders. Therefore, no federal income or excise tax provision is required. The Fund files income tax returns in U.S. federal and applicable state jurisdictions. The statute of limitations on the Fund’s tax return filings generally remains open for the three preceding fiscal reporting period ends. The Fund has analyzed its tax positions for the fiscal year ended December 31, 2018, including open tax years, and does not believe there are any uncertain tax positions requiring recognition in the Fund’s financial statements.
The tax components of capital shown in the following table represent distribution requirements the Fund must satisfy under the income tax regulations, losses the Fund may be able to offset against income and gains realized in future years and unrealized appreciation or depreciation of securities and other investments for federal income tax purposes.
| | | | | | | | | | | | |
Undistributed Net Investment Income | | Undistributed
Long-Term
Gain | | | Accumulated
Loss
Carryforward1,2 | | | Net Unrealized
Appreciation
Based on cost of
Securities and
Other Investments
for Federal Income
Tax Purposes | |
| |
$2,039,696 | | | $65,211,609 | | | | $— | | | | $120,933,480 | |
1. During the reporting period, the Fund did not utilize any capital loss carryforward.
2.During the previous reporting period, the Fund did not utilize any capital loss carryforward.
Net investment income (loss) and net realized gain (loss) may differ for financial statement and tax purposes. The character of dividends and distributions made during the fiscal year from net investment income or net realized gains are determined in accordance with federal income tax requirements, which may differ from the character of net investment income or net realized gains presented in those financial statements in accordance with U.S. GAAP. Also, due to timing of dividends and distributions, the fiscal year in which amounts are distributed may differ from the fiscal year in which the income or net realized gain was recorded by the Fund.
Accordingly, the following amounts have been reclassified for the reporting period. Net assets of the Fund were unaffected by the reclassifications.
| | | | |
Increase toPaid-in Capital | | Reduction to Accumulated
Net Earnings3 | |
| |
$11,711,569 | | | $11,711,569 | |
3.$11,717,513, including $11,502,965 of long-term capital gain, was distributed in connection with Fund share redemptions.
The tax character of distributions paid during the reporting periods:
| | | | | | | | |
| | | Year Ended
December 31, 2018 | | | Year Ended
December 31, 2017 | |
| |
Distributions paid from: | | | | | | | | |
Ordinary income | | $ | 26,045,927 | | | $ | 1,300,333 | |
Long-term capital gain | | | 33,473,272 | | | | 77,088,942 | |
| | | | |
Total | | $ | 59,519,199 | | | $ | 78,389,275 | |
| | | | |
The aggregate cost of securities and other investments and the composition of unrealized appreciation and depreciation of securities and other investments for federal income tax purposes at period end are noted in the following table. The primary difference between book and tax appreciation or depreciation of securities and other investments, if applicable, is attributable to the tax deferral of losses or tax realization of financial statement unrealized gain or loss.
16 OPPENHEIMER CAPITAL APPRECIATION FUND/VA
2. Significant Accounting Policies (Continued)
| | | | |
Federal tax cost of securities | | | $ 474,347,079 | |
| | | | |
Gross unrealized appreciation | | | $ 166,573,630 | |
Gross unrealized depreciation | | | (45,640,150) | |
| | | | |
Net unrealized appreciation | | | $ 120,933,480 | |
| | | | |
Use of Estimates. The preparation of financial statements in conformity with U.S. GAAP requires management to make estimates and assumptions that affect the reported amounts of assets and liabilities and disclosure of contingent assets and liabilities at the date of the financial statements and the reported amounts of increases and decreases in net assets from operations during the reporting period. Actual results could differ from those estimates.
New Accounting Pronouncements. In March 2017, Financial Accounting Standards Board (“FASB”) issued Accounting Standards Update (“ASU”), ASU2017-08. This provides guidance related to the amortization period for certain purchased callable debt securities held at a premium. The ASU is effective for annual periods beginning after December 15, 2018, and interim periods within those annual periods. The Manager has evaluated the impacts of these changes on the financial statements and there are no material impacts.
During August 2018, the Securities and Exchange Commission (the “SEC”) issued Final Rule ReleaseNo. 33-10532 (the “Rule”), Disclosure Update and Simplification. The rule amends certain financial statement disclosure requirements to conform to U.S. GAAP. The amendments to Rule6-04.17 of RegulationS-X (balance sheet) remove the requirement to separately state the book basis components of net assets: undistributed (over-distribution of) net investment income (“UNII”), accumulated undistributed net realized gains (losses), and net unrealized appreciation (depreciation) at the balance sheet date. Instead, consistent with U.S. GAAP, funds will be required to disclose total distributable earnings. The amendments to Rule6-09 of RegulationS-X (statement of changes in net assets) remove the requirement to separately state the sources of distributions paid. Instead, consistent with U.S. GAAP, funds will be required to disclose the total amount of distributions paid, except that any tax return of capital must be separately disclosed. The amendments also remove the requirement to parenthetically state the book basis amount of UNII on the statement of changes in net assets. The requirements of the Rule are effective November 5, 2018, and the Funds’ Statement of Assets and Liabilities and Statement of Changes in Net Assets for the current reporting period have been modified accordingly. In addition, certain amounts within each Fund’s Statement of Changes in Net Assets for the prior fiscal period have been modified to conform to the Rule.
3. Securities Valuation
The Fund calculates the net asset value of its shares as of 4:00 P.M. Eastern Time, on each day the New York Stock Exchange (the “Exchange” or “NYSE”) is open for trading, except in the case of a scheduled early closing of the Exchange, in which case the Fund will calculate net asset value of the shares as of the scheduled early closing time of the Exchange.
The Fund’s Board has adopted procedures for the valuation of the Fund’s securities and has delegated theday-to-day responsibility for valuation determinations under those procedures to the Manager. The Manager has established a Valuation Committee which is responsible for determining a fair valuation for any security for which market quotations are not readily available. The Valuation Committee’s fair valuation determinations are subject to review, approval and ratification by the Fund’s Board at least quarterly or more frequently, if necessary.
Valuation Methods and Inputs
Securities are valued primarily using unadjusted quoted market prices, when available, as supplied by third party pricing services or broker-dealers.
The following methodologies are used to determine the market value or the fair value of the types of securities described below:
Equity securities traded on a securities exchange (including exchange-traded derivatives other than futures and futures options) are valued based on the official closing price on the principal exchange on which the security is traded, as identified by the Manager, prior to the time when the Fund’s assets are valued. If the official closing price is unavailable, the security is valued at the last sale price on the principal exchange on which it is traded, or if no sales occurred, the security is valued at the mean between the quoted bid and asked prices.Over-the-counter equity securities are valued at the last published sale price, or if no sales occurred, at the mean between the quoted bid and asked prices. Events occurring after the close of trading on foreign exchanges may result in adjustments to the valuation of foreign securities to more accurately reflect their fair value as of the time when the Fund’s assets are valued.
Shares of a registered investment company that are not traded on an exchange are valued at that investment company’s net asset value per share.
Securities for which market quotations are not readily available, or when a significant event has occurred that would materially affect the value of the security, are fair valued either (i) by a standardized fair valuation methodology applicable to the security type or the significant event as previously approved by the Valuation Committee and the Fund’s Board or (ii) as determined in good faith by the Manager’s Valuation Committee. The Valuation Committee considers all relevant facts that are reasonably available, through either public information or information available to the Manager, when determining the fair value of a security. Those standardized fair valuation methodologies include, but are not limited to, valuing securities at the last sale price or initially at cost and subsequently adjusting the value based on: changes in company specific fundamentals, changes in an appropriate securities index, or changes in the value of similar securities which may be further adjusted for any discounts related to security-specific resale restrictions. When possible, such methodologies use observable market inputs such as unadjusted quoted prices of similar securities, observable interest rates, currency rates and yield curves. The methodologies used for valuing securities are not necessarily an indication of the risks associated with investing in those securities nor can it be assured that the Fund can obtain the fair value assigned to a security if it were to sell the security.
17 OPPENHEIMER CAPITAL APPRECIATION FUND/VA
NOTES TO FINANCIAL STATEMENTSContinued
3. Securities Valuation (Continued)
Classifications
Each investment asset or liability of the Fund is assigned a level at measurement date based on the significance and source of the inputs to its valuation.
Various data inputs may be used in determining the value of each of the Fund’s investments as of the reporting period end. These data inputs are categorized in the following hierarchy under applicable financial accounting standards:
1) Level1-unadjusted quoted prices in active markets for identical assets or liabilities (including securities actively traded on a securities exchange)
2) Level2-inputs other than unadjusted quoted prices that are observable for the asset or liability (such as unadjusted quoted prices for similar assets and market corroborated inputs such as interest rates, prepayment speeds, credit risks, etc.)
3) Level3-significant unobservable inputs (including the Manager’s own judgments about assumptions that market participants would use in pricing the asset or liability).
The inputs used for valuing securities are not necessarily an indication of the risks associated with investing in those securities.
The Fund classifies each of its investments in investment companies which are publicly offered as Level 1. Investment companies that are not publicly offered, if any, are classified as Level 2 in the fair value hierarchy.
The table below categorizes amounts that are included in the Fund’s Statement of Assets and Liabilities at period end based on valuation input level:
| | | | | | | | | | | | | | | | |
| | | Level 1—
Unadjusted Quoted Prices | | | Level 2— Other Significant Observable Inputs | | | Level 3— Significant Unobservable Inputs | | | Value | |
| |
Assets Table | | | | | | | | | | | | | | | | |
Investments, at Value: | | | | | | | | | | | | | | | | |
Common Stocks | | | | | | | | | | | | | | | | |
Consumer Discretionary | | $ | 190,870,889 | | | $ | — | | | $ | — | | | $ | 190,870,889 | |
Consumer Staples | | | 11,482,922 | | | | 4,019,313 | | | | — | | | | 15,502,235 | |
Energy | | | 14,372,118 | | | | — | | | | — | | | | 14,372,118 | |
Financials | | | 35,692,655 | | | | — | | | | — | | | | 35,692,655 | |
Health Care | | | 74,869,665 | | | | 2,087,946 | | | | — | | | | 76,957,611 | |
Industrials | | | 65,677,226 | | | | — | | | | — | | | | 65,677,226 | |
Information Technology | | | 177,486,698 | | | | — | | | | — | | | | 177,486,698 | |
Materials | | | 7,816,356 | | | | — | | | | — | | | | 7,816,356 | |
Utilities | | | 8,826,032 | | | | — | | | | — | | | | 8,826,032 | |
Investment Company | | | 2,094,243 | | | | — | | | | — | | | | 2,094,243 | |
| | | | |
Total Assets | | $ | 589,188,804 | | | $ | 6,107,259 | | | $ | — | | | $ | 595,296,063 | |
| | | | |
Forward currency exchange contracts and futures contracts, if any, are reported at their unrealized appreciation/depreciation at measurement date, which represents the change in the contract’s value from trade date. All additional assets and liabilities included in the above table are reported at their market value at measurement date.
For the reporting period, there were no transfers between levels.
4. Investments and Risks
Investments in Affiliated Funds. The Fund is permitted to invest in other mutual funds advised by the Manager (“Affiliated Funds”). Affiliated Funds are management investment companies registered under the 1940 Act, as amended. The Manager is the investment adviser of, and theSub-Adviser provides investment and related advisory services to, the Affiliated Funds. When applicable, the Fund’s investments in Affiliated Funds are included in the Statement of Investments. Shares of Affiliated Funds are valued at their net asset value per share. As a shareholder, the Fund is subject to its proportional share of the Affiliated Funds’ expenses, including their management fee. The Manager will waive fees and/or reimburse Fund expenses in an amount equal to the indirect management fees incurred through the Fund’s investment in the Affiliated Funds.
Each of the Affiliated Funds in which the Fund invests has its own investment risks, and those risks can affect the value of the Fund’s investments and therefore the value of the Fund’s shares. To the extent that the Fund invests more of its assets in one Affiliated Fund than in another, the Fund will have greater exposure to the risks of that Affiliated Fund.
Investments in Money Market Instruments.The Fund is permitted to invest its free cash balances in money market instruments to provide liquidity or for defensive purposes. The Fund may invest in money market instruments by investing in Class E shares of Oppenheimer Institutional Government Money Market Fund (“IGMMF”), which is an Affiliated Fund. IGMMF is regulated as a money market fund under the 1940 Act, as amended. The Fund may also invest in money market instruments directly or in other affiliated or unaffiliated money market funds.
Master Limited Partnerships (“MLPs”).MLPs issue common units that represent an equity ownership interest in a partnership and provide limited voting rights. MLP common units are registered with the Securities and Exchange Commission (“SEC”), and are freely tradable on securities exchanges such as the NYSE and the NASDAQ Stock Market (“NASDAQ”), or in theover-the-counter (“OTC”) market. An MLP consists of one or more general partners, who conduct the business, and one or more limited partners, who contribute capital. MLP common unit holders have a limited role in the
18 OPPENHEIMER CAPITAL APPRECIATION FUND/VA
4. Investments and Risks (Continued)
partnership’s operations and management. The Fund, as a limited partner, normally would not be liable for the debts of the MLP beyond the amounts the Fund has contributed, but would not be shielded to the same extent that a shareholder of a corporation would be. In certain circumstances creditors of an MLP would have the right to seek return of capital distributed to a limited partner. This right of an MLP’s creditors would continue after the Fund sold its investment in the MLP.
Equity Security Risk.Stocks and other equity securities fluctuate in price. The value of the Fund’s portfolio may be affected by changes in the equity markets generally. Equity markets may experience significant short-term volatility and may fall sharply at times. Different markets may behave differently from each other and U.S. equity markets may move in the opposite direction from one or more foreign stock markets. Adverse events in any part of the equity or fixed-income markets may have unexpected negative effects on other market segments.
The prices of individual equity securities generally do not all move in the same direction at the same time and a variety of factors can affect the price of a particular company’s securities. These factors may include, but are not limited to, poor earnings reports, a loss of customers, litigation against the company, general unfavorable performance of the company’s sector or industry, or changes in government regulations affecting the company or its industry.
Shareholder Concentration.At period end, one shareholder owned 20% or more of the Fund’s total outstanding shares.
The shareholder is a related partyof the Fund. Related parties may include, but are not limited to, the investment manager and its affiliates, affiliated broker dealers, fund of funds, and directors or employees.The related partyowned 61% of the Fund’s total outstanding shares at period end.
5. Market Risk Factors
The Fund’s investments in securities and/or financial derivatives may expose the Fund to various market risk factors:
Commodity Risk. Commodity risk relates to the change in value of commodities or commodity indexes as they relate to increases or decreases in the commodities market. Commodities are physical assets that have tangible properties. Examples of these types of assets are crude oil, heating oil, metals, livestock, and agricultural products.
Credit Risk.Credit risk relates to the ability of the issuer of debt to meet interest and principal payments, or both, as they come due. In general, lower-grade, higher-yield debt securities are subject to credit risk to a greater extent than lower-yield, higher-quality securities.
Equity Risk. Equity risk relates to the change in value of equity securities as they relate to increases or decreases in the general market.
Foreign Exchange Rate Risk. Foreign exchange rate risk relates to the change in the U.S. dollar value of a security held that is denominated in a foreign currency. The U.S. dollar value of a foreign currency denominated security will decrease as the dollar appreciates against the currency, while the U.S. dollar value will increase as the dollar depreciates against the currency.
Interest Rate Risk.Interest rate risk refers to the fluctuations in value of fixed-income securities resulting from the inverse relationship between price and yield. For example, an increase in general interest rates will tend to reduce the market value of already issued fixed-income investments, and a decline in general interest rates will tend to increase their value. In addition, debt securities with longer maturities, which tend to have higher yields, are subject to potentially greater fluctuations in value from changes in interest rates than obligations with shorter maturities.
Volatility Risk.Volatility risk refers to the magnitude of the movement, but not the direction of the movement, in a financial instrument’s price over a defined time period. Large increases or decreases in a financial instrument’s price over a relative time period typically indicate greater volatility risk, while small increases or decreases in its price typically indicate lower volatility risk.
6. Shares of Beneficial Interest
The Fund has authorized an unlimited number of $0.001 par value shares of beneficial interest of each class. Transactions in shares of beneficial interest were as follows:
| | | | | | | | | | | | | | | | |
| | | Year Ended December 31, 2018 | | | Year Ended December 31, 2017 | |
| | | Shares | | | Amount | | | Shares | | | Amount | |
| |
Non-Service Shares | | | | | | | | | | | | | | | | |
Sold | | | 363,347 | | | $ | 19,418,739 | | | | 393,813 | | | $ | 20,493,018 | |
Dividends and/or distributions reinvested | | | 779,254 | | | | 43,131,733 | | | | 978,541 | | | | 49,680,512 | |
Redeemed | | | (1,630,524) | | | | (91,352,971) | | | | (1,761,563) | | | | (93,219,544) | |
| | | | |
Net decrease | | | (487,923) | | | $ | (28,802,499) | | | | (389,209) | | | $ | (23,046,014) | |
| | | | |
|
| |
Service Shares | | | | | | | | | | | | | | | | |
Sold | | | 124,097 | | | $ | 6,689,300 | | | | 127,462 | | | $ | 6,431,379 | |
Dividends and/or distributions reinvested | | | 300,192 | | | | 16,387,466 | | | | 573,029 | | | | 28,708,763 | |
Redeemed | | | (3,229,296) | | | | (173,369,218) | | | | (1,113,678) | | | | (58,394,030) | |
| | | | |
Net decrease | | | (2,805,007) | | | $ | (150,292,452) | | | | (413,187) | | | $ | (23,253,888) | |
| | | | |
19 OPPENHEIMER CAPITAL APPRECIATION FUND/VA
NOTES TO FINANCIAL STATEMENTSContinued
7. Purchases and Sales of Securities
The aggregate cost of purchases and proceeds from sales of securities, other than short-term obligations and investments in IGMMF, for the reporting
period were as follows:
| | | | | | | | |
| | | Purchases | | | Sales | |
| |
Investment securities | | $ | 205,205,793 | | | | $447,542,853 | |
8. Fees and Other Transactions with Affiliates
Management Fees.Under the investment advisory agreement, the Fund pays the Manager a management fee based on the daily net assets of the Fund at an annual rate as shown in the following table:
| | |
| Fee Schedule |
|
Up to $200 million | | 0.75% |
Next $200 million | | 0.72 |
Next $200 million | | 0.69 |
Next $200 million | | 0.66 |
Next $200 million | | 0.60 |
Over $1 billion | | 0.58 |
The Fund’s effective management fee for the reporting period was 0.71% of average annual net assets before any applicable waivers.
Sub-Adviser Fees.The Manager has retained theSub-Adviser to provide theday-to-day portfolio management of the Fund. Under theSub-Advisory Agreement, the Manager pays theSub-Adviser an annual fee in monthly installments, equal to a percentage of the investment management fee collected by the Manager from the Fund, which shall be calculated after any investment management fee waivers. The fee paid to theSub-Adviser is paid by the Manager, not by the Fund.
Transfer Agent Fees.OFI Global (the “Transfer Agent”) serves as the transfer and shareholder servicing agent for the Fund. The Fund pays the Transfer Agent a fee based on annual net assets. Fees incurred and average net assets for each class with respect to these services are detailed in the Statement of Operations and Financial Highlights, respectively.
Sub-Transfer Agent Fees.The Transfer Agent has retained Shareholder Services, Inc., a wholly-owned subsidiary of OFI (the“Sub-Transfer Agent”), to provide theday-to-day transfer agent and shareholder servicing of the Fund. Under theSub-Transfer Agency Agreement, the Transfer Agent pays theSub-Transfer Agent an annual fee in monthly installments, equal to a percentage of the transfer agent fee collected by the Transfer Agent from the Fund, which shall be calculated after any applicable fee waivers. The fee paid to theSub-Transfer Agent is paid by the Transfer Agent, not by the Fund.
Trustees’ Compensation. The Fund’s Board of Trustees (“Board”) has adopted a compensation deferral plan for Independent Trustees that enables Trustees to elect to defer receipt of all or a portion of the annual compensation they are entitled to receive from the Fund. For purposes of determining the amount owed to the Trustees under the plan, deferred amounts are treated as though equal dollar amounts had been invested in shares of the Fund or in other Oppenheimer funds selected by the Trustees. The Fund purchases shares of the funds selected for deferral by the Trustees in amounts equal to his or her deemed investment, resulting in a Fund asset equal to the deferred compensation liability. Such assets are included as a component of “Other” within the asset section of the Statement of Assets and Liabilities. Deferral of Trustees’ fees under the plan will not affect the net assets of the Fund and will not materially affect the Fund’s assets, liabilities or net investment income per share. Amounts will be deferred until distributed in accordance with the compensation deferral plan.
Distribution and Service Plan for Service Shares.The Fund has adopted a Distribution and Service Plan (the “Plan”) pursuant to Rule12b-1 under the 1940 Act for Service shares to pay OppenheimerFunds Distributor, Inc. (the “Distributor”), for distribution related services, personal service and account maintenance for the Fund’s Service shares. Under the Plan, payments are made periodically at an annual rate of 0.25% of the daily net assets of Service shares of the Fund. The Distributor currently uses all of those fees to compensate sponsors of the insurance product that offers Fund shares, for providing personal service and maintenance of accounts of their variable contract owners that hold Service shares. These fees are paid out of the Fund’s assets on anon-going basis and increase operating expenses of the Service shares, which results in lower performance compared to the Fund’s shares that are not subject to a service fee. Fees incurred by the Fund under the Plan are detailed in the Statement of Operations.
Waivers and Reimbursements of Expenses. The Manager has contractually agreed to limit the Fund’s expenses after payments, waivers and/or reimbursements and reduction to custodian expenses, excluding any applicable dividend expense, taxes, interest and fees from borrowing, any subsidiary expenses, Acquired Fund Fees and Expenses, brokerage commissions, unusual and infrequent expenses and certain other Fund expenses; so that those expenses, as percentages of daily net assets, will not exceed the annual rate of 0.80% forNon-Service shares and 1.05% for Service shares.
During the reporting period, the Manager waived fees and/or reimbursed the Fund as follows:
| | | | |
Non-Service Shares | | $ | 273,233 | |
Service Shares | | | 107,498 | |
This fee waiver and/or expense reimbursement may not be amended or withdrawn for one year from the date of the Fund’s prospectus, unless approved
20 OPPENHEIMER CAPITAL APPRECIATION FUND/VA
8. Fees and Other Transactions with Affiliates (Continued)
by the Board.
The Manager will waive fees and/or reimburse Fund expenses in an amount equal to the indirect management fees incurred through the Fund’s investment in IGMMF. During the reporting period, the Manager waived fees and/or reimbursed the Fund $2,817 for IGMMF management fees.
9. Borrowings and Other Financing
Joint Credit Facility.A number of mutual funds managed by the Manager participate in a $1.95 billion revolving credit facility (the “Facility”) intended to provide short-term financing, if necessary, subject to certain restrictions in connection with atypical redemption activity. Expenses and fees related to the Facility are paid by the participating funds and are disclosed separately or as other expenses on the Statement of Operations. The Fund did not utilize the Facility during the reporting period.
10. Pending Acquisition
On October 18, 2018, Massachusetts Mutual Life Insurance Company, an indirect corporate parent of theSub-Adviser and the Manager, announced that it has entered into an agreement whereby Invesco Ltd. (“Invesco”), a global investment management company, will acquire theSub-Adviser (the “Transaction”). In connection with the Transaction, on January 11, 2019, the Fund’s Board unanimously approved an Agreement and Plan of Reorganization (the “Agreement”), which provides for the transfer of the assets and liabilities of the Fund to a corresponding, newly formed fund (the “Acquiring Fund”) in the Invesco family of funds (the “Reorganization”) in exchange for shares of the corresponding Acquiring Fund of equal value to the value of the shares of the Fund as of the close of business on the closing date. Although the Acquiring Fund will be managed by Invesco Advisers, Inc., the Acquiring Fund will, as of the closing date, have the same investment objective and substantially similar principal investment strategies and risks as the Fund. After the Reorganization, Invesco Advisers, Inc. will be the investment adviser to the Acquiring Fund, and the Fund will be liquidated and dissolved under applicable law and terminate its registration under the Investment Company Act of 1940, as amended. The Reorganization is expected to be atax-free reorganization for U.S. federal income tax purposes.
The Reorganization is subject to the approval of shareholders of the Fund. Shareholders of record of the Fund on January 14, 2019 will be entitled to vote on the Reorganization and will receive a combined prospectus and proxy statement describing the Reorganization, the shareholder meeting, and a discussion of the factors the Fund’s Board considered in approving the Agreement. The combined prospectus and proxy statement is expected to be distributed to shareholders of record on or about February 28, 2019. The anticipated date of the shareholder meeting is on or about April 12, 2019.
If shareholders approve the Agreement and certain other closing conditions are satisfied or waived, the Reorganization is expected to close during the second quarter of 2019, or as soon as practicable thereafter. This is subject to change.
21 OPPENHEIMER CAPITAL APPRECIATION FUND/VA
REPORT OF INDEPENDENT REGISTERED PUBLIC ACCOUNTING FIRM
To the Shareholders and Board of Trustees
Oppenheimer Variable Account Funds:
Opinion on the Financial Statements
We have audited the accompanying statement of assets and liabilities of Oppenheimer Capital Appreciation Fund/VA, a separate series of Oppenheimer Variable Account Funds, (the “Fund”), including the statement of investments, as of December 31, 2018, the related statement of operations for the year then ended, the statements of changes in net assets for each of the years in the two year period then ended, and the related notes (collectively, the “financial statements”) and the financial highlights for each of the years in the five year period then ended. In our opinion, the financial statements and financial highlights present fairly, in all material respects, the financial position of the Fund as of December 31, 2018, the results of its operations for the year then ended, the changes in its net assets for each of the years in the two year period then ended, and the financial highlights for each of the years in the five year period then ended, in conformity with U.S. generally accepted accounting principles.
Basis for Opinion
These financial statements and financial highlights are the responsibility of the Fund’s management. Our responsibility is to express an opinion on these financial statements and financial highlights based on our audits. We are a public accounting firm registered with the Public Company Accounting Oversight Board (United States) (“PCAOB”) and are required to be independent with respect to the Fund in accordance with the U.S. federal securities laws and the applicable rules and regulations of the Securities and Exchange Commission and the PCAOB.
We conducted our audits in accordance with the standards of the PCAOB. Those standards require that we plan and perform the audit to obtain reasonable assurance about whether the financial statements and financial highlights are free of material misstatement, whether due to error or fraud. Our audits included performing procedures to assess the risks of material misstatement of the financial statements and financial highlights, whether due to error or fraud, and performing procedures that respond to those risks. Such procedures included examining, on a test basis, evidence regarding the amounts and disclosures in the financial statements and financial highlights. Such procedures also included confirmation of securities owned as of December 31, 2018, by correspondence with the custodian, brokers and the transfer agent, or by other appropriate auditing procedures. Our audits also included evaluating the accounting principles used and significant estimates made by management, as well as evaluating the overall presentation of the financial statements and financial highlights. We believe that our audits provide a reasonable basis for our opinion.
KPMGLLP
We have not been able to determine the specific year that we began serving as the auditor of one or more Oppenheimer Funds investment companies, however we are aware that we have served as the auditor of one or more Oppenheimer Funds investment companies since at least 1969.
Denver, Colorado
February 14, 2019
22 OPPENHEIMER CAPITAL APPRECIATION FUND/VA
FEDERAL INCOME TAX INFORMATION Unaudited
In early 2019, if applicable, shareholders of record received information regarding all dividends and distributions paid to them by the Fund during calendar year 2018.
Capital gain distributions of $2.54341 per share were paid toNon-Service and Service shareholders, respectively, on June 19, 2018. Whether received in stock or in cash, the capital gain distribution should be treated by shareholders as a gain from the sale of the capital assets held for more than one year (long-term capital gains).
Dividends, if any, paid by the Fund during the reporting period which are not designated as capital gain distributions should be multiplied by the maximum amount allowable but not less than 100.00% to arrive at the amount eligible for the corporate dividend-received deduction.
Dividends, if any, paid by the Fund during the reporting period which are not designated as capital gain distributions, may be eligible for lower individual income tax rates to the extent that the Fund has received qualified dividend income as stipulated by recent tax legislation. In early 2019, shareholders of record received information regarding the percentage of distributions that are eligible for lower individual income tax rates. The amount will be the maximum amount allowed.
The foregoing information is presented to assist shareholders in reporting distributions received from the Fund to the Internal Revenue Service. Because of the complexity of the federal regulations which may affect your individual tax return and the many variations in state and local tax regulations, we recommend that you consult your tax advisor for specific guidance.
23 OPPENHEIMER CAPITAL APPRECIATION FUND/VA
BOARD APPROVAL OF THE FUND’S INVESTMENT ADVISORY AND SUB-ADVISORY AGREEMENTS Unaudited
The Fund has entered into an investment advisory agreement with OFI Global Asset Management, Inc. (“OFI Global” or the “Adviser”), a wholly-owned subsidiary of OppenheimerFunds, Inc. (“OFI” or the“Sub-Adviser”) (“OFI Global” and “OFI” together the “Managers”) and OFI Global has entered into asub-advisory agreement with OFI whereby OFI provides investmentsub-advisory services to the Fund (collectively, the “Agreements”). Each year, the Board of Trustees (the “Board”), including a majority of the independent Trustees, is required to determine whether to approve the terms of the Agreements and the renewal thereof. The Investment Company Act of 1940, as amended, requires that the Board request and evaluate, and that the Managers provide, such information as may be reasonably necessary to evaluate the terms of the Agreements. The Board employs an independent consultant to prepare a report that provides information, including comparative information that the Board requests for that purpose. In addition toin-person meetings focused on this evaluation, the Board receives information throughout the year regarding Fund services, fees, expenses and performance.
The Managers and the independent consultant provided information to the Board on the following factors: (i) the nature, quality and extent of the Managers’ services, (ii) the comparative investment performance of the Fund and the Managers, (iii) the fees and expenses of the Fund, including comparative fee and expense information, (iv) the profitability of the Managers and their affiliates, including an analysis of the cost of providing services, (v) whether economies of scale are realized as the Fund grows and whether fee levels reflect these economies of scale for Fund investors and (vi) other benefits to the Managers from their relationship with the Fund. The Board was aware that there are alternatives to retaining the Managers.
Outlined below is a summary of the principal information considered by the Board as well as the Board’s conclusions.
Nature, Quality and Extent of Services. The Board considered information about the nature, quality and extent of the services provided to the Fund and information regarding the Managers’ key personnel who provide such services. The Managers’ duties include providing the Fund with the services of theSub-Adviser’s portfolio manager and investment team, who provide research, analysis and other advisory services in regard to the Fund’s investments; and securities trading services. OFI Global is responsible for oversight of third-party service providers; monitoring compliance with applicable Fund policies and procedures and adherence to the Fund’s investment restrictions; risk management; and oversight of theSub-Adviser. OFI Global is also responsible for providing certain administrative services to the Fund. Those services include providing and supervising all administrative and clerical personnel who are necessary in order to provide effective corporate administration for the Fund; compiling and maintaining records with respect to the Fund’s operations; preparing and filing reports required by the U.S. Securities and Exchange Commission; preparing periodic reports regarding the operations of the Fund for its shareholders; preparing proxy materials for shareholder meetings; and preparing the registration statements required by federal and state securities laws for the sale of the Fund’s shares. OFI Global also provides the Fund with office space, facilities and equipment.
The Board also considered the quality of the services provided and the quality of the Managers’ resources that are available to the Fund. The Board took account of the fact that theSub-Adviser has over fifty years of experience as an investment adviser and that its assets under management rank it among the top mutual fund managers in the United States. The Board evaluated the Managers’ advisory, administrative, accounting, legal, compliance and risk management services, among other services, and information the Board has received regarding the experience and professional qualifications of the Managers’ key personnel and the size and functions of their staff. In its evaluation of the quality of the portfolio management services provided, the Board considered the experience of Paul Larson, the portfolio manager for the Fund, and theSub-Adviser’s investment team and analysts. The Board members also considered the totality of their experiences with the Managers as directors or trustees of the Fund and other funds advised by the Managers. The Board considered information regarding the quality of services provided by affiliates of the Managers, which the Board members have become knowledgeable about through their experiences with the Managers and in connection with the review or renewal of the Fund’s service agreements or service providers. The Board concluded, in light of the Managers’ experience, reputation, personnel, operations and resources that the Fund benefits from the services provided under the Agreements.
Investment Performance of the Managers and the Fund. Throughout the year, the Managers provided information on the investment performance of the Fund, the Adviser and theSub-Adviser, including comparative performance information. The Board also reviewed information, prepared by the Managers and by the independent consultant, comparing the Fund’s historical performance to relevant market indices and to the performance of other large growth funds underlying variable insurance products. The Board noted that the Fund underperformed its category median during all periods. The Board also considered, however, that Paul Larson took over sole portfolio management responsibilities in October 2016 and that the Fund was repositioned to an“all-weather orientation” from a growth orientation by December 31, 2016. In this regard, the Board considered that the Fund’s performance in 2017, the first full year with the Fund’s new portfolio manager and repositioned strategy, was an improvement over the prior year and that it was reasonable to allow the new portfolio manager more time to develop his performance record.
Fees and Expenses of the Fund. The Board reviewed the fees paid to the Adviser and the other expenses borne by the Fund. The Board noted that the Adviser, not the Fund, pays theSub-Adviser’s fee under thesub-advisory agreement. The independent consultant provided comparative data in regard to the fees and expenses of the Fund and other large growth funds underlying variable insurance products. In reviewing the fees and expenses charged to the VA funds, the Board considered the Adviser’s assertion that, because there is much greater disparity in the fees and services that may be provided by a manager to a VA fund as opposed to a retail fund, when comparing the expenses of the various VA funds to those of retail funds, it is most appropriate to focus on total expenses (rather than on the management fees). The Board considered that while the Fund’s total expenses were higher than its peer group median and its category median, its contractual management fee was lower than its peer group median and one basis point higher than its category median. The Board noted that the Adviser has contractually agreed to limit the Fund’s total annual operating expenses so that those expenses, as percentages of daily net assets, will not exceed the annual rate of 0.80% forNon-Service Shares and 1.05% for Service Shares. This waiver and/or reimbursement may not be amended or withdrawn for one year from the date of the Fund’s prospectus, unless approved by the Board. The Board further considered that the Adviser has agreed to waive fees and/or reimburse Fund expenses in an amount equal to the indirect management fees incurred through the Fund’s investments in funds managed by the Adviser or its affiliates.
Economies of Scale and Profits Realized by the Managers. The Board considered information regarding the Managers’ costs in serving as the Fund’s investment adviser andsub-adviser, including the costs associated with the personnel and systems necessary to manage the Fund, and
24 OPPENHEIMER CAPITAL APPRECIATION FUND/VA
BOARD APPROVAL OF THE FUND’S INVESTMENT ADVISORY ANDSUB-ADVISORY AGREEMENTSUnaudited / Continued
information regarding the Managers’ profitability from their relationship with the Fund. The Board also considered that the Managers must be able to pay and retain experienced professional personnel at competitive rates to provide quality services to the Fund. The Board reviewed whether the Managers may realize economies of scale in managing and supporting the Fund. The Board noted that the Fund currently has management fee breakpoints, which are intended to share with Fund shareholders economies of scale that may exist as the Fund’s assets grow.
Other Benefits to the Managers. In addition to considering the profits realized by the Managers, the Board considered information that was provided regarding the direct and indirect benefits the Managers receive as a result of their relationship with the Fund, including compensation paid to the Managers’ affiliates and research provided to the Adviser in connection with permissible brokerage arrangements (soft dollar arrangements).
Conclusions. These factors were also considered by the independent Trustees meeting separately from the full Board, assisted by experienced counsel to the Fund and to the independent Trustees. Fund counsel and the independent Trustees’ counsel are independent of the Managers within the meaning and intent of the Securities and Exchange Commission Rules.
Based on its review of the information it received and its evaluations described above, the Board, including a majority of the independent Trustees, decided to continue the Agreements through August 31, 2019. In arriving at its decision, the Board did not identify any factor or factors as being more important than others, but considered all of the above information, and considered the terms and conditions of the Agreements, including the management fees, in light of all the surrounding circumstances.
25 OPPENHEIMER CAPITAL APPRECIATION FUND/VA
PORTFOLIO PROXY VOTING POLICIES AND GUIDELINES; UPDATES TO STATEMENT OF INVESTMENTSUnaudited
The Fund has adopted Portfolio Proxy Voting Policies and Guidelines under which the Fund votes proxies relating to securities (“portfolio proxies”) held by the Fund. A description of the Fund’s Portfolio Proxy Voting Policies and Guidelines is available (i) without charge, upon request, by calling the Fund toll-free at 1.800.CALL OPP (225.5677), (ii) on the Fund’s website at www.oppenheimerfunds.com, and (iii) on the SEC’s website at www.sec.gov. In addition, the Fund is required to file FormN-PX, with its complete proxy voting record for the 12 months ended June 30th, no later than August 31st of each year. The Fund’s voting record is available (i) without charge, upon request, by calling the Fund toll-free at 1.800.CALL OPP (225.5677), and (ii) in the FormN-PX filing on the SEC’s website at www.sec.gov.
The Fund files its complete schedule of portfolio holdings with the SEC for the first quarter and the third quarter of each fiscal year on FormN-Q. The Fund’s FormN-Q filings are available on the SEC’s website at www.sec.gov.
26 OPPENHEIMER CAPITAL APPRECIATION FUND/VA
TRUSTEES AND OFFICERSUnaudited
| | |
| Name, Position(s) Held with the Fund, Length of Service, Year of Birth | | Principal Occupation(s) During the Past 5 Years; Other Trusteeships/Directorships Held; Number of Portfolios in the Fund Complex Currently Overseen |
| |
| INDEPENDENT TRUSTEES | | The address of each Trustee in the chart below is 6803 S. Tucson Way, Centennial, Colorado 80112-3924. Each Trustee serves for an indefinite term, or until his or her resignation, retirement, death or removal. Each of the Trustees in the chart below oversees 58 portfolios in the OppenheimerFunds complex. |
| |
Robert J. Malone, Chairman of the Board of Trustees (since 2016), Trustee (since 2002) Year of Birth: 1944 | | Chairman - Colorado Market of MidFirst Bank (since January 2015); Chairman of the Board (2012-2016) and Director (August 2005-January 2016) of Jones International University (educational organization); Trustee of the Gallagher Family Foundation(non-profit organization) (2000-2016); Chairman, Chief Executive Officer and Director of Steele Street Bank Trust (commercial banking) (August 2003-January 2015); Director of Opera Colorado Foundation(non-profit organization) (2008-2012); Director of Colorado UpLIFT (charitable organization) (1986-2010); Director of Jones Knowledge, Inc. (2006-2010); Former Chairman of U.S. Bank-Colorado (subsidiary of U.S. Bancorp and formerly Colorado National Bank) (July 1996-April 1999); Director of Commercial Assets, Inc. (real estate investment trust) (1993-2000); Director of U.S. Exploration, Inc. (oil and gas exploration) (1997-February 2004); Chairman of the Board (1991-1994) and Trustee (1985-1994) of Regis University; and Chairman of the Board (1990-1991) and Member (1984-1999) of Young Presidents Organization. Mr. Malone has served on the Boards of certain Oppenheimer funds since 2002, during which time he has become familiar with the Fund’s (and other Oppenheimer funds’) financial, accounting, regulatory and investment matters and has contributed to the Board’s deliberations. |
| |
Andrew J. Donohue, Trustee (since 2017) Year of Birth: 1950 | | Director, Mutual Fund Directors Forum (since February 2018); Of Counsel, Shearman & Sterling LLP (since September 2017); Chief of Staff of the U.S. Securities and Exchange Commission (regulator) (June 2015-February 2017); Managing Director and Investment Company General Counsel of Goldman Sachs (investment bank) (November2012-May 2015); Partner at Morgan Lewis & Bockius, LLP (law firm) (March 2011-October 2012); Director of the Division of Investment Management of U.S. Securities and Exchange Commission (regulator) (May 2006-November 2010); Global General Counsel of Merrill Lynch Investment Managers (investment firm) (May2003-May 2006); General Counsel (October 1991-November 2001) and Executive Vice President (January 1993-November 2001) of OppenheimerFunds, Inc. (investment firm) (June 1991-November 2001). Mr. Donohue has served on the Boards of certain Oppenheimer funds since 2017, during which time he has become familiar with the Fund’s (and other Oppenheimer funds’) financial, accounting, regulatory and investment matters and has contributed to the Board’s deliberations. |
| |
Richard F. Grabish, Trustee (since 2012) Year of Birth: 1948 | | Formerly Senior Vice President and Assistant Director of Sales and Marketing (March 1997-December 2007), Director (March 1987-December 2007) and Manager of Private Client Services (June 1985-June 2005) of A.G. Edwards & Sons, Inc. (broker/dealer and investment firm); Chairman and Chief Executive Officer of A.G. Edwards Trust Company, FSB (March 2001-December 2007); President and Vice Chairman of A.G. Edwards Trust Company, FSB (investment adviser) (April 1987-March 2001); President of A.G. Edwards Trust Company, FSB (investment adviser) (June 2005-December 2007). Mr. Grabish has served on the Boards of certain Oppenheimer funds since 2001, during which time he has become familiar with the Fund’s (and other Oppenheimer funds’) financial, accounting, regulatory and investment matters and has contributed to the Board’s deliberations. |
| |
Beverly L. Hamilton, Trustee (since 2002) Year of Birth: 1946 | | Trustee of Monterey Institute for International Studies (educational organization) (2000-2014); Board Member of Middlebury College (educational organization) (December 2005-June 2011); Director of the Board (1991-2016), Vice Chairman of the Board (2006-2009) and Chairman of the Board (2010-2013) of American Funds’ Emerging Markets Growth Fund, Inc. (mutual fund); Director of The California Endowment (philanthropic organization) (April 2002-April 2008); Director (February 2002-2005) and Chairman of Trustees (2006-2007) of the Community Hospital of Monterey Peninsula; President of ARCO Investment Management Company (February 1991-April 2000); Member of the investment committees of The Rockefeller Foundation (2001-2006) and The University of Michigan (since 2000); Advisor at Credit Suisse First Boston’s Sprout venture capital unit (venture capital fund) (1994-January 2005); Trustee of MassMutual Institutional Funds (investment company) (1996-June 2004); Trustee of MML Series Investment Fund (investment company) (April 1989-June 2004); Member of the investment committee of Hartford Hospital (2000-2003); and Advisor to Unilever (Holland) pension fund (2000-2003). Ms. Hamilton has served on the Boards of certain Oppenheimer funds since 2002, during which time she has become familiar with the Fund’s (and other Oppenheimer funds’) financial, accounting, regulatory and investment matters and has contributed to the Board’s deliberations. |
| |
Victoria J. Herget, Trustee (since 2012) Year of Birth:1951 | | Board Chair (2008-2015) and Director (2004-Present) of United Educators (insurance company); Trustee (since 2000) and Chair (2010-2017) of Newberry Library (independent research library); Trustee, Mather LifeWays (senior living organization) (since 2001); Independent Director of the First American Funds (mutual fund family) (2003-2011); former Managing Director (1993-2001), Principal (1985-1993), Vice President (1978-1985) and Assistant Vice President (1973-1978) of Zurich Scudder Investments (investment adviser) (and its predecessor firms); Trustee (1992-2007), Chair of the Board of Trustees (1999-2007), Investment Committee Chair (1994-1999) and Investment Committee member (2007-2010) of Wellesley College; Trustee, BoardSource(non-profit organization) (2006-2009) and Chicago City Day School(K-8 School) (1994-2005). Ms. Herget has served on the Boards of certain Oppenheimer funds since 2012, during which time she has become familiar with the Fund’s (and other Oppenheimer funds’) financial, accounting, regulatory and investment matters and has contributed to the Board’s deliberations. |
| |
Karen L. Stuckey, Trustee (since 2012) Year of Birth: 1953 | | Member (since May 2015) of Desert Mountain Community Foundation Advisory Board(non-profit organization); Partner (1990-2012) of PricewaterhouseCoopers LLP (professional services firm) (held various positions 1975-1990); Trustee (1992- 2006); member of Executive, Nominating and Audit Committees and Chair of Finance Committee (1992-2006), and Emeritus Trustee (since 2006) of Lehigh University; member, Women’s Investment Management Forum (professional organization) (since inception) and Trustee of Jennies School for Little Children(non-profit) (2011-2014). Ms. Stuckey has served on the Boards of certain Oppenheimer funds since 2012, during which time she has become familiar with the Fund’s (and other Oppenheimer funds’) financial, accounting, regulatory and investment matters and has contributed to the Board’s deliberations. |
27 OPPENHEIMER CAPITAL APPRECIATION FUND/VA
TRUSTEES AND OFFICERSUnaudited / Continued
| | |
James D. Vaughn, Trustee (since 2012) Year of Birth:1945 | | Retired; former managing partner (1994-2001) of Denver office of Deloitte & Touche LLP, (held various positions in Denver and New York offices from 1969-1993); Trustee and Chairman of the Audit Committee of Schroder Funds (2003-2012); Board member and Chairman of Audit Committee of AMG National Trust Bank (since 2005); Trustee and Investment Committee member, University of South Dakota Foundation (since 1996); Board member, Audit Committee Member and past Board Chair, Junior Achievement (since 1993); former Board member, Mile High United Way, Boys and Girls Clubs, Boy Scouts, Colorado Business Committee for the Arts, Economic Club of Colorado and Metro Denver Network. Mr. Vaughn has served on the Boards of certain Oppenheimer funds since 2012, during which time he has become familiar with the Fund’s (and other Oppenheimer funds’) financial, accounting, regulatory and investment matters and has contributed to the Board’s deliberations. |
| INTERESTED TRUSTEE AND OFFICER | | Mr. Steinmetz is an “Interested Trustee” because he is affiliated with the Manager and theSub-Adviser by virtue of his positions as Chairman and director of theSub-Adviser and officer and director of the Manager. Both as a Trustee and as an officer, Mr. Steinmetz serves for an indefinite term, or until his resignation, retirement, death or removal. Mr. Steinmetz’s address is 225 Liberty Street, New York, New York 10281- 1008. Mr. Steinmetz is an officer of 104 portfolios in the OppenheimerFunds complex. |
| |
Arthur P. Steinmetz, Trustee (since 2015), President and Principal Executive Officer (since 2014) Year of Birth: 1958 | | Chairman of OppenheimerFunds, Inc. (since January 2015); CEO and Chairman of OFI Global Asset Management, Inc. (since July 2014), President of OFI Global Asset Management, Inc. (since May 2013), a Director of OFI Global Asset Management, Inc. (since January 2013), Director of OppenheimerFunds, Inc. (since July 2014), President, Management Director and CEO of Oppenheimer Acquisition Corp. (OppenheimerFunds, Inc.‘s parent holding company) (since July 2014), and President and Director of OFI SteelPath, Inc. (since January 2013). Chief Investment Officer of the OppenheimerFunds advisory entities (January 2013-December 2013); Executive Vice President of OFI Global Asset Management, Inc. (January2013-May 2013); Chief Investment Officer of OppenheimerFunds, Inc. (October 2010-December 2012); Chief Investment Officer, Fixed- Income, of OppenheimerFunds, Inc. (April 2009-October 2010); Executive Vice President of OppenheimerFunds, Inc. (October 2009-December 2012); Director of Fixed Income of OppenheimerFunds, Inc. (January 2009-April 2009); and a Senior Vice President of OppenheimerFunds, Inc. (March 1993-September 2009). |
| OTHER OFFICERS OF THE FUND | | The addresses of the Officers in the chart below are as follows: for Mr. Larson, Mss. Lo Bessette, Foxson and Picciotto, 225 Liberty Street, New York, New York 10281-1008, for Mr. Petersen, 6803 S. Tucson Way, Centennial, Colorado 80112-3924. Each Officer serves for an indefinite term or until his or her resignation, retirement, death or removal. |
| |
Paul Larson, Vice President (since 2016) Year of Birth: 1971 | | Vice President of theSub-Adviser and Portfolio Manager of the Main Street Team (since January 2013). Prior to joining theSub-Adviser, he was a portfolio manager and Chief Equity Strategist at Morningstar. He was previously an analyst at Morningstar covering the energy sector and oversaw the firm’s natural resources analysts. Prior to joining Morningstar in 2002, Mr. Larson was an analyst with The Motley Fool. |
| |
Cynthia Lo Bessette, Secretary and Chief Legal Officer (since 2016) Year of Birth: 1969 | | Executive Vice President, General Counsel and Secretary of OFI Global Asset Management, Inc. (since February 2016); Senior Vice President and Deputy General Counsel of OFI Global Asset Management, Inc. (March 2015-February 2016); Chief Legal Officer of OppenheimerFunds, Inc. and OppenheimerFunds Distributor, Inc. (since February 2016); Vice President, General Counsel and Secretary of Oppenheimer Acquisition Corp. (since February 2016); General Counsel of OFI SteelPath, Inc., OFI Advisors, LLC and Index Management Solutions, LLC (since February 2016); Chief Legal Officer of OFI Global Institutional, Inc., HarbourView Asset Management Corporation, OFI Global Trust Company, Oppenheimer Real Asset Management, Inc., OFI Private Investments Inc., Shareholder Services, Inc. and Trinity Investment Management Corporation (since February 2016); Corporate Counsel (February 2012-March 2015) and Deputy Chief Legal Officer (April 2013-March 2015) of Jennison Associates LLC; Assistant General Counsel (April 2008-September 2009) and Deputy General Counsel (October 2009-February 2012) of Lord Abbett & Co. LLC. |
| |
Jennifer Foxson, Vice President and Chief Business Officer (since 2014) Year of Birth: 1969 | | Senior Vice President of OppenheimerFunds Distributor, Inc. (since June 2014); Vice President of OppenheimerFunds Distributor, Inc. (April 2006-June 2014); Vice President of OppenheimerFunds, Inc. (January 1998-March 2006); Assistant Vice President of OppenheimerFunds, Inc. (October 1991-December 1998). |
| |
Mary Ann Picciotto, Chief Compliance Officer and Chief Anti-Money Laundering Officer (since 2014) Year of Birth: 1973 | | Senior Vice President and Chief Compliance Officer of OFI Global Asset Management, Inc. (since March 2014); Chief Compliance Officer of OppenheimerFunds, Inc., OFI SteelPath, Inc., OFI Global Institutional, Inc., Oppenheimer Real Asset Management, Inc., OFI Private Investments Inc., Harborview Asset Management Corporation, Trinity Investment Management Corporation, and Shareholder Services, Inc. (since March 2014); Managing Director of Morgan Stanley Investment Management Inc. and certain of its various affiliated entities; Chief Compliance Officer of various Morgan Stanley Funds (May 2010-January 2014); Chief Compliance Officer of Morgan Stanley Investment Management Inc. (April 2007-January 2014). |
| |
Brian S. Petersen, Treasurer and Principal Financial & Accounting Officer (since 2016) Year of Birth: 1970 | | Senior Vice President of OFI Global Asset Management, Inc. (since January 2017); Vice President of OFI Global Asset Management, Inc. (January 2013-January 2017); Vice President of OppenheimerFunds, Inc. (February 2007-December 2012); Assistant Vice President of OppenheimerFunds, Inc. (August 2002-2007). |
The Fund’s Statement of Additional Information contains additional information about the Fund’s Trustees and Officers and is available without charge, upon request, by calling 1.800. 988.8287.
28 OPPENHEIMER CAPITAL APPRECIATION FUND/VA
THIS PAGE INTENTIONALLY LEFT BLANK.
29 OPPENHEIMER CAPITAL APPRECIATION FUND/VA
THIS PAGE INTENTIONALLY LEFT BLANK.
30 OPPENHEIMER CAPITAL APPRECIATION FUND/VA
THIS PAGE INTENTIONALLY LEFT BLANK.
31 OPPENHEIMER CAPITAL APPRECIATION FUND/VA
OPPENHEIMER CAPITAL APPRECIATION FUND/VA
A Series of Oppenheimer Variable Account Funds
| | |
| Manager | | OFI Global Asset Management, Inc. |
| |
| Sub-Adviser | | OppenheimerFunds, Inc. |
| |
| Distributor | | OppenheimerFunds Distributor, Inc. |
| |
| Transfer and Shareholder Servicing Agent | | OFI Global Asset Management, Inc. |
| |
| Sub-Transfer Agent | | Shareholder Services, Inc. DBA OppenheimerFunds Services |
| |
Independent Registered Public Accounting Firm | | KPMG LLP |
| |
| Legal Counsel | | Ropes & Gray LLP |
| |
| | Before investing in any of the Oppenheimer funds, investors should carefully consider a fund’s investment objectives, risks, charges and expenses. Fund prospectuses and summary prospectuses contain this and other information about the funds, and may be obtained by asking your financial advisor, visiting oppenheimerfunds.com or calling us at 1.800.988.8287. Read prospectuses and summary prospectuses carefully before investing. |
| |
| | © 2019 OppenheimerFunds, Inc. All rights reserved. Oppenheimer funds are distributed by OppenheimerFunds Distributor, Inc. |

| | | | |
| |  | | |
| | |
| | | December 31, 2018 | | |
| | | Oppenheimer | | |
| | Total Return Bond Fund/VA | | Annual Report |
| | A Series of Oppenheimer Variable Account Funds | | |
| | | |
| | ANNUAL REPORT | | |
| | |
| | Listing of Top Holdings | | |
| | |
| | Fund Performance Discussion | | |
| | |
| | Financial Statements | | |
PORTFOLIO MANAGERS: Krishna Memani and Peter A. Strzalkowski, CFA
AVERAGE ANNUAL TOTAL RETURNS FOR THE PERIODS ENDED 12/31/18
| | | | | | | | | | | | | | | | |
| | | Inception
Date | | | 1-Year | | | 5-Year | | | 10-Year | |
Non-Service Shares | | | 4/3/85 | | | | -1.02% | | | | 2.97% | | | | 5.37% | |
Service Shares | | | 5/1/02 | | | | -1.31 | | | | 2.71 | | | | 5.09 | |
Bloomberg Barclays Credit Index | | | | | | | -2.11 | | | | 3.22 | | | | 5.52 | |
Bloomberg Barclays U.S. Aggregate Bond Index | | | | | | | 0.01 | | | | 2.52 | | | | 3.48 | |
FTSE Broad Investment Grade Bond Index | | | | | | | -0.01 | | | | 2.51 | | | | 3.36 | |
Performance data quoted represents past performance, which does not guarantee future results.The investment return and principal value of an investment in the Fund will fluctuate so that an investor’s shares, when redeemed, may be worth more or less than their original cost. Current performance may be lower or higher than the performance quoted. For performance data current to the most recent month end, call us at 1.800.988.8287. The Fund’s total returns should not be expected to be the same as the returns of other funds, whether or not both funds have the same portfolio managers and/or similar names. The Fund’s total returns include changes in share price and reinvested distributions but do not include the charges associated with the separate account products that offer this Fund. Such performance would have been lower if such charges were taken into account. Returns for periods of less than one year are cumulative and not annualized. See Fund prospectuses and summary prospectuses for more information on share classes and sales charges.
TOP HOLDINGS AND ALLOCATIONS
| | | | |
PORTFOLIO ALLOCATION | | | | |
Mortgage-Backed Obligations | | | | |
Government Agency | | | 26.7% | |
Non-Agency | | | 12.4 | |
Non-Convertible Corporate Bonds and Notes | | | 38.6 | |
Asset-Backed Securities | | | 14.6 | |
Short-Term Notes | | | 6.4 | |
Investment Company | | | | |
Oppenheimer Institutional Government Money Market Fund | | | 1.2 | |
U.S. Government Obligations | | | 0.1 | |
Portfolio holdings and allocations are subject to change. Percentages are as of December 31, 2018 and are based on the total market value of investments.
| | | | |
CORPORATE BONDS & NOTES - TOP TEN INDUSTRIES | |
Commercial Banks | | | 6.5% | |
Oil, Gas & Consumable Fuels | | | 3.4 | |
Food Products | | | 2.6 | |
Capital Markets | | | 2.4 | |
Electric Utilities | | | 2.3 | |
Automobiles | | | 1.9 | |
Media | | | 1.8 | |
Chemicals | | | 1.8 | |
Diversified Telecommunication Services | | | 1.6 | |
Health Care Providers & Services | | | 1.5 | |
Portfolio holdings and allocations are subject to change. Percentages are as of December 31, 2018, and are based on net assets.
For more current Fund holdings, please visit oppenheimerfunds.com.
2 OPPENHEIMER TOTAL RETURN BOND FUND/VA
Fund Performance Discussion
MARKET OVERVIEW
Markets were volatile in 2018 and hit a wall in the last quarter of the year. Several shocks negatively affected market sentiment. The U.S. Federal Reserve (Fed) once again decided to hike interest rates, as was nearly universally expected, but the post-meeting conference was more hawkish than expected. Markets were expecting a clear message that the Fed might consider a pause in any future rate increases, but that was not initially communicated. Equity markets sold off, bonds rallied, and the U.S. dollar weakened. The sell-offs were sizable, which led some to think a recession might be imminent. It was not just the Fed making headlines, some key economic data was also weaker in December. In the U.S., regional surveys from the Fed and Institute for Supply Management (ISM) sentiment surveys decreased markedly, along with acool-off in housing. Politics were once again a factor because there was little clarity from the Trump Administration about the policies for tariffs on Chinese imports, and the U.S. Government shutdown did not help in an environment where the appetite for risk declined.
The U.S. economy continued to show strong growth momentum. As of the end of the reporting period, the tracking of fourth-quarter GDP data suggests the economy will finish the year at around 3% GDP growth. There are pockets of moderation, such as housing and investment expenditures that may have peaked in the second half of the year. Going forward, we believe investment should continue to support growth. With increasingly less slack in the economy, strong profits, and the corporate tax cuts, the environment for investment is healthy. Consumers so far do not seem to be affected by market jitters and politics. At period end, reports and anecdotes suggest that the holiday shopping period was good. Job growth is still strong, supporting both incomes and consumer confidence. Household finances are in good shape. If growth continues to be above trend as expected, the Fed may resume its hiking cycle, but for the time being, this may be the time for investors to take stock and observe the impact of the tightening delivered so far.
FUND REVIEW
Against this backdrop, the Fund’sNon-Service shares returned-1.02% during the reporting period. In comparison, the Bloomberg Barclays U.S. Aggregate Bond Index and the FTSE Broad Investment Grade Bond Index, returned 0.01% and-0.01%, respectively, during the reporting period. Credit underperformed this reporting period, and the Bloomberg Barclays Credit Index returned-2.11%.
In a period where U.S. Treasuries outperformed credit, the Fund’s underweight position in U.S. Treasuries and overweight exposure to investment grade credit were the top detractors to return, leading the Fund to underperform the Bloomberg Barclays U.S. Aggregate Bond Index. The Fund’s top contributors to return over the period were allocations to asset-backed securities (ABS) andnon-agency mortgage-backed securities (MBS).
STRATEGY & OUTLOOK
We believe macroeconomic fundamentals remain stable, with U.S. growth slowing as the effects of the stimulus package and tax reform fade, along with pockets of moderation in housing and investment expenditures. We think the Fed will hike interest rates again in 2019 after the 25 basis point increase in December that brought the range to2.25%-2.50%. The Fed’s communication was initially hawkish but it has turned dovish potentially leading to a pause so the Fed can observe the impact of its recent tightening measures. The portfolio has returned to a neutral duration exposure of 5.87 years, relative to the Bloomberg Barclays U.S. Aggregate Bond Index’s duration of 5.79 years. We previously reduced interest rate risk by taking a shorter duration posture than the benchmark, but ourstop-out level was executed as Treasury yields declined during the quarter.
On a sector level, we continue to maintain our strategic underweight to U.S. Treasuries. Over the period we maintained our significant overweight to agency MBS and slightly increased our exposure. Within structured credit, we continue to favor auto ABS given its attractive fundamentals, carry, and solid structures. We also maintained an overweight in CMBS and remainup-in-structure. Overall, we are more cautious on credit in general as we believe we reside in the fourth quarter of the credit cycle. We maintained our large overweight to investment-grade corporate credit and will continue to monitor valuations to determine our weighting. We also have modest exposure to typically high Sharpe ratioBB-rated corporates. As a result, we continue to be less likely to meaningfully increase credit risk, absent specific relative value opportunities. We typically avoidB-rated and below high yield corporate bonds as well as emerging market debt. Given the degree of uncertainty unlikely to be resolved in the near term, we continue to anticipate volatility going forward and view our commitment to risk management as an integral part of the investment process.
Investors should consider the Fund’s investment objective, risks, charges and expenses carefully before investing. The Fund’s prospectus and summary prospectus contain this and other information about the Fund, and may be obtained by asking your financial advisor or calling us at 1.800.988.8287. Read prospectuses and summary prospectuses carefully before investing.
3 OPPENHEIMER TOTAL RETURN BOND FUND/VA
Total returns include changes in share price and reinvestment of dividends and capital gains distributions in a hypothetical investment for the periods shown, but do not include the charges associated with the separate account products that offer this Fund.
The views in the Fund Performance Discussion represent the opinions of this Fund’s portfolio managers and are not intended as investment advice or to predict or depict the performance of any investment. These views are as of the close of business on December 31, 2018, and are subject to change based on subsequent developments. The Fund’s portfolio and strategies are subject to change.
Shares of Oppenheimer funds are not deposits or obligations of any bank, are not guaranteed by any bank, are not insured by the FDIC or any other agency, and involve investment risks, including the possible loss of the principal amount invested.
Comparing the Fund’s Performance to the Market. The graphs that follow show the performance of a hypothetical $10,000 investment in each share class of the Fund held until December 31, 2018. Performance is measured over aten-fiscal-year period for both Classes. Performance information does not reflect charges that apply to separate accounts investing in the Fund. If these charges were taken into account, performance would be lower. The graphs assume that all dividends and capital gains distributions were reinvested in additional shares.
The Fund’s performance is compared to the performance of the Bloomberg Barclays Credit Index, an index ofnon-convertible U.S. investment grade corporate bonds; the Bloomberg Barclays U.S. Aggregate Bond Index, an index of U.S. corporate and government bonds and the FTSE Broad Investment-Grade Bond Index, an index of institutionally traded U.S. Treasury Bonds, government-sponsored bonds, mortgage-backed securities and corporate securities. The indices are unmanaged and cannot be purchased directly by investors. While index comparisons may be useful to provide a benchmark for the Fund’s performance, it must be noted that the Fund’s investments are not limited to the investments comprising the indices. Index performance includes reinvestment of income, but does not reflect transaction costs, fees, expenses or taxes. Index performance is shown for illustrative purposes only as a benchmark for the Fund’s performance, and does not predict or depict performance of the Fund. The Fund’s performance reflects the effects of the Fund’s business and operating expenses.
4 OPPENHEIMER TOTAL RETURN BOND FUND/VA
COMPARISON OF CHANGE IN VALUE OF $10,000 HYPOTHETICAL INVESTMENTS IN:
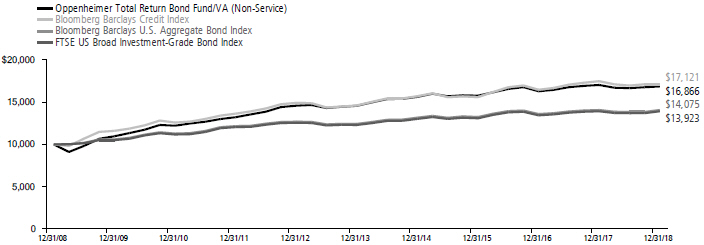
|
Average Annual Total Returns ofNon-Service Shares of the Fund at 12/31/18 |
1-Year -1.02% 5-Year 2.97% 10-Year 5.37% |
COMPARISON OF CHANGE IN VALUE OF $10,000 HYPOTHETICAL INVESTMENTS IN:
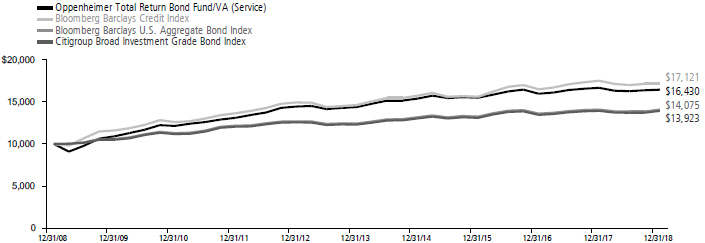
|
Average Annual Total Returns of Service Shares of the Fund at 12/31/18 |
1-Year -1.31% 5-Year 2.71% 10-Year 5.09% |
Performance data quoted represents past performance, which does not guarantee future results.The investment return and principal value of an investment in the Fund will fluctuate so that an investor’s shares, when redeemed, may be worth more or less than their original cost. Current performance may be lower or higher than the performance quoted. For performance data current to the most recent month end, call us at 1.800.988.8287. The Fund’s total returns should not be expected to be the same as the returns of other funds, whether or not both funds have the same portfolio managers and/or similar names. The Fund’s total returns include changes in share price and reinvested distributions but do not include the charges associated with the separate account products that offer this Fund. Such performance would have been lower if such charges were taken into account.
5 OPPENHEIMER TOTAL RETURN BOND FUND/VA
Fund Expenses
Fund Expenses.As a shareholder of the Fund, you incur two types of costs: (1) transaction costs and (2) ongoing costs, including management fees; distribution and service fees; and other Fund expenses. These examples are intended to help you understand your ongoing costs (in dollars) of investing in the Fund and to compare these costs with the ongoing costs of investing in other mutual funds.
The examples are based on an investment of $1,000.00 invested at the beginning of the period and held for the entire6-month period ended December 31, 2018.
Actual Expenses. The first section of the table provides information about actual account values and actual expenses. You may use the information in this section for the class of shares you hold, together with the amount you invested, to estimate the expense that you paid over the period. Simply divide your account value by $1,000.00 (for example, an $8,600.00 account value divided by $1,000.00 = 8.60), then multiply the result by the number in the first section under the heading entitled “Expenses Paid During 6 Months Ended December 31, 2018” to estimate the expenses you paid on your account during this period.
Hypothetical Example for Comparison Purposes.
The second section of the table provides information about hypothetical account values and hypothetical expenses based on the Fund’s actual expense ratio for each class of shares, and an assumed rate of return of 5% per year for each class before expenses, which is not the actual return. The hypothetical account values and expenses may not be used to estimate the actual ending account balance or expenses you paid for the period. You may use this information to compare the ongoing costs of investing in the Fund and other funds. To do so, compare this 5% hypothetical example for the class of shares you hold with the 5% hypothetical examples that appear in the shareholder reports of the other funds.
Please note that the expenses shown in the table are meant to highlight your ongoing costs only and do not reflect any charges associated with the separate accounts that offer this Fund. Therefore, the “hypothetical” lines of the table are useful in comparing ongoing costs only, and will not help you determine the relative total costs of owning different funds. In addition, if these separate account charges were included your costs would have been higher.
| | | | | | | | | | | | | | | | |
| Actual | | Beginning
Account
Value
July 1, 2018 | | | Ending
Account
Value
December 31, 2018 | | | Expenses
Paid During
6 Months Ended
December 31, 2018 | | | | |
Non-Service shares | | $ | 1,000.00 | | | $ | 1,012.20 | | | $ | 3.81 | | | | | |
Service shares | | | 1,000.00 | | | | 1,010.90 | | | | 5.08 | | | | | |
| | | | |
| Hypothetical | | | | | | | | | | | | |
(5% return before expenses) | | | | | | | | | | | | | | | | |
Non-Service shares | | | 1,000.00 | | | | 1,021.42 | | | | 3.83 | | | | | |
Service shares | | | 1,000.00 | | | | 1,020.16 | | | | 5.10 | | | | | |
Expenses are equal to the Fund’s annualized expense ratio for that class, multiplied by the average account value over the period, multiplied by 184/365 (to reflect theone-half year period). Those annualized expense ratios, excluding indirect expenses from affiliated funds, based on the6-month period ended December 31, 2018 are as follows:
| | |
| Class | | Expense Ratios |
Non-Service shares | | 0.75% |
Service shares | | 1.00 |
The expense ratios reflect voluntary and/or contractual waivers and/or reimbursements of expenses by the Fund’s Manager. Some of these undertakings may be modified or terminated at any time, as indicated in the Fund’s prospectus. The “Financial Highlights” tables in the Fund’s financial statements, included in this report, also show the gross expense ratios, without such waivers or reimbursements and reduction to custodian expenses, if applicable.
6 OPPENHEIMER TOTAL RETURN BOND FUND/VA
STATEMENT OF INVESTMENTSDecember 31, 2018
| | | | | | | | |
| | | Principal Amount | | | Value | |
| Asset-Backed Securities—19.1% | |
| Auto Loan—13.0% | | | | | | | | |
| American Credit Acceptance Receivables Trust: | |
| Series2015-3,Cl. D, 5.86%, 7/12/221 | | $ | 125,000 | | | $ | 125,572 | |
| Series2017-3,Cl. B, 2.25%, 1/11/211 | | | 27,101 | | | | 27,078 | |
| Series2017-4,Cl. B, 2.61%, 5/10/211 | | | 64,000 | | | | 63,905 | |
| Series2017-4,Cl. C, 2.94%, 1/10/241 | | | 183,000 | | | | 182,218 | |
| Series2017-4,Cl. D, 3.57%, 1/10/241 | | | 227,000 | | | | 225,704 | |
| Series2018-2,Cl. B, 3.46%, 8/10/221 | | | 255,000 | | | | 255,090 | |
| Series2018-2,Cl. C, 3.70%, 7/10/241 | | | 255,000 | | | | 255,467 | |
| Series2018-3,Cl. B, 3.49%, 6/13/221 | | | 80,000 | | | | 80,154 | |
| Series2018-4,Cl. C, 3.97%, 1/13/251 | | | 180,000 | | | | 180,839 | |
| AmeriCredit Automobile Receivables Trust: | |
| Series2017-2,Cl. D, 3.42%, 4/18/23 | | | 300,000 | | | | 299,666 | |
| Series2017-4,Cl. D, 3.08%, 12/18/23 | | | 190,000 | | | | 187,500 | |
| Series2018-3,Cl. C, 3.74%, 10/18/24 | | | 260,000 | | | | 264,209 | |
| Cabela’s Credit Card Master Note Trust, Series2015-2, Cl. A2, 3.125% [US0001M+67], 7/17/232 | | | 520,000 | | | | 520,754 | |
| Capital Auto Receivables Asset Trust: | | | | | | | | |
| Series2017-1,Cl. D, 3.15%, 2/20/251 | | | 40,000 | | | | 39,913 | |
| Series2018-2,Cl. B, 3.48%, 10/20/231 | | | 120,000 | | | | 120,663 | |
| Series2018-2,Cl. C, 3.69%, 12/20/231 | | | 115,000 | | | | 116,010 | |
| CarMax Auto Owner Trust: | | | | | | | | |
| Series2015-2,Cl. D, 3.04%, 11/15/21 | | | 100,000 | | | | 99,803 | |
| Series2015-3,Cl. D, 3.27%, 3/15/22 | | | 295,000 | | | | 294,664 | |
| Series2016-1,Cl. D, 3.11%, 8/15/22 | | | 185,000 | | | | 183,724 | |
| Series2017-1,Cl. D, 3.43%, 7/17/23 | | | 230,000 | | | | 229,951 | |
| Series2017-4,Cl. D, 3.30%, 5/15/24 | | | 100,000 | | | | 99,661 | |
| Series2018-4,Cl. C, 3.85%, 7/15/24 | | | 85,000 | | | | 86,747 | |
| CIG Auto Receivables Trust, Series2017-1A, Cl. A, 2.71%, 5/15/231 | | | 59,090 | | | | 58,741 | |
| CPS Auto Receivables Trust: | | | | | | | | |
| Series2017-C,Cl. A, 1.78%, 9/15/201 | | | 11,511 | | | | 11,494 | |
| Series2017-C,Cl. B, 2.30%, 7/15/211 | | | 100,000 | | | | 99,551 | |
| Series2017-D,Cl. B, 2.43%, 1/18/221 | | | 170,000 | | | | 168,784 | |
| Series2018-A,Cl. B, 2.77%, 4/18/221 | | | 125,000 | | | | 124,022 | |
| Series2018-B,Cl. B, 3.23%, 7/15/221 | | | 150,000 | | | | 149,927 | |
| CPS Auto Trust, Series2017-A, Cl. B, 2.68%, 5/17/211 | | | 30,000 | | | | 29,906 | |
| Credit Acceptance Auto Loan Trust: | | | | | |
| Series2017-3A,Cl. C, 3.48%, 10/15/261 | | | 205,000 | | | | 204,138 | |
| Series2018-1A,Cl. B, 3.60%, 4/15/271 | | | 125,000 | | | | 124,903 | |
| Series2018-1A,Cl. C, 3.77%, 6/15/271 | | | 180,000 | | | | 180,019 | |
| Series2018-2A,Cl. C, 4.16%, 9/15/271 | | | 105,000 | | | | 106,631 | |
| Series2018-3A,Cl. C, 4.04%, 12/15/271 | | | 210,000 | | | | 212,405 | |
| Drive Auto Receivables Trust: | | | | | | | | |
| Series2015-BA,Cl. D, 3.84%, 7/15/211 | | | 13,899 | | | | 13,920 | |
| Series2016-CA,Cl. D, 4.18%, 3/15/241 | | | 160,000 | | | | 160,858 | |
| Series2017-1,Cl. D, 3.84%, 3/15/23 | | | 225,000 | | | | 225,898 | |
| Series2017-3,Cl. C, 2.80%, 7/15/22 | | | 115,000 | | | | 114,726 | |
| Series2017-BA,Cl. D, 3.72%, 10/17/221 | | | 215,000 | | | | 215,463 | |
| Series2018-1,Cl. D, 3.81%, 5/15/24 | | | 180,000 | | | | 180,380 | |
| Series2018-2,Cl. D, 4.14%, 8/15/24 | | | 295,000 | | | | 297,525 | |
| Series2018-3,Cl. C, 3.72%, 9/16/24 | | | 115,000 | | | | 115,327 | |
| Series2018-3,Cl. D, 4.30%, 9/16/24 | | | 200,000 | | | | 202,900 | |
| Series2018-4,Cl. B, 3.36%, 10/17/22 | | | 130,000 | | | | 129,789 | |
| Series2018-5,Cl. C, 3.99%, 1/15/25 | | | 210,000 | | | | 211,988 | |
| DT Auto Owner Trust: | | | | | | | | |
| Series2016-4A,Cl. E, 6.49%, 9/15/231 | | | 120,000 | | | | 123,002 | |
| Series2017-1A,Cl. D, 3.55%, 11/15/221 | | | 125,000 | | | | 125,178 | |
| Series2017-1A,Cl. E, 5.79%, 2/15/241 | | | 240,000 | | | | 245,110 | |
| Series2017-2A,Cl. D, 3.89%, 1/15/231 | | | 175,000 | | | | 175,656 | |
| Series2017-3A,Cl. D, 3.58%, 5/15/231 | | | 70,000 | | | | 69,974 | |
| Series2017-3A,Cl. E, 5.60%, 8/15/241 | | | 155,000 | | | | 158,709 | |
| Series2017-4A,Cl. D, 3.47%, 7/17/231 | | | 190,000 | | | | 189,508 | |
| Series2017-4A,Cl. E, 5.15%, 11/15/241 | | | 135,000 | | | | 136,387 | |
| Series2018-1A,Cl. B, 3.04%, 1/18/221 | | | 145,000 | | | | 144,664 | |
| Series2018-2A,Cl. B, 3.43%, 5/16/221 | | | 80,000 | | | | 80,048 | |
| | | | | | | | |
| | | Principal Amount | | | Value | |
| Auto Loan (Continued) | | | | | | | | |
| DT Auto Owner Trust: (Continued) | |
| Series2018-3A,Cl. B, 3.56%, 9/15/221 | | $ | 250,000 | | | $ | 251,265 | |
| Series2018-3A,Cl. C, 3.79%, 7/15/241 | | | 100,000 | | | | 100,462 | |
| Exeter Automobile Receivables Trust: | | | | | |
| Series2018-1A,Cl. B, 2.75%, 4/15/221 | | | 140,000 | | | | 139,361 | |
| Series2018-4A,Cl. B, 3.64%, 11/15/221 | | | 210,000 | | | | 210,042 | |
| Flagship Credit Auto Trust, Series2016-1, Cl. C, 6.22%, 6/15/221 | | | 345,000 | | | | 356,809 | |
| GLS Auto Receivables Trust: | | | | | | | | |
| Series2018-1A,Cl. A, 2.82%, 7/15/223 | | | 226,344 | | | | 225,580 | |
| Series2018-3A,Cl. A, 3.35%, 8/15/221 | | | 115,157 | | | | 115,225 | |
| GM Financial Automobile Leasing Trust: | | | | | |
| Series2017-3,Cl. C, 2.73%, 9/20/21 | | | 120,000 | | | | 119,139 | |
| Series2018-2,Cl. C, 3.50%, 4/20/22 | | | 135,000 | | | | 135,509 | |
| GMF Floorplan Owner Revolving Trust: | | | | | | | | |
| Series2018-3,Cl. B, 3.49%, 9/15/221 | | | 240,000 | | | | 241,541 | |
| Series2018-3,Cl. C, 3.68%, 9/15/221 | | | 200,000 | | | | 201,283 | |
| Series2018-4,Cl. B, 3.68%, 9/15/231 | | | 200,000 | | | | 202,618 | |
| Series2018-4,Cl. C, 3.88%, 9/15/231 | | | 250,000 | | | | 253,309 | |
| Navistar Financial Dealer Note Master Owner Trust II: | | | | | | | | |
| Series2017-1,Cl. C, 4.056% [US0001M+155], 6/27/221,2 | | | 60,000 | | | | 60,147 | |
| Series2017-1,Cl. D, 4.806% [US0001M+230], 6/27/221,2 | | | 70,000 | | | | 70,070 | |
| Series2018-1,Cl. A, 3.136% [US0001M+63], 9/25/231,2 | | | 110,000 | | | | 110,005 | |
| Series2018-1,Cl. B, 3.306% [US0001M+80], 9/25/231,2 | | | 125,000 | | | | 125,163 | |
| Santander Drive Auto Receivables Trust: | | | | | | | | |
| Series2016-2,Cl. D, 3.39%, 4/15/22 | | | 320,000 | | | | 320,602 | |
| Series2017-1,Cl. D, 3.17%, 4/17/23 | | | 160,000 | | | | 159,541 | |
| Series2017-1,Cl. E, 5.05%, 7/15/241 | | | 355,000 | | | | 363,932 | |
| Series2017-2,Cl. D, 3.49%, 7/17/23 | | | 70,000 | | | | 69,666 | |
| Series2017-3,Cl. D, 3.20%, 11/15/23 | | | 280,000 | | | | 278,914 | |
| Series2018-1,Cl. D, 3.32%, 3/15/24 | | | 100,000 | | | | 99,372 | |
| Series2018-2,Cl. D, 3.88%, 2/15/24 | | | 165,000 | | | | 166,459 | |
| Series2018-3,Cl. C, 3.51%, 8/15/23 | | | 415,000 | | | | 415,514 | |
| Series2018-4,Cl. C, 3.56%, 7/15/24 | | | 290,000 | | | | 292,324 | |
| Series2018-5,Cl. C, 3.81%, 12/16/24 | | | 215,000 | | | | 216,591 | |
| Santander Retail Auto Lease Trust, Series2017-A, Cl. C, 2.96%, 11/21/221 | | | 180,000 | | | | 178,855 | |
| TCF Auto Receivables Owner Trust, Series2015-1A, Cl. D, 3.53%, 3/15/221 | | | 160,000 | | | | 159,508 | |
| United Auto Credit Securitization Trust, Series2018-1, Cl. C, 3.05%, 9/10/211 | | | 255,000 | | | | 254,083 | |
| Veros Automobile Receivables Trust, Series2017-1, Cl. A, 2.84%, 4/17/231 | | | 48,983 | | | | 48,842 | |
| Westlake Automobile Receivables Trust: | | | | | | | | |
| Series2016-1A,Cl. E, 6.52%, 6/15/221 | | | 260,000 | | | | 262,057 | |
| Series2017-2A,Cl. E, 4.63%, 7/15/241 | | | 305,000 | | | | 305,366 | |
| Series2018-1A,Cl. C, 2.92%, 5/15/231 | | | 145,000 | | | | 143,695 | |
| Series2018-1A,Cl. D, 3.41%, 5/15/231 | | | 160,000 | | | | 158,932 | |
| Series2018-3A,Cl. B, 3.32%, 10/16/231 | | | 245,000 | | | | 245,608 | |
| | | | | | | 15,784,212 | |
| Credit Card—5.4% | | | | | | | | |
| Cabela’s Credit Card Master Note Trust: | | | | | | | | |
| Series2015-1A,Cl. A2, 2.995% [US0001M+54], 3/15/232 | | | 495,000 | | | | 496,918 | |
| Series2015-2,Cl. A1, 2.25%, 7/17/23 | | | 570,000 | | | | 563,365 | |
| Series2016-1,Cl. A1, 1.78%, 6/15/22 | | | 655,000 | | | | 651,262 | |
| Series2016-1,Cl. A2, 3.305% [US0001M+85], 6/15/222 | | | 235,000 | | | | 235,665 | |
| Evergreen Credit Card Trust, Series2018-2, Cl. A, 2.805% [US0001M+35], 7/15/221,2 | | | 385,000 | | | | 384,945 | |
| GE Capital Credit Card Master Note Trust: | | | | | | | | |
| Series2012-7,Cl. A, 1.76%, 9/15/22 | | | 210,000 | | | | 208,200 | |
| Series2012-7,Cl. B, 2.21%, 9/15/22 | | | 185,000 | | | | 183,834 | |
7 OPPENHEIMER TOTAL RETURN BOND FUND/VA
STATEMENT OF INVESTMENTSContinued
| | | | | | | | |
| | | Principal Amount | | | Value | |
| Credit Card (Continued) | |
| Synchrony Credit Card Master Note Trust, | |
| Series2015-1, Cl. A, 2.37%, 3/15/23 | | $ | 610,000 | | | $ | 605,352 | |
| World Financial Network Credit Card Master Trust: | | | | | |
| Series2012-D,Cl. A, 2.15%, 4/17/23 | | | 585,000 | | | | 582,562 | |
| Series2016-C,Cl. A, 1.72%, 8/15/23 | | | 625,000 | | | | 618,342 | |
| Series2017-A,Cl. A, 2.12%, 3/15/24 | | | 485,000 | | | | 478,568 | |
| Series2017-C,Cl. A, 2.31%, 8/15/24 | | | 395,000 | | | | 389,647 | |
| Series2018-A,Cl. A, 3.07%, 12/16/24 | | | 495,000 | | | | 493,791 | |
| Series2018-B,Cl. A, 3.46%, 7/15/25 | | | 230,000 | | | | 232,542 | |
| Series2018-C,Cl. A, 3.55%, 8/15/25 | | | 470,000 | | | | 476,301 | |
| | | | | | | | 6,601,294 | |
| Equipment—0.4% | | | | | | | | |
| CCG Receivables Trust: | | | | | |
| Series2017-1,Cl. B, 2.75%, 11/14/231 | | | 230,000 | | | | 227,213 | |
| Series2018-1,Cl. B, 3.09%, 6/16/251 | | | 85,000 | | | | 84,704 | |
| Series2018-1,Cl. C, 3.42%, 6/16/251 | | | 20,000 | | | | 19,931 | |
| Series2018-2,Cl. C, 3.87%, 12/15/251 | | | 60,000 | | | | 60,526 | |
| CNH Equipment Trust, Series2017-C, Cl. B, 2.54%, 5/15/25 | | | 65,000 | | | | 64,201 | |
| Dell Equipment Finance Trust, Series2018-1, Cl. B, 3.34%, 6/22/231 | | | 80,000 | | | | 80,254 | |
| FRS I LLC, Series2013-1A, Cl. A1, 1.80%, 4/15/431 | | | 6,429 | | | | 6,408 | |
| | | | | | | | 543,237 | |
| Loans: Other—0.3% | |
| Ameriquest Mortgage Securities, Inc. Asset- Backed Pass-Through Certificates, Series 2005- R5, Cl. M2, 3.196% [US0001M+69], 7/25/352 | | | 88,084 | | | | 88,372 | |
| Dell Equipment Finance Trust, Series2017-2, Cl. B, 2.47%, 10/24/221 | | | 70,000 | | | | 69,399 | |
| Element Rail Leasing I LLC, Series2014-1A, Cl. | | | | | |
| A1, 2.299%, 4/19/441 | | | 149,517 | | | | 148,305 | |
| | | | | | | 306,076 | |
| Total Asset-Backed Securities (Cost $23,211,279) | | | | | | | 23,234,819 | |
| | | | | | | | | |
| Mortgage-Backed Obligations—51.3% | |
| Government Agency—35.0% | |
| FHLMC/FNMA/FHLB/Sponsored—31.0% | |
| Federal Home Loan Mortgage Corp. Gold Pool: | |
| 5.00%, 12/1/34 | | | 3,156 | | | | 3,337 | |
| 5.50%, 9/1/39 | | | 208,469 | | | | 221,142 | |
| 6.00%,10/1/22-10/1/29 | | | 273,923 | | | | 296,136 | |
| 6.50%,7/1/28-4/1/34 | | | 97,656 | | | | 106,206 | |
| 7.00%,10/1/31-10/1/37 | | | 77,990 | | | | 85,367 | |
| 9.00%,8/1/22-5/1/25 | | | 4,306 | | | | 4,592 | |
| Federal Home Loan Mortgage Corp. Non Gold Pool, 10.50%, 10/1/20 | | | 240 | | | | 241 | |
| Federal Home Loan Mortgage Corp., Interest-Only Stripped Mtg.-Backed Security: | |
| Series 205,Cl. IO, 74.346%, 9/1/294 | | | 3,960 | | | | 829 | |
| Series 206,Cl. IO, 0.00%, 12/15/294,5 | | | 72,029 | | | | 20,428 | |
| Series 243,Cl. 6, 0.00%, 12/15/324,5 | | | 44,963 | | | | 8,562 | |
| Series 304,Cl. C47, 5.341%, 12/15/274 | | | 71,206 | | | | 6,238 | |
| Federal Home Loan Mortgage Corp., Mtg.-Linked Amortizing Global Debt Securities, Series2012-1, Cl. A10, 2.06%, 1/15/22 | | | 220,408 | | | | 216,999 | |
| Federal Home Loan Mortgage Corp., Multifamily Structured Pass-Through Certificates, Interest-Only Stripped Mtg.-Backed Security, Series KC02, Cl. X1, 0.00%, 3/25/244,5 | | | 4,572,395 | | | | 84,364 | |
| Federal Home Loan Mortgage Corp., Principal- Only Stripped Mtg.-Backed Security, Series 176, Cl. PO, 4.108%, 6/1/266 | | | 21,379 | | | | 19,654 | |
| Federal Home Loan Mortgage Corp., Real Estate Mtg. Investment Conduit Multiclass Pass-Through Certificates: | |
| Series 151,Cl. F, 9.00%, 5/15/21 | | | 639 | | | | 652 | |
| Series 1674,Cl. Z, 6.75%, 2/15/24 | | | 5,944 | | | | 6,283 | |
| | | | | | | | |
| | | Principal Amount | | | Value | |
| FHLMC/FNMA/FHLB/Sponsored (Continued) | |
| Federal Home Loan Mortgage Corp., Real Estate Mtg. Investment Conduit Multiclass Pass-Through Certificates: (Continued) | |
| Series 2034,Cl. Z, 6.50%, 2/15/28 | | $ | 1,172 | | | $ | 1,270 | |
| Series 2042,Cl. N, 6.50%, 3/15/28 | | | 2,559 | | | | 2,753 | |
| Series 2043,Cl. ZP, 6.50%, 4/15/28 | | | 148,285 | | | | 163,485 | |
| Series 2046,Cl. G, 6.50%, 4/15/28 | | | 5,227 | | | | 5,763 | |
| Series 2053,Cl. Z, 6.50%, 4/15/28 | | | 1,321 | | | | 1,460 | |
| Series 2066,Cl. Z, 6.50%, 6/15/28 | | | 145,366 | | | | 157,742 | |
| Series 2195,Cl. LH, 6.50%, 10/15/29 | | | 115,528 | | | | 126,459 | |
| Series 2220,Cl. PD, 8.00%, 3/15/30 | | | 893 | | | | 1,025 | |
| Series 2326,Cl. ZP, 6.50%, 6/15/31 | | | 32,334 | | | | 35,055 | |
| Series 2461,Cl. PZ, 6.50%, 6/15/32 | | | 130,093 | | | | 142,080 | |
| Series 2470,Cl. LF, 3.455%[-3.667 x LIBOR01M+100], 2/15/322 | | | 1,061 | | | | 1,085 | |
| Series 2635,Cl. AG, 3.50%, 5/15/32 | | | 20,468 | | | | 20,525 | |
| Series 2770,Cl. TW, 4.50%, 3/15/19 | | | 236 | | | | 236 | |
| Series 3010,Cl. WB, 4.50%, 7/15/20 | | | 2,352 | | | | 2,357 | |
Series 3025,Cl. SJ, 15.748% | | | | | | | | |
[LIBOR01M-3.667], 8/15/352 | | | 11,158 | | | | 15,947 | |
Series 3030,Cl. FL, 2.855% | | | | | | | | |
[LIBOR01M+40], 9/15/352 | | | 1,701 | | | | 1,709 | |
| Series 3645,Cl. EH, 3.00%, 12/15/20 | | | 6,290 | | | | 6,266 | |
| Series 3815,Cl. BD, 3.00%, 10/15/20 | | | 5 | | | | 5 | |
| Series 3822,Cl. JA, 5.00%, 6/15/40 | | | 1,797 | | | | 1,832 | |
| Series 3848,Cl. WL, 4.00%, 4/15/40 | | | 12,841 | | | | 12,972 | |
| Series 3857,Cl. GL, 3.00%, 5/15/40 | | | 3,101 | | | | 3,136 | |
| Series 4221,Cl. HJ, 1.50%, 7/15/23 | | | 52,040 | | | | 50,810 | |
| Federal Home Loan Mortgage Corp., Real Estate Mtg. Investment Conduit Multiclass Pass-Through Certificates, Interest-Only Stripped Mtg.-Backed Security: | |
| Series 2074,Cl. S, 99.999%, 7/17/284 | | | 768 | | | | 72 | |
| Series 2079,Cl. S, 99.999%, 7/17/284 | | | 1,425 | | | | 162 | |
| Series 2130,Cl. SC, 99.999%, 3/15/294 | | | 47,343 | | | | 6,114 | |
| Series 2526,Cl. SE, 67.818%, 6/15/294 | | | 1,906 | | | | 307 | |
| Series 2796,Cl. SD, 99.999%, 7/15/264 | | | 94,563 | | | | 10,806 | |
| Series 2920,Cl. S, 32.733%, 1/15/354 | | | 402,587 | | | | 56,827 | |
| Series 2922,Cl. SE, 18.242%, 2/15/354 | | | 47,932 | | | | 6,238 | |
| Series 2981,Cl. AS, 0.00%, 5/15/354,5 | | | 60,434 | | | | 7,264 | |
| Series 3004,Cl. SB, 0.00%, 7/15/354,5 | | | 17,596 | | | | 1,691 | |
| Series 3397,Cl. GS, 0.00%, 12/15/374,5 | | | 9,650 | | | | 1,581 | |
| Series 3424,Cl. EI, 0.00%, 4/15/384,5 | | | 7,217 | | | | 641 | |
| Series 3450,Cl. BI, 9.077%, 5/15/384 | | | 244,851 | | | | 33,285 | |
| Series 3606,Cl. SN, 10.927%, 12/15/394 | | | 63,605 | | | | 7,718 | |
| Series 4057,Cl. QI, 4.996%, 6/15/274 | | | 441,912 | | | | 34,494 | |
| Series 4205,Cl. AI, 8.074%, 5/15/284 | | | 112,512 | | | | 8,540 | |
| Series 4818,Cl. BI, 0.00%, 3/15/454,5 | | | 166,386 | | | | 29,800 | |
| Federal National Mortgage Assn.: | |
2.50%, 1/1/347 | | | 1,705,000 | | | | 1,665,291 | |
3.00%,1/1/34-1/1/497 | | | 3,490,000 | | | | 3,437,489 | |
3.50%,1/1/34-1/1/497 | | | 11,325,000 | | | | 11,356,037 | |
4.00%,1/1/34-1/1/497 | | | 7,100,000 | | | | 7,245,327 | |
4.50%, 1/1/497 | | | 6,570,000 | | | | 6,807,486 | |
| 5.00%, 1/1/497 | | | 3,120,000 | | | | 3,269,582 | |
| Federal National Mortgage Assn. Pool: | |
5.00%,3/1/21-7/1/22 | | | 1,085 | | | | 1,105 | |
5.50%,2/1/35-5/1/36 | | | 96,823 | | | | 104,391 | |
6.50%,10/1/19-1/1/34 | | | 6,201 | | | | 6,902 | |
7.00%,1/1/30-12/1/32 | | | 14,285 | | | | 16,288 | |
7.50%, 1/1/33 | | | 2,843 | | | | 3,290 | |
| 8.50%, 7/1/32 | | | 3,306 | | | | 3,344 | |
| Federal National Mortgage Assn., Interest-Only Stripped Mtg.-Backed Security: | |
Series 221,Cl. 2, 99.999%, 5/25/234 | | | 1,133 | | | | 132 | |
Series 222,Cl. 2, 99.999%, 6/25/234 | | | 126,619 | | | | 14,070 | |
Series 252,Cl. 2, 0.00%, 11/25/234,5 | | | 109,211 | | | | 13,904 | |
Series 294,Cl. 2, 99.999%, 2/25/284 | | | 17,448 | | | | 3,695 | |
Series 301,Cl. 2, 20.916%, 4/25/294 | | | 1,390 | | | | 283 | |
Series 303,Cl. IO, 60.912%, 11/25/294 | | | 30,954 | | | | 7,096 | |
Series 320,Cl. 2, 66.392%, 4/25/324 | | | 127,159 | | | | 29,625 | |
Series 321,Cl. 2, 26.024%, 4/25/324 | | | 315,400 | | | | 74,086 | |
8 OPPENHEIMER TOTAL RETURN BOND FUND/VA
| | | | | | | | |
| | | | Principal Amount | | | | Value | |
| FHLMC/FNMA/FHLB/Sponsored (Continued) | |
| Federal National Mortgage Assn., Interest-Only Stripped Mtg.-Backed Security: (Continued) | |
| Series 324,Cl. 2, 13.502%, 7/25/324 | | $ | 3,112 | | | $ | 726 | |
| Series 331,Cl. 5, 0.00%, 2/25/334,5 | | | 4,438 | | | | 792 | |
| Series 331,Cl. 9, 24.792%, 2/25/334 | | | 102,794 | | | | 20,435 | |
| Series 334,Cl. 12, 0.00%, 3/25/334,5 | | | 7,349 | | | | 1,547 | |
| Series 334,Cl. 17, 43.05%, 2/25/334 | | | 64,429 | | | | 15,377 | |
| Series 339,Cl. 12, 0.00%, 6/25/334,5 | | | 102,716 | | | | 19,985 | |
| Series 339,Cl. 7, 0.00%, 11/25/334,5 | | | 215,072 | | | | 46,798 | |
| Series 343,Cl. 13, 0.00%, 9/25/334,5 | | | 107,174 | | | | 19,418 | |
| Series 343,Cl. 18, 0.00%, 5/25/344,5 | | | 26,148 | | | | 5,955 | |
| Series 345,Cl. 9, 0.00%, 1/25/344,5 | | | 78,252 | | | | 17,710 | |
| Series 351,Cl. 10, 0.00%, 4/25/344,5 | | | 33,940 | | | | 7,152 | |
| Series 351,Cl. 8, 0.00%, 4/25/344,5 | | | 59,169 | | | | 11,558 | |
| Series 356,Cl. 10, 0.00%, 6/25/354,5 | | | 41,231 | | | | 8,336 | |
| Series 356,Cl. 12, 0.00%, 2/25/354,5 | | | 20,303 | | | | 4,391 | |
| Series 362,Cl. 13, 0.00%, 8/25/354,5 | | | 79,543 | | | | 16,383 | |
| Series 364,Cl. 15, 0.00%, 9/25/354,5 | | | 4,279 | | | | 927 | |
| Series 364,Cl. 16, 0.00%, 9/25/354,5 | | | 88,282 | | | | 17,845 | |
| Series 365,Cl. 16, 0.00%, 3/25/364,5 | | | 111,033 | | | | 22,609 | |
| Federal National Mortgage Assn., Real Estate Mtg. Investment Conduit Multiclass Pass- Through Certificates: | |
| Series1993-87,Cl. Z, 6.50%, 6/25/23 | | | 88,561 | | | | 93,320 | |
| Series1998-58,Cl. PC, 6.50%, 10/25/28 | | | 79,429 | | | | 86,490 | |
| Series1998-61,Cl. PL, 6.00%, 11/25/28 | | | 39,974 | | | | 43,402 | |
| Series1999-54,Cl. LH, 6.50%, 11/25/29 | | | 66,835 | | | | 72,749 | |
| Series2001-51,Cl. OD, 6.50%, 10/25/31 | | | 4,168 | | | | 4,405 | |
| Series2001-74,Cl. QE, 6.00%, 12/25/31 | | | 94,938 | | | | 104,234 | |
| Series2003-28,Cl. KG, 5.50%, 4/25/23 | | | 240,352 | | | | 247,209 | |
| Series2004-25,Cl. PC, 5.50%, 1/25/34 | | | 225 | | | | 225 | |
| Series2005-73,Cl. DF, 2.756%[-3.667 x LIBOR01M+25], 8/25/352 | | | 1,996 | | | | 2,003 | |
| Series2006-11,Cl. PS, 15.377%[-3.667 xLIBOR01M-3.667], 3/25/362 | | | 62,423 | | | | 89,722 | |
| Series2006-46,Cl. SW, 15.01% | | | | | | | | |
| [LIBOR01M-3.667], 6/25/362 | | | 41,469 | | | | 57,376 | |
| Series2006-50,Cl. KS, 15.01% | | | | | | | | |
| [LIBOR01M-3.667], 6/25/362 | | | 53,817 | | | | 75,980 | |
| Series2008-75,Cl. DB, 4.50%, 9/25/23 | | | 80 | | | | 80 | |
| Series2009-113,Cl. DB, 3.00%, | | | | | | | | |
| 12/25/20 | | | 4,221 | | | | 4,201 | |
| Series2009-36,Cl. FA, 3.446% | | | | | | | | |
| [LIBOR01M+94], 6/25/372 | | | 26,347 | | | | 26,946 | |
| Series2009-70,Cl. TL, 4.00%, 8/25/19 | | | 55 | | | | 55 | |
| Series2010-43,Cl. KG, 3.00%, 1/25/21 | | | 2,680 | | | | 2,675 | |
| Series2011-3,Cl. EL, 3.00%, 5/25/20 | | | 4,109 | | | | 4,093 | |
| Series2011-38,Cl. AH, 2.75%, 5/25/20 | | | 2 | | | | 2 | |
| Series2011-82,Cl. AD, 4.00%, 8/25/26 | | | 9,900 | | | | 9,879 | |
| Federal National Mortgage Assn., Real Estate Mtg. Investment Conduit Multiclass Pass- Through Certificates, Interest-Only Stripped Mtg.-Backed Security: | |
| Series2001-61,Cl. SH, 20.897%, 11/18/314 | | | 3,953 | | | | 658 | |
| Series2001-63,Cl. SD, 43.66%, 12/18/314 | | | 1,300 | | | | 193 | |
| Series2001-65,Cl. S, 33.013%, 11/25/314 | | | 99,179 | | | | 18,494 | |
| Series2001-68,Cl. SC, 45.93%, 11/25/314 | | | 945 | | | | 148 | |
| Series2001-81,Cl. S, 32.836%, 1/25/324 | | | 29,274 | | | | 5,089 | |
| Series2002-28,Cl. SA, 35.92%, 4/25/324 | | | 918 | | | | 161 | |
| Series2002-38,Cl. SO, 83.089%, 4/25/324 | | | 2,823 | | | | 433 | |
| Series2002-39,Cl. SD, 59.52%, 3/18/324 | | | 1,867 | | | | 349 | |
| Series2002-47,Cl. NS, 36.388%, 4/25/324 | | | 91,379 | | | | 16,641 | |
| Series2002-48,Cl. S, 38.117%, 7/25/324 | | | 1,428 | | | | 272 | |
| Series2002-51,Cl. S, 35.261%, 8/25/324 | | | 83,887 | | | | 15,276 | |
| | | | | | | | |
| | | | Principal Amount | | | | Value | |
| FHLMC/FNMA/FHLB/Sponsored (Continued) | |
| Federal National Mortgage Assn., Real Estate Mtg. Investment Conduit Multiclass Pass- Through Certificates, Interest-Only Stripped Mtg.-Backed Security: (Continued) | |
| Series2002-52,Cl. SD, 81.21%, 9/25/324 | | $ | 131,373 | | | $ | 24,680 | |
| Series2002-52,Cl. SL, 35.459%, 9/25/324 | | | 949 | | | | 173 | |
| Series2002-53,Cl. SK, 80.587%, 4/25/324 | | | 6,504 | | | | 1,243 | |
| Series2002-56,Cl. SN, 35.14%, 7/25/324 | | | 1,947 | | | | 371 | |
| Series2002-60,Cl. SM, 16.201%, 8/25/324 | | | 12,213 | | | | 1,630 | |
| Series2002-7,Cl. SK, 22.457%, 1/25/324 | | | 5,765 | | | | 826 | |
| Series2002-77,Cl. BS, 23.425%, 12/18/324 | | | 8,417 | | | | 1,411 | |
| Series2002-77,Cl. IS, 55.581%, 12/18/324 | | | 4,809 | | | | 831 | |
| Series2002-77,Cl. SH, 31.217%, 12/18/324 | | | 39,121 | | | | 6,254 | |
| Series2002-84,Cl. SA, 28.222%, 12/25/324 | | | 94,813 | | | | 15,382 | |
| Series2002-9,Cl. MS, 30.416%, 3/25/324 | | | 1,520 | | | | 286 | |
| Series2002-90,Cl. SN, 16.432%, 8/25/324 | | | 6,283 | | | | 839 | |
| Series2002-90,Cl. SY, 22.669%, 9/25/324 | | | 4,745 | | | | 643 | |
| Series2003-26,Cl. DI, 76.438%, 4/25/334 | | | 4,661 | | | | 1,192 | |
| Series2003-33,Cl. SP, 28.304%, 5/25/334 | | | 97,799 | | | | 18,841 | |
| Series2003-4,Cl. S, 22.941%, 2/25/334 | | | 60,891 | | | | 11,090 | |
| Series2004-54,Cl. DS, 99.999%, 11/25/304 | | | 85,102 | | | | 12,159 | |
| Series2005-12,Cl. SC, 27.479%, 3/25/354 | | | 21,534 | | | | 2,947 | |
| Series2005-14,Cl. SE, 33.336%, 3/25/354 | | | 69,111 | | | | 8,487 | |
| Series2005-40,Cl. SA, 99.999%, 5/25/354 | | | 199,491 | | | | 29,490 | |
| Series2005-40,Cl. SB, 60.678%, 5/25/354 | | | 9,138 | | | | 1,104 | |
| Series2005-52,Cl. JH, 25.915%, 5/25/354 | | | 50,729 | | | | 6,460 | |
| Series2005-93,Cl. SI, 1.469%, 10/25/354 | | | 142,135 | | | | 19,395 | |
| Series2008-55,Cl. SA, 0.00%, 7/25/384,5 | | | 7,856 | | | | 796 | |
| Series2009-8,Cl. BS, 99.999%, 2/25/244 | | | 862 | | | | 44 | |
| Series2011-96,Cl. SA, 4.555%, 10/25/414 | | | 49,638 | | | | 7,403 | |
| Series2012-121,Cl. IB, 7.742%, 11/25/274 | | | 186,660 | | | | 15,677 | |
| Series2012-134,Cl. SA, 0.492%, 12/25/424 | | | 134,704 | | | | 24,268 | |
| Series2012-40,Cl. PI, 12.51%, 4/25/414 | | | 96,714 | | | | 14,618 | |
| Series2018-16,Cl. NI, 0.00%, 12/25/444,5 | | | 86,057 | | | | 14,069 | |
| Series2018-69,Cl. CI, 0.00%, 10/25/464,5 | | | 186,990 | | | | 25,495 | |
| Federal National Mortgage Assn., Real Estate Mtg. Investment Conduit Multiclass Pass-Through Certificates, Principal-Only Stripped Mtg.-Backed Security, Series1993-184, Cl. M, 5.195%, 9/25/236 | | | 39,799 | | | | 37,236 | |
| | | | | | | 37,626,009 | |
9 OPPENHEIMER TOTAL RETURN BOND FUND/VA
STATEMENT OF INVESTMENTSContinued
| | | | | | | | |
| | | Principal Amount | | | Value | |
| GNMA/Guaranteed—4.0% | |
| Federal Home Loan Mortgage Corp., Series 2018-HQA2, Cl. M1, 3.256% [US0001M+75], 10/25/481,2 | | $ | 380,000 | | | $ | 379,262 | |
| Government National Mortgage Assn. I Pool: 7.00%,12/15/23-3/15/26 | | | 3,435 | | | | 3,533 | |
| Government National Mortgage Assn. II Pool, 3.50%, 1/1/497 | | | 4,265,000 | | | | 4,294,419 | |
| Government National Mortgage Assn., Interest-Only Stripped Mtg.-Backed Security:+ | |
| Series2002-15,Cl. SM, 99.999%, 2/16/324 | | | 126,990 | | | | 1,187 | |
| Series2007-17,Cl. AI, 45.352%, 4/16/374 | | | 53,912 | | | | 7,495 | |
| Series2011-52,Cl. HS, 19.137%, 4/16/414 | | | 355,435 | | | | 49,353 | |
| Series2017-136,Cl. LI, 5.577%, 9/16/474 | | | 336,794 | | | | 70,051 | |
| | | | | | | | |
| | | | | | | 4,805,300 | |
| Non-Agency—16.3% | |
| Commercial—8.3% | |
| BCAP LLC Trust, Series2011-R11, Cl. 18A5, 4.79% [H15T1Y+210], 9/26/351,2 | | | 21,554 | | | | 21,607 | |
| Benchmark Mortgage Trust, Interest-Only Commercial Mtg. Pass-Through Certificates, Series2018-B1, Cl. XA, 0.00%, 1/15/514,5 | | | 1,784,578 | | | | 65,870 | |
| Capital Lease Funding Securitization LP, Interest-Only Commercial Mtg. Pass-Through Certificates, Series 1997-CTL1, Cl. IO, 0.00%, 6/22/241,4,5,8 | | | 177,031 | | | | 3,465 | |
| CD Mortgage Trust, Interest-Only Commercial Mtg. Pass-Through Certificates, Series 2017- CD6, Cl. XA, 0.00%, 11/13/504,5 | | | 748,117 | | | | 43,386 | |
| Chase Mortgage Finance Trust, Series 2005- A2, Cl. 1A3, 4.032%, 1/25/369 | | | 81,426 | | | | 76,924 | |
| Citigroup Commercial Mortgage Trust: | |
| Series2012-GC8,Cl. AAB, 2.608%, 9/10/45 | | | 86,209 | | | | 85,541 | |
| Series 2014-GC21,Cl. AAB, 3.477%, 5/10/47 | | | 95,000 | | | | 96,354 | |
| Citigroup Commercial Mortgage Trust, Interest-Only Commercial Mtg. Pass-Through Certificates: | | | | | | | | |
| Series 2013-GC17,Cl. XA, 0.00%, 11/10/464,5 | | | 396,809 | | | | 16,948 | |
| Series2017-C4,Cl. XA, 11.937%, 10/12/504 | | | 2,067,123 | | | | 143,242 | |
| COMM Mortgage Trust: | |
| Series2013-CR6,Cl. AM, 3.147%, 3/10/461 | | | 245,000 | | | | 242,306 | |
| Series 2014-CR17,Cl. ASB, 3.598%, 5/10/47 | | | 265,000 | | | | 269,068 | |
| Series 2014-CR20,Cl. ASB, 3.305%, 11/10/47 | | | 65,000 | | | | 65,665 | |
| Series 2014-CR21,Cl. AM, 3.987%, 12/10/47 | | | 715,000 | | | | 723,886 | |
| Series 2014-LC15,Cl. AM, 4.198%, 4/10/47 | | | 170,000 | | | | 175,291 | |
| Series 2014-UBS6,Cl. AM, 4.048%, 12/10/47 | | | 475,000 | | | | 477,938 | |
| Series 2015-CR22,Cl. A2, 2.856%, 3/10/48 | | | 120,000 | | | | 119,678 | |
| COMM Mortgage Trust, Interest-Only Stripped Mtg.-Backed Security, Series2012-CR5, Cl. XA, 0.00%, 12/10/454,5 | | | 2,030,190 | | | | 101,877 | |
| CSMC Mortgage-Backed Trust, Series2006-6, Cl. 1A4, 6.00%, 7/25/36 | | | 147,589 | | | | 120,681 | |
| First Horizon Alternative Mortgage Securities Trust, Series2005-FA8, Cl. 1A6, 3.156% [US0001M+65], 11/25/352 | | | 112,632 | | | | 84,159 | |
| | | | | | | | |
| | | Principal Amount | | | Value | |
| Commercial (Continued) | |
| FREMF Mortgage Trust: | |
| Series2010-K6,Cl. B, 5.367%, 12/25/461,9 | | $ | 55,000 | | | $ | 56,087 | |
| Series 2012-K710,Cl. B, 3.817%, 6/25/471,9 | | | 40,000 | | | | 39,975 | |
| Series 2012-K711,Cl. B, 3.558%, 8/25/451,9 | | | 15,000 | | | | 14,998 | |
| Series 2012-K711,Cl. C, 3.558%, 8/25/451,9 | | | 130,000 | | | | 129,847 | |
| Series2013-K25,Cl. C, 3.619%, 11/25/451,9 | | | 90,000 | | | | 88,492 | |
| Series2013-K26,Cl. C, 3.598%, 12/25/451,9 | | | 60,000 | | | | 58,931 | |
| Series2013-K27,Cl. C, 3.496%, 1/25/461,9 | | | 95,000 | | | | 92,900 | |
| Series2013-K28,Cl. C, 3.49%, 6/25/461,9 | | | 285,000 | | | | 278,506 | |
| Series 2013-K712,Cl. C, 3.358%, 5/25/451,9 | | | 70,000 | | | | 69,817 | |
| Series 2013-K713,Cl. C, 3.154%, 4/25/461,9 | | | 245,000 | | | | 244,069 | |
| Series 2014-K715,Cl. C, 4.124%, 2/25/461,9 | | | 190,000 | | | | 192,017 | |
| GS Mortgage Securities Corp. Trust, Series 2012-SHOP, Cl. A, 2.933%, 6/5/311 | | | 430,000 | | | | 429,167 | |
| GS Mortgage Securities Trust: | |
| Series2012-GC6,Cl. A3, 3.482%, 1/10/45 | | | 59,774 | | | | 60,439 | |
| Series 2013-GC12,Cl. AAB, 2.678%, 6/10/46 | | | 30,799 | | | | 30,488 | |
| Series 2013-GC16,Cl. AS, 4.649%, 11/10/46 | | | 45,000 | | | | 47,463 | |
| Series 2014-GC18,Cl. AAB, 3.648%, 1/10/47 | | | 85,000 | | | | 85,934 | |
| GSMSC Pass-Through Trust, Series2009-3R, Cl. 1A2, 6.00%, 4/25/371,9 | | | 189,552 | | | | 179,672 | |
| JP Morgan Chase Commercial Mortgage Securities Trust: | |
| Series2012-C6,Cl. ASB, 3.144%, 5/15/45 | | | 120,188 | | | | 119,798 | |
| Series2012-LC9,Cl. A4, 2.611%, 12/15/47 | | | 9,547 | | | | 9,520 | |
| Series2013-C10,Cl. AS, 3.372%, 12/15/47 | | | 315,000 | | | | 311,825 | |
| Series2013-C16,Cl. AS, 4.517%, 12/15/46 | | | 300,000 | | | | 310,525 | |
| Series 2013-LC11,Cl. AS, 3.216%, 4/15/46 | | | 40,000 | | | | 39,279 | |
| Series2014-C20,Cl. AS, 4.043%, 7/15/47 | | | 220,000 | | | | 222,088 | |
| Series2016-JP3,Cl. A2, 2.435%, 8/15/49 | | | 199,359 | | | | 195,379 | |
| JP Morgan Mortgage Trust, Series2007-A1, Cl. 5A1, 4.327%, 7/25/359 | | | 55,982 | | | | 57,504 | |
| JP Morgan Resecuritization Trust, Series 2009-5, Cl. 1A2, 4.434%, 7/26/361,9 | | | 169,218 | | | | 169,620 | |
| JPMBB Commercial Mortgage Securities Trust: | |
| Series2013-C17,Cl. ASB, 3.705%, 1/15/47 | | | 72,756 | | | | 73,572 | |
| Series2014-C18,Cl. A2, 2.879%, 2/15/47 | | | 6,458 | | | | 6,450 | |
| Series2014-C18,Cl. A3, 3.578%, 2/15/47 | | | 105,000 | | | | 105,379 | |
| Series2014-C19,Cl. ASB, 3.584%, 4/15/47 | | | 40,000 | | | | 40,242 | |
| Series2014-C24,Cl. B, 4.116%, 11/15/479 | | | 245,000 | | | | 243,503 | |
| Series2014-C25,Cl. AS, 4.065%, 11/15/47 | | | 200,000 | | | | 201,805 | |
Series2014-C26,Cl. AS, 3.80%, 1/15/48 | | | 255,000 | | | | 253,772 | |
10 OPPENHEIMER TOTAL RETURN BOND FUND/VA
| | | | | | | | |
| | | Principal Amount | | | Value | |
| Commercial (Continued) | |
| JPMBB Commercial Mortgage Securities Trust., Interest-Only Stripped Mtg.-Backed Security, Series2015-C27, Cl. XA, 0.00%, 2/15/484,5 | | $ | 2,851,266 | | | $ | 139,653 | |
| LB Commercial Conduit Mortgage Trust, Interest-Only Stripped Mtg.-Backed Security, Series1998-C1, Cl. IO, 0.00%, 2/18/304,5 | | | 67,745 | | | | 1 | |
| Lehman Structured Securities Corp., Series2002-GE1, Cl. A, 0.00%, 7/26/241,8,9 | | | 26,759 | | | | 18,990 | |
| Morgan Stanley Bank of America Merrill Lynch Trust: | |
| Series2013-C7,Cl. AAB, 2.469%, 2/15/46 | | | 82,713 | | | | 81,736 | |
| Series2013-C9,Cl. AS, 3.456%, 5/15/46 | | | 225,000 | | | | 224,730 | |
| Series2014-C19,Cl. AS, 3.832%, 12/15/47 | | | 595,000 | | | | 598,435 | |
| Morgan Stanley Capital I Trust: | | | | | | | | |
| Series2011-C1,Cl. A4, 5.033%, 9/15/471,9 | | | 59,271 | | | | 60,788 | |
| Series2011-C2,Cl. A4, 4.661%, 6/15/441 | | | 75,000 | | | | 77,471 | |
| Morgan Stanley Capital I, Inc., Interest-Only Commercial Mtg. Pass-Through Certificates, Series2017-HR2, Cl. XA, 0.00%, 12/15/504,5 | | | 681,074 | | | | 38,057 | |
| Morgan StanleyRe-Remic Trust, Series 2012- R3, Cl. 1B, 3.667%, 11/26/361,9 | | | 439,664 | | | | 402,645 | |
| Morgan Stanley Resecuritization Trust, Series2013-R9, Cl. 3A, 3.60%, 6/26/461,9 | | | 55,456 | | | | 55,344 | |
| RBSSP Resecuritization Trust, Series2010-1, Cl. 2A1, 4.044%, 7/26/451,9 | | | 11,073 | | | | 11,337 | |
| UBS Commercial Mortgage Trust, Interest-Only Commercial Mtg. Pass-Through Certificates, Series2017-C5, Cl. XA, 0.00%, 11/15/504,5 | | | 1,251,210 | | | | 78,684 | |
| Wells Fargo Commercial Mortgage Trust, Series 2015-NXS1, Cl. ASB, 2.934%, 5/15/48 | | | 305,000 | | | | 303,218 | |
| Wells Fargo Commercial Mortgage Trust, Interest-Only Commercial Mtg. Pass-Through Certificates, Series2017-C42, Cl. XA, 0.00%, 12/15/504,5 | | | 896,476 | | | | 57,089 | |
| WF-RBS Commercial Mortgage Trust: | | | | | | | | |
| Series2013-C14,Cl. AS, 3.488%, 6/15/46 | | | 150,000 | | | | 149,656 | |
| Series2014-C20,Cl. AS, 4.176%, 5/15/47 | | | 130,000 | | | | 134,274 | |
| Series2014-C22,Cl. A3, 3.528%, 9/15/57 | | | 45,000 | | | | 45,449 | |
| Series 2014-LC14,Cl. AS, 4.351%, 3/15/479 | | | 145,000 | | | | 147,480 | |
| | | | | | | | 10,017,986 | |
| Multi-Family—0.3% | |
| Connecticut Avenue Securities: | | | | | | | | |
| Series2014-C02,Cl. 1M2, 5.106% | | | | | | | | |
| [US0001M+260], 5/25/242 | | | 170,000 | | | | 178,247 | |
| Series2017-C04,Cl. 2M1, 3.356% | | | | | | | | |
| [US0001M+85], 11/25/292 | | | 248,104 | | | | 248,176 | |
| | | | | | | | 426,423 | |
| Residential—7.7% | |
| Banc of America Funding Trust: | | | | | | | | |
| Series2007-1,Cl. 1A3, 6.00%, 1/25/37 | | | 79,279 | | | | 75,125 | |
| Series2007-C,Cl. 1A4, 4.173%, 5/20/369 | | | 29,995 | | | | 28,928 | |
| Series2014-R7,Cl. 3A1, 4.607%, 3/26/361,9 | | | 57,574 | | | | 57,748 | |
| Banc of America Mortgage Trust, Series 2007-1, Cl. 1A24, 6.00%, 3/25/37 | | | 50,777 | | | | 47,014 | |
| Bear Stearns ARM Trust: | | | | | | | | |
| Series2005-9,Cl. A1, 4.73% [H15T1Y+230], 10/25/352 | | | 91,035 | | | | 91,950 | |
| Series2006-1,Cl. A1, 4.91% [H15T1Y+225], 2/25/362 | | | 111,071 | | | | 111,954 | |
| | | | | | | | |
| | | Principal Amount | | | Value | |
| Residential (Continued) | |
| CHL Mortgage Pass-Through Trust: | | | | | | | | |
| Series2005-17,Cl. 1A8, 5.50%, 9/25/35 | | $ | 10,688 | | | $ | 10,521 | |
| Series2005-26,Cl. 1A8, 5.50%, 11/25/35 | | | 68,169 | | | | 59,947 | |
| Series2005-J4,Cl. A7, 5.50%, 11/25/35 | | | 9,101 | | | | 9,074 | |
| Citigroup Mortgage Loan Trust, Inc., Series2006-AR1, Cl. 1A1, 4.28% [H15T1Y+240], 10/25/352 | | | 293,074 | | | | 296,127 | |
| Connecticut Avenue Securities: | | | | | | | | |
| Series2014-C03,Cl. 1M2, 5.506% | | | | | | | | |
| [US0001M+300], 7/25/242 | | | 293,225 | | | | 308,555 | |
| Series2014-C03,Cl. 2M2, 5.406% | | | | | | | | |
| [US0001M+290], 7/25/242 | | | 54,900 | | | | 57,448 | |
| Series2016-C03,Cl. 1M1, 4.506% [US0001M+200], 10/25/282 | | | 57,254 | | | | 57,723 | |
| Series2016-C07,Cl. 2M1, 3.806% [US0001M+130], 5/25/292 | | | 67,049 | | | | 67,130 | |
| Series2017-C02,Cl. 2M1, 3.656% [US0001M+115], 9/25/292 | | | 320,559 | | | | 321,370 | |
| Series2017-C03,Cl. 1M1, 3.456% [US0001M+95], 10/25/292 | | | 300,659 | | | | 301,004 | |
| Series2017-C06,Cl. 1M1, 3.256% [US0001M+75], 2/25/302 | | | 99,596 | | | | 99,523 | |
| Series2017-C07,Cl. 1M1, 3.156% [US0001M+65], 5/25/302 | | | 188,630 | | | | 188,259 | |
| Series2017-C07,Cl. 1M2, 4.906% [US0001M+240], 5/25/302 | | | 210,000 | | | | 211,811 | |
| Series2017-C07,Cl. 2M1, 3.156% [US0001M+65], 5/25/302 | | | 190,603 | | | | 190,311 | |
| Series2018-C01,Cl. 1M1, 3.106% [US0001M+60], 7/25/302 | | | 418,105 | | | | 416,789 | |
| Series2018-C02,Cl. 2M1, 3.156% [US0001M+65], 8/25/302 | | | 76,777 | | | | 76,709 | |
| Series2018-C03,Cl. 1M1, 3.186% [US0001M+68], 10/25/302 | | | 273,847 | | | | 273,255 | |
| Series2018-C04,Cl. 2M1, 3.256% [US0001M+75], 12/25/302 | | | 235,123 | | | | 235,002 | |
| Series2018-C05,Cl. 1M1, 3.226% [US0001M+72], 1/25/312 | | | 100,875 | | | | 100,674 | |
| Series2018-C06,Cl. 1M1, 3.056% [US0001M+55], 3/25/312 | | | 38,845 | | | | 38,736 | |
| Series2018-C06,Cl. 2M1, 3.056% [US0001M+55], 3/25/312 | | | 43,920 | | | | 43,800 | |
| Connecticut Avenue Securities Trust, Series2018-R07, Cl. 1M1, 3.256% [US0001M+75], 4/25/311,2 | | | 78,613 | | | | 78,513 | |
| GSR Mortgage Loan Trust, Series2005-AR4, Cl. 6A1, 4.332%, 7/25/359 | | | 49,307 | | | | 49,593 | |
| HomeBanc Mortgage Trust, Series2005-3, Cl. A2, 2.816% [US0001M+31], 7/25/352 | | | 21,036 | | | | 20,884 | |
| MASTR Asset Backed Securities Trust, Series 2006-WMC3, Cl. A3, 2.606% [US0001M+10], 8/25/362 | | | 45,381 | | | | 22,392 | |
| RALI Trust: | | | | | | | | |
| Series 2006-QS13,Cl. 1A8, 6.00%, 9/25/36 | | | 605 | | | | 532 | |
| Series2007-QS6,Cl. A28, 5.75%, 4/25/37 | | | 7,678 | | | | 7,017 | |
| STACR Trust: | | | | | | | | |
| Series 2018-DNA2,Cl. M1, 3.306% [US0001M+80], 12/25/301,2 | | | 380,000 | | | | 379,726 | |
| Series 2018-DNA3,Cl. M1, 3.256% [US0001M+75], 9/25/481,2 | | | 70,000 | | | | 69,895 | |
| Series 2018-HRP2,Cl. M2, 3.756% [US0001M+125], 2/25/471,2 | | | 215,000 | | | | 215,173 | |
| Structured Agency Credit Risk Debt Nts.: | | | | | | | | |
| Series2013-DN2,Cl. M2, 6.756% [US0001M+425], 11/25/232 | | | 256,540 | | | | 279,589 | |
11 OPPENHEIMER TOTAL RETURN BOND FUND/VA
STATEMENT OF INVESTMENTSContinued
| | | | | | | | |
| | | Principal Amount | | | Value | |
| Residential (Continued) | |
| Structured Agency Credit Risk Debt Nts.: (Continued) | |
| Series2014-DN1,Cl. M2, 4.706% | | | | | |
| [US0001M+220], 2/25/242 | | $ | 34,658 | | | $ | 35,310 | |
| Series2014-DN1,Cl. M3, 7.006% | | | | | | | | |
| [US0001M+450], 2/25/242 | | | 210,000 | | | | 235,693 | |
| Series2014-DN2,Cl. M3, 6.106% | | | | | | | | |
| [US0001M+360], 4/25/242 | | | 225,000 | | | | 242,842 | |
| Series2014-HQ2,Cl. M3, 6.256% | | | | | | | | |
| [US0001M+375], 9/25/242 | | | 335,000 | | | | 369,001 | |
| Series 2015-HQA2,Cl. M2, 5.306% | | | | | | | | |
| [US0001M+280], 5/25/282 | | | 39,947 | | | | 40,745 | |
| Series 2016-DNA1,Cl. M2, 5.406% | | | | | | | | |
| [US0001M+290], 7/25/282 | | | 72,770 | | | | 74,059 | |
| Series 2016-DNA4,Cl. M1, 3.306% | | | | | | | | |
| [US0001M+80], 3/25/292 | | | 1,462 | | | | 1,462 | |
| Series 2016-DNA4,Cl. M3, 6.306% | | | | | | | | |
| [US0001M+380], 3/25/292 | | | 325,000 | | | | 351,003 | |
| Series 2016-HQA3,Cl. M1, 3.306% | | | | | | | | |
| [US0001M+80], 3/25/292 | | | 75,234 | | | | 75,252 | |
| Series 2016-HQA3,Cl. M3, 6.356% | | | | | | | | |
| [US0001M+385], 3/25/292 | | | 110,000 | | | | 120,379 | |
| Series 2016-HQA4,Cl. M3, 6.406% | | | | | | | | |
| [US0001M+390], 4/25/292 | | | 320,000 | | | | 350,947 | |
| Series 2017-HQA1,Cl. M1, 3.706% | | | | | | | | |
| [US0001M+120], 8/25/292 | | | 469,809 | | | | 471,382 | |
| Series 2017-HQA2,Cl. M1, 3.306% | | | | | | | | |
| [US0001M+80], 12/25/292 | | | 151,526 | | | | 151,471 | |
| Series 2017-HQA3,Cl. M1, 3.056% [US0001M+55], 4/25/302 | | | 391,175 | | | | 390,501 | |
| Series 2018-DNA1,Cl. M1, 2.956% | | | | | | | | |
| [US0001M+45], 7/25/302 | | | 408,893 | | | | 407,028 | |
| Series 2018-DNA1,Cl. M2, 4.306% | | | | | | | | |
| [-3.667 x US0001M+180], 7/25/302 | | | 420,000 | | | | 404,178 | |
| WaMu Mortgage Pass-Through Certificates Trust: | | | | | | | | |
| Series 2003-AR10,Cl. A7, 4.487%, 10/25/339 | | | 64,937 | | | | 65,769 | |
| Series 2005-AR14,Cl. 1A4, 4.215%, 12/25/359 | | | 128,657 | | | | 127,308 | |
| Series 2005-AR16,Cl. 1A1, 4.28%, 12/25/359 | | | 58,179 | | | | 58,190 | |
| Wells Fargo Mortgage-Backed Securities Trust: | | | | | |
| Series 2005-AR15,Cl. 1A2, 4.671%, 9/25/359 | | | 57,103 | | | | 55,622 | |
| Series 2005-AR15,Cl. 1A6, 4.671%, 9/25/359 | | | 22,139 | | | | 21,405 | |
| Series2005-AR4,Cl. 2A2, 4.252%, 4/25/359 | | | 128,028 | | | | 129,029 | |
| Series 2006-AR10,Cl. 1A1, 4.309%, 7/25/369 | | | 42,196 | | | | 41,295 | |
| Series 2006-AR10,Cl. 5A5, 4.434%, 7/25/369 | | | 108,496 | | | | 108,454 | |
| Series2006-AR2,Cl. 2A3, 4.607%, 3/25/369 | | | 48,350 | | | | 48,934 | |
| Series2006-AR7,Cl. 2A4, 4.334%, 5/25/369 | | | 11,029 | | | | 11,299 | |
| Series2007-16,Cl. 1A1, 6.00%, 12/28/37 | | | 37,184 | | | | 36,856 | |
| | | | | | | 9,325,215 | |
Total Mortgage-Backed Obligations (Cost $63,124,342) | | | | 62,200,933 | |
| U.S. Government Obligation—0.2% | |
| United States Treasury Nts., 1.50%, 5/31/1910,11(Cost $193,106) | | | 193,000 | | | | 192,224 | |
| | | | | | | | |
| | | Principal Amount | | | Value | |
| Corporate Bonds and Notes—50.6% | |
| Consumer Discretionary—8.0% | |
| Automobiles—1.9% | |
| Daimler Finance North America LLC, 3.75% Sr. Unsec. Nts., 11/5/211 | | $ | 269,000 | | | $ | 270,009 | |
| General Motors Co., 6.25% Sr. Unsec. Nts., 10/2/43 | | | 78,000 | | | | 73,414 | |
| General Motors Financial Co., Inc.: | | | | | | | | |
| 4.15% Sr. Unsec. Nts., 6/19/23 | | | 272,000 | | | | 265,278 | |
| 4.20% Sr. Unsec. Nts., 11/6/21 | | | 250,000 | | | | 250,037 | |
| Harley-Davidson Financial Services, Inc., 2.40% Sr. Unsec. Nts., 6/15/201 | | | 323,000 | | | | 317,135 | |
| Hyundai Capital America: | | | | | | | | |
| 1.75% Sr. Unsec. Nts., 9/27/191 | | | 243,000 | | | | 239,948 | |
| 4.125% Sr. Unsec. Nts., 6/8/231 | | | 315,000 | | | | 315,656 | |
| Nissan Motor Acceptance Corp., 3.65% | | | | | | | | |
| Sr. Unsec. Nts., 9/21/211 | | | 310,000 | | | | 308,605 | |
| Volkswagen Group of America Finance | | | | | | | | |
| LLC, 4.00% Sr. Unsec. Nts., 11/12/211 | | | 298,000 | | | | 298,797 | |
| | | | | | | | 2,338,879 | |
| Diversified Consumer Services—0.2% | |
| Service Corp. International, 4.625% Sr. | | | | | | | | |
| Unsec. Nts., 12/15/27 | | | 325,000 | | | | 306,719 | |
| Entertainment—0.2% | | | | | | | | |
| 21st Century Fox America, Inc., 4.75% | |
| Sr. Unsec. Nts., 11/15/46 | | | 116,000 | | | | 126,460 | |
| Viacom, Inc., 4.375% Sr. Unsec. Nts., 3/15/43 | | | 100,000 | | | | 79,641 | |
| | | | | | | | 206,101 | |
| Hotels, Restaurants & Leisure—0.5% | |
| Aramark Services, Inc., 5.00% Sr. Unsec. | | | | | | | | |
| Nts., 4/1/251 | | | 303,000 | | | | 296,940 | |
| Royal Caribbean Cruises Ltd., 2.65% Sr. | | | | | | | | |
| Unsec. Nts., 11/28/20 | | | 287,000 | | | | 281,807 | |
| | | | | | | | 578,747 | |
| Household Durables—1.1% | |
| DR Horton, Inc., 2.55% Sr. Unsec. Nts., 12/1/20 | | | 320,000 | | | | 312,380 | |
| Lennar Corp., 4.75% Sr. Unsec. Nts., 5/30/25 | | | 314,000 | | | | 295,552 | |
| Newell Brands, Inc., 5.00% Sr. Unsec. | | | | | | | | |
| Nts., 11/15/23 | | | 171,000 | | | | 174,097 | |
| PulteGroup, Inc., 5.00% Sr. Unsec. Nts., 1/15/27 | | | 251,000 | | | | 228,096 | |
| Toll Brothers Finance Corp.: | | | | | | | | |
| 4.375% Sr. Unsec. Nts., 4/15/23 | | | 257,000 | | | | 242,223 | |
| 4.875% Sr. Unsec. Nts., 3/15/27 | | | 75,000 | | | | 68,250 | |
| | | | | | | | 1,320,598 | |
| Internet & Catalog Retail—0.5% | |
| Amazon.com, Inc., 4.95% Sr. Unsec. | | | | | | | | |
| Nts., 12/5/44 | | | 113,000 | | | | 125,724 | |
| QVC, Inc., 4.45% Sr. Sec. Nts., 2/15/25 | | | 565,000 | | | | 521,577 | |
| | | | | | | | 647,301 | |
| Media—1.8% | |
| Charter Communications Operating LLC/ | | | | | | | | |
| Charter Communications Operating | | | | | | | | |
| Capital, 5.375% Sr. Sec. Nts., 5/1/47 | | | 65,000 | | | | 59,176 | |
| Comcast Cable Communications | | | | | | | | |
| Holdings, Inc., 9.455% Sr. Unsec. Nts., 11/15/22 | | | 306,000 | | | | 371,940 | |
| Comcast Corp.: | | | | | | | | |
| 3.95% Sr. Unsec. Nts., 10/15/25 | | | 207,000 | | | | 209,727 | |
| 4.00% Sr. Unsec. Nts., 3/1/48 | | | 165,000 | | | | 150,946 | |
| Interpublic Group of Cos., Inc. (The): | | | | | | | | |
| 3.75% Sr. Unsec. Nts., 10/1/21 | | | 251,000 | | | | 252,644 | |
| 4.20% Sr. Unsec. Nts., 4/15/24 | | | 311,000 | | | | 311,179 | |
Sky Ltd., 3.75% Sr. Unsec. Nts., 9/16/241 | | | 152,000 | | | | 151,624 | |
12 OPPENHEIMER TOTAL RETURN BOND FUND/VA
| | | | | | | | |
| | | Principal Amount | | | Value | |
| Media (Continued) | |
| Time Warner Cable LLC, 4.50% Sr. Unsec. Unsub. Nts., 9/15/42 | | $ | 106,000 | | | $ | 85,599 | |
| Virgin Media Secured Finance plc, 5.25% Sr. Sec. Nts., 1/15/261 | | | 319,000 | | | | 293,480 | |
| WPP Finance 2010, 3.75% Sr. Unsec. Nts., 9/19/24 | | | 352,000 | | | | 329,345 | |
| | | | | | | | 2,215,660 | |
| Specialty Retail—1.3% | |
| AutoNation, Inc., 5.50% Sr. Unsec. Nts., 2/1/20 | | | 291,000 | | | | 297,434 | |
| AutoZone, Inc., 1.625% Sr. Unsec. Nts., 4/21/19 | | | 64,000 | | | | 63,692 | |
| Best Buy Co., Inc., 5.50% Sr. Unsec. Nts., 3/15/21 | | | 305,000 | | | | 314,629 | |
| L Brands, Inc., 5.625% Sr. Unsec. Nts., 2/15/22 | | | 297,000 | | | | 297,000 | |
| Ross Stores, Inc., 3.375% Sr. Unsec. Nts., 9/15/24 | | | 324,000 | | | | 318,535 | |
| Signet UK Finance plc, 4.70% Sr. Unsec. Nts., 6/15/24 | | | 342,000 | | | | 303,525 | |
| | | | | | | | 1,594,815 | |
| Textiles, Apparel & Luxury Goods—0.5% | |
| Hanesbrands, Inc., 4.875% Sr. Unsec. Nts., 5/15/261 | | | 316,000 | | | | 286,375 | |
| Levi Strauss & Co., 5.00% Sr. Unsec. Nts., 5/1/25 | | | 269,000 | | | | 264,293 | |
| | | | | | | | 550,668 | |
| Consumer Staples—5.3% | |
| Beverages—1.3% | |
| Anheuser-Busch Cos LLC/Anheuser-Busch InBev Worldwide, Inc., 3.65% Sr. Unsec. Nts., 2/1/261 | | | 85,000 | | | | 80,419 | |
| Anheuser-Busch InBev Worldwide, Inc., 8.20% Sr. Unsec. Unsub. Nts., 1/15/39 | | | 186,000 | | | | 240,044 | |
| Bacardi Ltd., 4.70% Sr. Unsec. Nts., 5/15/281 | | | 163,000 | | | | 157,024 | |
Keurig Dr Pepper, Inc.: | | | | | | | | |
| 4.057% Sr. Unsec. Nts., 5/25/231 | | | 304,000 | | | | 303,047 | |
| 4.597% Sr. Unsec. Nts., 5/25/281 | | | 162,000 | | | | 161,177 | |
| Molson Coors Brewing Co., 2.10% Sr. Unsec. Nts., 7/15/21 | | | 311,000 | | | | 300,022 | |
| Pernod Ricard SA, 4.25% Sr. Unsec. Nts., 7/15/221 | | | 307,000 | | | | 311,671 | |
| | | | | | | | 1,553,404 | |
| Food & Staples Retailing—0.4% | |
| Alimentation Couche-Tard, Inc., 2.35% Sr. Unsec. Nts., 12/13/191 | | | 343,000 | | | | 339,884 | |
Kroger Co. (The): | | | | | | | | |
| 2.00% Sr. Unsec. Nts., 1/15/19 | | | 15,000 | | | | 14,993 | |
4.45% Sr. Unsec. Nts., 2/1/47 | | | 89,000 | | | | 78,376 | |
| | | | | | | | 433,253 | |
| Food Products—2.6% | |
| Bunge Ltd. Finance Corp.: | |
| 3.25% Sr. Unsec. Nts., 8/15/26 | | | 216,000 | | | | 189,662 | |
| 3.50% Sr. Unsec. Nts., 11/24/20 | | | 313,000 | | | | 312,323 | |
| Campbell Soup Co., 3.30% Sr. Unsec. Nts., 3/15/21 | | | 311,000 | | | | 309,535 | |
| Conagra Brands, Inc.: | | | | | | | | |
| 3.80% Sr. Unsec. Nts., 10/22/21 | | | 240,000 | | | | 240,232 | |
| 4.60% Sr. Unsec. Nts., 11/1/25 | | | 302,000 | | | | 303,523 | |
| Kraft Heinz Foods Co.: | | | | | | | | |
| 2.80% Sr. Unsec. Nts., 7/2/20 | | | 316,000 | | | | 313,325 | |
| 3.95% Sr. Unsec. Nts., 7/15/25 | | | 177,000 | | | | 171,612 | |
Lamb Weston Holdings, Inc., 4.875% Sr. Unsec. Nts., 11/1/261 | | | 308,000 | | | | 297,220 | |
| | | | | | | | |
| | | Principal Amount | | | Value | |
| Food Products (Continued) | |
| Mondelez International Holdings Netherlands BV, 2.00% Sr. Unsec. Nts., 10/28/211 | | $ | 319,000 | | | $ | 305,838 | |
| Smithfield Foods, Inc.: | | | | | | | | |
| 2.70% Sr. Unsec. Nts., 1/31/201 | | | 137,000 | | | | 135,165 | |
| 3.35% Sr. Unsec. Nts., 2/1/221 | | | 174,000 | | | | 166,513 | |
Tyson Foods, Inc.: | | | | | | | | |
| 3.55% Sr. Unsec. Nts., 6/2/27 | | | 164,000 | | | | 153,092 | |
| 3.90% Sr. Unsec. Nts., 9/28/23 | | | 255,000 | | | | 254,902 | |
| | | | | | | | 3,152,942 | |
| Tobacco—1.0% | |
| Altria Group, Inc., 4.00% Sr. Unsec. Nts., 1/31/24 | | | 222,000 | | | | 218,402 | |
| BAT Capital Corp.: | |
| 2.297% Sr. Unsec. Nts., 8/14/20 | | | 330,000 | | | | 322,262 | |
| 3.557% Sr. Unsec. Nts., 8/15/27 | | | 169,000 | | | | 150,386 | |
| Imperial Brands Finance plc, 3.75% Sr. Unsec. Nts., 7/21/221 | | | 308,000 | | | | 305,756 | |
| Imperial Tobacco Finance plc, 2.95% Sr. Unsec. Nts., 7/21/201 | | | 233,000 | | | | 229,569 | |
| | | | | | | | 1,226,375 | |
| Energy—3.8% | |
| Energy Equipment & Services—0.4% | |
| Halliburton Co., 5.00% Sr. Unsec. Nts., 11/15/45 | | | 70,000 | | | | 69,568 | |
| Helmerich & Payne, Inc., 4.65% Sr. Unsec. Nts., 3/15/251 | | | 194,000 | | | | 198,149 | |
| Schlumberger Holdings Corp., 4.00% Sr. Unsec. Nts., 12/21/251 | | | 184,000 | | | | 181,974 | |
| | | | | | | | 449,691 | |
| Oil, Gas & Consumable Fuels—3.4% | |
| Anadarko Petroleum Corp., 4.50% Sr. Unsec. Nts., 7/15/44 | | | 64,000 | | | | 54,493 | |
| Andeavor Logistics LP/Tesoro Logistics Finance Corp., 4.25% Sr. Unsec. Nts., 12/1/27 | | | 166,000 | | | | 157,080 | |
| Apache Corp., 4.375% Sr. Unsec. Nts., 10/15/28 | | | 237,000 | | | | 221,951 | |
| Columbia Pipeline Group, Inc.: | | | | | | | | |
| 3.30% Sr. Unsec. Nts., 6/1/20 | | | 302,000 | | | | 301,019 | |
| 4.50% Sr. Unsec. Nts., 6/1/25 | | | 162,000 | | | | 163,453 | |
ConocoPhillips Co.: | | | | | | | | |
| 4.95% Sr. Unsec. Nts., 3/15/26 | | | 35,000 | | | | 37,505 | |
| 5.95% Sr. Unsec. Nts., 3/15/46 | | | 70,000 | | | | 85,589 | |
| Devon Energy Corp., 4.75% Sr. Unsec. Nts., 5/15/42 | | | 74,000 | | | | 64,288 | |
| Energy Transfer LP, 4.25% Sr. Sec. Nts., 3/15/23 | | | 245,000 | | | | 236,425 | |
| Energy Transfer Operating LP, 5.30% Sr. Unsec. Nts., 4/15/47 | | | 94,000 | | | | 83,232 | |
| Enterprise Products Operating LLC: | | | | | | | | |
| 4.85% Sr. Unsec. Nts., 8/15/42 | | | 79,000 | | | | 76,423 | |
| 4.90% Sr. Unsec. Nts., 5/15/46 | | | 27,000 | | | | 26,283 | |
| EQT Corp., 2.50% Sr. Unsec. Nts., 10/1/20 | | | 340,000 | | | | 332,543 | |
| Kinder Morgan Energy Partners LP, 5.80% Sr. Unsec. Nts., 3/1/21 | | | 124,000 | | | | 129,466 | |
Kinder Morgan, Inc.: | | | | | | | | |
| 5.20% Sr. Unsec. Nts., 3/1/48 | | | 80,000 | | | | 76,848 | |
| 5.55% Sr. Unsec. Nts., 6/1/45 | | | 138,000 | | | | 137,308 | |
| Marathon Petroleum Corp., 3.80% Sr. Unsec. Nts., 4/1/283 | | | 266,000 | | | | 250,252 | |
| ONEOK Partners LP, 8.625% Sr. Unsec. Nts., 3/1/19 | | | 192,000 | | | | 193,368 | |
| Pioneer Natural Resources Co., 3.45% Sr. Unsec. Nts., 1/15/21 | | | 318,000 | | | | 317,189 | |
| Sabine Pass Liquefaction LLC: | | | | | | | | |
| 4.20% Sr. Sec. Nts., 3/15/28 | | | 166,000 | | | | 159,174 | |
13 OPPENHEIMER TOTAL RETURN BOND FUND/VA
STATEMENT OF INVESTMENTSContinued
| | | | | | | | |
| | | Principal Amount | | | Value | |
| Oil, Gas & Consumable Fuels (Continued) | |
| Sabine Pass Liquefaction LLC: (Continued) | |
| 5.625% Sr. Sec. Nts., 2/1/21 | | $ | 237,000 | | | $ | 244,236 | |
| Shell International Finance BV, 4.00% Sr. Unsec. Nts., 5/10/46 | | | 110,000 | | | | 106,638 | |
| Sunoco Logistics Partners Operations LP, | |
| 4.00% Sr. Unsec. Nts., 10/1/27 | | | 194,000 | | | | 178,301 | |
| TransCanada PipeLines Ltd., | |
| 7.625% Sr. Unsec. Nts., 1/15/39 | | | 71,000 | | | | 88,774 | |
| Williams Cos., Inc. (The): | | | | | | | | |
3.70% Sr. Unsec. Unsub. Nts., 1/15/23 | | | 318,000 | | | | 310,597 | |
| 3.75% Sr. Unsec. Nts., 6/15/27 | | | 131,000 | | | | 124,423 | |
| | | | | | | | |
| | | | | | | | 4,156,858 | |
| Financials—13.0% | |
| Capital Markets—2.4% | |
| Blackstone Holdings Finance Co. LLC, 3.15% Sr. Unsec. Nts., 10/2/271 | | | 121,000 | | | | 114,157 | |
| Brookfield Asset Management, Inc., 4.00% Sr. Unsec. Nts., 1/15/25 | | | 252,000 | | | | 246,164 | |
| Credit Suisse AG (New York), 3.625% Sr. Unsec. Nts., 9/9/24 | | | 189,000 | | | | 185,572 | |
| Credit Suisse Group Funding Guernsey Ltd., 4.55% Sr. Unsec. Nts., 4/17/26 | | | 147,000 | | | | 145,836 | |
| E*TRADE Financial Corp., 5.875% [US0003M+443.5] Jr. Sub. Perpetual Bonds2,12 | | | 308,000 | | | | 277,970 | |
| Goldman Sachs Group, Inc. (The): | | | | | | | | |
| 3.50% Sr. Unsec. Nts., 11/16/26 | | | 172,000 | | | | 159,113 | |
| 3.75% Sr. Unsec. Nts., 2/25/26 | | | 170,000 | | | | 161,085 | |
| 4.017% [US0003M+137.3] Sr. Unsec. Nts., 10/31/382 | | | 136,000 | | | | 119,865 | |
| Morgan Stanley: | | | | | | | | |
| 4.375% Sr. Unsec. Nts., 1/22/47 | | | 219,000 | | | | 208,049 | |
| 5.00% Sub. Nts., 11/24/25 | | | 264,000 | | | | 269,705 | |
| MSCI, Inc., 4.75% Sr. Unsec. Nts., 8/1/261 | | | 311,000 | | | | 295,450 | |
| Northern Trust Corp., 3.375% | | | | | | | | |
| [US0003M+113.1] Sub. Nts., 5/8/322 | | | 119,000 | | | | 110,871 | |
| Raymond James Financial, Inc., 3.625% Sr. Unsec. Nts., 9/15/26 | | | 157,000 | | | | 148,275 | |
| TD Ameritrade Holding Corp., 3.30% Sr. Unsec. Nts., 4/1/27 | | | 197,000 | | | | 188,729 | |
| UBS Group Funding Switzerland AG: | | | | | | | | |
| 4.125% Sr. Unsec. Nts., 4/15/261 | | | 153,000 | | | | 152,231 | |
| 4.253% Sr. Unsec. Nts., 3/23/281 | | | 135,000 | | | | 133,324 | |
| | | | | | | | |
| | | | | | | | 2,916,396 | |
| Commercial Banks—6.5% | |
| ABN AMRO Bank NV, 4.40% | | | | | | | | |
| [USSW5+219.7] Sub. Nts., 3/27/282,13 | | | 321,000 | | | | 314,689 | |
| Bank of America Corp.: | | | | | | | | |
| 3.248% Sr. Unsec. Nts., 10/21/27 | | | 269,000 | | | | 249,038 | |
| 3.824% [US0003M+157.5] Sr. Unsec. Nts., 1/20/282 | | | 185,000 | | | | 179,749 | |
| 4.271% [US0003M+131] Sr. Unsec. Nts., 7/23/292 | | | 253,000 | | | | 252,260 | |
| 7.75% Jr. Sub. Nts., 5/14/38 | | | 232,000 | | | | 301,174 | |
| Bank of Ireland Group plc, 4.50% Sr. Unsec. Nts., 11/25/231 | | | 250,000 | | | | 245,174 | |
| BNP Paribas SA, 4.625% Sub. Nts., 3/13/271 | | | 184,000 | | | | 178,996 | |
| BPCE SA, 4.50% Sub. Nts., 3/15/251 | | | 185,000 | | | | 179,347 | |
Citigroup, Inc.: | | | | | | | | |
| 4.075% [US0003M+119.2] Sr. Unsec. Nts., 4/23/292 | | | 256,000 | | | | 250,127 | |
| 4.281% [US0003M+183.9] Sr. Unsec. Nts., 4/24/482 | | | 334,000 | | | | 310,209 | |
| Citizens Bank NA (Providence RI), | |
2.65% Sr. Unsec. Nts., 5/26/22 | | | 65,000 | | | | 63,201 | |
| | | | | | | | |
| | | Principal Amount | | | Value | |
| Commercial Banks (Continued) | |
| Compass Bank, 2.875% Sr. Unsec. Nts., 6/29/22 | | $ | 285,000 | | | $ | 273,304 | |
| Credit Agricole SA, 4.375% Sub. Nts., 3/17/251 | | | 310,000 | | | | 300,536 | |
| Fifth Third Bank (Cincinnati OH), 3.85% Sub. Nts., 3/15/26 | | | 168,000 | | | | 165,733 | |
| First Republic Bank, 4.375% Sub. Nts., 8/1/46 | | | 127,000 | | | | 117,796 | |
| HSBC Holdings plc: | | | | | | | | |
| 3.95% [US0003M+98.72] Sr. Unsec. | | | | | | | | |
| Nts., 5/18/242 | | | 103,000 | | | | 102,499 | |
| 4.041% [US0003M+154.6] Sr. Unsec. | | | | | | | | |
| Nts., 3/13/282 | | | 125,000 | | | | 119,782 | |
| 4.583% [US0003M+153.46] Sr. Unsec. Nts., 6/19/292 | | | 171,000 | | | | 169,796 | |
| Huntington Bancshares, Inc., 4.00% Sr. Unsec. Nts., 5/15/25 | | | 317,000 | | | | 319,119 | |
| JPMorgan Chase & Co.: | | | | | | | | |
| 3.54% [US0003M+138] Sr. Unsec. Nts., 5/1/282 | | | 259,000 | | | | 247,360 | |
| 3.782% [US0003M+133.7] Sr. Unsec. | | | | | | | | |
| Nts., 2/1/282 | | | 473,000 | | | | 459,871 | |
| 3.797% [US0003M+89] Sr. Unsec. Nts., 7/23/242 | | | 315,000 | | | | 315,745 | |
| KeyCorp, 4.15% Sr. Unsec. Nts., 10/29/25 | | | 101,000 | | | | 102,741 | |
| Lloyds Banking Group plc, 6.657% [US0003M+127] Jr. Sub. Perpetual Bonds1,2,12 | | | 334,000 | | | | 329,197 | |
| Nordea Bank Abp, 4.625% | | | | | | | | |
| [USSW5+169] Sub. Nts., 9/13/331,2 | | | 112,000 | | | | 108,970 | |
| PNC Bank NA, 4.05% Sub. Nts., 7/26/28 | | | 222,000 | | | | 223,408 | |
| PNC Financial Services Group, Inc. (The), 3.15% Sr. Unsec. Nts., 5/19/27 | | | 235,000 | | | | 224,620 | |
| Regions Financial Corp., 2.75% Sr. | | | | | | | | |
| Unsec. Nts., 8/14/22 | | | 177,000 | | | | 170,902 | |
| Royal Bank of Canada, 3.70% Sr. Unsec. Nts., 10/5/23 | | | 272,000 | | | | 273,251 | |
| SunTrust Bank (Atlanta GA): | | | | | | | | |
| 3.30% Sub. Nts., 5/15/26 | | | 112,000 | | | | 106,291 | |
| 4.05% Sr. Unsec. Nts., 11/3/25 | | | 135,000 | | | | 137,478 | |
| Synovus Financial Corp., 3.125% Sr. Unsec. Nts., 11/1/22 | | | 180,000 | | | | 170,098 | |
| Toronto-Dominion Bank (The), 3.50% Sr. Unsec. Nts., 7/19/23 | | | 252,000 | | | | 253,878 | |
| US Bancorp: | | | | | | | | |
| 3.10% Sub. Nts., 4/27/26 | | | 204,000 | | | | 193,449 | |
| 3.15% Sr. Unsec. Nts., 4/27/27 | | | 62,000 | | | | 59,493 | |
| Wells Fargo & Co.: | | | | | | | | |
| 3.584% [US0003M+131] Sr. Unsec. Nts., 5/22/282 | | | 257,000 | | | | 247,142 | |
| 4.75% Sub. Nts., 12/7/46 | | | 160,000 | | | | 154,613 | |
| | | | | | | | |
| | | | | | | | 7,871,036 | |
| Consumer Finance—0.9% | |
| American Express Co., 2.50% Sr. Unsec. Nts., 8/1/22 | | | 105,000 | | | | 101,425 | |
| American Express Credit Corp., 3.30% Sr. Unsec. Nts., 5/3/27 | | | 194,000 | | | | 188,987 | |
| Capital One Financial Corp., 3.75% Sr. Unsec. Nts., 3/9/27 | | | 103,000 | | | | 95,883 | |
Discover Bank: | | | | | | | | |
3.10% Sr. Unsec. Nts., 6/4/20 | | | 229,000 | | | | 227,476 | |
| 4.65% Sr. Unsec. Nts., 9/13/28 | | | 116,000 | | | | 113,289 | |
| Discover Financial Services, 3.75% Sr. Unsec. Nts., 3/4/25 | | | 137,000 | | | | 131,245 | |
Electricite de France SA, 6.50% Sr. | | | | | | | | |
Unsec. Nts., 1/26/191 | | | 246,000 | | | | 246,794 | |
| | | | | | | | |
| | | | | |
| 1,105,099
|
|
14 OPPENHEIMER TOTAL RETURN BOND FUND/VA
| | | | | | | | |
| | | Principal Amount | | | Value | |
| Diversified Financial Services—0.4% | |
| Berkshire Hathaway Energy Co., 3.80% Sr. Unsec. Nts., 7/15/48 | | $ | 75,000 | | | $ | 67,587 | |
| Peachtree Corners Funding Trust, 3.976% Sr. Unsec. Nts., 2/15/251 | | | 121,000 | | | | 117,579 | |
| Voya Financial, Inc., 5.65% | | | | | | | | |
| [US0003M+358] Jr. Sub. Nts., 5/15/532 | | | 300,000 | | | | 282,690 | |
| | | | | | | | |
| | | | | | | | 467,856 | |
| Insurance—1.4% | |
| Aflac, Inc., 4.75% Sr. Unsec. Nts., 1/15/49 | | | 106,000 | | | | 108,448 | |
| AXA Equitable Holdings, Inc., 4.35% Sr. Unsec. Nts., 4/20/281 | | | 172,000 | | | | 162,942 | |
| AXIS Specialty Finance plc, 5.15% Sr. Unsec. Nts., 4/1/45 | | | 167,000 | | | | 160,930 | |
| Boardwalk Pipelines LP, 4.95% Sr. Unsec. Nts., 12/15/24 | | | 156,000 | | | | 158,378 | |
| Brighthouse Financial, Inc., 3.70% Sr. Unsec. Nts., 6/22/27 | | | 67,000 | | | | 56,744 | |
| CNA Financial Corp., 3.45% Sr. Unsec. Nts., 8/15/27 | | | 239,000 | | | | 222,900 | |
| Hartford Financial Services Group, Inc. (The), 4.40% Sr. Unsec. Nts., 3/15/48 | | | 192,000 | | | | 180,038 | |
| Lincoln National Corp., 3.80% Sr. Unsec. Nts., 3/1/28 | | | 193,000 | | | | 187,654 | |
| Manulife Financial Corp., 4.061% | | | | | | | | |
| [USISDA05+164.7] Sub. Nts., 2/24/322 | | | 202,000 | | | | 190,915 | |
| Marsh & McLennan Cos., Inc., 4.35% Sr. Unsec. Nts., 1/30/47 | | | 106,000 | | | | 99,377 | |
| Prudential Financial, Inc., 5.20% [US0003M+304] Jr. Sub. Nts., 3/15/442 | | | 243,000 | | | | 227,812 | |
| | | | | | | | |
| | | | | | | 1,756,138 | |
| Real Estate Investment Trusts (REITs)—1.4% | |
| American Tower Corp.: | | | | | | | | |
| 2.80% Sr. Unsec. Nts., 6/1/20 | | | 72,000 | | | | 71,460 | |
| 3.00% Sr. Unsec. Nts., 6/15/23 | | | 262,000 | | | | 252,320 | |
| 4.00% Sr. Unsec. Nts., 6/1/25 | | | 168,000 | | | | 165,119 | |
| 5.05% Sr. Unsec. Unsub. Nts., 9/1/20 | | | 160,000 | | | | 163,871 | |
| Crown Castle International Corp., | | | | | | | | |
| 3.65% Sr. Unsec. Nts., 9/1/27 | | | 170,000 | | | | 157,974 | |
| Digital Realty Trust LP: | | | | | | | | |
| 3.40% Sr. Unsec. Nts., 10/1/20 | | | 29,000 | | | | 28,914 | |
| 5.875% Sr. Unsec. Nts., 2/1/20 | | | 118,000 | | | | 120,404 | |
Lamar Media Corp.,
5.75% Sr. Unsec. Nts., 2/1/26 | | | 292,000 | | | | 296,745 | |
| VEREIT Operating Partnership LP: | | | | | | | | |
| 3.00% Sr. Unsec. Nts., 2/6/19 | | | 126,000 | | | | 125,927 | |
| 4.625% Sr. Unsec. Nts., 11/1/25 | | | 305,000 | | | | 306,140 | |
| | | | | | | | |
| | | | | | | 1,688,874 | |
| Health Care—5.0% | |
| Biotechnology—1.1% | |
| AbbVie, Inc.: | | | | | | | | |
| 3.75% Sr. Unsec. Nts., 11/14/23 | | | 312,000 | | | | 310,745 | |
| 4.25% Sr. Unsec. Nts., 11/14/28 | | | 232,000 | | | | 225,814 | |
| Amgen, Inc., 4.563% Sr. Unsec. Nts., 6/15/48 | | | 89,000 | | | | 85,690 | |
| Biogen, Inc., 5.20% Sr. Unsec. Nts., 9/15/45 | | | 77,000 | | | | 79,571 | |
| Celgene Corp., 3.875% Sr. Unsec. Nts., 8/15/25 | | | 195,000 | | | | 188,074 | |
| Gilead Sciences, Inc., 4.75% Sr. Unsec. Nts., 3/1/46 | | | 133,000 | | | | 132,425 | |
| Shire Acquisitions Investments Ireland | | | | | | | | |
| DAC, 2.40% Sr. Unsec. Nts., 9/23/21 | | | 321,000 | | | | 310,590 | |
| | | | | | | | |
| | | | | | | 1,332,909 | |
| Health Care Equipment & Supplies—0.4% | |
| Becton Dickinson & Co.: | | | | | | | | |
| 2.404% Sr. Unsec. Nts., 6/5/20 | | | 213,000 | | | | 209,826 | |
| | | | | | | | |
| | | Principal Amount | | | Value | |
| Health Care Equipment & Supplies (Continued) | |
| Becton Dickinson & Co.: (Continued) 3.70% Sr. Unsec. Nts., 6/6/27 | | $ | 252,000 | | | $ | 238,659 | |
| Hologic, Inc., 4.375% Sr. Unsec. Nts., 10/15/251 | | | 13,000 | | | | 12,155 | |
| | | | | | | | |
| | | | | | | 460,640 | |
| Health Care Providers & Services—1.5% | |
| Cigna Corp., 3.75% Sr. Sec. Nts., 7/15/231 | | | 242,000 | | | | 241,428 | |
| Cigna Holding Co., 5.125% Sr. Unsec. Nts., 6/15/20 | | | 286,000 | | | | 293,375 | |
| CVS Health Corp.: | | | | | | | | |
| 2.125% Sr. Unsec. Nts., 6/1/21 | | | 334,000 | | | | 323,293 | |
| 5.05% Sr. Unsec. Nts., 3/25/48 | | | 286,000 | | | | 279,584 | |
| Fresenius Medical Care US Finance II, Inc., 5.875% Sr. Unsec. Nts., 1/31/221 | | | 431,000 | | | | 449,648 | |
| McKesson Corp., 3.65% Sr. Unsec. Nts., 11/30/20 | | | 287,000 | | | | 288,447 | |
| | | | | | | | |
| | | | | | | | 1,875,775 | |
| Life Sciences Tools & Services—0.6% | |
| IQVIA, Inc., 5.00% Sr. Unsec. Nts., 10/15/261 | | | 312,000 | | | | 299,130 | |
| Life Technologies Corp., 6.00% Sr. Unsec. Nts., 3/1/20 | | | 237,000 | | | | 243,673 | |
| Thermo Fisher Scientific, Inc., 4.15% Sr. | | | | | | | | |
| Unsec. Nts., 2/1/24 | | | 121,000 | | | | 122,696 | |
| | | | | | | | |
| | | | | | | 665,499 | |
| Pharmaceuticals—1.4% | |
| Allergan Funding SCS, 3.00% Sr. Unsec. Nts., 3/12/20 | | | 329,000 | | | | 327,785 | |
| Bayer US Finance II LLC: | | | | | | | | |
| 3.875% Sr. Unsec. Nts., 12/15/231 | | | 313,000 | | | | 307,643 | |
| 4.375% Sr. Unsec. Nts., 12/15/281 | | | 227,000 | | | | 217,293 | |
| Elanco Animal Health, Inc., 4.90% Sr. Unsec. Nts., 8/28/281 | | | 137,000 | | | | 139,751 | |
| Mylan NV, 3.15% Sr. Unsec. Nts., 6/15/21 | | | 303,000 | | | | 296,888 | |
| Takeda Pharmaceutical Co. Ltd.: | | | | | | | | |
| 4.00% Sr. Unsec. Nts., 11/26/211 | | | 279,000 | | | | 282,980 | |
| 5.00% Sr. Unsec. Nts., 11/26/281 | | | 159,000 | | | | 162,803 | |
| | | | | | | | |
| | | | | | | 1,735,143 | |
| Industrials—3.5% | |
| Aerospace & Defense—1.0% | |
BAE Systems Holdings, Inc.,
3.85% Sr. Unsec. Nts., 12/15/251 | | | 250,000 | | | | 248,349 | |
| Huntington Ingalls Industries, Inc., 3.483% Sr. Unsec. Nts., 12/1/27 | | | 176,000 | | | | 164,372 | |
L3 Technologies, Inc.,
3.85% Sr. Unsec. Nts., 6/15/23 | | | 317,000 | | | | 317,790 | |
| Northrop Grumman Corp., 4.75% Sr. Unsec. Nts., 6/1/43 | | | 175,000 | | | | 177,780 | |
| United Technologies Corp.: | | | | | | | | |
| 3.35% Sr. Unsec. Nts., 8/16/21 | | | 77,000 | | | | 76,836 | |
| 3.95% Sr. Unsec. Nts., 8/16/25 | | | 193,000 | | | | 191,868 | |
| | | | | | | | |
| | | | | | | 1,176,995 | |
| Air Freight & Couriers—0.1% | |
CH Robinson Worldwide, Inc., 4.20% Sr.
Unsec. Nts., 4/15/28 | | | 163,000 | | | | 163,858 | |
| Building Products—0.4% | |
Allegion US Holding Co., Inc.,
3.55% Sec. Nts., 10/1/27 | | | 246,000 | | | | 229,138 | |
| Fortune Brands Home & Security, Inc., 4.00% Sr. Unsec. Nts., 9/21/23 | | | 297,000 | | | | 294,146 | |
| | | | | | | | |
| | | | | | | 523,284 | |
15 OPPENHEIMER TOTAL RETURN BOND FUND/VA
STATEMENT OF INVESTMENTSContinued
| | | | | | | | |
| | | Principal Amount | | | Value | |
| Electrical Equipment—0.3% | |
Sensata Technologies BV,
4.875% Sr. Unsec. Nts., 10/15/231 | | $ | 334,000 | | | $ | 326,067 | |
| Industrial Conglomerates—0.3% | |
| GE Capital International Funding Co. Unlimited Co., 3.373% Sr. Unsec. Nts., 11/15/25 | | | 99,000 | | | | 88,115 | |
| Roper Technologies, Inc., 3.65% Sr. Unsec. Nts., 9/15/23 | | | 311,000 | | | | 311,539 | |
| | | | | | | | |
| | | | | | | 399,654 | |
| Machinery—0.2% | |
| Fortive Corp., 1.80% Sr. Unsec. Nts., 6/15/19 | | | 37,000 | | | | 36,562 | |
Nvent Finance Sarl, 4.55% Sr.
Unsec. Nts., 4/15/28 | | | 162,000 | | | | 159,111 | |
| | | | | | | | |
| | | | | | | 195,673 | |
| Professional Services—0.2% | |
| IHS Markit Ltd., 4.125% Sr. Unsec. Nts., 8/1/23 | | | 198,000 | | | | 196,228 | |
| | | | | | | | | |
| Road & Rail—0.5% | |
| Penske Truck Leasing Co. LP/PTL Finance Corp., 3.40% Sr. Unsec. Nts., 11/15/261 | | | 276,000 | | | | 258,516 | |
| Ryder System, Inc.: | | | | | | | | |
| 3.50% Sr. Unsec. Nts., 6/1/21 | | | 74,000 | | | | 74,131 | |
| 3.75% Sr. Unsec. Nts., 6/9/23 | | | 314,000 | | | | 312,367 | |
| | | | | | | | |
| | | | | | | 645,014 | |
| Trading Companies & Distributors—0.5% | |
| Air Lease Corp.: | | | | | | | | |
| 3.25% Sr. Unsec. Nts., 3/1/25 | | | 99,000 | | | | 91,297 | |
| 3.625% Sr. Unsec. Nts., 4/1/27 | | | 106,000 | | | | 95,021 | |
| GATX Corp., 3.50% Sr. Unsec. Nts., 3/15/28 | | | 261,000 | | | | 240,281 | |
| United Rentals North America, Inc., 4.625% Sr. Unsec. Nts., 10/15/25 | | | 168,000 | | | | 150,360 | |
| | | | | | | | |
| | | | | | | 576,959 | |
| Information Technology—3.4% | |
| Communications Equipment—0.2% | |
Motorola Solutions, Inc., 4.60%
Sr. Unsec. Nts., 2/23/28 | | | 241,000 | | | | 236,217 | |
| | | | | | | | | |
| Electronic Equipment, Instruments, & Components—0.4% | |
| Arrow Electronics, Inc., 3.875% Sr. | |
| Unsec. Nts., 1/12/28 | | | 232,000 | | | | 211,849 | |
CDW LLC/CDW Finance Corp.,
5.50% Sr. Unsec. Nts., 12/1/24 | | | 54,000 | | | | 53,595 | |
Tech Data Corp., 4.95% Sr.
Unsec. Nts., 2/15/27 | | | 264,000 | | | | 248,340 | |
| | | | | | | | |
| | | | | | | | 513,784 | |
| IT Services—0.8% | |
| DXC Technology Co.: | | | | | | | | |
| 2.875% Sr. Unsec. Nts., 3/27/20 | | | 238,000 | | | | 235,983 | |
| 4.75% Sr. Unsec. Nts., 4/15/27 | | | 241,000 | | | | 242,374 | |
| Fidelity National Information Services, Inc., 4.25% Sr. Unsec. Nts., 5/15/28 | | | 162,000 | | | | 161,338 | |
| VeriSign, Inc.: | | | | | | | | |
| 4.75% Sr. Unsec. Nts., 7/15/27 | | | 190,000 | | | | 178,895 | |
| 5.25% Sr. Unsec. Nts., 4/1/25 | | | 99,000 | | | | 98,381 | |
| | | | | | | | |
| | | | | | | | 916,971 | |
| Semiconductors & Semiconductor Equipment—0.6% | |
| Intel Corp., 3.734% Sr. Unsec. Nts., 12/8/47 | | | 94,000 | | | | 87,226 | |
| Microchip Technology, Inc., 3.922% Sr. Sec. Nts., 6/1/211 | | | 316,000 | | | | 313,634 | |
| NXP BV/NXP Funding LLC, 4.125% Sr. Unsec. Nts., 6/1/211 | | | 292,000 | | | | 289,080 | |
| | | | | | | | |
| | | | | | | 689,940 | |
| | | | | | | | |
| | | Principal Amount | | | Value | |
| Software—1.0% | |
| Autodesk, Inc., 4.375% Sr. Unsec. Nts., 6/15/25 | | $ | 98,000 | | | $ | 99,199 | |
| Dell International LLC/EMC Corp.: | |
| 4.42% Sr. Sec. Nts., 6/15/211 | | | 251,000 | | | | 250,886 | |
| 6.02% Sr. Sec. Nts., 6/15/261 | | | 199,000 | | | | 200,279 | |
| Open Text Corp., 5.625% Sr. Unsec. Nts., 1/15/231 | | | 236,000 | | | | 236,000 | |
Oracle Corp.,
2.95% Sr. Unsec. Nts., 5/15/25 | | | 194,000 | | | | 185,891 | |
| VMware, Inc.: | | | | | | | | |
| 2.30% Sr. Unsec. Nts., 8/21/20 | | | 104,000 | | | | 101,886 | |
| 3.90% Sr. Unsec. Nts., 8/21/27 | | | 161,000 | | | | 143,144 | |
| | | | | | | | |
| | | | | | | | 1,217,285 | |
| Technology Hardware, Storage & Peripherals—0.4% | |
| Apple, Inc., 4.375% Sr. Unsec. Nts., 5/13/45 | | | 198,000 | | | | 201,835 | |
Hewlett Packard Enterprise Co.,
3.60% Sr. Unsec. Nts., 10/15/20 | | | 323,000 | | | | 323,911 | |
| | | | | | | | |
| | | | | | | | 525,746 | |
| Materials—3.4% | |
| Chemicals—1.8% | |
Dow Chemical Co. (The),
4.55% Sr. Unsec. Nts., 11/30/251 | | | 208,000 | | | | 212,004 | |
| DowDuPont, Inc.: | | | | | | | | |
| 3.766% Sr. Unsec. Nts., 11/15/20 | | | 279,000 | | | | 281,744 | |
| 5.419% Sr. Unsec. Nts., 11/15/48 | | | 125,000 | | | | 130,525 | |
| Eastman Chemical Co., 3.50% Sr. | | | | | | | | |
| Unsec. Nts., 12/1/21 | | | 126,000 | | | | 126,713 | |
| LyondellBasell Industries NV, 5.00% Sr. Unsec. Nts., 4/15/19 | | | 236,000 | | | | 236,261 | |
| Nutrien Ltd.: | | | | | | | | |
| 3.375% Sr. Unsec. Nts., 3/15/25 | | | 275,000 | | | | 258,830 | |
| 4.875% Sr. Unsec. Nts., 3/30/20 | | | 41,000 | | | | 41,722 | |
| PolyOne Corp., 5.25% Sr. Unsec. Nts., 3/15/23 | | | 299,000 | | | | 290,030 | |
| RPM International, Inc.: | | | | | | | | |
| 3.45% Sr. Unsec. Unsub. Nts., 11/15/22 | | | 285,000 | | | | 282,544 | |
| 6.125% Sr. Unsec. Nts., 10/15/19 | | | 162,000 | | | | 164,983 | |
| Yara International ASA, 4.75% Sr. Unsec. Nts., 6/1/281 | | | 165,000 | | | | 164,864 | |
| | | | | | | | |
| | | | | | | | 2,190,220 | |
| Construction Materials—0.3% | |
| James Hardie International Finance DAC, 4.75% Sr. Unsec. Nts., 1/15/251 | | | 193,000 | | | | 176,354 | |
Martin Marietta Materials, Inc., 3.50%
Sr. Unsec. Nts., 12/15/27 | | | 161,000 | | | | 147,151 | |
| | | | | | | | |
| | | | | | | | 323,505 | |
| Containers & Packaging—0.5% | |
| Packaging Corp. of America: | | | | | | | | |
| 3.65% Sr. Unsec. Nts., 9/15/24 | | | 94,000 | | | | 92,480 | |
| 4.50% Sr. Unsec. Nts., 11/1/23 | | | 242,000 | | | | 248,307 | |
| Silgan Holdings, Inc., 4.75% Sr. Unsec. | | | | | | | | |
| Nts., 3/15/25 | | | 270,000 | | | | 253,125 | |
| | | | | | | | |
| | | | | | | | 593,912 | |
| Metals & Mining—0.6% | |
| Anglo American Capital plc: | | | | | | | | |
| 3.625% Sr. Unsec. Nts., 9/11/241 | | | 83,000 | | | | 78,412 | |
| 4.00% Sr. Unsec. Nts., 9/11/271 | | | 135,000 | | | | 122,115 | |
| ArcelorMittal, 6.125% Sr. Unsec. Nts., 6/1/25 | | | 285,000 | | | | 298,703 | |
| Goldcorp, Inc., 5.45% Sr. Unsec. Nts., 6/9/44 | | | 93,000 | | | | 92,627 | |
| Steel Dynamics, Inc., 4.125% Sr. Unsec. | | | | | | | | |
Nts., 9/15/25 | | | 229,000 | | | | 211,539 | |
| | | | | | | | |
| | | | | | | 803,396 | |
16 OPPENHEIMER TOTAL RETURN BOND FUND/VA
| | | | | | | | |
| | | Principal Amount | | | Value | |
| Paper & Forest Products—0.2% | |
Georgia-Pacific LLC, 3.734% Sr.
Unsec. Nts., 7/15/231 | | $ | 56,000 | | | $ | 56,563 | |
| Louisiana-Pacific Corp., 4.875% Sr. | | | | | | | | |
| Unsec. Nts., 9/15/24 | | | 186,000 | | | | 179,955 | |
| | | | | | | | |
| | | | | | | | 236,518 | |
| Telecommunication Services—2.0% | |
| Diversified Telecommunication Services—1.6% | |
| AT&T, Inc.: | | | | | | | | |
| 4.30% Sr. Unsec. Nts., 2/15/30 | | | 238,000 | | | | 225,548 | |
| 4.35% Sr. Unsec. Nts., 6/15/45 | | | 139,000 | | | | 118,047 | |
| 4.50% Sr. Unsec. Nts., 3/9/48 | | | 135,000 | | | | 116,835 | |
| British Telecommunications plc: | | | | | | | | |
| 4.50% Sr. Unsec. Nts., 12/4/23 | | | 201,000 | | | | 203,930 | |
| 9.625% Sr. Unsec. Nts., 12/15/30 | | | 270,000 | | | | 365,882 | |
| Deutsche Telekom International Finance BV, 4.375% Sr. Unsec. Nts., 6/21/281 | | | 149,000 | | | | 147,077 | |
| Telefonica Emisiones SA: | | | | | | | | |
| 4.103% Sr. Unsec. Nts., 3/8/27 | | | 90,000 | | | | 86,930 | |
| 5.213% Sr. Unsec. Nts., 3/8/47 | | | 79,000 | | | | 72,662 | |
| T-Mobile USA, Inc., 6.50% Sr. Unsec. Nts., 1/15/26 | | | 284,000 | | | | 290,390 | |
| Verizon Communications, Inc.: | | | | | | | | |
| 4.125% Sr. Unsec. Nts., 8/15/46 | | | 133,000 | | | | 117,965 | |
| 4.522% Sr. Unsec. Nts., 9/15/48 | | | 184,000 | | | | 173,302 | |
| | | | | | | | |
| | | | | | | | 1,918,568 | |
| Wireless Telecommunication Services—0.4% | |
| Vodafone Group plc: | | | | | | | | |
| 3.75% Sr. Unsec. Nts., 1/16/24 | | | 313,000 | | | | 308,832 | |
| 4.375% Sr. Unsec. Nts., 5/30/28 | | | 159,000 | | | | 154,627 | |
| | | | | | | | |
| | | | | | | | 463,459 | |
| Utilities—3.2% | | | | | | | | |
| Electric Utilities—2.3% | | | | | | | | |
| AEP Texas, Inc., 3.95% Sr. Unsec. Nts., 6/1/281 | | | 162,000 | | | | 162,648 | |
| Duke Energy Corp.: | | | | | | | | |
| 3.15% Sr. Unsec. Nts., 8/15/27 | | | 169,000 | | | | 158,405 | |
| 3.75% Sr. Unsec. Nts., 9/1/46 | | | 65,000 | | | | 56,506 | |
| Edison International: | | | | | | | | |
| 2.125% Sr. Unsec. Nts., 4/15/20 | | | 124,000 | | | | 120,728 | |
| 2.95% Sr. Unsec. Nts., 3/15/23 | | | 195,000 | | | | 184,371 | |
| EDP Finance BV, 3.625% Sr. Unsec. Nts., 7/15/241 | | | 219,000 | | | | 205,455 | |
| Electricite de France SA, 4.50% Sr. Unsec. Nts., 9/21/281 | | | 160,000 | | | | 155,353 | |
| Emera US Finance LP, 2.70% Sr. Unsec. Nts., 6/15/21 | | | 168,000 | | | | 163,754 | |
| Eversource Energy, 4.25% Sr. Unsec. Nts., 4/1/29 | | | 155,000 | | | | 158,218 | |
| Exelon Corp.: | | | | | | | | |
| 2.45% Sr. Unsec. Nts., 4/15/21 | | | 152,000 | | | | 148,738 | |
| 4.45% Sr. Unsec. Nts., 4/15/46 | | | 89,000 | | | | 85,088 | |
| FirstEnergy Corp., 3.90% Sr. Unsec. Nts., 7/15/27 | | | 175,000 | | | | 169,893 | |
| Indiana Michigan Power Co., 4.25% Sr. Unsec. Nts., 8/15/48 | | | 74,000 | | | | 73,144 | |
| Mid-Atlantic Interstate Transmission LLC, 4.10% Sr. Unsec. Nts., 5/15/281 | | | 162,000 | | | | 161,253 | |
| NextEra Energy Operating Partners LP, 4.25% Sr. Unsec. Nts., 9/15/241 | | | 30,000 | | | | 27,862 | |
| Pennsylvania Electric Co., 5.20% Sr. Unsec. Nts., 4/1/20 | | | 73,000 | | | | 74,839 | |
| PPL WEM Ltd./Western Power | | | | | | | | |
| Distribution Ltd., 5.375% Sr. Unsec. Unsub. Nts., 5/1/211 | | | 308,000 | | | | 318,176 | |
| TECO Finance, Inc., 5.15% Sr. Unsec. Nts., 3/15/20 | | | 153,000 | | | | 156,491 | |
| | | | | | | | |
| | | Principal Amount | | | Value | |
| Electric Utilities (Continued) | |
| Trans-Allegheny Interstate Line Co., 3.85% Sr. Unsec. Nts., 6/1/251 | | $ | 181,000 | | | $ | 180,568 | |
| | | | | | | | |
| | | | | | | | 2,761,490 | |
| Independent Power and Renewable Electricity Producers—0.0% | |
| PSEG Power LLC, 3.00%, 6/15/21 | | | 16,000 | | | | 15,745 | |
| | | | | | | | | |
| Multi-Utilities—0.9% | | | | | | | | |
| CenterPoint Energy Resources Corp., 4.50% Sr. Unsec. Nts., 1/15/21 | | | 116,000 | | | | 118,379 | |
| CenterPoint Energy, Inc.: | | | | | | | | |
| 3.60% Sr. Unsec. Nts., 11/1/21 | | | 190,000 | | | | 190,516 | |
| 4.25% Sr. Unsec. Nts., 11/1/28 | | | 147,000 | | | | 149,345 | |
| Dominion Energy, Inc.: | | | | | | | | |
| 2.579% Jr. Sub. Nts., 7/1/20 | | | 255,000 | | | | 251,061 | |
| 4.90% Sr. Unsec. Nts., 8/1/41 | | | 120,000 | | | | 119,538 | |
| Public Service Enterprise Group, Inc., 1.60% Sr. Unsec. Nts., 11/15/19 | | | 295,000 | | | | 290,945 | |
| | | | | | | | |
| | | | | | | 1,119,784 | |
| | | | | | | | |
Total Corporate Bonds and Notes
(Cost $62,823,133) | | | | | | | 61,337,648 | |
| Short-Term Notes—8.4% | | | | | |
| Alliant Energy Corp., 2.501%, 1/4/1914 | | | 550,000 | | | | 549,838 | |
| Ameren Illinois Co., 2.70%, 1/2/1914 | | | 550,000 | | | | 549,917 | |
| Clorox Co. (The), 2.65%, 1/2/191,14,15 | | | 550,000 | | | | 549,924 | |
| ENI Finance USA Co., 2.722%, 1/11/1914,15 | | | 550,000 | | | | 549,544 | |
| ERAC USA Finance Co., 2.903%, 1/10/191,14,15 | | | 550,000 | | | | 549,584 | |
| Eversource Energy, 2.752%, 1/7/1914,15 | | | 550,000 | | | | 549,718 | |
| Glencore Funding LLC: | | | | | | | | |
| 2.789%, 1/7/1914,15 | | | 250,000 | | | | 249,867 | |
| 3.002%, 1/3/1914,15 | | | 300,000 | | | | 299,932 | |
| International Paper Co., 2.852%, 1/3/191,14,15 | | | 300,000 | | | | 299,934 | |
| McKesson Corp., 3.157%, 1/22/191,14,15 | | | 550,000 | | | | 549,045 | |
| Mohawk Industries, Inc., 2.913%, 1/2/191,14,15 | | | 550,000 | | | | 549,920 | |
| NetApp Inc., 2.887%, 1/29/191,14,15 | | | 490,000 | | | | 488,860 | |
| Northrop Grumman Corp., 2.698%, 1/16/191,14,15 | | | 250,000 | | | | 249,692 | |
| Southern Company Funding Corp., 2.902%, 1/7/1914,15 | | | 550,000 | | | | 549,713 | |
| Telus Corp., 2.85%, 1/16/191,14 | | | 550,000 | | | | 549,390 | |
| Tyco Electronics Group SA, 2.914%, 1/2/191,14,15 | | | 550,000 | | | | 549,920 | |
| United Technologies Corp., 3.047%, 1/23/191,14,15 | | | 550,000 | | | | 548,999 | |
| VF Corp., 2.853%, 1/11/191,14,15 | | | 480,000 | | | | 479,609 | |
| Walgreens Boots Alliance, Inc., 2.925%, 1/7/1914 | | | 550,000 | | | | 549,713 | |
| Western Union Co. (The), 2.801%, 1/3/191,14,15 | | | 490,000 | | | | 489,893 | |
| Xcel Energy, Inc., 3.054%, 1/9/1914,15 | | | 550,000 | | | | 549,627 | |
| | | | | | | | |
Total Short-Term Notes (Cost $10,253,054) | | | | | | | 10,252,639 | |
| | | Shares | | | | |
| Investment Company—1.5% | | | | | |
| Oppenheimer Institutional Government Money Market Fund, Cl. E, 2.35%16,17(Cost $1,840,843) | | | 1,840,843 | | | | 1,840,843 | |
Total Investments, at Value (Cost $161,445,757) | | | 131.1% | | | | 159,059,106 | |
| Net Other Assets (Liabilities) | | | (31.1 | ) | | | (37,738,699 | ) |
| Net Assets | | | 100.0% | | | $ | 121,320,407 | |
| | | | | | | | |
17 OPPENHEIMER TOTAL RETURN BOND FUND/VA
STATEMENT OF INVESTMENTS Continued
Footnotes to Statement of Investments
1. Represents securities sold under Rule 144A, which are exempt from registration under the Securities Act of 1933, as amended. These securities have been determined to be liquid under guidelines established by the Board of Trustees. These securities amount to $35,515,630 or 29.27% of the Fund’s net assets at period end.
2. Represents the current interest rate for a variable or increasing rate security, determined as [Referenced Rate + Basis-point spread].
3. Restricted security. The aggregate value of restricted securities at period end was $475,832, which represents 0.39% of the Fund’s net assets. See Note 4 of the accompanying Notes.
Information concerning restricted securities is as follows:
| | | | | | | | | | | | | | | | |
| Security | | Acquisition
Dates | | | Cost | | | Value | | | Unrealized Appreciation/
(Depreciation) | |
GLS Auto Receivables Trust, Series2018-1A, Cl. A, 2.82%, 7/15/22 | | | 1/30/18 | | | $ | 226,330 | | | $ | 225,580 | | | $ | (750) | |
Marathon Petroleum Corp., 3.80% Sr. Unsec. Nts., 4/1/28 | | | 7/25/18 | | | | 253,584 | | | | 250,252 | | | | (3,332) | |
| | | | | | | | |
| | | | | | $ | 479,914 | | | $ | 475,832 | | | $ | (4,082) | |
| | | | | | | | |
4. Interest-Only Strips represent the right to receive the monthly interest payments on an underlying pool of mortgage loans. These securities typically decline in price as interest rates decline. Most other fixed income securities increase in price when interest rates decline. The principal amount of the underlying pool represents the notional amount on which current interest is calculated. The price of these securities is typically more sensitive to changes in prepayment rates than traditional mortgage-backed securities (for example, GNMA pass-throughs). Interest rates disclosed represent current yields based upon the current cost basis and estimated timing and amount of future cash flows. These securities amount to $1,848,972 or 1.52% of the Fund’s net assets at period end.
5. Interest rate is less than 0.0005%.
6. Principal-Only Strips represent the right to receive the monthly principal payments on an underlying pool of mortgage loans. The value of these securities generally increases as interest rates decline and prepayment rates rise. The price of these securities is typically more volatile than that of coupon-bearing bonds of the same maturity. Interest rates disclosed represent current yields based upon the current cost basis and estimated timing of future cash flows. These securities amount to $56,890 or 0.05% of the Fund’s net assets at period end.
7. All or a portion of the security position is when-issued or delayed delivery to be delivered and settled after period end. See Note 4 of the accompanying Notes.
8. The value of this security was determined using significant unobservable inputs. See Note 3 of the accompanying Notes.
9. This interest rate resets periodically. Interest rate shown reflects the rate in effect at period end. The rate on this variable rate security is not based on a published reference rate and spread but is determined by the issuer or agent based on current market conditions.
10. All or a portion of the security position is held in accounts at a futures clearing merchant and pledged to cover margin requirements on open futures contracts and written options on futures, if applicable. The aggregate market value of such securities is $169,316. See Note 6 of the accompanying Notes.
11. All or a portion of the security position has been pledged for collateral in association with forward roll transactions. See Note 4 of the accompanying Notes.
12. This bond has no contractual maturity date, is not redeemable and contractually pays an indefinite stream of interest.
13. Represents securities sold under Regulation S, which are exempt from registration under the Securities Act of 1933, as amended. These securities may not be offered or sold in the United States without and exemption from, or in a transaction not subject to, the registration requirements of the Securities Act of 1933. These securities amount to $314,689 or 0.26% of the Fund’s net assets at period end.
14. Current yield as of period end.
15. Security issued in an exempt transaction without registration under the Securities Act of 1933. Such securities amount to $8,053,781 or 6.64% of the Fund’s net assets, and have been determined to be liquid pursuant to guidelines adopted by the Board of Trustees.
16. Rate shown is the7-day yield at period end.
17. Is or was an affiliate, as defined in the Investment Company Act of 1940, as amended, at or during the reporting period, by virtue of the Fund owning at least 5% of the voting securities of the issuer or as a result of the Fund and the issuer having the same investment adviser. Transactions during the reporting period in which the issuer was an affiliate are as follows:
| | | | | | | | | | | | | | | | |
| | | Shares
December 31, 2017 | | | Gross
Additions | | | Gross
Reductions | | | Shares
December 31, 2018 | |
Investment Company | | | | | | | | | | | | | | | | |
Oppenheimer Institutional Government Money Market Fund, Cl. E | | | 2,772,340 | | | | 73,947,308 | | | | 74,878,805 | | | | 1,840,843 | |
| | | | |
| | | Value | | | Income | | | Realized
Gain (Loss) | | | Change in Unrealized
Gain (Loss) | |
Investment Company | | | | | | | | | | | | | | | | |
Oppenheimer Institutional Government Money Market Fund, Cl. E | | $ | 1,840,843 | | | $ | 57,521 | | | $ | — | | | $ | — | |
| | | | | | | | | | | | | | | | | | | | | | | | | | | | |
| Futures Contracts as of December 31, 2018 | |
| Description | | Buy/Sell | | | Expiration Date | | | Number of
Contracts | | | | | | Notional
Amount
(000’s) | | | Value | | | Unrealized
Appreciation/
(Depreciation) | |
| United States Treasury Long Bonds | | | Buy | | | | 3/20/19 | | | | 7 | | | | USD | | | | 983 | | | $ | 1,022,000 | | | $ | 39,398 | |
| United States Treasury Nts., 10 yr. | | | Sell | | | | 3/20/19 | | | | 24 | | | | USD | | | | 2,909 | | | | 2,928,375 | | | | (18,991 | ) |
| United states Treasury Nts., 2 yr. | | | Sell | | | | 3/29/19 | | | | 46 | | | | USD | | | | 9,716 | | | | 9,766,375 | | | | (50,237 | ) |
| United States Treasury Nts., 5 yr. | | | Sell | | | | 3/29/19 | | | | 27 | | | | USD | | | | 3,045 | | | | 3,096,563 | | | | (51,078 | ) |
| United States Ultra Bonds | | | Buy | | | | 3/20/19 | | | | 58 | | | | USD | | | | 8,830 | | | | 9,318,063 | | | | 487,756 | |
| | | | | | | | | | | | | | | | | | | | | | | | | | | | |
| | | | | | | | | | | | | | | | | | | | | | | | | | $ | 406,848 | |
| | | | | | | | | | | | | | | | | | | | | | | | | | | | |
| | |
| Glossary: | | |
| Definitions | | |
| H15T1Y | | US Treasury Yield Curve Rate T Note Constant Maturity 1 Year |
| ICE LIBOR | | Intercontinental Exchange Benchmark Administration-London Interbank Offered Rate |
| LIBOR01M | | ICE LIBOR USD 1 Month |
| US0001M | | ICE LIBOR USD 1 Month |
| US0003M | | ICE LIBOR USD 3 Month |
| USISDA05 | | USD ICE Swap Rate 11:00am NY 5 Year |
18 OPPENHEIMER TOTAL RETURN BOND FUND/VA
| | |
| Definitions (Continued) | | |
| USSW5 | | USD Swap Semi 30/360 5 Year |
See accompanying Notes to Financial Statements.
19 OPPENHEIMER TOTAL RETURN BOND FUND/VA
STATEMENT OF ASSETS AND LIABILITIESDecember 31, 2018
| | | | |
Assets | | | | |
Investments, at value—see accompanying statement of investments: | | | | |
Unaffiliated companies (cost $159,604,914) | | $ | 157,218,263 | |
Affiliated companies (cost $1,840,843) | | | 1,840,843 | |
| | | | |
| | | 159,059,106 | |
| |
Cash | | | 480,143 | |
| |
Cash used for collateral on futures | | | 220,000 | |
| |
Receivables and other assets: | | | | |
Investments sold (including $14,465,989 sold on a when-issued or delayed delivery basis) | | | 14,586,581 | |
Interest, dividends and principal paydowns | | | 763,811 | |
Variation margin receivable | | | 37,530 | |
Shares of beneficial interest sold | | | 1,337 | |
Other | | | 47,333 | |
| | | | |
Total assets | | | 175,195,841 | |
|
| |
| |
Liabilities | | | | |
Payables and other liabilities: | | | | |
Investments purchased (including $52,194,245 purchased on a when-issued or delayed delivery basis) | | | 52,743,635 | |
Shares of beneficial interest redeemed | | | 980,607 | |
Trustees’ compensation | | | 40,731 | |
Variation margin payable | | | 22,594 | |
Shareholder communications | | | 10,299 | |
Distribution and service plan fees | | | 10,133 | |
Other | | | 67,435 | |
| | | | |
Total liabilities | | | 53,875,434 | |
|
| |
Net Assets | | $ | 121,320,407 | |
| | | | |
|
| |
| |
Composition of Net Assets | | | | |
Par value of shares of beneficial interest | | $ | 16,283 | |
| |
Additionalpaid-in capital | | | 125,892,614 | |
| |
Total accumulated loss | | | (4,588,490) | |
| | | | |
Net Assets | | $ | 121,320,407 | |
| | | | |
|
| |
| |
Net Asset Value Per Share | | | | |
Non-Service Shares: | | | | |
| |
| Net asset value, redemption price per share and offering price per share (based on net assets of $74,929,188 and 10,003,612 shares of beneficial interest outstanding) | | | $7.49 | |
| |
Service Shares: | | | | |
| Net asset value, redemption price per share and offering price per share (based on net assets of $46,391,219 and 6,279,311 shares of beneficial interest outstanding) | | | $7.39 | |
See accompanying Notes to Financial Statements.
20 OPPENHEIMER TOTAL RETURN BOND FUND/VA
STATEMENT OF OPERATIONSFor the Year Ended December 31, 2018
| | | | |
| |
Investment Income | | | | |
Interest: | | | | |
Unaffiliated companies (net of foreign withholding taxes of $ 775) | | $ | 4,433,590 | |
| |
Fee income on when-issued securities | | | 651,750 | |
| |
Dividends — affiliated companies | | | 57,521 | |
| | | | |
Total investment income | | | 5,142,861 | |
|
| |
| |
Expenses | | | | |
Management fees | | | 752,983 | |
| |
Distribution and service plan fees — Service shares | | | 119,367 | |
| |
Transfer and shareholder servicing agent fees: | | | | |
Non-Service shares | | | 93,301 | |
Service shares | | | 57,296 | |
| |
Shareholder communications: | | | | |
Non-Service shares | | | 28,057 | |
Service shares | | | 17,327 | |
| |
Legal, auditing and other professional fees | | | 75,105 | |
| |
Custodian fees and expenses | | | 49,874 | |
| |
Trustees’ compensation | | | 11,496 | |
| |
Borrowing fees | | | 4,095 | |
| |
Other | | | 10,885 | |
| | | | |
Total expenses | | | 1,219,786 | |
Less reduction to custodian expenses | | | (282) | |
Less waivers and reimbursements of expenses | | | (154,813) | |
| | | | |
Net expenses | | | 1,064,691 | |
|
| |
Net Investment Income | | | 4,078,170 | |
|
| |
| |
Realized and Unrealized Gain (Loss) | | | | |
Net realized gain (loss) on: | | | | |
Investment transactions in unaffiliated companies | | | (2,201,938) | |
Futures contracts | | | (412,188) | |
Swap contracts | | | (3,068) | |
Swaption contracts written | | | 8,653 | |
| | | | |
Net realized loss | | | (2,608,541) | |
| |
Net change in unrealized appreciation/(depreciation) on: | | | | |
Investment transactions in unaffiliated companies | | | (3,316,860) | |
Futures contracts | | | 287,387 | |
| | | | |
Net change in unrealized appreciation/(depreciation) | | | (3,029,473) | |
|
| |
Net Decrease in Net Assets Resulting from Operations | | $ | (1,559,844) | |
| | | | |
See accompanying Notes to Financial Statements.
21 OPPENHEIMER TOTAL RETURN BOND FUND/VA
STATEMENTS OF CHANGES IN NET ASSETS
| | | | | | | | |
| | | Year Ended
December 31, 2018 | | | Year Ended
December 31, 20171 | |
| |
Operations | | | | | | | | |
Net investment income | | $ | 4,078,170 | | | $ | 3,104,326 | |
| |
Net realized gain (loss) | | | (2,608,541) | | | | 716,249 | |
| |
Net change in unrealized appreciation/(depreciation) | | | (3,029,473) | | | | 2,175,523 | |
| | | | |
Net increase (decrease) in net assets resulting from operations | | | (1,559,844) | | | | 5,996,098 | |
|
| |
Dividends and/or Distributions to Shareholders | | | | | | | | |
Dividends and distributions declared: | | | | | | | | |
Non-Service shares | | | (2,617,442) | | | | (2,024,420) | |
Service shares | | | (1,481,742) | | | | (1,136,931) | |
| | | | |
Total dividends and distributions declared | | | (4,099,184) | | | | (3,161,351) | |
|
| |
Beneficial Interest Transactions | | | | | | | | |
Net decrease in net assets resulting from beneficial interest transactions: | | | | | | | | |
Non-Service shares | | | (3,043,103) | | | | (3,666,983) | |
Service shares | | | (2,488,899) | | | | (3,411,210) | |
| | | | |
Total beneficial interest transactions | | | (5,532,002) | | | | (7,078,193) | |
|
| |
Net Assets | | | | | | | | |
Total decrease | | | (11,191,030) | | | | (4,243,446) | |
| |
Beginning of period | | | 132,511,437 | | | | 136,754,883 | |
| | | | |
End of period | | $ | 121,320,407 | | | $ | 132,511,437 | |
| | | | |
1. Prior period amounts have been conformed to current year presentation. See Notes to Financial Statements, Note 2– New Accounting Pronouncements for further details.
See accompanying Notes to Financial Statements.
22 OPPENHEIMER TOTAL RETURN BOND FUND/VA
FINANCIAL HIGHLIGHTS
| | | | | | | | | | | | | | | | | | | | |
| Non-Service Shares | | Year Ended
December 31,
2018 | | | Year Ended
December 31,
2017 | | | Year Ended
December 31,
2016 | | | Year Ended
December 31,
2015 | | | Year Ended
December 31,
2014 | |
Per Share Operating Data | | | | | | | | | | | | | | | | | | | | |
Net asset value, beginning of period | | | $7.83 | | | | $7.67 | | | | $7.71 | | | | $7.96 | | | | $7.83 | |
| |
Income (loss) from investment operations: | | | | | | | | | | | | | | | | | | | | |
Net investment income1 | | | 0.25 | | | | 0.19 | | | | 0.23 | | | | 0.27 | | | | 0.30 | |
Net realized and unrealized gain (loss) | | | (0.33) | | | | 0.16 | | | | 0.02 | | | | (0.19) | | | | 0.26 | |
| | | | |
Total from investment operations | | | (0.08) | | | | 0.35 | | | | 0.25 | | | | 0.08 | | | | 0.56 | |
| |
Dividends and/or distributions to shareholders: | | | | | | | | | | | | | | | | | | | | |
Dividends from net investment income | | | (0.26) | | | | (0.19) | | | | (0.29) | | | | (0.33) | | | | (0.43) | |
| |
Net asset value, end of period | | | $7.49 | | | | $7.83 | | | | $7.67 | | | | $7.71 | | | | $7.96 | |
| | | | |
|
| |
Total Return, at Net Asset Value2 | | | (1.02)% | | | | 4.59% | | | | 3.27% | | | | 0.96% | | | | 7.27% | |
|
| |
Ratios/Supplemental Data | | | | | | | | | | | | | | | | | | | | |
Net assets, end of period (in thousands) | | | $74,929 | | | | $81,481 | | | | $83,405 | | | | $85,160 | | | | $90,757 | |
| |
Average net assets (in thousands) | | | $77,723 | | | | $83,239 | | | | $87,039 | | | | $89,919 | | | | $94,336 | |
| |
Ratios to average net assets:3 | | | | | | | | | | | | | | | | | | | | |
Net investment income | | | 3.35% | | | | 2.38% | | | | 2.96% | | | | 3.46% | | | | 3.72% | |
Expenses excluding specific expenses listed below | | | 0.87% | | | | 0.85% | | | | 0.84% | | | | 0.82% | | | | 0.80% | |
Interest and fees from borrowings | | | 0.00%4 | | | | 0.00%4 | | | | 0.00%4 | | | | 0.00%4 | | | | 0.00% | |
| | | | |
Total expenses5 | | | 0.87% | | | | 0.85% | | | | 0.84% | | | | 0.82% | | | | 0.80% | |
Expenses after payments, waivers and/or reimbursements and reduction to custodian expenses | | | 0.75% | | | | 0.75% | | | | 0.75% | | | | 0.75% | | | | 0.75% | |
| |
Portfolio turnover rate6 | | | 64% | | | | 86% | | | | 79% | | | | 73% | | | | 127% | |
1. Per share amounts calculated based on the average shares outstanding during the period.
2. Assumes an initial investment on the business day before the first day of the fiscal period, with all dividends and distributions reinvested in additional shares on the reinvestment date, and redemption at the net asset value calculated on the last business day of the fiscal period. Total returns are not annualized for periods less than one full year. Total return information does not reflect expenses that apply at the separate account level or to related insurance products. Inclusion of these charges would reduce the total return figures for all periods shown. Returns do not reflect the deduction of taxes that a shareholder would pay on fund distributions or the redemption of fund shares.
3. Annualized for periods less than one full year.
4. Less than 0.005%.
5. Total expenses including indirect expenses from affiliated fund fees and expenses were as follows:
| | | | | | |
| | Year Ended December 31, 2018 | | | 0.87 | % |
| | Year Ended December 31, 2017 | | | 0.85 | % |
| | Year Ended December 31, 2016 | | | 0.85 | % |
| | Year Ended December 31, 2015 | | | 0.83 | % |
| | Year Ended December 31, 2014 | | | 0.81 | % |
6.The portfolio turnover rate excludes purchase and sale transactions of To Be Announced (TBA) mortgage-related securities as follows:
| | | | | | | | |
| | | Purchase Transactions | | | Sale Transactions | |
Year Ended December 31, 2018 | | | $641,318,699 | | | | $653,537,737 | |
Year Ended December 31, 2017 | | | $679,964,368 | | | | $662,714,451 | |
Year Ended December 31, 2016 | | | $672,031,328 | | | | $673,808,454 | |
Year Ended December 31, 2015 | | | $697,962,198 | | | | $709,720,690 | |
Year Ended December 31, 2014 | | | $560,409,975 | | | | $543,669,748 | |
See accompanying Notes to Financial Statements.
23 OPPENHEIMER TOTAL RETURN BOND FUND/VA
FINANCIAL HIGHLIGHTS Continued
| | | | | | | | | | | | | | | | | | | | | | | | |
| Service Shares | | Year Ended
December 31,
2018 | | | Year Ended
December 31,
2017 | | | | | | Year Ended
December 31,
2016 | | | Year Ended
December 31,
2015 | | | Year Ended
December 31,
2014 | |
Per Share Operating Data | | | | | | | | | | | | | | | | | | | | | | | | |
Net asset value, beginning of period | | | $7.73 | | | | $7.57 | | | | | | | | $7.61 | | | | $7.86 | | | | $7.74 | |
| |
Income (loss) from investment operations: | | | | | | | | | | | | | | | | | | | | | | | | |
Net investment income1 | | | 0.23 | | | | 0.16 | | | | | | | | 0.21 | | | | 0.25 | | | | 0.27 | |
Net realized and unrealized gain (loss) | | | (0.33) | | | | 0.17 | | | | | | | | 0.02 | | | | (0.19) | | | | 0.26 | |
| | | | |
Total from investment operations | | | (0.10) | | | | 0.33 | | | | | | | | 0.23 | | | | 0.06 | | | | 0.53 | |
| |
Dividends and/or distributions to shareholders: | | | | | | | | | | | | | | | | | | | | | | | | |
Dividends from net investment income | | | (0.24) | | | | (0.17) | | | | | | | | (0.27) | | | | (0.31) | | | | (0.41) | |
| |
Net asset value, end of period | | | $7.39 | | | | $7.73 | | | | | | | | $7.57 | | | | $7.61 | | | | $7.86 | |
| | | | |
|
| |
Total Return, at Net Asset Value2 | | | (1.31)% | | | | 4.38% | | | | | | | | 3.05% | | | | 0.70% | | | | 6.93% | |
|
| |
Ratios/Supplemental Data | | | | | | | | | | | | | | | | | | | | | | | | |
Net assets, end of period (in thousands) | | | $46,391 | | | | $51,030 | | | | | | | | $53,350 | | | | $52,519 | | | | $52,675 | |
| |
Average net assets (in thousands) | | | $47,731 | | | | $52,525 | | | | | | | | $52,738 | | | | $54,016 | | | | $55,215 | |
| |
Ratios to average net assets:3 | | | | | | | | | | | | | | | | | | | | | | | | |
Net investment income | | | 3.10% | | | | 2.13% | | | | | | | | 2.70% | | | | 3.21% | | | | 3.47% | |
Expenses excluding specific expenses listed below | | | 1.12% | | | | 1.10% | | | | | | | | 1.09% | | | | 1.07% | | | | 1.04% | |
Interest and fees from borrowings | | | 0.00%4 | | | | 0.00%4 | | | | | | | | 0.00%4 | | | | 0.00%4 | | | | 0.00% | |
| | | | |
Total expenses5 | | | 1.12% | | | | 1.10% | | | | | | | | 1.09% | | | | 1.07% | | | | 1.04% | |
Expenses after payments, waivers and/or reimbursements and reduction to custodian expenses | | | 1.00% | | | | 1.00% | | | | | | | | 1.00% | | | | 1.00% | | | | 1.00% | |
| |
Portfolio turnover rate6 | | | 64% | | | | 86% | | | | | | | | 79% | | | | 73% | | | | 127% | |
1. Per share amounts calculated based on the average shares outstanding during the period.
2. Assumes an initial investment on the business day before the first day of the fiscal period, with all dividends and distributions reinvested in additional shares on the reinvestment date, and redemption at the net asset value calculated on the last business day of the fiscal period. Total returns are not annualized for periods less than one full year. Total return information does not reflect expenses that apply at the separate account level or to related insurance products. Inclusion of these charges would reduce the total return figures for all periods shown. Returns do not reflect the deduction of taxes that a shareholder would pay on fund distributions or the redemption of fund shares.
3. Annualized for periods less than one full year.
4. Less than 0.005%.
5. Total expenses including indirect expenses from affiliated fund fees and expenses were as follows:
| | | | | | |
| | Year Ended December 31, 2018 | | | 1.12 | % |
| | Year Ended December 31, 2017 | | | 1.10 | % |
| | Year Ended December 31, 2016 | | | 1.10 | % |
| | Year Ended December 31, 2015 | | | 1.08 | % |
| | Year Ended December 31, 2014 | | | 1.05 | % |
6.The portfolio turnover rate excludes purchase and sale transactions of To Be Announced (TBA) mortgage-related securities as follows:
| | | | | | | | | | |
| | | | | Purchase Transactions | | | Sale Transactions | |
| | Year Ended December 31, 2018 | | | $641,318,699 | | | | $653,537,737 | |
| | Year Ended December 31, 2017 | | | $679,964,368 | | | | $662,714,451 | |
| | Year Ended December 31, 2016 | | | $672,031,328 | | | | $673,808,454 | |
| | Year Ended December 31, 2015 | | | $697,962,198 | | | | $709,720,690 | |
| | Year Ended December 31, 2014 | | | $560,409,975 | | | | $543,669,748 | |
See accompanying Notes to Financial Statements.
24 OPPENHEIMER TOTAL RETURN BOND FUND/VA
NOTES TO FINANCIAL STATEMENTSDecember 31, 2018
1. Organization
Oppenheimer Total Return Bond Fund/VA (the “Fund”), a separate series of Oppenheimer Variable Account Funds, is a diversifiedopen-end management investment company registered under the Investment Company Act of 1940 (“1940 Act”), as amended. The Fund’s main investment objective is to seek total return. The Fund’s investment adviser is OFI Global Asset Management, Inc. (“OFI Global” or the “Manager”), a wholly-owned subsidiary of OppenheimerFunds, Inc. (“OFI” or the“Sub-Adviser”). The Manager has entered into asub-advisory agreement with OFI.
Shares of the Fund are sold only to separate accounts of life insurance companies.
The Fund offers two classes of shares. Both classes are sold at their offering price, which is the net asset value per share, to separate investment accounts of participating insurance companies as an underlying investment for variable life insurance policies, variable annuity contracts or other investment products. The class of shares designated as Service shares is subject to a distribution and service plan. Both classes of shares have identical rights and voting privileges with respect to the Fund in general and exclusive voting rights on matters that affect that class alone. Earnings, net assets and net asset value per share may differ due to each class having its own expenses, such as transfer and shareholder servicing agent fees and shareholder communications, directly attributable to that class.
The following is a summary of significant accounting policies followed in the Fund’s preparation of financial statements in accordance with accounting principles generally accepted in the United States (“U.S. GAAP”).
2. Significant Accounting Policies
Security Valuation.All investments in securities are recorded at their estimated fair value, as described in Note 3.
Allocation of Income, Expenses, Gains and Losses.Income, expenses (other than those attributable to a specific class), gains and losses are allocated on a daily basis to each class of shares based upon the relative proportion of net assets represented by such class. Operating expenses directly attributable to a specific class are charged against the operations of that class.
Dividends and Distributions to Shareholders. Dividends and distributions to shareholders, which are determined in accordance with income tax regulations and may differ from U.S. GAAP, are recorded on theex-dividend date. Income and capital gain distributions, if any, are declared and paid annually or at other times as determined necessary by the Manager.
Investment Income.Dividend income is recorded on theex-dividend date or uponex-dividend notification in the case of certain foreign dividends where theex-dividend date may have passed.Non-cash dividends included in dividend income, if any, are recorded at the fair value of the securities received. Withholding taxes on foreign dividends, if any, and capital gains taxes on foreign investments, if any, have been provided for in accordance with the Fund’s understanding of the applicable tax rules and regulations. Interest income, if any, is recognized on an accrual basis. Discount and premium, which are included in interest income on the Statement of Operations, are amortized or accreted daily.
Custodian Fees. “Custodian fees and expenses” in the Statement of Operations may include interest expense incurred by the Fund on any cash overdrafts of its custodian account during the period. Such cash overdrafts may result from the effects of failed trades in portfolio securities and from cash outflows resulting from unanticipated shareholder redemption activity. The Fund pays interest to its custodian on such cash overdrafts, to the extent they are not offset by positive cash balances maintained by the Fund, at a rate equal to the Federal Funds Rate plus 2.00%. The “Reduction to custodian expenses” line item, if applicable, represents earnings on cash balances maintained by the Fund during the period. Such interest expense and other custodian fees may be paid with these earnings.
Security Transactions. Security transactions are recorded on the trade date. Realized gains and losses on securities sold are determined on the basis of identified cost.
Indemnifications.The Fund’s organizational documents provide current and former Trustees and officers with a limited indemnification against liabilities arising in connection with the performance of their duties to the Fund. In the normal course of business, the Fund may also enter into contracts that provide general indemnifications. The Fund’s maximum exposure under these arrangements is unknown as this would be dependent on future claims that may be made against the Fund. The risk of material loss from such claims is considered remote.
Federal Taxes.The Fund intends to comply with provisions of the Internal Revenue Code applicable to regulated investment companies and to distribute substantially all of its investment company taxable income, including any net realized gain on investments not offset by capital loss carryforwards, if any, to shareholders. Therefore, no federal income or excise tax provision is required. The Fund files income tax returns in U.S. federal and applicable state jurisdictions. The statute of limitations on the Fund’s tax return filings generally remains open for the three preceding fiscal reporting period ends. The Fund has analyzed its tax positions for the fiscal year ended December 31, 2018, including open tax years, and does not believe there are any uncertain tax positions requiring recognition in the Fund’s financial statements.
The tax components of capital shown in the following table represent distribution requirements the Fund must satisfy under the income tax regulations, losses the Fund may be able to offset against income and gains realized in future years and unrealized appreciation or depreciation of securities and other investments for federal income tax purposes.
25 OPPENHEIMER TOTAL RETURN BOND FUND/VA
NOTES TO FINANCIAL STATEMENTSContinued
2. Significant Accounting Policies (Continued)
| | | | | | | | | | | | |
Undistributed Net Investment Income | | Undistributed Long-Term Gain | | | Accumulated Loss Carryforward1,2 | | | Net Unrealized Depreciation Based on cost of Securities and Other Investments for Federal Income Tax Purposes | |
$4,124,124 | | | $— | | | | $6,272,272 | | | | $2,399,615 | |
1. During the reporting period, the Fund did not utilize any capital loss carryforward.
2.During the previous reporting period, the Fund did not utilize any capital loss carryforward.
Net investment income (loss) and net realized gain (loss) may differ for financial statement and tax purposes. The character of dividends and distributions made during the fiscal year from net investment income or net realized gains are determined in accordance with federal income tax requirements, which may differ from the character of net investment income or net realized gains presented in those financial statements in accordance with U.S. GAAP. Also, due to timing of dividends and distributions, the fiscal year in which amounts are distributed may differ from the fiscal year in which the income or net realized gain was recorded by the Fund.
Accordingly, the following amounts have been reclassified for the reporting period. Net assets of the Fund were unaffected by the reclassifications.
| | |
Increase toPaid-in Capital | | Increase to Accumulated Net Loss |
$719 | | $719 |
The tax character of distributions paid during the reporting periods:
| | | | | | | | |
| | | Year Ended
December 31, 2018 | | | Year Ended
December 31, 2017 | |
Distributions paid from: | | | | | | | | |
Ordinary income | | $ | 4,099,184 | | | $ | 3,161,351 | |
The aggregate cost of securities and other investments and the composition of unrealized appreciation and depreciation of securities and other investments for federal income tax purposes at period end are noted in the following table. The primary difference between book and tax appreciation or depreciation of securities and other investments, if applicable, is attributable to the tax deferral of losses or tax realization of financial statement unrealized gain or loss.
| | | | |
Federal tax cost of securities | | $ | 161,458,720 | |
Federal tax cost of other investments | | | (5,451,249) | |
| | | | |
Total federal tax cost | | $ | 156,007,471 | |
| | | | |
Gross unrealized appreciation | | $ | 1,568,588 | |
Gross unrealized depreciation | | | (3,968,203) | |
| | | | |
Net unrealized depreciation | | $ | (2,399,615) | |
| | | | |
Use of Estimates. The preparation of financial statements in conformity with U.S. GAAP requires management to make estimates and assumptions that affect the reported amounts of assets and liabilities and disclosure of contingent assets and liabilities at the date of the financial statements and the reported amounts of increases and decreases in net assets from operations during the reporting period. Actual results could differ from those estimates.
New Accounting Pronouncements. In March 2017, Financial Accounting Standards Board (“FASB”) issued Accounting Standards Update (“ASU”), ASU2017-08. This provides guidance related to the amortization period for certain purchased callable debt securities held at a premium. The ASU is effective for annual periods beginning after December 15, 2018, and interim periods within those annual periods. The Manager has evaluated the impacts of these changes on the financial statements and there are no material impacts.
During August 2018, the Securities and Exchange Commission (the “SEC”) issued Final Rule ReleaseNo. 33-10532 (the “Rule”), Disclosure Update and Simplification. The rule amends certain financial statement disclosure requirements to conform to U.S. GAAP. The amendments to Rule6-04.17 of RegulationS-X (balance sheet) remove the requirement to separately state the book basis components of net assets: undistributed (over-distribution of) net investment income (“UNII”), accumulated undistributed net realized gains (losses), and net unrealized appreciation (depreciation) at the balance sheet date. Instead, consistent with U.S. GAAP, funds will be required to disclose total distributable earnings. The amendments to Rule6-09 of RegulationS-X (statement of changes in net assets) remove the requirement to separately state the sources of distributions paid. Instead, consistent with U.S. GAAP, funds will be required to disclose the total amount of distributions paid, except that any tax return of capital must be separately disclosed. The amendments also remove the requirement to parenthetically state the book basis amount of UNII on the statement of changes in net assets. The requirements of the Rule are effective November 5, 2018, and the Funds’ Statement of Assets and Liabilities and Statement of Changes in Net Assets for the current reporting period have been modified accordingly. In addition, certain amounts within each Fund’s Statement of Changes in Net Assets for the prior fiscal period have been modified to conform to the Rule.
26 OPPENHEIMER TOTAL RETURN BOND FUND/VA
3. Securities Valuation
The Fund calculates the net asset value of its shares as of 4:00 P.M. Eastern Time, on each day the New York Stock Exchange (the “Exchange” or “NYSE”) is open for trading, except in the case of a scheduled early closing of the Exchange, in which case the Fund will calculate net asset value of the shares as of the scheduled early closing time of the Exchange.
The Fund’s Board has adopted procedures for the valuation of the Fund’s securities and has delegated theday-to-day responsibility for valuation determinations under those procedures to the Manager. The Manager has established a Valuation Committee which is responsible for determining a fair valuation for any security for which market quotations are not readily available. The Valuation Committee’s fair valuation determinations are subject to review, approval and ratification by the Fund’s Board at least quarterly or more frequently, if necessary.
Valuation Methods and Inputs
Securities are valued primarily using unadjusted quoted market prices, when available, as supplied by third party pricing services or broker-dealers.
The following methodologies are used to determine the market value or the fair value of the types of securities described below:
Shares of a registered investment company that are not traded on an exchange are valued at that investment company’s net asset value per share.
Corporate and government debt securities (of U.S. or foreign issuers) and municipal debt securities, short-term notes, mortgage-backed securities, collateralized mortgage obligations, and asset-backed securities are valued at the mean between the bid and asked prices utilizing evaluated prices obtained from third party pricing services or broker-dealers who may use matrix pricing methods to determine the evaluated prices. Pricing services generally price debt securities assuming orderly transactions of an institutional “round lot” size, but some trades may occur in smaller, “odd lot” sizes, sometimes at lower prices than institutional round lot trades. Standard inputs generally considered by third-party pricing vendors include reported trade data, broker-dealer price quotations, benchmark yields, issuer spreads on comparable securities, the credit quality, yield, maturity, as well as other appropriate factors.
Futures contracts and futures options traded on a commodities or futures exchange will be valued at the final settlement price or official closing price on the principal exchange as reported by such principal exchange at its trading session ending at, or most recently prior to, the time when the Fund’s assets are valued.
Securities for which market quotations are not readily available, or when a significant event has occurred that would materially affect the value of the security, are fair valued either (i) by a standardized fair valuation methodology applicable to the security type or the significant event as previously approved by the Valuation Committee and the Fund’s Board or (ii) as determined in good faith by the Manager’s Valuation Committee. The Valuation Committee considers all relevant facts that are reasonably available, through either public information or information available to the Manager, when determining the fair value of a security. Those standardized fair valuation methodologies include, but are not limited to, valuing securities at the last sale price or initially at cost and subsequently adjusting the value based on: changes in company specific fundamentals, changes in an appropriate securities index, or changes in the value of similar securities which may be further adjusted for any discounts related to security-specific resale restrictions. When possible, such methodologies use observable market inputs such as unadjusted quoted prices of similar securities, observable interest rates, currency rates and yield curves. The methodologies used for valuing securities are not necessarily an indication of the risks associated with investing in those securities nor can it be assured that the Fund can obtain the fair value assigned to a security if it were to sell the security.
To assess the continuing appropriateness of security valuations, the Manager regularly compares prior day prices and sale prices to the current day prices and challenges those prices exceeding certain tolerance levels with the third party pricing service or broker source. For those securities valued by fair valuations, whether through a standardized fair valuation methodology or a fair valuation determination, the Valuation Committee reviews and affirms the reasonableness of the valuations based on such methodologies and fair valuation determinations on a regular basis after considering all relevant information that is reasonably available.
Classifications
Each investment asset or liability of the Fund is assigned a level at measurement date based on the significance and source of the inputs to its valuation. Various data inputs may be used in determining the value of each of the Fund’s investments as of the reporting period end. These data inputs are categorized in the following hierarchy under applicable financial accounting standards:
1) Level1-unadjusted quoted prices in active markets for identical assets or liabilities (including securities actively traded on a securities exchange)
2) Level2-inputs other than unadjusted quoted prices that are observable for the asset or liability (such as unadjusted quoted prices for similar assets and market corroborated inputs such as interest rates, prepayment speeds, credit risks, etc.)
3) Level3-significant unobservable inputs (including the Manager’s own judgments about assumptions that market participants would use in pricing the asset or liability).
The inputs used for valuing securities are not necessarily an indication of the risks associated with investing in those securities.
The Fund classifies each of its investments in investment companies which are publicly offered as Level 1. Investment companies that are not publicly offered, if any, are classified as Level 2 in the fair value hierarchy.
The table below categorizes amounts that are included in the Fund’s Statement of Assets and Liabilities at period end based on valuation input level:
27 OPPENHEIMER TOTAL RETURN BOND FUND/VA
NOTES TO FINANCIAL STATEMENTSContinued
3. Securities Valuation (Continued)
| | | | | | | | | | | | | | | | |
| | | Level 1— Unadjusted Quoted Prices | | | Level 2—
Other Significant
Observable Inputs | | | Level 3—
Significant
Unobservable
Inputs | | | Value | |
Assets Table | | | | | | | | | | | | | | | | |
Investments, at Value: | | | | | | | | | | | | | | | | |
Asset-Backed Securities | | $ | — | | | $ | 23,234,819 | | | $ | — | | | $ | 23,234,819 | |
Mortgage-Backed Obligations | | | — | | | | 62,178,478 | | | | 22,455 | | | | 62,200,933 | |
U.S. Government Obligation | | | — | | | | 192,224 | | | | — | | | | 192,224 | |
Corporate Bonds and Notes | | | — | | | | 61,337,648 | | | | — | | | | 61,337,648 | |
Short-Term Notes | | | — | | | | 10,252,639 | | | | — | | | | 10,252,639 | |
Investment Company | | | 1,840,843 | | | | — | | | | — | | | | 1,840,843 | |
| | | | |
Total Investments, at Value | | | 1,840,843 | | | | 157,195,808 | | | | 22,455 | | | | 159,059,106 | |
Other Financial Instruments: | | | | | | | | | | | | | | | | |
Futures contracts | | | 527,154 | | | | — | | | | — | | | | 527,154 | |
| | | | |
Total Assets | | $ | 2,367,997 | | | $ | 157,195,808 | | | $ | 22,455 | | | $ | 159,586,260 | |
| | | | |
Liabilities Table | | | | | | | | | | | | | | | | |
Other Financial Instruments: | | | | | | | | | | | | | | | | |
Futures contracts | | $ | (120,306) | | | $ | — | | | $ | — | | | $ | (120,306) | |
| | | | |
Total Liabilities | | $ | (120,306) | | | $ | — | | | $ | — | | | $ | (120,306) | |
| | | | |
Forward currency exchange contracts and futures contracts, if any, are reported at their unrealized appreciation/depreciation at measurement date, which represents the change in the contract’s value from trade date. All additional assets and liabilities included in the above table are reported at their market value at measurement date.
The table below shows the transfers between Level 2 and Level 3. The Fund’s policy is to recognize transfers in and transfers out as of the beginning of the reporting period.
| | | | | | | | |
| | | Transfers into Level 2* | | | Transfers out of Level 3* | |
Assets Table | | | | | | | | |
Investments, at Value: | | | | | | | | |
Mortgage-Backed | | | | | | | | |
Obligations | | $ | 125,414 | | | $ | (125,414) | |
| | | | |
Total Assets | | $ | 125,414 | | | $ | (125,414) | |
| | | | |
*Transferred from Level 3 to Level 2 due to the availability of market data for this security.
4. Investments and Risks
Investments in Affiliated Funds. The Fund is permitted to invest in other mutual funds advised by the Manager (“Affiliated Funds”). Affiliated Funds are management investment companies registered under the 1940 Act, as amended. The Manager is the investment adviser of, and theSub-Adviser provides investment and related advisory services to, the Affiliated Funds. When applicable, the Fund’s investments in Affiliated Funds are included in the Statement of Investments. Shares of Affiliated Funds are valued at their net asset value per share. As a shareholder, the Fund is subject to its proportional share of the Affiliated Funds’ expenses, including their management fee. The Manager will waive fees and/or reimburse Fund expenses in an amount equal to the indirect management fees incurred through the Fund’s investment in the Affiliated Funds.
Each of the Affiliated Funds in which the Fund invests has its own investment risks, and those risks can affect the value of the Fund’s investments and therefore the value of the Fund’s shares. To the extent that the Fund invests more of its assets in one Affiliated Fund than in another, the Fund will have greater exposure to the risks of that Affiliated Fund.
Investments in Money Market Instruments.The Fund is permitted to invest its free cash balances in money market instruments to provide liquidity or for defensive purposes. The Fund may invest in money market instruments by investing in Class E shares of Oppenheimer Institutional Government Money Market Fund (“IGMMF”), which is an Affiliated Fund. IGMMF is regulated as a money market fund under the 1940 Act, as amended. The Fund may also invest in money market instruments directly or in other affiliated or unaffiliated money market funds.
Securities on a When-Issued or Delayed Delivery Basis.The Fund may purchase securities on a “when-issued” basis, and may purchase or sell securities on a “delayed delivery” basis. “When-issued” or “delayed delivery” refers to securities whose terms and indenture are available and for which a market exists, but which are not available for immediate delivery. Delivery and payment for securities that have been purchased by the Fund on a when-issued basis normally takes place within six months and possibly as long as two years or more after the trade date. During this period, such securities do not earn interest, are subject to market fluctuation and may increase or decrease in value prior to their delivery. The purchase of securities on a when-issued basis may increase the volatility of the Fund’s net asset value to the extent the Fund executes such transactions while remaining substantially fully invested. When the Fund engages in when-issued or delayed delivery transactions, it relies on the buyer or seller, as the case may be, to complete the transaction. Their failure to do so may cause the Fund to lose the opportunity to obtain or dispose of the security at a price and yield it
28 OPPENHEIMER TOTAL RETURN BOND FUND/VA
4. Investments and Risks (Continued)
considers advantageous. The Fund may also sell securities that it purchased on a when-issued basis or forward commitment prior to settlement of the original purchase.
At period end, the Fund had purchased securities issued on a when-issued or delayed delivery basis and sold securities issued on a delayed delivery basis as follows:
| | | | |
| | | When-Issued or
Delayed Delivery
Basis Transactions | |
Purchased securities | | $ | 52,194,245 | |
Sold securities | | | 14,465,989 | |
The Fund may enter into “forward roll” transactions with respect to mortgage-related securities. In this type of transaction, the Fund sells a mortgage-related security to a buyer and simultaneously agrees to repurchase a similar security (same type, coupon and maturity) at a later date at a set price. During the period between the sale and the repurchase, the Fund will not be entitled to receive interest and principal payments on the securities that have been sold. The Fund records the incremental difference between the forward purchase and sale of each forward roll as realized gain (loss) on investments or as fee income in the case of such transactions that have an associated fee in lieu of a difference in the forward purchase and sale price.
Forward roll transactions may be deemed to entail embedded leverage since the Fund purchases mortgage-related securities with extended settlement dates rather than paying for the securities under a normal settlement cycle. This embedded leverage increases the Fund’s market value of investments relative to its net assets which can incrementally increase the volatility of the Fund’s performance. Forward roll transactions can be replicated over multiple settlement periods.
Risks of entering into forward roll transactions include the potential inability of the counterparty to meet the terms of the agreement; the potential of the Fund to receive inferior securities at redelivery as compared to the securities sold to the counterparty; and counterparty credit risk.
At period end, the Fund pledged $22,907 of collateral to the counterparty for forward roll transactions.
Restricted Securities.At period end, investments in securities included issues that are restricted. A restricted security may have a contractual restriction on its resale and is valued under methods approved by the Board of Trustees as reflecting fair value. Securities that are restricted are marked with an applicable footnote on the Statement of Investments. Restricted securities are reported on a schedule following the Statement of Investments.
Shareholder Concentration.At period end, two shareholders each owned 20% or more of the Fund’s total outstanding shares.
5. Market Risk Factors
The Fund’s investments in securities and/or financial derivatives may expose the Fund to various market risk factors:
Commodity Risk. Commodity risk relates to the change in value of commodities or commodity indexes as they relate to increases or decreases in the commodities market. Commodities are physical assets that have tangible properties. Examples of these types of assets are crude oil, heating oil, metals, livestock, and agricultural products.
Credit Risk.Credit risk relates to the ability of the issuer of debt to meet interest and principal payments, or both, as they come due. In general, lower-grade, higher-yield debt securities are subject to credit risk to a greater extent than lower-yield, higher-quality securities.
Equity Risk. Equity risk relates to the change in value of equity securities as they relate to increases or decreases in the general market.
Foreign Exchange Rate Risk. Foreign exchange rate risk relates to the change in the U.S. dollar value of a security held that is denominated in a foreign currency. The U.S. dollar value of a foreign currency denominated security will decrease as the dollar appreciates against the currency, while the U.S. dollar value will increase as the dollar depreciates against the currency.
Interest Rate Risk.Interest rate risk refers to the fluctuations in value of fixed-income securities resulting from the inverse relationship between price and yield. For example, an increase in general interest rates will tend to reduce the market value of already issued fixed-income investments, and a decline in general interest rates will tend to increase their value. In addition, debt securities with longer maturities, which tend to have higher yields, are subject to potentially greater fluctuations in value from changes in interest rates than obligations with shorter maturities.
Volatility Risk.Volatility risk refers to the magnitude of the movement, but not the direction of the movement, in a financial instrument’s price over a defined time period. Large increases or decreases in a financial instrument’s price over a relative time period typically indicate greater volatility risk, while small increases or decreases in its price typically indicate lower volatility risk.
6. Use of Derivatives
The Fund’s investment objective not only permits the Fund to purchase investment securities, it also allows the Fund to enter into various types of derivatives contracts, including, but not limited to, futures contracts, forward currency exchange contracts, credit default swaps, interest rate swaps, total return swaps, variance swaps and purchased and written options. In doing so, the Fund will employ strategies in differing combinations to permit it to increase, decrease, or change the level or types of exposure to market risk factors. These instruments may allow the Fund to pursue its objectives more quickly and efficiently than if it were to make direct purchases or sales of securities capable of effecting a similar response to market factors. Such contracts may be entered into through a bilateralover-the-counter (“OTC”) transaction, or through a securities or futures exchange and cleared through a clearinghouse.
29 OPPENHEIMER TOTAL RETURN BOND FUND/VA
NOTES TO FINANCIAL STATEMENTS Continued
6. Use of Derivatives (Continued)
Derivatives may have little or no initial cash investment relative to their market value exposure and therefore can produce significant gains or losses in excess of their cost due to changes in the market risk factors and the overall market. This use of embedded leverage allows the Fund to increase its market value exposure relative to its net assets and can substantially increase the volatility of the Fund’s performance. In instances where the Fund is using derivatives to decrease, or hedge, exposures to market risk factors for securities held by the Fund, there are also risks that those derivatives may not perform as expected resulting in losses for the combined or hedged positions. Some derivatives have the potential for unlimited loss, regardless of the size of the Fund’s initial investment.
Additional associated risks from investing in derivatives also exist and potentially could have significant effects on the valuation of the derivative and the Fund. Typically, the associated risks are not the risks that the Fund is attempting to increase or decrease exposure to, per its investment objectives, but are the additional risks from investing in derivatives. Examples of these associated risks are liquidity risk, which is the risk that the Fund will not be able to sell the derivative in the open market in a timely manner, and counterparty credit risk, which is the risk that the counterparty will not fulfill its obligation to the Fund.
The Fund’s actual exposures to these market risk factors and associated risks during the period are discussed in further detail, by derivative type, below.
Futures Contracts
A futures contract is a commitment to buy or sell a specific amount of a commodity, financial instrument or currency at a negotiated price on a stipulated future date. The Fund may buy and sell futures contracts and may also buy or write put or call options on these futures contracts. Futures contracts and options thereon are generally entered into on a regulated futures exchange and cleared through a clearinghouse associated with the exchange.
Upon entering into a futures contract, the Fund is required to deposit either cash or securities (initial margin) in an amount equal to a certain percentage of the contract value in an account registered in the futures commission merchant’s name. Subsequent payments (variation margin) are paid to or from the futures commission merchant each day equal to the daily changes in the contract value. Such payments are recorded as unrealized gains and losses. Should the Fund fail to make requested variation margin payments, the futures commission merchant can gain access to the initial margin to satisfy the Fund’s payment obligations.
Futures contracts are reported on a schedule following the Statement of Investments. Securities held by a futures commission merchant to cover initial margin requirements on open futures contracts are noted in the Statement of Investments. Cash held by a futures commission merchant to cover initial margin requirements on open futures contracts and the receivable and/or payable for the daily mark to market for the variation margin are noted in the Statement of Assets and Liabilities. The net change in unrealized appreciation and depreciation is reported in the Statement of Operations. Realized gains (losses) are reported in the Statement of Operations at the closing or expiration of futures contracts.
The Fund may purchase and/or sell financial futures contracts and options on futures contracts to gain exposure to, or decrease exposure to interest rate risk, equity risk, foreign exchange rate risk, volatility risk, or commodity risk.
During the reporting period, the Fund had an ending monthly average market value of $9,085,868 and $52,724,554 on futures contracts purchased and sold, respectively.
Additional associated risks of entering into futures contracts (and related options) include the possibility that there may be an illiquid market where the Fund is unable to liquidate the contract or enter into an offsetting position and, if used for hedging purposes, the risk that the price of the contract will correlate imperfectly with the prices of the Fund’s securities.
Swap Contracts
The Fund may enter into swap contract agreements with a counterparty to exchange a series of cash flows based on either specified reference rates, the price or volatility of asset ornon-asset references, or the occurrence of a credit event, over a specified period. Swaps can be executed in abi-lateral privately negotiated arrangement with a dealer in an OTC transaction (“OTC swaps”) or executed on a regulated market. Certain swaps, regardless of the venue of their execution, are required to be cleared through a clearinghouse (“centrally cleared swaps”). Swap contracts may include interest rate, equity, debt, index, total return, credit default, currency, and volatility swaps.
Swap contracts are reported on a schedule following the Statement of Investments. The values of centrally cleared swap and OTC swap contracts are aggregated by positive and negative values and disclosed separately on the Statement of Assets and Liabilities. The unrealized appreciation (depreciation) related to the change in the valuation of the notional amount of the swap is combined with the accrued interest due to (owed by) the Fund, if any, at termination or settlement. The net change in this amount during the period is included on the Statement of Operations. The Fund also records any periodic payments received from (paid to) the counterparty, including at termination, under such contracts as realized gain (loss) on the Statement of Operations.
Swap contract agreements are exposed to the market risk factor of the specific underlying reference rate or asset. Swap contracts are typically more attractively priced compared to similar investments in related cash securities because they isolate the risk to one market risk factor and eliminate the other market risk factors. Investments in cash securities (for instance bonds) have exposure to multiple risk factors (credit and interest rate risk). Because swaps have embedded leverage, they can expose the Fund to substantial risk in the isolated market risk factor.
Credit Default Swap Contracts.A credit default swap is a contract that enables an investor to buy or sell protection against a defined-issuer credit event, such as the issuer’s failure to make timely payments of interest or principal on a debt security, bankruptcy or restructuring. The Fund may enter into credit default swaps either by buying or selling protection on a corporate issuer, sovereign issuer, or a basket or index of issuers (the “reference asset”).
The buyer of protection pays a periodic fee to the seller of protection based on the notional amount of the swap contract.
The seller of protection
30 OPPENHEIMER TOTAL RETURN BOND FUND/VA
6. Use of Derivatives (Continued)
agrees to compensate the buyer of protection for future potential losses as a result of a credit event on the reference asset. The contract effectively transfers the credit event risk of the reference asset from the buyer of protection to the seller of protection.
The ongoing value of the contract will fluctuate throughout the term of the contract based primarily on the credit risk of the reference asset. If the credit quality of the reference asset improves relative to the credit quality at contract initiation, the buyer of protection may have an unrealized loss greater than the anticipated periodic fee owed. This unrealized loss would be the result of current credit protection being cheaper than the cost of credit protection at contract initiation. If the buyer elects to terminate the contract prior to its maturity, and there has been no credit event, this unrealized loss will become realized. If the contract is held to maturity, and there has been no credit event, the realized loss will be equal to the periodic fee paid over the life of the contract.
If there is a credit event, the buyer of protection can exercise its rights under the contract and receive a payment from the seller of protection equal to the notional amount of the swap less the market value of specified debt securities issued by the reference asset. Upon exercise of the contract the difference between such value and the notional amount is recorded as realized gain (loss) and is included on the Statement of Operations.
The Fund may purchase or sell credit protection through credit default swaps to increase or decrease exposure to the credit risk of individual issuers and/or indexes of issuers that are either unavailable or considered to be less attractive in the bond market.
For the reporting period, the Fund had ending monthly average notional amounts of $45,769 on credit default swaps to sell protection.
Additional associated risks to the Fund include counterparty credit risk and liquidity risk.
At period end, the Fund had no credit default swap agreements outstanding.
Swaption Transactions
The Fund may enter into a swaption contract which grants the purchaser the right, but not the obligation, to enter into a swap transaction at preset terms detailed in the underlying agreement within a specified period of time. The purchaser pays a premium to the swaption writer who bears the risk of unfavorable changes in the preset terms on the underlying swap.
Purchased swaptions are reported as a component of investments in the Statement of Investments and the Statement of Assets and Liabilities. Written swaptions are reported on a schedule following the Statement of Investments and their value is reported as a separate asset or liability line item in the Statement of Assets and Liabilities. The net change in unrealized appreciation or depreciation on written swaptions is separately reported in the Statement of Operations. When a swaption is exercised, the cost of the swap is adjusted by the amount of premium paid or received. Upon the expiration or closing of an unexercised swaption contract, a gain or loss is reported in the Statement of Operations for the amount of the premium paid or received.
The Fund generally will incur a greater risk when it writes a swaption than when it purchases a swaption. When the Fund writes a swaption it will become obligated, upon exercise of the swaption, according to the terms of the underlying agreement. Swaption contracts written by the Fund do not give rise to counterparty credit risk prior to exercise as they obligate the Fund, not its counterparty, to perform. When the Fund purchases a swaption it only risks losing the amount of the premium it paid if the swaption expires unexercised. However, when the Fund exercises a purchased swaption there is a risk that the counterparty will fail to perform or otherwise default on its obligations under the swaption contract.
The Fund may purchase swaptions which give it the option to enter into an interest rate swap in which it pays a floating or fixed interest rate and receives a fixed or floating interest rate in order to increase or decrease exposure to interest rate risk. Purchasing the fixed portion of this swaption becomes more valuable as the reference interest rate decreases relative to the preset interest rate. Purchasing the floating portion of this swaption becomes more valuable as the reference interest rate increases relative to the preset interest rate.
The Fund may purchase swaptions which give it the option to buy or sell credit protection through credit default swaps in order to decrease or increase exposure to the credit risk of individual issuers and/ or indexes of issuers. A swaption selling protection becomes more valuable as the likelihood of a credit event on the reference asset decreases. A swaption buying protection becomes more valuable as the likelihood of a credit event on the reference asset increases.
At period end, the Fund had no purchased swaption contracts outstanding.
The Fund may write swaptions which give it the obligation, if exercised by the purchaser, to enter into an interest rate swap in which it pays a fixed or floating interest rate and receives a floating or fixed interest rate in order to increase or decrease exposure to interest rate risk. A written swaption paying a fixed rate becomes more valuable as the reference interest rate increases relative to the preset interest rate. A written swaption paying a floating rate becomes more valuable as the reference interest rate decreases relative to the preset interest rate.
The Fund may write swaptions which give it the obligation, if exercised by the purchaser, to sell or buy credit protection through credit default swaps in order to increase or decrease exposure to the credit risk of individual issuers and/or indexes of issuers. A written swaption selling protection becomes more valuable as the likelihood of a credit event on the reference asset decreases. A written swaption buying protection becomes more valuable as the likelihood of a credit event on the reference asset increases.
The Fund may enter into currency swaption contracts with the obligation to pay an interest rate on the US dollar notional amount or various foreign currency notional amounts and receive an interest rate on various foreign currency notional amounts or US dollar notional amounts, with an option to replace the contractual currency as disclosed in the Statement of Investments. This is done in order to take a positive investment perspective on the related currencies for which the Fund receives a payment. The US dollar swaption contracts seek to increase exposure to foreign exchange rate risk. The foreign currency swaption contracts seek to decrease exposure to foreign exchange rate risk.
During the reporting period, the Fund had an ending monthly average market value of $1,136 and $511 on purchased and written swaptions, respectively.
At period end, the Fund had no written swaption contracts outstanding.
Counterparty Credit Risk.Derivative positions are subject to the risk that the counterparty will not fulfill its obligation to the Fund. The Fund intends
31 OPPENHEIMER TOTAL RETURN BOND FUND/VA
NOTES TO FINANCIAL STATEMENTSContinued
6. Use of Derivatives (Continued)
to enter into derivative transactions with counterparties that the Manager believes to be creditworthy at the time of the transaction.
The Fund’s risk of loss from counterparty credit risk on OTC derivatives is generally limited to the aggregate unrealized gain netted against any collateral held by the Fund. For OTC options purchased, the Fund bears the risk of loss of the amount of the premiums paid plus the positive change in market values net of any collateral held by the Fund should the counterparty fail to perform under the contracts. Options written by the Fund do not typically give rise to counterparty credit risk, as options written generally obligate the Fund and not the counterparty to perform.
To reduce counterparty risk with respect to OTC transactions, the Fund has entered into master netting arrangements, established within the Fund’s International Swap and Derivatives Association, Inc. (“ISDA”) master agreements, which allow the Fund to make (or to have an entitlement to receive) a single net payment in the event of default(close-out netting) for outstanding payables and receivables with respect to certain OTC positions in swaps, options, swaptions, and forward currency exchange contracts for each individual counterparty. In addition, the Fund may require that certain counterparties post cash and/or securities in collateral accounts to cover their net payment obligations for those derivative contracts subject to ISDA master agreements. If the counterparty fails to perform under these contracts and agreements, the cash and/or securities will be made available to the Fund.
ISDA master agreements include credit related contingent features which allow counterparties to OTC derivatives to terminate derivative contracts prior to maturity in the event that, for example, the Fund’s net assets decline by a stated percentage or the Fund fails to meet the terms of its ISDA master agreements, which would cause the Fund to accelerate payment of any net liability owed to the counterparty.
For financial reporting purposes, the Fund does not offset derivative assets and derivative liabilities that are subject to netting arrangements in the Statement of Assets and Liabilities. Bankruptcy or insolvency laws of a particular jurisdiction may impose restrictions on or prohibitions against the right of offset in bankruptcy, insolvency or other events.
The Fund’s risk of loss from counterparty credit risk on exchange-traded derivatives cleared through a clearinghouse and for centrally cleared swaps is generally considered lower than as compared to OTC derivatives. However, counterparty credit risk exists with respect to initial and variation margin deposited/paid by the Fund that is held in futures commission merchant, broker and/or clearinghouse accounts for such exchange-traded derivatives and for centrally cleared swaps.
With respect to centrally cleared swaps, such transactions will be submitted for clearing, and if cleared, will be held in accounts at futures commission merchants or brokers that are members of clearinghouses. While brokers, futures commission merchants and clearinghouses are required to segregate customer margin from their own assets, in the event that a broker, futures commission merchant or clearinghouse becomes insolvent or goes into bankruptcy and at that time there is a shortfall in the aggregate amount of margin held by the broker, futures commission merchant or clearinghouse for all its customers, U.S. bankruptcy laws will typically allocate that shortfall on apro-rata basis across all the broker’s, futures commission merchant’s or clearinghouse’s customers, potentially resulting in losses to the Fund.
There is the risk that a broker, futures commission merchant or clearinghouse will decline to clear a transaction on the Fund’s behalf, and the Fund may be required to pay a termination fee to the executing broker with whom the Fund initially enters into the transaction. Clearinghouses may also be permitted to terminate centrally cleared swaps at any time. The Fund is also subject to the risk that the broker or futures commission merchant will improperly use the Fund’s assets deposited/paid as initial or variation margin to satisfy payment obligations of another customer. In the event of a default by another customer of the broker or futures commission merchant, the Fund might not receive its variation margin payments from the clearinghouse, due to the manner in which variation margin payments are aggregated for all customers of the broker/futures commission merchant.
Collateral and margin requirements differ by type of derivative. Margin requirements are established by the broker, futures commission merchant or clearinghouse for exchange-traded and cleared derivatives, including centrally cleared swaps. Brokers, futures commission merchants and clearinghouses can ask for margin in excess of the regulatory minimum, or increase the margin amount, in certain circumstances.
Collateral terms are contract specific for OTC derivatives. For derivatives traded under an ISDA master agreement, the collateral requirements are typically calculated by netting the mark to market amount for each transaction under such agreement and comparing that amount to the value of any collateral currently pledged by the Fund or the counterparty.
For financial reporting purposes, cash collateral that has been pledged to cover obligations of the Fund, if any, is reported separately on the Statement of Assets and Liabilities as cash pledged as collateral.Non-cash collateral pledged by the Fund, if any, is noted in the Statement of Investments. Generally, the amount of collateral due from or to a party must exceed a minimum transfer amount threshold (e.g. $250,000) before a transfer has to be made. To the extent amounts due to the Fund from its counterparties are not fully collateralized, contractually or otherwise, the Fund bears the risk of loss from counterparty nonperformance.
The following table presents the valuations of derivative instruments by risk exposure as reported within the Statement of Assets and Liabilities at period end:
| | | | | | | | | | | | | | |
| | | Asset Derivatives | | | Liability Derivatives | |
Derivatives Not Accounted for as Hedging Instruments | | Statement of Assets and Liabilities Location | | Value | | | Statement of Assets
and Liabilities Location | | | Value | |
Interest rate contracts Variation margin receivable | | $ | 37,530 | * | | | Variation margin payable | | | | 22,594 | * |
*Includes only the current day’s variation margin. Prior variation margin movements have been reflected in cash on the Statement of Assets and Liabilities upon receipt or payment.
The effect of derivative instruments on the Statement of Operations is as follows:
32 OPPENHEIMER TOTAL RETURN BOND FUND/VA
6. Use of Derivatives (Continued)
| | | | | | | | | | | | | | | | | | | | |
| Amount of Realized Gain or (Loss) Recognized on Derivatives | |
Derivatives Not Accounted for as Hedging Instruments | | Investment
transactions
in unaffiliated
companies* | | | Swaption
contracts
written | | | Futures
contracts | | | Swap contracts | | | Total | |
Credit contracts | | $ | (18,244 | ) | | $ | 8,653 | | | $ | — | | | $ | (3,068 | ) | | $ | (12,659) | |
Interest rate contracts | | | — | | | | — | | | | (412,188 | ) | | $ | — | | | $ | (412,188) | |
| | | | |
Total | | $ | (18,244 | ) | | $ | 8,653 | | | $ | (412,188 | ) | | $ | (3,068 | ) | | $ | (424,847 | ) |
| | | | |
*Includes purchased option contracts and purchased swaption contracts, if any.
| | | | |
| Amount of Change in Unrealized Gain or (Loss) Recognized on Derivatives | |
Derivatives Not Accounted for as Hedging Instruments | | Futures
contracts | |
Interest rate contracts | | $ | 287,387 | |
7. Shares of Beneficial Interest
The Fund has authorized an unlimited number of $0.001 par value shares of beneficial interest of each class. Transactions in shares of beneficial interest were as follows:
| | | | | | | | | | | | | | | | |
| | | Year Ended December 31, 2018 | | | Year Ended December 31, 2017 | |
| | | Shares | | | Amount | | | Shares | | | Amount | |
Non-Service Shares | | | | | | | | | | | | | | | | |
Sold | | | 1,820,955 | | | $ | 14,050,401 | | | | 1,035,605 | | | $ | 8,035,937 | |
Dividends and/or distributions reinvested | | | 353,708 | | | | 2,617,442 | | | | 261,553 | | | | 2,024,420 | |
Redeemed | | | (2,572,646 | ) | | | (19,710,946 | ) | | | (1,765,201 | ) | | | (13,727,340 | ) |
| | | | |
Net decrease | | | (397,983 | ) | | $ | (3,043,103 | ) | | | (468,043 | ) | | $ | (3,666,983 | ) |
| | | | |
| | | | | | | | | | | | | | | | |
Service Shares | | | | | | | | | | | | | | | | |
Sold | | | 1,451,512 | | | $ | 10,711,237 | | | | 1,815,951 | | | $ | 13,919,373 | |
Dividends and/or distributions reinvested | | | 202,701 | | | | 1,481,742 | | | | 148,618 | | | | 1,136,931 | |
Redeemed | | | (1,978,329 | ) | | | (14,681,878 | ) | | | (2,406,983 | ) | | | (18,467,514 | ) |
| | | | |
Net decrease | | | (324,116 | ) | | $ | (2,488,899 | ) | | | (442,414 | ) | | $ | (3,411,210 | ) |
| | | | |
8. Purchases and Sales of Securities
The aggregate cost of purchases and proceeds from sales of securities, other than short-term obligations and investments in IGMMF, for the reporting period were as follows:
| | | | | | | | |
| | | Purchases | | | Sales | |
Investment securities | | | $69,622,560 | | | | $68,144,898 | |
U.S. government and government agency obligations | | | — | | | | 1,541,315 | |
To Be Announced (TBA) mortgage-related securities | | | 641,318,699 | | | | 653,537,737 | |
9. Fees and Other Transactions with Affiliates
Management Fees.Under the investment advisory agreement, the Fund pays the Manager a management fee based on the daily net assets of the Fund at an annual rate as shown in the following table:
| | | | |
| Fee Schedule | | | |
Up to $1 billion | | | 0.60 | % |
Over $1 billion | | | 0.50 | |
The Fund’s effective management fee for the reporting period was 0.60% of average annual net assets before any applicable waivers.
Sub-Adviser Fees.The Manager has retained theSub-Adviser to provide theday-to-day portfolio management of the Fund. Under theSub-Advisory Agreement, the Manager pays theSub-Adviser an annual fee in monthly installments, equal to a percentage of the investment management fee collected by the Manager from the Fund, which shall be calculated after any investment management fee waivers. The fee paid to theSub-Adviser is paid by the Manager, not by the Fund.
Transfer Agent Fees.OFI Global (the “Transfer Agent”) serves as the transfer and shareholder servicing agent for the Fund. The Fund pays the Transfer Agent a fee based on annual net assets. Fees incurred and average net assets for each class with respect to these services are detailed in the Statement
33 OPPENHEIMER TOTAL RETURN BOND FUND/VA
NOTES TO FINANCIAL STATEMENTSContinued
9. Fees and Other Transactions with Affiliates (Continued)
of Operations and Financial Highlights, respectively.
Sub-Transfer Agent Fees.The Transfer Agent has retained Shareholder Services, Inc., a wholly-owned subsidiary of OFI (the“Sub-Transfer Agent”), to provide theday-to-day transfer agent and shareholder servicing of the Fund. Under theSub-Transfer Agency Agreement, the Transfer Agent pays theSub-Transfer Agent an annual fee in monthly installments, equal to a percentage of the transfer agent fee collected by the Transfer Agent from the Fund, which shall be calculated after any applicable fee waivers. The fee paid to theSub-Transfer Agent is paid by the Transfer Agent, not by the Fund.
Trustees’ Compensation. The Fund’s Board of Trustees (“Board”) has adopted a compensation deferral plan for Independent Trustees that enables Trustees to elect to defer receipt of all or a portion of the annual compensation they are entitled to receive from the Fund. For purposes of determining the amount owed to the Trustees under the plan, deferred amounts are treated as though equal dollar amounts had been invested in shares of the Fund or in other Oppenheimer funds selected by the Trustees. The Fund purchases shares of the funds selected for deferral by the Trustees in amounts equal to his or her deemed investment, resulting in a Fund asset equal to the deferred compensation liability. Such assets are included as a component of “Other” within the asset section of the Statement of Assets and Liabilities. Deferral of Trustees’ fees under the plan will not affect the net assets of the Fund and will not materially affect the Fund’s assets, liabilities or net investment income per share. Amounts will be deferred until distributed in accordance with the compensation deferral plan.
Distribution and Service Plan for Service Shares.The Fund has adopted a Distribution and Service Plan (the “Plan”) pursuant to Rule12b-1 under the 1940 Act for Service shares to pay OppenheimerFunds Distributor, Inc. (the “Distributor”), for distribution related services, personal service and account maintenance for the Fund’s Service shares. Under the Plan, payments are made periodically at an annual rate of 0.25% of the daily net assets of Service shares of the Fund. The Distributor currently uses all of those fees to compensate sponsors of the insurance product that offers Fund shares, for providing personal service and maintenance of accounts of their variable contract owners that hold Service shares. These fees are paid out of the Fund’s assets on anon-going basis and increase operating expenses of the Service shares, which results in lower performance compared to the Fund’s shares that are not subject to a service fee. Fees incurred by the Fund under the Plan are detailed in the Statement of Operations.
Waivers and Reimbursements of Expenses.The Manager has contractually agreed to limit the Fund’s expenses after payments, waivers and/or reimbursements and reduction to custodian expenses, excluding any applicable dividend expense, taxes, interest and fees from borrowing, any subsidiary expenses, Acquired Fund Fees and Expenses, brokerage commissions, unusual and infrequent expenses and certain other Fund expenses; so that those expenses, as percentages of daily net assets, will not exceed the annual rate of 0.75% forNon-Service shares and 1.00% for Service shares.
During the reporting period, the Manager waived fees and/or reimbursed the Fund as follows:
| | | | |
Non-Service Shares | | $ | 93,894 | |
Service Shares | | | 57,749 | |
This fee waiver and/or expense reimbursement may not be amended or withdrawn for one year from the date of the Fund’s prospectus, unless approved by the Board.
The Manager will waive fees and/or reimburse Fund expenses in an amount equal to the indirect management fees incurred through the Fund’s investment in IGMMF. During the reporting period, the Manager waived fees and/or reimbursed the Fund $3,170 for IGMMF management fees.
10. Borrowings and Other Financing
Joint Credit Facility.A number of mutual funds managed by the Manager participate in a $1.95 billion revolving credit facility (the “Facility”) intended to provide short-term financing, if necessary, subject to certain restrictions in connection with atypical redemption activity. Expenses and fees related to the Facility are paid by the participating funds and are disclosed separately or as other expenses on the Statement of Operations. The Fund did not utilize the Facility during the reporting period.
11. Pending Acquisition
On October 18, 2018, Massachusetts Mutual Life Insurance Company, an indirect corporate parent of theSub-Adviser and the Manager, announced that it has entered into an agreement whereby Invesco Ltd. (“Invesco”), a global investment management company, will acquire theSub-Adviser (the “Transaction”). In connection with the Transaction, on January 11, 2019, the Fund’s Board unanimously approved an Agreement and Plan of Reorganization (the “Agreement”), which provides for the transfer of the assets and liabilities of the Fund to a corresponding, newly formed fund (the “Acquiring Fund”) in the Invesco family of funds (the “Reorganization”) in exchange for shares of the corresponding Acquiring Fund of equal value to the value of the shares of the Fund as of the close of business on the closing date. Although the Acquiring Fund will be managed by Invesco Advisers, Inc., the Acquiring Fund will, as of the closing date, have the same investment objective and substantially similar principal investment strategies and risks as the Fund. After the Reorganization, Invesco Advisers, Inc. will be the investment adviser to the Acquiring Fund, and the Fund will be liquidated and dissolved under applicable law and terminate its registration under the Investment Company Act of 1940, as amended. The Reorganization is expected to be atax-free reorganization for U.S. federal income tax purposes.
The Reorganization is subject to the approval of shareholders of the Fund. Shareholders of record of the Fund on January 14, 2019 will be entitled to
34 OPPENHEIMER TOTAL RETURN BOND FUND/VA
11. Pending Acquisition (Continued)
vote on the Reorganization and will receive a combined prospectus and proxy statement describing the Reorganization, the shareholder meeting, and a discussion of the factors the Fund’s Board considered in approving the Agreement. The combined prospectus and proxy statement is expected to be distributed to shareholders of record on or about February 28, 2019. The anticipated date of the shareholder meeting is on or about April 12, 2019.
If shareholders approve the Agreement and certain other closing conditions are satisfied or waived, the Reorganization is expected to close during the second quarter of 2019, or as soon as practicable thereafter. This is subject to change.
35 OPPENHEIMER TOTAL RETURN BOND FUND/VA
REPORT OF INDEPENDENT REGISTERED PUBLIC ACCOUNTING FIRM
To the Shareholders and Board of Trustees
Oppenheimer Variable Account Funds:
Opinion on the Financial Statements
We have audited the accompanying statement of assets and liabilities of Oppenheimer Total Return Bond Fund/VA, a separate series of Oppenheimer Variable Account Funds, (the “Fund”), including the statement of investments, as of December 31, 2018, the related statement of operations for the year then ended, the statements of changes in net assets for each of the years in the two year period then ended, and the related notes (collectively, the “financial statements”) and the financial highlights for each of the years in the five year period then ended. In our opinion, the financial statements and financial highlights present fairly, in all material respects, the financial position of the Fund as of December 31, 2018, the results of its operations for the year then ended, the changes in its net assets for each of the years in the two year period then ended, and the financial highlights for each of the years in the five year period then ended, in conformity with U.S. generally accepted accounting principles.
Basis for Opinion
These financial statements and financial highlights are the responsibility of the Fund’s management. Our responsibility is to express an opinion on these financial statements and financial highlights based on our audits. We are a public accounting firm registered with the Public Company Accounting Oversight Board (United States) (“PCAOB”) and are required to be independent with respect to the Fund in accordance with the U.S. federal securities laws and the applicable rules and regulations of the Securities and Exchange Commission and the PCAOB.
We conducted our audits in accordance with the standards of the PCAOB. Those standards require that we plan and perform the audit to obtain reasonable assurance about whether the financial statements and financial highlights are free of material misstatement, whether due to error or fraud. Our audits included performing procedures to assess the risks of material misstatement of the financial statements and financial highlights, whether due to error or fraud, and performing procedures that respond to those risks. Such procedures included examining, on a test basis, evidence regarding the amounts and disclosures in the financial statements and financial highlights. Such procedures also included confirmation of securities owned as of December 31, 2018, by correspondence with the custodian, brokers and the transfer agent, or by other appropriate auditing procedures. Our audits also included evaluating the accounting principles used and significant estimates made by management, as well as evaluating the overall presentation of the financial statements and financial highlights. We believe that our audits provide a reasonable basis for our opinion.
KPMGLLP
We have not been able to determine the specific year that we began serving as the auditor of one or more Oppenheimer Funds investment companies, however we are aware that we have served as the auditor of one or more Oppenheimer Funds investment companies since at least 1969.
Denver, Colorado
February 14, 2019
36 OPPENHEIMER TOTAL RETURN BOND FUND/VA
FEDERAL INCOME TAX INFORMATIONUnaudited
In early 2019, if applicable, shareholders of record received information regarding all dividends and distributions paid to them by the Fund during calendar year 2018.
None of the dividends paid by the Fund during the reporting period are eligible for the corporate dividend-received deduction.
Dividends, if any, paid by the Fund during the reporting period which are not designated as capital gain distributions, may be eligible for lower individual income tax rates to the extent that the Fund has received qualified dividend income as stipulated by recent tax legislation. In early 2019, shareholders of record received information regarding the percentage of distributions that are eligible for lower individual income tax rates. The amount will be the maximum amount allowed.
The foregoing information is presented to assist shareholders in reporting distributions received from the Fund to the Internal Revenue Service. Because of the complexity of the federal regulations which may affect your individual tax return and the many variations in state and local tax regulations, we recommend that you consult your tax advisor for specific guidance.
37 OPPENHEIMER TOTAL RETURN BOND FUND/VA
BOARD APPROVAL OF THE FUND’S INVESTMENT ADVISORY ANDSUB-ADVISORY AGREEMENTSUnaudited
The Fund has entered into an investment advisory agreement with OFI Global Asset Management, Inc. (“OFI Global” or the “Adviser”), a wholly-owned subsidiary of OppenheimerFunds, Inc. (“OFI” or the“Sub-Adviser”) (“OFI Global” and “OFI” together the “Managers”) and OFI Global has entered into asub-advisory agreement with OFI whereby OFI provides investmentsub-advisory services to the Fund (collectively, the “Agreements”). Each year, the Board of Trustees (the “Board”), including a majority of the independent Trustees, is required to determine whether to approve the terms of the Agreements and the renewal thereof. The Investment Company Act of 1940, as amended, requires that the Board request and evaluate, and that the Managers provide, such information as may be reasonably necessary to evaluate the terms of the Agreements. The Board employs an independent consultant to prepare a report that provides information, including comparative information that the Board requests for that purpose. In addition toin-person meetings focused on this evaluation, the Board receives information throughout the year regarding Fund services, fees, expenses and performance.
The Managers and the independent consultant provided information to the Board on the following factors: (i) the nature, quality and extent of the Managers’ services, (ii) the comparative investment performance of the Fund and the Managers, (iii) the fees and expenses of the Fund, including comparative fee and expense information, (iv) the profitability of the Managers and their affiliates, including an analysis of the cost of providing services, (v) whether economies of scale are realized as the Fund grows and whether fee levels reflect these economies of scale for Fund investors and (vi) other benefits to the Managers from their relationship with the Fund. The Board was aware that there are alternatives to retaining the Managers.
Outlined below is a summary of the principal information considered by the Board as well as the Board’s conclusions.
Nature, Quality and Extent of Services. The Board considered information about the nature, quality and extent of the services provided to the Fund and information regarding the Managers’ key personnel who provide such services. The Managers’ duties include providing the Fund with the services of theSub-Adviser’s portfolio managers and investment team, who provide research, analysis and other advisory services in regard to the Fund’s investments; and securities trading services. OFI Global is responsible for oversight of third-party service providers; monitoring compliance with applicable Fund policies and procedures and adherence to the Fund’s investment restrictions; risk management; and oversight of theSub-Adviser. OFI Global is also responsible for providing certain administrative services to the Fund. Those services include providing and supervising all administrative and clerical personnel who are necessary in order to provide effective corporate administration for the Fund; compiling and maintaining records with respect to the Fund’s operations; preparing and filing reports required by the U.S. Securities and Exchange Commission; preparing periodic reports regarding the operations of the Fund for its shareholders; preparing proxy materials for shareholder meetings; and preparing the registration statements required by federal and state securities laws for the sale of the Fund’s shares. OFI Global also provides the Fund with office space, facilities and equipment.
The Board also considered the quality of the services provided and the quality of the Managers’ resources that are available to the Fund. The Board took account of the fact that theSub-Adviser has over fifty years of experience as an investment adviser and that its assets under management rank it among the top mutual fund managers in the United States. The Board evaluated the Managers’ advisory, administrative, accounting, legal, compliance and risk management services, among other services, and information the Board has received regarding the experience and professional qualifications of the Managers’ key personnel and the size and functions of their staff. In its evaluation of the quality of the portfolio management services provided, the Board considered the experience of Krishna Memani and Peter A. Strzalkowski, the portfolio managers for the Fund, and theSub-Adviser’s investment team and analysts. The Board members also considered the totality of their experiences with the Managers as directors or trustees of the Fund and other funds advised by the Managers. The Board considered information regarding the quality of services provided by affiliates of the Managers, which the Board members have become knowledgeable about through their experiences with the Managers and in connection with the review or renewal of the Fund’s service agreements or service providers. The Board concluded, in light of the Managers’ experience, reputation, personnel, operations and resources that the Fund benefits from the services provided under the Agreements.
Investment Performance of the Managers and the Fund. Throughout the year, the Managers provided information on the investment performance of the Fund, the Adviser and theSub-Adviser, including comparative performance information. The Board also reviewed information, prepared by the Managers and by the independent consultant, comparing the Fund’s historical performance to relevant market indices and to the performance of other intermediate-term bond funds underlying variable insurance products. The Board considered that the Fund outperformed its category median during theone-, three- and five-year periods, though it underperformed for theten-year period.
Fees and Expenses of the Fund. The Board reviewed the fees paid to the Adviser and the other expenses borne by the Fund. The Board noted that the Adviser, not the Fund, pays theSub-Adviser’s fee under thesub-advisory agreement. The independent consultant provided comparative data in regard to the fees and expenses of the Fund and other intermediate-term bond funds underlying variable insurance products. In reviewing the fees and expenses charged to the VA funds, the Board considered the Adviser’s assertion that, because there is much greater disparity in the fees and services that may be provided by a manager to a VA fund as opposed to a retail fund, when comparing the expenses of the various VA funds to those of retail funds, it is most appropriate to focus on total expenses (rather than on the management fees). The Board considered that the Fund’s total expenses and contractual management fee were higher than their respective peer group medians and category medians. The Board considered that the Adviser has contractually agreed to waive fees and/or reimburse certain expenses so that the Fund’s total annual operating expenses, as percentages of daily net assets, will not exceed that annual rate of 0.75% forNon-Service Shares and 1.00% for Service Shares. The Board also considered that the Adviser has contractually agreed to waive fees and/or reimburse Fund expenses in an amount equal to the indirect management fees incurred through the Fund’s investments in funds managed by the Adviser or its affiliates. Each of these fee waivers and/or expense reimbursements may not be amended or withdrawn for one year from the date of the Fund’s prospectus, unless approved by the Board.
Economies of Scale and Profits Realized by the Managers. The Board considered information regarding the Managers’ costs in serving as the Fund’s investment adviser andsub-adviser, including the costs associated with the personnel and systems necessary to manage the Fund, and information regarding the Managers’ profitability from their relationship with the Fund. The Board also considered that the Managers must be able to pay and retain experienced professional personnel at competitive rates to provide quality services to the Fund. The Board reviewed whether the Managers may realize economies of scale in managing and supporting the Fund. The Board noted that the Fund currently has management fee
38 OPPENHEIMER TOTAL RETURN BOND FUND/VA
BOARD APPROVAL OF THE FUND’S INVESTMENT ADVISORY ANDSUB-ADVISORY AGREEMENTSUnaudited / Continued
breakpoints, which are intended to share with Fund shareholders economies of scale that may exist as the Fund’s assets grow.
Other Benefits to the Managers. In addition to considering the profits realized by the Managers, the Board considered information that was provided regarding the direct and indirect benefits the Managers receive as a result of their relationship with the Fund, including compensation paid to the Managers’ affiliates.
Conclusions. These factors were also considered by the independent Trustees meeting separately from the full Board, assisted by experienced counsel to the Fund and to the independent Trustees. Fund counsel and the independent Trustees’ counsel are independent of the Managers within the meaning and intent of the Securities and Exchange Commission Rules.
Based on its review of the information it received and its evaluations described above, the Board, including a majority of the independent Trustees, decided to continue the Agreements through August 31, 2019. In arriving at its decision, the Board did not identify any factor or factors as being more important than others, but considered all of the above information, and considered the terms and conditions of the Agreements, including the management fees, in light of all the surrounding circumstances.
39 OPPENHEIMER TOTAL RETURN BOND FUND/VA
PORTFOLIO PROXY VOTING POLICIES AND GUIDELINES; UPDATES TO STATEMENT OF INVESTMENTS
The Fund has adopted Portfolio Proxy Voting Policies and Guidelines under which the Fund votes proxies relating to securities (“portfolio proxies”) held by the Fund. A description of the Fund’s Portfolio Proxy Voting Policies and Guidelines is available (i) without charge, upon request, by calling the Fund toll-free at 1.800.CALL OPP (225.5677), (ii) on the Fund’s website at www.oppenheimerfunds.com, and (iii) on the SEC’s website at www.sec.gov. In addition, the Fund is required to file FormN-PX, with its complete proxy voting record for the 12 months ended June 30th, no later than August 31st of each year. The Fund’s voting record is available (i) without charge, upon request, by calling the Fund toll-free at 1.800.CALL OPP (225.5677), and (ii) in the FormN-PX filing on the SEC’s website at www.sec.gov.
The Fund files its complete schedule of portfolio holdings with the SEC for the first quarter and the third quarter of each fiscal year on FormN-Q. The Fund’s FormN-Q filings are available on the SEC’s website at www.sec.gov.
40 OPPENHEIMER TOTAL RETURN BOND FUND/VA
TRUSTEES AND OFFICERSUnaudited
| | |
| |
| Name, Position(s) Held with the Fund, Length of Service, Year of Birth | | Principal Occupation(s) During the Past 5 Years; Other Trusteeships/Directorships Held; Number of Portfolios in the Fund Complex Currently Overseen |
| |
| INDEPENDENT TRUSTEES | | The address of each Trustee in the chart below is 6803 S. Tucson Way, Centennial, Colorado 80112-3924. Each Trustee serves for an indefinite term, or until his or her resignation, retirement, death or removal. Each of the Trustees in the chart below oversees 58 portfolios in the OppenheimerFunds complex. |
| |
Robert J. Malone, Chairman of the Board of Trustees (since 2016), Trustee (since 2002) Year of Birth: 1944 | | Chairman - Colorado Market of MidFirst Bank (since January 2015); Chairman of the Board (2012-2016) and Director (August 2005-January 2016) of Jones International University (educational organization); Trustee of the Gallagher Family Foundation(non-profit organization) (2000-2016); Chairman, Chief Executive Officer and Director of Steele Street Bank Trust (commercial banking) (August 2003-January 2015); Director of Opera Colorado Foundation(non-profit organization) (2008-2012); Director of Colorado UpLIFT (charitable organization) (1986-2010); Director of Jones Knowledge, Inc. (2006-2010); Former Chairman of U.S. Bank-Colorado (subsidiary of U.S. Bancorp and formerly Colorado National Bank) (July 1996-April 1999); Director of Commercial Assets, Inc. (real estate investment trust) (1993-2000); Director of U.S. Exploration, Inc. (oil and gas exploration) (1997-February 2004); Chairman of the Board (1991-1994) and Trustee (1985-1994) of Regis University; and Chairman of the Board (1990-1991) and Member (1984-1999) of Young Presidents Organization. Mr. Malone has served on the Boards of certain Oppenheimer funds since 2002, during which time he has become familiar with the Fund’s (and other Oppenheimer funds’) financial, accounting, regulatory and investment matters and has contributed to the Board’s deliberations. |
| |
Andrew J. Donohue, Trustee (since 2017) Year of Birth: 1950 | | Director, Mutual Fund Directors Forum (since February 2018); Of Counsel, Shearman & Sterling LLP (since September 2017); Chief of Staff of the U.S. Securities and Exchange Commission (regulator) (June 2015-February 2017); Managing Director and Investment Company General Counsel of Goldman Sachs (investment bank) (November2012-May 2015); Partner at Morgan Lewis & Bockius, LLP (law firm) (March 2011-October 2012); Director of the Division of Investment Management of U.S. Securities and Exchange Commission (regulator) (May 2006-November 2010); Global General Counsel of Merrill Lynch Investment Managers (investment firm) (May2003-May 2006); General Counsel (October 1991-November 2001) and Executive Vice President (January 1993-November 2001) of OppenheimerFunds, Inc. (investment firm) (June 1991-November 2001). Mr. Donohue has served on the Boards of certain Oppenheimer funds since 2017, during which time he has become familiar with the Fund’s (and other Oppenheimer funds’) financial, accounting, regulatory and investment matters and has contributed to the Board’s deliberations. |
| |
Richard F. Grabish, Trustee (since 2012) Year of Birth: 1948 | | Formerly Senior Vice President and Assistant Director of Sales and Marketing (March 1997-December 2007), Director (March 1987-December 2007) and Manager of Private Client Services (June 1985-June 2005) of A.G. Edwards & Sons, Inc. (broker/dealer and investment firm); Chairman and Chief Executive Officer of A.G. Edwards Trust Company, FSB (March 2001-December 2007); President and Vice Chairman of A.G. Edwards Trust Company, FSB (investment adviser) (April 1987-March 2001); President of A.G. Edwards Trust Company, FSB (investment adviser) (June 2005-December 2007). Mr. Grabish has served on the Boards of certain Oppenheimer funds since 2001, during which time he has become familiar with the Fund’s (and other Oppenheimer funds’) financial, accounting, regulatory and investment matters and has contributed to the Board’s deliberations. |
| |
Beverly L. Hamilton, Trustee (since 2002) Year of Birth: 1946 | | Trustee of Monterey Institute for International Studies (educational organization) (2000-2014); Board Member of Middlebury College (educational organization) (December 2005-June 2011); Director of the Board (1991-2016), Vice Chairman of the Board (2006-2009) and Chairman of the Board (2010-2013) of American Funds’ Emerging Markets Growth Fund, Inc. (mutual fund); Director of The California Endowment (philanthropic organization) (April 2002-April 2008); Director (February 2002-2005) and Chairman of Trustees (2006-2007) of the Community Hospital of Monterey Peninsula; President of ARCO Investment Management Company (February 1991-April 2000); Member of the investment committees of The Rockefeller Foundation (2001-2006) and The University of Michigan (since 2000); Advisor at Credit Suisse First Boston’s Sprout venture capital unit (venture capital fund) (1994-January 2005); Trustee of MassMutual Institutional Funds (investment company) (1996-June 2004); Trustee of MML Series Investment Fund (investment company) (April 1989-June 2004); Member of the investment committee of Hartford Hospital (2000-2003); and Advisor to Unilever (Holland) pension fund (2000-2003). Ms. Hamilton has served on the Boards of certain Oppenheimer funds since 2002, during which time she has become familiar with the Fund’s (and other Oppenheimer funds’) financial, accounting, regulatory and investment matters and has contributed to the Board’s deliberations. |
| |
Victoria J. Herget, Trustee (since 2012) Year of Birth:1951 | | Board Chair (2008-2015) and Director (2004-Present) of United Educators (insurance company); Trustee (since 2000) and Chair (2010-2017) of Newberry Library (independent research library); Trustee, Mather LifeWays (senior living organization) (since 2001); Independent Director of the First American Funds (mutual fund family) (2003-2011); former Managing Director (1993-2001), Principal (1985-1993), Vice President (1978-1985) and Assistant Vice President (1973-1978) of Zurich Scudder Investments (investment adviser) (and its predecessor firms); Trustee (1992-2007), Chair of the Board of Trustees (1999-2007), Investment Committee Chair (1994-1999) and Investment Committee member (2007-2010) of Wellesley College; Trustee, BoardSource(non-profit organization) (2006-2009) and Chicago City Day School(K-8 School) (1994-2005). Ms. Herget has served on the Boards of certain Oppenheimer funds since 2012, during which time she has become familiar with the Fund’s (and other Oppenheimer funds’) financial, accounting, regulatory and investment matters and has contributed to the Board’s deliberations. |
| |
Karen L. Stuckey, Trustee (since 2012) Year of Birth: 1953 | | Member (since May 2015) of Desert Mountain Community Foundation Advisory Board(non-profit organization); Partner (1990-2012) of PricewaterhouseCoopers LLP (professional services firm) (held various positions 1975-1990); Trustee (1992- 2006); member of Executive, Nominating and Audit Committees and Chair of Finance Committee (1992-2006), and Emeritus Trustee (since 2006) of Lehigh University; member, Women’s Investment Management Forum (professional organization) (since inception) and Trustee of Jennies School for Little Children(non-profit) (2011-2014). Ms. Stuckey has served on the Boards of certain Oppenheimer funds since 2012, during which time she has become familiar with the Fund’s (and other Oppenheimer funds’) financial, accounting, regulatory and investment matters and has contributed to the Board’s deliberations. |
41 OPPENHEIMER TOTAL RETURN BOND FUND/VA
TRUSTEES AND OFFICERSUnaudited / Continued
| | |
James D. Vaughn, Trustee (since 2012) Year of Birth:1945 | | Retired; former managing partner (1994-2001) of Denver office of Deloitte & Touche LLP, (held various positions in Denver and New York offices from 1969-1993); Trustee and Chairman of the Audit Committee of Schroder Funds (2003-2012); Board member and Chairman of Audit Committee of AMG National Trust Bank (since 2005); Trustee and Investment Committee member, University of South Dakota Foundation (since 1996); Board member, Audit Committee Member and past Board Chair, Junior Achievement (since 1993); former Board member, Mile High United Way, Boys and Girls Clubs, Boy Scouts, Colorado Business Committee for the Arts, Economic Club of Colorado and Metro Denver Network. Mr. Vaughn has served on the Boards of certain Oppenheimer funds since 2012, during which time he has become familiar with the Fund’s (and other Oppenheimer funds’) financial, accounting, regulatory and investment matters and has contributed to the Board’s deliberations. |
| |
| INTERESTED TRUSTEE AND OFFICER | | Mr. Steinmetz is an “Interested Trustee” because he is affiliated with the Manager and theSub-Adviser by virtue of his positions as Chairman and director of theSub-Adviser and officer and director of the Manager. Both as a Trustee and as an officer, Mr. Steinmetz serves for an indefinite term, or until his resignation, retirement, death or removal. Mr. Steinmetz’s address is 225 Liberty Street, New York, New York 10281- 1008. Mr. Steinmetz is an officer of 104 portfolios in the OppenheimerFunds complex. |
| |
Arthur P. Steinmetz, Trustee (since 2015), President and Principal Executive Officer (since 2014) Year of Birth: 1958 | | Chairman of OppenheimerFunds, Inc. (since January 2015); CEO and Chairman of OFI Global Asset Management, Inc. (since July 2014), President of OFI Global Asset Management, Inc. (since May 2013), a Director of OFI Global Asset Management, Inc. (since January 2013), Director of OppenheimerFunds, Inc. (since July 2014), President, Management Director and CEO of Oppenheimer Acquisition Corp. (OppenheimerFunds, Inc.‘s parent holding company) (since July 2014), and President and Director of OFI SteelPath, Inc. (since January 2013). Chief Investment Officer of the OppenheimerFunds advisory entities (January 2013-December 2013); Executive Vice President of OFI Global Asset Management, Inc. (January2013-May 2013); Chief Investment Officer of OppenheimerFunds, Inc. (October 2010-December 2012); Chief Investment Officer, Fixed- Income, of OppenheimerFunds, Inc. (April 2009-October 2010); Executive Vice President of OppenheimerFunds, Inc. (October 2009-December 2012); Director of Fixed Income of OppenheimerFunds, Inc. (January 2009-April 2009); and a Senior Vice President of OppenheimerFunds, Inc. (March 1993-September 2009). |
| |
| OTHER OFFICERS OF THE FUND | | The addresses of the Officers in the chart below are as follows: for Messrs. Memani, Strzalkowski, Mss. Lo Bessette, Foxson and Picciotto, 225 Liberty Street, New York, New York 10281-1008, for Mr. Petersen, 6803 S. Tucson Way, Centennial, Colorado 80112-3924. Each Officer serves for an indefinite term or until his or her resignation, retirement, death or removal. |
| |
Krishna Memani, Vice President (since 2009) Year of Birth: 1960 | | President of theSub-Adviser (since January 2013); Executive Vice President of the Manager (since January 2014) and Chief Investment Officer of the OppenheimerFunds advisory entities (since January 2014). Chief Investment Officer, Fixed Income of theSub-Adviser (January 2013-December 2013); Head of the Investment Grade Fixed Income Team of theSub-Adviser (March 2009-January 2014); Director of Fixed Income of theSub-Adviser (October 2010-December 2012); Senior Vice President of theSub-Adviser (March 2009-December 2012) and Senior Vice President of OFI Global Institutional, Inc. (April 2009-December 2012). Managing Director and Head of the U.S. and European Credit Analyst Team at Deutsche Bank Securities (June 2006-January 2009). Chief Credit Strategist at Credit Suisse Securities (August 2002-March 2006). Managing Director and Senior Portfolio Manager at Putnam Investments (September 1998-June 2002). |
| |
Peter A. Strzalkowski, Vice President (since 2009) Year of Birth: 1965 | | Senior Vice President of theSub-Adviser (since January 2016); Senior Portfolio Manager of theSub-Adviser (since August 2007);co-Team Leader for theSub-Adviser’s Investment Grade Fixed Income Team (since January 2014); Vice President of theSub-Adviser (August 2007-January 2016); a member of theSub-Adviser’s Investment Grade Fixed Income Team (April 2009-January 2014). Managing Partner and Chief Investment Officer of Vector Capital Management, LLC, a structured products money management firm he founded, (July 2006-August 2007); Senior Portfolio Manager at Highland Capital Management, L.P. (June 2005-July 2006); Senior Fixed Income Portfolio Manager at Microsoft Corp. (June 2003-June 2005); Vice President and Senior Fixed Income Portfolio Manager at First Citizens Bank Trust, Capital Management Group (April 2000-June 2003); a Vice President and Fixed Income Portfolio Manager at Centura Banks (November 1998-April 2000). |
| |
Cynthia Lo Bessette, Secretary and Chief Legal Officer (since 2016) Year of Birth: 1969 | | Executive Vice President, General Counsel and Secretary of OFI Global Asset Management, Inc. (since February 2016); Senior Vice President and Deputy General Counsel of OFI Global Asset Management, Inc. (March 2015-February 2016); Chief Legal Officer of OppenheimerFunds, Inc. and OppenheimerFunds Distributor, Inc. (since February 2016); Vice President, General Counsel and Secretary of Oppenheimer Acquisition Corp. (since February 2016); General Counsel of OFI SteelPath, Inc., OFI Advisors, LLC and Index Management Solutions, LLC (since February 2016); Chief Legal Officer of OFI Global Institutional, Inc., HarbourView Asset Management Corporation, OFI Global Trust Company, Oppenheimer Real Asset Management, Inc., OFI Private Investments Inc., Shareholder Services, Inc. and Trinity Investment Management Corporation (since February 2016); Corporate Counsel (February 2012-March 2015) and Deputy Chief Legal Officer (April 2013-March 2015) of Jennison Associates LLC; Assistant General Counsel (April 2008-September 2009) and Deputy General Counsel (October 2009-February 2012) of Lord Abbett & Co. LLC. |
| |
Jennifer Foxson, Vice President and Chief Business Officer (since 2014) Year of Birth: 1969 | | Senior Vice President of OppenheimerFunds Distributor, Inc. (since June 2014); Vice President of OppenheimerFunds Distributor, Inc. (April 2006-June 2014); Vice President of OppenheimerFunds, Inc. (January 1998-March 2006); Assistant Vice President of OppenheimerFunds, Inc. (October 1991-December 1998). |
| |
Mary Ann Picciotto, Chief Compliance Officer and Chief Anti- Money Laundering Officer (since 2014) Year of Birth: 1973 | | Senior Vice President and Chief Compliance Officer of OFI Global Asset Management, Inc. (since March 2014); Chief Compliance Officer of OppenheimerFunds, Inc., OFI SteelPath, Inc., OFI Global Institutional, Inc., Oppenheimer Real Asset Management, Inc., OFI Private Investments Inc., Harborview Asset Management Corporation, Trinity Investment Management Corporation, and Shareholder Services, Inc. (since March 2014); Managing Director of Morgan Stanley Investment Management Inc. and certain of its various affiliated entities; Chief Compliance Officer of various Morgan Stanley Funds (May 2010-January 2014); Chief Compliance Officer of Morgan Stanley Investment Management Inc. (April 2007-January 2014). |
42 OPPENHEIMER TOTAL RETURN BOND FUND/VA
| | |
Brian S. Petersen, Treasurer and Principal Financial & Accounting Officer (since 2016) Year of Birth: 1970 | | Senior Vice President of OFI Global Asset Management, Inc. (since January 2017); Vice President of OFI Global Asset Management, Inc. (January 2013-January 2017); Vice President of OppenheimerFunds, Inc. (February 2007-December 2012); Assistant Vice President of OppenheimerFunds, Inc. (August 2002-2007). |
The Fund’s Statement of Additional Information contains additional information about the Fund’s Trustees and Officers and is available without charge, upon request, by calling 1.800.988.8287.
43 OPPENHEIMER TOTAL RETURN BOND FUND/VA
OPPENHEIMER TOTAL RETURN BOND FUND/VA
A Series of Oppenheimer Variable Account Funds
| | |
| Manager | | OFI Global Asset Management, Inc. |
| |
| Sub-Adviser | | OppenheimerFunds, Inc. |
| |
| Distributor | | OppenheimerFunds Distributor, Inc. |
| |
Transfer and Shareholder Servicing Agent | | OFI Global Asset Management, Inc. |
| |
| Sub-Transfer Agent | | Shareholder Services, Inc. |
| | DBA OppenheimerFunds Services |
| |
| Independent | | KPMG LLP |
| Registered | | |
| Public | | |
| Accounting | | |
| Firm | | |
| |
| Legal Counsel | | Ropes & Gray LLP |
| |
| | Before investing in any of the Oppenheimer funds, investors should carefully consider a fund’s investment objectives, risks, charges and expenses. Fund prospectuses and summary prospectuses contain this and other information about the funds, and may be obtained by asking your financial advisor, visiting oppenheimerfunds.com or calling us at 1.800.988.8287. Read prospectuses and summary prospectuses carefully before investing. |
| |
| | © 2019 OppenheimerFunds, Inc. All rights reserved. Oppenheimer funds are distributed by OppenheimerFunds Distributor, Inc. |

| | | | |
| | 
| | |
| | |
| | | December 31, 2018 | | |
| | Oppenheimer | | |
| | Global Fund/VA | | Annual Report |
| | A Series of Oppenheimer Variable Account Funds | | |
| | | |
| | ANNUAL REPORT | | |
| | |
| | Listing of Top Holdings | | |
| | |
| | Fund Performance Discussion | | |
| | |
| | Financial Statements | | |
PORTFOLIO MANAGERS: Rajeev Bhaman, CFA and John Delano, CFA1
AVERAGE ANNUAL TOTAL RETURNS FOR THE PERIODS ENDED 12/31/18
| | | | | | | | | | | | | | |
| | | Inception
Date | | 1-Year | | | 5-Year | | | 10-Year | |
Non-Service Shares | | 11/12/90 | | | -13.18% | | | | 4.77% | | | | 11.23 | % |
Service Shares | | 7/13/00 | | | -13.39 | | | | 4.52 | | | | 10.94 | |
MSCI All Country World Index | | | | | -9.42 | | | | 4.26 | | | | 9.46 | |
Performance data quoted represents past performance, which does not guarantee future results. The investment return and principal value of an investment in the Fund will fluctuate so that an investor’s shares, when redeemed, may be worth more or less than their original cost. Current performance may be lower or higher than the performance quoted. For performance data current to the most recent month end, call us at 1.800.988.8287. The Fund’s total returns should not be expected to be the same as the returns of other funds, whether or not both funds have the same portfolio managers and/or similar names. The Fund’s total returns include changes in share price and reinvested distributions but do not include the charges associated with the separate account products that offer this Fund. Such performance would have been lower if such charges were taken into account. Returns for periods of less than one year are cumulative and not annualized. See Fund prospectuses and summary prospectuses for more information on share classes and sales charges.
TOP HOLDINGS AND ALLOCATIONS
TOP TEN COMMON STOCK HOLDINGS
| | |
Alphabet, Inc., Cl. A | | 6.6% |
LVMH Moet Hennessy Louis Vuitton SE | | 3.3 |
Airbus SE | | 3.3 |
Adobe, Inc. | | 2.8 |
Anthem, Inc. | | 2.8 |
Intuit, Inc. | | 2.8 |
S&P Global, Inc. | | 2.7 |
Facebook, Inc., Cl. A | | 2.6 |
SAP SE | | 2.4 |
Nidec Corp. | | 2.2 |
Portfolio holdings and allocations are subject to change. Percentages are as of December 31, 2018, and are based on net assets.
REGIONAL ALLOCATION
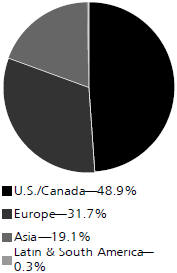
Portfolio holdings and allocations are subject to change. Percentages are as of December 31, 2018, and are based on the total market value of investments.
1. Effective March 31, 2019, Mr. Bhaman will retire as Portfolio Manager and Vice President and Mr. Delano will be the sole Portfolio Manager of the Fund.
For more current Fund holdings, please visit oppenheimerfunds.com.
2 OPPENHEIMER GLOBAL FUND/VA
Fund Performance Discussion
Volatility returned to global equity markets in 2018, as trade tariffs, rising interest rates, and politics, yielded a challenging environment. Against this backdrop, the Fund’sNon-Service shares produced a return of-13.18%, underperforming the MSCI All Country World Index (the “Index”), which returned-9.42%. The most significant underperforming sectors for the Fund were Health Care, Financials, Consumer Discretionary, and Real Estate. Stock selection detracted from performance in these sectors. The portfolio outperformed the Index in the Information Technology sector due to stock selection and in the Materials sector, where we have no exposure. We are perennially underweight Energy and Materials. We like certain companies for their technology or their access to a very scarce resource. However, we don’t believe that we can predict either energy or materials prices consistently, and so will continue to invest relatively little in those sectors.
MARKET OVERVIEW
Markets were volatile in 2018 and chaotic in the fourth quarter of the year. While some companies reported weaker than expected numbers for the third quarter, it seems to us to have been extrapolated into something much bigger than is likely to unfold, at least for now. Basically, we have the same conditions we have had, a good economic environment, though perhaps not as strong as before, and low interest rates. The declines in individual stocks, as is common, were often much worse than the broad averages, and as we are not broad market investors, the recent market creates some very attractive opportunities for us that the broad averages might not be much exposed to. This is apt to be particularly true of some of what we see in technology and health care. The 20th century made a comeback over the last several months, but our bet is that the future continues to devour the past, as it always has.
FUND REVIEW
Top contributors to performance this period included Adobe Systems Incorporated, Intuit, Inc., and Kering SA.
Adobe Systems Incorporated has risen by more than fourfold over the last five years as they have undergone a shift to a subscription based model. This model is preferred by many customers, as it offers no meaningful upfront costs, license flexibility, and seamless updates.
Intuit’s small business and tax platforms, QuickBooks and TurboTax, continued to gain share. We also see a sizable opportunity for Intuit to attach adjacent services to both platforms and to penetrate markets outside the U.S.
Kering SA continued the resurgence in its operations, which began inmid-2016. Gucci’s resurgence as a desirable brand has driven significant growth in sales and profits, and we believe it remains relevant for future growth as well.
Detractors from performance this period included JD.com, Inc., Citigroup, Inc., and Facebook, Inc.
JD.com had a difficult year. As the number two player in Chinesee-commerce, we believe it has immense long-term potential. However, it has struggled to become consistently profitable, as it has been investing in the future. An additional controversy with JD erupted during the period, when news reports indicated that its CEO was the subject of a sexual assault investigation in Minneapolis, Minnesota this summer. As with our style, we will be patient with this name. We believe it has very significant upside potential, and the valuation is very low by global standards for ane-commerce company with a market position such as it has.
Citigroup, Inc., along with bank shares generally, underperformed in the fourth quarter of 2018 as the U.S. yield curve flattened, which negatively impacts bank profitability.
Facebook has been weak this year, with the Cambridge Analytica controversy in the spring and lowered guidance following its second quarter earnings report. Despite this, we find appeal in the shares and see no reason to alter our thinking about its long-term potential. The shares are now very cheap. Some clarity about the durability of its business model will likely be seen in coming earnings releases and we expect the share price will likely respond accordingly.
POSITIONING AND OUTLOOK
Our thematic, long-term, investment style leads us towards quality businesses with sustainability of both enterprise and advantage. This, we believe, is an important buffer to rising chatter of protectionist trade policies. Our holdings are selected for the sustainability of their purpose and the sensibility of their price. If we have this combination well calibrated, and we believe we do, then our portfolio should be able to weather trade controversies relatively well.
3 OPPENHEIMER GLOBAL FUND/VA
As we have noted previously, trade has always been a key contributor to the advancement of prosperity. At its core, trade is about specialization and scale advantages. That makes for higher levels of productivity, and rising productivity is what creates higher living standards. The ability to produce more with the same or lower costs makes us collectively more prosperous. We have had an extended period with a lot of bark, and a little bit of bite surrounding trade. We believe that this will be resolved relatively soon, at least to such as degree that everyone can declare themselves a victor.
The standoff that the U.S. government seems to be in, regarding funding and a border wall, is the same brinksmanship narrative that we have seen too many times to recall. Each one has led to lots of media coverage and market anxiety, but have not been important market or economic events. This one, like all the others, will end, probably soon, and the world can move on to other things.
Top of mind for us as we enter 2019 is opportunity. We believe there are some very good opportunities to invest in best of breed companies in structurally ascendant industries. During the fourth quarter, a number of them sold off in indiscriminate fashion. So, in the present you can always find worry in markets, that is the norm, five years and ten years from now, we believe many of the names that sold off in the quarter will likely be much higher. That is what we are focused on as we open the year. Quarters like the fourth quarter of 2018 often create a good setting for patient, long-term investors.
Investors should consider the Fund’s investment objective, risks, charges and expenses carefully before investing. The Fund’s prospectus and summary prospectus contain this and other information about the Fund, and may be obtained by asking your financial advisor or calling us at 1.800.988.8287. Read prospectuses and summary prospectuses carefully before investing.
Total returns include changes in share price and reinvestment of dividends and capital gains distributions in a hypothetical investment for the periods shown, but do not include the charges associated with the separate account products that offer this Fund.
The views in the Fund Performance Discussion represent the opinions of this Fund’s portfolio managers and are not intended as investment advice or to predict or depict the performance of any investment. These views are as of the close of business on December 31, 2018, and are subject to change based on subsequent developments. The Fund’s portfolio and strategies are subject to change.
Shares of Oppenheimer funds are not deposits or obligations of any bank, are not guaranteed by any bank, are not insured by the FDIC or any other agency, and involve investment risks, including the possible loss of the principal amount invested.
Comparing the Fund’s Performance to the Market.The graphs that follow show the performance of a hypothetical $10,000 investment in each share class of the Fund held until December 31, 2018. Performance is measured over aten-fiscal-year period for both Classes. Performance information does not reflect charges that apply to separate accounts investing in the Fund. If these charges were taken into account, performance would be lower. The graphs assume that all dividends and capital gains distributions were reinvested in additional shares.
The Fund’s performance is compared to the performance of the MSCI All Country World Index. The MSCI All Country World Index is a free float-adjusted market capitalization weighted index that is designed to measure the equity market performance of developed and emerging markets. The Index isunmanaged and cannot be purchased directly by investors. While index comparisons may be useful to provide a benchmark for the Fund’s performance, it must be noted that the Fund’s investments are not limited to the investments comprising theIndex. Index performance includes reinvestment of income, but does not reflect transaction costs, fees, expenses or taxes. Index performance is shown for illustrative purposes only as a benchmark for the Fund’s performance, and does not predict or depict performance of the Fund. The Fund’s performance reflects the effects of the Fund’s business and operating expenses.
4 OPPENHEIMER GLOBAL FUND/VA
COMPARISON OF CHANGE IN VALUE OF $10,000 HYPOTHETICAL INVESTMENTS IN:
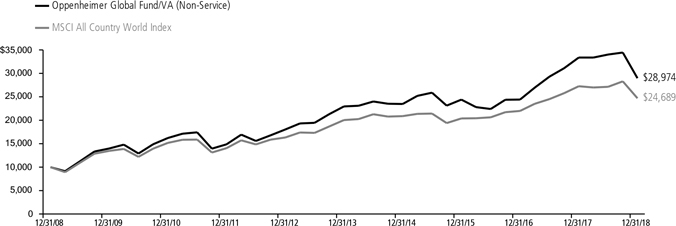
|
Average Annual Total Returns ofNon-Service Shares of the Fund at 12/31/18 |
1-Year -13.18% 5-Year 4.77% 10-Year 11.23% |
COMPARISON OF CHANGE IN VALUE OF $10,000 HYPOTHETICAL INVESTMENTS IN:
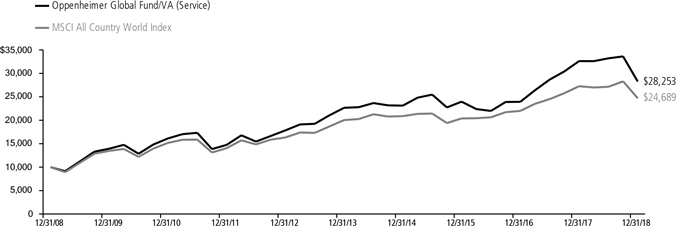
Average Annual Total Returns of Service Shares of the Fund at 12/31/18
1-Year -13.39% 5-Year 4.52% 10-Year 10.94%
Performance data quoted represents past performance, which does not guarantee future results. The investment return and principal value of an investment in the Fund will fluctuate so that an investor’s shares, when redeemed, may be worth more or less than their original cost. Current performance may be lower or higher than the performance quoted. For performance data current to the most recent month end, call us at 1.800.988.8287. The Fund’s total returns should not be expected to be the same as the returns of other funds, whether or not both funds have the same portfolio managers and/or similar names. The Fund’s total returns include changes in share price and reinvested distributions but do not include the charges associated with the separate account products that offer this Fund. Such performance would have been lower if such charges were taken into account.
5 OPPENHEIMER GLOBAL FUND/VA
Fund Expenses
Fund Expenses.As a shareholder of the Fund, you incur two types of costs: (1) transaction costs and (2) ongoing costs, including management fees; distribution and service fees; and other Fund expenses. These examples are intended to help you understand your ongoing costs (in dollars) of investing in the Fund and to compare these costs with the ongoing costs of investing in other mutual funds.
The examples are based on an investment of $1,000.00 invested at the beginning of the period and held for the entire6-month period ended December 31, 2018.
Actual Expenses. The first section of the table provides information about actual account values and actual expenses. You may use the information in this section for the class of shares you hold, together with the amount you invested, to estimate the expense that you paid over the period. Simply divide your account value by $1,000.00 (for example, an $8,600.00 account value divided by $1,000.00 = 8.60), then multiply the result by the number in the first section under the heading entitled “Expenses Paid During 6 Months Ended December 31, 2018” to estimate the expenses you paid on your account during this period.
Hypothetical Example for Comparison Purposes.
The second section of the table provides information about hypothetical account values and hypothetical expenses based on the Fund’s actual expense ratio for each class of shares, and an assumed rate of return of 5% per year for each class before expenses, which is not the actual return. The hypothetical account values and expenses may not be used to estimate the actual ending account balance or expenses you paid for the period. You may use this information to compare the ongoing costs of investing in the Fund and other funds. To do so, compare this 5% hypothetical example for the class of shares you hold with the 5% hypothetical examples that appear in the shareholder reports of the other funds.
Please note that the expenses shown in the table are meant to highlight your ongoing costs only and do not reflect any charges associated with the separate accounts that offer this Fund. Therefore, the “hypothetical” lines of the table are useful in comparing ongoing costs only, and will not help you determine the relative total costs of owning different funds. In addition, if these separate account charges were included your costs would have been higher.
| | | | | | | | | | | | | | | | |
| Actual | | Beginning Account Value July 1, 2018 | | | Ending Account Value
December 31, 2018 | | | Expenses Paid During
6 Months Ended
December 31, 2018 | |
Non-Service shares | | $ | 1,000.00 | | | $ | 851.80 | | | $ | 3.65 | | | | | |
Service shares | | | 1,000.00 | | | | 850.80 | | | | 4.82 | | | | | |
| |
| Hypothetical | | | | |
| (5% return before expenses) | | | | | | | | | | | | |
Non-Service shares | | | 1,000.00 | | | | 1,021.27 | | | | 3.98 | | | | | |
Service shares | | | 1,000.00 | | | | 1,020.01 | | | | 5.26 | | | | | |
Expenses are equal to the Fund’s annualized expense ratio for that class, multiplied by the average account value over the period, multiplied by 184/365 (to reflect theone-half year period). Those annualized expense ratios, excluding indirect expenses from affiliated funds, based on the6-month period ended December 31, 2018 are as follows:
| | | | | | | | |
| Class | | Expense Ratios | | | | |
Non-Service shares | | | 0.78% | | | | | |
Service shares | | | 1.03 | | | | | |
The expense ratios reflect voluntary and/or contractual waivers and/or reimbursements of expenses by the Fund’s Manager. Some of these undertakings may be modified or terminated at any time, as indicated in the Fund’s prospectus. The “Financial Highlights” tables in the Fund’s financial statements, included in this report, also show the gross expense ratios, without such waivers or reimbursements and reduction to custodian expenses, if applicable.
6 OPPENHEIMER GLOBAL FUND/VA
STATEMENT OF INVESTMENTSDecember 31, 2018
| | | | | | | | | | | | |
| | | Shares | | | Value | | | | |
| | | | | |
| Common Stocks—98.7% | | | | | | | | | |
| | | | | |
| Consumer Discretionary—27.4% | | | | | | | | | |
| | | | | |
| Automobiles—2.7% | | | | | | | | | |
| | | | | |
| Bayerische Motoren Werke AG | | | 455,466 | | | $ | 32,415,483 | | | | | |
| | | | | |
| Suzuki Motor Corp. | | | 457,300 | | | | 23,139,610 | | | | | |
| | | | | | | | | | | | |
| | | | | | | 55,555,093 | | | | | |
| |
| | | | | |
| Entertainment—2.2% | | | | | | | | | |
| | | | | |
| Capcom Co. Ltd. | | | 608,000 | | | | 12,119,961 | | | | | |
| | | | | |
| Walt Disney Co. (The) | | | 308,060 | | | | 33,778,779 | | | | | |
| | | | | | | | | | | | |
| | | | | | 45,898,740 | | | | |
| |
| | | | | |
| Hotels, Restaurants & Leisure—0.5% | | | | | | | | | |
| | | | | |
| International Game Technology plc | | | 724,261 | | | | 10,595,938 | | | | | |
| |
| | | | | |
| Household Durables—0.9% | | | | | | | | | |
| | | | | |
| Newell Brands, Inc. | | | 1,011,400 | | | | 18,801,926 | | | | | |
| |
| | | | | |
| Interactive Media & Services—10.2% | | | | | | | | | |
| | | | | |
| Alphabet, Inc., Cl. A1 | | | 130,890 | | | | 136,774,815 | | | | | |
| | | | | |
| Baidu, Inc., Sponsored ADR1 | | | 126,560 | | | | 20,072,416 | | | | | |
| | | | | |
| Facebook, Inc., Cl. A1 | | | 407,860 | | | | 53,466,367 | | | | | |
| | | | | | | | | | | | |
| | | | | | 210,313,598 | | | | |
| |
| | | | | |
| Internet & Catalog Retail—2.3% | | | | | | | | | |
| | | | | |
| Amazon.com, Inc.1 | | | 10,100 | | | | 15,169,897 | | | | | |
| | | | | |
| Farfetch Ltd., Cl. A1 | | | 552,040 | | | | 9,776,628 | | | | | |
| | | | | |
| JD.com, Inc., ADR1 | | | 1,087,577 | | | | 22,762,987 | | | | | |
| | | | | | | | | | | | |
| | | | | | 47,709,512 | | | | |
| |
| | | | | |
| Specialty Retail—2.6% | | | | | | | | | |
| | | | | |
| Industria de Diseno Textil SA | | | 1,182,023 | | | | 30,133,398 | | | | | |
| | | | | |
| Tiffany & Co. | | | 291,690 | | | | 23,483,962 | | | | | |
| | | | | | | | | | | | |
| | | | | | 53,617,360 | | | | |
| |
| | | | | |
| Textiles, Apparel & Luxury Goods—6.0% | | | | | | | | | |
| | | | | |
| Brunello Cucinelli SpA | | | 164,542 | | | | 5,655,079 | | | | | |
| | | | | |
| Kering SA | | | 97,600 | | | | 45,678,227 | | | | | |
| | | | | |
| LVMH Moet Hennessy Louis Vuitton SE | | | 235,781 | | | | 69,283,264 | | | | | |
| | | | | |
| Puma SE | | | 8,655 | | | | 4,239,336 | | | | | |
| | | | | | | | | | | | |
| | | | | | 124,855,906 | | | | |
| |
| | | | | |
| Consumer Staples—4.0% | | | | | | | | | |
| | | | | |
| Food Products—2.2% | | | | | | | | | |
| | | | | |
Unilever plc | | | 864,070 | | | | 45,223,407 | | | | | |
| | | | | |
| Household Products—1.8% | | | | | | | | | |
| | | | | |
Colgate-Palmolive Co. | | | 654,270 | | | | 38,942,150 | | | | | |
| | | | | |
| Energy—0.7% | | | | | | | | | |
| | | | | |
| Energy Equipment & Services—0.7% | | | | | | | | | |
| | | | | |
| TechnipFMC plc | | | 702,460 | | | | 14,161,182 | | | | | |
| | | | | |
| Financials—17.2% | | | | | | | | | |
| | | | | |
| Capital Markets—6.2% | | | | | | | | | |
| | | | | |
| Credit Suisse Group AG1 | | | 1,824,385 | | | | 20,104,983 | | | | | |
| | | | | |
| Goldman Sachs Group, Inc. (The) | | | 155,040 | | | | 25,899,432 | | | | | |
| | | | | |
| S&P Global, Inc. | | | 323,430 | | | | 54,963,694 | | | | | |
| | | | | |
| UBS Group AG1 | | | 2,161,861 | | | | 26,986,428 | | | | | |
| | | | | | | | | | | | |
| | | | | | 127,954,537 | | | | |
| |
| | | | | |
| Commercial Banks—4.8% | | | | | | | | | |
| | | | | |
| Banco Bilbao Vizcaya Argentaria SA | | | 1,621,743 | | | | 8,554,716 | | | | | |
| | | | | |
| Citigroup, Inc. | | | 795,120 | | | | 41,393,947 | | | | | |
| | | | | |
| ICICI Bank Ltd., Sponsored ADR | | | 3,130,204 | | | | 32,209,799 | | | | | |
| | | | | |
| Societe Generale SA | | | 581,849 | | | | 18,473,098 | | | | | |
| | | | | | | | | | | | |
| | | | | | 100,631,560 | | | | |
| |
| | | | | |
| Insurance—4.1% | | | | | | | | | |
| | | | | |
| Allianz SE | | | 193,844 | | | | 38,897,988 | | | | | |
| | | | | |
| Dai-ichi Life Holdings, Inc. | | | 817,600 | | | | 12,668,951 | | | | | |
| | | | | |
| Prudential plc | | | 1,818,837 | | | | 32,497,285 | | | | | |
| | | | | | | | | | | | |
| | | | | | 84,064,224 | | | | |
| |
| | | | | |
| Real Estate Management & Development—2.1% | | | | | | | | | |
| | | | | |
| DLF Ltd. | | | 17,032,091 | | | | 43,118,853 | | | | | |
| | | | | | | | | | | | |
| | | Shares | | | Value | | | | |
| | | | | |
| Health Care—14.3% | | | | | | | | | |
| | | | | |
| Biotechnology—7.8% | | | | | | | | | |
| | | | | |
| ACADIA Pharmaceuticals, Inc.1 | | | 417,390 | | | $ | 6,749,196 | | | | | |
| | | | | |
| AnaptysBio, Inc.1 | | | 123,230 | | | | 7,860,842 | | | | | |
| | | | | |
| Biogen, Inc.1 | | | 68,000 | | | | 20,462,560 | | | | | |
| | | | | |
| Bluebird Bio, Inc.1 | | | 92,840 | | | | 9,209,728 | | | | | |
| | | | | |
| Blueprint Medicines Corp.1 | | | 196,170 | | | | 10,575,525 | | | | | |
| | | | | |
| Circassia Pharmaceuticals plc1 | | | 4,006,224 | | | | 2,453,532 | | | | | |
| | | | | |
| Gilead Sciences, Inc. | | | 259,020 | | | | 16,201,701 | | | | | |
| | | | | |
| GlycoMimetics, Inc.1 | | | 545,010 | | | | 5,161,245 | | | | | |
| | | | | |
| Incyte Corp.1 | | | 198,730 | | | | 12,637,241 | | | | | |
| | | | | |
| Ionis Pharmaceuticals, Inc.1 | | | 232,180 | | | | 12,551,651 | | | | | |
| | | | | |
| Loxo Oncology, Inc.1 | | | 105,860 | | | | 14,827,810 | | | | | |
| | | | | |
| MacroGenics, Inc.1 | | | 511,180 | | | | 6,491,986 | | | | | |
| | | | | |
| Mirati Therapeutics, Inc.1 | | | 93,783 | | | | 3,978,275 | | | | | |
| | | | | |
| Sage Therapeutics, Inc.1 | | | 165,380 | | | | 15,841,750 | | | | | |
| | | | | |
| Shire plc | | | 200,350 | | | | 11,643,331 | | | | | |
| | | | | |
| uniQure NV1 | | | 161,820 | | | | 4,663,652 | | | | | |
| | | | | | | | | | | | |
| | | | | | | 161,310,025 | | | | | |
| |
| | | | | |
| Health Care Equipment & Supplies—0.7% | | | | | | | | | |
| | | | | |
| Zimmer Biomet Holdings, Inc. | | | 143,610 | | | | 14,895,229 | | | | | |
| |
| | | | | |
| Health Care Providers & Services—3.7% | | | | | | | | | |
| | | | | |
| Anthem, Inc. | | | 221,345 | | | | 58,131,837 | | | | | |
| | | | | |
| Centene Corp.1 | | | 156,860 | | | | 18,085,958 | | | | | |
| | | | | | | | | | | | |
| | | | | | 76,217,795 | | | | |
| |
| | | | | |
| Life Sciences Tools & Services—1.3% | | | | | | | | | |
| | | | | |
| Agilent Technologies, Inc. | | | 395,150 | | | | 26,656,819 | | | | | |
| |
| | | | | |
| Pharmaceuticals—0.8% | | | | | | | | | |
| | | | | |
| Bayer AG | | | 241,985 | | | | 16,779,523 | | | | | |
| |
| | | | | |
| Industrials—15.2% | | | | | | | | | |
| | | | | |
| Aerospace & Defense—3.3% | | | | | | | | | |
| | | | | |
| Airbus SE | | | 706,830 | | | | 67,601,897 | | | | | |
| |
| | | | | |
| Air Freight & Couriers—1.3% | | | | | | | | | |
| | | | | |
| United Parcel Service, Inc., Cl. B | | | 268,790 | | | | 26,215,089 | | | | | |
| |
| | | | | |
| Airlines—0.9% | | | | | | | | | |
| | | | | |
International Consolidated Airlines
Group SA | | | 2,429,230 | | | | 19,064,254 | | | | | |
| |
| | | | | |
| Building Products—1.2% | | | | | | | | | |
| | | | | |
| Assa Abloy AB, Cl. B | | | 1,362,450 | | | | 24,359,621 | | | | | |
| |
| | | | | |
| Construction & Engineering—0.5% | | | | | | | | | |
| | | | | |
| FLSmidth & Co. AS | | | 244,997 | | | | 11,007,629 | | | | | |
| |
| | | | | |
| Electrical Equipment—2.2% | | | | | | | | | |
| | | | | |
| Nidec Corp. | | | 406,500 | | | | 46,586,825 | | | | | |
| |
| | | | | |
| Industrial Conglomerates—2.7% | | | | | | | | | |
| | | | | |
| 3M Co. | | | 167,870 | | | | 31,985,950 | | | | | |
| | | | | |
| Siemens AG | | | 207,853 | | | | 23,181,696 | | | | | |
| | | | | | | | | | | | |
| | | | | | 55,167,646 | | | | |
| |
| | | | | |
| Machinery—2.2% | | | | | | | | | |
| | | | | |
| Atlas Copco AB, Cl. A | | | 576,183 | | | | 13,765,338 | | | | | |
| | | | | |
| FANUC Corp. | | | 127,400 | | | | 19,153,021 | | | | | |
| | | | | |
| Minebea Mitsumi, Inc. | | | 950,000 | | | | 13,642,004 | | | | | |
| | | | | | | | | | | | |
| | | | | | 46,560,363 | | | | |
| |
| | | | | |
| Professional Services—0.9% | | | | | | | | | |
| | | | | |
| Equifax, Inc. | | | 197,710 | | | | 18,412,732 | | | | | |
| |
| | | | | |
| Information Technology—19.9% | | | | | | | | | |
| | | | | |
| Electronic Equipment, Instruments, & Components—5.9% | | | | | | | | | |
| | | | | |
| Keyence Corp. | | | 69,822 | | | | 35,188,932 | | | | | |
| | | | | |
| Murata Manufacturing Co. Ltd. | | | 307,200 | | | | 42,328,329 | | | | | |
| | | | | |
| Omron Corp. | | | 478,100 | | | | 17,232,206 | | | | | |
| | | | | |
| TDK Corp. | | | 380,900 | | | | 27,103,104 | | | | | |
| | | | | | 121,852,571 | | | | |
| |
| | | | | |
| IT Services—2.5% | | | | | | | | | |
| | | | | |
| Earthport plc1 | | | 14,765,253 | | | | 5,048,559 | | | | | |
7 OPPENHEIMER GLOBAL FUND/VA
STATEMENT OF INVESTMENTSContinued
| | | | | | | | |
| | | Shares | | | Value | |
| |
IT Services (Continued) | | | | | |
| |
| PayPal Holdings, Inc.1 | | | 503,007 | | | $ | 42,297,859 | |
| |
| StoneCo Ltd., Cl. A1 | | | 298,340 | | | | 5,501,390 | |
| | | | | | | | |
| | | | | | | 52,847,808 | |
| |
Semiconductors & Semiconductor Equipment—2.7% | |
| |
Maxim Integrated Products, Inc. | | | 898,245 | | | | 45,675,758 | |
| |
Renesas Electronics Corp.1 | | | 2,167,400 | | | | 9,941,139 | |
| | | | | | | | |
| | | | | | 55,616,897 | |
| |
Software—8.8% | | | | | | | | |
| |
Adobe, Inc.1 | | | 260,853 | | | | 59,015,383 | |
| |
Intuit, Inc. | | | 294,750 | | | | 58,021,537 | |
| |
Nintendo Co. Ltd. | | | 61,000 | | | | 16,116,858 | |
| |
SAP SE | | | 493,706 | | | | 49,177,910 | |
| | | | | | | | |
| | | | | | 182,331,688 | |
| | | | | | | | |
| | | Shares | | | Value | |
| |
Software (Continued) | | | | | |
| |
Total Common Stocks
(Cost $1,170,852,283) | | | | | | $ | 2,044,928,397 | |
|
| | |
| |
| Preferred Stock—0.0% | | | | | |
| |
| Zee Entertainment Enterprises Ltd., 6% Cum.Non-Cv. (Cost $—) | | | 4,053,320 | | | | 443,563 | |
|
| | |
| |
| Investment Company—0.6% | | | | | |
| |
| Oppenheimer Institutional Government Money Market Fund, Cl. E, 2.35%2,3(Cost $12,835,777) | | | 12,835,777 | | | | 12,835,777 | |
| |
Total Investments, at Value
(Cost $1,183,688,060) | | | 99.3% | | | | 2,058,207,737 | |
| | | | |
Net Other Assets (Liabilities) | | | 0.7 | | | | 13,956,815 | |
| | | | |
Net Assets | | | 100.0% | | | $ | 2,072,164,552 | |
| | | | |
Footnotes to Statement of Investments
1. Non-income producing security.
2. Rate shown is the 7-day yield at period end.
3. Is or was an affiliate, as defined in the Investment Company Act of 1940, as amended, at or during the reporting period, by virtue of the Fund owning at least 5% of the voting securities of the issuer or as a result of the Fund and the issuer having the same investment adviser. Transactions during the reporting period in which the issuer was an affiliate are as follows:
| | | | | | | | | | | | | | | | |
| | | Shares
December 31, 2017 | | | Gross
Additions | | | Gross
Reductions | | | Shares
December 31, 2018 | |
| |
Investment Company | | | | | | | | | | | | | | | | |
| Oppenheimer Institutional Government Money Market Fund, Cl. E | | | 27,124,866 | | | | 416,452,765 | | | | 430,741,854 | | | | 12,835,777 | |
| | | | |
| | | Value | | | Income | | | Realized Gain (Loss) | | | Change in Unrealized
Gain (Loss) | |
| |
Investment Company | | | | | | | | | | | | | | | | |
| Oppenheimer Institutional Government Money Market Fund, Cl. E | | $ | 12,835,777 | | | $ | 291,363 | | | $ | — | | | $ | — | |
Distribution of investments representing geographic holdings, as a percentage of total investments at value, is as follows:
| | | | | | | | |
| Geographic Holdings (Unaudited) | | Value | | | Percent | |
| |
United States | | $ | 1,008,050,345 | | | | 48.9% | |
Japan | | | 275,220,941 | | | | 13.3 | |
France | | | 201,036,485 | | | | 9.8 | |
Germany | | | 164,691,936 | | | | 8.0 | |
United Kingdom | | | 128,224,847 | | | | 6.2 | |
India | | | 75,772,216 | | | | 3.7 | |
Switzerland | | | 47,091,411 | | | | 2.3 | |
China | | | 42,835,403 | | | | 2.1 | |
Spain | | | 38,688,114 | | | | 1.9 | |
Sweden | | | 38,124,959 | | | | 1.9 | |
Ireland | | | 11,643,331 | | | | 0.6 | |
Denmark | | | 11,007,628 | | | | 0.5 | |
Italy | | | 5,655,079 | | | | 0.3 | |
Brazil | | | 5,501,390 | | | | 0.3 | |
Netherlands | | | 4,663,652 | | | | 0.2 | |
| | | | |
Total | | $ | 2,058,207,737 | | | | 100.0% | |
| | | | |
| | | | | | | |
See accompanying Notes to Financial Statements.
8 OPPENHEIMER GLOBAL FUND/VA
STATEMENT OF ASSETS AND LIABILITIESDecmber 31, 2018
| | | | |
| |
Assets | | | | |
Investments, at value—see accompanying statement of investments: | | | | |
Unaffiliated companies (cost $1,170,852,283) | | $ | 2,045,371,960 | |
Affiliated companies (cost $12,835,777) | | | 12,835,777 | |
| | | | |
| | | 2,058,207,737 | |
| |
Cash | | | 2,026,072 | |
| |
Cash—foreign currencies (cost $8) | | | 8 | |
| |
Receivables and other assets: | | | | |
Dividends | | | 6,121,873 | |
Shares of beneficial interest sold | | | 5,688,269 | |
Investments sold | | | 2,147,678 | |
Other | | | 182,662 | |
| | | | |
Total assets | | | 2,074,374,299 | |
| |
Liabilities | | | | |
Payables and other liabilities: | | | | |
Shares of beneficial interest redeemed | | | 1,622,704 | |
Distribution and service plan fees | | | 197,655 | |
Trustees’ compensation | | | 152,462 | |
Foreign capital gains tax | | | 60,179 | |
Shareholder communications | | | 49,980 | |
Other | | | 126,767 | |
| | | | |
Total liabilities | | | 2,209,747 | |
| |
Net Assets | | $ | 2,072,164,552 | |
| | | | |
| | | | |
| |
Composition of Net Assets | | | | |
Par value of shares of beneficial interest | | $ | 54,827 | |
| |
Additionalpaid-in capital | | | 858,578,324 | |
| |
Total distributable earnings | | | 1,213,531,401 | |
| | | | |
Net Assets | | $ | 2,072,164,552 | |
| | | | |
| | | | |
| |
Net Asset Value Per Share | | | | |
Non-Service Shares: | | | | |
| Net asset value, redemption price per share and offering price per share (based on net assets of $1,160,316,850 and 30,531,405 shares of beneficial interest outstanding) | | | $38.00 | |
| |
| |
Service Shares: | | | | |
| |
| Net asset value, redemption price per share and offering price per share (based on net assets of $911,847,702 and 24,295,264 shares of beneficial interest outstanding) | | | $37.53 | |
See accompanying Notes to Financial Statements.
9 OPPENHEIMER GLOBAL FUND/VA
STATEMENT OF OPERATIONSFor the Year Ended December 31, 2018
| | | | |
| |
Investment Income | | | | |
Dividends: | | | | |
Unaffiliated companies (net of foreign withholding taxes of $1,774,231) | | $ | 41,353,418 | |
Affiliated companies | | | 291,363 | |
| |
Interest | | | 14,695 | |
| | | | |
Total investment income | | | 41,659,476 | |
|
| |
Expenses | | | | |
Management fees | | | 16,562,044 | |
| |
Distribution and service plan fees - Service shares | | | 3,042,370 | |
| |
Transfer and shareholder servicing agent fees: | | | | |
Non-Service shares | | | 1,684,071 | |
Service shares | | | 1,460,338 | |
| |
Shareholder communications: | | | | |
Non-Service shares | | | 107,629 | |
Service shares | | | 90,397 | |
| |
Custodian fees and expenses | | | 156,196 | |
| |
Borrowing fees | | | 84,418 | |
| |
Trustees’ compensation | | | 73,980 | |
| |
Other | | | 169,630 | |
| | | | |
Total expenses | | | 23,431,073 | |
Less reduction to custodian expenses | | | (1,045) | |
Less waivers and reimbursements of expenses | | | (16,203) | |
| | | | |
Net expenses | | | 23,413,825 | |
|
| |
Net Investment Income | | | 18,245,651 | |
|
| |
Realized and Unrealized Gain (Loss) | | | | |
Net realized gain (loss) on: | | | | |
Investment transactions in unaffiliated companies (net of foreign capital gains tax of $136,498) | | | 389,359,579 | |
Foreign currency transactions | | | (187,862) | |
| | | | |
Net realized gain | | | 389,171,717 | |
| |
Net change in unrealized appreciation/(depreciation) on: | | | | |
Investment transactions in unaffiliated companies | | | (723,643,838) | |
Translation of assets and liabilities denominated in foreign currencies | | | (112,159) | |
| | | | |
Net change in unrealized appreciation/(depreciation) | | | (723,755,997) | |
|
| |
Net Decrease in Net Assets Resulting from Operations | | | $ (316,338,629) | |
| | | | |
See accompanying Notes to Financial Statements.
10 OPPENHEIMER GLOBAL FUND/VA
STATEMENTS OF CHANGES IN NET ASSETS
| | | | | | | | |
| | | Year Ended December 31, 2018 | | | Year Ended
December 31, 20171 | |
| |
Operations | | | | | | | | |
Net investment income | | $ | 18,245,651 | | | $ | 14,689,456 | |
| |
Net realized gain | | | 389,171,717 | | | | 221,558,318 | |
| |
Net change in unrealized appreciation/(depreciation) | | | (723,755,997) | | | | 558,931,074 | |
| | | | |
Net increase (decrease) in net assets resulting from operations | | | (316,338,629) | | | | 795,178,848 | |
| |
Dividends and/or Distributions to Shareholders | | | | | | | | |
Dividends and distributions declared: | | | | | | | | |
Non-Service shares | | | (111,686,198) | | | | (12,766,011) | |
Service shares | | | (97,522,940) | | | | (8,799,180) | |
| | | | |
Total dividends and distributions declared | | | (209,209,138) | | | | (21,565,191) | |
| |
Beneficial Interest Transactions | | | | | | | | |
Net decrease in net assets resulting from beneficial interest transactions: | | | | | | | | |
Non-Service shares | | | (34,187,598) | | | | (179,504,173) | |
Service shares | | | (156,723,848) | | | | (115,703,050) | |
| | | | |
Total beneficial interest transactions | | | (190,911,446) | | | | (295,207,223) | |
| |
Net Assets | | | | | | | | |
Total increase (decrease) | | | (716,459,213) | | | | 478,406,434 | |
| |
Beginning of period | | | 2,788,623,765 | | | | 2,310,217,331 | |
| | | | |
End of period | | $ | 2,072,164,552 | | | $ | 2,788,623,765 | |
| | | | |
1. Prior period amounts have been conformed to current year presentation. See Notes to Financial Statements, Note 2– New Accounting Pronouncements for further details.
See accompanying Notes to Financial Statements.
11 OPPENHEIMER GLOBAL FUND/VA
FINANCIAL HIGHLIGHTS
| | | | | | | | | | | | | | | | | | | | |
| Non-Service Shares | | Year Ended
December 31,
2018 | | | Year Ended
December 31,
2017 | | | Year Ended
December 31,
2016 | | | Year Ended
December 31,
2015 | | | Year Ended
December 31,
2014 | |
| |
Per Share Operating Data | | | | | | | | | | | | | | | | | | | | |
Net asset value, beginning of period | | | $47.42 | | | | $35.02 | | | | $38.00 | | | | $39.50 | | | | $40.86 | |
| |
Income (loss) from investment operations: | | | | | | | | | | | | | | | | | | | | |
Net investment income1 | | | 0.37 | | | | 0.29 | | | | 0.26 | | | | 0.372 | | | | 0.522 | |
Net realized and unrealized gain (loss) | | | (5.99) | | | | 12.50 | | | | (0.42) | | | | 1.382 | | | | 0.442 | |
| | | | |
Total from investment operations | | | (5.62) | | | | 12.79 | | | | (0.16) | | | | 1.75 | | | | 0.96 | |
| |
| Dividends and/or distributions to shareholders: | | | | | | | | | | | | | | | | | | | | |
Dividends from net investment income | | | (0.47) | | | | (0.39) | | | | (0.38) | | | | (0.54) | | | | (0.46) | |
Distributions from net realized gain | | | (3.33) | | | | 0.00 | | | | (2.44) | | | | (2.71) | | | | (1.86) | |
| | | | |
| Total dividends and/or distributions to shareholders | | | (3.80) | | | | (0.39) | | | | (2.82) | | | | (3.25) | | | | (2.32) | |
| |
Net asset value, end of period | | | $38.00 | | | | $47.42 | | | | $35.02 | | | | $38.00 | | | | $39.50 | |
| | | | |
| | | | | | | | | | | | | | | | | | | | |
| |
Total Return, at Net Asset Value3 | | | (13.18)% | | | | 36.66% | | | | 0.08% | | | | 3.94% | | | | 2.29% | |
| | | | | | | | | | | | | | | | | | | | |
| |
Ratios/Supplemental Data | | | | | | | | | | | | | | | | | | | | |
Net assets, end of period (in thousands) | | | $1,160,317 | | | | $1,479,034 | | | | $1,245,070 | | | | $1,406,001 | | | | $1,468,107 | |
| |
Average net assets (in thousands) | | | $1,401,836 | | | | $1,379,895 | | | | $1,270,049 | | | | $1,502,338 | | | | $1,532,383 | |
| |
Ratios to average net assets:4 | | | | | | | | | | | | | | | | | | | | |
Net investment income | | | 0.81% | | | | 0.69% | | | | 0.75% | | | | 0.92%2 | | | | 1.30%2 | |
| Expenses excluding specific expenses listed below | | | 0.78% | | | | 0.76% | | | | 0.77% | | | | 0.76% | | | | 0.76% | |
Interest and fees from borrowings | | | 0.00%5 | | | | 0.00%5 | | | | 0.00%5 | | | | 0.00%5 | | | | 0.00% | |
| | | | |
Total expenses6 | | | 0.78% | | | | 0.76% | | | | 0.77% | | | | 0.76% | | | | 0.76% | |
| Expenses after payments, waivers and/or reimbursements and reduction to custodian expenses | | | 0.78%7 | | | | 0.76%7 | | | | 0.77%7 | | | | 0.76%7 | | | | 0.76%7 | |
| |
Portfolio turnover rate | | | 16% | | | | 9% | | | | 14% | | | | 14% | | | | 13% | |
1. Per share amounts calculated based on the average shares outstanding during the period.
2. Net investment income per share, net realized and unrealized gain (loss) per share and the net investment income ratio include an adjustment for a prior period reclassification for the years ended December 31, 2014 and 2015.
3. Assumes an initial investment on the business day before the first day of the fiscal period, with all dividends and distributions reinvested in additional shares on the reinvestment date, and redemption at the net asset value calculated on the last business day of the fiscal period. Total returns are not annualized for periods less than one full year. Total return information does not reflect expenses that apply at the separate account level or to related insurance products. Inclusion of these charges would reduce the total return figures for all periods shown. Returns do not reflect the deduction of taxes that a shareholder would pay on fund distributions or the redemption of fund shares.
4. Annualized for periods less than one full year.
5. Less than 0.005%.
6. Total expenses including indirect expenses from affiliated fund fees and expenses were as follows:
| | | | | | |
| | Year Ended December 31, 2018 | | | 0.78 | % |
| | Year Ended December 31, 2017 | | | 0.76 | % |
| | Year Ended December 31, 2016 | | | 0.77 | % |
| | Year Ended December 31, 2015 | | | 0.76 | % |
| | Year Ended December 31, 2014 | | | 0.76 | % |
7. Waiver was less than 0.005%.
See accompanying Notes to Financial Statements.
12 OPPENHEIMER GLOBAL FUND/VA
| | | | | | | | | | | | | | | | | | | | |
| Service Shares | | Year Ended
December 31,
2018 | | | Year Ended
December 31,
2017 | | | Year Ended
December 31,
2016 | | | Year Ended
December 31,
2015 | | | Year Ended
December 31,
2014 | |
| |
Per Share Operating Data | | | | | | | | | | | | | | | | | | | | |
Net asset value, beginning of period | | | $46.88 | | | | $34.64 | | | | $37.59 | | | | $39.10 | | | | $40.47 | |
| |
Income (loss) from investment operations: | | | | | | | | | | | | | | | | | | | | |
Net investment income1 | | | 0.26 | | | | 0.18 | | | | 0.17 | | | | 0.282 | | | | 0.422 | |
Net realized and unrealized gain (loss) | | | (5.92) | | | | 12.36 | | | | (0.41) | | | | 1.362 | | | | 0.422 | |
| | | | |
Total from investment operations | | | (5.66) | | | | 12.54 | | | | (0.24) | | | | 1.64 | | | | 0.84 | |
| |
| Dividends and/or distributions to shareholders: | | | | | | | | | | | | | | | | | | | | |
Dividends from net investment income | | | (0.36) | | | | (0.30) | | | | (0.27) | | | | (0.44) | | | | (0.35) | |
Distributions from net realized gain | | | (3.33) | | | | 0.00 | | | | (2.44) | | | | (2.71) | | | | (1.86) | |
| | | | |
| Total dividends and/or distributions to shareholders | | | (3.69) | | | | (0.30) | | | | (2.71) | | | | (3.15) | | | | (2.21) | |
| |
Net asset value, end of period | | | $37.53 | | | | $46.88 | | | | $34.64 | | | | $37.59 | | | | $39.10 | |
| | | | |
| | | | | | | | | | | | | | | | | | | | |
| |
Total Return, at Net Asset Value3 | | | (13.39)% | | | | 36.32% | | | | (0.16)% | | | | 3.67% | | | | 2.06% | |
| | | | | | | | | | | | | | | | | | | | |
| |
Ratios/Supplemental Data | | | | | | | | | | | | | | | | | | | | |
Net assets, end of period (in thousands) | | | $911,848 | | | | $1,309,590 | | | | $1,065,147 | | | | $1,081,711 | | | | $1,204,379 | |
| |
Average net assets (in thousands) | | | $1,215,299 | | | | $1,207,002 | | | | $1,016,772 | | | | $1,219,501 | | | | $1,265,528 | |
| |
Ratios to average net assets:4 | | | | | | | | | | | | | | | | | | | | |
Net investment income | | | 0.56% | | | | 0.43% | | | | 0.49% | | | | 0.70%2 | | | | 1.05%2 | |
| Expenses excluding specific expenses listed below | | | 1.03% | | | | 1.01% | | | | 1.02% | | | | 1.01% | | | | 1.01% | |
Interest and fees from borrowings | | | 0.00%5 | | | | 0.00%5 | | | | 0.00%5 | | | | 0.00%5 | | | | 0.00% | |
| | | | |
Total expenses6 | | | 1.03% | | | | 1.01% | | | | 1.02% | | | | 1.01% | | | | 1.01% | |
| Expenses after payments, waivers and/or reimbursements and reduction to custodian expenses | | | 1.03%7 | | | | 1.01%7 | | | | 1.02%7 | | | | 1.01%7 | | | | 1.01%7 | |
| |
Portfolio turnover rate | | | 16% | | | | 9% | | | | 14% | | | | 14% | | | | 13% | |
1. Per share amounts calculated based on the average shares outstanding during the period.
2. Net investment income per share, net realized and unrealized gain (loss) per share and the net investment income ratio include an adjustment for a prior period reclassification for the years ended December 31, 2014 and 2015.
3. Assumes an initial investment on the business day before the first day of the fiscal period, with all dividends and distributions reinvested in additional shares on the reinvestment date, and redemption at the net asset value calculated on the last business day of the fiscal period. Total returns are not annualized for periods less than one full year. Total return information does not reflect expenses that apply at the separate account level or to related insurance products. Inclusion of these charges would reduce the total return figures for all periods shown. Returns do not reflect the deduction of taxes that a shareholder would pay on fund distributions or the redemption of fund shares.
4. Annualized for periods less than one full year.
5. Less than 0.005%.
6. Total expenses including indirect expenses from affiliated fund fees and expenses were as follows:
| | | | | | |
| | Year Ended December 31, 2018 | | | 1.03 | % |
| | Year Ended December 31, 2017 | | | 1.01 | % |
| | Year Ended December 31, 2016 | | | 1.02 | % |
| | Year Ended December 31, 2015 | | | 1.01 | % |
| | Year Ended December 31, 2014 | | | 1.01 | % |
7. Waiver was less than 0.005%.
See accompanying Notes to Financial Statements.
13 OPPENHEIMER GLOBAL FUND/VA
NOTES TO FINANCIAL STATEMENTSDecember 31, 2018
1. Organization
Oppenheimer Global Fund/VA (the “Fund”), a separate series of Oppenheimer Variable Account Funds, is a diversifiedopen-end management investment company registered under the Investment Company Act of 1940 (“1940 Act”), as amended. The Fund’s investment objective is to seek capital appreciation. The Fund’s investment adviser is OFI Global Asset Management, Inc. (“OFI Global” or the “Manager”), a wholly-owned subsidiary of OppenheimerFunds, Inc. (“OFI” or the“Sub-Adviser”). The Manager has entered into asub-advisory agreement with OFI. Shares of the Fund are sold only to separate accounts of life insurance companies.
The Fund offers two classes of shares. Both classes are sold at their offering price, which is the net asset value per share, to separate investment accounts of participating insurance companies as an underlying investment for variable life insurance policies, variable annuity contracts or other investment products. The class of shares designated as Service shares is subject to a distribution and service plan. Both classes of shares have identical rights and voting privileges with respect to the Fund in general and exclusive voting rights on matters that affect that class alone. Earnings, net assets and net asset value per share may differ due to each class having its own expenses, such as transfer and shareholder servicing agent fees and shareholder communications, directly attributable to that class.
The following is a summary of significant accounting policies followed in the Fund’s preparation of financial statements in accordance with accounting principles generally accepted in the United States (“U.S. GAAP”).
2. Significant Accounting Policies
Security Valuation.All investments in securities are recorded at their estimated fair value, as described in Note 3.
Foreign Currency Translation.The books and records of the Fund are maintained in U.S. dollars. Any foreign currency amounts are translated into U.S. dollars on the following basis:
(1) Value of investment securities, other assets and liabilities — at the exchange rates prevailing at market close as described in Note 3.
(2) Purchases and sales of investment securities, income and expenses — at the rates of exchange prevailing on the respective dates of such transactions.
Although the net assets and the values are presented at the foreign exchange rates at market close, the Fund does not isolate the portion of the results of operations resulting from changes in foreign exchange rates on investments from the fluctuations arising from changes in prices of securities held. Such fluctuations are included with the net realized and unrealized gains or losses from investments shown in the Statement of Operations.
For securities, which are subject to foreign withholding tax upon disposition, realized and unrealized gains or losses on such securities are recorded net of foreign withholding tax.
Reported net realized foreign exchange gains or losses arise from sales of foreign currencies, currency gains or losses realized between the trade and settlement dates on securities transactions, the difference between the amounts of dividends, interest, and foreign withholding tax reclaims recorded on the Fund’s books, and the U.S. dollar equivalent of the amounts actually received or paid. Net unrealized foreign exchange gains and losses arise from changes in the value of assets and liabilities other than investments in securities, resulting from changes in the exchange rate.
Allocation of Income, Expenses, Gains and Losses.Income, expenses (other than those attributable to a specific class), gains and losses are allocated on a daily basis to each class of shares based upon the relative proportion of net assets represented by such class. Operating expenses directly attributable to a specific class are charged against the operations of that class.
Dividends and Distributions to Shareholders. Dividends and distributions to shareholders, which are determined in accordance with income tax regulations and may differ from U.S. GAAP, are recorded on theex-dividend date. Income and capital gain distributions, if any, are declared and paid annually or at other times as determined necessary by the Manager.
Investment Income.Dividend income is recorded on theex-dividend date or uponex-dividend notification in the case of certain foreign dividends where theex-dividend date may have passed.Non-cash dividends included in dividend income, if any, are recorded at the fair value of the securities received. Withholding taxes on foreign dividends, if any, and capital gains taxes on foreign investments, if any, have been provided for in accordance with the Fund’s understanding of the applicable tax rules and regulations. Interest income, if any, is recognized on an accrual basis. Discount and premium, which are included in interest income on the Statement of Operations, are amortized or accreted daily.
Custodian Fees. “Custodian fees and expenses” in the Statement of Operations may include interest expense incurred by the Fund on any cash overdrafts of its custodian account during the period. Such cash overdrafts may result from the effects of failed trades in portfolio securities and from cash outflows resulting from unanticipated shareholder redemption activity. The Fund pays interest to its custodian on such cash overdrafts, to the extent they are not offset by positive cash balances maintained by the Fund, at a rate equal to the Federal Funds Rate plus 2.00%. The “Reduction to custodian expenses” line item, if applicable, represents earnings on cash balances maintained by the Fund during the period. Such interest expense and other custodian fees may be paid with these earnings.
Security Transactions. Security transactions are recorded on the trade date. Realized gains and losses on securities sold are determined on the basis of identified cost.
Indemnifications.The Fund’s organizational documents provide current and former Trustees and officers with a limited indemnification against
14 OPPENHEIMER GLOBAL FUND/VA
2. Significant Accounting Policies (Continued)
liabilities arising in connection with the performance of their duties to the Fund. In the normal course of business, the Fund may also enter into contracts that provide general indemnifications. The Fund’s maximum exposure under these arrangements is unknown as this would be dependent on future claims that may be made against the Fund. The risk of material loss from such claims is considered remote.
Federal Taxes.The Fund intends to comply with provisions of the Internal Revenue Code applicable to regulated investment companies and to distribute substantially all of its investment company taxable income, including any net realized gain on investments not offset by capital loss carryforwards, if any, to shareholders. Therefore, no federal income or excise tax provision is required. The Fund files income tax returns in U.S. federal and applicable state jurisdictions. The statute of limitations on the Fund’s tax return filings generally remains open for the three preceding fiscal reporting period ends. The Fund has analyzed its tax positions for the fiscal year ended December 31, 2018, including open tax years, and does not believe there are any uncertain tax positions requiring recognition in the Fund’s financial statements.
The tax components of capital shown in the following table represent distribution requirements the Fund must satisfy under the income tax regulations, losses the Fund may be able to offset against income and gains realized in future years and unrealized appreciation or depreciation of securities and other investments for federal income tax purposes.
| | | | | | | | | | | | |
Undistributed Net Investment Income | | Undistributed
Long-Term
Gain | | | Accumulated
Loss
Carryforward1,2
| | | Net Unrealized
Appreciation
Based on cost of
Securities and
Other Investments
for Federal Income
Tax Purposes | |
| |
$18,602,380 | | | $339,695,425 | | | | $— | | | | $855,385,904 | |
1. During the reporting period, the Fund did not utilize any capital loss carryforward.
2.During the previous reporting period, the Fund utilized $17,365,953 of capital loss carryforward to offset capital gains realized in that fiscal year.
Net investment income (loss) and net realized gain (loss) may differ for financial statement and tax purposes. The character of dividends and distributions made during the fiscal year from net investment income or net realized gains are determined in accordance with federal income tax requirements, which may differ from the character of net investment income or net realized gains presented in those financial statements in accordance with U.S. GAAP. Also, due to timing of dividends and distributions, the fiscal year in which amounts are distributed may differ from the fiscal year in which the income or net realized gain was recorded by the Fund.
Accordingly, the following amounts have been reclassified for the reporting period. Net assets of the Fund were unaffected by the reclassifications.
| | | | |
Increase to Paid-in Capital | | Reduction to Accumulated
Net Earnings3 | |
| |
$41,445,526 | | | $41,445,526 | |
3. $41,445,526, including $41,433,466 of long-term capital gain, was distributed in connection with Fund share redemptions.
The tax character of distributions paid during the reporting periods:
| | | | | | | | |
| | | Year Ended
December 31, 2018 | | | Year Ended
December 31, 2017 | |
| |
Distributions paid from: | | | | | | | | |
Ordinary income | | $ | 23,283,339 | | | $ | 21,565,191 | |
Long-term capital gain | | | 185,925,799 | | | | — | |
| | | | |
Total | | $ | 209,209,138 | | | $ | 21,565,191 | |
| | | | |
The aggregate cost of securities and other investments and the composition of unrealized appreciation and depreciation of securities and other investments for federal income tax purposes at period end are noted in the following table. The primary difference between book and tax appreciation or depreciation of securities and other investments, if applicable, is attributable to the tax deferral of losses or tax realization of financial statement unrealized gain or loss.
| | | | |
Federal tax cost of securities | | $ | 1,202,560,358 | |
| |
Federal tax cost of other investments | | | 8 | |
| | | | |
Total federal tax cost | | $ | 1,202,560,366 | |
| | | | |
Gross unrealized appreciation | | $ | 979,753,837 | |
| |
Gross unrealized depreciation | | | (124,367,933) | |
| | | | |
Net unrealized appreciation | | $ | 855,385,904 | |
| | | | |
Certain foreign countries impose a tax on capital gains which is accrued by the Fund based on unrealized appreciation, if any, on affected securities. The tax is paid when the gain is realized.
15 OPPENHEIMER GLOBAL FUND/VA
NOTES TO FINANCIAL STATEMENTSContinued
2. Significant Accounting Policies (Continued)
Use of Estimates. The preparation of financial statements in conformity with U.S. GAAP requires management to make estimates and assumptions that affect the reported amounts of assets and liabilities and disclosure of contingent assets and liabilities at the date of the financial statements and the reported amounts of increases and decreases in net assets from operations during the reporting period. Actual results could differ from those estimates.
New Accounting Pronouncements. In March 2017, Financial Accounting Standards Board (“FASB”) issued Accounting Standards Update (“ASU”), ASU2017-08. This provides guidance related to the amortization period for certain purchased callable debt securities held at a premium. The ASU is effective for annual periods beginning after December 15, 2018, and interim periods within those annual periods. The Manager has evaluated the impacts of these changes on the financial statements and there are no material impacts.
During August 2018, the Securities and Exchange Commission (the “SEC”) issued Final Rule ReleaseNo. 33-10532 (the “Rule”), Disclosure Update and Simplification. The rule amends certain financial statement disclosure requirements to conform to U.S. GAAP. The amendments to Rule6-04.17 of RegulationS-X (balance sheet) remove the requirement to separately state the book basis components of net assets: undistributed (over-distribution of) net investment income (“UNII”), accumulated undistributed net realized gains (losses), and net unrealized appreciation (depreciation) at the balance sheet date. Instead, consistent with U.S. GAAP, funds will be required to disclose total distributable earnings. The amendments to Rule6-09 of RegulationS-X (statement of changes in net assets) remove the requirement to separately state the sources of distributions paid. Instead, consistent with U.S. GAAP, funds will be required to disclose the total amount of distributions paid, except that any tax return of capital must be separately disclosed. The amendments also remove the requirement to parenthetically state the book basis amount of UNII on the statement of changes in net assets. The requirements of the Rule are effective November 5, 2018, and the Funds’ Statement of Assets and Liabilities and Statement of Changes in Net Assets for the current reporting period have been modified accordingly. In addition, certain amounts within each Fund’s Statement of Changes in Net Assets for the prior fiscal period have been modified to conform to the Rule.
3. Securities Valuation
The Fund calculates the net asset value of its shares as of 4:00 P.M. Eastern Time, on each day the New York Stock Exchange (the “Exchange” or “NYSE”) is open for trading, except in the case of a scheduled early closing of the Exchange, in which case the Fund will calculate net asset value of the shares as of the scheduled early closing time of the Exchange.
The Fund’s Board has adopted procedures for the valuation of the Fund’s securities and has delegated theday-to-day responsibility for valuation determinations under those procedures to the Manager. The Manager has established a Valuation Committee which is responsible for determining a fair valuation for any security for which market quotations are not readily available. The Valuation Committee’s fair valuation determinations are subject to review, approval and ratification by the Fund’s Board at least quarterly or more frequently, if necessary.
Valuation Methods and Inputs
Securities are valued primarily using unadjusted quoted market prices, when available, as supplied by third party pricing services or broker-dealers.
The following methodologies are used to determine the market value or the fair value of the types of securities described below:
Equity securities traded on a securities exchange (including exchange-traded derivatives other than futures and futures options) are valued based on the official closing price on the principal exchange on which the security is traded, as identified by the Manager, prior to the time when the Fund’s assets are valued. If the official closing price is unavailable, the security is valued at the last sale price on the principal exchange on which it is traded, or if no sales occurred, the security is valued at the mean between the quoted bid and asked prices.Over-the-counter equity securities are valued at the last published sale price, or if no sales occurred, at the mean between the quoted bid and asked prices. Events occurring after the close of trading on foreign exchanges may result in adjustments to the valuation of foreign securities to more accurately reflect their fair value as of the time when the Fund’s assets are valued.
Shares of a registered investment company that are not traded on an exchange are valued at that investment company’s net asset value per share.
Securities for which market quotations are not readily available, or when a significant event has occurred that would materially affect the value of the security, are fair valued either (i) by a standardized fair valuation methodology applicable to the security type or the significant event as previously approved by the Valuation Committee and the Fund’s Board or (ii) as determined in good faith by the Manager’s Valuation Committee. The Valuation Committee considers all relevant facts that are reasonably available, through either public information or information available to the Manager, when determining the fair value of a security. Those standardized fair valuation methodologies include, but are not limited to, valuing securities at the last sale price or initially at cost and subsequently adjusting the value based on: changes in company specific fundamentals, changes in an appropriate securities index, or changes in the value of similar securities which may be further adjusted for any discounts related to security-specific resale restrictions. When possible, such methodologies use observable market inputs such as unadjusted quoted prices of similar securities, observable interest rates, currency rates and yield curves. The methodologies used for valuing securities are not necessarily an indication of the risks associated with investing in those securities nor can it be assured that the Fund can obtain the fair value assigned to a security if it were to sell the security.
Classifications
Each investment asset or liability of the Fund is assigned a level at measurement date based on the significance and source of the inputs to its valuation. Various data inputs may be used in determining the value of each of the Fund’s investments as of the reporting period end. These data inputs are categorized in the following hierarchy under applicable financial accounting standards:
1) Level1-unadjusted quoted prices in active markets for identical assets or liabilities (including securities actively traded on a securities exchange)
16 OPPENHEIMER GLOBAL FUND/VA
3. Securities Valuation (Continued)
2) Level2-inputs other than unadjusted quoted prices that are observable for the asset or liability (such as unadjusted quoted prices for similar assets and market corroborated inputs such as interest rates, prepayment speeds, credit risks, etc.)
3) Level3-significant unobservable inputs (including the Manager’s own judgments about assumptions that market participants would use in pricing the asset or liability).
The inputs used for valuing securities are not necessarily an indication of the risks associated with investing in those securities.
The Fund classifies each of its investments in investment companies which are publicly offered as Level 1. Investment companies that are not publicly offered, if any, are classified as Level 2 in the fair value hierarchy.
The table below categorizes amounts that are included in the Fund’s Statement of Assets and Liabilities at period end based on valuation input level:
| | | | | | | | | | | | | | | | |
| | | Level 1— Unadjusted Quoted Prices | | | Level 2— Other Significant
Observable Inputs | | | Level 3—
Significant
Unobservable
Inputs | | | Value | |
| |
Assets Table | | | | | | | | | | | | | | | | |
Investments, at Value: | | | | | | | | | | | | | | | | |
Common Stocks | | | | | | | | | | | | | | | | |
Consumer Discretionary | | $ | 344,683,715 | | | $ | 222,664,358 | | | $ | — | | | $ | 567,348,073 | |
Consumer Staples | | | 38,942,150 | | | | 45,223,407 | | | | — | | | | 84,165,557 | |
Energy | | | — | | | | 14,161,182 | | | | — | | | | 14,161,182 | |
Financials | | | 154,466,872 | | | | 201,302,302 | | | | — | | | | 355,769,174 | |
Health Care | | | 264,983,005 | | | | 30,876,386 | | | | — | | | | 295,859,391 | |
Industrials | | | 76,613,771 | | | | 238,362,285 | | | | — | | | | 314,976,056 | |
Information Technology | | | 210,511,927 | | | | 202,137,037 | | | | — | | | | 412,648,964 | |
Preferred Stock | | | 443,563 | | | | — | | | | — | | | | 443,563 | |
Investment Company | | | 12,835,777 | | | | — | | | | — | | | | 12,835,777 | |
| | | | |
Total Assets | | $ | 1,103,480,780 | | | $ | 954,726,957 | | | $ | — | | | $ | 2,058,207,737 | |
| | | | |
Forward currency exchange contracts and futures contracts, if any, are reported at their unrealized appreciation/depreciation at measurement date, which represents the change in the contract’s value from trade date. All additional assets and liabilities included in the above table are reported at their market value at measurement date.
For the reporting period, there were no transfers between levels.
4. Investments and Risks
Risks of Foreign Investing.The Fund may invest in foreign securities which are subject to special risks. Securities traded in foreign markets may be less liquid and more volatile than those traded in U.S. markets. Foreign issuers are usually not subject to the same accounting and disclosure requirements that U.S. companies are subject to, which may make it difficult for the Fund to evaluate a foreign company’s operations or financial condition. A change in the value of a foreign currency against the U.S. dollar will result in a change in the U.S. dollar value of investments denominated in that foreign currency and in the value of any income or distributions the Fund may receive on those investments. The value of foreign investments may be affected by exchange control regulations, foreign taxes, higher transaction and other costs, delays in the settlement of transactions, changes in economic or monetary policy in the United States or abroad, expropriation or nationalization of a company’s assets, or other political and economic factors. In addition, due to the inter-relationship of global economies and financial markets, changes in political and economic factors in one country or region could adversely affect conditions in another country or region. Investments in foreign securities may also expose the Fund to time-zone arbitrage risk. Foreign securities may trade on weekends or other days when the Fund does not price its shares. At times, the Fund may emphasize investments in a particular country or region and may be subject to greater risks from adverse events that occur in that country or region. Foreign securities and foreign currencies held in foreign banks and securities depositories may be subject to limited or no regulatory oversight.
Investments in Affiliated Funds. The Fund is permitted to invest in other mutual funds advised by the Manager (“Affiliated Funds”). Affiliated Funds are management investment companies registered under the 1940 Act, as amended. The Manager is the investment adviser of, and theSub-Adviser provides investment and related advisory services to, the Affiliated Funds. When applicable, the Fund’s investments in Affiliated Funds are included in the Statement of Investments. Shares of Affiliated Funds are valued at their net asset value per share. As a shareholder, the Fund is subject to its proportional share of the Affiliated Funds’ expenses, including their management fee. The Manager will waive fees and/or reimburse Fund expenses in an amount equal to the indirect management fees incurred through the Fund’s investment in the Affiliated Funds.
Each of the Affiliated Funds in which the Fund invests has its own investment risks, and those risks can affect the value of the Fund’s investments and therefore the value of the Fund’s shares. To the extent that the Fund invests more of its assets in one Affiliated Fund than in another, the Fund will have greater exposure to the risks of that Affiliated Fund.
Investments in Money Market Instruments.The Fund is permitted to invest its free cash balances in money market instruments to provide liquidity or for defensive purposes. The Fund may invest in money market instruments by investing in Class E shares of Oppenheimer Institutional Government Money Market Fund (“IGMMF”), which is an Affiliated Fund. IGMMF is regulated as a money market fund under the 1940 Act, as amended. The Fund
17 OPPENHEIMER GLOBAL FUND/VA
NOTES TO FINANCIAL STATEMENTSContinued
4. Investments and Risks (Continued)
may also invest in money market instruments directly or in other affiliated or unaffiliated money market funds.
Equity Security Risk.Stocks and other equity securities fluctuate in price. The value of the Fund’s portfolio may be affected by changes in the equity markets generally. Equity markets may experience significant short-term volatility and may fall sharply at times. Different markets may behave differently from each other and U.S. equity markets may move in the opposite direction from one or more foreign stock markets. Adverse events in any part of the equity or fixed-income markets may have unexpected negative effects on other market segments.
The prices of individual equity securities generally do not all move in the same direction at the same time and a variety of factors can affect the price of a particular company’s securities. These factors may include, but are not limited to, poor earnings reports, a loss of customers, litigation against the company, general unfavorable performance of the company’s sector or industry, or changes in government regulations affecting the company or its industry.
Shareholder Concentration.At period end, two shareholders each owned 20% or more of the Fund’s total outstanding shares.
A shareholder is a related partyof the Fund. Related parties may include, but are not limited to, the investment manager and its affiliates, affiliated broker dealers, fund of funds, and directors or employees. The related partyowned 30% of the Fund’s total outstanding shares at period end.
5. Market Risk Factors
The Fund’s investments in securities and/or financial derivatives may expose the Fund to various market risk factors:
Commodity Risk. Commodity risk relates to the change in value of commodities or commodity indexes as they relate to increases or decreases in the commodities market. Commodities are physical assets that have tangible properties. Examples of these types of assets are crude oil, heating oil, metals, livestock, and agricultural products.
Credit Risk.Credit risk relates to the ability of the issuer of debt to meet interest and principal payments, or both, as they come due. In general, lower-grade, higher-yield debt securities are subject to credit risk to a greater extent than lower-yield, higher-quality securities.
Equity Risk. Equity risk relates to the change in value of equity securities as they relate to increases or decreases in the general market.
Foreign Exchange Rate Risk. Foreign exchange rate risk relates to the change in the U.S. dollar value of a security held that is denominated in a foreign currency. The U.S. dollar value of a foreign currency denominated security will decrease as the dollar appreciates against the currency, while the U.S. dollar value will increase as the dollar depreciates against the currency.
Interest Rate Risk.Interest rate risk refers to the fluctuations in value of fixed-income securities resulting from the inverse relationship between price and yield. For example, an increase in general interest rates will tend to reduce the market value of already issued fixed-income investments, and a decline in general interest rates will tend to increase their value. In addition, debt securities with longer maturities, which tend to have higher yields, are subject to potentially greater fluctuations in value from changes in interest rates than obligations with shorter maturities.
Volatility Risk.Volatility risk refers to the magnitude of the movement, but not the direction of the movement, in a financial instrument’s price over a defined time period. Large increases or decreases in a financial instrument’s price over a relative time period typically indicate greater volatility risk, while small increases or decreases in its price typically indicate lower volatility risk.
6. Shares of Beneficial Interest
The Fund has authorized an unlimited number of $0.001 par value shares of beneficial interest of each class. Transactions in shares of beneficial interest were as follows:
| | | | | | | | | | | | | | | | |
| | | Year Ended December 31, 2018 | | | Year Ended December 31, 2017 | |
| | | Shares | | | | Amount | | | | Shares | | | | Amount | |
| |
Non-Service Shares | | | | | | | | | | | | | | | | |
Sold | | | 1,572,044 | | | $ | 70,351,613 | | | | 1,449,891 | | | $ | 60,471,325 | |
Dividends and/or distributions reinvested | | | 2,449,259 | | | | 111,686,198 | | | | 305,626 | | | | 12,766,011 | |
Redeemed | | | (4,681,582) | | | | (216,225,409) | | | | (6,113,341) | | | | (252,741,509) | |
| | | | |
Net decrease | | | (660,279) | | | $ | (34,187,598) | | | | (4,357,824) | | | $ | (179,504,173) | |
| | | | |
|
| |
Service Shares | | | | | | | | | | | | | | | | |
Sold | | | 2,224,972 | | | $ | 100,346,158 | | | | 2,582,124 | | | $ | 107,475,911 | |
Dividends and/or distributions reinvested | | | 2,162,851 | | | | 97,522,940 | | | | 212,797 | | | | 8,799,180 | |
Redeemed | | | (8,029,064) | | | | (354,592,946) | | | | (5,605,593) | | | | (231,978,141) | |
| | | | |
Net decrease | | | (3,641,241) | | | $ | (156,723,848) | | | | (2,810,672) | | | $ | (115,703,050) | |
| | | | |
7. Purchases and Sales of Securities
The aggregate cost of purchases and proceeds from sales of securities, other than short-term obligations and investments in IGMMF, for the reporting period were as follows:
| | | | | | | | |
| | | Purchases | | | Sales | |
| |
Investment securities | | $ | 420,953,394 | | | | $797,389,581 | |
18 OPPENHEIMER GLOBAL FUND/VA
8. Fees and Other Transactions with Affiliates
Management Fees.Under the investment advisory agreement, the Fund pays the Manager a management fee based on the daily net assets of the Fund at an annual rate as shown in the following table:
| | |
| Fee Schedule |
|
Up to $200 million | | 0.75% |
Next $200 million | | 0.72 |
Next $200 million | | 0.69 |
Next $200 million | | 0.66 |
Next $4.2 billion | | 0.60 |
Over $5 billion | | 0.58 |
The Fund’s effective management fee for the reporting period was 0.63% of average annual net assets before any applicable waivers.
Sub-Adviser Fees.The Manager has retained theSub-Adviser to provide theday-to-day portfolio management of the Fund. Under theSub-Advisory Agreement, the Manager pays theSub-Adviser an annual fee in monthly installments, equal to a percentage of the investment management fee collected by the Manager from the Fund, which shall be calculated after any investment management fee waivers. The fee paid to theSub-Adviser is paid by the Manager, not by the Fund.
Transfer Agent Fees.OFI Global (the “Transfer Agent”) serves as the transfer and shareholder servicing agent for the Fund. The Fund pays the Transfer Agent a fee based on annual net assets. Fees incurred and average net assets for each class with respect to these services are detailed in the Statement of Operations and Financial Highlights, respectively.
Sub-Transfer Agent Fees.The Transfer Agent has retained Shareholder Services, Inc., a wholly-owned subsidiary of OFI (the“Sub-Transfer Agent”), to provide theday-to-day transfer agent and shareholder servicing of the Fund. Under theSub-Transfer Agency Agreement, the Transfer Agent pays theSub-Transfer Agent an annual fee in monthly installments, equal to a percentage of the transfer agent fee collected by the Transfer Agent from the Fund, which shall be calculated after any applicable fee waivers. The fee paid to theSub-Transfer Agent is paid by the Transfer Agent, not by the Fund.
Trustees’ Compensation. The Fund’s Board of Trustees (“Board”) has adopted a compensation deferral plan for Independent Trustees that enables Trustees to elect to defer receipt of all or a portion of the annual compensation they are entitled to receive from the Fund. For purposes of determining the amount owed to the Trustees under the plan, deferred amounts are treated as though equal dollar amounts had been invested in shares of the Fund or in other Oppenheimer funds selected by the Trustees. The Fund purchases shares of the funds selected for deferral by the Trustees in amounts equal to his or her deemed investment, resulting in a Fund asset equal to the deferred compensation liability. Such assets are included as a component of “Other” within the asset section of the Statement of Assets and Liabilities. Deferral of Trustees’ fees under the plan will not affect the net assets of the Fund and will not materially affect the Fund’s assets, liabilities or net investment income per share. Amounts will be deferred until distributed in accordance with the compensation deferral plan.
Distribution and Service Plan for Service Shares.The Fund has adopted a Distribution and Service Plan (the “Plan”) pursuant to Rule12b-1 under the 1940 Act for Service shares to pay OppenheimerFunds Distributor, Inc. (the “Distributor”), for distribution related services, personal service and account maintenance for the Fund’s Service shares. Under the Plan, payments are made periodically at an annual rate of 0.25% of the daily net assets of Service shares of the Fund. The Distributor currently uses all of those fees to compensate sponsors of the insurance product that offers Fund shares, for providing personal service and maintenance of accounts of their variable contract owners that hold Service shares. These fees are paid out of the Fund’s assets on anon-going basis and increase operating expenses of the Service shares, which results in lower performance compared to the Fund’s shares that are not subject to a service fee. Fees incurred by the Fund under the Plan are detailed in the Statement of Operations.
Waivers and Reimbursements of Expenses. The Manager will waive fees and/or reimburse Fund expenses in an amount equal to the indirect management fees incurred through the Fund’s investment in IGMMF. During the reporting period, the Manager waived fees and/or reimbursed the Fund $16,203 for IGMMF management fees.
9. Borrowings and Other Financing
Joint Credit Facility.A number of mutual funds managed by the Manager participate in a $1.95 billion revolving credit facility (the “Facility”) intended to provide short-term financing, if necessary, subject to certain restrictions in connection with atypical redemption activity. Expenses and fees related to the Facility are paid by the participating funds and are disclosed separately or as other expenses on the Statement of Operations. The Fund did not utilize the Facility during the reporting period.
10. Pending Acquisition
On October 18, 2018, Massachusetts Mutual Life Insurance Company, an indirect corporate parent of theSub-Adviser and the Manager, announced that it has entered into an agreement whereby Invesco Ltd. (“Invesco”), a global investment management company, will acquire theSub-Adviser (the “Transaction”). In connection with the Transaction, on January 11, 2019, the Fund’s Board unanimously approved an Agreement and Plan of
19 OPPENHEIMER GLOBAL FUND/VA
NOTES TO FINANCIAL STATEMENTSContinued
10. Pending Acquisition (Continued)
Reorganization (the “Agreement”), which provides for the transfer of the assets and liabilities of the Fund to a corresponding, newly formed fund (the “Acquiring Fund”) in the Invesco family of funds (the “Reorganization”) in exchange for shares of the corresponding Acquiring Fund of equal value to the value of the shares of the Fund as of the close of business on the closing date. Although the Acquiring Fund will be managed by Invesco Advisers, Inc., the Acquiring Fund will, as of the closing date, have the same investment objective and substantially similar principal investment strategies and risks as the Fund. After the Reorganization, Invesco Advisers, Inc. will be the investment adviser to the Acquiring Fund, and the Fund will be liquidated and dissolved under applicable law and terminate its registration under the Investment Company Act of 1940, as amended. The Reorganization is expected to be atax-free reorganization for U.S. federal income tax purposes.
The Reorganization is subject to the approval of shareholders of the Fund. Shareholders of record of the Fund on January 14, 2019 will be entitled to vote on the Reorganization and will receive a combined prospectus and proxy statement describing the Reorganization, the shareholder meeting, and a discussion of the factors the Fund’s Board considered in approving the Agreement. The combined prospectus and proxy statement is expected to be distributed to shareholders of record on or about February 28, 2019. The anticipated date of the shareholder meeting is on or about April 12, 2019.
If shareholders approve the Agreement and certain other closing conditions are satisfied or waived, the Reorganization is expected to close during the second quarter of 2019, or as soon as practicable thereafter. This is subject to change.
20 OPPENHEIMER GLOBAL FUND/VA
REPORT OF INDEPENDENT REGISTERED PUBLIC ACCOUNTING FIRM
To the Shareholders and Board of Trustees
Oppenheimer Variable Account Funds:
Opinion on the Financial Statements
We have audited the accompanying statement of assets and liabilities of Oppenheimer Global Fund/VA, a separate series of Oppenheimer Variable Account Funds, (the “Fund”), including the statement of investments, as of December 31, 2018, the related statement of operations for the year then ended, the statements of changes in net assets for each of the years in the two year period then ended, and the related notes (collectively, the “financial statements”) and the financial highlights for each of the years in the five year period then ended. In our opinion, the financial statements and financial highlights present fairly, in all material respects, the financial position of the Fund as of December 31, 2018, the results of its operations for the year then ended, the changes in its net assets for each of the years in the two year period then ended, and the financial highlights for each of the years in the five year period then ended, in conformity with U.S. generally accepted accounting principles.
Basis for Opinion
These financial statements and financial highlights are the responsibility of the Fund’s management. Our responsibility is to express an opinion on these financial statements and financial highlights based on our audits. We are a public accounting firm registered with the Public Company Accounting Oversight Board (United States) (“PCAOB”) and are required to be independent with respect to the Fund in accordance with the U.S. federal securities laws and the applicable rules and regulations of the Securities and Exchange Commission and the PCAOB.
We conducted our audits in accordance with the standards of the PCAOB. Those standards require that we plan and perform the audit to obtain reasonable assurance about whether the financial statements and financial highlights are free of material misstatement, whether due to error or fraud. Our audits included performing procedures to assess the risks of material misstatement of the financial statements and financial highlights, whether due to error or fraud, and performing procedures that respond to those risks. Such procedures included examining, on a test basis, evidence regarding the amounts and disclosures in the financial statements and financial highlights. Such procedures also included confirmation of securities owned as of December 31, 2018, by correspondence with the custodian and the transfer agent, or by other appropriate auditing procedures. Our audits also included evaluating the accounting principles used and significant estimates made by management, as well as evaluating the overall presentation of the financial statements and financial highlights. We believe that our audits provide a reasonable basis for our opinion.
KPMGLLP
We have not been able to determine the specific year that we began serving as the auditor of one or more Oppenheimer Funds investment companies, however we are aware that we have served as the auditor of one or more Oppenheimer Funds investment companies since at least 1969.
Denver, Colorado
February 14, 2019
21 OPPENHEIMER GLOBAL FUND/VA
FEDERAL INCOME TAX INFORMATIONUnaudited
In early 2019, if applicable, shareholders of record received information regarding all dividends and distributions paid to them by the Fund during calendar year 2018.
Capital gain distributions of $3.33306 per share were paid toNon-Service and Serviceshareholders, respectively, on June 19, 2018. Whether received in stock or in cash, the capital gain distribution should be treated by shareholders as a gain from the sale of the capital assets held for more than one year (long-term capital gains).
Dividends, if any, paid by the Fund during the reporting period which are not designated as capital gain distributions should be multiplied by the maximum amount allowable but not less than 61.73% to arrive at the amount eligible for the corporate dividend-received deduction.
Dividends, if any, paid by the Fund during the reporting period which are not designated as capital gain distributions, may be eligible for lower individual income tax rates to the extent that the Fund has received qualified dividend income as stipulated by recent tax legislation. In early 2019, shareholders of record received information regarding the percentage of distributions that are eligible for lower individual income tax rates. The amount will be the maximum amount allowed.
The Fund has elected the application of Section 853 of the Internal Revenue Code to permit shareholders to take a federal income tax credit or deduction, at their option, on a per share basis. The maximum amount allowable but not less than $2,618,221 of foreign income taxes were paid by the Fund during the reporting period. A separate notice will be mailed to each shareholder, which will reflect the proportionate share of such foreign taxes which must be treated by shareholders as gross income for federal income tax purposes.
Gross income of the maximum amount allowable but not less than $16,574,216 was derived from sources within foreign countries or possessions of the United States.
The foregoing information is presented to assist shareholders in reporting distributions received from the Fund to the Internal Revenue Service. Because of the complexity of the federal regulations which may affect your individual tax return and the many variations in state and local tax regulations, we recommend that you consult your tax advisor for specific guidance.
22 OPPENHEIMER GLOBAL FUND/VA
BOARD APPROVAL OF THE FUND’S INVESTMENT ADVISORY ANDSUB-ADVISORY AGREEMENTSUnaudited
The Fund has entered into an investment advisory agreement with OFI Global Asset Management, Inc. (“OFI Global” or the “Adviser”), a wholly-owned subsidiary of OppenheimerFunds, Inc. (“OFI” or the“Sub-Adviser”) (“OFI Global” and “OFI” together the “Managers”) and OFI Global has entered into asub-advisory agreement with OFI whereby OFI provides investmentsub-advisory services to the Fund (collectively, the “Agreements”). Each year, the Board of Trustees (the “Board”), including a majority of the independent Trustees, is required to determine whether to approve the terms of the Agreements and the renewal thereof. The Investment Company Act of 1940, as amended, requires that the Board request and evaluate, and that the Managers provide, such information as may be reasonably necessary to evaluate the terms of the Agreements. The Board employs an independent consultant to prepare a report that provides information, including comparative information that the Board requests for that purpose. In addition toin-person meetings focused on this evaluation, the Board receives information throughout the year regarding Fund services, fees, expenses and performance.
The Managers and the independent consultant provided information to the Board on the following factors: (i) the nature, quality and extent of the Managers’ services, (ii) the comparative investment performance of the Fund and the Managers, (iii) the fees and expenses of the Fund, including comparative fee and expense information, (iv) the profitability of the Managers and their affiliates, including an analysis of the cost of providing services, (v) whether economies of scale are realized as the Fund grows and whether fee levels reflect these economies of scale for Fund investors and (vi) other benefits to the Managers from their relationship with the Fund. The Board was aware that there are alternatives to retaining the Managers.
Outlined below is a summary of the principal information considered by the Board as well as the Board’s conclusions.
Nature, Quality and Extent of Services.The Board considered information about the nature, quality and extent of the services provided to the Fund and information regarding the Managers’ key personnel who provide such services. The Managers’ duties include providing the Fund with the services of theSub-Adviser’s portfolio managers and investment team, who provide research, analysis and other advisory services in regard to the Fund’s investments; and securities trading services. OFI Global is responsible for oversight of third-party service providers; monitoring compliance with applicable Fund policies and procedures and adherence to the Fund’s investment restrictions; risk management; and oversight of theSub-Adviser. OFI Global is also responsible for providing certain administrative services to the Fund. Those services include providing and supervising all administrative and clerical personnel who are necessary in order to provide effective corporate administration for the Fund; compiling and maintaining records with respect to the Fund’s operations; preparing and filing reports required by the U.S. Securities and Exchange Commission; preparing periodic reports regarding the operations of the Fund for its shareholders; preparing proxy materials for shareholder meetings; and preparing the registration statements required by federal and state securities laws for the sale of the Fund’s shares. OFI Global also provides the Fund with office space, facilities and equipment.
The Board also considered the quality of the services provided and the quality of the Managers’ resources that are available to the Fund. The Board took account of the fact that theSub-Adviser has over fifty years of experience as an investment adviser and that its assets under management rank it among the top mutual fund managers in the United States. The Board evaluated the Managers’ advisory, administrative, accounting, legal, compliance and risk management services, among other services, and information the Board has received regarding the experience and professional qualifications of the Managers’ key personnel and the size and functions of their staff. In its evaluation of the quality of the portfolio management services provided, the Board considered the experience of Rajeev Bhaman and John Delano, the portfolio managers for the Fund, and theSub-Adviser’s investment team and analysts. The Board members also considered the totality of their experiences with the Managers as directors or trustees of the Fund and other funds advised by the Managers. The Board considered information regarding the quality of services provided by affiliates of the Managers, which the Board members have become knowledgeable about through their experiences with the Managers and in connection with the review or renewal of the Fund’s service agreements or service providers. The Board concluded, in light of the Managers’ experience, reputation, personnel, operations and resources that the Fund benefits from the services provided under the Agreements.
Investment Performance of the Managers and the Fund.Throughout the year, the Managers provided information on the investment performance of the Fund, the Adviser and theSub-Adviser, including comparative performance information. The Board also reviewed information, prepared by the Managers and by the independent consultant, comparing the Fund’s historical performance to relevant market indices and to the performance of other world large stock funds underlying variable insurance products. The Board considered that the Fund outperformed its category median during all periods.
Fees and Expenses of the Fund.The Board reviewed the fees paid to the Adviser and the other expenses borne by the Fund. The Board noted that the Adviser, not the Fund, pays theSub-Adviser’s fee under thesub-advisory agreement. The independent consultant provided comparative data in regard to the fees and expenses of the Fund and other world large stock funds underlying variable insurance products. In reviewing the fees and expenses charged to the VA funds, the Board considered the Adviser’s assertion that, because there is much greater disparity in the fees and services that may be provided by a manager to a VA fund as opposed to a retail fund, when comparing the expenses of the various VA funds to those of retail funds, it is most appropriate to focus on total expenses (rather than on the management fees). The Board considered that the Fund’s total expenses and contractual management fee were lower than their respective peer group medians and category medians. The Board further considered that the Adviser has agreed to waive fees and/or reimburse Fund expenses in an amount equal to the management fees incurred indirectly through the Fund’s investments in funds managed by the Adviser or its affiliates.
Economies of Scale and Profits Realized by the Managers.The Board considered information regarding the Managers’ costs in serving as the Fund’s investment adviser andsub-adviser, including the costs associated with the personnel and systems necessary to manage the Fund, and information regarding the Managers’ profitability from their relationship with the Fund. The Board also considered that the Managers must be able to pay and retain experienced professional personnel at competitive rates to provide quality services to the Fund. The Board reviewed whether the Managers may realize economies of scale in managing and supporting the Fund. The Board noted that the Fund currently has management fee breakpoints, which are intended to share with Fund shareholders economies of scale that may exist as the Fund’s assets grow.
Other Benefits to the Managers.In addition to considering the profits realized by the Managers, the Board considered information that was provided regarding the direct and indirect benefits the Managers receive as a result of their relationship with the Fund, including compensation paid to the Managers’ affiliates and research provided to the Adviser in connection with permissible brokerage arrangements (soft dollar arrangements).
23 OPPENHEIMER GLOBAL FUND/VA
BOARD APPROVAL OF THE FUND’S INVESTMENT ADVISORY ANDSUB-ADVISORY AGREEMENTSUnaudited / Continued
Conclusions.These factors were also considered by the independent Trustees meeting separately from the full Board, assisted by experienced counsel to the Fund and to the independent Trustees. Fund counsel and the independent Trustees’ counsel are independent of the Managers within the meaning and intent of the Securities and Exchange Commission Rules.
Based on its review of the information it received and its evaluations described above, the Board, including a majority of the independent Trustees, decided to continue the Agreements through August 31, 2019. In arriving at its decision, the Board did not identify any factor or factors as being more important than others, but considered all of the above information, and considered the terms and conditions of the Agreements, including the management fees, in light of all the surrounding circumstances.
24 OPPENHEIMER GLOBAL FUND/VA
PORTFOLIO PROXY VOTING POLICIES AND GUIDELINES; UPDATES TO STATEMENT OF INVESTMENTSUnaudited
The Fund has adopted Portfolio Proxy Voting Policies and Guidelines under which the Fund votes proxies relating to securities (“portfolio proxies”) held by the Fund. A description of the Fund’s Portfolio Proxy Voting Policies and Guidelines is available (i) without charge, upon request, by calling the Fund toll-free at 1.800.CALL OPP (225.5677), (ii) on the Fund’s website at www.oppenheimerfunds.com, and (iii) on the SEC’s website at www.sec.gov. In addition, the Fund is required to file FormN-PX, with its complete proxy voting record for the 12 months ended June 30th, no later than August 31st of each year. The Fund’s voting record is available (i) without charge, upon request, by calling the Fund toll-free at 1.800.CALL OPP (225.5677), and (ii) in the FormN-PX filing on the SEC’s website at www.sec.gov.
The Fund files its complete schedule of portfolio holdings with the SEC for the first quarter and the third quarter of each fiscal year on FormN-Q. The Fund’s FormN-Q filings are available on the SEC’s website at www.sec.gov.
25 OPPENHEIMER GLOBAL FUND/VA
TRUSTEES AND OFFICERSUnaudited
| | |
Name, Position(s) Held with the Fund, Length of
Service, Year of Birth | | Principal Occupation(s) During the Past 5 Years; Other Trusteeships/Directorships
Held; Number of Portfolios in the Fund Complex Currently Overseen |
| |
| INDEPENDENT TRUSTEES | | The address of each Trustee in the chart below is 6803 S. Tucson Way, Centennial, Colorado 80112-3924. Each Trustee serves for an indefinite term, or until his or her resignation, retirement, death or removal. Each of the Trustees in the chart below oversees 58 portfolios in the OppenheimerFunds complex. |
| |
Robert J. Malone,
Chairman of the Board of Trustees (since 2016),
Trustee (since 2002)
Year of Birth: 1944 | | Chairman - Colorado Market of MidFirst Bank (since January 2015); Chairman of the Board (2012-2016) and Director (August 2005-January 2016) of Jones International University (educational organization); Trustee of the Gallagher Family Foundation(non-profit organization) (2000-2016); Chairman, Chief Executive Officer and Director of Steele Street Bank Trust (commercial banking) (August 2003-January 2015); Director of Opera Colorado Foundation(non-profit organization) (2008-2012); Director of Colorado UpLIFT (charitable organization) (1986-2010); Director of Jones Knowledge, Inc. (2006-2010); Former Chairman of U.S. Bank-Colorado (subsidiary of U.S. Bancorp and formerly Colorado National Bank) (July 1996-April 1999); Director of Commercial Assets, Inc. (real estate investment trust) (1993-2000); Director of U.S. Exploration, Inc. (oil and gas exploration) (1997-February 2004); Chairman of the Board (1991-1994) and Trustee (1985-1994) of Regis University; and Chairman of the Board (1990-1991) and Member (1984-1999) of Young Presidents Organization. Mr. Malone has served on the Boards of certain Oppenheimer funds since 2002, during which time he has become familiar with the Fund’s (and other Oppenheimer funds’) financial, accounting, regulatory and investment matters and has contributed to the Board’s deliberations. |
| |
Andrew J. Donohue, Trustee (since 2017) Year of Birth: 1950 | | Director, Mutual Fund Directors Forum (since February 2018); Of Counsel, Shearman & Sterling LLP (since September 2017); Chief of Staff of the U.S. Securities and Exchange Commission (regulator) (June 2015-February 2017); Managing Director and Investment Company General Counsel of Goldman Sachs (investment bank) (November2012-May 2015); Partner at Morgan Lewis & Bockius, LLP (law firm) (March 2011-October 2012); Director of the Division of Investment Management of U.S. Securities and Exchange Commission (regulator) (May 2006-November 2010); Global General Counsel of Merrill Lynch Investment Managers (investment firm) (May2003-May 2006); General Counsel (October 1991-November 2001) and Executive Vice President (January 1993-November 2001) of OppenheimerFunds, Inc. (investment firm) (June 1991-November 2001). Mr. Donohue has served on the Boards of certain Oppenheimer funds since 2017, during which time he has become familiar with the Fund’s (and other Oppenheimer funds’) financial, accounting, regulatory and investment matters and has contributed to the Board’s deliberations. |
| |
Richard F. Grabish,
Trustee (since 2012)
Year of Birth: 1948 | | Formerly Senior Vice President and Assistant Director of Sales and Marketing (March 1997-December 2007), Director (March 1987-December 2007) and Manager of Private Client Services (June 1985-June 2005) of A.G. Edwards & Sons, Inc. (broker/dealer and investment firm); Chairman and Chief Executive Officer of A.G. Edwards Trust Company, FSB (March 2001-December 2007); President and Vice Chairman of A.G. Edwards Trust Company, FSB (investment adviser) (April 1987-March 2001); President of A.G. Edwards Trust Company, FSB (investment adviser) (June 2005-December 2007). Mr. Grabish has served on the Boards of certain Oppenheimer funds since 2001, during which time he has become familiar with the Fund’s (and other Oppenheimer funds’) financial, accounting, regulatory and investment matters and has contributed to the Board’s deliberations. |
| |
Beverly L. Hamilton,
Trustee (since 2002)
Year of Birth: 1946 | | Trustee of Monterey Institute for International Studies (educational organization) (2000-2014); Board Member of Middlebury College (educational organization) (December 2005-June 2011); Director of the Board (1991-2016), Vice Chairman of the Board (2006-2009) and Chairman of the Board (2010-2013) of American Funds’ Emerging Markets Growth Fund, Inc. (mutual fund); Director of The California Endowment (philanthropic organization) (April 2002-April 2008); Director (February 2002-2005) and Chairman of Trustees (2006-2007) of the Community Hospital of Monterey Peninsula; President of ARCO Investment Management Company (February 1991-April 2000); Member of the investment committees of The Rockefeller Foundation (2001-2006) and The University of Michigan (since 2000); Advisor at Credit Suisse First Boston’s Sprout venture capital unit (venture capital fund) (1994-January 2005); Trustee of MassMutual Institutional Funds (investment company) (1996-June 2004); Trustee of MML Series Investment Fund (investment company) (April 1989-June 2004); Member of the investment committee of Hartford Hospital (2000-2003); and Advisor to Unilever (Holland) pension fund (2000-2003). Ms. Hamilton has served on the Boards of certain Oppenheimer funds since 2002, during which time she has become familiar with the Fund’s (and other Oppenheimer funds’) financial, accounting, regulatory and investment matters and has contributed to the Board’s deliberations. |
| |
Victoria J. Herget,
Trustee (since 2012)
Year of Birth:1951 | | Board Chair (2008-2015) and Director (2004-Present) of United Educators (insurance company); Trustee (since 2000) and Chair (2010-2017) of Newberry Library (independent research library); Trustee, Mather LifeWays (senior living organization) (since 2001); Independent Director of the First American Funds (mutual fund family) (2003-2011); former Managing Director (1993-2001), Principal (1985-1993), Vice President (1978-1985) and Assistant Vice President (1973-1978) of Zurich Scudder Investments (investment adviser) (and its predecessor firms); Trustee (1992-2007), Chair of the Board of Trustees (1999-2007), Investment Committee Chair (1994-1999) and Investment Committee member (2007-2010) of Wellesley College; Trustee, BoardSource(non-profit organization) (2006-2009) and Chicago City Day School(K-8 School) (1994-2005). Ms. Herget has served on the Boards of certain Oppenheimer funds since 2012, during which time she has become familiar with the Fund’s (and other Oppenheimer funds’) financial, accounting, regulatory and investment matters and has contributed to the Board’s deliberations. |
| |
Karen L. Stuckey, Trustee (since 2012)
Year of Birth: 1953 | | Member (since May 2015) of Desert Mountain Community Foundation Advisory Board(non-profit organization); Partner (1990-2012) of PricewaterhouseCoopers LLP (professional services firm) (held various positions 1975-1990); Trustee (1992- 2006); member of Executive, Nominating and Audit Committees and Chair of Finance Committee (1992-2006), and Emeritus Trustee (since 2006) of Lehigh University; member, Women’s Investment Management Forum (professional organization) (since inception) and Trustee of Jennies School for Little Children(non-profit) (2011-2014). Ms. Stuckey has served on the Boards of certain Oppenheimer funds since 2012, during which time she has become familiar with the Fund’s (and other Oppenheimer funds’) financial, accounting, regulatory and investment matters and has contributed to the Board’s deliberations. |
26 OPPENHEIMER GLOBAL FUND/VA
| | |
James D. Vaughn, Trustee (since 2012) Year of Birth:1945 | | Retired; former managing partner (1994-2001) of Denver office of Deloitte & Touche LLP, (held various positions in Denver and New York offices from 1969-1993); Trustee and Chairman of the Audit Committee of Schroder Funds (2003-2012); Board member and Chairman of Audit Committee of AMG National Trust Bank (since 2005); Trustee and Investment Committee member, University of South Dakota Foundation (since 1996); Board member, Audit Committee Member and past Board Chair, Junior Achievement (since 1993); former Board member, Mile High United Way, Boys and Girls Clubs, Boy Scouts, Colorado Business Committee for the Arts, Economic Club of Colorado and Metro Denver Network. Mr. Vaughn has served on the Boards of certain Oppenheimer funds since 2012, during which time he has become familiar with the Fund’s (and other Oppenheimer funds’) financial, accounting, regulatory and investment matters and has contributed to the Board’s deliberations. |
INTERESTED TRUSTEE AND OFFICER Arthur P. Steinmetz, Trustee (since 2015), President and Principal Executive Officer (since 2014) Year of Birth: 1958 | | Mr. Steinmetz is an “Interested Trustee” because he is affiliated with the Manager and theSub-Adviser by virtue of his positions as Chairman and director of theSub-Adviser and officer and director of the Manager. Both as a Trustee and as an officer, Mr. Steinmetz serves for an indefinite term, or until his resignation, retirement, death or removal. Mr. Steinmetz’s address is 225 Liberty Street, New York, New York 10281- 1008. Mr. Steinmetz is an officer of 104 portfolios in the OppenheimerFunds complex. Chairman of OppenheimerFunds, Inc. (since January 2015); CEO and Chairman of OFI Global Asset Management, Inc. (since July 2014), President of OFI Global Asset Management, Inc. (since May 2013), a Director of OFI Global Asset Management, Inc. (since January 2013), Director of OppenheimerFunds, Inc. (since July 2014), President, Management Director and CEO of Oppenheimer Acquisition Corp. (OppenheimerFunds, Inc.‘s parent holding company) (since July 2014), and President and Director of OFI SteelPath, Inc. (since January 2013). Chief Investment Officer of the OppenheimerFunds advisory entities (January 2013-December 2013); Executive Vice President of OFI Global Asset Management, Inc. (January2013-May 2013); Chief Investment Officer of OppenheimerFunds, Inc. (October 2010-December 2012); Chief Investment Officer, Fixed-Income, of OppenheimerFunds, Inc. (April 2009-October 2010); Executive Vice President of OppenheimerFunds, Inc. (October 2009-December 2012); Director of Fixed Income of OppenheimerFunds, Inc. (January 2009-April 2009); and a Senior Vice President of OppenheimerFunds, Inc. (March 1993-September 2009). |
OTHER OFFICERS OF THE FUND Rajeev Bhaman, Vice President (since 2004) Year of Birth: 1963 John Delano, Vice President (since 2017) Year of Birth: 1972 Cynthia Lo Bessette, Secretary and Chief Legal Officer (since 2016) Year of Birth: 1969 | | The addresses of the Officers in the chart below are as follows: for Messrs. Bhaman, Delano Mss. Lo Bessette, Foxson and Picciotto, 225 Liberty Street, New York, New York 10281-1008, for Mr. Petersen, 6803 S. Tucson Way, Centennial, Colorado 80112-3924. Each Officer serves for an indefinite term or until his or her resignation, retirement, death or removal. Director of Global Equities of theSub-Adviser (since January 2013); Senior Vice President of theSub-Adviser (since May 2006); Vice President of theSub-Adviser (January1997-May 2006). An officer of other portfolios in the OppenheimerFunds complex. Senior Portfolio Manager of theSub-Adviser (since January 2017); Vice President and Director of Equity Research, Global Team, of theSub-Adviser (since October 2010); Director of Equity Research, Growth Team, of theSub-Adviser (April 2007 - October 2010). Executive Vice President, General Counsel and Secretary of OFI Global Asset Management, Inc. (since February 2016); Senior Vice President and Deputy General Counsel of OFI Global Asset Management, Inc. (March 2015-February 2016); Chief Legal Officer of OppenheimerFunds, Inc. and OppenheimerFunds Distributor, Inc. (since February 2016); Vice President, General Counsel and Secretary of Oppenheimer Acquisition Corp. (since February 2016); General Counsel of OFI SteelPath, Inc., OFI Advisors, LLC and Index Management Solutions, LLC (since February 2016); Chief Legal Officer of OFI Global Institutional, Inc., HarbourView Asset Management Corporation, OFI Global Trust Company, Oppenheimer Real Asset Management, Inc., OFI Private Investments Inc., Shareholder Services, Inc. and Trinity Investment Management Corporation (since February 2016); Corporate Counsel (February 2012-March 2015) and Deputy Chief Legal Officer (April 2013-March 2015) of Jennison Associates LLC; Assistant General Counsel (April 2008-September 2009) and Deputy General Counsel (October 2009-February 2012) of Lord Abbett & Co. LLC. |
| |
Jennifer Foxson, Vice President and Chief Business Officer (since 2014) Year of Birth: 1969 | | Senior Vice President of OppenheimerFunds Distributor, Inc. (since June 2014); Vice President of OppenheimerFunds Distributor, Inc. (April 2006-June 2014); Vice President of OppenheimerFunds, Inc. (January 1998-March 2006); Assistant Vice President of OppenheimerFunds, Inc. (October 1991-December 1998). |
| |
Mary Ann Picciotto, Chief Compliance Officer and Chief Anti-Money Laundering Officer (since 2014) Year of Birth: 1973 | | Senior Vice President and Chief Compliance Officer of OFI Global Asset Management, Inc. (since March 2014); Chief Compliance Officer of OppenheimerFunds, Inc., OFI SteelPath, Inc., OFI Global Institutional, Inc., Oppenheimer Real Asset Management, Inc., OFI Private Investments Inc., Harborview Asset Management Corporation, Trinity Investment Management Corporation, and Shareholder Services, Inc. (since March 2014); Managing Director of Morgan Stanley Investment Management Inc. and certain of its various affiliated entities; Chief Compliance Officer of various Morgan Stanley Funds (May 2010-January 2014); Chief Compliance Officer of Morgan Stanley Investment Management Inc. (April 2007-January 2014). |
| |
Brian S. Petersen, Treasurer and Principal Financial & Accounting Officer (since 2016) Year of Birth: 1970 | | Senior Vice President of OFI Global Asset Management, Inc. (since January 2017); Vice President of OFI Global Asset Management, Inc. (January 2013-January 2017); Vice President of OppenheimerFunds, Inc. (February 2007-December 2012); Assistant Vice President of OppenheimerFunds, Inc. (August 2002-2007). |
The Fund’s Statement of Additional Information contains additional information about the Fund’s Trustees and Officers and is available without charge, upon request, by calling 1.800.988.8287.
27 OPPENHEIMER GLOBAL FUND/VA
OPPENHEIMER GLOBAL FUND/VA
A Series of Oppenheimer Variable Account Funds
| | |
Manager | | OFI Global Asset Management, Inc. |
| |
Sub-Adviser | | OppenheimerFunds, Inc. |
| |
Distributor | | OppenheimerFunds Distributor, Inc. |
| |
Transfer and | | OFI Global Asset Management, Inc. |
Shareholder | | |
Servicing Agent | | |
| |
Sub-Transfer Agent | | Shareholder Services, Inc. |
| | DBA OppenheimerFunds Services |
| |
Independent | | KPMG LLP |
Registered | | |
Public | | |
Accounting | | |
Firm | | |
| |
Legal Counsel | | Ropes & Gray LLP |
| |
| | *Effective March 31, 2019, Mr. Bhaman will retire as Portfolio Manager and Vice President and Mr. Delano will be the sole Portfolio Manager of the Fund. |
| |
| | Before investing in any of the Oppenheimer funds, investors should carefully consider a Fund’s investment objective, risks, charges and expenses. Fund prospectuses and summary prospectuses contain this and other information about the funds, and may be obtained by asking your financial advisor, visiting oppenheimerfunds.com or calling us at 1.800.988.8287. Read prospectuses and summary prospectuses carefully before investing. |
| |
| | © 2019 OppenheimerFunds, Inc. All rights reserved. Oppenheimer funds are distributed by OppenheimerFunds Distributor, Inc. |

| | | | |
| | 
| | |
| | |
| | | December 31, 2018 | | |
| | | Oppenheimer | | |
| | Main Street Fund®/VA | | Annual Report |
| | A Series of Oppenheimer Variable Account Funds | | |
| | | |
| | ANNUAL REPORT | | |
| | |
| | Listing of Top Holdings | | |
| | |
| | Fund Performance Discussion | | |
| | |
| | Financial Statements | | |
PORTFOLIO MANAGERS: Manind Govil, CFA, Benjamin Ram and Paul Larson
AVERAGE ANNUAL TOTAL RETURNS FOR THE PERIODS ENDED 12/31/18
| | | | | | | | | | | | | | | | |
| | | Inception
Date | | | 1-Year | | | 5-Year | | | 10-Year | |
Non-Service Shares | | | 7/5/95 | | | | -7.89% | | | | 6.58% | | | | 12.17 | % |
Service Shares | | | 7/13/00 | | | | -8.10 | | | | 6.31 | | | | 11.89 | |
S&P 500 Index | | | | | | | -4.38 | | | | 8.49 | | | | 13.12 | |
Performance data quoted represents past performance, which does not guarantee future results.The investment return and principal value of an investment in the Fund will fluctuate so that an investor’s shares, when redeemed, may be worth more or less than their original cost. Current performance may be lower or higher than the performance quoted. For performance data current to the most recent month end, call us at 1.800.988.8287. The Fund’s total returns should not be expected to be the same as the returns of other funds, whether or not both funds have the same portfolio managers and/or similar names. The Fund’s total returns include changes in share price and reinvested distributions but do not include the charges associated with the separate account products that offer this Fund. Such performance would have been lower if such charges were taken into account. Returns for periods of less than one year are cumulative and not annualized. See Fund prospectuses and summary prospectuses for more information on share classes and sales charges.
TOP HOLDINGS AND ALLOCATIONS
TOP TEN COMMON STOCK HOLDINGS
| | |
Microsoft Corp. | | 6.3% |
JPMorgan Chase & Co. | | 3.9 |
Merck & Co., Inc. | | 3.9 |
UnitedHealth Group, Inc. | | 3.6 |
Amazon.com, Inc. | | 3.3 |
Facebook, Inc., Cl. A | | 3.3 |
Motorola Solutions, Inc. | | 2.9 |
Prologis, Inc. | | 2.6 |
Lockheed Martin Corp. | | 2.4 |
Apple, Inc. | | 2.3 |
Portfolio holdings and allocations are subject to change. Percentages are as of December 31, 2018, and are based on net assets.
SECTOR ALLOCATION
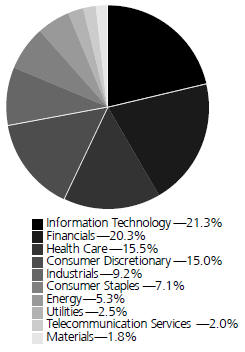
Portfolio holdings and allocations are subject to change. Percentages are as of December 31, 2018, and are based on the total market value of common stocks.
For more current Fund holdings, please visit oppenheimerfunds.com.
2 OPPENHEIMER MAIN STREET FUND/VA
Fund Performance Discussion
During a volatile year, the Fund’sNon-Service shares produced a return of-7.89%. In comparison, the S&P 500 Index (the “Index”) returned-4.38%. On the heels of the largest quarterly return for the S&P 500 Index since 2013, the fourth quarter of 2018 experienced the largest quarterly decline since the fourth quarter of 2008. The Fund’s underperformance versus the Index for theone-year period ended December 31, 2018, stemmed largely from stock selection in the Information Technology, Communication Services, Consumer Staples, and Consumer Discretionary sectors. The Fund outperformed the Index in Financials and Materials due to stock selection.
MARKET OVERVIEW
The U.S. economy continues to exhibit good economic growth, low unemployment and modest inflation. This is driven partly by tax cuts, technological innovation and falling regulatory hurdles. That said, the effects of the strain in the trading relationship with China have been a headwind to growth, but not nearly enough to offset the strong momentum in the economy.
This economic growth has been fairly broad-based across sectors. However, the stock price performance has not been as broad-based. Value stocks outperformed growth stocks during the fourth quarter of 2018, snapping a streak of seven consecutive quarters of the Russell 1000 Value Index underperforming the Russell 1000 Growth Index. This was helped by a rotation into defensive stocks and out of some of the high-flying technology names. However, growth stocks still significantly outperformed for the full calendar year.
We continue to focus on the fundamentals of each business to drive our investment decisions versus getting caught up in the temporary emotions of the market, always with the long-term welfare of our shareholders in mind. Our philosophy is to focus on companies we believe have sustainable competitive advantages that can outperform in most market environments. We combine this with our valuation discipline to seek a margin of safety, with downside protection ever an important consideration. That being said, we do have a history of underperforming ingo-go markets and outperforming in bear markets.
TOP INDIVIDUAL CONTRIBUTORS
Top contributors to performance this period included Merck & Co., Church & Dwight, and Motorola Solutions.
Merck had some Keytruda (immuno-oncology franchise and largest growth driver) approvals and positive data while their competitors’ data didn’t match up or failed. Also, pharmaceuticals performed relatively well in general as a more defensive industry during a sharp market selloff.
Church & Dwight, a consumer products company, saw third-quarter sales hold steady on a1-year basis and accelerated slightly on a2-year basis. Additionally, the margin outlook improved as pricing trends turned positive for the first time in nine quarters.
Motorola Solutions continued to display strong execution and to benefit from a favorable environment for public-safety spending. The company has recorded record backlogs with improved margins and return on invested capital.
TOP INDIVIDUAL DETRACTORS
Not owningAmazon, one of the largest index weights, through the end of April was the biggest relative detractor. Were-initiated a position in the company at the very end of April 2018 after previously selling the stock in early 2017. Other top detractors to relative performance that were owned in the portfolio includedKraft Heinz andDXC. Kraft stepped up reinvestment in 2018 – reinvesting tax reform windfall – which clipped industry-high margins and, although these investments seemingly resulted in the strongest organic sales growth in the company’s history in the third quarter, cost pressures took another step up in the order to deliver company record volumes. Shares of DXC declined sharply on a quarterly revenue shortfall. We believe the primary issues driving the revenue shortfall are company specific and self-inflicted and thus should be fixable. The company attributed the shortfall to are-organization in the sales force that resulted in execution issues and a shortage of skilled labor to meet demand for digital transformation projects, both of which are being addressed.
STRATEGY & OUTLOOK
In the short term, we expect the U.S. economy to continue to show economic growth, albeit at slower rates than experienced in 2018 as the “sugar high” from tax cuts wears off. This will be driven by favorable ongoing consumer confidence, falling regulatory hurdles, as well as technological innovation. The biggest macro risks we see are trade tariffs and higher interest rates.
3 OPPENHEIMER MAIN STREET FUND/VA
Speculation remains at an elevated level. Mania around cryptocurrency earlier in the year and cannabis stocks more recently are symptoms of these. We believe an equally big risk to stock prices is the stock market’s preference for so called “disruptors” and the potential for stocks with this perceived characteristic to become crowded trades and have valuations untethered to financial reality. While some of the high flyers lost altitude in the fourth quarter as the market corrected, a true capitulation point has not yet been reached.
Regarding trade tariffs, while concern has risen in recent weeks, the market continues to view bluster from D.C. as a negotiating tactic and is implying that all will end well. So far this has been borne out in trade negotiations between the U.S., Mexico and Canada. A true escalation could severely hamper global growth and thereby stock prices. Innovation, while a positive for the overall economy over the long term, creates short-term disruptions of which to be cognizant. Lastly, we are afraid companies have become addicted to low interest rates. If interest rates were to continue to rise materially, some companies’ historical decisions will look like a misallocation of capital and negatively impact their stock prices.
We believe a rise in interest rates and other monetary tightening will have profound implications for the equity markets. Due to the 2008 crisis, interest rates were driven to record lows and a flood of liquidity was unleashed. Short-term interest rates were at essentially zero and even longer rates were driven to around 2%. This was not just flash in the pan either, as the rates stayed at these levels for multiple years. When the cost of money became close to zero and its availability abundant, the equity market’s horizon became longer forstart-ups delivering profits. As a result, we have seen several companies focus on revenue growth through disruption without regard to profit generation.
We are afraid even established companies are addicted to low interest rates which is not sustainable for longer-term profitable growth. Once this corrects, it will be healthy in the longer-term because it will drive companies to generate profits. “Profitable Revenue Growth” is better, tougher and more sustainable than mere “Revenue Growth”. Over time, companies that generate such profitable growth are more durable investments with better down-side protection even though they may look a little short in a speculative environment. As a famous investor once said, you don’t know who has been swimming naked until the tide rolls out. At the moment, the tide is lower than it was a few months ago, but still relatively high. We know this won’t be the situation in perpetuity.
We continue to maintain our discipline around valuation and focus on companies with competitive advantages and skilled management teams that areout-executing peers. Evidence of this in the companies we look for include high returns on invested capital, consistently strong pricing power, and/or rising market shares. During times of economic volatility such companies frequently widen their lead over weaker competitors. We seek to invest in companies characterized by these qualities at compelling valuations and believe this disciplined approach is essential to generating superior long-term performance, especially in down markets.
We fully believe that over a complete market cycle, the value of our strategy will become apparent again.
Investors should consider the Fund’s investment objective, risks, charges and expenses carefully before investing. The Fund’s prospectus and summary prospectus contain this and other information about the Fund, and may be obtained by asking your financial advisor or calling us at 1.800.988.8287. Read prospectuses and summary prospectuses carefully before investing.
Total returns include changes in share price and reinvestment of dividends and capital gains distributions in a hypothetical investment for the periods shown, but do not include the charges associated with the separate account products that offer this Fund.
The views in the Fund Performance Discussion represent the opinions of this Fund’s portfolio managers and are not intended as investment advice or to predict or depict the performance of any investment. These views are as of the close of business on December 31, 2018, and are subject to change based on subsequent developments. The Fund’s portfolio and strategies are subject to change.
Shares of Oppenheimer funds are not deposits or obligations of any bank, are not guaranteed by any bank, are not insured by the FDIC or any other agency, and involve investment risks, including the possible loss of the principal amount invested.
Comparing the Fund’s Performance to the Market.The graphs that follow show the performance of a hypothetical $10,000 investment in each share class of the Fund held until December 31, 2018. Performance is measured over aten-fiscal-year period for both Classes. Performance information does not reflect charges that apply to separate accounts investing in the Fund. If these charges were taken into account, performance would be lower. The graphs assume that all dividends and capital gains distributions were reinvested in additional shares.
4 OPPENHEIMER MAIN STREET FUND/VA
The Fund’s performance is compared to the performance of the S&P 500 Index. The S&P 500 Index is a capitalization-weighted index of 500 stocks intended to be a representative sample of leading companies in leading industries within the U.S. economy. The Index isunmanaged and cannot be purchased directly by investors. While index comparisons may be useful to provide a benchmark for the Fund’s performance, it must be noted that the Fund’s investments are not limited to the investments comprising the Index. Index performance includes reinvestment of income, but does not reflect transaction costs, fees, expenses or taxes. Index performance is shown for illustrative purposes only as a benchmark for the Fund’s performance, and does not predict or depict performance of the Fund. The Fund’s performance reflects the effects of the Fund’s business and operating expenses.
COMPARISON OF CHANGE IN VALUE OF $10,000 HYPOTHETICAL INVESTMENTS IN:
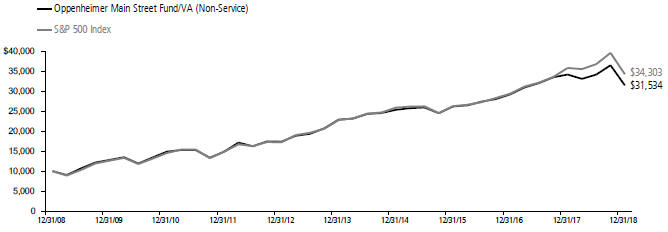
Average Annual Total Returns ofNon-Service Shares of the Fund at 12/31/18
1-Year -7.89% 5-Year 6.58% 10-Year 12.17%
COMPARISON OF CHANGE IN VALUE OF $10,000 HYPOTHETICAL INVESTMENTS IN:
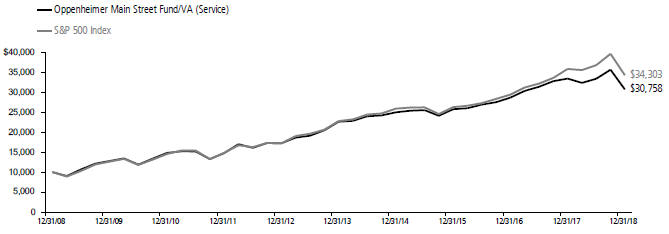
Average Annual Total Returns of Service Shares of the Fund at 12/31/18
1-Year -8.10% 5-Year 6.31% 10-Year 11.89%
Performance data quoted represents past performance, which does not guarantee future results.The investment return and principal value of an investment in the Fund will fluctuate so that an investor’s shares, when redeemed, may be worth more or less than their original cost. Current performance may be lower or higher than the performance quoted. For performance data current to the most recent month end, call us at 1.800.988.8287. The Fund’s total returns should not be expected to be the same as the returns of other funds, whether or not both funds have the same portfolio managers and/or similar names. The Fund’s total returns include changes in share price and reinvested distributions but do not include the charges associated with the separate account products that offer this Fund. Such performance would have been lower if such charges were taken into account.
5 OPPENHEIMER MAIN STREET FUND/VA
Fund Expenses
Fund Expenses.As a shareholder of the Fund, you incur two types of costs: (1) transaction costs and (2) ongoing costs, including management fees; distribution and service fees; and other Fund expenses. These examples are intended to help you understand your ongoing costs (in dollars) of investing in the Fund and to compare these costs with the ongoing costs of investing in other mutual funds.
The examples are based on an investment of $1,000.00 invested at the beginning of the period and held for the entire6-month period ended December 31, 2018.
Actual Expenses. The first section of the table provides information about actual account values and actual expenses. You may use the information in this section for the class of shares you hold, together with the amount you invested, to estimate the expense that you paid over the period. Simply divide your account value by $1,000.00 (for example, an $8,600.00 account value divided by $1,000.00 = 8.60), then multiply the result by the number in the first section under the heading entitled “Expenses Paid During 6 Months Ended December 31, 2018” to estimate the expenses you paid on your account during this period.
Hypothetical Example for Comparison Purposes.
The second section of the table provides information about hypothetical account values and hypothetical expenses based on the Fund’s actual expense ratio for each class of shares, and an assumed rate of return of 5% per year for each class before expenses, which is not the actual return. The hypothetical account values and expenses may not be used to estimate the actual ending account balance or expenses you paid for the period. You may use this information to compare the ongoing costs of investing in the Fund and other funds. To do so, compare this 5% hypothetical example for the class of shares you hold with the 5% hypothetical examples that appear in the shareholder reports of the other funds.
Please note that the expenses shown in the table are meant to highlight your ongoing costs only and do not reflect any charges associated with the separate accounts that offer this Fund. Therefore, the “hypothetical” lines of the table are useful in comparing ongoing costs only, and will not help you determine the relative total costs of owning different funds. In addition, if these separate account charges were included your costs would have been higher.
| | | | | | | | | | | | | | | | |
| Actual | | Beginning Account Value July 1, 2018 | | | Ending Account Value
December 31, 2018 | | | Expenses Paid During 6 Months Ended
December 31, 2018 | |
Non-Service shares | | $ | 1,000.00 | | | $ | 921.60 | | | | $ 3.93 | | | | | |
Service shares | | | 1,000.00 | | | | 920.50 | | | | 5.15 | | | | | |
| | | | |
| Hypothetical | | | | | | | | | | | | |
| (5% return before expenses) | | | | | | | | | | | | |
Non-Service shares | | | 1,000.00 | | | | 1,021.12 | | | | 4.13 | | | | | |
Service shares | | | 1,000.00 | | | | 1,019.86 | | | | 5.41 | | | | | |
Expenses are equal to the Fund’s annualized expense ratio for that class, multiplied by the average account value over the period, multiplied by 184/365 (to reflect theone-half year period). Those annualized expense ratios, excluding indirect expenses from affiliated funds, based on the6-month period ended December 31, 2018 are as follows:
| | | | | | | | |
| Class | | Expense Ratios | | | | |
Non-Service shares | | | 0.81% | | | | | |
Service shares | | | 1.06 | | | | | |
The expense ratios reflect voluntary and/or contractual waivers and/or reimbursements of expenses by the Fund’s Manager. Some of these undertakings may be modified or terminated at any time, as indicated in the Fund’s prospectus. The “Financial Highlights” tables in the Fund’s financial statements, included in this report, also show the gross expense ratios, without such waivers or reimbursements and reduction to custodian expenses, if applicable.
6 OPPENHEIMER MAIN STREET FUND/VA
STATEMENT OF INVESTMENTSDecember 31, 2018
| | | | | | | | |
| | | Shares | | | Value | |
| | | | | | | | | |
Common Stocks—98.5% | | | | | | | | |
Consumer Discretionary—14.8% | | | | | |
Hotels, Restaurants & Leisure—1.1% | |
Starbucks Corp. | | | 194,600 | | | $ | 12,532,240 | |
Interactive Media & Services—3.3% | |
Facebook, Inc., Cl. A1 | | | 278,400 | | | | 36,495,456 | |
Internet & Catalog Retail—4.3% | |
Amazon.com, Inc.1 | | | 24,390 | | | | 36,633,048 | |
Booking Holdings, Inc.1 | | | 6,600 | | | | 11,367,972 | |
| | | | | | | | 48,001,020 | |
Specialty Retail—6.1% | | | | | | | | |
Best Buy Co., Inc. | | | 363,700 | | | | 19,261,552 | |
Lowe’s Cos., Inc. | | | 264,880 | | | | 24,464,317 | |
O’Reilly Automotive, Inc.1 | | | 42,076 | | | | 14,488,029 | |
Ulta Beauty, Inc.1 | | | 41,930 | | | | 10,266,141 | |
| | | | | | | | 68,480,039 | |
Consumer Staples—7.0% | | | | | | | | |
Beverages—2.5% | | | | | | | | |
Constellation Brands, Inc., Cl. A | | | 40,790 | | | | 6,559,848 | |
PepsiCo, Inc. | | | 191,398 | | | | 21,145,651 | |
| | | | | | | | 27,705,499 | |
Food Products—1.1% | | | | | | | | |
Kraft Heinz Co. (The) | | | 282,645 | | | | 12,165,041 | |
Household Products—1.6% | |
Church & Dwight Co., Inc. | | | 270,730 | | | | 17,803,205 | |
Tobacco—1.8% | | | | | | | | |
Philip Morris International, Inc. | | | 306,449 | | | | 20,458,535 | |
Energy—5.2% | | | | | | | | |
Energy Equipment & Services—1.1% | |
Schlumberger Ltd. | | | 331,340 | | | | 11,954,747 | |
Oil, Gas & Consumable Fuels—4.1% | |
Magellan Midstream Partners LP2 | | | 385,810 | | | | 22,014,319 | |
Suncor Energy, Inc. | | | 855,920 | | | | 23,940,082 | |
| | | | | | | | 45,954,401 | |
Financials—19.9% | | | | | | | | |
Capital Markets—5.3% | | | | | | | | |
Bank of New York Mellon Corp. (The) | | | 397,250 | | | | 18,698,557 | |
CME Group, Inc., Cl. A | | | 52,790 | | | | 9,930,855 | |
Intercontinental Exchange, Inc. | | | 193,690 | | | | 14,590,668 | |
S&P Global, Inc. | | | 95,101 | | | | 16,161,464 | |
| | | | | | | | 59,381,544 | |
Commercial Banks—6.2% | | | | | | | | |
JPMorgan Chase & Co. | | | 443,170 | | | | 43,262,256 | |
SunTrust Banks, Inc. | | | 235,470 | | | | 11,877,107 | |
Wells Fargo & Co. | | | 311,180 | | | | 14,339,174 | |
| | | | | | | | 69,478,537 | |
Diversified Financial Services—4.0% | |
AXA Equitable Holdings, Inc. | | | 1,186,006 | | | | 19,723,280 | |
Berkshire Hathaway, Inc., Cl. B1 | | | 124,590 | | | | 25,438,786 | |
| | | | | | | | 45,162,066 | |
Insurance—1.8% | | | | | | | | |
Marsh & McLennan Cos., Inc. | | | 90,370 | | | | 7,207,008 | |
Progressive Corp. (The) | | | 216,270 | | | | 13,047,569 | |
| | | | | | | | 20,254,577 | |
Real Estate Investment Trusts (REITs)—2.6% | |
Prologis, Inc. | | | 484,873 | | | | 28,471,742 | |
Health Care—15.3% | |
Biotechnology—1.6% | | | | | | | | |
Celgene Corp.1 | | | 67,190 | | | | 4,306,207 | |
Gilead Sciences, Inc. | | | 210,200 | | | | 13,148,010 | |
| | | | | |
| 17,454,217
|
|
| | | | | | | | |
| | | Shares | | | Value | |
Health Care Equipment & Supplies—2.5% | |
Align Technology, Inc.1 | | | 20,370 | | | $ | 4,266,089 | |
Boston Scientific Corp.1 | | | 387,340 | | | | 13,688,595 | |
Zimmer Biomet Holdings, Inc. | | | 101,130 | | | | 10,489,204 | |
| | | | | | | | 28,443,888 | |
Health Care Providers & Services—4.4% | |
DaVita, Inc.1 | | | 96,204 | | | | 4,950,658 | |
Laboratory Corp. of America Holdings1 | | | 36,170 | | | | 4,570,441 | |
UnitedHealth Group, Inc. | | | 159,630 | | | | 39,767,026 | |
| | | | | | | | 49,288,125 | |
Health Care Technology—0.7% | | | | | | | | |
Cerner Corp.1 | | | 145,650 | | | | 7,637,886 | |
Life Sciences Tools & Services—1.9% | | | | | | | | |
Agilent Technologies, Inc. | | | 318,050 | | | | 21,455,653 | |
Pharmaceuticals—4.2% | | | | | | | | |
AstraZeneca plc, Sponsored ADR | | | 88,740 | | | | 3,370,345 | |
Merck & Co., Inc. | | | 565,890 | | | | 43,239,655 | |
| | | | | | | | 46,610,000 | |
Industrials—9.0% | | | | | | | | |
Aerospace & Defense—2.4% | | | | | | | | |
Lockheed Martin Corp. | | | 101,940 | | | | 26,691,970 | |
Commercial Services & Supplies—1.2% | |
Republic Services, Inc., Cl. A | | | 184,850 | | | | 13,325,837 | |
Machinery—1.4% | | | | | | | | |
Illinois Tool Works, Inc. | | | 126,960 | | | | 16,084,562 | |
Professional Services—0.6% | |
Nielsen Holdings plc | | | 266,990 | | | | 6,228,877 | |
Road & Rail—2.1% | | | | | | | | |
Union Pacific Corp. | | | 168,210 | | | | 23,251,668 | |
Trading Companies & Distributors—1.3% | |
Fastenal Co. | | | 288,400 | | | | 15,080,436 | |
Information Technology—21.0% | |
Communications Equipment—2.9% | |
Motorola Solutions, Inc. | | | 277,070 | | | | 31,874,133 | |
IT Services—5.4% | | | | | | | | |
Amdocs Ltd. | | | 349,890 | | | | 20,496,556 | |
DXC Technology Co. | | | 278,990 | | | | 14,833,898 | |
First Data Corp., Cl. A1 | | | 758,030 | | | | 12,818,287 | |
Visa, Inc., Cl. A | | | 92,560 | | | | 12,212,367 | |
| | | | | | | | 60,361,108 | |
Semiconductors & Semiconductor Equipment—2.1% | |
Applied Materials, Inc. | | | 423,910 | | | | 13,878,813 | |
Texas Instruments, Inc. | | | 102,490 | | | | 9,685,305 | |
| | | | | | | | 23,564,118 | |
Software—7.0% | | | | | | | | |
Microsoft Corp. | | | 689,950 | | | | 70,078,221 | |
ServiceNow, Inc.1 | | | 46,080 | | | | 8,204,544 | |
| | | | | | | | 78,282,765 | |
Technology Hardware, Storage & Peripherals—3.6% | |
Apple, Inc. | | | 165,326 | | | | 26,078,523 | |
NetApp, Inc. | | | 149,930 | | | | 8,946,323 | |
Western Digital Corp. | | | 139,125 | | | | 5,143,452 | |
| | | | | | | | 40,168,298 | |
Materials—1.8% | | | | | | | | |
Chemicals—1.8% | | | | | | | | |
Ecolab, Inc. | | | 97,410 | | | | 14,353,364 | |
PPG Industries, Inc. | | | 50,870 | | | | 5,200,440 | |
| | | | | | | | 19,553,804 | |
Telecommunication Services—2.0% | |
Diversified Telecommunication Services—2.0% | |
Verizon Communications, Inc. | | | 391,725 | | | | 22,022,780 | |
7 OPPENHEIMER MAIN STREET FUND/VA
STATEMENT OF INVESTMENTSContinued
| | | | | | | | |
| | | Shares | | | Value | |
Utilities—2.5% | | | | | | | | |
| Electric Utilities—1.5% | | | | | | | | |
Duke Energy Corp. | | | 196,900 | | | $ | 16,992,470 | |
Multi-Utilities—1.0% | | | | | | | | |
National Grid plc | | | 1,120,080 | | | | 10,831,807 | |
Total Common Stocks (Cost $1,007,072,194) | | | | | | | 1,099,503,051 | |
| | | | | | | | |
| | | Shares | | | Value | |
Investment Company—2.4% | |
| Oppenheimer Institutional Government Money Market Fund, Cl. E, 2.35%3,4(Cost $26,902,751) | | | 26,902,751 | | | $ | 26,902,751 | |
| Total Investments, at Value (Cost $1,033,974,945) | | | 100.9 | % | | | 1,126,405,802 | |
Net Other Assets (Liabilities) | | | (0.9 | ) | | | (9,778,266 | ) |
Net Assets | | | 100.0 | % | | $ | 1,116,627,536 | |
| | | | | | | | |
Footnotes to Statement of Investments
1.Non-income producing security.
2. Security is a Master Limited Partnership.
3. Rate shown is the7-day yield at period end.
4. Is or was an affiliate, as defined in the Investment Company Act of 1940, as amended, at or during the reporting period, by virtue of the Fund owning at least 5% of the voting securities of the issuer or as a result of the Fund and the issuer having the same investment adviser. Transactions during the reporting period in which the issuer was an affiliate are as follows:
| | | | | | | | | | | | | | | | |
| | | Shares
December 31, 2017 | | | Gross Additions | | | Gross
Reductions | | | Shares December 31, 2018 | |
Investment Company | | | | | | | | | | | | | | | | |
| Oppenheimer Institutional Government Money Market Fund, Cl. E | | | 19,085,774 | | | | 325,607,323 | | | | 317,790,346 | | | | 26,902,751 | |
| | | | |
| | | Value | | | Income | | | Realized Gain (Loss) | | | Change in Unrealized Gain (Loss) | |
Investment Company | | | | | | | | | | | | | | | | |
| Oppenheimer Institutional Government Money Market Fund, Cl. E | | $ | 26,902,751 | | | $ | 330,605 | | | $ | — | | | $ | — | |
See accompanying Notes to Financial Statements.
8 OPPENHEIMER MAIN STREET FUND/VA
STATEMENT OF ASSETS AND LIABILITIESDecember 31, 2018
| | | | |
| |
| |
Assets | | | | |
Investments, at value—see accompanying statement of investments: | | | | |
Unaffiliated companies (cost $1,007,072,194) | | $ | 1,099,503,051 | |
Affiliated companies (cost $26,902,751) | | | 26,902,751 | |
| | | | |
| | | 1,126,405,802 | |
| |
Cash | | | 750,000 | |
| |
Receivables and other assets: | | | | |
Dividends | | | 2,093,739 | |
Shares of beneficial interest sold | | | 1,029,035 | |
Other | | | 152,993 | |
| | | | |
Total assets | | | 1,130,431,569 | |
| |
| |
Liabilities | | | | |
Payables and other liabilities: | | | | |
Investments purchased | | | 11,908,490 | |
Shares of beneficial interest redeemed | | | 1,552,540 | |
Distribution and service plan fees | | | 139,246 | |
Trustees’ compensation | | | 135,396 | |
Shareholder communications | | | 31,688 | |
Other | | | 36,673 | |
| | | | |
Total liabilities | | | 13,804,033 | |
| |
Net Assets | | $ | 1,116,627,536 | |
| | | | |
| | | | |
| |
| |
Composition of Net Assets | | | | |
Par value of shares of beneficial interest | | $ | 41,910 | |
| |
Additionalpaid-in capital | | | 812,993,122 | |
| |
Total distributable earnings | | | 303,592,504 | |
| | | | |
Net Assets | | $ | 1,116,627,536 | |
| | | | |
| | | | |
| |
| |
Net Asset Value Per Share | | | | |
Non-Service Shares: | | | | |
| |
| Net asset value, redemption price per share and offering price per share (based on net assets of $485,229,394 and 18,095,402 shares of beneficial interest outstanding) | | | $26.82 | |
| |
| |
Service Shares: | | | | |
| |
| Net asset value, redemption price per share and offering price per share (based on net assets of $631,398,142 and 23,814,925 shares of beneficial interest outstanding) | | | $26.51 | |
See accompanying Notes to Financial Statements.
9 OPPENHEIMER MAIN STREET FUND/VA
STATEMENT OF OPERATIONSFor the Year Ended December 31, 2018
| | | | |
| |
| |
Investment Income | | | | |
Dividends: | | | | |
Unaffiliated companies (net of foreign withholding taxes of $147,105) | | $ | 23,160,343 | |
Affiliated companies | | | 330,605 | |
| |
Interest | | | 2,341 | |
| | | | |
Total investment income | | | 23,493,289 | |
| |
| |
Expenses | | | | |
Management fees | | | 8,493,002 | |
| |
Distribution and service plan fees — Service shares | | | 1,853,682 | |
| |
Transfer and shareholder servicing agent fees: | | | | |
Non-Service shares | | | 652,233 | |
Service shares | | | 889,767 | |
| |
Shareholder communications: | | | | |
Non-Service shares | | | 44,768 | |
Service shares | | | 60,611 | |
| |
Borrowing fees | | | 41,605 | |
| |
Trustees’ compensation | | | 41,096 | |
| |
Custodian fees and expenses | | | 8,218 | |
| |
Other | | | 83,059 | |
| | | | |
Total expenses | | | 12,168,041 | |
Less reduction to custodian expenses | | | (380) | |
Less waivers and reimbursements of expenses | | | (17,859) | |
| | | | |
Net expenses | | | 12,149,802 | |
| |
Net Investment Income | | | 11,343,487 | |
| |
Realized and Unrealized Gain (Loss) | | | | |
Net realized gain (loss) on: | | | | |
Investment transactions in unaffiliated companies | | | 222,507,418 | |
Foreign currency transactions | | | (41,761) | |
| | | | |
Net realized gain | | | 222,465,657 | |
| |
Net change in unrealized appreciation/(depreciation) on: | | | | |
Investment transactions in unaffiliated companies | | | (328,734,304) | |
Translation of assets and liabilities denominated in foreign currencies | | | (1,941) | |
| | | | |
Net change in unrealized appreciation/(depreciation) | | | (328,736,245) | |
| |
Net Decrease in Net Assets Resulting from Operations | | $ | (94,927,101) | |
| | | | |
See accompanying Notes to Financial Statements.
10 OPPENHEIMER MAIN STREET FUND/VA
STATEMENTS OF CHANGES IN NET ASSETS
| | | | | | | | |
| | | Year Ended December 31, 2018 | | | Year Ended December 31, 20171 | |
| |
Operations | | | | | | | | |
Net investment income | | $ | 11,343,487 | | | $ | 12,822,734 | |
| |
Net realized gain | | | 222,465,657 | | | | 121,840,022 | |
| |
Net change in unrealized appreciation/(depreciation) | | | (328,736,245 | ) | | | 68,971,875 | |
| | | | |
Net increase (decrease) in net assets resulting from operations | | | (94,927,101 | ) | | | 203,634,631 | |
| |
Dividends and/or Distributions to Shareholders | | | | | | | | |
Dividends and distributions declared: | | | | | | | | |
Non-Service shares | | | (53,341,045 | ) | | | (15,660,180) | |
Service shares | | | (71,631,264 | ) | | | (21,519,046) | |
| | | | |
Total dividends and distributions declared | | | (124,972,309 | ) | | | (37,179,226) | |
| |
Beneficial Interest Transactions | | | | | | | | |
Net increase (decrease) in net assets resulting from beneficial interest transactions: | | | | | | | | |
Non-Service shares | | | 17,298,831 | | | | 9,551,567 | |
Service shares | | | (27,705,526 | ) | | | (86,863,753) | |
| | | | |
Total beneficial interest transactions | | | (10,406,695 | ) | | | (77,312,186) | |
| |
Net Assets | | | | | | | | |
Total increase (decrease) | | | (230,306,105 | ) | | | 89,143,219 | |
| |
Beginning of period | | | 1,346,933,641 | | | | 1,257,790,422 | |
| | | | |
| End of period | | $ | 1,116,627,536 | | | $ | 1,346,933,641 | |
| | | | |
1. Prior period amounts have been conformed to current year presentation. See Notes to Financial Statements, Note 2 – New Accounting Pronouncements for further details.
See accompanying Notes to Financial Statements.
11 OPPENHEIMER MAIN STREET FUND/VA
FINANCIAL HIGHLIGHTS
| | | | | | | | | | | | | | | | | | | | |
| Non-Service Shares | | Year Ended December 31, 2018 | | | Year Ended December 31, 2017 | | | Year Ended December 31, 2016 | | | Year Ended December 31, 2015 | | | Year Ended
December 31,
2014 | |
Per Share Operating Data | | | | | | | | | | | | | | | | | | | | |
Net asset value, beginning of period | | | $32.25 | | | | $28.41 | | | | $29.24 | | | | $33.61 | | | | $31.24 | |
Income (loss) from investment operations: | | | | | | | | | | | | | | | | | | | | |
Net investment income1 | | | 0.32 | | | | 0.34 | | | | 0.33 | | | | 0.33 | | | | 0.28 | |
Net realized and unrealized gain (loss) | | | (2.55) | | | | 4.41 | | | | 2.76 | | | | 0.80 | | | | 3.01 | |
| | | | |
Total from investment operations | | | (2.23) | | | | 4.75 | | | | 3.09 | | | | 1.13 | | | | 3.29 | |
Dividends and/or distributions to shareholders: | | | | | | | | | | | | | | | | | | | | |
Dividends from net investment income | | | (0.38) | | | | (0.39) | | | | (0.34) | | | | (0.32) | | | | (0.27) | |
Distributions from net realized gain | | | (2.82) | | | | (0.52) | | | | (3.58) | | | | (5.18) | | | | (0.65) | |
| | | | |
Total dividends and/or distributions to shareholders | | | (3.20) | | | | (0.91) | | | | (3.92) | | | | (5.50) | | | | (0.92) | |
Net asset value, end of period | | | $26.82 | | | | $32.25 | | | | $28.41 | | | | $29.24 | | | | $33.61 | |
| | | | |
| |
| | | | |
| | | | | | | | | | | | | | | | | | | | |
Total Return, at Net Asset Value2 | | | (7.89)% | | | | 16.91% | | | | 11.62% | | | | 3.33% | | | | 10.70% | |
| | | | | | | | | | | | | | | | | | | | |
Ratios/Supplemental Data | | | | | | | | | | | | | | | | | | | | |
Net assets, end of period (in thousands) | | | $485,230 | | | | $561,555 | | | | $485,196 | | | | $518,456 | | | | $559,933 | |
Average net assets (in thousands) | | | $543,152 | | | | $535,770 | | | | $502,522 | | | | $541,020 | | | | $554,449 | |
Ratios to average net assets:3 | | | | | | | | | | | | | | | | | | | | |
Net investment income | | | 1.03% | | | | 1.12% | | | | 1.16% | | | | 1.05% | | | | 0.86% | |
| Expenses excluding specific expenses listed below | | | 0.80% | | | | 0.78% | | | | 0.79% | | | | 0.78% | | | | 0.77% | |
Interest and fees from borrowings | | | 0.00%4 | | | | 0.00%4 | | | | 0.00%4 | | | | 0.00%4 | | | | 0.00% | |
| | | | |
Total expenses5 | | | 0.80% | | | | 0.78% | | | | 0.79% | | | | 0.78% | | | | 0.77% | |
| Expenses after payments, waivers and/or reimbursements and reduction to custodian expenses | | | 0.80%6 | | | | 0.78%6 | | | | 0.79%6 | | | | 0.78%6 | | | | 0.77%6 | |
Portfolio turnover rate | | | 65% | | | | 35% | | | | 33% | | | | 44% | | | | 43% | |
1. Per share amounts calculated based on the average shares outstanding during the period.
2. Assumes an initial investment on the business day before the first day of the fiscal period, with all dividends and distributions reinvested in additional shares on the reinvestment date, and redemption at the net asset value calculated on the last business day of the fiscal period. Total returns are not annualized for periods less than one full year. Total return information does not reflect expenses that apply at the separate account level or to related insurance products. Inclusion of these charges would reduce the total return figures for all periods shown. Returns do not reflect the deduction of taxes that a shareholder would pay on fund distributions or the redemption of fund shares.
3. Annualized for periods less than one full year.
4. Less than 0.005%.
5. Total expenses including indirect expenses from affiliated fund fees and expenses were as follows:
| | | | | | |
| | | | | | |
| | Year Ended December 31, 2018 | | | 0.80% | |
| | Year Ended December 31, 2017 | | | 0.78% | |
| | Year Ended December 31, 2016 | | | 0.79% | |
| | Year Ended December 31, 2015 | | | 0.78% | |
| | Year Ended December 31, 2014 | | | 0.77% | |
6.Waiver was less than 0.005%.
See accompanying Notes to Financial Statements.
12 OPPENHEIMER MAIN STREET FUND/VA
| | | | | | | | | | | | | | | | | | | | |
| Service Shares | | Year Ended December 31, 2018 | | | Year Ended
December 31,
2017 | | | Year Ended
December 31,
2016 | | | Year Ended
December 31,
2015 | | | Year Ended
December 31,
2014 | |
Per Share Operating Data | | | | | | | | | | | | | | | | | | | | |
Net asset value, beginning of period | | | $31.91 | | | | $28.12 | | | | $28.98 | | | | $33.33 | | | | $30.99 | |
Income (loss) from investment operations: | | | | | | | | | | | | | | | | | | | | |
Net investment income1 | | | 0.24 | | | | 0.26 | | | | 0.26 | | | | 0.25 | | | | 0.19 | |
Net realized and unrealized gain (loss) | | | (2.53) | | | | 4.37 | | | | 2.72 | | | | 0.80 | | | | 2.99 | |
| | | | |
Total from investment operations | | | (2.29) | | | | 4.63 | | | | 2.98 | | | | 1.05 | | | | 3.18 | |
Dividends and/or distributions to shareholders: | | | | | | | | | | | | | | | | | | | | |
Dividends from net investment income | | | (0.29) | | | | (0.32) | | | | (0.26) | | | | (0.22) | | | | (0.19) | |
Distributions from net realized gain | | | (2.82) | | | | (0.52) | | | | (3.58) | | | | (5.18) | | | | (0.65) | |
| | | | |
Total dividends and/or distributions to shareholders | | | (3.11) | | | | (0.84) | | | | (3.84) | | | | (5.40) | | | | (0.84) | |
Net asset value, end of period | | | $26.51 | | | | $31.91 | | | | $28.12 | | | | $28.98 | | | | $33.33 | |
| | | | |
| |
| | | | |
| | | | | | | | | | | | | | | | | | | | |
Total Return, at Net Asset Value2 | | | (8.10)% | | | | 16.63% | | | | 11.30% | | | | 3.11% | | | | 10.40% | |
| | | | | | | | | | | | | | | | | | | | |
Ratios/Supplemental Data | | | | | | | | | | | | | | | | | | | | |
Net assets, end of period (in thousands) | | | $631,398 | | | | $785,379 | | | | $772,594 | | | | $715,328 | | | | $806,023 | |
Average net assets (in thousands) | | | $740,691 | | | | $788,342 | | | | $725,836 | | | | $757,218 | | | | $856,467 | |
Ratios to average net assets:3 | | | | | | | | | | | | | | | | | | | | |
Net investment income | | | 0.78% | | | | 0.87% | | | | 0.94% | | | | 0.80% | | | | 0.61% | |
| Expenses excluding specific expenses listed below | | | 1.05% | | | | 1.03% | | | | 1.04% | | | | 1.03% | | | | 1.02% | |
Interest and fees from borrowings | | | 0.00%4 | | | | 0.00%4 | | | | 0.00%4 | | | | 0.00%4 | | | | 0.00% | |
| | | | |
Total expenses5 | | | 1.05% | | | | 1.03% | | | | 1.04% | | | | 1.03% | | | | 1.02% | |
| Expenses after payments, waivers and/or reimbursements and reduction to custodian expenses | | | 1.05%6 | | | | 1.03%6 | | | | 1.04%6 | | | | 1.03%6 | | | | 1.02%6 | |
Portfolio turnover rate | | | 65% | | | | 35% | | | | 33% | | | | 44% | | | | 43% | |
1. Per share amounts calculated based on the average shares outstanding during the period.
2. Assumes an initial investment on the business day before the first day of the fiscal period, with all dividends and distributions reinvested in additional shares on the reinvestment date, and redemption at the net asset value calculated on the last business day of the fiscal period. Total returns are not annualized for periods less than one full year. Total return information does not reflect expenses that apply at the separate account level or to related insurance products. Inclusion of these charges would reduce the total return figures for all periods shown. Returns do not reflect the deduction of taxes that a shareholder would pay on fund distributions or the redemption of fund shares.
3. Annualized for periods less than one full year.
4. Less than 0.005%.
5. Total expenses including indirect expenses from affiliated fund fees and expenses were as follows:
| | | | | | |
| | | | | | |
| | Year Ended December 31, 2018 | | | 1.05% | |
| | Year Ended December 31, 2017 | | | 1.03% | |
| | Year Ended December 31, 2016 | | | 1.04% | |
| | Year Ended December 31, 2015 | | | 1.03% | |
| | Year Ended December 31, 2014 | | | 1.02% | |
6. Waiver was less than 0.005%.
See accompanying Notes to Financial Statements.
13 OPPENHEIMER MAIN STREET FUND/VA
NOTES TO FINANCIAL STATEMENTSDecember 31, 2018
1. Organization
Oppenheimer Main Street Fund/VA (the “Fund”), a separate series of Oppenheimer Variable Account Funds, is a diversifiedopen-end management investment company registered under the Investment Company Act of 1940 (“1940 Act”), as amended. The Fund’s investment objective is to seek capital appreciation. The Fund’s investment adviser is OFI Global Asset Management, Inc. (“OFI Global” or the “Manager”), a wholly-owned subsidiary of OppenheimerFunds, Inc. (“OFI” or the“Sub-Adviser”). The Manager has entered into asub-advisory agreement with OFI.
Shares of the Fund are sold only to separate accounts of life insurance companies.
The Fund offers two classes of shares. Both classes are sold at their offering price, which is the net asset value per share, to separate investment accounts of participating insurance companies as an underlying investment for variable life insurance policies, variable annuity contracts or other investment products. The class of shares designated as Service shares is subject to a distribution and service plan. Both classes of shares have identical rights and voting privileges with respect to the Fund in general and exclusive voting rights on matters that affect that class alone. Earnings, net assets and net asset value per share may differ due to each class having its own expenses, such as transfer and shareholder servicing agent fees and shareholder communications, directly attributable to that class.
The following is a summary of significant accounting policies followed in the Fund’s preparation of financial statements in accordance with accounting principles generally accepted in the United States (“U.S. GAAP”).
2. Significant Accounting Policies
Security Valuation.All investments in securities are recorded at their estimated fair value, as described in Note 3.
Foreign Currency Translation.The books and records of the Fund are maintained in U.S. dollars. Any foreign currency amounts are translated into U.S. dollars on the following basis:
(1) Value of investment securities, other assets and liabilities — at the exchange rates prevailing at market close as described in Note 3.
(2) Purchases and sales of investment securities, income and expenses — at the rates of exchange prevailing on the respective dates of such transactions.
Although the net assets and the values are presented at the foreign exchange rates at market close, the Fund does not isolate the portion of the results of operations resulting from changes in foreign exchange rates on investments from the fluctuations arising from changes in prices of securities held. Such fluctuations are included with the net realized and unrealized gains or losses from investments shown in the Statement of Operations.
For securities, which are subject to foreign withholding tax upon disposition, realized and unrealized gains or losses on such securities are recorded net of foreign withholding tax.
Reported net realized foreign exchange gains or losses arise from sales of foreign currencies, currency gains or losses realized between the trade and settlement dates on securities transactions, the difference between the amounts of dividends, interest, and foreign withholding tax reclaims recorded on the Fund’s books, and the U.S. dollar equivalent of the amounts actually received or paid. Net unrealized foreign exchange gains and losses arise from changes in the value of assets and liabilities other than investments in securities, resulting from changes in the exchange rate.
Allocation of Income, Expenses, Gains and Losses.Income, expenses (other than those attributable to a specific class), gains and losses are allocated on a daily basis to each class of shares based upon the relative proportion of net assets represented by such class. Operating expenses directly attributable to a specific class are charged against the operations of that class.
Dividends and Distributions to Shareholders. Dividends and distributions to shareholders, which are determined in accordance with income tax regulations and may differ from U.S. GAAP, are recorded on theex-dividend date. Income and capital gain distributions, if any, are declared and paid annually or at other times as determined necessary by the Manager.
Investment Income.Dividend income is recorded on theex-dividend date or uponex-dividend notification in the case of certain foreign dividends where theex-dividend date may have passed.Non-cash dividends included in dividend income, if any, are recorded at the fair value of the securities received. Withholding taxes on foreign dividends, if any, and capital gains taxes on foreign investments, if any, have been provided for in accordance with the Fund’s understanding of the applicable tax rules and regulations. Interest income, if any, is recognized on an accrual basis. Discount and premium, which are included in interest income on the Statement of Operations, are amortized or accreted daily.
Return of Capital Estimates.Distributions received from the Fund’s investments in Master Limited Partnerships (MLPs) and Real Estate Investments Trusts (REITs), generally are comprised of income and return of capital. Any return of capital estimates in excess of cost basis are classified as realized gain. The Fund records investment income and return of capital based on estimates. Such estimates are based on historical information available from each MLP, REIT and other industry sources. These estimates may subsequently be revised based on information received from MLPs and REITs after their tax reporting periods are concluded.
Custodian Fees. “Custodian fees and expenses” in the Statement of Operations may include interest expense incurred by the Fund on any cash overdrafts of its custodian account during the period. Such cash overdrafts may result from the effects of failed trades in portfolio securities and from cash outflows resulting from unanticipated shareholder redemption activity. The Fund pays interest to its custodian on such cash overdrafts, to the extent they are not offset by positive cash balances maintained by the Fund, at a rate equal to the Federal Funds Rate plus 2.00%. The “Reduction to custodian
14 OPPENHEIMER MAIN STREET FUND/VA
2. Significant Accounting Policies (Continued)
expenses” line item, if applicable, represents earnings on cash balances maintained by the Fund during the period. Such interest expense and other custodian fees may be paid with these earnings.
Security Transactions. Security transactions are recorded on the trade date. Realized gains and losses on securities sold are determined on the basis of identified cost.
Indemnifications.The Fund’s organizational documents provide current and former Trustees and officers with a limited indemnification against liabilities arising in connection with the performance of their duties to the Fund. In the normal course of business, the Fund may also enter into contracts that provide general indemnifications. The Fund’s maximum exposure under these arrangements is unknown as this would be dependent on future claims that may be made against the Fund. The risk of material loss from such claims is considered remote.
Federal Taxes.The Fund intends to comply with provisions of the Internal Revenue Code applicable to regulated investment companies and to distribute substantially all of its investment company taxable income, including any net realized gain on investments not offset by capital loss carryforwards, if any, to shareholders. Therefore, no federal income or excise tax provision is required. The Fund files income tax returns in U.S. federal and applicable state jurisdictions. The statute of limitations on the Fund’s tax return filings generally remains open for the three preceding fiscal reporting period ends. The Fund has analyzed its tax positions for the fiscal year ended December 31, 2018, including open tax years, and does not believe there are any uncertain tax positions requiring recognition in the Fund’s financial statements.
The tax components of capital shown in the following table represent distribution requirements the Fund must satisfy under the income tax regulations, losses the Fund may be able to offset against income and gains realized in future years and unrealized appreciation or depreciation of securities and other investments for federal income tax purposes.
| | | | | | | | | | | | |
Undistributed Net Investment Income | | Undistributed
Long-Term
Gain | | | Accumulated
Loss
Carryforward1,2
| | | Net Unrealized
Appreciation
Based on cost of
Securities and Other Investments
for Federal Income
Tax Purposes | |
$15,018,484 | | | $197,609,369 | | | | $— | | | | $91,100,040 | |
| 1. | During the reporting period, the Fund utilized $16,688 of capital loss carryforward to offset capital gains realized in that fiscal year. |
| 2. | During the previous reporting period, the Fund did not utilize any capital loss carryforward. |
Net investment income (loss) and net realized gain (loss) may differ for financial statement and tax purposes. The character of dividends and distributions made during the fiscal year from net investment income or net realized gains are determined in accordance with federal income tax requirements, which may differ from the character of net investment income or net realized gains presented in those financial statements in accordance with U.S. GAAP. Also, due to timing of dividends and distributions, the fiscal year in which amounts are distributed may differ from the fiscal year in which the income or net realized gain was recorded by the Fund.
Accordingly, the following amounts have been reclassified for the reporting period. Net assets of the Fund were unaffected by the reclassifications.
| | | | |
Increase toPaid-in Capital | | Reduction to Accumulated
Net Earnings3 | |
$20,665,886 | | | $20,665,886 | |
| 3. | $20,671,701 including $20,284,566 of long-term capital gain, was distributed in connection with Fund share redemptions. |
The tax character of distributions paid during the reporting periods:
| | | | | | | | |
| | | Year Ended
December 31, 2018 | | | Year Ended
December 31, 2017 | |
Distributions paid from: | | | | | | | | |
Ordinary income | | $ | 27,663,938 | | | $ | 14,838,310 | |
Long-term capital gain | | | 97,308,371 | | | | 22,340,916 | |
| | | | |
Total | | $ | 124,972,309 | | | $ | 37,179,226 | |
| | | | |
The aggregate cost of securities and other investments and the composition of unrealized appreciation and depreciation of securities and other investments for federal income tax purposes at period end are noted in the following table. The primary difference between book and tax appreciation or depreciation of securities and other investments, if applicable, is attributable to the tax deferral of losses or tax realization of financial statement unrealized gain or loss.
15 OPPENHEIMER MAIN STREET FUND/VA
NOTES TO FINANCIAL STATEMENTSContinued
2. Significant Accounting Policies (Continued)
| | | | |
Federal tax cost of securities | | $ | 1,035,299,452 | |
| | | | |
Gross unrealized appreciation | | $ | 180,226,403 | |
| |
Gross unrealized depreciation | | | (89,126,363) | |
| | | | |
Net unrealized appreciation | | $ | 91,100,040 | |
| | | | |
Use of Estimates. The preparation of financial statements in conformity with U.S. GAAP requires management to make estimates and assumptions that affect the reported amounts of assets and liabilities and disclosure of contingent assets and liabilities at the date of the financial statements and the reported amounts of increases and decreases in net assets from operations during the reporting period. Actual results could differ from those estimates.
New Accounting Pronouncements. In March 2017, Financial Accounting Standards Board (“FASB”) issued Accounting Standards Update (“ASU”), ASU2017-08. This provides guidance related to the amortization period for certain purchased callable debt securities held at a premium. The ASU is effective for annual periods beginning after December 15, 2018, and interim periods within those annual periods. The Manager has evaluated the impacts of these changes on the financial statements and there are no material impacts.
During August 2018, the Securities and Exchange Commission (the “SEC”) issued Final Rule ReleaseNo. 33-10532 (the “Rule”), Disclosure Update and Simplification. The rule amends certain financial statement disclosure requirements to conform to U.S. GAAP. The amendments to Rule6-04.17 of RegulationS-X (balance sheet) remove the requirement to separately state the book basis components of net assets: undistributed (over-distribution of) net investment income (“UNII”), accumulated undistributed net realized gains (losses), and net unrealized appreciation (depreciation) at the balance sheet date. Instead, consistent with U.S. GAAP, funds will be required to disclose total distributable earnings. The amendments to Rule6-09 of RegulationS-X (statement of changes in net assets) remove the requirement to separately state the sources of distributions paid. Instead, consistent with U.S. GAAP, funds will be required to disclose the total amount of distributions paid, except that any tax return of capital must be separately disclosed. The amendments also remove the requirement to parenthetically state the book basis amount of UNII on the statement of changes in net assets. The requirements of the Rule are effective November 5, 2018, and the Funds’ Statement of Assets and Liabilities and Statement of Changes in Net Assets for the current reporting period have been modified accordingly. In addition, certain amounts within each Fund’s Statement of Changes in Net Assets for the prior fiscal period have been modified to conform to the Rule.
3. Securities Valuation
The Fund calculates the net asset value of its shares as of 4:00 P.M. Eastern Time, on each day the New York Stock Exchange (the “Exchange” or “NYSE”) is open for trading, except in the case of a scheduled early closing of the Exchange, in which case the Fund will calculate net asset value of the shares as of the scheduled early closing time of the Exchange.
The Fund’s Board has adopted procedures for the valuation of the Fund’s securities and has delegated theday-to-day responsibility for valuation determinations under those procedures to the Manager. The Manager has established a Valuation Committee which is responsible for determining a fair valuation for any security for which market quotations are not readily available. The Valuation Committee’s fair valuation determinations are subject to review, approval and ratification by the Fund’s Board at least quarterly or more frequently, if necessary.
Valuation Methods and Inputs
Securities are valued primarily using unadjusted quoted market prices, when available, as supplied by third party pricing services or broker-dealers.
The following methodologies are used to determine the market value or the fair value of the types of securities described below:
Equity securities traded on a securities exchange (including exchange-traded derivatives other than futures and futures options) are valued based on the official closing price on the principal exchange on which the security is traded, as identified by the Manager, prior to the time when the Fund’s assets are valued. If the official closing price is unavailable, the security is valued at the last sale price on the principal exchange on which it is traded, or if no sales occurred, the security is valued at the mean between the quoted bid and asked prices.Over-the-counter equity securities are valued at the last published sale price, or if no sales occurred, at the mean between the quoted bid and asked prices. Events occurring after the close of trading on foreign exchanges may result in adjustments to the valuation of foreign securities to more accurately reflect their fair value as of the time when the Fund’s assets are valued.
Shares of a registered investment company that are not traded on an exchange are valued at that investment company’s net asset value per share.
Securities for which market quotations are not readily available, or when a significant event has occurred that would materially affect the value of the security, are fair valued either (i) by a standardized fair valuation methodology applicable to the security type or the significant event as previously approved by the Valuation Committee and the Fund’s Board or (ii) as determined in good faith by the Manager’s Valuation Committee. The Valuation Committee considers all relevant facts that are reasonably available, through either public information or information available to the Manager, when determining the fair value of a security. Those standardized fair valuation methodologies include, but are not limited to, valuing securities at the last sale price or initially at cost and subsequently adjusting the value based on: changes in company specific fundamentals, changes in an appropriate securities index, or changes in the value of similar securities which may be further adjusted for any discounts related to security-specific resale restrictions. When possible, such methodologies use observable market inputs such as unadjusted quoted prices of similar securities, observable interest rates, currency rates and yield curves. The methodologies used for valuing securities are not necessarily an indication of the risks associated with investing in those securities nor can it be assured that the Fund can obtain the fair value assigned to a security if it were to sell the security.
16 OPPENHEIMER MAIN STREET FUND/VA
3. Securities Valuation (Continued)
Classifications
Each investment asset or liability of the Fund is assigned a level at measurement date based on the significance and source of the inputs to its valuation. Various data inputs may be used in determining the value of each of the Fund’s investments as of the reporting period end. These data inputs are categorized in the following hierarchy under applicable financial accounting standards:
1) Level1-unadjusted quoted prices in active markets for identical assets or liabilities (including securities actively traded on a securities exchange)
2) Level2-inputs other than unadjusted quoted prices that are observable for the asset or liability (such as unadjusted quoted prices for similar assets and market corroborated inputs such as interest rates, prepayment speeds, credit risks, etc.)
3) Level3-significant unobservable inputs (including the Manager’s own judgments about assumptions that market participants would use in pricing the asset or liability).
The inputs used for valuing securities are not necessarily an indication of the risks associated with investing in those securities.
The Fund classifies each of its investments in investment companies which are publicly offered as Level 1. Investment companies that are not publicly offered, if any, are classified as Level 2 in the fair value hierarchy.
The table below categorizes amounts that are included in the Fund’s Statement of Assets and Liabilities at period end based on valuation input level:
| | | | | | | | | | | | | | | | |
| | | Level 1— Unadjusted Quoted Prices | | | Level 2— Other Significant Observable Inputs | | | Level 3— Significant
Unobservable
Inputs | | | Value | |
Assets Table | | | | | | | | | | | | | | | | |
Investments, at Value: | | | | | | | | | | | | | | | | |
Common Stocks | | | | | | | | | | | | | | | | |
Consumer Discretionary | | $ | 165,508,755 | | | $ | — | | | $ | — | | | $ | 165,508,755 | |
Consumer Staples | | | 78,132,280 | | | | — | | | | — | | | | 78,132,280 | |
Energy | | | 57,909,148 | | | | — | | | | — | | | | 57,909,148 | |
Financials | | | 222,748,466 | | | | — | | | | — | | | | 222,748,466 | |
Health Care | | | 170,889,769 | | | | — | | | | — | | | | 170,889,769 | |
Industrials | | | 100,663,350 | | | | — | | | | — | | | | 100,663,350 | |
Information Technology | | | 234,250,422 | | | | — | | | | — | | | | 234,250,422 | |
Materials | | | 19,553,804 | | | | — | | | | — | | | | 19,553,804 | |
Telecommunication Services | | | 22,022,780 | | | | — | | | | — | | | | 22,022,780 | |
Utilities | | | 16,992,470 | | | | 10,831,807 | | | | — | | | | 27,824,277 | |
Investment Company | | | 26,902,751 | | | | — | | | | — | | | | 26,902,751 | |
| | | | |
Total Assets | | $ | 1,115,573,995 | | | $ | 10,831,807 | | | $ | — | | | $ | 1,126,405,802 | |
| | | | |
Forward currency exchange contracts and futures contracts, if any, are reported at their unrealized appreciation/depreciation at measurement date, which represents the change in the contract’s value from trade date. All additional assets and liabilities included in the above table are reported at their market value at measurement date.
For the reporting period, there were no transfers between levels.
4. Investments and Risks
Investments in Affiliated Funds. The Fund is permitted to invest in other mutual funds advised by the Manager (“Affiliated Funds”). Affiliated Funds are management investment companies registered under the 1940 Act, as amended. The Manager is the investment adviser of, and theSub-Adviser provides investment and related advisory services to, the Affiliated Funds. When applicable, the Fund’s investments in Affiliated Funds are included in the Statement of Investments. Shares of Affiliated Funds are valued at their net asset value per share. As a shareholder, the Fund is subject to its proportional share of the Affiliated Funds’ expenses, including their management fee. The Manager will waive fees and/or reimburse Fund expenses in an amount equal to the indirect management fees incurred through the Fund’s investment in the Affiliated Funds.
Each of the Affiliated Funds in which the Fund invests has its own investment risks, and those risks can affect the value of the Fund’s investments and therefore the value of the Fund’s shares. To the extent that the Fund invests more of its assets in one Affiliated Fund than in another, the Fund will have greater exposure to the risks of that Affiliated Fund.
Investments in Money Market Instruments.The Fund is permitted to invest its free cash balances in money market instruments to provide liquidity or for defensive purposes. The Fund may invest in money market instruments by investing in Class E shares of Oppenheimer Institutional Government Money Market Fund (“IGMMF”), which is an Affiliated Fund. IGMMF is regulated as a money market fund under the 1940 Act, as amended. The Fund may also invest in money market instruments directly or in other affiliated or unaffiliated money market funds.
Master Limited Partnerships (“MLPs”).MLPs issue common units that represent an equity ownership interest in a partnership and provide limited voting rights. MLP common units are registered with the Securities and Exchange Commission (“SEC”), and are freely tradable on securities exchanges such as the NYSE and the NASDAQ Stock Market (“NASDAQ”), or in theover-the-counter (“OTC”) market. An MLP consists of one or more general
17 OPPENHEIMER MAIN STREET FUND/VA
NOTES TO FINANCIAL STATEMENTSContinued
4. Investments and Risks (Continued)
partners, who conduct the business, and one or more limited partners, who contribute capital. MLP common unit holders have a limited role in the partnership’s operations and management. The Fund, as a limited partner, normally would not be liable for the debts of the MLP beyond the amounts the Fund has contributed, but would not be shielded to the same extent that a shareholder of a corporation would be. In certain circumstances creditors of an MLP would have the right to seek return of capital distributed to a limited partner. This right of an MLP’s creditors would continue after the Fund sold its investment in the MLP.
Equity Security Risk.Stocks and other equity securities fluctuate in price. The value of the Fund’s portfolio may be affected by changes in the equity markets generally. Equity markets may experience significant short-term volatility and may fall sharply at times. Different markets may behave differently from each other and U.S. equity markets may move in the opposite direction from one or more foreign stock markets. Adverse events in any part of the equity or fixed-income markets may have unexpected negative effects on other market segments.
The prices of individual equity securities generally do not all move in the same direction at the same time and a variety of factors can affect the price of a particular company’s securities. These factors may include, but are not limited to, poor earnings reports, a loss of customers, litigation against the company, general unfavorable performance of the company’s sector or industry, or changes in government regulations affecting the company or its industry.
Shareholder Concentration.At period end, one shareholder owned 20% or more of the Fund’s total outstanding shares.
5. Market Risk Factors
The Fund’s investments in securities and/or financial derivatives may expose the Fund to various market risk factors:
Commodity Risk. Commodity risk relates to the change in value of commodities or commodity indexes as they relate to increases or decreases in the commodities market. Commodities are physical assets that have tangible properties. Examples of these types of assets are crude oil, heating oil, metals, livestock, and agricultural products.
Credit Risk.Credit risk relates to the ability of the issuer of debt to meet interest and principal payments, or both, as they come due. In general, lower-grade, higher-yield debt securities are subject to credit risk to a greater extent than lower-yield, higher-quality securities.
Equity Risk. Equity risk relates to the change in value of equity securities as they relate to increases or decreases in the general market.
Foreign Exchange Rate Risk. Foreign exchange rate risk relates to the change in the U.S. dollar value of a security held that is denominated in a foreign currency. The U.S. dollar value of a foreign currency denominated security will decrease as the dollar appreciates against the currency, while the U.S. dollar value will increase as the dollar depreciates against the currency.
Interest Rate Risk.Interest rate risk refers to the fluctuations in value of fixed-income securities resulting from the inverse relationship between price and yield. For example, an increase in general interest rates will tend to reduce the market value of already issued fixed-income investments, and a decline in general interest rates will tend to increase their value. In addition, debt securities with longer maturities, which tend to have higher yields, are subject to potentially greater fluctuations in value from changes in interest rates than obligations with shorter maturities.
Volatility Risk.Volatility risk refers to the magnitude of the movement, but not the direction of the movement, in a financial instrument’s price over a defined time period. Large increases or decreases in a financial instrument’s price over a relative time period typically indicate greater volatility risk, while small increases or decreases in its price typically indicate lower volatility risk.
6. Shares of Beneficial Interest
The Fund has authorized an unlimited number of $0.001 par value shares of beneficial interest of each class. Transactions in shares of beneficial interest were as follows:
| | | | | | | | | | | | | | | | | | | | | | | | | | | | |
| | | Year Ended December 31, 2018 | | | | | | | | | Year Ended December 31, 2017 | | | | |
| | | Shares | | | Amount | | | | | | | | | Shares | | | Amount | | | | |
Non-Service Shares | | | | | | | | | | | | | | | | | | | | | | | | | | | | |
Sold | | | 1,272,402 | | | $ | 37,785,582 | | | | | | | | | | | | 2,189,995 | | | $ | 66,648,162 | | | | | |
Dividends and/or distributions reinvested | | | 1,802,062 | | | | 53,341,045 | | | | | | | | | | | | 515,816 | | | | 15,660,180 | | | | | |
Acquisition—Note 10 | | | — | | | | — | | | | | | | | | | | | 14,913 | | | | 454,099 | | | | | |
Redeemed | | | (2,391,616 | ) | | | (73,827,796 | ) | | | | | | | | | | | (2,388,470 | ) | | | (73,210,874 | ) | | | | |
| | | | |
Net increase | | | 682,848 | | | $ | 17,298,831 | | | | | | | | | | | | 332,254 | | | $ | 9,551,567 | | | | | |
| | | | |
| |
| | | | | |
Service Shares | | | | | | | | | | | | | | | | | | | | | | | | | | | | |
Sold | | | 2,634,038 | | | $ | 78,888,308 | | | | | | | | | | | | 1,395,024 | | | $ | 42,024,615 | | | | | |
Dividends and/or distributions reinvested | | | 2,444,753 | | | | 71,631,264 | | | | | | | | | | | | 715,394 | | | | 21,519,046 | | | | | |
Acquisition—Note 10 | | | — | | | | — | | | | | | | | | | | | 244,900 | | | | 7,376,390 | | | | | |
Redeemed | | | (5,873,057 | ) | | | (178,225,098 | ) | | | | | | | | | | | (5,216,278 | ) | | | (157,783,804 | ) | | | | |
| | | | |
Net decrease | | | (794,266 | ) | | $ | (27,705,526 | ) | | | | | | | | | | | (2,860,960 | ) | | $ | (86,863,753 | ) | | | | |
| | | | |
18 OPPENHEIMER MAIN STREET FUND/VA
7. Purchases and Sales of Securities
The aggregate cost of purchases and proceeds from sales of securities, other than short-term obligations and investments in IGMMF, for the reporting period were as follows:
| | | | |
| | | Purchases | | Sales |
Investment securities | | $821,821,231 | | $940,074,382 |
8. Fees and Other Transactions with Affiliates
Management Fees.Under the investment advisory agreement, the Fund pays the Manager a management fee based on the daily net assets of the Fund at an annual rate as shown in the following table:
| | | | |
| Fee Schedule | | | |
Up to $200 million | | | 0.75% | |
Next $200 million | | | 0.72 | |
Next $200 million | | | 0.69 | |
Next $200 million | | | 0.66 | |
Next $200 million | | | 0.60 | |
Next $4 billion | | | 0.58 | |
Over $5 billion | | | 0.56 | |
The Fund’s effective management fee for the reporting period was 0.66% of average annual net assets before any applicable waivers.
Sub-Adviser Fees.The Manager has retained theSub-Adviser to provide theday-to-day portfolio management of the Fund. Under theSub-Advisory Agreement, the Manager pays theSub-Adviser an annual fee in monthly installments, equal to a percentage of the investment management fee collected by the Manager from the Fund, which shall be calculated after any investment management fee waivers. The fee paid to theSub-Adviser is paid by the Manager, not by the Fund.
Transfer Agent Fees.OFI Global (the “Transfer Agent”) serves as the transfer and shareholder servicing agent for the Fund. The Fund pays the Transfer Agent a fee based on annual net assets. Fees incurred and average net assets for each class with respect to these services are detailed in the Statement of Operations and Financial Highlights, respectively.
Sub-Transfer Agent Fees.The Transfer Agent has retained Shareholder Services, Inc., a wholly-owned subsidiary of OFI (the“Sub-Transfer Agent”), to provide theday-to-day transfer agent and shareholder servicing of the Fund. Under theSub-Transfer Agency Agreement, the Transfer Agent pays theSub-Transfer Agent an annual fee in monthly installments, equal to a percentage of the transfer agent fee collected by the Transfer Agent from the Fund, which shall be calculated after any applicable fee waivers. The fee paid to theSub-Transfer Agent is paid by the Transfer Agent, not by the Fund.
Trustees’ Compensation.The Fund’s Board of Trustees (“Board”) has adopted a compensation deferral plan for Independent Trustees that enables Trustees to elect to defer receipt of all or a portion of the annual compensation they are entitled to receive from the Fund. For purposes of determining the amount owed to the Trustees under the plan, deferred amounts are treated as though equal dollar amounts had been invested in shares of the Fund or in other Oppenheimer funds selected by the Trustees. The Fund purchases shares of the funds selected for deferral by the Trustees in amounts equal to his or her deemed investment, resulting in a Fund asset equal to the deferred compensation liability. Such assets are included as a component of “Other” within the asset section of the Statement of Assets and Liabilities. Deferral of Trustees’ fees under the plan will not affect the net assets of the Fund and will not materially affect the Fund’s assets, liabilities or net investment income per share. Amounts will be deferred until distributed in accordance with the compensation deferral plan.
Distribution and Service Plan for Service Shares.The Fund has adopted a Distribution and Service Plan (the “Plan”) pursuant to Rule12b-1 under the 1940 Act for Service shares to pay OppenheimerFunds Distributor, Inc. (the “Distributor”), for distribution related services, personal service and account maintenance for the Fund’s Service shares. Under the Plan, payments are made periodically at an annual rate of 0.25% of the daily net assets of Service shares of the Fund. The Distributor currently uses all of those fees to compensate sponsors of the insurance product that offers Fund shares, for providing personal service and maintenance of accounts of their variable contract owners that hold Service shares. These fees are paid out of the Fund’s assets on anon-going basis and increase operating expenses of the Service shares, which results in lower performance compared to the Fund’s shares that are not subject to a service fee. Fees incurred by the Fund under the Plan are detailed in the Statement of Operations.
Waivers and Reimbursements of Expenses.The Manager will waive fees and/or reimburse Fund expenses in an amount equal to the indirect management fees incurred through the Fund’s investment in IGMMF. During the reporting period, the Manager waived fees and/or reimbursed the Fund $17,859 for IGMMF management fees.
9. Borrowings and Other Financing
Joint Credit Facility.A number of mutual funds managed by the Manager participate in a $1.95 billion revolving credit facility (the “Facility”) intended to provide short-term financing, if necessary, subject to certain restrictions in connection with atypical redemption activity. Expenses and fees related to
19 OPPENHEIMER MAIN STREET FUND/VA
NOTES TO FINANCIAL STATEMENTSContinued
9. Borrowings and Other Financing (Continued)
the Facility are paid by the participating funds and are disclosed separately or as other expenses on the Statement of Operations. The Fund did not utilize the Facility during the reporting period.
10. Acquisition of Oppenheimer Equity Income Fund/VA
On May 1, 2017, the Fund acquired all of the net assets of Oppenheimer Equity Income Fund/VA, pursuant to an Agreement and Plan of Reorganization approved by the Fund’s Board. The exchange qualified as atax-free reorganization for federal income tax purposes. The purpose of this acquisition is to combine two funds with similar investment objectives, strategies and risks to allow shareholders to benefit from greater asset growth potential, as well as lowered total expenses.
Details of the merger are shown in the following table:
| | | | | | | | | | | | | | | | | | | | |
| | | | | Exchange
Ratio to One
Share of the
Oppenheimer
Equity Income
Fund/VA | | | Shares of
Beneficial
Interest Issued
by the Fund | | | Value of Issued
Shares of Beneficial
Interest | | | Combined Net Assets on
May 1, 20171 | | | |
| | Non-Service shares | | | 0.347188309 | | | | 14,913 | | | $ | 454,099 | | | $ | 522,307,311 | |
| | Service shares | | | 0.430279316 | | | | 244,900 | | | | 7,376,390 | | | | 789,160,812 | |
1. The net assets acquired included net unrealized appreciation of $1,182,786 and an unused capital loss carryforward of $126,540, potential utilization subject to tax limitations.
Had the merger occurred at the beginning of the reporting period, the Fund’s pro forma Statement of Operations would have been as follows (Unaudited):
| | | | | | |
| | | | | | |
| | Net investment income | | $ | 12,883,960 | |
| | Net gain on investments | | | 190,984,944 | |
| | Net increase in net assets resulting from operations | | | 203,868,904 | |
For financial reporting purposes, assets received and shares issued by the Fund were recorded at fair value; however, the tax cost basis of the investments received from Oppenheimer Equity Income Fund/VA were carried forward to align ongoing reporting of the Fund’s realized and unrealized gains and losses with amounts distributable to shareholders for tax purposes.
Because the combined investment portfolios have been managed as a single integrated portfolio since the acquisition was completed, it is not practicable to separate the amounts of revenue and earnings of Oppenheimer Equity Income Fund/VA that have been included in the Fund’s Statement of Operations since May 1, 2017.
11. Pending Acquisition
On October 18, 2018, Massachusetts Mutual Life Insurance Company, an indirect corporate parent of theSub-Adviser and the Manager, announced that it has entered into an agreement whereby Invesco Ltd. (“Invesco”), a global investment management company, will acquire theSub-Adviser (the “Transaction”). In connection with the Transaction, on January 11, 2019, the Fund’s Board unanimously approved an Agreement and Plan of Reorganization (the “Agreement”), which provides for the transfer of the assets and liabilities of the Fund to a corresponding, newly formed fund (the “Acquiring Fund”) in the Invesco family of funds (the “Reorganization”) in exchange for shares of the corresponding Acquiring Fund of equal value to the value of the shares of the Fund as of the close of business on the closing date. Although the Acquiring Fund will be managed by Invesco Advisers, Inc., the Acquiring Fund will, as of the closing date, have the same investment objective and substantially similar principal investment strategies and risks as the Fund. After the Reorganization, Invesco Advisers, Inc. will be the investment adviser to the Acquiring Fund, and the Fund will be liquidated and dissolved under applicable law and terminate its registration under the Investment Company Act of 1940, as amended. The Reorganization is expected to be atax-free reorganization for U.S. federal income tax purposes.
The Reorganization is subject to the approval of shareholders of the Fund. Shareholders of record of the Fund on January 14, 2019 will be entitled to vote on the Reorganization and will receive a combined prospectus and proxy statement describing the Reorganization, the shareholder meeting, and a discussion of the factors the Fund’s Board considered in approving the Agreement. The combined prospectus and proxy statement is expected to be distributed to shareholders of record on or about February 28, 2019. The anticipated date of the shareholder meeting is on or about April 12, 2019.
If shareholders approve the Agreement and certain other closing conditions are satisfied or waived, the Reorganization is expected to close during the second quarter of 2019, or as soon as practicable thereafter. This is subject to change.
20 OPPENHEIMER MAIN STREET FUND/VA
REPORT OF INDEPENDENT REGISTERED PUBLIC ACCOUNTING FIRM
To the Shareholders and Board of Trustees
Oppenheimer Variable Account Funds:
Opinion on the Financial Statements
We have audited the accompanying statement of assets and liabilities of Oppenheimer Main Street Fund/VA, a separate series of Oppenheimer Variable Account Funds, (the “Fund”), including the statement of investments, as of December 31, 2018, the related statement of operations for the year then ended, the statements of changes in net assets for each of the years in the two year period then ended, and the related notes (collectively, the “financial statements”) and the financial highlights for each of the years in the five year period then ended. In our opinion, the financial statements and financial highlights present fairly, in all material respects, the financial position of the Fund as of December 31, 2018, the results of its operations for the year then ended, the changes in its net assets for each of the years in the two year period then ended, and the financial highlights for each of the years in the five year period then ended, in conformity with U.S. generally accepted accounting principles.
Basis for Opinion
These financial statements and financial highlights are the responsibility of the Fund’s management. Our responsibility is to express an opinion on these financial statements and financial highlights based on our audits. We are a public accounting firm registered with the Public Company Accounting Oversight Board (United States) (“PCAOB”) and are required to be independent with respect to the Fund in accordance with the U.S. federal securities laws and the applicable rules and regulations of the Securities and Exchange Commission and the PCAOB.
We conducted our audits in accordance with the standards of the PCAOB. Those standards require that we plan and perform the audit to obtain reasonable assurance about whether the financial statements and financial highlights are free of material misstatement, whether due to error or fraud. Our audits included performing procedures to assess the risks of material misstatement of the financial statements and financial highlights, whether due to error or fraud, and performing procedures that respond to those risks. Such procedures included examining, on a test basis, evidence regarding the amounts and disclosures in the financial statements and financial highlights. Such procedures also included confirmation of securities owned as of December 31, 2018, by correspondence with the custodian, brokers and the transfer agent, or by other appropriate auditing procedures. Our audits also included evaluating the accounting principles used and significant estimates made by management, as well as evaluating the overall presentation of the financial statements and financial highlights. We believe that our audits provide a reasonable basis for our opinion.
KPMGLLP
We have not been able to determine the specific year that we began serving as the auditor of one or more Oppenheimer Funds investment companies, however we are aware that we have served as the auditor of one or more Oppenheimer Funds investment companies since at least 1969.
Denver, Colorado
February 14, 2019
21 OPPENHEIMER MAIN STREET FUND/VA
FEDERAL INCOME TAX INFORMATIONUnaudited
In early 2019, if applicable, shareholders of record received information regarding all dividends and distributions paid to them by the Fund during calendar year 2018.
Capital gain distributions of $2.4517per share were paid toNon-Service and Service shareholders, respectively, on June 19, 2018. Whether received in stock or in cash, the capital gain distribution should be treated by shareholders as a gain from the sale of the capital assets held for more than one year (long-term capital gains).
Dividends, if any, paid by the Fund during the reporting period which are not designated as capital gain distributions should be multiplied by the maximum amount allowable but not less than 100% to arrive at the amount eligible for the corporate dividend-received deduction.
Dividends, if any, paid by the Fund during the reporting period which are not designated as capital gain distributions, may be eligible for lower individual income tax rates to the extent that the Fund has received qualified dividend income as stipulated by recent tax legislation. In early 2019, shareholders of record received information regarding the percentage of distributions that are eligible for lower individual income tax rates. The amount will be the maximum amount allowed.
The foregoing information is presented to assist shareholders in reporting distributions received from the Fund to the Internal Revenue Service. Because of the complexity of the federal regulations which may affect your individual tax return and the many variations in state and local tax regulations, we recommend that you consult your tax advisor for specific guidance.
22 OPPENHEIMER MAIN STREET FUND/VA
BOARD APPROVAL OF THE FUND’S INVESTMENT ADVISORY ANDSUB-ADVISORY AGREEMENTSUnaudited
The Fund has entered into an investment advisory agreement with OFI Global Asset Management, Inc. (“OFI Global” or the “Adviser”), a wholly-owned subsidiary of OppenheimerFunds, Inc. (“OFI” or the“Sub-Adviser”) (“OFI Global” and “OFI” together the “Managers”) and OFI Global has entered into asub-advisory agreement with OFI whereby OFI provides investmentsub-advisory services to the Fund (collectively, the “Agreements”). Each year, the Board of Trustees (the “Board”), including a majority of the independent Trustees, is required to determine whether to approve the terms of the Agreements and the renewal thereof. The Investment Company Act of 1940, as amended, requires that the Board request and evaluate, and that the Managers provide, such information as may be reasonably necessary to evaluate the terms of the Agreements. The Board employs an independent consultant to prepare a report that provides information, including comparative information that the Board requests for that purpose. In addition toin-person meetings focused on this evaluation, the Board receives information throughout the year regarding Fund services, fees, expenses and performance.
The Managers and the independent consultant provided information to the Board on the following factors: (i) the nature, quality and extent of the Managers’ services, (ii) the comparative investment performance of the Fund and the Managers, (iii) the fees and expenses of the Fund, including comparative fee and expense information, (iv) the profitability of the Managers and their affiliates, including an analysis of the cost of providing services, (v) whether economies of scale are realized as the Fund grows and whether fee levels reflect these economies of scale for Fund investors and (vi) other benefits to the Managers from their relationship with the Fund. The Board was aware that there are alternatives to retaining the Managers.
Outlined below is a summary of the principal information considered by the Board as well as the Board’s conclusions.
Nature, Quality and Extent of Services. The Board considered information about the nature, quality and extent of the services provided to the Fund and information regarding the Managers’ key personnel who provide such services. The Managers’ duties include providing the Fund with the services of theSub-Adviser’s portfolio managers and investment team, who provide research, analysis and other advisory services in regard to the Fund’s investments; and securities trading services. OFI Global is responsible for oversight of third-party service providers; monitoring compliance with applicable Fund policies and procedures and adherence to the Fund’s investment restrictions; risk management; and oversight of theSub-Adviser. OFI Global is also responsible for providing certain administrative services to the Fund. Those services include providing and supervising all administrative and clerical personnel who are necessary in order to provide effective corporate administration for the Fund; compiling and maintaining records with respect to the Fund’s operations; preparing and filing reports required by the U.S. Securities and Exchange Commission; preparing periodic reports regarding the operations of the Fund for its shareholders; preparing proxy materials for shareholder meetings; and preparing the registration statements required by federal and state securities laws for the sale of the Fund’s shares. OFI Global also provides the Fund with office space, facilities and equipment.
The Board also considered the quality of the services provided and the quality of the Managers’ resources that are available to the Fund. The Board took account of the fact that theSub-Adviser has over fifty years of experience as an investment adviser and that its assets under management rank it among the top mutual fund managers in the United States. The Board evaluated the Managers’ advisory, administrative, accounting, legal, compliance and risk management services, among other services, and information the Board has received regarding the experience and professional qualifications of the Managers’ key personnel and the size and functions of their staff. In its evaluation of the quality of the portfolio management services provided, the Board considered the experience of Manind (“Mani”) Govil, Benjamin Ram and Paul Larson, the portfolio managers for the Fund, and theSub-Adviser’s investment team and analysts. The Board members also considered the totality of their experiences with the Managers as directors or trustees of the Fund and other funds advised by the Managers. The Board considered information regarding the quality of services provided by affiliates of the Managers, which the Board members have become knowledgeable about through their experiences with the Managers and in connection with the review or renewal of the Fund’s service agreements or service providers. The Board concluded, in light of the Managers’ experience, reputation, personnel, operations and resources that the Fund benefits from the services provided under the Agreements.
Investment Performance of the Managers and the Fund. Throughout the year, the Managers provided information on the investment performance of the Fund, the Adviser and theSub-Adviser, including comparative performance information. The Board also reviewed information, prepared by the Managers and by the independent consultant, comparing the Fund’s historical performance to relevant benchmarks or market indices and to the performance of other large blend funds underlying variable insurance products. The Board considered that the Fund outperformed its category median during the three- andten-year periods, though it underperformed its category median during the remaining periods. The Board also considered that the Fund ranked in the 4th and 34th percentiles of its category for the 2015 and 2016 calendar years, respectively, and that underperformance during 2017 affected the Fund’s performance record. In this regard, the Board noted that, when it reviewed the Fund’s performance and considered renewing the Agreements during the prior year, the Fund had outperformed its category median for all periods.
Fees and Expenses of the Fund. The Board reviewed the fees paid to the Adviser and the other expenses borne by the Fund. The Board noted that the Adviser, not the Fund, pays theSub-Adviser’s fee under thesub-advisory agreement. The independent consultant provided comparative data in regard to the fees and expenses of the Fund and other large blend funds underlying variable insurance products. In reviewing the fees and expenses charged to the VA funds, the Board considered the Adviser’s assertion that, because there is much greater disparity in the fees and services that may be provided by a manager to a VA fund as opposed to a retail fund, when comparing the expenses of the various VA funds to those of retail funds, it is most appropriate to focus on total expenses (rather than on the management fees). The Board considered that the Fund’s total expenses were higher than its peer group median and category median. The Board also considered that the Fund’s contractual management fee was lower than its category median and equal to its peer group median. The Board further considered that the Adviser has agreed to waive fees and/or reimburse Fund expenses in an amount equal to the management fees incurred indirectly through the Fund’s investment in funds managed by the Adviser or its affiliates.
Economies of Scale and Profits Realized by the Managers. The Board considered information regarding the Managers’ costs in serving as the Fund’s investment adviser andsub-adviser, including the costs associated with the personnel and systems necessary to manage the Fund, and information regarding the Managers’ profitability from their relationship with the Fund. The Board also considered that the Managers must be able to pay and retain experienced professional personnel at competitive rates to provide quality services to the Fund. The Board reviewed whether the Managers may realize economies of scale in managing and supporting the Fund. The Board noted that the Fund currently has management fee
23 OPPENHEIMER MAIN STREET FUND/VA
BOARD APPROVAL OF THE FUND’S INVESTMENT ADVISORY ANDSUB-ADVISORY AGREEMENTSUnaudited / Continued
breakpoints, which are intended to share with Fund shareholders economies of scale that may exist as the Fund’s assets grow.
Other Benefits to the Managers. In addition to considering the profits realized by the Managers, the Board considered information that was provided regarding the direct and indirect benefits the Managers receive as a result of their relationship with the Fund, including compensation paid to the Managers’ affiliates and research provided to the Adviser in connection with permissible brokerage arrangements (soft dollar arrangements).
Conclusions. These factors were also considered by the independent Trustees meeting separately from the full Board, assisted by experienced counsel to the Fund and to the independent Trustees. Fund counsel and the independent Trustees’ counsel are independent of the Managers within the meaning and intent of the Securities and Exchange Commission Rules.
Based on its review of the information it received and its evaluations described above, the Board, including a majority of the independent Trustees, decided to continue the Agreements through August 31, 2019. In arriving at its decision, the Board did not identify any factor or factors as being more important than others, but considered all of the above information, and considered the terms and conditions of the Agreements, including the management fees, in light of all the surrounding circumstances.
24 OPPENHEIMER MAIN STREET FUND/VA
PORTFOLIO PROXY VOTING POLICIES AND GUIDELINES; UPDATES TO STATEMENT OF INVESTMENTSUnaudited
The Fund has adopted Portfolio Proxy Voting Policies and Guidelines under which the Fund votes proxies relating to securities (“portfolio proxies”) held by the Fund. A description of the Fund’s Portfolio Proxy Voting Policies and Guidelines is available (i) without charge, upon request, by calling the Fund toll-free at 1.800.CALL OPP (225.5677), (ii) on the Fund’s website at www.oppenheimerfunds.com, and (iii) on the SEC’s website at www.sec.gov. In addition, the Fund is required to file FormN-PX, with its complete proxy voting record for the 12 months ended June 30th, no later than August 31st of each year. The Fund’s voting record is available (i) without charge, upon request, by calling the Fund toll-free at 1.800.CALL OPP (225.5677), and (ii) in the FormN-PX filing on the SEC’s website at www.sec.gov.
The Fund files its complete schedule of portfolio holdings with the SEC for the first quarter and the third quarter of each fiscal year on FormN-Q. The Fund’s FormN-Q filings are available on the SEC’s website at www.sec.gov.
25 OPPENHEIMER MAIN STREET FUND/VA
TRUSTEES AND OFFICERSUnaudited
| | |
| Name, Position(s) Held with the Fund, Length of Service, Year of Birth | | Principal Occupation(s) During the Past 5 Years; Other Trusteeships/Directorships Held; Number of Portfolios in the Fund Complex Currently Overseen |
| |
| INDEPENDENT TRUSTEES | | The address of each Trustee in the chart below is 6803 S. Tucson Way, Centennial, Colorado 80112-3924. Each Trustee serves for an indefinite term, or until his or her resignation, retirement, death or removal. Each of the Trustees in the chart below oversees 58 portfolios in the OppenheimerFunds complex. |
| |
Robert J. Malone, Chairman of the Board of Trustees (since 2016), Trustee (since 2002) Year of Birth: 1944 | | Chairman - Colorado Market of MidFirst Bank (since January 2015); Chairman of the Board (2012-2016) and Director (August 2005-January 2016) of Jones International University (educational organization); Trustee of the Gallagher Family Foundation(non-profit organization) (2000-2016); Chairman, Chief Executive Officer and Director of Steele Street Bank Trust (commercial banking) (August 2003-January 2015); Director of Opera Colorado Foundation(non-profit organization) (2008-2012); Director of Colorado UpLIFT (charitable organization) (1986-2010); Director of Jones Knowledge, Inc. (2006-2010); Former Chairman of U.S. Bank-Colorado (subsidiary of U.S. Bancorp and formerly Colorado National Bank) (July 1996-April 1999); Director of Commercial Assets, Inc. (real estate investment trust) (1993-2000); Director of U.S. Exploration, Inc. (oil and gas exploration) (1997-February 2004); Chairman of the Board (1991-1994) and Trustee (1985-1994) of Regis University; and Chairman of the Board (1990-1991) and Member (1984-1999) of Young Presidents Organization. Mr. Malone has served on the Boards of certain Oppenheimer funds since 2002, during which time he has become familiar with the Fund’s (and other Oppenheimer funds’) financial, accounting, regulatory and investment matters and has contributed to the Board’s deliberations. |
| |
Andrew J. Donohue, Trustee (since 2017) Year of Birth: 1950 | | Director, Mutual Fund Directors Forum (since February 2018); Of Counsel, Shearman & Sterling LLP (since September 2017); Chief of Staff of the U.S. Securities and Exchange Commission (regulator) (June 2015-February 2017); Managing Director and Investment Company General Counsel of Goldman Sachs (investment bank) (November2012-May 2015); Partner at Morgan Lewis & Bockius, LLP (law firm) (March 2011-October 2012); Director of the Division of Investment Management of U.S. Securities and Exchange Commission (regulator) (May 2006-November 2010); Global General Counsel of Merrill Lynch Investment Managers (investment firm) (May2003-May 2006); General Counsel (October 1991-November 2001) and Executive Vice President (January 1993-November 2001) of OppenheimerFunds, Inc. (investment firm) (June 1991-November 2001). Mr. Donohue has served on the Boards of certain Oppenheimer funds since 2017, during which time he has become familiar with the Fund’s (and other Oppenheimer funds’) financial, accounting, regulatory and investment matters and has contributed to the Board’s deliberations. |
| |
Richard F. Grabish, Trustee (since 2012) Year of Birth: 1948 | | Formerly Senior Vice President and Assistant Director of Sales and Marketing (March 1997-December 2007), Director (March 1987-December 2007) and Manager of Private Client Services (June 1985-June 2005) of A.G. Edwards & Sons, Inc. (broker/dealer and investment firm); Chairman and Chief Executive Officer of A.G. Edwards Trust Company, FSB (March 2001-December 2007); President and Vice Chairman of A.G. Edwards Trust Company, FSB (investment adviser) (April 1987-March 2001); President of A.G. Edwards Trust Company, FSB (investment adviser) (June 2005-December 2007). Mr. Grabish has served on the Boards of certain Oppenheimer funds since 2001, during which time he has become familiar with the Fund’s (and other Oppenheimer funds’) financial, accounting, regulatory and investment matters and has contributed to the Board’s deliberations. |
| |
Beverly L. Hamilton, Trustee (since 2002) Year of Birth: 1946 | | Trustee of Monterey Institute for International Studies (educational organization) (2000-2014); Board Member of Middlebury College (educational organization) (December 2005-June 2011); Director of the Board (1991-2016), Vice Chairman of the Board (2006-2009) and Chairman of the Board (2010-2013) of American Funds’ Emerging Markets Growth Fund, Inc. (mutual fund); Director of The California Endowment (philanthropic organization) (April 2002-April 2008); Director (February 2002-2005) and Chairman of Trustees (2006-2007) of the Community Hospital of Monterey Peninsula; President of ARCO Investment Management Company (February 1991-April 2000); Member of the investment committees of The Rockefeller Foundation (2001-2006) and The University of Michigan (since 2000); Advisor at Credit Suisse First Boston’s Sprout venture capital unit (venture capital fund) (1994-January 2005); Trustee of MassMutual Institutional Funds (investment company) (1996-June 2004); Trustee of MML Series Investment Fund (investment company) (April 1989-June 2004); Member of the investment committee of Hartford Hospital (2000-2003); and Advisor to Unilever (Holland) pension fund (2000-2003). Ms. Hamilton has served on the Boards of certain Oppenheimer funds since 2002, during which time she has become familiar with the Fund’s (and other Oppenheimer funds’) financial, accounting, regulatory and investment matters and has contributed to the Board’s deliberations. |
| |
Victoria J. Herget, Trustee (since 2012) Year of Birth: 1951 | | Board Chair (2008-2015) and Director (2004-Present) of United Educators (insurance company); Trustee (since 2000) and Chair (2010-2017) of Newberry Library (independent research library); Trustee, Mather LifeWays (senior living organization) (since 2001); Independent Director of the First American Funds (mutual fund family) (2003-2011); former Managing Director (1993-2001), Principal (1985-1993), Vice President (1978-1985) and Assistant Vice President (1973-1978) of Zurich Scudder Investments (investment adviser) (and its predecessor firms); Trustee (1992-2007), Chair of the Board of Trustees (1999-2007), Investment Committee Chair (1994-1999) and Investment Committee member (2007-2010) of Wellesley College; Trustee, BoardSource(non-profit organization) (2006-2009) and Chicago City Day School(K-8 School) (1994-2005). Ms. Herget has served on the Boards of certain Oppenheimer funds since 2012, during which time she has become familiar with the Fund’s (and other Oppenheimer funds’) financial, accounting, regulatory and investment matters and has contributed to the Board’s deliberations. |
| |
Karen L. Stuckey, Trustee (since 2012) Year of Birth: 1953 | | Member (since May 2015) of Desert Mountain Community Foundation Advisory Board(non-profit organization); Partner (1990-2012) of PricewaterhouseCoopers LLP (professional services firm) (held various positions 1975-1990); Trustee (1992- 2006); member of Executive, Nominating and Audit Committees and Chair of Finance Committee (1992-2006), and Emeritus Trustee (since 2006) of Lehigh University; member, Women’s Investment Management Forum (professional organization) (since inception) and Trustee of Jennies School for Little Children(non-profit) (2011-2014). Ms. Stuckey has served on the Boards of certain Oppenheimer funds since 2012, during which time she has become familiar with the Fund’s (and other Oppenheimer funds’) financial, accounting, regulatory and investment matters and has contributed to the Board’s deliberations. |
26 OPPENHEIMER MAIN STREET FUND/VA
| | |
James D. Vaughn, Trustee (since 2012) Year of Birth: 1945 | | Retired; former managing partner (1994-2001) of Denver office of Deloitte & Touche LLP, (held various positions in Denver and New York offices from 1969-1993); Trustee and Chairman of the Audit Committee of Schroder Funds (2003-2012); Board member and Chairman of Audit Committee of AMG National Trust Bank (since 2005); Trustee and Investment Committee member, University of South Dakota Foundation (since 1996); Board member, Audit Committee Member and past Board Chair, Junior Achievement (since 1993); former Board member, Mile High United Way, Boys and Girls Clubs, Boy Scouts, Colorado Business Committee for the Arts, Economic Club of Colorado and Metro Denver Network. Mr. Vaughn has served on the Boards of certain Oppenheimer funds since 2012, during which time he has become familiar with the Fund’s (and other Oppenheimer funds’) financial, accounting, regulatory and investment matters and has contributed to the Board’s deliberations. |
INTERESTED TRUSTEE AND OFFICER | | Mr. Steinmetz is an “Interested Trustee” because he is affiliated with the Manager and theSub-Adviser by virtue of his positions as Chairman and director of theSub-Adviser and officer and director of the Manager. Both as a Trustee and as an officer, Mr. Steinmetz serves for an indefinite term, or until his resignation, retirement, death or removal. Mr. Steinmetz’s address is 225 Liberty Street, New York, New York 10281- 1008. Mr. Steinmetz is an officer of 104 portfolios in the OppenheimerFunds complex. |
| |
Arthur P. Steinmetz, Trustee (since 2015), President and Principal Executive Officer (since 2014) Year of Birth: 1958 | | Chairman of OppenheimerFunds, Inc. (since January 2015); CEO and Chairman of OFI Global Asset Management, Inc. (since July 2014), President of OFI Global Asset Management, Inc. (since May 2013), a Director of OFI Global Asset Management, Inc. (since January 2013), Director of OppenheimerFunds, Inc. (since July 2014), President, Management Director and CEO of Oppenheimer Acquisition Corp. (OppenheimerFunds, Inc.‘s parent holding company) (since July 2014), and President and Director of OFI SteelPath, Inc. (since January 2013). Chief Investment Officer of the OppenheimerFunds advisory entities (January 2013-December 2013); Executive Vice President of OFI Global Asset Management, Inc. (January2013-May 2013); Chief Investment Officer of OppenheimerFunds, Inc. (October 2010-December 2012); Chief Investment Officer, Fixed- Income, of OppenheimerFunds, Inc. (April 2009-October 2010); Executive Vice President of OppenheimerFunds, Inc. (October 2009-December 2012); Director of Fixed Income of OppenheimerFunds, Inc. (January 2009-April 2009); and a Senior Vice President of OppenheimerFunds, Inc. (March 1993-September 2009). |
OTHER OFFICERS OF THE FUND | | The addresses of the Officers in the chart below are as follows: for Messrs. Govil, Ram, Larson, Mss. Lo Bessette, Foxson and Picciotto, 225 Liberty Street, New York, New York 10281-1008, for Mr. Petersen, 6803 S. Tucson Way, Centennial, Colorado 80112-3924. Each Officer serves for an indefinite term or until his or her resignation, retirement, death or removal. |
| |
Manind Govil, Vice President (since 2009) Year of Birth: 1969 | | Senior Vice President, the Main Street Team Leader and a portfolio manager of theSub-Adviser (since May 2009). Portfolio manager with RS Investment Management Co. LLC (October 2006-March 2009). Head of equity investments at The Guardian Life Insurance Company of America (August 2005-October 2006) when Guardian Life Insurance acquired an interest in RS Investment Management Co. LLC. Lead portfolio manager - large cap blend/core equity,co-head of equities and head of equity research (2001-July 2005), and was lead portfolio manager - core equity (April 1996-July 2005), at Mercantile Capital Advisers, Inc. |
| |
Benjamin Ram, Vice President (since 2009) Year of Birth: 1972 | | Senior Portfolio Manager of theSub-Adviser (since January 2011); Vice President and Portfolio Manager of theSub-Adviser (May 2009 - December 2010). Sector Manager for Financial Investments andco-Portfolio Manager formid-cap portfolios with the RS Core Equity Team of RS Investments Management Co. LLC (October2006-May 2009); Portfolio Manager of Mid Cap Strategies, Sector Manager Financials at The Guardian Life Insurance Company of America (January 2006-October 2006) when Guardian Life Insurance acquired an interest in RS Investments Management Co. LLC. Financial analyst (2003-2005) andco-portfolio manager (2005-2006) at Mercantile Capital Advisers, Inc.; Bank analyst at Legg Mason Securities (2000-2003); senior financial analyst at the CitiFinancial division of Citigroup, Inc. (1997-2000). |
| |
Paul Larson, Vice President (since 2014) Year of Birth: 1971 | | Vice President of theSub-Adviser (since January 2013). Prior to joining theSub-Adviser, he was a portfolio manager and Chief Equity Strategist at Morningstar. He was previously an analyst at Morningstar covering the energy sector and oversaw the firm’s natural resources analysts. Prior to joining Morningstar in 2002, Mr. Larson was an analyst with The Motley Fool. |
| |
Cynthia Lo Bessette, Secretary and Chief Legal Officer (since 2016) Year of Birth: 1969 | | Executive Vice President, General Counsel and Secretary of OFI Global Asset Management, Inc. (since February 2016); Senior Vice President and Deputy General Counsel of OFI Global Asset Management, Inc. (March 2015-February 2016); Chief Legal Officer of OppenheimerFunds, Inc. and OppenheimerFunds Distributor, Inc. (since February 2016); Vice President, General Counsel and Secretary of Oppenheimer Acquisition Corp. (since February 2016); General Counsel of OFI SteelPath, Inc., OFI Advisors, LLC and Index Management Solutions, LLC (since February 2016); Chief Legal Officer of OFI Global Institutional, Inc., HarbourView Asset Management Corporation, OFI Global Trust Company, Oppenheimer Real Asset Management, Inc., OFI Private Investments Inc., Shareholder Services, Inc. and Trinity Investment Management Corporation (since February 2016); Corporate Counsel (February 2012-March 2015) and Deputy Chief Legal Officer (April 2013-March 2015) of Jennison Associates LLC; Assistant General Counsel (April 2008-September 2009) and Deputy General Counsel (October 2009-February 2012) of Lord Abbett & Co. LLC. |
| |
Jennifer Foxson, Vice President and Chief Business Officer (since 2014) Year of Birth: 1969 | | Senior Vice President of OppenheimerFunds Distributor, Inc. (since June 2014); Vice President of OppenheimerFunds Distributor, Inc. (April 2006-June 2014); Vice President of OppenheimerFunds, Inc. (January 1998-March 2006); Assistant Vice President of OppenheimerFunds, Inc. (October 1991-December 1998). |
| |
Mary Ann Picciotto, Chief Compliance Officer and Chief Anti-Money Laundering Officer (since 2014) Year of Birth: 1973 | | Senior Vice President and Chief Compliance Officer of OFI Global Asset Management, Inc. (since March 2014); Chief Compliance Officer of OppenheimerFunds, Inc., OFI SteelPath, Inc., OFI Global Institutional, Inc., Oppenheimer Real Asset Management, Inc., OFI Private Investments Inc., Harborview Asset Management Corporation, Trinity Investment Management Corporation, and Shareholder Services, Inc. (since March 2014); Managing Director of Morgan Stanley Investment Management Inc. and certain of its various affiliated entities; Chief Compliance Officer of various Morgan Stanley Funds (May 2010-January 2014); Chief Compliance Officer of Morgan Stanley Investment Management Inc. (April 2007-January 2014). |
27 OPPENHEIMER MAIN STREET FUND/VA
TRUSTEES AND OFFICERSUnaudited / Continued
| | |
Brian S. Petersen, Treasurer and Principal Financial & Accounting Officer (since 2016) Year of Birth: 1970 | | Senior Vice President of OFI Global Asset Management, Inc. (since January 2017); Vice President of OFI Global Asset Management, Inc. (January 2013-January 2017); Vice President of OppenheimerFunds, Inc. (February 2007-December 2012); Assistant Vice President of OppenheimerFunds, Inc. (August 2002-2007). |
The Fund’s Statement of Additional Information contains additional information about the Fund’s Trustees and Officers and is available without charge, upon request, by calling 1.800.988.8287.
28 OPPENHEIMER MAIN STREET FUND/VA
THIS PAGE INTENTIONALLY LEFT BLANK.
29 OPPENHEIMER MAIN STREET FUND/VA
THIS PAGE INTENTIONALLY LEFT BLANK.
30 OPPENHEIMER MAIN STREET FUND/VA
THIS PAGE INTENTIONALLY LEFT BLANK.
31 OPPENHEIMER MAIN STREET FUND/VA
OPPENHEIMER MAIN STREET FUND/VA
A Series of Oppenheimer Variable Account Funds
| | |
| Manager | | OFI Global Asset Management, Inc. |
| |
| Sub-Adviser | | OppenheimerFunds, Inc. |
| |
| Distributor | | OppenheimerFunds Distributor, Inc. |
| |
Transfer and Shareholder Servicing Agent | | OFI Global Asset Management, Inc. |
| |
| Sub-Transfer Agent | | Shareholder Services, Inc. DBA OppenheimerFunds Services |
| |
Independent Registered Public Accounting Firm | | KPMG LLP |
| |
| Legal Counsel | | Ropes & Gray LLP |
| |
| | Before investing in any of the Oppenheimer funds, investors should carefully consider a fund’s investment objectives, risks, charges and expenses. Fund prospectuses and summary prospectuses contain this and other information about the funds, and may be obtained by asking your financial advisor, visiting oppenheimerfunds.com or calling us at 1.800.988.8287. Read prospectuses and summary prospectuses carefully before investing. |
| |
| | © 2019 OppenheimerFunds, Inc. All rights reserved. Oppenheimer funds are distributed by OppenheimerFunds Distributor, Inc. |
| | | | |
| |  | | |
| | |
| | | December 31, 2018 | | |
| | | Oppenheimer | | |
| | Main Street Small Cap Fund/VA | | Annual Report |
| | A Series of Oppenheimer Variable Account Funds | | |
| | | |
| | ANNUAL REPORT | | |
| | |
| | Listing of Top Holdings | | |
| | |
| | Fund Performance Discussion | | |
| | |
| | Financial Statements | | |
PORTFOLIO MANAGERS: Matthew P. Ziehl, CFA, Raymond Anello, CFA, Raman Vardharaj, CFA, Joy Budzinski, Kristin Ketner, Magnus Krantz and Adam Weiner.
AVERAGE ANNUAL TOTAL RETURNS FOR THE PERIODS ENDED 12/31/18
| | | | | | | | | | | | | | | | |
| | | Inception
Date | | | 1-Year | | | 5-Year | | | 10-Year | |
Non-Service Shares | | | 5/1/98 | | | | -10.32% | | | | 4.94% | | | | 13.37% | |
Service Shares | | | 7/16/01 | | | | -10.54 | | | | 4.69 | | | | 13.09 | |
Russell 2000 Index | | | | | | | -11.01 | | | | 4.41 | | | | 11.97 | |
Performance data quoted represents past performance, which does not guarantee future results.The investment return and principal value of an investment in the Fund will fluctuate so that an investor’s shares, when redeemed, may be worth more or less than their original cost. Current performance may be lower or higher than the performance quoted. For performance data current to the most recent month end, call us at 1.800.988.8287. The Fund’s total returns should not be expected to be the same as the returns of other funds, whether or not both funds have the same portfolio managers and/or similar names. The Fund’s total returns include changes in share price and reinvested distributions but do not include the charges associated with the separate account products that offer this Fund. Such performance would have been lower if such charges were taken into account. Returns for periods of less than one year are cumulative and not annualized. See Fund prospectuses and summary prospectuses for more information on share classes and sales charges.
TOP HOLDINGS AND ALLOCATIONS
| | | | |
TOP TEN COMMON STOCK HOLDINGS | | | | |
Korn/Ferry International | | | 2.1% | |
Four Corners Property Trust, Inc. | | | 2.1 | |
CACI International, Inc., Cl. A | | | 2.0 | |
ASGN, Inc. | | | 1.9 | |
Jack in the Box, Inc. | | | 1.8 | |
National Storage Affiliates Trust | | | 1.8 | |
Zynga, Inc., Cl. A | | | 1.8 | |
Generac Holdings, Inc. | | | 1.7 | |
j2 Global, Inc. | | | 1.6 | |
Visteon Corp. | | | 1.6 | |
Portfolio holdings and allocations are subject to change. Percentages are as of December 31, 2018, and are based on net assets.
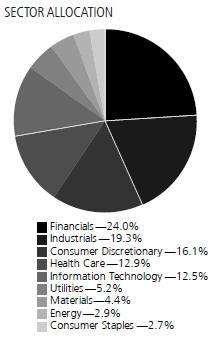
Portfolio holdings and allocations are subject to change. Percentages are as of December 31, 2018, and are based on the total market value of common stocks.
For more current Fund holdings, please visit oppenheimerfunds.com.
2 OPPENHEIMER MAIN STREET SMALL CAP FUND/VA
Fund Performance Discussion
During a volatile year, the Fund’sNon-Service shares produced a return of-10.32%. In comparison, the Fund outperformed the Russell 2000 Index (the “Index”), which returned-11.01%. The Fund’s outperformance versus the Index for theone-year period ended December 31, 2018, stemmed largely from stock selection within the Energy, Health Care, and Information Technology sectors. The largest underperformer for the Fund was stock selection in the Financials sector. Stock selection in the Industrials and Materials sectors also detracted from performance this period.
MARKET OVERVIEW
The U.S. economy continues to exhibit good economic growth, low unemployment and modest inflation. This is driven partly by tax cuts, technological innovation and falling regulatory hurdles. That said, the effects of the strain in the trading relationship with China have been a headwind to growth, but not nearly enough to offset the strong momentum in the economy.
Markets were volatile in 2018, particularly later in the year. Small caps, and equity markets in general, were under severe pressure during the fourth quarter of 2018 with the Russell 2000 Index declining by roughly 20%. The S&P 500 Index also experienced its worst quarterly return since the depths of the financial crises in 2008.
We continue to focus on the fundamentals of each business to drive our investment decisions versus getting caught up in the temporary emotions of the market, always with the long-term welfare of our shareholders in mind. Our philosophy is to focus on companies we believe have sustainable competitive advantages that can outperform in most market environments. We combine this with our valuation discipline to seek a margin of safety, with downside protection an important consideration. That being said, we do have a history of underperforming ingo-go markets andout-performing in bear markets.
TOP INDIVIDUAL CONTRIBUTORS
Holdings that were contributors to the Fund’s performance this period included Renewable Energy Group, Amedisys, and Etsy.
Home health provider Amedisys posted several quarters of better-than-expected earnings due to operational improvements, notably in labor cost management. Investors also warmed to the home health space as the reimbursement environment has improved, which we have long expected based on the lowerall-in cost and patient preference for treatment. Late in the year we exited the position at a significant profit due to valuation.
Renewable Energy Group rallied as investors cheered the company’s second quarter earnings report showing improved profitability and a strengthening balance sheet. These results were supported by regulatory measures enacted late last year reducing imports along with a retroactive extension of the biodiesel mixture excise tax credit for 2017, which boosted earnings and removed an uncertainty overhang to the stock. These developments have helped the company to continue emerging as a long-term leader inbio-based fuel.
Etsy’s stock moved substantially higher after instituting a significant price increase to narrow the “take rate” discount that was in place relative to other marketplaces. This was interpreted by the market as a sign of confidence that the marketplace has developed enough stickiness with sellers to support pricing power. Along with the pricing move helpingtop-line revenue growth and margins, the company will reinvest some of the proceeds to support more aggressive marketing to gain new buyers, enhance repeat purchase activity and improve conversion, which offers a lot of runway for continued strong growth for the foreseeable future.
TOP INDIVIDUAL DETRACTORS
Top detractors from performance included Visteon, Summit Materials, and Prestige Consumer Healthcare.
Visteon designs, engineers and manufactures cockpit electronics products and connected car solutions for most of the world’s major vehicle manufacturers. After a strong run over the past two to three years of meeting/beating analyst earnings estimates, the company reported had a disappointing 2018. Specifically, the company has been facing increasing headwinds related to softening vehicle production, diesel demand, and tariffs. While we acknowledge that the near-term outlook for the company has weakened, we think the company’s large backlog of $21 billion (roughly 7x annual sales), strong balance sheet and free cash flow, should help them weather a more challenging environment. After the recent pullback, we see the shares as having an attractive risk-reward given ourtwo- to three-year outlook.
3 OPPENHEIMER MAIN STREET SMALL CAP FUND/VA
Summit is one of the fastest growing construction materials companies that supplies aggregates, cement,ready-mix concrete and asphalt paving mix in the U.S. and western Canada. The company had a rough 2018 given the negative impact from poor weather in several of its key end markets combined with higher costs for raw materials, freight, labor, and fuel. Demand remains generally healthy and we are optimistic regarding the outlook for infrastructure spending over the next three to five years, which we believe should be beneficial for Summit. After the stock’s recent pullback, we see the shares as offering an attractive risk-reward over theintermediate-to-long term.
Prestige markets, sells, and distributes variousover-the-counter healthcare and consumer products. In 2017 and into 2018, Consumer Staples as a group were under pressure due to a variety of factors, and Prestige was no exception. Organic sales trends slowed and cost pressures increased, especially for transportation. Despite an attractive valuation, we exited the stock during the second quarter of 2018 as we did not see a catalyst for fundamental improvement.
STRATEGY & OUTLOOK
In the short term, we expect the U.S. economy to continue to show economic growth, albeit at slower rates than experienced in 2018 as the “sugar high” from tax cuts wears off. This will be driven by favorable ongoing consumer confidence, falling regulatory hurdles, as well as technological innovation. The biggest macro risks we see are trade tariffs and higher interest rates.
Speculation remains at an elevated level. Mania around cryptocurrency earlier in the year and cannabis stocks more recently are symptoms of these. We believe an equally big risk to stock prices is the stock market’s preference for so called “disruptors” and the potential for stocks with this perceived characteristic to become crowded trades and have valuations untethered to financial reality. While some of the high flyers lost altitude in the fourth quarter as the market corrected, a true capitulation point has not yet been reached.
Regarding trade tariffs, while concern has risen in recent weeks, the market continues to view bluster from D.C. as a negotiating tactic and is implying that all will end well. So far this has been borne out in trade negotiations between the U.S., Mexico and Canada. A true escalation could severely hamper global growth and thereby stock prices. Innovation, while a positive for the overall economy over the long term, creates short-term disruptions of which to be cognizant. Lastly, we are afraid companies have become addicted to low interest rates. If interest rates were to continue to rise materially, some companies’ historical decisions will look like a misallocation of capital and negatively impact their stock prices.
We believe a rise in interest rates and other monetary tightening will have profound implications for the equity markets. Due to the 2008 crisis, interest rates were driven to record lows and a flood of liquidity was unleashed. Short-term interest rates were at essentially zero and even longer rates were driven to around 2%. This was not just flash in the pan either, as the rates stayed at these levels for multiple years. When the cost of money became close to zero and its availability abundant, the equity market’s horizon became longer forstart-ups delivering profits. As a result, we have seen several companies focus on revenue growth through disruption without regard to profit generation.
We are afraid even established companies are addicted to low interest rates which is not sustainable for longer-term profitable growth. Once this corrects, it will be healthy in the longer-term because it will drive companies to generate profits. “Profitable Revenue Growth” is better, tougher and more sustainable than mere “Revenue Growth”. Over time, companies that generate such profitable growth are more durable investments with better down-side protection even though they may look a little short in a speculative environment. As a famous investor once said, you don’t know who has been swimming naked until the tide rolls out. At the moment, the tide is lower than it was a few months ago, but still relatively high. We know this won’t be the situation in perpetuity.
We continue to maintain our discipline around valuation and focus on companies with competitive advantages and skilled management teams that areout-executing peers. Evidence of this in the companies we look for include high returns on invested capital, consistently strong pricing power, and/or rising market shares. During times of economic volatility such companies frequently widen their lead over weaker competitors. We seek to invest in companies characterized by these qualities at compelling valuations and believe this disciplined approach is essential to generating superior long-term performance, especially in down markets.
We fully believe that over a complete market cycle, the value of our strategy will become apparent again.
Investors should consider the Fund’s investment objective, risks, charges and expenses carefully before investing. The Fund’s prospectus and summary prospectus contain this and other information about the Fund, and may be obtained by asking your financial advisor or calling us at 1.800.988.8287. Read prospectuses and summary prospectuses carefully before investing.
4 OPPENHEIMER MAIN STREET SMALL CAP FUND/VA
Total returns include changes in share price and reinvestment of dividends and capital gains distributions in a hypothetical investment for the periods shown, but do not include the charges associated with the separate account products that offer this Fund.
The views in the Fund Performance Discussion represent the opinions of this Fund’s portfolio managers and are not intended as investment advice or to predict or depict the performance of any investment. These views are as of the close of business on December 31, 2018, and are subject to change based on subsequent developments. The Fund’s portfolio and strategies are subject to change.
Shares of Oppenheimer funds are not deposits or obligations of any bank, are not guaranteed by any bank, are not insured by the FDIC or any other agency, and involve investment risks, including the possible loss of the principal amount invested.
Comparing the Fund’s Performance to the Market.The graphs that follow show the performance of a hypothetical $10,000 investment in each share class of the Fund held until December 31, 2018. Performance is measured over aten-fiscal-year period for both Classes. Performance information does not reflect charges that apply to separate accounts investing in the Fund. If these charges were taken into account, performance would be lower. The graphs assume that all dividends and capital gains distributions were reinvested in additional shares.
The Fund’s performance is compared to the performance of the Russell 2000 Index, which measures the performance of thesmall-cap segment of the U.S. equity universe. The Russell 2000 Index is a subset of the Russell 3000 Index representing approximately 10% of the total market capitalization of that index. It includes approximately 2000 of the smallest securities based on a combination of their market cap and current index membership. The Index isunmanaged and cannot be purchased directly by investors. While index comparisons may be useful to provide a benchmark for the Fund’s performance, it must be noted that the Fund’s investments are not limited to the investments comprising theIndex. Index performance includes reinvestment of income, but does not reflect transaction costs, fees, expenses or taxes. Index performance is shown for illustrative purposes only as a benchmark for the Fund’s performance, and does not predict or depict performance of the Fund. The Fund’s performance reflects the effects of the Fund’s business and operating expenses.
5 OPPENHEIMER MAIN STREET SMALL CAP FUND/VA
COMPARISON OF CHANGE IN VALUE OF $10,000 HYPOTHETICAL INVESTMENTS IN:
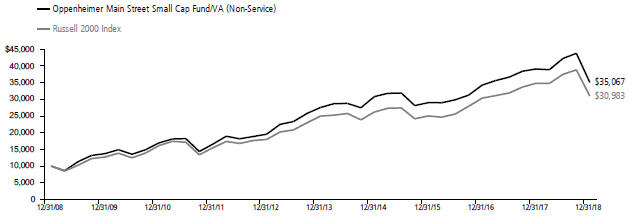
Average Annual Total Returns ofNon-Service Shares of the Fund at 12/31/18
1-Year -10.32% 5-Year 4.94% 10-Year 13.37%
COMPARISON OF CHANGE IN VALUE OF $10,000 HYPOTHETICAL INVESTMENTS IN:
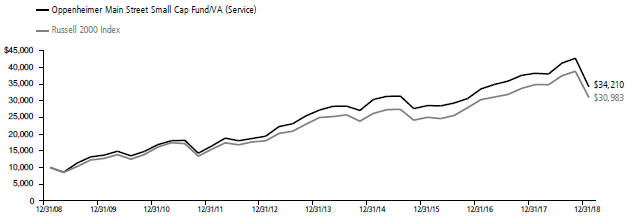
Average Annual Total Returns of Service Shares of the Fund at 12/31/18
1-Year -10.54% 5-Year 4.69% 10-Year 13.09%
Performance data quoted represents past performance, which does not guarantee future results.The investment return and principal value of an investment in the Fund will fluctuate so that an investor’s shares, when redeemed, may be worth more or less than their original cost. Current performance may be lower or higher than the performance quoted. For performance data current to the most recent month end, call us at 1.800.988.8287. The Fund’s total returns should not be expected to be the same as the returns of other funds, whether or not both funds have the same portfolio managers and/or similar names. The Fund’s total returns include changes in share price and reinvested distributions but do not include the charges associated with the separate account products that offer this Fund. Such performance would have been lower if such charges were taken into account.
6 OPPENHEIMER MAIN STREET SMALL CAP FUND/VA
Fund Expenses
Fund Expenses.As a shareholder of the Fund, you incur two types of costs: (1) transaction costs and (2) ongoing costs, including management fees; distribution and service fees; and other Fund expenses. These examples are intended to help you understand your ongoing costs (in dollars) of investing in the Fund and to compare these costs with the ongoing costs of investing in other mutual funds.
The examples are based on an investment of $1,000.00 invested at the beginning of the period and held for the entire6-month period ended December 31, 2018.
Actual Expenses. The first section of the table provides information about actual account values and actual expenses. You may use the information in this section for the class of shares you hold, together with the amount you invested, to estimate the expense that you paid over the period. Simply divide your account value by $1,000.00 (for example, an $8,600.00 account value divided by $1,000.00 = 8.60), then multiply the result by the number in the first section under the heading entitled “Expenses Paid During 6 Months Ended December 31, 2018” to estimate the expenses you paid on your account during this period.
Hypothetical Example for Comparison Purposes.
The second section of the table provides information about hypothetical account values and hypothetical expenses based on the Fund’s actual expense ratio for each class of shares, and an assumed rate of return of 5% per year for each class before expenses, which is not the actual return. The hypothetical account values and expenses may not be used to estimate the actual ending account balance or expenses you paid for the period. You may use this information to compare the ongoing costs of investing in the Fund and other funds. To do so, compare this 5% hypothetical example for the class of shares you hold with the 5% hypothetical examples that appear in the shareholder reports of the other funds.
Please note that the expenses shown in the table are meant to highlight your ongoing costs only and do not reflect any charges associated with the separate accounts that offer this Fund. Therefore, the “hypothetical” lines of the table are useful in comparing ongoing costs only, and will not help you determine the relative total costs of owning different funds. In addition, if these separate account charges were included your costs would have been higher.
| | | | | | | | | | | | | | | | |
| Actual | | Beginning
Account Value
July 1, 2018 | | | Ending Account Value
December 31, 2018 | | | Expenses Paid During 6 Months Ended December 31, 2018 | | | | |
Non-Service shares | | $ | 1,000.00 | | | $ | 830.00 | | | $ | 3.70 | | | | | |
Service shares | | | 1,000.00 | | | | 829.10 | | | | 4.85 | | | | | |
| | | | |
| Hypothetical | | | | | | | | | | | | |
(5% return before expenses) | | | | | | | | | | | | | | | | |
Non-Service shares | | | 1,000.00 | | | | 1,021.17 | | | | 4.08 | | | | | |
Service shares | | | 1,000.00 | | | | 1,019.91 | | | | 5.36 | | | | | |
Expenses are equal to the Fund’s annualized expense ratio for that class, multiplied by the average account value over the period, multiplied by 184/365 (to reflect theone-half year period). Those annualized expense ratios, excluding indirect expenses from affiliated funds, based on the6-month period ended December 31, 2018 are as follows:
| | |
| Class | | Expense Ratios |
Non-Service shares | | 0.80% |
Service shares | | 1.05 |
The expense ratios reflect voluntary and/or contractual waivers and/or reimbursements of expenses by the Fund’s Manager. Some of these undertakings may be modified or terminated at any time, as indicated in the Fund’s prospectus. The “Financial Highlights” tables in the Fund’s financial statements, included in this report, also show the gross expense ratios, without such waivers or reimbursements and reduction to custodian expenses, if applicable.
7 OPPENHEIMER MAIN STREET SMALL CAP FUND/VA
STATEMENT OF INVESTMENTSDecember 31, 2018
| | | | | | | | | | | | |
| | | Shares | | | | | | Value | |
| Common Stocks—97.9% | |
| Consumer Discretionary—15.9% | | | | | | | | | | | | |
| Auto Components—2.9% | | | | | | | | | | | | |
| Dorman Products, Inc.1 | | | 126,710 | | | | | | | $ | 11,406,434 | |
| Visteon Corp.1 | | | 217,910 | | | | | | | | 13,135,615 | |
| | | | | | | | | | | 24,542,049 | |
| | | | | | | | | | | | | |
| Diversified Consumer Services—2.0% | |
| Houghton Mifflin Harcourt Co.1 | | | 1,044,850 | | | | | | | | 9,257,371 | |
| Weight Watchers International, Inc.1 | | | 195,210 | | | | | | | | 7,525,345 | |
| | | | | | | | | | | 16,782,716 | |
| | | | | | | | | | | | | |
| Entertainment—1.8% | | | | | | | | | | | | |
Zynga, Inc., Cl. A1 | | | 3,882,937 | | | | | | | | 15,259,942 | |
| Hotels, Restaurants & Leisure—4.3% | |
| Jack in the Box, Inc. | | | 201,510 | | | | | | | | 15,643,222 | |
| Texas Roadhouse, Inc., Cl. A | | | 178,600 | | | | | | | | 10,662,420 | |
| Wendy’s Co. (The) | | | 703,130 | | | | | | | | 10,975,859 | |
| | | | | | | | | | | 37,281,501 | |
| | | | | | | | | | | | | |
| Household Durables—0.8% | | | | | | | | | | | | |
TopBuild Corp.1 | | | 144,410 | | | | | | | | 6,498,450 | |
| Internet & Catalog Retail—0.8% | | | | | | | | | | | | |
Etsy, Inc.1 | | | 147,920 | | | | | | | | 7,036,554 | |
| Specialty Retail—3.3% | | | | | | | | | | | | |
| AutoNation, Inc.1 | | | 275,140 | | | | | | | | 9,822,498 | |
| Children’s Place, Inc. (The) | | | 140,760 | | | | | | | | 12,681,069 | |
| Michaels Cos., Inc. (The)1 | | | 446,130 | | | | | | | | 6,040,600 | |
| | | | | | | | | | | 28,544,167 | |
| | | | | | | | | | | | | |
| Consumer Staples—2.6% | | | | | | | | | | | | |
| Household Products—1.5% | | | | | | | | | | | | |
Energizer Holdings, Inc. | | | 277,370 | | | | | | | | 12,523,255 | |
| Personal Products—1.1% | | | | | | | | | | | | |
Nu Skin Enterprises, Inc., Cl. A | | | 159,160 | | | | | | | | 9,761,283 | |
| Energy—2.8% | | | | | | | | | | | | |
| Oil, Gas & Consumable Fuels—2.8% | | | | | | | | | | | | |
| Matador Resources Co.1 | | | 580,443 | | | | | | | | 9,014,280 | |
| Noble Midstream Partners LP2 | | | 232,666 | | | | | | | | 6,710,088 | |
| Renewable Energy Group, Inc.1 | | | 335,269 | | | | | | | | 8,616,413 | |
| | | | | | | | | | | 24,340,781 | |
| | | | | | | | | | | | | |
| Financials—23.6% | | | | | | | | | | | | |
| Capital Markets—2.2% | | | | | | | | | | | | |
| Federated Investors, Inc., Cl. B | | | 216,900 | | | | | | | | 5,758,695 | |
| Focus Financial Partners, Inc., Cl. A1 | | | 132,200 | | | | | | | | 3,480,826 | |
| Stifel Financial Corp. | | | 229,640 | | | | | | | | 9,511,689 | |
| | | | | | | | | | | 18,751,210 | |
| | | | | | | | | | | | | |
| Commercial Banks—8.9% | | | | | | | | | | | | |
| Bank of NT Butterfield & Son Ltd. (The) | | | 267,720 | | | | | | | | 8,393,022 | |
| BankUnited, Inc. | | | 307,085 | | | | | | | | 9,194,125 | |
| Berkshire Hills Bancorp, Inc. | | | 237,940 | | | | | | | | 6,417,242 | |
| Cathay General Bancorp | | | 168,580 | | | | | | | | 5,652,487 | |
| Chemical Financial Corp. | | | 212,586 | | | | | | | | 7,782,774 | |
| Columbia Banking System, Inc. | | | 194,650 | | | | | | | | 7,063,849 | |
| Customers Bancorp, Inc.1 | | | 231,550 | | | | | | | | 4,214,210 | |
| Heritage Financial Corp. | | | 191,930 | | | | | | | | 5,704,160 | |
| IBERIABANK Corp. | | | 145,740 | | | | | | | | 9,368,167 | |
| Pacific Premier Bancorp, Inc.1 | | | 179,570 | | | | | | | | 4,582,626 | |
| Sterling Bancorp | | | 488,030 | | | | | | | | 8,057,375 | |
| | | | | | | | | | | 76,430,037 | |
| | | | | | | | | | | | | |
| Insurance—1.9% | | | | | | | | | | | | |
| James River Group Holdings Ltd. | | | 169,632 | | | | | | | | 6,198,353 | |
| ProAssurance Corp. | | | 240,160 | | | | | | | | 9,740,890 | |
| | | | | | | | | | | 15,939,243 | |
| | | | | | | | | | | | | |
| Real Estate Investment Trusts (REITs)—7.7% | | | | | | | | | |
| Brandywine Realty Trust | | | 877,960 | | | | | | | | 11,299,345 | |
| DiamondRock Hospitality Co. | | | 1,440,900 | | | | | | | | 13,083,372 | |
| EPR Properties | | | 131,400 | | | | | | | | 8,413,542 | |
| | | | | | | | | | | | |
| | | Shares | | | | | | Value | |
| Real Estate Investment Trusts (REITs) (Continued) | |
| Four Corners Property Trust, Inc. | | | 676,000 | | | | | | | $ | 17,711,200 | |
| National Storage Affiliates Trust | | | 583,246 | | | | | | | | 15,432,689 | |
| | | | | | | | | | | 65,940,148 | |
| | | | | | | | | | | | | |
| Thrifts & Mortgage Finance—2.9% | | | | | | | | | | | | |
| Beneficial Bancorp, Inc. | | | 443,740 | | | | | | | | 6,341,045 | |
| OceanFirst Financial Corp. | | | 337,233 | | | | | | | | 7,591,115 | |
| WSFS Financial Corp. | | | 298,820 | | | | | | | | 11,328,266 | |
| | | | | | | | | | | 25,260,426 | |
| | | | | | | | | | | | | |
| Health Care—12.6% | | | | | | | | | | | | |
| Biotechnology—3.3% | | | | | | | | | | | | |
| Emergent BioSolutions, Inc.1 | | | 176,370 | | | | | | | | 10,455,214 | |
| Ligand Pharmaceuticals, Inc.1 | | | 52,280 | | | | | | | | 7,094,396 | |
| Repligen Corp.1 | | | 152,710 | | | | | | | | 8,053,925 | |
| uniQure NV1 | | | 96,860 | | | | | | | | 2,791,505 | |
| | | | | | | | | | | 28,395,040 | |
| | | | | | | | | | | | | |
| Health Care Equipment & Supplies—3.4% | | | | | | | | | |
| AtriCure, Inc.1 | | | 174,770 | | | | | | | | 5,347,962 | |
| CryoPort, Inc.1 | | | 214,700 | | | | | | | | 2,368,141 | |
| Inogen, Inc.1 | | | 29,460 | | | | | | | | 3,658,048 | |
| Quidel Corp.1 | | | 140,650 | | | | | | | | 6,866,533 | |
| Senseonics Holdings, Inc.1 | | | 1,024,559 | | | | | | | | 2,653,608 | |
| Wright Medical Group NV1 | | | 296,120 | | | | | | | | 8,060,386 | |
| | | | | | | | | | | 28,954,678 | |
| | | | | | | | | | | | | |
| Health Care Providers & Services—2.9% | |
| Addus HomeCare Corp.1 | | | 108,312 | | | | | | | | 7,352,219 | |
| Diplomat Pharmacy, Inc.1 | | | 397,790 | | | | | | | | 5,354,253 | |
| LHC Group, Inc.1 | | | 132,770 | | | | | | | | 12,464,448 | |
| | | | | | | | | | | 25,170,920 | |
| | | | | | | | | | | | | |
| Health Care Technology—1.6% | | | | | | | | | | | | |
| Inspire Medical Systems, Inc.1 | | | 133,243 | | | | | | | | 5,629,517 | |
| Teladoc Health, Inc.1 | | | 163,940 | | | | | | | | 8,126,506 | |
| | | | | | | | | | | 13,756,023 | |
| | | | | | | | | | | | | |
| Pharmaceuticals—1.4% | | | | | | | | | | | | |
| Intersect ENT, Inc.1 | | | 207,210 | | | | | | | | 5,839,178 | |
| TherapeuticsMD, Inc.1 | | | 1,007,470 | | | | | | | | 3,838,461 | |
| Zogenix, Inc.1 | | | 67,060 | | | | | | | | 2,445,007 | |
| | | | | | | | | | | 12,122,646 | |
| | | | | | | | | | | | | |
| Industrials—18.8% | | | | | | | | | | | | |
| Airlines—1.3% | | | | | | | | | | | | |
Spirit Airlines, Inc.1 | | | 189,320 | | | | | | | | 10,965,414 | |
| Building Products—1.1% | | | | | | | | | | | | |
Masonite International Corp.1 | | | 203,641 | | | | | | | | 9,129,226 | |
| Commercial Services & Supplies—2.2% | |
| ACCO Brands Corp. | | | 1,219,957 | | | | | | | | 8,271,309 | |
| Advanced Disposal Services, Inc.1 | | | 443,077 | | | | | | | | 10,607,263 | |
| | | | | | | | | | | 18,878,572 | |
| | | | | | | | | | | | | |
| Construction & Engineering—1.9% | |
| Dycom Industries, Inc.1 | | | 129,610 | | | | | | | | 7,004,125 | |
| KBR, Inc. | | | 638,991 | | | | | | | | 9,699,883 | |
| | | | | | | | | | | 16,704,008 | |
| | | | | | | | | | | | | |
| Electrical Equipment—2.1% | | | | | | | | | | | | |
| Atkore International Group, Inc.1 | | | 172,210 | | | | | | | | 3,416,646 | |
| Generac Holdings, Inc.1 | | | 302,390 | | | | | | | | 15,028,783 | |
| | | | | | | | | | | 18,445,429 | |
| | | | | | | | | | | | | |
| Machinery—5.0% | | | | | | | | | | | | |
| EnPro Industries, Inc. | | | 123,600 | | | | | | | | 7,428,360 | |
| Evoqua Water Technologies Corp.1 | | | 640,040 | | | | | | | | 6,144,384 | |
| Greenbrier Cos., Inc. (The) | | | 237,170 | | | | | | | | 9,377,702 | |
| Manitowoc Co., Inc. (The)1 | | | 246,547 | | | | | | | | 3,641,499 | |
| Navistar International Corp.1 | | | 237,500 | | | | | | | | 6,163,125 | |
| Rexnord Corp.1 | | | 450,680 | | | | | | | | 10,343,106 | |
| | | | | | | | | | | 43,098,176 | |
8 OPPENHEIMER MAIN STREET SMALL CAP FUND/VA
| | | | | | | | | | | | |
| | | Shares | | | | | | Value | |
| Professional Services—4.0% | | | | | | | | | | | | |
| ASGN, Inc.1 | | | 303,316 | | | | | | | $ | 16,530,722 | |
| Korn/Ferry International | | | 461,865 | | | | | | | | 18,262,142 | |
| | | | | | | | | | | 34,792,864 | |
| | | | | | | | | | | | | |
| Road & Rail—1.2% | | | | | | | | | | | | |
Genesee & Wyoming, Inc., Cl. A1 | | | 138,520 | | | | | | | | 10,253,250 | |
| Information Technology—12.1% | | | | | | | | | | | | |
| IT Services—2.9% | | | | | | | | | | | | |
| CACI International, Inc., Cl. A1 | | | 122,909 | | | | | | | | 17,702,583 | |
| Perspecta, Inc. | | | 442,234 | | | | | | | | 7,615,270 | |
| | | | | | | | | | | 25,317,853 | |
| | | | | | | | | | | | | |
| Semiconductors & Semiconductor Equipment—2.3% | |
| Brooks Automation, Inc. | | | 311,810 | | | | | | | | 8,163,186 | |
| MKS Instruments, Inc. | | | 186,290 | | | | | | | | 12,036,197 | |
| | | | | | | | | | | 20,199,383 | |
| | | | | | | | | | | | | |
| Software—6.9% | | | | | | | | | | | | |
| Blackline, Inc.1 | | | 207,430 | | | | | | | | 8,494,259 | |
| Envestnet, Inc.1 | | | 122,460 | | | | | | | | 6,023,807 | |
| j2 Global, Inc. | | | 199,503 | | | | | | | | 13,841,518 | |
| Paylocity Holding Corp.1 | | | 128,540 | | | | | | | | 7,739,393 | |
| Pegasystems, Inc. | | | 207,621 | | | | | | | | 9,930,513 | |
| Q2 Holdings, Inc.1 | | | 180,580 | | | | | | | | 8,947,739 | |
| SendGrid, Inc.1 | | | 109,089 | | | | | | | | 4,709,372 | |
| | | | | | | | | | | 59,686,601 | |
| | | | | | | | | | | | |
| | | Shares | | | | | | Value | |
| Materials—4.3% | | | | | | | | | | | | |
| Construction Materials—0.9% | | | | | | | | | | | | |
Summit Materials, Inc., Cl. A1 | | | 600,521 | | | | | | | $ | 7,446,460 | |
| Metals & Mining—3.4% | | | | | | | | | | | | |
| Allegheny Technologies, Inc.1 | | | 437,758 | | | | | | | | 9,529,992 | |
| Compass Minerals International, Inc. | | | 163,990 | | | | | | | | 6,836,743 | |
| Kaiser Aluminum Corp. | | | 143,579 | | | | | | | | 12,820,169 | |
| | | | | | | | | | | | 29,186,904 | |
| Utilities—5.2% | | | | | | | | | | | | |
| Gas Utilities—2.5% | | | | | | | | | | | | |
| South Jersey Industries, Inc. | | | 301,570 | | | | | | | | 8,383,646 | |
| Suburban Propane Partners LP2 | | | 671,450 | | | | | | | | 12,938,841 | |
| | | | | | | | | | | | 21,322,487 | |
| Multi-Utilities—2.7% | | | | | | | | | | | | |
| Black Hills Corp. | | | 204,950 | | | | | | | | 12,866,761 | |
| NorthWestern Corp. | | | 168,300 | | | | | | | | 10,003,752 | |
| | | | | | | | | | | 22,870,513 | |
| Total Common Stocks (Cost $811,713,260) | | | | | | | | 841,588,209 | |
| | | | | | | | | | | | | |
| Investment Company—2.0% | |
| Oppenheimer Institutional Government Money Market Fund, Cl. E, 2.35%3,4(Cost $17,392,506) | | | 17,392,506 | | | | | | | | 17,392,506 | |
| Total Investments, at Value (Cost $829,105,766) | | | 99.9 | % | | | | | | | 858,980,715 | |
| | | | |
| Net Other Assets (Liabilities) | | | 0.1 | | | | | | | | 950,648 | |
| | | | |
| Net Assets | | | 100.0 | % | | | | | | $ | 859,931,363 | |
| | | | |
Footnotes to Statement of Investments
1.Non-income producing security.
2. Security is a Master Limited Partnership.
3. Rate shown is the7-day yield at period end.
4. Is or was an affiliate, as defined in the Investment Company Act of 1940, as amended, at or during the reporting period, by virtue of the Fund owning at least 5% of the voting securities of the issuer or as a result of the Fund and the issuer having the same investment adviser. Transactions during the reporting period in which the issuer was an affiliate are as follows:
| | | | | | | | | | | | | | | | |
| | | Shares December 31, 2017 | | | Gross Additions | | | Gross Reductions | | | Shares December 31, 2018 | |
Investment Company | | | | | | | | | | | | | | | | |
| Oppenheimer Institutional Government Money Market Fund, Cl. E | | | 20,455,339 | | | | 309,074,983 | | | | 312,137,816 | | | | 17,392,506 | |
| | | | |
| | | Value | | | Income | | | Realized Gain (Loss) | | | Change in Unrealized Gain (Loss) | |
Investment Company | | | | | | | | | | | | | | | | |
| Oppenheimer Institutional Government Money Market Fund, Cl. E | | $ | 17,392,506 | | | $ | 277,052 | | | $ | — | | | $ | — | |
See accompanying Notes to Financial Statements.
9 OPPENHEIMER MAIN STREET SMALL CAP FUND/VA
STATEMENT OF ASSETS AND LIABILITIESDecember 31, 2018
| | | | |
Assets | | | | |
Investments, at value—see accompanying statement of investments: | | | | |
Unaffiliated companies (cost $811,713,260) | | $ | 841,588,209 | |
Affiliated companies (cost $17,392,506) | | | 17,392,506 | |
| | | | |
| | | 858,980,715 | |
| |
Cash | | | 1,000,000 | |
| |
Receivables and other assets: | | | | |
Shares of beneficial interest sold | | | 654,407 | |
Dividends | | | 465,444 | |
Other | | | 88,775 | |
| | | | |
Total assets | | | 861,189,341 | |
Liabilities | | | | |
Payables and other liabilities: | | | | |
Investments purchased | | | 637,583 | |
Shares of beneficial interest redeemed | | | 307,288 | |
Distribution and service plan fees | | | 163,820 | |
Trustees’ compensation | | | 70,440 | |
Shareholder communications | | | 44,093 | |
Other | | | 34,754 | |
| | | | |
Total liabilities | | | 1,257,978 | |
Net Assets | | $ | 859,931,363 | |
| | | | |
| | | | |
Composition of Net Assets | | | | |
Par value of shares of beneficial interest | | $ | 42,826 | |
| |
Additionalpaid-in capital | | | 744,638,476 | |
| |
Total distributable earnings | | | 115,250,061 | |
| | | | |
Net Assets | | $ | 859,931,363 | |
| | | | |
| | | | |
Net Asset Value Per Share | | | | |
Non-Service Shares: | | | | |
| |
| Net asset value, redemption price per share and offering price per share (based on net assets of $123,961,720 and 6,087,111 shares of beneficial interest outstanding) | | | $20.36 | |
| |
| |
Service Shares: | | | | |
| Net asset value, redemption price per share and offering price per share (based on net assets of $735,969,643 and 36,738,947 shares of beneficial interest outstanding) | | | $20.03 | |
See accompanying Notes to Financial Statements.
10 OPPENHEIMER MAIN STREET SMALL CAP FUND/VA
STATEMENT OF OPERATIONSFor the Year EndedDecember 31, 2018
| | | | |
| |
Investment Income | | | | |
Dividends: | | | | |
Unaffiliated companies | | $ | 11,260,249 | |
Affiliated companies | | | 277,052 | |
| |
Interest | | | 38 | |
| | | | |
Total investment income | | | 11,537,339 | |
| |
Expenses | | | | |
Management fees | | | 7,205,624 | |
| |
Distribution and service plan fees — Service shares | | | 2,282,289 | |
| |
Transfer and shareholder servicing agent fees: | | | | |
Non-Service shares | | | 180,576 | |
Service shares | | | 1,095,498 | |
| |
Shareholder communications: | | | | |
Non-Service shares | | | 25,797 | |
Service shares | | | 153,501 | |
| |
Trustees’ compensation | | | 35,056 | |
| |
Borrowing fees | | | 34,466 | |
| |
Custodian fees and expenses | | | 6,999 | |
| |
Other | | | 77,522 | |
| | | | |
Total expenses | | | 11,097,328 | |
Less reduction to custodian expenses | | | (538) | |
Less waivers and reimbursements of expenses | | | (272,873) | |
| | | | |
Net expenses | | | 10,823,917 | |
| |
Net Investment Income | | | 713,422 | |
| |
Realized and Unrealized Gain (Loss) | | | | |
Net realized gain (loss) on: | | | | |
Investment transactions in unaffiliated companies | | | 96,680,793 | |
Foreign currency transactions | | | (333) | |
| | | | |
Net realized gain | | | 96,680,460 | |
| |
Net change in unrealized appreciation/(depreciation) on investment transactions in unaffiliated companies | | | (191,923,313) | |
| |
Net Decrease in Net Assets Resulting from Operations | | $ | (94,529,431) | |
| | | | |
See accompanying Notes to Financial Statements.
11 OPPENHEIMER MAIN STREET SMALL CAP FUND/VA
STATEMENTS OF CHANGES IN NET ASSETS
| | | | | | | | |
| | | Year Ended December 31, 2018 | | | Year Ended December 31, 20171
| |
| |
Operations | | | | | | | | |
Net investment income | | $ | 713,422 | | | $ | 700,445 | |
| |
Net realized gain | | | 96,680,460 | | | | 146,346,143 | |
| |
Net change in unrealized appreciation/(depreciation) | | | (191,923,313) | | | | (7,293,562) | |
| | | | |
Net increase (decrease) in net assets resulting from operations | | | (94,529,431) | | | | 139,753,026 | |
|
| |
Dividends and/or Distributions to Shareholders | | | | | | | | |
Dividends and distributions declared: | | | | | | | | |
Non-Service shares | | | (19,059,602) | | | | (9,410,741) | |
Service shares | | | (117,234,118) | | | | (55,255,007) | |
| | | | |
Total dividends and distributions declared | | | (136,293,720) | | | | (64,665,748) | |
|
| |
Beneficial Interest Transactions | | | | | | | | |
Net increase (decrease) in net assets resulting from beneficial interest transactions: | | | | | | | | |
Non-Service shares | | | 4,916,454 | | | | (3,222,317) | |
Service shares | | | (2,571,998) | | | | (50,919,555) | |
| | | | |
Total beneficial interest transactions | | | 2,344,456 | | | | (54,141,872) | |
|
| |
Net Assets | | | | | | | | |
Total increase (decrease) | | | (228,478,695) | | | | 20,945,406 | |
| |
Beginning of period | | | 1,088,410,058 | | | | 1,067,464,652 | |
| | | | |
End of period | | $ | 859,931,363 | | | $ | 1,088,410,058 | |
| | | | |
1.Prior period amounts have been conformed to current year presentation. See Notes to Financial Statements, Note 2– New Accounting Pronouncements for further details.
See accompanying Notes to Financial Statements.
12 OPPENHEIMER MAIN STREET SMALL CAP FUND/VA
FINANCIAL HIGHLIGHTS
| | | | | | | | | | | | | | | | | | | | |
| Non-Service Shares | | Year Ended December 31,
2018 | | | Year Ended December 31, 2017 | | | Year Ended December 31, 2016 | | | Year Ended December 31, 2015 | | | Year Ended December 31,
2014 | |
Per Share Operating Data | | | | | | | | | | | | | | | | | | | | |
Net asset value, beginning of period | | | $25.79 | | | | $24.08 | | | | $21.32 | | | | $26.56 | | | | $27.80 | |
| |
Income (loss) from investment operations: | | | | | | | | | | | | | | | | | | | | |
Net investment income1 | | | 0.07 | | | | 0.07 | | | | 0.16 | | | | 0.12 | | | | 0.26 | |
Net realized and unrealized gain (loss) | | | (2.07) | | | | 3.22 | | | | 3.55 | | | | (1.28) | | | | 2.74 | |
| | | | |
Total from investment operations | | | (2.00) | | | | 3.29 | | | | 3.71 | | | | (1.16) | | | | 3.00 | |
| |
Dividends and/or distributions to shareholders: | | | | | | | | | | | | | | | | | | | | |
Dividends from net investment income | | | (0.08) | | | | (0.22) | | | | (0.11) | | | | (0.23) | | | | (0.25) | |
Distributions from net realized gain | | | (3.35) | | | | (1.36) | | | | (0.84) | | | | (3.85) | | | | (3.99) | |
| | | | |
Total dividends and/or distributions to shareholders | | | (3.43) | | | | (1.58) | | | | (0.95) | | | | (4.08) | | | | (4.24) | |
| |
Net asset value, end of period | | | $20.36 | | | | $25.79 | | | | $24.08 | | | | $21.32 | | | | $26.56 | |
| | | | |
|
| |
Total Return, at Net Asset Value2 | | | (10.32)% | | | | 14.15% | | | | 18.05% | | | | (5.90)% | | | | 11.93% | |
|
| |
Ratios/Supplemental Data | | | | | | | | | | | | | | | | | | | | |
Net assets, end of period (in thousands) | | | $123,962 | | | | $152,617 | | | | $145,428 | | | | $129,104 | | | | $136,402 | |
| |
Average net assets (in thousands) | | | $150,279 | | | | $150,376 | | | | $130,889 | | | | $134,932 | | | | $133,864 | |
| |
Ratios to average net assets:3 | | | | | | | | | | | | | | | | | | | | |
Net investment income | | | 0.28% | | | | 0.28% | | | | 0.74% | | | | 0.49% | | | | 0.99% | |
Expenses excluding specific expenses listed below | | | 0.83% | | | | 0.80% | | | | 0.81% | | | | 0.80% | | | | 0.80% | |
| Interest and fees from borrowings | | | 0.00%4 | | | | 0.00%4 | | | | 0.00%4 | | | | 0.00%4 | | | | 0.00% | |
| | | | |
| Total expenses5 | | | 0.83% | | | | 0.80% | | | | 0.81% | | | | 0.80% | | | | 0.80% | |
| Expenses after payments, waivers and/or reimbursements and reduction to custodian expenses | | | 0.80% | | | | 0.80%6 | | | | 0.80% | | | | 0.80%6 | | | | 0.79% | |
| |
Portfolio turnover rate | | | 45% | | | | 42% | | | | 65% | | | | 43% | | | | 65% | |
1. Per share amounts calculated based on the average shares outstanding during the period.
2. Assumes an initial investment on the business day before the first day of the fiscal period, with all dividends and distributions reinvested in additional shares on the reinvestment date, and redemption at the net asset value calculated on the last business day of the fiscal period. Total returns are not annualized for periods less than one full year. Total return information does not reflect expenses that apply at the separate account level or to related insurance products. Inclusion of these charges would reduce the total return figures for all periods shown. Returns do not reflect the deduction of taxes that a shareholder would pay on fund distributions or the redemption of fund shares.
3. Annualized for periods less than one full year.
4. Less than 0.005%.
5. Total expenses including indirect expenses from affiliated fund fees and expenses were as follows:
| | | | | | |
| | Year Ended December 31, 2018 | | | 0.83 | % |
| | Year Ended December 31, 2017 | | | 0.80 | % |
| | Year Ended December 31, 2016 | | | 0.81 | % |
| | Year Ended December 31, 2015 | | | 0.80 | % |
| | Year Ended December 31, 2014 | | | 0.80 | % |
6.Waiver was less than 0.005%.
See accompanying Notes to Financial Statements.
13 OPPENHEIMER MAIN STREET SMALL CAP FUND/VA
FINANCIAL HIGHLIGHTSContinued
| | | | | | | | | | | | | | | | | | | | |
| Service Shares | | Year Ended December 31,
2018 | | | Year Ended December 31, 2017 | | | Year Ended December 31, 2016 | | | Year Ended December 31, 2015 | | | Year Ended December 31,
2014 | |
Per Share Operating Data | | | | | | | | | | | | | | | | | | | | |
Net asset value, beginning of period | | | $25.42 | | | | $23.75 | | | | $21.05 | | | | $26.26 | | | | $27.53 | |
| |
Income (loss) from investment operations: | | | | | | | | | | | | | | | | | | | | |
Net investment income1 | | | 0.01 | | | | 0.01 | | | | 0.10 | | | | 0.06 | | | | 0.19 | |
Net realized and unrealized gain (loss) | | | (2.03) | | | | 3.18 | | | | 3.49 | | | | (1.25) | | | | 2.71 | |
| | | | |
Total from investment operations | | | (2.02) | | | | 3.19 | | | | 3.59 | | | | (1.19) | | | | 2.90 | |
| |
Dividends and/or distributions to shareholders: | | | | | | | | | | | | | | | | | | | | |
Dividends from net investment income | | | (0.02) | | | | (0.16) | | | | (0.05) | | | | (0.17) | | | | (0.18) | |
Distributions from net realized gain | | | (3.35) | | | | (1.36) | | | | (0.84) | | | | (3.85) | | | | (3.99) | |
| | | | |
Total dividends and/or distributions to shareholders | | | (3.37) | | | | (1.52) | | | | (0.89) | | | | (4.02) | | | | (4.17) | |
| |
Net asset value, end of period | | | $20.03 | | | | $25.42 | | | | $23.75 | | | | $21.05 | | | | $26.26 | |
| | | | |
|
| |
Total Return, at Net Asset Value2 | | | (10.54)% | | | | 13.91% | | | | 17.67% | | | | (6.09)% | | | | 11.66% | |
|
| |
Ratios/Supplemental Data | | | | | | | | | | | | | | | | | | | | |
Net assets, end of period (in thousands) | | | $735,969 | | | | $935,793 | | | | $922,037 | | | | $856,719 | | | | $968,637 | |
| |
Average net assets (in thousands) | | | $911,784 | | | | $919,475 | | | | $850,883 | | | | $927,514 | | | | $957,874 | |
| |
Ratios to average net assets:3 | | | | | | | | | | | | | | | | | | | | |
Net investment income | | | 0.03% | | | | 0.03% | | | | 0.49% | | | | 0.24% | | | | 0.75% | |
Expenses excluding specific expenses listed below | | | 1.08% | | | | 1.05% | | | | 1.06% | | | | 1.05% | | | | 1.05% | |
| Interest and fees from borrowings | | | 0.00%4 | | | | 0.00%4 | | | | 0.00%4 | | | | 0.00%4 | | | | 0.00% | |
| | | | |
| Total expenses5 | | | 1.08% | | | | 1.05% | | | | 1.06% | | | | 1.05% | | | | 1.05% | |
| Expenses after payments, waivers and/or reimbursements and reduction to custodian expenses | | | 1.05% | | | | 1.05%6 | | | | 1.05% | | | | 1.05%6 | | | | 1.04% | |
| |
Portfolio turnover rate | | | 45% | | | | 42% | | | | 65% | | | | 43% | | | | 65% | |
1. Per share amounts calculated based on the average shares outstanding during the period.
2. Assumes an initial investment on the business day before the first day of the fiscal period, with all dividends and distributions reinvested in additional shares on the reinvestment date, and redemption at the net asset value calculated on the last business day of the fiscal period. Total returns are not annualized for periods less than one full year. Total return information does not reflect expenses that apply at the separate account level or to related insurance products. Inclusion of these charges would reduce the total return figures for all periods shown. Returns do not reflect the deduction of taxes that a shareholder would pay on fund distributions or the redemption of fund shares.
3. Annualized for periods less than one full year.
4. Less than 0.005%.
5. Total expenses including indirect expenses from affiliated fund fees and expenses were as follows:
| | | | | | |
| | Year Ended December 31, 2018 | | | 1.08 | % |
| | Year Ended December 31, 2017 | | | 1.05 | % |
| | Year Ended December 31, 2016 | | | 1.06 | % |
| | Year Ended December 31, 2015 | | | 1.05 | % |
| | Year Ended December 31, 2014 | | | 1.05 | % |
6.Waiver was less than 0.005%.
See accompanying Notes to Financial Statements.
14 OPPENHEIMER MAIN STREET SMALL CAP FUND/VA
NOTES TO FINANCIAL STATEMENTSDecember 31, 2018
1. Organization
Oppenheimer Main Street Small Cap Fund/VA (the “Fund”), a separate series of Oppenheimer Variable Account Funds, is a diversifiedopen-end management investment company registered under the Investment Company Act of 1940 (“1940 Act”), as amended. The Fund’s investment objective is to seek capital appreciation. The Fund’s investment adviser is OFI Global Asset Management, Inc. (“OFI Global” or the “Manager”), a wholly-owned subsidiary of OppenheimerFunds, Inc. (“OFI” or the“Sub-Adviser”). The Manager has entered into asub-advisory agreement with OFI.
Shares of the Fund are sold only to separate accounts of life insurance companies.
The Fund offers two classes of shares. Both classes are sold at their offering price, which is the net asset value per share, to separate investment accounts of participating insurance companies as an underlying investment for variable life insurance policies, variable annuity contracts or other investment products. The class of shares designated as Service shares is subject to a distribution and service plan. Both classes of shares have identical rights and voting privileges with respect to the Fund in general and exclusive voting rights on matters that affect that class alone. Earnings, net assets and net asset value per share may differ due to each class having its own expenses, such as transfer and shareholder servicing agent fees and shareholder communications, directly attributable to that class.
The following is a summary of significant accounting policies followed in the Fund’s preparation of financial statements in accordance with accounting principles generally accepted in the United States (“U.S. GAAP”).
2. Significant Accounting Policies
Security Valuation.All investments in securities are recorded at their estimated fair value, as described in Note 3.
Foreign Currency Translation.The books and records of the Fund are maintained in U.S. dollars. Any foreign currency amounts are translated into U.S. dollars on the following basis:
(1) Value of investment securities, other assets and liabilities — at the exchange rates prevailing at market close as described in Note 3.
(2) Purchases and sales of investment securities, income and expenses — at the rates of exchange prevailing on the respective dates of such transactions.
Although the net assets and the values are presented at the foreign exchange rates at market close, the Fund does not isolate the portion of the results of operations resulting from changes in foreign exchange rates on investments from the fluctuations arising from changes in prices of securities held. Such fluctuations are included with the net realized and unrealized gains or losses from investments shown in the Statement of Operations.
For securities, which are subject to foreign withholding tax upon disposition, realized and unrealized gains or losses on such securities are recorded net of foreign withholding tax.
Reported net realized foreign exchange gains or losses arise from sales of foreign currencies, currency gains or losses realized between the trade and settlement dates on securities transactions, the difference between the amounts of dividends, interest, and foreign withholding tax reclaims recorded on the Fund’s books, and the U.S. dollar equivalent of the amounts actually received or paid. Net unrealized foreign exchange gains and losses arise from changes in the value of assets and liabilities other than investments in securities, resulting from changes in the exchange rate.
Allocation of Income, Expenses, Gains and Losses.Income, expenses (other than those attributable to a specific class), gains and losses are allocated on a daily basis to each class of shares based upon the relative proportion of net assets represented by such class. Operating expenses directly attributable to a specific class are charged against the operations of that class.
Dividends and Distributions to Shareholders. Dividends and distributions to shareholders, which are determined in accordance with income tax regulations and may differ from U.S. GAAP, are recorded on theex-dividend date. Income and capital gain distributions, if any, are declared and paid annually or at other times as determined necessary by the Manager.
Investment Income.Dividend income is recorded on theex-dividend date or uponex-dividend notification in the case of certain foreign dividends where theex-dividend date may have passed.Non-cash dividends included in dividend income, if any, are recorded at the fair value of the securities received. Withholding taxes on foreign dividends, if any, and capital gains taxes on foreign investments, if any, have been provided for in accordance with the Fund’s understanding of the applicable tax rules and regulations. Interest income, if any, is recognized on an accrual basis. Discount and premium, which are included in interest income on the Statement of Operations, are amortized or accreted daily.
Return of Capital Estimates.Distributions received from the Fund’s investments in Master Limited Partnerships (MLPs) and Real Estate Investments Trusts (REITs), generally are comprised of income and return of capital. Any return of capital estimates in excess of cost basis are classified as realized gain. The Fund records investment income and return of capital based on estimates. Such estimates are based on historical information available from each MLP, REIT and other industry sources. These estimates may subsequently be revised based on information received from MLPs and REITs after their tax reporting periods are concluded.
Custodian Fees. “Custodian fees and expenses” in the Statement of Operations may include interest expense incurred by the Fund on any cash overdrafts of its custodian account during the period. Such cash overdrafts may result from the effects of failed trades in portfolio securities and from cash outflows resulting from unanticipated shareholder redemption activity. The Fund pays interest to its custodian on such cash overdrafts, to the extent they are not offset by positive cash balances maintained by the Fund, at a rate equal to the Federal Funds Rate plus 2.00%. The “Reduction to custodian expenses” line item, if applicable, represents earnings on cash balances maintained by the Fund during the period. Such interest expense and other
15 OPPENHEIMER MAIN STREET SMALL CAP FUND/VA
NOTES TO FINANCIAL STATEMENTSContinued
2. Significant Accounting Policies (Continued)
custodian fees may be paid with these earnings.
Security Transactions. Security transactions are recorded on the trade date. Realized gains and losses on securities sold are determined on the basis of identified cost.
Indemnifications.The Fund’s organizational documents provide current and former Trustees and officers with a limited indemnification against liabilities arising in connection with the performance of their duties to the Fund. In the normal course of business, the Fund may also enter into contracts that provide general indemnifications. The Fund’s maximum exposure under these arrangements is unknown as this would be dependent on future claims that may be made against the Fund. The risk of material loss from such claims is considered remote.
Federal Taxes.The Fund intends to comply with provisions of the Internal Revenue Code applicable to regulated investment companies and to distribute substantially all of its investment company taxable income, including any net realized gain on investments not offset by capital loss carryforwards, if any, to shareholders. Therefore, no federal income or excise tax provision is required. The Fund files income tax returns in U.S. federal and applicable state jurisdictions. The statute of limitations on the Fund’s tax return filings generally remains open for the three preceding fiscal reporting period ends. The Fund has analyzed its tax positions for the fiscal year ended December 31, 2018, including open tax years, and does not believe there are any uncertain tax positions requiring recognition in the Fund’s financial statements.
The tax components of capital shown in the following table represent distribution requirements the Fund must satisfy under the income tax regulations, losses the Fund may be able to offset against income and gains realized in future years and unrealized appreciation or depreciation of securities and other investments for federal income tax purposes.
| | | | | | | | | | | | |
Undistributed Net Investment Income | | Undistributed Long-Term Gain | | | Accumulated Loss Carryforward1,2
| | | Net Unrealized Appreciation Based on cost of Securities and Other Investments for Federal Income Tax Purposes | |
$8,560,095 | | | $76,676,963 | | | | $— | | | | $30,083,441 | |
1. During the reporting period, the Fund did not utilize any capital loss carryforward.
2.During the previous reporting period, the Fund did not utilize any capital loss carryforward.
Net investment income (loss) and net realized gain (loss) may differ for financial statement and tax purposes. The character of dividends and distributions made during the fiscal year from net investment income or net realized gains are determined in accordance with federal income tax requirements, which may differ from the character of net investment income or net realized gains presented in those financial statements in accordance with U.S. GAAP. Also, due to timing of dividends and distributions, the fiscal year in which amounts are distributed may differ from the fiscal year in which the income or net realized gain was recorded by the Fund.
Accordingly, the following amounts have been reclassified for the reporting period. Net assets of the Fund were unaffected by the reclassifications.
| | | | |
Increase toPaid-in Capital | | Reduction to Accumulated Net Earnings3 | |
$8,899,249 | | | $8,899,249 | |
3. $8,899,091, including $8,123,465 of long-term capital gain, was distributed in connection with Fund share redemptions.
The tax character of distributions paid during the reporting periods:
| | | | | | | | |
| | | Year Ended December 31, 2018 | | | Year Ended December 31, 2017 | |
Distributions paid from: | | | | | | | | |
Ordinary income | | $ | 29,120,771 | | | $ | 7,234,432 | |
Long-term capital gain | | | 107,172,949 | | | | 57,431,316 | |
| | | | |
Total | | $ | 136,293,720 | | | $ | 64,665,748 | |
| | | | |
The aggregate cost of securities and other investments and the composition of unrealized appreciation and depreciation of securities and other investments for federal income tax purposes at period end are noted in the following table. The primary difference between book and tax appreciation or depreciation of securities and other investments, if applicable, is attributable to the tax deferral of losses or tax realization of financial statement
unrealized gain or loss.
| | | | |
Federal tax cost of securities | | $ | 828,897,274 | |
| | | | |
Gross unrealized appreciation | | $ | 131,490,605 | |
Gross unrealized depreciation | | | (101,407,164) | |
| | | | |
Net unrealized appreciation | | $ | 30,083,441 | |
| | | | |
16 OPPENHEIMER MAIN STREET SMALL CAP FUND/VA
2. Significant Accounting Policies (Continued)
Use of Estimates. The preparation of financial statements in conformity with U.S. GAAP requires management to make estimates and assumptions that affect the reported amounts of assets and liabilities and disclosure of contingent assets and liabilities at the date of the financial statements and the reported amounts of increases and decreases in net assets from operations during the reporting period. Actual results could differ from those estimates.
New Accounting Pronouncements. In March 2017, Financial Accounting Standards Board (“FASB”) issued Accounting Standards Update (“ASU”), ASU2017-08. This provides guidance related to the amortization period for certain purchased callable debt securities held at a premium. The ASU is effective for annual periods beginning after December 15, 2018, and interim periods within those annual periods. The Manager has evaluated the impacts of these changes on the financial statements and there are no material impacts.
During August 2018, the Securities and Exchange Commission (the “SEC”) issued Final Rule ReleaseNo. 33-10532 (the “Rule”), Disclosure Update and Simplification. The rule amends certain financial statement disclosure requirements to conform to U.S. GAAP. The amendments to Rule6-04.17 of RegulationS-X (balance sheet) remove the requirement to separately state the book basis components of net assets: undistributed (over-distribution of) net investment income (“UNII”), accumulated undistributed net realized gains (losses), and net unrealized appreciation (depreciation) at the balance sheet date. Instead, consistent with U.S. GAAP, funds will be required to disclose total distributable earnings. The amendments to Rule6-09 of RegulationS-X (statement of changes in net assets) remove the requirement to separately state the sources of distributions paid. Instead, consistent with U.S. GAAP, funds will be required to disclose the total amount of distributions paid, except that any tax return of capital must be separately disclosed. The amendments also remove the requirement to parenthetically state the book basis amount of UNII on the statement of changes in net assets. The requirements of the Rule are effective November 5, 2018, and the Funds’ Statement of Assets and Liabilities and Statement of Changes in Net Assets for the current reporting period have been modified accordingly. In addition, certain amounts within each Fund’s Statement of Changes in Net Assets for the prior fiscal period have been modified to conform to the Rule.
3. Securities Valuation
The Fund calculates the net asset value of its shares as of 4:00 P.M. Eastern Time, on each day the New York Stock Exchange (the “Exchange” or “NYSE”) is open for trading, except in the case of a scheduled early closing of the Exchange, in which case the Fund will calculate net asset value of the shares as of the scheduled early closing time of the Exchange.
The Fund’s Board has adopted procedures for the valuation of the Fund’s securities and has delegated theday-to-day responsibility for valuation determinations under those procedures to the Manager. The Manager has established a Valuation Committee which is responsible for determining a fair valuation for any security for which market quotations are not readily available. The Valuation Committee’s fair valuation determinations are subject to review, approval and ratification by the Fund’s Board at least quarterly or more frequently, if necessary.
Valuation Methods and Inputs
Securities are valued primarily using unadjusted quoted market prices, when available, as supplied by third party pricing services or broker-dealers.
The following methodologies are used to determine the market value or the fair value of the types of securities described below:
Equity securities traded on a securities exchange (including exchange-traded derivatives other than futures and futures options) are valued based on the official closing price on the principal exchange on which the security is traded, as identified by the Manager, prior to the time when the Fund’s assets are valued. If the official closing price is unavailable, the security is valued at the last sale price on the principal exchange on which it is traded, or if no sales occurred, the security is valued at the mean between the quoted bid and asked prices.Over-the-counter equity securities are valued at the last published sale price, or if no sales occurred, at the mean between the quoted bid and asked prices. Events occurring after the close of trading on foreign exchanges may result in adjustments to the valuation of foreign securities to more accurately reflect their fair value as of the time when the Fund’s assets are valued.
Shares of a registered investment company that are not traded on an exchange are valued at that investment company’s net asset value per share.
Securities for which market quotations are not readily available, or when a significant event has occurred that would materially affect the value of the security, are fair valued either (i) by a standardized fair valuation methodology applicable to the security type or the significant event as previously approved by the Valuation Committee and the Fund’s Board or (ii) as determined in good faith by the Manager’s Valuation Committee. The Valuation Committee considers all relevant facts that are reasonably available, through either public information or information available to the Manager, when determining the fair value of a security. Those standardized fair valuation methodologies include, but are not limited to, valuing securities at the last sale price or initially at cost and subsequently adjusting the value based on: changes in company specific fundamentals, changes in an appropriate securities index, or changes in the value of similar securities which may be further adjusted for any discounts related to security-specific resale restrictions. When possible, such methodologies use observable market inputs such as unadjusted quoted prices of similar securities, observable interest rates, currency rates and yield curves. The methodologies used for valuing securities are not necessarily an indication of the risks associated with investing in those securities nor can it be assured that the Fund can obtain the fair value assigned to a security if it were to sell the security.
Classifications
Each investment asset or liability of the Fund is assigned a level at measurement date based on the significance and source of the inputs to its valuation.
Various data inputs may be used in determining the value of each of the Fund’s investments as of the reporting period end. These data inputs are categorized in the following hierarchy under applicable financial accounting standards:
1) Level1-unadjusted quoted prices in active markets for identical assets or liabilities (including securities actively traded on a securities exchange)
2) Level2-inputs other than unadjusted quoted prices that are observable for the asset or liability (such as unadjusted quoted prices for similar assets
17 OPPENHEIMER MAIN STREET SMALL CAP FUND/VA
NOTES TO FINANCIAL STATEMENTSContinued
3. Securities Valuation (Continued)
and market corroborated inputs such as interest rates, prepayment speeds, credit risks, etc.)
3) Level3-significant unobservable inputs (including the Manager’s own judgments about assumptions that market participants would use in pricing the asset or liability).
The inputs used for valuing securities are not necessarily an indication of the risks associated with investing in those securities.
The Fund classifies each of its investments in investment companies which are publicly offered as Level 1. Investment companies that are not publicly offered, if any, are classified as Level 2 in the fair value hierarchy.
The table below categorizes amounts that are included in the Fund’s Statement of Assets and Liabilities at period end based on valuation input level:
| | | | | | | | | | | | | | | | |
| | | Level 1— Unadjusted Quoted Prices | | | Level 2—
Other Significant
Observable Inputs | | | Level 3—
Significant
Unobservable Inputs | | | Value | |
Assets Table | | | | | | | | | | | | | | | | |
Investments, at Value: | | | | | | | | | | | | | | | | |
Common Stocks | | | | | | | | | | | | | | | | |
Consumer Discretionary | | $ | 135,945,379 | | | $ | — | | | $ | — | | | $ | 135,945,379 | |
Consumer Staples | | | 22,284,538 | | | | — | | | | — | | | | 22,284,538 | |
Energy | | | 24,340,781 | | | | — | | | | — | | | | 24,340,781 | |
Financials | | | 202,321,064 | | | | — | | | | — | | | | 202,321,064 | |
Health Care | | | 108,399,307 | | | | — | | | | — | | | | 108,399,307 | |
Industrials | | | 162,266,939 | | | | — | | | | — | | | | 162,266,939 | |
Information Technology | | | 105,203,837 | | | | — | | | | — | | | | 105,203,837 | |
Materials | | | 36,633,364 | | | | — | | | | — | | | | 36,633,364 | |
Utilities | | | 44,193,000 | | | | — | | | | — | | | | 44,193,000 | |
Investment Company | | | 17,392,506 | | | | — | | | | — | | | | 17,392,506 | |
| | | | |
Total Assets | | $ | 858,980,715 | | | $ | — | | | $ | — | | | $ | 858,980,715 | |
| | | | |
Forward currency exchange contracts and futures contracts, if any, are reported at their unrealized appreciation/depreciation at measurement date, which represents the change in the contract’s value from trade date. All additional assets and liabilities included in the above table are reported at their market value at measurement date.
For the reporting period, there were no transfers between levels.
4. Investments and Risks
Investments in Affiliated Funds. The Fund is permitted to invest in other mutual funds advised by the Manager (“Affiliated Funds”). Affiliated Funds are management investment companies registered under the 1940 Act, as amended. The Manager is the investment adviser of, and theSub-Adviser provides investment and related advisory services to, the Affiliated Funds. When applicable, the Fund’s investments in Affiliated Funds are included in the Statement of Investments. Shares of Affiliated Funds are valued at their net asset value per share. As a shareholder, the Fund is subject to its proportional share of the Affiliated Funds’ expenses, including their management fee. The Manager will waive fees and/or reimburse Fund expenses in an amount equal to the indirect management fees incurred through the Fund’s investment in the Affiliated Funds.
Each of the Affiliated Funds in which the Fund invests has its own investment risks, and those risks can affect the value of the Fund’s investments and therefore the value of the Fund’s shares. To the extent that the Fund invests more of its assets in one Affiliated Fund than in another, the Fund will have greater exposure to the risks of that Affiliated Fund.
Investments in Money Market Instruments.The Fund is permitted to invest its free cash balances in money market instruments to provide liquidity or for defensive purposes. The Fund may invest in money market instruments by investing in Class E shares of Oppenheimer Institutional Government Money Market Fund (“IGMMF”), which is an Affiliated Fund. IGMMF is regulated as a money market fund under the 1940 Act, as amended. The Fund may also invest in money market instruments directly or in other affiliated or unaffiliated money market funds.
Master Limited Partnerships (“MLPs”).MLPs issue common units that represent an equity ownership interest in a partnership and provide limited voting rights. MLP common units are registered with the Securities and Exchange Commission (“SEC”), and are freely tradable on securities exchanges such as the NYSE and the NASDAQ Stock Market (“NASDAQ”), or in theover-the-counter (“OTC”) market. An MLP consists of one or more general partners, who conduct the business, and one or more limited partners, who contribute capital. MLP common unit holders have a limited role in the partnership’s operations and management. The Fund, as a limited partner, normally would not be liable for the debts of the MLP beyond the amounts the Fund has contributed, but would not be shielded to the same extent that a shareholder of a corporation would be. In certain circumstances creditors of an MLP would have the right to seek return of capital distributed to a limited partner. This right of an MLP’s creditors would continue after the Fund sold its investment in the MLP.
Equity Security Risk.Stocks and other equity securities fluctuate in price. The value of the Fund’s portfolio may be affected by changes in the equity markets generally. Equity markets may experience significant short-term volatility and may fall sharply at times. Different markets may behave differently
18 OPPENHEIMER MAIN STREET SMALL CAP FUND/VA
4. Investments and Risks (Continued)
from each other and U.S. equity markets may move in the opposite direction from one or more foreign stock markets. Adverse events in any part of the equity or fixed-income markets may have unexpected negative effects on other market segments.
The prices of individual equity securities generally do not all move in the same direction at the same time and a variety of factors can affect the price of a particular company’s securities. These factors may include, but are not limited to, poor earnings reports, a loss of customers, litigation against the company, general unfavorable performance of the company’s sector or industry, or changes in government regulations affecting the company or its industry.
Shareholder Concentration.At period end, one shareholder owned 20% or more of the Fund’s total outstanding shares.
5. Market Risk Factors
The Fund’s investments in securities and/or financial derivatives may expose the Fund to various market risk factors:
Commodity Risk. Commodity risk relates to the change in value of commodities or commodity indexes as they relate to increases or decreases in the commodities market. Commodities are physical assets that have tangible properties. Examples of these types of assets are crude oil, heating oil, metals, livestock, and agricultural products.
Credit Risk.Credit risk relates to the ability of the issuer of debt to meet interest and principal payments, or both, as they come due. In general, lower-grade, higher-yield debt securities are subject to credit risk to a greater extent than lower-yield, higher-quality securities.
Equity Risk. Equity risk relates to the change in value of equity securities as they relate to increases or decreases in the general market.
Foreign Exchange Rate Risk. Foreign exchange rate risk relates to the change in the U.S. dollar value of a security held that is denominated in a foreign currency. The U.S. dollar value of a foreign currency denominated security will decrease as the dollar appreciates against the currency, while the U.S. dollar value will increase as the dollar depreciates against the currency.
Interest Rate Risk.Interest rate risk refers to the fluctuations in value of fixed-income securities resulting from the inverse relationship between price and yield. For example, an increase in general interest rates will tend to reduce the market value of already issued fixed-income investments, and a decline in general interest rates will tend to increase their value. In addition, debt securities with longer maturities, which tend to have higher yields, are subject to potentially greater fluctuations in value from changes in interest rates than obligations with shorter maturities.
Volatility Risk.Volatility risk refers to the magnitude of the movement, but not the direction of the movement, in a financial instrument’s price over a defined time period. Large increases or decreases in a financial instrument’s price over a relative time period typically indicate greater volatility risk, while small increases or decreases in its price typically indicate lower volatility risk.
6. Shares of Beneficial Interest
The Fund has authorized an unlimited number of $0.001 par value shares of beneficial interest of each class. Transactions in shares of beneficial interest were as follows:
| | | | | | | | | | | | | | | | | | | | | | | | | | | | |
| | | Year Ended December 31, 2018 | | | | | | | | | Year Ended December 31, 2017 | | | | |
| | | Shares | | | Amount | | | | | | | | | Shares | | | Amount | | | | |
Non-Service Shares | | | | | | | | | | | | | | | | | | | | | | | | | | | | |
Sold | | | 877,784 | | | $ | 21,586,667 | | | | | | | | | | | | 711,775 | | | $ | 17,670,310 | | | | | |
| Dividends and/or distributions reinvested | | | 754,537 | | | | 19,059,602 | | | | | | | | | | | | 392,769 | | | | 9,410,741 | | | | | |
Redeemed | | | (1,462,725 | ) | | | (35,729,815 | ) | | | | | | | | | | | (1,227,568 | ) | | | (30,303,368 | ) | | | | |
| | | | |
Net increase (decrease) | | | 169,596 | | | $ | 4,916,454 | | | | | | | | | | | | (123,024 | ) | | $ | (3,222,317 | ) | | | | |
| | | | |
| | | | | | | | | | | | | | | | | | | | | | | | | | | | | |
Service Shares | | | | | | | | | | | | | | | | | | | | | | | | | | | | |
Sold | | | 2,340,038 | | | $ | 56,752,666 | | | | | | | | | | | | 2,321,546 | | | $ | 56,712,198 | | | | | |
| Dividends and/or distributions reinvested | | | 4,711,982 | | | | 117,234,118 | | | | | | | | | | | | 2,336,364 | | | | 55,255,007 | | | | | |
Redeemed | | | (7,125,127 | ) | | | (176,558,782) | | | | | | | | | | | | (6,662,764 | ) | | | (162,886,760 | ) | | | | |
| | | | |
Net decrease | | | (73,107 | ) | | $ | (2,571,998) | | | | | | | | | | | | (2,004,854 | ) | | $ | (50,919,555 | ) | | | | |
| | | | |
7. Purchases and Sales of Securities
The aggregate cost of purchases and proceeds from sales of securities, other than short-term obligations and investments in IGMMF, for the reporting period were as follows:
| | | | |
| | | Purchases | | Sales |
Investment securities | | $463,481,479 | | $590,280,879 |
8. Fees and Other Transactions with Affiliates
Management Fees.Under the investment advisory agreement, the Fund pays the Manager a management fee based on the daily net assets of the Fund at an annual rate as shown in the following table:
19 OPPENHEIMER MAIN STREET SMALL CAP FUND/VA
NOTES TO FINANCIAL STATEMENTSContinued
8. Fees and Other Transactions with Affiliates (Continued)
| | | | |
| Fee Schedule | | | |
Up to $200 million | | | 0.75% | |
Next $200 million | | | 0.72 | |
Next $200 million | | | 0.69 | |
Next $200 million | | | 0.66 | |
Next $200 million | | | 0.60 | |
Next $4 billion | | | 0.58 | |
Over $5 billion | | | 0.56 | |
The Fund’s effective management fee for the reporting period was 0.68% of average annual net assets before any applicable waivers.
Sub-Adviser Fees.The Manager has retained theSub-Adviser to provide theday-to-day portfolio management of the Fund. Under theSub-Advisory Agreement, the Manager pays theSub-Adviser an annual fee in monthly installments, equal to a percentage of the investment management fee collected by the Manager from the Fund, which shall be calculated after any investment management fee waivers. The fee paid to theSub-Adviser is paid by the Manager, not by the Fund.
Transfer Agent Fees.OFI Global (the “Transfer Agent”) serves as the transfer and shareholder servicing agent for the Fund. The Fund pays the Transfer Agent a fee based on annual net assets. Fees incurred and average net assets for each class with respect to these services are detailed in the Statement of Operations and Financial Highlights, respectively.
Sub-Transfer Agent Fees.The Transfer Agent has retained Shareholder Services, Inc., a wholly-owned subsidiary of OFI (the“Sub-Transfer Agent”), to provide theday-to-day transfer agent and shareholder servicing of the Fund. Under theSub-Transfer Agency Agreement, the Transfer Agent pays theSub-Transfer Agent an annual fee in monthly installments, equal to a percentage of the transfer agent fee collected by the Transfer Agent from the Fund, which shall be calculated after any applicable fee waivers. The fee paid to theSub-Transfer Agent is paid by the Transfer Agent, not by the Fund.
Trustees’ Compensation. The Fund’s Board of Trustees (“Board”) has adopted a compensation deferral plan for Independent Trustees that enables Trustees to elect to defer receipt of all or a portion of the annual compensation they are entitled to receive from the Fund. For purposes of determining the amount owed to the Trustees under the plan, deferred amounts are treated as though equal dollar amounts had been invested in shares of the Fund or in other Oppenheimer funds selected by the Trustees. The Fund purchases shares of the funds selected for deferral by the Trustees in amounts equal to his or her deemed investment, resulting in a Fund asset equal to the deferred compensation liability. Such assets are included as a component of “Other” within the asset section of the Statement of Assets and Liabilities. Deferral of Trustees’ fees under the plan will not affect the net assets of the Fund and will not materially affect the Fund’s assets, liabilities or net investment income per share. Amounts will be deferred until distributed in accordance with the compensation deferral plan.
Distribution and Service Plan for Service Shares.The Fund has adopted a Distribution and Service Plan (the “Plan”) pursuant to Rule12b-1 under the 1940 Act for Service shares to pay OppenheimerFunds Distributor, Inc. (the “Distributor”), for distribution related services, personal service and account maintenance for the Fund’s Service shares. Under the Plan, payments are made periodically at an annual rate of 0.25% of the daily net assets of Service shares of the Fund. The Distributor currently uses all of those fees to compensate sponsors of the insurance product that offers Fund shares, for providing personal service and maintenance of accounts of their variable contract owners that hold Service shares. These fees are paid out of the Fund’s assets on anon-going basis and increase operating expenses of the Service shares, which results in lower performance compared to the Fund’s shares that are not subject to a service fee. Fees incurred by the Fund under the Plan are detailed in the Statement of Operations.
Waivers and Reimbursements of Expenses.The Manager has contractually agreed to limit the Fund’s expenses after payments, waivers and/or reimbursements and reduction to custodian expenses, excluding any applicable dividend expense, taxes, interest and fees from borrowing, any subsidiary expenses, Acquired Fund Fees and Expenses, brokerage commissions, unusual and infrequent expenses and certain other Fund expenses; so that those expenses, as percentages of daily net assets, will not exceed the annual rate of 0.80% forNon-Service shares and 1.05% for Service shares.
During the reporting period, the Manager waived fees and/or reimbursed the Fund as follows:
| | | | |
Non-Service Shares | | $ | 36,964 | |
Service Shares | | | 220,857 | |
This fee waiver and/or expense reimbursement may not be amended or withdrawn for one year from the date of the Fund’s prospectus, unless approved by the Board.
The Manager will waive fees and/or reimburse Fund expenses in an amount equal to the indirect management fees incurred through the Fund’s investment in IGMMF. During the reporting period, the Manager waived fees and/or reimbursed the Fund $15,052 for IGMMF management fees.
9. Borrowings and Other Financing
Joint Credit Facility.A number of mutual funds managed by the Manager participate in a $1.95 billion revolving credit facility (the “Facility”) intended to provide short-term financing, if necessary, subject to certain restrictions in connection with atypical redemption activity. Expenses and fees related to
20 OPPENHEIMER MAIN STREET SMALL CAP FUND/VA
9. Borrowings and Other Financing (Continued)
the Facility are paid by the participating funds and are disclosed separately or as other expenses on the Statement of Operations. The Fund did not utilize the Facility during the reporting period.
10. Pending Acquisition
On October 18, 2018, Massachusetts Mutual Life Insurance Company, an indirect corporate parent of theSub-Adviser and the Manager, announced that it has entered into an agreement whereby Invesco Ltd. (“Invesco”), a global investment management company, will acquire theSub-Adviser (the “Transaction”). In connection with the Transaction, on January 11, 2019, the Fund’s Board unanimously approved an Agreement and Plan of Reorganization (the “Agreement”), which provides for the transfer of the assets and liabilities of the Fund to a corresponding, newly formed fund (the “Acquiring Fund”) in the Invesco family of funds (the “Reorganization”) in exchange for shares of the corresponding Acquiring Fund of equal value to the value of the shares of the Fund as of the close of business on the closing date. Although the Acquiring Fund will be managed by Invesco Advisers, Inc., the Acquiring Fund will, as of the closing date, have the same investment objective and substantially similar principal investment strategies and risks as the Fund. After the Reorganization, Invesco Advisers, Inc. will be the investment adviser to the Acquiring Fund, and the Fund will be liquidated and dissolved under applicable law and terminate its registration under the Investment Company Act of 1940, as amended. The Reorganization is expected to be atax-free reorganization for U.S. federal income tax purposes.
The Reorganization is subject to the approval of shareholders of the Fund. Shareholders of record of the Fund on January 14, 2019 will be entitled to vote on the Reorganization and will receive a combined prospectus and proxy statement describing the Reorganization, the shareholder meeting, and a discussion of the factors the Fund’s Board considered in approving the Agreement. The combined prospectus and proxy statement is expected to be distributed to shareholders of record on or about February 28, 2019. The anticipated date of the shareholder meeting is on or about April 12, 2019.
If shareholders approve the Agreement and certain other closing conditions are satisfied or waived, the Reorganization is expected to close during the second quarter of 2019, or as soon as practicable thereafter. This is subject to change.
21 OPPENHEIMER MAIN STREET SMALL CAP FUND/VA
REPORT OF INDEPENDENT REGISTERED PUBLIC ACCOUNTING FIRM
To the Shareholders and Board of Trustees
Oppenheimer Variable Account Funds:
Opinion on the Financial Statements
We have audited the accompanying statement of assets and liabilities of Oppenheimer Main Street Small Cap Fund/VA, a separate series of Oppenheimer Variable Account Funds, (the “Fund”), including the statement of investments, as of December 31, 2018, the related statement of operations for the year then ended, the statements of changes in net assets for each of the years in the two year period then ended, and the related notes (collectively, the “financial statements”) and the financial highlights for each of the years in the five year period then ended. In our opinion, the financial statements and financial highlights present fairly, in all material respects, the financial position of the Fund as of December 31, 2018, the results of its operations for the year then ended, the changes in its net assets for each of the years in the two year period then ended, and the financial highlights for each of the years in the five year period then ended, in conformity with U.S. generally accepted accounting principles.
Basis for Opinion
These financial statements and financial highlights are the responsibility of the Fund’s management. Our responsibility is to express an opinion on these financial statements and financial highlights based on our audits. We are a public accounting firm registered with the Public Company Accounting Oversight Board (United States) (“PCAOB”) and are required to be independent with respect to the Fund in accordance with the U.S. federal securities laws and the applicable rules and regulations of the Securities and Exchange Commission and the PCAOB.
We conducted our audits in accordance with the standards of the PCAOB. Those standards require that we plan and perform the audit to obtain reasonable assurance about whether the financial statements and financial highlights are free of material misstatement, whether due to error or fraud. Our audits included performing procedures to assess the risks of material misstatement of the financial statements and financial highlights, whether due to error or fraud, and performing procedures that respond to those risks. Such procedures included examining, on a test basis, evidence regarding the amounts and disclosures in the financial statements and financial highlights. Such procedures also included confirmation of securities owned as of December 31, 2018, by correspondence with the custodian, brokers and the transfer agent, or by other appropriate auditing procedures. Our audits also included evaluating the accounting principles used and significant estimates made by management, as well as evaluating the overall presentation of the financial statements and financial highlights. We believe that our audits provide a reasonable basis for our opinion.
KPMGLLP
We have not been able to determine the specific year that we began serving as the auditor of one or more Oppenheimer Funds investment companies, however we are aware that we have served as the auditor of one or more Oppenheimer Funds investment companies since at least 1969.
Denver, Colorado
February 14, 2019
22 OPPENHEIMER MAIN STREET SMALL CAP FUND/VA
FEDERAL INCOME TAX INFORMATIONUnaudited
In early 2019, if applicable, shareholders of record received information regarding all dividends and distributions paid to them by the Fund during calendar year 2018.
Capital gain distributions of $2.65537 per share were paid toNon-Service and Service shareholders, respectively, on June 19, 2018. Whether received in stock or in cash, the capital gain distribution should be treated by shareholders as a gain from the sale of the capital assets held for more than one year (long-term capital gains).
Dividends, if any, paid by the Fund during the reporting period which are not designated as capital gain distributions should be multiplied by the maximum amount allowable but not less than 86.18% to arrive at the amount eligible for the corporate dividend-received deduction.
Dividends, if any, paid by the Fund during the reporting period which are not designated as capital gain distributions, may be eligible for lower individual income tax rates to the extent that the Fund has received qualified dividend income as stipulated by recent tax legislation. In early 2019, shareholders of record received information regarding the percentage of distributions that are eligible for lower individual income tax rates. The amount will be the maximum amount allowed.
The foregoing information is presented to assist shareholders in reporting distributions received from the Fund to the Internal Revenue Service. Because of the complexity of the federal regulations which may affect your individual tax return and the many variations in state and local tax regulations, we recommend that you consult your tax advisor for specific guidance.
23 OPPENHEIMER MAIN STREET SMALL CAP FUND/VA
BOARD APPROVAL OF THE FUND’S INVESTMENT ADVISORY ANDSUB-ADVISORY AGREEMENTSUnaudited
The Fund has entered into an investment advisory agreement with OFI Global Asset Management, Inc. (“OFI Global” or the “Adviser”), a wholly-owned subsidiary of OppenheimerFunds, Inc. (“OFI” or the“Sub-Adviser”) (“OFI Global” and “OFI” together the “Managers”) and OFI Global has entered into asub-advisory agreement with OFI whereby OFI provides investmentsub-advisory services to the Fund (collectively, the “Agreements”). Each year, the Board of Trustees (the “Board”), including a majority of the independent Trustees, is required to determine whether to approve the terms of the Agreements and the renewal thereof. The Investment Company Act of 1940, as amended, requires that the Board request and evaluate, and that the Managers provide, such information as may be reasonably necessary to evaluate the terms of the Agreements. The Board employs an independent consultant to prepare a report that provides information, including comparative information that the Board requests for that purpose. In addition toin-person meetings focused on this evaluation, the Board receives information throughout the year regarding Fund services, fees, expenses and performance.
The Managers and the independent consultant provided information to the Board on the following factors: (i) the nature, quality and extent of the Managers’ services, (ii) the comparative investment performance of the Fund and the Managers, (iii) the fees and expenses of the Fund, including comparative fee and expense information, (iv) the profitability of the Managers and their affiliates, including an analysis of the cost of providing services, (v) whether economies of scale are realized as the Fund grows and whether fee levels reflect these economies of scale for Fund investors and (vi) other benefits to the Managers from their relationship with the Fund. The Board was aware that there are alternatives to retaining the Managers.
Outlined below is a summary of the principal information considered by the Board as well as the Board’s conclusions.
Nature, Quality and Extent of Services. The Board considered information about the nature, quality and extent of the services provided to the Fund and information regarding the Managers’ key personnel who provide such services. The Managers’ duties include providing the Fund with the services of theSub-Adviser’s portfolio managers and investment team, who provide research, analysis and other advisory services in regard to the Fund’s investments; and securities trading services. OFI Global is responsible for oversight of third-party service providers; monitoring compliance with applicable Fund policies and procedures and adherence to the Fund’s investment restrictions; risk management; and oversight of theSub-Adviser. OFI Global is also responsible for providing certain administrative services to the Fund. Those services include providing and supervising all administrative and clerical personnel who are necessary in order to provide effective corporate administration for the Fund; compiling and maintaining records with respect to the Fund’s operations; preparing and filing reports required by the U.S. Securities and Exchange Commission; preparing periodic reports regarding the operations of the Fund for its shareholders; preparing proxy materials for shareholder meetings; and preparing the registration statements required by federal and state securities laws for the sale of the Fund’s shares. OFI Global also provides the Fund with office space, facilities and equipment.
The Board also considered the quality of the services provided and the quality of the Managers’ resources that are available to the Fund. The Board took account of the fact that theSub-Adviser has over fifty years of experience as an investment adviser and that its assets under management rank it among the top mutual fund managers in the United States. The Board evaluated the Managers’ advisory, administrative, accounting, legal, compliance and risk management services, among other services, and information the Board has received regarding the experience and professional qualifications of the Managers’ key personnel and the size and functions of their staff. In its evaluation of the quality of the portfolio management services provided, the Board considered the experience of Matthew P. Ziehl, Raymond Anello, Raman Vardharaj, Joy Budzinski, Kristin Ketner, Magnus Krantz and Adam Weiner, the portfolio managers for the Fund, and theSub-Adviser’s investment team and analysts. The Board members also considered the totality of their experiences with the Managers as directors or trustees of the Fund and other funds advised by the Managers. The Board considered information regarding the quality of services provided by affiliates of the Managers, which the Board members have become knowledgeable about through their experiences with the Managers and in connection with the review or renewal of the Fund’s service agreements or service providers. The Board concluded, in light of the Managers’ experience, reputation, personnel, operations and resources that the Fund benefits from the services provided under the Agreements.
Investment Performance of the Managers and the Fund. Throughout the year, the Managers provided information on the investment performance of the Fund, the Adviser and theSub-Adviser, including comparative performance information. The Board also reviewed information, prepared by the Managers and by the independent consultant, comparing the Fund’s historical performance to relevant market indices and to the performance of other small blend funds underlying variable insurance products. The Board noted that the Fund outperformed its category median for each of theone-, five- andten-year periods, though it underperformed its category median for the three-year period.
Fees and Expenses of the Fund. The Board reviewed the fees paid to the Adviser and the other expenses borne by the Fund. The Board noted that the Adviser, not the Fund, pays theSub-Adviser’s fee under thesub-advisory agreement. The independent consultant provided comparative data in regard to the fees and expenses of the Fund and other small blend funds underlying variable insurance products. In reviewing the fees and expenses charged to the VA funds, the Board considered the Adviser’s assertion that, because there is much greater disparity in the fees and services that may be provided by a manager to a VA fund as opposed to a retail fund, when comparing the expenses of the various VA funds to those of retail funds, it is most appropriate to focus on total expenses (rather than on the management fees). The Board considered that the Fund’s contractual management fee and total expenses were lower than their respective peer group medians and category medians. The Board also considered that the Adviser has contractually agreed to waive fees and/or reimburse certain expenses so that the Fund’s total annual operating expenses, as percentages of daily net assets, will not exceed the annual rate of 0.80% forNon-Service Shares and 1.05% for Service Shares. This fee waiver and/or expense reimbursement may not be amended or withdrawn for one year from the date of the Fund’s prospectus, unless approved by the Board. The Board further considered that the Adviser has agreed to waive fees and/or reimburse Fund expenses in an amount equal to the management fees incurred indirectly through the Fund’s investments in funds managed by the Adviser or its affiliates.
Economies of Scale and Profits Realized by the Managers. The Board considered information regarding the Managers’ costs in serving as the Fund’s investment adviser andsub-adviser, including the costs associated with the personnel and systems necessary to manage the Fund, and information regarding the Managers’ profitability from their relationship with the Fund. The Board also considered that the Managers must be able to pay and retain experienced professional personnel at competitive rates to provide quality services to the Fund. The Board reviewed whether the
24 OPPENHEIMER MAIN STREET SMALL CAP FUND/VA
BOARD APPROVAL OF THE FUND’S INVESTMENT ADVISORY ANDSUB-ADVISORY AGREEMENTSUnaudited / Continued
Managers may realize economies of scale in managing and supporting the Fund. The Board noted that the Fund currently has management fee breakpoints, which are intended to share with Fund shareholders economies of scale that may exist as the Fund’s assets grow.
Other Benefits to the Managers. In addition to considering the profits realized by the Managers, the Board considered information that was provided regarding the direct and indirect benefits the Managers receive as a result of their relationship with the Fund, including compensation paid to the Managers’ affiliates and research provided to the Adviser in connection with permissible brokerage arrangements (soft dollar arrangements).
Conclusions. These factors were also considered by the independent Trustees meeting separately from the full Board, assisted by experienced counsel to the Fund and to the independent Trustees. Fund counsel and the independent Trustees’ counsel are independent of the Managers within the meaning and intent of the Securities and Exchange Commission Rules.
Based on its review of the information it received and its evaluations described above, the Board, including a majority of the independent Trustees, decided to continue the Agreements through August 31, 2019. In arriving at its decision, the Board did not identify any factor or factors as being more important than others, but considered all of the above information, and considered the terms and conditions of the Agreements, including the management fees, in light of all the surrounding circumstances.
25 OPPENHEIMER MAIN STREET SMALL CAP FUND/VA
PORTFOLIO PROXY VOTING POLICIES AND GUIDELINES; UPDATES TO STATEMENT OF INVESTMENTSUnaudited
The Fund has adopted Portfolio Proxy Voting Policies and Guidelines under which the Fund votes proxies relating to securities (“portfolio proxies”) held by the Fund. A description of the Fund’s Portfolio Proxy Voting Policies and Guidelines is available (i) without charge, upon request, by calling the Fund toll-free at 1.800.CALL OPP (225.5677), (ii) on the Fund’s website at www.oppenheimerfunds.com, and (iii) on the SEC’s website at www.sec.gov. In addition, the Fund is required to file FormN-PX, with its complete proxy voting record for the 12 months ended June 30th, no later than August 31st of each year. The Fund’s voting record is available (i) without charge, upon request, by calling the Fund toll-free at 1.800.CALL OPP (225.5677), and (ii) in the FormN-PX filing on the SEC’s website at www.sec.gov.
The Fund files its complete schedule of portfolio holdings with the SEC for the first quarter and the third quarter of each fiscal year on FormN-Q. The Fund’s FormN-Q filings are available on the SEC’s website at www.sec.gov.
26 OPPENHEIMER MAIN STREET SMALL CAP FUND/VA
TRUSTEES AND OFFICERSUnaudited
| | |
| Name, Position(s) Held with the Fund, Length of Service, Year of Birth | | Principal Occupation(s) During the Past 5 Years; Other Trusteeships/Directorships Held; Number of Portfolios in the Fund Complex Currently Overseen |
| |
| INDEPENDENT TRUSTEES | | The address of each Trustee in the chart below is 6803 S. Tucson Way, Centennial, Colorado 80112-3924. Each Trustee serves for an indefinite term, or until his or her resignation, retirement, death or removal. Each of the Trustees in the chart below oversees 58 portfolios in the OppenheimerFunds complex. |
| |
Robert J. Malone, Chairman of the Board of Trustees (since 2016), Trustee (since 2002) Year of Birth: 1944 | | Chairman - Colorado Market of MidFirst Bank (since January 2015); Chairman of the Board (2012-2016) and Director (August 2005-January 2016) of Jones International University (educational organization); Trustee of the Gallagher Family Foundation(non-profit organization) (2000-2016); Chairman, Chief Executive Officer and Director of Steele Street Bank Trust (commercial banking) (August 2003-January 2015); Director of Opera Colorado Foundation(non-profit organization) (2008-2012); Director of Colorado UpLIFT (charitable organization) (1986-2010); Director of Jones Knowledge, Inc. (2006-2010); Former Chairman of U.S. Bank-Colorado (subsidiary of U.S. Bancorp and formerly Colorado National Bank) (July 1996-April 1999); Director of Commercial Assets, Inc. (real estate investment trust) (1993-2000); Director of U.S. Exploration, Inc. (oil and gas exploration) (1997-February 2004); Chairman of the Board (1991-1994) and Trustee (1985-1994) of Regis University; and Chairman of the Board (1990-1991) and Member (1984-1999) of Young Presidents Organization. Mr. Malone has served on the Boards of certain Oppenheimer funds since 2002, during which time he has become familiar with the Fund’s (and other Oppenheimer funds’) financial, accounting, regulatory and investment matters and has contributed to the Board’s deliberations. |
| |
Andrew J. Donohue, Trustee (since 2017) Year of Birth: 1950 | | Director, Mutual Fund Directors Forum (since February 2018); Of Counsel, Shearman & Sterling LLP (since September 2017); Chief of Staff of the U.S. Securities and Exchange Commission (regulator) (June 2015-February 2017); Managing Director and Investment Company General Counsel of Goldman Sachs (investment bank) (November2012-May 2015); Partner at Morgan Lewis & Bockius, LLP (law firm) (March 2011-October 2012); Director of the Division of Investment Management of U.S. Securities and Exchange Commission (regulator) (May 2006-November 2010); Global General Counsel of Merrill Lynch Investment Managers (investment firm) (May2003-May 2006); General Counsel (October 1991-November 2001) and Executive Vice President (January 1993-November 2001) of OppenheimerFunds, Inc. (investment firm) (June 1991-November 2001). Mr. Donohue has served on the Boards of certain Oppenheimer funds since 2017, during which time he has become familiar with the Fund’s (and other Oppenheimer funds’) financial, accounting, regulatory and investment matters and has contributed to the Board’s deliberations. |
| |
Richard F. Grabish, Trustee (since 2012) Year of Birth: 1948 | | Formerly Senior Vice President and Assistant Director of Sales and Marketing (March 1997-December 2007), Director (March 1987-December 2007) and Manager of Private Client Services (June 1985-June 2005) of A.G. Edwards & Sons, Inc. (broker/dealer and investment firm); Chairman and Chief Executive Officer of A.G. Edwards Trust Company, FSB (March 2001-December 2007); President and Vice Chairman of A.G. Edwards Trust Company, FSB (investment adviser) (April 1987-March 2001); President of A.G. Edwards Trust Company, FSB (investment adviser) (June 2005-December 2007). Mr. Grabish has served on the Boards of certain Oppenheimer funds since 2001, during which time he has become familiar with the Fund’s (and other Oppenheimer funds’) financial, accounting, regulatory and investment matters and has contributed to the Board’s deliberations. |
| |
Beverly L. Hamilton, Trustee (since 2002) Year of Birth: 1946 | | Trustee of Monterey Institute for International Studies (educational organization) (2000-2014); Board Member of Middlebury College (educational organization) (December 2005-June 2011); Director of the Board (1991-2016), Vice Chairman of the Board (2006-2009) and Chairman of the Board (2010-2013) of American Funds’ Emerging Markets Growth Fund, Inc. (mutual fund); Director of The California Endowment (philanthropic organization) (April 2002-April 2008); Director (February 2002-2005) and Chairman of Trustees (2006-2007) of the Community Hospital of Monterey Peninsula; President of ARCO Investment Management Company (February 1991-April 2000); Member of the investment committees of The Rockefeller Foundation (2001-2006) and The University of Michigan (since 2000); Advisor at Credit Suisse First Boston’s Sprout venture capital unit (venture capital fund) (1994-January 2005); Trustee of MassMutual Institutional Funds (investment company) (1996-June 2004); Trustee of MML Series Investment Fund (investment company) (April 1989-June 2004); Member of the investment committee of Hartford Hospital (2000-2003); and Advisor to Unilever (Holland) pension fund (2000-2003). Ms. Hamilton has served on the Boards of certain Oppenheimer funds since 2002, during which time she has become familiar with the Fund’s (and other Oppenheimer funds’) financial, accounting, regulatory and investment matters and has contributed to the Board’s deliberations. |
| |
Victoria J. Herget, Trustee (since 2012) Year of Birth: 1951 | | Board Chair (2008-2015) and Director (2004-Present) of United Educators (insurance company); Trustee (since 2000) and Chair (2010-2017) of Newberry Library (independent research library); Trustee, Mather LifeWays (senior living organization) (since 2001); Independent Director of the First American Funds (mutual fund family) (2003-2011); former Managing Director (1993-2001), Principal (1985-1993), Vice President (1978-1985) and Assistant Vice President (1973-1978) of Zurich Scudder Investments (investment adviser) (and its predecessor firms); Trustee (1992-2007), Chair of the Board of Trustees (1999-2007), Investment Committee Chair (1994-1999) and Investment Committee member (2007-2010) of Wellesley College; Trustee, BoardSource(non-profit organization) (2006-2009) and Chicago City Day School(K-8 School) (1994-2005). Ms. Herget has served on the Boards of certain Oppenheimer funds since 2012, during which time she has become familiar with the Fund’s (and other Oppenheimer funds’) financial, accounting, regulatory and investment matters and has contributed to the Board’s deliberations. |
| |
Karen L. Stuckey, Trustee (since 2012) Year of Birth: 1953 | | Member (since May 2015) of Desert Mountain Community Foundation Advisory Board(non-profit organization); Partner (1990-2012) of PricewaterhouseCoopers LLP (professional services firm) (held various positions 1975-1990); Trustee (1992- 2006); member of Executive, Nominating and Audit Committees and Chair of Finance Committee (1992-2006), and Emeritus Trustee (since 2006) of Lehigh University; member, Women’s Investment Management Forum (professional organization) (since inception) and Trustee of Jennies School for Little Children(non-profit) (2011-2014). Ms. Stuckey has served on the Boards of certain Oppenheimer funds since 2012, during which time she has become familiar with the Fund’s (and other Oppenheimer funds’) financial, accounting, regulatory and investment matters and has contributed to the Board’s deliberations. |
27 OPPENHEIMER MAIN STREET SMALL CAP FUND/VA
TRUSTEES AND OFFICERSUnaudited / Continued
| | |
James D. Vaughn, Trustee (since 2012) Year of Birth:1945 | | Retired; former managing partner (1994-2001) of Denver office of Deloitte & Touche LLP, (held various positions in Denver and New York offices from 1969-1993); Trustee and Chairman of the Audit Committee of Schroder Funds (2003-2012); Board member and Chairman of Audit Committee of AMG National Trust Bank (since 2005); Trustee and Investment Committee member, University of South Dakota Foundation (since 1996); Board member, Audit Committee Member and past Board Chair, Junior Achievement (since 1993); former Board member, Mile High United Way, Boys and Girls Clubs, Boy Scouts, Colorado Business Committee for the Arts, Economic Club of Colorado and Metro Denver Network. Mr. Vaughn has served on the Boards of certain Oppenheimer funds since 2012, during which time he has become familiar with the Fund’s (and other Oppenheimer funds’) financial, accounting, regulatory and investment matters and has contributed to the Board’s deliberations. |
INTERESTED TRUSTEE AND OFFICER | | Mr. Steinmetz is an “Interested Trustee” because he is affiliated with the Manager and theSub-Adviser by virtue of his positions as Chairman and director of theSub-Adviser and officer and director of the Manager. Both as a Trustee and as an officer, Mr. Steinmetz serves for an indefinite term, or until his resignation, retirement, death or removal. Mr. Steinmetz’s address is 225 Liberty Street, New York, New York 10281- 1008. Mr. Steinmetz is an officer of 104 portfolios in the OppenheimerFunds complex. |
| |
Arthur P. Steinmetz, Trustee (since 2015), President and Principal Executive Officer (since 2014) Year of Birth: 1958 | | Chairman of OppenheimerFunds, Inc. (since January 2015); CEO and Chairman of OFI Global Asset Management, Inc. (since July 2014), President of OFI Global Asset Management, Inc. (since May 2013), a Director of OFI Global Asset Management, Inc. (since January 2013), Director of OppenheimerFunds, Inc. (since July 2014), President, Management Director and CEO of Oppenheimer Acquisition Corp. (OppenheimerFunds, Inc.‘s parent holding company) (since July 2014), and President and Director of OFI SteelPath, Inc. (since January 2013). Chief Investment Officer of the OppenheimerFunds advisory entities (January 2013-December 2013); Executive Vice President of OFI Global Asset Management, Inc. (January2013-May 2013); Chief Investment Officer of OppenheimerFunds, Inc. (October 2010-December 2012); Chief Investment Officer, Fixed- Income, of OppenheimerFunds, Inc. (April 2009-October 2010); Executive Vice President of OppenheimerFunds, Inc. (October 2009-December 2012); Director of Fixed Income of OppenheimerFunds, Inc. (January 2009-April 2009); and a Senior Vice President of OppenheimerFunds, Inc. (March 1993-September 2009). |
OTHER OFFICERS OF THE FUND | | The addresses of the Officers in the chart below are as follows: for Messrs. Ziehl, Vardharaj, Anello, Krantz, Weiner, Mss. Lo Bessette, Budzinski, Ketner, Foxson and Picciotto, 225 Liberty Street, New York, New York 10281-1008, for Mr. Petersen, 6803 S. Tucson Way, Centennial, Colorado 80112-3924. Each Officer serves for an indefinite term or until his or her resignation, retirement, death or removal. |
| |
Matthew P. Ziehl, Vice President (since 2009) Year of Birth: 1967 | | Vice President and Senior Portfolio Manager of theSub-Adviser (since May 2009). Portfolio manager with RS Investment Management Co. LLC (October2006-May 2009); Managing Director at The Guardian Life Insurance Company (December 2001-October 2006) when Guardian Life Insurance acquired an interest in RS Investment Management Co. LLC. Team leader and co portfolio manager with Salomon Brothers Asset Management, Inc. for small growth portfolios (January 2001-December 2001). |
| |
Raman Vardharaj, Vice President (since 2009) Year of Birth: 1971 | | Vice President and portfolio manager of theSub-Adviser (since May 2009). Sector manager and a senior quantitative analyst creating stock selection models, monitoring portfolio risks and analyzing portfolio performance across the RS Core Equity Team of RS Investment Management Co. LLC (October2006-May 2009). Quantitative analyst at The Guardian Life Insurance Company of America (1998-October 2006) when Guardian Life Insurance acquired an interest in RS Investment Management Co. LLC. |
| |
Raymond Anello, Vice President (since 2011) Year of Birth: 1964 | | Vice President of theSub-Adviser (since May 2009) and a portfolio manager of theSub-Adviser (since April 2011). Sector manager for energy and utilities for theSub-Adviser’s Main Street Investment Team (since May 2009). Portfolio Manager of the RS All Cap Dividend product (from its inception in July 2007-April 2009) and served as a sector manager for energy and utilities for various other RS Investments products. Guardian Life Insurance Company (October 1999) and transitioned to RS Investments (October 2006) in connection with Guardian Life Insurance Company’s acquisition of an interest in RS Investments. Mr. Anello served as an equity portfolio manager/analyst and high yield analyst at Orion Capital (1995-1998) and an assistant portfolio manager at the Garrison Bradford portfolio management firm (1988-1995). |
| |
Joy Budzinski, Vice President (since 2012) Year of Birth: 1968 | | Vice President of theSub-Adviser (since May 2009) and a portfolio manager of theSub-Adviser (since November 2012). Sector manager for healthcare for theSub-Adviser’s Main Street Investment Team (since May 2009). Healthcare sector manager at RS Investment and Guardian Life Insurance Company. Guardian Life Insurance Company (August 2006) and transitioned to RS Investments (October 2006) in connection with Guardian Life Insurance Company’s acquisition of an interest in RS Investments. Senior equity analyst at Bank of New York BNY Asset Management (2001 -2006); portfolio manager and analyst at Alliance of America (1999-2001); portfolio manager and analyst at JP Morgan Chase (1993-1997); analyst at Prudential Investments (1997-1998). |
| |
Kristin Ketner, Vice President (since 2012) Year of Birth: 1965 | | Vice President of theSub-Adviser (since June 2009) and a portfolio manager of theSub-Adviser (since November 2012). Sector manager for consumer discretionary and consumer staples for theSub-Adviser’s Main Street Investment Team (since May 2009). Sector manager at RS Investment and Guardian Life Insurance Company. Guardian Life Insurance Company in February 2006 and transitioned to RS Investments in October 2006 in connection with Guardian Life Insurance Company’s acquisition of an interest in RS Investments. Portfolio Manager at Solstice Equity Management (2002-2005); retail analyst at Goldman Sachs (1999-2001); Director of Strategy and Integration at Staples (1997-1999); investment banker at Merrill Lynch (1987-1992 and 1995-1997) and Montgomery Securities (1994-1995). |
| |
Magnus Krantz, Vice President (since 2012) Year of Birth: 1967 | | Vice President of theSub-Adviser (since May 2009) and a portfolio manager of theSub-Adviser (since November 2012); sector manager for technology for theSub-Adviser’s Main Street Investment Team (since May 2009). Prior to joining theSub-Adviser, Mr. Krantz was a sector manager at RS Investment and Guardian Life Insurance Company. Mr. Krantz joined Guardian Life Insurance Company in December 2005 and transitioned to RS Investments in October 2006 in connection with Guardian Life Insurance Company’s acquisition of an interest in RS Investments. Portfolio manager and analyst at Citigroup Asset Management (1998-2005) and as a consultant at Price Waterhouse (1997-1998). He also served as product development engineer at Newbridge Networks (1993-1996) and as a software engineer at Mitel Corporation (1990-1993). |
28 OPPENHEIMER MAIN STREET SMALL CAP FUND/VA
| | |
Adam Weiner, Vice President (since 2012) Year of Birth: 1969 | | Vice President of theSub-Adviser (since May 2009) and a portfolio manager of theSub-Adviser (since November 2012). Sector manager for industrials and materials for theSub-Adviser’s Main Street Investment Team (since May 2009). Sector manager at RS Investment for industrials and materials (January 2007-April 2009). Director and senior equity analyst at Credit Suisse Asset Management (CSAM) (September 2004-December 2006). Equity analyst at Credit Suisse First Boston 2004-2006(buy-side) and 1999-2004 (sell-side) and Morgan Stanley (1996-1999); internal auditor at Dun and Bradstreet (1992-1996). Budget analyst, Information Resources Division of the Executive Office of the President (1990-1992). |
| |
Cynthia Lo Bessette, Secretary and Chief Legal Officer (since 2016) Year of Birth: 1969 | | Executive Vice President, General Counsel and Secretary of OFI Global Asset Management, Inc. (since February 2016); Senior Vice President and Deputy General Counsel of OFI Global Asset Management, Inc. (March 2015-February 2016); Chief Legal Officer of OppenheimerFunds, Inc. and OppenheimerFunds Distributor, Inc. (since February 2016); Vice President, General Counsel and Secretary of Oppenheimer Acquisition Corp. (since February 2016); General Counsel of OFI SteelPath, Inc., OFI Advisors, LLC and Index Management Solutions, LLC (since February 2016); Chief Legal Officer of OFI Global Institutional, Inc., HarbourView Asset Management Corporation, OFI Global Trust Company, Oppenheimer Real Asset Management, Inc., OFI Private Investments Inc., Shareholder Services, Inc. and Trinity Investment Management Corporation (since February 2016); Corporate Counsel (February 2012-March 2015) and Deputy Chief Legal Officer (April 2013-March 2015) of Jennison Associates LLC; Assistant General Counsel (April 2008-September 2009) and Deputy General Counsel (October 2009-February 2012) of Lord Abbett & Co. LLC. |
| |
Jennifer Foxson, Vice President and Chief Business Officer (since 2014) Year of Birth: 1969 | | Senior Vice President of OppenheimerFunds Distributor, Inc. (since June 2014); Vice President of OppenheimerFunds Distributor, Inc. (April 2006-June 2014); Vice President of OppenheimerFunds, Inc. (January 1998-March 2006); Assistant Vice President of OppenheimerFunds, Inc. (October 1991-December 1998). |
| |
Mary Ann Picciotto, Chief Compliance Officer and Chief Anti-Money Laundering Officer (since 2014) Year of Birth: 1973 | | Senior Vice President and Chief Compliance Officer of OFI Global Asset Management, Inc. (since March 2014); Chief Compliance Officer of OppenheimerFunds, Inc., OFI SteelPath, Inc., OFI Global Institutional, Inc., Oppenheimer Real Asset Management, Inc., OFI Private Investments Inc., Harborview Asset Management Corporation, Trinity Investment Management Corporation, and Shareholder Services, Inc. (since March 2014); Managing Director of Morgan Stanley Investment Management Inc. and certain of its various affiliated entities; Chief Compliance Officer of various Morgan Stanley Funds (May 2010-January 2014); Chief Compliance Officer of Morgan Stanley Investment Management Inc. (April 2007-January 2014). |
| |
Brian S. Petersen, Treasurer and Principal Financial & Accounting Officer (since 2016) Year of Birth: 1970 | | Senior Vice President of OFI Global Asset Management, Inc. (since January 2017); Vice President of OFI Global Asset Management, Inc. (January 2013-January 2017); Vice President of OppenheimerFunds, Inc. (February 2007-December 2012); Assistant Vice President of OppenheimerFunds, Inc. (August 2002-2007). |
The Fund’s Statement of Additional Information contains additional information about the Fund’s Trustees and Officers and is available without charge, upon request, by calling 1.800.988.8287.
29 OPPENHEIMER MAIN STREET SMALL CAP FUND/VA
THIS PAGE INTENTIONALLY LEFT BLANK.
30 OPPENHEIMER MAIN STREET SMALL CAP FUND/VA
THIS PAGE INTENTIONALLY LEFT BLANK.
31 OPPENHEIMER MAIN STREET SMALL CAP FUND/VA
OPPENHEIMER MAIN STREET SMALL CAP FUND/VA
A Series of Oppenheimer Variable Account Funds
| | |
| Manager | | OFI Global Asset Management, Inc. |
| |
| Sub-Adviser | | OppenheimerFunds, Inc. |
| |
| Distributor | | OppenheimerFunds Distributor, Inc. |
| |
Transfer and Shareholder Servicing Agent | | OFI Global Asset Management, Inc. |
| |
| Sub-Transfer Agent | | Shareholder Services, Inc. DBA OppenheimerFunds Services |
| |
Independent Registered Public Accounting Firm | | KPMG LLP |
| |
| Legal Counsel | | Ropes & Gray LLP |
| |
| | Before investing in any of the Oppenheimer funds, investors should carefully consider a fund’s investment objectives, risks, charges and expenses. Fund prospectuses and summary prospectuses contain this and other information about the funds, and may be obtained by asking your financial advisor, visiting oppenheimerfunds.com or calling us at 1.800.988.8287. Read prospectuses and summary prospectuses carefully before investing. |
| |
| | © 2019 OppenheimerFunds, Inc. All rights reserved. Oppenheimer funds are distributed by OppenheimerFunds Distributor, Inc. |
| | | | |
| | 
| | |
| | |
| | | December 31, 2018 | | |
| | Oppenheimer | | |
| | Government Money Fund/VA | | Annual Report |
| | A Series of Oppenheimer Variable Account Funds | | |
| | | |
| | ANNUAL REPORT | | |
| | |
| | Listing of Top Holdings | | |
| | |
| | Fund Performance Discussion | | |
| | |
| | Financial Statements | | |
PORTFOLIO MANAGERS: Christopher Proctor, CFA and Adam S. Wilde, CFA
| | | | | | | | |
Current Yield | | | | | | | | |
For the7-Day Period Ended 12/31/18 | | | | | |
With Compounding | | | 2.01% | | | | | |
Without Compounding | | | 1.99% | | | | | |
For the12-Month Period Ended 12/31/18 | | | | | |
With Compounding | | | 1.35% | | | | | |
Without Compounding | | | 1.35 | | | | | |
Performance data quoted represents past performance, which does not guarantee future results. Yields include dividends in a hypothetical investment for the periods shown. Current performance may be lower or higher than the performance quoted. For performance data current to the most recent month end, call us at 1.800.988.8287. The yields take into account contractual and voluntary fee waivers and/or expense reimbursements, without which yields would have been lower. Some of these undertakings may be modified at any time, as indicated in the prospectus. There is no guarantee that the Fund will maintain a positive yield. The Fund’s performance should not be expected to be the same as the returns of other funds, whether or not both funds have the same portfolio managers and/or similar names. The Fund’s performance does not include the charges associated with the separate account products that offer this Fund. Such performance would have been lower if such charges were taken into account. See Fund prospectuses and summary prospectuses for more information on share classes and sales charges.
| | | | | | | | |
| PORTFOLIO ALLOCATION | | | | | | |
Repurchase Agreements | | | 68.0 | % | | | | |
U.S. Government Agencies | | | 31.5 | | | | | |
Investment Companies | | | 0.5 | | | | | |
Portfolio holdings and allocations are subject to change. Percentages are as of December 31, 2018, and are based on the total market value of investments.
For more current Fund holdings, please visit oppenheimerfunds.com.
2 OPPENHEIMER GOVERNMENT MONEY FUND/VA
Fund Update
Throughout the reporting period, the Fund continued to offer very strong liquidity and a stable $1.00 net asset value (NAV), while providing competitive income. At its December meeting, the Federal Open Market Committee (FOMC) voted to lift the Federal Funds Rate to a range of 2.25% to 2.50%, completing its ninth hike in this cycle. The Fund continued to benefit from these rate hikes, with ongoing reinvestment at higher rates. With the current market conditions, the view towards continued rate hikes has diminished and there is now increased uncertainty around more hikes in 2019.
MARKET OVERVIEW
The current broader market view is for no more hikes in 2019; however, the FOMC consensus is indicating two more hikes in 2019. The median of the FOMC dots are projecting a target rate of 2.875% atyear-end 2019. Recently the Federal Reserve (“Fed”) has stressed the importance of data dependence versus a rules-based strategy. Coupled with the past nine hikes, the Fed continues to shrink its balance sheet down from $4.5 trillion, a move it started in October 2017. While the Fed has not indicated a balance sheet level it intends to hit, it has denoted the holdings will not return topre-recession levels (less than $1 trillion). While the tapering to date has had minimal impact on the market, upcoming roll offs and continued concerns in the market have caused some to ponder if the Fed will continue with the tapering well into 2019.
FUND REVIEW
The Fund’s weighted average maturity throughout the reporting period averaged 17 days with a range of9-23 days. Supply continues to be available, notably in Federal Home Loan Bank paper. We are heavily weighted in government repurchase agreements and will occasionally ladder in some long-dated fixed paper to the portfolio.
STRATEGY & OUTLOOK
Our strategy continues to incorporate selective and incremental investing as we seek to provide shareholders stable and steady value. We intend to remain active in the auction market, with most of that weight going to fixed-rate instruments with durations of three months or less. When pricing allows, we will continue to layer inone- and three-month floating rate securities. Our outlook is for rate hikes to weigh heavily on the FOMC. While they are nearing a more neutral rate, the FOMC have voiced the importance of being data dependent. We believe the Fund is well-positioned to meet any large outflow while taking advantage of any continued rate hike in 2019.
The views in the Fund Performance Discussion represent the opinions of this Fund’s portfolio managers and are not intended as investment advice or to predict or depict the performance of any investment. These views are as of the close of business on December 31, 2018, and are subject to change based on subsequent developments. The Fund’s portfolio and strategies are subject to change.
You could lose money by investing in the Fund. Although the Fund seeks to preserve the value of your investment at $1.00 per share, it cannot guarantee it will do so. An investment in the Fund is not insured or guaranteed by the Federal Deposit Insurance Corporation or any other government agency. The Fund’s sponsor has no legal obligation to provide financial support to the Fund, and you should not expect that the sponsor will provide financial support to the Fund at any time.
Shares of Oppenheimer funds are not deposits or obligations of any bank, are not guaranteed by any bank, are not insured by the FDIC or any other agency, and involve investment risks, including the possible loss of the principal amount invested.
3 OPPENHEIMER GOVERNMENT MONEY FUND/VA
Fund Expenses
Fund Expenses.As a shareholder of the Fund, you incur two types of costs: (1) transaction costs and (2) ongoing costs, including management fees; and other Fund expenses. These examples are intended to help you understand your ongoing costs (in dollars) of investing in the Fund and to compare these costs with the ongoing costs of investing in other mutual funds.
The examples are based on an investment of $1,000.00 invested at the beginning of the period and held for the entire6-month period ended December 31, 2018.
Actual Expenses. The first section of the table provides information about actual account values and actual expenses. You may use the information in this section, together with the amount you invested, to estimate the expense that you paid over the period. Simply divide your account value by $1,000.00 (for example, an $8,600.00 account value divided by $1,000.00 = 8.60), then multiply the result by the number in the first section under the heading entitled “Expenses Paid During 6 Months Ended December 31, 2018” to estimate the expenses you paid on your account during this period.
Hypothetical Example for Comparison Purposes.
The second section of the table provides information about hypothetical account values and hypothetical expenses based on the Fund’s actual expense ratio, and an assumed rate of return of 5% per year before expenses, which is not the actual return. The hypothetical account values and expenses may not be used to estimate the actual ending account balance or expenses you paid for the period. You may use this information to compare the ongoing costs of investing in the Fund and other funds. To do so, compare this 5% hypothetical example with the 5% hypothetical examples that appear in the shareholder reports of the other funds.
Please note that the expenses shown in the table are meant to highlight your ongoing costs only and do not reflect any charges associated with the separate accounts that offer this Fund. Therefore, the “hypothetical” lines of the table are useful in comparing ongoing costs only, and will not help you determine the relative total costs of owning different funds. In addition, if these separate account charges were included your costs would have been higher.
| | | | | | | | | | | | |
| Actual | | Beginning
Account
Value
July 1, 2018 | | | Ending
Account
Value
December 31, 2018 | | | Expenses
Paid During
6 Months Ended
December 31, 2018 | |
| | | |
| | | $ | 1,000.00 | | | $ | 1,008.10 | | | $ | 2.53 | |
| | | |
Hypothetical | | | | | | | | | | | | |
(5% return before expenses) | | | | | | | | | | | | |
| | | |
| | | | 1,000.00 | | | | 1,022.68 | | | | 2.55 | |
Expenses are equal to the Fund’s annualized expense ratio, multiplied by the average account value over the period, multiplied by 184/365 (to reflect theone-half year period). This annualized expense ratio, excluding indirect expenses from affiliated funds, based on the6-month period ended December 31, 2018 is as follows:
The expense ratio reflects voluntary and/or contractual waivers and/or reimbursements of expenses by the Fund’s Manager. Some of these undertakings may be modified or terminated at any time, as indicated in the Fund’s prospectus. The “Financial Highlights” table in the Fund’s financial statements, included in this report, also shows the gross expense ratio, without such waivers or reimbursements and reduction to custodian expenses, if applicable.
4 OPPENHEIMER GOVERNMENT MONEY FUND/VA
STATEMENT OF INVESTMENTSDecember 31, 2018
| | | | | | | | | | | | | | | | |
| | | | | | Final Legal Maturity | | | Principal | | | | |
| | | Maturity Date* | | | Date** | | | Amount | | | Value | |
U.S. Government Agencies—30.8% | | | | | | | | | | | | | |
Federal Farm Credit Bank: | | | | | | | | | | | | | | | | |
2.186%1 | | | 4/3/19 | | | | 4/3/19 | | | $ | 2,000,000 | | | $ | 1,989,062 | |
2.252%1 | | | 2/21/19 | | | | 2/21/19 | | | | 1,000,000 | | | | 996,869 | |
2.252%[US0001M-13.5]2 | | | 1/8/19 | | | | 3/8/19 | | | | 5,000,000 | | | | 4,999,867 | |
2.256%[US0003M-18]2 | | | 1/15/19 | | | | 10/15/19 | | | | 9,500,000 | | | | 9,498,845 | |
2.265%1 | | | 3/11/19 | | | | 3/11/19 | | | | 500,000 | | | | 497,873 | |
2.276%1 | | | 3/19/19 | | | | 3/19/19 | | | | 500,000 | | | | 497,615 | |
2.30%1 | | | 1/23/19 | | | | 1/23/19 | | | | 25,000,000 | | | | 24,965,014 | |
2.302%[US0001M-8.5]2 | | | 1/9/19 | | | | 7/9/19 | | | | 1,000,000 | | | | 999,955 | |
2.304%[US0001M-7.5]2 | | | 1/5/19 | | | | 11/5/19 | | | | 5,000,000 | | | | 4,999,776 | |
2.311%[US0001M-11]2 | | | 1/12/19 | | | | 3/12/19 | | | | 1,000,000 | | | | 999,994 | |
2.325%1 | | | 1/22/19 | | | | 1/22/19 | | | | 25,000,000 | | | | 24,966,167 | |
2.325%1 | | | 1/16/19 | | | | 1/16/19 | | | | 25,000,000 | | | | 24,975,833 | |
2.347%1 | | | 1/29/19 | | | | 1/29/19 | | | | 25,000,000 | | | | 24,954,500 | |
2.376%[US0001M-13]2 | | | 1/27/19 | | | | 3/27/19 | | | | 1,000,000 | | | | 999,942 | |
2.38% [FCPRDLY-312]2 | | | 1/2/19 | | | | 1/2/19 | | | | 4,500,000 | | | | 4,499,994 | |
2.38%1 | | | 2/14/19 | | | | 2/14/19 | | | | 20,000,000 | | | | 19,942,067 | |
2.38%[US0001M-6]2 | | | 1/14/19 | | | | 8/14/19 | | | | 3,000,000 | | | | 2,999,963 | |
2.421%1 | | | 6/14/19 | | | | 6/14/19 | | | | 3,000,000 | | | | 2,967,610 | |
2.43% [FCPRDLY-307]2 | | | 1/2/19 | | | | 2/20/19 | | | | 1,000,000 | | | | 999,993 | |
2.441%[US0001M-6.5]2 | | | 1/28/19 | | | | 3/28/19 | | | | 2,000,000 | | | | 2,000,000 | |
2.481%1 | | | 8/12/19 | | | | 8/12/19 | | | | 1,000,000 | | | | 985,009 | |
2.722%1 | | | 10/4/19 | | | | 10/4/19 | | | | 2,000,000 | | | | 1,959,367 | |
5.125% | | | 3/25/19 | | | | 3/25/19 | | | | 1,450,000 | | | | 1,459,002 | |
Federal Home Loan Bank: | | | | | | | | | | | | | | | | |
1.125% | | | 6/21/19 | | | | 6/21/19 | | | | 6,000,000 | | | | 5,960,190 | |
1.25% | | | 1/16/19 | | | | 1/16/19 | | | | 1,000,000 | | | | 999,655 | |
1.375% | | | 3/18/19 | | | | 3/18/19 | | | | 2,000,000 | | | | 1,996,669 | |
2.07%[US0003M-34]2 | | | 1/9/19 | | | | 4/9/19 | | | | 1,000,000 | | | | 1,000,000 | |
2.09%[US0003M-32]2 | | | 1/9/19 | | | | 4/9/19 | | | | 6,000,000 | | | | 5,997,665 | |
2.115%[US0003M-40.5]2 | | | 1/30/19 | | | | 1/30/19 | | | | 1,000,000 | | | | 1,000,000 | |
2.16%[US0003M-26]2 | | | 1/11/19 | | | | 10/11/19 | | | | 5,000,000 | | | | 4,996,615 | |
2.166%1 | | | 3/28/19 | | | | 3/28/19 | | | | 1,000,000 | | | | 994,936 | |
2.209%[US0001M-14]2 | | | 1/2/19 | | | | 1/2/19 | | | | 1,000,000 | | | | 1,000,000 | |
2.232%[US0001M-11.5]2 | | | 1/4/19 | | | | 6/4/19 | | | | 6,165,000 | | | | 6,163,790 | |
2.25%1 | | | 1/7/19 | | | | 1/7/19 | | | | 4,000,000 | | | | 3,998,507 | |
2.255%1 | | | 1/3/19 | | | | 1/3/19 | | | | 25,000,000 | | | | 24,996,875 | |
2.262%1 | | | 1/10/19 | | | | 1/10/19 | | | | 4,000,000 | | | | 3,997,750 | |
2.263%1 | | | 1/2/19 | | | | 1/2/19 | | | | 15,000,000 | | | | 14,999,060 | |
2.266%1 | | | 1/15/19 | | | | 1/15/19 | | | | 36,300,000 | | | | 36,268,103 | |
2.284%1 | | | 1/16/19 | | | | 1/16/19 | | | | 22,090,000 | | | | 22,069,098 | |
2.29%[US0001M-9]2 | | | 1/6/19 | | | | 4/5/19 | | | | 2,000,000 | | | | 2,000,000 | |
2.29%1 | | | 1/29/19 | | | | 1/29/19 | | | | 4,000,000 | | | | 3,992,922 | |
2.29%1 | | | 1/4/19 | | | | 1/4/19 | | | | 50,000,000 | | | | 49,990,478 | |
2.297%1 | | | 2/12/19 | | | | 2/12/19 | | | | 4,000,000 | | | | 3,989,360 | |
2.299%1 | | | 1/22/19 | | | | 1/22/19 | | | | 4,000,000 | | | | 3,994,668 | |
2.305%1 | | | 1/18/19 | | | | 1/18/19 | | | | 2,947,000 | | | | 2,943,808 | |
2.307%1 | | | 1/11/19 | | | | 1/11/19 | | | | 23,400,000 | | | | 23,385,056 | |
2.307%1 | | | 1/8/19 | | | | 1/8/19 | | | | 30,000,000 | | | | 29,986,583 | |
2.309%1 | | | 1/23/19 | | | | 1/23/19 | | | | 6,915,000 | | | | 6,905,293 | |
2.31%1 | | | 1/9/19 | | | | 1/9/19 | | | | 38,000,000 | | | | 37,980,545 | |
2.312%1 | | | 1/14/19 | | | | 1/14/19 | | | | 50,000,000 | | | | 49,958,382 | |
2.318%1 | | | 2/14/19 | | | | 2/14/19 | | | | 4,000,000 | | | | 3,988,756 | |
2.33%1 | | | 1/25/19 | | | | 1/25/19 | | | | 14,000,000 | | | | 13,978,367 | |
2.33%1 | | | 1/30/19 | | | | 1/30/19 | | | | 13,000,000 | | | | 12,975,738 | |
2.33%[US0001M-7]2 | | | 1/11/19 | | | | 2/11/19 | | | | 1,045,000 | | | | 1,045,007 | |
2.336%1 | | | 2/1/19 | | | | 2/1/19 | | | | 4,997,000 | | | | 4,987,004 | |
2.337%1 | | | 3/20/19 | | | | 3/20/19 | | | | 2,000,000 | | | | 1,989,990 | |
2.351%1 | | | 1/17/19 | | | | 1/17/19 | | | | 18,800,000 | | | | 18,780,406 | |
2.352%1 | | | 2/6/19 | | | | 2/6/19 | | | | 19,150,000 | | | | 19,105,226 | |
2.353%1 | | | 3/15/19 | | | | 3/15/19 | | | | 4,000,000 | | | | 3,981,101 | |
2.361%1 | | | 3/7/19 | | | | 3/7/19 | | | | 4,000,000 | | | | 3,983,100 | |
2.371%[US0001M-13.5]2 | | | 1/28/19 | | | | 2/28/19 | | | | 3,000,000 | | | | 3,000,000 | |
2.374%1 | | | 2/13/19 | | | | 2/13/19 | | | | 25,000,000 | | | | 24,929,528 | |
2.376%[US0001M-13]2 | | | 1/25/19 | | | | 1/25/19 | | | | 2,000,000 | | | | 2,000,000 | |
2.376%[US0001M-13]2 | | | 1/25/19 | | | | 2/25/19 | | | | 4,000,000 | | | | 4,000,025 | |
5 OPPENHEIMER GOVERNMENT MONEY FUND/VA
STATEMENT OF INVESTMENTSContinued
| | | | | | | | | | | | | | | | |
| | | | | | Final Legal Maturity | | | Principal | | | | |
| | | Maturity Date* | | | Date** | | | Amount | | | Value | |
U.S. Government Agencies (Continued) | | | | | | | | | | | | | |
Federal Home Loan Bank: (Continued) | | | | | | | | | | | | | |
2.377%1 | | | 2/8/19 | | | | 2/8/19 | | | $ | 5,875,000 | | | $ | 5,860,344 | |
2.38%1 | | | 2/20/19 | | | | 2/20/19 | | | | 22,750,000 | | | | 22,675,258 | |
2.381%1 | | | 3/18/19 | | | | 3/18/19 | | | | 7,000,000 | | | | 6,965,124 | |
2.382%1 | | | 2/22/19 | | | | 2/22/19 | | | | 18,000,000 | | | | 17,938,452 | |
2.386%[US0001M-12]2 | | | 1/25/19 | | | | 3/25/19 | | | | 3,000,000 | | | | 2,999,721 | |
2.389%1 | | | 2/15/19 | | | | 2/15/19 | | | | 20,076,000 | | | | 20,016,381 | |
2.39%[US0001M-13]2 | | | 1/2/19 | | | | 3/1/19 | | | | 1,000,000 | | | | 1,000,000 | |
2.39%[US0001M-6.5]2 | | | 1/17/19 | | | | 10/17/19 | | | | 2,000,000 | | | | 2,000,000 | |
2.391%[US0001M-11.5]2 | | | 1/26/19 | | | | 4/26/19 | | | | 3,000,000 | | | | 3,000,000 | |
2.394%[US0001M-11]2 | | | 1/22/19 | | | | 4/22/19 | | | | 2,000,000 | | | | 1,999,891 | |
2.394%[US0001M-11]2 | | | 1/22/19 | | | | 2/22/19 | | | | 2,000,000 | | | | 1,999,993 | |
2.399%[US0001M-10.5]2 | | | 1/24/19 | | | | 7/24/19 | | | | 1,000,000 | | | | 1,000,000 | |
2.401%[US0001M-10.5]2 | | | 1/28/19 | | | | 5/28/19 | | | | 3,000,000 | | | | 2,999,961 | |
2.401%[US0001M-10.5]2 | | | 1/26/19 | | | | 5/24/19 | | | | 1,000,000 | | | | 1,000,000 | |
2.401%[US0001M-10.5]2 | | | 1/26/19 | | | | 7/26/19 | | | | 10,000,000 | | | | 10,000,000 | |
2.401%[US0001M-10.5]2 | | | 1/27/19 | | | | 8/27/19 | | | | 4,000,000 | | | | 4,000,000 | |
2.408%1 | | | 4/10/19 | | | | 4/10/19 | | | | 4,000,000 | | | | 3,973,820 | |
2.41%[US0001M-11]2 | | | 1/2/19 | | | | 2/1/19 | | | | 3,000,000 | | | | 3,000,000 | |
2.414%1 | | | 3/13/19 | | | | 3/13/19 | | | | 4,000,000 | | | | 3,981,067 | |
2.414%1,3 | | | 1/28/19 | | | | 1/28/19 | | | | 7,000,000 | | | | 6,987,816 | |
2.426%[US0001M-8]2 | | | 1/26/19 | | | | 9/26/19 | | | | 3,000,000 | | | | 3,000,000 | |
2.429%1 | | | 4/12/19 | | | | 4/12/19 | | | | 4,000,000 | | | | 3,973,067 | |
2.446%[US0001M-6]2 | | | 1/26/19 | | | | 4/26/19 | | | | 1,000,000 | | | | 1,000,000 | |
2.452%[US0003M-34.5]2 | | | 1/2/19 | | | | 4/1/19 | | | | 1,000,000 | | | | 999,572 | |
2.459%[US0001M-4.5]2 | | | 1/20/19 | | | | 6/20/19 | | | | 13,000,000 | | | | 13,000,000 | |
2.48%1 | | | 5/3/19 | | | | 5/3/19 | | | | 4,000,000 | | | | 3,966,789 | |
2.484%1 | | | 5/6/19 | | | | 5/6/19 | | | | 4,000,000 | | | | 3,965,972 | |
2.507%1 | | | 5/10/19 | | | | 5/10/19 | | | | 2,000,000 | | | | 1,982,255 | |
2.618%[US0003M-19.5]2 | | | 3/28/19 | | | | 6/28/19 | | | | 5,000,000 | | | | 5,000,000 | |
2.632%[US0003M-16]2 | | | 3/20/19 | | | | 6/20/19 | | | | 5,000,000 | | | | 5,000,428 | |
Federal Home Loan Mortgage Corp., 1.125% | | | 4/15/19 | | | | 4/15/19 | | | | 3,526,000 | | | | 3,513,258 | |
Federal National Mortgage Assn.: | | | | | | | | | | | | | | | | |
1.00% | | | 2/26/19 | | | | 2/26/19 | | | | 4,790,000 | | | | 4,780,563 | |
1.875% | | | 2/19/19 | | | | 2/19/19 | | | | 3,150,000 | | | | 3,147,926 | |
2.237%1 | | | 1/7/19 | | | | 1/7/19 | | | | 20,100,000 | | | | 20,092,530 | |
2.26%1 | | | 1/2/19 | | | | 1/2/19 | | | | 50,000,000 | | | | 49,996,861 | |
2.301%1 | | | 1/23/19 | | | | 1/23/19 | | | | 5,500,000 | | | | 5,492,303 | |
2.54% [SOFRRATE+8]2 | | | 1/2/19 | | | | 1/30/19 | | | | 5,000,000 | | | | 5,000,000 | |
2.58% [SOFRRATE+12]2 | | | 1/2/19 | | | | 7/30/19 | | | | 6,000,000 | | | | 6,000,000 | |
Freddie Mac, 2.446%1 | | | 4/17/19 | | | | 4/17/19 | | | | 4,000,000 | | | | 3,971,510 | |
Tennessee Valley Authority: | | | | | | | | | | | | | | | | |
2.323%1 | | | 1/2/19 | | | | 1/2/19 | | | | 9,000,000 | | | | 8,999,420 | |
2.33%1 | | | 1/8/19 | | | | 1/8/19 | | | | 12,000,000 | | | | 11,994,575 | |
2.37%1 | | | 1/22/19 | | | | 1/22/19 | | | | 20,000,000 | | | | 19,972,408 | |
| | | | | | | | | | | | | | | | |
Total U.S. Government Agencies (Cost $942,711,838) | | | | | | | | | | | | | | | 942,711,838 | |
| | | | | | | | | | | | | | | | |
| | | | | | | | | | | | | | | | |
Repurchase Agreements—66.6% | | | | | | | | | | | | | | | | |
Repurchase Agreements4(Cost $2,034,100,000) | | | | | | | | | | | 2,034,100,000 | | | | 2,034,100,000 | |
| | | | |
| | | | | | | | | Shares | | | | |
Investment Company—0.5% | | | | | | | | | | | | | | | | |
Oppenheimer Institutional Government Money Market Fund, Cl. E, 2.35%5,6(Cost $15,554,790) | | | | 15,554,790 | | | | 15,554,790 | |
Total Investments, at Value (Cost $2,992,366,628) | | | | | | | | | | | 97.9% | | | | 2,992,366,628 | |
Net Other Assets (Liabilities) | | | | | | | | | | | 2.1 | | | | 63,358,947 | |
| | | | | | | | | | | | |
Net Assets | | | | | | | | | | | 100.0% | | | $ | 3,055,725,575 | |
| | | | | | | | | | | | |
Footnotes to Statement of Investments
Short-term notes and direct bank obligations are generally traded on a discount basis; the interest rate shown is the discount rate received by the Fund at the time of purchase. Other securities normally bear interest at the rates shown.
6 OPPENHEIMER GOVERNMENT MONEY FUND/VA
Footnotes to Statement of Investments(Continued)
* The Maturity Date represents the date used to calculate the Fund’s weighted average maturity as determined under Rule2a-7.
** If different from the Maturity Date, the Final Legal Maturity Date includes any maturity date extensions which may be affected at the option of the issuer or unconditional payments of principal by the issuer which may be affected at the option of the Fund, and represents the date used to calculate the Fund’s weighted average life as determined under Rule2a-7.
1. Zero coupon bond reflects effective yield on the original acquisition date.
2. Represents the current interest rate for a variable or increasing rate security, determined as [Referenced Rate + Basis-point spread].
3. All or a portion of the security position is when-issued or delayed delivery to be delivered and settled after period end. See Note 4 of the accompanying Notes.
4. Repurchase agreements:
| | | | | | | | | | | | | | | | | | | | | | | | | | | | | | |
| Counterparty | | Lending
Rate | | | Settlement
Date | | | Maturity
Date | | | Principal
Amount | | | Collateralized By | | Collateral
Received, at
Valuea | | | Repurchase
Agreements, at Value | | | Repurchase
Agreement
Proceeds to be
Receiveda | |
| Amherst Pierpont Securities LLC | | | 2.63% | | | | 12/31/18 | | | | 1/9/19 | | | | $64,000,000 | | | U.S. Treasury Nts., 2.75%, 7/31/23 and U.S. Government Agency Mortgages, 4.00%, 11/15/46 | | | $(70,439,886) | | | | $64,000,000 | | | | $64,042,124 | |
| ASL Capital Markets Inc. | | | 3.00 | | | | 12/31/18 | | | | 1/2/19 | | | | 473,000,000 | | | U.S. Treasury Bonds,2.75%-3.625%, 8/15/42- 8/15/48 and U.S. Treasury Nts.,1.625%-2.75%,4/30/23-5/15/26 | | | (482,540,479) | | | | 473,000,000 | | | | 473,078,901 | |
| Cantor Fitzgerald Secured, LLC | | | 3.05 | | | | 12/31/18 | | | | 1/2/19 | | | | 473,000,000 | | | U.S. Government Agency Mortgages, 3.00%- 8.00%,5/1/26-2/1/56 | | | (482,541,790) | | | | 473,000,000 | | | | 473,080,186 | |
| Credit Agricole Corp. & Investment Bank | | | 3.00 | | | | 12/31/18 | | | | 1/2/19 | | | | 10,000,000 | | | U.S. Government Agency Mortgages, 4.00%, 8/1/48 | | | (10,201,700) | | | | 10,000,000 | | | | 10,001,667 | |
| Deutsche Bank Securities, Inc. | | | 2.45 | | | | 12/26/18 | | | | 1/2/19 | | | | 54,000,000 | | | U.S. Government Agency Mortgages, 3.00%, 1/15/56 | | | (59,428,298) | | | | 54,000,000 | | | | 54,025,726 | |
| Deutsche Bank Securities, Inc. | | | 2.45 | | | | 12/14/18 | | | | 1/14/19 | | | | 40,000,000 | | | U.S. Government Agency Mortgages, 3.00%- 3.25%,3/15/50-1/15/56 | | | (44,056,895) | | | | 40,000,000 | | | | 40,051,722 | |
| Deutsche Bank Securities, Inc. | | | 2.95 | | | | 12/31/18 | | | | 1/2/19 | | | | 100,000,000 | | | U.S. Government Agency Mortgages, 3.00%, 1/15/56 | | | (110,018,028) | | | | 100,000,000 | | | | 100,016,389 | |
| INTL FCStone Financial, Inc. | | | 2.50 | | | | 12/26/18 | | | | 1/2/19 | | | | 76,000,000 | | | U.S. Treasury Bills, 0.00%,2/14/19-12/5/19; U.S. Treasury Nts.,1.00%-3.125%,3/15/19-11/15/28 and U.S. Government Agency Mortgages, 2.50%- 8.50%,3/1/19-12/1/48 | | | (77,783,203) | | | | 76,000,000 | | | | 76,036,973 | |
| INTL FCStone Financial, Inc. | | | 2.80 | | | | 12/31/18 | | | | 1/7/19 | | | | 10,000,000 | | | U.S. Government Agency Mortgages, 2.50%- 5.50%,2/1/28-12/1/48 | | | (10,216,407) | | | | 10,000,000 | | | | 10,016,085 | |
| RBC Dominion Securities, Inc. | | | 2.97 | | | | 12/31/18 | | | | 1/2/19 | | | | 300,000,000 | | | U.S. Treasury Bills, 0.00%,1/15/19-11/7/19; U.S. Treasury Bonds,1.75%-4.50%,1/15/28-11/15/47; U.S. Treasury Nts.,0.125%-3.00%, 4/30/19- 5/15/28 and U.S. Government Agency Mortgages,3.00%-5.00%,7/15/39-9/1/48 | | | (306,050,490) | | | | 300,000,000 | | | | 300,049,500 | |
| Royal Bank of Canada | | | 2.95 | | | | 12/31/18 | | | | 1/2/19 | | | | 14,100,000 | | | U.S. Government Agency Mortgages, 3.058%- 5.00%,6/1/47-6/1/51 | | | (14,384,357) | | | | 14,100,000 | | | | 14,102,311 | |
| South Street Securities LLC | | | 2.53 | | | | 12/27/18 | | | | 1/3/19 | | | | 20,000,000 | | | U.S. Government Agency Mortgages, 2.50%- 5.905%,11/1/19-9/1/48 | | | (20,408,602) | | | | 20,000,000 | | | | 20,008,433 | |
| South Street Securities LLC | | | 2.62 | | | | 12/31/18 | | | | 1/7/19 | | | | 20,000,000 | | | U.S. Government Agency Mortgages, 1.973%- 5.50%,6/1/19-9/1/48 | | | (20,402,969) | | | | 20,000,000 | | | | 20,002,911 | |
| South Street Securities LLC | | | 2.95 | | | | 12/31/18 | | | | 1/2/19 | | | | 366,000,000 | | | U.S. Treasury Nts., 0.625%, 4/15/23 and U.S. Government Agency Mortgages,1.75%-6.00%,5/1/20-2/15/60 | | | (373,381,236) | | | | 366,000,000 | | | | 366,060,035 | |
| TD Securities (USA) LLC | | | 3.00 | | | | 12/31/18 | | | | 1/2/19 | | | | 14,000,000 | | | U.S. Government Agency Mortgages, 3.50%, 7/1/48 | | | (14,282,380) | | | | 14,000,000 | | | | 14,002,333 | |
| | | | | | | | | | | | | | | | | | | | | | |
| | | | | | | | | | | | | | | | | | | | | $(2,096,136,720) | | | | $2,034,100,000 | | | | $2,034,575,296 | |
| | | | | | | | | | | | | | | | | | | | | | |
a.Includes accrued interest.
5. Rate shown is the7-day yield at period end.
6. Is or was an affiliate, as defined in the Investment Company Act of 1940, as amended, at or during the reporting period, by virtue of the Fund owning at least 5% of the voting securities of the issuer or as a result of the Fund and the issuer having the same investment adviser. Transactions during the reporting period in which the issuer was an affiliate are as follows:
| | | | | | | | | | | | | | | | |
| | | Shares
December 31, 2017 | | | Gross Additions | | | Gross
Reductions | | | Shares
December 31, 2018 | |
Investment Company | | | | | | | | | | | | | | | | |
| Oppenheimer Institutional Government Money Market Fund, Cl. E | | | 15,295,885 | | | | 258,905 | | | | — | | | | 15,554,790 | |
| | | | |
| | | Value | | | Income | | | Realized
Gain (Loss) | | | Change in Unrealized
Gain (Loss) | |
Investment Company | | | | | | | | | | | | | | | | |
| Oppenheimer Institutional Government Money Market Fund, Cl. E | | $ | 15,554,790 | | | $ | 273,851 | | | $ | — | | | $ | — | |
| | |
Glossary: | | |
Definitions | | |
FCPR DLY | | Federal Reserve Bank Prime Loan Rate US Daily |
7 OPPENHEIMER GOVERNMENT MONEY FUND/VA
STATEMENT OF INVESTMENTSContinued
| | |
Definitions (Continued) |
ICE LIBOR | | Intercontinental Exchange London Interbank Offered Rate |
SOFRRATE | | United States Secured Overnight Financing Rate |
US0001M | | ICE LIBOR USD 1 Month |
US0003M | | ICE LIBOR USD 3 Month |
See accompanying Notes to Financial Statements.
8 OPPENHEIMER GOVERNMENT MONEY FUND/VA
STATEMENT OF ASSETS AND LIABILITIESDecember 31, 2018
| | | | |
| |
Assets | | | | |
Investments, at value—see accompanying statement of investments: | | | | |
Unaffiliated companies (cost $942,711,838) | | $ | 942,711,838 | |
Affiliated companies (cost $15,554,790) | | | 15,554,790 | |
Repurchase agreements (cost $2,034,100,000) | | | 2,034,100,000 | |
| | | | |
| | | 2,992,366,628 | |
| |
Cash | | | 50,039 | |
| |
Receivables and other assets: | | | | |
Shares of beneficial interest sold | | | 72,047,436 | |
Interest and dividends | | | 641,925 | |
Other | | | 92,897 | |
| | | | |
Total assets | | | 3,065,198,925 | |
| |
Liabilities | | | | |
Payables and other liabilities: | | | | |
Investments purchased on a when-issued or delayed delivery basis | | | 6,987,816 | |
Dividends | | | 2,368,082 | |
Trustees’ compensation | | | 69,474 | |
Shareholder communications | | | 12,577 | |
Shares of beneficial interest redeemed | | | 4,668 | |
Other | | | 30,733 | |
| | | | |
Total liabilities | | | 9,473,350 | |
| |
Net Assets | | $ | 3,055,725,575 | |
| | | | |
|
| |
Composition of Net Assets | | | | |
Par value of shares of beneficial interest | | $ | 3,055,700 | |
| |
Additionalpaid-in capital | | | 3,052,710,785 | |
| |
Total accumulated loss | | | (40,910) | |
| | | | |
Net Assets—applicable to 3,055,700,242 shares of beneficial interest outstanding | | $ | 3,055,725,575 | |
| | | | |
|
| |
Net Asset Value, Redemption Price Per Share and Offering Price Per Share | | | $1.00 | |
See accompanying Notes to Financial Statements.
9 OPPENHEIMER GOVERNMENT MONEY FUND/VA
STATEMENT OF OPERATIONSFor the Year Ended December 31, 2018
| | | | |
| |
Investment Income | | | | |
Interest | | $ | 19,093,791 | |
| |
Dividends from affiliated companies | | | 273,851 | |
| | | | |
Total investment income | | | 19,367,642 | |
|
| |
Expenses | | | | |
Management fees | | | 3,999,278 | |
| |
Transfer and shareholder servicing agent fees | | | 1,131,274 | |
| |
Shareholder communications | | | 53,693 | |
| |
Trustees’ compensation | | | 54,522 | |
| |
Custodian fees and expenses | | | 7,883 | |
| |
Other | | | 89,857 | |
| | | | |
Total expenses | | | 5,336,507 | |
Less reduction to custodian expenses | | | (693) | |
Less waivers and reimbursements of expenses | | | (622,171) | |
| | | | |
Net expenses | | | 4,713,643 | |
| |
Net Investment Income | | | 14,653,999 | |
| |
Realized Gain on Investment Transactions in Unaffiliated Companies | | | 155 | |
| |
Net Increase in Net Assets Resulting from Operations | | $ | 14,654,154 | |
| | | | |
See accompanying Notes to Financial Statements.
10 OPPENHEIMER GOVERNMENT MONEY FUND/VA
STATEMENTS OF CHANGES IN NET ASSETS
| | | | | | | | |
| | | Year Ended
December 31, 2018 | | | Year Ended
December 31, 20171 | |
| |
Operations | | | | | | | | |
Net investment income | | $ | 14,653,999 | | | $ | 1,902,800 | |
| |
Net realized gain (loss) | | | 155 | | | | (366) | |
| | | | |
Net increase in net assets resulting from operations | | | 14,654,154 | | | | 1,902,434 | |
|
| |
Dividends and/or Distributions to Shareholders | | | | | | | | |
Dividends and distributions declared | | | (14,654,285) | | | | (1,903,588) | |
|
| |
Beneficial Interest Transactions | | | | | | | | |
Net increase (decrease) in net assets resulting from beneficial interest transactions | | | 2,630,121,422 | | | | (116,364,487) | |
|
| |
Net Assets | | | | | | | | |
Total increase (decrease) | | | 2,630,121,291 | | | | (116,365,641) | |
| |
Beginning of period | | | 425,604,284 | | | | 541,969,925 | |
| | | | |
End of period | | $ | 3,055,725,575 | | | $ | 425,604,284 | |
| | | | |
1.Prior period amounts have been conformed to current year presentation. See Notes to Financial Statements, Note 2 — New Accounting Pronouncements for further details.
See accompanying Notes to Financial Statements.
11 OPPENHEIMER GOVERNMENT MONEY FUND/VA
FINANCIAL HIGHLIGHTS
| | | | | | | | | | | | | | | | | | | | |
| | | Year Ended
December 31,
2018 | | | Year Ended
December 31,
2017 | | | Year Ended
December 31,
2016 | | | Year Ended
December 31,
2015 | | | Year Ended
December 31,
2014 | |
| |
Per Share Operating Data | | | | | | | | | | | | | | | | | | | | |
Net asset value, beginning of period | | | $1.00 | | | | $1.00 | | | | $1.00 | | | | $1.00 | | | | $1.00 | |
| |
Income (loss) from investment operations: | | | | | | | | | | | | | | | | | | | | |
Net investment income1 | | | 0.01 | | | | 0.002 | | | | 0.002 | | | | 0.002 | | | | 0.002 | |
Net realized and unrealized gain (loss) | | | 0.002 | | | | (0.00)2 | | | | (0.00)2 | | | | 0.002 | | | | 0.002 | |
| | | | |
Total from investment operations | | | 0.01 | | | | 0.002 | | | | 0.002 | | | | 0.002 | | | | 0.002 | |
| |
Dividends and/or distributions to shareholders: | | | | | | | | | | | | | | | | | | | | |
Dividends from net investment income | | | (0.01) | | | | (0.00)2 | | | | (0.00)2 | | | | (0.00)2 | | | | (0.00)2 | |
| |
Net asset value, end of period | | | $1.00 | | | | $1.00 | | | | $1.00 | | | | $1.00 | | | | $1.00 | |
| | | | |
| | | | | | | | | | | | | | | | | | | | |
| |
Total Return, at Net Asset Value3 | | | 1.35% | | | | 0.39% | | | | 0.01% | | | | 0.01% | | | | 0.01% | |
| | | | | | | | | | | | | | | | | | | | |
| |
| | | | | | | | | | | | | | | | | | | | |
Ratios/Supplemental Data | | | | | | | | | | | | | | | | | | | | |
Net assets, end of period (in thousands) | | | $3,055,726 | | | | $425,604 | | | | $541,970 | | | | $2,648,636 | | | | $515,297 | |
| |
Average net assets (in thousands) | | | $952,018 | | | | $488,532 | | | | $1,470,447 | | | | $1,144,581 | | | | $329,045 | |
| |
Ratios to average net assets:4 | | | | | | | | | | | | | | | | | | | | |
Net investment income | | | 1.54% | | | | 0.39% | | | | 0.01% | | | | 0.01% | | | | 0.01% | |
Total expenses5 | | | 0.56% | | | | 0.59% | | | | 0.55% | | | | 0.53% | | | | 0.57% | |
| Expenses after payments, waivers and/or reimbursements and reduction to custodian expenses | | | 0.50% | | | | 0.50% | | | | 0.35% | | | | 0.19% | | | | 0.15% | |
1. Per share amounts calculated based on the average shares outstanding during the period.
2. Less than $0.005 per share.
3. Assumes an initial investment on the business day before the first day of the fiscal period, with all dividends and distributions reinvested in additional shares on the reinvestment date, and redemption at the net asset value calculated on the last business day of the fiscal period. Total returns are not annualized for periods less than one full year. Total return information does not reflect expenses that apply at the separate account level or to related insurance products. Inclusion of these charges would reduce the total return figures for all periods shown. Returns do not reflect the deduction of taxes that a shareholder would pay on fund distributions or the redemption of fund shares.
4. Annualized for periods less than one full year.
5. Total expenses including indirect expenses from affiliated fund fees and expenses were as follows:
| | | | | | |
| | Year Ended December 31, 2018 | | | 0.56 | % |
| | Year Ended December 31, 2017 | | | 0.59 | % |
| | Year Ended December 31, 2016 | | | 0.55 | % |
| | Year Ended December 31, 2015 | | | 0.53 | % |
| | Year Ended December 31, 2014 | | | 0.57 | % |
See accompanying Notes to Financial Statements.
12 OPPENHEIMER GOVERNMENT MONEY FUND/VA
NOTES TO FINANCIAL STATEMENTSDecember 31, 2018
1. Organization
Oppenheimer Government Money Fund/VA (the “Fund”), a separate series of Oppenheimer Variable Account Funds, is a diversifiedopen-end management investment company registered under the Investment Company Act of 1940 (“1940 Act”), as amended. The Fund’s investment objective is to seek income consistent with stability of principal. The Fund’s investment adviser is OFI Global Asset Management, Inc. (“OFI Global” or the “Manager”), a wholly-owned subsidiary of OppenheimerFunds, Inc. (“OFI” or the“Sub-Adviser”). The Manager has entered into asub-advisory agreement with OFI. Shares of the Fund are sold only to separate accounts of life insurance companies.
The following is a summary of significant accounting policies followed in the Fund’s preparation of financial statements in accordance with accounting principles generally accepted in the United States (“U.S. GAAP”).
2. Significant Accounting Policies
Security Valuation.All investments in securities are recorded at their estimated fair value, as described in Note 3.
Dividends and Distributions to Shareholders.Dividends and distributions to shareholders, which are determined in accordance with income tax regulations and may differ from U.S. GAAP, are recorded on theex-dividend date. Income distributions, if any, are declared daily and paid monthly. Capital gain distributions, if any, are declared and paid annually but may be paid at other times to maintain the net asset value per share at $1.00.
Investment Income.Dividend income is recorded on theex-dividend date or uponex-dividend notification in the case of certain foreign dividends where theex-dividend date may have passed.Non-cash dividends included in dividend income, if any, are recorded at the fair value of the securities received. Withholding taxes on foreign dividends, if any, and capital gains taxes on foreign investments, if any, have been provided for in accordance with the Fund’s understanding of the applicable tax rules and regulations. Interest income, if any, is recognized on an accrual basis. Discount and premium, which are included in interest income on the Statement of Operations, are amortized or accreted daily.
Custodian Fees. “Custodian fees and expenses” in the Statement of Operations may include interest expense incurred by the Fund on any cash overdrafts of its custodian account during the period. Such cash overdrafts may result from the effects of failed trades in portfolio securities and from cash outflows resulting from unanticipated shareholder redemption activity. The Fund pays interest to its custodian on such cash overdrafts, to the extent they are not offset by positive cash balances maintained by the Fund, at a rate equal to the Federal Funds Rate plus 2.00%. The “Reduction to custodian expenses” line item, if applicable, represents earnings on cash balances maintained by the Fund during the period. Such interest expense and other custodian fees may be paid with these earnings.
Security Transactions. Security transactions are recorded on the trade date. Realized gains and losses on securities sold are determined on the basis of identified cost.
Indemnifications.The Fund’s organizational documents provide current and former Trustees and officers with a limited indemnification against liabilities arising in connection with the performance of their duties to the Fund. In the normal course of business, the Fund may also enter into contracts that provide general indemnifications. The Fund’s maximum exposure under these arrangements is unknown as this would be dependent on future claims that may be made against the Fund. The risk of material loss from such claims is considered remote.
Federal Taxes.The Fund intends to comply with provisions of the Internal Revenue Code applicable to regulated investment companies and to distribute substantially all of its investment company taxable income to shareholders. Therefore, no federal income or excise tax provision is required. The Fund files income tax returns in U.S. federal and applicable state jurisdictions. The statute of limitations on the Fund’s tax return filings generally remains open for the three preceding fiscal reporting period ends. The Fund has analyzed its tax positions for the fiscal year ended December 31, 2018, including open tax years, and does not believe there are any uncertain tax positions requiring recognition in the Fund’s financial statements.
The tax components of capital shown in the following table represent distribution requirements the Fund must satisfy under the income tax regulations, losses the Fund may be able to offset against income and gains realized in future years for federal income tax purposes.
| | | | | | | | |
Undistributed
Net Investment
Income | | Undistributed
Long-Term
Gain | | | Accumulated
Loss
Carryforward1,2,3 | |
| $2,399,703 | | | $— | | | | $426 | |
1.At period end, the Fund had $426 of net capital loss carryforwards available to offset future realized capital gains, if any, and thereby reduce future taxable gain distributions.
2. During the reporting period, the Fund did not utilize any capital loss carryforwards.
3. During the previous reporting period, the Fund did not utilize any capital loss carryforwards.
Net investment income (loss) and net realized gain (loss) may differ for financial statement and tax purposes. The character of dividends and distributions made during the fiscal year from net investment income or net realized gains are determined in accordance with federal income tax requirements, which may differ from the character of net investment income or net realized gains presented in those financial statements in accordance with U.S. GAAP. Also, due to timing of dividends and distributions, the fiscal year in which amounts are distributed may differ from the fiscal year in which the income or net realized gain was recorded by the Fund.
13 OPPENHEIMER GOVERNMENT MONEY FUND/VA
NOTES TO FINANCIAL STATEMENTSContinued
2. Significant Accounting Policies (Continued)
Accordingly, the following amounts have been reclassified for the reporting period. Net assets of the Fund were unaffected by the reclassifications.
| | | | |
Increase
toPaid-in Capital | | Increase to
Accumulated Net
Loss | |
$33,955 | | | $33,955 | |
The tax character of distributions paid during the reporting periods:
| | | | | | | | |
| | | Year Ended
December 31, 2018 | | | Year Ended
December 31, 2017 | |
Distributions paid from: | | | | | | | | |
Ordinary income | | $ | 14,654,285 | | | $ | 1,903,588 | |
Use of Estimates. The preparation of financial statements in conformity with U.S. GAAP requires management to make estimates and assumptions that affect the reported amounts of assets and liabilities and disclosure of contingent assets and liabilities at the date of the financial statements and the reported amounts of increases and decreases in net assets from operations during the reporting period. Actual results could differ from those estimates.
New Accounting Pronouncements. In March 2017, Financial Accounting Standards Board (“FASB”) issued Accounting Standards Update (“ASU”), ASU2017-08. This provides guidance related to the amortization period for certain purchased callable debt securities held at a premium. The ASU is effective for annual periods beginning after December 15, 2018, and interim periods within those annual periods. The Manager has evaluated the impacts of these changes on the financial statements and there are no material impacts.
During August 2018, the Securities and Exchange Commission (the “SEC”) issued Final Rule ReleaseNo. 33-10532 (the “Rule”), Disclosure Update and Simplification. The rule amends certain financial statement disclosure requirements to conform to U.S. GAAP. The amendments to Rule6-04.17 of RegulationS-X (balance sheet) remove the requirement to separately state the book basis components of net assets: undistributed (over-distribution of) net investment income (“UNII”), accumulated undistributed net realized gains (losses), and net unrealized appreciation (depreciation) at the balance sheet date. Instead, consistent with U.S. GAAP, funds will be required to disclose total distributable earnings. The amendments to Rule6-09 of RegulationS-X (statement of changes in net assets) remove the requirement to separately state the sources of distributions paid. Instead, consistent with U.S. GAAP, funds will be required to disclose the total amount of distributions paid, except that any tax return of capital must be separately disclosed. The amendments also remove the requirement to parenthetically state the book basis amount of UNII on the statement of changes in net assets. The requirements of the Rule are effective November 5, 2018, and the Funds’ Statement of Assets and Liabilities and Statement of Changes in Net Assets for the current reporting period have been modified accordingly. In addition, certain amounts within each Fund’s Statement of Changes in Net Assets for the prior fiscal period have been modified to conform to the Rule.
3. Securities Valuation
The Fund calculates the net asset value of its shares as of 4:00 P.M. Eastern Time, on each day the New York Stock Exchange (the “Exchange” or “NYSE”) is open for trading, except in the case of a scheduled early closing of the Exchange, in which case the Fund will calculate net asset value of the shares as of the scheduled early closing time of the Exchange.
The Fund’s Board has adopted procedures for the valuation of the Fund’s securities and has delegated theday-to-day responsibility for valuation determinations under those procedures to the Manager. The Manager has established a Valuation Committee which is responsible for determining a fair valuation for any security for which market quotations are not readily available. The Valuation Committee’s fair valuation determinations are subject to review, approval and ratification by the Fund’s Board at least quarterly or more frequently, if necessary.
Valuation Methods and Inputs
Securities are valued at cost adjusted by the amortization of discount or premium to maturity (amortized cost), which approximates market value. If amortized cost is determined not to approximate market value, the fair value of the portfolio securities will be determined under procedures approved by the Fund’s Board of Trustees.
Securities for which market quotations are not readily available, or when a significant event has occurred that would materially affect the value of the security, are fair valued either (i) by a standardized fair valuation methodology applicable to the security type or the significant event as previously approved by the Valuation Committee and the Fund’s Board or (ii) as determined in good faith by the Manager’s Valuation Committee. The Valuation Committee considers all relevant facts that are reasonably available, through either public information or information available to the Manager, when determining the fair value of a security. Those standardized fair valuation methodologies include, but are not limited to, valuing securities at the last sale price or initially at cost and subsequently adjusting the value based on: changes in company specific fundamentals, changes in an appropriate securities index, or changes in the value of similar securities which may be further adjusted for any discounts related to security-specific resale restrictions. When possible, such methodologies use observable market inputs such as unadjusted quoted prices of similar securities, observable interest rates, currency rates and yield curves. The methodologies used for valuing securities are not necessarily an indication of the risks associated with investing in those securities nor can it be assured that the Fund can obtain the fair value assigned to a security if it were to sell the security.
14 OPPENHEIMER GOVERNMENT MONEY FUND/VA
3. Securities Valuation (Continued)
Classifications
Each investment asset or liability of the Fund is assigned a level at measurement date based on the significance and source of the inputs to its valuation. Various data inputs may be used in determining the value of each of the Fund’s investments as of the reporting period end. These data inputs are categorized in the following hierarchy under applicable financial accounting standards:
1) Level1-unadjusted quoted prices in active markets for identical assets or liabilities (including securities actively traded on a securities exchange)
2) Level2-inputs other than unadjusted quoted prices that are observable for the asset or liability (such as unadjusted quoted prices for similar assets and market corroborated inputs such as interest rates, prepayment speeds, credit risks, etc.)
3) Level3-significant unobservable inputs (including the Manager’s own judgments about assumptions that market participants would use in pricing the asset or liability).
The inputs used for valuing securities are not necessarily an indication of the risks associated with investing in those securities.
The Fund classifies each of its investments in investment companies which are publicly offered as Level 1. Investment companies that are not publicly offered, if any, are measured using net asset value and are classified as Level 2 in the fair value hierarchy.
The table below categorizes amounts that are included in the Fund’s Statement of Assets and Liabilities at period end based on valuation input level:
| | | | | | | | | | | | | | | | |
| | | Level 1—
Unadjusted
Quoted Prices | | | Level 2—
Other Significant
Observable Inputs | | | Level 3—
Significant
Unobservable
Inputs | | | Value | |
Assets Table | | | | | | | | | | | | | | | | |
Investments, at Value: | | | | | | | | | | | | | | | | |
U.S. Government Agencies | | $ | — | | | $ | 942,711,838 | | | $ | — | | | $ | 942,711,838 | |
Repurchase Agreements | | | — | | | | 2,034,100,000 | | | | — | | | | 2,034,100,000 | |
Investment Company | | | 15,554,790 | | | | — | | | | — | | | | 15,554,790 | |
| | | | |
Total Assets | | $ | 15,554,790 | | | $ | 2,976,811,838 | | | $ | — | | | $ | 2,992,366,628 | |
| | | | |
For the reporting period, there were no transfers between levels.
4. Investments and Risks
Investments in Affiliated Funds. The Fund is permitted to invest in other mutual funds advised by the Manager (“Affiliated Funds”). Affiliated Funds are management investment companies registered under the 1940 Act, as amended. The Manager is the investment adviser of, and theSub-Adviser provides investment and related advisory services to, the Affiliated Funds. When applicable, the Fund’s investments in Affiliated Funds are included in the Statement of Investments. Shares of Affiliated Funds are valued at their net asset value per share. As a shareholder, the Fund is subject to its proportional share of the Affiliated Funds’ expenses, including their management fee. The Manager will waive fees and/or reimburse Fund expenses in an amount equal to the indirect management fees incurred through the Fund’s investment in the Affiliated Funds.
Each of the Affiliated Funds in which the Fund invests has its own investment risks, and those risks can affect the value of the Fund’s investments and therefore the value of the Fund’s shares. To the extent that the Fund invests more of its assets in one Affiliated Fund than in another, the Fund will have greater exposure to the risks of that Affiliated Fund.
Investments in Money Market Instruments.The Fund is permitted to invest its free cash balances in money market instruments to provide liquidity or for defensive purposes. The Fund may invest in money market instruments by investing in Class E shares of Oppenheimer Institutional Government Money Market Fund (“IGMMF”), which is an Affiliated Fund. IGMMF is regulated as a money market fund under the 1940 Act, as amended. The Fund may also invest in money market instruments directly or in other affiliated or unaffiliated money market funds.
Securities on a When-Issued or Delayed Delivery Basis.The Fund may purchase securities on a “when-issued” basis, and may purchase or sell securities on a “delayed delivery” basis. “When-issued” or “delayed delivery” refers to securities whose terms and indenture are available and for which a market exists, but which are not available for immediate delivery. Delivery and payment for securities that have been purchased by the Fund on a when-issued basis normally takes place within six months and possibly as long as two years or more after the trade date. During this period, such securities do not earn interest, are subject to market fluctuation and may increase or decrease in value prior to their delivery. The purchase of securities on a when-issued basis may increase the volatility of the Fund’s net asset value to the extent the Fund executes such transactions while remaining substantially fully invested. When the Fund engages in when-issued or delayed delivery transactions, it relies on the buyer or seller, as the case may be, to complete the transaction. Their failure to do so may cause the Fund to lose the opportunity to obtain or dispose of the security at a price and yield it considers advantageous. The Fund may also sell securities that it purchased on a when-issued basis or forward commitment prior to settlement of the original purchase.
At period end, the Fund had purchased securities issued on a when-issued or delayed delivery basis and sold securities issued on a delayed delivery basis as follows:
15 OPPENHEIMER GOVERNMENT MONEY FUND/VA
NOTES TO FINANCIAL STATEMENTSContinued
4. Investments and Risks (Continued)
| | | | |
| | | When-Issued or
Delayed Delivery
Basis Transactions | |
Purchased securities | | | $6,987,816 | |
Shareholder Concentration.At period end, one shareholder owned 20% or more of the Fund’s total outstanding shares.
5. Market Risk Factors
The Fund’s investments in securities and/or financial derivatives may expose the Fund to various market risk factors:
Commodity Risk. Commodity risk relates to the change in value of commodities or commodity indexes as they relate to increases or decreases in the commodities market. Commodities are physical assets that have tangible properties. Examples of these types of assets are crude oil, heating oil, metals, livestock, and agricultural products.
Credit Risk.Credit risk relates to the ability of the issuer of debt to meet interest and principal payments, or both, as they come due. In general, lower-grade, higher-yield debt securities are subject to credit risk to a greater extent than lower-yield, higher-quality securities.
Equity Risk. Equity risk relates to the change in value of equity securities as they relate to increases or decreases in the general market.
Foreign Exchange Rate Risk. Foreign exchange rate risk relates to the change in the U.S. dollar value of a security held that is denominated in a foreign currency. The U.S. dollar value of a foreign currency denominated security will decrease as the dollar appreciates against the currency, while the U.S. dollar value will increase as the dollar depreciates against the currency.
Interest Rate Risk.Interest rate risk refers to the fluctuations in value of fixed-income securities resulting from the inverse relationship between price and yield. For example, an increase in general interest rates will tend to reduce the market value of already issued fixed-income investments, and a decline in general interest rates will tend to increase their value. In addition, debt securities with longer maturities, which tend to have higher yields, are subject to potentially greater fluctuations in value from changes in interest rates than obligations with shorter maturities.
Volatility Risk.Volatility risk refers to the magnitude of the movement, but not the direction of the movement, in a financial instrument’s price over a defined time period. Large increases or decreases in a financial instrument’s price over a relative time period typically indicate greater volatility risk, while small increases or decreases in its price typically indicate lower volatility risk.
6. Shares of Beneficial Interest
The Fund has authorized an unlimited number of $0.001 par value shares of beneficial interest. Transactions in shares of beneficial interest were as follows:
| | | | | | | | | | | | | | | | |
| | | Year Ended December 31, 2018 | | | Year Ended December 31, 2017 | |
| | | Shares | | | | Amount | | | | Shares | | | | Amount | |
| |
Sold | | | 3,403,573,875 | | | $ | 3,403,573,875 | | | | 306,082,431 | | | $ | 306,082,431 | |
Dividends and/or distributions reinvested | | | 12,421,877 | | | | 12,421,877 | | | | 1,769,951 | | | | 1,769,951 | |
Redeemed | | | (785,874,330 | ) | | | (785,874,330) | | | | (424,216,869 | ) | | | (424,216,869) | |
| | | | |
Net increase (decrease) | | | 2,630,121,422 | | | $ | 2,630,121,422 | | | | (116,364,487 | ) | | $ | (116,364,487) | |
| | | | |
7. Fees and Other Transactions with Affiliates
Management Fees.Under the investment advisory agreement, the Fund pays the Manager a management fee based on the daily net assets of the Fund at an annual rate as shown in the following table:
| | |
| Fee Schedule |
Up to $500 million | | 0.450% |
Next $500 million | | 0.425 |
Next $500 million | | 0.400 |
Over $1.5 billion | | 0.375 |
The Fund’s effective management fee for the reporting period was 0.42% of average annual net assets before any applicable waivers.
Sub-Adviser Fees.The Manager has retained theSub-Adviser to provide theday-to-day portfolio management of the Fund. Under theSub-Advisory Agreement, the Manager pays theSub-Adviser an annual fee in monthly installments, equal to a percentage of the investment management fee collected by the Manager from the Fund, which shall be calculated after any investment management fee waivers. The fee paid to theSub-Adviser is paid by the Manager, not by the Fund.
Transfer Agent Fees.OFI Global (the “Transfer Agent”) serves as the transfer and shareholder servicing agent for the Fund. The Fund pays the Transfer Agent a fee based on annual net assets. Fees incurred and average net assets with respect to these services are detailed in the Statement of Operations and Financial Highlights, respectively.
Sub-Transfer Agent Fees.The Transfer Agent has retained Shareholder Services, Inc., a wholly-owned subsidiary of OFI (the“Sub-Transfer Agent”),
16 OPPENHEIMER GOVERNMENT MONEY FUND/VA
7. Fees and Other Transactions with Affiliates (Continued)
to provide theday-to-day transfer agent and shareholder servicing of the Fund. Under theSub-Transfer Agency Agreement, the Transfer Agent pays theSub-Transfer Agent an annual fee in monthly installments, equal to a percentage of the transfer agent fee collected by the Transfer Agent from the Fund, which shall be calculated after any applicable fee waivers. The fee paid to theSub-Transfer Agent is paid by the Transfer Agent, not by the Fund.
Trustees’ Compensation. The Fund’s Board of Trustees (“Board”) has adopted a compensation deferral plan for Independent Trustees that enables Trustees to elect to defer receipt of all or a portion of the annual compensation they are entitled to receive from the Fund. For purposes of determining the amount owed to the Trustees under the plan, deferred amounts are treated as though equal dollar amounts had been invested in shares of the Fund or in other Oppenheimer funds selected by the Trustees. The Fund purchases shares of the funds selected for deferral by the Trustees in amounts equal to his or her deemed investment, resulting in a Fund asset equal to the deferred compensation liability. Such assets are included as a component of “Other” within the asset section of the Statement of Assets and Liabilities. Deferral of Trustees’ fees under the plan will not affect the net assets of the Fund and will not materially affect the Fund’s assets, liabilities or net investment income per share. Amounts will be deferred until distributed in accordance with the compensation deferral plan.
Waivers and Reimbursements of Expenses.The Manager has voluntarily undertaken to waive fees and/or reimburse expenses to the extent necessary to assist the Fund in attempting to maintain a positive yield. There is no guarantee that the Fund will maintain a positive yield.
The Manager has contractually agreed to limit the Fund’s expenses after payments, waivers and/or reimbursements and reduction to custodian expenses, excluding any applicable dividend expense, taxes, interest and fees from borrowing, any subsidiary expenses, Acquired Fund Fees and Expenses, brokerage commissions, unusual and infrequent expenses and certain other Fund expenses; so that those expenses, as percentages of daily net assets, will not exceed the annual rate of 0.50%. During the reporting period, the Manager waived and/or reimbursed the Fund $606,751. This fee waiver and/or expense reimbursement may not be amended or withdrawn for one year from the date of the Fund’s prospectus, unless approved by the Board.
The Manager is permitted to recapture previously waived and/or reimbursed fees in any given fiscal year if the recapture would not: 1) cause the Fund to generate a negative daily yield, and 2) exceed amounts previously waived and/or reimbursed under this arrangement during the current and prior three fiscal years. The reimbursement to the Manager of such previous waivers and reimbursements would not include any portion of distribution and/or service fees. At period end, the following waived and/or reimbursed amounts are eligible for recapture:
| | | | |
| Expiration Date | | | |
December 31, 2019 | | $ | 2,982,813 | |
December 31, 2020 | | | 427,655 | |
December 31, 2021 | | | 606,751 | |
The Manager has not recaptured any previously waived and/or reimbursed amounts during the reporting period.
The Manager will waive fees and/or reimburse Fund expenses in an amount equal to the indirect management fees incurred through the Fund’s investment in IGMMF. During the reporting period, the Manager waived fees and/or reimbursed the Fund $15,420 for IGMMF management fees.
8. Repurchase Agreements
In a repurchase transaction, a Fund buys a security and simultaneously sells it back to an approved institution for delivery on an agreed-upon future date. The resale price exceeds the purchase price by an amount that reflects an agreed-upon interest rate effective for the period during which the repurchase agreement is in effect. Approved institutions include U.S. commercial banks, U.S. branches of foreign banks or broker-dealers that have been designated as primary dealers in government securities. They must meet credit requirements set by the investment adviser from time to time. Repurchase agreements must be fully collateralized. However, if the seller fails to pay the repurchase price on the delivery date, a Fund may incur costs in disposing of the collateral and may experience losses if there is any delay in its ability to do so. If the default on the part of the seller is due to its bankruptcy, a Fund’s ability to liquidate the collateral may be delayed or limited.
The following is a summary by counterparty of the market value of Borrowings and Other Financing Transactions and collateral (received) as of period end:
| | | | | | | | | | |
| Counterparty | | Repurchase Agreement
Proceeds to be Received 1 | | Collateral Received1 | | | Net Exposure2 | |
Repurchase Agreements | | | | | | | | | | |
Amherst Pierpont Securities LLC | | $64,042,124 | | | $(70,439,886) | | | | $(6,397,762) | |
ASL Capital Markets Inc. | | 473,078,901 | | | (482,540,479) | | | | (9,461,578) | |
Cantor Fitzgerald Secured, LLC | | 473,080,186 | | | (482,541,790) | | | | (9,461,604) | |
Credit Agricole Corp. & Investment Bank | | 10,001,667 | | | (10,201,700) | | | | (200,033) | |
Deutsche Bank Securities, Inc. | | 54,025,726 | | | (59,428,298) | | | | (5,402,572) | |
Deutsche Bank Securities, Inc. | | 40,051,722 | | | (44,056,895) | | | | (4,005,173) | |
Deutsche Bank Securities, Inc. | | 100,016,389 | | | (110,018,028) | | | | (10,001,639) | |
INTL FCStone Financial, Inc. | | 76,036,973 | | | (77,783,203) | | | | (1,746,230) | |
INTL FCStone Financial, Inc. | | 10,016,085 | | | (10,216,407) | | | | (200,322) | |
RBC Dominion Securities, Inc. | | 300,049,500 | | | (306,050,490) | | | | (6,000,990) | |
Royal Bank of Canada | | 14,102,311 | | | (14,384,357) | | | | (282,046) | |
South Street Securities LLC | | 20,008,433 | | | (20,408,602) | | | | (400,169) | |
17 OPPENHEIMER GOVERNMENT MONEY FUND/VA
NOTES TO FINANCIAL STATEMENTSContinued
8. Repurchase Agreements (Continued)
| | | | | | | | | | | | |
| Counterparty | | Repurchase Agreement
Proceeds to be Received 1 | | | Collateral Received1 | | | Net Exposure2 | |
| |
South Street Securities LLC | | | $20,002,911 | | | | $(20,402,969) | | | | $(400,058) | |
South Street Securities LLC | | | 366,060,035 | | | | (373,381,236) | | | | (7,321,201) | |
TD Securities (USA) LLC | | | 14,002,333 | | | | (14,282,380) | | | | (280,047) | |
| | | | | | | | |
| | | $2,034,575,296 | | | | $(2,096,136,720) | | | | | |
| | | | | | | | |
1. Includes accrued interest.
2. Net exposure represents the net receivable/payable that would be due from/to the counterparty in the event of default.
9. Pending Acquisition
On October 18, 2018, Massachusetts Mutual Life Insurance Company, an indirect corporate parent of theSub-Adviser and the Manager, announced that it has entered into an agreement whereby Invesco Ltd. (“Invesco”), a global investment management company, will acquire theSub-Adviser (the “Transaction”). In connection with the Transaction, on January 11, 2019, the Fund’s Board unanimously approved an Agreement and Plan of Reorganization (the “Agreement”), which provides for the transfer of the assets and liabilities of the Fund to a corresponding, newly formed fund (the “Acquiring Fund”) in the Invesco family of funds (the “Reorganization”) in exchange for shares of the corresponding Acquiring Fund of equal value to the value of the shares of the Fund as of the close of business on the closing date. Although the Acquiring Fund will be managed by Invesco Advisers, Inc., the Acquiring Fund will, as of the closing date, have the same investment objective and substantially similar principal investment strategies and risks as the Fund. After the Reorganization, Invesco Advisers, Inc. will be the investment adviser to the Acquiring Fund, and the Fund will be liquidated and dissolved under applicable law and terminate its registration under the Investment Company Act of 1940, as amended. The Reorganization is expected to be atax-free reorganization for U.S. federal income tax purposes.
The Reorganization is subject to the approval of shareholders of the Fund. Shareholders of record of the Fund on January 14, 2019 will be entitled to vote on the Reorganization and will receive a combined prospectus and proxy statement describing the Reorganization, the shareholder meeting, and a discussion of the factors the Fund’s Board considered in approving the Agreement. The combined prospectus and proxy statement is expected to be distributed to shareholders of record on or about February 28, 2019. The anticipated date of the shareholder meeting is on or about April 12, 2019.
If shareholders approve the Agreement and certain other closing conditions are satisfied or waived, the Reorganization is expected to close during the second quarter of 2019, or as soon as practicable thereafter. This is subject to change.
18 OPPENHEIMER GOVERNMENT MONEY FUND/VA
REPORT OF INDEPENDENT REGISTERED PUBLIC ACCOUNTING FIRM
To the Shareholders and Board of Trustees
Oppenheimer Variable Account Funds:
Opinion on the Financial Statements
We have audited the accompanying statement of assets and liabilities of Oppenheimer Government Money Fund/VA, a separate series of Oppenheimer Variable Account Funds, (the “Fund”), including the statement of investments, as of December 31, 2018, the related statement of operations for the year then ended, the statements of changes in net assets for each of the years in the two year period then ended, and the related notes (collectively, the “financial statements”) and the financial highlights for each of the years in the five year period then ended. In our opinion, the financial statements and financial highlights present fairly, in all material respects, the financial position of the Fund as of December 31, 2018, the results of its operations for the year then ended, the changes in its net assets for each of the years in the two year period then ended, and the financial highlights for each of the years in the five year period then ended, in conformity with U.S. generally accepted accounting principles.
Basis for Opinion
These financial statements and financial highlights are the responsibility of the Fund’s management. Our responsibility is to express an opinion on these financial statements and financial highlights based on our audits. We are a public accounting firm registered with the Public Company Accounting Oversight Board (United States) (“PCAOB”) and are required to be independent with respect to the Fund in accordance with the U.S. federal securities laws and the applicable rules and regulations of the Securities and Exchange Commission and the PCAOB.
We conducted our audits in accordance with the standards of the PCAOB. Those standards require that we plan and perform the audit to obtain reasonable assurance about whether the financial statements and financial highlights are free of material misstatement, whether due to error or fraud. Our audits included performing procedures to assess the risks of material misstatement of the financial statements and financial highlights, whether due to error or fraud, and performing procedures that respond to those risks. Such procedures included examining, on a test basis, evidence regarding the amounts and disclosures in the financial statements and financial highlights. Such procedures also included confirmation of securities owned as of December 31, 2018, by correspondence with the custodian, brokers and the transfer agent, or by other appropriate auditing procedures. Our audits also included evaluating the accounting principles used and significant estimates made by management, as well as evaluating the overall presentation of the financial statements and financial highlights. We believe that our audits provide a reasonable basis for our opinion.
KPMGLLP
We have not been able to determine the specific year that we began serving as the auditor of one or more Oppenheimer Funds investment companies, however we are aware that we have served as the auditor of one or more Oppenheimer Funds investment companies since at least 1969.
Denver, Colorado
February 14, 2019
19 OPPENHEIMER GOVERNMENT MONEY FUND/VA
FEDERAL INCOME TAX INFORMATIONUnaudited
In early 2019, if applicable, shareholders of record received information regarding all dividends and distributions paid to them by the Fund during calendar year 2018.
The foregoing information is presented to assist shareholders in reporting distributions received from the Fund to the Internal Revenue Service. Because of the complexity of the federal regulations which may affect your individual tax return and the many variations in state and local tax regulations, we recommend that you consult your tax advisor for specific guidance.
20 OPPENHEIMER GOVERNMENT MONEY FUND/VA
BOARD APPROVAL OF THE FUND’S INVESTMENT ADVISORY ANDSUB-ADVISORY AGREEMENTSUnaudited
The Fund has entered into an investment advisory agreement with OFI Global Asset Management, Inc. (“OFI Global” or the “Adviser”), a wholly-owned subsidiary of OppenheimerFunds, Inc. (“OFI” or the“Sub-Adviser”) (“OFI Global” and “OFI” together the “Managers”) and OFI Global has entered into asub-advisory agreement with OFI whereby OFI provides investmentsub-advisory services to the Fund (collectively, the “Agreements”). Each year, the Board of Trustees (the “Board”), including a majority of the independent Trustees, is required to determine whether to approve the terms of the Agreements and the renewal thereof. The Investment Company Act of 1940, as amended, requires that the Board request and evaluate, and that the Managers provide, such information as may be reasonably necessary to evaluate the terms of the Agreements. The Board employs an independent consultant to prepare a report that provides information, including comparative information that the Board requests for that purpose. In addition toin-person meetings focused on this evaluation, the Board receives information throughout the year regarding Fund services, fees, expenses and performance.
The Managers and the independent consultant provided information to the Board on the following factors: (i) the nature, quality and extent of the Managers’ services, (ii) the comparative investment performance of the Fund and the Managers, (iii) the fees and expenses of the Fund, including comparative fee and expense information, (iv) the profitability of the Managers and their affiliates, including an analysis of the cost of providing services, (v) whether economies of scale are realized as the Fund grows and whether fee levels reflect these economies of scale for Fund investors and (vi) other benefits to the Managers from their relationship with the Fund. The Board was aware that there are alternatives to retaining the Managers.
Outlined below is a summary of the principal information considered by the Board as well as the Board’s conclusions.
Nature, Quality and Extent of Services. The Board considered information about the nature, quality and extent of the services provided to the Fund and information regarding the Managers’ key personnel who provide such services. The Managers’ duties include providing the Fund with the services of theSub-Adviser’s portfolio managers and investment team, who provide research, analysis and other advisory services in regard to the Fund’s investments; and securities trading services. OFI Global is responsible for oversight of third-party service providers; monitoring compliance with applicable Fund policies and procedures and adherence to the Fund’s investment restrictions; risk management; and oversight of theSub-Adviser. OFI Global is also responsible for providing certain administrative services to the Fund. Those services include providing and supervising all administrative and clerical personnel who are necessary in order to provide effective corporate administration for the Fund; compiling and maintaining records with respect to the Fund’s operations; preparing and filing reports required by the U.S. Securities and Exchange Commission; preparing periodic reports regarding the operations of the Fund for its shareholders; preparing proxy materials for shareholder meetings; and preparing the registration statements required by federal and state securities laws for the sale of the Fund’s shares. OFI Global also provides the Fund with office space, facilities and equipment.
The Board also considered the quality of the services provided and the quality of the Managers’ resources that are available to the Fund. The Board took account of the fact that theSub-Adviser has over fifty years of experience as an investment adviser and that its assets under management rank it among the top mutual fund managers in the United States. The Board evaluated the Managers’ advisory, administrative, accounting, legal, compliance and risk management services, among other services, and information the Board has received regarding the experience and professional qualifications of the Managers’ key personnel and the size and functions of their staff. In its evaluation of the quality of the portfolio management services provided, the Board considered the experience of Christopher Proctor and Adam Wilde, the portfolio managers for the Fund, and theSub-Adviser’s investment team and analysts. The Board members also considered the totality of their experiences with the Managers as directors or trustees of the Fund and other funds advised by the Managers. The Board considered information regarding the quality of services provided by affiliates of the Managers, which the Board members have become knowledgeable about through their experiences with the Managers and in connection with the review or renewal of the Fund’s service agreements or service providers. The Board concluded, in light of the Managers’ experience, reputation, personnel, operations and resources that the Fund benefits from the services provided under the Agreements.
Investment Performance of the Managers and the Fund. Throughout the year, the Managers provided information on the investment performance of the Fund, the Adviser and theSub-Adviser, including comparative performance information. The Board also reviewed information, prepared by the Managers and by the independent consultant, comparing the Fund’s historical performance to relevant market indices and to the performance of other money market taxable funds. The Board considered that the Fund outperformed its category median during theten-year period, performed in line with its category median during the five-year period (ranking in the 45th percentile), and underperformed its category median during the more recent periods. It noted the Managers’ assertion that the Fund is grouped in a fairly homogenous category that is characterized by extremely tight return dispersion, and that despite its quintile rankings, the Fund has remained largely in line with its competitors. In this regard, the Board further noted that the Fund’s returns were only three basis points lower than the category median in theone-year period and one basis point lower in the three-year period. The Board also considered that the Fund ranked in the first or second quintiles of its category in eight of the last ten calendar years. The Board further noted that the Fund has three shareholders, including one that holds a majority of the Fund’s assets, and that, as a result, the Fund is positioned more defensively than peers that have a more diversified shareholder base.
Fees and Expenses of the Fund. The Board reviewed the fees paid to the Adviser and the other expenses borne by the Fund. The Board noted that the Adviser, not the Fund, pays theSub-Adviser’s fee under thesub-advisory agreement. The independent consultant provided comparative data in regard to the fees and expenses of the Fund and other money market-taxable funds. In reviewing the fees and expenses charged to the VA funds, the Board considered the Adviser’s assertion that, because there is much greater disparity in the fees and services that may be provided by a manager to a VA fund as opposed to a retail fund, when comparing the expenses of the various VA funds to those of retail funds, it is most appropriate to focus on total expenses (rather than on the management fees). The Board considered that the Fund’s total expenses were higher than its peer group median and its category median. The Board also considered that the Fund’s contractual management fee was higher than both its peer group median and its category median. The Board noted that the Adviser has contractually agreed to limit the Fund’s total annual operating expenses so that those expenses, as a percentage of daily net assets, will not exceed the annual rate of 0.50%. This contractual expense limitation may not be amended or withdrawn until one year after the date of the Fund’s prospectus, unless approved by the Board. The Board also considered that the Adviser voluntarily agreed to waive fees to assist the Fund in attempting to maintain a positive yield, although there is no guarantee that the Fund will maintain a positive yield. This voluntary fee waiver may be amended or withdrawn at any time without prior notice to shareholders.
21 OPPENHEIMER GOVERNMENT MONEY FUND/VA
BOARD APPROVAL OF THE FUND’S INVESTMENT ADVISORY ANDSUB-ADVISORY AGREEMENTSUnaudited / Continued
Economies of Scale and Profits Realized by the Managers. The Board considered information regarding the Managers’ costs in serving as the Fund’s investment adviser andsub-adviser, including the costs associated with the personnel and systems necessary to manage the Fund, and information regarding the Managers’ profitability from their relationship with the Fund. The Board also considered that the Managers must be able to pay and retain experienced professional personnel at competitive rates to provide quality services to the Fund. The Board reviewed whether the Managers may realize economies of scale in managing and supporting the Fund. The Board noted that the Fund currently has management fee breakpoints, which are intended to share with Fund shareholders economies of scale that may exist as the Fund’s assets grow.
Other Benefits to the Managers. In addition to considering the profits realized by the Managers, the Board considered information that was provided regarding the direct and indirect benefits the Managers receive as a result of their relationship with the Fund, including compensation paid to the Managers’ affiliates.
Conclusions. These factors were also considered by the independent Trustees meeting separately from the full Board, assisted by experienced counsel to the Fund and to the independent Trustees. Fund counsel and the independent Trustees’ counsel are independent of the Managers within the meaning and intent of the Securities and Exchange Commission Rules.
Based on its review of the information it received and its evaluations described above, the Board, including a majority of the independent Trustees, decided to continue the Agreements through August 31, 2019. In arriving at its decision, the Board did not identify any factor or factors as being more important than others, but considered all of the above information, and considered the terms and conditions of the Agreements, including the management fees, in light of all the surrounding circumstances.
22 OPPENHEIMER GOVERNMENT MONEY FUND/VA
PORTFOLIO PROXY VOTING POLICIES AND GUIDELINES; UPDATES TO STATEMENT OF INVESTMENTSUnaudited
The Fund has adopted Portfolio Proxy Voting Policies and Guidelines under which the Fund votes proxies relating to securities (“portfolio proxies”) held by the Fund. A description of the Fund’s Portfolio Proxy Voting Policies and Guidelines is available (i) without charge, upon request, by calling the Fund toll-free at 1.800.CALL OPP (225.5677), (ii) on the Fund’s website at www.oppenheimerfunds.com, and (iii) on the SEC’s website at www.sec.gov. In addition, the Fund is required to file FormN-PX, with its complete proxy voting record for the 12 months ended June 30th, no later than August 31st of each year. The Fund’s voting record is available (i) without charge, upon request, by calling the Fund toll-free at 1.800.CALL OPP (225.5677), and (ii) in the FormN-PX filing on the SEC’s website at www.sec.gov.
The Fund files its complete schedule of portfolio holdings with the SEC for the first quarter and the third quarter of each fiscal year on FormN-Q. The Fund’s FormN-Q filings are available on the SEC’s website at www.sec.gov.
23 OPPENHEIMER GOVERNMENT MONEY FUND/VA
TRUSTEES AND OFFICERSUnaudited
| | |
Name, Position(s) Held with the Fund, Length of
Service, Year of Birth | | Principal Occupation(s) During the Past 5 Years; Other Trusteeships/Directorships
Held; Number of Portfolios in the Fund Complex Currently Overseen |
| |
| INDEPENDENT TRUSTEES | | The address of each Trustee in the chart below is 6803 S. Tucson Way, Centennial, Colorado 80112-3924. Each Trustee serves for an indefinite term, or until his or her resignation, retirement, death or removal. Each of the Trustees in the chart below oversees 58 portfolios in the OppenheimerFunds complex. |
| |
Robert J. Malone, Chairman of the Board of Trustees (since 2016), Trustee (since 2002) Year of Birth: 1944 | | Chairman - Colorado Market of MidFirst Bank (since January 2015); Chairman of the Board (2012-2016) and Director (August 2005-January 2016) of Jones International University (educational organization); Trustee of the Gallagher Family Foundation(non-profit organization) (2000-2016); Chairman, Chief Executive Officer and Director of Steele Street Bank Trust (commercial banking) (August 2003-January 2015); Director of Opera Colorado Foundation(non-profit organization) (2008-2012); Director of Colorado UpLIFT (charitable organization) (1986-2010); Director of Jones Knowledge, Inc. (2006-2010); Former Chairman of U.S. Bank-Colorado (subsidiary of U.S. Bancorp and formerly Colorado National Bank) (July 1996-April 1999); Director of Commercial Assets, Inc. (real estate investment trust) (1993-2000); Director of U.S. Exploration, Inc. (oil and gas exploration) (1997-February 2004); Chairman of the Board (1991-1994) and Trustee (1985-1994) of Regis University; and Chairman of the Board (1990-1991) and Member (1984-1999) of Young Presidents Organization. Mr. Malone has served on the Boards of certain Oppenheimer funds since 2002, during which time he has become familiar with the Fund’s (and other Oppenheimer funds’) financial, accounting, regulatory and investment matters and has contributed to the Board’s deliberations. |
| |
Andrew J. Donohue, Trustee (since 2017) Year of Birth: 1950 | | Director, Mutual Fund Directors Forum (since February 2018); Of Counsel, Shearman & Sterling LLP (since September 2017); Chief of Staff of the U.S. Securities and Exchange Commission (regulator) (June 2015-February 2017); Managing Director and Investment Company General Counsel of Goldman Sachs (investment bank) (November2012-May 2015); Partner at Morgan Lewis & Bockius, LLP (law firm) (March 2011-October 2012); Director of the Division of Investment Management of U.S. Securities and Exchange Commission (regulator) (May 2006-November 2010); Global General Counsel of Merrill Lynch Investment Managers (investment firm) (May2003-May 2006); General Counsel (October 1991-November 2001) and Executive Vice President (January 1993-November 2001) of OppenheimerFunds, Inc. (investment firm) (June 1991-November 2001). Mr. Donohue has served on the Boards of certain Oppenheimer funds since 2017, during which time he has become familiar with the Fund’s (and other Oppenheimer funds’) financial, accounting, regulatory and investment matters and has contributed to the Board’s deliberations. |
| |
Richard F. Grabish, Trustee (since 2012) Year of Birth: 1948 | | Formerly Senior Vice President and Assistant Director of Sales and Marketing (March 1997-December 2007), Director (March 1987-December 2007) and Manager of Private Client Services (June 1985-June 2005) of A.G. Edwards & Sons, Inc. (broker/dealer and investment firm); Chairman and Chief Executive Officer of A.G. Edwards Trust Company, FSB (March 2001-December 2007); President and Vice Chairman of A.G. Edwards Trust Company, FSB (investment adviser) (April 1987-March 2001); President of A.G. Edwards Trust Company, FSB (investment adviser) (June 2005-December 2007). Mr. Grabish has served on the Boards of certain Oppenheimer funds since 2001, during which time he has become familiar with the Fund’s (and other Oppenheimer funds’) financial, accounting, regulatory and investment matters and has contributed to the Board’s deliberations. |
| |
Beverly L. Hamilton, Trustee (since 2002) Year of Birth: 1946 | | Trustee of Monterey Institute for International Studies (educational organization) (2000-2014); Board Member of Middlebury College (educational organization) (December 2005-June 2011); Director of the Board (1991-2016), Vice Chairman of the Board (2006-2009) and Chairman of the Board (2010-2013) of American Funds’ Emerging Markets Growth Fund, Inc. (mutual fund); Director of The California Endowment (philanthropic organization) (April 2002-April 2008); Director (February 2002-2005) and Chairman of Trustees (2006-2007) of the Community Hospital of Monterey Peninsula; President of ARCO Investment Management Company (February 1991-April 2000); Member of the investment committees of The Rockefeller Foundation (2001-2006) and The University of Michigan (since 2000); Advisor at Credit Suisse First Boston’s Sprout venture capital unit (venture capital fund) (1994-January 2005); Trustee of MassMutual Institutional Funds (investment company) (1996-June 2004); Trustee of MML Series Investment Fund (investment company) (April 1989-June 2004); Member of the investment committee of Hartford Hospital (2000-2003); and Advisor to Unilever (Holland) pension fund (2000-2003). Ms. Hamilton has served on the Boards of certain Oppenheimer funds since 2002, during which time she has become familiar with the Fund’s (and other Oppenheimer funds’) financial, accounting, regulatory and investment matters and has contributed to the Board’s deliberations. |
| |
Victoria J. Herget, Trustee (since 2012) Year of Birth: 1951 | | Board Chair (2008-2015) and Director (2004-Present) of United Educators (insurance company); Trustee (since 2000) and Chair (2010-2017) of Newberry Library (independent research library); Trustee, Mather LifeWays (senior living organization) (since 2001); Independent Director of the First American Funds (mutual fund family) (2003-2011 and July 2018-January 2019); former Managing Director (1993-2001), Principal (1985-1993), Vice President (1978-1985) and Assistant Vice President (1973-1978) of Zurich Scudder Investments (investment adviser) (and its predecessor firms); Trustee (1992-2007), Chair of the Board of Trustees (1999-2007), Investment Committee Chair (1994-1999) and Investment Committee member (2007-2010) of Wellesley College; Trustee, BoardSource(non-profit organization) (2006-2009) and Chicago City Day School(K-8 School) (1994-2005). Ms. Herget has served on the Boards of certain Oppenheimer funds since 2012, during which time she has become familiar with the Fund’s (and other Oppenheimer funds’) financial, accounting, regulatory and investment matters and has contributed to the Board’s deliberations. |
| |
Karen L. Stuckey, Trustee (since 2012) Year of Birth: 1953 | | Member (since May 2015) of Desert Mountain Community Foundation Advisory Board(non-profit organization); Partner (1990-2012) of PricewaterhouseCoopers LLP (professional services firm) (held various positions 1975-1990); Trustee (1992- 2006); member of Executive, Nominating and Audit Committees and Chair of Finance Committee (1992-2006), and Emeritus Trustee (since 2006) of Lehigh University; member, Women’s Investment Management Forum (professional organization) (since inception) and Trustee of Jennies School for Little Children(non-profit) (2011-2014). Ms. Stuckey has served on the Boards of certain Oppenheimer funds since 2012, during which time she has become familiar with the Fund’s (and other Oppenheimer funds’) financial, accounting, regulatory and investment matters and has contributed to the Board’s deliberations. |
24 OPPENHEIMER GOVERNMENT MONEY FUND/VA
| | |
| |
James D. Vaughn, Trustee (since 2012) Year of Birth: 1945 | | Retired; former managing partner (1994-2001) of Denver office of Deloitte & Touche LLP, (held various positions in Denver and New York offices from 1969-1993); Trustee and Chairman of the Audit Committee of Schroder Funds (2003-2012); Board member and Chairman of Audit Committee of AMG National Trust Bank (since 2005); Trustee and Investment Committee member, University of South Dakota Foundation (since 1996); Board member, Audit Committee Member and past Board Chair, Junior Achievement (since 1993); former Board member, Mile High United Way, Boys and Girls Clubs, Boy Scouts, Colorado Business Committee for the Arts, Economic Club of Colorado and Metro Denver Network. Mr. Vaughn has served on the Boards of certain Oppenheimer funds since 2012, during which time he has become familiar with the Fund’s (and other Oppenheimer funds’) financial, accounting, regulatory and investment matters and has contributed to the Board’s deliberations. |
INTERESTED TRUSTEE AND OFFICER | | Mr. Steinmetz is an “Interested Trustee” because he is affiliated with the Manager and theSub-Adviser by virtue of his positions as Chairman and director of theSub-Adviser and officer and director of the Manager. Both as a Trustee and as an officer, Mr. Steinmetz serves for an indefinite term, or until his resignation, retirement, death or removal. Mr. Steinmetz’s address is 225 Liberty Street, New York, New York 10281- 1008. Mr. Steinmetz is an officer of 104 portfolios in the OppenheimerFunds complex. |
| |
Arthur P. Steinmetz, Trustee (Since 2015), President and Principal Executive Officer (since 2014) Year of Birth: 1958 | | Chairman of OppenheimerFunds, Inc. (since January 2015); CEO and Chairman of OFI Global Asset Management, Inc. (since July 2014), President of OFI Global Asset Management, Inc. (since May 2013), a Director of OFI Global Asset Management, Inc. (since January 2013), Director of OppenheimerFunds, Inc. (since July 2014), President, Management Director and CEO of Oppenheimer Acquisition Corp. (OppenheimerFunds, Inc.‘s parent holding company) (since July 2014), and President and Director of OFI SteelPath, Inc. (since January 2013). Chief Investment Officer of the OppenheimerFunds advisory entities from (January 2013-December 2013); Executive Vice President of OFI Global Asset Management, Inc. (January2013-May 2013); Chief Investment Officer of OppenheimerFunds, Inc. (October 2010-December 2012); Chief Investment Officer, Fixed- Income, of OppenheimerFunds, Inc. (April 2009-October 2010); Executive Vice President of OppenheimerFunds, Inc. (October 2009-December 2012); Director of Fixed Income of OppenheimerFunds, Inc. (January 2009-April 2009); and a Senior Vice President of OppenheimerFunds, Inc. (March 1993-September 2009). |
OTHER OFFICERS OF THE FUND | | The addresses of the Officers in the chart below are as follows: for Mss. Lo Bessette, Foxson and Picciotto, 225 Liberty Street, New York, New York 10281-1008, for Messrs. Proctor, Wilde and Petersen, 6803 S. Tucson Way, Centennial, Colorado 80112-3924. Each Officer serves for an indefinite term or until his or her resignation, retirement, death or removal. |
| |
Christopher Proctor, Vice President (since 2010) Year of Birth: 1968 | | Head of the Cash Strategies Team (since July 2013); Senior Vice President of theSub-Adviser (since July 2013) and Senior Portfolio Manager of theSub-Adviser (since January 2010). Vice President of theSub-Adviser (August 2008-July 2013). Vice President at Calamos Asset Management (January 2007-March 2008) and Scudder-Kemper Investments (1999-2002). Managing Director andCo-Founder of Elmhurst Capital Management (June 2004-January 2007); Senior Manager of Research for Etrade Global Asset Management (2002-2004). |
| |
Adam S. Wilde, Vice President (since 2013) Year of Birth: 1978 | | Vice President of theSub-Adviser (since May 2011) and a Portfolio Manager of theSub-Adviser (since July 2013). He served as the head of credit research for the cash strategies team of theSub-Adviser (from 2011 to 2013), and as an Assistant Vice President and senior research analyst of theSub-Adviser (from 2008 to 2011). Mr. Wilde served as an intermediate research analyst of theSub-Adviser (from 2007 to 2008) and served in other analyst roles of theSub-Adviser (since 2002). Mr. Wilde joined theSub-Adviser in 2001. |
| |
Cynthia Lo Bessette, Secretary and Chief Legal Officer (since 2016) Year of Birth: 1969 | | Executive Vice President, General Counsel and Secretary of OFI Global Asset Management, Inc. (since February 2016); Senior Vice President and Deputy General Counsel of OFI Global Asset Management, Inc. (March 2015-February 2016); Chief Legal Officer of OppenheimerFunds, Inc. and OppenheimerFunds Distributor, Inc. (since February 2016); Vice President, General Counsel and Secretary of Oppenheimer Acquisition Corp. (since February 2016); General Counsel of OFI SteelPath, Inc., OFI Advisors, LLC and Index Management Solutions, LLC (since February 2016); Chief Legal Officer of OFI Global Institutional, Inc., HarbourView Asset Management Corporation, OFI Global Trust Company, Oppenheimer Real Asset Management, Inc., OFI Private Investments Inc., Shareholder Services, Inc. and Trinity Investment Management Corporation (since February 2016); Corporate Counsel (February 2012-March 2015) and Deputy Chief Legal Officer (April 2013-March 2015) of Jennison Associates LLC; Assistant General Counsel (April 2008-September 2009) and Deputy General Counsel (October 2009-February 2012) of Lord Abbett & Co. LLC. |
| |
Jennifer Foxson, Vice President and Chief Business Officer (since 2014) Year of Birth: 1969 | | Senior Vice President of OppenheimerFunds Distributor, Inc. (since June 2014); Vice President of OppenheimerFunds Distributor, Inc. (April 2006-June 2014); Vice President of OppenheimerFunds, Inc. (January 1998-March 2006); Assistant Vice President of OppenheimerFunds, Inc. (October 1991-December 1998). |
| |
Mary Ann Picciotto, Chief Compliance Officer and Chief Anti-Money Laundering Officer (since 2014) Year of Birth: 1973 | | Senior Vice President and Chief Compliance Officer of OFI Global Asset Management, Inc. (since March 2014); Chief Compliance Officer of OppenheimerFunds, Inc., OFI SteelPath, Inc., OFI Global Institutional, Inc., Oppenheimer Real Asset Management, Inc., OFI Private Investments Inc., Harborview Asset Management Corporation, Trinity Investment Management Corporation, and Shareholder Services, Inc. (since March 2014); Managing Director of Morgan Stanley Investment Management Inc. and certain of its various affiliated entities; Chief Compliance Officer of various Morgan Stanley Funds (May 2010-January 2014); Chief Compliance Officer of Morgan Stanley Investment Management Inc. (April 2007-January 2014). |
| |
Brian S. Petersen, Treasurer and Principal Financial & Accounting Officer (since 2016) Year of Birth: 1970 | | Senior Vice President of OFI Global Asset Management, Inc. (since January 2017); Vice President of OFI Global Asset Management, Inc. (January 2013-January 2017); Vice President of OppenheimerFunds, Inc. (February 2007-December 2012); Assistant Vice President of OppenheimerFunds, Inc. (August 2002-2007). |
The Fund’s Statement of Additional Information contains additional information about the Fund’s Trustees and Officers and is available without charge, upon request, by calling 1.800.988.8287.
25 OPPENHEIMER GOVERNMENT MONEY FUND/VA
THIS PAGE INTENTIONALLY LEFT BLANK.
26 OPPENHEIMER GOVERNMENT MONEY FUND/VA
THIS PAGE INTENTIONALLY LEFT BLANK.
27 OPPENHEIMER GOVERNMENT MONEY FUND/VA
OPPENHEIMER GOVERNMENT MONEY FUND/VA
A Series of Oppenheimer Variable Account Funds
| | |
Manager | | OFI Global Asset Management, Inc. |
| |
Sub-Adviser | | OppenheimerFunds, Inc. |
| |
Distributor | | OppenheimerFunds Distributor, Inc. |
| |
Transfer and | | OFI Global Asset Management, Inc. |
Shareholder | | |
Servicing Agent | | |
| |
Sub-Transfer Agent | | Shareholder Services, Inc. |
| | DBA OppenheimerFunds Services |
| |
Independent | | KPMG LLP |
Registered | | |
Public | | |
Accounting | | |
Firm | | |
| |
Legal Counsel | | Ropes & Gray LLP |
| |
| | Before investing in any of the Oppenheimer funds, investors should carefully consider a fund’s investment objectives, risks, charges and expenses. Fund prospectuses and summary prospectuses contain this and other information about the funds and may be obtained by asking your financial advisor, visiting oppenheimerfunds.com or calling us at 1.800.988.8287. Read prospectuses and summary prospectuses carefully before investing. |
| |
| | © 2019 OppenheimerFunds, Inc. All rights reserved. Oppenheimer funds are distributed by OppenheimerFunds Distributor, Inc. |


December 31, 2018

ANNUAL REPORT
Listing of Top Holdings
Fund Performance Discussion
Financial Statements
PORTFOLIO MANAGERS: Hemant Baijal, Krishna Memani, Ruta Ziverte, and Chris Kelly, CFA
AVERAGE ANNUAL TOTAL RETURNS FOR THE PERIODS ENDED 12/31/18
| | | | | | | | | | | | | | | | |
| | | Inception
Date | | | 1-Year | | | 5-Year | | | 10-Year | |
Non-Service Shares | | | 5/3/93 | | | | -4.40 | % | | | 1.70 | % | | | 5.45 | % |
Service Shares | | | 3/19/01 | | | | -4.54 | | | | 1.46 | | | | 5.18 | |
Bloomberg Barclays U.S. Aggregate Bond Index | | | | | | | 0.01 | | | | 2.52 | | | | 3.48 | |
Performance data quoted represents past performance, which does not guarantee future results. The investment return and principal value of an investment in the Fund will fluctuate so that an investor’s shares, when redeemed, may be worth more or less than their original cost. Current performance may be lower or higher than the performance quoted. For performance data current to the most recent month end, call us at 1.800.988.8287. The Fund’s total returns should not be expected to be the same as the returns of other funds, whether or not both funds have the same portfolio managers and/or similar names. The Fund’s total returns include changes in share price and reinvested distributions but do not include the charges associated with the separate account products that offer this Fund. Such performance would have been lower if such charges were taken into account. Returns for periods of less than one year are cumulative and not annualized. See Fund prospectuses and summary prospectuses for more information on share classes and sales charges.
TOP HOLDINGS AND ALLOCATIONS
PORTFOLIO ALLOCATION
| | | | |
| Non-Convertible Corporate Bonds and Notes | | | 37.4 | % |
Investment Companies | | | | |
Eaton Vance Floating-Rate Income Trust | | | 0.1 | |
Oppenheimer Institutional Government Money Market Fund | | | 4.5 | |
Oppenheimer Limited-Term Bond Fund | | | 0.4 | |
Oppenheimer Master Event-Linked Bond Fund, LLC | | | 1.9 | |
Oppenheimer Master Loan Fund, LLC | | | 9.2 | |
Oppenheimer Ultra-Short Duration Fund | | | 3.2 | |
Mortgage-Backed Obligations | | | | |
Government Agency | | | 11.8 | |
Non-Agency | | | 7.1 | |
Foreign Government Obligations | | | 18.2 | |
Asset-Backed Securities | | | 2.1 | |
Preferred Stocks | | | 1.2 | |
Short-Term Notes | | | 1.2 | |
Structured Securities | | | 0.5 | |
Corporate Loans | | | 0.4 | |
Over-the-Counter Options Purchased | | | 0.4 | |
| Over-the-Counter Interest Rate Swaptions Purchased | | | 0.3 | |
Common Stocks | | | 0.1 | |
Rights, Warrants and Certificates | | | —* | |
| * | Represents a value of less than 0.05%. |
Portfolio holdings and allocations are subject to change. Percentages are as of December 31, 2018, and are based on total market value of investments.
REGIONAL ALLOCATION
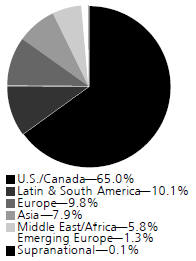
Portfolio holdings and allocations are subject to change. Percentages are as of December 31, 2018, and are based on the total market value of investments.
For more current Fund holdings, please visit oppenheimerfunds.com.
2 OPPENHEIMER GLOBAL STRATEGIC INCOME FUND/VA
Fund Performance Discussion
The Fund’sNon-Service shares produced a return of-4.40% during the reporting period, versus the 0.01% return provided by the Bloomberg Barclays U.S. Aggregate Bond Index (the “Index”).
MARKET OVERVIEW
Markets were volatile in 2018 and hit a wall in the last quarter of the year. Several shocks negatively affected market sentiment. The U.S. Federal Reserve (Fed) once again decided to hike interest rates in December 2018, as was nearly universally expected, but the post-meeting conference was more hawkish than expected.
Markets were expecting a clear message that the Fed might consider a pause in any future rate increases, but that was not initially communicated. Equity markets sold off, bonds rallied, and the U.S. dollar weakened. The sell-offs were sizable, which led some to think a recession might be imminent. It was not just the Fed making headlines; some key economic data was also weaker in December. In the U.S., economic indicators within regional surveys from the Fed and the Institute for Supply Management (ISM) sentiment surveys decreased markedly, along with acool-off in housing. Politics were once again a factor because there was little clarity from the Trump administration about the policies for tariffs on Chinese imports, and the U.S. government shutdown did not help in an environment where the appetite for risk declined.
Global economic data continued to soften, but current projections still point to global growth for 2018 and 2019, remaining around its historical average. As we enter 2019, U.S. growth momentum may slow as the boost from fiscal stimulus fades toward the second half of the year, while the Eurozone and emerging market (EM) growth should stabilize by the second half of the year, a development that could reduce the momentum gap between the U.S. and the rest of the world.
In December, the European Central Bank (ECB) ended its quantitative easing (QE) program, as widely expected, despite weakening data in the Eurozone throughout the year. ECB President Mario Draghi continued to express confidence in the Eurozone outlook with trend growth above potential and strong Eurozone fundamentals, albeit weakened data, which may be temporary. Eurozone data weaknesses seem to have stabilized in the second half of the year. The underlying forces of growth in the Eurozone, such as job creation and income growth, a revival of bank lending, and high levels of confidence, are intact and growth for the region should remain in the 1.5%–2% range.
A slowing China, tightening financial conditions, and uncertainty about the U.S.-China trade dispute were strong headwinds for Asian emerging markets for most of 2018. Third-quarter figures for gross domestic product (GDP) growth highlighted the increasing divergence between the still-robust U.S. growth and the rest of the world’s more moderate growth. Since then, the high-frequency indicators, such as Purchasing Managers’ Index (PMI) data and export numbers from Asia, point to continuing softer growth in the region, especially in China.
The emerging market economies of Latin America and select frontier African countries have seen lackluster growth, and uncertainties about global growth would prevent a meaningful appreciation in the growth cycle for these regions now. Nonetheless, we expect a growth recovery in Latin America for all countries, except for Mexico, where the U.S. slowdown, combined with uncertainties over Mexican government policy, will likely reduce growth in 2019. Growth in Latin America as a region is likely to double to 2% from last year provided Argentina’s economy stops contracting; in Argentina, we see the economic program on the right track. In Brazil, economic activity remains at a slow pace for now despite incipient signs of improvement, such as the widespread increase in consumer and business confidence indicators. We forecast a recovery toward 3% this year, assuming progress in the pension reform efforts now underway supports this more benign environment.
The U.S. economy continued to show strong growth momentum. As of the reporting period’s end, the tracking of fourth-quarter GDP data suggests the economy will finish the year at around 3% GDP growth. There are pockets of moderation, such as housing and investment expenditures that may have peaked in the second half of the year. Going forward, investment should continue to support growth. With increasingly less slack in the economy, strong profits, and the corporate tax cuts, the environment for investment is healthy. Consumers so far do not seem to be affected by market jitters and politics. At period end, early reports and anecdotes suggest that the holiday shopping period was good. Job growth is still strong, supporting both incomes and consumer confidence. Household finances are in good shape. If growth continues to be above trend, as expected, the Fed may resume its hiking cycle, but for the time being, this may be the time to take stock and observe the impact of the tightening delivered so far. In our view, it is most likely the case that the Fed has paused its rate increases and may not change rates for at least the next two to three of its Open Market Committee meetings.
3 OPPENHEIMER GLOBAL STRATEGIC INCOME FUND/VA
FUND REVIEW
The Fund’s underperformance relative to the Index this reporting period was largely the result of its allocation to emerging market local debt and emerging market credit. Monetary tightening in the U.S., the stronger U.S. dollar, and global trade tensions continued to provide headwinds for emerging markets during the reporting period, and countries with severe macro imbalances and high foreign currency funding needs such as Argentina and Turkey suffered heavy pressure in August 2018. In Argentina, the response to the sharpsell-off in the currency was a revised International Monetary Fund (IMF) program increasing its size and the speed of disbursement, which we believe will alleviate market concerns over financing and help stabilize asset prices. In Turkey’s case, the central bank hiked rates aggressively and the government announced a more realistic medium-term program with a tighter fiscal policy and steps to rebalance the economy. While emerging market local debt detracted for the overall period, performance improved in the fourth-quarter of 2018, which saw a transition from concerns over serial EM crises in Argentina and Turkey and key elections (Mexico and Brazil) to worries over a broader global growth slowdown, including the U.S., with weakening macroeconomic data, declining oil prices, and U.S.-China trade war tensions. Therisk-off sentiment intensified in November and December, particularly in U.S. equities and high-yield credit, while emerging markets proved relatively resilient by comparison as expectations for Fed hikes in 2019 declined as the communication became more dovish.
The Fund’s high yield exposure was another top detractor from performance this period, which underperformed, particularly over the volatile fourth quarter of 2018. High-yield bonds struggled in 2018 amid headwinds from rising rates, U.S.-China trade tensions, and underlying concerns surrounding “peak” earnings and the duration of the economic cycle.
Contributing positively to performance this reporting period was our exposure to leveraged loans. In sharp contrast to the first three quarters of 2018, the fourth quarter saw a dramatic shift in investor sentiment. Solid corporate fundamentals and strong technical demand helped drive stable and steady positive performance in the loan market for the first 9.5 months of 2018. However, in the fourth quarter, heightened volatility returned to the broad markets as a confluence of macro factors surfaced in concert. Despite a weak Q4, overall leveraged loan contribution to performance was a positive.
STRATEGY & OUTLOOK
We ended 2018 with increased financial market volatility, as tighter U.S. financial conditions combined with trade concerns negatively impacted the U.S. equity market. Expectations throughout the year shifted from expecting synchronized global growth to slowing global growth, with materially tighter financial conditions. During the period of heightened financial market volatility, however, emerging market assets did better relative to their developed market counterparts, as their correction had occurred earlier, particularly in the second and third quarters.
From an asset valuation perspective, EM assets are still undervalued versus developed market assets, in our view. At period end, emerging market local bonds offer real yields that are at or close to15-year highs when compared to developed market real yields. Similarly, emerging market currency levels remain attractive to us. In credit, we believe European financial subordinated debt offers value as do both emerging market hard currency sovereign debt and corporate debt. In our view, core European currency rates are on the expensive side of the spectrum versus the U.S. dollar.
Investors should consider the Fund’s investment objective, risks, charges and expenses carefully before investing. The Fund’s prospectus and summary prospectus contain this and other information about the Fund, and may be obtained by asking your financial advisor or calling us at 1.800.988.8287. Read prospectuses and summary prospectuses carefully before investing.
Total returns include changes in share price and reinvestment of dividends and capital gains distributions in a hypothetical investment for the periods shown, but do not include the charges associated with the separate account products that offer this Fund.
The views in the Fund Performance Discussion represent the opinions of this Fund’s portfolio managers and are not intended as investment advice or to predict or depict the performance of any investment. These views are as of the close of business on December 31, 2018, and are subject to change based on subsequent developments. The Fund’s portfolio and strategies are subject to change.
Shares of Oppenheimer funds are not deposits or obligations of any bank, are not guaranteed by any bank, are not insured by the FDIC or any other agency, and involve investment risks, including the possible loss of the principal amount invested.
Comparing the Fund’s Performance to the Market.The graphs that follow show the performance of a hypothetical $10,000 investment in each share class of the Fund held until December 31, 2018. Performance is measured over aten-fiscal-year period for both Classes. Performance information does not
4 OPPENHEIMER GLOBAL STRATEGIC INCOME FUND/VA
reflect charges that apply to separate accounts investing in the Fund. If these charges were taken into account, performance would be lower. The graphs assume that all dividends and capital gains distributions were reinvested in additional shares.
The Fund’s performance is compared to the performance of the Bloomberg Barclays U.S. Aggregate Bond Index, an index of U.S. Government and corporate bonds. The Index isunmanaged and cannot be purchased directly by investors. While index comparisons may be useful to provide a benchmark for the Fund’s performance, it must be noted that the Fund’s investments are not limited to the investments comprising the Index. Index performance includes reinvestment of income, but does not reflect transaction costs, fees, expenses or taxes. Index performance is shown for illustrative purposes only as a benchmark for the Fund’s performance, and does not predict or depict performance of the Fund. The Fund’s performance reflects the effects of the Fund’s business and operating expenses.
COMPARISON OF CHANGE IN VALUE OF $10,000 HYPOTHETICAL INVESTMENTS IN:
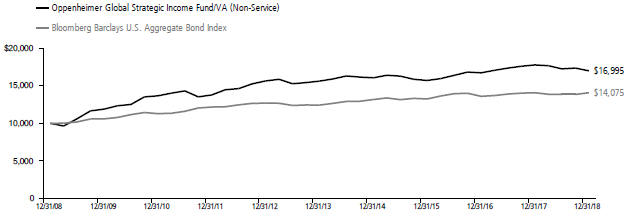
Average Annual Total Returns ofNon-Service Shares of the Fund at 12/31/18
1-Year -4.40% 5-Year 1.70% 10-Year5.45%
COMPARISON OF CHANGE IN VALUE OF $10,000 HYPOTHETICAL INVESTMENTS IN:
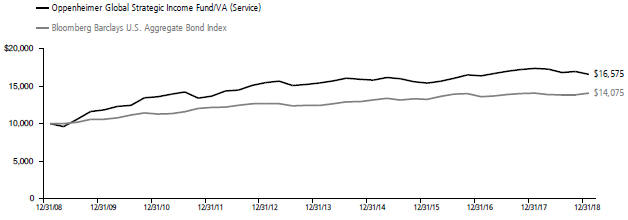
Average Annual Total Returns of Service Shares of the Fund at 12/31/18
1-Year -4.54% 5-Year 1.46% 10-Year5.18%
Performance data quoted represents past performance, which does not guarantee future results. The investment return and principal value of an investment in the Fund will fluctuate so that an investor’s shares, when redeemed, may be worth more or less than their original cost. Current performance may be lower or higher than the performance quoted. For performance data current to the most recent month end, call us at 1.800.988.8287. The Fund’s total returns should not be expected to be the same as the returns of other funds, whether or not both funds have the same portfolio managers and/or similar names. The Fund’s total returns include changes in share price and reinvested distributions but do not include the charges associated with the separate account products that offer this Fund. Such performance would have been lower if such charges were taken into account.
5 OPPENHEIMER GLOBAL STRATEGIC INCOME FUND/VA
Fund Expenses
Fund Expenses.As a shareholder of the Fund, you incur two types of costs: (1) transaction costs and (2) ongoing costs, including management fees; distribution and service fees; and other Fund expenses. These examples are intended to help you understand your ongoing costs (in dollars) of investing in the Fund and to compare these costs with the ongoing costs of investing in other mutual funds.
The examples are based on an investment of $1,000.00 invested at the beginning of the period and held for the entire6-month period ended December 31, 2018.
Actual Expenses. The first section of the table provides information about actual account values and actual expenses. You may use the information in this section for the class of shares you hold, together with the amount you invested, to estimate the expense that you paid over the period. Simply divide your account value by $1,000.00 (for example, an $8,600.00 account value divided by $1,000.00 = 8.60), then multiply the result by the number in the first section under the heading entitled “Expenses Paid During 6 Months Ended December 31, 2018” to estimate the expenses you paid on your account during this period.
Hypothetical Example for Comparison Purposes.
The second section of the table provides information about hypothetical account values and hypothetical expenses based on the Fund’s actual expense ratio for each class of shares, and an assumed rate of return of 5% per year for each class before expenses, which is not the actual return. The hypothetical account values and expenses may not be used to estimate the actual ending account balance or expenses you paid for the period. You may use this information to compare the ongoing costs of investing in the Fund and other funds. To do so, compare this 5% hypothetical example for the class of shares you hold with the 5% hypothetical examples that appear in the shareholder reports of the other funds.
Please note that the expenses shown in the table are meant to highlight your ongoing costs only and do not reflect any charges associated with the separate accounts that offer this Fund. Therefore, the “hypothetical” lines of the table are useful in comparing ongoing costs only, and will not help you determine the relative total costs of owning different funds. In addition, if these separate account charges were included your costs would have been higher.
| | | | | | | | | | | | | | | | | | | | | | |
| Actual | | Beginning
Account Value
July 1, 2018 | | | | | | Ending Account Value December 31, 2018 | | | | | | Expenses
Paid During 6 Months Ended
December 31, 2018 | | | |
| Non-Service shares | | $ | 1,000.00 | | | | | | | $ | 985.20 | | | | | | | $ | 4.16 | | | |
| Service shares | | | 1,000.00 | | | | | | | | 985.60 | | | | | | | | 5.42 | | | |
| | | | | | |
| Hypothetical | | | | | | | | | | | | | | | | | | | | | | |
| (5% return before expenses) | | | | | | | | | | | | | | | | | | | | | | |
| Non-Service shares | | | 1,000.00 | | | | | | | | 1,021.02 | | | | | | | | 4.24 | | | |
| Service shares | | | 1,000.00 | | | | | | | | 1,019.76 | | | | | | | | 5.51 | | | |
Expenses are equal to the Fund’s annualized expense ratio for that class, multiplied by the average account value over the period, multiplied by 184/365 (to reflect theone-half year period). Those annualized expense ratios, excluding indirect expenses from affiliated funds, based on the6-month period ended December 31, 2018 are as follows:
| | | | |
| Class | | Expense Ratios | |
| Non-Service shares | | | 0.83% | |
| Service shares | | | 1.08 | |
The expense ratios reflect voluntary and/or contractual waivers and/or reimbursements of expenses by the Fund’s Manager. Some of these undertakings may be modified or terminated at any time, as indicated in the Fund’s prospectus. The “Financial Highlights” tables in the Fund’s financial statements, included in this report, also show the gross expense ratios, without such waivers or reimbursements and reduction to custodian expenses, if applicable.
6 OPPENHEIMER GLOBAL STRATEGIC INCOME FUND/VA
CONSOLIDATED STATEMENT OF INVESTMENTSDecember 31, 2018
| | | | | | | | |
| | | Principal Amount | | | Value |
| Asset-Backed Securities—2.3% | |
| American Credit Acceptance Receivables Trust: | |
| Series2015-3, Cl. D, 5.86%, 7/12/221 | | $ | 275,000 | | | $ | 276,258 | |
| Series2017-3, Cl. B, 2.25%, 1/11/211 | | | 56,286 | | | | 56,238 | |
| Series2017-4, Cl. B, 2.61%, 5/10/211 | | | 180,000 | | | | 179,733 | |
| Series2017-4, Cl. C, 2.94%, 1/10/241 | | | 510,000 | | | | 507,821 | |
| Series2017-4, Cl. D, 3.57%, 1/10/241 | | | 673,000 | | | | 669,158 | |
| AmeriCredit Automobile Receivables Trust: | |
| Series2017-2, Cl. D, 3.42%, 4/18/23 | | | 830,000 | | | | 829,077 | |
| Series2017-4, Cl. D, 3.08%, 12/18/23 | | | 375,000 | | | | 370,066 | |
| Cabela’s Credit Card Master Note Trust: | |
| Series2016-1, Cl. A1, 1.78%, 6/15/22 | | | 870,000 | | | | 865,036 | |
| Series2016-1, Cl. A2, 3.305% [US0001M+85], 6/15/222 | | | 1,690,000 | | | | 1,694,786 | |
| Capital Auto Receivables Asset Trust, | |
| Series2017-1, Cl. D, 3.15%, 2/20/251 | | | 110,000 | | | | 109,760 | |
| CarMax Auto Owner Trust: | |
| Series2015-2, Cl. D, 3.04%, 11/15/21 | | | 175,000 | | | | 174,655 | |
| Series2015-3, Cl. D, 3.27%, 3/15/22 | | | 610,000 | | | | 609,304 | |
| Series2016-1, Cl. D, 3.11%, 8/15/22 | | | 465,000 | | | | 461,794 | |
| Series2017-1, Cl. D, 3.43%, 7/17/23 | | | 630,000 | | | | 629,865 | |
| Series2017-4, Cl. D, 3.30%, 5/15/24 | | | 280,000 | | | | 279,051 | |
| Series2018-1, Cl. D, 3.37%, 7/15/24 | | | 195,000 | | | | 192,865 | |
| CCG Receivables Trust: | |
| Series2017-1, Cl. B, 2.75%, 11/14/231 | | | 635,000 | | | | 627,307 | |
| Series2018-1, Cl. B, 3.09%, 6/16/251 | | | 240,000 | | | | 239,165 | |
| Series2018-1, Cl. C, 3.42%, 6/16/251 | | | 70,000 | | | | 69,758 | |
| CIG Auto Receivables Trust, Series 2017- 1A, Cl. A, 2.71%, 5/15/231 | | | 163,633 | | | | 162,668 | |
| CNH Equipment Trust, Series2017-C, Cl. B, 2.54%, 5/15/25 | | | 185,000 | | | | 182,726 | |
| CPS Auto Receivables Trust: | |
| Series2017-C, Cl. A, 1.78%, 9/15/201 | | | 31,504 | | | | 31,458 | |
| Series2017-C, Cl. B, 2.30%, 7/15/211 | | | 275,000 | | | | 273,764 | |
| Series2017-D, Cl. B, 2.43%, 1/18/221 | | | 470,000 | | | | 466,639 | |
| Series2018-A, Cl. B, 2.77%, 4/18/221 | | | 370,000 | | | | 367,104 | |
| CPS Auto Trust, Series2017-A, Cl. B, 2.68%, 5/17/211 | | | 60,000 | | | | 59,812 | |
| Credit Acceptance Auto Loan Trust: | |
| Series2017-3A, Cl. C, 3.48%, 10/15/261 | | | 565,000 | | | | 562,624 | |
| Series2018-1A, Cl. B, 3.60%, 4/15/271 | | | 360,000 | | | | 359,721 | |
| Series2018-1A, Cl. C, 3.77%, 6/15/271 | | | 510,000 | | | | 510,053 | |
| Dell Equipment Finance Trust, Series2017-2, Cl. B, 2.47%, 10/24/221 | | | 190,000 | | | | 188,368 | |
| Drive Auto Receivables Trust: | |
| Series2015-BA, Cl. D, 3.84%, 7/15/211 | | | 31,273 | | | | 31,320 | |
| Series2016-CA, Cl. D, 4.18%, 3/15/241 | | | 430,000 | | | | 432,306 | |
| Series2017-3, Cl. C, 2.80%, 7/15/22 | | | 315,000 | | | | 314,249 | |
| Series2017-BA, Cl. D, 3.72%, 10/17/221 | | | 610,000 | | | | 611,314 | |
| Series2018-1, Cl. D, 3.81%, 5/15/24 | | | 470,000 | | | | 470,991 | |
| Series2018-3, Cl. D, 4.30%, 9/16/24 | | | 175,000 | | | | 177,538 | |
| DT Auto Owner Trust: | |
| Series2016-4A, Cl. E, 6.49%, 9/15/231 | | | 200,000 | | | | 205,004 | |
| Series2017-1A, Cl. D, 3.55%, 11/15/221 | | | 440,000 | | | | 440,625 | |
| Series2017-1A, Cl. E, 5.79%, 2/15/241 | | | 415,000 | | | | 423,837 | |
| Series2017-2A, Cl. D, 3.89%, 1/15/231 | | | 495,000 | | | | 496,857 | |
| Series2017-3A, Cl. E, 5.60%, 8/15/241 | | | 380,000 | | | | 389,092 | |
| Series2017-4A, Cl. D, 3.47%, 7/17/231 | | | 560,000 | | | | 558,551 | |
| Series2017-4A, Cl. E, 5.15%, 11/15/241 | | | 390,000 | | | | 394,007 | |
| Series2018-1A, Cl. B, 3.04%, 1/18/221 | | | 410,000 | | | | 409,049 | |
| Element Rail Leasing I LLC, Series 2014- 1A, Cl. A1, 2.299%, 4/19/441 | | | 136,372 | | | | 135,267 | |
| Exeter Automobile Receivables Trust, Series2018-1A, Cl. B, 2.75%, 4/15/221 | | | 405,000 | | | | 403,151 | |
| Flagship Credit Auto Trust, Series 2016- 1, Cl. C, 6.22%, 6/15/221 | | | 980,000 | | | | 1,013,545 | |
| GLS Auto Receivables Trust, Series 2018- 1A, Cl. A, 2.82%, 7/15/223 | | | 642,252 | | | | 640,082 | |
| | | | | | | | |
| | | Principal Amount | | | Value |
| Asset-Backed Securities (Continued) | |
| GM Financial Automobile Leasing Trust, Series2017-3, Cl. C, 2.73%, 9/20/21 | | $ | 320,000 | | | $ | 317,705 | |
| Navistar Financial Dealer Note Master Owner Trust II: | |
| Series2017-1, Cl. C, 4.056% [US0001M+155], 6/27/221,2 | | | 160,000 | | | | 160,392 | |
| Series2017-1, Cl. D, 4.806% | |
| [US0001M+230], 6/27/221,2 | | | 185,000 | | | | 185,186 | |
| Santander Drive Auto Receivables Trust: | |
| Series2015-5, Cl. D, 3.65%, 12/15/21 | | | 915,000 | | | | 917,215 | |
| Series2016-2, Cl. D, 3.39%, 4/15/22 | | | 300,000 | | | | 300,565 | |
| Series2017-1, Cl. D, 3.17%, 4/17/23 | | | 440,000 | | | | 438,738 | |
| Series2017-1, Cl. E, 5.05%, 7/15/241 | | | 1,110,000 | | | | 1,137,927 | |
| Series2017-2, Cl. D, 3.49%, 7/17/23 | | | 190,000 | | | | 189,092 | |
| Series2017-3, Cl. D, 3.20%, 11/15/23 | | | 760,000 | | | | 757,052 | |
| Series2018-1, Cl. D, 3.32%, 3/15/24 | | | 290,000 | | | | 288,180 | |
| Series2018-2, Cl. D, 3.88%, 2/15/24 | | | 145,000 | | | | 146,282 | |
| Santander Retail Auto Lease Trust, Series2017-A, Cl. C, 2.96%, 11/21/221 | | | 505,000 | | | | 501,788 | |
| TCF Auto Receivables Owner Trust, Series2015-1A, Cl. D, 3.53%, 3/15/221 | | | 285,000 | | | | 284,123 | |
| United Auto Credit Securitization Trust, Series2018-1, Cl. C, 3.05%, 9/10/211 | | | 625,000 | | | | 622,752 | |
| Veros Automobile Receivables Trust, Series2017-1, Cl. A, 2.84%, 4/17/231 | | | 134,703 | | | | 134,317 | |
| Westlake Automobile Receivables Trust: | |
| Series2016-1A, Cl. E, 6.52%, 6/15/221 | | | 670,000 | | | | 675,302 | |
| Series2017-2A, Cl. E, 4.63%, 7/15/241 | | | 685,000 | | | | 685,822 | |
| Series2018-1A, Cl. C, 2.92%, 5/15/231 | | | 420,000 | | | | 416,221 | |
| Series2018-1A, Cl. D, 3.41%, 5/15/231 | | | 845,000 | | | | 839,362 | |
| World Financial Network Credit Card Master Trust: | |
| Series2012-D, Cl. A, 2.15%, 4/17/23 | | | 420,000 | | | | 418,250 | |
| Series2017-A, Cl. A, 2.12%, 3/15/24 | | | 1,125,000 | | | | 1,110,081 | |
| Series2017-C, Cl. A, 2.31%, 8/15/24 | | | 1,130,000 | | | | 1,114,685 | |
| Series2018-A, Cl. A, 3.07%, 12/16/24 | | | 1,440,000 | | | | 1,436,482 | |
| Series2018-C, Cl. A, 3.55%, 8/15/25 | | | 415,000 | | | | 420,564 | |
| Total Asset-Backed Securities (Cost $33,131,944) | | | | 33,051,502 | |
| | | | | |
| Mortgage-Backed Obligations—20.9% | |
|
| Government Agency—13.1% | |
|
| FHLMC/FNMA/FHLB/Sponsored—12.3% | |
| Federal Home Loan Mortgage Corp. Gold Pool: | |
| 5.00%, 9/1/33 | | | 203,915 | | | | 216,550 | |
| 5.50%, 9/1/39 | | | 226,927 | | | | 240,722 | |
| 6.00%, 11/1/21 | | | 26,116 | | | | 28,104 | |
| 6.50%,4/1/19-8/1/32 | | | 170,820 | | | | 186,829 | |
| 7.00%,10/1/31-10/1/37 | | | 36,760 | | | | 40,435 | |
| 7.50%, 1/1/32 | | | 203,446 | | | | 237,421 | |
| Federal Home Loan Mortgage Corp., Interest-Only Stripped Mtg.-Backed Security: | |
| Series 192,Cl. IO, 99.999%, 2/1/284 | | | 4,283 | | | | 856 | |
| Series 205,Cl. IO, 58.037%, 9/1/294 | | | 24,466 | | | | 5,121 | |
| Series 243,Cl. 6, 0.00%, 12/15/324,5 | | | 54,598 | | | | 10,397 | |
| Federal Home Loan Mortgage Corp., Real Estate Mtg. Investment Conduit Multiclass Pass-Through Certificates: | |
| Series 1360,Cl. PZ, 7.50%, 9/15/22 | | | 160,003 | | | | 168,380 | |
| Series 151,Cl. F, 9.00%, 5/15/21 | | | 959 | | | | 979 | |
| Series 1674,Cl. Z, 6.75%, 2/15/24 | | | 80,243 | | | | 84,820 | |
| Series 1897,Cl. K, 7.00%, 9/15/26 | | | 315,068 | | | | 342,240 | |
| Series 2043,Cl. ZP, 6.50%, 4/15/28 | | | 131,809 | | | | 145,320 | |
| Series 2106,Cl. FG, 2.905% | |
| [LIBOR01M+45], 12/15/282 | | | 229,426 | | | | 230,029 | |
| Series 2122,Cl. F, 2.905% | |
| [LIBOR01M+45], 2/15/292 | | | 6,272 | | | | 6,274 | |
| Series 2148,Cl. ZA, 6.00%, 4/15/29 | | | 130,652 | | | | 141,575 | |
| Series 2195,Cl. LH, 6.50%, 10/15/29 | | | 92,361 | | | | 101,100 | |
| Series 2326,Cl. ZP, 6.50%, 6/15/31 | | | 12,436 | | | | 13,483 | |
| Series 2344,Cl. FP, 3.405% | |
| [LIBOR01M+95], 8/15/312 | | | 61,365 | | | | 63,013 | |
| Series 2368,Cl. PR, 6.50%, 10/15/31 | | | 43,023 | | | | 47,731 | |
7 OPPENHEIMER GLOBAL STRATEGIC INCOME FUND/VA
CONSOLIDATED STATEMENT OF INVESTMENTSContinued
| | | | | | | | |
| | | Principal Amount | | | Value |
| |
| FHLMC/FNMA/FHLB/Sponsored (Continued) | |
| Federal Home Loan Mortgage Corp., Real Estate Mtg. Investment Conduit Multiclass Pass-Through Certificates: (Continued) | |
| Series 2412,Cl. GF, 3.405% [LIBOR01M+95], 2/15/322 | | $ | 75,176 | | | $ | 77,241 | |
| Series 2449,Cl. FL, 3.005% [LIBOR01M+55], 1/15/322 | | | 69,215 | | | | 70,187 | |
| Series 2451,Cl. FD, 3.455% | |
| [LIBOR01M+100], 3/15/322 | | | 31,762 | | | | 32,495 | |
| Series 2461,Cl. PZ, 6.50%, 6/15/32 | | | 156,706 | | | | 171,145 | |
| Series 2464,Cl. FI, 3.455% [LIBOR01M+100], 2/15/322 | | | 29,343 | | | | 30,027 | |
| Series 2470,Cl. AF, 3.455% [LIBOR01M+100], 3/15/322 | | | 54,495 | | | | 56,071 | |
| Series 2470,Cl. LF, 3.455% [LIBOR01M+100], 2/15/322 | | | 30,028 | | | | 30,729 | |
| Series 2477,Cl. FZ, 3.005% [LIBOR01M+55], 6/15/312 | | | 120,237 | | | | 120,961 | |
| Series 2517,Cl. GF, 3.455% [LIBOR01M+100], 2/15/322 | | | 26,108 | | | | 26,717 | |
| Series 2635,Cl. AG, 3.50%, 5/15/32 | | | 39,617 | | | | 39,728 | |
| Series 2676,Cl. KY, 5.00%, 9/15/23 | | | 350,677 | | | | 357,991 | |
| Series 2770,Cl. TW, 4.50%, 3/15/19 | | | 354 | | | | 354 | |
| Series 3025,Cl. SJ, 15.748%[-3.667 x LIBOR01M+2,475], 8/15/352 | | | 74,581 | | | | 106,592 | |
| Series 3815,Cl. BD, 3.00%, 10/15/20 | | | 17 | | | | 17 | |
| Series 3848,Cl. WL, 4.00%, 4/15/40 | | | 94,329 | | | | 95,293 | |
| Series 3857,Cl. GL, 3.00%, 5/15/40 | | | 4,651 | | | | 4,705 | |
| Series 3917,Cl. BA, 4.00%, 6/15/38 | | | 55,120 | | | | 56,287 | |
| Series 4221,Cl. HJ, 1.50%, 7/15/23 | | | 134,337 | | | | 131,162 | |
| Federal Home Loan Mortgage Corp., Real Estate Mtg. Investment Conduit Multiclass Pass-Through Certificates, Interest-Only Stripped Mtg.-Backed Security: | |
| Series 2074,Cl. S, 99.999%, 7/17/284 | | | 5,888 | | | | 554 | |
| Series 2079,Cl. S, 99.999%, 7/17/284 | | | 10,710 | | | | 1,217 | |
| Series 2136,Cl. SG, 33.37%, 3/15/294 | | | 332,952 | | | | 45,380 | |
| Series 2399,Cl. SG, 99.999%, 12/15/264 | | | 169,710 | | | | 21,381 | |
| Series 2437,Cl. SB, 44.68%, 4/15/324 | | | 570,445 | | | | 77,142 | |
| Series 2526,Cl. SE, 52.359%, 6/15/294 | | | 11,710 | | | | 1,888 | |
| Series 2682,Cl. TQ, 99.999%, 10/15/334 | | | 125,164 | | | | 18,604 | |
| Series 2795,Cl. SH, 56.469%, 3/15/244 | | | 200,778 | | | | 12,430 | |
| Series 2920,Cl. S, 44.609%, 1/15/354 | | | 131,200 | | | | 18,519 | |
| Series 2922,Cl. SE, 18.046%, 2/15/354 | | | 22,203 | | | | 2,890 | |
| Series 2981,Cl. AS, 0.453%, 5/15/354 | | | 200,734 | | | | 24,129 | |
| Series 2981,Cl. BS, 99.999%, 5/15/354 | | | 256,755 | | | | 36,556 | |
| Series 3397,Cl. GS, 0.00%, 12/15/374,5 | | | 89,709 | | | | 14,694 | |
| Series 3424,Cl. EI, 0.00%, 4/15/384,5 | | | 27,938 | | | | 2,483 | |
| Series 3450,Cl. BI, 10.192%, 5/15/384 | | | 145,680 | | | | 19,804 | |
| Series 3606,Cl. SN, 11.375%, 12/15/394 | | | 43,336 | | | | 5,258 | |
| Series 3659,Cl. IE, 0.00%, 3/15/194,5 | | | 443 | | | | 1 | |
| Federal National Mortgage Assn.: | |
| 2.50%, 1/1/346 | | | 5,145,000 | | | | 5,025,173 | |
| 3.00%,1/1/34-1/1/496 | | | 10,425,000 | | | | 10,268,553 | |
| 3.50%,1/1/34-1/1/496 | | | 34,550,000 | | | | 34,643,356 | |
| 4.00%,1/1/34-1/1/496 | | | 20,860,000 | | | | 21,287,223 | |
| 4.50%, 1/1/496 | | | 82,465,000 | | | | 85,445,870 | |
| 5.00%, 1/1/496 | | | 8,605,000 | | | | 9,017,549 | |
| Federal National Mortgage Assn. Pool: | |
| 5.00%,7/1/19-7/1/33 | | | 232,305 | | | | 245,982 | |
| 5.50%,4/1/21-5/1/36 | | | 129,379 | | | | 138,106 | |
| 6.50%,12/1/29-1/1/34 | | | 376,627 | | | | 418,637 | |
| 7.00%,1/1/30-6/1/34 | | | 481,993 | | | | 544,890 | |
| 7.50%,2/1/27-3/1/33 | | | 644,083 | | | | 742,957 | |
| 8.50%, 7/1/32 | | | 484 | | | | 490 | |
| Federal National Mortgage Assn., Interest-Only Stripped Mtg.-Backed Security: | |
| Series 214,Cl. 2, 99.999%, 3/25/234 | | | 55,311 | | | | 5,867 | |
| Series 221,Cl. 2, 99.999%, 5/25/234 | | | 6,790 | | | | 790 | |
| Series 254,Cl. 2, 99.999%, 1/25/244 | | | 117,319 | | | | 15,685 | |
| Series 301,Cl. 2, 19.788%, 4/25/294 | | | 25,451 | | | | 5,188 | |
| Series 313,Cl. 2, 99.999%, 6/25/314 | | | 268,093 | | | | 60,608 | |
| | | | | | | | |
| | | Principal Amount | | | Value |
| |
| FHLMC/FNMA/FHLB/Sponsored (Continued) | |
| Federal National Mortgage Assn., Interest-Only Stripped Mtg.-Backed Security: (Continued) | |
| Series 319,Cl. 2, 1.114%, 2/25/324 | | $ | 127,824 | | | $ | 28,572 | |
| Series 321,Cl. 2, 28.744%, 4/25/324 | | | 38,369 | | | | 9,013 | |
| Series 324,Cl. 2, 0.00%, 7/25/324,5 | | | 37,998 | | | | 8,861 | |
| Series 328,Cl. 2, 0.00%, 12/25/324,5 | | | 75,734 | | | | 17,354 | |
| Series 331,Cl. 5, 2.464%, 2/25/334 | | | 145,154 | | | | 25,916 | |
| Series 332,Cl. 2, 0.00%, 3/25/334,5 | | | 618,310 | | | | 143,140 | |
| Series 334,Cl. 12, 0.00%, 3/25/334,5 | | | 118,066 | | | | 24,856 | |
| Series 339,Cl. 15, 6.304%, 10/25/334 | | | 344,933 | | | | 75,639 | |
| Series 345,Cl. 9, 0.00%, 1/25/344,5 | | | 109,562 | | | | 24,796 | |
| Series 351,Cl. 10, 0.00%, 4/25/344,5 | | | 66,634 | | | | 14,042 | |
| Series 351,Cl. 8, 0.00%, 4/25/344,5 | | | 120,574 | | | | 23,554 | |
| Series 356,Cl. 10, 0.00%, 6/25/354,5 | | | 84,328 | | | | 17,049 | |
| Series 356,Cl. 12, 0.00%, 2/25/354,5 | | | 41,622 | | | | 9,002 | |
| Series 362,Cl. 13, 0.00%, 8/25/354,5 | | | 54,976 | | | | 11,323 | |
| Federal National Mortgage Assn., Real Estate Mtg. Investment Conduit Multiclass Pass- Through Certificates: | |
| Series1999-54,Cl. LH, 6.50%, 11/25/29 | | | 80,474 | | | | 87,596 | |
| Series2001-80,Cl. ZB, 6.00%, 1/25/32 | | | 67,920 | | | | 72,751 | |
| Series2002-29,Cl. F, 3.506% [LIBOR01M+100], 4/25/322 | | | 33,065 | | | | 33,862 | |
| Series2002-64,Cl. FJ, 3.506% [LIBOR01M+100], 4/25/322 | | | 10,182 | | | | 10,427 | |
| Series2002-68,Cl. FH, 2.955% [LIBOR01M+50], 10/18/322 | | | 22,275 | | | | 22,375 | |
| Series2002-84,Cl. FB, 3.506% [LIBOR01M+100], 12/25/322 | | | 141,353 | | | | 144,894 | |
| Series2002-90,Cl. FH, 3.006% [LIBOR01M+50], 9/25/322 | | | 79,087 | | | | 79,397 | |
| Series2003-11,Cl. FA, 3.506% [LIBOR01M+100], 9/25/322 | | | 141,356 | | | | 144,077 | |
| Series2003-116,Cl. FA, 2.906% [LIBOR01M+40], 11/25/332 | | | 14,565 | | | | 14,581 | |
| Series2004-25,Cl. PC, 5.50%, 1/25/34 | | | 2,134 | | | | 2,134 | |
| Series2005-109,Cl. AH, 5.50%, 12/25/25 | | | 494,729 | | | | 507,976 | |
| Series2005-31,Cl. PB, 5.50%, 4/25/35 | | | 560,000 | | | | 613,088 | |
| Series2005-71,Cl. DB, 4.50%, 8/25/25 | | | 69,269 | | | | 70,161 | |
| Series2006-11,Cl. PS, 15.377%[-3.667 x LIBOR01M+2,456.67], 3/25/362 | | | 72,310 | | | | 103,934 | |
| Series2006-46,Cl. SW, 15.01%[-3.667 x LIBOR01M+2,419.92], 6/25/362 | | | 109,315 | | | | 151,246 | |
| Series2008-75,Cl. DB, 4.50%, 9/25/23 | | | 133 | | | | 133 | |
| Series2009-113,Cl. DB, 3.00%, 12/25/20 | | | 6,316 | | | | 6,287 | |
| Series2009-36,Cl. FA, 3.446% [LIBOR01M+94], 6/25/372 | | | 18,007 | | | | 18,416 | |
| Series2009-70,Cl. TL, 4.00%, 8/25/19 | | | 223 | | | | 223 | |
| Series2010-43,Cl. KG, 3.00%, 1/25/21 | | | 6,999 | | | | 6,986 | |
| Series2011-122,Cl. EC, 1.50%, 1/25/20 | | | 3,959 | | | | 3,924 | |
| Series2011-15,Cl. DA, 4.00%, 3/25/41 | | | 43,058 | | | | 43,444 | |
| Series2011-3,Cl. EL, 3.00%, 5/25/20 | | | 6,148 | | | | 6,125 | |
| Series2011-3,Cl. KA, 5.00%, 4/25/40 | | | 120,181 | | | | 125,271 | |
| Series2011-38,Cl. AH, 2.75%, 5/25/20 | | | 5 | | | | 5 | |
| Series2011-6,Cl. BA, 2.75%, 6/25/20 | | | 3,350 | | | | 3,366 | |
| Series2011-82,Cl. AD, 4.00%, 8/25/26 | | | 26,553 | | | | 26,497 | |
| Series2012-20,Cl. FD, 2.906% [LIBOR01M+40], 3/25/422 | | | 175,120 | | | | 175,239 | |
| Federal National Mortgage Assn., Real Estate Mtg. Investment Conduit Multiclass Pass- Through Certificates, Interest-Only Stripped Mtg.-Backed Security: | |
| Series2001-61,Cl. SH, 35.04%, 11/18/314 | | | 36,317 | | | | 6,050 | |
| Series2001-63,Cl. SD, 47.484%, 12/18/314 | | | 9,335 | | | | 1,384 | |
| Series2001-68,Cl. SC, 39.467%, 11/25/314 | | | 6,771 | | | | 1,058 | |
| Series2001-81,Cl. S, 41.987%, 1/25/324 | | | 7,964 | | | | 1,384 | |
8 OPPENHEIMER GLOBAL STRATEGIC INCOME FUND/VA
| | | | | | | | |
| | | Principal Amount | | | Value |
| |
| FHLMC/FNMA/FHLB/Sponsored (Continued) | |
| Federal National Mortgage Assn., Real Estate Mtg. Investment Conduit Multiclass Pass-Through Certificates, Interest-Only Stripped Mtg.-Backed Security: (Continued) | |
| Series2002-28,Cl. SA, 29.978%, 4/25/324 | | $ | 5,834 | | | $ | 1,023 | |
| Series2002-38,Cl. SO, 63.721%, 4/25/324 | | | 39,738 | | | | 6,093 | |
| Series2002-48,Cl. S, 35.381%, 7/25/324 | | | 8,622 | | | | 1,642 | |
| Series2002-52,Cl. SL, 28.049%, 9/25/324 | | | 5,862 | | | | 1,068 | |
| Series2002-56,Cl. SN, 36.479%, 7/25/324 | | | 11,848 | | | | 2,257 | |
| Series2002-77,Cl. IS, 51.864%, 12/18/324 | | | 67,702 | | | | 11,692 | |
| Series2002-77,Cl. SH, 37.95%, 12/18/324 | | | 11,234 | | | | 1,796 | |
| Series2002-9,Cl. MS, 27.535%, 3/25/324 | | | 10,683 | | | | 2,013 | |
| Series2003-13,Cl. IO, 48.938%, 3/25/334 | | | 117,536 | | | | 27,636 | |
| Series2003-26,Cl. DI, 53.764%, 4/25/334 | | | 94,534 | | | | 24,168 | |
| Series2003-33,Cl. SP, 28.697%, 5/25/334 | | | 63,730 | | | | 12,277 | |
| Series2003-4,Cl. S, 19.129%, 2/25/334 | | | 18,199 | | | | 3,315 | |
| Series2004-56,Cl. SE, 1.947%, 10/25/334 | | | 302,624 | | | | 49,897 | |
| Series2005-12,Cl. SC, 24.477%, 3/25/354 | | | 9,977 | | | | 1,365 | |
| Series2005-14,Cl. SE, 39.168%, 3/25/354 | | | 374,103 | | | | 45,943 | |
| Series2005-40,Cl. SA, 42.441%, 5/25/354 | | | 324,904 | | | | 48,029 | |
| Series2005-40,Cl. SB, 99.999%, 5/25/354 | | | 522,087 | | | | 63,087 | |
| Series2005-52,Cl. JH, 23.407%, 5/25/354 | | | 188,531 | | | | 24,009 | |
| Series2005-63,Cl. SA, 28.045%, 10/25/314 | | | 17,525 | | | | 2,284 | |
| Series2006-90,Cl. SX, 99.999%, 9/25/364 | | | 360,745 | | | | 62,180 | |
| Series2007-88,Cl. XI, 0.00%, 6/25/374,5 | | | 344,645 | | | | 52,419 | |
| Series2008-55,Cl. SA, 0.00%, 7/25/384,5 | | | 24,027 | | | | 2,433 | |
| Series2009-8,Cl. BS, 0.00%, 2/25/244,5 | | | 853 | | | | 44 | |
| Series2010-95,Cl. DI, 0.00%, 11/25/204,5 | | | 20,856 | | | | 234 | |
| Series2011-96,Cl. SA, 4.21%, 10/25/414 | | | 145,876 | | | | 21,755 | |
| Series2012-134,Cl. SA, 0.29%, 12/25/424 | | | 482,900 | | | | 87,000 | |
| Series2012-40,Cl. PI, 10.751%, 4/25/414 | | | 773,708 | | | | 116,943 | |
| Federal National Mortgage Assn., Stripped Mtg.-Backed Security, Series 302, Cl. 2, 6.00%, 5/1/29 | | | 3 | | | | 1 | |
| | | | | | | | |
| | | | 175,478,946 | |
|
| |
| |
| GNMA/Guaranteed—0.8% | |
| Government National Mortgage Assn. I Pool: | |
| 7.00%,4/15/28-7/15/28 | | | 45,850 | | | | 49,569 | |
| 8.00%, 5/15/26 | | | 7,855 | | | | 7,868 | |
| Government National Mortgage Assn. II Pool: | |
| 3.125% [H15T1Y+150], 11/20/252 | | | 1,941 | | | | 1,993 | |
| 3.50%, 1/1/496 | | | 11,310,000 | | | | 11,388,014 | |
| Government National Mortgage Assn., Interest-Only Stripped Mtg.-Backed Security: | |
| Series2007-17,Cl. AI, 35.389%, 4/16/374 | | | 192,352 | | | | 26,742 | |
| | | | | | | | |
| | | Principal Amount | | | Value |
| |
| GNMA/Guaranteed (Continued) | |
| Government National Mortgage Assn., Interest-Only Stripped Mtg.-Backed Security: (Continued) | |
| Series2011-52,Cl. HS, 16.599%, 4/16/414 | | $ | 323,519 | | | $ | 44,921 | |
| | | | 11,519,107 | |
| | | | | |
| |
| Non-Agency—7.8% | |
| |
| Commercial—3.5% | |
| BCAP LLC Trust: | |
| Series2011-R11,Cl. 18A5, 4.79% [H15T1Y+210], 9/26/351,2 | | | 23,532 | | | | 23,589 | |
| Series2012-RR6,Cl. RR6, 2.054%, 11/26/361 | | | 27,427 | | | | 27,354 | |
| Benchmark Mortgage Trust, Interest-Only Commercial Mtg. Pass-Through Certificates, Series2018-B1, Cl. XA, 0.00%, 1/15/514,5 | | | 5,737,781 | | | | 211,785 | |
| CD Mortgage Trust, Interest-Only Commercial Mtg. Pass-Through Certificates, Series 2017- CD6, Cl. XA, 0.00%, 11/13/504,5 | | | 2,308,758 | | | | 133,894 | |
| Chase Mortgage Finance Trust, Series 2005- A2, Cl. 1A3, 4.032%, 1/25/367 | | | 11,290 | | | | 10,666 | |
| Citigroup Commercial Mortgage Trust: | |
| Series2012-GC8,Cl. AAB, 2.608%, 9/10/45 | | | 243,633 | | | | 241,747 | |
| Series 2014-GC21,Cl. AAB, 3.477%, 5/10/47 | | | 270,000 | | | | 273,847 | |
| Citigroup Commercial Mortgage Trust, Interest-Only Commercial Mtg. Pass-Through Certificates, Series2017-C4, Cl. XA, 11.937%, 10/12/504 | | | 6,126,835 | | | | 424,562 | |
| COMM Mortgage Trust: | |
| Series2013-CR6,Cl. AM, 3.147%, 3/10/461 | | | 960,000 | | | | 949,443 | |
| Series 2014-CR17,Cl. ASB, 3.598%, 5/10/47 | | | 870,000 | | | | 883,355 | |
| Series 2014-CR20,Cl. ASB, 3.305%, 11/10/47 | | | 180,000 | | | | 181,843 | |
| Series 2014-CR21,Cl. AM, 3.987%, 12/10/47 | | | 25,000 | | | | 25,311 | |
| Series 2014-LC15,Cl. AM, 4.198%, 4/10/47 | | | 455,000 | | | | 469,160 | |
| Series 2014-UBS6,Cl. AM, 4.048%, 12/10/47 | | | 1,600,000 | | | | 1,609,895 | |
| Series 2015-CR22,Cl. A2, 2.856%, 3/10/48 | | | 305,000 | | | | 304,182 | |
| COMM Mortgage Trust, Interest-Only Stripped Mtg.-Backed Security, Series2012-CR5, Cl. XA, 0.00%, 12/10/454,5 | | | 2,559,184 | | | | 128,423 | |
| DeutscheAlt-B Securities, Inc. Mortgage Loan Trust, Series2006-AB2, Cl. A1, 5.307%, 6/25/367 | | | 45,760 | | | | 42,985 | |
| Deutsche Mortgage Securities, Inc., Series2013-RS1, Cl. 1A2, 2.69% [US0001M+22], 7/22/361,2 | | | 5,060,144 | | | | 4,911,038 | |
| FREMF Mortgage Trust: | |
| Series2012-K20,Cl. C, 3.87%, 5/25/451,7 | | | 4,165,000 | | | | 4,138,571 | |
| Series2013-K25,Cl. C, 3.619%, 11/25/451,7 | | | 135,000 | | | | 132,738 | |
| Series2013-K26,Cl. C, 3.598%, 12/25/451,7 | | | 95,000 | | | | 93,307 | |
| Series2013-K27,Cl. C, 3.496%, 1/25/461,7 | | | 1,460,000 | | | | 1,427,730 | |
| Series2013-K28,Cl. C, 3.49%, 6/25/461,7 | | | 2,330,000 | | | | 2,276,908 | |
| Series2013-K29,Cl. C, 3.481%, 5/25/461,7 | | | 2,300,000 | | | | 2,211,665 | |
| Series 2013-K713,Cl. C, 3.154%, 4/25/461,7 | | | 535,000 | | | | 532,968 | |
9 OPPENHEIMER GLOBAL STRATEGIC INCOME FUND/VA
CONSOLIDATED STATEMENT OF INVESTMENTSContinued
| | | | | | | | |
| | | Principal Amount | | | Value |
| |
| Commercial (Continued) | |
| FREMF Mortgage Trust: (Continued) | |
| Series 2014-K714,Cl. C, 3.854%, 1/25/471,7 | | $ | 400,000 | | | $ | 402,832 | |
| Series2015-K44,Cl. B, 3.683%, 1/25/481,7 | | | 2,310,000 | | | | 2,255,272 | |
| Series2015-K45,Cl. B, 3.591%, 4/25/481,7 | | | 4,646,000 | | | | 4,517,326 | |
| Series2017-K62,Cl. B, 3.875%, 1/25/501,7 | | | 280,000 | | | | 271,794 | |
| Series 2017-K724,Cl. B, 3.487%, 11/25/231,7 | | | 1,535,000 | | | | 1,524,082 | |
| GS Mortgage Securities Corp. Trust, Series 2012-SHOP, Cl. A, 2.933%, 6/5/311 | | | 1,200,000 | | | | 1,197,676 | |
| GS Mortgage Securities Trust: | |
| Series 2013-GC12,Cl. AAB, 2.678%, 6/10/46 | | | 83,598 | | | | 82,753 | |
| Series 2013-GC16,Cl. AS, 4.649%, 11/10/46 | | | 160,000 | | | | 168,756 | |
| Series 2014-GC18,Cl. AAB, 3.648%, 1/10/47 | | | 235,000 | | | | 237,581 | |
| JP Morgan Chase Commercial Mortgage Securities Trust: | |
| Series2012-C6,Cl. ASB, 3.144%, 5/15/45 | | | 335,820 | | | | 334,730 | |
| Series2012-LC9,Cl. A4, 2.611%, 12/15/47 | | | 28,642 | | | | 28,559 | |
| Series2013-C10,Cl. AS, 3.372%, 12/15/47 | | | 855,000 | | | | 846,383 | |
| Series2013-C16,Cl. AS, 4.517%, 12/15/46 | | | 820,000 | | | | 848,767 | |
| Series 2013-LC11,Cl. AS, 3.216%, 4/15/46 | | | 235,000 | | | | 230,763 | |
| Series2014-C20,Cl. AS, 4.043%, 7/15/47 | | | 630,000 | | | | 635,979 | |
| Series2016-JP3,Cl. A2, 2.435%, 8/15/49 | | | 543,707 | | | | 532,853 | |
| JP Morgan Mortgage Trust, Series2007-A1, Cl. 5A1, 4.327%, 7/25/357 | | | 45,630 | | | | 46,870 | |
| JP Morgan Resecuritization Trust, Series 2009-5, Cl. 1A2, 4.434%, 7/26/361,7 | | | 2,142,141 | | | | 2,147,240 | |
| JPMBB Commercial Mortgage Securities Trust: | |
| Series2013-C17,Cl. ASB, 3.705%, 1/15/47 | | | 194,016 | | | | 196,191 | |
| Series2014-C18,Cl. A3, 3.578%, 2/15/47 | | | 295,000 | | | | 296,065 | |
| Series2014-C19,Cl. ASB, 3.584%, 4/15/47 | | | 110,000 | | | | 110,667 | |
| Series2014-C24,Cl. B, 4.116%, 11/15/477 | | | 680,000 | | | | 675,846 | |
| Series2014-C25,Cl. AS, 4.065%, 11/15/47 | | | 1,720,000 | | | | 1,735,519 | |
| Series2014-C26,Cl. AS, 3.80%, 1/15/48 | | | 1,515,000 | | | | 1,507,707 | |
| Morgan Stanley Bank of America Merrill Lynch Trust: | |
| Series2013-C7,Cl. AAB, 2.469%, 2/15/46 | | | 235,732 | | | | 232,947 | |
| Series2013-C9,Cl. AS, 3.456%, 5/15/46 | | | 570,000 | | | | 569,317 | |
| Series2014-C14,Cl. B, 4.674%, 2/15/477 | | | 240,000 | | | | 250,994 | |
| Morgan Stanley Capital I, Inc., Interest-Only Commercial Mtg. Pass-Through Certificates, Series2017-HR2, Cl. XA, 0.00%, 12/15/504,5 | | | 2,013,393 | | | | 112,504 | |
| Morgan StanleyRe-Remic Trust, Series 2012- R3, Cl. 1A, 3.667%, 11/26/361,7 | | | 3,732 | | | | 3,721 | |
| Morgan Stanley Resecuritization Trust, Series2013-R9, Cl. 3A, 3.60%, 6/26/461,7 | | | 48,897 | | | | 48,798 | |
| Structured Adjustable Rate Mortgage Loan Trust, Series2004-10, Cl. 2A, 4.30%, 8/25/347 | | | 1,975,497 | | | | 1,975,108 | |
| UBS Commercial Mortgage Trust, Interest-Only Commercial Mtg. Pass-Through Certificates, Series2017-C5, Cl. XA, 0.00%, 11/15/504,5 | | | 3,813,212 | | | | 239,800 | |
| | | | | | | | |
| | | Principal Amount | | | Value |
| |
| Commercial (Continued) | |
| UBS-Barclays Commercial Mortgage Trust, Series2012-C2, Cl. E, 4.892%, 5/10/631,7 | | $ | 930,000 | | | $ | 789,285 | |
| Wells Fargo Commercial Mortgage Trust, Series 2015-NXS1, Cl. ASB, 2.934%, 5/15/48 | | | 940,000 | | | | 934,507 | |
| Wells Fargo Commercial Mortgage Trust, Interest-Only Commercial Mtg. Pass-Through Certificates, Series2017-C42, Cl. XA, 0.00%, 12/15/504,5 | | | 2,798,996 | | | | 178,245 | |
| WF-RBS Commercial Mortgage Trust: | |
| Series2013-C14,Cl. AS, 3.488%, 6/15/46 | | | 640,000 | | | | 638,532 | |
| Series2014-C20,Cl. AS, 4.176%, 5/15/47 | | | 490,000 | | | | 506,111 | |
| Series2014-C22,Cl. A3, 3.528%, 9/15/57 | | | 120,000 | | | | 121,197 | |
| Series 2014-LC14,Cl. AS, 4.351%, 3/15/477 | | | 395,000 | | | | 401,756 | |
| WF-RBS Commercial Mortgage Trust, Interest-Only Commercial Mtg. Pass-Through Certificates, Series2011-C3, Cl. XA, 0.00%, 3/15/441,4,5 | | | 3,024,070 | | | | 75,828 | |
| | | | 49,577,827 | |
| |
| Multi-Family—0.0% | |
| Connecticut Avenue Securities, Series 2017- C04, Cl. 2M1, 3.356% [US0001M+85], 11/25/292 | | | 609,314 | | | | 609,491 | |
|
| |
| |
| Residential—4.3% | |
| Banc of America Funding Trust, Series 2014- R7, Cl. 3A1, 4.607%, 3/26/361,7 | | | 23,669 | | | | 23,741 | |
| Bear Stearns ARM Trust, Series2006-1, Cl. A1, 4.91% [H15T1Y+225], 2/25/362 | | | 34,654 | | | | 34,930 | |
| CHL Mortgage Pass-Through Trust: | |
| Series2005-17,Cl. 1A8, 5.50%, 9/25/35 | | | 499,645 | | | | 491,873 | |
| Series2005-J4,Cl. A7, 5.50%, 11/25/35 | | | 480,061 | | | | 478,679 | |
| Citigroup Mortgage Loan Trust, Inc.: | |
| Series2005-2,Cl. 1A3, 4.439%, 5/25/357 | | | 545,383 | | | | 548,955 | |
| Series2006-AR1,Cl. 1A1, 4.28% [H15T1Y+240], 10/25/352 | | | 158,212 | | | | 159,860 | |
| Series2009-8,Cl. 7A2, 4.608%, 3/25/361,7 | | | 6,700,659 | | | | 6,678,108 | |
| Series2014-8,Cl. 1A2, 2.76% [US0001M+29], 7/20/361,2 | | | 3,400,000 | | | | 3,337,075 | |
| Connecticut Avenue Securities: | |
| Series2014-C03,Cl. 1M2, 5.506% [US0001M+300], 7/25/242 | | | 827,158 | | | | 870,401 | |
| Series2016-C03,Cl. 1M1, 4.506% [US0001M+200], 10/25/282 | | | 143,134 | | | | 144,308 | |
| Series2016-C07,Cl. 2M1, 3.806% [US0001M+130], 5/25/292 | | | 182,949 | | | | 183,169 | |
| Series2017-C01,Cl. 1M2, 6.056% [US0001M+355], 7/25/292 | | | 4,140,000 | | | | 4,392,406 | |
| Series2017-C02,Cl. 2M1, 3.656% [US0001M+115], 9/25/292 | | | 905,658 | | | | 907,948 | |
| Series2017-C03,Cl. 1M1, 3.456% [US0001M+95], 10/25/292 | | | 893,134 | | | | 894,158 | |
| Series2017-C06,Cl. 1M1, 3.256% [US0001M+75], 2/25/302 | | | 196,701 | | | | 196,559 | |
| Series2017-C07,Cl. 1M1, 3.156% [US0001M+65], 5/25/302 | | | 552,088 | | | | 551,003 | |
| Series2017-C07,Cl. 1M2, 4.906% [US0001M+240], 5/25/302 | | | 580,000 | | | | 585,002 | |
| Series2017-C07,Cl. 2M1, 3.156% [US0001M+65], 5/25/302 | | | 190,603 | | | | 190,310 | |
| Series2018-C01,Cl. 1M1, 3.106% [US0001M+60], 7/25/302 | | | 752,589 | | | | 750,220 | |
| Series2018-C02,Cl. 2M1, 3.156% [US0001M+65], 8/25/302 | | | 240,346 | | | | 240,134 | |
10 OPPENHEIMER GLOBAL STRATEGIC INCOME FUND/VA
| | | | | | | | |
| | | Principal Amount | | | Value |
| |
| Residential (Continued) | |
| CWHEQ Revolving Home Equity Loan Trust: | |
| Series2005-G,Cl. 2A, 2.685% [US0001M+23], 12/15/352 | | $ | 22,139 | | | $ | 21,798 | |
| Series2006-H,Cl. 2A1A, 2.605% [US0001M+15], 11/15/362 | | | 18,012 | | | | 13,888 | |
| GSR Mortgage Loan Trust, Series2005-AR4, Cl. 6A1, 4.332%, 7/25/357 | | | 10,348 | | | | 10,408 | |
| HomeBanc Mortgage Trust, Series2005-3, Cl. A2, 2.816% [US0001M+31], 7/25/352 | | | 14,507 | | | | 14,403 | |
| MASTR Asset Backed Securities Trust, Series 2006-WMC3, Cl. A3, 2.606% [US0001M+10], 8/25/362 | | | 849,280 | | | | 419,043 | |
| RALI Trust, Series 2006-QS13, Cl. 1A8, 6.00%, 9/25/36 | | | 12,101 | | | | 10,642 | |
| Residential Asset Securitization Trust, Series 2005-A6CB, Cl. A7, 6.00%, 6/25/35 | | | 1,721,608 | | | | 1,577,710 | |
| Structured Agency Credit Risk Debt Nts.: | |
| Series2013-DN2,Cl. M2, 6.756% [US0001M+425], 11/25/232 | | | 891,140 | | | | 971,204 | |
| Series2014-DN1,Cl. M3, 7.006% [US0001M+450], 2/25/242 | | | 815,000 | | | | 914,712 | |
| Series2014-DN2,Cl. M3, 6.106% [US0001M+360], 4/25/242 | | | 840,000 | | | | 906,610 | |
| Series2014-HQ2,Cl. M3, 6.256% [US0001M+375], 9/25/242 | | | 915,000 | | | | 1,007,869 | |
| Series 2015-HQA2,Cl. M2, 5.306% [US0001M+280], 5/25/282 | | | 252,298 | | | | 257,340 | |
| Series 2016-DNA1,Cl. M2, 5.406% [US0001M+290], 7/25/282 | | | 294,720 | | | | 299,940 | |
| Series 2016-DNA3,Cl. M3, 7.506% [US0001M+500], 12/25/282 | | | 3,845,000 | | | | 4,329,290 | |
| Series 2016-DNA4,Cl. M1, 3.306% [US0001M+80], 3/25/292 | | | 3,927 | | | | 3,927 | |
| Series 2016-DNA4,Cl. M3, 6.306% [US0001M+380], 3/25/292 | | | 5,570,000 | | | | 6,015,650 | |
| Series 2016-HQA3,Cl. M1, 3.306% [US0001M+80], 3/25/292 | | | 203,131 | | | | 203,180 | |
| Series 2016-HQA3,Cl. M3, 6.356% [US0001M+385], 3/25/292 | | | 3,400,000 | | | | 3,720,817 | |
| Series 2016-HQA4,Cl. M3, 6.406% [US0001M+390], 4/25/292 | | | 4,580,000 | | | | 5,022,934 | |
| Series 2017-DNA1,Cl. M2, 5.756% [US0001M+325], 7/25/292 | | | 4,400,000 | | | | 4,633,767 | |
| Series 2017-HQA1,Cl. M1, 3.706% [US0001M+120], 8/25/292 | | | 1,442,205 | | | | 1,447,032 | |
| Series 2017-HQA2,Cl. M1, 3.306% [US0001M+80], 12/25/292 | | | 418,499 | | | | 418,348 | |
| Series 2017-HQA3,Cl. M1, 3.056% [US0001M+55], 4/25/302 | | | 923,982 | | | | 922,390 | |
| Series 2018-DNA1,Cl. M1, 2.956% [US0001M+45], 7/25/302 | | | 1,556,582 | | | | 1,549,481 | |
| Series 2018-DNA1,Cl. M2, 4.306% [US0001M+180], 7/25/302 | | | 1,200,000 | | | | 1,154,793 | |
| WaMu Mortgage Pass-Through Certificates Trust: | |
| Series 2003-AR10,Cl. A7, 4.487%, 10/25/337 | | | 53,444 | | | | 54,129 | |
| Series 2005-AR16,Cl. 1A1, 4.28%, 12/25/357 | | | 7,552 | | | | 7,554 | |
| Wells Fargo Mortgage-Backed Securities Trust: | |
| Series2005-AR1,Cl. 1A1, 4.093%, 2/25/357 | | | 707,956 | | | | 725,512 | |
| Series 2005-AR15,Cl. 1A2, 4.671%, 9/25/357 | | | 110,399 | | | | 107,537 | |
| Series 2005-AR15,Cl. 1A6, 4.671%, 9/25/357 | | | 1,336,467 | | | | 1,292,122 | |
| Series2005-AR4,Cl. 2A2, 4.252%, 4/25/357 | | | 6,167 | | | | 6,216 | |
| Series 2006-AR10,Cl. 1A1, 4.309%, 7/25/367 | | | 136,374 | | | | 133,460 | |
| | | | | | | | |
| | | Principal Amount | | | Value |
| |
| Residential (Continued) | |
| Wells Fargo Mortgage-Backed Securities Trust: (Continued) | |
| Series 2006-AR10,Cl. 5A5, 4.434%, 7/25/367 | | $ | 242,520 | | | $ | 242,426 | |
| Series2006-AR2,Cl. 2A3, 4.607%, 3/25/367 | | | 1,146,954 | | | | 1,160,799 | |
| Series2006-AR7,Cl. 2A4, 4.334%, 5/25/367 | | | 642,475 | | | | 658,216 | |
| | | | 61,893,986 | |
| Total Mortgage-Backed Obligations (Cost $294,155,463) | | | | 299,079,357 | |
| | |
| Foreign Government Obligations—20.2% | |
Angola—0.3% | |
| Republic of Angola: | |
| 8.25% Sr. Unsec. Nts., 5/9/281 | | | 850,000 | | | | 802,744 | |
| 9.375% Sr. Unsec. Nts., 5/8/481 | | | 4,290,000 | | | | 4,028,010 | |
| | | | 4,830,754 | |
| | |
| Argentina—1.3% | |
| Argentine Republic: | |
| 2.937% Unsec. Nts., 4/30/208 | | ARS | 161,500,000 | | | | 4,674,323 | |
| 5.875% Sr. Unsec. Nts., 1/11/28 | | | 4,130,000 | | | | 2,983,925 | |
| 6.50% Sr. Unsec. Nts., 2/15/231 | | | 1,465,000 | | | | 1,186,650 | |
| 6.875% Sr. Unsec. Nts., 1/26/27 | | | 1,525,000 | | | | 1,167,578 | |
| 6.875% Sr. Unsec. Nts., 1/11/48 | | | 1,785,000 | | | | 1,251,731 | |
| 7.50% Sr. Unsec. Nts., 4/22/26 | | | 9,320,000 | | | | 7,496,775 | |
| 18.20% Unsec. Nts., 10/3/21 | | ARS | 9,285,000 | | | | 189,719 | |
| | | | 18,950,701 | |
| | |
| Brazil—1.2% | |
| Federative Republic of Brazil: | |
| 10.00% Unsec. Nts., 1/1/21 | | BRL | 11,000,000 | | | | 2,968,655 | |
| 10.00% Unsec. Nts., 1/1/25 | | BRL | 26,900,000 | | | | 7,239,582 | |
| 10.00% Unsec. Nts., 1/1/27 | | BRL | 11,500,000 | | | | 3,102,110 | |
| 18.447% Unsec. Nts., 5/15/4516 | | BRL | 4,350,000 | | | | 4,065,014 | |
| | | | 17,375,361 | |
| | |
| Chile—0.5% | |
| Republic of Chile, 4.50% Bonds, 3/1/21 | | CLP | 4,818,500,000 | | | | 7,082,186 | |
| | |
| Colombia—0.8% | |
| Republic of Colombia: | |
| 4.50% Sr. Unsec. Nts., 3/15/29 | | | 1,225,000 | | | | 1,212,750 | |
| 6.125% Sr. Unsec. Nts., 1/18/41 | | | 1,615,000 | | | | 1,748,238 | |
| Series B, 6.25% Sr. Unsec. Nts., | |
| 11/26/25 | | COP | 8,700,000,000 | | | | 2,659,877 | |
| Series B, 7.50% Bonds, 8/26/26 | | COP | 12,830,000,000 | | | | 4,182,347 | |
| Series B, 10.00% Bonds, 7/24/24 | | COP | 5,146,000,000 | | | | 1,868,092 | |
| | | | 11,671,304 | |
| | |
| Dominican Republic—0.6% | |
| Dominican Republic: | |
| 5.95% Sr. Unsec. Nts., 1/25/271 | | | 5,595,000 | | | | 5,595,000 | |
| 6.00% Sr. Unsec. Nts., 7/19/281 | | | 2,690,000 | | | | 2,693,363 | |
| 6.85% Sr. Unsec. Nts., 1/27/451 | | | 930,000 | | | | 918,375 | |
| | | | 9,206,738 | |
| | |
| Ecuador—0.2% | |
| Republic of Ecuador: | |
| 7.875% Sr. Unsec. Nts., 1/23/281 | | | 815,000 | | | | 665,753 | |
| 8.875% Sr. Unsec. Nts., 10/23/271 | | | 1,660,000 | | | | 1,433,825 | |
| 9.65% Sr. Unsec. Nts., 12/13/261 | | | 985,000 | | | | 900,044 | |
| | | | 2,999,622 | |
| | |
| Egypt—0.5% | |
| Arab Republic of Egypt: | |
| 4.75% Sr. Unsec. Nts., 4/16/261 | | EUR | 1,900,000 | | | | 1,982,086 | |
| 6.125% Sr. Unsec. Nts., 1/31/221 | | | 965,000 | | | | 948,800 | |
| 6.588% Sr. Unsec. Nts., 2/21/281 | | | 1,445,000 | | | | 1,293,275 | |
| 7.903% Sr. Unsec. Nts., 2/21/481 | | | 625,000 | | | | 540,095 | |
| 8.50% Sr. Unsec. Nts., 1/31/471 | | | 1,450,000 | | | | 1,313,759 | |
11 OPPENHEIMER GLOBAL STRATEGIC INCOME FUND/VA
CONSOLIDATED STATEMENT OF INVESTMENTSContinued
| | | | | | | | |
| | | Principal Amount | | | Value |
| |
| Egypt (Continued) | |
| Arab Republic of Egypt: (Continued) | |
| Series 3YR, 16.00% Unsec. Nts., 12/12/20 | | EGP | 29,000,000 | | | $ | 1,540,234 | |
| | | | 7,618,249 | |
| | |
| Gabon—0.2% | |
Gabonese Republic, 6.375% Bonds, 12/12/241 | | | 2,410,000 | | | | 2,171,868 | |
| Ghana—0.2% | |
| Republic of Ghana: | |
| 7.625% Sr. Unsec. Nts., 5/16/291 | | | 2,420,000 | | | | 2,176,064 | |
| 8.627% Sr. Unsec. Nts., 6/16/491 | | | 1,440,000 | | | | 1,260,173 | |
| | | | 3,436,237 | |
| | |
| Greece—2.2% | |
| Hellenic Republic: | |
| 0.000%Bonds, 10/15/427 | | EUR | 30,230,000 | | | | 106,852 | |
| 3.375% Sr. Unsec. Nts., 2/15/251,9 | | EUR | 5,070,000 | | | | 5,623,084 | |
| 3.90% Bonds, 1/30/339 | | EUR | 17,660,000 | | | | 18,461,107 | |
| 4.00% Bonds, 1/30/379 | | EUR | 7,215,000 | | | | 7,294,179 | |
| | | | 31,485,222 | |
| | |
| Hungary—0.1% | |
| Hungary: | |
| Series 25/B, 5.50% Bonds, 6/24/25 | | HUF | 160,840,000 | | | | 673,986 | |
| Series 27/A, 3.00% Bonds, 10/27/27 | | HUF | 400,000,000 | | | | 1,433,636 | |
| | | | 2,107,622 | |
| | |
| India—1.6% | |
| Republic of India: | |
| 7.59% Sr. Unsec. Nts., 1/11/26 | | INR | 600,000,000 | | | | 8,711,151 | |
| 8.20% Sr. Unsec. Nts., 2/15/22 | | INR | 600,000,000 | | | | 8,811,805 | |
| 8.20% Sr. Unsec. Nts., 9/24/25 | | INR | 315,600,000 | | | | 4,723,856 | |
| | | | 22,246,812 | |
| | |
| Indonesia—1.4% | |
| Perusahaan Penerbit SBSN Indonesia III: | |
| 4.35% Sr. Unsec. Nts., 9/10/241 | | | 525,000 | | | | 523,031 | |
| 4.55% Sr. Unsec. Nts., 3/29/261 | | | 790,000 | | | | 785,260 | |
| Republic of Indonesia: | |
| 3.85% Sr. Unsec. Nts., 7/18/271 | | | 905,000 | | | | 861,385 | |
| 4.125% Sr. Unsec. Nts., 1/15/251 | | | 490,000 | | | | 483,353 | |
| 8.125% Sr. Unsec. Nts., 5/15/24 | | IDR | 35,000,000,000 | | | | 2,478,599 | |
| Series FR56, 8.375% Sr. Unsec. Nts., 9/15/26 | | IDR | 104,095,000,000 | | | | 7,372,662 | |
| Series FR59, 7.00% Sr. Unsec. Nts., 5/15/27 | | IDR | 10,000,000,000 | | | | 650,209 | |
| Series FR74, 7.50% Sr. Unsec. Nts., 8/15/32 | | IDR | 112,480,000,000 | | | | 7,340,923 | |
| | | | 20,495,422 | |
| | |
| Iraq—0.1% | |
| Republic of Iraq: | |
| 5.80% Unsec. Nts., 1/15/281 | | | 615,000 | | | | 553,131 | |
| 6.752% Sr. Unsec. Nts., 3/9/231 | | | 800,000 | | | | 763,918 | |
| | | | 1,317,049 | |
| | |
| Italy—0.6% | |
| Italy Buoni Poliennali Del Tesoro, 1.45% Bonds, 11/15/249 | | EUR | 7,070,000 | | | | 7,841,554 | |
| | |
| Kenya—0.0% | |
| Republic of Kenya, 8.25% Sr. Unsec. Nts., 2/28/481 | | | 510,000 | | | | 436,058 | |
| | |
| Mexico—2.3% | |
| United Mexican States: | |
| 3.75% Sr. Unsec. Nts., 1/11/28 | | | 920,000 | | | | 862,739 | |
| Series M, 5.75% Bonds, 3/5/26 | | MXN | 54,445,000 | | | | 2,343,032 | |
| Series M, 6.50% Bonds, 6/9/22 | | MXN | 160,000,000 | | | | 7,649,029 | |
| Series M, 8.00% Sr. Unsec. Nts., 12/7/23 | | MXN | 340,000,000 | | | | 16,899,004 | |
| | | | | | | | |
| | | Principal Amount | | | Value |
| | | |
| Mexico (Continued) | | | | | | | | |
| United Mexican States: (Continued) | | | | | | | | |
| Series M20, 8.50% Sr. Unsec. Nts., 5/31/29 | | MXN | 90,000,000 | | | $ | 4,507,018 | |
| | | | | | | 32,260,822 | |
| | |
| Mongolia—0.1% | | | | | | | | |
| Development Bank of Mongolia LLC, 7.25% Unsec. Nts., 10/23/231 | | | 620,000 | | | | 609,485 | |
| | |
| Mongolia, 5.625% Sr. Unsec. Nts., 5/1/231 | | | 1,455,000 | | | | 1,382,325 | |
| | | | | | | 1,991,810 | |
| | |
| Nigeria—0.3% | | | | | | | | |
| Federal Republic of Nigeria: | | | | | | | | |
| 7.143% Sr. Unsec. Nts., 2/23/301 | | | 1,570,000 | | | | 1,393,438 | |
| 7.696% Sr. Unsec. Nts., 2/23/381 | | | 1,610,000 | | | | 1,410,235 | |
| 9.248% Sr. Unsec. Nts., 1/21/491 | | | 1,060,000 | | | | 1,032,198 | |
| | | | | | | 3,835,871 | |
| | |
| Oman—0.2% | | | | | | | | |
Sultanate of Oman, 6.75% Sr. Unsec. Nts., 1/17/481 | | | 3,185,000 | | | | 2,636,811 | |
| Peru—0.4% | | | | | | | | |
| Republic of Peru: | | | | | | | | |
| 5.70% Unsec. Nts., 8/12/241 | | PEN | 5,345,000 | | | | 1,645,529 | |
| 5.94% Sr. Unsec. Nts., 2/12/291,9 | | PEN | 2,800,000 | | | | 843,209 | |
| 6.15% Sr. Unsec. Nts., 8/12/321,9 | | PEN | 4,370,000 | | | | 1,322,178 | |
| 6.35% Sr. Unsec. Nts., 8/12/281 | | PEN | 7,140,000 | | | | 2,223,873 | |
| | | | | | | 6,034,789 | |
| | |
| Poland—0.5% | | | | | | | | |
| Republic of Poland, Series 0422 | | | | | | | | |
| 2.25% Bonds, 4/25/22 | | PLN | 23,800,000 | | | | 6,447,410 | |
| | |
| Russia—0.1% | | | | | | | | |
| Russian Federation, Series 6209, 7.60% | | | | | | | | |
| Bonds, 7/20/22 | | RUB | 66,585,000 | | | | 944,174 | |
| | |
| Senegal—0.1% | | | | | | | | |
| Republic of Senegal: | | | | | | | | |
| 6.25% Unsec. Nts., 5/23/331 | | | 460,000 | | | | 397,460 | |
| 6.75% Sr. Unsec. Nts., 3/13/481 | | | 835,000 | | | | 695,033 | |
| | | | | | | 1,092,493 | |
| | |
| South Africa—2.0% | | | | | | | | |
| Republic of South Africa: | | | | | | | | |
| 5.65% Sr. Unsec. Nts., 9/27/47 | | | 605,000 | | | | 539,908 | |
| Series 2023, 7.75% Bonds, 2/28/23 | | ZAR | 22,500,000 | | | | 1,544,497 | |
| Series 2030, 8.00% Bonds, 1/31/30 | | ZAR | 77,000,000 | | | | 4,844,233 | |
| Series 2037, 8.50% Bonds, 1/31/37 | | ZAR | 107,000,000 | | | | 6,616,843 | |
| Series 2048, 8.75% Bonds, 2/28/48 | | ZAR | 60,000,000 | | | | 3,711,951 | |
| Series R186, 10.50% Bonds, 12/21/26 | | ZAR | 131,675,000 | | | | 9,958,639 | |
| Series R214, 6.50% Bonds, 2/28/41 | | ZAR | 25,000,000 | | | | 1,212,203 | |
| | | | | | | 28,428,274 | |
| | |
| Sri Lanka—0.3% | | | | | | | | |
| Democratic Socialist Republic of Sri Lanka: | | | | | | | | |
| 5.75% Sr. Unsec. Nts., 4/18/231 | | | 1,450,000 | | | | 1,341,525 | |
| 5.875% Sr. Unsec. Nts., 7/25/221 | | | 1,350,000 | | | | 1,269,231 | |
| 6.25% Sr. Unsec. Nts., 10/4/201 | | | 465,000 | | | | 453,398 | |
| 6.75% Sr. Unsec. Nts., 4/18/281 | | | 950,000 | | | | 867,545 | |
| | | | | | | 3,931,699 | |
| | |
| Thailand—0.6% | | | | | | | | |
| Kingdom of Thailand: | | | | | | | | |
| 1.875% Sr. Unsec. Nts., 6/17/22 | | THB | 65,400,000 | | | | 2,000,577 | |
| 2.125% Sr. Unsec. Nts., 12/17/26 | | THB | 210,000,000 | | | | 6,315,260 | |
| | | | | | | 8,315,837 | |
| | |
| Turkey—0.7% | | | | | | | | |
| Republic of Turkey: | | | | | | | | |
| 7.25% Sr. Unsec. Nts., 12/23/23 | | | 1,825,000 | | | | 1,878,755 | |
| 10.60% Bonds, 2/11/26 | | TRY | 5,000,000 | | | | 735,002 | |
| 10.70% Bonds, 2/17/21 | | TRY | 22,045,000 | | | | 3,611,340 | |
12 OPPENHEIMER GLOBAL STRATEGIC INCOME FUND/VA
| | | | | | | | |
| | | Principal Amount | | | Value |
| |
| Turkey (Continued) | |
| Republic of Turkey: (Continued) | |
| 11.00% Bonds, 2/24/27 | | TRY | 4,750,000 | | | $ | 698,252 | |
| 12.40% Bonds, 3/8/28 | | TRY | 17,500,000 | | | | 2,775,036 | |
| | | | 9,698,385 | |
| | |
| Ukraine—0.8% | |
| Ukraine: | |
| 7.75% Sr. Unsec. Nts., 9/1/239 | | | 2,050,000 | | | | 1,848,844 | |
| 7.75% Sr. Unsec. Nts., 9/1/249 | | | 1,295,000 | | | | 1,142,085 | |
| 7.75% Sr. Unsec. Nts., 9/1/259 | | | 900,000 | | | | 781,573 | |
| 7.75% Sr. Unsec. Nts., 9/1/269 | | | 2,940,000 | | | | 2,512,303 | |
| 7.75% Sr. Unsec. Nts., 9/1/279 | | | 2,720,000 | | | | 2,306,370 | |
| 8.994% Sr. Unsec. Nts., 2/1/241 | | | 1,565,000 | | | | 1,464,071 | |
| 9.75% Sr. Unsec. Nts., 11/1/281 | | | 730,000 | | | | 686,065 | |
| | | | 10,741,311 | |
| | |
| Uruguay—0.0% | |
| Oriental Republic of Uruguay, 9.875% | |
| Sr. Unsec. Nts., 6/20/221 | | UYU | 13,555,000 | | | | 414,250 | |
| Total Foreign Government Obligations (Cost $312,285,250) | | | | 288,046,695 | |
| | |
| Corporate Loans—0.4% | |
| Albertson’s LLC, Sr. Sec. Credit Facilities 1st Lien Term Loan, Tranche B7, 5.522% [LIBOR4+300], 11/17/252 | | | 273,052 | | | | 259,741 | |
| Aleris International, Inc., Sr. Sec. Credit Facilities 1st Lien Term Loan, 7.052% 2/27/237 | | | 547,250 | | | | 543,745 | |
| American Greetings Corp., Sr. Sec. Credit Facilities 1st Lien Term Loan, Tranche B, 6.804% [LIBOR12+450], 4/6/242 | | | 587,050 | | | | 578,978 | |
| Clear Channel Communications, Inc., Extended Sr. Sec. Credit Facilities 1st Lien Term Loan, Tranche D, 9.095% [LIBOR4+675], 1/30/192,10 | | | 800,000 | | | | 541,112 | |
| JC Penney Corp., Inc., Sr. Sec. Credit Facilities 1st Lien Term Loan, Tranche B, 6.569% [LIBOR4+425], 6/23/232 | | | 384,740 | | | | 330,300 | |
| KIK Custom Products, Inc., Sr. Sec. Credit Facilities 1st Lien Term Loan, Tranche B, 6.522% 5/15/237 | | | 570,000 | | | | 539,365 | |
| Monitronics International, Inc., Sr. Sec. Credit Facilities 1st Lien Term Loan, Tranche B2, 8.303% [LIBOR4+550], 9/30/222 | | | 272,906 | | | | 244,763 | |
| Murray Energy Corp., Sr. Sec. Credit Facilities 1st Lien Term Loan, Tranche B2, 9.326% [LIBOR12+725], 10/17/222 | | | 1,575,063 | | | | 1,342,741 | |
| Neiman Marcus Group Ltd. LLC, Sr. Sec. Credit Facilities 1st Lien Term Loan, 5.568% [LIBOR12+325], 10/25/202 | | | 1,043,988 | | | | 885,761 | |
| PetSmart, Inc., Sr. Sec. Credit Facilities 1st Lien Term Loan, Tranche B, 5.32% [LIBOR12+300], 3/11/222 | | | 273,582 | | | | 217,107 | |
| Windstream Services LLC, Sr. Sec. Credit Facilities 1st Lien Term Loan, Tranche B6, 6.31% [LIBOR12+400], 3/29/212 | | | 306,086 | | | | 274,712 | |
| Total Corporate Loans (Cost $6,206,518) | | | | 5,758,325 | |
| | |
| Corporate Bonds and Notes—41.4% | |
|
| Consumer Discretionary—6.3% | |
|
| Auto Components—0.2% | |
| American Axle & Manufacturing, Inc., 6.25% Sr. Unsec. Nts., 4/1/25 | | | 1,100,000 | | | | 1,005,125 | |
| Cooper-Standard Automotive, Inc., 5.625% Sr. Unsec. Nts., 11/15/261 | | | 250,000 | | | | 221,250 | |
| Dana Financing Luxembourg Sarl, 6.50% Sr. Unsec. Nts., 6/1/261 | | | 705,000 | | | | 679,444 | |
| | | | | | | | |
| | | Principal Amount | | | Value |
| |
| Auto Components (Continued) | |
| Goodyear Tire & Rubber Co. (The), 5.00% Sr. Unsec. Nts., 5/31/26 | | $ | 520,000 | | | $ | 469,950 | |
| Grinding Media,Inc./Moly-Cop AltaSteel Ltd., 7.375% Sr. Sec. Nts., 12/15/231 | | | 345,000 | | | | 335,512 | |
| Tenneco, Inc., 5.00% Sr. Unsec. Nts., 7/15/26 | | | 360,000 | | | | 278,730 | |
| | | | 2,990,011 | |
| | |
| |
| Automobiles—0.3% | |
| Ford Motor Credit Co. LLC, 5.75% Sr. Unsec. Nts., 2/1/21 | | | 1,460,000 | | | | 1,489,726 | |
| General Motors Financial Co., Inc., 4.20% Sr. Unsec. Nts., 11/6/21 | | | 1,460,000 | | | | 1,460,218 | |
| Jaguar Land Rover Automotive plc, 4.50% Sr. Unsec. Nts., 10/1/271 | | | 690,000 | | | | 517,500 | |
| Tesla, Inc., 5.30% Sr. Unsec. Nts., 8/15/251 | | | 570,000 | | | | 497,325 | |
| Williams Scotsman International, Inc., 6.875% Sr. Sec. Nts., 8/15/233 | | | 560,000 | | | | 539,000 | |
| | | | 4,503,769 | |
| | |
| |
| Distributors—0.0% | |
| LKQ Corp., 4.75% Sr. Unsec. Nts., 5/15/23 | | | 387,000 | | | | 369,585 | |
| | |
| |
| Diversified Consumer Services—0.1% | |
| Cengage Learning, Inc., 9.50% Sr. Unsec. Nts., 6/15/241 | | | 140,000 | | | | 95,900 | |
| KCA Deutag UK Finance plc, 9.625% Sr. Sec. Nts., 4/1/231 | | | 275,000 | | | | 222,750 | |
| Service Corp. International, 4.625% Sr. Unsec. Nts., 12/15/27 | | | 290,000 | | | | 273,687 | |
| | | | 592,337 | |
| | |
| |
| Entertainment—0.3% | |
| AMC Entertainment Holdings, Inc.: | |
| 5.75% Sr. Sub. Nts., 6/15/25 | | | 705,000 | | | | 623,044 | |
| 5.875% Sr. Sub. Nts., 11/15/26 | | | 760,000 | | | | 653,600 | |
| 6.125% Sr. Sub. Nts., 5/15/27 | | | 520,000 | | | | 447,200 | |
| Cinemark USA, Inc., 4.875% Sr. Unsec. Nts., 6/1/23 | | | 495,000 | | | | 476,437 | |
| Lions Gate Capital Holdings LLC, 5.875% Sr. Unsec. Nts., 11/1/241 | | | 1,215,000 | | | | 1,205,887 | |
| Live Nation Entertainment, Inc., 5.625% Sr. Unsec. Nts., 3/15/261 | | | 550,000 | | | | 539,000 | |
| Netflix, Inc., 5.875% Sr. Unsec. Nts., 11/15/281 | | | 275,000 | | | | 268,656 | |
| Sirius XM Radio, Inc., 5.375% Sr. Unsec. Nts., 7/15/261 | | | 665,000 | | | | 624,269 | |
| | | | 4,838,093 | |
| | |
| |
| Hotels, Restaurants & Leisure—1.7% | |
| 1011778 B.C. ULC/New Red Finance, Inc.: | |
| 4.25% Sr. Sec. Nts., 5/15/241 | | | 785,000 | | | | 724,798 | |
| 5.00% Sec. Nts., 10/15/251 | | | 1,335,000 | | | | 1,231,537 | |
| Aramark Services, Inc.: | |
| 4.75% Sr. Unsec. Nts., 6/1/26 | | | 745,000 | | | | 702,162 | |
| 5.00% Sr. Unsec. Nts., 2/1/281 | | | 815,000 | | | | 762,025 | |
| Boyd Gaming Corp.: | |
| 6.00% Sr. Unsec. Nts., 8/15/26 | | | 690,000 | | | | 647,737 | |
| 6.375% Sr. Unsec. Nts., 4/1/26 | | | 220,000 | | | | 213,675 | |
| Caesars Resort Collection LLC/CRC Finco, Inc., 5.25% Sr. Unsec. Nts., 10/15/251 | | | 820,000 | | | | 707,250 | |
| CEC Entertainment, Inc., 8.00% Sr. Unsec. Nts., 2/15/22 | | | 670,000 | | | | 589,600 | |
| Downstream Development Authority of the Quapaw Tribe of Oklahoma, 10.50% Sr. Sec. Nts., 2/15/231 | | | 330,000 | | | | 326,700 | |
| Eldorado Resorts, Inc., 6.00% Sr. Unsec. Nts., 4/1/25 | | | 540,000 | | | | 523,606 | |
13 OPPENHEIMER GLOBAL STRATEGIC INCOME FUND/VA
CONSOLIDATED STATEMENT OF INVESTMENTSContinued
| | | | | | | | |
| | | Principal Amount | | | Value |
| |
| Hotels, Restaurants & Leisure (Continued) | |
| Gateway Casinos & Entertainment Ltd., 8.25% Sec. Nts., 3/1/241 | | $ | 390,000 | | | $ | 396,825 | |
| Golden Nugget, Inc.: | |
| 6.75% Sr. Unsec. Nts., 10/15/243 | | | 1,370,000 | | | | 1,294,650 | |
| 8.75% Sr. Sub. Nts., 10/1/251 | | | 1,160,000 | | | | 1,119,400 | |
| Hilton Domestic Operating Co., Inc.: | |
| 4.25% Sr. Unsec. Nts., 9/1/24 | | | 425,000 | | | | 402,687 | |
| 5.125% Sr. Unsec. Nts., 5/1/261 | | | 550,000 | | | | 529,375 | |
| Hilton Grand Vacations Borrower LLC/ Hilton Grand Vacations Borrower, Inc., 6.125% Sr. Unsec. Nts., 12/1/24 | | | 700,000 | | | | 698,250 | |
| International Game Technology plc, 6.25% Sr. Sec. Nts., 2/15/221 | | | 1,130,000 | | | | 1,138,475 | |
| IRB Holding Corp., 6.75% Sr. Unsec. Nts., 2/15/261 | | | 270,000 | | | | 236,925 | |
| KFC Holding Co./Pizza Hut Holdings LLC/ Taco Bell of America LLC: 4.75% Sr. Unsec. Nts., 6/1/271 | | | 435,000 | | | | 405,637 | |
| 5.25% Sr. Unsec. Nts., 6/1/261 | | | 995,000 | | | | 965,180 | |
| Marriott Ownership Resorts, Inc./ILG LLC, 6.50% Sr. Unsec. Nts., 9/15/261 | | | 280,000 | | | | 271,250 | |
| Melco Resorts Finance Ltd., 4.875% Sr. Unsec. Nts., 6/6/251 | | | 1,230,000 | | | | 1,132,537 | |
| MGM Growth Properties Operating Partnership LP/MGP Finance Co.-Issuer, Inc., 5.625% Sr. Unsec. Nts., 5/1/24 | | | 925,000 | | | | 919,219 | |
| MGM Resorts International: | |
| 5.75% Sr. Unsec. Nts., 6/15/25 | | | 510,000 | | | | 494,700 | |
| 6.00% Sr. Unsec. Nts., 3/15/23 | | | 855,000 | | | | 861,412 | |
| 6.625% Sr. Unsec. Nts., 12/15/21 | | | 405,000 | | | | 416,137 | |
| Mohegan Gaming & Entertainment, 7.875% Sr. Unsec. Nts., 10/15/241 | | | 780,000 | | | | 732,225 | |
| Penn National Gaming, Inc., 5.625% Sr. Unsec. Nts., 1/15/271 | | | 725,000 | | | | 650,688 | |
| PF Chang’s China Bistro, Inc., 10.25% Sr. Unsec. Nts., 6/30/201 | | | 875,000 | | | | 805,000 | |
| Premier Cruises Ltd., 11.00% Sr. Unsec. Nts., 3/15/081,10,11 | | | 250,000 | | | | — | |
| Scientific Games International, Inc.: | |
| 5.00% Sr. Sec. Nts., 10/15/251 | | | 1,000,000 | | | | 895,000 | |
| 10.00% Sr. Unsec. Nts., 12/1/22 | | | 1,712,000 | | | | 1,739,803 | |
| Six Flags Entertainment Corp., 4.875% Sr. Unsec. Nts., 7/31/241 | | | 500,000 | | | | 472,500 | |
| Sugarhouse HSP Gaming Prop Mezz LP/ Sugarhouse HSP Gaming Finance Corp., 5.875% Sr. Sec. Nts., 5/15/251 | | | 285,000 | | | | 267,188 | |
| Viking Cruises Ltd., 5.875% Sr. Unsec. Nts., 9/15/271 | | | 560,000 | | | | 523,600 | |
| Wynn Las Vegas LLC/Wynn Las Vegas Capital Corp.: | |
| 5.25% Sr. Unsec. Nts., 5/15/271 | | | 390,000 | | | | 343,688 | |
| 5.50% Sr. Unsec. Nts., 3/1/251 | | | 275,000 | | | | 257,125 | |
| Wynn Macau Ltd.: | |
| 4.875% Sr. Unsec. Nts., 10/1/241 | | | 135,000 | | | | 120,488 | |
| 5.50% Sr. Unsec. Nts., 10/1/271 | | | 135,000 | | | | 117,788 | |
| | | | 24,636,842 | |
| | |
| |
| Household Durables—0.8% | |
| Arcelik AS, 5.00% Sr. Unsec. Nts., 4/3/231 | | | 495,000 | | | | 450,935 | |
| Beazer Homes USA, Inc.: | |
| 5.875% Sr. Unsec. Nts., 10/15/27 | | | 935,000 | | | | 743,325 | |
| 6.75% Sr. Unsec. Nts., 3/15/25 | | | 1,680,000 | | | | 1,451,100 | |
| 7.25% Sr. Unsec. Nts., 2/1/23 | | | 43,000 | | | | 40,205 | |
| KB Home, 7.625% Sr. Unsec. Nts., 5/15/23 | | | 430,000 | | | | 437,525 | |
| Lennar Corp.: | |
| 4.50% Sr. Unsec. Nts., 4/30/24 | | | 95,000 | | | | 90,012 | |
| 4.75% Sr. Unsec. Nts., 4/1/21 | | | 1,465,000 | | | | 1,455,844 | |
| | | | | | | | |
| | | Principal Amount | | | Value |
| |
| Household Durables (Continued) | |
| Lennar Corp.: (Continued) | |
| 4.75% Sr. Unsec. Nts., 5/30/25 | | $ | 840,000 | | | $ | 790,650 | |
| M/I Homes, Inc., 5.625% Sr. Unsec. Nts., 8/1/25 | | | 795,000 | | | | 731,400 | |
| MDC Holdings, Inc., 6.00% Sr. Unsec. Nts., 1/15/43 | | | 800,000 | | | | 628,000 | |
| PulteGroup, Inc., 5.50% Sr. Unsec. Nts., 3/1/26 | | | 740,000 | | | | 715,025 | |
| Resideo Funding, Inc., 6.125% Sr. Unsec. Nts., 11/1/261 | | | 855,000 | | | | 844,312 | |
| Taylor Morrison Communities, Inc., 6.625% Sr. Unsec. Nts., 5/15/22 | | | 1,240,000 | | | | 1,243,100 | |
| Taylor Morrison Communities, Inc./Taylor Morrison Holdings II, Inc., 5.875% Sr. Unsec. Nts., 4/15/231 | | | 560,000 | | | | 543,200 | |
| Toll Brothers Finance Corp., 4.375% Sr. Unsec. Nts., 4/15/23 | | | 180,000 | | | | 169,650 | |
| William Lyon Homes, Inc.: | |
| 5.875% Sr. Unsec. Nts., 1/31/25 | | | 1,020,000 | | | | 872,100 | |
| 6.00% Sr. Unsec. Nts., 9/1/23 | | | 550,000 | | | | 497,750 | |
| | | | 11,704,133 | |
| | |
| |
| Leisure Equipment & Products—0.0% | |
| Mattel, Inc., 6.75% Sr. Unsec. Nts., 12/31/251 | | | 430,000 | | | | 384,717 | |
| | |
| |
| Media—2.0% | |
| Altice Financing SA: | |
| 6.625% Sr. Sec. Nts., 2/15/231 | | | 205,000 | | | | 197,312 | |
| 7.50% Sr. Sec. Nts., 5/15/261 | | | 480,000 | | | | 439,200 | |
| Altice Finco SA, 8.125% Sec. Nts., 1/15/241 | | | 695,000 | | | | 649,825 | |
| Altice France SA: | |
| 7.375% Sr. Sec. Nts., 5/1/261 | | | 580,000 | | | | 533,600 | |
| 8.125% Sr. Sec. Nts., 2/1/271 | | | 560,000 | | | | 529,200 | |
| Altice Luxembourg SA, 7.75% Sr. Unsec. Nts., 5/15/221 | | | 205,000 | | | | 187,319 | |
| AMC Networks, Inc.: | |
| 4.75% Sr. Unsec. Nts., 8/1/25 | | | 530,000 | | | | 482,300 | |
| 5.00% Sr. Unsec. Nts., 4/1/24 | | | 275,000 | | | | 261,250 | |
| Belo Corp., 7.75% Sr. Unsec. Nts., 6/1/27 | | | 1,362,000 | | | | 1,416,480 | |
| Block Communications, Inc., 6.875% Sr. Unsec. Nts., 2/15/251 | | | 460,000 | | | | 463,450 | |
| CCO Holdings LLC/CCO Holdings Capital Corp.: | |
| 4.00% Sr. Unsec. Nts., 3/1/231 | | | 265,000 | | | | 247,775 | |
| 5.00% Sr. Unsec. Nts., 2/1/281 | | | 840,000 | | | | 774,900 | |
| 5.125% Sr. Unsec. Nts., 5/1/271 | | | 1,040,000 | | | | 971,256 | |
| 5.375% Sr. Unsec. Nts., 5/1/251 | | | 205,000 | | | | 197,056 | |
| 5.75% Sr. Unsec. Nts., 2/15/261 | | | 1,315,000 | | | | 1,291,987 | |
| 5.875% Sr. Unsec. Nts., 4/1/241 | | | 325,000 | | | | 324,188 | |
| 5.875% Sr. Unsec. Nts., 5/1/271 | | | 205,000 | | | | 199,362 | |
| Clear Channel International BV, 8.75% Sr. Unsec. Nts., 12/15/203 | | | 265,000 | | | | 268,312 | |
| Clear Channel Worldwide Holdings, Inc.: | |
| 6.50% Sr. Unsec. Nts., Series B, 11/15/22 | | | 1,465,000 | | | | 1,472,325 | |
| 7.625% Sr. Sub. Nts., Series B, 3/15/20 | | | 1,505,000 | | | | 1,473,019 | |
| CSC Holdings LLC: | |
| 5.25% Sr. Unsec. Nts., 6/1/24 | | | 715,000 | | | | 656,906 | |
| 5.50% Sr. Sec. Nts., 5/15/261 | | | 205,000 | | | | 193,725 | |
| 5.50% Sr. Unsec. Nts., 4/15/271 | | | 750,000 | | | | 699,375 | |
| 10.875% Sr. Unsec. Nts., 10/15/251 | | | 722,000 | | | | 812,553 | |
| DISH DBS Corp.: | |
| 5.875% Sr. Unsec. Nts., 11/15/24 | | | 2,280,000 | | | | 1,843,950 | |
| 7.75% Sr. Unsec. Nts., 7/1/26 | | | 250,000 | | | | 207,500 | |
| Gray Television, Inc.: | |
| 5.125% Sr. Unsec. Nts., 10/15/241 | | | 760,000 | | | | 702,620 | |
| 5.875% Sr. Unsec. Nts., 7/15/261 | | | 1,370,000 | | | | 1,280,676 | |
14 OPPENHEIMER GLOBAL STRATEGIC INCOME FUND/VA
| | | | | | | | |
| | | Principal Amount | | | Value |
| |
| Media (Continued) | |
| iHeartCommunications, Inc., 9.00% Sr. Sec. Nts., 12/15/19 | | $ | 1,455,000 | | | $ | 982,125 | |
| MDC Partners, Inc., 6.50% Sr. Unsec. Nts., 5/1/241 | | | 255,000 | | | | 233,325 | |
| Meredith Corp., 6.875% Sr. Unsec. Nts., 2/1/261 | | | 250,000 | | | | 245,000 | |
| Nexstar Broadcasting, Inc., 5.625% Sr. Unsec. Nts., 8/1/241 | | | 1,095,000 | | | | 1,026,563 | |
| Salem Media Group, Inc., 6.75% Sr. Sec. Nts., 6/1/241 | | | 775,000 | | | | 691,688 | |
| Sinclair Television Group, Inc., 5.625% Sr. Unsec. Nts., 8/1/241 | | | 715,000 | | | | 672,100 | |
| TEGNA, Inc., 5.50% Sr. Unsec. Nts., 9/15/241 | | | 650,000 | | | | 632,125 | |
| Townsquare Media, Inc., 6.50% Sr. Unsec. Nts., 4/1/231 | | | 265,000 | | | | 244,794 | |
| Tribune Media Co., 5.875% Sr. Unsec. Nts., 7/15/22 | | | 725,000 | | | | 732,250 | |
| Univision Communications, Inc.: | |
| 5.125% Sr. Sec. Nts., 5/15/231 | | | 245,000 | | | | 220,500 | |
| 5.125% Sr. Sec. Nts., 2/15/251 | | | 1,435,000 | | | | 1,262,800 | |
| UPCB Finance IV Ltd., 5.375% Sr. Sec. Nts., 1/15/251 | | | 135,000 | | | | 126,579 | |
| Virgin Media Secured Finance plc, 5.50% Sr. Sec. Nts., 8/15/261 | | | 705,000 | | | | 653,782 | |
| Ziggo BV, 5.50% Sr. Sec. Nts., 1/15/271 | | | 1,590,000 | | | | 1,427,025 | |
| | | | 27,928,077 | |
| | |
| |
| Multiline Retail—0.1% | |
| JC Penney Corp., Inc.: | |
| 5.875% Sr. Sec. Nts., 7/1/231 | | | 525,000 | | | | 422,625 | |
| 7.40% Sr. Unsec. Nts., 4/1/37 | | | 270,000 | | | | 91,800 | |
| 8.625% Sec. Nts., 3/15/251 | | | 865,000 | | | | 467,100 | |
| Neiman Marcus Group Ltd. LLC, 8.00% Sr. Unsec. Nts., 10/15/211 | | | 280,000 | | | | 116,900 | |
| | | | 1,098,425 | |
| | |
| |
| Specialty Retail—0.7% | |
| Claire’s Stores, Inc., 9.00%, 3/15/1910,12 | | | 405,000 | | | | 255,604 | |
| Freedom Mortgage Corp.: | |
| 8.125% Sr. Unsec. Nts., 11/15/241 | | | 400,000 | | | | 345,000 | |
| 8.25% Sr. Unsec. Nts., 4/15/251 | | | 825,000 | | | | 709,500 | |
| GameStop Corp.: | |
| 5.50% Sr. Unsec. Nts., 10/1/191 | | | 685,000 | | | | 684,144 | |
| 6.75% Sr. Unsec. Nts., 3/15/211 | | | 1,180,000 | | | | 1,180,000 | |
| L Brands, Inc.: | |
| 5.25% Sr. Unsec. Nts., 2/1/28 | | | 270,000 | | | | 231,187 | |
| 6.875% Sr. Unsec. Nts., 11/1/35 | | | 1,775,000 | | | | 1,491,355 | |
| Lithia Motors, Inc., 5.25% Sr. Unsec. Nts., 8/1/251 | | | 530,000 | | | | 489,588 | |
| Party City Holdings, Inc., 6.625% Sr. Unsec. Nts., 8/1/261 | | | 560,000 | | | | 511,000 | |
| PetSmart, Inc.: | |
| 5.875% Sr. Sec. Nts., 6/1/251 | | | 700,000 | | | | 509,250 | |
| 7.125% Sr. Unsec. Nts., 3/15/231 | | | 285,000 | | | | 167,437 | |
| Sonic Automotive, Inc., 6.125% Sr. Sub. Nts., 3/15/27 | | | 650,000 | | | | 572,000 | |
| Staples, Inc., 8.50% Sr. Unsec. Nts., 9/15/251 | | | 3,330,000 | | | | 3,020,976 | |
| | | | 10,167,041 | |
| | |
| |
| Textiles, Apparel & Luxury Goods—0.1% | |
| Hanesbrands, Inc.: | |
| 4.625% Sr. Unsec. Nts., 5/15/241 | | | 380,000 | | | | 358,150 | |
| 4.875% Sr. Unsec. Nts., 5/15/261 | | | 495,000 | | | | 448,594 | |
| | | | 806,744 | |
| | |
| |
| Consumer Staples—1.2% | |
|
| Beverages—0.0% | |
| Coca-Cola Icecek AS, 4.215% Sr. Unsec. Nts., 9/19/241 | | | 445,000 | | | | 417,757 | |
| | | | | | | | |
| | | Principal Amount | | | Value |
| |
| Food & Staples Retailing—0.4% | |
| Albertsons Cos. LLC/Safeway, Inc./New Albertson LP/Albertson’s LLC, 6.625% Sr. Unsec. Nts., 6/15/24 | | $ | 1,035,000 | | | $ | 965,137 | |
| Fresh Market, Inc. (The), 9.75% Sr. Sec. Nts., 5/1/231 | | | 820,000 | | | | 594,500 | |
| Ingles Markets, Inc., 5.75% Sr. Unsec. Nts., 6/15/23 | | | 688,000 | | | | 682,840 | |
| New Albertsons LP, 7.45% Sr. Unsec. Nts., 8/1/29 | | | 740,000 | | | | 595,700 | |
| Performance Food Group, Inc., 5.50% Sr. Unsec. Nts., 6/1/241 | | | 495,000 | | | | 480,769 | |
| Rite Aid Corp., 6.125% Sr. Unsec. Nts., 4/1/231 | | | 1,345,000 | | | | 1,067,594 | |
| Simmons Foods, Inc.: | |
| 5.75% Sec. Nts., 11/1/241 | | | 1,870,000 | | | | 1,337,050 | |
| 7.75% Sr. Sec. Nts., 1/15/241 | | | 275,000 | | | | 277,750 | |
| | | | 6,001,340 | |
| | |
| |
| Food Products—0.6% | |
| B&G Foods, Inc., 5.25% Sr. Unsec. Nts., 4/1/25 | | | 260,000 | | | | 242,775 | |
| BRF SA, 3.95% Sr. Unsec. Nts., 5/22/231 | | | 495,000 | | | | 446,738 | |
| Dean Foods Co., 6.50% Sr. Unsec. Nts., 3/15/231 | | | 530,000 | | | | 425,325 | |
| JBS USA LUX SA/JBS USA Finance, Inc.: | |
| 5.75% Sr. Unsec. Nts., 6/15/251 | | | 1,315,000 | | | | 1,260,756 | |
| 6.75% Sr. Unsec. Nts., 2/15/281 | | | 1,360,000 | | | | 1,331,100 | |
| MARB BondCo plc, 6.875% Sr. Unsec. Nts., 1/19/251 | | | 510,000 | | | | 474,241 | |
| MHP Lux SA, 6.95% Sr. Unsec. Nts., 4/3/261 | | | 485,000 | | | | 419,331 | |
| Minerva Luxembourg SA, 6.50% Sr. Unsec. Nts., 9/20/261 | | | 1,905,000 | | | | 1,781,194 | |
| Pilgrim’s Pride Corp.: | |
| 5.75% Sr. Unsec. Nts., 3/15/251 | | | 860,000 | | | | 810,550 | |
| 5.875% Sr. Unsec. Nts., 9/30/271 | | | 265,000 | | | | 241,150 | |
| Post Holdings, Inc.: | |
| 5.00% Sr. Unsec. Nts., 8/15/261 | | | 325,000 | | | | 297,375 | |
| 5.75% Sr. Unsec. Nts., 3/1/271 | | | 795,000 | | | | 749,288 | |
| | | | 8,479,823 | |
| | |
| |
| Household Products—0.1% | |
| Kronos Acquisition Holdings, Inc., 9.00% Sr. Unsec. Nts., 8/15/231 | | | 645,000 | | | | 496,650 | |
| Spectrum Brands, Inc., 6.125% Sr. Unsec. Nts., 12/15/24 | | | 280,000 | | | | 270,900 | |
| | | | 767,550 | |
| | |
| |
| Personal Products—0.1% | |
| Avon International Operations, Inc., 7.875% Sr. Sec. Nts., 8/15/221 | | | 910,000 | | | | 900,900 | |
| | |
| |
| Energy—6.3% | |
|
| Energy Equipment & Services—1.5% | |
| Basic Energy Services, Inc., 10.75% Sr. Sec. Nts., 10/15/231 | | | 285,000 | | | | 246,525 | |
| Bristow Group, Inc.: | |
| 6.25% Sr. Unsec. Nts., 10/15/22 | | | 135,000 | | | | 47,925 | |
| 8.75% Sr. Sec. Nts., 3/1/231 | | | 455,000 | | | | 327,600 | |
| Calfrac Holdings LP, 8.50% Sr. Unsec. Nts., 6/15/261 | | | 1,135,000 | | | | 811,525 | |
| CGG Holding US, Inc., 9.00% Sr. Sec. Nts., 5/1/231 | | | 140,000 | | | | 138,600 | |
| CSI Compressco LP/CSI Compressco Finance, Inc., 7.50% Sr. Sec. Nts., 4/1/251 | | | 285,000 | | | | 266,475 | |
| Ensco plc: | |
| 5.20% Sr. Unsec. Nts., 3/15/25 | | | 685,000 | | | | 458,950 | |
| 7.75% Sr. Unsec. Nts., 2/1/26 | | | 135,000 | | | | 100,575 | |
| Eterna Capital Pte Ltd.: | |
| 7.50% Sr. Sec. Nts., 12/11/229,13 | | | 794,395 | | | | 775,518 | |
15 OPPENHEIMER GLOBAL STRATEGIC INCOME FUND/VA
CONSOLIDATED STATEMENT OF INVESTMENTSContinued
| | | | | | | | |
| | | Principal Amount | | | Value |
| |
| Energy Equipment & Services (Continued) | |
| Eterna Capital Pte Ltd.: (Continued) 8.00% Sr. Sec. Nts., 12/11/2213 | | $ | 2,912,870 | | | $ | 2,607,517 | |
| Exterran Energy Solutions LP/EES Finance Corp., 8.125% Sr. Unsec. Nts., 5/1/25 | | | 260,000 | | | | 250,250 | |
| Hi-Crush Partners LP, 9.50% Sr. Unsec. Nts., 8/1/261 | | | 420,000 | | | | 310,800 | |
| KCA Deutag UK Finance plc, 7.25% Sr. Sec. Nts., 5/15/211 | | | 200,000 | | | | 163,000 | |
| McDermott Technology Americas, Inc./McDermott Technology US, Inc., 10.625% Sr. Unsec. Nts., 5/1/241 | | | 2,935,000 | | | | 2,487,412 | |
| Nabors Industries, Inc., 5.75% Sr. Unsec. Nts., 2/1/25 | | | 480,000 | | | | 364,730 | |
| Nine Energy Service, Inc., 8.75% Sr. Unsec. Nts., 11/1/231 | | | 285,000 | | | | 272,175 | |
| Noble Holding International Ltd., 7.875% Sr. Unsec. Nts., 2/1/261 | | | 540,000 | | | | 462,375 | |
| Parker Drilling Co.: | |
| 6.75% Sr. Unsec. Nts., 7/15/22 | | | 685,000 | | | | 352,775 | |
| 7.50% Sr. Unsec. Nts., 8/1/20 | | | 140,000 | | | | 76,300 | |
| Pertamina Persero PT, 5.625% Sr. Unsec. Nts., 5/20/431 | | | 6,755,000 | | | | 6,413,879 | |
| Pioneer Energy Services Corp., 6.125% Sr. Unsec. Nts., 3/15/22 | | | 1,655,000 | | | | 1,017,825 | |
| Precision Drilling Corp., 7.125% Sr. Unsec. Nts., 1/15/261 | | | 330,000 | | | | 285,450 | |
| Rowan Cos., Inc., 7.375% Sr. Unsec. Nts., 6/15/25 | | | 610,000 | | | | 492,575 | |
| SESI LLC, 7.75% Sr. Unsec. Nts., 9/15/24 | | | 435,000 | | | | 348,000 | |
| Tervita Escrow Corp., 7.625% Sec. Nts., 12/1/211 | | | 275,000 | | | | 263,312 | |
| Transocean Pontus Ltd., 6.125% Sr. Sec. Nts., 8/1/251 | | | 275,000 | | | | 266,750 | |
| Transocean, Inc.: | |
| 7.50% Sr. Unsec. Nts., 1/15/261 | | | 265,000 | | | | 233,863 | |
| 9.00% Sr. Unsec. Nts., 7/15/231 | | | 995,000 | | | | 993,756 | |
| Trinidad Drilling Ltd., 6.625% Sr. Unsec. Nts., 2/15/251 | | | 385,000 | | | | 390,198 | |
| Unit Corp., 6.625% Sr. Sub. Nts., 5/15/21 | | | 135,000 | | | | 123,525 | |
| Weatherford International Ltd., 9.875% | |
| Sr. Unsec. Nts., 2/15/24 | | | 1,572,000 | | | | 974,640 | |
| | | | 22,324,800 | |
| | |
| |
| Oil, Gas & Consumable Fuels—4.8% | |
| Alta Mesa Holdings LP/Alta Mesa Finance Services Corp., 7.875% Sr. Unsec. Nts., 12/15/24 | | | 265,000 | | | | 165,625 | |
| Ardagh Packaging Finance plc/Ardagh | |
| Holdings USA, Inc., 6.00% Sr. Unsec. Nts., 2/15/251 | | | 955,000 | | | | 883,967 | |
| Ascent Resources Utica Holdings LLC/ ARU Finance Corp., 10.00% Sr. Unsec. Nts., 4/1/221 | | | 275,000 | | | | 282,645 | |
| Baytex Energy Corp., 5.625% Sr. Unsec. Nts., 6/1/241 | | | 505,000 | | | | 439,350 | |
| Berry Petroleum Co. LLC, 7.00% Sr. Unsec. Nts., 2/15/261 | | | 135,000 | | | | 122,175 | |
| Blue Racer Midstream LLC/Blue Racer Finance Corp., 6.625% Sr. Unsec. Nts., 7/15/261 | | | 550,000 | | | | 514,250 | |
| California Resources Corp., 8.00% Sec. Nts., 12/15/221 | | | 658,000 | | | | 447,440 | |
| Calumet Specialty Products Partners LP/ Calumet Finance Corp.: | |
| 6.50% Sr. Unsec. Nts., 4/15/21 | | | 415,000 | | | | 347,562 | |
| 7.625% Sr. Unsec. Nts., 1/15/22 | | | 755,000 | | | | 611,550 | |
| Centennial Resource Production LLC, 5.375% Sr. Unsec. Nts., 1/15/261 | | | 430,000 | | | | 402,050 | |
| | | | | | | | |
| | | Principal Amount | | | Value |
| |
| Oil, Gas & Consumable Fuels (Continued) | |
| Cheniere Corpus Christi Holdings LLC: | | | | | | | | |
| 5.125% Sr. Sec. Nts., 6/30/27 | | $ | 525,000 | | | $ | 497,595 | |
| 7.00% Sr. Sec. Nts., 6/30/24 | | | 940,000 | | | | 994,050 | |
| Chesapeake Energy Corp.: | | | | | | | | |
| 6.125% Sr. Unsec. Nts., 2/15/21 | | | 493,000 | | | | 465,885 | |
| 7.00% Sr. Unsec. Nts., 10/1/24 | | | 1,405,000 | | | | 1,222,350 | |
| 7.50% Sr. Unsec. Nts., 10/1/26 | | | 570,000 | | | | 490,200 | |
| 8.00% Sr. Unsec. Nts., 1/15/25 | | | 265,000 | | | | 235,187 | |
| 8.00% Sr. Unsec. Nts., 6/15/27 | | | 425,000 | | | | 359,125 | |
| Citadel LP, 5.375% Sr. Unsec. Nts., 1/17/231 | | | 280,000 | | | | 277,700 | |
| CITGO Petroleum Corp., 6.25% Sr. Sec. Nts., 8/15/221 | | | 70,000 | | | | 68,075 | |
| CNX Resources Corp., 5.875% Sr. Unsec. Nts., 4/15/22 | | | 195,000 | | | | 187,687 | |
| Crestwood Midstream Partners LP/ Crestwood Midstream Finance Corp., 5.75% Sr. Unsec. Nts., 4/1/25 | | | 100,000 | | | | 93,250 | |
| CrownRock LP/CrownRock Finance, Inc., 5.625% Sr. Unsec. Nts., 10/15/251 | | | 1,080,000 | | | | 976,050 | |
| CVR Refining LLC/Coffeyville Finance, Inc., 6.50% Sr. Unsec. Nts., 11/1/22 | | | 1,155,000 | | | | 1,143,450 | |
| DCP Midstream Operating LP, 2.70% Sr. Unsec. Nts., 4/1/19 | | | 345,000 | | | | 343,059 | |
| Denbury Resources, Inc.: | | | | | | | | |
| 9.00% Sec. Nts., 5/15/211 | | | 555,000 | | | | 521,700 | |
| 9.25% Sec. Nts., 3/31/221 | | | 611,000 | | | | 566,702 | |
| Endeavor Energy Resources LP/EER Finance, Inc., 5.75% Sr. Unsec. Nts., 1/30/281 | | | 275,000 | | | | 281,930 | |
| Energy Transfer Equity LP, 7.50% Sr. Sec. Nts., 10/15/20 | | | 290,000 | | | | 302,325 | |
| Energy Transfer LP, 5.875% Sr. Sec. Nts., 1/15/24 | | | 565,000 | | | | 578,210 | |
| Energy Transfer Operating LP, 6.625% [US0003M+415.5] Jr. Sub. Perpetual Bonds2,14 | | | 684,000 | | | | 565,582 | |
| Enviva Partners LP/Enviva Partners Finance Corp., 8.50% Sr. Unsec. Nts., 11/1/21 | | | 1,090,000 | | | | 1,121,337 | |
| EP Energy LLC/Everest Acquisition Finance, Inc.: | | | | | | | | |
| 7.75% Sr. Sec. Nts., 5/15/261 | | | 415,000 | | | | 368,831 | |
| 8.00% Sr. Sec. Nts., 11/29/241 | | | 425,000 | | | | 318,750 | |
| 8.00% Sec. Nts., 2/15/251 | | | 1,692,000 | | | | 706,410 | |
| 9.375% Sec. Nts., 5/1/243 | | | 3,042,000 | | | | 1,368,900 | |
| Extraction Oil & Gas, Inc., 7.375% Sr. Unsec. Nts., 5/15/241 | | | 265,000 | | | | 219,950 | |
| Foresight Energy LLC/Foresight Energy Finance Corp., 11.50% Sec. Nts., 4/1/231 | | | 210,000 | | | | 179,550 | |
| Frontera Energy Corp., 9.70% Sr. Unsec. Nts., 6/25/231 | | | 985,000 | | | | 975,150 | |
| Genesis Energy LP/Genesis Energy Finance Corp.: | | | | | | | | |
| 6.00% Sr. Unsec. Nts., 5/15/23 | | | 725,000 | | | | 672,437 | |
| 6.25% Sr. Unsec. Nts., 5/15/26 | | | 1,005,000 | | | | 866,812 | |
| 6.50% Sr. Unsec. Nts., 10/1/25 | | | 795,000 | | | | 703,575 | |
| 6.75% Sr. Unsec. Nts., 8/1/22 | | | 140,000 | | | | 137,200 | |
| Gulfport Energy Corp.: | | | | | | | | |
| 6.00% Sr. Unsec. Nts., 10/15/24 | | | 275,000 | | | | 244,750 | |
| 6.375% Sr. Unsec. Nts., 5/15/25 | | | 275,000 | | | | 244,406 | |
| Halcon Resources Corp., 6.75% Sr. Unsec. Nts., 2/15/25 | | | 530,000 | | | | 389,550 | |
| Hess Infrastructure Partners LP/Hess Infrastructure Partners Finance Corp., 5.625% Sr. Unsec. Nts., 2/15/261 | | | 275,000 | | | | 267,437 | |
| HighPoint Operating Corp., 8.75% Sr. Unsec. Nts., 6/15/25 | | | 188,000 | | | | 179,540 | |
16 OPPENHEIMER GLOBAL STRATEGIC INCOME FUND/VA
| | | | | | | | |
| | | Principal Amount | | | Value |
| |
| Oil, Gas & Consumable Fuels (Continued) | |
| Hilcorp Energy I LP/Hilcorp Finance Co., 5.75% Sr. Unsec. Nts., 10/1/251 | | $ | 165,000 | | | $ | 147,675 | |
| Holly Energy Partners LP/Holly Energy Finance Corp., 6.00% Sr. Unsec. Nts., 8/1/241 | | | 265,000 | | | | 261,025 | |
| Indigo Natural Resources LLC, 6.875% Sr. Unsec. Nts., 2/15/261 | | | 455,000 | | | | 393,575 | |
| Indika Energy Capital III Pte Ltd., 5.875% Sr. Sec. Nts., 11/9/241 | | | 1,190,000 | | | | 1,040,613 | |
| Jones Energy Holdings LLC/Jones Energy Finance Corp., 6.75% Sr. Unsec. Nts., 4/1/22 | | | 818,000 | | | | 159,510 | |
| KazMunayGas National Co. JSC: | |
| 4.75% Sr. Unsec. Nts., 4/24/251 | | | 1,025,000 | | | | 1,018,594 | |
| 5.375% Sr. Unsec. Nts., 4/24/301 | | | 1,915,000 | | | | 1,887,734 | |
| 6.375% Sr. Unsec. Nts., 10/24/481 | | | 1,720,000 | | | | 1,735,910 | |
| KazTransGas JSC, 4.375% Sr. Unsec. Nts., 9/26/271 | | | 1,155,000 | | | | 1,074,627 | |
| Laredo Petroleum, Inc.: | |
| 5.625% Sr. Unsec. Nts., 1/15/22 | | | 285,000 | | | | 257,212 | |
| 6.25% Sr. Unsec. Nts., 3/15/23 | | | 165,000 | | | | 148,912 | |
| LBC Tank Terminals Holding Netherlands BV, 6.875% Sr. Unsec. Nts., 5/15/231 | | | 235,000 | | | | 211,500 | |
| Medco Platinum Road Pte Ltd., 6.75% Sr. Sec. Nts., 1/30/251 | | | 2,115,000 | | | | 1,814,031 | |
| MEG Energy Corp.: | |
| 6.50% Sec. Nts., 1/15/251 | | | 520,000 | | | | 529,750 | |
| 7.00% Sr. Unsec. Nts., 3/31/241 | | | 615,000 | | | | 590,400 | |
| Moss Creek Resources Holdings, Inc., 7.50% Sr. Unsec. Nts., 1/15/261 | | | 575,000 | | | | 500,250 | |
| Murphy Oil Corp., 6.875% Sr. Unsec. Nts., 8/15/24 | | | 390,000 | | | | 388,841 | |
| Murray Energy Corp., 12.00% Sec. Nts., 4/15/241,13 | | | 2,418,173 | | | | 1,317,904 | |
| Newfield Exploration Co., 5.625% Sr. Unsec. Nts., 7/1/24 | | | 290,000 | | | | 294,350 | |
| NGL Energy Partners LP/NGL Energy Finance Corp.: | | | | | | | | |
| 6.125% Sr. Unsec. Nts., 3/1/25 | | | 1,295,000 | | | | 1,120,175 | |
| 7.50% Sr. Unsec. Nts., 11/1/23 | | | 705,000 | | | | 680,325 | |
| Northern Oil & Gas, Inc., 9.50% Sec. Nts., 5/15/2313 | | | 145,000 | | | | 140,287 | |
| NuStar Logistics LP, 5.625% Sr. Unsec. Nts., 4/28/27 | | | 330,000 | | | | 308,962 | |
| Oasis Petroleum, Inc.: | |
| 6.25% Sr. Unsec. Nts., 5/1/261 | | | 275,000 | | | | 231,688 | |
| 6.875% Sr. Unsec. Nts., 1/15/23 | | | 355,000 | | | | 328,819 | |
| Parkland Fuel Corp., 6.00% Sr. Unsec. Nts., 4/1/261 | | | 275,000 | | | | 259,188 | |
| Parsley Energy LLC/Parsley Finance Corp., 5.625% Sr. Unsec. Nts., 10/15/271 | | | 400,000 | | | | 365,500 | |
| PBF Holding Co. LLC/PBF Finance Corp.: | | | | | | | | |
| 7.00% Sr. Sec. Nts., 11/15/23 | | | 375,000 | | | | 360,000 | |
| 7.25% Sr. Unsec. Nts., 6/15/25 | | | 420,000 | | | | 396,900 | |
| PBF Logistics LP/PBF Logistics Finance Corp., 6.875% Sr. Unsec. Nts., 5/15/23 | | | 430,000 | | | | 424,625 | |
| PDC Energy, Inc., 5.75% Sr. Unsec. Nts., 5/15/26 | | | 535,000 | | | | 477,488 | |
| Peabody Energy Corp., 6.375% Sr. Sec. Nts., 3/31/251 | | | 275,000 | | | | 256,438 | |
| Petrobras Global Finance BV: | |
| 5.299% Sr. Unsec. Nts., 1/27/25 | | | 1,475,000 | | | | 1,412,313 | |
| 5.999% Sr. Unsec. Nts., 1/27/28 | | | 2,660,000 | | | | 2,511,067 | |
| Petroleos Mexicanos: | |
| 3.75% Sr. Unsec. Nts., 2/21/249 | | EUR | 505,000 | | | | 557,258 | |
| 3.75% Sr. Unsec. Nts., 4/16/269 | | EUR | 895,000 | | | | 939,987 | |
| Puma International Financing SA, 5.00% Sr. Unsec. Nts., 1/24/261 | | | 1,045,000 | | | | 815,185 | |
| | | | | | | | |
| | | Principal Amount | | | Value |
| |
| Oil, Gas & Consumable Fuels (Continued) | |
| QEP Resources, Inc., 5.625% Sr. Unsec. Nts., 3/1/26 | | $ | 665,000 | | | $ | 554,444 | |
| Reliance Industries Ltd.: | | | | | | | | |
| 6.78% Unsec. Nts., 9/16/20 | | INR | 70,000,000 | | | | 991,273 | |
| 7.00% Unsec. Nts., 8/31/22 | | INR | 210,000,000 | | | | 2,934,616 | |
| Repsol International Finance BV, 4.50% [EUSA10+420] Jr. Sub. Nts., 3/25/752,9 | | EUR | 1,410,000 | | | | 1,657,915 | |
| Resolute Energy Corp., 8.50% Sr. Unsec. Nts., 5/1/20 | | | 2,015,000 | | | | 1,987,294 | |
| Rio Oil Finance Trust Series2018-1, 8.20% Sr. Sec. Nts., 4/6/281 | | | 740,000 | | | | 777,000 | |
| Saka Energi Indonesia PT, 4.45% Sr. Unsec. Nts., 5/5/241 | | | 600,000 | | | | 550,384 | |
| Sanchez Energy Corp.: | | | | | | | | |
| 6.125% Sr. Unsec. Nts., 1/15/23 | | | 1,600,000 | | | | 296,000 | |
| 7.25% Sr. Sec. Nts., 2/15/231 | | | 570,000 | | | | 467,400 | |
| 7.75% Sr. Unsec. Nts., 6/15/21 | | | 755,000 | | | | 181,200 | |
| SemGroup Corp./Rose Rock Finance Corp.: | | | | | | | | |
| 5.625% Sr. Unsec. Nts., 7/15/22 | | | 165,000 | | | | 156,338 | |
| 5.625% Sr. Unsec. Nts., 11/15/23 | | | 545,000 | | | | 498,675 | |
| SM Energy Co.: | | | | | | | | |
| 6.625% Sr. Unsec. Nts., 1/15/27 | | | 280,000 | | | | 250,600 | |
| 6.75% Sr. Unsec. Nts., 9/15/26 | | | 170,000 | | | | 153,000 | |
| Southern Gas Corridor CJSC, 6.875% Sr. Unsec. Nts., 3/24/261 | | | 1,015,000 | | | | 1,099,736 | |
| Southwestern Energy Co.: | | | | | | | | |
| 6.20% Sr. Unsec. Nts., 1/23/25 | | | 137,000 | | | | 123,129 | |
| 7.50% Sr. Unsec. Nts., 4/1/26 | | | 265,000 | | | | 251,750 | |
| SRC Energy, Inc., 6.25% Sr. Unsec. Nts., 12/1/25 | | | 305,000 | | | | 254,675 | |
| Summit Midstream Holdings LLC/Summit Midstream Finance Corp., 5.75% Sr. Unsec. Nts., 4/15/25 | | | 780,000 | | | | 721,500 | |
| Sunoco LP/Sunoco Finance Corp.: | | | | | | | | |
| 4.875% Sr. Unsec. Nts., 1/15/23 | | | 335,000 | | | | 327,463 | |
| 5.50% Sr. Unsec. Nts., 2/15/26 | | | 180,000 | | | | 171,000 | |
| 5.875% Sr. Unsec. Nts., 3/15/28 | | | 404,000 | | | | 378,904 | |
| Tallgrass Energy Partners LP/Tallgrass Energy Finance Corp.: | | | | | | | | |
| 5.50% Sr. Unsec. Nts., 9/15/241 | | | 555,000 | | | | 548,063 | |
| 5.50% Sr. Unsec. Nts., 1/15/281 | | | 335,000 | | | | 323,275 | |
| Targa Resources Partners LP/Targa Resources Partners Finance Corp.: | | | | | | | | |
| 5.00% Sr. Unsec. Nts., 1/15/28 | | | 635,000 | | | | 576,263 | |
| 5.875% Sr. Unsec. Nts., 4/15/261 | | | 550,000 | | | | 537,625 | |
| Topaz Marine SA, 9.125% Sr. Unsec. Nts., 7/26/221 | | | 480,000 | | | | 483,413 | |
| TransMontaigne Partners LP/TLP Finance Corp., 6.125% Sr. Unsec. Nts., 2/15/26 | | | 135,000 | | | | 121,500 | |
| Ultra Resources, Inc.: | | | | | | | | |
| 6.875% Sr. Unsec. Nts., 4/15/221 | | | 390,000 | | | | 140,400 | |
| 7.125% Sr. Unsec. Nts., 4/15/251 | | | 295,000 | | | | 94,400 | |
| USA Compression Partners LP/USA Compression Finance Corp., 6.875% Sr. Unsec. Nts., 4/1/261 | | | 415,000 | | | | 400,475 | |
| W&T Offshore, Inc., 9.75% Sec. Nts., 11/1/231 | | | 70,000 | | | | 61,950 | |
| Whiting Petroleum Corp., 6.625% Sr. Unsec. Nts., 1/15/26 | | | 550,000 | | | | 474,375 | |
| WildHorse Resource Development Corp., 6.875% Sr. Unsec. Nts., 2/1/25 | | | 275,000 | | | | 261,250 | |
| WPX Energy, Inc.: | | | | | | | | |
| 5.75% Sr. Unsec. Nts., 6/1/26 | | | 275,000 | | | | 250,250 | |
| 8.25% Sr. Unsec. Nts., 8/1/23 | | | 415,000 | | | | 435,750 | |
| | | | | | | 68,203,214 | |
17 OPPENHEIMER GLOBAL STRATEGIC INCOME FUND/VA
CONSOLIDATED STATEMENT OF INVESTMENTSContinued
| | | | | | | | |
| | | Principal Amount | | | Value |
| |
| Financials—12.3% | |
|
| Capital Markets—1.8% | |
| Charles Schwab Corp. (The), 5.00% [US0003M+257.5] Jr. Sub. Perpetual Bonds2,14 | | $ | 1,343,000 | | | $ | 1,130,135 | |
| Credit Suisse Group AG: | |
| 7.125% [USSW5+510.8] Jr. Sub. Perpetual Bonds2,9,14 | | | 1,260,000 | | | | 1,245,825 | |
| 7.50% [USSW5+459.8] Jr. Sub. Perpetual Bonds2,9,14 | | | 4,280,000 | | | | 4,363,460 | |
| Diamond Resorts International, Inc.: | |
| 7.75% Sr. Sec. Nts., 9/1/231 | | | 265,000 | | | | 255,394 | |
| 10.75% Sr. Unsec. Nts., 9/1/241 | | | 590,000 | | | | 532,475 | |
| E*TRADE Financial Corp., 5.875% [US0003M+443.5] Jr. Sub. Perpetual Bonds2,14 | | | 1,258,000 | | | | 1,135,345 | |
| Eagle Intermediate Global Holding BV/ Ruyi US Finance LLC, 7.50% Sr. Sec. Nts., 5/1/253 | | | 285,000 | | | | 267,686 | |
| European Bank for Reconstruction & Development, 28.50%, 7/10/19 | | TRY | 10,100,000 | | | | 1,955,249 | |
| Flex Acquisition Co., Inc., 6.875% Sr. Unsec. Nts., 1/15/251 | | | 1,530,000 | | | | 1,369,350 | |
| Goldman Sachs Group, Inc. (The): | |
| 5.00% [US0003M+287.4] Jr. Sub. Perpetual Bonds2,14 | | | 681,000 | | | | 575,871 | |
| 5.375% [US0003M+392.2] Jr. Sub. Perpetual Bonds2,14 | | | 645,000 | | | | 624,051 | |
| Huarong Finance 2017 Co. Ltd., 4.25% Sr. Unsec. Nts., 11/7/279 | | | 1,015,000 | | | | 914,840 | |
| Icahn Enterprises LP/Icahn Enterprises Finance Corp., 6.375% Sr. Unsec. Nts., 12/15/25 | | | 545,000 | | | | 525,925 | |
| Macquarie Bank Ltd. (London), 6.125% [USSW5+370.3] Jr. Sub. Perpetual Bonds1,2,14 | | | 1,268,000 | | | | 1,085,725 | |
| MSCI, Inc., 5.375% Sr. Unsec. Nts., 5/15/271 | | | 275,000 | | | | 269,844 | |
| NCI Building Systems, Inc., 8.00% Sec. Nts., 4/15/261 | | | 135,000 | | | | 124,031 | |
| Prime Security Services Borrower LLC/ Prime Finance, Inc., 9.25% Sec. Nts., 5/15/231 | | | 867,000 | | | | 896,261 | |
| Refinitiv US Holdings, Inc.: | |
| 6.25% Sr. Sec. Nts., 5/15/261 | | | 285,000 | | | | 275,381 | |
| 8.25% Sr. Unsec. Nts., 11/15/261 | | | 285,000 | | | | 261,131 | |
| Rivers Pittsburgh Borrower LP/Rivers Pittsburgh Finance Corp., 6.125% Sr. Sec. Nts., 8/15/211 | | | 375,000 | | | | 364,688 | |
| State Street Corp., 5.625% [US0003M+253.9] Jr. Sub. Perpetual Bonds2,14 | | | 609,000 | | | | 576,266 | |
| Tempo Acquisition LLC/Tempo Acquisition Finance Corp., 6.75% Sr. Unsec. Nts., 6/1/251 | | | 805,000 | | | | 748,650 | |
| TerraForm Power Operating LLC: | |
| 4.25% Sr. Unsec. Nts., 1/31/231 | | | 510,000 | | | | 478,125 | |
| 5.00% Sr. Unsec. Nts., 1/31/281 | | | 195,000 | | | | 172,331 | |
| Trident Merger Sub, Inc., 6.625% Sr. Unsec. Nts., 11/1/251 | | | 805,000 | | | | 720,475 | |
| UBS Group Funding Switzerland AG: | |
| 6.875% [USISDA05+549.65] Jr. Sub. Perpetual Bonds2,9,14 | | | 3,905,000 | | | | 3,917,367 | |
| 7.125% [USSW5+588.3] Jr. Sub. Perpetual Bonds2,9,14 | | | 1,220,000 | | | | 1,240,603 | |
| | | | 26,026,484 | |
| | |
| |
| Commercial Banks—6.1% | |
| Abanca Corp. Bancaria SA, 7.50% [EUSA5+732.6] Jr. Sub. Perpetual Bonds2,9,14,15 | | EUR | 1,600,000 | | | | 1,736,407 | |
| | | | | | | | |
| | | Principal Amount | | | Value |
| |
| Commercial Banks (Continued) | |
| Astana Finance JSC, 9.16% Sr. Unsec. Nts., 12/22/2410,11 | | $ | 315,159 | | | $ | — | |
| Australia & New Zealand Banking Group Ltd. (United Kingdom), 6.75% [USISDA05+516.8] Jr. Sub. Perpetual Bonds1,2,14 | | | 105,000 | | | | 103,294 | |
| Banca Monte dei Paschi di Siena SpA, 5.375% [EUSA5+500.5] Sub. Nts., 1/18/282,9 | | EUR | 4,239,000 | | | | 2,851,195 | |
| Banco Bilbao Vizcaya Argentaria SA: 5.875% [EUSA5+566] Jr. Sub. Perpetual Bonds2,9,14,15 | | EUR | 2,190,000 | | | | 2,335,674 | |
| 6.125% [USSW5+387] Jr. Sub. Perpetual Bonds2,14 | | | 1,290,000 | | | | 1,083,600 | |
| 6.75% [EUSA5+660.4] Jr. Sub. Perpetual Bonds2,9,14 | | EUR | 1,450,000 | | | | 1,648,902 | |
| 8.875% [EUSA5+917.7] Jr. Sub. Perpetual Bonds2,9,14 | | EUR | 2,860,000 | | | | 3,559,080 | |
| Banco do Brasil SA (Cayman), 3.875% Sr. Unsec. Nts., 10/10/22 | | | 1,370,000 | | | | 1,323,762 | |
| Banco Mercantil del Norte SA (Grand Cayman), 7.625% [H15T10Y+535.3] Jr. Sub. Perpetual Bonds1,2,14 | | | 395,000 | | | | 384,141 | |
Banco Santander SA: 6.375% [USSW5+478.8] Jr. Sub. Perpetual Bonds2,9,14 | | | 1,290,000 | | | | 1,238,239 | |
| 6.75% [EUSA5+680.3] Jr. Sub. Perpetual Bonds2,9,14 | | EUR | 4,235,000 | | | | 4,946,264 | |
| Bank of America Corp., 6.30% [US0003M+455.3] Jr. Sub. Perpetual Bonds2,14 | | | 1,478,000 | | | | 1,504,826 | |
| Barclays plc: | |
| 7.75% [USSW5+484.2] Jr. Sub. Perpetual Bonds2,14 | | | 1,165,000 | | | | 1,123,549 | |
| 7.875% [USSW5+677.2] Jr. Sub. Perpetual Bonds2,9,14 | | | 1,225,000 | | | | 1,229,594 | |
| BBVA Bancomer SA, 5.35% [H15T5Y+300] Sub. Nts., 11/12/291,2 | | | 865,000 | | | | 800,125 | |
| BNP Paribas SA: | |
| 7.625% [USSW5+631.4] Jr. Sub. Perpetual Bonds1,2,14 | | | 1,210,000 | | | | 1,235,712 | |
| 7.625% [USSW5+631.4] Jr. Sub. Perpetual Bonds2,9,14 | | | 4,535,000 | | | | 4,631,369 | |
| Caixa Geral de Depositos SA, 5.75% [EUSA5+550] Sub. Nts., 6/28/282,9 | | EUR | 1,455,000 | | | | 1,700,749 | |
| CaixaBank SA, 6.75% [EUSA5+649.8] Jr. Sub. Perpetual Bonds2,9,14 | | EUR | �� 2,915,000 | | | | 3,384,392 | |
| CIT Group, Inc.: | |
| 4.125% Sr. Unsec. Nts., 3/9/21 | | | 460,000 | | | | 454,250 | |
| 5.00% Sr. Unsec. Nts., 8/15/22 | | | 140,000 | | | | 138,425 | |
| 5.25% Sr. Unsec. Nts., 3/7/25 | | | 285,000 | | | | 279,300 | |
| 5.80% [US0003M+397.2] Jr. Sub. Perpetual Bonds2,14 | | | 1,308,000 | | | | 1,187,010 | |
| Citigroup, Inc., 6.125% [US0003M+447.8] Jr. Sub. Perpetual Bonds2,14 | | | 947,000 | | | | 925,692 | |
| Citizens Financial Group, Inc., 6.00% [US0003M+300.3] Jr. Sub. Perpetual Bonds2,14 | | | 635,000 | | | | 585,787 | |
| Credit Agricole SA, 8.125% [USSW5+618.5] Jr. Sub. Perpetual Bonds1,2,14 | | | 1,390,000 | | | | 1,433,437 | |
| Fidelity Bank plc, 10.50% Sr. Unsec. Nts., 10/16/221 | | | 560,000 | | | | 562,958 | |
| Fifth Third Bancorp, 5.10% [US0003M+303.33] Jr. Sub. Perpetual Bonds2,14 | | | 335,000 | | | | 291,869 | |
18 OPPENHEIMER GLOBAL STRATEGIC INCOME FUND/VA
| | | | | | | | |
| | | Principal Amount | | | Value |
| Commercial Banks (Continued) | | | | | | | | |
| HSBC Holdings plc: | | | | | | | | |
| 5.25% [EUSA5+438.3] Jr. Sub. Perpetual Bonds2,9,14 | | EUR | 5,215,000 | | | $ | 5,945,181 | |
| 6.00% [EUSA5+533.8] Jr. Sub. Perpetual Bonds2,9,14 | | EUR | 1,745,000 | | | | 2,120,147 | |
| Huntington Bancshares, Inc., 5.70% [US0003M+288] Jr. Sub. Perpetual Bonds2,14 | | | 674,000 | | | | 599,439 | |
| IDBI Bank Ltd.(GIFT-IFC), 5.00% Sr. Unsec. Nts., 9/25/199 | | | 430,000 | | | | 430,739 | |
| ING Groep NV, 6.875% [USSW5+512.4] Jr. Sub. Perpetual Bonds2,9,14 | | | 1,210,000 | | | | 1,206,975 | |
Intesa Sanpaolo SpA: 3.875% Sr. Unsec. Nts., 1/12/281 | | | 1,465,000 | | | | 1,254,187 | |
| 7.00% [EUSA5+688.4] Jr. Sub. Perpetual Bonds2,9,14 | | EUR | 1,405,000 | | | | 1,633,075 | |
| 7.70% [USSW5+546.15] Jr. Sub. Perpetual Bonds1,2,14 | | | 2,931,000 | | | | 2,630,573 | |
JPMorgan Chase & Co.: 6.125% [US0003M+333] Jr. Sub. Perpetual Bonds2,14 | | | 1,231,000 | | | | 1,223,306 | |
| 5.99% [US0003M+347] Jr. Sub. Perpetual Bonds, Series 12,14 | | | 1,136,000 | | | | 1,124,640 | |
| KBC Group NV, 5.625% [EUSA5+475.9] Jr. Sub. Perpetual Bonds2,9,14 | | EUR | 2,145,000 | | | | 2,455,331 | |
| Kenan Advantage Group, Inc. (The), 7.875% Sr. Unsec. Nts., 7/31/231 | | | 965,000 | | | | 928,813 | |
| Lloyds Bank plc, 7.50% Sr. Unsec. Nts., 4/2/327,9 | | | 2,825,000 | | | | 2,278,283 | |
| Lloyds Banking Group plc: | | | | | | | | |
| 6.375% [EUSA5+529] Jr. Sub. Perpetual Bonds2,9,14 | | EUR | 1,820,000 | | | | 2,062,296 | |
| 7.50% [USSW5+449.6] Jr. Sub. Perpetual Bonds2,14 | | | 1,239,000 | | | | 1,198,980 | |
| Royal Bank of Scotland Group plc, 7.50% [USSW5+580] Jr. Sub. Perpetual Bonds2,14 | | | 2,250,000 | | | | 2,233,125 | |
| Societe Generale SA: | | | | | | | | |
| 6.75% [EUSA5+553.8] Jr. Sub. Perpetual Bonds2,9,14 | | EUR | 1,255,000 | | | | 1,459,363 | |
| 7.375% [USSW5+623.8] Jr. Sub. Perpetual Bonds1,2,14 | | | 5,460,000 | | | | 5,330,325 | |
| SunTrust Banks, Inc.: | | | | | | | | |
| 5.05% [US0003M+310.2] Jr. Sub. Perpetual Bonds2,14 | | | 992,000 | | | | 872,960 | |
| 5.125% [US0003M+278.6] Jr. Sub. Perpetual Bonds2,14 | | | 694,000 | | | | 590,077 | |
| Swiss Insured Brazil Power Finance Sarl, 9.85% Sr. Sec. Nts., 7/16/32 | | BRL | 5,250,000 | | | | 1,364,736 | |
| UBS Group Funding Switzerland AG: | | | | | | | | |
| 5.00% [USSW5+243.2] Jr. Sub. Perpetual Bonds2,9,14 | | | 435,000 | | | | 362,953 | |
| 5.75% [EUSA5+528.7] Jr. Sub. Perpetual Bonds2,9,14 | | EUR | 2,925,000 | | | | 3,559,352 | |
| Wachovia Capital Trust III, 5.57% [US0003M+93] Jr. Sub. Perpetual Bonds2,14 | | | 1,323,000 | | | | 1,198,307 | |
| Wells Fargo & Co., 6.558% | | | | | | | | |
| [US0003M+377] Jr. Sub. Perpetual Bonds, Series K2,14 | | | 270,000 | | | | 268,650 | |
| Zenith Bank plc, 7.375% Sr. Unsec. Nts., 5/30/221 | | | 550,000 | | | | 547,528 | |
| | | | | | | | 87,558,943 | |
| Consumer Finance—1.0% | | | | | | | | |
| Ahern Rentals, Inc., 7.375% Sec. Nts., 5/15/231 | | | 605,000 | | | | 487,025 | |
| Ally Financial, Inc.: | | | | | | | | |
| 4.625% Sr. Unsec. Nts., 5/19/22 | | | 440,000 | | | | 433,950 | |
| 5.75% Sub. Nts., 11/20/25 | | | 1,070,000 | | | | 1,068,662 | |
| | | | | | | | |
| | | Principal Amount | | | Value |
| Consumer Finance (Continued) | | | | | | | | |
| Ally Financial, Inc.: (Continued) | | | | | | | | |
| 8.00% Sr. Unsec. Nts., 11/1/31 | | $ | 415,000 | | | $ | 462,725 | |
| American Express Co., 4.90% [US0003M+328.5] Jr. Sub. Perpetual Bonds2,14 | | | 974,000 | | | | 933,822 | |
| Discover Financial Services, 5.50% [US0003M+307.6] Jr. Sub. Perpetual Bonds2,14 | | | 652,000 | | | | 542,516 | |
| Enova International, Inc., 8.50% Sr. Unsec. Nts., 9/15/251 | | | 855,000 | | | | 698,963 | |
| Minejesa Capital BV: | | | | | | | | |
| 4.625% Sr. Sec. Nts., 8/10/303 | | | 2,660,000 | | | | 2,380,923 | |
| 5.625% Sr. Sec. Nts., 8/10/373 | | | 4,285,000 | | | | 3,771,160 | |
| Navient Corp.: | | | | | | | | |
| 5.875% Sr. Unsec. Nts., 10/25/24 | | | 790,000 | | | | 663,600 | |
| 6.50% Sr. Unsec. Nts., 6/15/22 | | | 535,000 | | | | 499,176 | |
| 6.625% Sr. Unsec. Nts., 7/26/21 | | | 505,000 | | | | 488,588 | |
| 6.75% Sr. Unsec. Nts., 6/25/25 | | | 685,000 | | | | 585,675 | |
| 6.75% Sr. Unsec. Nts., 6/15/26 | | | 415,000 | | | | 345,488 | |
| Terraform Global Operating LLC, 6.125% Sr. Unsec. Nts., 3/1/261 | | | 820,000 | | | | 764,650 | |
| TMX Finance LLC/TitleMax Finance Corp., 11.125% Sr. Sec. Nts., 4/1/231 | | | 555,000 | | | | 448,690 | |
| | | | | | | | 14,575,613 | |
| Diversified Financial Services—0.4% | | | | | |
| Export-Import Bank of India, 7.35% Sr. Unsec. Nts., 5/18/22 | | INR | 70,000,000 | | | | 981,095 | |
| Fidelity & Guaranty Life Holdings, Inc., 5.50% Sr. Unsec. Nts., 5/1/251 | | | 385,000 | | | | 369,715 | |
| JPMorgan Hipotecaria su Casita, 6.47% Sec. Nts., 8/26/351,11 | | MXN | 5,808,600 | | | | 26,602 | |
| Park Aerospace Holdings Ltd.: | | | | | | | | |
| 5.25% Sr. Unsec. Nts., 8/15/221 | | | 135,000 | | | | 131,119 | |
| 5.50% Sr. Unsec. Nts., 2/15/241 | | | 570,000 | | | | 551,475 | |
| Rural Electrification Corp. Ltd.: | | | | | | | | |
| 7.24% Sr. Unsec. Nts., 10/21/21 | | INR | 140,000,000 | | | | 1,972,788 | |
| 7.60% Sr. Unsec. Nts., 4/17/21 | | INR | 100,000,000 | | | | 1,419,830 | |
| Voya Financial, Inc., 4.70% | | | | | | | | |
| [US0003M+208.4] Jr. Sub. Nts., 1/23/482 | | | 686,000 | | | | 541,165 | |
| | | | | | | 5,993,789 | |
| Insurance—0.9% | | | | | | | | |
| AXA SA, 3.875% [EUSA11+325] Jr. Sub. Perpetual Bonds2,9,14 | | EUR | 2,825,000 | | | | 3,293,791 | |
| Credivalores-Crediservicios SAS, 9.75% Sr. Unsec. Nts., 7/27/221 | | | 670,000 | | | | 586,250 | |
| Genworth Holdings, Inc.: | | | | | | | | |
| 7.625% Sr. Unsec. Nts., 9/24/21 | | | 330,000 | | | | 327,525 | |
| 7.70% Sr. Unsec. Nts., 6/15/20 | | | 430,000 | | | | 436,450 | |
| Hartford Financial Services Group, Inc. (The), 4.741% [US0003M+212.5] Jr. Sub. Nts., 2/12/472,3 | | | 689,000 | | | | 552,922 | |
| HUB International Ltd., 7.00% Sr. Unsec. Nts., 5/1/261 | | | 275,000 | | | | 250,250 | |
| Liberty Mutual Group, Inc., 5.693% [US0003M+290.5] Jr. Sub. Nts., 3/15/371,2 | | | 323,000 | | | | 301,197 | |
| Lincoln National Corp., 4.998% [US0003M+235.75] Jr. Sub. Nts., 5/17/662 | | | 704,000 | | | | 576,013 | |
| MetLife, Inc., 5.25% [US0003M+357.5] Jr. Sub. Perpetual Bonds2,14 | | | 647,000 | | | | 622,738 | |
| Power Finance Corp. Ltd.: | | | | | | | | |
| 7.27% Sr. Unsec. Nts., 12/22/21 | | INR | 140,000,000 | | | | 1,989,382 | |
| 7.42% Sr. Unsec. Nts., 6/26/20 | | INR | 85,000,000 | | | | 1,212,216 | |
| 7.50% Sr. Unsec. Nts., 8/16/21 | | INR | 140,000,000 | | | | 1,963,660 | |
| | | | | | | 12,112,394 | |
19 OPPENHEIMER GLOBAL STRATEGIC INCOME FUND/VA
CONSOLIDATED STATEMENT OF INVESTMENTSContinued
| | | | | | | | |
| | | Principal Amount | | | Value |
| Real Estate Investment Trusts (REITs)—0.8% | |
| AHP Health Partners, Inc., 9.75% Sr. Unsec. Nts., 7/15/261 | | $ | 275,000 | | | $ | 279,812 | |
| Banco Invex SA/Hipotecaria Credito y Casa SA de CV, 6.45% Sec. Nts., 3/13/3410,11,16 | | MXN | 4,830,531 | | | | — | |
| Equinix, Inc.: | | | | | | | | |
| 5.375% Sr. Unsec. Nts., 5/15/27 | | | 780,000 | | | | 764,400 | |
| 5.875% Sr. Unsec. Nts., 1/15/26 | | | 945,000 | | | | 954,450 | |
| GLP Capital LP/GLP Financing II, Inc., 5.375% Sr. Unsec. Nts., 11/1/23 | | | 410,000 | | | | 417,154 | |
| Iron Mountain US Holdings, Inc., 5.375% Sr. Unsec. Nts., 6/1/261 | | | 995,000 | | | | 910,425 | |
| Iron Mountain, Inc., 4.875% Sr. Unsec. Nts., 9/15/271 | | | 410,000 | | | | 359,775 | |
| iStar, Inc.: | | | | | | | | |
| 5.00% Sr. Unsec. Nts., 7/1/19 | | | 197,000 | | | | 196,508 | |
| 5.25% Sr. Unsec. Nts., 9/15/22 | | | 800,000 | | | | 749,920 | |
| 6.00% Sr. Unsec. Nts., 4/1/22 | | | 1,165,000 | | | | 1,130,050 | |
| Lamar Media Corp., 5.75% Sr. Unsec. Nts., 2/1/26 | | | 620,000 | | | | 630,075 | |
| MPT Operating Partnership LP/MPT Finance Corp.: | | | | | | | | |
| 5.00% Sr. Unsec. Nts., 10/15/27 | | | 795,000 | | | | 728,916 | |
| 6.375% Sr. Unsec. Nts., 3/1/24 | | | 250,000 | | | | 257,500 | |
| Outfront Media Capital LLC/Outfront Media Capital Corp., 5.875% Sr. Unsec. Nts., 3/15/25 | | | 720,000 | | | | 709,200 | |
| SBA Communications Corp., 4.00% Sr. Unsec. Nts., 10/1/22 | | | 690,000 | | | | 660,675 | |
| Starwood Property Trust, Inc.: | | | | | | | | |
| 4.75% Sr. Unsec. Nts., 3/15/25 | | | 805,000 | | | | 726,513 | |
| 5.00% Sr. Unsec. Nts., 12/15/21 | | | 760,000 | | | | 748,600 | |
| Uniti Group LP/Uniti Group Finance, Inc./ CSL Capital LLC, 8.25% Sr. Unsec. Nts., 10/15/23 | | | 780,000 | | | | 682,500 | |
| | | | | | | | 10,906,473 | |
| Real Estate Management & Development—0.7% | |
| Agile Group Holdings Ltd., 9.00% Sr. Sec. Nts., 5/21/209 | | | 2,620,000 | | | | 2,693,158 | |
| CIFI Holdings Group Co. Ltd., 7.75% Sr. Unsec. Nts., 6/5/209 | | | 1,555,000 | | | | 1,577,084 | |
| Country Garden Holdings Co. Ltd., 7.50% Sr. Sec. Nts., 3/9/209 | | | 1,555,000 | | | | 1,577,631 | |
| Greystar Real Estate Partners LLC, 5.75% Sr. Sec. Nts., 12/1/251 | | | 805,000 | | | | 788,900 | |
| Hunt Cos., Inc., 6.25% Sr. Sec. Nts., 2/15/261 | | | 815,000 | | | | 698,374 | |
| Mattamy Group Corp., 6.875% Sr. Unsec. Nts., 12/15/231 | | | 505,000 | | | | 474,069 | |
| New Metro Global Ltd., 6.50% Sr. Unsec. Nts., 4/23/219 | | | 490,000 | | | | 476,171 | |
| Realogy Group LLC/Realogy Co.-Issuer Corp., 4.875% Sr. Unsec. Nts., 6/1/231 | | | 965,000 | | | | 844,375 | |
| Shea Homes LP/Shea Homes Funding Corp., 6.125% Sr. Unsec. Nts., 4/1/251 | | | 745,000 | | | | 663,050 | |
| Times China Holdings Ltd., 6.25% Sr. Sec. Nts., 1/23/209 | | | 490,000 | | | | 485,183 | |
| | | | | | | | 10,277,995 | |
| Thrifts & Mortgage Finance—0.6% | |
| Export-Import Bank of India, 8.00% Sr. Unsec. Nts., 5/27/21 | | INR | 280,000,000 | | | | 4,013,062 | |
| LIC Housing Finance Ltd., 7.45% Sr. Sec. Nts., 10/17/22 | | INR | 70,000,000 | | | | 989,485 | |
| Nationstar Mortgage Holdings, Inc., 8.125% Sr. Unsec. Nts., 7/15/231 | | | 415,000 | | | | 405,663 | |
| Provident Funding Associates LP/PFG Finance Corp., 6.375% Sr. Unsec. Nts., 6/15/251 | | | 395,000 | | | | 359,450 | |
| | | | | | | | |
| | | Principal Amount | | | Value |
| Thrifts & Mortgage Finance (Continued) | |
| Quicken Loans, Inc.: | | | | | | | | |
| 5.25% Sr. Unsec. Nts., 1/15/281 | | $ | 1,075,000 | | | $ | 955,406 | |
| 5.75% Sr. Unsec. Nts., 5/1/251 | | | 1,150,000 | | | | 1,081,000 | |
| Radian Group, Inc., 4.50% Sr. Unsec. Nts., 10/1/24 | | | 545,000 | | | | 496,631 | |
| | | | | | | 8,300,697 | |
| Health Care—2.9% | | | | | | | | |
| Biotechnology—0.1% | | | | | | | | |
| WeWork Cos, Inc., 7.875% Sr. Unsec. Nts., 5/1/251 | | | 1,380,000 | | | | 1,231,650 | |
| Health Care Equipment & Supplies—0.1% | |
| DJO Finance LLC/DJO Finance Corp., 8.125% Sec. Nts., 6/15/211 | | | 480,000 | | | | 495,600 | |
| Hill-Rom Holdings, Inc., 5.75% Sr. Unsec. Nts., 9/1/231 | | | 495,000 | | | | 496,856 | |
| Hologic, Inc., 4.375% Sr. Unsec. Nts., 10/15/251 | | | 145,000 | | | | 135,575 | |
| | | | | | | | 1,128,031 | |
| Health Care Providers & Services—1.5% | |
| Acadia Healthcare Co., Inc.: | | | | | | | | |
| 5.625% Sr. Unsec. Nts., 2/15/23 | | | 305,000 | | | | 290,512 | |
| 6.50% Sr. Unsec. Nts., 3/1/24 | | | 250,000 | | | | 242,500 | |
| Agiliti Health, Inc., 7.625% Sec. Nts., 8/15/20 | | | 755,000 | | | | 750,281 | |
| Centene Corp.: | | | | | | | | |
| 4.75% Sr. Unsec. Nts., 5/15/22 | | | 655,000 | | | | 649,269 | |
| 5.375% Sr. Unsec. Nts., 6/1/261 | | | 825,000 | | | | 804,375 | |
| 6.125% Sr. Unsec. Nts., 2/15/24 | | | 245,000 | | | | 251,431 | |
| CHS/Community Health Systems, Inc.: | | | | | | | | |
| 6.25% Sr. Sec. Nts., 3/31/23 | | | 1,695,000 | | | | 1,546,772 | |
| 6.875% Sr. Unsec. Nts., 2/1/22 | | | 549,000 | | | | 252,540 | |
| 8.125% Sec. Nts., 6/30/243 | | | 60,000 | | | | 44,100 | |
| DaVita, Inc.: | | | | | | | | |
| 5.00% Sr. Unsec. Nts., 5/1/25 | | | 275,000 | | | | 250,594 | |
| 5.125% Sr. Unsec. Nts., 7/15/24 | | | 1,285,000 | | | | 1,207,900 | |
| Encompass Health Corp., 5.75% Sr. Unsec. Nts., 11/1/24 | | | 1,235,000 | | | | 1,227,281 | |
| Envision Healthcare Corp., 8.75% Sr. Unsec. Nts., 10/15/261 | | | 855,000 | | | | 741,712 | |
| HCA, Inc.: | | | | | | | | |
| 5.375% Sr. Unsec. Nts., 2/1/25 | | | 680,000 | | | | 664,700 | |
| 5.375% Sr. Unsec. Nts., 9/1/26 | | | 1,415,000 | | | | 1,379,625 | |
| 5.50% Sr. Sec. Nts., 6/15/47 | | | 365,000 | | | | 346,750 | |
| 5.625% Sr. Unsec. Nts., 9/1/28 | | | 1,415,000 | | | | 1,369,013 | |
| 5.875% Sr. Unsec. Nts., 2/15/26 | | | 275,000 | | | | 274,313 | |
| 7.50% Sr. Unsec. Nts., 2/15/22 | | | 1,425,000 | | | | 1,517,625 | |
| OCP SA, 4.50% Sr. Unsec. Nts., 10/22/251 | | | 960,000 | | | | 922,299 | |
| Omnicare, Inc., 4.75% Sr. Unsec. Nts., 12/1/22 | | | 1,765,000 | | | | 1,822,503 | |
| RegionalCare Hospital Partners Holdings, Inc./LifePoint Health, Inc., 9.75% Sr. Unsec. Nts., 12/1/261 | | | 855,000 | | | | 812,250 | |
| Select Medical Corp., 6.375% Sr. Unsec. Nts., 6/1/21 | | | 770,000 | | | | 770,963 | |
| Tenet Healthcare Corp.: | | | | | | | | |
| 4.375% Sr. Sec. Nts., 10/1/21 | | | 520,000 | | | | 505,700 | |
| 6.75% Sr. Unsec. Nts., 6/15/23 | | | 1,685,000 | | | | 1,588,113 | |
| 7.50% Sec. Nts., 1/1/221 | | | 505,000 | | | | 513,206 | |
| 8.125% Sr. Unsec. Nts., 4/1/22 | | | 765,000 | | | | 769,781 | |
| TPC Group, Inc., 8.75% Sr. Sec. Nts., 12/15/201 | | | 420,000 | | | | 401,100 | |
| | | | | | | | 21,917,208 | |
| Health Care Technology—0.1% | |
| Telenet Finance Luxembourg Notes Sarl, 5.50% Sr. Sec. Nts., 3/1/281 | | | 805,000 | | | | 732,550 | |
20 OPPENHEIMER GLOBAL STRATEGIC INCOME FUND/VA
| | | | | | | | |
| | | Principal Amount | | | Value |
| Life Sciences Tools & Services—0.0% | |
| West Street Merger Sub, Inc., 6.375% Sr. Unsec. Nts., 9/1/251 | | $ | 415,000 | | | $ | 369,350 | |
| Pharmaceuticals—1.1% | | | | | | | | |
| Bausch Health Cos., Inc.: | | | | | | | | |
| 5.50% Sr. Unsec. Nts., 3/1/231 | | | 355,000 | | | | 324,981 | |
| 5.50% Sr. Sec. Nts., 11/1/251 | | | 935,000 | | | | 875,394 | |
| 5.875% Sr. Unsec. Nts., 5/15/231 | | | 1,025,000 | | | | 951,969 | |
| 6.125% Sr. Unsec. Nts., 4/15/251 | | | 1,480,000 | | | | 1,295,000 | |
| 7.00% Sr. Sec. Nts., 3/15/241 | | | 655,000 | | | | 663,188 | |
| 9.00% Sr. Unsec. Nts., 12/15/251 | | | 1,220,000 | | | | 1,218,475 | |
| Endo Dac/Endo Finance LLC/Endo Finco, | | | | | |
| Inc.: | | | | | | | | |
| 5.875% Sr. Sec. Nts., 10/15/241 | | | 275,000 | | | | 261,250 | |
| 6.00% Sr. Unsec. Nts., 7/15/231 | | | 1,255,000 | | | | 963,212 | |
| 6.00% Sr. Unsec. Nts., 2/1/251 | | | 540,000 | | | | 390,150 | |
| Endo Finance LLC/Endo Finco, Inc.: | | | | | | | | |
| 5.375% Sr. Unsec. Nts., 1/15/231 | | | 1,745,000 | | | | 1,334,925 | |
| 7.25% Sr. Unsec. Nts., 1/15/221 | | | 275,000 | | | | 239,250 | |
| Mallinckrodt International Finance SA/ | | | | | |
| Mallinckrodt CB LLC: | | | | | | | | |
| 4.875% Sr. Unsec. Nts., 4/15/201 | | | 835,000 | | | | 809,950 | |
| 5.50% Sr. Unsec. Nts., 4/15/251 | | | 1,320,000 | | | | 917,400 | |
| 5.625% Sr. Unsec. Nts., 10/15/231 | | | 285,000 | | | | 218,025 | |
| 5.75% Sr. Unsec. Nts., 8/1/221 | | | 930,000 | | | | 804,450 | |
| Prestige Brands, Inc., 6.375% Sr. Unsec. Nts., 3/1/241 | | | 325,000 | | | | 315,250 | |
| Teva Pharmaceutical Finance Co. BV, 3.65% Sr. Unsec. Nts., 11/10/21 | | | 485,000 | | | | 459,804 | |
| Teva Pharmaceutical Finance Netherlands II BV, 0.375% Sr. Unsec. Nts., 7/25/209 | | EUR | 1,460,000 | | | | 1,634,804 | |
| Teva Pharmaceutical Finance Netherlands III BV: | | | | | | | | |
| 1.70% Sr. Unsec. Nts., 7/19/19 | | | 235,000 | | | | 231,942 | |
| 3.15% Sr. Unsec. Nts., 10/1/26 | | | 275,000 | | | | 210,336 | |
| 6.00% Sr. Unsec. Nts., 4/15/24 | | | 875,000 | | | | 844,943 | |
| Valeant Pharmaceuticals International, 8.50% Sr. Unsec. Nts., 1/31/271 | | | 825,000 | | | | 802,313 | |
| | | | | | | 15,767,011 | |
| Industrials—3.5% | | | | | | | | |
| Aerospace & Defense—0.6% | | | | | | | | |
| Arconic, Inc., 5.125% Sr. Unsec. Nts., 10/1/24 | | | 535,000 | | | | 517,947 | |
| Bombardier, Inc.: | | | | | | | | |
| 6.00% Sr. Unsec. Nts., 10/15/221 | | | 475,000 | | | | 447,687 | |
| 7.50% Sr. Unsec. Nts., 12/1/241 | | | 1,140,000 | | | | 1,077,300 | |
| 7.50% Sr. Unsec. Nts., 3/15/251 | | | 805,000 | | | | 761,731 | |
| 8.75% Sr. Unsec. Nts., 12/1/211 | | | 1,170,000 | | | | 1,209,488 | |
| DAE Funding LLC: | | | | | | | | |
| 4.50% Sr. Unsec. Nts., 8/1/221 | | | 590,000 | | | | 567,875 | |
| 5.00% Sr. Unsec. Nts., 8/1/241 | | | 265,000 | | | | 257,050 | |
| Kratos Defense & Security Solutions, Inc., 6.50% Sr. Sec. Nts., 11/30/251 | | | 400,000 | | | | 407,500 | |
| TransDigm, Inc.: | | | | | | | | |
| 6.375% Sr. Sub. Nts., 6/15/26 | | | 655,000 | | | | 611,606 | |
| 6.50% Sr. Sub. Nts., 7/15/24 | | | 535,000 | | | | 522,294 | |
| Triumph Group, Inc.: | | | | | | | | |
| 5.25% Sr. Unsec. Nts., 6/1/22 | | | 785,000 | | | | 686,875 | |
| 7.75% Sr. Unsec. Nts., 8/15/25 | | | 2,435,000 | | | | 2,154,975 | |
| | | | | | | 9,222,328 | |
| Airlines—0.2% | | | | | | | | |
| American Airlines Group, Inc., 4.625% Sr. Unsec. Nts., 3/1/201 | | | 645,000 | | | | 644,193 | |
| Controladora Mabe SA de CV, 5.60% Sr. Unsec. Nts., 10/23/281 | | | 830,000 | | | | 781,030 | |
| Gol Finance, Inc., 7.00% Sr. Unsec. Nts., 1/31/251 | | | 515,000 | | | | 458,994 | |
| | | | | | | | |
| | | Principal Amount | | | Value |
| Airlines (Continued) | | | | | | | | |
| United Continental Holdings, Inc., 4.25% Sr. Unsec. Nts., 10/1/22 | | $ | 800,000 | | | $ | 773,000 | |
| | | | | | | 2,657,217 | |
| Building Products—0.1% | | | | | | | | |
| JELD-WEN, Inc.: | | | | | | | | |
| 4.625% Sr. Unsec. Nts., 12/15/251 | | | 120,000 | | | | 105,300 | |
| 4.875% Sr. Unsec. Nts., 12/15/271 | | | 120,000 | | | | 101,700 | |
| Standard Industries, Inc., 5.375% Sr. Unsec. Nts., 11/15/241 | | | 915,000 | | | | 862,388 | |
| | | | | | | 1,069,388 | |
| Commercial Services & Supplies—0.6% | |
| ACCO Brands Corp., 5.25% Sr. Unsec. Nts., 12/15/241 | | | 815,000 | | | | 731,462 | |
| Affinion Group, Inc., 12.50% Sr. Unsec. Nts., 11/10/223,13 | | | 1,004,830 | | | | 764,927 | |
| ARD Finance SA, 7.125% Sr. Sec. Nts., 9/15/2313 | | | 775,000 | | | | 699,437 | |
| Brink’s Co. (The), 4.625% Sr. Unsec. Nts., 10/15/271 | | | 870,000 | | | | 796,250 | |
| Clean Harbors, Inc., 5.125% Sr. Unsec. Nts., 6/1/21 | | | 830,000 | | | | 830,000 | |
| Covanta Holding Corp.: | | | | | | | | |
| 5.875% Sr. Unsec. Nts., 3/1/24 | | | 850,000 | | | | 801,125 | |
| 5.875% Sr. Unsec. Nts., 7/1/25 | | | 310,000 | | | | 286,363 | |
| 6.00% Sr. Unsec. Nts., 1/1/27 | | | 570,000 | | | | 513,000 | |
| GFL Environmental, Inc., 5.625% Sr. Unsec. Nts., 5/1/221 | | | 720,000 | | | | 667,800 | |
| Hulk Finance Corp., 7.00% Sr. Unsec. Nts., 6/1/261 | | | 825,000 | | | | 721,875 | |
| RR Donnelley & Sons Co., 7.875% Sr. Unsec. Nts., 3/15/21 | | | 371,000 | | | | 372,855 | |
| TMS International Corp., 7.25% Sr. Unsec. Nts., 8/15/251 | | | 265,000 | | | | 248,438 | |
| Waste Pro USA, Inc., 5.50% Sr. Unsec. Nts., 2/15/261 | | | 125,000 | | | | 115,625 | |
| West Corp.: | | | | | | | | |
| 5.375% Sr. Unsec. Nts., 7/15/221 | | | 685,000 | | | | 653,319 | |
| 8.50% Sr. Unsec. Nts., 10/15/251 | | | 665,000 | | | | 528,675 | |
| | | | | | | 8,731,151 | |
| Construction & Engineering—0.1% | |
| AECOM, 5.125% Sr. Unsec. Nts., 3/15/27 | | | 535,000 | | | | 460,100 | |
| Fideicomiso PA Pacifico Tres, 8.25% Sr. Sec. Nts., 1/15/351 | | | 510,000 | | | | 535,500 | |
| New Enterprise Stone & Lime Co., Inc., 6.25% Sr. Sec. Nts., 3/15/261 | | | 275,000 | | | | 250,937 | |
| Tutor Perini Corp., 6.875% Sr. Unsec. Nts., 5/1/251 | | | 565,000 | | | | 526,863 | |
| | | | | | | 1,773,400 | |
| Electrical Equipment—0.2% | |
| Sensata Technologies BV, 5.625% Sr. Unsec. Nts., 11/1/241 | | | 1,090,000 | | | | 1,077,737 | |
| Vertiv Group Corp., 9.25% Sr. Unsec. Nts., 10/15/241 | | | 760,000 | | | | 703,000 | |
| Vertiv Intermediate Holding Corp., 12.00% Sr. Unsec. Nts., 2/15/221,13 | | | 570,000 | | | | 526,538 | |
| | | | | | | 2,307,275 | |
| Industrial Conglomerates—0.3% | |
| Citgo Holding, Inc., 10.75% Sr. Sec. Nts., 2/15/201 | | | 570,000 | | | | 582,825 | |
| General Electric Co., 5.00% [US0003M+333] Jr. Sub. Perpetual Bonds2,14 | | | 2,594,000 | | | | 1,987,652 | |
| Icahn Enterprises LP/Icahn Enterprises Finance Corp., 5.875% Sr. Unsec. Nts., 2/1/22 | | | 385,000 | | | | 378,744 | |
21 OPPENHEIMER GLOBAL STRATEGIC INCOME FUND/VA
CONSOLIDATED STATEMENT OF INVESTMENTSContinued
| | | | | | | | |
| | | Principal Amount | | | Value |
| |
| Industrial Conglomerates (Continued) | |
| Tupras Turkiye Petrol Rafinerileri AS, 4.50% Sr. Unsec. Nts., 10/18/241 | | $ | 460,000 | | | $ | 403,724 | |
| Wind Tre SpA, 5.00% Sr. Sec. Nts., 1/20/26 | | | 805,000 | | | | 667,152 | |
| | | | 4,020,097 | |
| | |
| |
| Machinery—0.4% | |
| Allison Transmission, Inc.: | |
| 4.75% Sr. Unsec. Nts., 10/1/271 | | | 265,000 | | | | 237,175 | |
| 5.00% Sr. Unsec. Nts., 10/1/241 | | | 500,000 | | | | 481,875 | |
| Amsted Industries, Inc., 5.00% Sr. Unsec. Nts., 3/15/221 | | | 1,120,000 | | | | 1,094,800 | |
| EnPro Industries, Inc., 5.75% Sr. Unsec. Nts., 10/15/261 | | | 285,000 | | | | 275,737 | |
| Icahn Enterprises LP/Icahn Enterprises Finance Corp., 6.75% Sr. Unsec. Nts., 2/1/24 | | | 570,000 | | | | 566,437 | |
| Meritor, Inc., 6.25% Sr. Unsec. Nts., 2/15/24 | | | 150,000 | | | | 144,000 | |
| Navistar International Corp., 6.625% Sr. Unsec. Nts., 11/1/251 | | | 915,000 | | | | 887,550 | |
| Stevens Holding Co., Inc., 6.125% Sr. Unsec. Nts., 10/1/261 | | | 570,000 | | | | 564,300 | |
| Terex Corp., 5.625% Sr. Unsec. Nts., 2/1/251 | | | 525,000 | | | | 489,563 | |
| Titan International, Inc., 6.50% Sr. Sec. Nts., 11/30/233 | | | 990,000 | | | | 891,000 | |
| Wabash National Corp., 5.50% Sr. Unsec. Nts., 10/1/251 | | | 270,000 | | | | 232,538 | |
| | | | 5,864,975 | |
| | |
| |
| Professional Services—0.1% | |
| Brand Industrial Services, Inc., 8.50% Sr. Unsec. Nts., 7/15/251 | | | 795,000 | | | | 681,712 | |
| IHS Markit Ltd., 4.00% Sr. Unsec. Nts., 3/1/261 | | | 270,000 | | | | 251,775 | |
| | | | 933,487 | |
| | |
| |
| Road & Rail—0.2% | |
| Algeco Global Finance plc, 8.00% Sr. Sec. Nts., 2/15/231 | | | 270,000 | | | | 253,125 | |
| Avis Budget Car Rental LLC/Avis Budget Finance, Inc., 5.25% Sr. Unsec. Nts., 3/15/251 | | | 520,000 | | | | 451,750 | |
| DAE Funding LLC, 4.00% Sr. Unsec. Nts., 8/1/201 | | | 265,000 | | | | 259,038 | |
| Hertz Corp. (The): | |
| 5.50% Sr. Unsec. Nts., 10/15/241 | | | 420,000 | | | | 308,700 | |
| 5.875% Sr. Unsec. Nts., 10/15/20 | | | 660,000 | | | | 642,675 | |
| 7.375% Sr. Unsec. Nts., 1/15/21 | | | 265,000 | | | | 258,706 | |
| 7.625% Sec. Nts., 6/1/221 | | | 570,000 | | | | 538,650 | |
| | | | 2,712,644 | |
| | |
| |
| Trading Companies & Distributors—0.5% | |
| American Builders & Contractors Supply Co., Inc., 5.75% Sr. Unsec. Nts., 12/15/231 | | | 340,000 | | | | 337,450 | |
| Fly Leasing Ltd., 5.25% Sr. Unsec. Nts., 10/15/24 | | | 530,000 | | | | 480,975 | |
| H&E Equipment Services, Inc., 5.625% Sr. Unsec. Nts., 9/1/25 | | | 800,000 | | | | 737,000 | |
| Herc Rentals, Inc., 7.50% Sec. Nts., 6/1/221 | | | 473,000 | | | | 496,650 | |
| ILFCE-Capital Trust I, 4.55% [30YR CMT+155] Jr. Sub. Nts., 12/21/651,2 | | | 1,355,000 | | | | 1,056,900 | |
| National Bank for Agriculture & Rural Development, 8.39% Sr. Unsec. Nts., 7/19/21 | | INR | 55,000,000 | | | | 795,257 | |
| Standard Industries, Inc., 6.00% Sr. Unsec. Nts., 10/15/251 | | | 740,000 | | | | 712,509 | |
| | | | | | | | |
| | | Principal Amount | | | Value |
| |
| Trading Companies & Distributors (Continued) | |
| United Rentals North America, Inc.: | |
| 4.625% Sr. Unsec. Nts., 10/15/25 | | $ | 265,000 | | | $ | 237,175 | |
| 4.875% Sr. Unsec. Nts., 1/15/28 | | | 690,000 | | | | 607,200 | |
| 5.875% Sr. Unsec. Nts., 9/15/26 | | | 1,235,000 | | | | 1,168,619 | |
| 6.50% Sr. Unsec. Nts., 12/15/26 | | | 570,000 | | | | 562,875 | |
| | | | 7,192,610 | |
| | |
| |
| Transportation Infrastructure—0.2% | |
| Aeropuerto Internacional de Tocumen SA, 6.00% Sr. Sec. Nts., 11/18/481 | | | 425,000 | | | | 423,385 | |
| DP World Ltd., 5.625% Sr. Unsec. Nts., 9/25/481 | | | 1,010,000 | | | | 953,440 | |
| GMR Hyderabad International Airport Ltd., 4.25% Sr. Sec. Nts., 10/27/271 | | | 965,000 | | | | 797,275 | |
| Jasa Marga Persero Tbk PT, 7.50% Sr. Unsec. Nts., 12/11/201 | | IDR | 9,160,000,000 | | | | 600,632 | |
| | | | 2,774,732 | |
| | |
| |
| Information Technology—1.5% | |
|
| Communications Equipment—0.2% | |
| CommScope Technologies LLC, 6.00% Sr. Unsec. Nts., 6/15/251 | | | 570,000 | | | | 521,550 | |
| HTA Group Ltd., 9.125% Sr. Unsec. Nts., 3/8/223 | | | 455,000 | | | | 463,872 | |
| Infor US, Inc., 6.50% Sr. Unsec. Nts., 5/15/22 | | | 920,000 | | | | 893,228 | |
| Plantronics, Inc., 5.50% Sr. Unsec. Nts., 5/31/231 | | | 435,000 | | | | 405,637 | |
| Riverbed Technology, Inc., 8.875% Sr. Unsec. Nts., 3/1/231 | | | 295,000 | | | | 219,038 | |
| ViaSat, Inc., 5.625% Sr. Unsec. Nts., 9/15/251 | | | 265,000 | | | | 245,125 | |
| | | | 2,748,450 | |
| | |
| |
| Electronic Equipment, Instruments, & Components—0.1% | |
| APX Group, Inc., 7.875% Sr. Sec. Nts., 12/1/22 | | | 275,000 | | | | 261,250 | |
| CDW LLC/CDW Finance Corp., 5.00% Sr. Unsec. Nts., 9/1/23 | | | 485,000 | | | | 478,937 | |
| TTM Technologies, Inc., 5.625% Sr. Unsec. Nts., 10/1/251 | | | 800,000 | | | | 746,000 | |
| | | | 1,486,187 | |
| | |
| |
| Internet Software & Services—0.1% | |
| | |
| Rackspace Hosting, Inc., 8.625% Sr. Unsec. Nts., 11/15/241 | | | 1,395,000 | | | | 1,091,588 | |
| |
| IT Services—0.5% | |
| Alliance Data Systems Corp., 5.375% Sr. Unsec. Nts., 8/1/221 | | | 275,000 | | | | 269,156 | |
| Booz Allen Hamilton, Inc., 5.125% Sr. Unsec. Nts., 5/1/251 | | | 280,000 | | | | 267,400 | |
| Everi Payments, Inc., 7.50% Sr. Unsec. Nts., 12/15/251 | | | 1,075,000 | | | | 1,019,906 | |
| Exela Intermediate LLC/Exela Finance, Inc., 10.00% Sr. Sec. Nts., 7/15/231 | | | 770,000 | | | | 738,237 | |
| First Data Corp.: | |
| 5.00% Sr. Sec. Nts., 1/15/241 | | | 455,000 | | | | 439,644 | |
| 5.75% Sec. Nts., 1/15/241 | | | 910,000 | | | | 892,109 | |
| Gartner, Inc., 5.125% Sr. Unsec. Nts., 4/1/251 | | | 780,000 | | | | 760,648 | |
| GTT Communications, Inc., 7.875% Sr. Unsec. Nts., 12/31/241 | | | 140,000 | | | | 121,800 | |
| Harland Clarke Holdings Corp., 6.875% Sr. Sec. Nts., 3/1/201 | | | 835,000 | | | | 816,213 | |
| Sabre GLBL, Inc., 5.25% Sr. Sec. Nts., 11/15/231 | | | 825,000 | | | | 818,813 | |
| VeriSign, Inc., 4.75% Sr. Unsec. Nts., 7/15/27 | | | 590,000 | | | | 555,515 | |
| | | | 6,699,441 | |
22 OPPENHEIMER GLOBAL STRATEGIC INCOME FUND/VA
| | | | | | | | |
| | | Principal Amount | | | Value | |
| |
| Semiconductors & Semiconductor Equipment—0.1% | |
| NXP BV/NXP Funding LLC, 4.625% Sr. Unsec. Nts., 6/1/231 | | $ | 1,350,000 | | | $ | 1,326,375 | |
| Qorvo, Inc., 5.50% Sr. Unsec. Nts., 7/15/261 | | | 555,000 | | | | 531,413 | |
| Versum Materials, Inc., 5.50% Sr. Unsec. Nts., 9/30/241 | | | 250,000 | | | | 248,125 | |
| | | | 2,105,913 | |
| | |
| |
| Software—0.3% | |
| Dell International LLC/EMC Corp.: | |
| 5.875% Sr. Unsec. Nts., 6/15/211 | | | 215,000 | | | | 215,298 | |
| 7.125% Sr. Unsec. Nts., 6/15/241 | | | 745,000 | | | | 758,611 | |
| Informatica LLC, 7.125% Sr. Unsec. Nts., 7/15/231 | | | 595,000 | | | | 582,440 | |
| j2 Cloud Services LLC/j2 Global Co.- Obligor, Inc., 6.00% Sr. Unsec. Nts., 7/15/251 | | | 790,000 | | | | 775,187 | |
| Symantec Corp., 5.00% Sr. Unsec. Nts., 4/15/251 | | | 495,000 | | | | 463,103 | |
| TIBCO Software, Inc., 11.375% Sr. Unsec. Nts., 12/1/211 | | | 625,000 | | | | 656,250 | |
| Uber Technologies, Inc.: | |
| 7.50% Sr. Unsec. Nts., 11/1/231 | | | 285,000 | | | | 276,450 | |
| 8.00% Sr. Unsec. Nts., 11/1/261 | | | 285,000 | | | | 275,737 | |
| Veritas US, Inc./Veritas Bermuda Ltd., 7.50% Sr. Sec. Nts., 2/1/231 | | | 1,125,000 | | | | 922,500 | |
| | | | 4,925,576 | |
| | |
| |
| Technology Hardware, Storage & Peripherals—0.2% | |
| Banff Merger Sub, Inc., 9.75% Sr. Unsec. Nts., 9/1/261 | | | 850,000 | | | | 779,875 | |
| Harland Clarke Holdings Corp., 8.375% Sr. Sec. Nts., 8/15/221 | | | 920,000 | | | | 842,950 | |
| NCR Corp., 6.375% Sr. Unsec. Nts., 12/15/23 | | | 520,000 | | | | 505,289 | |
| | | | 2,128,114 | |
| | |
| |
| Materials—3.3% | |
|
| Chemicals—1.1% | |
| Ashland LLC: | |
| 4.75% Sr. Unsec. Nts., 8/15/22 | | | 285,000 | | | | 281,794 | |
| 6.875% Sr. Unsec. Nts., 5/15/43 | | | 295,000 | | | | 292,050 | |
| Avantor, Inc.: | |
| 6.00% Sr. Sec. Nts., 10/1/241 | | | 415,000 | | | | 408,775 | |
| 9.00% Sr. Unsec. Nts., 10/1/251 | | | 835,000 | | | | 837,087 | |
| Blue Cube Spinco LLC, 9.75% Sr. Unsec. Nts., 10/15/23 | | | 285,000 | | | | 314,212 | |
| Celanese US Holdings LLC, 5.875% Sr. Unsec. Nts., 6/15/21 | | | 1,285,000 | | | | 1,351,499 | |
| CF Industries, Inc.: | |
| 3.40% Sr. Sec. Nts., 12/1/211 | | | 1,460,000 | | | | 1,432,472 | |
| 5.15% Sr. Unsec. Nts., 3/15/34 | | | 335,000 | | | | 283,075 | |
| Chemours Co. (The), 6.625% Sr. Unsec. Nts., 5/15/23 | | | 233,000 | | | | 236,204 | |
| Consolidated Energy Finance SA, 6.50% Sr. Unsec. Nts., 5/15/261 | | | 275,000 | | | | 264,688 | |
| CVR Partners LP/CVR Nitrogen Finance Corp., 9.25% Sec. Nts., 6/15/231 | | | 185,000 | | | | 193,094 | |
| Hexion, Inc.: | |
| 6.625% Sr. Sec. Nts., 4/15/20 | | | 1,850,000 | | | | 1,480,000 | |
| 10.375% Sr. Sec. Nts., 2/1/221 | | | 240,000 | | | | 192,600 | |
| Huntsman International LLC, 4.875% Sr. Unsec. Nts., 11/15/20 | | | 285,000 | | | | 287,138 | |
| Koppers, Inc., 6.00% Sr. Unsec. Nts., 2/15/251 | | | 510,000 | | | | 451,350 | |
| Kraton Polymers LLC/Kraton Polymers Capital Corp., 7.00% Sr. Unsec. Nts., 4/15/251 | | | 260,000 | | | | 240,500 | |
| LSB Industries, Inc., 9.625% Sr. Sec. Nts., 5/1/231 | | | 135,000 | | | | 137,700 | |
| | | | | | | | |
| | | Principal Amount | | | Value | |
| Chemicals (Continued) | |
| NOVA Chemicals Corp.: | | | | | | | | |
| 4.875% Sr. Unsec. Nts., 6/1/241 | | $ | 260,000 | | | $ | 235,625 | |
| 5.25% Sr. Unsec. Nts., 8/1/231 | | | 340,000 | | | | 322,575 | |
| Olin Corp.: | | | | | | | | |
| 5.00% Sr. Unsec. Nts., 2/1/30 | | | 240,000 | | | | 211,200 | |
| 5.125% Sr. Unsec. Nts., 9/15/27 | | | 300,000 | | | | 277,500 | |
| Petkim Petrokimya Holding AS, 5.875% Sr. Unsec. Nts., 1/26/231 | | | 800,000 | | | | 731,118 | |
| Platform Specialty Products Corp.: | |
| 5.875% Sr. Unsec. Nts., 12/1/251 | | | 305,000 | | | | 286,700 | |
| 6.50% Sr. Unsec. Nts., 2/1/221 | | | 195,000 | | | | 195,731 | |
| PQ Corp.: | | | | | | | | |
| 5.75% Sr. Unsec. Nts., 12/15/251 | | | 270,000 | | | | 251,100 | |
| 6.75% Sr. Sec. Nts., 11/15/221 | | | 285,000 | | | | 294,975 | |
| Rain CII Carbon LLC/CII Carbon Corp., 7.25% Sec. Nts., 4/1/251 | | | 980,000 | | | | 891,800 | |
| Starfruit Finco BV/Starfruit US Holdco LLC: | |
| 6.50% Sr. Unsec. Nts., 10/1/261 | | EUR | 1,455,000 | | | | 1,547,124 | |
| 8.00% Sr. Unsec. Nts., 10/1/261 | | | 430,000 | | | | 398,825 | |
| Tronox Finance plc, 5.75% Sr. Unsec. Nts., 10/1/251 | | | 535,000 | | | | 435,356 | |
| Venator Finance Sarl/Venator Materials LLC, 5.75% Sr. Unsec. Nts., 7/15/251 | | | 790,000 | | | | 635,950 | |
| | | | | | | 15,399,817 | |
| | |
| |
| Construction Materials—0.2% | |
| CIMPOR Financial Operations BV, 5.75% Sr. Unsec. Nts., 7/17/241 | | | 2,040,000 | | | | 1,700,850 | |
| James Hardie International Finance DAC, 4.75% Sr. Unsec. Nts., 1/15/251 | | | 130,000 | | | | 118,788 | |
| Summit Materials LLC/Summit Materials Finance Corp., 5.125% Sr. Unsec. Nts., 6/1/251 | | | 260,000 | | | | 237,250 | |
| US Concrete, Inc., 6.375% Sr. Unsec. Nts., 6/1/24 | | | 715,000 | | | | 661,375 | |
| | | | | | | 2,718,263 | |
| | | | | | | | | |
| |
| Containers & Packaging—0.7% | |
| ARD Securities Finance Sarl, 8.75% Sr. Sec. Nts., 1/31/231,13 | | | 852,240 | | | | 724,404 | |
| Ball Corp., 4.375% Sr. Unsec. Nts., 12/15/20 | | | 1,460,000 | | | | 1,469,125 | |
| BWAY Holding Co., 7.25% Sr. Unsec. Nts., 4/15/251 | | | 555,000 | | | | 500,194 | |
| Crown Americas LLC/Crown Americas Capital Corp. IV, 4.50% Sr. Unsec. Nts., 1/15/23 | | | 605,000 | | | | 592,144 | |
| Crown Americas LLC/Crown Americas Capital Corp. VI, 4.75% Sr. Unsec. Nts., 2/1/261 | | | 270,000 | | | | 256,837 | |
| Flex Acquisition Co., Inc., 7.875% Sr. Unsec. Nts., 7/15/261 | | | 555,000 | | | | 500,887 | |
| Graphic Packaging International LLC, 4.75% Sr. Unsec. Nts., 4/15/21 | | | 770,000 | | | | 770,962 | |
| Intertape Polymer Group, Inc., 7.00% Sr. Unsec. Nts., 10/15/261 | | | 570,000 | | | | 564,300 | |
| Klabin Finance SA, 4.875% Sr. Unsec. Nts., 9/19/271 | | | 350,000 | | | | 318,500 | |
| OI European Group BV, 4.00% Sr. Unsec. Nts., 3/15/231 | | | 535,000 | | | | 501,563 | |
| Owens-Brockway Glass Container, Inc., 5.00% Sr. Unsec. Nts., 1/15/221 | | | 500,000 | | | | 496,875 | |
| Plastipak Holdings, Inc., 6.25% Sr. Unsec. Nts., 10/15/251 | | | 800,000 | | | | 712,000 | |
| Reynolds Group Issuer, Inc./Reynolds Group Issuer LLC/Reynolds Group Issuer Luxembourg SA: | | | | | | | | |
| 5.125% Sr. Sec. Nts., 7/15/231 | | | 745,000 | | | | 710,544 | |
| 7.00% Sr. Unsec. Nts., 7/15/241 | | | 995,000 | | | | 949,603 | |
23 OPPENHEIMER GLOBAL STRATEGIC INCOME FUND/VA
CONSOLIDATED STATEMENT OF INVESTMENTSContinued
| | | | | | | | |
| | | Principal Amount | | | Value | |
| |
| Containers & Packaging (Continued) | |
| Sealed Air Corp.: | | | | | | | | |
| 4.875% Sr. Unsec. Nts., 12/1/221 | | $ | 585,000 | | | $ | 581,344 | |
| 6.875% Sr. Unsec. Nts., 7/15/331 | | | 270,000 | | | | 270,675 | |
| | | | | | | 9,919,957 | |
| | | | | | | | |
| |
| Metals & Mining—1.2% | |
| AK Steel Corp.: | | | | | | | | |
| 6.375% Sr. Unsec. Nts., 10/15/25 | | | 1,000,000 | | | | 775,000 | |
| 7.00% Sr. Unsec. Nts., 3/15/27 | | | 405,000 | | | | 317,925 | |
| Alcoa Nederland Holding BV: | | | | | | | | |
| 6.125% Sr. Unsec. Nts., 5/15/281 | | | 510,000 | | | | 489,600 | |
| 6.75% Sr. Unsec. Nts., 9/30/241 | | | 245,000 | | | | 249,900 | |
| 7.00% Sr. Unsec. Nts., 9/30/261 | | | 240,000 | | | | 246,000 | |
| Aleris International, Inc., 10.75% Sec. | | | | | | | | |
| Nts., 7/15/231 | | | 280,000 | | | | 286,804 | |
| Allegheny Technologies, Inc., 7.875% Sr. Unsec. Nts., 8/15/23 | | | 530,000 | | | | 542,587 | |
| ArcelorMittal: | | | | | | | | |
| 6.75% Sr. Unsec. Nts., 3/1/41 | | | 295,000 | | | | 311,303 | |
| 7.00% Sr. Unsec. Nts., 10/15/39 | | | 145,000 | | | | 153,213 | |
| Coeur Mining, Inc., 5.875% Sr. Unsec. Nts., 6/1/24 | | | 785,000 | | | | 693,744 | |
| Constellium NV, 6.625% Sr. Unsec. Nts., 3/1/251 | | | 510,000 | | | | 474,300 | |
| Eldorado Gold Corp., 6.125% Sr. Unsec. Nts., 12/15/201 | | | 590,000 | | | | 538,375 | |
| Ferroglobe plc/Globe Specialty Metals, Inc., 9.375% Sr. Unsec. Nts., 3/1/221 | | | 750,000 | | | | 618,750 | |
| First Quantum Minerals Ltd.: | | | | | | | | |
| 6.50% Sr. Unsec. Nts., 3/1/241 | | | 275,000 | | | | 229,281 | |
| 6.875% Sr. Unsec. Nts., 3/1/261 | | | 275,000 | | | | 221,719 | |
| 7.00% Sr. Unsec. Nts., 2/15/211 | | | 285,000 | | | | 274,134 | |
| 7.25% Sr. Unsec. Nts., 4/1/231 | | | 780,000 | | | | 689,325 | |
| Freeport-McMoRan, Inc.: | | | | | | | | |
| 3.10% Sr. Unsec. Nts., 3/15/20 | | | 340,000 | | | | 333,200 | |
| 4.00% Sr. Unsec. Nts., 11/14/21 | | | 1,460,000 | | | | 1,425,325 | |
| 4.55% Sr. Unsec. Nts., 11/14/24 | | | 530,000 | | | | 490,913 | |
| 5.40% Sr. Unsec. Nts., 11/14/34 | | | 310,000 | | | | 245,675 | |
| 5.45% Sr. Unsec. Nts., 3/15/43 | | | 350,000 | | | | 268,187 | |
| Hudbay Minerals, Inc., 7.625% Sr. Unsec. Nts., 1/15/251 | | | 850,000 | | | | 835,125 | |
| Indonesia Asahan Aluminium Persero PT: | | | | | | | | |
| 6.53% Sr. Unsec. Nts., 11/15/281 | | | 310,000 | | | | 325,927 | |
| 6.757% Sr. Unsec. Nts., 11/15/481 | | | 250,000 | | | | 256,883 | |
| JSW Steel Ltd., 4.75% Sr. Unsec. Nts., 11/12/199 | | | 950,000 | | | | 948,219 | |
| Kinross Gold Corp., 4.50% Sr. Unsec. Nts., 7/15/27 | | | 450,000 | | | | 389,813 | |
| Metinvest BV, 7.75% Sr. Unsec. Nts., 4/23/231 | | | 465,000 | | | | 424,756 | |
| Mountain Province Diamonds, Inc., 8.00% Sec. Nts., 12/15/221 | | | 335,000 | | | | 337,261 | |
| Northwest Acquisitions ULC/Dominion Finco, Inc., 7.125% Sec. Nts., 11/1/221 | | | 715,000 | | | | 708,586 | |
| Southern Copper Corp., 7.50% Sr. Unsec. Nts., 7/27/35 | | | 900,000 | | | | 1,055,250 | |
| SunCoke Energy Partners LP/SunCoke Energy Partners Finance Corp., 7.50% Sr. Unsec. Nts., 6/15/251 | | | 330,000 | | | | 313,500 | |
| Teck Resources Ltd., 5.20% Sr. Unsec. Nts., 3/1/42 | | | 685,000 | | | | 578,825 | |
| United States Steel Corp.: | | | | | | | | |
| 6.25% Sr. Unsec. Nts., 3/15/26 | | | 140,000 | | | | 123,025 | |
| 6.875% Sr. Unsec. Nts., 8/15/25 | | | 845,000 | | | | 777,400 | |
| Zekelman Industries, Inc., 9.875% Sr. Sec. Nts., 6/15/231 | | | 275,000 | | | | 290,813 | |
| | | | | | | 17,240,643 | |
| | | | | | | | |
| | | Principal Amount | | | Value | |
| |
| Paper & Forest Products—0.1% | |
| Clearwater Paper Corp., 5.375% Sr. Unsec. Nts., 2/1/251 | | $ | 245,000 | | | $ | 222,337 | |
| Louisiana-Pacific Corp., 4.875% Sr. Unsec. Nts., 9/15/24 | | | 255,000 | | | | 246,712 | |
| Mercer International, Inc.: | | | | | | | | |
| 5.50% Sr. Unsec. Nts., 1/15/26 | | | 250,000 | | | | 225,000 | |
6.50% Sr. Unsec. Nts., 2/1/24 | | | 165,000 | | | | 162,113 | |
| Suzano Austria GmbH, 7.00% Sr. Unsec. Nts., 3/16/471 | | | 845,000 | | | | 869,083 | |
| | | | | | | 1,725,245 | |
| | | | | | | | |
| |
| Telecommunication Services—2.6% | |
|
| Diversified Telecommunication Services—1.3% | |
| Axtel SAB de CV, 6.375% Sr. Unsec. Nts., 11/14/241 | | | 965,000 | | | | 918,912 | |
| CenturyLink, Inc.: | | | | | | | | |
| 5.625% Sr. Unsec. Nts., 4/1/25 | | | 785,000 | | | | 692,762 | |
| 6.15% Sr. Unsec. Nts., Series Q, 9/15/19 | | | 340,000 | | | | 345,195 | |
| 6.45% Sr. Unsec. Nts., Series S, 6/15/21 | | | 615,000 | | | | 615,769 | |
| 7.50% Sr. Unsec. Nts., Series Y, 4/1/24 | | | 940,000 | | | | 909,450 | |
| Cincinnati Bell, Inc., 8.00% Sr. Unsec. Nts., 10/15/251 | | | 265,000 | | | | 219,950 | |
| Eldorado Resorts, Inc., 6.00% Sr. Unsec. Nts., 9/15/261 | | | 425,000 | | | | 402,687 | |
| Frontier Communications Corp.: | | | | | | | | |
| 8.50% Sec. Nts., 4/1/261 | | | 1,100,000 | | | | 965,250 | |
| 8.75% Sr. Unsec. Nts., 4/15/22 | | | 590,000 | | | | 376,125 | |
10.50% Sr. Unsec. Nts., 9/15/22 | | | 1,315,000 | | | | 920,500 | |
| GCI LLC, 6.75% Sr. Unsec. Nts., 6/1/21 | | | 140,000 | | | | 140,669 | |
| Intelsat Connect Finance SA, 9.50% Sr. Unsec. Nts., 2/15/231 | | | 420,000 | | | | 363,300 | |
| Intelsat Jackson Holdings SA: | | | | | | | | |
| 5.50% Sr. Unsec. Nts., 8/1/23 | | | 255,000 | | | | 223,125 | |
| 8.00% Sr. Sec. Nts., 2/15/241 | | | 615,000 | | | | 634,987 | |
| 8.50% Sr. Unsec. Nts., 10/15/241 | | | 565,000 | | | | 550,875 | |
9.75% Sr. Unsec. Nts., 7/15/251 | | | 790,000 | | | | 796,162 | |
| Intelsat Luxembourg SA, 7.75% Sr. Unsec. Nts., 6/1/21 | | | 565,000 | | | | 516,975 | |
| Level 3 Financing, Inc., 5.25% Sr. Unsec. Nts., 3/15/26 | | | 1,195,000 | | | | 1,096,412 | |
| Oi SA, 10.00% Sr. Unsec. Nts., 7/27/2513 | | | 2,500,000 | | | | 2,484,400 | |
| Qwest Capital Funding, Inc., 7.75% Sr. Unsec. Nts., 2/15/31 | | | 260,000 | | | | 213,200 | |
| Qwest Corp., 6.875% Sr. Unsec. Nts., 9/15/33 | | | 785,000 | | | | 703,720 | |
| T-Mobile USA, Inc.: | | | | | | | | |
| 4.00% Sr. Unsec. Nts., 4/15/22 | | | 780,000 | | | | 762,450 | |
| 4.50% Sr. Unsec. Nts., 2/1/26 | | | 245,000 | | | | 225,706 | |
| 4.75% Sr. Unsec. Nts., 2/1/28 | | | 250,000 | | | | 227,188 | |
| 5.125% Sr. Unsec. Nts., 4/15/25 | | | 780,000 | | | | 760,500 | |
| 5.375% Sr. Unsec. Nts., 4/15/27 | | | 390,000 | | | | 377,813 | |
6.00% Sr. Unsec. Nts., 4/15/24 | | | 710,000 | | | | 711,775 | |
| Windstream Services LLC / Windstream Finance Corp., 9.00% Sec. Nts., 6/30/25 | | | 298,000 | | | | 203,385 | |
| Windstream Services LLC/Windstream Finance Corp., 8.625% Sr. Sec. Nts., 10/31/25 | | | 772,000 | | | | 690,940 | |
| Zayo Group LLC/Zayo Capital, Inc.: | | | | | | | | |
| 5.75% Sr. Unsec. Nts., 1/15/271 | | | 265,000 | | | | 237,175 | |
| 6.00% Sr. Unsec. Nts., 4/1/23 | | | 895,000 | | | | 851,369 | |
| | | | | | | 19,138,726 | |
| | | | | | | | |
| |
| Wireless Telecommunication Services—1.3% | |
| C&W Senior Financing DAC, 6.875% Sr. Unsec. Nts., 9/15/271 | | | 550,000 | | | | 510,262 | |
| Empresa Nacional del Petroleo, 5.25% Sr. Unsec. Nts., 11/6/291 | | | 835,000 | | | | 850,985 | |
| Fortress Transportation & Infrastructure Investors LLC, 6.50% Sr. Unsec. Nts., 10/1/251 | | | 850,000 | | | | 796,875 | |
24 OPPENHEIMER GLOBAL STRATEGIC INCOME FUND/VA
| | | | | | | | |
| | | Principal Amount | | | Value | |
| |
| Wireless Telecommunication Services (Continued) | |
| Gogo Intermediate Holdings LLC/Gogo | |
| Finance Co., Inc., 12.50% Sr. Sec. Nts., 7/1/221 | | $ | 140,000 | | | $ | 150,231 | |
| GTH Finance BV, 7.25% Sr. Unsec. Nts., 4/26/231 | | | 940,000 | | | | 965,742 | |
| Springleaf Finance Corp.: | | | | | | | | |
| 5.625% Sr. Unsec. Nts., 3/15/23 | | | 805,000 | | | | 744,625 | |
| 6.125% Sr. Unsec. Nts., 5/15/22 | | | 785,000 | | | | 765,147 | |
| 6.875% Sr. Unsec. Nts., 3/15/25 | | | 560,000 | | | | 502,600 | |
| 7.125% Sr. Unsec. Nts., 3/15/26 | | | 850,000 | | | | 760,219 | |
| 8.25% Sr. Unsec. Nts., 12/15/20 | | | 490,000 | | | | 508,375 | |
| Sprint Capital Corp., 6.875% Sr. Unsec. Nts., 11/15/28 | | | 1,192,158 | | | | 1,129,570 | |
| Sprint Communications, Inc.: | | | | | | | | |
| 6.00% Sr. Unsec. Nts., 11/15/22 | | | 1,979,000 | | | | 1,947,000 | |
| 7.00% Sr. Unsec. Nts., 3/1/201 | | | 850,000 | | | | 873,375 | |
| Sprint Corp.: | | | | | | | | |
| 7.125% Sr. Unsec. Nts., 6/15/24 | | | 2,505,000 | | | | 2,488,868 | |
| 7.625% Sr. Unsec. Nts., 3/1/26 | | | 830,000 | | | | 821,700 | |
| 7.875% Sr. Unsec. Nts., 9/15/23 | | | 2,075,000 | | | | 2,134,656 | |
| Telefonica Europe BV, 5.875% | | | | | | | | |
| [EUSA10+430.1] Jr. Sub. Perpetual Bonds2,9,14 | | EUR | 1,410,000 | | | | 1,724,251 | |
| Trilogy International Partners LLC/Trilogy International Finance, Inc., 8.875% Sr. Sec. Nts., 5/1/221 | | | 685,000 | | | | 664,450 | |
| | | | | | | 18,338,931 | |
| | | | | | | | |
| |
| Utilities—1.5% | |
| |
| Electric Utilities—0.4% | |
| Capex SA, 6.875% Sr. Unsec. Nts., 5/15/241 | | | 450,000 | | | | 375,750 | |
| Eskom Holdings SOC Ltd.: | | | | | | | | |
| 5.75% Sr. Unsec. Nts., 1/26/211 | | | 995,000 | | | | 940,488 | |
| 6.75% Sr. Unsec. Nts., 8/6/231 | | | 2,335,000 | | | | 2,136,128 | |
| Inkia Energy Ltd., 5.875% Sr. Unsec. Nts., 11/9/271 | | | 865,000 | | | | 804,459 | |
| Light Servicos de Eletricidade SA/Light Energia SA, 7.25% Sr. Unsec. Nts., 5/3/231 | | | 965,000 | | | | 925,203 | |
| NextEra Energy Capital Holdings, Inc., 4.80% [US0003M+240.9] Jr. Sub. Nts., 12/1/772 | | | 665,000 | | | | 562,553 | |
| NextEra Energy Operating Partners LP, 4.50% Sr. Unsec. Nts., 9/15/271 | | | 125,000 | | | | 111,719 | |
| PPL Capital Funding, Inc., 5.468% [US0003M+266.5] Jr. Sub. Nts., 3/30/672 | | | 352,000 | | | | 306,240 | |
| | | | | | | 6,162,540 | |
| | | | | | | | |
| |
| Gas Utilities—0.2% | |
| | | |
| AmeriGas Partners LP/AmeriGas Finance Corp., 5.50% Sr. Unsec. Nts., 5/20/25 | | | 550,000 | | | | 506,000 | |
| | | |
| Ferrellgas Partners LP/Ferrellgas Partners Finance Corp., 8.625% Sr. Unsec. Nts., 6/15/20 | | | 85,000 | | | | 61,094 | |
| | | |
| Naturgy Finance BV, 4.125% | | | | | | | | |
| [EUSA8+335.3] Jr. Sub. Perpetual Bonds2,9,14 | | EUR | 1,410,000 | | | | 1,655,040 | |
| Suburban Propane Partners LP/Suburban Energy Finance Corp., 5.875% Sr. Unsec. Nts., 3/1/27 | | | 645,000 | | | | 574,050 | |
| Superior Plus LP/Superior General Partner, Inc., 7.00% Sr. Unsec. Nts., 7/15/261 | | | 275,000 | | | | 266,750 | |
| | | | | | | 3,062,934 | |
| | | | | | | | |
| | | Principal Amount | | | Value | |
| |
| Independent Power and Renewable Electricity Producers—0.4% | |
| AES Andres BV/Dominican Power Partners/Empresa Generadora de Electricidad Itabo SA, 7.95% Sr. Unsec. Nts., 5/11/261 | | $ | 490,000 | | | $ | 497,350 | |
| AES Corp.: | | | | | | | | |
| 4.00% Sr. Unsec. Nts., 3/15/21 | | | 275,000 | | | | 270,875 | |
| 6.00% Sr. Unsec. Nts., 5/15/26 | | | 540,000 | | | | 550,800 | |
| Calpine Corp.: | | | | | | | | |
| 5.25% Sr. Sec. Nts., 6/1/261 | | | 1,090,000 | | | | 998,713 | |
| 5.75% Sr. Unsec. Nts., 1/15/25 | | | 855,000 | | | | 784,463 | |
| 5.875% Sr. Sec. Nts., 1/15/241 | | | 275,000 | | | | 270,187 | |
| Clearway Energy Operating LLC, 5.75% Sr. Unsec. Nts., 10/15/251 | | | 285,000 | | | | 273,244 | |
| Drax Finco plc, 6.625% Sr. Sec. Nts., 11/1/251 | | | 275,000 | | | | 270,875 | |
| NRG Energy, Inc.: | | | | | | | | |
| 6.625% Sr. Unsec. Nts., 1/15/27 | | | 665,000 | | | | 672,481 | |
| 7.25% Sr. Unsec. Nts., 5/15/26 | | | 620,000 | | | | 647,900 | |
| Talen Energy Supply LLC, 4.60% Sr. Unsec. Nts., 12/15/21 | | | 8,000 | | | | 7,240 | |
| Vistra Operations Co. LLC, 5.50% Sr. Unsec. Nts., 9/1/261 | | | 280,000 | | | | 270,550 | |
| | | | | | | 5,514,678 | |
| | | | | | | | |
| |
| Multi-Utilities—0.5% | |
| AssuredPartners, Inc., 7.00% Sr. Unsec. Nts., 8/15/251 | | | 330,000 | | | | 299,072 | |
| Crestwood Midstream Partners LP/ Crestwood Midstream Finance Corp., 6.25% Sr. Unsec. Nts., 4/1/23 | | | 265,000 | | | | 256,388 | |
| Eskom Holdings SOC Ltd., 6.35% Sr. Unsec. Nts., 8/10/281 | | | 5,750,000 | | | | 5,554,132 | |
| NGPL PipeCo LLC: | | | | | | | | |
| 4.875% Sr. Unsec. Nts., 8/15/271 | | | 395,000 | | | | 373,769 | |
| 7.768% Sr. Unsec. Nts., 12/15/371 | | | 210,000 | | | | 240,450 | |
| Rockpoint Gas Storage Canada Ltd., 7.00% Sr. Sec. Nts., 3/31/231 | | | 365,000 | | | | 344,925 | |
| WEC Energy Group, Inc., 4.729% [US0003M+211.25] Jr. Sub. Nts., 5/15/672 | | | 22,000 | | | | 18,060 | |
| | | | | | | 7,086,796 | |
| Total Corporate Bonds and Notes (Cost $644,171,464) | | | | 590,766,449 | |
| | | | | | | | |
| | | Shares | | | | | |
| Preferred Stocks—1.3% | |
| American Homes 4 Rent, 6.35% Cum., Non- Vtg. | | | 4,200 | | | | 93,030 | |
| Citigroup Capital XIII, 7.75% Cum.,Non-Vtg. [US0003M+637]2 | | | 61,700 | | | | 1,630,731 | |
| Digital Realty Trust, Inc., 6.625% Cum., Series C,Non-Vtg. | | | 3,900 | | | | 103,272 | |
| Digital Realty Trust, Inc., 7.375% Cum.,Non-Vtg. | | | 25,600 | | | | 645,376 | |
| DTE Energy Co., 5.375% Jr. Sub.,Non-Vtg. | | | 25,000 | | | | 569,250 | |
| eBay, Inc., 6.00% Cv. | | | 25,700 | | | | 654,836 | |
| Fifth Third Bancorp, 6.625%Non-Cum., Non- Vtg. [US0003M+371]2 | | | 21,900 | | | | 566,553 | |
| GMAC Capital Trust I, 7.20% Jr. Sub.,Non-Vtg. [US0003M+578.5]2 | | | 61,325 | | | | 1,554,589 | |
| Goldman Sachs Group, Inc. (The), 6.30% Non- Cum., Series N,Non-Vtg. | | | 49,575 | | | | 1,257,222 | |
| Huntington Bancshares, Inc., 6.25% Non- Cum.,Non-Vtg. | | | 24,925 | | | | 618,638 | |
| KeyCorp, 6.125%Non-Cum.,Non-Vtg. [US0003M+389.2]2 | | | 53,125 | | | | 1,371,687 | |
| Morgan Stanley, 5.85%Non-Cum.,Non-Vtg. [US0003M+349.1]2 | | | 35,475 | | | | 861,333 | |
| Morgan Stanley, 6.375%Non-Cum.,Non-Vtg. [US0003M+370.8]2 | | | 49,650 | | | | 1,252,669 | |
25 OPPENHEIMER GLOBAL STRATEGIC INCOME FUND/VA
CONSOLIDATED STATEMENT OF INVESTMENTSContinued
| | | | | | | | |
| | | Shares | | | Value | |
| Preferred Stocks (Continued) | | | | | | | | |
| NiSource, Inc., 6.50%,Non-Vtg. [H15T5Y+363.2]2,17 | | | 23,493 | | | $ | 588,265 | |
| Northern Trust Corp., 5.85%Non-Cum.,Non-Vtg. | | | 13,150 | | | | 326,251 | |
| PNC Financial Services Group, Inc. (The), 6.125%Non-Cum.,Non-Vtg. [US0003M+406.7]2 | | | 49,500 | | | | 1,274,130 | |
| Prudential Financial, Inc., 5.75% Jr. Sub. | | | 5,200 | | | | 123,448 | |
| Public Storage, 5.20% Cum., Series X, Non- Vtg. | | | 25,450 | | | | 561,173 | |
| Qwest Corp., 7.00% Sr. Unsec. | | | 17,350 | | | | 358,972 | |
| Senior Housing Properties Trust, 5.625% Sr. Unsec. | | | 13,925 | | | | 281,146 | |
| Senior Housing Properties Trust, 6.25% Sr. Unsec.,Non-Vtg. | | | 6,375 | | | | 144,713 | |
| Synovus Financial Corp., 6.30%Non-Cum., Series D,Non-Vtg. [US0003M+335.2]2 | | | 24,374 | | | | 585,951 | |
| US Bancorp, 6.50%Non-Cum.,Non-Vtg. [US0003M+446.8]2 | | | 57,900 | | | | 1,533,192 | |
| Ventas Realty LP/Ventas Capital Corp., 5.45% Sr. Unsec. | | | 26,825 | | | | 649,165 | |
| Wells Fargo & Co., 6.625%Non-Cum Non- Vtg. [US0003M+369]2 | | | 26,450 | | | | 695,106 | |
| Total Preferred Stocks (Cost $19,595,246) | | | | 18,300,698 | |
| | |
| | | | | | | | |
| Common Stocks—0.1% | | | | | | | | |
| Advanz Pharma Corp.17 | | | 2,103 | | | | 40,167 | |
| Alcoa Corp.17 | | | 11,035 | | | | 293,310 | |
| Arco Capital Corp. Ltd.1,11,12,17 | | | 690,638 | | | | — | |
| Avaya Holdings Corp.17 | | | 11,857 | | | | 172,638 | |
| Bausch Health Cos, Inc.17 | | | 4,376 | | | | 80,825 | |
| Carrizo Oil & Gas, Inc.17 | | | 17,605 | | | | 198,761 | |
| CyrusOne, Inc. | | | 3,571 | | | | 188,835 | |
| First Data Corp., Cl. A17 | | | 10,218 | | | | 172,786 | |
| Herc Holdings, Inc.17 | | | 6,075 | | | | 157,889 | |
| JSC Astana Finance, GDR1,11,17 | | | 446,838 | | | | — | |
| Kinross Gold Corp.17 | | | 52,267 | | | | 169,345 | |
| Newfield Exploration Co.17 | | | 7,806 | | | | 114,436 | |
| Premier Holdings Ltd.11,17 | | | 18,514 | | | | — | |
| Quicksilver Resources, Inc.11,17 | | | 4,151,000 | | | | — | |
| Sabine Oil11,17 | | | 837 | | | | 38,084 | |
| Targa Resources Corp. | | | 2,631 | | | | 94,769 | |
| United Rentals, Inc.17 | | | 1,791 | | | | 183,631 | |
| United States Steel Corp. | | | 14,256 | | | | 260,029 | |
| Total Common Stocks (Cost $7,793,201) | | | | 2,165,505 | |
| | | | | | | | |
| | | Units | | | Value | |
| Rights, Warrants and Certificates—0.0% | | | | | |
| Affinion Group Wts., Strike Price $1, Exp. 11/10/2211,17 | | | 8,816 | | | $ | 74,848 | |
| Sabine Oil Tranche 1 Wts., Strike Price $4.49, | | | | | |
| Exp. 8/11/2611,17 | | | 2,612 | | | | 11,101 | |
| Sabine Oil Tranche 2 Wts., Strike Price $2.72, | | | | | |
| Exp. 8/11/2611,17 | | | 549 | | | | 1,715 | |
| Total Rights, Warrants and Certificates (Cost $420,786) | | | | 87,664 | |
| | | | | | | | |
| | | Principal Amount | | | | |
| Structured Securities—0.5% | | | | | | | | |
| Deutsche Bank AG, Coriolanus Ltd. Sec. Credit Linked Bonds: | | | | | |
| 3.003% Sr. Sec. Nts., 4/30/251,8 | | | 881,750 | | | | 783,396 | |
| 3.054% Sr. Sec. Nts., 4/30/251,8 | | | 1,123,486 | | | | 998,167 | |
| 3.098% Sr. Sec. Nts., 4/30/251,8 | | | 969,950 | | | | 861,758 | |
| 3.131% Sr. Sec. Nts., 4/30/251,8 | | | 867,013 | | | | 770,302 | |
| 3.179% Sr. Sec. Nts., 4/30/251,8 | | | 1,079,501 | | | | 959,089 | |
| 3.231% Sr. Sec. Nts., 4/30/251,8 | | | 1,232,087 | | | | 1,094,654 | |
| 3.265% Sr. Sec. Nts., 4/30/251,8 | | | 984,293 | | | | 874,501 | |
| 3.346% Sr. Sec. Nts., 4/30/251,8 | | | 925,194 | | | | 821,994 | |
| Morgan Stanley, Russian Federation Total Return Linked Bonds, Series 007, Cl. VR, 5.00%, 8/22/3411 | | RUB | 25,388,281 | | | | 74,171 | |
| Total Structured Securities (Cost $7,668,140) | | | | 7,238,032 | |
| Short-Term Notes—1.3% | | | | | | | | |
| Arab Republic of Egypt Treasury Bills: | | | | | | | | |
| 16.013%, 3/5/198 | | EGP | 50,000,000 | | | | 2,714,779 | |
| 18.432%, 2/5/198 | | EGP | 87,000,000 | | | | 4,800,374 | |
| Argentine Republic Treasury Bills: | | | | | | | | |
| 0.00%, 3/29/198 | | ARS | 8,200,000 | | | | 242,669 | |
| 0.00%, 1/31/198 | | ARS | 371,000,000 | | | | 11,302,398 | |
| Total Short-Term Notes (Cost $18,900,130) | | | | 19,060,220 | |
| | | Shares | | | | | |
| Investment Companies—21.4% | | | | | | | | |
| Eaton Vance Floating-Rate Income Trust | | | 117,200 | | | | 1,483,751 | |
| Oppenheimer Institutional Government Money Market Fund, Cl. E, 2.35%18,19 | | | 70,746,424 | | | | 70,746,424 | |
| Oppenheimer Limited-Term Bond Fund, Cl. I19 | | | 1,654,825 | | | | 7,363,973 | |
| Oppenheimer Master Event-Linked Bond Fund, LLC19 | | | 1,954,233 | | | | 29,797,284 | |
| Oppenheimer Master Loan Fund, LLC19 | | | 8,607,367 | | | | 144,969,978 | |
| Oppenheimer Ultra-Short Duration Fund, Cl. Y19 | | | 10,238,165 | | | | 51,088,443 | |
| Total Investment Companies (Cost $320,011,537) | | | | 305,449,853 | |
| | | | | | | | | | | | | | | | | | | | | | | | | | | | | | |
| Counterparty | | | | | | Exercise Price | | | Expiration
Date | | | | | | | | Contracts | | | Notional
Amount
(000’s) | | Value | |
| Over-the-Counter Options Purchased—0.5% | | | | |
| AUD Currency Call17 | | BOA | | | | USD | | | 0.748 | | | | 3/1/19 | | | | | | | AUD | | | 25,500,000 | | | AUD 200,000 | | | 26,339 | |
| BRL Currency Call17 | | JPM | | | | BRL | | | 3.200 | | | | 4/25/19 | | | | | | | BRL | | | 48,000,000 | | | BRL 482,560 | | | 12,192 | |
| BRL Currency Put17 | | GSCO-OT | | | | BRL | | | 3.350 | | | | 12/6/19 | | | | | | | BRL | | | 586,000 | | | BRL 5,000 | | | 104,813 | |
| BRL Currency Call17 | | GSCO-OT | | | | BRL | | | 3.734 | | | | 2/14/19 | | | | | | | BRL | | | 54,550,000 | | | BRL 373,400 | | | 78,338 | |
| BRL Currency Call17 | | JPM | | | | BRL | | | 3.200 | | | | 10/17/19 | | | | | | | BRL | | | 1,414,000 | | | BRL 32,000 | | | 53,425 | |
| BRL Currency Call17 | | JPM | | | | BRL | | | 3.354 | | | | 9/25/19 | | | | | | | BRL | | | 600,000 | | | BRL 5,150 | | | 83,164 | |
| BRL Currency Call17 | | GSCO-OT | | | | BRL | | | 3.400 | | | | 12/10/19 | | | | | | | BRL | | | 586,000 | | | BRL 5,300 | | | 132,811 | |
| BRL Currency Call17 | | JPM | | | | BRL | | | 3.150 | | | | 5/20/19 | | | | | | | BRL | | | 424,096 | | | BRL 5,000 | | | 8,449 | |
| BRL Currency Call17 | | CITNA-B | | | | BRL | | | 3.200 | | | | 4/25/19 | | | | | | | BRL | | | 48,000,000 | | | BRL 512,000 | | | 12,192 | |
| BRL Currency Call17 | | JPM | | | | BRL | | | 3.000 | | | | 5/16/19 | | | | | | | BRL | | | 550,000 | | | BRL 5,000 | | | 4,148 | |
| BRL Currency Call17 | | GSCO-OT | | | | BRL | | | 3.150 | | | | 5/20/19 | | | | | | | BRL | | | 424,096 | | | BRL 5,000 | | | 8,449 | |
| CAD Currency Call17 | | SCB | | | | CAD | | | 1.295 | | | | 2/1/19 | | | | | | | CAD | | | 56,980,000 | | | CAD 194,250 | | | 7,806 | |
| CAD Currency Call17 | | SCB | | | | CAD | | | 1.298 | | | | 1/18/19 | | | | | | | CAD | | | 9,170,000 | | | CAD 129,750 | | | 871 | |
| CLP Currency Call17 | | GSCO-OT | | | | CLP | | | 665.000 | | | | 2/11/19 | | | | | | | CLP | | | 10,714,000,000 | | | CLP 133,000,000 | | | 42,535 | |
| CLP Currency Call17 | | CITNA-B | | | | CLP | | | 643.700 | | | | 11/4/19 | | | | | | | CLP | | | 18,914,000,000 | | | CLP 64,370,000 | | | 416,108 | |
| CLP Currency Call17 | | CITNA-B | | | | CLP | | | 650.000 | | | | 2/21/19 | | | | | | | CLP | | | 11,336,500,000 | | | CLP 97,500,000 | | | 22,673 | |
| EUR Currency Put17 | | BOA | | | | SEK | | | 9.250 | | | | 4/29/20 | | | | | | | EUR | | | 2,800,000 | | | EUR 10,000 | | | 670,628 | |
| EUR Currency Put17 | | JPM | | | | JPY | | | 126.400 | | | | 1/25/19 | | | | | | | EUR | | | 21,000,000 | | | EUR 200,000 | | | 297,028 | |
26 OPPENHEIMER GLOBAL STRATEGIC INCOME FUND/VA
| | | | | | | | | | | | | | | | | | | | | | | | | | | | | | | | |
| | | | | | | | | | | | | | | | | | | | | Notional | | | |
| | | | | | | | | | | | Expiration | | | | | | | | | Amount | | | |
| | | Counterparty | | | | | | Exercise Price | | | Date | | | | | | Contracts | | | (000’s) | | | Value |
| Over-the-Counter Options Purchased (Continued) | | | | | | | | | |
| IDR Currency Call17 | | | SCB | | | | IDR | | | | 15050.000 | | | | 9/5/19 | | | | IDR | | | | 361,682,350,000 | | | | IDR 2,558,500,000 | | | $ | 723,365 | |
| INR Currency Call17 | | | GSCO-OT | | | | INR | | | | 74.050 | | | | 1/23/19 | | | | INR | | | | 555,375,000 | | | | INR 7,405,000 | | | | 467,070 | |
| INR Currency Call17 | | | GSCO-OT | | | | INR | | | | 68.400 | | | | 10/21/19 | | | | INR | | | | 565,000 | | | | INR 5,000 | | | | 385,807 | |
| MXN Currency Call17 | | | CITNA-B | | | | MXN | | | | 18.578 | | | | 8/15/19 | | | | MXN | | | | 139,332,500 | | | | MXN 1,393,328 | | | | 75,936 | |
| MXN Currency Call17,20 | | | CITNA-B | | | | MXN | | | | 18.000 | | | | 10/23/19 | | | | MXN | | | | 750,000 | | | | MXN 5,500 | | | | 91,413 | |
| MXN Currency Call17 | | | GSCO-OT | | | | MXN | | | | 19.500 | | | | 10/29/19 | | | | MXN | | | | 382,000,000 | | | | MXN 3,900,000 | | | | 479,028 | |
| NOK Currency Call17 | | | BOA | | | | NOK | | | | 8.424 | | | | 3/8/19 | | | | NOK | | | | 483,011,000 | | | | NOK 3,664,223 | | | | 384,849 | |
| NOK Currency Call17 | | | JPM | | | | NOK | | | | 8.240 | | | | 2/4/19 | | | | NOK | | | | 296,410,000 | | | | NOK 2,529,680 | | | | 27,270 | |
| PLN Currency Call17 | | | GSCO-OT | | | | PLN | | | | 3.489 | | | | 8/19/19 | | | | PLN | | | | 98,630,000 | | | | PLN 872,125 | | | | 233,358 | |
| RUB Currency Call17 | | | JPM | | | | RUB | | | | 59.500 | | | | 6/7/19 | | | | RUB | | | | 1,682,200,000 | | | | RUB 14,875,000 | | | | 42,055 | |
| RUB Currency Call17 | | | GSCO-OT | | | | RUB | | | | 63.979 | | | | 8/12/19 | | | | RUB | | | | 452,220,000 | | | | RUB 6,397,900 | | | | 37,534 | |
| SEK Currency Call17 | | | GSCO-OT | | | | SEK | | | | 8.882 | | | | 2/4/19 | | | | SEK | | | | 351,243,000 | | | | SEK 2,398,140 | | | | 560,935 | |
| TRY Currency Put17 | | | CITNA-B | | | | TRY | | | | 4.000 | | | | 5/23/19 | | | | TRY | | | | 710,000 | | | | TRY 10,000 | | | | 6,869 | |
| TRY Currency Call17 | | | GSCO-OT | | | | TRY | | | | 6.000 | | | | 10/16/19 | | | | TRY | | | | 90,000,000 | | | | TRY 600,000 | | | | 969,930 | |
| ZAR Currency Call17 | | | GSCO-OT | | | | ZAR | | | | 13.597 | | | | 8/15/19 | | | | ZAR | | | | 11,972,500 | | | | ZAR 1,019,738 | | | | 17,707 | |
| ZAR Currency Call17 | | | GSCO-OT | | | | ZAR | | | | 13.250 | | | | 8/12/19 | | | | ZAR | | | | 93,654,000 | | | | ZAR 1,325,000 | | | | 95,714 | |
| TotalOver-the-Counter Options Purchased (Cost $8,567,928) | | | | | | | | | | | | 6,580,809 | |
| | | | | | | | |
| | | | | | Pay / Receive | | | | | | | | | Expiration | | | | | | | | | |
| | | Counterparty | | | Floating Rate | | | Floating Rate | | | Fixed Rate | | | Date | | | Notional Amount (000’s) | | | |
| Over-the-Counter Interest Rate Swaptions Purchased—0.4% | | | | | | | | | | | | | |
| Interest Rate Floor maturing 11/8/22 Call17 | | | JPM | | | | Receive | | |
| MAX[(( 0.656%-1y))
* 10 * notional, 0]
EUR EURIBOR |
| | | 0.656% | | | | 11/8/22 | | | | EU | R | | | 36,600 | | | | 2,020,402 | |
| Interest Rate Swap maturing 12/16/49 Put17 | | | MSCO | | | | Receive | | |
| Three-Month
USD-LIBOR-BBA |
| | | 3.762 | | | | 12/12/19 | | | | US | D | | | 29,240 | | | | 184,192 | |
| Interest Rate Swap maturing 3/16/21 Put17 | | | GSCO-OT | | | | Receive | | |
| Three-Month
USD-LIBOR-BBA |
| | | 2.975 | | | | 3/12/19 | | | | US | D | | | 146,200 | | | | 39,475 | |
| Interest Rate Swap maturing 8/19/20 Put17 | | | GSCOI | | | | Receive | | |
| Three-Month
USD-LIBOR-BBA |
| | | 3.350 | | | | 5/14/19 | | | | US | D | | | 146,500 | | | | 7,023 | |
| | | | | | | | | | | If USISDA02 is less | | | | | | | | | | | | | | | | | | | | | |
| | | | | | | | | | | than or equal to | | | | | | | | | | | | | | | | | | | | | |
| | | | | | | | | | | 2.905%, then the | | | | | | | | | | | | | | | | | | | | | |
| | | | | | | | | | | greater of: (INDEX | | | | | | | | | | | | | | | | | | | | | |
| Interest Rate Cap maturing 12/12/19 Put17 | | | GSCOI | | | | Pay | | |
| minus 0.095%) * 10
Or Zero, Otherwise
zero |
| | | 9.500 | | | | 12/12/19 | | | | US | D | | | 29,240 | | | | 597,081 | |
| Interest Rate Cap maturing 5/14/20 Put17 | | | GSCOI | | | | Pay | | |
| The greater of: 10 x
(INDEX minus 0.6%)
or Zero |
| | | 60.000 | | | | 5/14/20 | | | | US | D | | | 29,300 | | | | 233,521 | |
| Interest Rate Swap maturing 12/16/49 Call17 | | | MSCO | | | | Pay | | |
| Three-Month
USD-LIBOR-BBA |
| | | 2.262 | | | | 12/12/19 | | | | US | D | | | 29,240 | | | | 441,885 | |
| Interest Rate Swap maturing 5/13/21 Call17 | | | BAC | | | | Pay | | |
| Three-Month
USD-LIBOR-BBA |
| | | 3.045 | | | | 5/9/19 | | | | US | D | | | 228,755 | | | | 2,031,193 | |
| TotalOver-the-Counter Interest Rate Swaptions Purchased (Cost $3,845,090) | | | | | | | | | | | | | | | | 5,554,772 | |
| Total Investments, at Value (Cost $1,676,752,697) | | | | | | | | | | | | | | | | | | | | 110.7% | | | | 1,581,139,881 | |
| Net Other Assets (Liabilities) | | | | | | | | | | | | | | | | | | | | | | | | (10.7) | | | | (152,600,349 | ) |
| | | | | | | | | | | | | | | | | | | | | | | | | | | | |
Net Assets | | | | | | | | | | | | | | | | | | | | | | | | | | | 100.0% | | | $ | 1,428,539,532 | |
| | | | | | | | | | | | | | | | | | | | | | | | | | | | |
Consolidated Footnotes to Statement of Investments
1. Represents securities sold under Rule 144A, which are exempt from registration under the Securities Act of 1933, as amended. These securities have been determined to be liquid under guidelines established by the Board of Trustees. These securities amount to $389,215,362 or 27.25% of the Fund’s net assets at period end.
2. Represents the current interest rate for a variable or increasing rate security, determined as [Referenced Rate + Basis-point spread].
3. Restricted security. The aggregate value of restricted securities at period end was $13,247,534, which represents 0.93% of the Fund’s net assets. See Note 4 of the accompanying Consolidated Notes. Information concerning restricted securities is as follows:
| | | | | | | | | | | | | | | | |
| | | | | | | | | | | | Unrealized | |
| | | Acquisition | | | | | | | | | Appreciation/ | |
| Security | | Dates | | | Cost | | | Value | | | (Depreciation) | |
| Affinion Group, Inc., 12.50% Sr. Unsec. Nts., 11/10/22 | | | 1/15/13-11/10/18 | | | $ | 899,049 | | | $ | 764,927 | | | $ | (134,122 | ) |
| CHS/Community Health Systems, Inc., 8.125% Sec. Nts., 6/30/24 | | | 6/22/18 | | | | 49,861 | | | | 44,100 | | | | (5,761 | ) |
| Clear Channel International BV, 8.75% Sr. Unsec. Nts., 12/15/20 | | | 8/9/17 | | | | 269,522 | | | | 268,312 | | | | (1,210 | ) |
| Eagle Intermediate Global Holding BV/Ruyi US Finance LLC, 7.50% Sr. Sec. Nts., 5/1/25 | | | 9/27/18 | | | | 280,163 | | | | 267,686 | | | | (12,477 | ) |
| EP Energy LLC/Everest Acquisition Finance, Inc., 9.375% Sec. Nts., 5/1/24 | | | 1/29/13-10/23/18 | | | | 2,697,661 | | | | 1,368,900 | | | | (1,328,761 | ) |
27 OPPENHEIMER GLOBAL STRATEGIC INCOME FUND/VA
CONSOLIDATED STATEMENT OF INVESTMENTSContinued
Consolidated Footnotes to Statement of Investments (Continued)
| | | | | | | | | | | | | | | | |
| | | | | | | | | | | | Unrealized | |
| | | Acquisition | | | | | | | | | Appreciation/ | |
| Security | | Dates | | | Cost | | | Value | | | (Depreciation) | |
| GLS Auto Receivables Trust, Series2018-1A, Cl. A, 2.82%, 7/15/22 | | | 1/30/18 | | | $ | 642,210 | | | $ | 640,082 | | | $ | (2,128 | ) |
| Golden Nugget, Inc., 6.75% Sr. Unsec. Nts., 10/15/24 | | | 9/20/16-9/12/17 | | | | 1,366,832 | | | | 1,294,650 | | | | (72,182 | ) |
| Hartford Financial Services Group, Inc. (The), 4.741% [US0003M+212.5] Jr. Sub. Nts., 2/12/47 | | | 1/18/18-1/22/18 | | | | 670,914 | | | | 552,922 | | | | (117,992 | ) |
| HTA Group Ltd., 9.125% Sr. Unsec. Nts., 3/8/22 | | | 3/1/17-3/7/18 | | | | 458,796 | | | | 463,872 | | | | 5,076 | |
| Minejesa Capital BV, 4.625% Sr. Sec. Nts., 8/10/30 | | | 11/9/17-5/11/18 | | | | 2,605,058 | | | | 2,380,923 | | | | (224,135 | ) |
| Minejesa Capital BV, 5.625% Sr. Sec. Nts., 8/10/37 | | | 7/25/18-8/1/18 | | | | 4,094,181 | | | | 3,771,160 | | | | (323,021 | ) |
| Titan International, Inc., 6.50% Sr. Sec. Nts., 11/30/23 | | | 11/9/17 | | | | 990,000 | | | | 891,000 | | | | (99,000 | ) |
| Williams Scotsman International, Inc., 6.875% Sr. Sec. Nts., 8/15/23 | | | 7/31/18 | | | | 560,000 | | | | 539,000 | | | | (21,000 | ) |
| | | | | | | | |
| | | | | | $ | 15,584,247 | | | $ | 13,247,534 | | | $ | (2,336,713 | ) |
| | | | | | | | |
4. Interest-Only Strips represent the right to receive the monthly interest payments on an underlying pool of mortgage loans. These securities typically decline in price as interest rates decline. Most other fixed income securities increase in price when interest rates decline. The principal amount of the underlying pool represents the notional amount on which current interest is calculated. The price of these securities is typically more sensitive to changes in prepayment rates than traditional mortgage-backed securities (for example, GNMA pass-throughs). Interest rates disclosed represent current yields based upon the current cost basis and estimated timing and amount of future cash flows. These securities amount to $3,099,741 or 0.22% of the Fund’s net assets at period end.
5. Interest rate is less than 0.0005%.
6. All or a portion of the security position is when-issued or delayed delivery to be delivered and settled after period end. See Note 4 of the accompanying Consolidated Notes.
7. This interest rate resets periodically. Interest rate shown reflects the rate in effect at period end. The rate on this variable rate security is not based on a published reference rate and spread but is determined by the issuer or agent based on current market conditions.
8. Zero coupon bond reflects effective yield on the original acquisition date.
9. Represents securities sold under Regulation S, which are exempt from registration under the Securities Act of 1933, as amended. These securities may not be offered or sold in the United States without an exemption from, or in a transaction not subject to, the registration requirements of the Securities Act of 1933. These securities amount to $134,430,151 or 9.41% of the Fund’s net assets at period end.
10. This security is not accruing income because the issuer has missed an interest payment on it and/or is not anticipated to make future interest and or principal payments. The rate shown is the contractual interest rate. See Note 4 of the accompanying Consolidated Notes.
11. The value of this security was determined using significant unobservable inputs. See Note 3 of the accompanying Consolidated Notes.
12. Security received as the result of issuer reorganization.
13. Interest or dividend ispaid-in-kind, when applicable.
14. This bond has no contractual maturity date, is not redeemable and contractually pays an indefinite stream of interest.
15. All or a portion of this security is owned by the subsidiary. See Note 2 of the accompanying Consolidated Notes.
16. Denotes an inflation-indexed security: coupon or principal are indexed to a consumer price index.
17.Non-income producing security.
18. Rate shown is the7-day yield at period end.
19. Is or was an affiliate, as defined in the Investment Company Act of 1940, as amended, at or during the reporting period, by virtue of the Fund owning at least 5% of the voting securities of the issuer or as a result of the Fund and the issuer having the same investment adviser. Transactions during the reporting period in which the issuer was an affiliate are as follows:
| | | | | | | | | | | | | | |
| | | Shares | | Gross | | Gross | | Shares |
| | | December 31, 2017 | | Additions | | Reductions | | December 31, 2018 |
| Investment Company | | | | | | | | | | | | | | |
| Oppenheimer Institutional Government Money Market Fund, Cl. E | | | 41,765,253 | | | | 698,423,057 | | | | 669,441,886 | | | 70,746,424 |
| Oppenheimer Limited-Term Bond Fund, Cl. I | | | — | | | | 1,654,825 | | | | — | | | 1,654,825 |
| Oppenheimer Master Event-Linked Bond Fund, LLC | | | 2,520,983 | | | | — | | | | 566,750 | | | 1,954,233 |
| Oppenheimer Master Loan Fund, LLC | | | 14,397,097 | | | | — | | | | 5,789,730 | | | 8,607,367 |
| Oppenheimer Ultra-Short Duration Fund, Cl. Y | | | 27,024,582 | | | | 253,583 | | | | 17,040,000 | | | 10,238,165 |
| | | | |
| | | Value | | Income | | Realized
Gain (Loss) | | Change in Unrealized
Gain (Loss) |
| Investment Company | | | | | | | | | | | | | | |
| Oppenheimer Institutional Government Money Market Fund, Cl. E | | $ | 70,746,424 | | | $ | 1,619,058 | | | $ | — | | | $ — |
| Oppenheimer Limited-Term Bond Fund, Cl. I | | | 7,363,973 | | | | 21,470 | | | | — | | | 16,503 |
| Oppenheimer Master Event-Linked Bond Fund, LLC | | | 29,797,284 | | | | 2,399,000 | a | | | (723,081 | )a | | (1,408,559)a |
| Oppenheimer Master Loan Fund, LLC | | | 144,969,978 | | | | 12,440,975 | b | | | 3,277,211 | b | | (11,799,913)b |
| Oppenheimer Ultra-Short Duration Fund, Cl. Y | | | 51,088,443 | | | | 1,274,377 | | | | (170,400 | ) | | (201,633) |
| | | |
| Total | | $ | 303,966,102 | | | $ | 17,754,880 | | | $ | 2,383,730 | | | $ (13,393,602) |
| | | |
a. Represents the amount allocated to the Fund from Oppenheimer Master Event-Linked Bond Fund, LLC.
b.Represents the amount allocated to the Fund from Oppenheimer Master Loan Fund, LLC.
20.Knock-out option becomes ineligible for exercise if at any time spot rates are less than or equal to 18 MXN per 1 USD.
Distribution of investments representing geographic holdings, as a percentage of total investments at value, is as follows:
| | | | | | | | |
| Geographic Holdings (Unaudited) | | Value | | | Percent | |
| United States | | $ | 1,014,127,291 | | | | 63.8% | |
| India | | | 44,538,584 | | | | 2.8 | |
| Indonesia | | | 41,756,255 | | | | 2.6 | |
| Mexico | | | 37,315,255 | | | | 2.4 | |
| South Africa | | | 37,172,443 | | | | 2.4 | |
| Brazil | | | 32,597,157 | | | | 2.2 | |
| Greece | | | 31,485,222 | | | | 2.0 | |
28 OPPENHEIMER GLOBAL STRATEGIC INCOME FUND/VA
| | | | | | | | |
| Geographic Holdings (Unaudited) (Continued) | | Value | | Percent |
| Argentina | | $ | 30,871,517 | | | | 2.0 | % |
| Spain | | | 24,969,763 | | | | 1.6 | |
| United Kingdom | | | 21,309,379 | | | | 1.3 | |
| Canada | | | 19,547,384 | | | | 1.2 | |
| France | | | 18,585,398 | | | | 1.2 | |
| Italy | | | 16,877,735 | | | | 1.1 | |
| Egypt | | | 15,133,403 | | | | 1.0 | |
| Switzerland | | | 14,689,560 | | | | 0.9 | |
| Peru | | | 13,431,906 | | | | 0.9 | |
| Colombia | | | 12,793,054 | | | | 0.8 | |
| Turkey | | | 12,678,717 | | | | 0.8 | |
| Ukraine | | | 11,585,398 | | | | 0.7 | |
| Netherlands | | | 10,528,112 | | | | 0.7 | |
| Dominican Republic | | | 9,704,088 | | | | 0.7 | |
| Chile | | | 8,414,487 | | | | 0.6 | |
| Thailand | | | 8,315,837 | | | | 0.5 | |
| China | | | 6,914,373 | | | | 0.4 | |
| Luxembourg | | | 6,878,613 | | | | 0.4 | |
| Poland | | | 6,680,768 | | | | 0.4 | |
| Kazakhstan | | | 5,716,865 | | | | 0.4 | |
| Nigeria | | | 4,946,356 | | | | 0.3 | |
| Angola | | | 4,830,754 | | | | 0.3 | |
| Israel | | | 4,031,655 | | | | 0.3 | |
| Sri Lanka | | | 3,931,699 | | | | 0.3 | |
| Ghana | | | 3,436,237 | | | | 0.2 | |
| Belgium | | | 3,399,381 | | | | 0.2 | |
| Ireland | | | 3,367,461 | | | | 0.2 | |
| Ecuador | | | 2,999,622 | | | | 0.2 | |
| Eurozone | | | 2,988,058 | | | | 0.2 | |
| Oman | | | 2,636,811 | | | | 0.2 | |
| United Arab Emirates | | | 2,520,815 | | | | 0.2 | |
| Gabon | | | 2,171,868 | | | | 0.1 | |
| Hungary | | | 2,107,622 | | | | 0.1 | |
| Mongolia | | | 1,991,811 | | | | 0.1 | |
| Supranational | | | 1,955,249 | | | | 0.1 | |
| Bermuda | | | 1,779,099 | | | | 0.1 | |
| Cayman Islands | | | 1,708,750 | | | | 0.1 | |
| Portugal | | | 1,700,749 | | | | 0.1 | |
| New Zealand | | | 1,660,147 | | | | 0.1 | |
| Iraq | | | 1,317,049 | | | | 0.1 | |
| Australia | | | 1,215,358 | | | | 0.1 | |
| Hong Kong | | | 1,132,537 | | | | 0.1 | |
| Azerbaijan | | | 1,099,736 | | | | 0.1 | |
| Russia | | | 1,097,934 | | | | 0.1 | |
| Senegal | | | 1,092,493 | | | | 0.1 | |
| Morocco | | | 922,299 | | | | 0.1 | |
| Singapore | | | 815,185 | | | | 0.1 | |
| Sweden | | | 560,935 | | | | 0.0 | |
| Mauritius | | | 463,873 | | | | 0.0 | |
| Zambia | | | 451,000 | | | | 0.0 | |
| Kenya | | | 436,058 | | | | 0.0 | |
| Panama | | | 423,385 | | | | 0.0 | |
| Uruguay | | | 414,250 | | | | 0.0 | |
| Norway | | | 412,118 | | | | 0.0 | |
| Trinidad and Tobago | | | 264,688 | | | | 0.0 | |
| Macau | | | 238,275 | | | | 0.0 | |
| | | | |
| Total | | $ | 1,581,139,881 | | | | 100.0 | % |
| | | | |
| | | | | | | | | | | | | | | | | | | | | | | | |
Forward Currency Exchange Contracts as of December 31, 2018 | |
| Counterparty | | Settlement Month(s) | | | Currency Purchased (000’s) | | | | Currency Sold (000’s) | | | Unrealized
Appreciation | | | Unrealized
Depreciation | |
| BAC | | | 02/2019 | | | IDR | | 260,657,000 | | USD | | | | | 18,139 | | | $ | — | | | $ | 112,952 | |
| BAC | | | 03/2019 | | | KRW | | 2,937,600 | | USD | | | | | 2,622 | | | | 22,969 | | | | — | |
| BAC | | | 03/2019 | | | MYR | | 760 | | USD | | | | | 182 | | | | 2,408 | | | | — | |
| BAC | | | 02/2019 | | | USD | | 25,470 | | EUR | | | | | 22,200 | | | | — | | | | 57,342 | |
| BAC | | | 01/2019 | | | USD | | 11,840 | | MXN | | | | | 238,700 | | | | — | | | | 287,294 | |
| BAC | | | 02/2019 | | | USD | | 13,803 | | NOK | | | | | 119,852 | | | | — | | | | 80,703 | |
| BAC | | | 03/2019 | | | USD | | 6,411 | | PLN | | | | | 24,160 | | | | — | | | | 56,538 | |
| BAC | | | 03/2019 | | | USD | | 29,316 | | ZAR | | | | | 419,790 | | | | 405,175 | | | | — | |
29 OPPENHEIMER GLOBAL STRATEGIC INCOME FUND/VA
CONSOLIDATED STATEMENT OF INVESTMENTSContinued
| | | | | | | | | | | | | | | | | | | | | | | | | | |
Forward Currency Exchange Contracts (Continued) | | | | | | | | | |
| Counterparty | | Settlement Month(s) | | | Currency Purchased (000’s) | | | | Currency Sold (000’s) | | | Unrealized
Appreciation | | | Unrealized Depreciation |
| BAC | | | 03/2019 | | | ZAR | | 114,990 | | USD | | | | | | | 8,030 | | | $ | — | | | $ | 110,987 | |
| BOA | | | 02/2019 | | | EUR | | 75 | | USD | | | | | | | 86 | | | | — | | | | 179 | |
| BOA | | | 03/2019 | | | INR | | 276,100 | | USD | | | | | | | 3,773 | | | | 164,048 | | | | — | |
| BOA | | | 02/2019 | | | JPY | | 1,847,000 | | USD | | | | | | | 16,492 | | | | 416,938 | | | | — | |
| BOA | | | 02/2019 | | | USD | | 32,270 | | EUR | | | | | | | 27,981 | | | | 99,459 | | | | — | |
| BOA | | | 03/2019 | | | USD | | 1,918 | | HUF | | | | | | | 542,000 | | | | — | | | | 26,446 | |
| BOA | | | 03/2019 | | | USD | | 17,732 | | IDR | | | | | | | 262,024,000 | | | | — | | | | 277,797 | |
| BOA | | | 03/2019 | | | USD | | 40,712 | | INR | | | | | | | 2,979,300 | | | | — | | | | 1,770,185 | |
| BOA | | | 02/2019 | | | USD | | 28,077 | | NOK | | | | | | | 239,533 | | | | 328,997 | | | | — | |
| BOA | | | 03/2019 | | | USD | | 8,255 | | THB | | | | | | | 269,400 | | | | — | | | | 36,201 | |
| CITNA-B | | | 02/2019 - 06/2019 | | | BRL | | 86,853 | | USD | | | | | | | 22,525 | | | | 767,362 | | | | 1,088,441 | |
| CITNA-B | | | 03/2019 | | | COP | | 23,809,000 | | USD | | | | | | | 7,301 | | | | 3,615 | | | | — | |
| CITNA-B | | | 02/2019 | | | EUR | | 910 | | USD | | | | | | | 1,075 | | | | — | | | | 28,226 | |
| CITNA-B | | | 03/2019 | | | RUB | | 251,100 | | USD | | | | | | | 3,573 | | | | — | | | | 5,423 | |
| CITNA-B | | | 04/2019 | | | USD | | 2,716 | | BRL | | | | | | | 9,750 | | | | 222,658 | | | | — | |
| CITNA-B | | | 03/2019 | | | USD | | 9,204 | | COP | | | | | | | 29,419,000 | | | | 178,291 | | | | — | |
| CITNA-B | | | 02/2019 | | | USD | | 884 | | EUR | | | | | | | 775 | | | | — | | | | 6,747 | |
| CITNA-B | | | 02/2019 - 03/2019 | | | USD | | 27,202 | | JPY | | | | | | | 3,019,800 | | | | 17,165 | | | | 501,376 | |
| CITNA-B | | | 01/2019 | | | USD | | 18,009 | | MXN | | | | | | | 365,500 | | | | — | | | | 560,588 | |
| CITNA-B | | | 03/2019 | | | USD | | 6,238 | | PEN | | | | | | | 21,070 | | | | — | | | | 92 | |
| CITNA-B | | | 10/2019 | | | USD | | 3,466 | | TRY | | | | | | | 22,230 | | | | — | | | | 185,520 | |
| DEU | | | 02/2019 | | | EUR | | 2,150 | | USD | | | | | | | 2,473 | | | | 1,547 | | | | 2,530 | |
| DEU | | | 02/2019 | | | USD | | 38,489 | | EUR | | | | | | | 33,435 | | | | 110,049 | | | | 70,161 | |
| GSCO-OT | | | 01/2019 - 06/2019 | | | BRL | | 68,496 | | USD | | | | | | | 18,146 | | | | — | | | | 631,673 | |
| GSCO-OT | | | 01/2019 | | | COP | | 24,240,000 | | USD | | | | | | | 7,551 | | | | — | | | | 92,424 | |
| GSCO-OT | | | 02/2019 | | | EUR | | 310 | | USD | | | | | | | 357 | | | | — | | | | 526 | |
| GSCO-OT | | | 02/2019 - 03/2019 | | | JPY | | 1,457,982 | | USD | | | | | | | 14,029 | | | | 28,078 | | | | 669,555 | |
| GSCO-OT | | | 02/2019 | | | NOK | | 448,183 | | USD | | | | | | | 52,102 | | | | — | | | | 183,183 | |
| GSCO-OT | | | 02/2019 | | | SEK | | 160,580 | | USD | | | | | | | 17,869 | | | | 301,822 | | | | — | |
| GSCO-OT | | | 01/2019 - 06/2019 | | | USD | | 20,225 | | BRL | | | | | | | 78,526 | | | | 547,232 | | | | 421,496 | |
| GSCO-OT | | | 02/2019 | | | USD | | 4,966 | | EUR | | | | | | | 4,320 | | | | — | | | | 1,199 | |
| GSCO-OT | | | 02/2019 | | | USD | | 3,500 | | IDR | | | | | | | 51,957,000 | | | | — | | | | 93,176 | |
| GSCO-OT | | | 01/2019 | | | USD | | 8,570 | | MXN | | | | | | | 173,241 | | | | — | | | | 240,051 | |
| GSCO-OT | | | 10/2019 | | | USD | | 5,475 | | TRY | | | | | | | 39,450 | | | | — | | | | 1,004,808 | |
| GSCO-OT | | | 08/2019 | | | USD | | 3,039 | | ZAR | | | | | | | 44,824 | | | | 9,802 | | | | — | |
| GSCO-OT | | | 05/2019 | | | ZAR | | 10,470 | | USD | | | | | | | 730 | | | | — | | | | 15,618 | |
| HSBC | | | 02/2019 | | | AUD | | 6,500 | | USD | | | | | | | 4,694 | | | | — | | | | 111,883 | |
| HSBC | | | 02/2019 | | | EUR | | 5,775 | | USD | | | | | | | 6,631 | | | | 8,670 | | | | 428 | |
| HSBC | | | 02/2019 | | | USD | | 16,532 | | EUR | | | | | | | 14,215 | | | | 240,220 | | | | 54,584 | |
| JPM | | | 01/2019 - 02/2019 | | | BRL | | 163,096 | | USD | | | | | | | 42,780 | | | | 22,940 | | | | 743,389 | |
| JPM | | | 02/2019 | | | EUR | | 17,456 | | USD | | | | | | | 20,410 | | | | 193 | | | | 339,599 | |
| JPM | | | 09/2019 | | | IDR | | 188,087,000 | | USD | | | | | | | 11,898 | | | | 707,222 | | | | — | |
| JPM | | | 02/2019 | | | JPY | | 1,636,000 | | USD | | | | | | | 14,726 | | | | 248,421 | | | | — | |
| JPM | | | 02/2019 | | | NOK | | 99,642 | | USD | | | | | | | 11,952 | | | | — | | | | 408,636 | |
| JPM | | | 03/2019 | | | RUB | | 498,200 | | USD | | | | | | | 7,207 | | | | — | | | | 128,734 | |
| JPM | | | 01/2019 - 04/2019 | | | USD | | 56,260 | | BRL | | | | | | | 212,815 | | | | 1,420,314 | | | | — | |
| JPM | | | 03/2019 | | | USD | | 7,254 | | CLP | | | | | | | 4,940,000 | | | | 130,262 | | | | — | |
| JPM | | | 01/2019 | | | USD | | 7,537 | | COP | | | | | | | 24,240,000 | | | | 78,336 | | | | — | |
| JPM | | | 02/2019 | | | USD | | 18,507 | | EUR | | | | | | | 15,925 | | | | 195,704 | | | | — | |
| JPM | | | 02/2019 | | | USD | | 14,002 | | IDR | | | | | | | 208,700,000 | | | | — | | | | 430,862 | |
| JPM | | | 02/2019 | | | USD | | 14,690 | | JPY | | | | | | | 1,636,000 | | | | — | | | | 283,596 | |
| JPM | | | 02/2019 | | | USD | | 26,036 | | NOK | | | | | | | 219,980 | | | | 670,922 | | | | 117,817 | |
| JPM | | | 03/2019 | | | USD | | 1,367 | | RUB | | | | | | | 91,600 | | | | 65,254 | | | | — | |
| JPM | | | 03/2019 | | | USD | | 8,836 | | TRY | | | | | | | 49,820 | | | | — | | | | 202,449 | |
| JPM | | | 08/2019 | | | ZAR | | 44,824 | | USD | | | | | | | 3,039 | | | | — | | | | 9,802 | |
| SCB | | | 02/2019 | | | EUR | | 1,460 | | USD | | | | | | | 1,691 | | | | — | | | | 12,292 | |
| SCB | | | 09/2019 | | | USD | | 11,553 | | IDR | | | | | | | 188,087,000 | | | | — | | | | 1,052,182 | |
| | | | | | | | | | | | | | | | | | | | | | |
| Total Unrealized Appreciation and Depreciation | | | $ | 7,416,073 | | | $ | 12,515,690 | |
| | | | | | | | | | | | | | | | | | | | | | |
| | | | | | | | | | | | | | | | | | | | | | | | | | |
Futures Contracts as of December 31, 2018 | | | | | | | | | | | |
| Description | | Buy/Sell | | | Expiration Date | | | Number of
Contracts | | | | | | Notional
Amount
(000’s) | | | Value | | | Unrealized
Appreciation/
(Depreciation) |
| Euro-BUND | | | Sell | | | | 3/07/19 | | | | 110 | | | | EUR | | | | 20,436 | | | $ | 20,611,355 | | | $ (175,310) |
| Euro-BUXL | | | Sell | | | | 3/07/19 | | | | 67 | | | | EUR | | | | 13,524 | | | | 13,865,339 | | | (340,914) |
| Euro-OAT | | | Sell | | | | 3/07/19 | | | | 78 | | | | EUR | | | | 13,471 | | | | 13,476,770 | | | (5,451) |
| United States Treasury Long Bonds | | | Buy | | | | 3/20/19 | | | | 10 | | | | USD | | | | 1,444 | | | | 1,460,000 | | | 16,483 |
30 OPPENHEIMER GLOBAL STRATEGIC INCOME FUND/VA
| | | | | | | | | | | | | | | | | | | | | | | | | | |
Futures Contracts (Continued) | | | | | | | | | | | |
| Description | | Buy/Sell | | | Expiration Date | | | Number of
Contracts | | | | | | Notional
Amount
(000’s) | | | Value | | | Unrealized
Appreciation/
(Depreciation) |
| United States Treasury Long Bonds | | | Sell | | | | 3/20/19 | | | | 106 | | | | USD | | | | 14,845 | | | $ | 15,476,000 | | | $ (631,069) |
| United States Treasury Nts., 10 yr. | | | Buy | | | | 3/20/19 | | | | 153 | | | | USD | | | | 18,268 | | | | 18,668,391 | | | 400,699 |
| United States Treasury Nts., 10 yr. | | | Sell | | | | 3/20/19 | | | | 296 | | | | USD | | | | 35,448 | | | | 36,116,625 | | | (669,000) |
| United States Treasury Nts., 2 yr. | | | Buy | | | | 3/29/19 | | | | 94 | | | | USD | | | | 19,834 | | | | 19,957,375 | | | 123,848 |
| United States Treasury Nts., 2 yr. | | | Sell | | | | 3/29/19 | | | | 571 | | | | USD | | | | 120,519 | | | | 121,230,438 | | | (711,474) |
| United States Treasury Nts., 5 yr. | | | Buy | | | | 3/29/19 | | | | 133 | | | | USD | | | | 15,010 | | | | 15,253,438 | | | 243,523 |
| United States Ultra 10 yr. | | | Sell | | | | 3/20/19 | | | | 8 | | | | USD | | | | 1,030 | | | | 1,040,625 | | | (10,763) |
| United States Ultra Bonds | | | Buy | | | | 3/20/19 | | | | 68 | | | | USD | | | | 10,353 | | | | 10,924,625 | | | 571,777 |
| | | | | | | | | | | | | | | | | | | | | | | | | | |
| | | | | | | | | | | | | | | | | | | | | | | | | | $ (1,187,651) |
| | | | | | | | | | | | | | | | | | | | | | | | | | |
| | | | | | | | | | | | | | | | | | | | | | | | | | | | | | | | |
Over-the-Counter Options Written at December 31, 2018 | | | | | | | | | | | | | |
| Description | | Counterparty | | | | | Exercise Price | | | Expiration Date | | | | | Number of
Contracts | | | Notional Amount (000’s) | | | Premiums Received | | | Value | |
AUD Currency Call | | | BOA | | | USD | | | 0.772 | | | | 3/1/19 | | | AUD | | | (25,500,000 | ) | | | AUD 200,000 | | | $ | 60,042 | | | $ | (6,274 | ) |
AUD Currency Put | | | BOA | | | USD | | | 0.719 | | | | 3/1/19 | | | AUD | | | (25,500,000 | ) | | | AUD 200,000 | | | | 127,153 | | | | (675,658 | ) |
BRL Currency Put1 | | | GSCO-OT | | | BRL | | | 4.500 | | | | 12/10/19 | | | BRL | | | (586,000 | ) | | | BRL 5,300 | | | | 121,888 | | | | (100,326 | ) |
BRL Currency Put2 | | | GSCO-OT | | | BRL | | | 4.500 | | | | 12/6/19 | | | BRL | | | (586,000 | ) | | | BRL 5,000 | | | | 103,839 | | | | (99,854 | ) |
BRL Currency Call | | | GSCO-OT | | | BRL | | | 3.559 | | | | 2/14/19 | | | BRL | | | (52,000,000 | ) | | | BRL 355,900 | | | | 68,861 | | | | (12,606 | ) |
BRL Currency Put | | | GSCO-OT | | | BRL | | | 4.018 | | | | 2/14/19 | | | BRL | | | (58,700,000 | ) | | | BRL 401,750 | | | | 194,488 | | | | (142,179 | ) |
CAD Currency Call | | | SCB | | | CAD | | | 1.260 | | | | 2/1/19 | | | CAD | | | (55,440,000 | ) | | | CAD 189,000 | | | | 119,284 | | | | (2,439 | ) |
CAD Currency Put | | | SCB | | | CAD | | | 1.341 | | | | 1/18/19 | | | CAD | | | (9,480,000 | ) | | | CAD 134,050 | | | | 37,043 | | | | (132,597 | ) |
CAD Currency Call | | | SCB | | | CAD | | | 1.264 | | | | 1/18/19 | | | CAD | | | (8,930,000 | ) | | | CAD 126,400 | | | | 18,249 | | | | (116 | ) |
CAD Currency Put | | | SCB | | | CAD | | | 1.339 | | | | 2/1/19 | | | CAD | | | (58,916,000 | ) | | | CAD 200,850 | | | | 238,832 | | | | (917,676 | ) |
CLP Currency Put | | | CITNA-B | | | CLP | | | 710.000 | | | | 2/21/19 | | | CLP | | | (12,383,000,000 | ) | | | CLP 106,500,000 | | | | 216,534 | | | | (160,979 | ) |
CLP Currency Call | | | CITNA-B | | | CLP | | | 615.000 | | | | 2/21/19 | | | CLP | | | (10,726,000,000 | ) | | | CLP 92,250,000 | | | | 94,479 | | | | (10,726 | ) |
CLP Currency Put | | | CITNA-B | | | CLP | | | 785.750 | | | | 11/4/19 | | | CLP | | | (23,088,000,000 | ) | | | CLP 78,575,000 | | | | 504,513 | | | | (392,496 | ) |
CLP Currency Put | | | GSCO-OT | | | CLP | | | 707.500 | | | | 2/11/19 | | | CLP | | | (11,399,000,000 | ) | | | CLP 141,500,000 | | | | 168,705 | | | | (138,840 | ) |
CLP Currency Call | | | GSCO-OT | | | CLP | | | 635.000 | | | | 2/11/19 | | | CLP | | | (10,230,500,000 | ) | | | CLP 127,000,000 | | | | 72,838 | | | | (7,570 | ) |
COP Currency Put | | | CITNA-B | | | COP | | | 3256.000 | | | | 2/13/19 | | | COP | | | (47,689,000,000 | ) | | | COP 325,600,000 | | | | 247,672 | | | | (245,598 | ) |
COP Currency Put | | | CITNA-B | | | COP | | | 3162.000 | | | | 1/15/19 | | | COP | | | (44,700,000,000 | ) | | | COP 316,200,000 | | | | 267,071 | | | | (402,300 | ) |
COP Currency Put | | | GSCO-OT | | | COP | | | 3340.000 | | | | 3/4/19 | | | COP | | | (58,560,000,000 | ) | | | COP 501,000,000 | | | | 141,473 | | | | (203,789 | ) |
COP Currency Call | | | GSCO-OT | | | COP | | | 3065.000 | | | | 3/4/19 | | | COP | | | (53,700,000,000 | ) | | | COP 459,750,000 | | | | 155,984 | | | | (55,311 | ) |
COP Currency Call | | | JPM | | | COP | | | 3162.000 | | | | 1/15/19 | | | COP | | | (44,700,000,000 | ) | | | COP 316,200,000 | | | | 179,097 | | | | (44,700 | ) |
COP Currency Put | | | JPM | | | COP | | | 3316.000 | | | | 3/12/19 | | | COP | | | (48,482,000,000 | ) | | | COP 331,600,000 | | | | 176,152 | | | | (222,532 | ) |
COP Currency Call | | | JPM | | | COP | | | 3038.000 | | | | 3/12/19 | | | COP | | | (44,417,500,000 | ) | | | COP 303,800,000 | | | | 95,570 | | | | (42,641 | ) |
EUR Currency Call | | | BOA | | | EUR | | | 1.157 | | | | 5/29/19 | | | EUR | | | (29,290,000 | ) | | | EUR 100,000 | | | | 703,561 | | | | (606,008 | ) |
EUR Currency Put | | | GSCO-OT | | | ZAR | | | 15.750 | | | | 7/10/19 | | | EUR | | | (7,120,000 | ) | | | EUR 75,000 | | | | 233,186 | | | | (118,251 | ) |
EUR Currency Call | | | JPM | | | JPY | | | 131.800 | | | | 1/25/19 | | | EUR | | | (21,000,000 | ) | | | EUR 200,000 | | | | 150,909 | | | | (14,538 | ) |
EUR Currency Call | | | JPM | | | ZAR | | | 17.438 | | | | 7/10/19 | | | EUR | | | (7,120,000 | ) | | | EUR 75,000 | | | | 391,297 | | | | (354,006 | ) |
EUR Currency Put | | | JPM | | | JPY | | | 120.600 | | | | 1/25/19 | | | EUR | | | (21,000,000 | ) | | | EUR 200,000 | | | | 102,757 | | | | (25,131 | ) |
EUR Currency Call | | | SCB | | | EUR | | | 1.156 | | | | 5/29/19 | | | EUR | | | (43,940,000 | ) | | | EUR 250,000 | | | | 1,044,893 | | | | (929,841 | ) |
IDR Currency Put | | | GSCO-OT | | | IDR | | | 15000.000 | | | | 7/10/19 | | | IDR | | | (390,000,000,000 | ) | | | IDR 3,005,250,000 | | | | 949,000 | | | | (390,000 | ) |
IDR Currency Put | | | SCB | | | IDR | | | 17550.000 | | | | 9/5/19 | | | IDR | | | (421,762,500,000 | ) | | | IDR 2,983,500,000 | | | | 693,205 | | | | — | |
INR Currency Call | | | GSCO-OT | | | INR | | | 72.000 | | | | 1/23/19 | | | INR | | | (540,000,000 | ) | | | INR 7,200,000 | | | | 21,226 | | | | (251,640 | ) |
INR Currency Put | | | GSCO-OT | | | INR | | | 76.950 | | | | 1/23/19 | | | INR | | | (577,125,000 | ) | | | INR 7,695,000 | | | | 48,007 | | | | (1,154 | ) |
INR Currency Put | | | GSCO-OT | | | INR | | | 80.050 | | | | 10/14/19 | | | INR | | | (1,131,600,000 | ) | | | INR 8,005,000 | | | | 282,723 | | | | (84,870 | ) |
MXN Currency Put | | | CITNA-B | | | MXN | | | 22.828 | | | | 8/15/19 | | | MXN | | | (171,202,500 | ) | | | MXN 1,712,108 | | | | 192,431 | | | | (117,274 | ) |
MXN Currency Put | | | GSCO-OT | | | MXN | | | 19.500 | | | | 1/4/19 | | | MXN | | | (257,300,000 | ) | | | MXN 2,730,000 | | | | 192,751 | | | | (133,539 | ) |
MXN Currency Put | | | GSCO-OT | | | MXN | | | 24.500 | | | | 10/29/19 | | | MXN | | | (479,900,000 | ) | | | MXN 4,900,000 | | | | 438,766 | | | | (261,545 | ) |
MXN Currency Call | | | JPM | | | MXN | | | 20.000 | | | | 1/3/19 | | | MXN | | | (235,000,000 | ) | | | MXN 3,200,000 | | | | 157,285 | | | | (224,895 | ) |
NOK Currency Put | | | BOA | | | NOK | | | 8.787 | | | | 3/8/19 | | | NOK | | | (503,854,000 | ) | | | NOK 3,822,345 | | | | 417,269 | | | | (498,755 | ) |
NOK Currency Call | | | BOA | | | NOK | | | 8.153 | | | | 3/8/19 | | | NOK | | | (467,500,000 | ) | | | NOK 3,546,555 | | | | 205,510 | | | | (84,417 | ) |
NOK Currency Call | | | JPM | | | NOK | | | 7.975 | | | | 2/4/19 | | | NOK | | | (286,870,000 | ) | | | NOK 2,448,325 | | | | 114,449 | | | | (8,319 | ) |
NOK Currency Put | | | JPM | | | NOK | | | 8.600 | | | | 2/4/19 | | | NOK | | | (309,360,000 | ) | | | NOK 2,640,200 | | | | 262,890 | | | | (492,192 | ) |
PLN Currency Put | | | GSCO-OT | | | PLN | | | 4.104 | | | | 8/19/19 | | | PLN | | | (116,018,000 | ) | | | PLN 1,025,875 | | | | 566,590 | | | | (255,356 | ) |
RUB Currency Call | | | CITNA-B | | | RUB | | | 67.000 | | | | 2/13/19 | | | RUB | | | (981,000,000 | ) | | | RUB 6,700,000 | | | | 235,952 | | | | (52,003 | ) |
RUB Currency Put | | | GSCO-OT | | | RUB | | | 83.540 | | | | 8/12/19 | | | RUB | | | (590,480,000 | ) | | | RUB 8,354,000 | | | | 148,808 | | | | (92,115 | ) |
RUB Currency Put | | | JPM | | | RUB | | | 70.000 | | | | 6/7/19 | | | RUB | | | (1,979,100,000 | ) | | | RUB 17,500,000 | | | | 793,217 | | | | (1,236,937 | ) |
SEK Currency Put | | | GSCO-OT | | | SEK | | | 9.285 | | | | 2/4/19 | | | SEK | | | (367,159,500 | ) | | | SEK 2,506,815 | | | | 295,404 | | | | (33,411 | ) |
SEK Currency Call | | | GSCO-OT | | | SEK | | | 8.587 | | | | 2/4/19 | | | SEK | | | (339,557,000 | ) | | | SEK 2,318,355 | | | | 133,664 | | | | (93,039 | ) |
SEK Currency Put | | | JPM | | | SEK | | | 9.080 | | | | 1/23/19 | | | SEK | | | (149,000,000 | ) | | | SEK 454,000 | | | | 215,459 | | | | (24,138 | ) |
TRY Currency Put | | | GSCO-OT | | | TRY | | | 8.800 | | | | 10/16/19 | | | TRY | | | (132,000,000 | ) | | | TRY 568,080 | | | | 667,170 | | | | (174,504 | ) |
ZAR Currency Call | | | CITNA-B | | | ZAR | | | 13.500 | | | | 5/7/19 | | | ZAR | | | (98,900,000 | ) | | | ZAR 1,350,000 | | | | 160,804 | | | | (84,955 | ) |
ZAR Currency Call | | | GSCO-OT | | | ZAR | | | 13.286 | | | | 2/26/19 | | | ZAR | | | (97,296,000 | ) | | | ZAR 996,450 | | | | 101,573 | | | | (22,408 | ) |
ZAR Currency Put | | | GSCO-OT | | | ZAR | | | 17.916 | | | | 8/12/19 | | | ZAR | | | (126,631,000 | ) | | | ZAR 1,791,550 | | | | 173,483 | | | | (96,113 | ) |
ZAR Currency Put | | | GSCO-OT | | | ZAR | | | 18.208 | | | | 8/15/19 | | | ZAR | | | (136,560,000 | ) | | | ZAR 1,365,600 | | | | 284,250 | | | | (92,178 | ) |
31 OPPENHEIMER GLOBAL STRATEGIC INCOME FUND/VA
CONSOLIDATED STATEMENT OF INVESTMENTSContinued
| | | | | | | | | | | | | | | | | | | | | | | | | | | | | | | | | | |
Over-the-Counter Options Written (Continued) | | | | | | | | | | | | | | | | | | | |
| Description | | Counterparty | | | | | | Exercise Price | | | Expiration Date | | | | | | Number of Contracts | | | Notional Amount (000’s) | | | Premiums Received | | | Value |
| ZAR Currency Put | | | GSCO-OT | | | | ZAR | | | | 14.978 | | | | 2/26/19 | | | | ZAR | | | | (109,683,600) | | | | ZAR 1,123,313 | | | $ | 83,272 | | | $ (122,740) |
| ZAR Currency Put | | | GSCO-OT | | | | ZAR | | | | 14.646 | | | | 5/27/19 | | | | ZAR | | | | (102,522,000) | | | | ZAR 1,464,600 | | | | 187,628 | | | (322,022) |
| TotalOver-the-Counter Options Written | | | | | | | | | | | | | | | | | | | | | | | $ | 14,059,156 | | | $ (11,315,501) |
| | | | | | | | | | | | | | | | | | | | | | | | | | | | | | | |
1.Knock-out option becomes ineligible for exercise if at any time spot rates are less than or equal to 3.6 BRL per 1 USD.
2.Knock-out option becomes ineligible for exercise if at any time spot rates are less than or equal to 3.6 BRL per 1 USD.
| | | | | | | | | | | | | | | | | | | | | | | | | | | | | | | | | | |
| Centrally Cleared Credit Default Swaps at December 31, 2018 | | | | | | | | | | | | | | | |
| Reference Asset | | | Buy/Sell Protection | | | Fixed Rate | | | Maturity Date | | | | | | Notional Amount (000’s) | | | Premiums Received/(Paid) | | | Value | | | Unrealized Appreciation/ (Depreciation) |
| CDX.EM.30 | | | | Buy | | | | 1.000% | | | | 12/20/23 | | | | USD | | | | 2,000 | | | $ | (95,222) | | | $ | 93,232 | | | $ (1,990) |
| CDX.EM.30 | | | | Buy | | | | 1.000 | | | | 12/20/23 | | | | USD | | | | 2,000 | | | | (97,622) | | | | 93,232 | | | (4,390) |
| CDX.EM.30 | | | | Buy | | | | 1.000 | | | | 12/20/23 | | | | USD | | | | 1,000 | | | | (47,956) | | | | 46,616 | | �� | (1,340) |
| CDX.EM.30 | | | | Buy | | | | 1.000 | | | | 12/20/23 | | | | USD | | | | 1,000 | | | | (48,811) | | | | 46,616 | | | (2,195) |
| CDX.EM.30 | | | | Buy | | | | 1.000 | | | | 12/20/23 | | | | USD | | | | 1,000 | | | | (44,311) | | | | 46,616 | | | 2,305 |
| CDX.EM.30 | | | | Buy | | | | 1.000 | | | | 12/20/23 | | | | USD | | | | 1,000 | | | | (45,311) | | | | 46,616 | | | 1,305 |
| CDX.EM.30 | | | | Buy | | | | 1.000 | | | | 12/20/23 | | | | USD | | | | 1,000 | | | | (46,856) | | | | 46,616 | | | (240) |
| CDX.EM.30 | | | | Buy | | | | 1.000 | | | | 12/20/23 | | | | USD | | | | 1,000 | | | | (46,911) | | | | 46,616 | | | (295) |
| CDX.EM.30 | | | | Buy | | | | 1.000 | | | | 12/20/23 | | | | USD | | | | 1,000 | | | | (47,111) | | | | 46,616 | | | (495) |
| CDX.EM.30 | | | | Buy | | | | 1.000 | | | | 12/20/23 | | | | USD | | | | 1,000 | | | | (45,411) | | | | 46,616 | | | 1,205 |
| CDX.HY.31 | | | | Sell | | | | 5.000 | | | | 12/20/23 | | | | USD | | | | 3,000 | | | | (174,373) | | | | 63,293 | | | (111,080) |
| Federative Republic of Brazil | | | | Buy | | | | 1.000 | | | | 12/20/23 | | | | USD | | | | 1,750 | | | | (159,965) | | | | 81,719 | | | (78,246) |
| Federative Republic of Brazil | | | | Sell | | | | 1.000 | | | | 6/20/22 | | | | USD | | | | 2,500 | | | | 154,768 | | | | (48,407) | | | 106,361 |
| People’s Republic of China | | | | Buy | | | | 1.000 | | | | 12/20/23 | | | | USD | | | | 4,500 | | | | 81,048 | | | | (70,608) | | | 10,440 |
| Petrobras Global Finance BV | | | | Sell | | | | 1.000 | | | | 12/20/20 | | | | USD | | | | 1,000 | | | | 10,092 | | | | (9,633) | | | 459 |
| Petrobras Global Finance BV | | | | Sell | | | | 1.000 | | | | 12/20/20 | | | | USD | | | | 1,000 | | | | 10,178 | | | | (9,633) | | | 545 |
| Republic of South Africa | | | | Buy | | | | 1.000 | | | | 12/20/23 | | | | USD | | | | 1,000 | | | | (61,012) | | | | 53,574 | | | (7,438) |
| Russian Federation | | | | Buy | | | | 1.000 | | | | 12/20/23 | | | | USD | | | | 2,000 | | | | (68,304) | | | | 46,893 | | | (21,411) |
| Turkey Government International | | | | Buy | | | | 1.000 | | | | 12/20/23 | | | | USD | | | | 1,000 | | | | (122,432) | | | | 109,209 | | | (13,223) |
| Turkey Government International | | | | Buy | | | | 1.000 | | | | 12/20/23 | | | | USD | | | | 1,000 | | | | (114,057) | | | | 109,209 | | | (4,848) |
| United Mexican States | | | | Buy | | | | 1.000 | | | | 12/20/23 | | | | USD | | | | 3,250 | | | | (51,730) | | | | 78,554 | | | 26,824 |
| Total Cleared Credit Default Swaps | | | | | | | | | | | | | | | | | | | | | | | $ | (1,061,309) | | | $ | 963,562 | | | $ (97,747) |
| | | | | | | | | | | | | | | | | | | | | | | | | | | |
| | | | | | | | | | | | | | | | | | | | | | | | | | | | | | | | | | |
| Over-the-Counter Credit Default Swaps at December 31, 2018 | | | | | | | | | | | | | | | | | | | |
| Reference Asset | | Counterparty | | | Buy/Sell
Protection | | | Fixed Rate | | | Maturity Date | | | | | | Notional Amount
(000’s) | | | Premiums
Received/(Paid) | | | Value | | | Unrealized
Appreciation/
(Depreciation) |
| Hellenic Republic | | | BAC | | | | Sell | | | | 1.000% | | | | 6/20/25 | | | | USD | | | | 1,414 | | | $ | 235,247 | | | $ | (272,347) | | | $ (37,100) |
| Hellenic Republic | | | BAC | | | | Sell | | | | 1.000 | | | | 6/20/25 | | | | USD | | | | 3,534 | | | | 529,497 | | | | (680,674) | | | (151,177) |
| Hellenic Republic | | | BAC | | | | Sell | | | | 1.000 | | | | 12/20/25 | | | | USD | | | | 3,400 | | | | 528,719 | | | | (700,057) | | | (171,338) |
| Hellenic Republic | | | BAC | | | | Sell | | | | 1.000 | | | | 12/20/19 | | | | USD | | | | 2,350 | | | | 35,260 | | | | (31,527) | | | 3,733 |
| Hellenic Republic | | | GSCOI | | | | Sell | | | | 1.000 | | | | 6/20/25 | | | | USD | | | | 1,410 | | | | 222,469 | | | | (271,576) | | | (49,107) |
| Idbi Bank Ltd./difc Dubai | | | BAC | | | | Sell | | | | 1.000 | | | | 12/20/22 | | | | USD | | | | 1,000 | | | | 32,421 | | | | (27,427) | | | 4,994 |
| Idbi Bank Ltd./difc Dubai | | | BNP | | | | Sell | | | | 1.000 | | | | 12/20/22 | | | | USD | | | | 1,000 | | | | 30,175 | | | | (27,427) | | | 2,748 |
| Oriental Republic of Uruguay | | | BOA | | | | Sell | | | | 1.000 | | | | 12/20/21 | | | | USD | | | | 2,697 | | | | 48,742 | | | | 15,642 | | | 64,384 |
| Republic Of Italy Government I | | | BAC | | | | Buy | | | | 1.000 | | | | 12/20/23 | | | | USD | | | | 7,070 | | | | (523,946) | | | | 327,404 | | | (196,542) |
| State Bank of India | | | BNP | | | | Sell | | | | 1.000 | | | | 9/20/19 | | | | USD | | | | 1,740 | | | | 71,791 | | | | 9,634 | | | 81,425 |
| TotalOver-the-Counter Credit Default Swaps | | | | | | | | | | | | | | | | | | | $ | 1,210,375 | | | $ | (1,658,355) | | | $ (447,980) |
| | | | | | | | | | | | | | | | | | | | | | | | | | | |
The table that follows shows the undiscounted maximum potential payment by the Fund related to selling credit protection in credit default swaps:
| | | | | | |
Type of Reference Asset on which the Fund Sold Protection | | Total Maximum Potential Payments for Selling Credit Protection
(Undiscounted) | | Amount Recoverable* | | Reference Asset Rating Range** (Unaudited) |
| Non-Investment Grade Corporate Debt Indexes | | $ 3,000,000 | | $ — | | BB |
| Non-Investment Grade Single Name Corporate Debt | | 4,000,000 | | — | | BB+ to BB |
| Investment Grade Single Name Corporate Debt | | 1,740,000 | | — | | BBB- |
| Investment Grade Sovereign Debt | | 2,697,000 | | — | | BBB |
| Non-Investment Grade Sovereign Debt | | 14,608,000 | | 1,750,000 | | BB- to BB |
| | | | | | |
| Total USD | | $ 26,045,000 | | $ 1,750,000 | | |
| | | | | | |
*Amounts recoverable includes potential payments from related purchased protection for instances where the Fund is the seller of protection. In addition, the Fund has no recourse provisions under the credit derivatives and holds no collateral which can offset or reduce potential payments under a triggering event.
**The period end reference asset security ratings, as rated by any rating organization, are included in the equivalent Standard & Poor’s rating category. The reference asset rating represents
32 OPPENHEIMER GLOBAL STRATEGIC INCOME FUND/VA
the likelihood of a potential credit event on the reference asset which would result in a related payment by the Fund.
| | | | | | | | | | | | | | | | | | | | | | | | | | | | | | | | |
Centrally Cleared Interest Rate Swaps at December 31, 2018 | | | | | | | | | | | | | | | | | | | |
| Counterparty | | Pay/Receive Floating Rate | | | Floating Rate | | Fixed Rate | | | Maturity Date | | | | | | Notional Amount (000’s) | | | Premiums Received / (Paid) | | | Value | | | Unrealized Appreciation/ (Depreciation) |
BAC | | | Receive | | | Six-Month JPY BBA LIBOR | | | 0.296% | | | | 11/29/27 | | | | JPY | | | | 4,654,000 | | | $ | 59 | | | $ | (632,916) | | | $ (632,857) |
BAC | | | Receive | | | Six-Month EUR EURIBOR | | | 1.123 | | | | 3/8/28 | | | | EUR | | | | 2,475 | | | | — | | | | (129,206) | | | (129,206) |
BNP | | | Pay | | | Six-MonthHUF-BUBOR-Reuters | | | 1.210 | | | | 10/26/20 | | | | HUF | | | | 2,101,000 | | | | — | | | | 59,849 | | | 59,849 |
BNP | | | Receive | | | Six-MonthHUF-BUBOR-Reuters | | | 3.280 | | | | 10/26/28 | | | | HUF | | | | 475,700 | | | | — | | | | (180,632) | | | (180,632) |
BNP | | | Pay | | | MXN TIIE BANXICO | | | 8.000 | | | | 8/13/20 | | | | MXN | | | | 311,315 | | | | — | | | | (86,042) | | | (86,042) |
BOA | | | Pay | | | Three-Month USD BBA LIBOR | | | 2.905 | | | | 12/17/20 | | | | USD | | | | 146,500 | | | | — | | | | 645,013 | | | 645,013 |
BOA | | | Pay | | | Three-Month USD BBA LIBOR | | | 2.915 | | | | 12/17/20 | | | | USD | | | | 131,800 | | | | — | | | | 605,837 | | | 605,837 |
CITNA-B | | | Pay | | | CLICP | | | 2.901 | | | | 8/9/19 | | | | CLP | | | | 9,271,500 | | | | — | | | | (5,973) | | | (5,973) |
CITNA-B | | | Pay | | | Six-Month PLN WIBOR WIBO | | | 2.990 | | | | 11/17/27 | | | | PLN | | | | 5,770 | | | | — | | | | 73,443 | | | 73,443 |
CITNA-B | | | Pay | | | Six-Month HUF BUBOR | | | 2.205 | | | | 3/8/28 | | | | HUF | | | | 825,000 | | | | — | | | | 62,897 | | | 62,897 |
CITNA-B | | | Receive | | | JIBA3M | | | 7.250 | | | | 7/10/20 | | | | ZAR | | | | 104,000 | | | | — | | | | 291 | | | 291 |
DEU | | | Pay | | | MXN TIIE BANXICO | | | 8.140 | | | | 10/19/20 | | | | MXN | | | | 322,900 | | | | — | | | | (66,573) | | | (66,573) |
DEU | | | Pay | | | JIBA3M | | | 8.420 | | | | 8/29/28 | | | | ZAR | | | | 62,800 | | | | — | | | | 78,759 | | | 78,759 |
DEU | | | Receive | | | JIBA3M | | | 7.500 | | | | 8/15/20 | | | | ZAR | | | | 136,300 | | | | — | | | | (36,322) | | | (36,322) |
DEU | | | Pay | | | Three-Month ZAR JIBAR SAFEX | | | 7.675 | | | | 2/21/22 | | | | ZAR | | | | 26,465 | | | | — | | | | 12,505 | | | 12,505 |
DEU | | | Receive | | | JIBA3M | | | 7.120 | | | | 6/29/19 | | | | ZAR | | | | 202,850 | | | | — | | | | 4,116 | | | 4,116 |
GSCOI | | | Receive | | | BZDI | | | 8.235 | | | | 1/2/20 | | | | BRL | | | | 45,400 | | | | — | | | | (256,390) | | | (256,390) |
GSCOI | | | Pay | | | EUR006M | | | 1.413 | | | | 7/4/44 | | | | EUR | | | | 1,980 | | | | — | | | | 12,328 | | | 12,328 |
GSCOI | | | Pay | | | EUR006M | | | 1.482 | | | | 7/4/44 | | | | EUR | | | | 3,200 | | | | — | | | | 107,751 | | | 107,751 |
GSCOI | | | Pay | | | MXN TIIE BANXICO | | | 8.770 | | | | 10/29/20 | | | | MXN | | | | 324,700 | | | | — | | | | 42,184 | | | 42,184 |
GSCOI | | | Pay | | | EUR006M | | | 0.861 | | | | 8/15/27 | | | | EUR | | | | 8,030 | | | | — | | | | 184,792 | | | 184,792 |
GSCOI | | | Pay | | | MXN TIIE BANXICO | | | 7.995 | | | | 10/15/20 | | | | MXN | | | | 300,000 | | | | — | | | | (81,849) | | | (81,849) |
GSCOI | | | Receive | | | SORF6M | | | 2.335 | | | | 10/16/21 | | | | SGD | | | | 22,600 | | | | — | | | | (251,673) | | | (251,673) |
GSCOI | | | Pay | | | Three-Month COP IBR OIS Compound | | | 6.500 | | | | 11/9/28 | | | | COP | | | | 6,000,000 | | | | — | | | | 53,034 | | | 53,034 |
GSCOI | | | Pay | | | MXN TIIE BANXICO | | | 8.015 | | | | 10/9/20 | | | | MXN | | | | 320,000 | | | | — | | | | (84,508) | | | (84,508) |
GSCOI | | | Pay | | | MXN TIIE BANXICO | | | 7.760 | | | | 9/25/20 | | | | MXN | | | | 312,000 | | | | — | | | | (134,703) | | | (134,703) |
GSCOI | | | Pay | | | COOVIBR | | | 4.610 | | | | 6/7/20 | | | | COP | | | | 20,710,000 | | | | — | | | | 17,629 | | | 17,629 |
GSCOI | | | Pay | | | BZDI | | | 11.730 | | | | 1/2/25 | | | | BRL | | | | 17,600 | | | | — | | | | 423,452 | | | 423,452 |
GSCOI | | | Pay | | | EUR006M | | | 1.553 | | | | 7/4/44 | | | | EUR | | | | 4,331 | | | | — | | | | 224,423 | | | 224,423 |
GSCOI | | | Pay | | | MXN TIIE BANXICO | | | 8.210 | | | | 1/30/19 | | | | MXN | | | | 538,000 | | | | — | | | | (11,102) | | | (11,102) |
GSCOI | | | Pay | | | MXN TIIE BANXICO | | | 8.480 | | | | 10/27/20 | | | | MXN | | | | 155,730 | | | | — | | | | (19,377) | | | (19,377) |
GSCOI | | | Pay | | | IRS P00.00R00.00 10/15/25 GOLDMAN SACH SHORT | | | 3.450 | | | | 10/15/25 | | | | GBP | | | | 6,930 | | | | — | | | | (46,118) | | | (46,118) |
JPM | | | Pay | | | MXN TIIE BANXICO | | | 8.880 | | | | 10/26/28 | | | | MXN | | | | 83,200 | | | | — | | | | 15,224 | | | 15,224 |
JPM | | | Pay | | | MXN TIIE BANXICO | | | 8.750 | | | | 10/29/20 | | | | MXN | | | | 649,000 | | | | — | | | | 72,935 | | | 72,935 |
JPM | | | Pay | | | BZDI | | | 10.940 | | | | 1/2/23 | | | | BRL | | | | 22,770 | | | | — | | | | 396,878 | | | 396,878 |
JPM | | | Pay | | | BZDI | | | 8.245 | | | | 1/4/21 | | | | BRL | | | | 31,950 | | | | — | | | | 137,370 | | | 137,370 |
JPM | | | Pay | | | COOVIBR | | | 4.890 | | | | 10/17/20 | | | | COP | | | | 46,900,000 | | | | — | | | | 109,354 | | | 109,354 |
| | | | | | Six-Month HUF | | | | | | | | | | | | | | | | | | | | | | | | | | |
JPM | | | Pay | | | BUBOR | | | 1.865 | | | | 1/24/28 | | | | HUF | | | | 375,735 | | | | — | | | | (9,221) | | | (9,221) |
JPM | | | Pay | | | Three-Month ZAR JIBAR SAFEX | | | 7.930 | | | | 11/27/22 | | | | ZAR | | | | 15,000 | | | | — | | | | 14,302 | | | 14,302 |
JPM | | | Pay | | | MXN TIIE BANXICO | | | 8.600 | | | | 10/27/20 | | | | MXN | | | | 158,670 | | | | — | | | | (3,090) | | | (3,090) |
MSCO | | | Pay | | | EUR006M | | | 0.791 | | | | 2/15/28 | | | | EUR | | | | 9,650 | | | | — | | | | 46,729 | | | 46,729 |
MSCO | | | Pay | | | Three-Month USD BBA LIBOR | | | 2.856 | | | | 12/9/22 | | | | USD | | | | 44,000 | | | | — | | | | 299,535 | | | 299,535 |
SIB | | | Pay | | | MXN TIIE BANXICO | | | 9.280 | | | | 11/22/28 | | | | MXN | | | | 90,500 | | | | — | | | | 139,929 | | | 139,929 |
SIB | | | Pay | | | BZDI | | | 9.825 | | | | 7/1/20 | | | | BRL | | | | 500,000 | | | | — | | | | 1,141,307 | | | 1,141,307 |
| | | | | | | | | | | | | | | | | | | | | | | | | | | | | | | | |
Total of Centrally Cleared Interest Rate Swaps | | | | | | | | | | | | | | | $ | 59 | | | $ | 2,946,171 | | | $ 2,946,230 |
| | | | | | | | | | | | | | | | | | | | | | | | | | | | | | | | |
33 OPPENHEIMER GLOBAL STRATEGIC INCOME FUND/VA
CONSOLIDATED STATEMENT OF INVESTMENTSContinued
| | | | | | | | | | | | | | | | | | | | | | | | | | | | | | | | |
Over-the-Counter Interest Rate Swaps at December 31, 2018 | | | | | | | | | | | | | | | |
| Counterparty | | Pay/Receive
Floating Rate | | | Floating Rate | | Fixed Rate | | | Maturity Date | | | | | | Notional
Amount
(000’s) | | | Premiums Received
/ (Paid) | | | Value | | | Unrealized Appreciation/ (Depreciation) |
BOA | | | Pay | | | Six-Month INR FBIL MIBOR OIS Compound | | | 6.330% | | | | 1/31/22 | | | | INR | | | | 210,000 | | | $ | — | | | $ | 4,012 | | | $ 4,012 |
BOA | | | Pay | | | Six-Month THB THBFIX | | | 2.200 | | | | 3/20/22 | | | | THB | | | | 99,500 | | | | — | | | | 34,818 | | | 34,818 |
BOA | | | Pay | | | NSERO | | | 6.623 | | | | 3/20/20 | | | | INR | | | | 2,035,500 | | | | — | | | | 80,988 | | | 80,988 |
BOA | | | Receive | | | Six-Month INR FBIL MIBOR OIS Compound | | | 6.620 | | | | 3/20/23 | | | | INR | | | | 458,000 | | | | — | | | | (85,355) | | | (85,355) |
GSCOI | | | Pay | | | Six-Month CLP TNA | | | 3.620 | | | | 2/8/23 | | | | CLP | | | | 1,822,500 | | | | — | | | | 11,582 | | | 11,582 |
GSCOI | | | Receive | | | KWCDC | | | 1.970 | | | | 8/22/20 | | | | KRW | | | | 42,846,005 | | | | — | | | | (67,388) | | | (67,388) |
JPM | | | Receive | | | Three-Month MYR KLIBOR BNM | | | 4.005 | | | | 2/21/22 | | | | MYR | | | | 13,230 | | | | — | | | | (30,878) | | | (30,878) |
SCB | | | Pay | | | Three-Month MYR KLIBOR BNM | | | 3.310 | | | | 8/19/21 | | | | MYR | | | | 45,000 | | | | — | | | | (103,906) | | | (103,906) |
| | | | | | | | | | | | | | | | | | | | | | | | | | | | | | | | |
Total ofOver-the-Counter Interest Rate Swaps | | | | | | | | | | | | | | | $ | — | | | $ | (156,127) | | | $ (156,127) |
| | | | | | | | | | | | | | | | | | | | | | | | | | | | | | | | |
| | | | | | | | | | | | | | | | | | | | | | | | | | | | |
Over-the-Counter Total Return Swaps at December 31, 2018 | | | | | | | | | | | |
| Reference Asset | | Counterparty | | | Pay/Receive Total
Return* | | Floating Rate | | | Maturity Date | | | | | | Notional
Amount
(000’s) | | | Value | | | Unrealized
Appreciation/
(Depreciation) |
IBOXX EUR Liquid High Yield | | | | | | | | | | | | | | | | | | | | | | | | | | | | |
Index Series 1 Version 1 | | | JPM | | | Receive | | | EUR-EURIBOR | | | | 6/26/19 | | | | EUR | | | | 7,068 | | | $ | (265,388 | ) | | $ (265,388) |
IBOXX EUR Liquid High Yield | | | | | | | | | | | | | | | | | | | | | | | | | | | | |
Index Series 1 Version 1 | | | BOA | | | Receive | | | EUR-EURIBOR | | | | 6/26/19 | | | | EUR | | | | 3,657 | | | | (135,533 | ) | | (135,533) |
IBOXX EUR Liquid High Yield | | | | | | | | | | | | | | | | | | | | | | | | | | | | |
Index Series 1 Version 1 | | | JPM | | | Receive | | | EUR-EURIBOR | | | | 6/26/19 | | | | EUR | | | | 22,000 | | | | (321,251 | ) | | (321,251) |
| | | | | | | | | | | | | | | | | | | | | | | | | | | | |
TotalOver-the-Counter Total Return Swaps | | | | | | | | | | | | | | | | | | | | | $ | (722,172) | | | $ (722,172) |
| | | | | | | | | | | | | | | | | | | | | | | | | | | | |
*Fund will pay or receive the total return of the reference asset depending on whether the return is positive or negative. For contracts where the Fund has elected to receive the total return of the reference asset if positive, it will be responsible for paying the floating rate and the total return of the reference asset if negative. If the Fund has elected to pay the total return of the reference asset if positive, it will receive the floating rate and the total return of the reference asset if negative.
| | | | | | | | | | | | | | | | | | | | | | | | | | | | | | | | | | | | |
Over-the-Counter Credit Default Swaptions Written at December 31, 2018 | | | | | | | | | | | | | | | | | |
| Description | | Counterparty | | | Buy/Sell
Protection | | | Reference Asset | | | Fixed Rate | | | Expiration Date | | | | | | Notional
Amount
(000’s) | | | Premiums Received | | | Value | |
| Credit Default Swap maturing | | | | | | | | | |
| ITRAXX Europe
Crossover Series |
| | | | | | | | | | | | | | | | | | | | | | | | |
| 12/20/23 Put | | | JPM | | | | Sell | | | | 30 Version 2 | | | | 5.000 | % | | | 2/20/19 | | | | EUR | | | | 18,300 | | | $ | 234,170 | | | $ | (154,214) | |
| | | | | | | | | | | | | | | | | | | | | | | | | | | | | | | | | | | | | | | | |
Over-the-Counter Interest Rate Swaptions Written at December 31, 2018 | | | | | | | | | | | | | | | | | |
| Description | | Counterparty | | | Pay/Receive
Floating Rate | | | Floating Rate | | | Fixed
Rate | | | Expiration
Date | | | | | | Notional | | | Amount
(000’s) | | | Premiums
Received | | | Value | |
| Interest Rate Swap maturing 5/14/29 Call | | | BAC | | | | Receive | | |
| Three-Month
USD-LIBOR-BBA |
| | | 3.103% | | | | 5/9/19 | | | | USD | | | | | | | | 49,420 | | | $ | 1,088,935 | | | $ | (1,817,358) | |
| Interest Rate Swap maturing 9/22/22 Call | | | BOA | | | | Receive | | |
| Three-Month
USD-LIBOR-BBA |
| | | 3.118 | | | | 9/18/20 | | | | USD | | | | | | | | 72,910 | | | | 575,989 | | | | (1,113,333) | |
| Interest Rate Swap maturing 3/6/29 Put | | | BOA | | | | Pay | | |
| Three-Month
USD-LIBOR-BBA |
| | | 3.150 | | | | 3/4/19 | | | | USD | | | | | | | | 33,700 | | | | 150,918 | | | | (26,118) | |
| Interest Rate Swap maturing 11/19/22 Call | | | BOA | | | | Receive | | |
| Three-Month
USD-LIBOR-BBA |
| | | 3.112 | | | | 11/15/19 | | | | USD | | | | | | | | 146,500 | | | | 1,133,544 | | | | (2,748,980) | |
| Interest Rate Swap maturing 2/14/29 Call | | | BOA | | | | Receive | | |
| Three-Month
CAD-BA-CDOR |
| | | 2.888 | | | | 2/14/19 | | | | CAD | | | | | | | | 33,700 | | | | 226,696 | | | | (888,553) | |
| Interest Rate Swap maturing 3/16/21 Put | | | GSCOI | | | | Pay | | |
| Three-Month
USD-LIBOR-BBA |
| | | 3.095 | | | | 3/12/19 | | | | USD | | | | | | | | 146,200 | | | | 84,796 | | | | (26,363) | |
| Interest Rate Swap maturing 3/16/21 Put | | | GSCOI | | | | Pay | | |
| Three-Month
USD-LIBOR-BBA |
| | | 3.215 | | | | 3/12/19 | | | | USD | | | | | | | | 146,200 | | | | 43,860 | | | | (18,998) | |
| Interest Rate Swap maturing 8/19/20 Put | | | GSCOI | | | | Pay | | |
| Three-Month
USD-LIBOR-BBA |
| | | 3.350 | | | | 2/14/19 | | | | USD | | | | | | | | 146,500 | | | | 43,950 | | | | (466) | |
| Interest Rate Swap maturing 3/6/29 Put | | | JPM | | | | Pay | | |
| Three-Month
USD-LIBOR-BBA |
| | | 3.125 | | | | 3/4/19 | | | | USD | | | | | | | | 65,900 | | | | 342,863 | | | | (59,670) | |
| Interest Rate Floor maturing 11/9/22 Call | | | JPM | | | | Receive | | |
| 3 month,
MAX[(-0.034%
minus EUR
EURIBOR)
* 10 * Notional, 0] |
| | | 0.034 | | | | 11/9/22 | | | | EUR | | | | | | | | 36,600 | | | | 503,605 | | | | (869,301) | |
34 OPPENHEIMER GLOBAL STRATEGIC INCOME FUND/VA
| | | | | | | | | | | | | | | | | | | | | | | | | | | | | | | | | | | | | | | | |
Over-the-Counter Interest Rate Swaptions Written (Continued) | | | | | | | | | | | | | | | | | |
| Description | | Counterparty | | | Pay/Receive
Floating Rate | | | Floating Rate | | | Fixed
Rate | | | Expiration
Date | | | | | | Notional | | | Amount
(000’s) | | | Premiums
Received | | | Value | |
| Interest Rate Floor maturing 11/9/22 Call | | | JPM | | | | Receive | | |
| 3 month,
MAX[(0.306%
minus EUR
EURIBOR) * 10 *
Notional, 0] |
| | | 0.306% | | | | 11/9/22 | | | | EUR | | | | | | | | 36,600 | | | $ | 923,275 | | | $ | (1,570,865) | |
| Interest Rate Swap maturing 2/12/24 Call | | | JPM | | | | Receive | | |
| Six-Month
AUD-BBR-BBSW |
| | | 2.620 | | | | 2/11/19 | | | | AUD | | | | | | | | 44,000 | | | | 129,186 | | | | (573,719) | |
| Interest Rate Swap maturing 2/11/24 Call | | | JPM | | | | Receive | | |
| Six-Month
AUD-BBR-BBSW |
| | | 2.620 | | | | 2/8/19 | | | | AUD | | | | | | | | 44,000 | | | | 133,106 | | | | (573,896) | |
| Interest Rate Swap maturing 1/22/21 Put | | | JPM | | | | Pay | | |
| MXN TIIE
BANXICO |
| | | 8.730 | | | | 1/24/19 | | | | MXN | | | | | | | | 637,000 | | | | 132,888 | | | | (54,666) | |
| Interest Rate Swap maturing 9/21/21 Call | | | JPM | | | | Receive | | |
| Three-Month
USD-LIBOR-BBA |
| | | 3.145 | | | | 9/18/19 | | | | USD | | | | | | | | 145,820 | | | | 371,841 | | | | (926,839) | |
| Interest Rate Swap maturing 12/9/22 Call | | | MSCO | | | | Receive | | |
| Three-Month
USD-LIBOR-BBA |
| | | 2.356 | | | | 12/7/20 | | | | USD | | | | | | | | 167,000 | | | | 801,600 | | | | (1,329,080) | |
| Interest Rate Swap maturing 1/16/49 Call | | | MSCO | | | | Receive | | |
| Three-Month
USD-LIBOR-BBA |
| | | 3.009 | | | | 1/14/19 | | | | USD | | | | | | | | 8,050 | | | | 100,625 | | | | (291,542) | |
| Interest Rate Swap maturing 1/16/49 Put | | | MSCO | | | | Pay | | |
| Three-Month
USD-LIBOR-BBA |
| | | 3.009 | | | | 1/14/19 | | | | USD | | | | | | | | 8,050 | | | | 100,625 | | | | (8,128) | |
| Interest Rate Swap maturing 11/19/21 Put | | | NOM | | | | Pay | | |
| Three-Month
USD-LIBOR-BBA |
| | | 3.165 | | | | 11/15/19 | | | | USD | | | | | | | | 73,200 | | | | 366,000 | | | | (103,256) | |
| Interest Rate Swap maturing 11/19/21 Call | | | NOM | | | | Receive | | |
| Three-Month
USD-LIBOR-BBA |
| | | 2.915 | | | | 11/15/19 | | | | USD | | | | | | | | 124,500 | | | | 402,794 | | | | (1,172,926) | |
| Interest Rate Swap maturing 11/8/22 Call | | | NOM | | | | Receive | | |
| Three-Month
USD-LIBOR-BBA |
| | | 3.000 | | | | 11/6/19 | | | | USD | | | | | | | | 109,800 | | | | 538,020 | | | | (1,771,253) | |
| Interest Rate Swap maturing 11/8/22 Put | | | NOM | | | | Pay | | |
| Three-Month
USD-LIBOR-BBA |
| | | 3.263 | | | | 11/6/19 | | | | USD | | | | | | | | 54,900 | | | | 425,475 | | | | (92,394) | |
| | | | | | | | | | | | | | | | | | | | | | | | | | | | | | | | | | | | | | | | |
| TotalOver-the-Counter Interest Rate Swaptions Written | | | | | | | | | | | | | | | $ | 8,620,591 | | | $ | (16,037,704) | |
| | | | | | | | | | | | | | | | | | | | | | | | | | | | | | | | | | | | | | | | |
| | |
| Glossary: | | |
| Counterparty Abbreviations | | |
| BAC | | Barclays Bank plc |
| BNP | | BNP Paribas |
| BOA | | Bank of America NA |
| CITNA-B | | Citibank NA |
| DEU | | Deutsche Bank AG |
| GSCOI | | Goldman Sachs International |
| GSCO-OT | | Goldman Sachs Bank USA |
| HSBC | | HSBC Bank USA NA |
| JPM | | JPMorgan Chase Bank NA |
| MSCO | | Morgan Stanley Capital Services, Inc. |
| NOM | | Nomura Global Financial Products, Inc. |
| SCB | | Standard Chartered Bank |
| SIB | | Banco Santander SA |
|
| Currency abbreviations indicate amounts reporting in currencies |
| ARS | | Argentine Peso |
| AUD | | Australian Dollar |
| BRL | | Brazilian Real |
| CAD | | Canadian Dollar |
| CLP | | Chilean Peso |
| COP | | Colombian Peso |
| EGP | | Egyptian Pounds |
| EUR | | Euro |
| GBP | | British Pound Sterling |
| HUF | | Hungarian Forint |
| IDR | | Indonesian Rupiah |
| INR | | Indian Rupee |
| JPY | | Japanese Yen |
| KRW | | South Korean Won |
| MXN | | Mexican Nuevo Peso |
| MYR | | Malaysian Ringgit |
| NOK | | Norwegian Krone |
| PEN | | Peruvian New Sol |
| PLN | | Polish Zloty |
| RUB | | Russian Ruble |
| SEK | | Swedish Krona |
| SGD | | Singapore Dollar |
| THB | | Thailand Baht |
| TRY | | New Turkish Lira |
35 OPPENHEIMER GLOBAL STRATEGIC INCOME FUND/VA
CONSOLIDATED STATEMENT OF INVESTMENTSContinued
| | |
| Currency abbreviations indicate amounts reporting in currencies (Continued) |
| UYU | | Uruguay Peso |
| ZAR | | South African Rand |
|
| Definitions |
| 30YR CMT | | 30 Year Constant Maturity Treasury |
| BA-CDOR | | Canada Bankers Acceptances Deposit Offering Rate |
| BANXICO | | Banco de Mexico |
| BBA | | British Bankers’ Association |
| BBA LIBOR | | British Bankers’ Association London - Interbank Offered Rate |
| BBR | | Bank Bill Rate |
| BBSW | | Bank Bill Swap Reference Rate (Australian Financial Market) |
| BNM | | Bank Negra Malaysia |
| BUBOR | | Budapest Interbank Offered Rate |
| BUND | | German Federal Obligation |
| BUXL | | German Federal Obligation |
| BZDI | | Brazil Interbank Deposit Rate |
| CDOR | | Canada Bankers Acceptances Rate |
| CDX.IM.23 | | Market CDX Emerging Markets Index |
| CDX.HY.31 | | Market CDX High Yield Index |
| CLICP | | Sinacofi Chile Interbank Rate Average |
| COOVIBR | | Colombia IBR Overnight Nominal interbank Reference Rate |
| EURIBOR | | Euro Interbank Offered Rate |
| EUR006M | | EURIBOR 6 Month ACT/360 |
| EUSA5 | | EUR Swap Annual 5 Year |
| EUSA8 | | EUR Swap Annual 8 Year |
| EUSA10 | | EUR Swap Annual 10 Year |
| EUSA11 | | EUR Swap Annual 11 Year |
| FBIL | | Financial Benchmarks India Private Ltd. |
| H15T5Y | | US Treasury Yield Curve Rate T Note Constant Maturity 5 Year |
| H15T10Y | | US Treasury Yield Curve Rate T Note Constant Maturity 10 Year |
| H15T1Y | | US Treasury Yield Curve Rate T Note Constant Maturity 1 Year |
| IBR | | Indicador Bancario de Referencia |
| ICE LIBOR | | Intercontinental Exchange London Interbank Offered Rate |
| INDEX | | 10 year USD CMS minus 2 year USD CMS |
| ITRAXX Europe Crossover Series 30 Version 2 | | Credit Default Swap Trading Index for a Specific Basket of Securities |
| JIBA3M | | South Africa Johannesburg Interbank Agreed Rate 3 Month |
| JIBAR SAFEX | | South Africa Johannesburg Interbank Agreed Rate/Futures Exchange |
| KLIBOR | | Kuala Lumpur Interbank Offered Rate |
| KWCDC | | South Korean Won Index |
| LIBOR | | London Interbank Offered Rate |
| LIBOR01M | | ICE LIBOR USD 1 Month |
| LIBOR4 | | London Interbank Offered Rate-Quarterly |
| LIBOR12 | | London Interbank Offered Rate-Monthly |
| MIBOR | | Mumbai Interbank Offered Rate |
| NSERO | | India Rupee Floating Rate |
| OAT | | French Government Bonds |
| OIS | | Overnight Index Swap |
| SORF6M | | Association of Banks in Singapore Swap Offer Rate Fixing 6 Month |
| THBFIX | | Thai Baht Interest Rate Fixing |
| TIIE | | Interbank Equilibrium Interest Rate |
| TNA | | Non-Deliverable CLP Camara |
| US0001M | | ICE LIBOR USD 1 Month |
| US0003M | | ICE LIBOR USD 3 Month |
| USISDA02 | | USD ICE Swap Rate 2 Year |
| USISDA05 | | USD ICE Swap Rate 11:00am NY 5 Year |
| USSW5 | | USD Swap Semi 30/360 5 Year |
| WIBOR WIBO | | Poland Warsaw Interbank Offer Bid Rate |
See accompanying Notes to Consolidated Financial Statements.
36 OPPENHEIMER GLOBAL STRATEGIC INCOME FUND/VA
CONSOLIDATED STATEMENT OF ASSETS AND LIABILITIESDecember 31, 2018
| | | | |
Assets | | | | |
| Investments, at value—see accompanying consolidated statement of investments: | | | | |
| Unaffiliated companies (cost $1,358,218,880) | | $ | 1,277,173,779 | |
| Affiliated companies (cost $318,533,817) | | | 303,966,102 | |
| | | 1,581,139,881 | |
| Cash | | | 16,347,124 | |
| Cash—foreign currencies (cost $1,540,466) | | | 1,442,807 | |
| Cash used for collateral on futures | | | 2,219,000 | |
| Cash used for collateral on OTC derivatives | | | 23,029,000 | |
| Cash used for collateral on centrally cleared swaps | | | 6,721,882 | |
| Cash used for collateral on forward roll transactions | | | 93,000 | |
| Unrealized appreciation on forward currency exchange contracts | | | 7,416,073 | |
| Swaps, at value (net premiums paid $403,413) | | | 484,080 | |
| Centrally cleared swaps, at value (premiums paid $1,317,395) | | | 6,083,709 | |
| Receivables and other assets: | | | | |
| Investments sold (including $30,128,739 sold on a when-issued or delayed delivery basis) | | | 30,704,718 | |
| Interest, dividends and principal paydowns | | | 18,533,873 | |
| Variation margin receivable | | | 73,625 | |
| Shares of beneficial interest sold | | | 43,183 | |
| Other | | | 473,201 | |
| Total assets | | | 1,694,805,156 | |
Liabilities | | | | |
| Unrealized depreciation on forward currency exchange contracts | | | 12,515,690 | |
| Options written, at value (premiums received $14,059,156) | | | 11,315,501 | |
| Swaps, at value (premiums received $1,613,788) | | | 3,020,734 | |
| Centrally cleared swaps, at value (premiums received $256,145) | | | 2,173,976 | |
| Swaptions written, at value (premiums received $8,854,761) | | | 16,191,918 | |
| Payables and other liabilities: | | | | |
| Investments purchased (including $205,787,303 purchased on a when-issued or delayed delivery basis) | | | 206,800,857 | |
| Shares of beneficial interest redeemed | | | 13,328,331 | |
| Distribution and service plan fees | | | 233,167 | |
| Variation margin payable | | | 172,244 | |
| Trustees’ compensation | | | 134,336 | |
| Shareholder communications | | | 59,145 | |
| Other | | | 319,725 | |
| Total liabilities | | | 266,265,624 | |
Net Assets | | $ | 1,428,539,532 | |
| | | | |
| | | | |
Composition of Net Assets | | | | |
| Par value of shares of beneficial interest | | $ | 299,811 | |
| Additionalpaid-in capital | | | 1,647,796,481 | |
| Total accumulated loss | | | (219,556,760 | ) |
Net Assets | | $ | 1,428,539,532 | |
| | | | |
| | | | |
Net Asset Value Per Share | | | | |
| Non-Service Shares: | | | | |
| Net asset value, redemption price per share and offering price per share (based on net assets of $346,706,274 and 74,357,124 shares of beneficial interest outstanding) | | | $4.66 | |
| |
| Service Shares: | | | | |
| Net asset value, redemption price per share and offering price per share (based on net assets of $1,081,833,258 and 225,453,677 shares of beneficial interest outstanding) | | | $4.80 | |
See accompanying Notes to Consolidated Financial Statements.
37 OPPENHEIMER GLOBAL STRATEGIC INCOME FUND/VA
CONSOLIDATED STATEMENT OF OPERATIONSFor the Year EndedDecember 31, 2018
| | | | |
Allocation of Income and Expenses from Master Funds1 | | | | |
| Net investment income allocated from Oppenheimer Master Event-Linked Bond Fund, LLC: | | | | |
| Interest | | $ | 2,378,221 | |
| Dividends | | | 20,779 | |
| Net expenses | | | (147,112 | ) |
| Net investment income allocated from Oppenheimer Master Event-Linked Bond Fund, LLC | | | 2,251,888 | |
| Net investment income allocated from Oppenheimer Master Loan Fund, LLC | | | | |
| Interest | | | 12,180,676 | |
| Dividends | | | 260,299 | |
| Net expenses | | | (795,865 | ) |
| Net investment income allocated from Oppenheimer Master Loan Fund, LLC | | | 11,645,110 | |
| Total allocation of net investment income from master funds | | | 13,896,998 | |
Investment Income | | | | |
| Interest — unaffiliated companies (net of foreign withholding taxes of $636,862) | | | 72,289,122 | |
| Fee income on when-issued securities | | | 1,703,225 | |
| Dividends: | | | | |
| Unaffiliated companies | | | 1,239,002 | |
| Affiliated companies | | | 2,914,905 | |
| Total investment income | | | 78,146,254 | |
Expenses | | | | |
| Management fees | | | 9,817,868 | |
| Distribution and service plan fees — service shares | | | 2,994,145 | |
| Transfer and shareholder servicing agent fees: | | | | |
| Non-Service shares | | | 462,335 | |
| Service shares | | | 1,437,190 | |
| Shareholder communications: | | | | |
| Non-Service shares | | | 58,244 | |
| Service shares | | | 180,618 | |
| Custodian fees and expenses | | | 187,542 | |
| Trustees’ compensation | | | 58,693 | |
| Borrowing fees | | | 51,162 | |
| Other | | | 655,366 | |
| Total expenses | | | 15,903,163 | |
| Less reduction to custodian expenses | | | (6,761 | ) |
| Less waivers and reimbursements of expenses | | | (1,094,392 | ) |
| Net expenses | | | 14,802,010 | |
Net Investment Income | | | 77,241,242 | |
38 OPPENHEIMER GLOBAL STRATEGIC INCOME FUND/VA
| | | | |
| Realized and Unrealized Gain (Loss) | | | | |
| Net realized gain (loss) on: | | | | |
| Investment transactions in: | | | | |
Unaffiliated companies (net of foreign capital gains tax of $63,121) | | $ | (36,366,957 | ) |
Affiliated companies | | | (170,400 | ) |
| Option contracts written | | | (10,098,095 | ) |
| Futures contracts | | | (4,393,486 | ) |
| Foreign currency transactions | | | (563,751 | ) |
| Forward currency exchange contracts | | | 12,345,407 | |
| Swap contracts | | | 121,196 | |
| Swaption contracts written | | | 6,029,807 | |
| Net realized gain (loss) allocated from: | | | | |
| Oppenheimer Master Event-Linked Bond Fund, LLC | | | (723,081 | ) |
| Oppenheimer Master Loan Fund, LLC | | | 3,277,211 | |
| Net realized loss | | | (30,542,149 | ) |
| Net change in unrealized appreciation/(depreciation) on: | | | | |
| Investment transactions in: | | | | |
Unaffiliated companies | | | (96,495,492 | ) |
Affiliated companies | | | (185,130 | ) |
| Translation of assets and liabilities denominated in foreign currencies | | | 191,463 | |
| Forward currency exchange contracts | | | (3,914,697 | ) |
| Futures contracts | | | (2,143,659 | ) |
| Option contracts written | | | 2,455,973 | |
| Swap contracts | | | 686,096 | |
| Swaption contracts written | | | (7,729,374 | ) |
| Net change in unrealized appreciation/(depreciation) allocated from: | | | | |
| Oppenheimer Master Event-Linked Bond Fund, LLC | | | (1,408,559 | ) |
| Oppenheimer Master Loan Fund, LLC | | | (11,799,913 | ) |
| Net change in unrealized appreciation/(depreciation) | | | (120,343,292 | ) |
Net Decrease in Net Assets Resulting from Operations | | $ | (73,644,199 | ) |
| | | | |
1. The Fund invests in certain affiliated mutual funds that expect to be treated as partnerships for tax purposes. See Note 4 of the accompanying Consolidated Notes.
See accompanying Notes to Consolidated Financial Statements.
39 OPPENHEIMER GLOBAL STRATEGIC INCOME FUND/VA
CONSOLIDATED STATEMENTS OF CHANGES IN NET ASSETS
| | | | | | | | |
| | | Year Ended | | Year Ended |
| | | December 31, 2018 | | December 31, 20171 |
| Operations | | | | | | | | |
| Net investment income | | $ | 77,241,242 | | | $ | 71,440,901 | |
| Net realized gain (loss) | | | (30,542,149 | ) | | | 6,249,553 | |
| Net change in unrealized appreciation/(depreciation) | | | (120,343,292 | ) | | | 22,696,681 | |
| Net increase (decrease) in net assets resulting from operations | | | (73,644,199 | ) | | | 100,387,135 | |
| Dividends and/or Distributions to Shareholders | | | | | | | | |
| Dividends and distributions declared: | | | | | | | | |
| Non-Service shares | | | (18,866,160 | ) | | | (9,178,475 | ) |
| Service shares | | | (54,450,673 | ) | | | (25,692,448 | ) |
| Total dividends and distributions declared | | | (73,316,833 | ) | | | (34,870,923 | ) |
| Beneficial Interest Transactions | | | | | | | | |
| Net decrease in net assets resulting from beneficial interest transactions: | | | | | | | | |
| Non-Service shares | | | (10,549,208 | ) | | | (23,313,057 | ) |
| Service shares | | | (84,976,296 | ) | | | (56,507,178 | ) |
| Total beneficial interest transactions | | | (95,525,504 | ) | | | (79,820,235 | ) |
| Net Assets | | | | | | | | |
| Total decrease | | | (242,486,536 | ) | | | (14,304,023 | ) |
| Beginning of period | | | 1,671,026,068 | | | | 1,685,330,091 | |
| End of period | | $ | 1,428,539,532 | | | $ | 1,671,026,068 | |
| | | | | | | | |
1. Prior period amounts have been conformed to current year presentation. See Notes to Consolidated Financial Statements, Note 2– New Accounting Pronouncements for further details.
See accompanying Notes to Consolidated Financial Statements.
40 OPPENHEIMER GLOBAL STRATEGIC INCOME FUND/VA
CONSOLIDATED FINANCIAL HIGHLIGHTS
| | | | | | | | | | | | | | | | | | | | |
| Non-Service Shares | | Year Ended
December 31,
2018 | | | Year Ended
December 31,
2017 | | | Year Ended
December 31,
2016 | | | Year Ended
December 31,
2015 | | | Year Ended
December 31,
2014 | |
| Per Share Operating Data | | | | | | | | | | | | | | | | | | | | |
| Net asset value, beginning of period | | | $5.13 | | | | $4.94 | | | | $4.88 | | | | $5.30 | | | | $5.38 | |
| Income (loss) from investment operations: | | | | | | | | | | | | | | | | | | | | |
| Net investment income1 | | | 0.25 | | | | 0.22 | | | | 0.20 | | | | 0.23 | | | | 0.26 | |
| Net realized and unrealized gain (loss) | | | (0.47) | | | | 0.09 | | | | 0.11 | | | | (0.34) | | | | (0.11) | |
| Total from investment operations | | | (0.22) | | | | 0.31 | | | | 0.31 | | | | (0.11) | | | | 0.15 | |
| Dividends and/or distributions to shareholders: | | | | | | | | | | | | | | | | | | | | |
| Dividends from net investment income | | | (0.25) | | | | (0.12) | | | | (0.25) | | | | (0.31) | | | | (0.23) | |
| Net asset value, end of period | | | $4.66 | | | | $5.13 | | | | $4.94 | | | | $4.88 | | | | $5.30 | |
| | | | | | | | | | | | | | | | | | | | |
| | | | | | | | | | | | | | | | | | | | |
| Total Return, at Net Asset Value2 | | | (4.40)% | | | | 6.27% | | | | 6.53% | | | | (2.26)% | | | | 2.84% | |
| | | | | | | | | | | | | | | | | | | | |
| Ratios/Supplemental Data | | | | | | | | | | | | | | | | | | | | |
| Net assets, end of period (in thousands) | | | $346,707 | | | | $393,337 | | | | $401,308 | | | | $429,710 | | | | $586,951 | |
| Average net assets (in thousands) | | | $385,157 | | | | $400,945 | | | | $416,054 | | | | $510,765 | | | | $707,673 | |
| Ratios to average net assets:3,4 | | | | | | | | | | | | | | | | | | | | |
| Net investment income | | | 5.07% | | | | 4.40% | | | | 4.00% | | | | 4.51% | | | | 4.73% | |
| Expenses excluding specific expenses listed below | | | 0.88% | | | | 0.82% | | | | 0.79% | | | | 0.76% | | | | 0.74% | |
| Interest and fees from borrowings | | | 0.00%5 | | | | 0.00%5 | | | | 0.00%5 | | | | 0.00%5 | | | | 0.00% | |
| Total expenses6 | | | 0.88% | | | | 0.82% | | | | 0.79% | | | | 0.76% | | | | 0.74% | |
| Expenses after payments, waivers and/or reimbursements and reduction to custodian expenses | | | 0.81% | | | | 0.76% | | | | 0.74% | | | | 0.73% | | | | 0.71% | |
| Portfolio turnover rate7 | | | 68% | | | | 74% | | | | 80% | | | | 79% | | | | 93% | |
1. Per share amounts calculated based on the average shares outstanding during the period.
2. Assumes an initial investment on the business day before the first day of the fiscal period, with all dividends and distributions reinvested in additional shares on the reinvestment date, and redemption at the net asset value calculated on the last business day of the fiscal period. Total returns are not annualized for periods less than one full year. Total return information does not reflect expenses that apply at the separate account level or to related insurance products. Inclusion of these charges would reduce the total return figures for all periods shown. Returns do not reflect the deduction of taxes that a shareholder would pay on fund distributions or the redemption of fund shares.
3. Annualized for periods less than one full year.
4. Includes the Fund’s share of the allocated expenses and/or net investment income from the master funds.
5. Less than 0.005%.
6. Total expenses including indirect expenses from affiliated fund fees and expenses were as follows:
| | | | | | |
| Year Ended December 31, 2018 | | | 0.90 | % | | |
| Year Ended December 31, 2017 | | | 0.83 | % | | |
| Year Ended December 31, 2016 | | | 0.80 | % | | |
| Year Ended December 31, 2015 | | | 0.77 | % | | |
| Year Ended December 31, 2014 | | | 0.75 | % | | |
7. The portfolio turnover rate excludes purchase and sale transactions of To Be Announced (TBA) mortgage-related securities as follows:
| | | | | | | | |
| | | Purchase Transactions | | | Sale Transactions | |
| Year Ended December 31, 2018 | | | $2,370,164,194 | | | | $2,399,236,376 | |
| Year Ended December 31, 2017 | | | $2,271,944,419 | | | | $2,153,905,799 | |
| Year Ended December 31, 2016 | | | $1,798,210,272 | | | | $1,766,445,159 | |
| Year Ended December 31, 2015 | | | $1,225,140,927 | | | | $1,266,426,777 | |
| Year Ended December 31, 2014 | | | $1,348,552,640 | | | | $1,337,346,996 | |
See accompanying Notes to Consolidated Financial Statements.
41 OPPENHEIMER GLOBAL STRATEGIC INCOME FUND/VA
CONSOLIDATED FINANCIAL HIGHLIGHTSContinued
| | | | | | | | | | | | | | | | | | | | |
| Service Shares | | Year Ended
December 31,
2018 | | | Year Ended
December 31,
2017 | | | Year Ended
December 31,
2016 | | | Year Ended
December 31,
2015 | | | Year Ended
December 31,
2014 | |
| Per Share Operating Data | | | | | | | | | | | | | | | | | | | | |
| Net asset value, beginning of period | | | $5.27 | | | | $5.07 | | | | $5.00 | | | | $5.42 | | | | $5.50 | |
| Income (loss) from investment operations: | | | | | | | | | | | | | | | | | | | | |
| Net investment income1 | | | 0.24 | | | | 0.22 | | | | 0.19 | | | | 0.23 | | | | 0.25 | |
| Net realized and unrealized gain (loss) | | | (0.48) | | | | 0.08 | | | | 0.12 | | | | (0.35) | | | | (0.11) | |
| Total from investment operations | | | (0.24) | | | | 0.30 | | | | 0.31 | | | | (0.12) | | | | 0.14 | |
| Dividends and/or distributions to shareholders: | | | | | | | | | | | | | | | | | | | | |
| Dividends from net investment income | | | (0.23) | | | | (0.10) | | | | (0.24) | | | | (0.30) | | | | (0.22) | |
| Net asset value, end of period | | | $4.80 | | | | $5.27 | | | | $5.07 | | | | $5.00 | | | | $5.42 | |
| | | | | | | | | | | | | | | | | | | | |
| | | | | | | | | | | | | | | | | | | | |
| Total Return, at Net Asset Value2 | | | (4.54)% | | | | 6.04% | | | | 6.27% | | | | (2.49)% | | | | 2.49% | |
| | | | | | | | | | | | | | | | | | | | |
| Ratios/Supplemental Data | | | | | | | | | | | | | | | | | | | | |
| Net assets, end of period (in thousands) | | | $1,081,833 | | | | $1,277,689 | | | | $1,284,022 | | | | $1,375,143 | | | | $1,551,247 | |
| Average net assets (in thousands) | | | $1,196,988 | | | | $1,295,999 | | | | $1,332,343 | | | | $1,496,350 | | | | $1,646,615 | |
| Ratios to average net assets:3,4 | | | | | | | | | | | | | | | | | | | | |
| Net investment income | | | 4.82% | | | | 4.15% | | | | 3.75% | | | | 4.26% | | | | 4.48% | |
| Expenses excluding specific expenses listed below | | | 1.13% | | | | 1.07% | | | | 1.04% | | | | 1.01% | | | | 0.99% | |
| Interest and fees from borrowings | | | 0.00%5 | | | | 0.00%5 | | | | 0.00%5 | | | | 0.00%5 | | | | 0.00% | |
| Total expenses6 | | | 1.13% | | | | 1.07% | | | | 1.04% | | | | 1.01% | | | | 0.99% | |
| Expenses after payments, waivers and/or reimbursements and reduction to custodian expenses | | | 1.06% | | | | 1.01% | | | | 0.99% | | | | 0.98% | | | | 0.96% | |
| Portfolio turnover rate7 | | | 68% | | | | 74% | | | | 80% | | | | 79% | | | | 93% | |
1. Per share amounts calculated based on the average shares outstanding during the period.
2. Assumes an initial investment on the business day before the first day of the fiscal period, with all dividends and distributions reinvested in additional shares on the reinvestment date, and redemption at the net asset value calculated on the last business day of the fiscal period. Total returns are not annualized for periods less than one full year. Total return information does not reflect expenses that apply at the separate account level or to related insurance products. Inclusion of these charges would reduce the total return figures for all periods shown. Returns do not reflect the deduction of taxes that a shareholder would pay on fund distributions or the redemption of fund shares.
3. Annualized for periods less than one full year.
4. Includes the Fund’s share of the allocated expenses and/or net investment income from the master funds.
5. Less than 0.005%.
6. Total expenses including indirect expenses from affiliated fund fees and expenses were as follows:
| | | | | | |
| Year Ended December 31, 2018 | | | 1.15 | % | | |
| Year Ended December 31, 2017 | | | 1.08 | % | | |
| Year Ended December 31, 2016 | | | 1.05 | % | | |
| Year Ended December 31, 2015 | | | 1.02 | % | | |
| Year Ended December 31, 2014 | | | 1.00 | % | | |
7. The portfolio turnover rate excludes purchase and sale transactions of To Be Announced (TBA) mortgage-related securities as follows:
| | | | | | | | |
| | | Purchase Transactions | | | Sale Transactions | |
| Year Ended December 31, 2018 | | | $2,370,164,194 | | | | $2,399,236,376 | |
| Year Ended December 31, 2017 | | | $2,271,944,419 | | | | $2,153,905,799 | |
| Year Ended December 31, 2016 | | | $1,798,210,272 | | | | $1,766,445,159 | |
| Year Ended December 31, 2015 | | | $1,225,140,927 | | | | $1,266,426,777 | |
| Year Ended December 31, 2014 | | | $1,348,552,640 | | | | $1,337,346,996 | |
See accompanying Notes to Consolidated Financial Statements.
42 OPPENHEIMER GLOBAL STRATEGIC INCOME FUND/VA
NOTES TO CONSOLIDATED FINANCIAL STATEMENTSDecember 31, 2018
1. Organization
Oppenheimer Global Strategic Income Fund/VA (the “Fund”), a separate series of Oppenheimer Variable Account Funds, is a diversifiedopen-end management investment company registered under the Investment Company Act of 1940 (“1940 Act”), as amended. The Fund’s main investment objective is to seek total return. The Fund’s investment adviser is OFI Global Asset Management, Inc. (“OFI Global” or the “Manager”), a wholly-owned subsidiary of OppenheimerFunds, Inc. (“OFI” or the“Sub-Adviser”). The Manager has entered into asub-advisory agreement with OFI. Shares of the Fund are sold only to separate accounts of life insurance companies.
The Fund offers two classes of shares. Both classes are sold at their offering price, which is the net asset value per share, to separate investment accounts of participating insurance companies as an underlying investment for variable life insurance policies, variable annuity contracts or other investment products. The class of shares designated as Service shares is subject to a distribution and service plan. Both classes of shares have identical rights and voting privileges with respect to the Fund in general and exclusive voting rights on matters that affect that class alone. Earnings, net assets and net asset value per share may differ due to each class having its own expenses, such as transfer and shareholder servicing agent fees and shareholder communications, directly attributable to that class.
The following is a summary of significant accounting policies followed in the Fund’s preparation of financial statements in accordance with accounting principles generally accepted in the United States (“U.S. GAAP”).
2. Significant Accounting Policies
Security Valuation.All investments in securities are recorded at their estimated fair value, as described in Note 3.
Basis for Consolidation.The Fund has established a Cayman Islands exempted company, Oppenheimer Global Strategic Income Fund/VA (Cayman) Ltd.(the “Subsidiary”), which is wholly-owned and controlled by the Fund. The Fund and Subsidiary are both managed by the Manager. The Fund may invest up to 25% of its total assets in the Subsidiary. The Subsidiary invests primarily in Regulation S securities. The Fund applies its investment restrictions and compliance policies and procedures, on a look-through basis, to the Subsidiary.
The financial statements have been consolidated and include accounts of the Fund and the Subsidiary. Accordingly, all inter-company transactions and balances have been eliminated. At period end, the Fund owned 88,909 shares with net assets of $7,163,082 in the Subsidiary.
Other financial information at period end:
| | | | |
| Total market value of investments | | $ | 4,072,081 | |
| Net assets | | $ | 7,163,082 | |
| Net income (loss) | | $ | 36,663 | |
| Net realized gain (loss) | | $ | (306,519 | ) |
| Net change in unrealized appreciation/depreciation | | $ | (409,095 | ) |
Foreign Currency Translation.The books and records of the Fund are maintained in U.S. dollars. Any foreign currency amounts are translated into U.S. dollars on the following basis:
(1) Value of investment securities, other assets and liabilities — at the exchange rates prevailing at market close as described in Note 3.
(2) Purchases and sales of investment securities, income and expenses — at the rates of exchange prevailing on the respective dates of such transactions.
Although the net assets and the values are presented at the foreign exchange rates at market close, the Fund does not isolate the portion of the results of operations resulting from changes in foreign exchange rates on investments from the fluctuations arising from changes in prices of securities held. Such fluctuations are included with the net realized and unrealized gains or losses from investments shown in the Consolidated Statement of Operations.
For securities, which are subject to foreign withholding tax upon disposition, realized and unrealized gains or losses on such securities are recorded net of foreign withholding tax.
Reported net realized foreign exchange gains or losses arise from sales of foreign currencies, currency gains or losses realized between the trade and settlement dates on securities transactions, the difference between the amounts of dividends, interest, and foreign withholding tax reclaims recorded on the Fund’s books, and the U.S. dollar equivalent of the amounts actually received or paid. Net unrealized foreign exchange gains and losses arise from changes in the value of assets and liabilities other than investments in securities, resulting from changes in the exchange rate.
Allocation of Income, Expenses, Gains and Losses.Income, expenses (other than those attributable to a specific class), gains and losses are allocated on a daily basis to each class of shares based upon the relative proportion of net assets represented by such class. Operating expenses directly attributable to a specific class are charged against the operations of that class.
Dividends and Distributions to Shareholders. Dividends and distributions to shareholders, which are determined in accordance with income tax regulations and may differ from U.S. GAAP, are recorded on theex-dividend date. Income and capital gain distributions, if any, are declared and paid annually or at other times as determined necessary by the Manager.
Investment Income.Dividend income is recorded on theex-dividend date or uponex-dividend notification in the case of certain foreign dividends where theex-dividend date may have passed.Non-cash dividends included in dividend income, if any, are recorded at the fair value of the securities received. Withholding taxes on foreign dividends, if any, and capital gains taxes on foreign investments, if any, have been provided for in accordance with
43 OPPENHEIMER GLOBAL STRATEGIC INCOME FUND/VA
NOTES TO CONSOLIDATED FINANCIAL STATEMENTSContinued
2. Significant Accounting Policies (Continued)
the Fund’s understanding of the applicable tax rules and regulations. Interest income, if any, is recognized on an accrual basis. Discount and premium, which are included in interest income on the Consolidated Statement of Operations, are amortized or accreted daily.
Custodian Fees. “Custodian fees and expenses” in the Consolidated Statement of Operations may include interest expense incurred by the Fund on any cash overdrafts of its custodian account during the period. Such cash overdrafts may result from the effects of failed trades in portfolio securities and from cash outflows resulting from unanticipated shareholder redemption activity. The Fund pays interest to its custodian on such cash overdrafts, to the extent they are not offset by positive cash balances maintained by the Fund, at a rate equal to the Federal Funds Rate plus 2.00%. The “Reduction to custodian expenses” line item, if applicable, represents earnings on cash balances maintained by the Fund during the period. Such interest expense and other custodian fees may be paid with these earnings.
Security Transactions. Security transactions are recorded on the trade date. Realized gains and losses on securities sold are determined on the basis of identified cost.
Indemnifications.The Fund’s organizational documents provide current and former Trustees and officers with a limited indemnification against liabilities arising in connection with the performance of their duties to the Fund. In the normal course of business, the Fund may also enter into contracts that provide general indemnifications. The Fund’s maximum exposure under these arrangements is unknown as this would be dependent on future claims that may be made against the Fund. The risk of material loss from such claims is considered remote.
Federal Taxes.The Fund intends to comply with provisions of the Internal Revenue Code applicable to regulated investment companies and to distribute substantially all of its investment company taxable income, including any net realized gain on investments not offset by capital loss carryforwards, if any, to shareholders. Therefore, no federal income or excise tax provision is required. The Fund files income tax returns in U.S. federal and applicable state jurisdictions. The statute of limitations on the Fund’s tax return filings generally remains open for the three preceding fiscal reporting period ends. The Fund has analyzed its tax positions for the fiscal year ended December 31, 2018, including open tax years, and does not believe there are any uncertain tax positions requiring recognition in the Fund’s financial statements.
Subchapter M requires, among other things, that at least 90% of the Fund’s gross income be derived from securities or derived with respect to its business of investing in securities (typically referred to as “qualifying income”). Income from commodity-linked derivatives may not be treated as “qualifying income” for purposes of the 90% gross income requirement. The Internal Revenue Service (IRS) has previously issued a number of private letter rulings which conclude that income derived from commodity index-linked notes and investments in a wholly-owned subsidiary will be “qualifying income.” As a result, the Fund will gain exposure to commodities through commodity-linked notes and its wholly-owned subsidiary.
The IRS has suspended the granting of private letter rulings pending further review. As a result, there can be no assurance that the IRS will not change its position with respect to commodity-linked notes and wholly-owned subsidiaries. In addition, future legislation and guidance from the Treasury and the IRS may adversely affect the Fund’s ability to gain exposure to commodities through commodity-linked notes and its wholly-owned subsidiary.
The Fund is required to include in income for federal income tax purposes all of the subsidiary’s net income and gains whether or not such income is distributed by the subsidiary. Net income and gains from the subsidiary are generally treated as ordinary income by the Fund, regardless of the character of the subsidiary’s underlying income. Net losses from the subsidiary do not pass through to the Fund for federal income tax purposes.
The tax components of capital shown in the following table represent distribution requirements the Fund must satisfy under the income tax regulations, losses the Fund may be able to offset against income and gains realized in future years and unrealized appreciation or depreciation of securities and other investments for federal income tax purposes.
| | | | | | | | | | | | |
Undistributed Net Investment Income | | Undistributed
Long-Term
Gain | | | Accumulated
Loss
Carryforward1,2,3,4 | | | Net Unrealized
Depreciation
Based on cost of
Securities and
Other Investments
for Federal Income
Tax Purposes | |
| $51,756,881 | | | $— | | | | $174,013,686 | | | | $96,120,115 | |
1.At period end, the Fund had $173,076,585 of net capital loss carryforward available to offset future realized capital gains, if any, and thereby reduce future taxable gain distributions.
2. The Fund has $937,101 of straddle losses which were deferred.
3. During the reporting period, the Fund did not utilize any capital loss carryforward.
4.During the previous reporting period, the Fund utilized $3,016,001 of capital loss carryforward to offset capital gains realized in that fiscal year.
Net investment income (loss) and net realized gain (loss) may differ for financial statement and tax purposes. The character of dividends and distributions made during the fiscal year from net investment income or net realized gains are determined in accordance with federal income tax requirements, which may differ from the character of net investment income or net realized gains presented in those financial statements in accordance with U.S. GAAP. Also, due to timing of dividends and distributions, the fiscal year in which amounts are distributed may differ from the fiscal year in which the income or net realized gain was recorded by the Fund.
Accordingly, the following amounts have been reclassified for the reporting period. Net assets of the Fund were unaffected by the reclassifications.
44 OPPENHEIMER GLOBAL STRATEGIC INCOME FUND/VA
2. Significant Accounting Policies (Continued)
| | | | |
Increase toPaid-in Capital | | Increase to
Accumulated Net
Loss | |
| $132 | | | $132 | |
The tax character of distributions paid during the reporting periods:
| | | | | | | | |
| | | Year Ended
December 31, 2018 | | | Year Ended
December 31, 2017 | |
| Distributions paid from: | | | | | | | | |
| Ordinary income | | $ | 73,316,833 | | | $ | 34,870,923 | |
The aggregate cost of securities and other investments and the composition of unrealized appreciation and depreciation of securities and other investments for federal income tax purposes at period end are noted in the following table. The primary difference between book and tax appreciation or depreciation of securities and other investments, if applicable, is attributable to the tax deferral of losses or tax realization of financial statement unrealized gain or loss.
| | | | |
| Federal tax cost of securities | | $ | 1,674,141,574 | |
| Federal tax cost of other investments | | | (181,945,254 | ) |
| | | | |
| Total federal tax cost | | $ | 1,492,196,320 | |
| | | | |
| Gross unrealized appreciation | | $ | 59,297,790 | |
| Gross unrealized depreciation | | | (155,417,905 | ) |
| | | | |
| Net unrealized depreciation | | $ | (96,120,115 | ) |
| | | | |
Use of Estimates. The preparation of financial statements in conformity with U.S. GAAP requires management to make estimates and assumptions that affect the reported amounts of assets and liabilities and disclosure of contingent assets and liabilities at the date of the financial statements and the reported amounts of increases and decreases in net assets from operations during the reporting period. Actual results could differ from those estimates.
New Accounting Pronouncements. In March 2017, Financial Accounting Standards Board (“FASB”) issued Accounting Standards Update (“ASU”), ASU2017-08. This provides guidance related to the amortization period for certain purchased callable debt securities held at a premium. The ASU is effective for annual periods beginning after December 15, 2018, and interim periods within those annual periods. The Manager has evaluated the impacts of these changes on the financial statements and there are no material impacts.
During August 2018, the Securities and Exchange Commission (the “SEC”) issued Final Rule ReleaseNo. 33-10532 (the “Rule”), Disclosure Update and Simplification. The rule amends certain financial statement disclosure requirements to conform to U.S. GAAP. The amendments to Rule6-04.17 of RegulationS-X (balance sheet) remove the requirement to separately state the book basis components of net assets: undistributed (over-distribution of) net investment income (“UNII”), accumulated undistributed net realized gains (losses), and net unrealized appreciation (depreciation) at the balance sheet date. Instead, consistent with U.S. GAAP, funds will be required to disclose total distributable earnings. The amendments to Rule6-09 of RegulationS-X (statement of changes in net assets) remove the requirement to separately state the sources of distributions paid. Instead, consistent with U.S. GAAP, funds will be required to disclose the total amount of distributions paid, except that any tax return of capital must be separately disclosed. The amendments also remove the requirement to parenthetically state the book basis amount of UNII on the statement of changes in net assets. The requirements of the Rule are effective November 5, 2018, and the Funds’ Consolidated Statement of Assets and Liabilities and Consolidated Statement of Changes in Net Assets for the current reporting period have been modified accordingly. In addition, certain amounts within each Fund’s Consolidated Statement of Changes in Net Assets for the prior fiscal period have been modified to conform to the Rule.
3. Securities Valuation
The Fund calculates the net asset value of its shares as of 4:00 P.M. Eastern Time, on each day the New York Stock Exchange (the “Exchange” or “NYSE”) is open for trading, except in the case of a scheduled early closing of the Exchange, in which case the Fund will calculate net asset value of the shares as of the scheduled early closing time of the Exchange.
The Fund’s Board has adopted procedures for the valuation of the Fund’s securities and has delegated theday-to-day responsibility for valuation determinations under those procedures to the Manager. The Manager has established a Valuation Committee which is responsible for determining a fair valuation for any security for which market quotations are not readily available. The Valuation Committee’s fair valuation determinations are subject to review, approval and ratification by the Fund’s Board at least quarterly or more frequently, if necessary.
Valuation Methods and Inputs
Securities are valued primarily using unadjusted quoted market prices, when available, as supplied by third party pricing services or broker-dealers.
The following methodologies are used to determine the market value or the fair value of the types of securities described below:
Equity securities traded on a securities exchange (including exchange-traded derivatives other than futures and futures options) are valued based on the official closing price on the principal exchange on which the security is traded, as identified by the Manager, prior to the time when the Fund’s assets
45 OPPENHEIMER GLOBAL STRATEGIC INCOME FUND/VA
NOTES TO CONSOLIDATED FINANCIAL STATEMENTSContinued
3. Securities Valuation (Continued)
are valued. If the official closing price is unavailable, the security is valued at the last sale price on the principal exchange on which it is traded, or if no sales occurred, the security is valued at the mean between the quoted bid and asked prices.Over-the-counter equity securities are valued at the last published sale price, or if no sales occurred, at the mean between the quoted bid and asked prices. Events occurring after the close of trading on foreign exchanges may result in adjustments to the valuation of foreign securities to more accurately reflect their fair value as of the time when the Fund’s assets are valued.
Shares of a registered investment company that are not traded on an exchange are valued at that investment company’s net asset value per share.
Corporate and government debt securities (of U.S. or foreign issuers) and municipal debt securities, short-term notes, mortgage-backed securities, collateralized mortgage obligations, and asset-backed securities are valued at the mean between the bid and asked prices utilizing evaluated prices obtained from third party pricing services or broker-dealers who may use matrix pricing methods to determine the evaluated prices. Pricing services generally price debt securities assuming orderly transactions of an institutional “round lot” size, but some trades may occur in smaller, “odd lot” sizes, sometimes at lower prices than institutional round lot trades. Standard inputs generally considered by third-party pricing vendors include reported trade data, broker-dealer price quotations, benchmark yields, issuer spreads on comparable securities, the credit quality, yield, maturity, as well as other appropriate factors.
Loans are valued at the mean between the bid and asked prices utilizing evaluated prices obtained from third party pricing services or broker-dealers. Standard inputs generally considered by third-party pricing vendors include information obtained from market participants regarding broker-dealer price quotations.
Structured securities, swaps, swaptions, and otherover-the-counter derivatives are valued utilizing evaluated prices obtained from third party pricing services or broker-dealers. Standard inputs generally considered by third-party pricing vendors include market information relevant to the underlying reference asset such as the price of financial instruments, stock market indices, foreign currencies, interest rate spreads, commodities, credit spreads, credit event probabilities, index values, individual security values, forward interest rates, variable interest rates, volatility measures, and forward currency rates, or the occurrence of other specific events.
Forward foreign currency exchange contracts are valued utilizing current and forward currency rates obtained from third party pricing services. When the settlement date of a contract is an interim date for which a quotation is not available, interpolated values are derived using the nearest dated forward currency rate.
Futures contracts and futures options traded on a commodities or futures exchange will be valued at the final settlement price or official closing price on the principal exchange as reported by such principal exchange at its trading session ending at, or most recently prior to, the time when the Fund’s assets are valued.
Securities for which market quotations are not readily available, or when a significant event has occurred that would materially affect the value of the security, are fair valued either (i) by a standardized fair valuation methodology applicable to the security type or the significant event as previously approved by the Valuation Committee and the Fund’s Board or (ii) as determined in good faith by the Manager’s Valuation Committee. The Valuation Committee considers all relevant facts that are reasonably available, through either public information or information available to the Manager, when determining the fair value of a security. Those standardized fair valuation methodologies include, but are not limited to, valuing securities at the last sale price or initially at cost and subsequently adjusting the value based on: changes in company specific fundamentals, changes in an appropriate securities index, or changes in the value of similar securities which may be further adjusted for any discounts related to security-specific resale restrictions. When possible, such methodologies use observable market inputs such as unadjusted quoted prices of similar securities, observable interest rates, currency rates and yield curves. The methodologies used for valuing securities are not necessarily an indication of the risks associated with investing in those securities nor can it be assured that the Fund can obtain the fair value assigned to a security if it were to sell the security.
To assess the continuing appropriateness of security valuations, the Manager regularly compares prior day prices and sale prices to the current day prices and challenges those prices exceeding certain tolerance levels with the third party pricing service or broker source. For those securities valued by fair valuations, whether through a standardized fair valuation methodology or a fair valuation determination, the Valuation Committee reviews and affirms the reasonableness of the valuations based on such methodologies and fair valuation determinations on a regular basis after considering all relevant information that is reasonably available.
Classifications
Each investment asset or liability of the Fund is assigned a level at measurement date based on the significance and source of the inputs to its valuation. Various data inputs may be used in determining the value of each of the Fund’s investments as of the reporting period end. These data inputs are categorized in the following hierarchy under applicable financial accounting standards:
1) Level1-unadjusted quoted prices in active markets for identical assets or liabilities (including securities actively traded on a securities exchange)
2) Level2-inputs other than unadjusted quoted prices that are observable for the asset or liability (such as unadjusted quoted prices for similar assets and market corroborated inputs such as interest rates, prepayment speeds, credit risks, etc.)
3) Level3-significant unobservable inputs (including the Manager’s own judgments about assumptions that market participants would use in pricing the asset or liability).
The inputs used for valuing securities are not necessarily an indication of the risks associated with investing in those securities.
The Fund classifies each of its investments in investment companies which are publicly offered as Level 1. Investment companies that are not publicly offered, if any, are classified as Level 2 in the fair value hierarchy.
46 OPPENHEIMER GLOBAL STRATEGIC INCOME FUND/VA
3. Securities Valuation (Continued)
The table below categorizes amounts that are included in the Fund’s Consolidated Statement of Assets and Liabilities at period end based on valuation input level:
| | | | | | | | | | | | | | | | |
| | | Level 1— Unadjusted Quoted Prices | | | Level 2— Other Significant
Observable Inputs | | | Level 3— Significant
Unobservable
Inputs | | | Value |
Assets Table | | | | | | | | | | | | | | | | |
Investments, at Value: | | | | | | | | | | | | | | | | |
| Asset-Backed Securities | | $ | — | | | $ | 33,051,502 | | | $ | — | | | $ | 33,051,502 | |
| Mortgage-Backed Obligations | | | — | | | | 299,079,357 | | | | — | | | | 299,079,357 | |
| Foreign Government Obligations | | | — | | | | 288,046,695 | | | | — | | | | 288,046,695 | |
| Corporate Loans | | | — | | | | 5,758,325 | | | | — | | | | 5,758,325 | |
| Corporate Bonds and Notes | | | — | | | | 590,739,847 | | | | 26,602 | | | | 590,766,449 | |
| Preferred Stocks | | | 18,300,698 | | | | — | | | | — | | | | 18,300,698 | |
| Common Stocks | | | 2,127,421 | | | | — | | | | 38,084 | | | | 2,165,505 | |
| Rights, Warrants and Certificates | | | — | | | | — | | | | 87,664 | | | | 87,664 | |
| Structured Securities | | | — | | | | 7,163,861 | | | | 74,171 | | | | 7,238,032 | |
| Short-Term Notes | | | — | | | | 19,060,220 | | | | — | | | | 19,060,220 | |
| Investment Companies | | | 130,682,591 | | | | 174,767,262 | | | | — | | | | 305,449,853 | |
| Over-the-Counter Options Purchased | | | — | | | | 6,580,809 | | | | — | | | | 6,580,809 | |
| Over-the-Counter Interest Rate Swaptions Purchased | | | — | | | | 5,554,772 | | | | — | | | | 5,554,772 | |
| Total Investments, at Value | | | 151,110,710 | | | | 1,429,802,650 | | | | 226,521 | | | | 1,581,139,881 | |
| | | | |
Other Financial Instruments: | | | | | | | | | | | | | | | | |
| Swaps, at value | | | — | | | | 484,080 | | | | — | | | | 484,080 | |
| Centrally cleared swaps, at value | | | — | | | | 6,083,709 | | | | — | | | | 6,083,709 | |
| Futures contracts | | | 1,356,330 | | | | — | | | | — | | | | 1,356,330 | |
| Forward currency exchange contracts | | | — | | | | 7,416,073 | | | | — | | | | 7,416,073 | |
| | | | |
| Total Assets | | $ | 152,467,040 | | | $ | 1,443,786,512 | | | $ | 226,521 | | | $ | 1,596,480,073 | |
| | | | |
| | | | |
Liabilities Table | | | | | | | | | | | | | | | | |
Other Financial Instruments: | | | | | | | | | | | | | | | | |
| Swaps, at value | | $ | — | | | $ | (3,020,734 | ) | | $ | — | | | $ | (3,020,734) | |
| Centrally cleared swaps, at value | | | — | | | | (2,173,976 | ) | | | — | | | | (2,173,976) | |
| Options written, at value | | | — | | | | (11,315,501 | ) | | | — | | | | (11,315,501) | |
| Futures contracts | | | (2,543,981 | ) | | | — | | | | — | | | | (2,543,981) | |
| Forward currency exchange contracts | | | — | | | | (12,515,690 | ) | | | — | | | | (12,515,690) | |
| Swaptions written, at value | | | — | | | | (16,191,918 | ) | | | — | | | | (16,191,918) | |
| | | | |
| Total Liabilities | | $ | (2,543,981 | ) | | $ | (45,217,819 | ) | | $ | — | | | | $ (47,761,800) | |
| | | | |
Forward currency exchange contracts and futures contracts, if any, are reported at their unrealized appreciation/depreciation at measurement date, which represents the change in the contract’s value from trade date. All additional assets and liabilities included in the above table are reported at their market value at measurement date.
The table below shows the transfers between Level 2 and Level 3. The Fund’s policy is to recognize transfers in and transfers out as of the beginning of the reporting period.
| | | | | | | | | | | | | | | | |
| | | Transfers into Level 2* | | | Transfers out of Level 2** | | | Transfers into Level 3** | | | Transfers out of Level 3* |
Assets Table | | | | | | | | | | | | | | | | |
Investments, at Value: | | | | | | | | | | | | | | | | |
| Mortgage-Backed Obligations | | $ | 51,559 | | | $ | – | | | $ | – | | | $ | (51,559) | |
| Common Stocks | | | – | | | | (39,045 | ) | | | 39,045 | | |
| –
|
|
| Rights, Warrants and Certificates | | | – | | | | (21,067 | ) | | | 21,067 | | | | – | |
| | | | |
| Total Assets | | $ | 51,559 | | | $ | (60,112 | ) | | $ | 60,112 | | | $ | (51,559) | |
| | | | |
*Transferred from Level 3 to Level 2 due to the availability of market data for this security.
**Transferred from Level 2 to Level 3 because of the lack of observable market data due to a decrease in market activity for these securities.
4. Investments and Risks
Risks of Foreign Investing.The Fund may invest in foreign securities which are subject to special risks. Securities traded in foreign markets may be less liquid and more volatile than those traded in U.S. markets. Foreign issuers are usually not subject to the same accounting and disclosure requirements that U.S. companies are subject to, which may make it difficult for the Fund to evaluate a foreign company’s operations or financial condition. A change in the value of a foreign currency against the U.S. dollar will result in a change in the U.S. dollar value of investments denominated in that foreign currency and in the value of any income or distributions the Fund may receive on those investments. The value of foreign investments may be affected by exchange control regulations, foreign taxes, higher transaction and other costs, delays in the settlement of transactions, changes in economic or monetary policy in the United States or abroad, expropriation or nationalization of a company’s assets, or other political and economic
47 OPPENHEIMER GLOBAL STRATEGIC INCOME FUND/VA
NOTES TO CONSOLIDATED FINANCIAL STATEMENTSContinued
4. Investments and Risks (Continued)
factors. In addition, due to the inter-relationship of global economies and financial markets, changes in political and economic factors in one country or region could adversely affect conditions in another country or region. Investments in foreign securities may also expose the Fund to time-zone arbitrage risk. Foreign securities may trade on weekends or other days when the Fund does not price its shares. At times, the Fund may emphasize investments in a particular country or region and may be subject to greater risks from adverse events that occur in that country or region. Foreign securities and foreign currencies held in foreign banks and securities depositories may be subject to limited or no regulatory oversight.
Investments in Affiliated Funds. The Fund is permitted to invest in other mutual funds advised by the Manager (“Affiliated Funds”). Affiliated Funds are management investment companies registered under the 1940 Act, as amended. The Manager is the investment adviser of, and theSub-Adviser provides investment and related advisory services to, the Affiliated Funds. When applicable, the Fund’s investments in Affiliated Funds are included in the Consolidated Statement of Investments. Shares of Affiliated Funds are valued at their net asset value per share. As a shareholder, the Fund is subject to its proportional share of the Affiliated Funds’ expenses, including their management fee. The Manager will waive fees and/or reimburse Fund expenses in an amount equal to the indirect management fees incurred through the Fund’s investment in the Affiliated Funds.
Each of the Affiliated Funds in which the Fund invests has its own investment risks, and those risks can affect the value of the Fund’s investments and therefore the value of the Fund’s shares. To the extent that the Fund invests more of its assets in one Affiliated Fund than in another, the Fund will have greater exposure to the risks of that Affiliated Fund.
Investments in Money Market Instruments.The Fund is permitted to invest its free cash balances in money market instruments to provide liquidity or for defensive purposes. The Fund may invest in money market instruments by investing in Class E shares of Oppenheimer Institutional Government Money Market Fund (“IGMMF”), which is an Affiliated Fund. IGMMF is regulated as a money market fund under the 1940 Act, as amended. The Fund may also invest in money market instruments directly or in other affiliated or unaffiliated money market funds.
Investment in Oppenheimer Master Funds.The Fund is permitted to invest in entities sponsored and/or advised by the Manager or an affiliate. Certain of these entities in which the Fund invests are mutual funds registered under the 1940 Act, as amended, that expect to be treated as partnerships for tax purposes, specifically Oppenheimer Master Loan Fund, LLC (“Master Loan”) and Oppenheimer Master Event-Linked Bond Fund, LLC (“Master Event-Linked Bond”) (the “Master Funds”). Each Master Fund has its own investment risks, and those risks can affect the value of the Fund’s investments and therefore the value of the Fund’s shares. To the extent that the Fund invests more of its assets in one Master Fund than in another, the Fund will have greater exposure to the risks of that Master Fund.
The investment objective of Master Loan is to seek income. The investment objective of Master Event-Linked Bond is to seek total return. The Fund’s investments in the Master Funds are included in the Consolidated Statement of Investments. The Fund recognizes income and gain/(loss) on its investments in each Master Fund according to its allocatedpro-rata share, based on its relative proportion of total outstanding Master Fund shares held, of the total net income earned and the net gain/(loss) realized on investments sold by the Master Funds. As a shareholder, the Fund is subject to its proportional share of the Master Funds’ expenses, including their management fee. The Manager will waive fees and/or reimburse Fund expenses in an amount equal to the indirect management fees incurred through the Fund’s investment in the Master Funds. The Fund owns 13.4% of Master Loan and 8.4% of Master Event-Linked Bond at period end.
Structured Securities.The Fund invests in structured securities whose market values, interest rates and/or redemption prices are linked to the performance of underlying foreign currencies, interest rate spreads, stock market indices, prices of individual securities, commodities or other financial instruments or the occurrence of other specific events. The structured securities are often leveraged, increasing the volatility of each note’s market value relative to the change in the underlying linked financial element or event. Fluctuations in value of these securities are recorded as unrealized gains and losses in the accompanying Consolidated Statement of Operations. The Fund records a realized gain or loss when a structured security is sold or matures.
Loans.The Fund invests in loans made to U.S. and foreign borrowers that are corporations, partnerships or other business entities. The Fund will do so directly as an original lender or by assignment or indirectly through participation agreements or certain derivative instruments. While many of these loans will be collateralized, the Fund can also invest in uncollateralized loans. Loans are often issued in connection with recapitalizations, acquisitions, leveraged buyouts, and refinancing of borrowers. The loans often pay interest at rates that float above (or are adjusted periodically based on) a benchmark that reflects current interest rates although the Fund can also invest in loans with fixed interest rates.
When investing in loans, the Fund generally will have a contractual relationship only with the lender, not with the relevant borrower. As a result, the Fund generally will have the right to receive payments of principal, interest, and any fees to which it is entitled only from the lender selling the participation and only upon receipt by the lender of the payments from the relevant borrower. The Fund may not directly benefit from the collateral supporting the debt obligation in which it has purchased the participation. As a result, the Fund will assume the credit risk of both the borrower and the institution selling the participation to the Fund.
Securities on a When-Issued or Delayed Delivery Basis.The Fund may purchase securities on a “when-issued” basis, and may purchase or sell securities on a “delayed delivery” basis. “When-issued” or “delayed delivery” refers to securities whose terms and indenture are available and for which a market exists, but which are not available for immediate delivery. Delivery and payment for securities that have been purchased by the Fund on a when-issued basis normally takes place within six months and possibly as long as two years or more after the trade date. During this period, such securities do not earn interest, are subject to market fluctuation and may increase or decrease in value prior to their delivery. The purchase of securities
48 OPPENHEIMER GLOBAL STRATEGIC INCOME FUND/VA
4. Investments and Risks (Continued)
on a when-issued basis may increase the volatility of the Fund’s net asset value to the extent the Fund executes such transactions while remaining substantially fully invested. When the Fund engages in when-issued or delayed delivery transactions, it relies on the buyer or seller, as the case may be, to complete the transaction. Their failure to do so may cause the Fund to lose the opportunity to obtain or dispose of the security at a price and yield it considers advantageous. The Fund may also sell securities that it purchased on a when-issued basis or forward commitment prior to settlement of the original purchase.
At period end, the Fund had purchased securities issued on a when-issued or delayed delivery basis and sold securities issued on a delayed delivery basis as follows:
| | | | |
| | | When-Issued or
Delayed Delivery
Basis Transactions | |
| Purchased securities | | | $205,787,303 | |
| |
| Sold securities | | | 30,128,739 | |
The Fund may enter into “forward roll” transactions with respect to mortgage-related securities. In this type of transaction, the Fund sells a mortgage-related security to a buyer and simultaneously agrees to repurchase a similar security (same type, coupon and maturity) at a later date at a set price. During the period between the sale and the repurchase, the Fund will not be entitled to receive interest and principal payments on the securities that have been sold. The Fund records the incremental difference between the forward purchase and sale of each forward roll as realized gain (loss) on investments or as fee income in the case of such transactions that have an associated fee in lieu of a difference in the forward purchase and sale price.
Forward roll transactions may be deemed to entail embedded leverage since the Fund purchases mortgage-related securities with extended settlement dates rather than paying for the securities under a normal settlement cycle. This embedded leverage increases the Fund’s market value of investments relative to its net assets which can incrementally increase the volatility of the Fund’s performance. Forward roll transactions can be replicated over multiple settlement periods.
Risks of entering into forward roll transactions include the potential inability of the counterparty to meet the terms of the agreement; the potential of the Fund to receive inferior securities at redelivery as compared to the securities sold to the counterparty; and counterparty credit risk.
At period end, the counterparty pledged $572,549 of collateral to the Fund for forward roll transactions.
At period end, the Fund pledged $93,000 of collateral to the counterparty for forward roll transactions.
Restricted Securities.At period end, investments in securities included issues that are restricted. A restricted security may have a contractual restriction on its resale and is valued under methods approved by the Board of Trustees as reflecting fair value. Securities that are restricted are marked with an applicable footnote on the Consolidated Statement of Investments. Restricted securities are reported on a schedule following the Consolidated Statement of Investments.
Equity Security Risk.Stocks and other equity securities fluctuate in price. The value of the Fund’s portfolio may be affected by changes in the equity markets generally. Equity markets may experience significant short-term volatility and may fall sharply at times. Different markets may behave differently from each other and U.S. equity markets may move in the opposite direction from one or more foreign stock markets. Adverse events in any part of the equity or fixed-income markets may have unexpected negative effects on other market segments.
The prices of individual equity securities generally do not all move in the same direction at the same time and a variety of factors can affect the price of a particular company’s securities. These factors may include, but are not limited to, poor earnings reports, a loss of customers, litigation against the company, general unfavorable performance of the company’s sector or industry, or changes in government regulations affecting the company or its industry.
Credit Risk.The Fund invests in high-yield,non-investment-grade bonds, which may be subject to a greater degree of credit risk. Credit risk relates to the ability of the issuer to meet interest or principal payments or both as they become due. The Fund may acquire securities that have missed an interest payment, and is not obligated to dispose of securities whose issuers or underlying obligors subsequently miss an interest and/or principal payment.
Information concerning securities not accruing interest at period end is as follows:
| | | | |
| Cost | | $ | 2,966,073 | |
| Market Value | | $ | 796,716 | |
| Market Value as % of Net Assets | | | 0.06% | |
Sovereign Debt Risk.The Fund invests in sovereign debt securities, which are subject to certain special risks. These risks include, but are not limited to, the risk that a governmental entity may delay or refuse, or otherwise be unable, to pay interest or repay the principal on its sovereign debt. There may also be no legal process for collecting sovereign debt that a government does not pay or bankruptcy proceedings through which all or part of such sovereign debt may be collected. In addition, a restructuring or default of sovereign debt may also cause additional impacts to the financial markets, such as downgrades to credit ratings, reduced liquidity and increased volatility, among others.
Shareholder Concentration.At period end, three shareholders each owned 20% or more of the Fund’s total outstanding shares.
A shareholder is a related partyof the Fund. Related parties may include, but are not limited to, the investment manager and its affiliates, affiliated
49 OPPENHEIMER GLOBAL STRATEGIC INCOME FUND/VA
NOTES TO CONSOLIDATED FINANCIAL STATEMENTSContinued
4. Investments and Risks (Continued)
broker dealers, fund of funds, and directors or employees.The related partyowned 22% of the Fund’s total outstanding shares at period end.
5. Market Risk Factors
The Fund’s investments in securities and/or financial derivatives may expose the Fund to various market risk factors:
Commodity Risk. Commodity risk relates to the change in value of commodities or commodity indexes as they relate to increases or decreases in the commodities market. Commodities are physical assets that have tangible properties. Examples of these types of assets are crude oil, heating oil, metals, livestock, and agricultural products.
Credit Risk.Credit risk relates to the ability of the issuer of debt to meet interest and principal payments, or both, as they come due. In general, lower-grade, higher-yield debt securities are subject to credit risk to a greater extent than lower-yield, higher-quality securities.
Equity Risk. Equity risk relates to the change in value of equity securities as they relate to increases or decreases in the general market.
Foreign Exchange Rate Risk. Foreign exchange rate risk relates to the change in the U.S. dollar value of a security held that is denominated in a foreign currency. The U.S. dollar value of a foreign currency denominated security will decrease as the dollar appreciates against the currency, while the U.S. dollar value will increase as the dollar depreciates against the currency.
Interest Rate Risk.Interest rate risk refers to the fluctuations in value of fixed-income securities resulting from the inverse relationship between price and yield. For example, an increase in general interest rates will tend to reduce the market value of already issued fixed-income investments, and a decline in general interest rates will tend to increase their value. In addition, debt securities with longer maturities, which tend to have higher yields, are subject to potentially greater fluctuations in value from changes in interest rates than obligations with shorter maturities.
Volatility Risk.Volatility risk refers to the magnitude of the movement, but not the direction of the movement, in a financial instrument’s price over a defined time period. Large increases or decreases in a financial instrument’s price over a relative time period typically indicate greater volatility risk, while small increases or decreases in its price typically indicate lower volatility risk.
6. Use of Derivatives
The Fund’s investment objective not only permits the Fund to purchase investment securities, it also allows the Fund to enter into various types of derivatives contracts, including, but not limited to, futures contracts, forward currency exchange contracts, credit default swaps, interest rate swaps, total return swaps, variance swaps and purchased and written options. In doing so, the Fund will employ strategies in differing combinations to permit it to increase, decrease, or change the level or types of exposure to market risk factors. These instruments may allow the Fund to pursue its objectives more quickly and efficiently than if it were to make direct purchases or sales of securities capable of effecting a similar response to market factors. Such contracts may be entered into through a bilateralover-the-counter (“OTC”) transaction, or through a securities or futures exchange and cleared through a clearinghouse.
Derivatives may have little or no initial cash investment relative to their market value exposure and therefore can produce significant gains or losses in excess of their cost due to changes in the market risk factors and the overall market. This use of embedded leverage allows the Fund to increase its market value exposure relative to its net assets and can substantially increase the volatility of the Fund’s performance. In instances where the Fund is using derivatives to decrease, or hedge, exposures to market risk factors for securities held by the Fund, there are also risks that those derivatives may not perform as expected resulting in losses for the combined or hedged positions. Some derivatives have the potential for unlimited loss, regardless of the size of the Fund’s initial investment.
Additional associated risks from investing in derivatives also exist and potentially could have significant effects on the valuation of the derivative and the Fund. Typically, the associated risks are not the risks that the Fund is attempting to increase or decrease exposure to, per its investment objectives, but are the additional risks from investing in derivatives. Examples of these associated risks are liquidity risk, which is the risk that the Fund will not be able to sell the derivative in the open market in a timely manner, and counterparty credit risk, which is the risk that the counterparty will not fulfill its obligation to the Fund.
The Fund’s actual exposures to these market risk factors and associated risks during the period are discussed in further detail, by derivative type, below.
Forward Currency Exchange Contracts
The Fund may enter into forward currency exchange contracts (“forward contracts”) for the purchase or sale of a foreign currency at a negotiated rate at a future date. Such contracts are traded in the OTC inter-bank currency dealer market.
Forward contracts are reported on a schedule following the Consolidated Statement of Investments. The unrealized appreciation (depreciation) is reported in the Consolidated Statement of Assets and Liabilities as a receivable (or payable) and in the Consolidated Statement of Operations within the change in unrealized appreciation (depreciation). At contract close, the difference between the original cost of the contract and the value at the close date is recorded as a realized gain (loss) in the Consolidated Statement of Operations.
The Fund may enter into forward foreign currency exchange contracts in order to decrease exposure to foreign exchange rate risk associated with either specific transactions or portfolio instruments or to increase exposure to foreign exchange rate risk.
During the reporting period, the Fund had daily average contract amounts on forward contracts to buy and sell of $272,409,303 and $459,354,497, respectively.
Additional associated risk to the Fund includes counterparty credit risk. Counterparty credit risk arises from the possibility that the counterparty to a forward contract will default and fail to perform its obligations to the Fund.
50 OPPENHEIMER GLOBAL STRATEGIC INCOME FUND/VA
6. Use of Derivatives (Continued)
Futures Contracts
A futures contract is a commitment to buy or sell a specific amount of a commodity, financial instrument or currency at a negotiated price on a stipulated future date. The Fund may buy and sell futures contracts and may also buy or write put or call options on these futures contracts. Futures contracts and options thereon are generally entered into on a regulated futures exchange and cleared through a clearinghouse associated with the exchange.
Upon entering into a futures contract, the Fund is required to deposit either cash or securities (initial margin) in an amount equal to a certain percentage of the contract value in an account registered in the futures commission merchant’s name. Subsequent payments (variation margin) are paid to or from the futures commission merchant each day equal to the daily changes in the contract value. Such payments are recorded as unrealized gains and losses. Should the Fund fail to make requested variation margin payments, the futures commission merchant can gain access to the initial margin to satisfy the Fund’s payment obligations.
Futures contracts are reported on a schedule following the Consolidated Statement of Investments. Securities held by a futures commission merchant to cover initial margin requirements on open futures contracts are noted in the Consolidated Statement of Investments. Cash held by a futures commission merchant to cover initial margin requirements on open futures contracts and the receivable and/or payable for the daily mark to market for the variation margin are noted in the Consolidated Statement of Assets and Liabilities. The net change in unrealized appreciation and depreciation is reported in the Consolidated Statement of Operations. Realized gains (losses) are reported in the Consolidated Statement of Operations at the closing or expiration of futures contracts.
The Fund may purchase and/or sell financial futures contracts and options on futures contracts to gain exposure to, or decrease exposure to interest rate risk, equity risk, foreign exchange rate risk, volatility risk, or commodity risk.
During the reporting period, the Fund had an ending monthly average market value of $104,691,785 and $210,627,356 on futures contracts purchased and sold, respectively.
Additional associated risks of entering into futures contracts (and related options) include the possibility that there may be an illiquid market where the Fund is unable to liquidate the contract or enter into an offsetting position and, if used for hedging purposes, the risk that the price of the contract will correlate imperfectly with the prices of the Fund’s securities.
Option Activity
The Fund may buy and sell put and call options, or write put and call options. When an option is written, the Fund receives a premium and becomes obligated to sell or purchase the underlying security, currency or other underlying financial instrument at a fixed price, upon exercise of the option.
Options can be traded through an exchange or through a privately negotiated arrangement with a dealer in an OTC transaction. Options traded through an exchange are generally cleared through a clearinghouse (such as The Options Clearing Corporation). The difference between the premium received or paid, and market value of the option, is recorded as unrealized appreciation or depreciation. The net change in unrealized appreciation or depreciation is reported in the Consolidated Statement of Operations. When an option is exercised, the cost of the security purchased or the proceeds of the security sale are adjusted by the amount of premium received or paid. Upon the expiration or closing of the option transaction, a gain or loss is reported in the Consolidated Statement of Operations.
Foreign Currency Options.The Fund may purchase or write call and put options on currencies to increase or decrease exposure to foreign exchange rate risk. A purchased call, or written put option becomes more valuable as the price of the underlying financial instrument appreciates relative to the strike price. A purchased put, or written call option becomes more valuable as the price of the underlying financial instrument depreciates relative to the strike price.
Interest Rate Options.The Fund may purchase or write call and put options on treasury and/or euro futures to increase or decrease exposure to interest rate risk. A purchased call or written put option becomes more valuable as the price of the underlying financial instrument appreciates relative to the strike price. A purchased put or written call option becomes more valuable as the price of the underlying financial instrument depreciates relative to the strike price.
Index/Security Options.The Fund may purchase or write call and put options on individual equity securities and/or equity indexes to increase or decrease exposure to equity risk. A purchased call or written put option becomes more valuable as the price of the underlying financial instrument appreciates relative to the strike price. A purchased put or written call option becomes more valuable as the price of the underlying financial instrument depreciates relative to the strike price.
During the reporting period, the Fund had an ending monthly average market value of $2,515,484 and $1,061,162 on purchased call options and purchased put options, respectively.
Options written, if any, are reported in a schedule following the Consolidated Statement of Investments and as a liability in the Consolidated Statement of Assets and Liabilities. Securities held in collateral accounts to cover potential obligations with respect to outstanding written options are noted in the Consolidated Statement of Investments.
The risk in writing a call option is the market price of the underlying security increasing above the strike price and the option being exercised. The Fund must then purchase the underlying security at the higher market price and deliver it for the strike price or, if it owns the underlying security, deliver it at the strike price and forego any benefit from the increase in the price of the underlying security above the strike price. The risk in writing a put option is the market price of the underlying security decreasing below the strike price and the option being exercised. The Fund must then purchase the underlying security at the strike price when the market price of the underlying security is below the strike price. Alternatively, the Fund could also close out a written option position, in which case the risk is that the closing transaction will require a premium to be paid by the Fund that is greater than the premium the Fund received. When writing options, the Fund has the additional risk that there may be an illiquid market where the Fund is unable to close the
51 OPPENHEIMER GLOBAL STRATEGIC INCOME FUND/VA
NOTES TO CONSOLIDATED FINANCIAL STATEMENTSContinued
6. Use of Derivatives (Continued)
contract. The risk in buying an option is that the Fund pays a premium for the option, and the option may be worth less than the premium paid or expire worthless.
During the reporting period, the Fund had an ending monthly average market value of $1,743,703 and $9,558,845 on written call options and written put options, respectively.
Additional associated risks to the Fund include counterparty credit risk and liquidity risk.
Swap Contracts
The Fund may enter into swap contract agreements with a counterparty to exchange a series of cash flows based on either specified reference rates, the price or volatility of asset ornon-asset references, or the occurrence of a credit event, over a specified period. Swaps can be executed in abi-lateral privately negotiated arrangement with a dealer in an OTC transaction (“OTC swaps”) or executed on a regulated market. Certain swaps, regardless of the venue of their execution, are required to be cleared through a clearinghouse (“centrally cleared swaps”). Swap contracts may include interest rate, equity, debt, index, total return, credit default, currency, and volatility swaps.
Swap contracts are reported on a schedule following the Consolidated Statement of Investments. The values of centrally cleared swap and OTC swap contracts are aggregated by positive and negative values and disclosed separately on the Consolidated Statement of Assets and Liabilities. The unrealized appreciation (depreciation) related to the change in the valuation of the notional amount of the swap is combined with the accrued interest due to (owed by) the Fund, if any, at termination or settlement. The net change in this amount during the period is included on the Consolidated Statement of Operations. The Fund also records any periodic payments received from (paid to) the counterparty, including at termination, under such contracts as realized gain (loss) on the Consolidated Statement of Operations.
Swap contract agreements are exposed to the market risk factor of the specific underlying reference rate or asset. Swap contracts are typically more attractively priced compared to similar investments in related cash securities because they isolate the risk to one market risk factor and eliminate the other market risk factors. Investments in cash securities (for instance bonds) have exposure to multiple risk factors (credit and interest rate risk). Because swaps have embedded leverage, they can expose the Fund to substantial risk in the isolated market risk factor.
Credit Default Swap Contracts.A credit default swap is a contract that enables an investor to buy or sell protection against a defined-issuer credit event, such as the issuer’s failure to make timely payments of interest or principal on a debt security, bankruptcy or restructuring. The Fund may enter into credit default swaps either by buying or selling protection on a corporate issuer, sovereign issuer, or a basket or index of issuers (the “reference asset”).
The buyer of protection pays a periodic fee to the seller of protection based on the notional amount of the swap contract. The seller of protection agrees to compensate the buyer of protection for future potential losses as a result of a credit event on the reference asset. The contract effectively transfers the credit event risk of the reference asset from the buyer of protection to the seller of protection.
The ongoing value of the contract will fluctuate throughout the term of the contract based primarily on the credit risk of the reference asset. If the credit quality of the reference asset improves relative to the credit quality at contract initiation, the buyer of protection may have an unrealized loss greater than the anticipated periodic fee owed. This unrealized loss would be the result of current credit protection being cheaper than the cost of credit protection at contract initiation. If the buyer elects to terminate the contract prior to its maturity, and there has been no credit event, this unrealized loss will become realized. If the contract is held to maturity, and there has been no credit event, the realized loss will be equal to the periodic fee paid over the life of the contract.
If there is a credit event, the buyer of protection can exercise its rights under the contract and receive a payment from the seller of protection equal to the notional amount of the swap less the market value of specified debt securities issued by the reference asset. Upon exercise of the contract the difference between such value and the notional amount is recorded as realized gain (loss) and is included on the Consolidated Statement of Operations.
The Fund may purchase or sell credit protection through credit default swaps to increase or decrease exposure to the credit risk of individual issuers and/or indexes of issuers that are either unavailable or considered to be less attractive in the bond market.
The Fund has engaged in spread curve trades by simultaneously purchasing and selling protection through credit default swaps referenced to the same reference asset but with different maturities. Spread curve trades attempt to gain exposure to credit risk on a forward basis by realizing gains on the expected differences in spreads.
For the reporting period, the Fund had ending monthly average notional amounts of $27,988,462 and $21,067,538 on credit default swaps to buy protection and credit default swaps to sell protection, respectively.
Additional associated risks to the Fund include counterparty credit risk and liquidity risk.
Interest Rate Swap Contracts.An interest rate swap is an agreement between counterparties to exchange periodic payments based on interest rates. One cash flow stream will typically be a floating rate payment based upon a specified floating interest rate while the other is typically a fixed interest rate.
The Fund may enter into interest rate swaps in which it pays the fixed or floating interest rate in order to increase or decrease exposure to interest rate risk. Typically, if relative interest rates rise, floating payments under a swap agreement will be greater than the fixed payments.
For the reporting period, the Fund had ending monthly average notional amounts of $180,148,007 and $429,900,062 on interest rate swaps which pay a fixed rate and interest rate swaps which receive a fixed rate, respectively.
Additional associated risks to the Fund include counterparty credit risk and liquidity risk.
Total Return Swap Contracts.A total return swap is an agreement between counterparties to exchange periodic payments based on the value of asset ornon-asset references. One cash flow is typically based on anon-asset reference (such as an interest rate) and the other on the total return of
52 OPPENHEIMER GLOBAL STRATEGIC INCOME FUND/VA
6. Use of Derivatives (Continued)
a reference asset (such as a security or a basket of securities or securities index). The total return of the reference asset typically includes appreciation or depreciation on the reference asset, plus any interest or dividend payments.
Total return swap contracts are exposed to the market risk factor of the specific underlying financial instrument or index. Total return swaps are less standard in structure than other types of swaps and can isolate and/or include multiple types of market risk factors including equity risk, credit risk, and interest rate risk.
The Fund may enter into total return swaps to increase or decrease exposure to the credit risk of various indexes or basket of securities. These credit risk related total return swaps require the Fund to pay to, or receive payments from, the counterparty based on the movement of credit spreads of the related indexes or securities.
For the reporting period, the Fund had ending monthly average notional amounts of $12,950,002 on total return swaps which are long the reference asset.
Additional associated risks to the Fund include counterparty credit risk and liquidity risk.
Swaption Transactions
The Fund may enter into a swaption contract which grants the purchaser the right, but not the obligation, to enter into a swap transaction at preset terms detailed in the underlying agreement within a specified period of time. The purchaser pays a premium to the swaption writer who bears the risk of unfavorable changes in the preset terms on the underlying swap.
Purchased swaptions are reported as a component of investments in the Consolidated Statement of Investments and the Consolidated Statement of Assets and Liabilities. Written swaptions are reported on a schedule following the Consolidated Statement of Investments and their value is reported as a separate asset or liability line item in the Consolidated Statement of Assets and Liabilities. The net change in unrealized appreciation or depreciation on written swaptions is separately reported in the Consolidated Statement of Operations. When a swaption is exercised, the cost of the swap is adjusted by the amount of premium paid or received. Upon the expiration or closing of an unexercised swaption contract, a gain or loss is reported in the Consolidated Statement of Operations for the amount of the premium paid or received.
The Fund generally will incur a greater risk when it writes a swaption than when it purchases a swaption. When the Fund writes a swaption it will become obligated, upon exercise of the swaption, according to the terms of the underlying agreement. Swaption contracts written by the Fund do not give rise to counterparty credit risk prior to exercise as they obligate the Fund, not its counterparty, to perform. When the Fund purchases a swaption it only risks losing the amount of the premium it paid if the swaption expires unexercised. However, when the Fund exercises a purchased swaption there is a risk that the counterparty will fail to perform or otherwise default on its obligations under the swaption contract.
The Fund may purchase swaptions which give it the option to enter into an interest rate swap in which it pays a floating or fixed interest rate and receives a fixed or floating interest rate in order to increase or decrease exposure to interest rate risk. Purchasing the fixed portion of this swaption becomes more valuable as the reference interest rate decreases relative to the preset interest rate. Purchasing the floating portion of this swaption becomes more valuable as the reference interest rate increases relative to the preset interest rate.
The Fund may purchase swaptions which give it the option to buy or sell credit protection through credit default swaps in order to decrease or increase exposure to the credit risk of individual issuers and/ or indexes of issuers. A swaption selling protection becomes more valuable as the likelihood of a credit event on the reference asset decreases. A swaption buying protection becomes more valuable as the likelihood of a credit event on the reference asset increases.
The Fund may write swaptions which give it the obligation, if exercised by the purchaser, to enter into an interest rate swap in which it pays a fixed or floating interest rate and receives a floating or fixed interest rate in order to increase or decrease exposure to interest rate risk. A written swaption paying a fixed rate becomes more valuable as the reference interest rate increases relative to the preset interest rate. A written swaption paying a floating rate becomes more valuable as the reference interest rate decreases relative to the preset interest rate.
The Fund may write swaptions which give it the obligation, if exercised by the purchaser, to sell or buy credit protection through credit default swaps in order to increase or decrease exposure to the credit risk of individual issuers and/or indexes of issuers. A written swaption selling protection becomes more valuable as the likelihood of a credit event on the reference asset decreases. A written swaption buying protection becomes more valuable as the likelihood of a credit event on the reference asset increases.
The Fund may enter into currency swaption contracts with the obligation to pay an interest rate on the US dollar notional amount or various foreign currency notional amounts and receive an interest rate on various foreign currency notional amounts or US dollar notional amounts, with an option to replace the contractual currency as disclosed in the Consolidated Statement of Investments. This is done in order to take a positive investment perspective on the related currencies for which the Fund receives a payment. The US dollar swaption contracts seek to increase exposure to foreign exchange rate risk. The foreign currency swaption contracts seek to decrease exposure to foreign exchange rate risk.
During the reporting period, the Fund had an ending monthly average market value of $2,935,559 and $5,998,881 on purchased and written swaptions, respectively.
Counterparty Credit Risk.Derivative positions are subject to the risk that the counterparty will not fulfill its obligation to the Fund. The Fund intends to enter into derivative transactions with counterparties that the Manager believes to be creditworthy at the time of the transaction.
The Fund’s risk of loss from counterparty credit risk on OTC derivatives is generally limited to the aggregate unrealized gain netted against any collateral held by the Fund. For OTC options purchased, the Fund bears the risk of loss of the amount of the premiums paid plus the positive change in market values net of any collateral held by the Fund should the counterparty fail to perform under the contracts. Options written by the Fund do not typically give rise to counterparty credit risk, as options written generally obligate the Fund and not the counterparty to perform.
53 OPPENHEIMER GLOBAL STRATEGIC INCOME FUND/VA
NOTES TO CONSOLIDATED FINANCIAL STATEMENTSContinued
6. Use of Derivatives (Continued)
To reduce counterparty risk with respect to OTC transactions, the Fund has entered into master netting arrangements, established within the Fund’s International Swap and Derivatives Association, Inc. (“ISDA”) master agreements, which allow the Fund to make (or to have an entitlement to receive) a single net payment in the event of default(close-out netting) for outstanding payables and receivables with respect to certain OTC positions in swaps, options, swaptions, and forward currency exchange contracts for each individual counterparty. In addition, the Fund may require that certain counterparties post cash and/or securities in collateral accounts to cover their net payment obligations for those derivative contracts subject to ISDA master agreements. If the counterparty fails to perform under these contracts and agreements, the cash and/or securities will be made available to the Fund.
At period end, the Fund has required certain counterparties to post collateral of $477,762.
ISDA master agreements include credit related contingent features which allow counterparties to OTC derivatives to terminate derivative contracts prior to maturity in the event that, for example, the Fund’s net assets decline by a stated percentage or the Fund fails to meet the terms of its ISDA master agreements, which would cause the Fund to accelerate payment of any net liability owed to the counterparty.
For financial reporting purposes, the Fund does not offset derivative assets and derivative liabilities that are subject to netting arrangements in the Consolidated Statement of Assets and Liabilities. Bankruptcy or insolvency laws of a particular jurisdiction may impose restrictions on or prohibitions against the right of offset in bankruptcy, insolvency or other events.
The Fund’s risk of loss from counterparty credit risk on exchange-traded derivatives cleared through a clearinghouse and for centrally cleared swaps is generally considered lower than as compared to OTC derivatives. However, counterparty credit risk exists with respect to initial and variation margin deposited/paid by the Fund that is held in futures commission merchant, broker and/or clearinghouse accounts for such exchange-traded derivatives and for centrally cleared swaps.
With respect to centrally cleared swaps, such transactions will be submitted for clearing, and if cleared, will be held in accounts at futures commission merchants or brokers that are members of clearinghouses. While brokers, futures commission merchants and clearinghouses are required to segregate customer margin from their own assets, in the event that a broker, futures commission merchant or clearinghouse becomes insolvent or goes into bankruptcy and at that time there is a shortfall in the aggregate amount of margin held by the broker, futures commission merchant or clearinghouse for all its customers, U.S. bankruptcy laws will typically allocate that shortfall on apro-rata basis across all the broker’s, futures commission merchant’s or clearinghouse’s customers, potentially resulting in losses to the Fund.
There is the risk that a broker, futures commission merchant or clearinghouse will decline to clear a transaction on the Fund’s behalf, and the Fund may be required to pay a termination fee to the executing broker with whom the Fund initially enters into the transaction. Clearinghouses may also be permitted to terminate centrally cleared swaps at any time. The Fund is also subject to the risk that the broker or futures commission merchant will improperly use the Fund’s assets deposited/paid as initial or variation margin to satisfy payment obligations of another customer. In the event of a default by another customer of the broker or futures commission merchant, the Fund might not receive its variation margin payments from the clearinghouse, due to the manner in which variation margin payments are aggregated for all customers of the broker/futures commission merchant.
Collateral and margin requirements differ by type of derivative. Margin requirements are established by the broker, futures commission merchant or clearinghouse for exchange-traded and cleared derivatives, including centrally cleared swaps. Brokers, futures commission merchants and clearinghouses can ask for margin in excess of the regulatory minimum, or increase the margin amount, in certain circumstances.
Collateral terms are contract specific for OTC derivatives. For derivatives traded under an ISDA master agreement, the collateral requirements are typically calculated by netting the mark to market amount for each transaction under such agreement and comparing that amount to the value of any collateral currently pledged by the Fund or the counterparty.
For financial reporting purposes, cash collateral that has been pledged to cover obligations of the Fund, if any, is reported separately on the Consolidated Statement of Assets and Liabilities as cash pledged as collateral.Non-cash collateral pledged by the Fund, if any, is noted in the Consolidated Statement of Investments. Generally, the amount of collateral due from or to a party must exceed a minimum transfer amount threshold (e.g., $250,000) before a transfer has to be made. To the extent amounts due to the Fund from its counterparties are not fully collateralized, contractually or otherwise, the Fund bears the risk of loss from counterparty nonperformance.
The following table presents by counterparty the Fund’s OTC derivative assets net of the related collateral pledged by the Fund at period end:
| | | | | | | | | | | | | | | | | | | | |
| | | | | | Gross Amounts Not Offset in the Consolidated
Statement of Assets & Liabilities | | | | |
| Counterparty | | Gross Amounts Not Offset in the Consolidated Statement of Assets &
Liabilities* | | | Financial Instruments Available for Offset | | | Financial Instruments Collateral Received** | | | Cash Collateral Received** | | | Net Amount | |
| Bank of America NA | | $ | 2,226,718 | | | $ | (2,226,718 | ) | | $ | – | | | $ | – | | | $ | – | |
| Barclays Bank plc | | | 2,789,149 | | | | (2,789,149 | ) | | | – | | | | – | | | | – | |
| BNP Paribas | | | 9,634 | | | | (9,634 | ) | | | – | | | | – | | | | – | |
| Citibank NA | | | 1,814,282 | | | | (1,814,282 | ) | | | – | | | | – | | | | – | |
| Deutsche Bank AG | | | 111,596 | | | | (72,691 | ) | | | – | | | | (38,905 | ) | | | – | |
| Goldman Sachs Bank USA | | | 4,540,438 | | | | (4,540,438 | ) | | | – | | | | – | | | | – | |
| Goldman Sachs International | | | 849,207 | | | | (384,791 | ) | | | – | | | | – | | | | 464,416 | |
54 OPPENHEIMER GLOBAL STRATEGIC INCOME FUND/VA
6. Use of Derivatives (Continued)
| | | | | | | | | | | | | | | | | | | | |
| | | | | | Gross Amounts Not Offset in the Consolidated
Statement of Assets & Liabilities | | | |
| Counterparty | | Gross Amounts Not Offset in the Consolidated Statement of Assets & Liabilities* | | | Financial
Instruments
Available for
Offset | | | Financial Instruments Collateral Received** | | Cash Collateral Received** | | Net Amount |
| HSBC Bank USA NA | | $ | 248,890 | | | $ | (166,895 | ) | | $ | (81,995 | ) | | $ | – | | | $ | – | |
| JPMorgan Chase Bank NA | | | 6,087,701 | | | | (6,087,701 | ) | | | – | | | | – | | | | – | |
| Morgan Stanley Capital Services, Inc. | | | 626,077 | | | | (626,077 | ) | | | – | | | | – | | | | – | |
| Standard Chartered Bank | | | 732,042 | | | | (732,042 | ) | | | – | | | | – | | | | – | |
| | | | |
| | $ | 20,035,734 | | | $ | (19,450,418 | ) | | $ | (81,995 | ) | | $ | (38,905 | ) | | $ | 464,416 | |
| | | | |
| *OTC derivatives are reported gross on the Consolidated Statement of Assets and Liabilities. Exchange traded options and margin related to centrally cleared swaps and futures, if any, are excluded from these reported amounts. | |
| **Reported collateral posted for the benefit of the Fund within this table is limited to the net outstanding amount due from an individual counterparty. The collateral posted for the benefit of the Fund may exceed these amounts. | |
The following table presents by counterparty the Fund’s OTC derivative liabilities net of the related collateral pledged by the Fund at period end:
| | | | | | | | | | | | | | | | | | | | |
| | | | | | Gross Amounts Not Offset in the Consolidated
Statement of Assets & Liabilities | | | | |
| Counterparty | | Gross Amounts Not Offset in the Consolidated Statement of Assets & Liabilities* | | | Financial
Instruments
Available for
Offset | | | Financial Instruments Collateral Pledged** | | | Cash Collateral Pledged** | | | Net Amount | |
| Bank of America NA | | $ | (8,979,792) | | | $ | 2,226,718 | | | $ | – | | | $ | 5,650,000 | | | $ | (1,103,074) | |
| Barclays Bank plc | | | (4,235,206) | | | | 2,789,149 | | | | – | | | | 1,120,000 | | | | (326,057) | |
| BNP Paribas | | | (27,427) | | | | 9,634 | | | | – | | | | – | | | | (17,793) | |
| Citibank NA | | | (3,842,744) | | | | 1,814,282 | | | | – | | | | 1,910,000 | | | | (118,462) | |
| Deutsche Bank AG | | | (72,691) | | | | 72,691 | | | | – | | | | – | | | | – | |
| Goldman Sachs Bank USA | | | (6,659,069) | | | | 4,540,438 | | | | – | | | | 2,118,631 | | | | – | |
| Goldman Sachs International | | | (384,791) | | | | 384,791 | | | | – | | | | – | | | | – | |
| HSBC Bank USA, NA | | | (166,895) | | | | 166,895 | | | | – | | | | – | | | | – | |
| JPMorgan Chase Bank NA | | | (10,755,600) | | | | 6,087,701 | | | | – | | | | 4,667,899 | | | | – | |
| Morgan Stanley Capital Services, Inc. | | | (1,628,750) | | | | 626,077 | | | | – | | | | 870,000 | | | | (132,673) | |
| Nomura Global Financial Products, Inc. | | | (3,139,829) | | | | – | | | | – | | | | 2,710,000 | | | | (429,829) | |
| Standard Chartered Bank | | | (3,151,049) | | | | 732,042 | | | | – | | | | 2,184,000 | | | | (235,007) | |
| | | | |
| | $ | (43,043,843) | | | $ | 19,450,418 | | | $ | – | | | $ | 21,230,530 | | | $ | (2,362,895) | |
| | | | |
| *OTC derivatives are reported gross on the Consolidated Statement of Assets and Liabilities. Exchange traded options and margin related to centrally cleared swaps and futures, if any, are excluded from these reported amounts. | |
| **Reported collateral pledged within this table is limited to the net outstanding amount due from the Fund. The securities pledged as collateral by the Fund as reported on the Consolidated Statement of Investments may exceed these amounts. | |
The following table presents the valuations of derivative instruments by risk exposure as reported within the Consolidated Statement of Assets and Liabilities at period end:
| | | | | | | | | | | | |
| | | Asset Derivatives | | | Liability Derivatives | |
Derivatives Not Accounted for as Hedging Instruments | | Consolidated Statement of Assets and Liabilities Location | | Value | | | Consolidated Statement of Assets and Liabilities Location | | Value | |
| Credit contracts | | Swaps, at value | | $ | 352,680 | | | Swaps, at value | | $ | 2,733,207 | |
| Interest rate contracts | | Swaps, at value | | | 131,400 | | | Swaps, at value | | | 287,527 | |
| Credit contracts | | Centrally cleared swaps,
at value | | | 1,101,843 | | | Centrally cleared swaps,
at value | | | 138,281 | |
55 OPPENHEIMER GLOBAL STRATEGIC INCOME FUND/VA
NOTES TO CONSOLIDATED FINANCIAL STATEMENTSContinued
6. Use of Derivatives (Continued)
| | | | | | | | | | | | |
| | | Asset Derivatives | | | Liability Derivatives | |
Derivatives Not Accounted for as Hedging Instruments | | Consolidated Statement of Assets and Liabilities Location | | Value | | | Consolidated Statement of Assets and Liabilities Location | | Value | |
| Interest rate contracts | | Centrally cleared swaps,
at value | | $ | 4,981,866 | | | Centrally cleared swaps,
at value | | $ | 2,035,695 | |
| Interest contracts | | Variation margin receivable | | | 73,625* | | | Variation margin payable | | | 172,244* | |
| Forward currency exchange contracts | | Unrealized appreciation on
forward currency exchange contracts | | | 7,416,073 | | | Unrealized depreciation on
forward currency exchange contracts | | | 12,515,690 | |
| Currnecy contracts | | | | | | | | Options written, at value | | | 11,315,501 | |
| Credit contracts | | | | | | | | Swaptions written, at value | | | 154,214 | |
| Interest rate contracts | | | | | | | | Swaptions written, at value | | | 16,037,704 | |
| Currency contracts | | Investments, at value | | | 6,580,809** | | | | | | | |
| Interest rate contracts | | Investments, at value | | | 5,554,772** | | | | | | | |
| | | | | | | | | | | | |
Total | | | | $ | 26,193,068 | | | | | $ | 45,390,063 | |
| | | | | | | | | | | | |
*Includes only the current day’s variation margin. Prior variation margin movements have been reflected in cash on the Consolidated Statement of Assets and Liabilities upon receipt or payment.
**Amounts relate to purchased option contracts and purchased swaption contracts, if any.
The effect of derivative instruments on the Consolidated Statement of Operations is as follows:
| | | | | | | | | | | | | | | | | | | | | | | | | | | | |
| Amount of Realized Gain or (Loss) Recognized on Derivatives | |
Derivatives Not Accounted for as Hedging Instruments | | Investment
transactions in unaffiliated companies* | | | Swaption
contracts
written | | | Option
contracts
written | | | Futures
contracts | | | Forward
currency
exchange
contracts | | | Swap contracts | | | Total | |
| Credit contracts | | $ | (1,269,155) | | | $ | 987,709 | | | $ | — | | | $ | — | | | $ | — | | | $ | (1,544,707) | | | $ | (1,826,153) | |
| Currency Contracts | | | (3,907,131) | | | | — | | | | (9,570,137) | | | | — | | | | — | | | | — | | | | (13,477,268) | |
| Equity contracts | | | 612,646 | | | | — | | | | (635,679) | | | | — | | | | — | | | | 39,257 | | | | 16,224 | |
| Forward currency exchange contracts | | | — | | | | — | | | | — | | | | — | | | | 12,345,407 | | | | — | | | | 12,345,407 | |
| Interest rate contracts | | | (2,276,424) | | | | 5,042,098 | | | | 107,721 | | | | (4,393,486) | | | | — | | | | 1,626,646 | | | | 106,555 | |
| | | | |
| Total | | $ | (6,840,064) | | | $ | 6,029,807 | | | $ | (10,098,095) | | | $ | (4,393,486) | | | $ | 12,345,407 | | | $ | 121,196 | | | $ | (2,835,235) | |
| | | | |
*Includes purchased option contracts and purchased swaption contracts, if any.
| | | | | | | | | | | | | | | | | | | | | | | | | | | | |
| Amount of Change in Unrealized Gain or (Loss) Recognized on Derivatives | |
Derivatives Not Accounted for as Hedging Instruments | | Investment
transactions in unaffiliated companies* | | | Option
contracts
written | | | Swaption
contracts
written | | | Futures
contracts | | | Forward
currency
exchange
contracts | | | Swap contracts | | | Total | |
| Credit contracts | | $ | — | | | $ | — | | | $ | 79,956 | | | $ | — | | | $ | — | | | $ | (1,454,956) | | | $ | (1,375,000) | |
| Currency contracts | | | (1,683,402) | | | | 2,455,973 | | | | — | | | | — | | | | — | | | | — | | | | 772,571 | |
| Equity contracts | | | 412,524 | | | | — | | | | — | | | | — | | | | — | | | | — | | | | 412,524 | |
| Forward currency exchange contracts | | | — | | | | — | | | | — | | | | — | | | | (3,914,697) | | | | — | | | | (3,914,697) | |
| Interest rate contracts | | | 2,317,763 | | | | — | | | | (7,809,330) | | | | (2,143,659) | | | | — | | | | 2,141,052 | | | | (5,494,174) | |
| | | | |
| Total | | $ | 1,046,885 | | | $ | 2,455,973 | | | $ | (7,729,374) | | | $ | (2,143,659) | | | $ | (3,914,697) | | | $ | 686,096 | | | $ | (9,598,776) | |
| | | | |
*Includes purchased option contracts and purchased swaption contracts, if any.
7. Shares of Beneficial Interest
The Fund has authorized an unlimited number of $0.001 par value shares of beneficial interest of each class. Transactions in shares of beneficial interest were as follows:
| | | | | | | | | | | | | | | | |
| | | Year Ended December 31, 2018 | | | Year Ended December 31, 2017 | |
| | | Shares | | | Amount | | | Shares | | | Amount | |
Non-Service Shares | | | | | | | | | | | | | | | | |
| Sold | | | 8,490,294 | | | $ | 42,380,338 | | | | 4,936,516 | | | $ | 24,907,153 | |
| Dividends and/or distributions reinvested | | | 3,988,617 | | | | 18,866,160 | | | | 1,828,381 | | | | 9,178,475 | |
| Redeemed | | | (14,761,302) | | | | (71,795,706) | | | | (11,338,330) | | | | (57,398,685) | |
| | | | |
Net decrease | | | (2,282,391) | | | $ | (10,549,208) | | | | (4,573,433) | | | $ | (23,313,057) | |
| | | | |
56 OPPENHEIMER GLOBAL STRATEGIC INCOME FUND/VA
7. Shares of Beneficial Interest (Continued)
| | | | | | | | | | | | | | | | |
| | | Year Ended December 31, 2018 | | | Year Ended December 31, 2017 | |
| | | Shares | | | Amount | | | Shares | | | Amount | |
Service Shares | | | | | | | | | | | | | | | | |
| Sold | | | 9,208,135 | | | $ | 46,798,575 | | | | 12,450,513 | | | $ | 64,464,791 | |
| Dividends and/or distributions reinvested | | | 11,180,836 | | | | 54,450,673 | | | | 4,979,157 | | | | 25,692,448 | |
| Redeemed | | | (37,228,166) | | | | (186,225,544) | | | | (28,206,027) | | | | (146,664,417) | |
| | | | |
Net decrease | | | (16,839,195) | | | $ | (84,976,296) | | | | (10,776,357) | | | $ | (56,507,178) | |
| | | | |
8. Purchases and Sales of Securities
The aggregate cost of purchases and proceeds from sales of securities, other than short-term obligations and investments in IGMMF, for the reporting period were as follows:
| | | | |
| | | Purchases | | Sales |
| Investment securities | | $965,760,387 | | $1,125,856,667 |
| U.S. government and government agency obligations | | — | | 1,586,013 |
| To Be Announced (TBA) mortgage-related securities | | 2,370,164,194 | | 2,399,236,376 |
9. Fees and Other Transactions with Affiliates
Management Fees.Under the investment advisory agreement, the Fund pays the Manager a management fee based on the daily net assets of the Fund at an annual rate as shown in the following table:
| | | | |
| Fee Schedule | | | |
| Up to $200 million | | | 0.75 | % |
| Next $200 million | | | 0.72 | |
| Next $200 million | | | 0.69 | |
| Next $200 million | | | 0.66 | |
| Next $200 million | | | 0.60 | |
| Next $4 billion | | | 0.50 | |
| Over $5 billion | | | 0.48 | |
The Manager also provides investment management related services to the Subsidiary. The Subsidiary pays the Manager a monthly management fee at an annual rate according to the above schedule. The Subsidiary also pays certain other expenses including custody and directors’ fees.
The Fund’s effective management fee for the reporting period was 0.62% of average annual net assets before any Subsidiary management fees or any applicable waivers.
Sub-Adviser Fees.The Manager has retained theSub-Adviser to provide theday-to-day portfolio management of the Fund and the Subsidiary. Under theSub-Advisory Agreement, the Manager pays theSub-Adviser an annual fee in monthly installments, equal to a percentage of the investment management fee collected by the Manager from the Fund and the Subsidiary, which shall be calculated after any investment management fee waivers. The fee paid to theSub-Adviser is paid by the Manager, not by the Fund.
Transfer Agent Fees.OFI Global (the “Transfer Agent”) serves as the transfer and shareholder servicing agent for the Fund. The Fund pays the Transfer Agent a fee based on annual net assets. Fees incurred and average net assets for each class with respect to these services are detailed in the Consolidated Statement of Operations and Consolidated Financial Highlights, respectively.
Sub-Transfer Agent Fees.The Transfer Agent has retained Shareholder Services, Inc., a wholly-owned subsidiary of OFI (the“Sub-Transfer Agent”), to provide theday-to-day transfer agent and shareholder servicing of the Fund. Under theSub-Transfer Agency Agreement, the Transfer Agent pays theSub-Transfer Agent an annual fee in monthly installments, equal to a percentage of the transfer agent fee collected by the Transfer Agent from the Fund, which shall be calculated after any applicable fee waivers. The fee paid to theSub-Transfer Agent is paid by the Transfer Agent, not by the Fund.
Trustees’ Compensation. The Fund’s Board of Trustees (“Board”) has adopted a compensation deferral plan for Independent Trustees that enables Trustees to elect to defer receipt of all or a portion of the annual compensation they are entitled to receive from the Fund. For purposes of determining the amount owed to the Trustees under the plan, deferred amounts are treated as though equal dollar amounts had been invested in shares of the Fund or in other Oppenheimer funds selected by the Trustees. The Fund purchases shares of the funds selected for deferral by the Trustees in amounts equal to his or her deemed investment, resulting in a Fund asset equal to the deferred compensation liability. Such assets are included as a component of “Other” within the asset section of the Consolidated Statement of Assets and Liabilities. Deferral of Trustees’ fees under the plan will not affect the net assets of the Fund and will not materially affect the Fund’s assets, liabilities or net investment income per share. Amounts will be deferred until distributed in accordance with the compensation deferral plan.
Distribution and Service Plan for Service Shares.The Fund has adopted a Distribution and Service Plan (the “Plan”) pursuant to Rule12b-1 under the 1940 Act for Service shares to pay OppenheimerFunds Distributor, Inc. (the “Distributor”), for distribution related services, personal service and account maintenance for the Fund’s Service shares. Under the Plan, payments are made periodically at an annual rate of 0.25% of the daily net assets of
57 OPPENHEIMER GLOBAL STRATEGIC INCOME FUND/VA
NOTES TO CONSOLIDATED FINANCIAL STATEMENTSContinued
9. Fees and Other Transactions with Affiliates (Continued)
Service shares of the Fund. The Distributor currently uses all of those fees to compensate sponsors of the insurance product that offers Fund shares, for providing personal service and maintenance of accounts of their variable contract owners that hold Service shares. These fees are paid out of the Fund’s assets on anon-going basis and increase operating expenses of the Service shares, which results in lower performance compared to the Fund’s shares that are not subject to a service fee. Fees incurred by the Fund under the Plan are detailed in the Consolidated Statement of Operations.
Waivers and Reimbursements of Expenses. The Manager has contractually agreed to waive the management fee it receives from the Fund in an amount equal to the management fee it receives from the Subsidiary. During the reporting period, the Manager waived $63,128. This fee waiver and/or expense reimbursement may not be amended or withdrawn for one year from the date of the Fund’s prospectus, unless approved by the Board.
The Manager will waive fees and/or reimburse Fund expenses in an amount equal to the indirect management fees incurred through the Fund’s investments in Affiliated Funds. During the reporting period, the Manager waived fees and/or reimbursed the Fund $1,031,264 for these management fees. This fee waiver and/or expense reimbursement may not be amended or withdrawn for one year from the date of the Fund’s prospectus, unless approved by the Board.
10. Borrowings and Other Financing
Joint Credit Facility.A number of mutual funds managed by the Manager participate in a $1.95 billion revolving credit facility (the “Facility”) intended to provide short-term financing, if necessary, subject to certain restrictions in connection with atypical redemption activity. Expenses and fees related to the Facility are paid by the participating funds and are disclosed separately or as other expenses on the Consolidated Statement of Operations. The Fund did not utilize the Facility during the reporting period.
11. Pending Acquisition
On October 18, 2018, Massachusetts Mutual Life Insurance Company, an indirect corporate parent of theSub-Adviser and the Manager, announced that it has entered into an agreement whereby Invesco Ltd. (“Invesco”), a global investment management company, will acquire theSub-Adviser (the “Transaction”). In connection with the Transaction, on January 11, 2019, the Fund’s Board unanimously approved an Agreement and Plan of Reorganization (the “Agreement”), which provides for the transfer of the assets and liabilities of the Fund to a corresponding, newly formed fund (the “Acquiring Fund”) in the Invesco family of funds (the “Reorganization”) in exchange for shares of the corresponding Acquiring Fund of equal value to the value of the shares of the Fund as of the close of business on the closing date. Although the Acquiring Fund will be managed by Invesco Advisers, Inc., the Acquiring Fund will, as of the closing date, have the same investment objective and substantially similar principal investment strategies and risks as the Fund. After the Reorganization, Invesco Advisers, Inc. will be the investment adviser to the Acquiring Fund, and the Fund will be liquidated and dissolved under applicable law and terminate its registration under the Investment Company Act of 1940, as amended. The Reorganization is expected to be atax-free reorganization for U.S. federal income tax purposes.
The Reorganization is subject to the approval of shareholders of the Fund. Shareholders of record of the Fund on January 14, 2019 will be entitled to vote on the Reorganization and will receive a combined prospectus and proxy statement describing the Reorganization, the shareholder meeting, and a discussion of the factors the Fund’s Board considered in approving the Agreement. The combined prospectus and proxy statement is expected to be distributed to shareholders of record on or about February 28, 2019. The anticipated date of the shareholder meeting is on or about April 12, 2019.
If shareholders approve the Agreement and certain other closing conditions are satisfied or waived, the Reorganization is expected to close during the second quarter of 2019, or as soon as practicable thereafter. This is subject to change.
58 OPPENHEIMER GLOBAL STRATEGIC INCOME FUND/VA
REPORT OF INDEPENDENT REGISTERED PUBLIC ACCOUNTING FIRM
To the Shareholders and Board of Trustees
Oppenheimer Variable Account Funds:
Opinion on the Consolidated Financial Statements
We have audited the accompanying consolidated statement of assets and liabilities of Oppenheimer Global Strategic Income Fund/VA, a separate series of Oppenheimer Variable Account Funds, and subsidiary (the “Fund”), including the consolidated statement of investments, as of December 31, 2018, the related consolidated statement of operations for the year then ended, the consolidated statements of changes in net assets for each of the years in the two year period then ended, and the related consolidated notes (collectively, the “consolidated financial statements”) and the consolidated financial highlights for each of the years in the five year period then ended. In our opinion, the consolidated financial statements and consolidated financial highlights present fairly, in all material respects, the consolidated financial position of the Fund as of December 31, 2018, the results of their consolidated operations for the year then ended, the changes in their consolidated net assets for each of the years in the two year period then ended, and the consolidated financial highlights for each of the years in the five year period then ended, in conformity with U.S. generally accepted accounting principles.
Basis for Opinion
These consolidated financial statements and consolidated financial highlights are the responsibility of the Fund’s management. Our responsibility is to express an opinion on these consolidated financial statements and consolidated financial highlights based on our audits. We are a public accounting firm registered with the Public Company Accounting Oversight Board (United States) (“PCAOB”) and are required to be independent with respect to the Fund in accordance with the U.S. federal securities laws and the applicable rules and regulations of the Securities and Exchange Commission and the PCAOB.
We conducted our audits in accordance with the standards of the PCAOB. Those standards require that we plan and perform the audit to obtain reasonable assurance about whether the consolidated financial statements and consolidated financial highlights are free of material misstatement, whether due to error or fraud. Our audits included performing procedures to assess the risks of material misstatement of the consolidated financial statements and consolidated financial highlights, whether due to error or fraud, and performing procedures that respond to those risks. Such procedures included examining, on a test basis, evidence regarding the amounts and disclosures in the consolidated financial statements and consolidated financial highlights. Such procedures also included confirmation of securities owned as of December 31, 2018, by correspondence with the custodian, brokers and the transfer agent, or by other appropriate auditing procedures. Our audits also included evaluating the accounting principles used and significant estimates made by management, as well as evaluating the overall presentation of the consolidated financial statements and consolidated financial highlights. We believe that our audits provide a reasonable basis for our opinion.
KPMGLLP
We have not been able to determine the specific year that we began serving as the auditor of one or more Oppenheimer Funds investment companies, however we are aware that we have served as the auditor of one or more Oppenheimer Funds investment companies since at least 1969.
Denver, Colorado
February 19, 2019
59 OPPENHEIMER GLOBAL STRATEGIC INCOME FUND/VA
FEDERAL INCOME TAX INFORMATIONUnaudited
In early 2019, if applicable, shareholders of record received information regarding all dividends and distributions paid to them by the Fund during calendar year 2018.
Dividends, if any, paid by the Fund during the reporting period which are not designated as capital gain distributions should be multiplied by the maximum amount allowable but not less than 3.50% to arrive at the amount eligible for the corporate dividend-received deduction.
Dividends, if any, paid by the Fund during the reporting period which are not designated as capital gain distributions, may be eligible for lower individual income tax rates to the extent that the Fund has received qualified dividend income as stipulated by recent tax legislation. In early 2019, shareholders of record received information regarding the percentage of distributions that are eligible for lower individual income tax rates. The amount will be the maximum amount allowed.
The foregoing information is presented to assist shareholders in reporting distributions received from the Fund to the Internal Revenue Service. Because of the complexity of the federal regulations which may affect your individual tax return and the many variations in state and local tax regulations, we recommend that you consult your tax advisor for specific guidance.
60 OPPENHEIMER GLOBAL STRATEGIC INCOME FUND/VA
BOARD APPROVAL OF THE FUND’S INVESTMENT ADVISORY ANDSUB-ADVISORY AGREEMENTSUnaudited
The Fund has entered into an investment advisory agreement with OFI Global Asset Management, Inc. (“OFI Global” or the “Adviser”), a wholly-owned subsidiary of OppenheimerFunds, Inc. (“OFI” or the“Sub-Adviser”) (“OFI Global” and “OFI” together the “Managers”) and OFI Global has entered into asub-advisory agreement with OFI whereby OFI provides investmentsub-advisory services to the Fund (collectively, the “Agreements”). Each year, the Board of Trustees (the “Board”), including a majority of the independent Trustees, is required to determine whether to approve the terms of the Agreements and the renewal thereof. The Investment Company Act of 1940, as amended, requires that the Board request and evaluate, and that the Managers provide, such information as may be reasonably necessary to evaluate the terms of the Agreements. The Board employs an independent consultant to prepare a report that provides information, including comparative information that the Board requests for that purpose. In addition toin-person meetings focused on this evaluation, the Board receives information throughout the year regarding Fund services, fees, expenses and performance.
The Managers and the independent consultant provided information to the Board on the following factors: (i) the nature, quality and extent of the Managers’ services, (ii) the comparative investment performance of the Fund and the Managers, (iii) the fees and expenses of the Fund, including comparative fee and expense information, (iv) the profitability of the Managers and their affiliates, including an analysis of the cost of providing services, (v) whether economies of scale are realized as the Fund grows and whether fee levels reflect these economies of scale for Fund investors and (vi) other benefits to the Managers from their relationship with the Fund. The Board was aware that there are alternatives to retaining the Managers.
Outlined below is a summary of the principal information considered by the Board as well as the Board’s conclusions.
Nature, Quality and Extent of Services. The Board considered information about the nature, quality and extent of the services provided to the Fund and information regarding the Managers’ key personnel who provide such services. The Managers’ duties include providing the Fund with the services of theSub-Adviser’s portfolio managers and investment team, who provide research, analysis and other advisory services in regard to the Fund’s investments; and securities trading services. OFI Global is responsible for oversight of third-party service providers; monitoring compliance with applicable Fund policies and procedures and adherence to the Fund’s investment restrictions; risk management; and oversight of theSub-Adviser. OFI Global is also responsible for providing certain administrative services to the Fund. Those services include providing and supervising all administrative and clerical personnel who are necessary in order to provide effective corporate administration for the Fund; compiling and maintaining records with respect to the Fund’s operations; preparing and filing reports required by the U.S. Securities and Exchange Commission; preparing periodic reports regarding the operations of the Fund for its shareholders; preparing proxy materials for shareholder meetings; and preparing the registration statements required by federal and state securities laws for the sale of the Fund’s shares. OFI Global also provides the Fund with office space, facilities and equipment.
The Board also considered the quality of the services provided and the quality of the Managers’ resources that are available to the Fund. The Board took account of the fact that theSub-Adviser has over fifty years of experience as an investment adviser and that its assets under management rank it among the top mutual fund managers in the United States. The Board evaluated the Managers’ advisory, administrative, accounting, legal, compliance and risk management services, among other services, and information the Board has received regarding the experience and professional qualifications of the Managers’ key personnel and the size and functions of their staff. In its evaluation of the quality of the portfolio management services provided, the Board considered the experience of Hemant Baijal, Krishna Memani, Ruta Ziverte and Chris Kelly, the portfolio managers for the Fund, and theSub-Adviser’s investment team and analysts. The Board members also considered the totality of their experiences with the Managers as directors or trustees of the Fund and other funds advised by the Managers. The Board considered information regarding the quality of services provided by affiliates of the Managers, which the Board members have become knowledgeable about through their experiences with the Managers and in connection with the review or renewal of the Fund’s service agreements or service providers. The Board concluded, in light of the Managers’ experience, reputation, personnel, operations and resources that the Fund benefits from the services provided under the Agreements.
Investment Performance of the Managers and the Fund. Throughout the year, the Managers provided information on the investment performance of the Fund, the Adviser and theSub-Adviser, including comparative performance information. The Board also reviewed information, prepared by the Managers and by the independent consultant, comparing the Fund’s historical performance to relevant market indices and to the performance of other multisector bond funds underlying variable insurance products. The Board considered that the Fund underperformed its category median during all periods. The Board considered that, as a result of the Board’s conversations with the Adviser, and in an effort to address performance, the Adviser added two portfolio managers to the Fund’s investment team in January 2017. The Board further noted that a portfolio manager of the Fund was replaced in January 2018. It also considered the Fund’s performance against its benchmark, the Bloomberg Barclays U.S. Aggregate Bond Index, which the Managers stated is a good comparison for Fund performance, and noted that the Fund outperformed its benchmark during theone-, three- and five-year periods.
Fees and Expenses of the Fund. The Board reviewed the fees paid to the Adviser and the other expenses borne by the Fund. The Board noted that the Adviser, not the Fund, pays theSub-Adviser’s fee under thesub-advisory agreement. The independent consultant provided comparative data in regard to the fees and expenses of the Fund and other multisector bond funds underlying variable insurance products. In reviewing the fees and expenses charged to the VA funds, the Board considered the Adviser’s assertion that, because there is much greater disparity in the fees and services that may be provided by a manager to a VA fund as opposed to a retail fund, when comparing the expenses of the various VA funds to those of retail funds, it is most appropriate to focus on total expenses (rather than on the management fees). The Board considered that the Fund’s total expenses were higher than its category median and its peer group median. The Board also considered that the Fund’s contractual management fee was lower than its category median and equal to its peer group median. The Board further considered the Fund’s current contractual fee waivers, specifically that (a) the Adviser has contractually agreed to waive fees and/or reimburse Fund expenses in an amount equal to the management fees incurred indirectly through the Fund’s investment in funds managed by the Adviser or its affiliates, which may not be amended or withdrawn for one year from the date of the Fund’s prospectus, unless approved by the Board and (b) the Adviser has contractually agreed to waive the management fee it receives from the Fund in an amount equal to the management fee it receives from the Fund’s subsidiary, which will continue to be in effect for so long as the Fund invests in the subsidiary and may not be terminated unless approved by the Board.
61 OPPENHEIMER GLOBAL STRATEGIC INCOME FUND/VA
BOARD APPROVAL OF THE FUND’S INVESTMENT ADVISORY ANDSUB-ADVISORY AGREEMENTSUnaudited / Continued
Economies of Scale and Profits Realized by the Managers. The Board considered information regarding the Managers’ costs in serving as the Fund’s investment adviser andsub-adviser, including the costs associated with the personnel and systems necessary to manage the Fund, and information regarding the Managers’ profitability from their relationship with the Fund. The Board also considered that the Managers must be able to pay and retain experienced professional personnel at competitive rates to provide quality services to the Fund. The Board reviewed whether the Managers may realize economies of scale in managing and supporting the Fund. The Board noted that the Fund currently has management fee breakpoints, which are intended to share with Fund shareholders economies of scale that may exist as the Fund’s assets grow.
Other Benefits to the Managers. In addition to considering the profits realized by the Managers, the Board considered information that was provided regarding the direct and indirect benefits the Managers receive as a result of their relationship with the Fund, including compensation paid to the Managers’ affiliates.
Conclusions. These factors were also considered by the independent Trustees meeting separately from the full Board, assisted by experienced counsel to the Fund and to the independent Trustees. Fund counsel and the independent Trustees’ counsel are independent of the Managers within the meaning and intent of the Securities and Exchange Commission Rules.
Based on its review of the information it received and its evaluations described above, the Board, including a majority of the independent Trustees, decided to continue the Agreements through August 31, 2019. In arriving at its decision, the Board did not identify any factor or factors as being more important than others, but considered all of the above information, and considered the terms and conditions of the Agreements, including the management fees, in light of all the surrounding circumstances.
62 OPPENHEIMER GLOBAL STRATEGIC INCOME FUND/VA
PORTFOLIO PROXY VOTING POLICIES AND GUIDELINES; UPDATES TO STATEMENT OF INVESTMENTSUnaudited
The Fund has adopted Portfolio Proxy Voting Policies and Guidelines under which the Fund votes proxies relating to securities (“portfolio proxies”) held by the Fund. A description of the Fund’s Portfolio Proxy Voting Policies and Guidelines is available (i) without charge, upon request, by calling the Fund toll-free at 1.800.CALL OPP (225.5677), (ii) on the Fund’s website at www.oppenheimerfunds.com, and (iii) on the SEC’s website at www.sec.gov. In addition, the Fund is required to file FormN-PX, with its complete proxy voting record for the 12 months ended June 30th, no later than August 31st of each year. The Fund’s voting record is available (i) without charge, upon request, by calling the Fund toll-free at 1.800.CALL OPP (225.5677), and (ii) in the FormN-PX filing on the SEC’s website at www.sec.gov.
The Fund files its complete schedule of portfolio holdings with the SEC for the first quarter and the third quarter of each fiscal year on FormN-Q. The Fund’s FormN-Q filings are available on the SEC’s website at www.sec.gov.
63 OPPENHEIMER GLOBAL STRATEGIC INCOME FUND/VA
TRUSTEES AND OFFICERSUnaudited
| | |
| Name, Position(s) Held with the Fund, Length of Service, Year of Birth | | Principal Occupation(s) During the Past 5 Years; Other Trusteeships/Directorships Held; Number of Portfolios in the Fund Complex Currently Overseen |
| |
| INDEPENDENT TRUSTEES | | The address of each Trustee in the chart below is 6803 S. Tucson Way, Centennial, Colorado 80112-3924. Each Trustee serves for an indefinite term, or until his or her resignation, retirement, death or removal. Each of the Trustees in the chart below oversees 58 portfolios in the OppenheimerFunds complex. |
| |
Robert J. Malone, Chairman of the Board of Trustees (since 2016), Trustee (since 2002) Year of Birth: 1944 | | Chairman - Colorado Market of MidFirst Bank (since January 2015); Chairman of the Board (2012-2016) and Director (August 2005-January 2016) of Jones International University (educational organization); Trustee of the Gallagher Family Foundation(non-profit organization) (2000-2016); Chairman, Chief Executive Officer and Director of Steele Street Bank Trust (commercial banking) (August 2003-January 2015); Director of Opera Colorado Foundation(non-profit organization) (2008-2012); Director of Colorado UpLIFT (charitable organization) (1986-2010); Director of Jones Knowledge, Inc. (2006-2010); Former Chairman of U.S. Bank-Colorado (subsidiary of U.S. Bancorp and formerly Colorado National Bank) (July 1996-April 1999); Director of Commercial Assets, Inc. (real estate investment trust) (1993-2000); Director of U.S. Exploration, Inc. (oil and gas exploration) (1997-February 2004); Chairman of the Board (1991-1994) and Trustee (1985-1994) of Regis University; and Chairman of the Board (1990-1991) and Member (1984-1999) of Young Presidents Organization. Mr. Malone has served on the Boards of certain Oppenheimer funds since 2002, during which time he has become familiar with the Fund’s (and other Oppenheimer funds’) financial, accounting, regulatory and investment matters and has contributed to the Board’s deliberations. |
| |
Andrew J. Donohue, Trustee (since 2017) Year of Birth: 1950 | | Director, Mutual Fund Directors Forum (since February 2018); Of Counsel, Shearman & Sterling LLP (since September 2017); Chief of Staff of the U.S. Securities and Exchange Commission (regulator) (June 2015-February 2017); Managing Director and Investment Company General Counsel of Goldman Sachs (investment bank) (November2012-May 2015); Partner at Morgan Lewis & Bockius, LLP (law firm) (March 2011-October 2012); Director of the Division of Investment Management of U.S. Securities and Exchange Commission (regulator) (May 2006-November 2010); Global General Counsel of Merrill Lynch Investment Managers (investment firm) (May2003-May 2006); General Counsel (October 1991-November 2001) and Executive Vice President (January 1993-November 2001) of OppenheimerFunds, Inc. (investment firm) (June 1991-November 2001). Mr. Donohue has served on the Boards of certain Oppenheimer funds since 2017, during which time he has become familiar with the Fund’s (and other Oppenheimer funds’) financial, accounting, regulatory and investment matters and has contributed to the Board’s deliberations. |
| |
Richard F. Grabish, Trustee (since 2012) Year of Birth: 1948 | | Formerly Senior Vice President and Assistant Director of Sales and Marketing (March 1997-December 2007), Director (March 1987-December 2007) and Manager of Private Client Services (June 1985-June 2005) of A.G. Edwards & Sons, Inc. (broker/dealer and investment firm); Chairman and Chief Executive Officer of A.G. Edwards Trust Company, FSB (March 2001-December 2007); President and Vice Chairman of A.G. Edwards Trust Company, FSB (investment adviser) (April 1987-March 2001); President of A.G. Edwards Trust Company, FSB (investment adviser) (June 2005-December 2007). Mr. Grabish has served on the Boards of certain Oppenheimer funds since 2001, during which time he has become familiar with the Fund’s (and other Oppenheimer funds’) financial, accounting, regulatory and investment matters and has contributed to the Board’s deliberations. |
| |
Beverly L. Hamilton, Trustee (since 2002) Year of Birth: 1946 | | Trustee of Monterey Institute for International Studies (educational organization) (2000-2014); Board Member of Middlebury College (educational organization) (December 2005-June 2011); Director of the Board (1991-2016), Vice Chairman of the Board (2006-2009) and Chairman of the Board (2010-2013) of American Funds’ Emerging Markets Growth Fund, Inc. (mutual fund); Director of The California Endowment (philanthropic organization) (April 2002-April 2008); Director (February 2002-2005) and Chairman of Trustees (2006-2007) of the Community Hospital of Monterey Peninsula; President of ARCO Investment Management Company (February 1991-April 2000); Member of the investment committees of The Rockefeller Foundation (2001-2006) and The University of Michigan (since 2000); Advisor at Credit Suisse First Boston’s Sprout venture capital unit (venture capital fund) (1994-January 2005); Trustee of MassMutual Institutional Funds (investment company) (1996-June 2004); Trustee of MML Series Investment Fund (investment company) (April 1989-June 2004); Member of the investment committee of Hartford Hospital (2000-2003); and Advisor to Unilever (Holland) pension fund (2000-2003). Ms. Hamilton has served on the Boards of certain Oppenheimer funds since 2002, during which time she has become familiar with the Fund’s (and other Oppenheimer funds’) financial, accounting, regulatory and investment matters and has contributed to the Board’s deliberations. |
| |
Victoria J. Herget, Trustee (since 2012) Year of Birth:1951 | | Board Chair (2008-2015) and Director (2004-Present) of United Educators (insurance company); Trustee (since 2000) and Chair (2010-2017) of Newberry Library (independent research library); Trustee, Mather LifeWays (senior living organization) (since 2001); Independent Director of the First American Funds (mutual fund family) (2003-2011); former Managing Director (1993-2001), Principal (1985-1993), Vice President (1978-1985) and Assistant Vice President (1973-1978) of Zurich Scudder Investments (investment adviser) (and its predecessor firms); Trustee (1992-2007), Chair of the Board of Trustees (1999-2007), Investment Committee Chair (1994-1999) and Investment Committee member (2007-2010) of Wellesley College; Trustee, BoardSource(non-profit organization) (2006-2009) and Chicago City Day School(K-8 School) (1994-2005). Ms. Herget has served on the Boards of certain Oppenheimer funds since 2012, during which time she has become familiar with the Fund’s (and other Oppenheimer funds’) financial, accounting, regulatory and investment matters and has contributed to the Board’s deliberations. |
| |
Karen L. Stuckey, Trustee (since 2012) Year of Birth: 1953 | | Member (since May 2015) of Desert Mountain Community Foundation Advisory Board(non-profit organization); Partner (1990-2012) of PricewaterhouseCoopers LLP (professional services firm) (held various positions 1975-1990); Trustee (1992- 2006); member of Executive, Nominating and Audit Committees and Chair of Finance Committee (1992-2006), and Emeritus Trustee (since 2006) of Lehigh University; member, Women’s Investment Management Forum (professional organization) (since inception) and Trustee of Jennies School for Little Children(non-profit) (2011-2014). Ms. Stuckey has served on the Boards of certain Oppenheimer funds since 2012, during which time she has become familiar with the Fund’s (and other Oppenheimer funds’) financial, accounting, regulatory and investment matters and has contributed to the Board’s deliberations. |
64 OPPENHEIMER GLOBAL STRATEGIC INCOME FUND/VA
| | |
James D. Vaughn, Trustee (since 2012) Year of Birth:1945 | | Retired; former managing partner (1994-2001) of Denver office of Deloitte & Touche LLP, (held various positions in Denver and New York offices from 1969-1993); Trustee and Chairman of the Audit Committee of Schroder Funds (2003-2012); Board member and Chairman of Audit Committee of AMG National Trust Bank (since 2005); Trustee and Investment Committee member, University of South Dakota Foundation (since 1996); Board member, Audit Committee Member and past Board Chair, Junior Achievement (since 1993); former Board member, Mile High United Way, Boys and Girls Clubs, Boy Scouts, Colorado Business Committee for the Arts, Economic Club of Colorado and Metro Denver Network. Mr. Vaughn has served on the Boards of certain Oppenheimer funds since 2012, during which time he has become familiar with the Fund’s (and other Oppenheimer funds’) financial, accounting, regulatory and investment matters and has contributed to the Board’s deliberations. |
| | |
| INTERESTED TRUSTEE AND OFFICER | | Mr. Steinmetz is an “Interested Trustee” because he is affiliated with the Manager and theSub-Adviser by virtue of his positions as Chairman and director of theSub-Adviser and officer and director of the Manager. Both as a Trustee and as an officer, Mr. Steinmetz serves for an indefinite term, or until his resignation, retirement, death or removal. Mr. Steinmetz’s address is 225 Liberty Street, New York, New York 10281- 1008. Mr. Steinmetz is an officer of 104 portfolios in the OppenheimerFunds complex. |
| |
Arthur P. Steinmetz, Trustee (since 2015), President and Principal Executive Officer (since 2014) Year of Birth: 1958 | | Chairman of OppenheimerFunds, Inc. (since January 2015); CEO and Chairman of OFI Global Asset Management, Inc. (since July 2014), President of OFI Global Asset Management, Inc. (since May 2013), a Director of OFI Global Asset Management, Inc. (since January 2013), Director of OppenheimerFunds, Inc. (since July 2014), President, Management Director and CEO of Oppenheimer Acquisition Corp. (OppenheimerFunds, Inc.‘s parent holding company) (since July 2014), and President and Director of OFI SteelPath, Inc. (since January 2013). Chief Investment Officer of the OppenheimerFunds advisory entities (January 2013-December 2013); Executive Vice President of OFI Global Asset Management, Inc. (January2013-May 2013); Chief Investment Officer of OppenheimerFunds, Inc. (October 2010-December 2012); Chief Investment Officer, Fixed- Income, of OppenheimerFunds, Inc. (April 2009-October 2010); Executive Vice President of OppenheimerFunds, Inc. (October 2009-December 2012); Director of Fixed Income of OppenheimerFunds, Inc. (January 2009-April 2009); and a Senior Vice President of OppenheimerFunds, Inc. (March 1993-September 2009). |
| | |
| OTHER OFFICERS OF THE FUND | | The addresses of the Officers in the chart below are as follows: for Messrs. Baijal, Memani, Kelly Mss. Ziverte, Lo Bessette, Foxson and Picciotto, 225 Liberty Street, New York, New York 10281-1008, for Mr. Petersen 6803 S. Tucson Way, Centennial, Colorado 80112-3924. Each Officer serves for an indefinite term or until his or her resignation, retirement, death or removal. |
| |
Hemant Baijal, Vice President (since 2015) Year of Birth: 1962 | | Senior Vice President of theSub-Adviser (since January 2016); Senior Portfolio Manager of theSub-Adviser (since July 2011);Co-Head of the Global Debt Team (since January 2015); Vice President of theSub-Adviser (July 2011-January 2016). Co- founder, Partner and Portfolio Manager of Six Seasons Global Asset Management (January 2009-December 2010); Partner and Portfolio Manager of Aravali Partners, LLC (September 2006-December 2008); Partner and Portfolio Manager at Havell Capital Management, LLC (November 1996-August 2006). |
| |
Krishna Memani, Vice President (since 2009) Year of Birth: 1960 | | President of theSub-Adviser (since January 2013); Executive Vice President of the Manager (since January 2014) and Chief Investment Officer of the OppenheimerFunds advisory entities (since January 2014). Chief Investment Officer, Fixed Income of theSub-Adviser (January 2013-December 2013); Head of the Investment Grade Fixed Income Team of theSub-Adviser (March 2009-January 2014); Director of Fixed Income of theSub-Adviser (October 2010-December 2012); Senior Vice President of theSub-Adviser (March 2009-December 2012) and Senior Vice President of OFI Global Institutional, Inc. (April 2009-December 2012). Managing Director and Head of the U.S. and European Credit Analyst Team at Deutsche Bank Securities (June 2006-January 2009). Chief Credit Strategist at Credit Suisse Securities (August 2002-March 2006). Managing Director and Senior Portfolio Manager at Putnam Investments (September 1998-June 2002). |
| |
Chris Kelly, Vice President (since 2017) Year of Birth: 1967 | | Senior Vice President of theSub-Adviser (since January 2016); Portfolio Manager of theSub-Adviser (since March 2015);Co-Head of the Global Debt Team (since March 2015); Vice President of theSub-Adviser (March 2015-January 2016). Deputy Head of Emerging Markets Fixed Income at BlackRock, Inc. (June 2012 - January 2015); Portfolio Manager and Deputy Chief Investment Officer of Emerging Markets at Fisher Francis Trees and Watts, a BNP Paribas Investment Partner (February 2008 - April 2012). |
| |
Ruta Ziverte, Vice President (since 2017) Year of Birth: 1973 | | Vice President and Senior Portfolio Manager of theSub-Adviser (July 2015). Prior to joining theSub-Adviser, she was Senior Vice President and Portfolio Manager at GE Asset Management (June 2009 to June 2015). |
| |
Cynthia Lo Bessette, Secretary and Chief Legal Officer (since 2016) Year of Birth: 1969 | | Executive Vice President, General Counsel and Secretary of OFI Global Asset Management, Inc. (since February 2016); Senior Vice President and Deputy General Counsel of OFI Global Asset Management, Inc. (March 2015-February 2016); Chief Legal Officer of OppenheimerFunds, Inc. and OppenheimerFunds Distributor, Inc. (since February 2016); Vice President, General Counsel and Secretary of Oppenheimer Acquisition Corp. (since February 2016); General Counsel of OFI SteelPath, Inc., OFI Advisors, LLC and Index Management Solutions, LLC (since February 2016); Chief Legal Officer of OFI Global Institutional, Inc., HarbourView Asset Management Corporation, OFI Global Trust Company, Oppenheimer Real Asset Management, Inc., OFI Private Investments Inc., Shareholder Services, Inc. and Trinity Investment Management Corporation (since February 2016); Corporate Counsel (February 2012-March 2015) and Deputy Chief Legal Officer (April 2013-March 2015) of Jennison Associates LLC; Assistant General Counsel (April 2008-September 2009) and Deputy General Counsel (October 2009-February 2012) of Lord Abbett & Co. LLC. |
| |
Jennifer Foxson, Vice President and Chief Business Officer (since 2014) Year of Birth: 1969 | | Senior Vice President of OppenheimerFunds Distributor, Inc. (since June 2014); Vice President of OppenheimerFunds Distributor, Inc. (April 2006-June 2014); Vice President of OppenheimerFunds, Inc. (January 1998-March 2006); Assistant Vice President of OppenheimerFunds, Inc. (October 1991-December 1998). |
65 OPPENHEIMER GLOBAL STRATEGIC INCOME FUND/VA
TRUSTEES AND OFFICERSUnaudited / Continued
| | |
Mary Ann Picciotto, Chief Compliance Officer and Chief Anti-Money Laundering Officer (since 2014) Year of Birth: 1973 | | Senior Vice President and Chief Compliance Officer of OFI Global Asset Management, Inc. (since March 2014); Chief Compliance Officer of OppenheimerFunds, Inc., OFI SteelPath, Inc., OFI Global Institutional, Inc., Oppenheimer Real Asset Management, Inc., OFI Private Investments Inc., Harborview Asset Management Corporation, Trinity Investment Management Corporation, and Shareholder Services, Inc. (since March 2014); Managing Director of Morgan Stanley Investment Management Inc. and certain of its various affiliated entities; Chief Compliance Officer of various Morgan Stanley Funds (May 2010-January 2014); Chief Compliance Officer of Morgan Stanley Investment Management Inc. (April 2007-January 2014). |
| |
Brian S. Petersen, Treasurer and Principal Financial & Accounting Officer (since 2016) Year of Birth: 1970 | | Senior Vice President of OFI Global Asset Management, Inc. (since January 2017); Vice President of OFI Global Asset Management, Inc. (January 2013-January 2017); Vice President of OppenheimerFunds, Inc. (February 2007-December 2012); Assistant Vice President of OppenheimerFunds, Inc. (August 2002-2007). |
The Fund’s Statement of Additional Information contains additional information about the Fund’s Trustees and Officers and is available without charge, upon request, by calling 1.800.988.8287.
66 OPPENHEIMER GLOBAL STRATEGIC INCOME FUND/VA
THIS PAGE INTENTIONALLY LEFT BLANK.
67 OPPENHEIMER GLOBAL STRATEGIC INCOME FUND/VA
OPPENHEIMER GLOBAL STRATEGIC INCOME FUND/VA
A Series of Oppenheimer Variable Account Funds
| | |
| Manager | | OFI Global Asset Management, Inc. |
| |
| Sub-Adviser | | OppenheimerFunds, Inc. |
| |
| Distributor | | OppenheimerFunds Distributor, Inc. |
| |
| Transfer and Shareholder Servicing Agent | | OFI Global Asset Management, Inc. |
| |
| Sub-Transfer Agent | | Shareholder Services, Inc. DBA OppenheimerFunds Services |
| |
| Independent Registered Public Accounting Firm | | KPMG LLP |
| |
| Legal Counsel | | Ropes & Gray LLP |
| |
| | Before investing in any of the Oppenheimer funds, investors should carefully consider a fund’s investment objectives, risks, charges and expenses. Fund prospectuses and summary prospectuses contain this and other information about the funds, and may be obtained by asking your financial advisor, visiting oppenheimerfunds.com or calling us at 1.800.988.8287. Read prospectuses and summary prospectuses carefully before investing. |
| |
| | © 2019 OppenheimerFunds, Inc. All rights reserved. Oppenheimer funds are distributed by OppenheimerFunds Distributor, Inc. |

December 31, 2018 Annual ReportANNUAL REPORT Listing of Top Holdings Fund Performance Discussion Financial Statements
PORTFOLIO MANAGERS: Ben Rockmuller, CFA and Alessio de Longis, CFA
AVERAGE ANNUAL TOTAL RETURNS FOR THE PERIODS ENDED 12/31/18
| | | | | | | | | | | | | | | | |
| | | Inception
Date | | | 1-Year | | | 5-Year | | | Since
Inception | |
Non-Service Shares | | | 11/14/13 | | | | -3.21 | % | | | 0.66 | % | | | 0.51 | % |
Service Shares | | | 11/14/13 | | | | -3.30 | | | | 0.45 | | | | 0.29 | |
ICE Bank of America Merrill Lynch3-Month U.S. Treasury Bill Index | | | | | | | 1.87 | | | | 0.63 | | | | 0.61 | |
Performance data quoted represents past performance, which does not guarantee future results.The investment return and principal value of an investment in the Fund will fluctuate so that an investor’s shares, when redeemed, may be worth more or less than their original cost. Current performance may be lower or higher than the performance quoted. For performance data current to the most recent month end, call us at 1.800.988.8287. The Fund’s total returns should not be expected to be the same as the returns of other funds, whether or not both funds have the same portfolio managers and/or similar names. The Fund’s total returns include changes in share price and reinvested distributions but do not include the charges associated with the separate account products that offer this Fund. Such performance would have been lower if such charges were taken into account. Returns for periods of less than one year are cumulative and not annualized. See Fund prospectuses and summary prospectuses for more information on share classes and sales charges.
TOP HOLDINGS AND ALLOCATIONS
TOP TEN COMMON STOCK HOLDINGS
| | | | | | |
Alphabet, Inc., Cl. A | | 3.7% | | | | |
Microsoft Corp. | | 2.2 | | | | |
Energy Transfer LP | | 1.1 | | | | |
Chubb Ltd. | | 0.8 | | | | |
Imperva, Inc. | | 0.8 | | | | |
Esterline Technologies Corp. | | 0.8 | | | | |
Navigators Group, Inc. (The) | | 0.8 | | | | |
Integrated Device Technology, Inc. | | 0.8 | | | | |
Investment Technology Group, Inc. | | 0.8 | | | | |
Electro Scientific Industries, Inc. | | 0.8 | | | | |
Portfolio holdings and allocations are subject to change. Percentages are as of December 31, 2018, and are based on net assets.
PORTFOLIO ALLOCATION
| | | | | | | | |
| Common Stocks | | | 49.5 | % | | | | |
| Event-Linked Bonds | | | | | | | | |
Multiple Event | | | 7.7 | | | | | |
Earthquake | | | 5.2 | | | | | |
Windstorm | | | 3.0 | | | | | |
Other | | | 0.8 | | | | | |
Longevity | | | 0.1 | | | | | |
Pandemic | | | 0.1 | | | | | |
Fire | | | —* | | | | | |
| Short-Term Notes | | | 13.1 | | | | | |
| Foreign Government Obligations | | | 6.2 | | | | | |
| Investment Companies | | | | | | | | |
Highland/iBoxx Senior Loan Exchange Traded Fund | | | 0.6 | | | | | |
Oppenheimer Institutional Government Money Market Fund | | | 2.1 | | | | | |
SPDR Gold Trust Exchange Traded Fund | | | 1.3 | | | | | |
| Corporate Loans | | | 3.8 | | | | | |
| Asset-Backed Securities | | | 2.8 | | | | | |
| Non-Convertible Corporate Bonds and Notes | | | 2.0 | | | | | |
| Mortgage-Backed Obligations | | | | | | | | |
Non-Agency | | | 0.7 | | | | | |
| Preferred Stocks | | | 0.6 | | | | | |
| Structured Securities | | | 0.3 | | | | | |
| Over-the-Counter Interest Rate Swaptions Purchased | | | 0.1 | | | | | |
| Rights, Warrants and Certificates | | | —* | | | | | |
| Over-the-Counter Options Purchased | | | —* | | | | | |
| Exchange-Traded Options Purchased | | | —* | | | | | |
*Represents a value of less than 0.05%.
Portfolio holdings and allocations are subject to change. Percentages are as of December 31, 2018, and are based on the total market value of investments.
For more current Fund holdings, please visit oppenheimerfunds.com.
2 OPPENHEIMER GLOBAL MULTI-ALTERNATIVES FUND/VA
Fund Performance Discussion
The Fund’sNon-Service shares returned-3.21% during the reporting period. On a relative basis, the Fund underperformed the ICE Bank of America Merrill Lynch3-Month U.S. Treasury Bill Index (the “Index”), which returned 1.87% during the same period.
FUND REVIEW
The Fund’s underperformance versus the Index stemmed largely from its exposure to income alternatives and select Alpha alternatives strategies.
In income alternatives, the largest detractor was our exposure to master-limited partnerships (MLPs). Despite a move higher in energy prices earlier in the period, MLPs struggled during the period and underperformed. We believe they are increasingly supported by crude and natural gas volume increases, stable energy markets, and cheap valuations. Furthermore, we believe the restructuring of the sector (incentive distribution rights elimination or simplification) should improve prospects for distributable cash flow. Our exposure to event-linked bonds and leveraged loans detracted from performance to a lesser degree. Also, the Fund’s risk management overlays detracted from performance. In particular, our relative value positioning between equity markets was a detractor.
In Alpha alternatives, our Currency Alpha, Fundamental Alternatives, and Direct Volatility strategies detracted from performance. Our Direct Volatility strategy systematically rides on the Volatility Risk Premium and continuously extracts value from the spread between implied variance and realized variance of S&P 500 index. In Currency Alpha, our recent overweight positions to safe-haven currencies like the Swiss Franc and underweight positions to emerging market currencies like the Brazilian Real detracted from performance. Also, our underweight to the U.S. Dollar worked against us as this currency appreciated against most developed and emerging currencies. We did have positive results in Alpha Alternatives within our Alternative Risk Premia strategies. In particular, our foreign currency gamma strategy and our merger arbitrage strategy were contributors for the year. Also, our long and short oil positions worked quite well throughout the year and added to performance as well as our Funding Markets relative value strategies.
STRATEGY & OUTLOOK
The Fund comprises a flexible blend of alternative strategies and assets and is designed to be a turnkey alternative solution that improves the risk/reward tradeoff of a traditional balanced portfolio. We classify alternatives into three categories: Alpha alternatives, such as Global Multi Strategies, Fundamental Alternatives Strategies, and the Currency Alpha Strategy, rely less on the direction of major markets and economic factors to generate returns. Income alternatives (e.g. MLPs, loans, and event-linked bonds) provide exposure to relatively stable income producing assets with less interest rate sensitivity than traditional fixed income allocations. Real asset alternatives, like Global Real Estate and Commodities, could help guard against inflation over the long-term. We combine these strategies and assets to provide a core, alternative exposure that can potentially offset some of the risk from equity drawdowns, rising interest rates and inflationary shocks.
Global growth continues to slow, led by the deceleration of economic activity in Europe and most recently the U.S. However, we see early signs of stabilization in emerging markets (EM), which is tentatively confirmed by the recent market price action. Emerging market equities have outperformed developed markets during the global equitysell-off of the fourth quarter of 2018. Similarly, our global risk appetite framework suggests improving market sentiment for the first time since April. As a result, we have increased risk in our portfolio overlays after being underweight risk. In addition, we have tilt to emerging market equities versus developed markets. As always, we continue to closely monitor the developments in financial conditions as well as the political and policy landscape to assess risks to the macro outlook and financial markets. We are paying close attention to the policy backdrop and the inflation picture; both are potential headwinds to derail the advanced cycle.
Investors should consider the Fund’s investment objective, risks, charges and expenses carefully before investing. The Fund’s prospectus and summary prospectus contain this and other information about the Fund, and may be obtained by asking your financial advisor or calling us at 1.800.988.8287. Read prospectuses and summary prospectuses carefully before investing.
Total returns include changes in share price and reinvestment of dividends and capital gains distributions in a hypothetical investment for the periods shown, but do not include the charges associated with the separate account products that offer this Fund.
The views in the Fund Performance Discussion represent the opinions of this Fund’s portfolio managers and are not intended as investment advice or to predict or depict the performance of any investment. These views are as of the close of business on December 31, 2018, and are subject to change based on subsequent developments. The Fund’s portfolio and strategies are subject to change.
3 OPPENHEIMER GLOBAL MULTI-ALTERNATIVES FUND/VA
Shares of Oppenheimer funds are not deposits or obligations of any bank, are not guaranteed by any bank, are not insured by the FDIC or any other agency, and involve investment risks, including the possible loss of the principal amount invested.
Comparing the Fund’s Performance to the Market.The graphs that follow show the performance of a hypothetical $10,000 investment in each share class of the Fund held until December 31, 2018. Performance is measured over aten-fiscal-year period for both Classes. Performance information does not reflect charges that apply to separate accounts investing in the Fund. If these charges were taken into account, performance would be lower. The graphs assume that all dividends and capital gains distributions were reinvested in additional shares.
The Fund’s performance is compared to the performance of the ICE Bank of America Merrill Lynch3-Month U.S. Treasury Bill Index. The ICE Bank of America Merrill Lynch3-month U.S. Treasury Bill Index is an index of short-term U.S. Government securities with a remaining term to final maturity of less than three months. The Index is unmanaged and cannot be purchased directly by investors. While index comparisons may be useful to provide a benchmark for the Fund’s performance, it must be noted that the Fund’s investments are not limited to the investments comprising the Index. Index performance includes reinvestment of income, but does not reflect transaction costs, fees, expenses or taxes. Index performance is shown for illustrative purposes only as a benchmark for the Fund’s performance, and does not predict or depict performance of the Fund. The Fund’s performance reflects the effects of the Fund’s business and operating expenses.
4 OPPENHEIMER GLOBAL MULTI-ALTERNATIVES FUND/VA
COMPARISON OF CHANGE IN VALUE OF $10,000 HYPOTHETICAL INVESTMENTS IN:
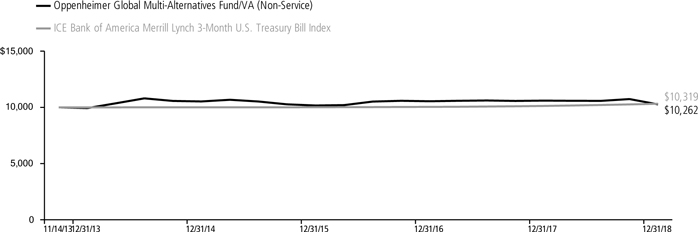
Average Annual Total Returns ofNon-Service Shares of the Fund at 12/31/18
1-Year -3.21% 5-Year 0.66% Since Inception (11/14/13) 0.51%
COMPARISON OF CHANGE IN VALUE OF $10,000 HYPOTHETICAL INVESTMENTS IN:
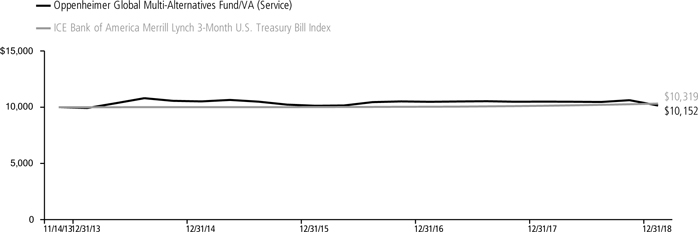
Average Annual Total Returns of Service Shares of the Fund at 12/31/18
1-Year -3.30% 5-Year 0.45% Since Inception (11/14/13) 0.29%
Performance data quoted represents past performance, which does not guarantee future results. The investment return and principal value of an investment in the Fund will fluctuate so that an investor’s shares, when redeemed, may be worth more or less than their original cost. Current performance may be lower or higher than the performance quoted. For performance data current to the most recent month end, call us at 1.800.988.8287. The Fund’s total returns should not be expected to be the same as the returns of other funds, whether or not both funds have the same portfolio managers and/or similar names. The Fund’s total returns include changes in share price and reinvested distributions but do not include the charges associated with the separate account products that offer this Fund. Such performance would have been lower if such charges were taken into account.
5 OPPENHEIMER GLOBAL MULTI-ALTERNATIVES FUND/VA
Fund Expenses
Fund Expenses.As a shareholder of the Fund, you incur two types of costs: (1) transaction costs and (2) ongoing costs, including management fees; distribution and service fees; and other Fund expenses. These examples are intended to help you understand your ongoing costs (in dollars) of investing in the Fund and to compare these costs with the ongoing costs of investing in other mutual funds.
The examples are based on an investment of $1,000.00 invested at the beginning of the period and held for the entire6-month period ended December 31, 2018.
Actual Expenses. The first section of the table provides information about actual account values and actual expenses. You may use the information in this section for the class of shares you hold, together with the amount you invested, to estimate the expense that you paid over the period. Simply divide your account value by $1,000.00 (for example, an $8,600.00 account value divided by $1,000.00 = 8.60), then multiply the result by the number in the first section under the heading entitled “Expenses Paid During 6 Months Ended December 31, 2018” to estimate the expenses you paid on your account during this period.
Hypothetical Example for Comparison Purposes.
The second section of the table provides information about hypothetical account values and hypothetical expenses based on the Fund’s actual expense ratio for each class of shares, and an assumed rate of return of 5% per year for each class before expenses, which is not the actual return. The hypothetical account values and expenses may not be used to estimate the actual ending account balance or expenses you paid for the period. You may use this information to compare the ongoing costs of investing in the Fund and other funds. To do so, compare this 5% hypothetical example for the class of shares you hold with the 5% hypothetical examples that appear in the shareholder reports of the other funds.
Please note that the expenses shown in the table are meant to highlight your ongoing costs only and do not reflect any charges associated with the separate accounts that offer this Fund. Therefore, the “hypothetical” lines of the table are useful in comparing ongoing costs only, and will not help you determine the relative total costs of owning different funds. In addition, if these separate account charges were included your costs would have been higher.
| | | | | | | | | | | | | | | | | | |
| | | Beginning | | | | | Ending | | | | | Expenses | | | |
| | | Account | | | | | Account | | | | | Paid During | | | |
| | | Value | | | | | Value | | | | | 6 Months Ended | | | |
| Actual | | July 1, 2018 | | | | | December 31, 2018 | | December 31, 2018 |
| Non-Service shares | | $ | 1,000.00 | | | | | $ | 970.30 | | | | | $ | 7.38 | | | |
| Service shares | | | 1,000.00 | | | | | | 970.30 | | | | | | 8.58 | | | |
| | | | | | |
| Hypothetical | | | | | | | | | | | | | | | | | | |
| (5% return before expenses) | | | | | | | | | | | | | | | | | | |
| Non-Service shares | | | 1,000.00 | | | | | | 1,017.74 | | | | | | 7.55 | | | |
| Service shares | | | 1,000.00 | | | | | | 1,016.53 | | | | | | 8.78 | | | |
Expenses are equal to the Fund’s annualized expense ratio for that class, multiplied by the average account value over the period, multiplied by 184/365 (to reflect theone-half year period). Those annualized expense ratios, excluding indirect expenses from affiliated funds, based on the6-month period ended December 31, 2018 are as follows:
| | | | | | |
| Class | | Expense Ratios | | | |
Non-Service shares | | 1.48% | | | | |
Service shares | | 1.72 | | | | |
The expense ratios reflect voluntary and/or contractual waivers and/or reimbursements of expenses by the Fund’s Manager. Some of these undertakings may be modified or terminated at any time, as indicated in the Fund’s prospectus. The “Financial Highlights” tables in the Fund’s financial statements, included in this report, also show the gross expense ratios, without such waivers or reimbursements and reduction to custodian expenses, if applicable.
6 OPPENHEIMER GLOBAL MULTI-ALTERNATIVES FUND/VA
CONSOLIDATED STATEMENT OF INVESTMENTSDecember 31, 2018
| | | | | | | | |
| | | Shares | | | Value | |
| Common Stocks—48.3% | | | | | | | | |
| Consumer Discretionary—5.7% | | | | | |
| Entertainment—0.2% | | | | | |
| Live Nation Entertainment, Inc.1 | | | 15,170 | | | $ | 747,123 | |
| Hotels, Restaurants & Leisure—0.3% | | | | | |
| Choice Hotels International, Inc. | | | 11,620 | | | | 831,760 | |
| McDonald’s Corp. | | | 2,020 | | | | 358,691 | |
| | | | | | | | 1,190,451 | |
| Household Durables—0.2% | | | | | |
| DR Horton, Inc. | | | 5,170 | | | | 179,192 | |
| Lennar Corp., Cl. A | | | 4,500 | | | | 176,175 | |
| Mohawk Industries, Inc.1 | | | 2,580 | | | | 301,757 | |
| | | | | | | | 657,124 | |
| Interactive Media & Services—3.7% | | | | | |
| Alphabet, Inc., Cl. A1,2 | | | 12,896 | | | | 13,475,804 | |
| Media—0.8% | | | | | |
| DISH Network Corp., Cl. A1 | | | 20,363 | | | | 508,464 | |
| Media General, Inc.1,3,4 | | | 1,099 | | | | 59 | |
| Tribune Media Co., Cl. A | | | 56,249 | | | | 2,552,580 | |
| | | | | | | | 3,061,103 | |
| Specialty Retail—0.5% | | | | | |
| Children’s Place, Inc. (The) | | | 3,990 | | | | 359,459 | |
| Lowe’s Cos., Inc. | | | 10,930 | | | | 1,009,495 | |
| Ross Stores, Inc. | | | 3,910 | | | | 325,312 | |
| | | | | | | | 1,694,266 | |
| Consumer Staples—1.2% | | | | | |
| Beverages—0.6% | | | | | |
| Coca-Cola Co. (The)2 | | | 46,970 | | | | 2,224,029 | |
| Tobacco—0.6% | | | | | |
| Philip Morris International, Inc.2 | | | 29,730 | | | | 1,984,775 | |
| Energy—8.3% | | | | | |
| Energy Equipment & Services—0.3% | | | | | |
| Halliburton Co. | | | 7,405 | | | | 196,825 | |
| Schlumberger Ltd. | | | 8,265 | | | | 298,201 | |
| USA Compression Partners LP5 | | | 34,586 | | | | 448,926 | |
| | | | | | | | 943,952 | |
| Oil, Gas & Consumable Fuels—8.0% | | | | | |
| Antero Midstream GP LP | | | 54,169 | | | | 605,609 | |
| Buckeye Partners LP5 | | | 47,769 | | | | 1,384,823 | |
| Chevron Corp. | | | 4,400 | | | | 478,676 | |
| Concho Resources, Inc.1 | | | 2,690 | | | | 276,505 | |
| ConocoPhillips | | | 8,262 | | | | 515,136 | |
| DCP Midstream LP5 | | | 15,444 | | | | 409,112 | |
| Energy Transfer LP5,2 | | | 309,580 | | | | 4,089,552 | |
| Enterprise Products Partners LP5 | | | 97,904 | | | | 2,407,459 | |
| EOG Resources, Inc. | | | 2,962 | | | | 258,316 | |
| EQM Midstream Partners LP5 | | | 29,336 | | | | 1,268,782 | �� |
| Magellan Midstream Partners LP5 | | | 25,955 | | | | 1,480,992 | |
| MPLX LP5 | | | 58,587 | | | | 1,775,186 | |
| Occidental Petroleum Corp. | | | 10,770 | | | | 661,063 | |
| Phillips 66 Partners LP5 | | | 53 | | | | 2,232 | |
| Pioneer Natural Resources Co. | | | 2,100 | | | | 276,192 | |
| Plains All American Pipeline LP5 | | | 10,056 | | | | 201,522 | |
| Plains GP Holdings LP, Cl. A1 | | | 17,231 | | | | 346,343 | |
| Sunoco LP5 | | | 6,737 | | | | 183,179 | |
| Tallgrass Energy LP, Cl. A | | | 91,205 | | | | 2,219,930 | |
| Targa Resources Corp. | | | 31,183 | | | | 1,123,212 | |
| TC PipeLines LP5 | | | 48,396 | | | | 1,554,480 | |
| TOTAL SA, Sponsored ADR | | | 12,820 | | | | 668,948 | |
| TransMontaigne Partners LP5 | | | 23,197 | | | | 941,334 | |
| Valero Energy Corp. | | | 7,331 | | | | 549,605 | |
| Valero Energy Partners LP5 | | | 64,389 | | | | 2,715,284 | |
| Western Gas Partners LP5 | | | 7,852 | | | | 331,590 | |
| Williams Cos., Inc. (The) | | | 103,509 | | | | 2,282,373 | |
| | | | | | | 29,007,435 | |
| | | | | | | | |
| | | Shares | | | Value | |
| Financials—10.6% | | | | | |
| Capital Markets—1.3% | | | | | |
| Goldman Sachs Group, Inc. (The) | | | 5,740 | | | $ | 958,867 | |
| Investment Technology Group, Inc. | | | 90,189 | | | | 2,727,315 | |
| Raymond James Financial, Inc. | | | 5,760 | | | | 428,602 | |
| State Street Corp. | | | 8,170 | | | | 515,282 | |
| | | | | | | | 4,630,066 | |
| Commercial Banks—0.9% | | | | | |
| BNP Paribas SA | | | 10,100 | | | | 454,886 | |
| M&T Bank Corp. | | | 10,085 | | | | 1,443,466 | |
| PNC Financial Services Group, Inc. (The) | | | 3,640 | | | | 425,553 | |
| Wells Fargo & Co. | | | 20,590 | | | | 948,787 | |
| | | | | | | | 3,272,692 | |
| Diversified Financial Services—0.0% | | | | | |
| NewStar Financial, Inc.1,3 | | | 409 | | | | — | |
| Insurance—2.5% | | | | | |
| Allstate Corp. (The) | | | 6,300 | | | | 520,569 | |
| Aspen Insurance Holdings Ltd. | | | 64,683 | | | | 2,716,039 | |
| Chubb Ltd. | | | 22,815 | | | | 2,947,242 | |
| Navigators Group, Inc. (The) | | | 39,568 | | | | 2,749,580 | |
| Travelers Cos., Inc. (The) | | | 2,720 | | | | 325,720 | |
| | | | | | | | 9,259,150 | |
| Real Estate Investment Trusts (REITs)—4.5% | | | | | |
| Agree Realty Corp. | | | 7,760 | | | | 458,771 | |
| Allied Properties Real Estate Investment Trust | | | 10,380 | | | | 336,977 | |
| AvalonBay Communities, Inc. | | | 2,420 | | | | 421,201 | |
| Blackstone Mortgage Trust, Inc., Cl. A | | | 45,445 | | | | 1,447,878 | |
| Boston Properties, Inc. | | | 4,030 | | | | 453,576 | |
| Chesapeake Lodging Trust | | | 600 | | | | 14,610 | |
| Cousins Properties, Inc. | | | 28,910 | | | | 228,389 | |
| Crown Castle International Corp. | | | 920 | | | | 99,940 | |
| Derwent London plc | | | 1,780 | | | | 64,605 | |
| Dexus | | | 26,799 | | | | 200,422 | |
| Digital Realty Trust, Inc. | | | 7,170 | | | | 763,963 | |
| Equinix, Inc. | | | 470 | | | | 165,703 | |
| Equity Residential | | | 8,460 | | | | 558,445 | |
| Extra Space Storage, Inc. | | | 4,950 | | | | 447,876 | |
| First Industrial Realty Trust, Inc. | | | 8,740 | | | | 252,236 | |
| Fortune Real Estate Investment Trust | | | 104,000 | | | | 119,273 | |
| Gaming & Leisure Properties, Inc. | | | 4,800 | | | | 155,088 | |
| Gecina SA | | | 1,580 | | | | 203,965 | |
| GLPJ-REIT | | | 296 | | | | 302,357 | |
| Goodman Group | | | 45,300 | | | | 339,069 | |
| Green REIT plc | | | 93,771 | | | | 144,806 | |
| Hammerson plc | | | 12,870 | | | | 53,896 | |
| Hoshino Resorts REIT, Inc. | | | 35 | | | | 165,833 | |
| Host Hotels & Resorts, Inc. | | | 10,970 | | | | 182,870 | |
| ICADE | | | 2,040 | | | | 155,081 | |
| InfraREIT, Inc. | | | 6,730 | | | | 141,465 | |
| Inmobiliaria Colonial Socimi SA | | | 22,787 | | | | 211,803 | |
| Invesco Office J-Reit, Inc. | | | 1,622 | | | | 226,562 | |
| Invincible Investment Corp. | | | 240 | | | | 99,068 | |
| Keppel REIT | | | 388,300 | | | | 324,928 | |
| Kilroy Realty Corp. | | | 8,500 | | | | 534,480 | |
| Land Securities Group plc | | | 18,581 | | | | 190,476 | |
| Link REIT | | | 38,000 | | | | 382,683 | |
| LondonMetric Property plc | | | 40,080 | | | | 88,776 | |
| Mapletree Logistics Trust | | | 210,700 | | | | 194,547 | |
| Medical Properties Trust, Inc. | | | 13,510 | | | | 217,241 | |
| National Retail Properties, Inc. | | | 7,280 | | | | 353,153 | |
| New Residential Investment Corp. | | | 8,850 | | | | 125,759 | |
| Park Hotels & Resorts, Inc. | | | 7,790 | | | | 202,384 | |
| Physicians Realty Trust | | | 10,070 | | | | 161,422 | |
| Prologis, Inc. | | | 9,510 | | | | 558,427 | |
| Regency Centers Corp. | | | 8,292 | | | | 486,575 | |
| Scentre Group | | | 106,999 | | | | 293,896 | |
7 OPPENHEIMER GLOBAL MULTI-ALTERNATIVES FUND/VA
CONSOLIDATED STATEMENT OF INVESTMENTSContinued
| | | | | | | | |
| | | Shares | | | Value | |
| Real Estate Investment Trusts (REITs) (Continued) | |
| Segro plc | | | 19,380 | | | $ | 145,369 | |
| Simon Property Group, Inc. | | | 3,080 | | | | 517,409 | |
| Starwood Property Trust, Inc. | | | 30,590 | | | | 602,929 | |
| STORE Capital Corp. | | | 10,200 | | | | 288,762 | |
| Sun Communities, Inc. | | | 2,480 | | | | 252,241 | |
| UDR, Inc. | | | 15,390 | | | | 609,752 | |
| Unibail-Rodamco-Westfield | | | 2,193 | | | | 338,750 | |
| Unite Group plc (The) | | | 23,400 | | | | 240,072 | |
| VICI Properties, Inc. | | | 10,240 | | | | 192,307 | |
| Weingarten Realty Investors | | | 4,390 | | | | 108,916 | |
| Welltower, Inc. | | | 6,030 | | | | 418,542 | |
| | | | | | | | 16,245,524 | |
| Real Estate Management & Development—1.3% | |
| Castellum AB | | | 14,788 | | | | 272,211 | |
| China Overseas Land & Investment Ltd. | | | 98,000 | | | | 337,291 | |
| China Resources Land Ltd. | | | 82,000 | | | | 313,081 | |
| City Developments Ltd. | | | 22,700 | | | | 134,711 | |
| CK Asset Holdings Ltd. | | | 74,500 | | | | 541,746 | |
| Deutsche Wohnen SE | | | 2,543 | | | | 116,563 | |
| Fabege AB | | | 11,610 | | | | 154,562 | |
| Hulic Co. Ltd. | | | 16,900 | | | | 151,230 | |
| KWG Group Holdings Ltd. | | | 195,500 | | | | 171,200 | |
| Mitsubishi Estate Co. Ltd. | | | 15,100 | | | | 236,631 | |
| Mitsui Fudosan Co. Ltd. | | | 19,400 | | | | 429,853 | |
| Shimao Property Holdings Ltd. | | | 92,500 | | | | 244,683 | |
| Shurgard Self Storage S.A.1 | | | 2,544 | | | | 70,640 | |
| SM Prime Holdings, Inc. | | | 126,000 | | | | 85,770 | |
| StorageVault Canada, Inc. | | | 70,058 | | | | 121,621 | |
| Sumitomo Realty & Development Co. Ltd. | | | 5,400 | | | | 197,228 | |
| Swire Properties Ltd. | | | 43,600 | | | | 152,356 | |
| Vonovia SE | | | 18,351 | | | | 832,877 | |
| Wharf Real Estate Investment Co. Ltd. | | | 38,000 | | | | 225,882 | |
| | | | | | | | 4,790,136 | |
| Thrifts & Mortgage Finance—0.1% | | | | | |
| WSFS Financial Corp. | | | 6,980 | | | | 264,612 | |
| Health Care—4.5% | | | | | |
| Biotechnology—0.7% | | | | | |
| TESARO, Inc.1 | | | 35,057 | | | | 2,602,982 | |
| Health Care Equipment & Supplies—0.5% | |
| Abbott Laboratories | | | 8,800 | | | | 636,504 | |
| Medtronic plc | | | 13,492 | | | | 1,227,232 | |
| | | | | | | | 1,863,736 | |
| Health Care Providers & Services—1.4% | |
| AMN Healthcare Services, Inc.1 | | | 5,950 | | | | 337,127 | |
| Cigna Corp. | | | 5,984 | | | | 1,136,481 | |
| Civitas Solutions, Inc.1 | | | 33,026 | | | | 578,285 | |
| HCA Healthcare, Inc. | | | 2,675 | | | | 332,904 | |
| Premier, Inc., Cl. A1 | | | 16,410 | | | | 612,914 | |
| Quest Diagnostics, Inc. | | | 5,520 | | | | 459,650 | |
| UnitedHealth Group, Inc.2 | | | 6,985 | | | | 1,740,103 | |
| | | | | | | | 5,197,464 | |
| Life Sciences Tools & Services—0.7% | |
| Pacific Biosciences of California, Inc.1 | | | 342,696 | | | | 2,535,951 | |
| Pharmaceuticals—1.2% | | | | | |
| Allergan plc2 | | | 3,210 | | | | 429,049 | |
| Ambit Biosciences Corp.1,3 | | | 10,347 | | | | — | |
| Merck & Co., Inc. | | | 17,375 | | | | 1,327,624 | |
| Mylan NV1 | | | 20,450 | | | | 560,330 | |
| Novartis AG, Sponsored ADR | | | 11,973 | | | | 1,027,403 | |
| Roche Holding AG | | | 3,699 | | | | 914,667 | |
| Teva Pharmaceutical Industries Ltd.1 | | | 10 | | | | — | |
| | | | | | | 4,259,073 | |
| | | | | | | | |
| | | Shares | | | Value | |
| Industrials—4.7% | | | | | |
| Aerospace & Defense—2.2% | | | | | |
| Esterline Technologies Corp.1 | | | 22,688 | | | $ | 2,755,458 | |
| L3 Technologies, Inc. | | | 3,480 | | | | 604,337 | |
| Lockheed Martin Corp. | | | 5,365 | | | | 1,404,772 | |
| Northrop Grumman Corp. | | | 4,640 | | | | 1,136,336 | |
| Raytheon Co. | | | 6,410 | | | | 982,973 | |
| Sparton Corp.1 | | | 51,323 | | | | 933,565 | |
| | | | | | | | 7,817,441 | |
| Air Freight & Couriers—0.1% | | | | | |
| FedEx Corp. | | | 2,260 | | | | 364,606 | |
| Airlines—0.0% | | | | | |
| CHC Group LLC1,4 | | | 697 | | | | — | |
| Commercial Services & Supplies—0.3% | | | | | |
| Republic Services, Inc., Cl. A | | | 15,680 | | | | 1,130,371 | |
| Construction & Engineering—0.1% | | | | | |
| Granite Construction, Inc. | | | 6,490 | | | | 261,417 | |
| Electrical Equipment—0.7% | | | | | |
| Emerson Electric Co. | | | 40,000 | | | | 2,390,000 | |
| Industrial Conglomerates—0.3% | | | | | |
| Honeywell International, Inc.2 | | | 8,290 | | | | 1,095,275 | |
| Machinery—0.3% | | | | | |
| Stanley Black & Decker, Inc. | | | 9,320 | | | | 1,115,977 | �� |
| Professional Services—0.7% | | | | | |
| Dun & Bradstreet Corp. (The) | | | 19,097 | | | | 2,725,905 | |
| Information Technology—10.1% | | | | | |
| Communications Equipment—1.2% | | | | | |
| ARRIS International plc1 | | | 86,626 | | | | 2,648,157 | |
| Cisco Systems, Inc. | | | 42,450 | | | | 1,839,358 | |
| | | | | | | | 4,487,515 | |
| Electronic Equipment, Instruments, & Components—0.8% | |
| Electro Scientific Industries, Inc.1 | | | 90,679 | | | | 2,716,743 | |
| IT Services—0.8% | | | | | |
| ConvergeOne Holdings, Inc. | | | 31,372 | | | | 388,386 | |
| Travelport Worldwide Ltd. | | | 164,944 | | | | 2,576,425 | |
| | | | | | | | 2,964,811 | |
| Semiconductors & Semiconductor Equipment—1.8% | |
| Hanergy Thin Film Power Group Ltd.1,4 | | | 161,121 | | | | — | |
| Integrated Device Technology, Inc.1 | | | 56,689 | | | | 2,745,448 | |
| QUALCOMM, Inc.2 | | | 13,769 | | | | 783,594 | |
| Taiwan Semiconductor Manufacturing | | | | | | | | |
| Co. Ltd., Sponsored ADR | | | 23,583 | | | | 870,448 | |
| Xilinx, Inc. | | | 24,245 | | | | 2,064,947 | |
| | | | | | | | 6,464,437 | |
| Software—5.1% | | | | | |
| Apptio, Inc., Cl. A1 | | | 72,038 | | | | 2,734,563 | |
| Imperva, Inc.1 | | | 49,863 | | | | 2,776,870 | |
| Microsoft Corp.2 | | | 80,000 | | | | 8,125,600 | |
| MINDBODY, Inc., Cl. A1 | | | 66,254 | | | | 2,411,646 | |
| Red Hat, Inc.1 | | | 14,352 | | | | 2,520,785 | |
| | | | | | | | 18,569,464 | |
| Technology Hardware, Storage & Peripherals—0.4% | |
| Apple, Inc. | | | 8,600 | | | | 1,356,564 | |
| Materials—1.1% | | | | | |
| Chemicals—0.5% | | | | | |
| Celanese Corp., Cl. A2 | | | 11,190 | | | | 1,006,765 | |
| Westlake Chemical Partners LP5 | | | 31,010 | | | | 748,271 | |
| | | | | | | | 1,755,036 | |
| Containers & Packaging—0.5% | | | | | |
| Packaging Corp. of America | | | 6,620 | | | | 552,505 | |
| Sonoco Products Co.2 | | | 25,310 | | | | 1,344,720 | |
| | | | | | | 1,897,225 | |
8 OPPENHEIMER GLOBAL MULTI-ALTERNATIVES FUND/VA
| | | | | | | | |
| | | Shares | | | Value | |
| Metals & Mining—0.1% | |
Steel Dynamics, Inc. | | | 7,670 | | | $ | 230,407 | |
| Telecommunication Services—0.6% | |
| Diversified Telecommunication Services—0.6% | |
| BCE, Inc. | | | 30,545 | | | | 1,207,444 | |
| Verizon Communications, Inc. | | | 17,190 | | | | 966,422 | |
| | | | | | | | 2,173,866 | |
| Utilities—1.5% | |
| Electric Utilities—0.6% | |
| American Electric Power Co., Inc. | | | 18,160 | | | | 1,357,278 | |
| Duke Energy Corp. | | | 740 | | | | 63,862 | |
| Edison International | | | 8,195 | | | | 465,230 | |
| Exelon Corp. | | | 1,420 | | | | 64,042 | |
| Xcel Energy, Inc. | | | 1,250 | | | | 61,588 | |
| | | | | | | | 2,012,000 | |
| Independent Power and Renewable Electricity Producers—0.6% | |
| NRG Energy, Inc. | | | 58,000 | | | | 2,296,800 | |
| Multi-Utilities—0.3% | |
| CMS Energy Corp. | | | 17,050 | | | | 846,532 | |
| Consolidated Edison, Inc. | | | 810 | | | | 61,933 | |
| Dominion Energy, Inc. | | | 880 | | | | 62,885 | |
| Public Service Enterprise Group, Inc. | | | 1,200 | | | | 62,460 | |
| | | | | | | 1,033,810 | |
Total Common Stocks (Cost $168,987,197) | | | | 174,767,118 | |
| Preferred Stocks—0.6% | |
| Citigroup Capital XIII, 7.75% Cum., Non-Vtg. [US0003M+637]6 | | | 48,625 | | | | 1,285,159 | |
| Kinesis 2017 Sidecar, Preferred1,4 | | | 32,412 | | | | 105,921 | |
| M&T Bank Corp., 6.375% Cum., Series A, Non-Vtg. | | | 340 | | | | 344,246 | |
| M&T Bank Corp., 6.375% Cum., Series C, Non-Vtg. | | | 475 | | | | 479,406 | |
| Total Preferred Stocks (Cost $2,444,298) | | | | | | | 2,214,732 | |
| | |
| | | Units | | | | |
| Rights, Warrants and Certificates—0.0% | |
| Kaisa Group Holdings Ltd. Rts., Strike Price $1, Exp. 12/31/49, 0.00%1(Cost $0) | | | 231 | | | | — | |
| | |
| | | Principal
Amount | | | | |
| Asset-Backed Securities—2.8% | |
| Bear Stearns Structured Products Trust, Series 2007-EMX1, Cl. A2, 3.806% [US0001M+130], 3/25/376,7 | | $ | 1,600,000 | | | | 1,601,928 | |
| GSAMP Trust, Series2005-HE4, Cl. M3, 3.286% [US0001M+78], 7/25/456 | | | 1,400,000 | | | | 1,391,684 | |
| Morgan Stanley ABS Capital I, Inc. Trust, Series2006-NC1, Cl. M1, 2.886% [US0001M+38], 12/25/356 | | | 1,780,000 | | | | 1,768,282 | |
| New Century Home Equity Loan Trust, Series2005-1, Cl. M2, 3.226% [US0001M+72], 3/25/356 | | | 397,953 | | | | 383,970 | |
| Raspro Trust, Series2005-1A, Cl. G, 3.192% [LIBOR03M+40], 3/23/246,7 | | | 591,639 | | | | 596,587 | |
| SG Mortgage Securities Trust, Series 2005-OPT1, Cl. M2, 2.956% [US0001M+45], 10/25/356 | | | 4,250,000 | | | | 4,220,923 | |
Total Asset-Backed Securities (Cost $8,921,227) | | | | | | | 9,963,374 | |
| Mortgage-Backed Obligation—0.6% | |
| RAMP Trust, Series2005-RS6, Cl. M4, 3.481% [US0001M+97.5], 6/25/356(Cost $2,098,602) | | | 2,300,000 | | | | 2,300,788 | |
| | | | | | | | |
| | |
| | | Principal
Amount | | | Value | |
| Foreign Government Obligation—6.1% | | | | | | | | |
Federative Republic of Brazil, 5.825%, 4/1/1911(Cost $22,105,168) BRL | | | 86,800,000 | | | $ | 22,063,134 | |
| Non-Convertible Corporate Bonds and Notes—1.9% | |
| Amphenol Corp., 2.55% Sr. Unsec. Nts., 1/30/19 | | | 500,000 | | | | 499,681 | |
| Bank of America Corp., 6.25% [US0003M+370.5] Jr. Sub. Perpetual Bonds6,8 | | | 1,290,000 | | | | 1,276,133 | |
Daimler Finance North America LLC, 3.132% [US0003M+55] Sr. Unsec. Nts., 5/4/216,7 | | | 500,000 | | | | 495,713 | |
| Goldman Sachs Capital II, 4.00% [US0003M+76.75] Jr. Sub. Perpetual Bonds6,8 | | | 8,000 | | | | 5,460 | |
| Goldman Sachs Group, Inc. (The): 5.375% [US0003M+392.2] Jr. Sub. Perpetual Bonds6,8 | | | 999,000 | | | | 966,552 | |
| 5.70% [US0003M+388.4] Jr. Sub. Perpetual Bonds, Series L6,8 | | | 580,000 | | | | 566,283 | |
Lukoil International Finance BV, 6.125% Sr. Unsec. Nts., 11/9/207 | | | 1,284,000 | | | | 1,325,602 | |
| Nutrien Ltd., 6.75%, 1/15/19 | | | 300,000 | | | | 300,338 | |
| Resolute Energy Corp., 8.50% Sr. Unsec. Nts., 5/1/20 | | | 600,000 | | | | 591,750 | |
| Samson Investment Co., 9.75% Sr. Unsec. Nts., 2/15/203,4,9 | | | 300,000 | | | | — | |
| SandRidge Energy, Inc., 7.50% Sr. Unsec. Nts., 3/15/213,4,9 | | | 500,000 | | | | — | |
| United States Cellular Corp., 6.70% Sr. Unsec. Nts., 12/15/33 | | | 590,000 | | | | 576,200 | |
| Wells Fargo Bank NA, 2.987% [US0003M+51] Sr. Unsec. Nts., 10/22/216 | | | 425,000 | | | | 420,135 | |
TotalNon-Convertible Corporate Bonds and Notes (Cost $7,289,606) | | | | | | | 7,023,847 | |
| Corporate Loans—3.7% | |
| Axalta Coating Systems US Holdings, Inc., Sr. Sec. Credit Facilities 1st Lien Term Loan, 4.136% [LIBOR4+175], 6/1/246 | | | 3,217,172 | | | | 3,041,563 | |
| Delos Finance Sarl, Sr. Sec. Credit Facilities 1st Lien Term Loan, 4.553% [LIBOR4+175], 10/6/236 | | | 3,165,000 | | | | 3,087,457 | |
| Hilton Worldwide Finance LLC, Sr. Sec. Credit Facilities 1st Lien Term Loan, 4.031% [LIBOR12+175], 10/25/236 | | | 2,892,137 | | | | 2,799,169 | |
| Live Nation Entertainment, Inc., Sr. Sec. Credit Facilities 1st Lien Term Loan, 4.313% [LIBOR4+175], 10/31/236 | | | 797,970 | | | | 781,675 | |
| Neiman Marcus Group Ltd. LLC, Sr. Sec. Credit Facilities 1st Lien Term Loan, 5.568% [LIBOR12+325], 10/25/206 | | | 755,179 | | | | 640,724 | |
| Vistra Operations Co. LLC, Sr. Sec. Credit Facilities 1st Lien Term Loan, 4.595% [LIBOR12+225], 12/14/236 | | | 3,300,326 | | | | 3,182,076 | |
Total Corporate Loans (Cost $14,136,584) | | | | | | | 13,532,664 | |
| Event-Linked Bonds—16.4% | |
| Earthquake—5.0% | | | | | | | | |
| Acorn Re Ltd. Catastrophe Linked Nts., 4.986% [US0003M+275], 11/10/216,7 | | | 500,000 | | | | 494,875 | |
Azzurro RE I DAC Catastrophe Linked Nts., 2.15% [EUR003M+215], 1/16/196,10 EUR | | | 800,000 | | | | 916,531 | |
9 OPPENHEIMER GLOBAL MULTI-ALTERNATIVES FUND/VA
CONSOLIDATED STATEMENT OF INVESTMENTSContinued
| | | | | | | | | | |
| | | | | Principal
Amount | | | Value | |
| Earthquake (Continued) | | | | | | | | | | |
| Buffalo Re Ltd. Catastrophe Linked Nts.: | | | | | |
| 6.051% [US0006M+348], 4/7/206,7 | | | | $ | 500,000 | | | $ | 500,675 | |
| 9.731% [US0006M+716], 4/7/206,7 | | | | | 250,000 | | | | 249,262 | |
Golden State Re II Ltd. Catastrophe Linked Nts., 4.637%[T-BILL 3MO+220], 1/8/196,7 | | | | | 1,250,000 | | | | 1,254,687 | |
Golden State RE II Ltd. Catastrophe Linked Nts., 4.982% [US0003M+220], 1/8/236,7 | | | | | 500,000 | | | | 497,775 | |
| International Bank for Reconstruction & Development Catastrophe Linked Nts.: | |
| 4.916% [US0003M+250],2/14/20-2/15/216,7 | | | | | 1,500,000 | | | | 1,495,525 | |
| 5.416% [US0003M+300], 2/15/216,7 | | | | | 1,250,000 | | | | 1,242,563 | |
| 8.416% [US0003M+600], 2/15/216,7 | | | | | 900,000 | | | | 895,815 | |
| 10.666% [US0003M+825], 2/14/206,7 | | | | | 500,000 | | | | 496,313 | |
| Kilimanjaro Re Ltd. Catastrophe Linked Nts., 6.195%[T-BILL 3MO+375], 11/25/196,7 | | | | | 750,000 | | | | 739,387 | |
| Kizuna Re II Ltd. Catastrophe Linked Nts.: | | | | | |
| 4.32%[T-BILL 3MO+187.5], 4/11/236,7 | | | | | 750,000 | | | | 730,762 | |
| 4.945%[T-BILL 3MO+250], 4/11/236,7 | | | | | 250,000 | | | | 244,212 | |
| Merna Re Ltd. Catastrophe Linked Nts.: | | | | | |
| 4.445%[T-BILL 3MO+200],4/8/20-4/8/216,7 | | | | | 1,250,000 | | | | 1,248,737 | |
| Nakama Re Ltd. Catastrophe Linked Nts.: | | | | | |
| 3.25% [US0006M+325], 10/13/216,7 | | | | | 750,000 | | | | 740,813 | |
| 4.236% [US0003M+200], 4/13/236,7 | | | | | 500,000 | | | | 493,375 | |
| 4.429% [US0006M+220], 10/13/216,7 | | | | | 650,000 | | | | 640,868 | |
| 4.567%[T-BILL 3MO+212.5], 1/16/196,7 | | | | | 750,000 | | | | 752,062 | |
| 5.236% [US0003M+300], 4/13/236,7 | | | | | 500,000 | | | | 491,925 | |
| 5.317%[T-BILL 3MO+287.5],1/16/20-1/14/216,7 | | | | | 1,000,000 | | | | 993,975 | |
| 5.692%[T-BILL 3MO+325], 1/14/216,7 | | | | | 250,000 | | | | 247,738 | |
| Torrey Pines Re Ltd. Catastrophe Linked Nts.: | |
| 5.472% [US0006M+303], 6/9/206,7 | | | | | 375,000 | | | | 369,769 | |
| 6.289% [US0006M+380], 6/9/206,7 | | | | | 250,000 | | | | 248,313 | |
| 9.039% [US0006M+655], 6/9/206,7 | | | | | 500,000 | | | | 503,675 | |
| Ursa Re Ltd. Catastrophe Linked Nts.: | | | | | |
| 4.00% [ZERO+400], 12/10/196,7 | | | | | 500,000 | | | | 490,875 | |
| 5.25%[T-BILL 3MO+525], 12/10/206,7 | | | | | 500,000 | | | | 495,225 | |
| 6.452%[T-BILL 3MO+400], 12/10/206,7 | | | | | 250,000 | | | | 246,488 | |
| 8.452%[T-BILL 3MO+600], 5/27/206,7 | | | | | 500,000 | | | | 494,375 | |
| | | | | | | | | | 18,216,595 | |
| Fire—0.0% | | | | | | | | | | |
Cal Phoenix Re Ltd. Catastrophe Linked Nts., 9.918% [US0003M+750], 8/13/216,7 | | | | | 850,000 | | | | 85,000 | |
| Longevity—0.1% | | | | | | | | | | |
Vita Capital VI Ltd. Catastrophe Linked Nts., 5.24% [US0006M+290], 1/8/216,7 | | | | | 250,000 | | | | 252,362 | |
| Multiple Event—7.5% | | | | | | | | | | |
Alamo Re Ltd. Catastrophe Linked Nts., 5.692%[T-BILL 1MO+325], 6/7/216,7 | | | | | 250,000 | | | | 247,787 | |
| Armor Re II Ltd. Catastrophe Linked Nts., 5.945%[T-BILL 3MO+350], 6/8/206,7 | | | | | 750,000 | | | | 744,487 | |
| Atlas Capital UK 2018 plc Catastrophe Linked Nts., 8.578% [US0003M+600], 6/7/226,7 | | | | | 250,000 | | | | 249,987 | |
| Atlas IX Capital DAC Catastrophe Linked Nts., 10.677% [US0003M+788], 1/7/196,7 | | | | | 500,000 | | | | 370,000 | |
| Blue Halo Re Ltd. Catastrophe Linked Nts.: | | | | | |
| 10.695%[T-BILL 3MO+825], 7/26/196,7 | | | | | 250,000 | | | | 251,187 | |
| | | | | | | | | | |
| | | | | Principal
Amount | | | Value | |
| Multiple Event (Continued) | |
| Blue Halo Re Ltd. Catastrophe Linked Nts.: (Continued) | |
| 16.445%[T-BILL 3MO+1,400], 6/21/196,7 | | | | $ | 500,000 | | | $ | 488,750 | |
| Bonanza Re Ltd. Catastrophe Linked Nts.: | | | | | |
| 6.141% [US0006M+398], 12/31/196,7 | | | | | 250,000 | | | | 245,387 | |
| 7.391% [US0006M+523], 12/31/196,7 | | | | | 250,000 | | | | 244,962 | |
| Bowline Re Ltd. Series2018-1 Catastrophe Linked Nts., 6.945%[T-BILL 3MO+450], 5/23/226,7 | | | | | 750,000 | | | | 729,937 | |
| Caelus Re IV Ltd. Catastrophe Linked Nts., 7.972%[T-BILL 3MO+553], 3/6/206,7 | | | | | 500,000 | | | | 485,000 | |
| Caelus Re V Ltd. Catastrophe Linked Nts.: | | | | | |
| 2.942%[T-BILL 1MO+50], 6/5/206,7 | | | | | 1,000,000 | | | | 122,550 | |
| 5.652%[T-BILL 3MO+321], 6/5/206,7 | | | | | 750,000 | | | | 657,975 | |
| 5.942%[T-BILL 3MO+350], 6/7/216,7 | | | | | 250,000 | | | | 235,937 | |
| 9.942%[T-BILL 3MO+750], 6/7/216,7 | | | | | 250,000 | | | | 191,250 | |
| 12.942%[T-BILL 3MO+1,050], 6/7/216,7 | | | | | 250,000 | | | | 88,437 | |
| Citrus Re Ltd. Catastrophe Linked Nts., 7.371% [US0006M+523], 3/18/206,7 | | | | | 127,052 | | | | 125,146 | |
| Cranberry Re Ltd. Catastrophe Linked Nts., 4.481% [US0006M+200], 7/13/206,7 | | | | | 750,000 | | | | 741,412 | |
| East Lane Re VI Ltd. Catastrophe Linked Nts., 5.842%[T-BILL 3MO+339], 3/13/206,7 | | | | | 500,000 | | | | 500,575 | |
| Eclipse Re Ltd. Catastrophe Linked Nts., 0.00%, 7/1/197 | | | | | 250,000 | | | | 245,102 | |
| FloodSmart Re Ltd. Catastrophe Linked Nts.: | | | | | |
| 13.728%[T-BILL 3MO+1,125], 8/6/216,7 | | | | | 250,000 | | | | 248,362 | |
| 15.978%[T-BILL 3MO+1,350], 8/6/216,7 | | | | | 250,000 | | | | 248,612 | |
| Fortius Re II Ltd. Catastrophe Linked Nts., 4.803% [US0006M+375], 7/7/216,7 | | | | | 750,000 | | | | 749,138 | |
| Galilei Re Ltd. Catastrophe Linked Nts.: | | | | | |
| 6.84% [US0006M+466], 1/8/206,7 | | | | | 500,000 | | | | 500,175 | |
| 6.86% [US0006M+466], 1/8/216,7 | | | | | 500,000 | | | | 491,875 | |
| 10.61% [US0006M+841], 1/8/216,7 | | | | | 250,000 | | | | 245,862 | |
| 16.06% [US0006M+1,388], 1/8/206,7 | | | | | 250,000 | | | | 249,137 | |
| 16.08% [US0006M+1,388], 1/8/216,7 | | | | | 500,000 | | | | 495,075 | |
| Galileo Re Ltd. Catastrophe Linked Nts.: | | | | | |
| 15.947%[T-BILL 3MO+1,351], 1/8/196,7 | | | | | 500,000 | | | | 501,875 | |
| 19.912% [US0003M+1,750], 11/6/206,7 | | | | | 250,000 | | | | 251,512 | |
| Kendall Re Ltd. Catastrophe Linked | | | | | |
| Nts., 7.682% [US0003M+525], 5/6/216,7 | | | | | 750,000 | | | | 741,188 | |
| Kilimanjaro II Re Ltd. Catastrophe Linked Nts.: | | | | | |
| 9.713% [US0006M+714], 4/20/216,7 | | | | | 250,000 | | | | 248,563 | |
| 12.063% [US0006M+949], 4/20/216,7 | | | | | 750,000 | | | | 745,613 | |
| Kilimanjaro Re Ltd. Catastrophe Linked Nts.: | | | | | |
| 6.858% [US0003M+465], 5/6/226,7 | | | | | 500,000 | | | | 485,075 | |
| 6.878% [US0003M+465], 5/5/236,7 | | | | | 500,000 | | | | 483,025 | |
| 9.195%[T-BILL 3MO+675], 12/6/196,7 | | | | | 250,000 | | | | 250,163 | |
| 11.695%[T-BILL 3MO+925], 12/6/196,7 | | | | | 250,000 | | | | 249,388 | |
| 14.708% [US0003M+1,250], 5/6/226,7 | | | | | 500,000 | | | | 487,525 | |
| 14.728% [US0003M+1,250], 5/5/236,7 | | | | | 500,000 | | | | 481,225 | |
| Lion II Re DAC Catastrophe Linked Nts., 3.17% [EUR003M+317], 7/15/216,7 | | EUR | | | 750,000 | | | | 856,885 | |
| Loma Reinsurance Bermuda Ltd. Catastrophe Linked Nts., 0.50%[T-BILL 3MO+50], 1/8/196,7 | | | | | 500,000 | | | | 227,500 | |
10 OPPENHEIMER GLOBAL MULTI-ALTERNATIVES FUND/VA
| | | | | | | | | | |
| | | | | Principal
Amount | | | Value | |
| Multiple Event (Continued) | |
| MetroCat Re Ltd. Catastrophe Linked Nts., 6.145%[T-BILL 3MO+370], 5/8/206,7 | | | | $ | 500,000 | | | $ | 498,075 | |
| Northshore Re II Ltd. Catastrophe Linked Nts., 10.363% [US0003M+770], 7/8/226,7 | | | | | 500,000 | | | | 498,625 | |
| Panthera Re Ltd. Catastrophe Linked Nts., 5.945%[T-BILL 3MO+350], 3/9/206,7 | | | | | 250,000 | | | | 252,025 | |
| Residential Reinsurance 2013 Ltd. Catastrophe Linked Nts., 2.952%[T-BILL 3MO+50], 3/6/196,7 | | | | | 125,000 | | | | 121,875 | |
| Residential Reinsurance 2014 Ltd. Catastrophe Linked Nts., 2.952%[T-BILL 3MO+50], 3/6/196,7 | | | | | 750,000 | | | | 75 | |
| Residential Reinsurance 2015 Ltd. Catastrophe Linked Nts., 13.422%[T-BILL 3MO+1097], 6/6/196,7 | | | | | 500,000 | | | | 30,000 | |
| Residential Reinsurance 2016 Ltd. Catastrophe Linked Nts.: | |
| 5.702%[T-BILL 3MO+325], 6/6/206,7 | | | | | 1,000,000 | | | | 990,250 | |
| 6.272%[T-BILL 3MO+382], 12/6/206,7 | | | | | 250,000 | | | | 249,763 | |
13.972%[T-BILL 3MO+1,152], 6/6/206,7 | | | | | 750,000 | | | | 41,250 | |
| Residential Reinsurance 2017 Ltd. Catastrophe Linked Nts.: | |
| 5.502%[T-BILL 3MO+305], 6/6/216,7 | | | | | 375,000 | | | | 367,856 | |
| 18.364%, 3/6/197,11 | | | | | 250,000 | | | | 231,875 | |
| Residential Reinsurance 2018 Ltd. Catastrophe Linked Nts.: | |
| 5.702%[T-BILL 3MO+325], 6/6/226,7 | | | | | 500,000 | | | | 489,375 | |
| 12.376%, 6/6/197,11 | | | | | 500,000 | | | | 90,000 | |
| 13.952%[T-BILL 3MO+1,150], 12/6/226,7 | | | | | 500,000 | | | | 495,175 | |
| 22.565%, 12/6/197,11 | | | | | 750,000 | | | | 600,675 | |
| Resilience Re Ltd. Catastrophe Linked Nts.: | |
| 7.50%, 2/8/1911 | | | | | 250,000 | | | | 249,025 | |
| 10.63%, 4/8/197,11 | | | | | 250,000 | | | | 248,488 | |
| Riverfront Re Ltd. Catastrophe Linked Nts.: | |
| 7.172%[T-BILL 3MO+472], 1/15/216,7 | | | | | 750,000 | | | | 748,238 | |
| 9.202%[T-BILL 3MO+675], 1/15/216,7 | | | | | 500,000 | | | | 498,125 | |
| Sanders Re Ltd. Catastrophe Linked Nts.: | |
| 5.624% [US0006M+311], 6/5/206,7 | | | | | 750,000 | | | | 743,138 | |
| 5.644% [US0006M+307], 12/6/216,7 | | | | | 750,000 | | | | 741,263 | |
| 7.952%[T-BILL 3MO+550], 4/7/226,7 | | | | | 750,000 | | | | 740,738 | |
| SD Re Ltd. Catastrophe Linked Nts., 6.276% [US0003M+400], 10/19/216,7 | | | | | 850,000 | | | | 833,808 | |
| Spectrum Capital Ltd. Catastrophe Linked Nts.: | |
| 6.085% [US0006M+350], 6/8/216,7 | | | | | 250,000 | | | | 249,088 | |
| 8.335% [US0006M+575], 6/8/216,7 | | | | | 250,000 | | | | 246,963 | |
| Tailwind Re Ltd.2017-1 Catastrophe | |
| Linked Nts., 13.452%[T-BILL 3MO+1100], 1/8/226,7 | | | | | 250,000 | | | | 250,688 | |
| Tramline Re II Ltd. Catastrophe Linked Nts., 10.702%[T-BILL 3MO+825], 1/4/196,7 | | | | | 400,000 | | | | 401,300 | |
| | | | | | | | | | 27,111,397 | |
| Other—0.8% | |
| Benu Capital DAC Catastrophe Linked Nts.: | |
| 2.55% [EUR003M+255], 1/8/206,7 | | EUR | | | 250,000 | | | | 289,066 | |
| 3.35% [EUR003M+335], 1/8/206,7 | | EUR | | | 500,000 | | | | 579,334 | |
| Horse Capital I DAC Catastrophe Linked Nts., 12.00% [EUR003M+1200], 6/15/206,7 | | EUR | | | 750,000 | | | | 872,417 | |
| Vitality Re V Ltd. Catastrophe Linked Nts., 4.952%[T-BILL 3MO+250], 1/7/196,7 | | | | | 250,000 | | | | 250,937 | |
| Vitality Re VII Ltd. Catastrophe Linked Nts., 5.102%[T-BILL 3MO+265], 1/7/206,7 | | | | | 250,000 | | | | 252,613 | |
| | | | | | | | | | |
| | | | | Principal
Amount | | | Value | |
| Other (Continued) | |
| Vitality Re VIII Ltd. Catastrophe Linked Nts., 4.452%[T-BILL 3MO+200], 1/8/216,7 | | | | $ | 500,000 | | | $ | 503,575 | |
| | | | | | | | | | 2,747,942 | |
| Pandemic—0.1% | | | | | | | | | | |
International Bank for Reconstruction & Development Catastrophe Linked Nts., 7.957%[US0006M-40+690], 7/15/20 | | | | | 250,000 | | | | 251,637 | |
| Windstorm—2.9% | | | | | | | | | | |
| Akibare Re Ltd. Catastrophe Linked Nts.: | |
| 4.286% [US0003M+190], 4/7/226,7 | | | | | 250,000 | | | | 244,587 | |
| 4.296% [US0003M+190], 4/7/226,7 | | | | | 500,000 | | | | 490,625 | |
| 4.781% [US0006M+234], 4/7/206,7 | | | | | 500,000 | | | | 495,100 | |
| Alamo Re Ltd. Catastrophe Linked Nts., | |
| 7.292%[T-BILL 3MO+485], 6/8/206,7 | | | | | 250,000 | | | | 249,587 | |
| Aozora Re Ltd. Catastrophe Linked Nts.: | |
| 4.323% [US0006M+200], 4/7/216,7 | | | | | 750,000 | | | | 743,287 | |
| 4.681% [US0006M+224], 4/7/206,7 | | | | | 500,000 | | | | 497,675 | |
| Casablanca Re Ltd. Catastrophe Linked Nts.: | |
| 5.25% [US0006M+525], 6/4/207 | | | | | 250,000 | | | | 253,375 | |
| 17.258% [US0006M+1,600], 6/4/204,7 | | | | | 250,000 | | | | 122,500 | |
| Citrus Re Ltd. Catastrophe Linked Nts., 10.292%[T-BILL 3MO+785], 2/25/196,7 | | | | | 363,396 | | | | 307,069 | |
| Everglades Re II Ltd. Catastrophe Linked Nts., 7.372%[T-BILL 3MO+492], 5/8/206,7 | | | | | 250,000 | | | | 248,812 | |
| First Coast Re2017-1 Ltd. Catastrophe Linked Nts., 6.528%[T-BILL 3MO+405], 6/7/216,7 | | | | | 250,000 | | | | 246,162 | |
| Frontline Re Ltd. Catastrophe Linked Nts., 9.478%[T-BILL 3MO+700], 7/6/226,7 | | | | | 250,000 | | | | 241,937 | |
| Hexagon Reinsurance DAC Catastrophe Linked Nts.: | |
| 6.50% [EUR003M+650], 1/19/226,7 | | EUR | | | 250,000 | | | | 285,922 | |
| 8.00% [EUR003M+800], 1/19/226,7 | | EUR | | | 250,000 | | | | 285,063 | |
| Integrity Re Ltd. Catastrophe Linked Nts., 5.884% [US0003M+375], 6/10/226,7 | | | | | 750,000 | | | | 736,238 | |
| International Bank for Reconstruction & Development Catastrophe Linked Nts.: | |
| 8.034% [US0006M+590], 12/20/196,7 | | | | | 775,000 | | | | 778,759 | |
| 11.434% [US0006M+930], 12/20/196,7 | | | | | 250,000 | | | | 250,200 | |
| Long Point Re III Ltd. Catastrophe Linked Nts., 5.195%[T-BILL 3MO+275], 6/1/226,7 | | | | | 1,100,000 | | | | 1,096,535 | |
| Manatee Re II Ltd. Catastrophe Linked Nts.: | |
| 6.695%[T-BILL 3MO+425], 6/7/216,7 | | | | | 750,000 | | | | 741,713 | |
| 10.195%[T-BILL 3MO+775], 6/7/216 | | | | | 550,000 | | | | 549,258 | |
| Manatee Re Ltd. Catastrophe Linked Nts., 1.899%[T-BILL 3MO+50], 3/10/194,7 | | | | | 500,000 | | | | 12,550 | |
| Pelican IV Re Ltd. Catastrophe Linked Nts., 4.716% [US0003M+225], 5/7/216,7 | | | | | 750,000 | | | | 742,013 | |
| Queen Street XI Re DAC Catastrophe | |
| Linked Nts., 8.602%[T-BILL 3MO+615], 6/7/196,7 | | | | | 250,000 | | | | 250,488 | |
| Queen Street XII Re Designated Activity Co. Catastrophe Linked Nts., 7.966% [US0006M+525], 4/8/206,7 | | | | | 750,000 | | | | 747,938 | |
| | | | | | | | | 10,617,393 | |
Total Event-Linked Bonds
(Cost $65,042,156) | | | | | | | 59,282,326 | |
11 OPPENHEIMER GLOBAL MULTI-ALTERNATIVES FUND/VA
CONSOLIDATED STATEMENT OF INVESTMENTSContinued
| | | | | | | | |
| | | | | Principal
Amount | | Value | |
| Structured Securities—0.3% | |
| Toronto-Dominion Bank (The), Enterprise Products Partners LP Equity Linked Nts.: | |
| Sr. Unsec. Nts.,6/6/19-11/20/19 | | | | $ 1,254,000 | | $ | 1,133,996 | |
Total Structured Securities
(Cost $1,255,603) | | | | | | | 1,133,996 | |
| Short-Term Notes—12.7% | |
| Canada—0.1% | |
Bell Canada, Inc., 2.704%, 2/4/1912,13 | | USD | | 500,000 | | | 498,633 | |
| Italy—0.1% | |
ENI Finance USA, Inc., 2.675%, 1/8/1912,13 | | USD | | 500,000 | | | 499,696 | |
| Japan—4.1% | |
Japan Treasury Discount Bills, 0.00%, 2/12/1911 | | JPY | | 1,630,000,000 | | | 14,874,187 | |
| Mexico—3.8% | |
United Mexican States Treasury Bills, 8.26%, 2/14/1911,13 | | MXN | | 272,000,000 | | | 13,699,690 | |
| United States—4.6% | |
Air Liquide US LLC, 2.684%, 2/15/197,12,13 | | USD | | 500,000 | | | 498,386 | |
| AT&T, Inc.: | | | | | | | | |
| 2.902%, 5/28/197,12,13 | | USD | | 250,000 | | | 246,760 | |
| 3.093%, 5/30/197,12,13 | | USD | | 300,000 | | | 296,056 | |
| Eastman Chemical Co., 2.756%, 1/3/1912,13 | | USD | | 500,000 | | | 499,890 | |
| General Electric Co., 2.814%, 1/11/1913 | | USD | | 500,000 | | | 499,539 | |
| Glencore Funding LLC, 2.779%, 1/7/1912,13 | | USD | | 500,000 | | | 499,734 | |
| United States Treasury Bills, 2.212%, 1/31/1911,14,15 | | USD | | 13,500,000 | | | 13,474,758 | |
Walgreens Boots Alliance, Inc., 2.759%, 1/29/1913 | | USD | | 500,000 | | | 498,837 | |
| | | | | | | 16,513,960 | |
| Total Short-Term Notes (Cost $44,974,088) | | | 46,086,166 | |
| | | |
| | | | | Shares | | | |
| Investment Companies—4.0% | |
| Highland/iBoxx Senior Loan Exchange Traded Fund | | | | 125,133 | | | 2,149,785 | |
| Oppenheimer Institutional Government | | | | | | | | |
Money Market Fund,
Cl. E, 2.35%16,17,18 | | | | 7,565,931 | | | 7,565,931 | |
| SPDR Gold Trust Exchange Traded Fund1,18 | | | | 37,684 | | | 4,569,185 | |
Total Investment Companies
(Cost $14,289,986) | | | | | | | 14,284,901 | |
| | | | | | | | | | | | | | | | | | | | | | | | | | | | | | |
| | | | | | | | | Exercise Price | | | Expiration Date | | | | | | Contracts | | | Notional Amount (000’s) | | | Value |
| Exchange-Traded Options Purchased—0.0% | | | | | | | | | | | | | | | | | | | |
| S&P 500 Index Call1 | | | | | | | USD | | | | 2,795.000 | | | | 1/18/19 | | | | USD | | | | 8 | | | | USD 2,005 | | | $ 320 |
| S&P 500 Index Call1 | | | | | | | USD | | | | 2,840.000 | | | | 2/15/19 | | | | USD | | | | 14 | | | | USD 3,510 | | | 2,170 |
| Total Exchange-Traded Options Purchased (Cost $93,124) | | | | | | | | | | | | | | | | | | | | | | | 2,490 |
| | | Counterparty | | | | | | Exercise Price | | | Expiration Date | | | | | | Contracts | | | Notional Amount (000’s) | | | |
| Over-the-Counter Option Purchased—0.0% | | | | | | | | | | | | | | | | | | | |
| CNH Currency Put (Cost $45,591)1 | | | GSCO-OT | | | | CNH | | | | 6.869 | | | | 8/27/19 | | | | CNH | | | | 12,000,000 | | | CNH | 397,000 | | | 33,648 |
| | | Counterparty | | | Pay / Receive
Floating Rate | | | Floating Rate | | | Fixed Rate | | | Expiration
Date | | | Notional Amount (000’s) | | | |
| Over-the-Counter Interest Rate Swaptions Purchased—0.1% | | | | | | | | | | | | | | | | | | | |
| Interest Rate Swap maturing | | | | | | | | | | | Six-Month JPY BBA | | | | | | | | | | | | | | | | | | | |
| 1/28/31 Put1 | | | GSCOI | | | | Receive | | | | LIBOR | | | | 0.523% | | | | 1/26/21 | | | | JPY | | | | 196,000 | | | 10,613 |
| Interest Rate Swap maturing | | | | | | | | | | | Six-Month JPY BBA | | | | | | | | | | | | | | | | | | | |
| 4/30/31 Put1 | | | GSCOI | | | | Receive | | | | LIBOR | | | | 0.485 | | | | 4/27/21 | | | | JPY | | | | 525,000 | | | 38,569 |
| Interest Rate Swap maturing | | | | | | | | | | | Three-Month USD | | | | | | | | | | | | | | | | | | | |
| 9/29/31 Put1 | | | MSCO | | | | Receive | | | | BBA LIBOR | | | | 3.178 | | | | 9/27/21 | | | | USD | | | | 650 | | | 17,989 |
12 OPPENHEIMER GLOBAL MULTI-ALTERNATIVES FUND/VA
| | | | | | | | | | | | | | | | | | | | | | | | | | | | | | |
| | | Counterparty | | | Pay / Receive
Floating Rate | | | Floating Rate | | | Fixed Rate | | | Expiration
Date | | | Notional Amount (000’s) | | | Value |
| Over-the-Counter Interest Rate Swaptions Purchased (Continued) | | | | | | | | | | | | | | | | | | | |
| Interest Rate Swap maturing | | | | | | | | | | | Three-Month USD | | | | | | | | | | | | | | | | | | | |
| 9/29/31 Put1 | | | MSCO | | | | Receive | | | | BBA LIBOR | | | | 3.253% | | | | 10/21/21 | | | | USD | | | | 10,500 | | | $ 271,783 |
TotalOver-the-Counter Interest Rate Swaptions Purchased (Cost $546,492) | | | | | | | | | | | | | | | | | | | 338,954 |
Total Investments, at Value (Cost $352,229,722) | | | | | | | | | | | | | | | | 97.5% | | | 353,028,138 |
| Net Other Assets (Liabilities) | | | | | | | | | | | | | | | | | | | | | | | | 2.5 | | | 9,088,182 |
| | | | | | | | | | | | | | | | | | | | | | | | | | | |
| Net Assets | | | | | | | | | | | | | | | | | | | | | | | | | | | 100.0% | | | $ 362,116,320 |
| | | | | | | | | | | | | | | | | | | | | | | | | | | |
Footnotes to Consolidated Statement of Investments
1.Non-income producing security.
2. All or portion of the security position is held in segregated accounts and pledged to cover margin requirements with respect to securities sold short. The aggregate market value of such securities is $7,555,155. See Note 10 of accompanying Consolidated Notes.
3. Security received as the result of issuer reorganization.
4. The value of this security was determined using significant unobservable inputs. See Note 3 of the accompanying Consolidated Notes.
5. Security is a Master Limited Partnership.
6. Represents the current interest rate for a variable or increasing rate security, determined as [Referenced Rate + Basis-point spread].
7. Represents securities sold under Rule 144A, which are exempt from registration under the Securities Act of 1933, as amended. These securities have been determined to be liquid under guidelines established by the Board of Trustees. These securities amount to $62,376,907 or 17.23% of the Fund’s net assets at period end.
8. This bond has no contractual maturity date, is not redeemable and contractually pays an indefinite stream of interest.
9. This security is not accruing income because the issuer has missed an interest payment on it and/or is not anticipated to make future interest and or principal payments. The rate shown is the contractual interest rate. See Note 4 of the accompanying Consolidated Notes.
10. Restricted security. The aggregate value of restricted securities at period end was $916,531, which represents 0.25% of the Fund’s net assets. See Note 4 of the accompanying Consolidated Notes. Information concerning restricted securities is as follows:
| | | | | | | | | | | | | | | | |
| Security | | Acquisition
Dates | | | Cost | | | Value | | | Unrealized
Appreciation/
(Depreciation) | |
| Azzurro RE I DAC Catastrophe Linked Nts., 2.15% [EUR003M+215], 1/16/19 | | | 6/12/15-10/5/18 | | | $ | 907,586 | | | $ | 916,531 | | | $ | 8,945 | |
11. Zero coupon bond reflects effective yield on the original acquisition date.
12. Security issued in an exempt transaction without registration under the Securities Act of 1933. Such securities amount to $3,039,155 or 0.84% of the Fund’s net assets, and have been determined to be liquid pursuant to guidelines adopted by the Board of Trustees.
13. Current yield as of period end.
14. All or a portion of the security position is held in accounts at a futures clearing merchant and pledged to cover margin requirements on open futures contracts and written options on futures, if applicable. The aggregate market value of such securities is $1,710,795. See Note 6 of the accompanying Consolidated Notes.
15. All or a portion of the security position is held in segregated accounts and pledged to cover margin requirements under certain derivative contracts. The aggregate market value of such securities is $3,397,635. See Note 6 of the accompanying Consolidated Notes.
16. Is or was an affiliate, as defined in the Investment Company Act of 1940, as amended, at or during the reporting period, by virtue of the Fund owning at least 5% of the voting securities of the issuer or as a result of the Fund and the issuer having the same investment adviser. Transactions during the reporting period in which the issuer was an affiliate are as follows:
| | | | | | | | | | | | | | | | |
| | | Shares
December 31, 2017 | | | Gross
Additions | | | Gross
Reductions | | | Shares
December 31, 2018 | |
| Investment Company | | | | | | | | | | | | | | | | |
| Oppenheimer Institutional Government Money Market Fund, Cl. E | | | 17,082,111 | | | | 467,519,266 | | | | 477,035,446 | | | | 7,565,931 | |
| | | | |
| | | Value | | | Income | | | Realized
Gain (Loss) | | | Change in Unrealized
Gain (Loss) | |
| Investment Company | | | | | | | | | | | | | | | | |
| Oppenheimer Institutional Government Money Market Fund, Cl. E | | $ | 7,565,931 | | | $ | 989,934 | | | $ | — | | | $ | — | |
17. Rate shown is the7-day yield at period end.
18. All or a portion of this security is owned by the subsidiary. See Note 2 of the accompanying Consolidated Notes.
Distribution of investments representing geographic holdings, as a percentage of total investments at value, is as follows:
| | | | | | | | | | | | |
| Geographic Holdings (Unaudited) | | Value | | | Percent | | | | |
| United States | | $ | 227,956,148 | | | | 64.6 | % | | | | |
| Bermuda | | | 29,509,324 | | | | 8.4 | | | | | |
| Brazil | | | 22,063,134 | | | | 6.2 | | | | | |
| Japan | | | 21,061,793 | | | | 6.0 | | | | | |
| Mexico | | | 14,728,649 | | | | 4.2 | | | | | |
| Supranational | | | 7,245,890 | | | | 2.1 | | | | | |
| Cayman Islands | | | 6,551,216 | | | | 1.9 | | | | | |
| Ireland | | | 6,449,081 | | | | 1.8 | | | | | |
| Canada | | | 2,813,752 | | | | 0.8 | | | | | |
| France | | | 2,690,029 | | | | 0.8 | | | | | |
| Switzerland | | | 1,942,071 | | | | 0.5 | | | | | |
| Hong Kong | | | 1,666,623 | | | | 0.5 | | | | | |
| Germany | | | 1,445,152 | | | | 0.4 | | | | | |
| Russia | | | 1,325,602 | | | | 0.4 | | | | | |
| United Kingdom | | | 1,071,750 | | | | 0.3 | | | | | |
| Taiwan | | | 870,449 | | | | 0.2 | | | | | |
13 OPPENHEIMER GLOBAL MULTI-ALTERNATIVES FUND/VA
CONSOLIDATED STATEMENT OF INVESTMENTSContinued
| | | | | | | | | | |
| Geographic Holdings (Unaudited) (Continued) | | Value | | | Percent | | | |
| Australia | | $ | 833,387 | | | | 0.2 | % | | |
| China | | | 821,572 | | | | 0.2 | | | |
| Singapore | | | 654,186 | | | | 0.2 | | | |
| Italy | | | 499,697 | | | | 0.1 | | | |
| Sweden | | | 426,772 | | | | 0.1 | | | |
| Spain | | | 211,803 | | | | 0.1 | | | |
| Philippines | | | 85,770 | | | | 0.0 | | | |
| Luxembourg | | | 70,640 | | | | 0.0 | | | |
| China Offshore | | | 33,648 | | | | 0.0 | | | |
| Finland | | | — | | | | – | | | |
| Netherlands | | | — | | | | – | | | |
| Israel | | | — | | | | – | | | |
| Denmark | | | — | | | | – | | | |
| Total | | $ | 353,028,138 | | | | 100.0 | % | | |
| | | |
| | | | | | | | |
| | | Shares Sold Short | | | Value | |
| Securities Sold Short—(10.6)% | | | | | | | | |
| Common Stock Securities Sold Short—(10.6)% | | | | | | | | |
| AbbVie, Inc. | | | (8,132 | ) | | $ | (749,689) | |
| Air Lease Corp., Cl. A | | | (14,015 | ) | | | (423,393) | |
| Aircastle Ltd. | | | (34,250 | ) | | | (590,470) | |
| Ally Financial, Inc. | | | (59,460 | ) | | | (1,347,364) | |
| Apache Corp. | | | (27,130 | ) | | | (712,162) | |
| AvalonBay Communities, Inc. | | | (1,690 | ) | | | (294,144) | |
| Boeing Co. (The) | | | (2,942 | ) | | | (948,795) | |
| Camden Property Trust | | | (17,580 | ) | | | (1,547,919) | |
| Caterpillar, Inc. | | | (5,610 | ) | | | (712,863) | |
| Church & Dwight Co., Inc. | | | (23,660 | ) | | | (1,555,882) | |
| Cie Financiere Richemont SA | | | (10,579 | ) | | | (679,885) | |
| CNH Industrial NV | | | (38,850 | ) | | | (357,808) | |
| Colgate-Palmolive Co. | | | (17,590 | ) | | | (1,046,957) | |
| Corning, Inc. | | | (27,990 | ) | | | (845,578) | |
| Darden Restaurants, Inc. | | | (6,060 | ) | | | (605,152) | |
| Digital Realty Trust, Inc. | | | (10,720 | ) | | | (1,142,216) | |
| Dril-Quip, Inc.1 | | | (13,930 | ) | | | (418,318) | |
| Equity Residential | | | (8,800 | ) | | | (580,888) | |
| Fastenal Co. | | | (11,800 | ) | | | (617,022) | |
| General Mills, Inc. | | | (29,040 | ) | | | (1,130,818) | |
| GlaxoSmithKline plc, Sponsored ADR | | | (10,817 | ) | | | (413,317) | |
| HP, Inc. | | | (41,880 | ) | | | (856,865) | |
| Intel Corp. | | | (29,490 | ) | | | (1,383,966) | |
| International Business Machines Corp. | | | (2,630 | ) | | | (298,952) | |
| Ipsen SA | | | (4,370 | ) | | | (563,616) | |
| Jones Lang LaSalle, Inc. | | | (11,096 | ) | | | (1,404,754) | |
| Kirby Corp.1 | | | (9,580 | ) | | | (645,309) | |
| Koninklijke Ahold Delhaize NV | | | (48,948 | ) | | | (1,234,840) | |
| Louisiana-Pacific Corp. | | | (50,450 | ) | | | (1,120,999) | |
| Nokia OYJ, Sponsored ADR | | | (229,144 | ) | | | (1,333,618) | |
| Novo Nordisk AS, Sponsored ADR | | | (26,336 | ) | | | (1,213,299) | |
| Oceaneering International, Inc.1 | | | (27,450 | ) | | | (332,145) | |
| Oil States International, Inc.1 | | | (40,960 | ) | | | (584,909) | |
| Pennsylvania Real Estate Investment Trust | | | (211,436 | ) | | | (1,255,930) | |
| Procter & Gamble Co. (The) | | | (6,570 | ) | | | (603,914) | |
| ResMed, Inc. | | | (12,070 | ) | | | (1,374,411) | |
| Rio Tinto plc, Sponsored ADR | | | (9,090 | ) | | | (440,683) | |
| SAP SE, Sponsored ADR | | | (13,902 | ) | | | (1,383,944) | |
| Starbucks Corp. | | | (13,420 | ) | | | (864,248) | |
| Target Corp. | | | (8,230 | ) | | | (543,921) | |
| W.W. Grainger, Inc. | | | (2,625 | ) | | | (741,195) | |
| Weingarten Realty Investors | | | (48,040 | ) | | | (1,191,872) | |
| West Fraser Timber Co. Ltd. | | | (15,976 | ) | | | (789,204) | |
| Western Union Co. (The) | | | (62,200 | ) | | | (1,061,132) | |
| William Demant Holding AS1 | | | (31,455 | ) | | | (891,687) | |
| | | | | | | | |
| Total Securities Sold Short (Proceeds $42,016,029) | | | | | | $ | (38,836,053) | |
| | | | | | | | |
| | | | | | | | | | | | | | | | | | | | | | | | | | |
| Forward Currency Exchange Contracts as of December 31, 2018 | |
| | | | | | | | | | | | | | | | | Unrealized | | | Unrealized | |
| Counterparty | | Settlement Month(s) | | | Currency Purchased (000’s) | | | | | | Currency Sold (000’s) | | | Appreciation | | | Depreciation | |
| BAC | | | 01/2019 | | | BRL | | | 86,800 | | | | USD | | | | 22,401 | | | $ | — | | | $ | 5,491 | |
14 OPPENHEIMER GLOBAL MULTI-ALTERNATIVES FUND/VA
| | | | | | | | | | | | | | | | | | | | | | |
| Forward Currency Exchange Contracts (Continued) |
| Counterparty | | Settlement Month(s) | | | Currency Purchased (000’s) | | | Currency Sold (000’s) | | | Unrealized
Appreciation | | | Unrealized
Depreciation |
| BAC | | | 01/2019 | | | CHF | | | 1,740 | | | USD | | | 1,835 | | | $ | — | | | $ 62,185 |
| BAC | | | 01/2019 | | | MXN | | | 36,900 | | | USD | | | 1,844 | | | | 29,896 | | | — |
| BAC | | | 01/2019 | | | MYR | | | 7,920 | | | USD | | | 1,896 | | | | 20,532 | | | — |
| BAC | | | 01/2019 | | | USD | | | 20,840 | | | BRL | | | 86,800 | | | | — | | | 1,555,629 |
| BAC | | | 01/2019 | | | USD | | | 1,330 | | | THB | | | 43,000 | | | | 9,462 | | | — |
| BOA | | | 01/2019 | | | GBP | | | 735 | | | USD | | | 931 | | | | 6,501 | | | — |
| BOA | | | 01/2019 | | | USD | | | 1,859 | | | ILS | | | 6,990 | | | | — | | | 12,458 |
| CITNA-B | | | 01/2019 | | | IDR | | | 13,436,000 | | | USD | | | 918 | | | | 13,506 | | | — |
| CITNA-B | | | 01/2019 | | | USD | | | 1,805 | | | CHF | | | 1,740 | | | | 32,254 | | | — |
| CITNA-B | | | 01/2019 | | | USD | | | 663 | | | COP | | | 2,000,000 | | | | 47,560 | | | — |
| CITNA-B | | | 02/2019 | | | USD | | | 14,405 | | | JPY | | | 1,630,000 | | | | — | | | 514,380 |
| DEU | | | 01/2019 | | | EUR | | | 250 | | | USD | | | 284 | | | | 3,245 | | | — |
| DEU | | | 01/2019 | | | USD | | | 1,707 | | | CAD | | | 2,200 | | | | 94,629 | | | — |
| DEU | | | 01/2019 | | | USD | | | 4,199 | | | EUR | | | 3,550 | | | | 126,487 | | | — |
| GSCO-OT | | | 01/2019 | | | JPY | | | 207,000 | | | USD | | | 1,864 | | | | 26,825 | | | — |
| GSCO-OT | | | 01/2019 | | | USD | | | 921 | | | AUD | | | 1,305 | | | | 1,859 | | | — |
| GSCO-OT | | | 11/2019 | | | USD | | | 1,822 | | | CNH | | | 12,750 | | | | — | | | 33,683 |
| GSCO-OT | | | 01/2019 | | | USD | | | 1,840 | | | NZD | | | 2,740 | | | | 470 | | | — |
| JPM | | | 01/2019 - 02/2019 | | | BRL | | | 90,370 | | | USD | | | 23,176 | | | | 139,377 | | | — |
| JPM | | | 01/2019 | | | INR | | | 130,000 | | | USD | | | 1,850 | | | | 17,664 | | | — |
| JPM | | | 01/2019 | | | TRY | | | 9,760 | | | USD | | | 1,820 | | | | 8,984 | | | — |
| JPM | | | 01/2019 - 04/2019 | | | USD | | | 44,512 | | | BRL | | | 173,600 | | | | 5,491 | | | 135,841 |
| JPM | | | 01/2019 | | | USD | | | 924 | | | CHF | | | 915 | | | | — | | | 8,069 |
| JPM | | | 01/2019 | | | USD | | | 2,139 | | | EUR | | | 1,870 | | | | 3,197 | | | 9,204 |
| JPM | | | 02/2019 | | | USD | | | 13,064 | | | MXN | | | 272,000 | | | | — | | | 683,763 |
| JPM | | | 01/2019 | | | ZAR | | | 26,780 | | | USD | | | 1,844 | | | | 13,835 | | | — |
| Total Unrealized Appreciation and Depreciation | | | $ | 601,774 | | | $ 3,020,703 |
| | | | | | | | | | | | | | | | | | | |
| | | | | | | | | | | | | | | | | | | | | | | | | | | | |
| Futures Contracts as of December 31, 2018 | |
| Description | | Buy/Sell | | | Expiration Date | | | Number of
Contracts | | | | | | Notional
Amount
(000’s) | | | Value | | | Unrealized
Appreciation/
(Depreciation) | |
| Brent Crude Oil* | | | Sell | | | | 1/31/19 | | | | 65 | | | | USD | | | | 3,742 | | | | $ 3,497,000 | | | | $ 245,021 | |
| E-Mini Russell 2000 Index | | | Buy | | | | 3/15/19 | | | | 315 | | | | USD | | | | 21,647 | | | | 21,246,750 | | | | (399,993) | |
| Euro-BONO | | | Sell | | | | 3/07/19 | | | | 10 | | | | EUR | | | | 1,642 | | | | 1,657,327 | | | | (14,936) | |
| Euro-BTP | | | Sell | | | | 3/07/19 | | | | 26 | | | | EUR | | | | 3,673 | | | | 3,807,694 | | | | (134,372) | |
| Euro-BUND | | | Buy | | | | 3/07/19 | | | | 67 | | | | EUR | | | | 12,479 | | | | 12,554,189 | | | | 75,587 | |
| Euro-OAT | | | Sell | | | | 3/07/19 | | | | 10 | | | | EUR | | | | 1,731 | | | | 1,727,791 | | | | 2,739 | |
| MSCI Emerging Market Index | | | Buy | | | | 3/15/19 | | | | 369 | | | | USD | | | | 17,839 | | | | 17,837,460 | | | | (1,798) | |
| Nikkei 225 Index | | | Sell | | | | 3/07/19 | | | | 8 | | | | JPY | | | | 1,536 | | | | 1,459,788 | | | | 75,970 | |
| S&P 500E-Mini Index | | | Sell | | | | 3/15/19 | | | | 148 | | | | USD | | | | 18,617 | | | | 18,538,850 | | | | 78,082 | |
| S&P MID 400E-Mini Index | | | Buy | | | | 3/15/19 | | | | 9 | | | | USD | | | | 1,562 | | | | 1,495,980 | | | | (66,126) | |
| S&P/TSX 60 Index | | | Sell | | | | 3/14/19 | | | | 4 | | | | CAD | | | | 503 | | | | 502,373 | | | | 442 | |
| SPI 200 Index | | | Sell | | | | 3/21/19 | | | | 7 | | | | AUD | | | | 678 | | | | 685,456 | | | | (7,560) | |
| Stoxx Europe 600 Index | | | Sell | | | | 3/15/19 | | | | 359 | | | | EUR | | | | 6,993 | | | | 6,865,002 | | | | 128,099 | |
| United States Treasury Long Bonds | | | Sell | | | | 3/20/19 | | | | 99 | | | | USD | | | | 14,400 | | | | 14,454,000 | | | | (53,993) | |
| United States Treasury Nts., 10 yr. | | | Sell | | | | 3/20/19 | | | | 26 | | | | USD | | | | 3,097 | | | | 3,172,406 | | | | (75,809) | |
| United States Treasury Nts., 5 yr. | | | Sell | | | | 3/29/19 | | | | 42 | | | | USD | | | | 4,736 | | | | 4,816,875 | | | | (80,785) | |
| | | | | | | | | | | | | | | | | | | | | | | | | | | $ (229,432) | |
| | | | | | | | | | | | | | | | | | | | | | | | | | | | |
*All or a portion of this security is owned by the subsidiary. See Note 2 of the accompanying Consolidated Notes.
| | | | | | | | | | | | | | | | | | | | | | | | | | | | | | | | | | | | |
| Over-the-Counter Options Written at December 31, 2018 | | | | | | | | | | | | | | | | | |
| Description | | Counterparty | | | | | | Exercise Price | | | Expiration Date | | | | | | Number of
Contracts | | | Notional
Amount
(000’s) | | | Premiums Received | | | Value |
| |
| JPY Currency Call | | | JPM | | | | JPY | | | | 110.310 | | | | 1/4/19 | | | | JPY | | | | (531,000,000 | ) | | | JPY 576,000 | | | $ | 21,373 | | | $ | (35,322) | |
| |
| JPY Currency Put | | | JPM | | | | JPY | | | | 110.310 | | | | 1/4/19 | | | | JPY | | | | (531,000,000 | ) | | | JPY 576,000 | | | | 22,432 | | | | (4,142) | |
| |
| JPY Currency Put | | | JPM | | | | JPY | | | | 109.940 | | | | 1/7/19 | | | | JPY | | | | (529,000,000 | ) | | | JPY 574,000 | | | | 22,238 | | | | (13,394) | |
| |
| JPY Currency Call | | | JPM | | | | JPY | | | | 109.940 | | | | 1/7/19 | | | | JPY | | | | (529,000,000 | ) | | | JPY 574,000 | | | | 21,660 | | | | (28,762) | |
| | | | | | | | | | | | | | | | | | | | | | | | | | | | | | | | |
| TotalOver-the-Counter Options Written | | | | | | | | | | | | | | | $ | 87,703 | | | $ | (81,620) | |
| | | | | | | | | | | | | | | | | | | | | | | | | | | | | | | | |
| | | | | | | | | | | | | | | | | | | | | | | | | | | | |
| | | | | | | | | | | | | | | | | | | | | | | | | | | | |
| Centrally Cleared Credit Default Swaps at December 31, 2018 | | | | | | | | | | | | | | | | | | | | |
| | | | | | | | | | | | | | | | | | | | | | | | | | |
Reference Asset | | Buy/Sell Protection | | Fixed Rate | | | Maturity Date | | | | | Notional Amount
(000’s) | | | Premiums
Received/(Paid) | | | Value | | | Unrealized
Appreciation/
(Depreciation) |
| CDX.HY.29 | | Buy | | | 5.000% | | | | 12/20/22 | | | USD | | | 100 | | | $ | 6,785 | | | | $ (3,521 | ) | | $ 3,264 |
| CDX.HY.30 | | Buy | | | 5.000 | | | | 6/20/23 | | | USD | | | 2,000 | | | | 136,044 | | | | (64,029 | ) | | 72,015 |
15 OPPENHEIMER GLOBAL MULTI-ALTERNATIVES FUND/VA
CONSOLIDATED STATEMENT OF INVESTMENTSContinued
| | | | | | | | | | | | | | | | | | | | | | | | | | | | | | | | | | | | |
| Centrally Cleared Credit Default Swaps (Continued) | | | | | | | | | | | | | | | | | | | | | |
| Reference Asset | | | | | Buy/Sell
Protection | | | Fixed Rate | | | Maturity Date | | | | | | Notional Amount
(000’s) | | | Premiums
Received/(Paid) | | | Value | | | Unrealized
Appreciation/
(Depreciation) | |
| CDX.IG.30 | | | | | | | Sell | | | | 1.000% | | | | 6/20/23 | | | | USD | | | | 5,750 | | | $ | (102,256 | ) | | $ | 48,394 | | | $ | (53,862) | |
| CDX.IG.30 | | | | | | | Sell | | | | 1.000 | | | | 6/20/23 | | | | USD | | | | 550 | | | | (9,826 | ) | | | 4,629 | | | | (5,197) | |
| CDX.IG.31 | | | | | | | Sell | | | | 1.000 | | | | 12/20/23 | | | | USD | | | | 300 | | | | (5,768 | ) | | | 1,773 | | | | (3,995) | |
| CDX.IG.31 | | | | | | | Sell | | | | 1.000 | | | | 12/20/23 | | | | USD | | | | 120 | | | | (1,838 | ) | | | 709 | | | | (1,129) | |
| Federation of Malaysia | | | | | | | Buy | | | | 1.000 | | | | 12/20/22 | | | | USD | | | | 80 | | | | 1,620 | | | | (448 | ) | | | 1,172 | |
| iTraxx.Main.27 | | | | | | | Buy | | | | 1.000 | | | | 6/20/22 | | | | EUR | | | | 5,040 | | | | 107,520 | | | | (91,302 | ) | | | 16,218 | |
| iTraxx.Main.28 | | | | | | | Buy | | | | 1.000 | | | | 12/20/22 | | | | EUR | | | | 170 | | | | 4,961 | | | | (2,578 | ) | | | 2,383 | |
| iTraxx.Main.29 | | | | | | | Buy | | | | 1.000 | | | | 6/20/23 | | | | EUR | | | | 350 | | | | 6,671 | | | | (4,165 | ) | | | 2,506 | |
| iTraxx.Main.30 | | | | | | | Buy | | | | 1.000 | | | | 12/20/23 | | | | EUR | | | | 250 | | | | 3,842 | | | | (1,827 | ) | | | 2,015 | |
The Neiman Marcus Group LLC | | | | Buy | | | | 5.000 | | | | 12/20/20 | | | | USD | | | | 715 | | | | 41,433 | | | | 207,782 | | | | 249,215 | |
Total Cleared Credit Default Swaps | | | | | | | | | | | | | | | | | | | | | | | $ | 189,188 | | | $ | 95,417 | | | $ | 284,605 | |
| | | | | | | | | | | | | | | | | | | | | | | | | | | | |
| | | | | | | | | | | | | | | | | | | | | | | | | | | | | | | | | | | | | |
| Over-the-Counter Credit Default Swaps at December 31, 2018 | | | | | | | | | | | | | | | | | | | | | |
| Reference Asset | | Counterparty | | | Buy/Sell
Protection | | | Fixed Rate | | | Maturity Date | | | | | | Notional Amount
(000’s) | | | Premiums
Received/(Paid) | | | Value | | | Unrealized
Appreciation/
(Depreciation) | |
| BNP Paribas | | | GSCOI | | | | Buy | | | | 1.000% | | | | 12/20/23 | | | | EUR | | | | 1,400 | | | $ | (36,612 | ) | | $ | 72,755 | | | $ | 36,143 | |
| CDX.NA.HY.25 | | | GSCOI | | | | Buy | | | | 5.000 | | | | 12/20/20 | | | | USD | | | | 1,125 | | | | (194,688 | ) | | | (84,640 | ) | | | (279,328) | |
| Federation of Malaysia | | | BNP | | | | Buy | | | | 1.000 | | | | 12/20/20 | | | | USD | | | | 1,700 | | | | (110,693 | ) | | | (19,373 | ) | | | (130,066) | |
| Federation of Malaysia | | | BNP | | | | Buy | | | | 1.000 | | | | 6/20/21 | | | | USD | | | | 775 | | | | (22,856 | ) | | | (8,552 | ) | | | (31,408) | |
| Federation of Malaysia | | | MOS-A | | | | Buy | | | | 1.000 | | | | 12/20/20 | | | | USD | | | | 1,700 | | | | (85,394 | ) | | | (19,373 | ) | | | (104,767) | |
| TotalOver-the-Counter Credit Default Swaps | | | | | | | | | | | $ | (450,243 | ) | | $ | (59,183) | | | $ | (509,426) | |
| | | | | | | | | | | | | | | | | | | | | | | | | | | | |
The table that follows shows the undiscounted maximum potential payment by the Fund related to selling credit protection in credit default swaps:
| | | | | | | | | | | | |
| Type of Reference Asset on which the Fund Sold Protection | | Total Maximum
Potential Payments
for Selling Credit
Protection
(Undiscounted) | | | Amount Recoverable* | | | Reference Asset Rating
Range** | |
| Investment Grade Corporate Debt Indexes | | | $6,720,000 | | | | $ — | | | | BBB to BBB- | |
| Total | | | $6,720,000 | | | | $— | | | | | |
| | | | | | | | | | | | |
* The Fund has no amounts recoverable from related purchased protection. In addition, the Fund has no recourse provisions under the credit derivatives and holds no collateral which can offset or reduce potential payments under a triggering event.
** The period end reference asset security ratings, as rated by any rating organization, are included in the equivalent Standard & Poor’s rating category. The reference asset rating represents the likelihood of a potential credit event on the reference asset which would result in a related payment by the Fund.
| | | | | | | | | | | | | | | | | | | | | | | | | | | | | | | | | | | | |
| Over-the-Counter Total Return Swaps at December 31, 2018 | | | | | | | | | | | | | | | | | | | | | |
| Reference Asset | | Counterparty | | | Pay/Receive Total
Return* | | | Floating Rate | | | Maturity
Date | | | | | | | | | Notional
Amount
(000’s) | | | Value | | | Unrealized
Appreciation/
(Depreciation) | |
| | | | | | | | | | | One-Month HKD- | | | | | | | | | | | | | | | | | | | | | | | | | |
| | | | | | | | | | | HIBOR-HKAB minus 50 | | | | | | | | | | | | | | | | | | | | | | | | | |
| 0998.HK-China Citic Bank Corp. | | | GSCOI | | | | Pay | | | | basis points | | | | 5/24/19 | | | | HKD | | | | | | | | 4,167 | | | $ | 62,392 | | | $ | 62,392 | |
| | | | | | | | | | | One-Month HKD- | | | | | | | | | | | | | | | | | | | | | | | | | |
1988.HK China Minsheng | | | | | | | | | | | HIBOR-HKAB minus 50 | | | | | | | | | | | | | | | | | | | | | | | | | |
| Banking Corp. Ltd. | | | GSCOI | | | | Pay | | | | basis points | | | | 5/24/19 | | | | HKD | | | | | | | | 4,237 | | | | 64,575 | | | | 64,575 | |
| | | | | | | | | | | One-Month HKD- | | | | | | | | | | | | | | | | | | | | | | | | | |
3328.HK Bank of | | | | | | | | | | | HIBOR-HKAB minus 50 | | | | | | | | | | | | | | | | | | | | | | | | | |
| Communications-HK BR | | | GSCOI | | | | Pay | | | | basis points | | | | 5/24/19 | | | | HKD | | | | | | | | 4,227 | | | | (2,567 | ) | | | (2,567) | |
| | | | | | | | | | | One-Month HKD- | | | | | | | | | | | | | | | | | | | | | | | | | |
| | | | | | | | | | | HIBOR-HKAB minus 50 | | | | | | | | | | | | | | | | | | | | | | | | | |
| 3968.HK China Merchants Bank | | | GSCOI | | | | Pay | | | | basis points | | | | 5/24/19 | | | | HKD | | | | | | | | 4,269 | | | | 77,809 | | | | 77,809 | |
| | | | | | | | | | | One-Month HKD- | | | | | | | | | | | | | | | | | | | | | | | | | |
| | | | | | | | | | | HIBOR-HKAB minus 50 | | | | | | | | | | | | | | | | | | | | | | | | | |
| 6818.HK China Everbriight Bank | | | GSCOI | | | | Pay | | | | basis points | | | | 5/24/19 | | | | HKD | | | | | | | | 2,105 | | | | 28,648 | | | | 28,648 | |
| | | | | | | | | | | One-Month USD BBA | | | | | | | | | | | | | | | | | | | | | | | | | |
| EMR.N - Emerson Electric Co. | | | GSCOI | | | | Pay | | | | LIBOR plus 60 bps | | | | 1/18/19 | | | | USD | | | | | | | | 2,418 | | | | 30,472 | | | | 30,472 | |
| | | | | | | | | | | One-Month USD BBA | | | | | | | | | | | | | | | | | | | | | | | | | |
| GOOGL.OQ - Alphabet Inc. | | | GSCOI | | | | Pay | | | | LIBOR plus 60 bps | | | | 1/18/19 | | | | USD | | | | | | | | 11,569 | | | | 87,994 | | | | 87,994 | |
| | | | | | | | | | | One-Month USD BBA | | | | | | | | | | | | | | | | | | | | | | | | | |
| MSFT.OQ - Microsoft Corp. | | | GSCOI | | | | Pay | | | | LIBOR plus 60 bps | | | | 1/18/19 | | | | USD | | | | | | | | 8,482 | | | | 366,878 | | | | 366,878 | |
| | | | | | | | | | | One-Month USD BBA | | | | | | | | | | | | | | | | | | | | | | | | | |
| NRG.N - NRG Energy, Inc. | | | GSCOI | | | | Pay | | | | LIBOR plus 60 bps | | | | 1/18/19 | | | | USD | | | | | | | | 2,455 | | | | 160,676 | | | | 160,676 | |
16 OPPENHEIMER GLOBAL MULTI-ALTERNATIVES FUND/VA
| | | | | | | | | | | | | | | | | | | | | | | | |
| Over-the-Counter Total Return Swaps (Continued) | | | | | |
| | | | | | | | | | | | | | Notional | | | | | | Unrealized | |
| | | | | Pay/Receive Total | | | | | | | | | Amount | | | | | | Appreciation/ | |
| Reference Asset | | Counterparty | | Return* | | Floating Rate | | Maturity Date | | | | | (000’s) | | | Value | | | (Depreciation) | |
| SRLN.P - SPDR Blackstone/GSO | | | | | | One-Month USD BBA | | | | | | | | | | | | | | | | | | |
| Senior Loan | | GSCOI | | Receive | | LIBOR plus 45 bps | | | 12/31/19 | | | USD | | | 56,313 | | | | $ (1,879,362 | ) | | | $ (1,879,362) | |
| | | | | | | | | | | | | | | | | | | | |
| TotalOver-the-Counter Total Return Swaps | | | | | | | | | | | | | | | $ (1,002,485 | ) | | | $ (1,002,485) | |
| | | | | | | | | | | | | | | | | | | | |
*Fund will pay or receive the total return of the reference asset depending on whether the return is positive or negative. For contracts where the Fund has elected to receive the total return of the reference asset if positive, it will be responsible for paying the floating rate and the total return of the reference asset if negative. If the Fund has elected to pay the total return of the reference asset if positive, it will receive the floating rate and the total return of the reference asset if negative.
| | |
| Glossary: | | |
| Counterparty Abbreviations | | |
| BAC | | Barclays Bank plc |
| BNP | | BNP Paribas |
| BOA | | Bank of America NA |
| CITNA-B | | Citibank NA |
| DEU | | Deutsche Bank AG |
| GSCOI | | Goldman Sachs International |
| GSCO-OT | | Goldman Sachs Bank USA |
| JPM | | JPMorgan Chase Bank NA |
| MOS-A | | Morgan Stanley |
| MSCO | | Morgan Stanley Capital Services, Inc. |
Currency abbreviations indicate amounts reporting in currencies |
| AUD | | Australian Dollar |
| BRL | | Brazilian Real |
| CAD | | Canadian Dollar |
| CHF | | Swiss Franc |
| CNH | | Offshore ChineseRenminbi |
| COP | | Colombian Peso |
| DKK | | Danish Krone |
| EUR | | Euro |
| GBP | | British Pound Sterling |
| HKD | | Hong Kong Dollar |
| IDR | | Indonesian Rupiah |
| ILS | | Israeli Shekel |
| INR | | Indian Rupee |
| JPY | | Japanese Yen |
| MXN | | Mexican Nuevo Peso |
| MYR | | Malaysian Ringgit |
| NZD | | New Zealand Dollar |
| THB | | Thailand Baht |
| TRY | | New Turkish Lira |
| ZAR | | South African Rand |
Definitions |
| BBA | | British Bankers’ Association |
| BBA LIBOR | | British Bankers’ Association London - Interbank Offered Rate |
| BONO | | Spanish Government Bonds |
| BTP | | Italian Treasury Bonds |
| BUND | | German Federal Obligation |
| CDX.HY.29 | | Markit CDX High Yield Index |
| CDX.HY.30 | | Markit CDX High Yield Index |
| CDX.IG.30 | | Markit CDX Investment Grade Index |
| CDX.IG.31 | | Markit CDX Investment Grade Index |
| CDX.NA.HY.25 | | Markit CDX North American High Yield |
| EUR003M | | EURIBOR 3 Month ACT/360 |
| HIBOR | | Hong Kong Interbank Offered Rate |
| HKAB | | Hong Kong Association of Banks |
| ICE LIBOR | | Intercontinental Exchange London Interbank Offered Rate |
| iTraxx.Main.27 | | Credit Default Swap Trading Index for a Specific Basket of Securities |
| iTraxx.Main.28 | | Credit Default Swap Trading Index for a Specific Basket of Securities |
| iTraxx.Main.29 | | Credit Default Swap Trading Index for a Specific Basket of Securities |
| iTraxx.Main.30 | | Credit Default Swap Trading Index for a Specific Basket of Securities |
| LIBOR | | London Interbank Offered Rate |
| LIBOR03M | | ICE LIBOR USD 3 Month |
| LIBOR4 | | London Interbank Offered Rate-Quarterly |
| LIBOR12 | | London Interbank Offered Rate-Monthly |
| MLHKOPCB | | Custom Basket of Securities |
17 OPPENHEIMER GLOBAL MULTI-ALTERNATIVES FUND/VA
CONSOLIDATED STATEMENT OF INVESTMENTSContinued
| | |
| Definitions (Continued) | | |
| OAT | | French Government Bonds |
| S&P | | Standard & Poor’s |
| T-BILL 1MO | | US Treasury Bill 1 Month |
| T-BILL 3MO | | US Treasury Bill 3 Month |
| US0001M | | ICE LIBOR USD 1 Month |
| US0003M | | ICE LIBOR USD 3 Month |
| US0006M | | ICE LIBOR USD 6 Month |
| ZERO | | ZERO Constant Index |
See accompanying Notes to Consolidated Financial Statements.
18 OPPENHEIMER GLOBAL MULTI-ALTERNATIVES FUND/VA
CONSOLIDATED STATEMENT OF ASSETS AND LIABILITIESDecember 31, 2018
| | | | |
Assets | | | | |
Investments, at value—see accompanying consolidated statement of investments: | | | | |
Unaffiliated companies (cost $344,663,791) | | $ | 345,462,207 | |
Affiliated companies (cost $7,565,931) | | | 7,565,931 | |
| | | | |
| | | 353,028,138 | |
Cash | | | 4,754,375 | |
Cash used for collateral on futures | | | 2,976,000 | |
Cash used for collateral on OTC derivatives | | | 11,000 | |
Cash used for collateral on centrally cleared swaps | | | 167,311 | |
Deposits with broker for securities sold short | | | 38,268,859 | |
Deposits with broker for foreign securities sold short (cost $4,468,481) | | | 4,385,254 | |
Unrealized appreciation on forward currency exchange contracts | | | 601,774 | |
Swaps, at value (premiums paid $36,612) | | | 952,199 | |
Centrally cleared swaps, at value (net premiums paid $78,255) | | | 263,287 | |
Receivables and other assets: | | | | |
Interest and dividends | | | 926,143 | |
Investments sold | | | 566,683 | |
Variation margin receivable | | | 147,925 | |
Shares of beneficial interest sold | | | 2,712 | |
Other | | | 400,533 | |
| | | | |
Total assets | | | 407,452,193 | |
Liabilities | | | | |
Securities sold short, at value (proceeds $42,016,029)—see accompanying consolidated statement of investments | | | 38,836,053 | |
Unrealized depreciation on forward currency exchange contracts | | | 3,020,703 | |
Options written, at value (premiums received $87,703) | | | 81,620 | |
Swaps, at value (premiums paid $413,631) | | | 2,013,867 | |
Centrally cleared swaps, at value (premiums received $267,443) | | | 167,870 | |
Payables and other liabilities: | | | | |
Investments purchased | | | 521,692 | |
Variation margin payable | | | 315,062 | |
Dividends on short sales | | | 35,585 | |
Shares of beneficial interest redeemed | | | 20,469 | |
Trustees’ compensation | | | 16,150 | |
Shareholder communications | | | 9,012 | |
Distribution and service plan fees | | | 857 | |
Other | | | 296,933 | |
| | | | |
Total liabilities | | | 45,335,873 | |
Net Assets | | $ | 362,116,320 | |
| | | | |
| | | | |
Composition of Net Assets | | | | |
Par value of shares of beneficial interest | | $ | 38,141 | |
Additionalpaid-in capital | | | 388,554,414 | |
Total accumulated loss | | | (26,476,235) | |
| | | | |
Net Assets | | $ | 362,116,320 | |
| | | | |
| | | | |
Net Asset Value Per Share | | | | |
Non-Service Shares: | | | | |
| Net asset value, redemption price per share and offering price per share (based on net assets of $358,148,675 and 37,721,571 shares of beneficial interest outstanding) | | | $9.49 | |
Service Shares: | | | | |
| Net asset value, redemption price per share and offering price per share (based on net assets of $3,967,645 and 419,045 shares of beneficial interest outstanding) | | | $9.47 | |
See accompanying Notes to Consolidated Financial Statements.
19 OPPENHEIMER GLOBAL MULTI-ALTERNATIVES FUND/VA
CONSOLIDATED STATEMENT OF OPERATIONSFor the Year Ended December 31, 2018
| | | | |
Investment Income | | | | |
Interest (net of foreign withholding taxes of $2,201) | | $ | 8,258,907 | |
Dividends: | | | | |
Unaffiliated companies (net of foreign withholding taxes of $53,345) | | | 2,660,101 | |
Affiliated companies | | | 989,934 | |
| | | | |
Total investment income | | | 11,908,942 | |
Expenses | | | | |
Management fees | | | 4,221,425 | |
Distribution and service plan fees —Service shares | | | 9,739 | |
Transfer and shareholder servicing agent fees: | | | | |
Non-Service shares | | | 487,763 | |
Service shares | | | 4,675 | |
Shareholder communications: | | | | |
Non-Service shares | | | 47,128 | |
Service shares | | | 477 | |
Dividends on short sales | | | 787,819 | |
Custodian fees and expenses | | | 133,449 | |
Financing expense from short sales | | | 78,019 | |
Trustees’ compensation | | | 28,951 | |
Borrowing fees | | | 13,022 | |
Other | | | 247,949 | |
| | | | |
Total expenses | | | 6,060,416 | |
Less reduction to custodian expenses | | | (1,132) | |
Less waivers and reimbursements of expenses | | | (221,494) | |
| | | | |
Net expenses | | | 5,837,790 | |
Net Investment Income | | | 6,071,152 | |
Realized and Unrealized Gain (Loss) | | | | |
Net realized gain (loss) on: | | | | |
Investment transactions in unaffiliated companies (net of foreign capital gains tax of $3,683) | | | 4,781,531 | |
Option contracts written | | | 4,927,608 | |
Futures contracts | | | (2,575,207) | |
Foreign currency transactions | | | 362,677 | |
Forward currency exchange contracts | | | (1,416,713) | |
Short Positions | | | (2,731,106) | |
Swap contracts | | | (1,290,479) | |
| | | | |
Net realized gain | | | 2,058,311 | |
Net change in unrealized appreciation/(depreciation) on: | | | | |
Investment transactions in unaffiliated companies | | | (25,252,540) | |
Translation of assets and liabilities denominated in foreign currencies | | | (302,568) | |
Forward currency exchange contracts | | | (1,397,897) | |
Futures contracts | | | (923,620) | |
Option contracts written | | | 6,083 | |
Short positions | | | 7,478,985 | |
Swap contracts | | | (42,372) | |
| | | | |
Net change in unrealized appreciation/(depreciation) | | | (20,433,929) | |
Net Decrease in Net Assets Resulting from Operations | | $ | (12,304,466) | |
| | | | |
See accompanying Notes to Consolidated Financial Statements.
20 OPPENHEIMER GLOBAL MULTI-ALTERNATIVES FUND/VA
CONSOLIDATED STATEMENTS OF CHANGES IN NET ASSETS
| | | | | | | | |
| | | Year Ended
December 31, 2018 | | | Year Ended
December 31, 20171 | |
| Operations | | | | | | | | |
Net investment income | | $ | 6,071,152 | | | $ | 4,888,490 | |
Net realized gain (loss) | | | 2,058,311 | | | | (12,625,099) | |
Net change in unrealized appreciation/(depreciation) | | | (20,433,929) | | | | 9,719,277 | |
Net increase (decrease) in net assets resulting from operations | | | (12,304,466) | | | | 1,982,668 | |
| Dividends and/or Distributions to Shareholders | | | | | | | | |
Dividends and distributions declared: | | | | | | | | |
Non-Service shares | | | (1,458,889) | | | | (3,921,732) | |
Service shares | | | (6,755) | | | | (24,086) | |
Total dividends and distributions declared | | | (1,465,644) | | | | (3,945,818) | |
| Beneficial Interest Transactions | | | | | | | | |
Net increase (decrease) in net assets resulting from beneficial interest transactions: | | | | | | | | |
Non-Service shares | | | (44,039,495) | | | | 17,307,626 | |
Service shares | | | 648,158 | | | | 940,121 | |
Total beneficial interest transactions | | | (43,391,337) | | | | 18,247,747 | |
| Net Assets | | | | | | | | |
Total increase (decrease) | | | (57,161,447) | | | | 16,284,597 | |
Beginning of period | | | 419,277,767 | | | | 402,993,170 | |
End of period | | $ | 362,116,320 | | | $ | 419,277,767 | |
| | | | |
1. Prior period amounts have been conformed to current year presentation. See Notes to Consolidated Financial Statements, Note 2– New Accounting Pronouncements for further details.
See accompanying Notes to Consolidated Financial Statements.
21 OPPENHEIMER GLOBAL MULTI-ALTERNATIVES FUND/VA
CONSOLIDATED FINANCIAL HIGHLIGHTS
| | | | | | | | | | | | | | | | | | | | |
| Non-Service Shares | | Year Ended
December 31,
2018 | | | Year Ended
December 31,
2017 | | | Year Ended
December 31,
2016 | | | Year Ended
December 31,
20151 | | | Year Ended
December 31,
20141 | |
| Per Share Operating Data | | | | | | | | | | | | | | | | | | | | |
| Net asset value, beginning of period | | | $9.84 | | | | $9.88 | | | | $9.66 | | | | $10.04 | | | | $9.92 | |
| Income (loss) from investment operations: | | | | | | | | | | | | | | | | | | | | |
| Net investment income2 | | | 0.15 | | | | 0.12 | | | | 0.11 | | | | 0.11 | | | | 0.08 | |
| Net realized and unrealized gain (loss) | | | (0.46) | | | | (0.06) | | | | 0.25 | | | | (0.46) | | | | 0.52 | |
| Total from investment operations | | | (0.31) | | | | 0.06 | | | | 0.36 | | | | (0.35) | | | | 0.60 | |
| Dividends and/or distributions to shareholders: | | | | | | | | | | | | | | | | | | | | |
| Dividends from net investment income | | | (0.04) | | | | (0.10) | | | | (0.14) | | | | (0.03) | | | | (0.25) | |
| Distributions from net realized gain | | | 0.00 | | | | 0.00 | | | | 0.00 | | | | 0.00 | | | | (0.21) | |
| Tax return of capital distribution | | | 0.00 | | | | 0.00 | | | | 0.00 | | | | 0.00 | | | | (0.02) | |
| Total dividends and/or distributions to shareholders | | | (0.04) | | | | (0.10) | | | | (0.14) | | | | (0.03) | | | | (0.48) | |
| Net asset value, end of period | | | $9.49 | | | | $9.84 | | | | $9.88 | | | | $9.66 | | | | $10.04 | |
| | | | | | | | | | | | | | | | | | | | |
| | | | | | | | | | | | | | | | | | | | |
| Total Return, at Net Asset Value3 | | | (3.21)% | | | | 0.56% | | | | 3.71% | | | | (3.45)% | | | | 6.02% | |
| | | | | | | | | | | | | | | | | | | | |
| Ratios/Supplemental Data | | | | | | | | | | | | | | | | | | | | |
| Net assets, end of period (in thousands) | | | $358,149 | | | | $415,811 | | | | $400,449 | | | | $406,286 | | | | $262,573 | |
| Average net assets (in thousands) | | | $406,201 | | | | $408,282 | | | | $408,810 | | | | $363,975 | | | | $161,988 | |
| Ratios to average net assets:4 | | | | | | | | | | | | | | | | | | | | |
| Net investment income | | | 1.48% | | | | 1.19% | | | | 1.11% | | | | 1.11% | | | | 0.77%5 | |
| Expenses excluding specific expenses listed below | | | 1.27% | | | | 1.24% | | | | 1.23% | | | | 1.24% | | | | 1.33% | |
| Dividends and/or interest expense on securities sold short | | | 0.19% | | | | 0.11% | | | | 0.22% | | | | 0.17% | | | | 0.08% | |
| Borrowing expenses on securities sold short | | | 0.02% | | | | 0.00% | | | | 0.02% | | | | 0.05% | | | | 0.02% | |
| Interest and fees from borrowings | | | 0.00%6 | | | | 0.00%6 | | | | 0.00%6 | | | | 0.00%6 | | | | 0.00% | |
| Total expenses7 | | | 1.48% | | | | 1.35% | | | | 1.47% | | | | 1.46% | | | | 1.43%5 | |
| Expenses after payments, waivers and/or reimbursements and reduction to custodian expenses | | | 1.43% | | | | 1.32% | | | | 1.43% | | | | 1.41% | | | | 1.31%5 | |
| Portfolio turnover rate | | | 155% | | | | 129% | | | | 93% | | | | 67% | | | | 147% | |
1. Net investment income per share, net realized and unrealized gain (loss) per share and the net investment income ratio include an adjustment for a prior period reclassification for the years ended December 31, 2014 and 2015.
2. Per share amounts calculated based on the average shares outstanding during the period.
3. Assumes an initial investment on the business day before the first day of the fiscal period, with all dividends and distributions reinvested in additional shares on the reinvestment date, and redemption at the net asset value calculated on the last business day of the fiscal period. Total returns are not annualized for periods less than one full year. Total return information does not reflect expenses that apply at the separate account level or to related insurance products. Inclusion of these charges would reduce the total return figures for all periods shown. Returns do not reflect the deduction of taxes that a shareholder would pay on fund distributions or the redemption of fund shares.
4. Annualized for periods less than one full year.
5. Includes the Fund’s share of the allocated expenses and/or net investment income from the master funds.
6. Less than 0.005%.
7. Total expenses including indirect expenses from affiliated fund fees and expenses were as follows:
| | | | | | | | |
| | Year Ended December 31, 2018 | | | 1.49 | % | | |
| | Year Ended December 31, 2017 | | | 1.36 | % | | |
| | Year Ended December 31, 2016 | | | 1.48 | % | | |
| | Year Ended December 31, 2015 | | | 1.47 | % | | |
| | Year Ended December 31, 2014 | | | 1.45 | % | | |
See accompanying Notes to Consolidated Financial Statements.
22 OPPENHEIMER GLOBAL MULTI-ALTERNATIVES FUND/VA
| | | | | | | | | | | | | | | | | | | | |
| Service Shares | | Year Ended
December 31,
2018 | | | Year Ended
December 31,
2017 | | | Year Ended
December 31,
2016 | | | Year Ended
December 31,
20151 | | | Year Ended
December 31,
20141 | |
| Per Share Operating Data | | | | | | | | | | | | | | | | | | | | |
| Net asset value, beginning of period | | | $9.81 | | | | $9.87 | | | | $9.65 | | | | $10.03 | | | | $9.92 | |
| Income (loss) from investment operations: | | | | | | | | | | | | | | | | | | | | |
| Net investment income2 | | | 0.12 | | | | 0.09 | | | | 0.08 | | | | 0.08 | | | | 0.08 | |
| Net realized and unrealized gain (loss) | | | (0.44) | | | | (0.07) | | | | 0.26 | | | | (0.45) | | | | 0.50 | |
| Total from investment operations | | | (0.32) | | | | 0.02 | | | | 0.34 | | | | (0.37) | | | | 0.58 | |
| Dividends and/or distributions to shareholders: | | | | | | | | | | | | | | | | | | | | |
| Dividends from net investment income | | | (0.02) | | | | (0.08) | | | | (0.12) | | | | (0.01) | | | | (0.25) | |
| Distributions from net realized gain | | | 0.00 | | | | 0.00 | | | | 0.00 | | | | 0.00 | | | | (0.21) | |
| Tax return of capital distribution | | | 0.00 | | | | 0.00 | | | | 0.00 | | | | 0.00 | | | | (0.01) | |
| Total dividends and/or distributions to shareholders | | | (0.02) | | | | (0.08) | | | | (0.12) | | | | (0.01) | | | | (0.47) | |
| Net asset value, end of period | | | $9.47 | | | | $9.81 | | | | $9.87 | | | | $9.65 | | | | $10.03 | |
| | | | | | | | | | | | | | | | | | | | |
| | | | | | | | | | | | | | | | | | | | |
| Total Return, at Net Asset Value3 | | | (3.30)% | | | | 0.19% | | | | 3.49% | | | | (3.68)% | | | | 5.90% | |
| | | | | | | | | | | | | | | | | | | | |
| Ratios/Supplemental Data | | | | | | | | | | | | | | | | | | | | |
| Net assets, end of period (in thousands) | | | $3,967 | | | | $3,467 | | | | $2,544 | | | | $1,845 | | | | $1,332 | |
| Average net assets (in thousands) | | | $3,899 | | | | $3,063 | | | | $2,054 | | | | $1,695 | | | | $335 | |
| Ratios to average net assets:4 | | | | | | | | | | | | | | | | | | | | |
| Net investment income | | | 1.23% | | | | 0.92% | | | | 0.85% | | | | 0.85% | | | | 0.78%5 | |
| Expenses excluding specific expenses listed below | | | 1.53% | | | | 1.49% | | | | 1.48% | | | | 1.48% | | | | 1.68% | |
| Dividends and/or interest expense on securities sold short | | | 0.19% | | | | 0.11% | | | | 0.22% | | | | 0.17% | | | | 0.08% | |
| Borrowing expenses on securities sold short | | | 0.02% | | | | 0.00% | | | | 0.02% | | | | 0.05% | | | | 0.02% | |
| Interest and fees from borrowings | | | 0.00%6 | | | | 0.00%6 | | | | 0.00%6 | | | | 0.00%6 | | | | 0.00% | |
| Total expenses7 | | | 1.74% | | | | 1.60% | | | | 1.72% | | | | 1.70% | | | | 1.78%5 | |
| Expenses after payments, waivers and/or reimbursements and reduction to custodian expenses | | | 1.67% | | | | 1.57% | | | | 1.68% | | | | 1.65% | | |
| 1.67%5
|
|
| Portfolio turnover rate | | | 155% | | | | 129% | | | | 93% | | | | 67% | | | | 147% | |
1.Net investment income per share, net realized and unrealized gain (loss) per share and the net investment income ratio include an adjustment for a prior period reclassification for the years ended December 31, 2014 and 2015.
2.Per share amounts calculated based on the average shares outstanding during the period.
3.Assumes an initial investment on the business day before the first day of the fiscal period, with all dividends and distributions reinvested in additional shares on the reinvestment date, and redemption at the net asset value calculated on the last business day of the fiscal period. Total returns are not annualized for periods less than one full year. Total return information does not reflect expenses that apply at the separate account level or to related insurance products. Inclusion of these charges would reduce the total return figures for all periods shown. Returns do not reflect the deduction of taxes that a shareholder would pay on fund distributions or the redemption of fund shares.
4.Annualized for periods less than one full year.
5.Includes the Fund’s share of the allocated expenses and/or net investment income from the master funds.
6.Less than 0.005%.
7.Total expenses including indirect expenses from affiliated fund fees and expenses were as follows:
| | | | | | | | |
| | Year Ended December 31, 2018 | | | 1.75 | % | | |
| | Year Ended December 31, 2017 | | | 1.61 | % | | |
| | Year Ended December 31, 2016 | | | 1.73 | % | | |
| | Year Ended December 31, 2015 | | | 1.71 | % | | |
| | Year Ended December 31, 2014 | | | 1.80 | % | | |
See accompanying Notes to Consolidated Financial Statements.
23 OPPENHEIMER GLOBAL MULTI-ALTERNATIVES FUND/VA
NOTES TO CONSOLIDATED FINANCIAL STATEMENTSDecember 31, 2018
1. Organization
Oppenheimer Global Multi-Alternatives Fund/VA (the “Fund”), a separate series of Oppenheimer Variable Account Funds, is a diversifiedopen-end management investment company registered under the Investment Company Act of 1940 (“1940 Act”), as amended. The Fund’s investment objective is to seek total return. The Fund’s investment adviser is OFI Global Asset Management, Inc. (“OFI Global” or the “Manager”), a wholly-owned subsidiary of OppenheimerFunds, Inc. (“OFI” or the“Sub-Adviser”). The Manager has entered into asub-advisory agreement with OFI.
TheSub-Adviser has entered intosub-sub-advisory agreements with Barings LLC and OFI SteelPath, Inc. (collectively, the“Sub-Sub-Advisers”). Shares of the Fund are sold only to separate accounts of life insurance companies.
The Fund offers two classes of shares. Both classes are sold at their offering price, which is the net asset value per share, to separate investment accounts of participating insurance companies as an underlying investment for variable life insurance policies, variable annuity contracts or other investment products. The class of shares designated as Service shares is subject to a distribution and service plan. Both classes of shares have identical rights and voting privileges with respect to the Fund in general and exclusive voting rights on matters that affect that class alone. Earnings, net assets and net asset value per share may differ due to each class having its own expenses, such as transfer and shareholder servicing agent fees and shareholder communications, directly attributable to that class.
The following is a summary of significant accounting policies followed in the Fund’s preparation of financial statements in accordance with accounting principles generally accepted in the United States (“U.S. GAAP”).
2. Significant Accounting Policies
Security Valuation.All investments in securities are recorded at their estimated fair value, as described in Note 3.
Basis for Consolidation.The Fund has established a Cayman Islands exempted company, Oppenheimer Global Multi-Alternatives Fund/VA (Cayman) Ltd., (the “Subsidiary”), which is wholly-owned and controlled by the Fund. The Fund and Subsidiary are both managed by the Manager. The Fund may invest up to 25% of its total assets in the Subsidiary. The Subsidiary invests primarily in commodity-linked derivatives (including commodity futures, financial futures, options and swap contracts) and certain fixed-income securities and other investments that may serve as margin or collateral for its derivatives positions. The Fund applies its investment restrictions and compliance policies and procedures, on a look-through basis, to the Subsidiary.
The financial statements have been consolidated and include accounts of the Fund and the Subsidiary. Accordingly, all inter-company transactions and balances have been eliminated. At period end, the Fund owned 23,736 shares with net assets of $13,069,459 in the Subsidiary.
Other financial information at period end:
| | | | |
| Total market value of investments | | $ | 12,135,116 | |
| Net assets | | $ | 13,069,459 | |
| Net income (loss) | | $ | (53,741) | |
| Net realized gain (loss) | | $ | 333,038 | |
| Net change in unrealized appreciation/depreciation | | $ | (13,741) | |
Foreign Currency Translation.The books and records of the Fund are maintained in U.S. dollars. Any foreign currency amounts are translated into U.S. dollars on the following basis:
(1) Value of investment securities, other assets and liabilities — at the exchange rates prevailing at market close as described in Note 3.
(2) Purchases and sales of investment securities, income and expenses — at the rates of exchange prevailing on the respective dates of such transactions.
Although the net assets and the values are presented at the foreign exchange rates at market close, the Fund does not isolate the portion of the results of operations resulting from changes in foreign exchange rates on investments from the fluctuations arising from changes in prices of securities held. Such fluctuations are included with the net realized and unrealized gains or losses from investments shown in the Consolidated Statement of Operations.
For securities, which are subject to foreign withholding tax upon disposition, realized and unrealized gains or losses on such securities are recorded net of foreign withholding tax.
Reported net realized foreign exchange gains or losses arise from sales of foreign currencies, currency gains or losses realized between the trade and settlement dates on securities transactions, the difference between the amounts of dividends, interest, and foreign withholding tax reclaims recorded on the Fund’s books, and the U.S. dollar equivalent of the amounts actually received or paid. Net unrealized foreign exchange gains and losses arise from changes in the value of assets and liabilities other than investments in securities, resulting from changes in the exchange rate.
Allocation of Income, Expenses, Gains and Losses.Income, expenses (other than those attributable to a specific class), gains and losses are allocated on a daily basis to each class of shares based upon the relative proportion of net assets represented by such class. Operating expenses directly attributable to a specific class are charged against the operations of that class.
Dividends and Distributions to Shareholders. Dividends and distributions to shareholders, which are determined in accordance with income tax regulations and may differ from U.S. GAAP, are recorded on theex-dividend date. Income and capital gain distributions, if any, are declared and paid annually or at other times as determined necessary by the Manager.
24 OPPENHEIMER GLOBAL MULTI-ALTERNATIVES FUND/VA
2. Significant Accounting Policies (Continued)
Investment Income.Dividend income is recorded on theex-dividend date or uponex-dividend notification in the case of certain foreign dividends where theex-dividend date may have passed.Non-cash dividends included in dividend income, if any, are recorded at the fair value of the securities received. Withholding taxes on foreign dividends, if any, and capital gains taxes on foreign investments, if any, have been provided for in accordance with the Fund’s understanding of the applicable tax rules and regulations. Interest income, if any, is recognized on an accrual basis. Discount and premium, which are included in interest income on the Consolidated Statement of Operations, are amortized or accreted daily.
Return of Capital Estimates.Distributions received from the Fund’s investments in Master Limited Partnerships (MLPs) and Real Estate Investments Trusts (REITs), generally are comprised of income and return of capital. Any return of capital estimates in excess of cost basis are classified as realized gain. The Fund records investment income and return of capital based on estimates. Such estimates are based on historical information available from each MLP, REIT and other industry sources. These estimates may subsequently be revised based on information received from MLPs and REITs after their tax reporting periods are concluded.
Custodian Fees. “Custodian fees and expenses” in the Consolidated Statement of Operations may include interest expense incurred by the Fund on any cash overdrafts of its custodian account during the period. Such cash overdrafts may result from the effects of failed trades in portfolio securities and from cash outflows resulting from unanticipated shareholder redemption activity. The Fund pays interest to its custodian on such cash overdrafts, to the extent they are not offset by positive cash balances maintained by the Fund, at a rate equal to the Federal Funds Rate plus 2.00%. The “Reduction to custodian expenses” line item, if applicable, represents earnings on cash balances maintained by the Fund during the period. Such interest expense and other custodian fees may be paid with these earnings.
Security Transactions. Security transactions are recorded on the trade date. Realized gains and losses on securities sold are determined on the basis of identified cost.
Indemnifications.The Fund’s organizational documents provide current and former Trustees and officers with a limited indemnification against liabilities arising in connection with the performance of their duties to the Fund. In the normal course of business, the Fund may also enter into contracts that provide general indemnifications. The Fund’s maximum exposure under these arrangements is unknown as this would be dependent on future claims that may be made against the Fund. The risk of material loss from such claims is considered remote.
Federal Taxes.The Fund intends to comply with provisions of the Internal Revenue Code applicable to regulated investment companies and to distribute substantially all of its investment company taxable income, including any net realized gain on investments not offset by capital loss carryforwards, if any, to shareholders. Therefore, no federal income or excise tax provision is required. The Fund files income tax returns in U.S. federal and applicable state jurisdictions. The statute of limitations on the Fund’s tax return filings generally remains open for the three preceding fiscal reporting period ends. The Fund has analyzed its tax positions for the fiscal year ended December 31, 2018, including open tax years, and does not believe there are any uncertain tax positions requiring recognition in the Fund’s financial statements.
Subchapter M requires, among other things, that at least 90% of the Fund’s gross income be derived from securities or derived with respect to its business of investing in securities (typically referred to as “qualifying income”). Income from commodity-linked derivatives may not be treated as “qualifying income” for purposes of the 90% gross income requirement. The Internal Revenue Service (IRS) has previously issued a number of private letter rulings which conclude that income derived from commodity index-linked notes and investments in a wholly-owned subsidiary will be “qualifying income.” As a result, the Fund will gain exposure to commodities through commodity-linked notes and its wholly-owned subsidiary.
The IRS has suspended the granting of private letter rulings pending further review. As a result, there can be no assurance that the IRS will not change its position with respect to commodity-linked notes and wholly-owned subsidiaries. In addition, future legislation and guidance from the Treasury and the IRS may adversely affect the Fund’s ability to gain exposure to commodities through commodity-linked notes and its wholly-owned subsidiary.
The Fund is required to include in income for federal income tax purposes all of the subsidiary’s net income and gains whether or not such income is distributed by the subsidiary. Net income and gains from the subsidiary are generally treated as ordinary income by the Fund, regardless of the character of the subsidiary’s underlying income. Net losses from the subsidiary do not pass through to the Fund for federal income tax purposes.
The tax components of capital shown in the following table represent distribution requirements the Fund must satisfy under the income tax regulations, losses the Fund may be able to offset against income and gains realized in future years and unrealized appreciation or depreciation of securities and other investments for federal income tax purposes.
| | | | | | | | | | | | |
Undistributed Net Investment Income | | Undistributed
Long-Term
Gain | | | Accumulated
Loss
Carryforward1,2,3,4
| | | Net Unrealized
Depreciation
Based on cost of
Securities and
Other Investments
for Federal Income
Tax Purposes | |
| $1,924,435 | | | $— | | | | $22,136,325 | | | | $3,364,050 | |
1.At period end, the Fund had $22,059,913 of net capital loss carryforward available to offset future realized capital gains, if any, and thereby reduce future taxable gain distributions.
2.The Fund had $76,412 of straddle losses which were deferred.
25 OPPENHEIMER GLOBAL MULTI-ALTERNATIVES FUND/VA
NOTES TO CONSOLIDATED FINANCIAL STATEMENTSContinued
2. Significant Accounting Policies (Continued)
3. During the reporting period, the Fund did not utilize any capital loss carryforward.
4.During the previous reporting period, the Fund did not utilize any capital loss carryforward.
Net investment income (loss) and net realized gain (loss) may differ for financial statement and tax purposes. The character of dividends and distributions made during the fiscal year from net investment income or net realized gains are determined in accordance with federal income tax requirements, which may differ from the character of net investment income or net realized gains presented in those financial statements in accordance with U.S. GAAP. Also, due to timing of dividends and distributions, the fiscal year in which amounts are distributed may differ from the fiscal year in which the income or net realized gain was recorded by the Fund.
Accordingly, the following amounts have been reclassified for the reporting period. Net assets of the Fund were unaffected by the reclassifications.
| | | | |
Increase
toPaid-in Capital | | Increase
to Accumulated Net
Realized Loss | |
| $19,550 | | | $19,550 | |
The tax character of distributions paid during the reporting periods:
| | | | | | | | |
| | | Year Ended
December 31, 2018 | | | Year Ended
December 31, 2017 | |
| Distributions paid from: | | | | | | | | |
| Ordinary income | | $ | 1,465,644 | | | $ | 3,945,818 | |
The aggregate cost of securities and other investments and the composition of unrealized appreciation and depreciation of securities and other investments for federal income tax purposes at period end are noted in the following table. The primary difference between book and tax appreciation or depreciation of securities and other investments, if applicable, is attributable to the tax deferral of losses or tax realization of financial statement unrealized gain or loss.
| | | | |
| Federal tax cost of securities | | $ | 358,222,165 | |
| Federal tax cost of other investments | | | (47,870,304) | |
| | | | |
| Total federal tax cost | | $ | 310,351,861 | |
| | | | |
| Gross unrealized appreciation | | $ | 22,691,856 | |
| Gross unrealized depreciation | | | (26,055,906) | |
| | | | |
| Net unrealized depreciation | | $ | (3,364,050) | |
| | | | |
Use of Estimates. The preparation of financial statements in conformity with U.S. GAAP requires management to make estimates and assumptions that affect the reported amounts of assets and liabilities and disclosure of contingent assets and liabilities at the date of the financial statements and the reported amounts of increases and decreases in net assets from operations during the reporting period. Actual results could differ from those estimates.
New Accounting Pronouncements. In March 2017, Financial Accounting Standards Board (“FASB”) issued Accounting Standards Update (“ASU”), ASU2017-08. This provides guidance related to the amortization period for certain purchased callable debt securities held at a premium. The ASU is effective for annual periods beginning after December 15, 2018, and interim periods within those annual periods. The Manager has evaluated the impacts of these changes on the financial statements and there are no material impacts.
During August 2018, the Securities and Exchange Commission (the “SEC”) issued Final Rule ReleaseNo. 33-10532 (the “Rule”), Disclosure Update and Simplification. The rule amends certain financial statement disclosure requirements to conform to U.S. GAAP. The amendments to Rule6-04.17 of RegulationS-X (balance sheet) remove the requirement to separately state the book basis components of net assets: undistributed (over-distribution of) net investment income (“UNII”), accumulated undistributed net realized gains (losses), and net unrealized appreciation (depreciation) at the balance sheet date. Instead, consistent with U.S. GAAP, funds will be required to disclose total distributable earnings. The amendments to Rule6-09 of RegulationS-X (statement of changes in net assets) remove the requirement to separately state the sources of distributions paid. Instead, consistent with U.S. GAAP, funds will be required to disclose the total amount of distributions paid, except that any tax return of capital must be separately disclosed. The amendments also remove the requirement to parenthetically state the book basis amount of UNII on the statement of changes in net assets. The requirements of the Rule are effective November 5, 2018, and the Funds’ Consolidated Statement of Assets and Liabilities and Consolidated Statement of Changes in Net Assets for the current reporting period have been modified accordingly. In addition, certain amounts within each Fund’s Consolidated Statement of Changes in Net Assets for the prior fiscal period have been modified to conform to the Rule.
3. Securities Valuation
The Fund calculates the net asset value of its shares as of 4:00 P.M. Eastern Time, on each day the New York Stock Exchange (the “Exchange” or “NYSE”) is open for trading, except in the case of a scheduled early closing of the Exchange, in which case the Fund will calculate net asset value of the shares as of the scheduled early closing time of the Exchange.
The Fund’s Board has adopted procedures for the valuation of the Fund’s securities and has delegated theday-to-day responsibility for valuation
26 OPPENHEIMER GLOBAL MULTI-ALTERNATIVES FUND/VA
3. Securities Valuation (Continued)
determinations under those procedures to the Manager. The Manager has established a Valuation Committee which is responsible for determining a fair valuation for any security for which market quotations are not readily available. The Valuation Committee’s fair valuation determinations are subject to review, approval and ratification by the Fund’s Board at least quarterly or more frequently, if necessary.
Valuation Methods and Inputs
Securities are valued primarily using unadjusted quoted market prices, when available, as supplied by third party pricing services or broker-dealers.
The following methodologies are used to determine the market value or the fair value of the types of securities described below:
Equity securities traded on a securities exchange (including exchange-traded derivatives other than futures and futures options) are valued based on the official closing price on the principal exchange on which the security is traded, as identified by the Manager, prior to the time when the Fund’s assets are valued. If the official closing price is unavailable, the security is valued at the last sale price on the principal exchange on which it is traded, or if no sales occurred, the security is valued at the mean between the quoted bid and asked prices.Over-the-counter equity securities are valued at the last published sale price, or if no sales occurred, at the mean between the quoted bid and asked prices. Events occurring after the close of trading on foreign exchanges may result in adjustments to the valuation of foreign securities to more accurately reflect their fair value as of the time when the Fund’s assets are valued.
Shares of a registered investment company that are not traded on an exchange are valued at that investment company’s net asset value per share.
Corporate and government debt securities (of U.S. or foreign issuers) and municipal debt securities, short-term notes, mortgage-backed securities, collateralized mortgage obligations, and asset-backed securities are valued at the mean between the bid and asked prices utilizing evaluated prices obtained from third party pricing services or broker-dealers who may use matrix pricing methods to determine the evaluated prices. Pricing services generally price debt securities assuming orderly transactions of an institutional “round lot” size, but some trades may occur in smaller, “odd lot” sizes, sometimes at lower prices than institutional round lot trades. Standard inputs generally considered by third-party pricing vendors include reported trade data, broker-dealer price quotations, benchmark yields, issuer spreads on comparable securities, the credit quality, yield, maturity, as well as other appropriate factors.
Event-linked bonds, are valued at the mean between the bid and asked prices utilizing evaluated prices obtained from third party pricing services or broker-dealers. Standard inputs generally considered by third-party pricing vendors include reported trade data and broker-dealer price quotations.
Loans are valued at the mean between the bid and asked prices utilizing evaluated prices obtained from third party pricing services or broker-dealers. Standard inputs generally considered by third-party pricing vendors include information obtained from market participants regarding broker-dealer price quotations.
Structured securities, swaps, swaptions, and otherover-the-counter derivatives are valued utilizing evaluated prices obtained from third party pricing services or broker-dealers. Standard inputs generally considered by third-party pricing vendors include market information relevant to the underlying reference asset such as the price of financial instruments, stock market indices, foreign currencies, interest rate spreads, commodities, credit spreads, credit event probabilities, index values, individual security values, forward interest rates, variable interest rates, volatility measures, and forward currency rates, or the occurrence of other specific events.
Forward foreign currency exchange contracts are valued utilizing current and forward currency rates obtained from third party pricing services. When the settlement date of a contract is an interim date for which a quotation is not available, interpolated values are derived using the nearest dated forward currency rate.
Futures contracts and futures options traded on a commodities or futures exchange will be valued at the final settlement price or official closing price on the principal exchange as reported by such principal exchange at its trading session ending at, or most recently prior to, the time when the Fund’s assets are valued.
Securities for which market quotations are not readily available, or when a significant event has occurred that would materially affect the value of the security, are fair valued either (i) by a standardized fair valuation methodology applicable to the security type or the significant event as previously approved by the Valuation Committee and the Fund’s Board or (ii) as determined in good faith by the Manager’s Valuation Committee. The Valuation Committee considers all relevant facts that are reasonably available, through either public information or information available to the Manager, when determining the fair value of a security. Those standardized fair valuation methodologies include, but are not limited to, valuing securities at the last sale price or initially at cost and subsequently adjusting the value based on: changes in company specific fundamentals, changes in an appropriate securities index, or changes in the value of similar securities which may be further adjusted for any discounts related to security-specific resale restrictions. When possible, such methodologies use observable market inputs such as unadjusted quoted prices of similar securities, observable interest rates, currency rates and yield curves. The methodologies used for valuing securities are not necessarily an indication of the risks associated with investing in those securities nor can it be assured that the Fund can obtain the fair value assigned to a security if it were to sell the security.
To assess the continuing appropriateness of security valuations, the Manager regularly compares prior day prices and sale prices to the current day prices and challenges those prices exceeding certain tolerance levels with the third party pricing service or broker source. For those securities valued by fair valuations, whether through a standardized fair valuation methodology or a fair valuation determination, the Valuation Committee reviews and affirms the reasonableness of the valuations based on such methodologies and fair valuation determinations on a regular basis after considering all relevant information that is reasonably available.
Classifications
Each investment asset or liability of the Fund is assigned a level at measurement date based on the significance and source of the inputs to its valuation.
Various data inputs may be used in determining the value of each of the Fund’s investments as of the reporting period end. These data inputs are
27 OPPENHEIMER GLOBAL MULTI-ALTERNATIVES FUND/VA
NOTES TO CONSOLIDATED FINANCIAL STATEMENTSContinued
3. Securities Valuation (Continued)
categorized in the following hierarchy under applicable financial accounting standards:
1) Level1-unadjusted quoted prices in active markets for identical assets or liabilities (including securities actively traded on a securities exchange)
2) Level2-inputs other than unadjusted quoted prices that are observable for the asset or liability (such as unadjusted quoted prices for similar assets and market corroborated inputs such as interest rates, prepayment speeds, credit risks, etc.)
3) Level3-significant unobservable inputs (including the Manager’s own judgments about assumptions that market participants would use in pricing the asset or liability).
The inputs used for valuing securities are not necessarily an indication of the risks associated with investing in those securities.
The Fund classifies each of its investments in investment companies which are publicly offered as Level 1. Investment companies that are not publicly offered, if any, are classified as Level 2 in the fair value hierarchy.
The table below categorizes amounts that are included in the Fund’s Consolidated Statement of Assets and Liabilities at period end based on valuation input level:
| | | | | | | | | | | | | | | | |
| | | Level 1— Unadjusted Quoted Prices | | | Level 2— Other Significant Observable Inputs | | | Level 3— Significant Unobservable Inputs | | | Value | |
| Assets Table | | | | | | | | | | | | | | | | |
| Investments, at Value: | | | | | | | | | | | | | | | | |
| Common Stocks | | | | | | | | | | | | | | | | |
Consumer Discretionary | | $ | 20,825,812 | | | $ | — | | | $ | 59 | | | $ | 20,825,871 | |
Consumer Staples | | | 4,208,804 | | | | — | | | | — | | | | 4,208,804 | |
Energy | | | 29,951,387 | | | | — | | | | — | | | | 29,951,387 | |
Financials | | | 28,852,542 | | | | 9,609,638 | | | | — | | | | 38,462,180 | |
Health Care | | | 15,544,539 | | | | 914,667 | | | | — | | | | 16,459,206 | |
Industrials | | | 16,900,992 | | | | — | | | | — | | | | 16,900,992 | |
Information Technology | | | 36,559,534 | | | | — | | | | — | | | | 36,559,534 | |
Materials | | | 3,882,668 | | | | — | | | | — | | | | 3,882,668 | |
Telecommunication Services | | | 2,173,866 | | | | — | | | | — | | | | 2,173,866 | |
Utilities | | | 5,342,610 | | | | — | | | | — | | | | 5,342,610 | |
| Preferred Stocks | | | 1,285,159 | | | | 823,652 | | | | 105,921 | | | | 2,214,732 | |
| Rights, Warrants and Certificates | | | — | | | | — | | | | — | | | | — | |
| Asset-Backed Securities | | | — | | | | 9,963,374 | | | | — | | | | 9,963,374 | |
| Mortgage-Backed Obligation | | | — | | | | 2,300,788 | | | | — | | | | 2,300,788 | |
| Foreign Government Obligation | | | — | | | | 22,063,134 | | | | — | | | | 22,063,134 | |
| Non-Convertible Corporate Bonds and Notes | | | — | | | | 7,023,847 | | | | — | | | | 7,023,847 | |
| Corporate Loans | | | — | | | | 13,532,664 | | | | — | | | | 13,532,664 | |
| Event-Linked Bonds | | | — | | | | 59,147,276 | | | | 135,050 | | | | 59,282,326 | |
| Structured Securities | | | — | | | | 1,133,996 | | | | — | | | | 1,133,996 | |
| Short-Term Notes | | | — | | | | 46,086,166 | | | | — | | | | 46,086,166 | |
| Investment Companies | | | 14,284,901 | | | | — | | | | — | | | | 14,284,901 | |
| Exchange-Traded Options Purchased | | | 2,490 | | | | — | | | | — | | | | 2,490 | |
| Over-the-Counter Option Purchased | | | — | | | | 33,648 | | | | — | | | | 33,648 | |
| Over-the-Counter Interest Rate Swaptions Purchased | | | — | | | | 338,954 | | | | — | | | | 338,954 | |
| | | | |
| Total Investments, at Value | | | 179,815,304 | | | | 172,971,804 | | | | 241,030 | | | | 353,028,138 | |
| Other Financial Instruments: | | | | | | | | | | | | | | | | |
| Swaps, at value | | | — | | | | 952,199 | | | | — | | | | 952,199 | |
| Centrally cleared swaps, at value | | | — | | | | 263,287 | | | | — | | | | 263,287 | |
| Futures contracts | | | 605,940 | | | | — | | | | — | | | | 605,940 | |
| Forward currency exchange contracts | | | — | | | | 601,774 | | | | — | | | | 601,774 | |
| | | | |
| Total Assets | | $ | 180,421,244 | | | $ | 174,789,064 | | | $ | 241,030 | | | $ | 355,451,338 | |
| | | | |
| | | | |
| Liabilities Table | | | | | | | | | | | | | | | | |
| Other Financial Instruments: | | | | | | | | | | | | | | | | |
| Common Stock Securities Sold Short | | $ | (35,466,025 | ) | | $ | (3,370,028 | ) | | $ | — | | | $ | (38,836,053 | ) |
| Other Financial Instruments: | | | | | | | | | | | | | | | | |
| Swaps, at value | | | — | | | | (2,013,867 | ) | | | — | | | | (2,013,867 | ) |
| Centrally cleared swaps, at value | | | — | | | | (167,870 | ) | | | — | | | | (167,870 | ) |
| Options written, at value | | | — | | | | (81,620 | ) | | | — | | | | (81,620 | ) |
| Futures contracts | | | (835,372 | ) | | | — | | | | — | | | | (835,372 | ) |
| Forward currency exchange contracts | | | — | | | | (3,020,703 | ) | | | — | | | | (3,020,703 | ) |
| | | | |
| Total Liabilities | | $ | (36,301,397 | ) | | $ | (8,654,088 | ) | | $ | — | | | $ | (44,955,485 | ) |
| | | | |
Forward currency exchange contracts and futures contracts, if any, are reported at their unrealized appreciation/depreciation at measurement date, which represents the change in the contract’s value from trade date. All additional assets and liabilities included in the above table are reported at their market value at measurement date.
28 OPPENHEIMER GLOBAL MULTI-ALTERNATIVES FUND/VA
3. Securities Valuation (Continued)
The table below shows the transfers between Level 2 and Level 3. The Fund’s policy is to recognize transfers in and transfers out as of the beginning of the reporting period.
| | | | | | | | |
| | | Transfers out of Level 2* | | | Transfers into Level 3* | |
| Assets Table | | | | | | | | |
| Investments, at Value: | | | | | | | | |
| Common Stocks | | | | | | | | |
Information Technology | | $ | (2) | | | $ | 2 | |
Industrials | | | (6,273) | | | | 6,273 | |
| Preferred Stocks | | | (240,517) | | | | 240,517 | |
| Event-Linked Bonds | | | (13,000) | | | | 13,000 | |
| | | | |
| Total Assets | | $ | (259,792) | | | $ | 259,792 | |
| | | | |
*Transferred from Level 2 to Level 3 because of the lack of observable market data due to a decrease in market activity for these securities.
4. Investments and Risks
Risks of Foreign Investing.The Fund may invest in foreign securities which are subject to special risks. Securities traded in foreign markets may be less liquid and more volatile than those traded in U.S. markets. Foreign issuers are usually not subject to the same accounting and disclosure requirements that U.S. companies are subject to, which may make it difficult for the Fund to evaluate a foreign company’s operations or financial condition. A change in the value of a foreign currency against the U.S. dollar will result in a change in the U.S. dollar value of investments denominated in that foreign currency and in the value of any income or distributions the Fund may receive on those investments. The value of foreign investments may be affected by exchange control regulations, foreign taxes, higher transaction and other costs, delays in the settlement of transactions, changes in economic or monetary policy in the United States or abroad, expropriation or nationalization of a company’s assets, or other political and economic factors. In addition, due to the inter-relationship of global economies and financial markets, changes in political and economic factors in one country or region could adversely affect conditions in another country or region. Investments in foreign securities may also expose the Fund to time-zone arbitrage risk. Foreign securities may trade on weekends or other days when the Fund does not price its shares. At times, the Fund may emphasize investments in a particular country or region and may be subject to greater risks from adverse events that occur in that country or region. Foreign securities and foreign currencies held in foreign banks and securities depositories may be subject to limited or no regulatory oversight.
Investments in Affiliated Funds. The Fund is permitted to invest in other mutual funds advised by the Manager (“Affiliated Funds”). Affiliated Funds are management investment companies registered under the 1940 Act, as amended. The Manager is the investment adviser of, and theSub-Adviser provides investment and related advisory services to, the Affiliated Funds. When applicable, the Fund’s investments in Affiliated Funds are included in the Consolidated Statement of Investments. Shares of Affiliated Funds are valued at their net asset value per share. As a shareholder, the Fund is subject to its proportional share of the Affiliated Funds’ expenses, including their management fee. The Manager will waive fees and/or reimburse Fund expenses in an amount equal to the indirect management fees incurred through the Fund’s investment in the Affiliated Funds.
Each of the Affiliated Funds in which the Fund invests has its own investment risks, and those risks can affect the value of the Fund’s investments and therefore the value of the Fund’s shares. To the extent that the Fund invests more of its assets in one Affiliated Fund than in another, the Fund will have greater exposure to the risks of that Affiliated Fund.
Investments in Money Market Instruments.The Fund is permitted to invest its free cash balances in money market instruments to provide liquidity or for defensive purposes. The Fund may invest in money market instruments by investing in Class E shares of Oppenheimer Institutional Government Money Market Fund (“IGMMF”), which is an Affiliated Fund. IGMMF is regulated as a money market fund under the 1940 Act, as amended. The Fund may also invest in money market instruments directly or in other affiliated or unaffiliated money market funds.
Master Limited Partnerships (“MLPs”).MLPs issue common units that represent an equity ownership interest in a partnership and provide limited voting rights. MLP common units are registered with the Securities and Exchange Commission (“SEC”), and are freely tradable on securities exchanges such as the NYSE and the NASDAQ Stock Market (“NASDAQ”), or in theover-the-counter (“OTC”) market. An MLP consists of one or more general partners, who conduct the business, and one or more limited partners, who contribute capital. MLP common unit holders have a limited role in the partnership’s operations and management. The Fund, as a limited partner, normally would not be liable for the debts of the MLP beyond the amounts the Fund has contributed, but would not be shielded to the same extent that a shareholder of a corporation would be. In certain circumstances creditors of an MLP would have the right to seek return of capital distributed to a limited partner. This right of an MLP’s creditors would continue after the Fund sold its investment in the MLP.
Structured Securities.The Fund invests in structured securities whose market values, interest rates and/or redemption prices are linked to the performance of underlying foreign currencies, interest rate spreads, stock market indices, prices of individual securities, commodities or other financial instruments or the occurrence of other specific events. The structured securities are often leveraged, increasing the volatility of each note’s market value relative to the change in the underlying linked financial element or event. Fluctuations in value of these securities are recorded as unrealized gains and losses in the accompanying Consolidated Statement of Operations. The Fund records a realized gain or loss when a structured security is sold or matures.
29 OPPENHEIMER GLOBAL MULTI-ALTERNATIVES FUND/VA
NOTES TO CONSOLIDATED FINANCIAL STATEMENTSContinued
4. Investments and Risks (Continued)
Event-Linked Bonds.The Fund may invest in “event-linked” bonds. Event-linked bonds, which are sometimes referred to as “catastrophe” bonds, are fixed income securities for which the return of principal and payment of interest is contingent on thenon-occurrence of a specific trigger event, such as a hurricane, earthquake, or other occurrence that leads to physical or economic loss. If the trigger event occurs prior to maturity, the Fund may lose all or a portion of its principal in addition to interest otherwise due from the security. Event-linked bonds may expose the Fund to certain other risks, including issuer default, adverse regulatory or jurisdictional interpretations, liquidity risk and adverse tax consequences. The Fund records the net change in market value of event-linked bonds on the Consolidated Statement of Operations as a change in unrealized appreciation or depreciation on investments. The Fund records a realized gain or loss on the Consolidated Statement of Operations upon the sale or maturity of such securities.
Loans.The Fund invests in loans made to U.S. and foreign borrowers that are corporations, partnerships or other business entities. The Fund will do so directly as an original lender or by assignment or indirectly through participation agreements or certain derivative instruments. While many of these loans will be collateralized, the Fund can also invest in uncollateralized loans. Loans are often issued in connection with recapitalizations, acquisitions, leveraged buyouts, and refinancing of borrowers. The loans often pay interest at rates that float above (or are adjusted periodically based on) a benchmark that reflects current interest rates although the Fund can also invest in loans with fixed interest rates.
When investing in loans, the Fund generally will have a contractual relationship only with the lender, not with the relevant borrower. As a result, the Fund generally will have the right to receive payments of principal, interest, and any fees to which it is entitled only from the lender selling the participation and only upon receipt by the lender of the payments from the relevant borrower. The Fund may not directly benefit from the collateral supporting the debt obligation in which it has purchased the participation. As a result, the Fund will assume the credit risk of both the borrower and the institution selling the participation to the Fund.
Restricted Securities.At period end, investments in securities included issues that are restricted. A restricted security may have a contractual restriction on its resale and is valued under methods approved by the Board of Trustees as reflecting fair value. Securities that are restricted are marked with an applicable footnote on the Consolidated Statement of Investments. Restricted securities are reported on a schedule following the Consolidated Statement of Investments.
Equity Security Risk.Stocks and other equity securities fluctuate in price. The value of the Fund’s portfolio may be affected by changes in the equity markets generally. Equity markets may experience significant short-term volatility and may fall sharply at times. Different markets may behave differently from each other and U.S. equity markets may move in the opposite direction from one or more foreign stock markets. Adverse events in any part of the equity or fixed-income markets may have unexpected negative effects on other market segments.
The prices of individual equity securities generally do not all move in the same direction at the same time and a variety of factors can affect the price of a particular company’s securities. These factors may include, but are not limited to, poor earnings reports, a loss of customers, litigation against the company, general unfavorable performance of the company’s sector or industry, or changes in government regulations affecting the company or its industry.
Credit Risk.The Fund invests in high-yield,non-investment-grade bonds, which may be subject to a greater degree of credit risk. Credit risk relates to the ability of the issuer to meet interest or principal payments or both as they become due. The Fund may acquire securities that have missed an interest payment, and is not obligated to dispose of securities whose issuers or underlying obligors subsequently miss an interest and/or principal payment.
Information concerning securities not accruing interest at period end is as follows:
| | | | |
| Cost | | | $5,761 | |
| Market Value | | | $– | |
| Market Value as % of Net Assets | | | Less than 0.005 | % |
Sovereign Debt Risk.The Fund invests in sovereign debt securities, which are subject to certain special risks. These risks include, but are not limited to, the risk that a governmental entity may delay or refuse, or otherwise be unable, to pay interest or repay the principal on its sovereign debt. There may also be no legal process for collecting sovereign debt that a government does not pay or bankruptcy proceedings through which all or part of such sovereign debt may be collected. In addition, a restructuring or default of sovereign debt may also cause additional impacts to the financial markets, such as downgrades to credit ratings, reduced liquidity and increased volatility, among others.
Shareholder Concentration.At period end, one shareholder owned 20% or more of the Fund’s total outstanding shares.
The shareholder is a related partyof the Fund. Related parties may include, but are not limited to, the investment manager and its affiliates, affiliated broker dealers, fund of funds, and directors or employees.The related partyowned 95% of the Fund’s total outstanding shares at period end.
5. Market Risk Factors
The Fund’s investments in securities and/or financial derivatives may expose the Fund to various market risk factors:
Commodity Risk. Commodity risk relates to the change in value of commodities or commodity indexes as they relate to increases or decreases in the commodities market. Commodities are physical assets that have tangible properties. Examples of these types of assets are crude oil, heating oil, metals, livestock, and agricultural products.
Credit Risk.Credit risk relates to the ability of the issuer of debt to meet interest and principal payments, or both, as they come due. In general,
30 OPPENHEIMER GLOBAL MULTI-ALTERNATIVES FUND/VA
5. Market Risk Factors (Continued)
lower-grade, higher-yield debt securities are subject to credit risk to a greater extent than lower-yield, higher-quality securities.
Equity Risk. Equity risk relates to the change in value of equity securities as they relate to increases or decreases in the general market.
Foreign Exchange Rate Risk. Foreign exchange rate risk relates to the change in the U.S. dollar value of a security held that is denominated in a foreign currency. The U.S. dollar value of a foreign currency denominated security will decrease as the dollar appreciates against the currency, while the U.S. dollar value will increase as the dollar depreciates against the currency.
Interest Rate Risk.Interest rate risk refers to the fluctuations in value of fixed-income securities resulting from the inverse relationship between price and yield. For example, an increase in general interest rates will tend to reduce the market value of already issued fixed-income investments, and a decline in general interest rates will tend to increase their value. In addition, debt securities with longer maturities, which tend to have higher yields, are subject to potentially greater fluctuations in value from changes in interest rates than obligations with shorter maturities.
Volatility Risk.Volatility risk refers to the magnitude of the movement, but not the direction of the movement, in a financial instrument’s price over a defined time period. Large increases or decreases in a financial instrument’s price over a relative time period typically indicate greater volatility risk, while small increases or decreases in its price typically indicate lower volatility risk.
6. Use of Derivatives
The Fund’s investment objective not only permits the Fund to purchase investment securities, it also allows the Fund to enter into various types of derivatives contracts, including, but not limited to, futures contracts, forward currency exchange contracts, credit default swaps, interest rate swaps, total return swaps, variance swaps and purchased and written options. In doing so, the Fund will employ strategies in differing combinations to permit it to increase, decrease, or change the level or types of exposure to market risk factors. These instruments may allow the Fund to pursue its objectives more quickly and efficiently than if it were to make direct purchases or sales of securities capable of effecting a similar response to market factors. Such contracts may be entered into through a bilateralover-the-counter (“OTC”) transaction, or through a securities or futures exchange and cleared through a clearinghouse.
Derivatives may have little or no initial cash investment relative to their market value exposure and therefore can produce significant gains or losses in excess of their cost due to changes in the market risk factors and the overall market. This use of embedded leverage allows the Fund to increase its market value exposure relative to its net assets and can substantially increase the volatility of the Fund’s performance. In instances where the Fund is using derivatives to decrease, or hedge, exposures to market risk factors for securities held by the Fund, there are also risks that those derivatives may not perform as expected resulting in losses for the combined or hedged positions. Some derivatives have the potential for unlimited loss, regardless of the size of the Fund’s initial investment.
Additional associated risks from investing in derivatives also exist and potentially could have significant effects on the valuation of the derivative and the Fund. Typically, the associated risks are not the risks that the Fund is attempting to increase or decrease exposure to, per its investment objective, but are the additional risks from investing in derivatives. Examples of these associated risks are liquidity risk, which is the risk that the Fund will not be able to sell the derivative in the open market in a timely manner, and counterparty credit risk, which is the risk that the counterparty will not fulfill its obligation to the Fund.
The Fund’s actual exposures to these market risk factors and associated risks during the period are discussed in further detail, by derivative type, below.
Forward Currency Exchange Contracts
The Fund may enter into forward currency exchange contracts (“forward contracts”) for the purchase or sale of a foreign currency at a negotiated rate at a future date. Such contracts are traded in the OTC inter-bank currency dealer market.
Forward contracts are reported on a schedule following the Consolidated Statement of Investments. The unrealized appreciation (depreciation) is reported in the Consolidated Statement of Assets and Liabilities as a receivable (or payable) and in the Consolidated Statement of Operations within the change in unrealized appreciation (depreciation). At contract close, the difference between the original cost of the contract and the value at the close date is recorded as a realized gain (loss) in the Consolidated Statement of Operations.
The Fund may enter into forward foreign currency exchange contracts in order to decrease exposure to foreign exchange rate risk associated with either specific transactions or portfolio instruments or to increase exposure to foreign exchange rate risk.
During the reporting period, the Fund had daily average contract amounts on forward contracts to buy and sell of $88,902,396 and $165,409,403, respectively.
Additional associated risk to the Fund includes counterparty credit risk. Counterparty credit risk arises from the possibility that the counterparty to a forward contract will default and fail to perform its obligations to the Fund.
Futures Contracts
A futures contract is a commitment to buy or sell a specific amount of a commodity, financial instrument or currency at a negotiated price on a stipulated future date. The Fund may buy and sell futures contracts and may also buy or write put or call options on these futures contracts. Futures contracts and options thereon are generally entered into on a regulated futures exchange and cleared through a clearinghouse associated with the exchange.
Upon entering into a futures contract, the Fund is required to deposit either cash or securities (initial margin) in an amount equal to a certain percentage of the contract value in an account registered in the futures commission merchant’s name. Subsequent payments (variation margin) are paid to or from the futures commission merchant each day equal to the daily changes in the contract value. Such payments are recorded as unrealized gains
31 OPPENHEIMER GLOBAL MULTI-ALTERNATIVES FUND/VA
NOTES TO CONSOLIDATED FINANCIAL STATEMENTSContinued
6. Use of Derivatives (Continued)
and losses. Should the Fund fail to make requested variation margin payments, the futures commission merchant can gain access to the initial margin to satisfy the Fund’s payment obligations.
Futures contracts are reported on a schedule following the Consolidated Statement of Investments. Securities held by a futures commission merchant to cover initial margin requirements on open futures contracts are noted in the Consolidated Statement of Investments. Cash held by a futures commission merchant to cover initial margin requirements on open futures contracts and the receivable and/or payable for the daily mark to market for the variation margin are noted in the Consolidated Statement of Assets and Liabilities. The net change in unrealized appreciation and depreciation is reported in the Consolidated Statement of Operations. Realized gains (losses) are reported in the Consolidated Statement of Operations at the closing or expiration of futures contracts.
The Fund may purchase and/or sell financial futures contracts and options on futures contracts to gain exposure to, or decrease exposure to interest rate risk, equity risk, foreign exchange rate risk, volatility risk, or commodity risk.
During the reporting period, the Fund had an ending monthly average market value of 82,489,865 and $54,124,776 on futures contracts purchased and sold, respectively.
Additional associated risks of entering into futures contracts (and related options) include the possibility that there may be an illiquid market where the Fund is unable to liquidate the contract or enter into an offsetting position and, if used for hedging purposes, the risk that the price of the contract will correlate imperfectly with the prices of the Fund’s securities.
Option Activity
The Fund may buy and sell put and call options, or write put and call options. When an option is written, the Fund receives a premium and becomes obligated to sell or purchase the underlying security, currency or other underlying financial instrument at a fixed price, upon exercise of the option.
Options can be traded through an exchange or through a privately negotiated arrangement with a dealer in an OTC transaction. Options traded through an exchange are generally cleared through a clearinghouse (such as The Options Clearing Corporation). The difference between the premium received or paid, and market value of the option, is recorded as unrealized appreciation or depreciation. The net change in unrealized appreciation or depreciation is reported in the Consolidated Statement of Operations. When an option is exercised, the cost of the security purchased or the proceeds of the security sale are adjusted by the amount of premium received or paid. Upon the expiration or closing of the option transaction, a gain or loss is reported in the Consolidated Statement of Operations.
Foreign Currency Options.The Fund may purchase or write call and put options on currencies to increase or decrease exposure to foreign exchange rate risk. A purchased call, or written put option becomes more valuable as the price of the underlying financial instrument appreciates relative to the strike price. A purchased put, or written call option becomes more valuable as the price of the underlying financial instrument depreciates relative to the strike price.
Index/Security Options.The Fund may purchase or write call and put options on individual equity securities and/or equity indexes to increase or decrease exposure to equity risk. A purchased call or written put option becomes more valuable as the price of the underlying financial instrument appreciates relative to the strike price. A purchased put or written call option becomes more valuable as the price of the underlying financial instrument depreciates relative to the strike price.
During the reporting period, the Fund had an ending monthly average market value of $107,940 and $70,579 on purchased call options and purchased put options, respectively.
Options written, if any, are reported in a schedule following the Consolidated Statement of Investments and as a liability in the Consolidated Statement of Assets and Liabilities. Securities held in collateral accounts to cover potential obligations with respect to outstanding written options are noted in the Consolidated Statement of Investments.
The risk in writing a call option is the market price of the underlying security increasing above the strike price and the option being exercised. The Fund must then purchase the underlying security at the higher market price and deliver it for the strike price or, if it owns the underlying security, deliver it at the strike price and forego any benefit from the increase in the price of the underlying security above the strike price. The risk in writing a put option is the market price of the underlying security decreasing below the strike price and the option being exercised. The Fund must then purchase the underlying security at the strike price when the market price of the underlying security is below the strike price. Alternatively, the Fund could also close out a written option position, in which case the risk is that the closing transaction will require a premium to be paid by the Fund that is greater than the premium the Fund received. When writing options, the Fund has the additional risk that there may be an illiquid market where the Fund is unable to close the contract. The risk in buying an option is that the Fund pays a premium for the option, and the option may be worth less than the premium paid or expire worthless.
During the reporting period, the Fund had an ending monthly average market value of $55,369 and $107,278 on written call options and written put options, respectively.
Additional associated risks to the Fund include counterparty credit risk and liquidity risk.
Swap Contracts
The Fund may enter into swap contract agreements with a counterparty to exchange a series of cash flows based on either specified reference rates, the price or volatility of asset ornon-asset references, or the occurrence of a credit event, over a specified period. Swaps can be executed in abi-lateral privately negotiated arrangement with a dealer in an OTC transaction (“OTC swaps”) or executed on a regulated market. Certain swaps, regardless of the venue of their execution, are required to be cleared through a clearinghouse (“centrally cleared swaps”). Swap contracts may include interest rate, equity, debt, index, total return, credit default, currency, and volatility swaps.
32 OPPENHEIMER GLOBAL MULTI-ALTERNATIVES FUND/VA
6. Use of Derivatives (Continued)
Swap contracts are reported on a schedule following the Consolidated Statement of Investments. The values of centrally cleared swap and OTC swap contracts are aggregated by positive and negative values and disclosed separately on the Consolidated Statement of Assets and Liabilities. The unrealized appreciation (depreciation) related to the change in the valuation of the notional amount of the swap is combined with the accrued interest due to (owed by) the Fund, if any, at termination or settlement. The net change in this amount during the period is included on the Consolidated Statement of Operations. The Fund also records any periodic payments received from (paid to) the counterparty, including at termination, under such contracts as realized gain (loss) on the Consolidated Statement of Operations.
Swap contract agreements are exposed to the market risk factor of the specific underlying reference rate or asset. Swap contracts are typically more attractively priced compared to similar investments in related cash securities because they isolate the risk to one market risk factor and eliminate the other market risk factors. Investments in cash securities (for instance bonds) have exposure to multiple risk factors (credit and interest rate risk). Because swaps have embedded leverage, they can expose the Fund to substantial risk in the isolated market risk factor.
Credit Default Swap Contracts.A credit default swap is a contract that enables an investor to buy or sell protection against a defined-issuer credit event, such as the issuer’s failure to make timely payments of interest or principal on a debt security, bankruptcy or restructuring. The Fund may enter into credit default swaps either by buying or selling protection on a corporate issuer, sovereign issuer, or a basket or index of issuers (the “reference asset”).
The buyer of protection pays a periodic fee to the seller of protection based on the notional amount of the swap contract. The seller of protection agrees to compensate the buyer of protection for future potential losses as a result of a credit event on the reference asset. The contract effectively transfers the credit event risk of the reference asset from the buyer of protection to the seller of protection.
The ongoing value of the contract will fluctuate throughout the term of the contract based primarily on the credit risk of the reference asset. If the credit quality of the reference asset improves relative to the credit quality at contract initiation, the buyer of protection may have an unrealized loss greater than the anticipated periodic fee owed. This unrealized loss would be the result of current credit protection being cheaper than the cost of credit protection at contract initiation. If the buyer elects to terminate the contract prior to its maturity, and there has been no credit event, this unrealized loss will become realized. If the contract is held to maturity, and there has been no credit event, the realized loss will be equal to the periodic fee paid over the life of the contract.
If there is a credit event, the buyer of protection can exercise its rights under the contract and receive a payment from the seller of protection equal to the notional amount of the swap less the market value of specified debt securities issued by the reference asset. Upon exercise of the contract the difference between such value and the notional amount is recorded as realized gain (loss) and is included on the Consolidated Statement of Operations.
The Fund may purchase or sell credit protection through credit default swaps to increase or decrease exposure to the credit risk of individual issuers and/or indexes of issuers that are either unavailable or considered to be less attractive in the bond market.
The Fund has engaged in spread curve trades by simultaneously purchasing and selling protection through credit default swaps referenced to the same reference asset but with different maturities. Spread curve trades attempt to gain exposure to credit risk on a forward basis by realizing gains on the expected differences in spreads.
For the reporting period, the Fund had ending monthly average notional amounts of $23,253,019 and 7,007,506 on credit default swaps to buy protection and credit default swaps to sell protection, respectively.
Additional associated risks to the Fund include counterparty credit risk and liquidity risk.
Interest Rate Swap Contracts.An interest rate swap is an agreement between counterparties to exchange periodic payments based on interest rates. One cash flow stream will typically be a floating rate payment based upon a specified floating interest rate while the other is typically a fixed interest rate.
The Fund may enter into interest rate swaps in which it pays the fixed or floating interest rate in order to increase or decrease exposure to interest rate risk. Typically, if relative interest rates rise, floating payments under a swap agreement will be greater than the fixed payments.
For the reporting period, the Fund had ending monthly average notional amounts of $6,163,245 and $6,176,570 on interest rate swaps which pay a fixed rate and interest rate swaps which receive a fixed rate, respectively.
Additional associated risks to the Fund include counterparty credit risk and liquidity risk.
At period end, the Fund had no interest rate swap agreements outstanding.
Total Return Swap Contracts.A total return swap is an agreement between counterparties to exchange periodic payments based on the value of asset ornon-asset references. One cash flow is typically based on anon-asset reference (such as an interest rate) and the other on the total return of a reference asset (such as a security or a basket of securities or securities index). The total return of the reference asset typically includes appreciation or depreciation on the reference asset, plus any interest or dividend payments.
Total return swap contracts are exposed to the market risk factor of the specific underlying financial instrument or index. Total return swaps are less standard in structure than other types of swaps and can isolate and/or include multiple types of market risk factors including equity risk, credit risk, and interest rate risk.
The Fund may enter into total return swaps on various equity securities or indexes to increase or decrease exposure to equity risk. These equity risk related total return swaps require the Fund to pay or receive a floating reference interest rate, and an amount equal to the opposite price movement of securities or an index (expressed as a percentage) multiplied by the notional amount of the contract. Equity leg payments equal to the positive price movement of the same securities or index (expressed as a percentage) multiplied by the notional amount of the contract and, in some cases, dividends paid on the securities. Reference leg payments equal a floating reference interest rate and an amount equal to the negative price movement of the same securities or index (expressed as a percentage) multiplied by the notional amount of the contract.
33 OPPENHEIMER GLOBAL MULTI-ALTERNATIVES FUND/VA
NOTES TO CONSOLIDATED FINANCIAL STATEMENTSContinued
6. Use of Derivatives (Continued)
The Fund may enter into total return swaps to increase or decrease exposure to the credit risk of various indexes or basket of securities. These credit risk related total return swaps require the Fund to pay to, or receive payments from, the counterparty based on the movement of credit spreads of the related indexes or securities.
For the reporting period, the Fund had ending monthly average notional amounts of $64,411,000 and $8,767,381 on total return swaps which are long the reference asset and total return swaps which are short the reference asset, respectively.
Additional associated risks to the Fund include counterparty credit risk and liquidity risk.
Volatility Swap Contracts. A volatility swap is an agreement between counterparties to exchange periodic payments based on the measured volatility of a reference security, index, currency or other reference investment over a specified time frame. One cash flow is typically based on the realized volatility of the reference investment as measured by changes in its price or level over the specified time period while the other cash flow is based on a specified rate representing expected volatility for the reference investment at the time the swap is executed, or the measured volatility of a different reference investment over the specified time period. The appreciation or depreciation on a volatility swap will typically depend on the magnitude of the reference investment’s volatility, or size of the movements in its price, over the specified time period, rather than general directional increases or decreases in its price.
Volatility swaps are less standard in structure than other types of swaps and provide pure, or isolated, exposure to volatility risk of the specific underlying reference investment. Volatility swaps are typically used to speculate on future volatility levels, to trade the spread between realized and expected volatility, or to decrease the volatility exposure of investments held by the Fund.
The Fund may enter into volatility/variance swaps to increase or decrease exposure to the volatility risk of various reference investments. These types of volatility swaps require the Fund to either pay the measured volatility, or price variance or the fixed rate payment then receive a fixed rate payment or the measured volatility or price variance. If the measured volatility of the related reference investment increases over the period, the measured volatility payment will depreciate in value. Conversely, if the measured volatility of the related reference investment decreases over the period, the fixed rate swap payment will appreciate in value.
For the reporting period, the Fund had ending monthly average notional amounts of $12,969 and $6,980 on volatility swaps which pay measured volatility/variance and volatility swaps which receive measured volatility/variance, respectively.
Additional associated risks to the Fund include counterparty credit risk and liquidity risk.
At period end, the Fund had no volatility swap agreements outstanding.
Swaption Transactions
The Fund may enter into a swaption contract which grants the purchaser the right, but not the obligation, to enter into a swap transaction at preset terms detailed in the underlying agreement within a specified period of time. The purchaser pays a premium to the swaption writer who bears the risk of unfavorable changes in the preset terms on the underlying swap.
Purchased swaptions are reported as a component of investments in the Consolidated Statement of Investments and the Consolidated Statement of Assets and Liabilities. Written swaptions are reported on a schedule following the Consolidated Statement of Investments and their value is reported as a separate asset or liability line item in the Consolidated Statement of Assets and Liabilities. The net change in unrealized appreciation or depreciation on written swaptions is separately reported in the Consolidated Statement of Operations. When a swaption is exercised, the cost of the swap is adjusted by the amount of premium paid or received. Upon the expiration or closing of an unexercised swaption contract, a gain or loss is reported in the Consolidated Statement of Operations for the amount of the premium paid or received.
The Fund generally will incur a greater risk when it writes a swaption than when it purchases a swaption. When the Fund writes a swaption it will become obligated, upon exercise of the swaption, according to the terms of the underlying agreement. Swaption contracts written by the Fund do not give rise to counterparty credit risk prior to exercise as they obligate the Fund, not its counterparty, to perform. When the Fund purchases a swaption it only risks losing the amount of the premium it paid if the swaption expires unexercised. However, when the Fund exercises a purchased swaption there is a risk that the counterparty will fail to perform or otherwise default on its obligations under the swaption contract.
The Fund may purchase swaptions which give it the option to enter into an interest rate swap in which it pays a floating or fixed interest rate and receives a fixed or floating interest rate in order to increase or decrease exposure to interest rate risk. Purchasing the fixed portion of this swaption becomes more valuable as the reference interest rate decreases relative to the preset interest rate. Purchasing the floating portion of this swaption becomes more valuable as the reference interest rate increases relative to the preset interest rate.
The Fund may write swaptions which give it the obligation, if exercised by the purchaser, to enter into an interest rate swap in which it pays a fixed or floating interest rate and receives a floating or fixed interest rate in order to increase or decrease exposure to interest rate risk. A written swaption paying a fixed rate becomes more valuable as the reference interest rate increases relative to the preset interest rate. A written swaption paying a floating rate becomes more valuable as the reference interest rate decreases relative to the preset interest rate.
During the reporting period, the Fund had an ending monthly average market value of $412,700 on purchased swaptions.
During the reporting period end, the Fund had no written swaption contracts outstanding.
Counterparty Credit Risk.Derivative positions are subject to the risk that the counterparty will not fulfill its obligation to the Fund. The Fund intends to enter into derivative transactions with counterparties that the Manager believes to be creditworthy at the time of the transaction.
The Fund’s risk of loss from counterparty credit risk on OTC derivatives is generally limited to the aggregate unrealized gain netted against any collateral held by the Fund. For OTC options purchased, the Fund bears the risk of loss of the amount of the premiums paid plus the positive change in market values net of any collateral held by the Fund should the counterparty fail to perform under the contracts. Options written by the Fund do not
34 OPPENHEIMER GLOBAL MULTI-ALTERNATIVES FUND/VA
6. Use of Derivatives (Continued)
typically give rise to counterparty credit risk, as options written generally obligate the Fund and not the counterparty to perform.
To reduce counterparty risk with respect to OTC transactions, the Fund has entered into master netting arrangements, established within the Fund’s International Swap and Derivatives Association, Inc. (“ISDA”) master agreements, which allow the Fund to make (or to have an entitlement to receive) a single net payment in the event of default(close-out netting) for outstanding payables and receivables with respect to certain OTC positions in swaps, options, swaptions, and forward currency exchange contracts for each individual counterparty. In addition, the Fund may require that certain counterparties post cash and/or securities in collateral accounts to cover their net payment obligations for those derivative contracts subject to ISDA master agreements. If the counterparty fails to perform under these contracts and agreements, the cash and/or securities will be made available to the Fund.
At period end, the Fund has required certain counterparties to post collateral of $440,000.
ISDA master agreements include credit related contingent features which allow counterparties to OTC derivatives to terminate derivative contracts prior to maturity in the event that, for example, the Fund’s net assets decline by a stated percentage or the Fund fails to meet the terms of its ISDA master agreements, which would cause the Fund to accelerate payment of any net liability owed to the counterparty.
For financial reporting purposes, the Fund does not offset derivative assets and derivative liabilities that are subject to netting arrangements in the Consolidated Statement of Assets and Liabilities. Bankruptcy or insolvency laws of a particular jurisdiction may impose restrictions on or prohibitions against the right of offset in bankruptcy, insolvency or other events.
The Fund’s risk of loss from counterparty credit risk on exchange-traded derivatives cleared through a clearinghouse and for centrally cleared swaps is generally considered lower than as compared to OTC derivatives. However, counterparty credit risk exists with respect to initial and variation margin deposited/paid by the Fund that is held in futures commission merchant, broker and/or clearinghouse accounts for such exchange-traded derivatives and for centrally cleared swaps.
With respect to centrally cleared swaps, such transactions will be submitted for clearing, and if cleared, will be held in accounts at futures commission merchants or brokers that are members of clearinghouses. While brokers, futures commission merchants and clearinghouses are required to segregate customer margin from their own assets, in the event that a broker, futures commission merchant or clearinghouse becomes insolvent or goes into bankruptcy and at that time there is a shortfall in the aggregate amount of margin held by the broker, futures commission merchant or clearinghouse for all its customers, U.S. bankruptcy laws will typically allocate that shortfall on apro-rata basis across all the broker’s, futures commission merchant’s or clearinghouse’s customers, potentially resulting in losses to the Fund.
There is the risk that a broker, futures commission merchant or clearinghouse will decline to clear a transaction on the Fund’s behalf, and the Fund may be required to pay a termination fee to the executing broker with whom the Fund initially enters into the transaction. Clearinghouses may also be permitted to terminate centrally cleared swaps at any time. The Fund is also subject to the risk that the broker or futures commission merchant will improperly use the Fund’s assets deposited/paid as initial or variation margin to satisfy payment obligations of another customer. In the event of a default by another customer of the broker or futures commission merchant, the Fund might not receive its variation margin payments from the clearinghouse, due to the manner in which variation margin payments are aggregated for all customers of the broker/futures commission merchant.
Collateral and margin requirements differ by type of derivative. Margin requirements are established by the broker, futures commission merchant or clearinghouse for exchange-traded and cleared derivatives, including centrally cleared swaps. Brokers, futures commission merchants and clearinghouses can ask for margin in excess of the regulatory minimum, or increase the margin amount, in certain circumstances.
Collateral terms are contract specific for OTC derivatives. For derivatives traded under an ISDA master agreement, the collateral requirements are typically calculated by netting the mark to market amount for each transaction under such agreement and comparing that amount to the value of any collateral currently pledged by the Fund or the counterparty.
For financial reporting purposes, cash collateral that has been pledged to cover obligations of the Fund, if any, is reported separately on the Consolidated Statement of Assets and Liabilities as cash pledged as collateral.Non-cash collateral pledged by the Fund, if any, is noted in the Consolidated Statement of Investments. Generally, the amount of collateral due from or to a party must exceed a minimum transfer amount threshold (e.g., $250,000) before a transfer has to be made. To the extent amounts due to the Fund from its counterparties are not fully collateralized, contractually or otherwise, the Fund bears the risk of loss from counterparty nonperformance.
The following table presents by counterparty the Fund’s OTC derivative assets net of the related collateral pledged by the Fund at period end:
| | | | | | | | | | | | | | | | | | | | |
| | | | | | Gross Amounts Not Offset in the Consolidated
Statement of Assets & Liabilities | | | | |
| Counterparty | | Gross Amounts
Not Offset in the
Consolidated
Statement
of Assets &
Liabilities* | | | Financial
Instruments
Available for
Offset | | | Financial
Instruments
Collateral
Received** | | | Cash Collateral
Received** | | | Net Amount | |
| Bank of America NA | | $ | 6,501 | | | $ | (6,501) | | | $ | – | | | $ | – | | | $ | – | |
| Barclays Bank plc | | | 59,890 | | | | (59,890) | | | | – | | | | – | | | | – | |
| Citibank NA | | | 93,320 | | | | (93,320) | | | | – | | | | – | | | | – | |
| Deutsche Bank AG | | | 224,361 | | | | – | | | | – | | | | – | | | | 224,361 | |
35 OPPENHEIMER GLOBAL MULTI-ALTERNATIVES FUND/VA
NOTES TO CONSOLIDATED FINANCIAL STATEMENTSContinued
6. Use of Derivatives (Continued)
| | | | | | | | | | | | | | | | | | | | |
| | | | | Gross Amounts Not Offset in the Consolidated
Statement of Assets & Liabilities | | |
| Counterparty | | Gross Amounts
Not Offset in the
Consolidated
Statement
of Assets &
Liabilities* | | Financial
Instruments
Available for
Offset | | Financial
Instruments
Collateral
Received** | | Cash Collateral
Received** | | Net Amount |
| | | | | |
| Goldman Sachs Bank | | | | | | | | | | | | | | | | | | | | |
| USA | | $ | 62,802 | | | $ | (33,683) | | | $ | – | | | $ | – | | | $ | 29,119 | |
| Goldman Sachs | | | | | | | | | | | | | | | | | | | | |
| International | | | 1,001,381 | | | | (1,001,381) | | | | – | | | | – | | | | – | |
| JPMorgan Chase Bank | | | | | | | | | | | | | | | | | | | | |
| NA | | | 188,548 | | | | (188,548) | | | | – | | | | – | | | | – | |
| Morgan Stanley Capital | | | | | | | | | | | | | | | | | | | | |
| Services, Inc. | | | 289,772 | | | | – | | | | – | | | | (289,772) | | | | – | |
| | $ | 1,926,575 | | | $ | (1,383,323) | | | $ | – | | | $ | (289,772) | | | $ | 253,480 | |
| | | | | | | | | | | | | | | | | | | | |
*OTC derivatives are reported gross on the Consolidated Statement of Assets and Liabilities. Exchange traded options and margin related to centrally cleared swaps and futures, if any, are excluded from these reported amounts. **Reported collateral posted for the benefit of the Fund within this table is limited to the net outstanding amount due from an individual counterparty. The collateral posted for the benefit of the Fund may exceed these amounts. | |
The following table presents by counterparty the Fund’s OTC derivative liabilities net of the related collateral pledged by the Fund at period end:
| | | | | | | | | | | | | | | | | | | | |
| | | | | Gross Amounts Not Offset in the Consolidated Statement of Assets & Liabilities | | |
| Counterparty | | Gross Amounts Not Offset in the
Consolidated
Statement of Assets &
Liabilities* | | Financial Instruments
Available for
Offset | | Financial Instruments
Collateral
Pledged** | | Cash Collateral Pledged** | | Net Amount |
Bank of America NA | | $ | (12,458) | | | $ | 6,501 | | | $ | – | | | $ | – | | | $ | (5,957) | |
Barclays Bank plc | | | (1,623,305) | | | | 59,890 | | | | 1,563,415 | | | | – | | | | – | |
BNP Paribas | | | (27,925) | | | | – | | | | – | | | | 11,000 | | | | (16,925) | |
Citibank NA | | | (514,380) | | | | 93,320 | | | | 331,379 | | | | – | | | | (89,681) | |
Goldman Sachs Bank | | | | | | | | | | | | | | | | | | | | |
USA | | | (33,683) | | | | 33,683 | | | | – | | | | – | | | | – | |
Goldman Sachs | | | | | | | | | | | | | | | | | | | | |
International | | | (1,966,569) | | | | 1,001,381 | | | | 622,833 | | | | – | | | | (342,355) | |
JPMorgan Chase Bank | | | | | | | | | | | | | | | | | | | | |
NA | | | (918,497) | | | | 188,548 | | | | 702,684 | | | | – | | | | (27,265) | |
Morgan Stanley | | | (19,373) | | | | – | | | | – | | | | – | | | | (19,373) | |
| | | | |
| | $ | (5,116,190) | | | $ | 1,383,323 | | | $ | 3,220,311 | | | $ | 11,000 | | | $ | (501,556) | |
| | | | |
*OTC derivatives are reported gross on the Consolidated Statement of Assets and Liabilities. Exchange traded options and margin related to centrally cleared swaps and futures, if any, are excluded from these reported amounts. **Reported collateral pledged within this table is limited to the net outstanding amount due from the Fund. The securities pledged as collateral by the Fund as reported on the Consolidated Statement of Investments may exceed these amounts. | |
The following table presents the valuations of derivative instruments by risk exposure as reported within the Consolidated Statement of Assets and Liabilities at period end:
| | | | | | | | | | | | |
| | | Asset Derivatives | | | Liability Derivatives | |
Derivatives Not Accounted for as Hedging Instruments | | Consolidated
Statement of Assets
and Liabilities Location | | Value | | | Consolidated
Statement of Assets
and Liabilities Location | | Value | |
Credit contracts | | Swaps, at value | | $ | 72,755 | | | Swaps,
at value | | $ | 2,011,300 | |
Equity contracts | | Swaps, at value | | | 879,444 | | | Swaps,
at value | | | 2,567 | |
Credit contracts | | Centrally cleared swaps,
at value | | | 263,287 | | | Centrally
cleared
swaps,at value | | | 167,870 | |
Commodity contracts | | | | | | | | Variation
margin
payable | | | 38,350 | * |
Equity contracts | | Variation margin receivable | | | 147,925 | * | | Variation
margin
payable | | | 209,649 | * |
Interest rate contracts | | | | | | | | Variation
margin
payable | | | 67,063 | * |
36 OPPENHEIMER GLOBAL MULTI-ALTERNATIVES FUND/VA
6. Use of Derivatives (Continued)
| | | | | | | | | | | | |
| | | Asset Derivatives | | | Liability Derivatives | |
Derivatives Not Accounted
for as Hedging
Instruments | | Consolidated Statement of Assets and Liabilities Location | | Value | | | Consolidated Statement of Assets
and Liabilities Location | | Value | |
| Forward currency exchange contracts | | Unrealized appreciation on foreign currency exchange contracts | | | $ 601,774 | | | Unrealized depreciation on foreign currency exchange contracts | | | $ 3,020,703 | |
Currency contracts | | | | | | | | Options written, at value | | | 81,620 | |
Equity contracts | | Investments, at value | | | 2,490** | | | | | | | |
Currency contracts | | Investments, at value | | | 33,648** | | | | | | | |
Interest rate contracts | | Investments, at value | | | 338,954** | | | | | | | |
| | | | | | | | | | | | |
Total | | | | $ | 2,340,277 | | | | | $ | 5,599,122 | |
| | | | | | | | | | | | |
*Includes only the current day’s variation margin. Prior variation margin movements have been reflected in cash on the Consolidated Statement of Assets and Liabilities upon receipt or payment.
**Amounts relate to purchased option contracts and purchased swaption contracts, if any.
The effect of derivative instruments on the Consolidated Statement of Operations is as follows:
| | | | | | | | | | | | | | | | | | | | | | | | |
| Amount of Realized Gain or (Loss) Recognized on Derivatives | |
Derivatives Not Accounted for as Hedging Instruments | | Investment
transactions
in unaffiliated
companies* | | | Option
contracts
written | | | Futures contracts | | | Forward
currency
exchange
contracts | | | Swap contracts | | | Total | |
Commodity contracts | | $ | — | | | $ | — | | | $ | 643,306 | | | $ | — | | | $ | — | | | $ | 643,306 | |
Credit contracts | | | — | | | | — | | | | — | | | | — | | | | (953,486) | | | | (953,486) | |
Currency contracts | | | (98,177) | | | | 5,625,409 | | | | — | | | | — | | | | — | | | | 5,527,232 | |
Equity contracts | | | 687,764 | | | | (697,801) | | | | (4,223,295) | | | | — | | | | (352,760) | | | | (4,586,092) | |
Forward currency
exchange contracts | | | — | | | | — | | | | — | | | | (1,416,713) | | | | — | | | | (1,416,713) | |
Interest rate contracts | | | (124,138) | | | | — | | | | 1,004,782 | | | | — | | | | 178,014 | | | | 1,058,658 | |
Volatility contracts | | | — | | | | — | | | | — | | | | — | | | | (162,247) | | | | (162,247) | |
| | | | |
| Total | | $ | 465,449 | | | $ | 4,927,608 | | | $ | (2,575,207) | | | $ | (1,416,713) | | | $ | (1,290,479) | | | $ | 110,658 | |
| | | | |
|
| Amount of Change in Unrealized Gain or (Loss) Recognized on Derivatives | |
Derivatives Not Accounted for as Hedging Instruments | | Investment
transactions
in unaffiliated
companies* | | | Option
contracts
written | | | Futures contracts | | | Forward
currency
exchange
contracts | | | Swap contracts | | | Total | |
Commodity contracts | | $ | — | | | $ | — | | | $ | 96,922 | | | $ | — | | | $ | — | | | $ | 96,922 | |
Credit contracts | | | — | | | | — | | | | — | | | | — | | | | (1,526,796 | ) | | | (1,526,796) | |
Currency contracts | | | 25,607 | | | | 6,083 | | | | — | | | | — | | | | — | | | | 31,690 | |
Equity contracts | | | (78,204 | ) | | | — | | | | (525,359 | ) | | | — | | | | 1,268,772 | | | | 665,209 | |
Forward currency
exchange contracts | | | — | | | | — | | | | — | | | | (1,397,897 | ) | | | — | | | | (1,397,897) | |
Interest rate contracts | | | 140,666 | | | | — | | | | (450,420 | ) | | | — | | | | 135,284 | | | | (174,470) | |
Volatility contracts | | | — | | | | — | | | | (44,763 | ) | | | — | | | | 80,368 | | | | 35,605 | |
| | | | |
Total | | $ | 88,069 | | | $ | 6,083 | | | $ | (923,620 | ) | | $ | (1,397,897 | ) | | $ | (42,372 | ) | | $ | (2,269,737) | |
| | | | |
*Includes purchased option contracts and purchased swaption contracts, if any.
7. Shares of Beneficial Interest
The Fund has authorized an unlimited number of $0.001 par value shares of beneficial interest of each class. Transactions in shares of beneficial interest were as follows:
| | | | | | | | | | | | | | | | |
| | | Year Ended December 31, 2018 | | | Year Ended December 31, 2017 | |
| | | Shares | | | Amount | | | Shares | | | Amount | |
Non-Service Shares | | | | | | | | | | | | | | | | |
Sold | | | 294,457 | | | $ | 2,964,146 | | | | 1,734,875 | | | $ | 17,157,352 | |
Dividends and/or distributions reinvested | | | 148,527 | | | | 1,458,889 | | | | 397,645 | | | | 3,921,732 | |
Redeemed | | | (4,989,113 | ) | | | (48,462,530 | ) | | | (380,193 | ) | | | (3,771,458) | |
| | | | |
Net increase (decrease) | | | (4,546,129 | ) | | $ | (44,039,495 | ) | | | 1,752,327 | | | $ | 17,307,626 | |
| | | | |
37 OPPENHEIMER GLOBAL MULTI-ALTERNATIVES FUND/VA
NOTES TO CONSOLIDATED FINANCIAL STATEMENTSContinued
7. Shares of Beneficial Interest (Continued)
| | | | | | | | | | | | | | | | |
| | | Year Ended December 31, 2018 | | | Year Ended December 31, 2017 | |
| | | Shares | | | Amount | | | Shares | | | Amount | |
| Service Shares | | | | | | | | | | | | | | | | |
| Sold | | | 151,472 | | | $ | 1,489,983 | | | | 151,036 | | | $ | 1,490,635 | |
| Dividends and/or distributions reinvested | | | 688 | | | | 6,755 | | | | 2,437 | | | | 24,086 | |
| Redeemed | | | (86,324 | ) | | | (848,580 | ) | | | (58,070 | ) | | | (574,600 | ) |
| Net increase | | | 65,836 | | | $ | 648,158 | | | | 95,403 | | | $ | 940,121 | |
| | | | | | | | | | | | | | | | |
8. Purchases and Sales of Securities
The aggregate cost of purchases and proceeds from sales of securities, other than short-term obligations and investments in IGMMF, for the reporting period were as follows:
| | | | | | | | |
| | | Purchases | | | Sales | |
| Investment securities | | | $330,749,057 | | | | $328,740,200 | |
9. Fees and Other Transactions with Affiliates
Management Fees.Under the investment advisory agreement, the Fund pays the Manager a management fee based on the daily net assets of the Fund at an annual rate as shown in the following table:
| | | | | | |
| | | Fee Schedule | | | | |
| | Up to $500 million | | 1.00% | | |
| | Next $500 million | | 0.95 | | |
| | Next $4 billion | | 0.90 | | |
| | Over $5 billion | | 0.88 | | |
The Manager also provides investment management related services to the Subsidiary. The Subsidiary pays the Manager a monthly management fee at an annual rate according to the above schedule. The Subsidiary also pays certain other expenses including custody and directors’ fees.
The Fund’s effective management fee for the reporting period was 1.00% of average annual net assets before any Subsidiary management fees or any applicable waivers.
Sub-Adviser Fees.The Manager has retained theSub-Adviser to provide theday-to-day portfolio management of the Fund and the Subsidiary. Under theSub-Advisory Agreement, the Manager pays theSub-Adviser an annual fee in monthly installments, equal to a percentage of the investment management fee collected by the Manager from the Fund and the Subsidiary, which shall be calculated after any investment management fee waivers. The fee paid to theSub-Adviser is paid by the Manager, not by the Fund.
Sub-Sub-Adviser Fees.TheSub-Adviser retains theSub-Sub-Advisers to provide theday-to-day portfolio management of the Fund. Under theSub-Sub-Advisory Agreement, theSub-Adviser pays theSub-Sub-Advisers an annual fee in monthly installments, based on the average daily net assets of the Fund. The fee paid to theSub-Sub-Advisers under theSub-Sub-Advisory agreement is paid by theSub-Adviser, not by the Fund.
Transfer Agent Fees.OFI Global (the “Transfer Agent”) serves as the transfer and shareholder servicing agent for the Fund. The Fund pays the Transfer Agent a fee based on annual net assets. Fees incurred and average net assets for each class with respect to these services are detailed in the Consolidated Statement of Operations and Consolidated Financial Highlights, respectively.
Sub-Transfer Agent Fees.The Transfer Agent has retained Shareholder Services, Inc., a wholly-owned subsidiary of OFI (the“Sub-Transfer Agent”), to provide theday-to-day transfer agent and shareholder servicing of the Fund. Under theSub-Transfer Agency Agreement, the Transfer Agent pays theSub-Transfer Agent an annual fee in monthly installments, equal to a percentage of the transfer agent fee collected by the Transfer Agent from the Fund, which shall be calculated after any applicable fee waivers. The fee paid to theSub-Transfer Agent is paid by the Transfer Agent, not by the Fund.
Trustees’ Compensation. The Fund’s Board of Trustees (“Board”) has adopted a compensation deferral plan for Independent Trustees that enables Trustees to elect to defer receipt of all or a portion of the annual compensation they are entitled to receive from the Fund. For purposes of determining the amount owed to the Trustees under the plan, deferred amounts are treated as though equal dollar amounts had been invested in shares of the Fund or in other Oppenheimer funds selected by the Trustees. The Fund purchases shares of the funds selected for deferral by the Trustees in amounts equal to his or her deemed investment, resulting in a Fund asset equal to the deferred compensation liability. Such assets are included as a component of “Other” within the asset section of the Consolidated Statement of Assets and Liabilities. Deferral of Trustees’ fees under the plan will not affect the net assets of the Fund and will not materially affect the Fund’s assets, liabilities or net investment income per share. Amounts will be deferred until distributed in accordance with the compensation deferral plan.
Distribution and Service Plan for Service Shares.The Fund has adopted a Distribution and Service Plan (the “Plan”) pursuant to Rule12b-1 under the 1940 Act for Service shares to pay OppenheimerFunds Distributor, Inc. (the “Distributor”), for distribution related services, personal service and account maintenance for the Fund’s Service shares. Under the Plan, payments are made periodically at an annual rate of 0.25% of the daily net assets of
38 OPPENHEIMER GLOBAL MULTI-ALTERNATIVES FUND/VA
9. Fees and Other Transactions with Affiliates (Continued)
Service shares of the Fund. The Distributor currently uses all of those fees to compensate sponsors of the insurance product that offers Fund shares, for providing personal service and maintenance of accounts of their variable contract owners that hold Service shares. These fees are paid out of the Fund’s assets on anon-going basis and increase operating expenses of the Service shares, which results in lower performance compared to the Fund’s shares that are not subject to a service fee. Fees incurred by the Fund under the Plan are detailed in the Consolidated Statement of Operations.
Waivers and Reimbursements of Expenses.The Manager has contractually agreed to waive fees and/or reimburse expenses to limit the Fund’s “Expenses after payments, waivers and/or reimbursements and reduction to custodian expenses” (excluding any applicable dividends tied to short sales expense, taxes, interest and fees from borrowing, any subsidiary expenses, Acquired Fund Fees and Expenses, brokerage commissions, unusual and infrequent expenses and certain other Fund expenses) so that, as percentages of average daily net assets, those expenses will not exceed the annual rate of 1.20% forNon-Service shares and 1.45% for Service shares as calculated on the daily net assets of the Fund.
During the reporting period, the Manager waived fees and/or reimbursed the Fund as follows:
| | | | |
| Non-Service Shares | | $ | 43,955 | |
| Service Shares | | | 1,145 | |
This fee waiver and/or expense reimbursement may not be amended or withdrawn for one year from the date of the Fund’s prospectus, unless approved by the Board.
The Manager has contractually agreed to waive the management fee it receives from the Fund in an amount equal to the management fee it receives from the Subsidiary. During the reporting period, the Manager waived $117,689. This fee waiver and/or expense reimbursement may not be amended or withdrawn for one year from the date of the Fund’s prospectus, unless approved by the Board.
The Manager will waive fees and/or reimburse Fund expenses in an amount equal to the indirect management fees incurred through the Fund’s investment in IGMMF. During the reporting period, the Manager waived fees and/or reimbursed the Fund $58,705 for IGMMF management fees.
10. Borrowings and Other Financing
Securities Sold Short.The Fund sells securities that it does not own, and it will therefore be obligated to purchase such securities at a future date. Upon entering into a short position, the Fund is required to segregate cash or securities at its custodian which are pledged for the benefit of the lending broker and/or to deposit and pledge cash directly at the lending broker, with a value equal to a certain percentage, exceeding 100%, of the value of the securities that it sold short. Cash that has been segregated and pledged for this purpose will be disclosed on the Consolidated Statement of Assets and Liabilities; securities that have been segregated and pledged for this purpose are disclosed as such in the Consolidated Statement of Investments. The aggregate market value of such cash and securities at period end is $45,824,014. The value of the open short position is recorded as a liability, and the Fund records an unrealized gain or loss to the extent of the difference between the proceeds received and the change in value of the open short position. The Fund records a realized gain or loss when the short position is closed out. By entering into short sales, the Fund bears the risk of an unlimited loss, since the price of the security sold short could theoretically increase without limit. Purchasing securities previously sold short to close out a short position can itself cause the price of the securities to rise further, thereby increasing the loss. Further, there is no assurance that a security the Fund needs to buy to cover a short position will be available for purchase at a reasonable price. Until the security is replaced, the Fund is required to pay the lender any dividend or interest earned. Dividend expense on short sales is treated as an expense in the Consolidated Statement of Operations.
Joint Credit Facility.A number of mutual funds managed by the Manager participate in a $1.95 billion revolving credit facility (the “Facility”) intended to provide short-term financing, if necessary, subject to certain restrictions in connection with atypical redemption activity. Expenses and fees related to the Facility are paid by the participating funds and are disclosed separately or as other expenses on the Consolidated Statement of Operations. The Fund did not utilize the Facility during the reporting period.
11. Pending Acquisition
On October 18, 2018, Massachusetts Mutual Life Insurance Company, an indirect corporate parent of theSub-Adviser and the Manager, announced that it has entered into an agreement whereby Invesco Ltd. (“Invesco”), a global investment management company, will acquire theSub-Adviser (the “Transaction”). In connection with the Transaction, on January 11, 2019, the Fund’s Board unanimously approved an Agreement and Plan of Reorganization (the “Agreement”), which provides for the transfer of the assets and liabilities of the Fund to a corresponding, newly formed fund (the “Acquiring Fund”) in the Invesco family of funds (the “Reorganization”) in exchange for shares of the corresponding Acquiring Fund of equal value to the value of the shares of the Fund as of the close of business on the closing date. Although the Acquiring Fund will be managed by Invesco Advisers, Inc., the Acquiring Fund will, as of the closing date, have the same investment objective and substantially similar principal investment strategies and risks as the Fund. After the Reorganization, Invesco Advisers, Inc. will be the investment adviser to the Acquiring Fund, and the Fund will be liquidated and dissolved under applicable law and terminate its registration under the Investment Company Act of 1940, as amended. The Reorganization is expected to be atax-free reorganization for U.S. federal income tax purposes.
The Reorganization is subject to the approval of shareholders of the Fund. Shareholders of record of the Fund on January 14, 2019 will be entitled to vote on the Reorganization and will receive a combined prospectus and proxy statement describing the Reorganization, the shareholder meeting, and a discussion of the factors the Fund’s Board considered in approving the Agreement. The combined prospectus and proxy statement is expected to be
39 OPPENHEIMER GLOBAL MULTI-ALTERNATIVES FUND/VA
NOTES TO CONSOLIDATED FINANCIAL STATEMENTSContinued
11. Pending Acquisition (Continued)
distributed to shareholders of record on or about February 28, 2019. The anticipated date of the shareholder meeting is on or about April 12, 2019.
If shareholders approve the Agreement and certain other closing conditions are satisfied or waived, the Reorganization is expected to close during the second quarter of 2019, or as soon as practicable thereafter. This is subject to change.
12. Subsequent Event
On February 12, 2019, the Board of Trustees of the Fund, upon the recommendation of the Fund’s investment adviser, OFI Global Asset Management, Inc., approved a plan to liquidate the Fund (the “Liquidation”), such Liquidation to take place on or about April 29, 2019 (the “Liquidation Date”).
40 OPPENHEIMER GLOBAL MULTI-ALTERNATIVES FUND/VA
REPORT OF INDEPENDENT REGISTERED PUBLIC ACCOUNTING FIRM
To the Shareholders and Board of Trustees
Oppenheimer Variable Account Funds:
Opinion on the Consolidated Financial Statements
We have audited the accompanying consolidated statement of assets and liabilities of Oppenheimer Global Multi-Alternatives Fund/VA, a separate series of Oppenheimer Variable Account Funds, and subsidiary (the “Fund”), including the consolidated statement of investments, as of December 31, 2018, the related consolidated statement of operations for the year then ended, the consolidated statements of changes in net assets for each of the years in the two year period then ended, and the related consolidated notes (collectively, the “consolidated financial statements”) and the consolidated financial highlights for each of the years in the five year period then ended. In our opinion, the consolidated financial statements and consolidated financial highlights present fairly, in all material respects, the consolidated financial position of the Fund as of December 31, 2018, the results of their consolidated operations for the year then ended, the changes in their consolidated net assets for each of the years in the two year period then ended, and the consolidated financial highlights for each of the years in the five year period then ended, in conformity with U.S. generally accepted accounting principles.
Emphasis of Matter
As discussed in Note 12 to the consolidated financial statements, on February 12, 2019, the Board of Trustees of Oppenheimer Variable Account Funds approved a plan to liquidate the Fund. The liquidation is expected to conclude on or about April 29, 2019. Our opinion is not modified with respect to this matter.
Basis for Opinion
These consolidated financial statements and consolidated financial highlights are the responsibility of the Fund’s management. Our responsibility is to express an opinion on these consolidated financial statements and consolidated financial highlights based on our audits. We are a public accounting firm registered with the Public Company Accounting Oversight Board (United States) (“PCAOB”) and are required to be independent with respect to the Fundin accordance with the U.S. federal securities laws and the applicable rules and regulations of the Securities and Exchange Commission and the PCAOB.
We conducted our audits in accordance with the standards of the PCAOB. Those standards require that we plan and perform the audit to obtain reasonable assurance about whether the consolidated financial statements and consolidated financial highlights are free of material misstatement, whether due to error or fraud. Our audits included performing procedures to assess the risks of material misstatement of the consolidated financial statements and consolidated financial highlights, whether due to error or fraud, and performing procedures that respond to those risks. Such procedures included examining, on a test basis, evidence regarding the amounts and disclosures in the consolidated financial statements and consolidated financial highlights. Such procedures also included confirmation of securities owned as of December 31, 2018, by correspondence with the custodian, brokers and the transfer agent, or by other appropriate auditing procedures. Our audits also included evaluating the accounting principles used and significant estimates made by management, as well as evaluating the overall presentation of the consolidated financial statements and consolidated financial highlights. We believe that our audits provide a reasonable basis for our opinion.
KPMGLLP
We have not been able to determine the specific year that we began serving as the auditor of one or more Oppenheimer Funds investment companies, however we are aware that we have served as the auditor of one or more Oppenheimer Funds investment companies since at least 1969.
Denver, Colorado
February 19, 2019
41 OPPENHEIMER GLOBAL MULTI-ALTERNATIVES FUND/VA
FEDERAL INCOME TAX INFORMATIONUnaudited
In early 2019, if applicable, shareholders of record received information regarding all dividends and distributions paid to them by the Fund during calendar year 2018.
Dividends, if any, paid by the Fund during the reporting period which are not designated as capital gain distributions should be multiplied by the maximum amount allowable but not less than 100% to arrive at the amount eligible for the corporate dividend-received deduction.
Dividends, if any, paid by the Fund during the reporting period which are not designated as capital gain distributions, may be eligible for lower individual income tax rates to the extent that the Fund has received qualified dividend income as stipulated by recent tax legislation. In early 2019, shareholders of record received information regarding the percentage of distributions that are eligible for lower individual income tax rates. The amount will be the maximum amount allowed.
The foregoing information is presented to assist shareholders in reporting distributions received from the Fund to the Internal Revenue Service. Because of the complexity of the federal regulations which may affect your individual tax return and the many variations in state and local tax regulations, we recommend that you consult your tax advisor for specific guidance.
42 OPPENHEIMER GLOBAL MULTI-ALTERNATIVES FUND/VA
BOARD APPROVAL OF THE FUND’S INVESTMENT ADVISORY,SUB-ADVISORY ANDSUB-SUB ADVISORY AGREEMENTSUnaudited
The Fund has entered into an investment advisory agreement with OFI Global Asset Management, Inc. (“OFI Global” or the “Adviser”), a wholly-owned subsidiary of OppenheimerFunds, Inc. (“OFI” or the“Sub-Adviser”). OFI Global has entered into asub-advisory agreement with OFI whereby OFI provides investmentsub-advisory services to the Fund, and OFI has entered intosub-sub advisory agreements with Barings, LLC (“Barings”) and OFI SteelPath, Inc. (“OFI SteelPath”), whereby Barings and OFI SteelPath provide investmentsub-sub advisory services to the Fund (collectively, all the investment advisory agreements are referred to as the “Agreements,” and OFI Global and OFI are referred to as the “Managers” and Barings and OFI SteelPath are referred to as the“Sub-Sub Advisers”). Each year, the Board of Trustees (the “Board”), including a majority of the independent Trustees, is required to determine whether to approve the terms of the Agreements and the renewal thereof. The Investment Company Act of 1940, as amended, requires that the Board request and evaluate, and that the Managers andSub-Sub Advisers provide, such information as may be reasonably necessary to evaluate the terms of the Agreements. The Board employs an independent consultant to prepare a report that provides information, including comparative information that the Board requests for that purpose. In addition toin-person meetings focused on this evaluation, the Board receives information throughout the year regarding Fund services, fees, expenses and performance.
The Managers,Sub-Sub Advisers, and the independent consultant provided information to the Board on the following factors: (i) the nature, quality and extent of the Managers’ andSub-Sub Advisers’ services, (ii) the comparative investment performance of the Fund and the Managers andSub-Sub Advisers, (iii) the fees and expenses of the Fund, including comparative fee and expense information, (iv) the profitability of the Managers,Sub-Sub Advisers and their affiliates, including an analysis of the cost of providing services, (v) whether economies of scale are realized as the Fund grows and whether fee levels reflect these economies of scale for Fund investors and (vi) other benefits to the Managers andSub-Sub Advisers from their relationship with the Fund. The Board was aware that there are alternatives to retaining the Managers andSub-Sub Advisers.
Outlined below is a summary of the principal information considered by the Board as well as the Board’s conclusions.
Nature, Quality and Extent of Services. The Board considered information about the nature, quality and extent of the services provided to the Fund and information regarding the Managers’ andSub-Sub Advisers’ key personnel who provide such services. The Managers’ andSub-Sub Advisers’ duties include providing the Fund with the services of the portfolio managers and investment team, who provide research, analysis and other advisory services in regard to the Fund’s investments; and, for OFI SteelPath, securities trading services. OFI, among other duties, provides full portfolio management and investment advice, oversight of theSub-Sub Advisers, securities trading, and clearance and settlement support services to the Funds, which, among other things, involve the management of large pools of cash and require expertise in analyzing and selecting investments and instruments. OFI Global is responsible for oversight of other third-party service providers; monitoring compliance with applicable Fund policies and procedures and adherence to the Fund’s investment restrictions; risk management; and oversight of theSub-Adviser. OFI Global is also responsible for providing certain administrative services to the Fund. Those services include providing and supervising all administrative and clerical personnel who are necessary in order to provide effective corporate administration for the Fund; compiling and maintaining records with respect to the Fund’s operations; preparing and filing reports required by the U.S. Securities and Exchange Commission; preparing periodic reports regarding the operations of the Fund for its shareholders; preparing proxy materials for shareholder meetings; and preparing the registration statements required by federal and state securities laws for the sale of the Fund’s shares. OFI Global also provides the Fund with office space, facilities and equipment.
The Board also considered the quality of the services provided and the quality of the Managers’ andSub-Sub Advisers’ resources that are available to the Fund. The Board took account of the fact that theSub-Adviser has over fifty years of experience as an investment adviser and that its assets under management rank it among the top mutual fund managers in the United States. The Board evaluated the Managers’ advisory, administrative, accounting, legal, compliance and risk management services, among other services, and information the Board has received regarding the experience and professional qualifications of the Managers’ key personnel and the size and functions of their staff. In its evaluation of the quality of the portfolio management services provided, the Board considered the experience of Benjamin Rockmuller and Alessio de Longis, the portfolio managers for the Fund, and theSub-Sub Adviser’s investment team and analysts. The Board members also considered the totality of their experiences with the Managers andSub-Sub Advisers as directors or trustees of the Fund and other funds advised by the Managers andSub-Sub Advisers. The Board considered information regarding the quality of services provided by affiliates of the Managers, which the Board members have become knowledgeable about through their experiences with the Managers and in connection with the review or renewal of the Fund’s service agreements or service providers. The Board concluded, in light of the Managers’ andSub-Sub Advisers’ experience, reputation, personnel, operations and resources that the Fund benefits from the services provided under the Agreements.
Investment Performance of the Managers,Sub-Sub Advisers and the Fund. Throughout the year, the Managers provided information on the investment performance of the Fund, the Adviser, theSub-Adviser and theSub-Sub-Advisers, including comparative performance information. The Board also reviewed information, prepared by the Managers and by the independent consultant, comparing the Fund’s historical performance to relevant market indices and to the performance of other multialternative funds. The Board considered that while the Fund underperformed its category median for theone- and three-year periods, this was largely due to the Fund’s underperformance in 2017. The Board also considered that the Fund was launched on November 14, 2013, and ranked in the 16th percentile of its category in the 2014 calendar year and in the 31st percentile in the 2016 calendar year. The Board took into consideration that, when it reviewed the Fund’s performance and considered renewing the Agreements during the prior year, the Fund had outperformed its category median for theone- and three-year periods.
Fees and Expenses of the Fund. The Board reviewed the fees paid to the Managers and the other expenses borne by the Fund. The Board noted that the Adviser, not the Fund, pays theSub-Adviser’s fee under thesub-advisory agreement, and theSub-Adviser pays theSub-Sub-Advisers’ fees under thesub-sub-advisory agreements. The independent consultant provided comparative data in regard to the fees and expenses of the Fund and other multialternative funds. In reviewing the fees and expenses charged to the Fund, the Board considered the Adviser’s assertion that, because there is much greater disparity in the fees and services that may be provided by a manager to a VA fund as opposed to a retail fund, when comparing the expenses of the Fund to those of retail funds, it is most appropriate to focus on total expenses (rather than on the management fees). The Board considered that the Fund’s total expenses were lower than the category median and equal to the peer group median. The Board noted that the Fund’s contractual management fee was lower than the category median and peer group median. The Board further considered the Fund’s current contractual fee waivers,
43 OPPENHEIMER GLOBAL MULTI-ALTERNATIVES FUND/VA
BOARD APPROVAL OF THE FUND’S INVESTMENT ADVISORY, SUB-ADVISORY AND SUB-SUB ADVISORY
AGREEMENTSUnaudited / Continued
specifically that (a) the Adviser has contractually agreed to waive fees and/or reimburse Fund expenses in an amount equal to the management fees incurred indirectly through the Fund’s investments in funds managed by the Adviser or its affiliates, which may not be amended or withdrawn for one year from the date of this prospectus, unless approved by the Board and (b) the Adviser has contractually agreed to waive the management fee it receives from the Fund in an amount equal to the management fee it receives from the Fund’s subsidiary, which will continue to be in effect for so long as the Fund invests in the subsidiary and may not be terminated unless approved by the Board. Finally, the Board took into account that the Adviser has voluntarily agreed to limit the Fund’s total annual operating expenses so that those expenses, as percentages of daily net assets, will not exceed the annual rate of 1.20% forNon-Service Shares and 1.45% for Service Shares.
Economies of Scale and Profits Realized by the Managers andSub-Sub Advisers. The Board considered information regarding the Managers’ andSub-Sub Advisers’ costs in serving as the Fund’s investment adviser,sub-adviser andsub-sub-advisers, including the costs associated with the personnel and systems necessary to manage the Fund, and information regarding the Managers’ andSub-Sub Advisers’ profitability from their relationship with the Fund. The Board also considered that the Managers andSub-Sub Advisers must be able to pay and retain experienced professional personnel at competitive rates to provide quality services to the Fund. The Board reviewed whether the Managers andSub-Sub Advisers may realize economies of scale in managing and supporting the Fund. The Board noted that the Fund currently has management fee breakpoints, which are intended to share with Fund shareholders economies of scale that may exist as the Fund’s assets grow.
Other Benefits to the Managers andSub-Sub Advisers. In addition to considering the profits realized by the Managers andSub-Sub Advisers, the Board considered information that was provided regarding the direct and indirect benefits the Managers andSub-Sub Advisers receive as a result of their relationship with the Fund, including compensation paid to the Managers’ affiliates and research provided to the Adviser in connection with permissible brokerage arrangements (soft dollar arrangements).
Conclusions. These factors were also considered by the independent Trustees meeting separately from the full Board, assisted by experienced counsel to the Fund and to the independent Trustees. Fund counsel and the independent Trustees’ counsel are independent of the Managers andSub-Sub Advisers within the meaning and intent of the Securities and Exchange Commission Rules.
Based on its review of the information it received and its evaluations described above, the Board, including a majority of the independent Trustees, decided to continue the Agreements through August 31, 2019. In arriving at its decision, the Board did not identify any factor or factors as being more important than others, but considered all of the above information, and considered the terms and conditions of the Agreements, including the management fees, in light of all the surrounding circumstances.
44 OPPENHEIMER GLOBAL MULTI-ALTERNATIVES FUND/VA
PORTFOLIO PROXY VOTING POLICIES AND GUIDELINES; UPDATES TO STATEMENT OF INVESTMENTSUnaudited
The Fund has adopted Portfolio Proxy Voting Policies and Guidelines under which the Fund votes proxies relating to securities (“portfolio proxies”) held by the Fund. A description of the Fund’s Portfolio Proxy Voting Policies and Guidelines is available (i) without charge, upon request, by calling the Fund toll-free at 1.800.CALL OPP (225.5677), (ii) on the Fund’s website at www.oppenheimerfunds.com, and (iii) on the SEC’s website at www.sec.gov. In addition, the Fund is required to file FormN-PX, with its complete proxy voting record for the 12 months ended June 30th, no later than August 31st of each year. The Fund’s voting record is available (i) without charge, upon request, by calling the Fund toll-free at 1.800.CALL OPP (225.5677), and (ii) in the FormN-PX filing on the SEC’s website at www.sec.gov.
The Fund files its complete schedule of portfolio holdings with the SEC for the first quarter and the third quarter of each fiscal year on FormN-Q. The Fund’s FormN-Q filings are available on the SEC’s website at www.sec.gov.
45 OPPENHEIMER GLOBAL MULTI-ALTERNATIVES FUND/VA
TRUSTEES AND OFFICERSUnaudited
| | |
| Name, Position(s) Held with the Fund, Length of Service, Year of Birth | | Principal Occupation(s) During the Past 5 Years; Other Trusteeships/Directorships Held; Number of Portfolios in the Fund Complex Currently Overseen |
| |
| INDEPENDENT TRUSTEES | | The address of each Trustee in the chart below is 6803 S. Tucson Way, Centennial, Colorado 80112-3924. Each Trustee serves for an indefinite term, or until his or her resignation, retirement, death or removal. Each of the Trustees in the chart below oversees 58 portfolios in the OppenheimerFunds complex. |
| |
Robert J. Malone, Chairman of the Board of Trustees (since 2016), Trustee (since 2002) Year of Birth: 1944 | | Chairman - Colorado Market of MidFirst Bank (since January 2015); Chairman of the Board (2012-2016) and Director (August 2005-January 2016) of Jones International University (educational organization); Trustee of the Gallagher Family Foundation(non-profit organization) (2000-2016); Chairman, Chief Executive Officer and Director of Steele Street Bank Trust (commercial banking) (August 2003-January 2015); Director of Opera Colorado Foundation(non-profit organization) (2008-2012); Director of Colorado UpLIFT (charitable organization) (1986-2010); Director of Jones Knowledge, Inc. (2006-2010); Former Chairman of U.S. Bank-Colorado (subsidiary of U.S. Bancorp and formerly Colorado National Bank) (July 1996-April 1999); Director of Commercial Assets, Inc. (real estate investment trust) (1993-2000); Director of U.S. Exploration, Inc. (oil and gas exploration) (1997-February 2004); Chairman of the Board (1991-1994) and Trustee (1985-1994) of Regis University; and Chairman of the Board (1990-1991) and Member (1984-1999) of Young Presidents Organization. Mr. Malone has served on the Boards of certain Oppenheimer funds since 2002, during which time he has become familiar with the Fund’s (and other Oppenheimer funds’) financial, accounting, regulatory and investment matters and has contributed to the Board’s deliberations. |
| |
Andrew J. Donohue, Trustee (since 2017) Year of Birth: 1950 | | Director, Mutual Fund Directors Forum (since February 2018); Of Counsel, Shearman & Sterling LLP (since September 2017); Chief of Staff of the U.S. Securities and Exchange Commission (regulator) (June 2015-February 2017); Managing Director and Investment Company General Counsel of Goldman Sachs (investment bank) (November2012-May 2015); Partner at Morgan Lewis & Bockius, LLP (law firm) (March 2011-October 2012); Director of the Division of Investment Management of U.S. Securities and Exchange Commission (regulator) (May 2006-November 2010); Global General Counsel of Merrill Lynch Investment Managers (investment firm) (May2003-May 2006); General Counsel (October 1991-November 2001) and Executive Vice President (January 1993-November 2001) of OppenheimerFunds, Inc. (investment firm) (June 1991-November 2001). Mr. Donohue has served on the Boards of certain Oppenheimer funds since 2017, during which time he has become familiar with the Fund’s (and other Oppenheimer funds’) financial, accounting, regulatory and investment matters and has contributed to the Board’s deliberations. |
| |
Richard F. Grabish, Trustee (since 2012) Year of Birth: 1948 | | Formerly Senior Vice President and Assistant Director of Sales and Marketing (March 1997-December 2007), Director (March 1987-December 2007) and Manager of Private Client Services (June 1985-June 2005) of A.G. Edwards & Sons, Inc. (broker/dealer and investment firm); Chairman and Chief Executive Officer of A.G. Edwards Trust Company, FSB (March 2001-December 2007); President and Vice Chairman of A.G. Edwards Trust Company, FSB (investment adviser) (April 1987-March 2001); President of A.G. Edwards Trust Company, FSB (investment adviser) (June 2005-December 2007). Mr. Grabish has served on the Boards of certain Oppenheimer funds since 2001, during which time he has become familiar with the Fund’s (and other Oppenheimer funds’) financial, accounting, regulatory and investment matters and has contributed to the Board’s deliberations. |
| |
Beverly L. Hamilton, Trustee (since 2002) Year of Birth: 1946 | | Trustee of Monterey Institute for International Studies (educational organization) (2000-2014); Board Member of Middlebury College (educational organization) (December 2005-June 2011); Director of the Board (1991-2016), Vice Chairman of the Board (2006-2009) and Chairman of the Board (2010-2013) of American Funds’ Emerging Markets Growth Fund, Inc. (mutual fund); Director of The California Endowment (philanthropic organization) (April 2002-April 2008); Director (February 2002-2005) and Chairman of Trustees (2006-2007) of the Community Hospital of Monterey Peninsula; President of ARCO Investment Management Company (February 1991-April 2000); Member of the investment committees of The Rockefeller Foundation (2001-2006) and The University of Michigan (since 2000); Advisor at Credit Suisse First Boston’s Sprout venture capital unit (venture capital fund) (1994-January 2005); Trustee of MassMutual Institutional Funds (investment company) (1996-June 2004); Trustee of MML Series Investment Fund (investment company) (April 1989-June 2004); Member of the investment committee of Hartford Hospital (2000-2003); and Advisor to Unilever (Holland) pension fund (2000-2003). Ms. Hamilton has served on the Boards of certain Oppenheimer funds since 2002, during which time she has become familiar with the Fund’s (and other Oppenheimer funds’) financial, accounting, regulatory and investment matters and has contributed to the Board’s deliberations. |
| |
Victoria J. Herget, Trustee (since 2012) Year of Birth:1951 | | Board Chair (2008-2015) and Director (2004-Present) of United Educators (insurance company); Trustee (since 2000) and Chair (2010-2017) of Newberry Library (independent research library); Trustee, Mather LifeWays (senior living organization) (since 2001); Independent Director of the First American Funds (mutual fund family) (2003-2011); former Managing Director (1993-2001), Principal (1985-1993), Vice President (1978-1985) and Assistant Vice President (1973-1978) of Zurich Scudder Investments (investment adviser) (and its predecessor firms); Trustee (1992-2007), Chair of the Board of Trustees (1999-2007), Investment Committee Chair (1994-1999) and Investment Committee member (2007-2010) of Wellesley College; Trustee, BoardSource(non-profit organization) (2006-2009) and Chicago City Day School(K-8 School) (1994-2005). Ms. Herget has served on the Boards of certain Oppenheimer funds since 2012, during which time she has become familiar with the Fund’s (and other Oppenheimer funds’) financial, accounting, regulatory and investment matters and has contributed to the Board’s deliberations. |
| |
Karen L. Stuckey, Trustee (since 2012) Year of Birth: 1953 | | Member (since May 2015) of Desert Mountain Community Foundation Advisory Board(non-profit organization); Partner (1990-2012) of PricewaterhouseCoopers LLP (professional services firm) (held various positions 1975-1990); Trustee (1992- 2006); member of Executive, Nominating and Audit Committees and Chair of Finance Committee (1992-2006), and Emeritus Trustee (since 2006) of Lehigh University; member, Women’s Investment Management Forum (professional organization) (since inception) and Trustee of Jennies School for Little Children(non-profit) (2011-2014). Ms. Stuckey has served on the Boards of certain Oppenheimer funds since 2012, during which time she has become familiar with the Fund’s (and other Oppenheimer funds’) financial, accounting, regulatory and investment matters and has contributed to the Board’s deliberations. |
46 OPPENHEIMER GLOBAL MULTI-ALTERNATIVES FUND/VA
| | |
| |
James D. Vaughn, Trustee (since 2012) Year of Birth:1945 | | Retired; former managing partner (1994-2001) of Denver office of Deloitte & Touche LLP, (held various positions in Denver and New York offices from 1969-1993); Trustee and Chairman of the Audit Committee of Schroder Funds (2003-2012); Board member and Chairman of Audit Committee of AMG National Trust Bank (since 2005); Trustee and Investment Committee member, University of South Dakota Foundation (since 1996); Board member, Audit Committee Member and past Board Chair, Junior Achievement (since 1993); former Board member, Mile High United Way, Boys and Girls Clubs, Boy Scouts, Colorado Business Committee for the Arts, Economic Club of Colorado and Metro Denver Network. Mr. Vaughn has served on the Boards of certain Oppenheimer funds since 2012, during which time he has become familiar with the Fund’s (and other Oppenheimer funds’) financial, accounting, regulatory and investment matters and has contributed to the Board’s deliberations. |
| INTERESTED TRUSTEE AND OFFICER | | Mr. Steinmetz is an “Interested Trustee” because he is affiliated with the Manager and theSub-Adviser by virtue of his positions as Chairman and director of theSub-Adviser and officer and director of the Manager. Both as a Trustee and as an officer, Mr. Steinmetz serves for an indefinite term, or until his resignation, retirement, death or removal. Mr. Steinmetz’s address is 225 Liberty Street, New York, New York 10281- 1008. Mr. Steinmetz is an officer of 104 portfolios in the OppenheimerFunds complex. |
| |
Arthur P. Steinmetz, Trustee (since 2015), President and Principal Executive Officer (since 2014) Year of Birth: 1958 | | Chairman of OppenheimerFunds, Inc. (since January 2015); CEO and Chairman of OFI Global Asset Management, Inc. (since July 2014), President of OFI Global Asset Management, Inc. (since May 2013), a Director of OFI Global Asset Management, Inc. (since January 2013), Director of OppenheimerFunds, Inc. (since July 2014), President, Management Director and CEO of Oppenheimer Acquisition Corp. (OppenheimerFunds, Inc.‘s parent holding company) (since July 2014), and President and Director of OFI SteelPath, Inc. (since January 2013). Chief Investment Officer of the OppenheimerFunds advisory entities (January 2013-December 2013); Executive Vice President of OFI Global Asset Management, Inc. (January2013-May 2013); Chief Investment Officer of OppenheimerFunds, Inc. (October 2010-December 2012); Chief Investment Officer, Fixed- Income, of OppenheimerFunds, Inc. (April 2009-October 2010); Executive Vice President of OppenheimerFunds, Inc. (October 2009-December 2012); Director of Fixed Income of OppenheimerFunds, Inc. (January 2009-April 2009); and a Senior Vice President of OppenheimerFunds, Inc. (March 1993-September 2009). |
| OTHER OFFICERS OF THE FUND | | The addresses of the Officers in the chart below are as follows: for Messrs. Rockmuller, de Longis, Mss. Lo Bessette, Foxson and Picciotto, 225 Liberty Street, New York, New York 10281-1008, for Mr. Petersen, 6803 S. Tucson Way, Centennial, Colorado 80112-3924. Each Officer serves for an indefinite term or until his or her resignation, retirement, death or removal. |
| |
Benjamin H. Rockmuller, Vice President (since 2014) Year of Birth: 1979 | | Vice President of theSub-Adviser (since September 2010); Assistant Vice President of theSub-Adviser (January 2010-August 2010); Portfolio Manager of theSub-Adviser (since July 2010); Senior Analyst of theSub-Adviser for the Global Debt Team (January 2010-July 2010); Intermediate Analyst of theSub-Adviser for the Global Debt Team (January 2007-January 2010); Junior Analyst of theSub-Adviser for the Global Debt Team (April 2004-January 2007) and Junior Analyst of theSub-Adviser for the High Yield Team (June 2003-April 2004). |
| |
Alessio de Longis, Vice President (since 2016) Year of Birth: 1978 | | Vice President of theSub-Adviser (since June 2010); Assistant Vice President of theSub-Adviser (May 2009-June 2010); Senior Research Analyst of theSub-Adviser (January 2008-June 2010); Intermediate Research Analyst of theSub-Adviser (January 2006-January 2008) Junior Analyst of theSub-Adviser (February 2004-January 2006). |
| |
Cynthia Lo Bessette, Secretary and Chief Legal Officer (since 2016) Year of Birth: 1969 | | Executive Vice President, General Counsel and Secretary of OFI Global Asset Management, Inc. (since February 2016); Senior Vice President and Deputy General Counsel of OFI Global Asset Management, Inc. (March 2015-February 2016); Chief Legal Officer of OppenheimerFunds, Inc. and OppenheimerFunds Distributor, Inc. (since February 2016); Vice President, General Counsel and Secretary of Oppenheimer Acquisition Corp. (since February 2016); General Counsel of OFI SteelPath, Inc., OFI Advisors, LLC and Index Management Solutions, LLC (since February 2016); Chief Legal Officer of OFI Global Institutional, Inc., HarbourView Asset Management Corporation, OFI Global Trust Company, Oppenheimer Real Asset Management, Inc., OFI Private Investments Inc., Shareholder Services, Inc. and Trinity Investment Management Corporation (since February 2016); Corporate Counsel (February 2012-March 2015) and Deputy Chief Legal Officer (April 2013-March 2015) of Jennison Associates LLC; Assistant General Counsel (April 2008-September 2009) and Deputy General Counsel (October 2009-February 2012) of Lord Abbett & Co. LLC. |
| |
Jennifer Foxson, Vice President and Chief Business Officer (since 2014) Year of Birth: 1969 | | Senior Vice President of OppenheimerFunds Distributor, Inc. (since June 2014); Vice President of OppenheimerFunds Distributor, Inc. (April 2006-June 2014); Vice President of OppenheimerFunds, Inc. (January 1998-March 2006); Assistant Vice President of OppenheimerFunds, Inc. (October 1991-December 1998). |
| |
Mary Ann Picciotto, Chief Compliance Officer and Chief Anti-Money Laundering Officer (since 2014) Year of Birth: 1973 | | Senior Vice President and Chief Compliance Officer of OFI Global Asset Management, Inc. (since March 2014); Chief Compliance Officer of OppenheimerFunds, Inc., OFI SteelPath, Inc., OFI Global Institutional, Inc., Oppenheimer Real Asset Management, Inc., OFI Private Investments Inc., Harborview Asset Management Corporation, Trinity Investment Management Corporation, and Shareholder Services, Inc. (since March 2014); Managing Director of Morgan Stanley Investment Management Inc. and certain of its various affiliated entities; Chief Compliance Officer of various Morgan Stanley Funds (May 2010-January 2014); Chief Compliance Officer of Morgan Stanley Investment Management Inc. (April 2007-January 2014). |
| |
Brian S. Petersen, Treasurer and Principal Financial & Accounting Officer (since 2016) Year of Birth: 1970 | | Senior Vice President of OFI Global Asset Management, Inc. (since January 2017); Vice President of OFI Global Asset Management, Inc. (January 2013-January 2017); Vice President of OppenheimerFunds, Inc. (February 2007-December 2012); Assistant Vice President of OppenheimerFunds, Inc. (August 2002-2007). |
The Fund’s Statement of Additional Information contains additional information about the Fund’s Trustees and Officers and is available without charge, upon request, by calling 1.800.988.8287.
47 OPPENHEIMER GLOBAL MULTI-ALTERNATIVES FUND/VA
OPPENHEIMER GLOBAL MULTI-ALTERNATIVES FUND/VA
| | |
| A Series of Oppenheimer Variable Account Funds |
| |
| Manager | | OFI Global Asset Management, Inc. |
| |
| Sub-Adviser | | OppenheimerFunds, Inc. |
| |
| Distributor | | OppenheimerFunds Distributor, Inc. |
| |
| Transfer and | | OFI Global Asset Management, Inc. |
| Shareholder | | |
| Servicing Agent | | |
| |
| Sub-Transfer Agent | | Shareholder Services, Inc. DBA OppenheimerFunds Services |
| |
| Independent | | KPMG LLP |
| Registered | | |
| Public | | |
| Accounting | | |
| Firm | | |
| |
| Legal Counsel | | Ropes & Gray LLP |
| |
| | Before investing in any of the Oppenheimer funds, investors should carefully consider a fund’s investment objectives, risks, charges and expenses. Fund prospectuses and summary prospectuses contain this and other information about the funds and may be obtained by asking your financial advisor, visiting oppenheimerfunds.com or calling us at 1.800.988.8287. Read prospectuses and summary prospectuses carefully before investing. |
| |
| | © 2019 OppenheimerFunds, Inc. All rights reserved. Oppenheimer funds are distributed by OppenheimerFunds Distributor, Inc. |

| | | | |
| | |  | | |
| | | | |
| | |
| | | December 31, 2018 | | |
| | Oppenheimer | | |
| | International Growth Fund/VA | | Annual Report |
| | A Series of Oppenheimer Variable Account Funds | | |
| | | |
| | ANNUAL REPORT | | |
| | |
| | Listing of Top Holdings | | |
| | |
| | Fund Performance Discussion | | |
| | |
| | Financial Statements | | |
PORTFOLIO MANAGERS: George R. Evans, CFA, and Robert B. Dunphy, CFA
AVERAGE ANNUAL TOTAL RETURNS FOR THE PERIODS ENDED 12/31/18
| | | | | | | | | | | | | | |
| | | Inception
Date | | 1-Year | | | 5-Year | | | 10-Year | |
Non-Service Shares | | 5/13/92 | | | -19.42% | | | | -0.90% | | | | 8.11 | % |
Service Shares | | 3/19/01 | | | -19.55 | | | | -1.08 | | | | 7.87 | |
MSCI AC Worldex-U.S. Index | | | | | -14.20 | | | | 0.68 | | | | 6.57 | |
Performance data quoted represents past performance, which does not guarantee future results. The investment return and principal value of an investment in the Fund will fluctuate so that an investor’s shares, when redeemed, may be worth more or less than their original cost. Current performance may be lower or higher than the performance quoted. For performance data current to the most recent month end, call us at 1.800.988.8287. The Fund’s total returns should not be expected to be the same as the returns of other funds, whether or not both funds have the same portfolio managers and/or similar names. The Fund’s total returns include changes in share price and reinvested distributions but do not include the charges associated with the separate account products that offer this Fund. Such performance would have been lower if such charges were taken into account. Returns for periods of less than one year are cumulative and not annualized. See Fund prospectuses and summary prospectuses for more information on share classes and sales charges.
TOP HOLDINGS AND ALLOCATIONS
TOP TEN COMMON STOCK HOLDINGS
| | |
SAP SE | | 2.3% |
Infineon Technologies AG | | 2.3 |
ICICI Bank Ltd., Sponsored ADR | | 2.2 |
Bunzl plc | | 2.0 |
Nokia OYJ | | 1.9 |
Novo Nordisk AS, Cl. B | | 1.9 |
Temenos AG | | 1.9 |
Hermes International | | 1.7 |
ASML Holding NV | | 1.7 |
Keyence Corp. | | 1.6 |
Portfolio holdings and allocations are subject to change. Percentages are as of December 31, 2018, and are based on net assets.
REGIONAL ALLOCATION
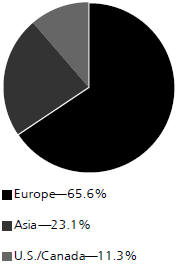
Portfolio holdings and allocations are subject to change. Percentages are as of December 31, 2018, and are based on the total market value of investments.
For more current Fund holdings, please visit oppenheimerfunds.com.
2 OPPENHEIMER INTERNATIONAL GROWTH FUND/VA
Fund Performance Discussion
In a volatile market environment, the Fund’sNon-Service shares returned-19.42% over theone-year reporting period ended December 31, 2018. In relative terms, the Fund underperformed the MSCI AC Worldex-U.S. Index (the “Index”), which returned-14.20%.
During the reporting period, our portfolio continued to underperform due to positions in the automobile industry, mostly due to tariff concerns, and in the semiconductor sector, due to worries over slower growth. We continue to have frequent discussions with the management of the companies we own in both the automobile and semiconductor value chains. We are also meeting with other companies and analysts to cross-check the information we receive. Our conversations, and the earnings reports and announcements these companies are making, give us confidence that our long-term investment theses are intact, and that their current valuations are compelling. We are invested in automobile component companies that we believe are well-placed to benefit from the car’s electronification as it evolves into a computer on wheels. The value of the auto component market is growing rapidly, and at a pace that far outstrips the effect of a potential slowdown in global car sales. We are invested in the semiconductor value chain seeking to benefit from the demand for more chips for more uses as we continue to integrate technology more deeply into our lives.
Outperforming sectors included Financials and Health Care. Stock selection in both sectors contributed positively to performance, along with an underweight position in Financials and an overweight position in Health Care.
MARKET OVERVIEW
During the fourth quarter of 2018, equity markets experienced a significant correction. The year ended with negative returns in all major equity markets. Amidst the negative sentiment, it is worth remembering that investors in equity markets had strong returns in 2017. It was unusual for the upward trend to continue for as long as it did. The catalysts for this correction are concerns over U.S. trade policy, political and macroeconomic uncertainty on several fronts in Europe, and a slowdown in Chinese growth.
TOP INDIVIDUAL CONTRIBUTORS
Top performing stocks for the Fund this period included NEX Group plc, Nokia Oyj, and Edenred SA.
NEX Group plc, a UK company, is a “broker’s broker.” It is the intermediary between professional participants in manyover-the-counter financial markets such as those for foreign exchange, bonds and some derivative instruments. During the year, the Chicago Mercantile Exchange (“CME”) bid for NEX and the share price rose to reflect a significant acquisition premium. We exited our position.
Nokia Oyj has successfully transformed itself from a handset manufacturer to one of the few telecom equipment providers left in the world. In our opinion, it is the leader in the integrated software and equipment solutions that 5G networks require.Build-out of 5G networks has begun in earnest this year and Nokia is positioned to be a beneficiary.
Edenred SA is a French company that operates in several countries around the world offering prepaid vouchers for products and services. Their clients are companies who use these to compensate employees or to reward loyal customers, and governments who use them to deliver aid. The increasing digitization of the world is driving both Edenred’s top line growth and their operating leverage.
TOP INDIVIDUAL DETRACTORS
Top detractors from Portfolio performance included ams AG, Valeo SA, and Continental AG.
ams AG is an Austrian company that we believe is well-positioned to be one of the winners in the 3D sensor market. Demand for 3D sensors is growing faster than the semiconductor market as a whole. They are increasingly required for facial recognition, factory process automation, and augmented reality applications. After rising to record highs earlier in the year, the stock price has suffered from profit taking and concerns over its position in the Apple supply chain. In our opinion, ams has the wherewithal to diversify away from Apple.
Valeo SA is a French auto component supplier that is on the right side of the trend towards more complex auto components. Demand for Valeo’s products, which include driver assist features, electric powertrains, and thermal regulators, is increasing at a multiple of car volumes. In the short term, the tariff talk this reporting period has prompted profit taking in Valeo’s shares, which reached record highs earlier in 2018.
3 OPPENHEIMER INTERNATIONAL GROWTH FUND/VA
Continental AG is the German automobile component supplier better known for its tires. We have owned the company for several years as part of our “Evolution of the Car” theme. Uncertainty over U.S. trade policy in general, and potential automobile tariffs in particular, have negatively affected the share prices of auto suppliers, Continental included. In our opinion, regardless of where they are made, the automobiles of the future will have more and more expensive components than at present, and Continental is well poised to benefit from that trend.
STRATEGY & OUTLOOK
Looking ahead, we see reason for optimism, particularly in international equity markets. The equity risk premium, which has increased on the back of uncertainty, can decline as those uncertainties dissipate. The form of Brexit will become clear. The Italian budget dispute with the European Union (EU) is likely to be resolved. Trade disputes between the U.S. and China may be settled if the U.S. Administration wants to declare a trade war victory before the U.S. presidential campaign season begins. Most importantly, while these political and macroeconomic issues command headlines and effect sentiment, deeper fundamental trends are continuing to restructure the world economy.
The Internet of Things is becoming a reality. Automation of industrial production continues. People are demanding safer and less polluting cars. Newly affluent consumers in emerging markets are buying packaged food, branded drinks, and luxury goods. The companies that we own can monetize these growth streams for a long time to come. The value of a company is the return it provides to its investors on the capital they invest in it. A share price can be driven by sentiment in the short term, but must reflect fundamental earning power in the long term.
Investors should consider the Fund’s investment objective, risks, charges and expenses carefully before investing. The Fund’s prospectus and summary prospectus contain this and other information about the Fund, and may be obtained by asking your financial advisor or calling us at 1.800.988.8287. Read prospectuses and summary prospectuses carefully before investing.
Total returns include changes in share price and reinvestment of dividends and capital gains distributions in a hypothetical investment for the periods shown, but do not include the charges associated with the separate account products that offer this Fund.
The views in the Fund Performance Discussion represent the opinions of this Fund’s portfolio managers and are not intended as investment advice or to predict or depict the performance of any investment. These views are as of the close of business on December 31, 2018, and are subject to change based on subsequent developments. The Fund’s portfolio and strategies are subject to change.
Shares of Oppenheimer funds are not deposits or obligations of any bank, are not guaranteed by any bank, are not insured by the FDIC or any other agency, and involve investment risks, including the possible loss of the principal amount invested.
Comparing the Fund’s Performance to the Market.The graphs that follow show the performance of a hypothetical $10,000 investment in each share class of the Fund held until December 31, 2018. Performance is measured over aten-fiscal-year period for both Classes. Performance information does not reflect charges that apply to separate accounts investing in the Fund. If these charges were taken into account, performance would be lower. The graphs assume that all dividends and capital gains distributions were reinvested in additional shares.
The Fund’s performance is compared to the performance of the MSCI AC Worldex-U.S. Index. The MSCI AC Worldex-U.S. Index is designed to measure the equity market performance of developed and emerging markets and excludes the U.S. The Index isunmanaged and cannot be purchased directly by investors. While index comparisons may be useful to provide a benchmark for the Fund’s performance, it must be noted that the Fund’s investments are not limited to the investments comprising theIndex. Index performance includes reinvestment of income, but does not reflect transaction costs, fees, expenses or taxes. Index performance is shown for illustrative purposes only as a benchmark for the Fund’s performance, and does not predict or depict performance of the Fund. The Fund’s performance reflects the effects of the Fund’s business and operating expenses.
4 OPPENHEIMER INTERNATIONAL GROWTH FUND/VA
COMPARISON OF CHANGE IN VALUE OF $10,000 HYPOTHETICAL INVESTMENTS IN:
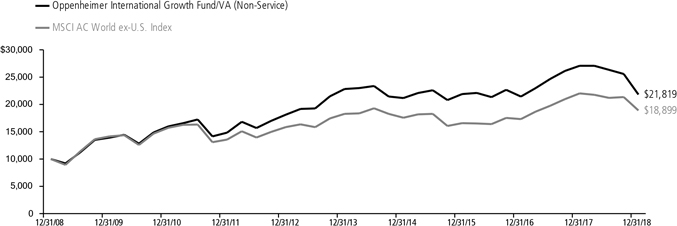
Average Annual Total Returns ofNon-Service Shares of the Fund at 12/31/18
1-Year -19.42% 5-Year -0.90% 10-Year 8.11%
COMPARISON OF CHANGE IN VALUE OF $10,000 HYPOTHETICAL INVESTMENTS IN:
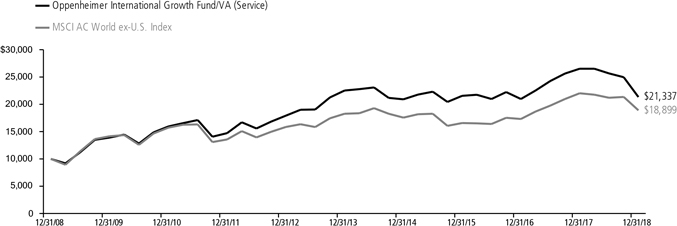
Average Annual Total Returns of Service Shares of the Fund at 12/31/18
1-Year -19.55% 5-Year -1.08% 10-Year 7.87%
Performance data quoted represents past performance, which does not guarantee future results. The investment return and principal value of an investment in the Fund will fluctuate so that an investor’s shares, when redeemed, may be worth more or less than their original cost. Current performance may be lower or higher than the performance quoted. For performance data current to the most recent month end, call us at 1.800.988.8287. The Fund’s total returns should not be expected to be the same as the returns of other funds, whether or not both funds have the same portfolio managers and/or similar names. The Fund’s total returns include changes in share price and reinvested distributions but do not include the charges associated with the separate account products that offer this Fund. Such performance would have been lower if such charges were taken into account.
5 OPPENHEIMER INTERNATIONAL GROWTH FUND/VA
Fund Expenses
Fund Expenses.As a shareholder of the Fund, you incur two types of costs: (1) transaction costs and (2) ongoing costs, including management fees; distribution and service fees; and other Fund expenses. These examples are intended to help you understand your ongoing costs (in dollars) of investing in the Fund and to compare these costs with the ongoing costs of investing in other mutual funds.
The examples are based on an investment of $1,000.00 invested at the beginning of the period and held for the entire6-month period ended December 31, 2018.
Actual Expenses. The first section of the table provides information about actual account values and actual expenses. You may use the information in this section for the class of shares you hold, together with the amount you invested, to estimate the expense that you paid over the period. Simply divide your account value by $1,000.00 (for example, an $8,600.00 account value divided by $1,000.00 = 8.60), then multiply the result by the number in the first section under the heading entitled “Expenses Paid During 6 Months Ended December 31, 2018” to estimate the expenses you paid on your account during this period.
Hypothetical Example for Comparison Purposes.
The second section of the table provides information about hypothetical account values and hypothetical expenses based on the Fund’s actual expense ratio for each class of shares, and an assumed rate of return of 5% per year for each class before expenses, which is not the actual return. The hypothetical account values and expenses may not be used to estimate the actual ending account balance or expenses you paid for the period. You may use this information to compare the ongoing costs of investing in the Fund and other funds. To do so, compare this 5% hypothetical example for the class of shares you hold with the 5% hypothetical examples that appear in the shareholder reports of the other funds.
Please note that the expenses shown in the table are meant to highlight your ongoing costs only and do not reflect any charges associated with the separate accounts that offer this Fund. Therefore, the “hypothetical” lines of the table are useful in comparing ongoing costs only, and will not help you determine the relative total costs of owning different funds. In addition, if these separate account charges were included your costs would have been higher.
| | | | | | | | | | | | | | | | |
| Actual | | Beginning Account Value July 1, 2018 | | | Ending Account Value
December 31, 2018 | | | Expenses Paid During 6 Months Ended
December 31, 2018 | |
Non-Service shares | | $ | 1,000.00 | | | $ | 828.60 | | | $ | 4.62 | | | | | |
Service shares | | | 1,000.00 | | | | 831.40 | | | | 5.79 | | | | | |
| |
| Hypothetical | | | | |
| (5% return before expenses) | | | | | | | | | | | | |
Non-Service shares | | | 1,000.00 | | | | 1,020.16 | | | | 5.10 | | | | | |
Service shares | | | 1,000.00 | | | | 1,018.90 | | | | 6.38 | | | | | |
Expenses are equal to the Fund’s annualized expense ratio for that class, multiplied by the average account value over the period, multiplied by 184/365 (to reflect theone-half year period). Those annualized expense ratios, excluding indirect expenses from affiliated funds, based on the6-month period ended December 31, 2018 are as follows:
| | | | | | | | |
| Class | | Expense Ratios | | | | |
Non-Service shares | | | 1.00% | | | | | |
Service shares | | | 1.25 | | | | | |
The expense ratios reflect voluntary and/or contractual waivers and/or reimbursements of expenses by the Fund’s Manager. Some of these undertakings may be modified or terminated at any time, as indicated in the Fund’s prospectus. The “Financial Highlights” tables in the Fund’s financial statements, included in this report, also show the gross expense ratios, without such waivers or reimbursements and reduction to custodian expenses, if applicable.
6 OPPENHEIMER INTERNATIONAL GROWTH FUND/VA
STATEMENT OF INVESTMENTSDecember 31, 2018
| | | | | | | | | | | | |
| | | Shares | | | Value | | | | |
| | | | | |
| Common Stocks—95.9% | | | | | | | | | |
| | | | | |
| Consumer Discretionary—22.6% | | | | | | | | | |
| | | | | |
| Auto Components—3.5% | | | | | | | | | |
| | | | | |
| Continental AG | | | 38,170 | | | $ | 5,278,084 | | | | | |
| | | | | |
| Koito Manufacturing Co. Ltd. | | | 125,100 | | | | 6,381,679 | | | | | |
| | | | | |
| Valeo SA | | | 155,643 | | | | 4,513,154 | | | | | |
| | | | | | | | | | | | |
| | | | 16,172,917 | | | | | |
| |
| | | | | |
| Automobiles—3.7% | | | | | | | | | |
| | | | | |
| Bayerische Motoren Werke AG | | | 61,427 | | | | 4,974,795 | | | | | |
| | | | | |
| Hero MotoCorp Ltd. | | | 168,227 | | | | 7,468,882 | | | | | |
| | | | | |
| Subaru Corp. | | | 218,000 | | | | 4,653,804 | | | | | |
| | | | | | | | | | | | |
| | | | | | | 17,097,481 | | | | | |
| |
| | | | | |
| Entertainment—0.1% | | | | | | | | | |
| |
| | | | | |
| Ubisoft Entertainment SA1 | | | 6,110 | | | | 490,175 | | | | | |
| |
| | | | | |
| Hotels, Restaurants & Leisure—3.3% | | | | | | | | | |
| | | | | |
| Carnival Corp. | | | 132,528 | | | | 6,533,630 | | | | | |
| | | | | |
| Domino’s Pizza Group plc | | | 1,034,444 | | | | 3,063,514 | | | | | |
| | | | | |
| Whitbread plc | | | 97,976 | | | | 5,703,392 | | | | | |
| | | | | | | | | | | | |
| | | | | | | 15,300,536 | | | | | |
| |
| | | | | |
| Household Durables—1.2% | | | | | | | | | | | | |
| | | | | |
| SEB SA2 | | | 3,520 | | | | 453,003 | | | | | |
| | | | | |
| SEB SA2 | | | 39,200 | | | | 5,044,801 | | | | | |
| | | | | | | | | | | | |
| | | | 5,497,804 | | | | | |
| |
| | | | | |
| Interactive Media & Services—2.3% | | | | | | | | | |
| | | | | |
| Baidu, Inc., Sponsored ADR1 | | | 31,520 | | | | 4,999,072 | | | | | |
| | | | | |
| Scout24 AG3 | | | 125,307 | | | | 5,767,273 | | | | | |
| | | | | | | | | | | | |
| | | | | | | 10,766,345 | | | | | |
| |
| | | | | |
| Internet & Catalog Retail—1.4% | | | | | | | | | | | | |
| | | | | |
| Alibaba Group Holding Ltd., Sponsored | | | | | | | | | |
| ADR1 | | | 28,236 | | | | 3,870,308 | | | | | |
| | | | | |
| JD.com, Inc., ADR1 | | | 135,314 | | | | 2,832,122 | | | | | |
| | | | | | | | | | | | |
| | | | 6,702,430 | | | | | |
| |
| | | | | |
| Media—1.4% | | | | | | | | | | | | |
| | | | | |
| SES SA, Cl. A, FDR | | | 350,360 | | | | 6,710,749 | | | | | |
| |
| | | | | |
| Multiline Retail—0.7% | | | | | | | | | |
| | | | | |
| Dollarama, Inc. | | | 142,711 | | | | 3,394,247 | | | | | |
| |
| | | | | |
| Specialty Retail—1.1% | | | | | | | | | |
| | | | | |
| Nitori Holdings Co. Ltd. | | | 40,400 | | | | 5,018,327 | | | | | |
| |
| | | | | |
| Textiles, Apparel & Luxury Goods—3.9% | | | | | | | | | |
| | | | | |
| Cie Financiere Richemont SA | | | 60,907 | | | | 3,914,337 | | | | | |
| | | | | |
| Hermes International | | | 14,256 | | | | 7,884,233 | | | | | |
| | | | | |
| LVMH Moet Hennessy Louis Vuitton SE | | | 21,370 | | | | 6,279,485 | | | | | |
| | | | | | | | | | | | |
| | | | | | | 18,078,055 | | | | | |
| |
| | | | | |
| Consumer Staples—10.2% | | | | | | | | | | | | |
| | | | | |
| Beverages—2.3% | | | | | | | | | | | | |
| | | | | |
| Heineken NV | | | 56,860 | | | | 5,011,491 | | | | | |
| | | | | |
| Pernod Ricard SA | | | 35,040 | | | | 5,753,479 | | | | | |
| | | | | | | | | | | | |
| | | | | | | 10,764,970 | | | | | |
| |
| | | | | |
| Food & Staples Retailing—2.4% | | | | | | | | | | | | |
| |
| | | | | |
| Alimentation Couche-Tard, Inc., Cl. B | | | 132,388 | | | | 6,585,459 | | | | | |
| | | | | |
| CP ALL PCL | | | 2,170,000 | | | | 4,565,101 | | | | | |
| | | | | | | | | | | | |
| | | | | | | 11,150,560 | | | | | |
| |
| | | | | |
| Food Products—3.1% | | | | | | | | | | | | |
| | | | | |
| Barry Callebaut AG | | | 2,773 | | | | 4,312,205 | | | | | |
| | | | | |
| Saputo, Inc. | | | 169,552 | | | | 4,867,230 | | | | | |
| | | | | |
| WH Group Ltd.3 | | | 7,050,000 | | | | 5,375,809 | | | | | |
| | | | | | | | | | | | |
| | | | | | | 14,555,244 | | | | | |
| |
| | | | | |
| Household Products—1.6% | | | | | | | | | | | | |
| | | | | |
| Reckitt Benckiser Group plc | | | 98,714 | | | | 7,538,395 | | | | | |
| |
| | | | | |
| Tobacco—0.8% | | | | | | | | | |
| | | | | |
| Swedish Match AB | | | 90,576 | | | | 3,570,941 | | | | | |
| | | | | | | | |
| | | Shares | | | Value | |
| |
| Energy—0.9% | | | | | |
| |
Energy Equipment & Services—0.9% | | | | | |
| |
| TechnipFMC plc | | | 215,012 | | | $ | 4,334,516 | |
|
| |
| Financials—4.4% | | | | | |
| |
Commercial Banks—2.2% | | | | | | | | |
| |
| ICICI Bank Ltd., Sponsored ADR | | | 1,001,303 | | | | 10,303,408 | |
|
| |
Insurance—2.2% | | | | | | | | |
| |
| Legal & General Group plc | | | 1,524,986 | | | | 4,474,735 | |
| |
| Prudential plc | | | 315,601 | | | | 5,638,865 | |
| | | | | | | | |
| | | | | | | 10,113,600 | |
|
| |
| Health Care—14.4% | | | | | | | | |
| |
| Biotechnology—3.1% | | | | | |
| |
| CSL Ltd. | | | 54,312 | | | | 7,092,936 | |
| |
| Grifols SA | | | 287,299 | | | | 7,504,332 | |
| | | | | | | | |
| | | | | | | 14,597,268 | |
|
| |
| Health Care Equipment & Supplies—5.4% | | | | | |
| |
| EssilorLuxottica SA | | | 33,433 | | | | 4,221,659 | |
| |
| Hoya Corp. | | | 107,193 | | | | 6,551,881 | |
| |
| Medtronic plc | | | 10,400 | | | | 945,984 | |
| |
| ResMed, Inc. | | | 8,620 | | | | 981,560 | |
| |
| Siemens Healthineers AG1,3 | | | 143,270 | | | | 5,998,650 | |
| |
| Sonova Holding AG | | | 21,792 | | | | 3,553,216 | |
| |
| William Demant Holding AS1 | | | 110,528 | | | | 3,133,250 | |
| | | | | | | | |
| | | | | | | 25,386,200 | |
|
| |
Health Care Providers & Services—0.2% | |
| |
| Fresenius Medical Care AG & Co. KGaA | | | 14,208 | | | | 922,896 | |
|
| |
| Life Sciences Tools & Services—1.6% | | | | | |
| |
| Lonza Group AG1 | | | 28,012 | | | | 7,282,474 | |
|
| |
Pharmaceuticals—4.1% | | | | | | | | |
| |
| Bayer AG | | | 62,453 | | | | 4,330,564 | |
| |
Novo Nordisk AS, Cl. B | | | 190,863 | | | | 8,773,535 | |
| |
| Roche Holding AG | | | 24,031 | | | | 5,942,248 | |
| | | | | | | | |
| | | | 19,046,347 | |
|
| |
Industrials—17.2% | | | | | | | | |
| |
Aerospace & Defense—1.3% | | | | | | | | |
| |
| Airbus SE | | | 61,980 | | | | 5,927,826 | |
|
| |
| Commercial Services & Supplies—2.9% | | | | | |
| |
| Edenred | | | 186,094 | | | | 6,821,682 | |
| |
| Prosegur Cash SA3 | | | 1,212,557 | | | | 2,671,381 | |
| |
| Prosegur Cia de Seguridad SA | | | 816,094 | | | | 4,135,221 | |
| | | | | | | | |
| | | | 13,628,284 | |
|
| |
Construction & Engineering—1.3% | |
| |
Boskalis Westminster | | | 240,169 | | | | 5,944,943 | |
|
| |
Electrical Equipment—3.0% | | | | | | | | |
| |
Legrand SA | | | 92,390 | | | | 5,200,041 | |
| |
| Melrose Industries plc | | | 1,519,210 | | | | 3,145,898 | |
| |
Nidec Corp. | | | 50,200 | | | | 5,753,158 | |
| | | | | | | | |
| | | | | | | 14,099,097 | |
|
| |
Machinery—5.3% | | | | | | | | |
| |
| Aalberts Industries NV | | | 110,168 | | | | 3,647,501 | |
| |
| Atlas Copco AB, Cl. A | | | 205,152 | | | | 4,901,198 | |
| |
| Epiroc AB, Cl. A1 | | | 362,445 | | | | 3,442,119 | |
| |
Kubota Corp. | | | 391,900 | | | | 5,518,275 | |
| |
| VAT Group AG1,3 | | | 53,256 | | | | 4,689,605 | |
| |
Weir Group plc (The) | | | 169,676 | | | | 2,789,776 | |
| | | | | | | | |
| | | | | | | 24,988,474 | |
|
| |
| Professional Services—0.7% | | | | | |
| |
| Intertek Group plc | | | 56,970 | | | | 3,468,332 | |
|
| |
| Trading Companies & Distributors—2.7% | | | | | |
| |
Bunzl plc | | | 299,989 | | | | 9,026,301 | |
| |
| Ferguson plc | | | 52,576 | | | | 3,367,279 | |
| | | | | | | | |
| | | | | | | 12,393,580 | |
7 OPPENHEIMER INTERNATIONAL GROWTH FUND/VA
STATEMENT OF INVESTMENTSContinued
| | | | | | | | |
| | | Shares | | | Value | |
| |
| Information Technology—20.9% | |
| |
Communications Equipment—1.9% | |
| |
Nokia OYJ | | | 1,570,863 | | | $ | 9,076,306 | |
|
| |
Electronic Equipment, Instruments, & Components—3.0% | |
| |
Hitachi Ltd. | | | 238,600 | | | | 6,342,418 | |
|
| |
Keyence Corp. | | | 15,112 | | | | 7,616,155 | |
| | | | | | | | |
| | | | | | | 13,958,573 | |
|
| |
Internet Software & Services—1.0% | |
| |
United Internet AG | | | 105,636 | | | | 4,621,067 | |
|
| |
IT Services—2.8% | | | | | | | | |
| |
Amadeus IT Group SA | | | 73,054 | | | | 5,086,687 | |
| |
Atos SE | | | 55,050 | | | | 4,479,083 | |
| |
EPAM Systems, Inc.1 | | | 29,380 | | | | 3,408,374 | |
| | | | | | | | |
| | | | | | | 12,974,144 | |
|
| |
Semiconductors & Semiconductor Equipment—6.0% | |
| |
ams AG | | | 116,157 | | | | 2,800,925 | |
| |
ASML Holding NV | | | 50,432 | | | | 7,868,752 | |
| |
Infineon Technologies AG | | | 550,201 | | | | 10,948,293 | |
| |
STMicroelectronics NV | | | 467,530 | | | | 6,671,934 | |
| | | | | | | | |
| | | | | | | 28,289,904 | |
|
| |
Software—6.2% | | | | | | | | |
| |
Atlassian Corp. plc, Cl. A1 | | | 11,060 | | | | 984,119 | |
| |
Dassault Systemes SE | | | 31,967 | | | | 3,774,245 | |
| |
SAP SE | | | 109,982 | | | | 10,955,275 | |
| |
Temenos AG1 | | | 71,922 | | | | 8,667,468 | |
| | | | | | | | |
| | | Shares | | | Value | |
| |
Software (Continued) | | | | | |
| |
Xero Ltd.1 | | | 150,707 | | | $ | 4,441,067 | |
| | | | | | | | |
| | | | | | | 28,822,174 | |
|
| |
Materials—3.7% | | | | | | | | |
| |
Chemicals—2.1% | | | | | | | | |
| |
Novozymes AS, Cl. B | | | 88,472 | | | | 3,954,571 | |
| |
Sika AG | | | 45,965 | | | | 5,841,848 | |
| | | | | | | | |
| | | | 9,796,419 | |
|
| |
Construction Materials—0.5% | |
| |
James Hardie Industries plc | | | 217,747 | | | | 2,318,826 | |
|
| |
Containers & Packaging—1.1% | |
| |
CCL Industries, Inc., Cl. B | | | 145,568 | | | | 5,337,777 | |
|
| |
Telecommunication Services—1.6% | |
| |
Diversified Telecommunication Services—1.6% | |
| |
Nippon Telegraph & Telephone Corp. | | | 180,600 | | | | 7,353,319 | |
| | | | | | | | |
Total Common Stocks
(Cost $357,909,309) | | | | | | | 447,794,930 | |
| |
| Preferred Stock—0.0% | | | | | |
| |
| Zee Entertainment Enterprises Ltd., 6% Cum.Non-Cv. (Cost $—) | | | 599,541 | | | | 65,609 | |
|
| |
| Investment Company—3.8% | | | | | |
| |
Oppenheimer Institutional Government Money Market Fund, Cl. E, 2.35%4,5
(Cost $17,692,763) | | | 17,692,763 | | | | 17,692,763 | |
| |
| Total Investments, at Value (Cost $375,602,072) | | | 99.7% | | | | 465,553,302 | |
| | | | |
Net Other Assets (Liabilities) | | | 0.3 | | | | 1,302,597 | |
| | | | |
Net Assets | | | 100.0% | | | $ | 466,855,899 | |
| | | | |
Footnotes to Statement of Investments
1.Non-income producing security.
2. The Fund holds securities which have been issued by the same entity and that trade on separate exchanges.
3. Represents securities sold under Rule 144A, which are exempt from registration under the Securities Act of 1933, as amended. These securities have been determined to be liquid under guidelines established by the Board of Trustees. These securities amount to $24,502,718 or 5.25% of the Fund’s net assets at period end.
4. Rate shown is the7-day yield at period end.
5. Is or was an affiliate, as defined in the Investment Company Act of 1940, as amended, at or during the reporting period, by virtue of the Fund owning at least 5% of the voting securities of the issuer or as a result of the Fund and the issuer having the same investment adviser. Transactions during the reporting period in which the issuer was an affiliate are as follows:
| | | | | | | | | | | | | | | | |
| | | Shares
December 31, 2017 | | | Gross
Additions | | | Gross
Reductions | | | Shares December 31, 2018 | |
| |
Investment Company | | | | | | | | | | | | | | | | |
| Oppenheimer Institutional Government Money Market Fund, Cl. E | | | 1,843,768 | | | | 144,286,201 | | | | 128,437,206 | | | | 17,692,763 | |
| | | | |
| | | Value | | | Income | | | Realized Gain (Loss) | | | Change in Unrealized
Gain (Loss) | |
| |
Investment Company | |
| Oppenheimer Institutional Government Money Market Fund, Cl. E | | $ | 17,692,763 | | | $ | 318,389 | | | $ | — | | | $ | — | |
| | | | | | | | |
| Distribution of investments representing geographic holdings, as a percentage of total investments at value, is as follows: | | | | | | |
| Geographic Holdings (Unaudited) | | Value | | | Percent | |
France | | $ | 60,842,867 | | | | 13.1 | % |
Japan | | | 55,189,015 | | | | 11.9 | |
Germany | | | 53,796,897 | | | | 11.6 | |
Switzerland | | | 50,875,335 | | | | 10.9 | |
United Kingdom | | | 49,183,722 | | | | 10.6 | |
United States | | | 32,929,589 | | | | 7.0 | |
Netherlands | | | 22,472,686 | | | | 4.8 | |
Canada | | | 20,184,715 | | | | 4.3 | |
Spain | | | 19,397,623 | | | | 4.2 | |
India | | | 17,837,899 | | | | 3.8 | |
Denmark | | | 15,861,356 | | | | 3.4 | |
Sweden | | | 11,914,258 | | | | 2.6 | |
China | | | 11,701,503 | | | | 2.5 | |
Finland | | | 9,076,306 | | | | 1.9 | |
Australia | | | 8,077,055 | | | | 1.7 | |
Luxembourg | | | 6,710,749 | | | | 1.4 | |
Hong Kong | | | 5,375,808 | | | | 1.2 | |
8 OPPENHEIMER INTERNATIONAL GROWTH FUND/VA
| | | | | | | | |
| Geographic Holdings (Unaudited) (Continued) | | Value | | | Percent | |
Thailand | | $ | 4,565,101 | | | | 1.0% | |
New Zealand | | | 4,441,067 | | | | 1.0 | |
Austria | | | 2,800,925 | | | | 0.6 | |
Ireland | | | 2,318,826 | | | | 0.5 | |
| | | | |
Total | | $ | 465,553,302 | | | | 100.0% | |
| | | | |
See accompanying Notes to Financial Statements.
9 OPPENHEIMER INTERNATIONAL GROWTH FUND/VA
STATEMENT OF ASSETS AND LIABILITIES December 31, 2018
| | | | |
| |
Assets | | | | |
Investments, at value—see accompanying statement of investments: | | | | |
Unaffiliated companies (cost $357,909,309) | | $ | 447,860,539 | |
Affiliated companies (cost $17,692,763) | | | 17,692,763 | |
| | | | |
| | | 465,553,302 | |
| |
Cash | | | 502,487 | |
| |
Cash—foreign currencies (cost $21) | | | 21 | |
| |
Receivables and other assets: | | | | |
Shares of beneficial interest sold | | | 1,935,389 | |
Dividends | | | 1,783,162 | |
Investments sold | | | 45,519 | |
Other | | | 48,021 | |
| | | | |
Total assets | | | 469,867,901 | |
|
| |
Liabilities | | | | |
Payables and other liabilities: | | | | |
Investments purchased | | | 2,508,277 | |
Foreign capital gains tax | | | 244,782 | |
Shares of beneficial interest redeemed | | | 108,338 | |
Distribution and service plan fees | | | 42,594 | |
Trustees’ compensation | | | 37,303 | |
Shareholder communications | | | 8,898 | |
Other | | | 61,810 | |
| | | | |
Total liabilities | | | 3,012,002 | |
|
| |
Net Assets | | $ | 466,855,899 | |
| | | | |
|
| |
Composition of Net Assets | | | | |
Par value of shares of beneficial interest | | $ | 225,607 | |
| |
Additionalpaid-in capital | | | 356,564,376 | |
| |
Total distributable earnings | | | 110,065,916 | |
| | | | |
Net Assets | | $ | 466,855,899 | |
| | | | |
|
| |
Net Asset Value Per Share | | | | |
Non-Service Shares: | | | | |
Net asset value, redemption price per share and offering price per share (based on net assets of $267,220,333 and 131,439,239 shares of beneficial interest outstanding) | | | $2.03 | |
| |
Service Shares: | | | | |
Net asset value, redemption price per share and offering price per share (based on net assets of $199,635,566 and 94,167,704 shares of beneficial interest outstanding) | | | $2.12 | |
See accompanying Notes to Financial Statements.
10 OPPENHEIMER INTERNATIONAL GROWTH FUND/VA
STATEMENT OF OPERATIONS For the Year Ended December 31, 2018
| | | | |
| |
Investment Income | | | | |
Dividends: | | | | |
Unaffiliated companies (net of foreign withholding taxes of $983,683) | | $ | 9,875,501 | |
Affiliated companies | | | 318,389 | |
| | | | |
Total investment income | | | 10,193,890 | |
|
| |
Expenses | | | | |
Management fees | | | 5,229,829 | |
| |
Distribution and service plan fees - Service shares | | | 578,191 | |
| |
Transfer and shareholder servicing agent fees: | | | | |
Non-Service shares | | | 390,537 | |
Service shares | | | 277,532 | |
| |
Shareholder communications: | | | | |
Non-Service shares | | | 23,918 | |
Service shares | | | 17,357 | |
| |
Custodian fees and expenses | | | 59,508 | |
| |
Trustees’ compensation | | | 20,595 | |
| |
Borrowing fees | | | 17,754 | |
| |
Other | | | 70,332 | |
| | | | |
Total expenses | | | 6,685,553 | |
Less reduction to custodian expenses | | | (259) | |
Less waivers and reimbursements of expenses | | | (520,056) | |
| | | | |
Net expenses | | | 6,165,238 | |
|
| |
Net Investment Income | | | 4,028,652 | |
|
| |
Realized and Unrealized Gain (Loss) | | | | |
Net realized gain (loss) on: | | | | |
Investment transactions in unaffiliated companies (net of foreign capital gains tax of $153,215) | | | 25,037,688 | |
Foreign currency transactions | | | (11,396) | |
| | | | |
Net realized gain | | | 25,026,292 | |
| |
Net change in unrealized appreciation/(depreciation) on: | | | | |
Investment transactions in unaffiliated companies | | | (139,715,193) | |
Translation of assets and liabilities denominated in foreign currencies | | | (48,724) | |
| | | | |
Net change in unrealized appreciation/(depreciation) | | | (139,763,917) | |
| |
Net Decrease in Net Assets Resulting from Operations | | | $ (110,708,973) | |
| | | | |
See accompanying Notes to Financial Statements.
11 OPPENHEIMER INTERNATIONAL GROWTH FUND/VA
STATEMENTS OF CHANGES IN NET ASSETS
| | | | | | | | |
| | | Year Ended
December 31, 2018 | | | Year Ended
December 31, 20171 | |
| | |
Operations | | | | | | | | |
Net investment income | | $ | 4,028,652 | | | $ | 4,255,911 | |
Net realized gain | | | 25,026,292 | | | | 14,279,372 | |
Net change in unrealized appreciation/(depreciation) | | | (139,763,917) | | | | 108,297,137 | |
| | | | |
Net increase (decrease) in net assets resulting from operations | | | (110,708,973) | | | | 126,832,420 | |
| | |
Dividends and/or Distributions to Shareholders | | | | | | | | |
Dividends and distributions declared: | | | | | | | | |
Non-Service shares | | | (9,134,490) | | | | (4,868,321) | |
Service shares | | | (5,690,284) | | | | (2,425,707) | |
| | | | |
Total dividends and distributions declared | | | (14,824,774) | | | | (7,294,028) | |
| | |
Beneficial Interest Transactions | | | | | | | | |
Net increase (decrease) in net assets resulting from beneficial interest transactions: | | | | | | | | |
Non-Service shares | | | (20,815,884) | | | | (14,779,318) | |
Service shares | | | 13,746,754 | | | | 17,507,241 | |
| | | | |
Total beneficial interest transactions | | | (7,069,130) | | | | 2,727,923 | |
| | |
Net Assets | | | | | | | | |
Total increase (decrease) | | | (132,602,877) | | | | 122,266,315 | |
Beginning of period | | | 599,458,776 | | | | 477,192,461 | |
| | | | |
End of period | | $ | 466,855,899 | | | $ | 599,458,776 | |
| | | | |
| | | | |
1. Prior period amounts have been conformed to current year presentation. See Notes to Financial Statements, Note 2– New Accounting Pronouncements for further details.
See accompanying Notes to Financial Statements.
12 OPPENHEIMER INTERNATIONAL GROWTH FUND/VA
FINANCIAL HIGHLIGHTS
| | | | | | | | | | | | | | | | | | | | |
| Non-Service Shares | | Year Ended
December 31,
2018 | | | Year Ended
December 31,
2017 | | | Year Ended
December 31,
2016 | | | Year Ended
December 31,
2015 | | | Year Ended
December 31,
2014 | |
| |
Per Share Operating Data | | | | | | | | | | | | | | | | | | | | |
Net asset value, beginning of period | | | $2.59 | | | | $2.08 | | | | $2.20 | | | | $2.31 | | | | $2.57 | |
| |
Income (loss) from investment operations: | | | | | | | | | | | | | | | | | | | | |
Net investment income1 | | | 0.02 | | | | 0.02 | | | | 0.03 | | | | 0.03 | | | | 0.03 | |
Net realized and unrealized gain (loss) | | | (0.51) | | | | 0.52 | | | | (0.08) | | | | 0.06 | | | | (0.21) | |
| | | | |
Total from investment operations | | | (0.49) | | | | 0.54 | | | | (0.05) | | | | 0.09 | | | | (0.18) | |
| |
Dividends and/or distributions to shareholders: | | | | | | | | | | | | | | | | | | | | |
Dividends from net investment income | | | (0.02) | | | | (0.03) | | | | (0.02) | | | | (0.03) | | | | (0.03) | |
Distributions from net realized gain | | | (0.05) | | | | 0.00 | | | | (0.05) | | | | (0.17) | | | | (0.05) | |
| | | | |
Total dividends and/or distributions to shareholders | | | (0.07) | | | | (0.03) | | | | (0.07) | | | | (0.20) | | | | (0.08) | |
| |
Net asset value, end of period | | | $2.03 | | | | $2.59 | | | | $2.08 | | | | $2.20 | | | | $2.31 | |
| | | | |
| | | | | | | | | | | | | | | | | | | | |
| |
Total Return, at Net Asset Value2 | | | (19.42)% | | | | 26.29% | | | | (2.12)% | | | | 3.43% | | | | (7.22)% | |
| | | | | | | | | | | | | | | | | | | | |
Ratios/Supplemental Data | | | | | | | | | | | | | | | | | | | | |
Net assets, end of period (in thousands) | | | $267,220 | | | | $360,417 | | | | $301,559 | | | | $317,547 | | | | $358,756 | |
| |
Average net assets (in thousands) | | | $325,080 | | | | $339,999 | | | | $305,269 | | | | $343,347 | | | | $400,556 | |
| |
Ratios to average net assets:3 | | | | | | | | | | | | | | | | | | | | |
Net investment income | | | 0.83% | | | | 0.87% | | | | 1.24% | | | | 1.08% | | | | 1.13% | |
Expenses excluding specific expenses listed below | | | 1.10% | | | | 1.08% | | | | 1.09% | | | | 1.08% | | | | 1.07% | |
Interest and fees from borrowings | | | 0.00%4 | | | | 0.00%4 | | | | 0.00%4 | | | | 0.00%4 | | | | 0.00% | |
| | | | |
Total expenses5 | | | 1.10% | | | | 1.08% | | | | 1.09% | | | | 1.08% | | | | 1.07% | |
| Expenses after payments, waivers and/or reimbursements and reduction to custodian expenses | | | 1.00% | | | | 1.00% | | | | 1.00% | | | | 1.00% | | | | 1.00% | |
| |
Portfolio turnover rate | | | 25% | | | | 27% | | | | 15% | | | | 24% | | | | 41% | |
1. Per share amounts calculated based on the average shares outstanding during the period.
2. Assumes an initial investment on the business day before the first day of the fiscal period, with all dividends and distributions reinvested in additional shares on the reinvestment date, and redemption at the net asset value calculated on the last business day of the fiscal period. Total returns are not annualized for periods less than one full year. Total return information does not reflect expenses that apply at the separate account level or to related insurance products. Inclusion of these charges would reduce the total return figures for all periods shown. Returns do not reflect the deduction of taxes that a shareholder would pay on fund distributions or the redemption of fund shares.
3. Annualized for periods less than one full year.
4. Less than 0.005%.
5. Total expenses including indirect expenses from affiliated fund fees and expenses were as follows:
| | | | | | |
| | Year Ended December 31, 2018 | | | 1.10 | % |
| | Year Ended December 31, 2017 | | | 1.08 | % |
| | Year Ended December 31, 2016 | | | 1.09 | % |
| | Year Ended December 31, 2015 | | | 1.08 | % |
| | Year Ended December 31, 2014 | | | 1.07 | % |
See accompanying Notes to Financial Statements.
13 OPPENHEIMER INTERNATIONAL GROWTH FUND/VA
FINANCIAL HIGHLIGHTSContinued
| | | | | | | | | | | | | | | | | | | | |
| Service Shares | | Year Ended
December 31,
2018 | | | Year Ended
December 31,
2017 | | | Year Ended
December 31,
2016 | | | Year Ended
December 31,
2015 | | | Year Ended
December 31,
2014 | |
Per Share Operating Data | | | | | | | | | | | | | | | | | | | | |
Net asset value, beginning of period | | | $2.70 | | | | $2.16 | | | | $2.29 | | | | $2.40 | | | | $2.66 | |
Income (loss) from investment operations: | | | | | | | | | | | | | | | | | | | | |
Net investment income1 | | | 0.01 | | | | 0.01 | | | | 0.02 | | | | 0.02 | | | | 0.02 | |
Net realized and unrealized gain (loss) | | | (0.52) | | | | 0.56 | | | | (0.08) | | | | 0.06 | | | | (0.21) | |
| | | | |
Total from investment operations | | | (0.51) | | | | 0.57 | | | | (0.06) | | | | 0.08 | | | | (0.19) | |
Dividends and/or distributions to shareholders: | | | | | | | | | | | | | | | | | | | | |
Dividends from net investment income | | | (0.02) | | | | (0.03) | | | | (0.02) | | | | (0.02) | | | | (0.02) | |
Distributions from net realized gain | | | (0.05) | | | | 0.00 | | | | (0.05) | | | | (0.17) | | | | (0.05) | |
| | | | |
Total dividends and/or distributions to shareholders | | | (0.07) | | | | (0.03) | | | | (0.07) | | | | (0.19) | | | | (0.07) | |
Net asset value, end of period | | | $2.12 | | | | $2.70 | | | | $2.16 | | | | $2.29 | | | | $2.40 | |
| | | | |
| | | | | | | | | | | | | | | | | | | | |
Total Return, at Net Asset Value2 | | | (19.55)% | | | | 26.44% | | | | (2.72)% | | | | 3.11% | | | | (7.15)% | |
| | | | | | | | | | | | | | | | | | | | |
Ratios/Supplemental Data | | | | | | | | | | | | | | | | | | | | |
Net assets, end of period (in thousands) | | | $199,636 | | | | $239,042 | | | | $175,633 | | | | $169,292 | | | | $145,515 | |
Average net assets (in thousands) | | | $231,130 | | | | $213,440 | | | | $174,834 | | | | $165,226 | | | | $128,694 | |
Ratios to average net assets:3 | | | | | | | | | | | | | | | | | | | | |
Net investment income | | | 0.58% | | | | 0.60% | | | | 0.99% | | | | 0.79% | | | | 0.85% | |
Expenses excluding specific expenses listed below | | | 1.35% | | | | 1.33% | | | | 1.34% | | | | 1.33% | | | | 1.32% | |
Interest and fees from borrowings | | | 0.00%4 | | | | 0.00%4 | | | | 0.00%4 | | | | 0.00%4 | | | | 0.00% | |
| | | | |
Total expenses5 | | | 1.35% | | | | 1.33% | | | | 1.34% | | | | 1.33% | | | | 1.32% | |
| Expenses after payments, waivers and/or reimbursements and reduction to custodian expenses | | | 1.25% | | | | 1.25% | | | | 1.25% | | | | 1.25% | | | | 1.25% | |
Portfolio turnover rate | | | 25% | | | | 27% | | | | 15% | | | | 24% | | | | 41% | |
1. Per share amounts calculated based on the average shares outstanding during the period.
2. Assumes an initial investment on the business day before the first day of the fiscal period, with all dividends and distributions reinvested in additional shares on the reinvestment date, and redemption at the net asset value calculated on the last business day of the fiscal period. Total returns are not annualized for periods less than one full year. Total return information does not reflect expenses that apply at the separate account level or to related insurance products. Inclusion of these charges would reduce the total return figures for all periods shown. Returns do not reflect the deduction of taxes that a shareholder would pay on fund distributions or the redemption of fund shares.
3. Annualized for periods less than one full year.
4. Less than 0.005%.
5. Total expenses including indirect expenses from affiliated fund fees and expenses were as follows:
| | | | | | |
| | Year Ended December 31, 2018 | | | 1.35 | % |
| | Year Ended December 31, 2017 | | | 1.33 | % |
| | Year Ended December 31, 2016 | | | 1.34 | % |
| | Year Ended December 31, 2015 | | | 1.33 | % |
| | Year Ended December 31, 2014 | | | 1.32 | % |
See accompanying Notes to Financial Statements.
14 OPPENHEIMER INTERNATIONAL GROWTH FUND/VA
NOTES TO FINANCIAL STATEMENTSDecember 31, 2018
1. Organization
Oppenheimer International Growth Fund/VA (the “Fund”), is a separate series of Oppenheimer Variable Account Funds, which is registered under the Investment Company Act of 1940 (“1940 Act”), as amended, as a diversifiedopen-end management investment company. The Fund’s investment objective is to seek capital appreciation. The Fund’s investment adviser is OFI Global Asset Management, Inc. (“OFI Global” or the “Manager”), a wholly-owned subsidiary of OppenheimerFunds, Inc. (“OFI” or the“Sub-Adviser”). The Manager has entered into asub-advisory agreement with OFI. Shares of the Fund are sold only to separate accounts of life insurance companies.
The Fund offers two classes of shares. Both classes are sold at their offering price, which is the net asset value per share, to separate investment accounts of participating insurance companies as an underlying investment for variable life insurance policies, variable annuity contracts or other investment products. The class of shares designated as Service shares is subject to a distribution and service plan. Both classes of shares have identical rights and voting privileges with respect to the Fund in general and exclusive voting rights on matters that affect that class alone. Earnings, net assets and net asset value per share may differ due to each class having its own expenses, such as transfer and shareholder servicing agent fees and shareholder communications, directly attributable to that class.
The following is a summary of significant accounting policies followed in the Fund’s preparation of financial statements in accordance with accounting principles generally accepted in the United States (“U.S. GAAP”).
2. Significant Accounting Policies
Security Valuation.All investments in securities are recorded at their estimated fair value, as described in Note 3.
Foreign Currency Translation.The books and records of the Fund are maintained in U.S. dollars. Any foreign currency amounts are translated into U.S. dollars on the following basis:
(1) Value of investment securities, other assets and liabilities — at the exchange rates prevailing at market close as described in Note 3.
(2) Purchases and sales of investment securities, income and expenses — at the rates of exchange prevailing on the respective dates of such transactions.
Although the net assets and the values are presented at the foreign exchange rates at market close, the Fund does not isolate the portion of the results of operations resulting from changes in foreign exchange rates on investments from the fluctuations arising from changes in prices of securities held. Such fluctuations are included with the net realized and unrealized gains or losses from investments shown in the Statement of Operations.
For securities, which are subject to foreign withholding tax upon disposition, realized and unrealized gains or losses on such securities are recorded net of foreign withholding tax.
Reported net realized foreign exchange gains or losses arise from sales of foreign currencies, currency gains or losses realized between the trade and settlement dates on securities transactions, the difference between the amounts of dividends, interest, and foreign withholding tax reclaims recorded on the Fund’s books, and the U.S. dollar equivalent of the amounts actually received or paid. Net unrealized foreign exchange gains and losses arise from changes in the value of assets and liabilities other than investments in securities, resulting from changes in the exchange rate.
Allocation of Income, Expenses, Gains and Losses.Income, expenses (other than those attributable to a specific class), gains and losses are allocated on a daily basis to each class of shares based upon the relative proportion of net assets represented by such class. Operating expenses directly attributable to a specific class are charged against the operations of that class.
Dividends and Distributions to Shareholders. Dividends and distributions to shareholders, which are determined in accordance with income tax regulations and may differ from U.S. GAAP, are recorded on theex-dividend date. Income and capital gain distributions, if any, are declared and paid annually or at other times as determined necessary by the Manager.
Investment Income.Dividend income is recorded on theex-dividend date or uponex-dividend notification in the case of certain foreign dividends where theex-dividend date may have passed.Non-cash dividends included in dividend income, if any, are recorded at the fair value of the securities received. Withholding taxes on foreign dividends, if any, and capital gains taxes on foreign investments, if any, have been provided for in accordance with the Fund’s understanding of the applicable tax rules and regulations. Interest income, if any, is recognized on an accrual basis. Discount and premium, which are included in interest income on the Statement of Operations, are amortized or accreted daily.
Custodian Fees. “Custodian fees and expenses” in the Statement of Operations may include interest expense incurred by the Fund on any cash overdrafts of its custodian account during the period. Such cash overdrafts may result from the effects of failed trades in portfolio securities and from cash outflows resulting from unanticipated shareholder redemption activity. The Fund pays interest to its custodian on such cash overdrafts, to the extent they are not offset by positive cash balances maintained by the Fund, at a rate equal to the Federal Funds Rate plus 2.00%. The “Reduction to custodian expenses” line item, if applicable, represents earnings on cash balances maintained by the Fund during the period. Such interest expense and other custodian fees may be paid with these earnings.
Security Transactions. Security transactions are recorded on the trade date. Realized gains and losses on securities sold are determined on the basis of identified cost.
Indemnifications.The Fund’s organizational documents provide current and former Trustees and officers with a limited indemnification against
15 OPPENHEIMER INTERNATIONAL GROWTH FUND/VA
NOTES TO FINANCIAL STATEMENTSContinued
2. Significant Accounting Policies (Continued)
liabilities arising in connection with the performance of their duties to the Fund. In the normal course of business, the Fund may also enter into contracts that provide general indemnifications. The Fund’s maximum exposure under these arrangements is unknown as this would be dependent on future claims that may be made against the Fund. The risk of material loss from such claims is considered remote.
Federal Taxes.The Fund intends to comply with provisions of the Internal Revenue Code applicable to regulated investment companies and to distribute substantially all of its investment company taxable income, including any net realized gain on investments not offset by capital loss carryforwards, if any, to shareholders. Therefore, no federal income or excise tax provision is required. The Fund files income tax returns in U.S. federal and applicable state jurisdictions. The statute of limitations on the Fund’s tax return filings generally remains open for the three preceding fiscal reporting period ends. The Fund has analyzed its tax positions for the fiscal year ended December 31, 2018, including open tax years, and does not believe there are any uncertain tax positions requiring recognition in the Fund’s financial statements.
The tax components of capital shown in the following table represent distribution requirements the Fund must satisfy under the income tax regulations, losses the Fund may be able to offset against income and gains realized in future years and unrealized appreciation or depreciation of securities and other investments for federal income tax purposes.
| | | | | | | | | | | | |
Undistributed Net Investment Income | | Undistributed
Long-Term
Gain | | | Accumulated
Loss
Carryforward1,2 | | | Net Unrealized
Appreciation Based on cost of
Securities and
Other Investments
for Federal Income
Tax Purposes | |
| |
$3,849,308 | | | $22,072,630 | | | | $— | | | | $84,181,282 | |
1. During the reporting period, the Fund did not utilize any capital loss carryforward.
2.During the previous reporting period, the Fund utilized $417,148 of capital loss carryforward to offset capital gains realized in that fiscal year.
Net investment income (loss) and net realized gain (loss) may differ for financial statement and tax purposes. The character of dividends and distributions made during the fiscal year from net investment income or net realized gains are determined in accordance with federal income tax requirements, which may differ from the character of net investment income or net realized gains presented in those financial statements in accordance with U.S. GAAP. Also, due to timing of dividends and distributions, the fiscal year in which amounts are distributed may differ from the fiscal year in which the income or net realized gain was recorded by the Fund.
Accordingly, the following amounts have been reclassified for the reporting period. Net assets of the Fund were unaffected by the reclassifications.
| | | | |
Increase toPaid-in Capital | | Reduction to
Accumulated Net
Earnings3 | |
| |
$2,199,217 | | | $2,199,217 | |
3. $2,198,404, all of which was long-term capital gain, was distributed in connection with Fund share redemptions.
The tax character of distributions paid during the reporting periods:
| | | | | | | | |
| | | Year Ended
December 31, 2018 | | | Year Ended
December 31, 2017 | |
| |
Distributions paid from: | | | | | | | | |
Ordinary income | | $ | 4,584,335 | | | $ | 7,294,028 | |
Long-term capital gain | | | 10,240,439 | | | | — | |
| | | | |
Total | | $ | 14,824,774 | | | $ | 7,294,028 | |
| | | | |
The aggregate cost of securities and other investments and the composition of unrealized appreciation and depreciation of securities and other investments for federal income tax purposes at period end are noted in the following table. The primary difference between book and tax appreciation or depreciation of securities and other investments, if applicable, is attributable to the tax deferral of losses or tax realization of financial statement unrealized gain or loss.
| | | | |
Federal tax cost of securities | | $ | 381,104,843 | |
Federal tax cost of other investments | | | (277) | |
| | | | |
Total federal tax cost | | $ | 381,104,566 | |
| | | | |
Gross unrealized appreciation | | $ | 141,615,225 | |
Gross unrealized depreciation | | | (57,433,943) | |
| | | | |
Net unrealized appreciation | | $ | 84,181,282 | |
| | | | |
Certain foreign countries impose a tax on capital gains which is accrued by the Fund based on unrealized appreciation, if any, on affected securities. The tax is paid when the gain is realized.
16 OPPENHEIMER INTERNATIONAL GROWTH FUND/VA
2. Significant Accounting Policies (Continued)
Use of Estimates. The preparation of financial statements in conformity with U.S. GAAP requires management to make estimates and assumptions that affect the reported amounts of assets and liabilities and disclosure of contingent assets and liabilities at the date of the financial statements and the reported amounts of increases and decreases in net assets from operations during the reporting period. Actual results could differ from those estimates.
New Accounting Pronouncements. In March 2017, Financial Accounting Standards Board (“FASB”) issued Accounting Standards Update (“ASU”), ASU2017-08. This provides guidance related to the amortization period for certain purchased callable debt securities held at a premium. The ASU is effective for annual periods beginning after December 15, 2018, and interim periods within those annual periods. The Manager has evaluated the impacts of these changes on the financial statements and there are no material impacts.
During August 2018, the Securities and Exchange Commission (the “SEC”) issued Final Rule ReleaseNo. 33-10532 (the “Rule”), Disclosure Update and Simplification. The rule amends certain financial statement disclosure requirements to conform to U.S. GAAP. The amendments to Rule6-04.17 of RegulationS-X (balance sheet) remove the requirement to separately state the book basis components of net assets: undistributed (over-distribution of) net investment income (“UNII”), accumulated undistributed net realized gains (losses), and net unrealized appreciation (depreciation) at the balance sheet date. Instead, consistent with U.S. GAAP, funds will be required to disclose total distributable earnings. The amendments to Rule6-09 of RegulationS-X (statement of changes in net assets) remove the requirement to separately state the sources of distributions paid. Instead, consistent with U.S. GAAP, funds will be required to disclose the total amount of distributions paid, except that any tax return of capital must be separately disclosed. The amendments also remove the requirement to parenthetically state the book basis amount of UNII on the statement of changes in net assets. The requirements of the Rule are effective November 5, 2018, and the Funds’ Statement of Assets and Liabilities and Statement of Changes in Net Assets for the current reporting period have been modified accordingly. In addition, certain amounts within each Fund’s Statement of Changes in Net Assets for the prior fiscal period have been modified to conform to the Rule.
3. Securities Valuation
The Fund calculates the net asset value of its shares as of 4:00 P.M. Eastern Time, on each day the New York Stock Exchange (the “Exchange” or “NYSE”) is open for trading, except in the case of a scheduled early closing of the Exchange, in which case the Fund will calculate net asset value of the shares as of the scheduled early closing time of the Exchange.
The Fund’s Board has adopted procedures for the valuation of the Fund’s securities and has delegated theday-to-day responsibility for valuation determinations under those procedures to the Manager. The Manager has established a Valuation Committee which is responsible for determining a fair valuation for any security for which market quotations are not readily available. The Valuation Committee’s fair valuation determinations are subject to review, approval and ratification by the Fund’s Board at least quarterly or more frequently, if necessary.
Valuation Methods and Inputs
Securities are valued primarily using unadjusted quoted market prices, when available, as supplied by third party pricing services or broker-dealers.
The following methodologies are used to determine the market value or the fair value of the types of securities described below:
Equity securities traded on a securities exchange (including exchange-traded derivatives other than futures and futures options) are valued based on the official closing price on the principal exchange on which the security is traded, as identified by the Manager, prior to the time when the Fund’s assets are valued. If the official closing price is unavailable, the security is valued at the last sale price on the principal exchange on which it is traded, or if no sales occurred, the security is valued at the mean between the quoted bid and asked prices.Over-the-counter equity securities are valued at the last published sale price, or if no sales occurred, at the mean between the quoted bid and asked prices. Events occurring after the close of trading on foreign exchanges may result in adjustments to the valuation of foreign securities to more accurately reflect their fair value as of the time when the Fund’s assets are valued.
Shares of a registered investment company that are not traded on an exchange are valued at that investment company’s net asset value per share.
Securities for which market quotations are not readily available, or when a significant event has occurred that would materially affect the value of the security, are fair valued either (i) by a standardized fair valuation methodology applicable to the security type or the significant event as previously approved by the Valuation Committee and the Fund’s Board or (ii) as determined in good faith by the Manager’s Valuation Committee. The Valuation Committee considers all relevant facts that are reasonably available, through either public information or information available to the Manager, when determining the fair value of a security. Those standardized fair valuation methodologies include, but are not limited to, valuing securities at the last sale price or initially at cost and subsequently adjusting the value based on: changes in company specific fundamentals, changes in an appropriate securities index, or changes in the value of similar securities which may be further adjusted for any discounts related to security-specific resale restrictions. When possible, such methodologies use observable market inputs such as unadjusted quoted prices of similar securities, observable interest rates, currency rates and yield curves. The methodologies used for valuing securities are not necessarily an indication of the risks associated with investing in those securities nor can it be assured that the Fund can obtain the fair value assigned to a security if it were to sell the security.
Classifications
Each investment asset or liability of the Fund is assigned a level at measurement date based on the significance and source of the inputs to its valuation. Various data inputs may be used in determining the value of each of the Fund’s investments as of the reporting period end. These data inputs are categorized in the following hierarchy under applicable financial accounting standards:
1) Level1-unadjusted quoted prices in active markets for identical assets or liabilities (including securities actively traded on a securities exchange)
17 OPPENHEIMER INTERNATIONAL GROWTH FUND/VA
NOTES TO FINANCIAL STATEMENTSContinued
3. Securities Valuation (Continued)
2) Level2-inputs other than unadjusted quoted prices that are observable for the asset or liability (such as unadjusted quoted prices for similar assets and market corroborated inputs such as interest rates, prepayment speeds, credit risks, etc.)
3) Level3-significant unobservable inputs (including the Manager’s own judgments about assumptions that market participants would use in pricing the asset or liability).
The inputs used for valuing securities are not necessarily an indication of the risks associated with investing in those securities.
The Fund classifies each of its investments in investment companies which are publicly offered as Level 1. Investment companies that are not publicly offered, if any, are classified as Level 2 in the fair value hierarchy.
The table below categorizes amounts that are included in the Fund’s Statement of Assets and Liabilities at period end based on valuation input level:
| | | | | | | | | | | | | | | | |
| | | Level 1— Unadjusted Quoted Prices | | | Level 2— Other Significant
Observable Inputs | | | Level 3—
Significant
Unobservable
Inputs | | | Value | |
Assets Table | | | | | | | | | | | | | | | | |
Investments, at Value: | | | | | | | | | | | | | | | | |
Common Stocks | | | | | | | | | | | | | | | | |
Consumer Discretionary | | $ | 21,629,379 | | | $ | 83,599,687 | | | $ | — | | | $ | 105,229,066 | |
Consumer Staples | | | 11,452,689 | | | | 36,127,421 | | | | — | | | | 47,580,110 | |
Energy | | | — | | | | 4,334,516 | | | | — | | | | 4,334,516 | |
Financials | | | 10,303,408 | | | | 10,113,600 | | | | — | | | | 20,417,008 | |
Health Care | | | 1,927,544 | | | | 65,307,641 | | | | — | | | | 67,235,185 | |
Industrials | | | — | | | | 80,450,536 | | | | — | | | | 80,450,536 | |
Information Technology | | | 4,392,493 | | | | 93,349,675 | | | | — | | | | 97,742,168 | |
Materials | | | 5,337,777 | | | | 12,115,245 | | | | — | | | | 17,453,022 | |
Telecommunication Services | | | — | | | | 7,353,319 | | | | — | | | | 7,353,319 | |
Preferred Stock | | | 65,609 | | | | — | | | | — | | | | 65,609 | |
Investment Company | | | 17,692,763 | | | | — | | | | — | | | | 17,692,763 | |
| | | | |
Total Assets | | $ | 72,801,662 | | | $ | 392,751,640 | | | $ | — | | | $ | 465,553,302 | |
| | | | |
Forward currency exchange contracts and futures contracts, if any, are reported at their unrealized appreciation/depreciation at measurement date, which represents the change in the contract’s value from trade date. All additional assets and liabilities included in the above table are reported at their market value at measurement date.
For the reporting period, there were no transfers between levels.
4. Investments and Risks
Risks of Foreign Investing.The Fund may invest in foreign securities which are subject to special risks. Securities traded in foreign markets may be less liquid and more volatile than those traded in U.S. markets. Foreign issuers are usually not subject to the same accounting and disclosure requirements that U.S. companies are subject to, which may make it difficult for the Fund to evaluate a foreign company’s operations or financial condition. A change in the value of a foreign currency against the U.S. dollar will result in a change in the U.S. dollar value of investments denominated in that foreign currency and in the value of any income or distributions the Fund may receive on those investments. The value of foreign investments may be affected by exchange control regulations, foreign taxes, higher transaction and other costs, delays in the settlement of transactions, changes in economic or monetary policy in the United States or abroad, expropriation or nationalization of a company’s assets, or other political and economic factors. In addition, due to the inter-relationship of global economies and financial markets, changes in political and economic factors in one country or region could adversely affect conditions in another country or region. Investments in foreign securities may also expose the Fund to time-zone arbitrage risk. Foreign securities may trade on weekends or other days when the Fund does not price its shares. At times, the Fund may emphasize investments in a particular country or region and may be subject to greater risks from adverse events that occur in that country or region. Foreign securities and foreign currencies held in foreign banks and securities depositories may be subject to limited or no regulatory oversight.
Investments in Affiliated Funds. The Fund is permitted to invest in other mutual funds advised by the Manager (“Affiliated Funds”). Affiliated Funds are management investment companies registered under the 1940 Act, as amended. The Manager is the investment adviser of, and theSub-Adviser provides investment and related advisory services to, the Affiliated Funds. When applicable, the Fund’s investments in Affiliated Funds are included in the Statement of Investments. Shares of Affiliated Funds are valued at their net asset value per share. As a shareholder, the Fund is subject to its proportional share of the Affiliated Funds’ expenses, including their management fee. The Manager will waive fees and/or reimburse Fund expenses in an amount equal to the indirect management fees incurred through the Fund’s investment in the Affiliated Funds.
Each of the Affiliated Funds in which the Fund invests has its own investment risks, and those risks can affect the value of the Fund’s investments and therefore the value of the Fund’s shares. To the extent that the Fund invests more of its assets in one Affiliated Fund than in another, the Fund will have greater exposure to the risks of that Affiliated Fund.
Investments in Money Market Instruments.The Fund is permitted to invest its free cash balances in money market instruments to provide liquidity
18 OPPENHEIMER INTERNATIONAL GROWTH FUND/VA
4. Investments and Risks (Continued)
or for defensive purposes. The Fund may invest in money market instruments by investing in Class E shares of Oppenheimer Institutional Government Money Market Fund (“IGMMF”), which is an Affiliated Fund. IGMMF is regulated as a money market fund under the 1940 Act, as amended. The Fund may also invest in money market instruments directly or in other affiliated or unaffiliated money market funds.
Equity Security Risk.Stocks and other equity securities fluctuate in price. The value of the Fund’s portfolio may be affected by changes in the equity markets generally. Equity markets may experience significant short-term volatility and may fall sharply at times. Different markets may behave differently from each other and U.S. equity markets may move in the opposite direction from one or more foreign stock markets. Adverse events in any part of the equity or fixed-income markets may have unexpected negative effects on other market segments.
The prices of individual equity securities generally do not all move in the same direction at the same time and a variety of factors can affect the price of a particular company’s securities. These factors may include, but are not limited to, poor earnings reports, a loss of customers, litigation against the company, general unfavorable performance of the company’s sector or industry, or changes in government regulations affecting the company or its industry.
Shareholder Concentration.At period end, one shareholder owned 20% or more of the Fund’s total outstanding shares.
The shareholder is a related party of the Fund. Related parties may include, but are not limited to, the investment manager and its affiliates, affiliated broker dealers, fund of funds, and directors or employees. The related partyowned 38% of the Fund’s total outstanding shares at period end.
5. Market Risk Factors
The Fund’s investments in securities and/or financial derivatives may expose the Fund to various market risk factors:
Commodity Risk. Commodity risk relates to the change in value of commodities or commodity indexes as they relate to increases or decreases in the commodities market. Commodities are physical assets that have tangible properties. Examples of these types of assets are crude oil, heating oil, metals, livestock, and agricultural products.
Credit Risk.Credit risk relates to the ability of the issuer of debt to meet interest and principal payments, or both, as they come due. In general, lower-grade, higher-yield debt securities are subject to credit risk to a greater extent than lower-yield, higher-quality securities.
Equity Risk. Equity risk relates to the change in value of equity securities as they relate to increases or decreases in the general market.
Foreign Exchange Rate Risk. Foreign exchange rate risk relates to the change in the U.S. dollar value of a security held that is denominated in a foreign currency. The U.S. dollar value of a foreign currency denominated security will decrease as the dollar appreciates against the currency, while the U.S. dollar value will increase as the dollar depreciates against the currency.
Interest Rate Risk.Interest rate risk refers to the fluctuations in value of fixed-income securities resulting from the inverse relationship between price and yield. For example, an increase in general interest rates will tend to reduce the market value of already issued fixed-income investments, and a decline in general interest rates will tend to increase their value. In addition, debt securities with longer maturities, which tend to have higher yields, are subject to potentially greater fluctuations in value from changes in interest rates than obligations with shorter maturities.
Volatility Risk.Volatility risk refers to the magnitude of the movement, but not the direction of the movement, in a financial instrument’s price over a defined time period. Large increases or decreases in a financial instrument’s price over a relative time period typically indicate greater volatility risk, while small increases or decreases in its price typically indicate lower volatility risk.
6. Shares of Beneficial Interest
The Fund has authorized an unlimited number of $0.001 par value shares of beneficial interest of each class. Transactions in shares of beneficial interest were as follows:
| | | | | | | | | | | | | | | | |
| | | Year Ended December 31, 2018 | | | Year Ended December 31, 2017 | |
| | | Shares | | | | Amount | | | | Shares | | | | Amount | |
| |
Non-Service Shares | | | | | | | | | | | | | | | | |
Sold | | | 21,532,426 | | | $ | 51,243,851 | | | | 22,026,198 | | | $ | 51,090,812 | |
Dividends and/or distributions reinvested | | | 3,639,212 | | | | 9,134,490 | | | | 2,045,409 | | | | 4,868,321 | |
Redeemed | | | (32,856,876) | | | | (81,194,225) | | | | (30,252,278) | | | | (70,738,451) | |
| | | | |
Net decrease | | | (7,685,238) | | | $ | (20,815,884) | | | | (6,180,671) | | | $ | (14,779,318) | |
| | | | |
| | | | |
| | | | |
| |
Service Shares | | | | | | | | | | | | | | | | |
Sold | | | 19,920,360 | | | $ | 51,115,122 | | | | 23,171,844 | | | $ | 56,773,388 | |
Dividends and/or distributions reinvested | | | 2,171,864 | | | | 5,690,284 | | | | 978,108 | | | | 2,425,707 | |
Redeemed | | | (16,510,354) | | | | (43,058,652) | | | | (16,813,549) | | | | (41,691,854) | |
| | | | |
Net increase | | | 5,581,870 | | | $ | 13,746,754 | | | | 7,336,403 | | | $ | 17,507,241 | |
| | | | |
7. Purchases and Sales of Securities
The aggregate cost of purchases and proceeds from sales of securities, other than short-term obligations and investments in IGMMF, for the reporting period were as follows:
19 OPPENHEIMER INTERNATIONAL GROWTH FUND/VA
NOTES TO FINANCIAL STATEMENTSContinued
7. Purchases and Sales of Securities (Continued)
| | | | | | | | |
| | | Purchases | | | Sales | |
| |
Investment securities | | $ | 136,268,957 | | | | $162,936,301 | |
8. Fees and Other Transactions with Affiliates
Management Fees.Under the investment advisory agreement, the Fund pays the Manager a management fee based on the daily net assets of the Fund at an annual rate as shown in the following table:
| | |
| Fee Schedule |
|
Up to $250 million | | 1.00% |
Next $250 million | | 0.90 |
Next $500 million | | 0.85 |
Over $1 billion | | 0.82 |
The Fund’s effective management fee for the reporting period was 0.94% of average annual net assets before any applicable waivers.
Sub-Adviser Fees.The Manager has retained theSub-Adviser to provide theday-to-day portfolio management of the Fund. Under theSub-Advisory Agreement, the Manager pays theSub-Adviser an annual fee in monthly installments, equal to a percentage of the investment management fee collected by the Manager from the Fund, which shall be calculated after any investment management fee waivers. The fee paid to theSub-Adviser is paid by the Manager, not by the Fund.
Transfer Agent Fees.OFI Global (the “Transfer Agent”) serves as the transfer and shareholder servicing agent for the Fund. The Fund pays the Transfer Agent a fee based on annual net assets. Fees incurred and average net assets for each class with respect to these services are detailed in the Statement of Operations and Financial Highlights, respectively.
Sub-Transfer Agent Fees.The Transfer Agent has retained Shareholder Services, Inc., a wholly-owned subsidiary of OFI (the“Sub-Transfer Agent”), to provide theday-to-day transfer agent and shareholder servicing of the Fund. Under theSub-Transfer Agency Agreement, the Transfer Agent pays theSub-Transfer Agent an annual fee in monthly installments, equal to a percentage of the transfer agent fee collected by the Transfer Agent from the Fund, which shall be calculated after any applicable fee waivers. The fee paid to theSub-Transfer Agent is paid by the Transfer Agent, not by the Fund.
Trustees’ Compensation. The Fund’s Board of Trustees (“Board”) has adopted a compensation deferral plan for Independent Trustees that enables Trustees to elect to defer receipt of all or a portion of the annual compensation they are entitled to receive from the Fund. For purposes of determining the amount owed to the Trustees under the plan, deferred amounts are treated as though equal dollar amounts had been invested in shares of the Fund or in other Oppenheimer funds selected by the Trustees. The Fund purchases shares of the funds selected for deferral by the Trustees in amounts equal to his or her deemed investment, resulting in a Fund asset equal to the deferred compensation liability. Such assets are included as a component of “Other” within the asset section of the Statement of Assets and Liabilities. Deferral of Trustees’ fees under the plan will not affect the net assets of the Fund and will not materially affect the Fund’s assets, liabilities or net investment income per share. Amounts will be deferred until distributed in accordance with the compensation deferral plan.
Distribution and Service Plan for Service Shares.The Fund has adopted a Distribution and Service Plan (the “Plan”) pursuant to Rule12b-1 under the 1940 Act for Service shares to pay OppenheimerFunds Distributor, Inc. (the “Distributor”), for distribution related services, personal service and account maintenance for the Fund’s Service shares. Under the Plan, payments are made periodically at an annual rate of 0.25% of the daily net assets of Service shares of the Fund. The Distributor currently uses all of those fees to compensate sponsors of the insurance product that offers Fund shares, for providing personal service and maintenance of accounts of their variable contract owners that hold Service shares. These fees are paid out of the Fund’s assets on anon-going basis and increase operating expenses of the Service shares, which results in lower performance compared to the Fund’s shares that are not subject to a service fee. Fees incurred by the Fund under the Plan are detailed in the Statement of Operations.
Waivers and Reimbursements of Expenses.The Manager has contractually agreed to limit the Fund’s expenses after payments, waivers and/or reimbursements and reduction to custodian expenses, excluding any applicable dividend expense, taxes, interest and fees from borrowing, any subsidiary expenses, Acquired Fund Fees and Expenses, brokerage commissions, unusual and infrequent expenses and certain other Fund expenses; so that those expenses, as percentages of daily net assets, will not exceed the annual rate of 1.00% forNon-Service shares and 1.25% for Service shares.
During the reporting period, the Manager waived fees and/or reimbursed the Fund as follows:
| | | | |
Non-Service Shares | | $ | 293,471 | |
Service Shares | | | 210,344 | |
This fee waiver and/or expense reimbursement may not be amended or withdrawn for one year from the date of the Fund’s prospectus, unless approved by the Board.
The Manager will waive fees and/or reimburse Fund expenses in an amount equal to the indirect management fees incurred through the Fund’s investment in IGMMF. During the reporting period, the Manager waived fees and/or reimbursed the Fund $16,241 for IGMMF management fees.
20 OPPENHEIMER INTERNATIONAL GROWTH FUND/VA
9. Borrowings and Other Financing
Joint Credit Facility.A number of mutual funds managed by the Manager participate in a $1.95 billion revolving credit facility (the “Facility”) intended to provide short-term financing, if necessary, subject to certain restrictions in connection with atypical redemption activity. Expenses and fees related to the Facility are paid by the participating funds and are disclosed separately or as other expenses on the Statement of Operations. The Fund did not utilize the Facility during the reporting period.
10. Pending Acquisition
On October 18, 2018, Massachusetts Mutual Life Insurance Company, an indirect corporate parent of theSub-Adviser and the Manager, announced that it has entered into an agreement whereby Invesco Ltd. (“Invesco”), a global investment management company, will acquire theSub-Adviser (the “Transaction”). In connection with the Transaction, on January 11, 2019, the Fund’s Board unanimously approved an Agreement and Plan of Reorganization (the “Agreement”), which provides for the transfer of the assets and liabilities of the Fund to a corresponding, newly formed fund (the “Acquiring Fund”) in the Invesco family of funds (the “Reorganization”) in exchange for shares of the corresponding Acquiring Fund of equal value to the value of the shares of the Fund as of the close of business on the closing date. Although the Acquiring Fund will be managed by Invesco Advisers, Inc., the Acquiring Fund will, as of the closing date, have the same investment objective and substantially similar principal investment strategies and risks as the Fund. After the Reorganization, Invesco Advisers, Inc. will be the investment adviser to the Acquiring Fund, and the Fund will be liquidated and dissolved under applicable law and terminate its registration under the Investment Company Act of 1940, as amended. The Reorganization is expected to be atax-free reorganization for U.S. federal income tax purposes.
The Reorganization is subject to the approval of shareholders of the Fund. Shareholders of record of the Fund on January 14, 2019 will be entitled to vote on the Reorganization and will receive a combined prospectus and proxy statement describing the Reorganization, the shareholder meeting, and a discussion of the factors the Fund’s Board considered in approving the Agreement. The combined prospectus and proxy statement is expected to be distributed to shareholders of record on or about February 28, 2019. The anticipated date of the shareholder meeting is on or about April 12, 2019.
If shareholders approve the Agreement and certain other closing conditions are satisfied or waived, the Reorganization is expected to close during the second quarter of 2019, or as soon as practicable thereafter. This is subject to change.
21 OPPENHEIMER INTERNATIONAL GROWTH FUND/VA
REPORT OF INDEPENDENT REGISTERED PUBLIC ACCOUNTING FIRM
To the Shareholders and Board of Trustees
Oppenheimer Variable Account Funds:
Opinion on the Financial Statements
We have audited the accompanying statement of assets and liabilities of Oppenheimer International Growth Fund/VA, a separate series of Oppenheimer Variable Account Funds, (the “Fund”), including the statement of investments, as of December 31, 2018, the related statement of operations for the year then ended, the statements of changes in net assets for each of the years in the two year period then ended, and the related notes (collectively, the “financial statements”) and the financial highlights for each of the years in the five year period then ended. In our opinion, the financial statements and financial highlights present fairly, in all material respects, the financial position of the Fund as of December 31, 2018, the results of its operations for the year then ended, the changes in its net assets for each of the years in the two year period then ended, and the financial highlights for each of the years in the five year period then ended, in conformity with U.S. generally accepted accounting principles.
Basis for Opinion
These financial statements and financial highlights are the responsibility of the Fund’s management. Our responsibility is to express an opinion on these financial statements and financial highlights based on our audits. We are a public accounting firm registered with the Public Company Accounting Oversight Board (United States) (“PCAOB”) and are required to be independent with respect to the Fund in accordance with the U.S. federal securities laws and the applicable rules and regulations of the Securities and Exchange Commission and the PCAOB.
We conducted our audits in accordance with the standards of the PCAOB. Those standards require that we plan and perform the audit to obtain reasonable assurance about whether the financial statements and financial highlights are free of material misstatement, whether due to error or fraud. Our audits included performing procedures to assess the risks of material misstatement of the financial statements and financial highlights, whether due to error or fraud, and performing procedures that respond to those risks. Such procedures included examining, on a test basis, evidence regarding the amounts and disclosures in the financial statements and financial highlights. Such procedures also included confirmation of securities owned as of December 31, 2018, by correspondence with the custodian, brokers and the transfer agent, or by other appropriate auditing procedures. Our audits also included evaluating the accounting principles used and significant estimates made by management, as well as evaluating the overall presentation of the financial statements and financial highlights. We believe that our audits provide a reasonable basis for our opinion.
KPMGLLP
We have not been able to determine the specific year that we began serving as the auditor of one or more Oppenheimer Funds investment companies, however we are aware that we have served as the auditor of one or more Oppenheimer Funds investment companies since at least 1969.
Denver, Colorado
February 14, 2019
22 OPPENHEIMER INTERNATIONAL GROWTH FUND/VA
FEDERAL INCOME TAX INFORMATIONUnaudited
In early 2019, if applicable, shareholders of record received information regarding all dividends and distributions paid to them by the Fund during calendar year 2018.
Capital gain distributions of $0.04704 per share were paid toNon-Service and Service shareholders, respectively, on June 19, 2018. Whether received in stock or in cash, the capital gain distribution should be treated by shareholders as a gain from the sale of the capital assets held for more than one year (long-term capital gains).
None of the dividends paid by the Fund during the reporting period are eligible for the corporate dividend-received deduction.
Dividends, if any, paid by the Fund during the reporting period which are not designated as capital gain distributions, may be eligible for lower individual income tax rates to the extent that the Fund has received qualified dividend income as stipulated by recent tax legislation. In early 2019, shareholders of record received information regarding the percentage of distributions that are eligible for lower individual income tax rates. The amount will be the maximum amount allowed.
The foregoing information is presented to assist shareholders in reporting distributions received from the Fund to the Internal Revenue Service. Because of the complexity of the federal regulations which may affect your individual tax return and the many variations in state and local tax regulations, we recommend that you consult your tax advisor for specific guidance.
23 OPPENHEIMER INTERNATIONAL GROWTH FUND/VA
BOARD APPROVAL OF THE FUND’S INVESTMENT ADVISORY ANDSUB-ADVISORY AGREEMENTSUnaudited
The Fund has entered into an investment advisory agreement with OFI Global Asset Management, Inc. (“OFI Global” or the “Adviser”), a wholly-owned subsidiary of OppenheimerFunds, Inc. (“OFI” or the“Sub-Adviser”) (“OFI Global” and “OFI” together the “Managers”) and OFI Global has entered into asub-advisory agreement with OFI whereby OFI provides investmentsub-advisory services to the Fund (collectively, the “Agreements”). Each year, the Board of Trustees (the “Board”), including a majority of the independent Trustees, is required to determine whether to approve the terms of the Agreements and the renewal thereof. The Investment Company Act of 1940, as amended, requires that the Board request and evaluate, and that the Managers provide, such information as may be reasonably necessary to evaluate the terms of the Agreements. The Board employs an independent consultant to prepare a report that provides information, including comparative information that the Board requests for that purpose. In addition toin-person meetings focused on this evaluation, the Board receives information throughout the year regarding Fund services, fees, expenses and performance.
The Managers and the independent consultant provided information to the Board on the following factors: (i) the nature, quality and extent of the Managers’ services, (ii) the comparative investment performance of the Fund and the Managers, (iii) the fees and expenses of the Fund, including comparative fee and expense information, (iv) the profitability of the Managers and their affiliates, including an analysis of the cost of providing services, (v) whether economies of scale are realized as the Fund grows and whether fee levels reflect these economies of scale for Fund investors and (vi) other benefits to the Managers from their relationship with the Fund. The Board was aware that there are alternatives to retaining the Managers.
Outlined below is a summary of the principal information considered by the Board as well as the Board’s conclusions.
Nature, Quality and Extent of Services. The Board considered information about the nature, quality and extent of the services provided to the Fund and information regarding the Managers’ key personnel who provide such services. The Managers’ duties include providing the Fund with the services of theSub-Adviser’s portfolio managers and investment team, who provide research, analysis and other advisory services in regard to the Fund’s investments; and securities trading services. OFI Global is responsible for oversight of third-party service providers; monitoring compliance with applicable Fund policies and procedures and adherence to the Fund’s investment restrictions; risk management; and oversight of theSub-Adviser. OFI Global is also responsible for providing certain administrative services to the Fund. Those services include providing and supervising all administrative and clerical personnel who are necessary in order to provide effective corporate administration for the Fund; compiling and maintaining records with respect to the Fund’s operations; preparing and filing reports required by the U.S. Securities and Exchange Commission; preparing periodic reports regarding the operations of the Fund for its shareholders; preparing proxy materials for shareholder meetings; and preparing the registration statements required by federal and state securities laws for the sale of the Fund’s shares. OFI Global also provides the Fund with office space, facilities and equipment.
The Board also considered the quality of the services provided and the quality of the Managers’ resources that are available to the Fund. The Board took account of the fact that theSub-Adviser has over fifty years of experience as an investment adviser and that its assets under management rank it among the top mutual fund managers in the United States. The Board evaluated the Managers’ advisory, administrative, accounting, legal, compliance and risk management services, among other services, and information the Board has received regarding the experience and professional qualifications of the Managers’ key personnel and the size and functions of their staff. In its evaluation of the quality of the portfolio management services provided, the Board considered the experience of George R. Evans and Robert B. Dunphy the portfolio managers for the Fund, and theSub-Adviser’s investment team and analysts. The Board members also considered the totality of their experiences with the Managers as directors or trustees of the Fund and other funds advised by the Managers. The Board considered information regarding the quality of services provided by affiliates of the Managers, which the Board members have become knowledgeable about through their experiences with the Managers and in connection with the review or renewal of the Fund’s service agreements or service providers. The Board concluded, in light of the Managers’ experience, reputation, personnel, operations and resources that the Fund benefits from the services provided under the Agreements.
Investment Performance of the Managers and the Fund. Throughout the year, the Managers provided information on the investment performance of the Fund, the Adviser and theSub-Adviser, including comparative performance information. The Board also reviewed information, prepared by the Managers and by the independent consultant, comparing the Fund’s historical performance to relevant market indices and to the performance of other foreign large growth funds underlying variable insurance products. The Board noted that the Fund outperformed its category median during the five- andten-year periods, while it underperformed is category median during theone- and three-year periods. The Board further noted that the Fund’s recent underperformance occurred in 2014 and 2017 and observed that the Fund has ranked in the top 25% of its category in six of the last nine calendar years.
Fees and Expenses of the Fund. The Board reviewed the fees paid to the Adviser and the other expenses borne by the Fund. The Board noted that the Adviser, not the Fund, pays theSub-Adviser’s fee under thesub-advisory agreement. The independent consultant provided comparative data in regard to the fees and expenses of the Fund and other foreign large growth funds underlying variable insurance products. In reviewing the fees and expenses charged to the VA funds, the Board considered the Adviser’s assertion that, because there is much greater disparity in the fees and services that may be provided by a manager to a VA fund as opposed to a retail fund, when comparing the expenses of the various VA funds to those of retail funds, it is most appropriate to focus on total expenses (rather than on the management fees). The Board considered that the Fund’s total expenses and contractual management fee were higher than their respective peer group medians and its category medians. The Board noted that the Adviser has contractually agreed to waive fees and/or reimburse certain expenses so that the Fund’s total annual operating expenses, as percentages of daily net assets, will not exceed the annual rate of 1.00% forNon-Service Shares and 1.25% for Service Shares. This fee waiver and/or expense reimbursement may not be amended or withdrawn until one year from the date of the Fund’s prospectus, unless approved by the Board. The Board further noted that the Adviser has agreed to waive fees and/or reimburse Fund expenses in an amount equal to the management fees incurred indirectly through the Fund’s investments in funds managed by the Adviser or its affiliates.
Economies of Scale and Profits Realized by the Managers. The Board considered information regarding the Managers’ costs in serving as the Fund’s investment adviser andsub-adviser, including the costs associated with the personnel and systems necessary to manage the Fund, and information regarding the Managers’ profitability from their relationship with the Fund. The Board also considered that the Managers must be able
24 OPPENHEIMER INTERNATIONAL GROWTH FUND/VA
BOARD APPROVAL OF THE FUND’S INVESTMENT ADVISORY ANDSUB-ADVISORY AGREEMENTSUnaudited / Continued
to pay and retain experienced professional personnel at competitive rates to provide quality services to the Fund. The Board reviewed whether the Managers may realize economies of scale in managing and supporting the Fund. The Board noted that the Fund currently has management fee breakpoints, which are intended to share with Fund shareholders economies of scale that may exist as the Fund’s assets grow.
Other Benefits to the Managers. In addition to considering the profits realized by the Managers, the Board considered information that was provided regarding the direct and indirect benefits the Managers receive as a result of their relationship with the Fund, including compensation paid to the Managers’ affiliates and research provided to the Adviser in connection with permissible brokerage arrangements (soft dollar arrangements).
Conclusions. These factors were also considered by the independent Trustees meeting separately from the full Board, assisted by experienced counsel to the Fund and to the independent Trustees. Fund counsel and the independent Trustees’ counsel are independent of the Managers within the meaning and intent of the Securities and Exchange Commission Rules.
Based on its review of the information it received and its evaluations described above, the Board, including a majority of the independent Trustees, decided to continue the Agreements through August 31, 2019. In arriving at its decision, the Board did not identify any factor or factors as being more important than others, but considered all of the above information, and considered the terms and conditions of the Agreements, including the management fees, in light of all the surrounding circumstances.
25 OPPENHEIMER INTERNATIONAL GROWTH FUND/VA
PORTFOLIO PROXY VOTING POLICIES AND GUIDELINES; UPDATES TO STATEMENT OF INVESTMENTSUnaudited
The Fund has adopted Portfolio Proxy Voting Policies and Guidelines under which the Fund votes proxies relating to securities (“portfolio proxies”) held by the Fund. A description of the Fund’s Portfolio Proxy Voting Policies and Guidelines is available (i) without charge, upon request, by calling the Fund toll-free at 1.800.CALL OPP (225.5677), (ii) on the Fund’s website at www.oppenheimerfunds.com, and (iii) on the SEC’s website at www.sec.gov. In addition, the Fund is required to file FormN-PX, with its complete proxy voting record for the 12 months ended June 30th, no later than August 31st of each year. The Fund’s voting record is available (i) without charge, upon request, by calling the Fund toll-free at 1.800.CALL OPP (225.5677), and (ii) in the FormN-PX filing on the SEC’s website at www.sec.gov.
The Fund files its complete schedule of portfolio holdings with the SEC for the first quarter and the third quarter of each fiscal year on FormN-Q. The Fund’s FormN-Q filings are available on the SEC’s website at www.sec.gov.
26 OPPENHEIMER INTERNATIONAL GROWTH FUND/VA
TRUSTEES AND OFFICERSUnaudited
| | |
Name, Position(s) Held with the Fund, Length of
Service, Year of Birth | | Principal Occupation(s) During the Past 5 Years; Other Trusteeships/Directorships
Held; Number of Portfolios in the Fund Complex Currently Overseen |
| |
| INDEPENDENT TRUSTEES | | The address of each Director in the chart below is 6803 S. Tucson Way, Centennial, Colorado 80112-3924. Each Director serves for an indefinite term, or until his or her resignation, retirement, death or removal. Each of the Trustees in the chart below oversees 58 portfolios in the OppenheimerFunds complex. |
| |
Robert J. Malone, Chairman of the Board of Trustees (since 2016), Trustee (since 2002) Year of Birth: 1944 | | Chairman - Colorado Market of MidFirst Bank (since January 2015); Chairman of the Board (2012-2016) and Director (August 2005-January 2016) of Jones International University (educational organization); Trustee of the Gallagher Family Foundation(non-profit organization) (2000-2016); Chairman, Chief Executive Officer and Director of Steele Street Bank Trust (commercial banking) (August 2003-January 2015); Director of Opera Colorado Foundation(non-profit organization) (2008-2012); Director of Colorado UpLIFT (charitable organization) (1986-2010); Director of Jones Knowledge, Inc. (2006-2010); Former Chairman of U.S. Bank-Colorado (subsidiary of U.S. Bancorp and formerly Colorado National Bank) (July 1996-April 1999); Director of Commercial Assets, Inc. (real estate investment trust) (1993-2000); Director of U.S. Exploration, Inc. (oil and gas exploration) (1997-February 2004); Chairman of the Board (1991-1994) and Trustee (1985-1994) of Regis University; and Chairman of the Board (1990-1991) and Member (1984-1999) of Young Presidents Organization. Oversees 54 portfolios in the OppenheimerFunds complex. Mr. Malone has served on the Boards of certain Oppenheimer funds since 2002, during which time he has become familiar with the Fund’s (and other Oppenheimer funds’) financial, accounting, regulatory and investment matters and has contributed to the Boards’ deliberations. |
| |
Andrew J. Donohue, Trustee (since 2017) Year of Birth: 1950 | | Director, Mutual Fund Directors Forum (since February 2018); Of Counsel, Shearman & Sterling LLP (since September 2017); Chief of Staff of the U.S. Securities and Exchange Commission (regulator) (June 2015-February 2017); Managing Director and Investment Company General Counsel of Goldman Sachs (investment bank) (November2012-May 2015); Partner at Morgan Lewis & Bockius, LLP (law firm) (March 2011-October 2012); Director of the Division of Investment Management of U.S. Securities and Exchange Commission (regulator) (May 2006-November 2010); Global General Counsel of Merrill Lynch Investment Managers (investment firm) (May2003-May 2006); General Counsel (October 1991-November 2001) and Executive Vice President (January 1993-November 2001) of OppenheimerFunds, Inc. (investment firm) (June 1991-November 2001). Mr. Donohue has served on the Boards of certain Oppenheimer funds since 2017, during which time he has become familiar with the Fund’s (and other Oppenheimer funds’) financial, accounting, regulatory and investment matters and has contributed to the Board’s deliberations. |
| |
Richard F. Grabish, Trustee (since 2012) Year of Birth: 1948 | | Formerly Senior Vice President and Assistant Director of Sales and Marketing (March 1997-December 2007), Director (March 1987-December 2007) and Manager of Private Client Services (June 1985-June 2005) of A.G. Edwards & Sons, Inc. (broker/dealer and investment firm); Chairman and Chief Executive Officer of A.G. Edwards Trust Company, FSB (March 2001-December 2007); President and Vice Chairman of A.G. Edwards Trust Company, FSB (investment adviser) (April 1987-March 2001); President of A.G. Edwards Trust Company, FSB (investment adviser) (June 2005-December 2007). Mr. Grabish has served on the Boards of certain Oppenheimer funds since 2001, during which time he has become familiar with the Fund’s (and other Oppenheimer funds’) financial, accounting, regulatory and investment matters and has contributed to the Board’s deliberations. |
| |
Beverly L. Hamilton, Trustee (since 2002) Year of Birth: 1946 | | Trustee of Monterey Institute for International Studies (educational organization) (2000-2014); Board Member of Middlebury College (educational organization) (December 2005-June 2011); Director of the Board (1991-2016), Vice Chairman of the Board (2006-2009) and Chairman of the Board (2010-2013) of American Funds’ Emerging Markets Growth Fund, Inc. (mutual fund); Director of The California Endowment (philanthropic organization) (April 2002-April 2008); Director (February 2002-2005) and Chairman of Trustees (2006-2007) of the Community Hospital of Monterey Peninsula; President of ARCO Investment Management Company (February 1991-April 2000); Member of the investment committees of The Rockefeller Foundation (2001-2006) and The University of Michigan (since 2000); Advisor at Credit Suisse First Boston’s Sprout venture capital unit (venture capital fund) (1994-January 2005); Trustee of MassMutual Institutional Funds (investment company) (1996-June 2004); Trustee of MML Series Investment Fund (investment company) (April 1989-June 2004); Member of the investment committee of Hartford Hospital (2000-2003); and Advisor to Unilever (Holland) pension fund (2000-2003). Ms. Hamilton has served on the Boards of certain Oppenheimer funds since 2002, during which time she has become familiar with the Fund’s (and other Oppenheimer funds’) financial, accounting, regulatory and investment matters and has contributed to the Board’s deliberations. |
| |
Victoria J. Herget, Trustee (since 2012) Year of Birth:1951 | | Board Chair (2008-2015) and Director (2004-Present) of United Educators (insurance company); Trustee (since 2000) and Chair (2010-2017) of Newberry Library (independent research library); Trustee, Mather LifeWays (senior living organization) (since 2001); Independent Director of the First American Funds (mutual fund family) (2003-2011); former Managing Director (1993-2001), Principal (1985-1993), Vice President (1978-1985) and Assistant Vice President (1973-1978) of Zurich Scudder Investments (investment adviser) (and its predecessor firms); Trustee (1992-2007), Chair of the Board of Trustees (1999-2007), Investment Committee Chair (1994-1999) and Investment Committee member (2007-2010) of Wellesley College; Trustee, BoardSource(non-profit organization) (2006-2009) and Chicago City Day School(K-8 School) (1994-2005). Ms. Herget has served on the Boards of certain Oppenheimer funds since 2012, during which time she has become familiar with the Fund’s (and other Oppenheimer funds’) financial, accounting, regulatory and investment matters and has contributed to the Board’s deliberations. |
| |
Karen L. Stuckey, Trustee (since 2012) Year of Birth: 1953 | | Member (since May 2015) of Desert Mountain Community Foundation Advisory Board(non-profit organization); Partner (1990-2012) of PricewaterhouseCoopers LLP (professional services firm) (held various positions 1975-1990); Trustee (1992- 2006); member of Executive, Nominating and Audit Committees and Chair of Finance Committee (1992-2006), and Emeritus Trustee (since 2006) of Lehigh University; member, Women’s Investment Management Forum (professional organization) (since inception) and Trustee of Jennies School for Little Children(non-profit) (2011-2014). Ms. Stuckey has served on the Boards of certain Oppenheimer funds since 2012, during which time she has become familiar with the Fund’s (and other Oppenheimer funds’) financial, accounting, regulatory and investment matters and has contributed to the Board’s deliberations. |
27 OPPENHEIMER INTERNATIONAL GROWTH FUND/VA
TRUSTEES AND OFFICERSUnaudited / Continued
| | |
| |
James D. Vaughn, Trustee (since 2012) Year of Birth:1945 | | Retired; former managing partner (1994-2001) of Denver office of Deloitte & Touche LLP, (held various positions in Denver and New York offices from 1969-1993); Trustee and Chairman of the Audit Committee of Schroder Funds (2003-2012); Board member and Chairman of Audit Committee of AMG National Trust Bank (since 2005); Trustee and Investment Committee member, University of South Dakota Foundation (since 1996); Board member, Audit Committee Member and past Board Chair, Junior Achievement (since 1993); former Board member, Mile High United Way, Boys and Girls Clubs, Boy Scouts, Colorado Business Committee for the Arts, Economic Club of Colorado and Metro Denver Network. Mr. Vaughn has served on the Boards of certain Oppenheimer funds since 2012, during which time he has become familiar with the Fund’s (and other Oppenheimer funds’) financial, accounting, regulatory and investment matters and has contributed to the Board’s deliberations. |
INTERESTED TRUSTEE AND OFFICER | | Mr. Steinmetz is an “Interested Trustee” because he is affiliated with the Manager and theSub-Adviser by virtue of his positions as Chairman and director of theSub-Adviser and officer and director of the Manager. Both as a Trustee and as an officer, Mr. Steinmetz serves for an indefinite term, or until his resignation, retirement, death or removal. Mr. Steinmetz’s address is 225 Liberty Street, New York, New York 10281- 1008. Mr. Steinmetz is an officer of 104 portfolios in the OppenheimerFunds complex. |
| |
Arthur P. Steinmetz, Trustee (since 2015), President and Principal Executive Officer (since 2014) Year of Birth: 1958 | | Chairman of OppenheimerFunds, Inc. (since January 2015); CEO and Chairman of OFI Global Asset Management, Inc. (since July 2014), President of OFI Global Asset Management, Inc. (since May 2013), a Director of OFI Global Asset Management, Inc. (since January 2013), Director of OppenheimerFunds, Inc. (since July 2014), President, Management Director and CEO of Oppenheimer Acquisition Corp. (OppenheimerFunds, Inc.‘s parent holding company) (since July 2014), and President and Director of OFI SteelPath, Inc. (since January 2013). Chief Investment Officer of the OppenheimerFunds advisory entities (January 2013-December 2013); Executive Vice President of OFI Global Asset Management, Inc. (January2013-May 2013); Chief Investment Officer of OppenheimerFunds, Inc. (October 2010-December 2012); Chief Investment Officer, Fixed- Income, of OppenheimerFunds, Inc. (April 2009-October 2010); Executive Vice President of OppenheimerFunds, Inc. (October 2009-December 2012); Director of Fixed Income of OppenheimerFunds, Inc. (January 2009-April 2009); and a Senior Vice President of OppenheimerFunds, Inc. (March 1993-September 2009). |
OTHER OFFICERS OF THE FUND | | The addresses of the Officers in the chart below are as follows: for Messrs. Evans, Dunphy, Mss. Foxson and Picciotto, 225 Liberty Street, New York, New York 10281-1008, for Mr. Petersen, 6803 S. Tucson Way, Centennial, Colorado 80112-3924. Each Officer serves for an indefinite term or until his or her resignation, retirement, death or removal. |
| |
George R. Evans, Vice President (since 1999) Year of Birth: 1959 | | CIO Equities of theSub-Adviser (since January 2013); Senior Vice President of theSub-Adviser (since July 2004). Director of International Equities of theSub-Adviser (since July 2004); Director of Equities of theSub-Adviser (October 2010-December 2012); Vice President of HarbourView Asset Management Corporation (July 1994-November 2001) and Vice President of theSub-Adviser (October 1993-July 2004). A portfolio manager and officer of other portfolios in the OppenheimerFunds complex. |
| |
Robert B. Dunphy, Vice President (since 2012) Year of Birth: 1979 | | Vice President of theSub-Adviser (since January 2011); Senior Portfolio Manager (since May 2011); Senior Research Analyst and Assistant Vice President of theSub-Adviser (May 2009-January 2011), and an Intermediate Research Analyst of the Sub- Adviser (January2006-May 2009). A portfolio manager of other portfolios in the OppenheimerFunds complex. |
| |
Cynthia Lo Bessette, Secretary and Chief Legal Officer (since 2016) Year of Birth: 1969 | | Executive Vice President, General Counsel and Secretary of OFI Global Asset Management, Inc. (since February 2016); Senior Vice President and Deputy General Counsel of OFI Global Asset Management, Inc. (March 2015-February 2016); Chief Legal Officer of OppenheimerFunds, Inc. and OppenheimerFunds Distributor, Inc. (since February 2016); Vice President, General Counsel and Secretary of Oppenheimer Acquisition Corp. (since February 2016); General Counsel of OFI SteelPath, Inc., OFI Advisors, LLC and Index Management Solutions, LLC (since February 2016); Chief Legal Officer of OFI Global Institutional, Inc., HarbourView Asset Management Corporation, OFI Global Trust Company, Oppenheimer Real Asset Management, Inc., OFI Private Investments Inc., Shareholder Services, Inc. and Trinity Investment Management Corporation (since February 2016); Corporate Counsel (February 2012-March 2015) and Deputy Chief Legal Officer (April 2013-March 2015) of Jennison Associates LLC; Assistant General Counsel (April 2008-September 2009) and Deputy General Counsel (October 2009-February 2012) of Lord Abbett & Co. LLC. |
| |
Jennifer Foxson, Vice President and Chief Business Officer (since 2014) Year of Birth: 1969 | | Senior Vice President of OppenheimerFunds Distributor, Inc. (since June 2014); Vice President of OppenheimerFunds Distributor, Inc. (April 2006-June 2014); Vice President of OppenheimerFunds, Inc. (January 1998-March 2006); Assistant Vice President of OppenheimerFunds, Inc. (October 1991-December 1998). |
| |
Mary Ann Picciotto, Chief Compliance Officer and Chief Anti-Money Laundering Officer (since 2014) Year of Birth: 1973 | | Asset Management, Inc. (since March 2014); Chief Compliance Officer of OppenheimerFunds, Inc., OFI SteelPath, Inc., OFI Global Institutional, Inc., Oppenheimer Real Asset Management, Inc., OFI Private Investments Inc., Harborview Asset Management Corporation, Trinity Investment Management Corporation, and Shareholder Services, Inc. (since March 2014); Managing Director of Morgan Stanley Investment Management Inc. and certain of its various affiliated entities; Chief Compliance Officer of various Morgan Stanley Funds (May 2010-January 2014); Chief Compliance Officer of Morgan Stanley Investment Management Inc. (April 2007-January 2014). |
| |
Brian S. Petersen, Treasurer and Principal Financial & Accounting Officer (since 2016) Year of Birth: 1970 | | Senior Vice President of OFI Global Asset Management, Inc. (since January 2017); Vice President of OFI Global Asset Management, Inc. (January 2013-January 2017); Vice President of OppenheimerFunds, Inc. (February 2007-December 2012); Assistant Vice President of OppenheimerFunds, Inc. (August 2002-2007). |
The Fund’s Statement of Additional Information contains additional information about the Fund’s Trustees and Officers and is available without charge, upon request, by calling 1.800.988.8287.
28 OPPENHEIMER INTERNATIONAL GROWTH FUND/VA
THIS PAGE INTENTIONALLY LEFT BLANK.
29 OPPENHEIMER INTERNATIONAL GROWTH FUND/VA
THIS PAGE INTENTIONALLY LEFT BLANK.
30 OPPENHEIMER INTERNATIONAL GROWTH FUND/VA
THIS PAGE INTENTIONALLY LEFT BLANK.
31 OPPENHEIMER INTERNATIONAL GROWTH FUND/VA
OPPENHEIMER INTERNATIONAL GROWTH FUND/VA
A Series of Oppenheimer Variable Account Funds
| | |
Manager | | OFI Global Asset Management, Inc. |
| |
Sub-Adviser | | OppenheimerFunds, Inc. |
| |
Distributor | | OppenheimerFunds Distributor, Inc. |
| |
Transfer and | | OFI Global Asset Management, Inc. |
Shareholder | | |
Servicing Agent | | |
| |
Sub-Transfer Agent | | Shareholder Services, Inc. |
| | DBA OppenheimerFunds Services |
| |
Independent | | KPMG LLP |
Registered | | |
Public | | |
Accounting | | |
Firm | | |
| |
Legal Counsel | | Ropes & Gray LLP |
| |
| | Before investing in any of the Oppenheimer funds, investors should carefully consider a fund’s investment objectives, risks, charges and expenses. Fund prospectuses and summary prospectuses contain this and other information about the funds and may be obtained by asking your financial advisor, visiting oppenheimerfunds.com or calling us at 1.800.988.8287. Read prospectuses and summary prospectuses carefully before investing. |
| |
| | © 2019 OppenheimerFunds, Inc. All rights reserved. Oppenheimer funds are distributed by OppenheimerFunds Distributor, Inc. |

Item 2. Code of Ethics.
The registrant has adopted a code of ethics that applies to the registrant’s principal executive officer, principal financial officer, principal accounting officer or controller or persons performing similar functions.
Item 3. Audit Committee Financial Expert.
The Board of Trustees of the registrant has determined that Karen L. Stuckey, the Chairwoman of the Board’s Audit Committee, is the audit committee financial expert and that Ms. Stuckey is “independent” for purposes of this Item 3.
Item 4. Principal Accountant Fees and Services.
The principal accountant for the audit of the registrant’s annual financial statements billed $486,600 in fiscal 2018 and $453,400 in fiscal 2017.
The principal accountant for the audit of the registrant’s annual financial statements billed $64,174 in fiscal 2018 and $35,000 in fiscal 2017.
The principal accountant for the audit of the registrant’s annual financial statements billed $297,836 in fiscal 2018 and $386,986 in fiscal 2017 to the registrant’s investment adviser or any entity controlling, controlled by, or under common control with the adviser that provides ongoing services to the registrant.
Such services include: Internal control reviews, GIPS attestation procedures, custody audits, CP Conduit fees, incremental, and additional, audit services.
The principal accountant for the audit of the registrant’s annual financial statements billed $34,209 in fiscal 2018 and $14,903 in fiscal 2017.
The principal accountant for the audit of the registrant’s annual financial statements billed $534,826 in fiscal 2018 and $591,136 in fiscal 2017 to the registrant’s investment adviser or any entity controlling, controlled by, or under common control with the adviser that provides ongoing services to the registrant.
Such services include: tax compliance, tax planning and tax advice. Tax compliance generally involves preparation of original and amended tax returns, claims for a refund and tax payment-planning services. Tax planning and tax advice includes assistance with tax audits and appeals, tax advice related to mergers and acquisitions and requests for rulings or technical advice from taxing authorities.
The principal accountant for the audit of the registrant’s annual financial statements billed no such fees in fiscal 2018 and no such fees in fiscal 2017.
The principal accountant for the audit of the registrant’s annual financial statements billed no such fees in fiscal 2018 and no such fees in fiscal 2017 to the registrant’s investment adviser or any entity controlling, controlled by, or under common control with the adviser that provides ongoing services to the registrant.
Such fees would include the cost to the principal accountant of attending audit committee meetings and consultations regarding the registrant’s retirement plan with respect to its Trustees.
| (e) | (1) During its regularly scheduled periodic meetings, the registrant’s audit committee willpre-approve all audit, audit-related, tax and other services to be provided by the principal accountants of the registrant. |
The audit committee has delegatedpre-approval authority to its Chairman for any subsequent new engagements that arise between regularly scheduled meeting dates provided that any fees suchpre-approved are presented to the audit committee at its next regularly scheduled meeting.
Under applicable laws,pre-approval ofnon-audit services may be waived provided that: 1) the aggregate amount of all such services provided constitutes no more than five percent of the total amount of fees paid by the registrant to its principal accountant during the fiscal year in which services are provided 2) such services were not recognized by the registrant at the time of engagement asnon-audit services and 3) such services are promptly brought to the attention of the audit committee of the registrant and approved prior to the completion of the audit.
(2) 0%
| (f) | Not applicable as less than 50%. |
| (g) | The principal accountant for the audit of the registrant’s annual financial statements billed $931,045 in fiscal 2018 and $1,028,025 in fiscal 2017 to the registrant and the registrant’s investment adviser or any entity controlling, controlled by, or under common control with the adviser that provides ongoing services to the registrant related tonon-audit fees. Those billings did not include any prohibitednon-audit services as defined by the Securities Exchange Act of 1934. |
| (h) | The registrant’s audit committee of the board of Trustees has considered whether the provision ofnon-audit services that were rendered to the registrant’s investment adviser, and any entity controlling, controlled by, or under common control with the investment adviser that provides ongoing services to the registrant that were notpre-approved pursuant to paragraph (c)(7)(ii) of Rule2-01 of RegulationS-X is compatible with maintaining the principal accountant’s independence. No such services were rendered. |
Item 5. Audit Committee of Listed Registrants
Not applicable.
Item 6. Schedule of Investments.
a) Not applicable. The complete schedule of investments is included in Item 1 of this FormN-CSR.
b) Not applicable.
Item 7. Disclosure of Proxy Voting Policies and Procedures forClosed-End Management Investment Companies.
Not applicable.
Item 8. Portfolio Managers ofClosed-End Management Investment Companies.
Not applicable.
Item 9. Purchases of Equity Securities byClosed-End Management Investment Company and Affiliated Purchasers.
Not applicable.
Item 10. Submission of Matters to a Vote of Security Holders.
The Fund’s Governance Committee Provisions with Respect to Nominations of Directors/Trustees to the Respective Boards
None
Item 11. Controls and Procedures.
Based on their evaluation of the registrant’s disclosure controls and procedures (as defined in rule30a-3(c) under the Investment Company Act of 1940 (17 CFR270.30a-3(c)) as of 12/31/2018, the registrant’s principal executive officer and principal financial officer found the registrant’s disclosure controls and procedures to provide reasonable assurances that information required to be disclosed by the registrant in the reports that it files under the Securities Exchange Act of 1934 (a) is accumulated and communicated to registrant’s management, including its principal executive officer and principal financial officer, to allow timely decisions regarding required disclosure, and (b) is recorded, processed, summarized and reported, within the time periods specified in the rules and forms adopted by the U.S. Securities and Exchange Commission.
There have been no changes in the registrant’s internal controls over financial reporting that occurred during the registrant’s second fiscal quarter of the period covered by this report that
have materially affected, or are reasonably likely to materially affect, the registrant’s internal control over financial reporting.
Item 12. Disclosure of Securities Lending Activities forClosed-End Management Investment Companies.
Not applicable.
Item 13. Exhibits.
| (a) | (1) Exhibit attached hereto. |
| | (2) Exhibits attached hereto. |
SIGNATURES
Pursuant to the requirements of the Securities Exchange Act of 1934 and the Investment Company Act of 1940, the registrant has duly caused this report to be signed on its behalf by the undersigned, thereunto duly authorized.
| | |
| Oppenheimer Variable Account Funds |
| |
| By: | | /s/ Arthur P. Steinmetz |
| | Arthur P. Steinmetz |
| | Principal Executive Officer |
Date: 2/15/2019
Pursuant to the requirements of the Securities Exchange Act of 1934 and the Investment Company Act of 1940, this report has been signed below by the following persons on behalf of the registrant and in the capacities and on the dates indicated.
| | |
| |
| By: | | /s/ Arthur P. Steinmetz |
| | Arthur P. Steinmetz |
| | Principal Executive Officer |
Date: 2/15/2019
| | |
| |
| By: | | /s/ Brian S. Petersen |
| | Brian S. Petersen |
| | Principal Financial Officer |
Date: 2/15/2019