UNITED STATES
SECURITIES AND EXCHANGE COMMISSION
WASHINGTON, D.C. 20549
FORM N-CSR
CERTIFIED SHAREHOLDER REPORT OF REGISTERED MANAGEMENT
INVESTMENT COMPANIES
Investment Company Act file number 811-4108
Oppenheimer Variable Account Funds
(Exact name of registrant as specified in charter)
6803 South Tucson Way, Centennial, Colorado 80112-3924
(Address of principal executive offices) (Zip code)
Cynthia Lo Bessette
OFI Global Asset Management, Inc.
225 Liberty Street, New York, New York 10281-1008
(Name and address of agent for service)
Registrant’s telephone number, including area code: (303) 768-3200
Date of fiscal year end: December 31
Date of reporting period: 12/31/2017
Item 1. Reports to Stockholders.
| | | | |
| | 
| | |
| | |
| | | December 31, 2017 | | |
| | Oppenheimer | | |
| | Discovery Mid Cap Growth Fund/VA | | Annual Report |
| | A Series of Oppenheimer Variable Account Funds | | |
| | | |
| | ANNUAL REPORT | | |
| | |
| | Listing of Top Holdings | | |
| | |
| | Fund Performance Discussion | | |
| | |
| | Financial Statements | | |
PORTFOLIO MANAGERS: Ronald J. Zibelli, Jr., CFA and Justin Livengood, CFA
AVERAGE ANNUAL TOTAL RETURNS FOR THE PERIODS ENDED 12/31/17
| | | | | | | | | | | | | | |
| | | Inception
Date | | 1-Year | | | 5-Year | | | 10-Year | |
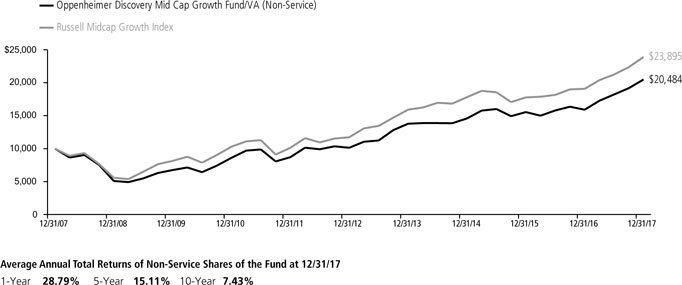
Non-Service Shares | | 8/15/86 | | | 28.79% | | | | 15.11% | | | | 7.43 | % |
Service Shares | | 10/16/00 | | | 28.46 | | | | 14.82 | | | | 7.16 | |
Russell Midcap Growth Index | | | | | 25.27 | | | | 15.30 | | | | 9.10 | |
Performance data quoted represents past performance, which does not guarantee future results. The investment return and principal value of an investment in the Fund will fluctuate so that an investor’s shares, when redeemed, may be worth more or less than their original cost. Current performance may be lower or higher than the performance quoted. For performance data current to the most recent month end, call us at 1.800.988.8287. The Fund’s total returns should not be expected to be the same as the returns of other funds, whether or not both funds have the same portfolio managers and/or similar names. The Fund’s total returns include changes in share price and reinvested distributions but do not include the charges associated with the separate account products that offer this Fund. Such performance would have been lower if such charges were taken into account. Returns for periods of less than one year are cumulative and not annualized. See Fund prospectuses and summary prospectuses for more information on share classes and sales charges.
TOP HOLDINGS AND ALLOCATIONS
TOP TEN COMMON STOCK HOLDINGS
| | |
XPO Logistics, Inc. | | 2.0% |
Red Hat, Inc. | | 1.7 |
SVB Financial Group | | 1.6 |
Total System Services, Inc. | | 1.5 |
Equinix, Inc. | | 1.5 |
DR Horton, Inc. | | 1.5 |
Diamondback Energy, Inc. | | 1.5 |
Waste Connections, Inc. | | 1.5 |
Rockwell Automation, Inc. | | 1.5 |
Mettler-Toledo International, Inc. | | 1.5 |
Portfolio holdings and allocations are subject to change. Percentages are as of December 31, 2017, and are based on net assets. For more current Fund holdings, please visit oppenheimerfunds.com.
SECTOR ALLOCATION
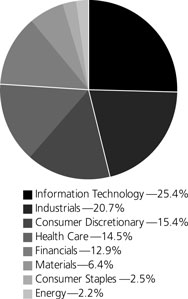
Portfolio holdings and allocations are subject to change. Percentages are as of December 31, 2017, and are based on the total market value of common stocks.
2 OPPENHEIMER DISCOVERY MID CAP GROWTH FUND/VA
Fund Performance Discussion
The Fund’s Non-Service shares produced a return of 28.79% during the reporting period, outperforming the Russell Midcap Growth Index (the “Index”) return of 25.27%. The Fund outperformed the Index in 8 out of 11 sectors, led by Consumer Discretionary, Consumer Staples and Health Care. Stock selection benefited in these three sectors, as did underweight positions in Consumer Discretionary and Consumer Staples. The Fund underperformed the Index within the Financials and Energy sectors, due to stock selection and an overweight position, respectively.
MARKET OVERVIEW
Domestic equities posted solid gains in 2017, continuing their strong upward move following the November 2016 election. Investors anticipated an administration friendly to both the economy and financial markets. Less regulation, tax reform and other policies favorable to domestic economic growth were on the new administration’s agenda. Consumer and business confidence remained high, corporate earnings strengthened, and other macroeconomic factors (employment, capital expenditures) were favorable, while inflationary pressures (wage growth, commodity prices, interest rates) seemed contained. During the year, growth indices outperformed their value counterparts.
TOP INDIVIDUAL CONTRIBUTORS
Top performing stocks for the Fund this reporting period included XPO Logistics, Inc., Align Technology, Inc. and Autodesk, Inc.
XPO Logistics, a non-asset based freight transportation provider, recorded strong financial results despite hurricane-related headwinds in the third quarter of 2017. The company benefited from e-commerce demand for its contract logistics and “last mile” services. In addition, growth in intermodal services and a favorable brokerage market benefited the company. The stock also rose due to rumored bids from Home Depot and/or Amazon. This remains one of the largest holdings in the Fund.
Align Technology designs, manufactures, and markets the Invisalign System, a method for treating the misalignment of teeth. This company is part of our Medical Technology theme, which we think is a bright spot in an overall difficult environment for Health Care companies. Align has delivered standout results this year, driven by their leadership in the market for adult dental correction, and increasing penetration of the teen market.
Autodesk is the leading provider of CAD software using a SaaS delivery model. The company reported strong results due to the continued success of their subscription business model transition and diligent total spend management.
TOP INDIVIDUAL DETRACTORS
Detractors from performance this reporting period included CBS Corporation, Nabors Industries Ltd., and Vulcan Materials Company.
CBS is a multimedia company that operates broadcasting, television production, and publishing businesses. The stock trended downwards driven by mixed earnings results and a difficult environment overall for media companies. We have exited our position in CBS.
Nabors Industries is one of the largest operators of land drilling rigs in the U.S. Earlier this year, the company reported somewhat disappointing financial results related to higher-than-expected operating costs. As a result we exited our position.
Vulcan Materials Company produces construction aggregates. The company’s principal product lines are aggregates, asphalt mix and concrete, and cement. Hurricanes Harvey and Irma had a major impact on Vulcan’s operations as stated by the company’s management on their Q3 earnings call. We have since exited our position in Vulcan.
STRATEGY & OUTLOOK
At the end of the period, the Fund was overweight Industrials, Financials and Health Care while underweight Consumer Discretionary and Consumer Staples.
Our long-term investment process remains the same. We seek dynamic companies with above-average and sustainable revenue and earnings growth that we believe are positioned to outperform. This includes leading firms in structurally attractive industries with committed management teams that have proven records of performance.
3 OPPENHEIMER DISCOVERY MID CAP GROWTH FUND/VA
Looking forward, we expect the U.S. economy to expand at a rate of 3% or more, faster than the trajectory of the last several years, due to an uplift from a synchronized global recovery. Although interest rates remain very low in a historical context, monetary stimulus has peaked. We believe the Federal Reserve will gradually raise short term rates while buying fewer bonds. Meanwhile, corporate profits are growing at a robust pace and cash flows are being directed to capital expenditures, dividends, buybacks and acquisitions. The impact of tax reform being passed in the United States could drive further market upside, as companies direct their tax savings into profitable investments. Equity valuations remain high but the bull market may persist given the favorable macro conditions. Technology driven disruption remains abundant across the economy and is at the forefront of our fundamental research. Our opportunity set remains compelling and we expect stock selection can continue to drive our relative performance.
Investors should consider the Fund’s investment objective, risks, charges and expenses carefully before investing. The Fund’s prospectus and summary prospectus contain this and other information about the Fund, and may be obtained by asking your financial advisor or calling us at 1.800.988.8287. Read prospectuses and summary prospectuses carefully before investing.
Total returns include changes in share price and reinvestment of dividends and capital gains distributions in a hypothetical investment for the periods shown, but do not include the charges associated with the separate account products that offer this Fund.
The Fund’s investment strategy and focus can change over time. The mention of specific fund holdings does not constitute a recommendation by OppenheimerFunds, Inc. or its affiliates.
Shares of Oppenheimer funds are not deposits or obligations of any bank, are not guaranteed by any bank, are not insured by the FDIC or any other agency, and involve investment risks, including the possible loss of the principal amount invested.
Comparing the Fund’s Performance to the Market. The graphs that follow show the performance of a hypothetical $10,000 investment in each share class of the Fund held until December 31, 2017. Performance is measured over a ten-fiscal-year period for both Classes. Performance information does not reflect charges that apply to separate accounts investing in the Fund. If these charges were taken into account, performance would be lower. The graphs assume that all dividends and capital gains distributions were reinvested in additional shares.
The Fund’s performance is compared to the performance of the Russell Midcap Growth Index. The Russell Midcap Growth Index measures the performance of the mid-cap growth segment of the U.S. equity universe. It includes those Russell Midcap companies with higher price-to-book ratios and higher forecasted growth values. The Index is unmanaged and cannot be purchased directly by investors. While index comparisons may be useful to provide a benchmark for the Fund’s performance, it must be noted that the Fund’s investments are not limited to the investments comprising the Index. Index performance includes reinvestment of income, but does not reflect transaction costs, fees, expenses or taxes. Index performance is shown for illustrative purposes only as a benchmark for the Fund’s performance, and does not predict or depict performance of the Fund. The Fund’s performance reflects the effects of the Fund’s business and operating expenses.
4 OPPENHEIMER DISCOVERY MID CAP GROWTH FUND/VA
COMPARISON OF CHANGE IN VALUE OF $10,000 HYPOTHETICAL INVESTMENTS IN:
COMPARISON OF CHANGE IN VALUE OF $10,000 HYPOTHETICAL INVESTMENTS IN:
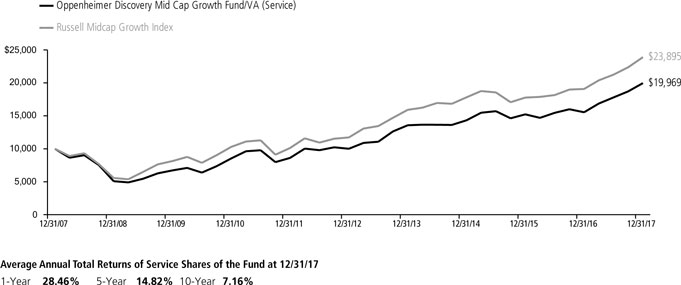
Performance data quoted represents past performance, which does not guarantee future results. The investment return and principal value of an investment in the Fund will fluctuate so that an investor’s shares, when redeemed, may be worth more or less than their original cost. Current performance may be lower or higher than the performance quoted. For performance data current to the most recent month end, call us at 1.800.988.8287. The Fund’s total returns should not be expected to be the same as the returns of other funds, whether or not both funds have the same portfolio managers and/or similar names. The Fund’s total returns include changes in share price and reinvested distributions but do not include the charges associated with the separate account products that offer this Fund. Such performance would have been lower if such charges were taken into account.
5 OPPENHEIMER DISCOVERY MID CAP GROWTH FUND/VA
Fund Expenses
Fund Expenses. As a shareholder of the Fund, you incur two types of costs: (1) transaction costs and (2) ongoing costs, including management fees; distribution and service fees; and other Fund expenses. These examples are intended to help you understand your ongoing costs (in dollars) of investing in the Fund and to compare these costs with the ongoing costs of investing in other mutual funds.
The examples are based on an investment of $1,000.00 invested at the beginning of the period and held for the entire 6-month period ended December 31, 2017.
Actual Expenses. The first section of the table provides information about actual account values and actual expenses. You may use the information in this section for the class of shares you hold, together with the amount you invested, to estimate the expense that you paid over the period. Simply divide your account value by $1,000.00 (for example, an $8,600.00 account value divided by $1,000.00 = 8.60), then multiply the result by the number in the first section under the heading entitled “Expenses Paid During 6 Months Ended December 31, 2017” to estimate the expenses you paid on your account during this period.
Hypothetical Example for Comparison Purposes.
The second section of the table provides information about hypothetical account values and hypothetical expenses based on the Fund’s actual expense ratio for each class of shares, and an assumed rate of return of 5% per year for each class before expenses, which is not the actual return. The hypothetical account values and expenses may not be used to estimate the actual ending account balance or expenses you paid for the period. You may use this information to compare the ongoing costs of investing in the Fund and other funds. To do so, compare this 5% hypothetical example for the class of shares you hold with the 5% hypothetical examples that appear in the shareholder reports of the other funds.
Please note that the expenses shown in the table are meant to highlight your ongoing costs only and do not reflect any charges associated with the separate accounts that offer this Fund. Therefore, the “hypothetical” lines of the table are useful in comparing ongoing costs only, and will not help you determine the relative total costs of owning different funds. In addition, if these separate account charges were included your costs would have been higher.
| | | | | | | | | | | | | | | | |
| Actual | | Beginning Account Value July 1, 2017 | | | Ending Account Value
December 31, 2017 | | | Expenses Paid During 6 Months Ended
December 31, 2017 | |
Non-Service shares | | $ | 1,000.00 | | | $ | 1,124.00 | | | $ | 4.29 | | | | | |
Service shares | | | 1,000.00 | | | | 1,122.40 | | | | 5.63 | | | | | |
| |
| Hypothetical | | | | |
| (5% return before expenses) | | | | | | | | | | | | |
Non-Service shares | | | 1,000.00 | | | | 1,021.17 | | | | 4.08 | | | | | |
Service shares | | | 1,000.00 | | | | 1,019.91 | | | | 5.36 | | | | | |
Expenses are equal to the Fund’s annualized expense ratio for that class, multiplied by the average account value over the period, multiplied by 184/365 (to reflect the one-half year period). Those annualized expense ratios, excluding indirect expenses from affiliated funds, based on the 6-month period ended December 31, 2017 are as follows:
| | | | | | | | |
| Class | | Expense Ratios | | | | |
Non-Service shares | | | 0.80% | | | | | |
Service shares | | | 1.05 | | | | | |
The expense ratios reflect voluntary and/or contractual waivers and/or reimbursements of expenses by the Fund’s Manager. Some of these undertakings may be modified or terminated at any time, as indicated in the Fund’s prospectus. The “Financial Highlights” tables in the Fund’s financial statements, included in this report, also show the gross expense ratios, without such waivers or reimbursements and reduction to custodian expenses, if applicable.
6 OPPENHEIMER DISCOVERY MID CAP GROWTH FUND/VA
STATEMENT OF INVESTMENTS December 31, 2017
| | | | | | | | | | | | |
| | | Shares | | | Value | | | | |
| | | | | |
| Common Stocks—98.7% | | | | | | | | | |
| | | | | |
| Consumer Discretionary—15.3% | | | | | | | | | |
| | | | | |
| Auto Components—1.7% | | | | | | | | | |
| | | | | |
| Aptiv plc | | | 85,380 | | | $ | 7,242,785 | | | | | |
| | | | | |
| Visteon Corp.1 | | | 42,350 | | | | 5,299,679 | | | | | |
| | | | | | | | | | | | |
| | | | | | | 12,542,464 | | | | | |
| |
| | | | | |
| Distributors—1.3% | | | | | | | | | |
| | | | | |
| Pool Corp. | | | 70,720 | | | | 9,168,848 | | | | | |
| |
| | | | | |
| Hotels, Restaurants & Leisure—6.1% | | | | | | | | | |
| | | | | |
| Hilton Worldwide Holdings, Inc. | | | 134,453 | | | | 10,737,416 | | | | | |
| | | | | |
| Restaurant Brands International, Inc. | | | 148,420 | | | | 9,124,862 | | | | | |
| | | | | |
| Royal Caribbean Cruises Ltd. | | | 79,390 | | | | 9,469,639 | | | | | |
| | | | | |
| Vail Resorts, Inc. | | | 47,680 | | | | 10,130,570 | | | | | |
| | | | | |
| Wynn Resorts Ltd. | | | 33,510 | | | | 5,649,451 | | | | | |
| | | | | | | | | | | | |
| | | | | | | 45,111,938 | | | | | |
| |
| | | | | |
| Household Durables—3.0% | | | | | | | | | |
| | | | | |
| DR Horton, Inc. | | | 219,160 | | | | 11,192,501 | | | | | |
| | | | | |
| Mohawk Industries, Inc.1 | | | 21,000 | | | | 5,793,900 | | | | | |
| | | | | |
| NVR, Inc.1 | | | 1,320 | | | | 4,630,851 | | | | | |
| | | | | | | | | | | | |
| | | | | | | 21,617,252 | | | | | |
| |
| | | | | |
| Multiline Retail—1.0% | | | | | | | | | |
| | | | | |
| Dollar Tree, Inc.1 | | | 67,280 | | | | 7,219,817 | | | | | |
| |
| | | | | |
| Specialty Retail—1.0% | | | | | | | | | |
| | | | | |
| Ross Stores, Inc. | | | 94,960 | | | | 7,620,540 | | | | | |
| |
| | | | | |
| Textiles, Apparel & Luxury Goods—1.2% | | | | | | | | | |
| | | | | |
| lululemon athletica, Inc.1 | | | 23,940 | | | | 1,881,444 | | | | | |
| | | | | |
| PVH Corp. | | | 49,060 | | | | 6,731,523 | | | | | |
| | | | | | | | | | | | |
| | | | | | | 8,612,967 | | | | | |
| |
| | | | | |
| Consumer Staples—2.5% | | | | | | | | | |
| | | | | |
| Beverages—1.5% | | | | | | | | | |
| | | | | |
| Constellation Brands, Inc., Cl. A | | | 46,690 | | | | 10,671,933 | | | | | |
| |
| | | | | |
| Food Products—1.0% | | | | | | | | | |
| | | | | |
| Lamb Weston Holdings, Inc. | | | 134,680 | | | | 7,602,686 | | | | | |
| |
| | | | | |
| Energy—2.1% | | | | | | | | | |
| | | | | |
| Energy Equipment & Services—0.6% | | | | | | | | | |
| | | | | |
| RPC, Inc. | | | 179,340 | | | | 4,578,550 | | | | | |
| |
| | | | | |
| Oil, Gas & Consumable Fuels—1.5% | | | | | | | | | |
| | | | | |
| Diamondback Energy, Inc.1 | | | 87,983 | | | | 11,107,854 | | | | | |
| |
| | | | | |
| Financials—12.7% | | | | | | | | | |
| | | | | |
| Capital Markets—5.5% | | | | | | | | | |
| | | | | |
| Cboe Global Markets, Inc. | | | 76,000 | | | | 9,468,840 | | | | | |
| | | | | |
| E*TRADE Financial Corp.1 | | | 197,900 | | | | 9,809,903 | | | | | |
| | | | | |
| MarketAxess Holdings, Inc. | | | 18,530 | | | | 3,738,428 | | | | | |
| | | | | |
| MSCI, Inc., Cl. A | | | 64,510 | | | | 8,163,095 | | | | | |
| | | | | |
| Raymond James Financial, Inc. | | | 105,460 | | | | 9,417,578 | | | | | |
| | | | | | | | | | | | |
| | | | | | | 40,597,844 | | | | | |
| |
| | | | | |
| Commercial Banks—2.1% | | | | | | | | | |
| | | | | |
| First Republic Bank | | | 41,480 | | | | 3,593,827 | | | | | |
| | | | | |
| SVB Financial Group1 | | | 49,490 | | | | 11,569,277 | | | | | |
| | | | | | | | | | | | |
| | | | | | | 15,163,104 | | | | | |
| |
| | | | | |
| Insurance—2.2% | | | | | | | | | |
| | | | | |
| Arch Capital Group Ltd.1 | | | 35,630 | | | | 3,234,135 | | | | | |
| | | | | |
| Athene Holding Ltd., Cl. A1 | | | 101,130 | | | | 5,229,432 | | | | | |
| | | | | |
| Progressive Corp. (The) | | | 133,930 | | | | 7,542,938 | | | | | |
| | | | | | | | | | | | |
| | | | | | | 16,006,505 | | | | | |
| |
| | | | | |
| Real Estate Investment Trusts (REITs)—2.9% | | | | | | | | | |
| | | | | |
| Equinix, Inc. | | | 24,810 | | | | 11,244,388 | | | | | |
| | | | | |
| SBA Communications Corp., Cl. A1 | | | 63,680 | | | | 10,402,765 | | | | | |
| | | | | | | | | | | | |
| | | | | | | 21,647,153 | | | | | |
| |
| | | | | |
| Health Care—14.3% | | | | | | | | | |
| | | | | |
| Biotechnology—1.3% | | | | | | | | | |
| | | | | |
| Exelixis, Inc.1 | | | 156,370 | | | | 4,753,648 | | | | | |
| | | | | | | | |
| | | Shares | | | Value | |
| |
| Biotechnology (Continued) | | | | | |
| |
| Neurocrine Biosciences, Inc.1 | | | 57,600 | | | $ | 4,469,184 | |
| | | | | | | | |
| | | | | | | 9,222,832 | |
|
| |
| Health Care Equipment & Supplies—5.6% | | | | | |
| |
| ABIOMED, Inc.1 | | | 32,250 | | | | 6,043,972 | |
| |
| Align Technology, Inc.1 | | | 45,120 | | | | 10,025,213 | |
| |
| Cooper Cos., Inc. (The) | | | 23,950 | | | | 5,218,226 | |
| |
| IDEXX Laboratories, Inc.1 | | | 53,310 | | | | 8,336,618 | |
| |
| Intuitive Surgical, Inc.1 | | | 15,100 | | | | 5,510,594 | |
| |
| Teleflex, Inc. | | | 23,050 | | | | 5,735,301 | |
| | | | | | | | |
| | | | | | | 40,869,924 | |
|
| |
| Health Care Providers & Services—0.7% | | | | | |
| |
| WellCare Health Plans, Inc.1 | | | 27,320 | | | | 5,494,325 | |
|
| |
| Health Care Technology—0.9% | | | | | |
| |
| Veeva Systems, Inc., Cl. A1 | | | 121,370 | | | | 6,709,334 | |
|
| |
| Life Sciences Tools & Services—4.4% | | | | | |
| |
| Agilent Technologies, Inc. | | | 160,470 | | | | 10,746,676 | |
| |
| Bio-Rad Laboratories, Inc., Cl. A1 | | | 15,410 | | | | 3,677,905 | |
| |
| ICON plc1 | | | 63,620 | | | | 7,134,983 | |
| |
| Mettler-Toledo International, Inc.1 | | | 17,500 | | | | 10,841,600 | |
| | | | | | | | |
| | | | | | | 32,401,164 | |
|
| |
| Pharmaceuticals—1.4% | | | | | |
| |
| Catalent, Inc.1 | | | 126,950 | | | | 5,215,106 | |
| |
| Zoetis, Inc., Cl. A | | | 68,960 | | | | 4,967,878 | |
| | | | | | | | |
| | | | | | | 10,182,984 | |
|
| |
| Industrials—20.4% | | | | | |
| |
| Aerospace & Defense—1.7% | | | | | |
| |
| BWX Technologies, Inc. | | | 87,080 | | | | 5,267,469 | |
| |
| L3 Technologies, Inc. | | | 36,650 | | | | 7,251,203 | |
| | | | | | | | |
| | | | | | | 12,518,672 | |
|
| |
| Air Freight & Couriers—2.0% | | | | | |
| |
| XPO Logistics, Inc.1 | | | 161,730 | | | | 14,812,851 | |
| |
| Building Products—2.3% | | | | | |
| |
| A.O. Smith Corp. | | | 139,220 | | | | 8,531,402 | |
| |
| Owens Corning | | | 90,810 | | | | 8,349,071 | |
| | | | | | | | |
| | | | | | | 16,880,473 | |
|
| |
| Commercial Services & Supplies—2.8% | | | | | |
| |
| Copart, Inc.1 | | | 220,520 | | | | 9,524,259 | |
| |
| Waste Connections, Inc. | | | 156,005 | | | | 11,066,994 | |
| | | | | | | | |
| | | | | | | 20,591,253 | |
|
| |
| Construction & Engineering—1.1% | | | | | |
| |
| Quanta Services, Inc.1 | | | 204,350 | | | | 7,992,128 | |
|
| |
| Electrical Equipment—1.5% | | | | | |
| |
| Rockwell Automation, Inc. | | | 56,070 | | | | 11,009,345 | |
|
| |
| Industrial Conglomerates—1.2% | | | | | |
| |
| Roper Technologies, Inc. | | | 35,070 | | | | 9,083,130 | |
|
| |
| Machinery—4.6% | | | | | |
| |
| IDEX Corp. | | | 58,960 | | | | 7,780,951 | |
| |
| Oshkosh Corp. | | | 81,480 | | | | 7,405,717 | |
| |
| WABCO Holdings, Inc.1 | | | 70,670 | | | | 10,141,145 | |
| |
| Xylem, Inc. | | | 120,940 | | | | 8,248,108 | |
| | | | | | | | |
| | | | | | | 33,575,921 | |
|
| |
| Professional Services—1.1% | | | | | |
| |
| TransUnion1 | | | 151,190 | | | | 8,309,402 | |
|
| |
| Road & Rail—0.8% | | | | | |
| |
Knight-Swift Transportation
Holdings, Inc., Cl. A | | | 128,380 | | | | 5,612,774 | |
|
| |
| Trading Companies & Distributors—1.3% | | | | | |
| |
| United Rentals, Inc.1 | | | 54,080 | | | | 9,296,893 | |
|
| |
| Information Technology—25.0% | | | | | |
| |
| Electronic Equipment, Instruments, & Components—4.6% | |
| |
| Amphenol Corp., Cl. A | | | 123,120 | | | | 10,809,936 | |
7 OPPENHEIMER DISCOVERY MID CAP GROWTH FUND/VA
STATEMENT OF INVESTMENTS Continued
| | | | | | | | |
| | | Shares | | | Value | |
| |
| Electronic Equipment, Instruments, & Components (Continued) | |
| |
CDW Corp. | | | 109,990 | | | $ | 7,643,205 | |
| |
Cognex Corp. | | | 116,300 | | | | 7,112,908 | |
| |
Trimble, Inc.1 | | | 203,270 | | | | 8,260,893 | |
| | | | | | | | |
| | | | | | | 33,826,942 | |
|
| |
Internet Software & Services—2.4% | | | | | |
| |
CoStar Group, Inc.1 | | | 24,660 | | | | 7,322,787 | |
| |
IAC/InterActiveCorp1 | | | 43,120 | | | | 5,272,713 | |
| |
MercadoLibre, Inc. | | | 15,410 | | | | 4,848,911 | |
| | | | | | | | |
| | | | | | | 17,444,411 | |
|
| |
IT Services—4.7% | | | | | |
| |
Black Knight, Inc.1 | | | 84,820 | | | | 3,744,803 | |
| |
DXC Technology Co. | | | 102,300 | | | | 9,708,270 | |
| |
Global Payments, Inc. | | | 95,680 | | | | 9,590,963 | |
| |
Total System Services, Inc. | | | 142,860 | | | | 11,298,798 | |
| | | | | | | | |
| | | | | | | 34,342,834 | |
|
| |
Semiconductors & Semiconductor Equipment—5.2% | |
| |
Lam Research Corp. | | | 54,450 | | | | 10,022,611 | |
| |
Microchip Technology, Inc. | | | 116,950 | | | | 10,277,566 | |
| |
Monolithic Power Systems, Inc. | | | 32,260 | | | | 3,624,734 | |
| |
ON Semiconductor Corp.1 | | | 271,910 | | | | 5,693,795 | |
| |
Teradyne, Inc. | | | 216,880 | | | | 9,080,766 | |
| | | | | | | | |
| | | | | | | 38,699,472 | |
|
| |
Software—8.1% | | | | | |
| |
Atlassian Corp. plc, Cl. A1 | | | 71,330 | | | | 3,246,942 | |
| |
Autodesk, Inc.1 | | | 50,820 | | | | 5,327,460 | |
| |
PTC, Inc.1 | | | 94,110 | | | | 5,719,065 | |
| | | | | | | | |
| | | Shares | | | Value | |
| |
Software (Continued) | | | | | |
| |
Red Hat, Inc.1 | | | 101,530 | | | $ | 12,193,753 | |
| |
ServiceNow, Inc.1 | | | 76,994 | | | | 10,039,248 | |
| |
Synopsys, Inc.1 | | | 80,600 | | | | 6,870,344 | |
| |
Take-Two Interactive Software, Inc.1 | | | 86,230 | | | | 9,466,329 | |
| |
Workday, Inc., Cl. A1 | | | 65,050 | | | | 6,618,187 | |
| | | | | | | | |
| | | | | | | 59,481,328 | |
|
| |
Materials—6.4% | | | | | |
| |
Chemicals—3.8% | | | | | |
| |
Albemarle Corp. | | | 56,960 | | | | 7,284,615 | |
| |
Celanese Corp., Cl. A | | | 67,280 | | | | 7,204,342 | |
| |
FMC Corp. | | | 61,170 | | | | 5,790,352 | |
| |
Westlake Chemical Corp. | | | 67,330 | | | | 7,172,665 | |
| | | | | | | | |
| | | | | | | 27,451,974 | |
|
| |
Containers & Packaging—2.0% | | | | | |
| |
Avery Dennison Corp. | | | 57,720 | | | | 6,629,719 | |
| |
Packaging Corp. of America | | | 66,470 | | | | 8,012,959 | |
| | | | | | | | |
| | | | | | | 14,642,678 | |
|
| |
Metals & Mining—0.6% | | | | | |
| |
Steel Dynamics, Inc. | | | 107,080 | | | | 4,618,360 | |
| | | | | | | | |
Total Common Stocks (Cost $558,970,346) | | | | 724,340,859 | |
|
| | |
| |
| Investment Company—1.0% | | | | | |
| |
| Oppenheimer Institutional Government Money Market Fund, Cl. E, 1.22%2,3 (Cost $7,573,590) | | | 7,573,590 | | | | 7,573,590 | |
| |
| Total Investments, at Value (Cost $566,543,936) | | | 99.7% | | | | 731,914,449 | |
| |
Net Other Assets (Liabilities) | | | 0.3 | | | | 2,359,136 | |
| | | | |
Net Assets | | | 100.0% | | | $ | 734,273,585 | |
| | | | |
Footnotes to Statement of Investments
1. Non-income producing security.
2. Rate shown is the 7-day yield at period end.
3. Is or was an affiliate, as defined in the Investment Company Act of 1940, as amended, at or during the reporting period, by virtue of the Fund owning at least 5% of the voting securities of the issuer or as a result of the Fund and the issuer having the same investment adviser. Transactions during the reporting period in which the issuer was an affiliate are as follows:
| | | | | | | | | | | | | | | | |
| | | Shares
December 31, 2016 | | | Gross
Additions | | | Gross
Reductions | | | Shares
December 31, 2017 | |
| |
| Oppenheimer Institutional Government Money Market Fund, Cl. E | | | 21,498,967 | | | | 277,704,583 | | | | 291,629,960 | | | | 7,573,590 | |
| | | | |
| | | Value | | | Income | | | Realized Gain (Loss) | | | Change in Unrealized
Gain (Loss) | |
| |
| Oppenheimer Institutional Government Money Market Fund, Cl. E | | $ | 7,573,590 | | | $ | 103,497 | | | $ | — | | | $ | — | |
See accompanying Notes to Financial Statements.
8 OPPENHEIMER DISCOVERY MID CAP GROWTH FUND/VA
STATEMENT OF ASSETS AND LIABILITIES December 31, 2017
| | | | |
| |
Assets | | | | |
Investments, at value—see accompanying statement of investments: | | | | |
Unaffiliated companies (cost $558,970,346) | | $ | 724,340,859 | |
Affiliated companies (cost $7,573,590) | | | 7,573,590 | |
| | | | |
| | | 731,914,449 | |
| |
Cash | | | 500,000 | |
| |
Receivables and other assets: | | | | |
Investments sold | | | 1,839,423 | |
Dividends | | | 362,838 | |
Shares of beneficial interest sold | | | 102,121 | |
Other | | | 69,101 | |
| | | | |
Total assets | | | 734,787,932 | |
| |
Liabilities | | | | |
Payables and other liabilities: | | | | |
Shares of beneficial interest redeemed | | | 393,059 | |
Trustees’ compensation | | | 58,125 | |
Shareholder communications | | | 17,009 | |
Distribution and service plan fees | | | 8,380 | |
Other | | | 37,774 | |
| | | | |
Total liabilities | | | 514,347 | |
| |
Net Assets | | $ | 734,273,585 | |
| | | | |
|
| |
Composition of Net Assets | | | | |
Par value of shares of beneficial interest | | $ | 8,745 | |
| |
Additional paid-in capital | | | 468,328,663 | |
| |
Accumulated net investment loss | | | (58,125) | |
| |
Accumulated net realized gain on investments | | | 100,623,789 | |
| |
Net unrealized appreciation on investments | | | 165,370,513 | |
| | | | |
Net Assets | | $ | 734,273,585 | |
| | | | |
|
| |
Net Asset Value Per Share | | | | |
Non-Service Shares: | | | | |
| Net asset value, redemption price per share and offering price per share (based on net assets of $694,675,055 and 8,249,616 shares of beneficial interest outstanding) | | | $84.21 | |
| |
| |
Service Shares: | | | | |
| |
| Net asset value, redemption price per share and offering price per share (based on net assets of $39,598,530 and 495,758 shares of beneficial interest outstanding) | | | $79.87 | |
See accompanying Notes to Financial Statements.
9 OPPENHEIMER DISCOVERY MID CAP GROWTH FUND/VA
STATEMENT OF OPERATIONS For the Year Ended December 31, 2017
| | | | |
| |
Investment Income | | | | |
Dividends: | | | | |
Unaffiliated companies (net of foreign withholding taxes of $37,642) | | $ | 4,638,316 | |
Affiliated companies | | | 103,497 | |
| | | | |
Total investment income | | | 4,741,813 | |
|
| |
Expenses | | | | |
Management fees | | | 4,955,861 | |
| |
Distribution and service plan fees — service shares | | | 89,281 | |
| |
Transfer and shareholder servicing agent fees: | | | | |
Non-Service shares | | | 660,619 | |
Service shares | | | 35,724 | |
| |
Shareholder communications: | | | | |
Non-Service shares | | | 48,071 | |
Service shares | | | 2,591 | |
| |
Trustees’ compensation | | | 27,421 | |
| |
Borrowing fees | | | 18,665 | |
| |
Custodian fees and expenses | | | 4,658 | |
| |
Other | | | 85,280 | |
| | | | |
Total expenses | | | 5,928,171 | |
Less reduction to custodian expenses | | | (429) | |
Less waivers and reimbursements of expenses | | | (249,055) | |
| | | | |
Net expenses | | | 5,678,687 | |
|
| |
Net Investment Loss | | | (936,874) | |
|
| |
Realized and Unrealized Gain | | | | |
Net realized gain on investment transactions in unaffiliated companies | | | 111,170,933 | |
| |
Net change in unrealized appreciation/depreciation on investment transactions in unaffiliated companies | | | 64,493,500 | |
| |
Net Increase in Net Assets Resulting from Operations | | $ | 174,727,559 | |
| | | | |
See accompanying Notes to Financial Statements.
10 OPPENHEIMER DISCOVERY MID CAP GROWTH FUND/VA
STATEMENTS OF CHANGES IN NET ASSETS
| | | | | | | | |
| | | Year Ended
December 31, 2017 | | | Year Ended
December 31, 2016 | |
| |
Operations | | | | | | | | |
Net investment income (loss) | | $ | (936,874) | | | $ | 192,842 | |
| |
Net realized gain | | | 111,170,933 | | | | 74,319,102 | |
| |
Net change in unrealized appreciation/depreciation | | | 64,493,500 | | | | (60,542,760) | |
| | | | |
Net increase in net assets resulting from operations | | | 174,727,559 | | | | 13,969,184 | |
|
| |
Dividends and/or Distributions to Shareholders | | | | | | | | |
Dividends from net investment income: | | | | | | | | |
Non-Service shares | | | (202,565) | | | | — | |
Service shares | | | — | | | | — | |
| | | | |
| | | (202,565) | | | | — | |
|
| |
Distributions from net realized gain: | | | | | | | | |
Non-Service shares | | | (66,541,431) | | | | (48,415,668) | |
Service shares | | | (3,695,269) | | | | (2,737,189) | |
| | | | |
| | | (70,236,700) | | | | (51,152,857) | |
|
| |
Beneficial Interest Transactions | | | | | | | | |
Net increase (decrease) in net assets resulting from beneficial interest transactions: | | | | | | | | |
Non-Service shares | | | (8,172,895) | | | | (21,717,260) | |
Service shares | | | 2,197,994 | | | | (2,617,902) | |
| | | | |
| | | (5,974,901) | | | | (24,335,162) | |
|
| |
Net Assets | | | | | | | | |
Total increase (decrease) | | | 98,313,393 | | | | (61,518,835) | |
| |
Beginning of period | | | 635,960,192 | | | | 697,479,027 | |
| | | | |
End of period (including accumulated net investment income (loss) of $(58,125) and $154,168, respectively) | | $ | 734,273,585 | | | $ | 635,960,192 | |
| | | | |
See accompanying Notes to Financial Statements.
11 OPPENHEIMER DISCOVERY MID CAP GROWTH FUND/VA
FINANCIAL HIGHLIGHTS
| | | | | | | | | | | | | | | | | | | | |
| Non-Service Shares | | Year Ended
December 31,
2017 | | | Year Ended
December 31,
2016 | | | Year Ended
December 31,
2015 | | | Year Ended
December 31,
2014 | | | Year Ended
December 31,
2013 | |
| |
Per Share Operating Data | | | | | | | | | | | | | | | | | | | | |
Net asset value, beginning of period | | | $72.65 | | | | $76.85 | | | | $78.82 | | | | $74.51 | | | | $54.80 | |
| |
Income (loss) from investment operations: | | | | | | | | | | | | | | | | | | | | |
Net investment income (loss)1 | | | (0.10) | | | | 0.03 | | | | (0.19) | | | | (0.29) | | | | (0.16) | |
Net realized and unrealized gain | | | 20.08 | | | | 1.69 | | | | 5.67 | | | | 4.60 | | | | 19.88 | |
| | | | |
Total from investment operations | | | 19.98 | | | | 1.72 | | | | 5.48 | | | | 4.31 | | | | 19.72 | |
| |
Dividends and/or distributions to shareholders: | | | | | | | | | | | | | | | | | | | | |
Dividends from net investment income | | | (0.03) | | | | 0.00 | | | | 0.00 | | | | 0.00 | | | | (0.01) | |
Distributions from net realized gain | | | (8.39) | | | | (5.92) | | | | (7.45) | | | | 0.00 | | | | 0.00 | |
| | | | |
Total dividends and/or distributions to shareholders | | | (8.42) | | | | (5.92) | | | | (7.45) | | | | 0.00 | | | | (0.01) | |
| |
Net asset value, end of period | | | $84.21 | | | | $72.65 | | | | $76.85 | | | | $78.82 | | | | $74.51 | |
| | | | |
| | | | | | | | | | | | | | | | | | | | |
| |
Total Return, at Net Asset Value2 | | | 28.79% | | | | 2.34% | | | | 6.61% | | | | 5.78% | | | | 35.98% | |
| | | | | | | | | | | | | | | | | | | | |
| |
Ratios/Supplemental Data | | | | | | | | | | | | | | | | | | | | |
Net assets, end of period (in thousands) | | | $694,675 | | | | $603,708 | | | | $660,450 | | | | $682,515 | | | | $725,406 | |
| |
Average net assets (in thousands) | | | $661,192 | | | | $621,110 | | | | $695,736 | | | | $688,259 | | | | $618,970 | |
| |
Ratios to average net assets:3 | | | | | | | | | | | | | | | | | | | | |
Net investment income (loss) | | | (0.12)% | | | | 0.04% | | | | (0.24)% | | | | (0.39)% | | | | (0.24)% | |
Expenses excluding specific expenses listed below | | | 0.84% | | | | 0.84% | | | | 0.83% | | | | 0.83% | | | | 0.84% | |
Interest and fees from borrowings | | | 0.00%4 | | | | 0.00%4 | | | | 0.00%4 | | | | 0.00% | | | | 0.00% | |
| | | | |
Total expenses5 | | | 0.84% | | | | 0.84% | | | | 0.83% | | | | 0.83% | | | | 0.84% | |
| Expenses after payments, waivers and/or reimbursements and reduction to custodian expenses | | | 0.80% | | | | 0.80% | | | | 0.80% | | | | 0.80% | | | | 0.80% | |
| |
Portfolio turnover rate | | | 105% | | | | 141% | | | | 81% | | | | 113% | | | | 84% | |
1. Per share amounts calculated based on the average shares outstanding during the period.
2. Assumes an initial investment on the business day before the first day of the fiscal period, with all dividends and distributions reinvested in additional shares on the reinvestment date, and redemption at the net asset value calculated on the last business day of the fiscal period. Total returns are not annualized for periods less than one full year. Total return information does not reflect expenses that apply at the separate account level or to related insurance products. Inclusion of these charges would reduce the total return figures for all periods shown. Returns do not reflect the deduction of taxes that a shareholder would pay on fund distributions or the redemption of fund shares.
3. Annualized for periods less than one full year.
4. Less than 0.005%.
5. Total expenses including indirect expenses from affiliated fund fees and expenses were as follows:
| | | | | | |
| | Year Ended December 31, 2017 | | | 0.84 | % |
| | Year Ended December 31, 2016 | | | 0.84 | % |
| | Year Ended December 31, 2015 | | | 0.83 | % |
| | Year Ended December 31, 2014 | | | 0.83 | % |
| | Year Ended December 31, 2013 | | | 0.84 | % |
See accompanying Notes to Financial Statements.
12 OPPENHEIMER DISCOVERY MID CAP GROWTH FUND/VA
| | | | | | | | | | | | | | | | | | |
| Service Shares | | Year Ended
December 31,
2017 | | | Year Ended
December 31,
2016 | | | Year Ended
December 31,
2015 | | | Year Ended
December 31,
2014 | | | Year Ended
December 31,
2013 |
|
Per Share Operating Data | | | | | | | | | | | | | | | | | | |
Net asset value, beginning of period | | | $69.43 | | | | $73.88 | | | | $76.21 | | | | $72.22 | | | $53.25 |
|
Income (loss) from investment operations: | | | | | | | | | | | | | | | | | | |
Net investment loss1 | | | (0.28) | | | | (0.15) | | | | (0.38) | | | | (0.46) | | | (0.30) |
Net realized and unrealized gain | | | 19.11 | | | | 1.62 | | | | 5.50 | | | | 4.45 | | | 19.27 |
| | | |
Total from investment operations | | | 18.83 | | | | 1.47 | | | | 5.12 | | | | 3.99 | | | 18.97 |
|
Dividends and/or distributions to shareholders: | | | | | | | | | | | | | | | | | | |
Dividends from net investment income | | | 0.00 | | | | 0.00 | | | | 0.00 | | | | 0.00 | | | 0.00 |
Distributions from net realized gain | | | (8.39) | | | | (5.92) | | | | (7.45) | | | | 0.00 | | | 0.00 |
| | | |
Total dividends and/or distributions to shareholders | | | (8.39) | | | | (5.92) | | | | (7.45) | | | | 0.00 | | | 0.00 |
|
Net asset value, end of period | | | $79.87 | | | | $69.43 | | | | $73.88 | | | | $76.21 | | | $72.22 |
| | | |
| | | | | | | | | | | | | | | | | | |
|
Total Return, at Net Asset Value2 | | | 28.46% | | | | 2.08% | | | | 6.35% | | | | 5.53% | | | 35.62% |
| | | | | | | | | | | | | | | | | | |
|
Ratios/Supplemental Data | | | | | | | | | | | | | | | | | | |
Net assets, end of period (in thousands) | | | $39,599 | | | | $32,252 | | | | $37,029 | | | | $30,964 | | | $36,549 |
|
Average net assets (in thousands) | | | $35,753 | | | | $33,797 | | | | $32,812 | | | | $32,927 | | | $35,905 |
|
Ratios to average net assets:3 | | | | | | | | | | | | | | | | | | |
Net investment loss | | | (0.37)% | | | | (0.21)% | | | | (0.49)% | | | | (0.64)% | | | (0.49)% |
Expenses excluding specific expenses listed below | | | 1.09% | | | | 1.09% | | | | 1.08% | | | | 1.08% | | | 1.09% |
Interest and fees from borrowings | | | 0.00%4 | | | | 0.00%4 | | | | 0.00%4 | | | | 0.00% | | | 0.00% |
| | | |
Total expenses5 | | | 1.09% | | | | 1.09% | | | | 1.08% | | | | 1.08% | | | 1.09% |
| Expenses after payments, waivers and/or reimbursements and reduction to custodian expenses | | | 1.05% | | | | 1.05% | | | | 1.05% | | | | 1.05% | | | 1.05% |
|
Portfolio turnover rate | | | 105% | | | | 141% | | | | 81% | | | | 113% | | | 84% |
1. Per share amounts calculated based on the average shares outstanding during the period.
2. Assumes an initial investment on the business day before the first day of the fiscal period, with all dividends and distributions reinvested in additional shares on the reinvestment date, and redemption at the net asset value calculated on the last business day of the fiscal period. Total returns are not annualized for periods less than one full year. Total return information does not reflect expenses that apply at the separate account level or to related insurance products. Inclusion of these charges would reduce the total return figures for all periods shown. Returns do not reflect the deduction of taxes that a shareholder would pay on fund distributions or the redemption of fund shares.
3. Annualized for periods less than one full year.
4. Less than 0.005%.
5. Total expenses including indirect expenses from affiliated fund fees and expenses were as follows:
| | | | | | |
| | Year Ended December 31, 2017 | | | 1.09 | % |
| | Year Ended December 31, 2016 | | | 1.09 | % |
| | Year Ended December 31, 2015 | | | 1.08 | % |
| | Year Ended December 31, 2014 | | | 1.08 | % |
| | Year Ended December 31, 2013 | | | 1.09 | % |
See accompanying Notes to Financial Statements.
13 OPPENHEIMER DISCOVERY MID CAP GROWTH FUND/VA
NOTES TO FINANCIAL STATEMENTS December 31, 2017
1. Organization
Oppenheimer Discovery Mid Cap Growth Fund/VA (the “Fund”), a separate series of Oppenheimer Variable Account Funds, is a diversified open-end management investment company registered under the Investment Company Act of 1940 (“1940 Act”), as amended. The Fund’s investment objective is to seek capital appreciation. The Fund’s investment adviser is OFI Global Asset Management, Inc. (“OFI Global” or the “Manager”), a wholly-owned subsidiary of OppenheimerFunds, Inc. (“OFI” or the “Sub-Adviser”). The Manager has entered into a sub-advisory agreement with OFI. Shares of the Fund are sold only to separate accounts of life insurance companies.
The Fund offers two classes of shares. Both classes are sold at their offering price, which is the net asset value per share, to separate investment accounts of participating insurance companies as an underlying investment for variable life insurance policies, variable annuity contracts or other investment products. The class of shares designated as Service shares is subject to a distribution and service plan. Both classes of shares have identical rights and voting privileges with respect to the Fund in general and exclusive voting rights on matters that affect that class alone. Earnings, net assets and net asset value per share may differ due to each class having its own expenses, such as transfer and shareholder servicing agent fees and shareholder communications, directly attributable to that class.
The following is a summary of significant accounting policies followed in the Fund’s preparation of financial statements in accordance with accounting principles generally accepted in the United States (“U.S. GAAP”).
2. Significant Accounting Policies
Security Valuation. All investments in securities are recorded at their estimated fair value, as described in Note 3.
Allocation of Income, Expenses, Gains and Losses. Income, expenses (other than those attributable to a specific class), gains and losses are allocated on a daily basis to each class of shares based upon the relative proportion of net assets represented by such class. Operating expenses directly attributable to a specific class are charged against the operations of that class.
Dividends and Distributions to Shareholders. Dividends and distributions to shareholders, which are determined in accordance with income tax regulations and may differ from U.S. GAAP, are recorded on the ex-dividend date. Income and capital gain distributions, if any, are declared and paid annually or at other times as determined necessary by the Manager.
Investment Income. Dividend income is recorded on the ex-dividend date or upon ex-dividend notification in the case of certain foreign dividends where the ex-dividend date may have passed. Non-cash dividends included in dividend income, if any, are recorded at the fair value of the securities received. Withholding taxes on foreign dividends, if any, and capital gains taxes on foreign investments, if any, have been provided for in accordance with the Fund’s understanding of the applicable tax rules and regulations. Interest income, if any, is recognized on an accrual basis. Discount and premium, which are included in interest income on the Statement of Operations, are amortized or accreted daily.
Return of Capital Estimates. Distributions received from the Fund’s investments in Real Estate Investments Trusts (REITs), generally are comprised of income and return of capital. The Fund records investment income and return of capital based on estimates. Such estimates are based on historical information available from each REIT and other industry sources. These estimates may subsequently be revised based on information received from REITs after their tax reporting periods are concluded.
Custodian Fees. “Custodian fees and expenses” in the Statement of Operations may include interest expense incurred by the Fund on any cash overdrafts of its custodian account during the period. Such cash overdrafts may result from the effects of failed trades in portfolio securities and from cash outflows resulting from unanticipated shareholder redemption activity. The Fund pays interest to its custodian on such cash overdrafts, to the extent they are not offset by positive cash balances maintained by the Fund, at a rate equal to the Federal Funds Rate plus 2.00%. The “Reduction to custodian expenses” line item, if applicable, represents earnings on cash balances maintained by the Fund during the period. Such interest expense and other custodian fees may be paid with these earnings.
Security Transactions. Security transactions are recorded on the trade date. Realized gains and losses on securities sold are determined on the basis of identified cost.
Indemnifications. The Fund’s organizational documents provide current and former Trustees and officers with a limited indemnification against liabilities arising in connection with the performance of their duties to the Fund. In the normal course of business, the Fund may also enter into contracts that provide general indemnifications. The Fund’s maximum exposure under these arrangements is unknown as this would be dependent on future claims that may be made against the Fund. The risk of material loss from such claims is considered remote.
Federal Taxes. The Fund intends to comply with provisions of the Internal Revenue Code applicable to regulated investment companies and to distribute substantially all of its investment company taxable income, including any net realized gain on investments not offset by capital loss carryforwards, if any, to shareholders. Therefore, no federal income or excise tax provision is required. The Fund files income tax returns in U.S. federal and applicable state jurisdictions. The statute of limitations on the Fund’s tax return filings generally remains open for the three preceding fiscal reporting period ends. The Fund has analyzed its tax positions for the fiscal year ended December 31, 2017, including open tax years, and does not believe there are any uncertain tax positions requiring recognition in the Fund’s financial statements.
14 OPPENHEIMER DISCOVERY MID CAP GROWTH FUND/VA
2. Significant Accounting Policies (Continued)
The tax components of capital shown in the following table represent distribution requirements the Fund must satisfy under the income tax regulations, losses the Fund may be able to offset against income and gains realized in future years and unrealized appreciation or depreciation of securities and other investments for federal income tax purposes.
| | | | | | | | | | | | |
Undistributed Net Investment Income | | Undistributed
Long-Term
Gain | | | Accumulated
Loss
Carryforward1,2 | | | Net Unrealized
Appreciation
Based on cost of
Securities and
Other Investments
for Federal Income
Tax Purposes | |
| |
$23,400,569 | | | $77,709,831 | | | | $— | | | | $164,883,893 | |
1. During the reporting period, the Fund did not utilize any capital loss carryforward.
2. During the previous reporting period, the Fund did not utilize any capital loss carryforward.
Net investment income (loss) and net realized gain (loss) may differ for financial statement and tax purposes. The character of dividends and distributions made during the fiscal year from net investment income or net realized gains are determined in accordance with federal income tax requirements, which may differ from the character of net investment income or net realized gains presented in those financial statements in accordance with U.S. GAAP. Also, due to timing of dividends and distributions, the fiscal year in which amounts are distributed may differ from the fiscal year in which the income or net realized gain was recorded by the Fund.
Accordingly, the following amounts have been reclassified for the reporting period. Net assets of the Fund were unaffected by the reclassifications.
| | | | | | | | |
Increase to Paid-in Capital | | Reduction
to Accumulated
Net Investment
Loss | | | Reduction
to Accumulated Net
Realized Gain
on Investments3 | |
| |
$7,408,883 | | | $927,146 | | | | $8,336,029 | |
3. $7,400,685, including $5,687,901 of long-term capital gain, was distributed in connection with Fund share redemptions.
The tax character of distributions paid during the reporting periods:
| | | | | | | | |
| | | Year Ended
December 31, 2017 | | | Year Ended
December 31, 2016 | |
| |
Distributions paid from: | | | | | | | | |
Ordinary income | | $ | 202,565 | | | $ | — | |
Long-term capital gain | | | 70,236,700 | | | | 51,152,857 | |
| | | | |
Total | | $ | 70,439,265 | | | $ | 51,152,857 | |
| | | | |
The aggregate cost of securities and other investments and the composition of unrealized appreciation and depreciation of securities and other investments for federal income tax purposes at period end are noted in the following table. The primary difference between book and tax appreciation or depreciation of securities and other investments, if applicable, is attributable to the tax deferral of losses or tax realization of financial statement unrealized gain or loss.
| | | | |
Federal tax cost of securities | | $ | 567,030,556 | |
| | | | |
Gross unrealized appreciation | | $ | 166,244,790 | |
| |
Gross unrealized depreciation | | | (1,360,897) | |
| | | | |
Net unrealized appreciation | | $ | 164,883,893 | |
| | | | |
Use of Estimates. The preparation of financial statements in conformity with U.S. GAAP requires management to make estimates and assumptions that affect the reported amounts of assets and liabilities and disclosure of contingent assets and liabilities at the date of the financial statements and the reported amounts of increases and decreases in net assets from operations during the reporting period. Actual results could differ from those estimates.
3. Securities Valuation
The Fund calculates the net asset value of its shares as of 4:00 P.M. Eastern time, on each day the New York Stock Exchange (the “Exchange”) is open for trading, except in the case of a scheduled early closing of the Exchange, in which case the Fund will calculate net asset value of the shares as of the scheduled early closing time of the Exchange.
The Fund’s Board has adopted procedures for the valuation of the Fund’s securities and has delegated the day-to-day responsibility for valuation determinations under those procedures to the Manager. The Manager has established a Valuation Committee which is responsible for determining a fair valuation for any security for which market quotations are not readily available. The Valuation Committee’s fair valuation determinations are subject to review, approval and ratification by the Fund’s Board at least quarterly or more frequently, if necessary.
15 OPPENHEIMER DISCOVERY MID CAP GROWTH FUND/VA
NOTES TO FINANCIAL STATEMENTS Continued
3. Securities Valuation (Continued)
Valuation Methods and Inputs
Securities are valued primarily using unadjusted quoted market prices, when available, as supplied by third party pricing services or broker-dealers.
The following methodologies are used to determine the market value or the fair value of the types of securities described below:
Equity securities traded on a securities exchange (including exchange-traded derivatives other than futures and futures options) are valued based on the official closing price on the principal exchange on which the security is traded, as identified by the Manager, prior to the time when the Fund’s assets are valued. If the official closing price is unavailable, the security is valued at the last sale price on the principal exchange on which it is traded, or if no sales occurred, the security is valued at the mean between the quoted bid and asked prices. Over-the-counter equity securities are valued at the last published sale price, or if no sales occurred, at the mean between the quoted bid and asked prices. Events occurring after the close of trading on foreign exchanges may result in adjustments to the valuation of foreign securities to more accurately reflect their fair value as of the time when the Fund’s assets are valued.
Shares of a registered investment company that are not traded on an exchange are valued at that investment company’s net asset value per share.
Securities for which market quotations are not readily available, or when a significant event has occurred that would materially affect the value of the security, are fair valued either (i) by a standardized fair valuation methodology applicable to the security type or the significant event as previously approved by the Valuation Committee and the Fund’s Board or (ii) as determined in good faith by the Manager’s Valuation Committee. The Valuation Committee considers all relevant facts that are reasonably available, through either public information or information available to the Manager, when determining the fair value of a security. Those standardized fair valuation methodologies include, but are not limited to, valuing securities at the last sale price or initially at cost and subsequently adjusting the value based on: changes in company specific fundamentals, changes in an appropriate securities index, or changes in the value of similar securities which may be further adjusted for any discounts related to security-specific resale restrictions. When possible, such methodologies use observable market inputs such as unadjusted quoted prices of similar securities, observable interest rates, currency rates and yield curves. The methodologies used for valuing securities are not necessarily an indication of the risks associated with investing in those securities nor can it be assured that the Fund can obtain the fair value assigned to a security if it were to sell the security.
Classifications
Each investment asset or liability of the Fund is assigned a level at measurement date based on the significance and source of the inputs to its valuation. Various data inputs may be used in determining the value of each of the Fund’s investments as of the reporting period end. These data inputs are categorized in the following hierarchy under applicable financial accounting standards:
1) Level 1-unadjusted quoted prices in active markets for identical assets or liabilities (including securities actively traded on a securities exchange)
2) Level 2-inputs other than unadjusted quoted prices that are observable for the asset or liability (such as unadjusted quoted prices for similar assets and market corroborated inputs such as interest rates, prepayment speeds, credit risks, etc.)
3) Level 3-significant unobservable inputs (including the Manager’s own judgments about assumptions that market participants would use in pricing the asset or liability).
The inputs used for valuing securities are not necessarily an indication of the risks associated with investing in those securities.
The Fund classifies each of its investments in investment companies which are publicly offered as Level 1. Investment companies that are not publicly offered, if any, are classified as Level 2 in the fair value hierarchy.
The table below categorizes amounts that are included in the Fund’s Statement of Assets and Liabilities at period end based on valuation input level:
| | | | | | | | | | | | | | | | |
| | | Level 1— Unadjusted
Quoted Prices | | | Level 2— Other Significant
Observable Inputs | | | Level 3—
Significant Unobservable
Inputs | | | Value | |
| |
Assets Table | | | | | | | | | | | | | | | | |
Investments, at Value: | | | | | | | | | | | | | | | | |
Common Stocks | | | | | | | | | | | | | | | | |
Consumer Discretionary | | $ | 111,893,826 | | | $ | — | | | $ | — | | | $ | 111,893,826 | |
Consumer Staples | | | 18,274,619 | | | | — | | | | — | | | | 18,274,619 | |
Energy | | | 15,686,404 | | | | — | | | | — | | | | 15,686,404 | |
Financials | | | 93,414,606 | | | | — | | | | — | | | | 93,414,606 | |
Health Care | | | 104,880,563 | | | | — | | | | — | | | | 104,880,563 | |
Industrials | | | 149,682,842 | | | | — | | | | — | | | | 149,682,842 | |
Information Technology | | | 183,794,987 | | | | — | | | | — | | | | 183,794,987 | |
Materials | | | 46,713,012 | | | | — | | | | — | | | | 46,713,012 | |
Investment Company | | | 7,573,590 | | | | — | | | | — | | | | 7,573,590 | |
| | | | |
Total Assets | | $ | 731,914,449 | | | $ | — | | | $ | — | | | $ | 731,914,449 | |
| | | | |
Forward currency exchange contracts and futures contracts, if any, are reported at their unrealized appreciation/depreciation at measurement date, which represents the change in the contract’s value from trade date. All additional assets and liabilities included in the above table are reported at their market value at measurement date.
16 OPPENHEIMER DISCOVERY MID CAP GROWTH FUND/VA
4. Investments and Risks
Investments in Affiliated Funds. The Fund is permitted to invest in other mutual funds advised by the Manager (“Affiliated Funds”). Affiliated Funds are open-end management investment companies registered under the 1940 Act, as amended. The Manager is the investment adviser of, and the Sub-Adviser provides investment and related advisory services to, the Affiliated Funds. When applicable, the Fund’s investments in Affiliated Funds are included in the Statement of Investments. Shares of Affiliated Funds are valued at their net asset value per share. As a shareholder, the Fund is subject to its proportional share of the Affiliated Funds’ expenses, including their management fee. The Manager will waive fees and/or reimburse Fund expenses in an amount equal to the indirect management fees incurred through the Fund’s investment in the Affiliated Funds.
Each of the Affiliated Funds in which the Fund invests has its own investment risks, and those risks can affect the value of the Fund’s investments and therefore the value of the Fund’s shares. To the extent that the Fund invests more of its assets in one Affiliated Fund than in another, the Fund will have greater exposure to the risks of that Affiliated Fund.
Investments in Money Market Instruments. The Fund is permitted to invest its free cash balances in money market instruments to provide liquidity or for defensive purposes. The Fund may invest in money market instruments by investing in Class E shares of Oppenheimer Institutional Government Money Market Fund (“IGMMF”), which is an Affiliated Fund. IGMMF is regulated as a money market fund under the 1940 Act, as amended. The Fund may also invest in money market instruments directly or in other affiliated or unaffiliated money market funds.
Equity Security Risk. Stocks and other equity securities fluctuate in price. The value of the Fund’s portfolio may be affected by changes in the equity markets generally. Equity markets may experience significant short-term volatility and may fall sharply at times. Different markets may behave differently from each other and U.S. equity markets may move in the opposite direction from one or more foreign stock markets. Adverse events in any part of the equity or fixed-income markets may have unexpected negative effects on other market segments.
The prices of individual equity securities generally do not all move in the same direction at the same time and a variety of factors can affect the price of a particular company’s securities. These factors may include, but are not limited to, poor earnings reports, a loss of customers, litigation against the company, general unfavorable performance of the company’s sector or industry, or changes in government regulations affecting the company or its industry.
Shareholder Concentration. At period end, two shareholders owned 20% or more of the Fund’s total outstanding shares.
The shareholders are related parties of the Fund. Related parties may include, but are not limited to, the investment manager and its affiliates, affiliated broker dealers, fund of funds, and directors or employees. Related parties owned 67% of the Fund’s total outstanding shares at period end.
5. Market Risk Factors
The Fund’s investments in securities and/or financial derivatives may expose the Fund to various market risk factors:
Commodity Risk. Commodity risk relates to the change in value of commodities or commodity indexes as they relate to increases or decreases in the commodities market. Commodities are physical assets that have tangible properties. Examples of these types of assets are crude oil, heating oil, metals, livestock, and agricultural products.
Credit Risk. Credit risk relates to the ability of the issuer of debt to meet interest and principal payments, or both, as they come due. In general, lower-grade, higher-yield debt securities are subject to credit risk to a greater extent than lower-yield, higher-quality securities.
Equity Risk. Equity risk relates to the change in value of equity securities as they relate to increases or decreases in the general market.
Foreign Exchange Rate Risk. Foreign exchange rate risk relates to the change in the U.S. dollar value of a security held that is denominated in a foreign currency. The U.S. dollar value of a foreign currency denominated security will decrease as the dollar appreciates against the currency, while the U.S. dollar value will increase as the dollar depreciates against the currency.
Interest Rate Risk. Interest rate risk refers to the fluctuations in value of fixed-income securities resulting from the inverse relationship between price and yield. For example, an increase in general interest rates will tend to reduce the market value of already issued fixed-income investments, and a decline in general interest rates will tend to increase their value. In addition, debt securities with longer maturities, which tend to have higher yields, are subject to potentially greater fluctuations in value from changes in interest rates than obligations with shorter maturities.
Volatility Risk. Volatility risk refers to the magnitude of the movement, but not the direction of the movement, in a financial instrument’s price over a defined time period. Large increases or decreases in a financial instrument’s price over a relative time period typically indicate greater volatility risk, while small increases or decreases in its price typically indicate lower volatility risk.
6. Shares of Beneficial Interest
The Fund has authorized an unlimited number of $0.001 par value shares of beneficial interest of each class. Transactions in shares of beneficial interest were as follows:
17 OPPENHEIMER DISCOVERY MID CAP GROWTH FUND/VA
NOTES TO FINANCIAL STATEMENTS Continued
6. Shares of Beneficial Interest (Continued)
| | | | | | | | | | | | | | | | |
| | | Year Ended December 31, 2017 | | | Year Ended December 31, 2016 | |
| | | Shares | | | | Amount | | | | Shares | | | | Amount | |
| |
Non-Service Shares | | | | | | | | | | | | | | | | |
Sold | | | 235,884 | | | $ | 18,341,538 | | | | 260,318 | | | $ | 19,152,890 | |
Dividends and/or distributions reinvested | | | 881,558 | | | | 66,743,996 | | | | 674,971 | | | | 48,415,668 | |
Redeemed | | | (1,177,553) | | | | (93,258,429) | | | | (1,219,400) | | | | (89,285,818) | |
| | | | |
Net decrease | | | (60,111) | | | $ | (8,172,895) | | | | (284,111) | | | $ | (21,717,260) | |
| | | | |
|
| |
Service Shares | | | | | | | | | | | | | | | | |
Sold | | | 69,577 | | | $ | 5,232,152 | | | | 50,885 | | | $ | 3,568,573 | |
Dividends and/or distributions reinvested | | | 51,387 | | | | 3,695,269 | | | | 39,878 | | | | 2,737,189 | |
Redeemed | | | (89,745) | | | | (6,729,427) | | | | (127,436) | | | | (8,923,664) | |
| | | | |
Net increase (decrease) | | | 31,219 | | | $ | 2,197,994 | | | | (36,673) | | | $ | (2,617,902) | |
| | | | |
7. Purchases and Sales of Securities
The aggregate cost of purchases and proceeds from sales of securities, other than short-term obligations and investments in IGMMF, for the reporting period were as follows:
| | | | | | | | |
| | | Purchases | | | Sales | |
| |
Investment securities | | $ | 716,653,993 | | | | $789,560,177 | |
8. Fees and Other Transactions with Affiliates
Management Fees. Under the investment advisory agreement, the Fund pays the Manager a management fee based on the daily net assets of the Fund at an annual rate as shown in the following table:
| | |
| Fee Schedule |
|
Up to $200 million | | 0.75% |
Next $200 million | | 0.72 |
Next $200 million | | 0.69 |
Next $200 million | | 0.66 |
Next $700 million | | 0.60 |
Over $1.5 billion | | 0.58 |
The Fund’s effective management fee for the reporting period was 0.71% of average annual net assets before any applicable waivers.
Sub-Adviser Fees. The Manager has retained the Sub-Adviser to provide the day-to-day portfolio management of the Fund. Under the Sub-Advisory Agreement, the Manager pays the Sub-Adviser an annual fee in monthly installments, equal to a percentage of the investment management fee collected by the Manager from the Fund, which shall be calculated after any investment management fee waivers. The fee paid to the Sub-Adviser is paid by the Manager, not by the Fund.
Transfer Agent Fees. OFI Global (the “Transfer Agent”) serves as the transfer and shareholder servicing agent for the Fund. The Fund pays the Transfer Agent a fee based on annual net assets. Fees incurred and average net assets for each class with respect to these services are detailed in the Statement of Operations and Financial Highlights, respectively.
Sub-Transfer Agent Fees. The Transfer Agent has retained Shareholder Services, Inc., a wholly-owned subsidiary of OFI (the “Sub-Transfer Agent”), to provide the day-to-day transfer agent and shareholder servicing of the Fund. Under the Sub-Transfer Agency Agreement, the Transfer Agent pays the Sub-Transfer Agent an annual fee in monthly installments, equal to a percentage of the transfer agent fee collected by the Transfer Agent from the Fund, which shall be calculated after any applicable fee waivers. The fee paid to the Sub-Transfer Agent is paid by the Transfer Agent, not by the Fund.
Trustees’ Compensation. The Fund’s Board of Trustees (“Board”) has adopted a compensation deferral plan for Independent Trustees that enables Trustees to elect to defer receipt of all or a portion of the annual compensation they are entitled to receive from the Fund. For purposes of determining the amount owed to the Trustees under the plan, deferred amounts are treated as though equal dollar amounts had been invested in shares of the Fund or in other Oppenheimer funds selected by the Trustees. The Fund purchases shares of the funds selected for deferral by the Trustees in amounts equal to his or her deemed investment, resulting in a Fund asset equal to the deferred compensation liability. Such assets are included as a component of “Other” within the asset section of the Statement of Assets and Liabilities. Deferral of Trustees’ fees under the plan will not affect the net assets of the Fund and will not materially affect the Fund’s assets, liabilities or net investment income per share. Amounts will be deferred until distributed in accordance with the compensation deferral plan.
Distribution and Service Plan for Service Shares. The Fund has adopted a Distribution and Service Plan (the “Plan”) pursuant to Rule 12b-1 under the 1940 Act for Service shares to pay OppenheimerFunds Distributor, Inc. (the “Distributor”), for distribution related services, personal service and
18 OPPENHEIMER DISCOVERY MID CAP GROWTH FUND/VA
8. Fees and Other Transactions with Affiliates (Continued)
account maintenance for the Fund’s Service shares. Under the Plan, payments are made periodically at an annual rate of 0.25% of the daily net assets of Service shares of the Fund. The Distributor currently uses all of those fees to compensate sponsors of the insurance product that offers Fund shares, for providing personal service and maintenance of accounts of their variable contract owners that hold Service shares. These fees are paid out of the Fund’s assets on an on-going basis and increase operating expenses of the Service shares, which results in lower performance compared to the Fund’s shares that are not subject to a service fee. Fees incurred by the Fund under the Plan are detailed in the Statement of Operations.
Waivers and Reimbursements of Expenses. The Manager has contractually agreed to limit the Fund’s expenses after payments, waivers and/or reimbursements and reduction to custodian expenses, excluding any applicable dividend expense, taxes, interest and fees from borrowing, any subsidiary expenses, Acquired Fund Fees and Expenses, brokerage commissions, unusual and infrequent expenses and certain other Fund expenses; so that those expenses, as percentages of daily net assets, will not exceed the annual rate of 0.80% for Non-Service shares and 1.05% for Service shares.
During the reporting period, the Manager waived fees and/or reimbursed the Fund as follows:
| | | | |
Non-Service shares | | $ | 223,589 | |
Service shares | | | 12,170 | |
This fee waiver and/or expense reimbursement may not be amended or withdrawn for one year from the date of the Fund’s prospectus, unless approved by the Board.
The Manager will waive fees and/or reimburse Fund expenses in an amount equal to the indirect management fees incurred through the Fund’s investment in IGMMF. During the reporting period, the Manager waived fees and/or reimbursed the Fund $13,296 for IGMMF management fees. This fee waiver and/or expense reimbursement may not be amended or withdrawn for one year from the date of the Fund’s prospectus, unless approved by the Board.
9. Borrowings and Other Financing
Joint Credit Facility. A number of mutual funds managed by the Manager participate in a $1.875 billion revolving credit facility (the “Facility”) intended to provide short-term financing, if necessary, subject to certain restrictions in connection with atypical redemption activity. Expenses and fees related to the Facility are paid by the participating funds and are disclosed separately or as other expenses on the Statement of Operations. The Fund did not utilize the Facility during the reporting period.
19 OPPENHEIMER DISCOVERY MID CAP GROWTH FUND/VA
REPORT OF INDEPENDENT REGISTERED PUBLIC ACCOUNTING FIRM
To the Shareholders and Board of Trustees
Oppenheimer Variable Account Funds:
Opinion on the Financial Statements
We have audited the accompanying statement of assets and liabilities of Oppenheimer Discovery Mid Cap Growth Fund/VA, a separate series of Oppenheimer Variable Account Funds, (the “Fund”), including the statement of investments, as of December 31, 2017, the related statement of operations for the year then ended, the statements of changes in net assets for each of the years in the two year period then ended, and the related notes (collectively, the “financial statements”) and the financial highlights for each of the years in the five year period then ended. In our opinion, the financial statements and financial highlights present fairly, in all material respects, the financial position of the Fund as of December 31, 2017, the results of its operations for the year then ended, the changes in its net assets for each of the years in the two year period then ended, and the financial highlights for each of the years in the five year period then ended, in conformity with U.S. generally accepted accounting principles.
Basis for Opinion
These financial statements and financial highlights are the responsibility of the Fund’s management. Our responsibility is to express an opinion on these financial statements and financial highlights based on our audits. We are a public accounting firm registered with the Public Company Accounting Oversight Board (United States) (“PCAOB”) and are required to be independent with respect to the Fund in accordance with the U.S. federal securities laws and the applicable rules and regulations of the Securities and Exchange Commission and the PCAOB.
We conducted our audits in accordance with the standards of the PCAOB. Those standards require that we plan and perform the audit to obtain reasonable assurance about whether the financial statements and financial highlights are free of material misstatement, whether due to error or fraud. Our audits included performing procedures to assess the risks of material misstatement of the financial statements and financial highlights, whether due to error or fraud, and performing procedures that respond to those risks. Such procedures included examining, on a test basis, evidence regarding the amounts and disclosures in the financial statements and financial highlights. Such procedures also included confirmation of securities owned as of December 31, 2017, by correspondence with the custodian, brokers and the transfer agent, or by other appropriate auditing procedures. Our audits also included evaluating the accounting principles used and significant estimates made by management, as well as evaluating the overall presentation of the financial statements and financial highlights. We believe that our audits provide a reasonable basis for our opinion.
KPMGLLP
We have not been able to determine the specific year that we began serving as the auditor of one or more Oppenheimer Funds investment companies, however we are aware that we have served as the auditor of one or more Oppenheimer Funds investment companies since at least 1969.
Denver, Colorado
February 13, 2018
20 OPPENHEIMER DISCOVERY MID CAP GROWTH FUND/VA
FEDERAL INCOME TAX INFORMATION Unaudited
In early 2018, if applicable, shareholders of record received information regarding all dividends and distributions paid to them by the Fund during calendar year 2017.
Capital gain distributions of $8.38645 per share were paid to Non-Service and Service shareholders, respectively, on June 20, 2017. Whether received in stock or in cash, the capital gain distribution should be treated by shareholders as a gain from the sale of the capital assets held for more than one year (long-term capital gains).
Dividends, if any, paid by the Fund during the reporting period which are not designated as capital gain distributions should be multiplied by the maximum amount allowable but not less than 15.51% to arrive at the amount eligible for the corporate dividend-received deduction.
The foregoing information is presented to assist shareholders in reporting distributions received from the Fund to the Internal Revenue Service. Because of the complexity of the federal regulations which may affect your individual tax return and the many variations in state and local tax regulations, we recommend that you consult your tax advisor for specific guidance.
21 OPPENHEIMER DISCOVERY MID CAP GROWTH FUND/VA
BOARD APPROVAL OF THE FUND’S INVESTMENT ADVISORY AND SUB-ADVISORY AGREEMENTS Unaudited
The Fund has entered into an investment advisory agreement with OFI Global Asset Management, Inc. (“OFI Global” or the “Adviser”), a wholly-owned subsidiary of OppenheimerFunds, Inc. (“OFI” or the “Sub-Adviser”) (“OFI Global” and “OFI” together, the “Managers”) and OFI Global has entered into a sub-advisory agreement with OFI whereby OFI provides investment sub-advisory services to the Fund (collectively, the “Agreements”). Each year, the Board of Trustees (the “Board”), including a majority of the independent Trustees, is required to determine whether to approve the terms of the Agreements and the renewal thereof. The Investment Company Act of 1940, as amended, requires that the Board request and evaluate, and that the Managers provide, such information as may be reasonably necessary to evaluate the terms of the Agreements. The Board employs an independent consultant to prepare a report that provides information, including comparative information that the Board requests for that purpose. In addition to in-person meetings focused on this evaluation, the Board receives information throughout the year regarding Fund services, fees, expenses and performance.
The Managers and the independent consultant provided information to the Board on the following factors: (i) the nature, quality and extent of the Managers’ services, (ii) the comparative investment performance of the Fund and the Managers, (iii) the fees and expenses of the Fund, including comparative fee and expense information, (iv) the profitability of the Managers and their affiliates, including an analysis of the cost of providing services, (v) whether economies of scale are realized as the Fund grows and whether fee levels reflect these economies of scale for Fund investors and (vi) other benefits to the Managers from their relationship with the Fund. The Board was aware that there are alternatives to retaining the Managers.
Outlined below is a summary of the principal information considered by the Board as well as the Board’s conclusions.
Nature, Quality and Extent of Services. The Board considered information about the nature, quality and extent of the services provided to the Fund and information regarding the Managers’ key personnel who provide such services. The Managers’ duties include providing the Fund with the services of the portfolio managers and the Sub-Adviser’s investment team, who provide research, analysis and other advisory services in regard to the Fund’s investments; and securities trading services. OFI Global is responsible for oversight of third-party service providers; monitoring compliance with applicable Fund policies and procedures and adherence to the Fund’s investment restrictions; risk management; and oversight of the Sub-Adviser. OFI Global is also responsible for providing certain administrative services to the Fund. Those services include providing and supervising all administrative and clerical personnel who are necessary in order to provide effective corporate administration for the Fund; compiling and maintaining records with respect to the Fund’s operations; preparing and filing reports required by the U.S. Securities and Exchange Commission; preparing periodic reports regarding the operations of the Fund for its shareholders; preparing proxy materials for shareholder meetings; and preparing the registration statements required by federal and state securities laws for the sale of the Fund’s shares. OFI Global also provides the Fund with office space, facilities and equipment.
The Board also considered the quality of the services provided and the quality of the Managers’ resources that are available to the Fund. The Board took account of the fact that the Sub-Adviser has over fifty years of experience as an investment adviser and that its assets under management rank it among the top mutual fund managers in the United States. The Board evaluated the Managers’ advisory, administrative, accounting, legal, compliance and risk management services, among other services, and information the Board has received regarding the experience and professional qualifications of the Managers’ key personnel and the size and functions of their staff. In its evaluation of the quality of the portfolio management services provided, the Board considered the experience of Ronald Zibelli and Justin Livengood, the portfolio managers for the Fund, and the Sub-Adviser’s investment team and analysts. The Board members also considered the totality of their experiences with the Managers as directors or trustees of the Fund and other funds advised by the Managers. The Board considered information regarding the quality of services provided by affiliates of the Managers, which the Board members have become knowledgeable about through their experiences with the Managers and in connection with the review or renewal of the Fund’s service agreements or service providers. The Board concluded, in light of the Managers’ experience, reputation, personnel, operations and resources that the Fund benefits from the services provided under the Agreements.
Investment Performance of the Managers and the Fund. Throughout the year, the Managers provided information on the investment performance of the Fund, the Adviser and the Sub-Adviser, including comparative performance information. The Board also reviewed information, prepared by the Managers and by the independent consultant, comparing the Fund’s historical performance to relevant market indices and to the performance of other mid-cap growth funds underlying variable insurance products. The Board considered that the Fund outperformed its performance category median for the three- and five-year periods, while it underperformed its category median for the one- and ten-year periods. The Board also noted that the Fund’s performance improved in 2017 and that the Fund outperformed its category median in the year-to-date period ended June 30, 2017.
Fees and Expenses of the Fund. The Board reviewed the fees paid to the Adviser and the other expenses borne by the Fund. The independent consultant provided comparative data in regard to the fees and expenses of the Fund and other mid-cap growth funds underlying variable insurance products. In reviewing the fees and expenses charged to the VA funds, the Board considered the Adviser’s assertion that, because there is much greater disparity in the fees and services that may be provided by a manager to a VA fund as opposed to a retail fund, when comparing the expenses of the various VA funds to those of retail funds, it is most appropriate to focus on total expenses (rather than on the management fees). Accordingly, while the Board reviewed and considered all expenses, it focused on total expenses. The Board considered that the Fund’s contractual management fees and total expenses were lower than their respective peer group medians and category medians. The Board noted that the Adviser has contractually agreed to limit the Fund’s total annual operating expenses so that those expenses, as percentages of daily net assets, will not exceed the annual rate of 0.80% for Non-Service Shares and 1.05% for Service Shares. This contractual expense limitation may not be amended or withdrawn for one year from the date of the Fund’s prospectus, unless approved by the Board.
Economies of Scale and Profits Realized by the Managers. The Board considered information regarding the Managers’ costs in serving as the Fund’s investment adviser and sub-adviser, including the costs associated with the personnel and systems necessary to manage the Fund, and information regarding the Managers’ profitability from their relationship with the Fund. The Board also considered that the Managers must be able to pay and retain experienced professional personnel at competitive rates to provide quality services to the Fund. The Board reviewed whether the Managers may realize economies of scale in managing and supporting the Fund. The Board noted that the Fund currently has management fee breakpoints, which are intended to share with Fund shareholders economies of scale that may exist as the Fund’s assets grow.
22 OPPENHEIMER DISCOVERY MID CAP GROWTH FUND/VA
BOARD APPROVAL OF THE FUND’S INVESTMENT ADVISORY AND SUB-ADVISORY AGREEMENTS Unaudited / Continued
Other Benefits to the Managers. In addition to considering the profits realized by the Managers, the Board considered information that was provided regarding the direct and indirect benefits the Managers receive as a result of their relationship with the Fund, including compensation paid to the Managers’ affiliates and research provided to the Adviser in connection with permissible brokerage arrangements (soft dollar arrangements).
Conclusions. These factors were also considered by the independent Trustees meeting separately from the full Board, assisted by experienced counsel to the Fund and to the independent Trustees. Fund counsel and the independent Trustees’ counsel are independent of the Managers within the meaning and intent of the Securities and Exchange Commission rules.
Based on its review of the information it received and its evaluations described above, the Board, including a majority of the independent Trustees, decided to continue the Agreements through August 31, 2018. In arriving at its decision, the Board did not identify any factor or factors as being more important than others, but considered all of the above information, and considered the terms and conditions of the Agreements, including the management fees, in light of all the surrounding circumstances.
23 OPPENHEIMER DISCOVERY MID CAP GROWTH FUND/VA
PORTFOLIO PROXY VOTING POLICIES AND GUIDELINES; UPDATES TO STATEMENTS OF INVESTMENTS Unaudited
The Fund has adopted Portfolio Proxy Voting Policies and Guidelines under which the Fund votes proxies relating to securities (“portfolio proxies”) held by the Fund. A description of the Fund’s Portfolio Proxy Voting Policies and Guidelines is available (i) without charge, upon request, by calling the Fund toll-free at 1.800.CALL OPP (225.5677), (ii) on the Fund’s website at www.oppenheimerfunds.com, and (iii) on the SEC’s website at www.sec.gov. In addition, the Fund is required to file Form N-PX, with its complete proxy voting record for the 12 months ended June 30th, no later than August 31st of each year. The Fund’s voting record is available (i) without charge, upon request, by calling the Fund toll-free at 1.800.CALL OPP (225.5677), and (ii) in the Form N-PX filing on the SEC’s website at www.sec.gov.
The Fund files its complete schedule of portfolio holdings with the SEC for the first quarter and the third quarter of each fiscal year on Form N-Q. The Fund’s Form N-Q filings are available on the SEC’s website at www.sec.gov. Those forms may be reviewed and copied at the SEC’s Public Reference Room in Washington, D.C. Information on the operation of the Public Reference Room may be obtained by calling 1-800-SEC-0330.
24 OPPENHEIMER DISCOVERY MID CAP GROWTH FUND/VA
TRUSTEES AND OFFICERS Unaudited
| | |
Name, Position(s) Held with the Fund, Length of
Service, Year of Birth | | Principal Occupation(s) During the Past 5 Years; Other Trusteeships/Directorships
Held; Number of Portfolios in the Fund Complex Currently Overseen |
| |
| INDEPENDENT TRUSTEES | | The address of each Trustee in the chart below is 6803 S. Tucson Way, Centennial, Colorado 80112-3924. Each Trustee serves for an indefinite term, or until his or her resignation, retirement, death or removal. |
| |
Robert J. Malone, Chairman of the Board of Trustees (since 2016), Trustee (since 2002) Year of Birth: 1944 | | Chairman - Colorado Market of MidFirst Bank (since January 2015); Chairman of the Board (2012-2016) and Director (August 2005-January 2016) of Jones International University (educational organization); Trustee of the Gallagher Family Foundation (non-profit organization) (2000-2016); Chairman, Chief Executive Officer and Director of Steele Street Bank Trust (commercial banking) (August 2003-January 2015); Director of Opera Colorado Foundation (non-profit organization) (2008-2012); Director of Colorado UpLIFT (charitable organization) (1986-2010); Director of Jones Knowledge, Inc. (2006-2010); Former Chairman of U.S. Bank-Colorado (subsidiary of U.S. Bancorp and formerly Colorado National Bank) (July 1996-April 1999); Director of Commercial Assets, Inc. (real estate investment trust) (1993-2000); Director of U.S. Exploration, Inc. (oil and gas exploration) (1997-February 2004); Chairman of the Board (1991-1994) and Trustee (1985-1994) of Regis University; and Chairman of the Board (1990-1991) and Member (1984-1999) of Young Presidents Organization. Oversees 54 portfolios in the OppenheimerFunds complex. Mr. Malone has served on the Boards of certain Oppenheimer funds since 2002, during which time he has become familiar with the Fund’s (and other Oppenheimer funds’) financial, accounting, regulatory and investment matters and has contributed to the Boards’ deliberations. |
| |
Andrew J. Donohue, Trustee (since 2017) Year of Birth: 1950 | | Of Counsel, Shearman & Sterling LLP (since September 2017); Chief of Staff of the U.S. Securities and Exchange Commission (regulator) (June 2015-February 2017); Managing Director and Investment Company General Counsel of Goldman Sachs (investment bank) (November 2012-May 2015); Partner at Morgan Lewis & Bockius, LLP (law firm) (March 2011-October 2012); Director of the Division of Investment Management of U.S. Securities and Exchange Commission (regulator) (May 2006-November 2010); Global General Counsel of Merrill Lynch Investment Managers (investment firm) (May 2003-May 2006); General Counsel (October 1991-November 2001) and Executive Vice President (January 1993-November 2001) of OppenheimerFunds, Inc. (investment firm) (June 1991-November 2001). Oversees 54 portfolios in the OppenheimerFunds complex. Mr. Donohue has served on the Boards of certain Oppenheimer funds since 2017, during which time he has become familiar with the Fund’s (and other Oppenheimer funds’) financial, accounting, regulatory and investment matters and has contributed to the Boards’ deliberations. |
| |
Jon S. Fossel, Trustee (since 1990) Year of Birth: 1942 | | Chairman of the Board of Jack Creek Preserve Foundation (non-profit organization) (2005-2015); Director of Jack Creek Preserve Foundation (non-profit organization) (since March 2005); Chairman of the Board (2006-December 2011) and Director (June 2002-December 2011) of UNUMProvident (insurance company); Director of Northwestern Energy Corp. (public utility corporation) (November 2004-December 2009); Director of P.R. Pharmaceuticals (October 1999-October 2003); Director of Rocky Mountain Elk Foundation (non-profit organization) (February 1998-February 2003 and February 2005-February 2007); Chairman and Director (until October 1996) and President and Chief Executive Officer (until October 1995) of the Sub-Adviser; President, Chief Executive Officer and Director of the following: Oppenheimer Acquisition Corp. (“OAC”) (parent holding company of the Sub-Adviser), Shareholders Services, Inc. and Shareholder Financial Services, Inc. (until October 1995). Oversees 54 portfolios in the OppenheimerFunds complex. Mr. Fossel has served on the Boards of certain Oppenheimer funds since 1990, during which time he has become familiar with the Fund’s (and other Oppenheimer funds’) financial, accounting, regulatory and investment matters and has contributed to the Boards’ deliberations. |
| |
Richard F. Grabish, Trustee (since 2012) Year of Birth: 1948 | | Formerly Senior Vice President and Assistant Director of Sales and Marketing (March 1997-December 2007), Director (March 1987-December 2007) and Manager of Private Client Services (June 1985-June 2005) of A.G. Edwards & Sons, Inc. (broker/dealer and investment firm); Chairman and Chief Executive Officer of A.G. Edwards Trust Company, FSB (March 2001-December 2007); President and Vice Chairman of A.G. Edwards Trust Company, FSB (investment adviser) (April 1987-March 2001); President of A.G. Edwards Trust Company, FSB (investment adviser) (June 2005-December 2007). Oversees 54 portfolios in the OppenheimerFunds complex. Mr. Grabish has served on the Boards of certain Oppenheimer funds since 2001, during which time he has become familiar with the Fund’s (and other Oppenheimer funds’) financial, accounting, regulatory and investment matters and has contributed to the Boards’ deliberations. |
| |
Beverly L. Hamilton, Trustee (since 2002) Year of Birth: 1946 | | Trustee of Monterey Institute for International Studies (educational organization) (2000-2014); Board Member of Middlebury College (educational organization) (December 2005-June 2011); Director (1991-2016), Vice Chairman of the Board (2006- 2009) and Chairman of the Board (2010-2013) of American Funds’ Emerging Markets Growth Fund, Inc. (mutual fund); Director of The California Endowment (philanthropic organization) (April 2002-April 2008); Director (February 2002-2005) and Chairman of Trustees (2006-2007) of the Community Hospital of Monterey Peninsula; President of ARCO Investment Management Company (February 1991-April 2000); Member of the investment committees of The Rockefeller Foundation (2001-2006) and The University of Michigan (since 2000); Advisor at Credit Suisse First Boston’s Sprout venture capital unit (venture capital fund) (1994-January 2005); Trustee of MassMutual Institutional Funds (investment company) (1996-June 2004); Trustee of MML Series Investment Fund (investment company) (April 1989-June 2004); Member of the investment committee of Hartford Hospital (2000-2003); and Advisor to Unilever (Holland) pension fund (2000-2003). Oversees 54 portfolios in the OppenheimerFunds complex. Ms. Hamilton has served on the Boards of certain Oppenheimer funds since 2002, during which time she has become familiar with the Fund’s (and other Oppenheimer funds’) financial, accounting, regulatory and investment matters and has contributed to the Boards’ deliberations. |
| |
Victoria J. Herget, Trustee (since 2012) Year of Birth:1951 | | Board Chair (2008-2015) and Director (2004-Present), United Educators (insurance company); Trustee (since 2000) and Chair (since 2010), Newberry Library (independent research library); Trustee, Mather LifeWays (senior living organization) (since 2001); Independent Director of the First American Funds (mutual fund family) (2003-2011); former Managing Director (1993-2001), Principal (1985-1993), Vice President (1978-1985) and Assistant Vice President (1973-1978) of Zurich Scudder Investments (investment adviser) (and its predecessor firms); Trustee (1992-2007), Chair of the Board of Trustees (1999-2007), Investment Committee Chair (1994-1999) and Investment Committee member (2007-2010) of Wellesley College; Trustee, BoardSource (non-profit organization) (2006-2009) and Chicago City Day School (K-8 School) (1994-2005). Oversees 54 portfolios in the OppenheimerFunds complex. Ms. Herget has served on the Boards of certain Oppenheimer funds since 2012, during which time she has become familiar with the Fund’s (and other Oppenheimer funds’) financial, accounting, regulatory and investment matters and has contributed to the Boards’ deliberations. |
25 OPPENHEIMER DISCOVERY MID CAP GROWTH FUND/VA
TRUSTEES AND OFFICERS Unaudited / Continued
| | |
F. William Marshall, Jr., Trustee (since 2000) Year of Birth: 1942 | | Trustee Emeritus of Worcester Polytech Institute (WPI) (private university) (since 2009); Trustee of MassMutual Select Funds (formerly MassMutual Institutional Funds) (investment company) (1996-2015), MML Series Investment Fund (investment company) (1996-2015) and Mass Mutual Premier Funds (investment company) (January 2012-December 2015); President and Treasurer of the SIS Charitable Fund (private charitable fund) (January 1999-March 2011); Former Trustee of WPI (1985- 2008); Former Chairman of the Board (2004-2006) and Former Chairman of the Investment Committee of WPI (1994-2008); Chairman of SIS Family Bank, F.S.B. (formerly SIS Bank) (commercial bank) (January 1999-July 1999); Executive Vice President of Peoples Heritage Financial Group, Inc. (commercial bank) (January 1999-July 1999); and Former President and Chief Executive Officer of SIS Bancorp. (1993-1999). Oversees 54 portfolios in the OppenheimerFunds complex. Mr. Marshall has served on the Boards of certain Oppenheimer funds since 2000, during which time he has become familiar with the Fund’s (and other Oppenheimer funds’) financial, accounting, regulatory and investment matters and has contributed to the Boards’ deliberations. |
| |
Karen L. Stuckey, Trustee (since 2012) Year of Birth: 1953 | | Member (since May 2015) of Desert Mountain Community Foundation Advisory Board (non-profit organization); Partner (1990-2012) of PricewaterhouseCoopers LLP (professional services firm) (held various positions 1975-1990); Trustee (1992- 2006); member of Executive, Nominating and Audit Committees and Chair of Finance Committee (1992-2006), and Emeritus Trustee (since 2006) of Lehigh University; and member, Women’s Investment Management Forum (professional organization) since inception. Oversees 54 portfolios in the OppenheimerFunds complex. Ms. Stuckey has served on the Boards of certain Oppenheimer funds since 2012, during which time she has become familiar with the Fund’s (and other Oppenheimer funds’) financial, accounting, regulatory and investment matters and has contributed to the Boards’ deliberations. |
| |
James D. Vaughn, Trustee (since 2012) Year of Birth: 1945 | | Retired; former managing partner (1994-2001) of Denver office of Deloitte & Touche LLP, (held various positions 1969- 1993); Trustee and Chairman of the Audit Committee of Schroder Funds (2003-2012); Board member and Chairman of Audit Committee of AMG National Trust Bank (since 2005); Trustee and Investment Committee member, University of South Dakota Foundation (since 1996); Board member, Audit Committee Member and past Board Chair, Junior Achievement (since 1993); former Board member, Mile High United Way, Boys and Girls Clubs, Boy Scouts, Colorado Business Committee for the Arts, Economic Club of Colorado and Metro Denver Network. Oversees 54 portfolios in the OppenheimerFunds complex. Mr. Vaughn has served on the Boards of certain Oppenheimer funds since 2012, during which time he has become familiar with the Fund’s (and other Oppenheimer funds’) financial, accounting, regulatory and investment matters and has contributed to the Boards’ deliberations. |
INTERESTED TRUSTEE AND OFFICER | | Mr. Steinmetz is an “Interested Trustee” because he is affiliated with the Manager and the Sub-Adviser by virtue of his positions as Chairman and director of the Sub-Adviser and officer and director of the Manager. Both as a Trustee and as an officer, Mr. Steinmetz serves for an indefinite term, or until his resignation, retirement, death or removal. Mr. Steinmetz’s address is 225 Liberty Street, New York, New York 10281-1008. |
| |
Arthur P. Steinmetz, Trustee (since 2015), President and Principal Executive Officer (since 2014) Year of Birth: 1958 | | Chairman of the Sub-Adviser (since January 2015); CEO and Chairman of the Manager (since July 2014), President of the Manager (since May 2013), a Director of the Manager (since January 2013), Director of the Sub-Adviser (since July 2014), President, Management Director and CEO of Oppenheimer Acquisition Corp. (the Sub-Adviser’s parent holding company) (since July 2014), and President and Director of OFI SteelPath, Inc. (since January 2013). Chief Investment Officer of the OppenheimerFunds advisory entities from (January 2013-December 2013); Executive Vice President of the Manager (January 2013-May 2013); Chief Investment Officer of the Sub-Adviser (October 2010-December 2012); Chief Investment Officer, Fixed- Income, of the Sub-Adviser (April 2009-October 2010); Executive Vice President of the Sub-Adviser (October 2009-December 2012); Director of Fixed Income of the Sub-Adviser (January 2009-April 2009); and a Senior Vice President of the Sub-Adviser (March 1993-September 2009). An officer of 111 portfolios in the OppenheimerFunds complex. |
OTHER OFFICERS OF THE FUND | | The addresses of the Officers in the chart below are as follows: for Messrs. Zibelli, Jr., Livengood, Mss. Lo Bessette, Foxson and Picciotto, 225 Liberty Street, New York, New York 10281-1008, for Mr. Petersen, 6803 S. Tucson Way, Centennial, Colorado 80112-3924. Each Officer serves for an indefinite term or until his or her resignation, retirement, death or removal. |
| |
Ronald J. Zibelli, Jr., Vice President (since 2008) Year of Birth: 1959 | | Senior Vice President of the Sub-Adviser (since January 2014); Senior Portfolio Manager of the Sub-Adviser (since May 2006) and Vice President of the Sub-Adviser (May 2006-January 2014). Prior to joining the Sub-Adviser, he spent six years at Merrill Lynch Investment Managers, during which time he was a Managing Director and Small Cap Growth Team Leader, responsible for managing 11 portfolios. Prior to joining Merrill Lynch Investment Managers, Mr. Zibelli spent 12 years with Chase Manhattan Bank, including two years as Senior Portfolio Manager (U.S. Small Cap Equity) at Chase Asset Management. A portfolio manager and an officer of other portfolios in the OppenheimerFunds complex. |
| |
Justin Livengood, Vice President (since 2014) Year of Birth: 1974 | | Vice President (since May 2006) and Senior Portfolio (since January 2014) of the Sub-Adviser. Senior Research Analyst of the Sub-Adviser (May 2006-January 2014), responsible for the health care, energy and financial services sectors for mid- and small-cap growth accounts. Before joining the Sub-Adviser in May 2006, Mr. Livengood was a vice president and fund analyst with Merrill Lynch Investment Managers, where he specialized in financial services, health care, energy and basic materials for the Merrill Lynch Small Cap Growth Fund. During his tenure at Merrill Lynch he also worked as an investment banking analyst in the Global Media Group and as an associate with Merrill Lynch Ventures. A portfolio manager and an officer of other portfolios in the OppenheimerFunds complex. |
| |
Cynthia Lo Bessette, Secretary and Chief Legal Officer (since 2016) Year of Birth: 1969 | | Executive Vice President, General Counsel and Secretary of the Manager (since February 2016); Senior Vice President and Deputy General Counsel of the Manager (March 2015-February 2016); Chief Legal Officer of the Sub-Adviser and the Distributor (since February 2016); Vice President, General Counsel and Secretary of Oppenheimer Acquisition Corp. (since February 2016); General Counsel of OFI SteelPath, Inc., OFI Advisors, LLC and Index Management Solutions, LLC (since February 2016); Chief Legal Officer of OFI Global Institutional, Inc., HarbourView Asset Management Corporation, OFI Global Trust Company, Oppenheimer Real Asset Management, Inc., OFI Private Investments Inc., Shareholder Services, Inc. and Trinity Investment Management Corporation (since February 2016); Corporate Counsel (February 2012-March 2015) and Deputy Chief Legal Officer (April 2013-March 2015) of Jennison Associates LLC; Assistant General Counsel (April 2008-September 2009) and Deputy General Counsel (October 2009-February 2012) of Lord Abbett & Co. LLC. An officer of 111 portfolios in the OppenheimerFunds complex. |
26 OPPENHEIMER DISCOVERY MID CAP GROWTH FUND/VA
| | |
| |
Jennifer Foxson, Vice President and Chief Business
Officer (since 2014)
Year of Birth: 1969 | | Senior Vice President of OppenheimerFunds Distributor, Inc. (since June 2014); Vice President of OppenheimerFunds Distributor, Inc. (April 2006-June 2014); Vice President of the Sub-Adviser (January 1998-March 2006); Assistant Vice President of the Sub-Adviser (October 1991-December 1998). An officer of 111 portfolios in the OppenheimerFunds complex. |
| |
Mary Ann Picciotto, Chief Compliance Officer and Chief
Anti-Money Laundering Officer (since 2014) Year of Birth: 1973 | | Senior Vice President and Chief Compliance Officer of the Manager (since March 2014); Chief Compliance Officer of the Sub- Adviser, OFI SteelPath, Inc., OFI Global Trust Company, OFI Global Institutional, Inc., Oppenheimer Real Asset Management, Inc., OFI Private Investments, Inc., Harborview Asset Management Corporation, Trinity Investment Management Corporation, and Shareholder Services, Inc. (since March 2014); Managing Director of Morgan Stanley Investment Management Inc. and certain of its various affiliated entities; Chief Compliance Officer of various Morgan Stanley Funds (May 2010-January 2014); Chief Compliance Officer of Morgan Stanley Investment Management Inc. (April 2007-January 2014). An officer of 111 portfolios in the OppenheimerFunds complex. |
| |
Brian S. Petersen, Treasurer and Principal Financial &
Accounting Officer (since 2016) Year of Birth: 1970 | | Senior Vice President of the Manager (since January 2017); Vice President of the Manager (January 2013-January 2017); Vice President of the Sub-Adviser (February 2007-December 2012); Assistant Vice President of the Sub-Adviser (August 2002- 2007). An officer of 111 portfolios in the OppenheimerFunds complex. |
The Fund’s Statement of Additional Information contains additional information about the Fund’s Trustees and Officers and is available without charge, upon request, by calling 1.800.988.8287.
27 OPPENHEIMER DISCOVERY MID CAP GROWTH FUND/VA
OPPENHEIMER DISCOVERY MID CAP GROWTH FUND/VA
A Series of Oppenheimer Variable Account Funds
| | |
Manager | | OFI Global Asset Management, Inc. |
| |
Sub-Adviser | | OppenheimerFunds, Inc. |
| |
Distributor | | OppenheimerFunds Distributor, Inc. |
| |
Transfer and | | OFI Global Asset Management, Inc. |
Shareholder | | |
Servicing Agent | | |
| |
Sub-Transfer Agent | | Shareholder Services, Inc. |
| | DBA OppenheimerFunds Services |
| |
Independent | | KPMG LLP |
Registered | | |
Public | | |
Accounting | | |
Firm | | |
| |
Legal Counsel | | Ropes & Gray LLP |
| |
| | Before investing in any of the Oppenheimer funds, investors should carefully consider a fund’s investment objectives, risks, charges and expenses. Fund prospectuses and summary prospectuses contain this and other information about the funds, and may be obtained by asking your financial advisor, visiting oppenheimerfunds.com or calling us at 1.800.988.8287. Read prospectuses and summary prospectuses carefully before investing. |
| |
| | © 2018 OppenheimerFunds, Inc. All rights reserved. Oppenheimer funds are distributed by OppenheimerFunds Distributor, Inc. |


December 31, 2017
| | | | | | |
| | | | | | |
| | Oppenheimer | | Annual Report | | |
| | Conservative Balanced Fund/VA | | |
| | A Series of Oppenheimer Variable Account Funds | | |
| | | | | | |
ANNUAL REPORT
Listing of Top Holdings
Fund Performance Discussion
Financial Statements
PORTFOLIO MANAGERS: Krishna Memani and Magnus Krantz
AVERAGE ANNUAL TOTAL RETURNS FOR THE PERIODS ENDED 12/31/17
| | | | | | | | | | | | | | | | | | | | |
| | | Inception Date | | | | | | 1-Year | | | 5-Year | | | 10-Year | |
Non-Service Shares | | | 2/9/87 | | | | | | | | 9.25 | % | | | 7.26 | % | | | 2.26 | % |
Service Shares | | | 5/1/02 | | | | | | | | 8.95 | | | | 6.99 | | | | 2.00 | |
Russell 3000 Index | | | | | | | | | | | 21.13 | | | | 15.58 | | | | 8.60 | |
Bloomberg Barclays U.S. Aggregate Bond Index | | | | | | | | | | | 3.54 | | | | 2.10 | | | | 4.01 | |
Reference Index | | | | | | | | | | | 9.48 | | | | 6.85 | | | | 6.19 | |
Performance data quoted represents past performance, which does not guarantee future results. The investment return and principal value of an investment in the Fund will fluctuate so that an investor’s shares, when redeemed, may be worth more or less than their original cost. Current performance may be lower or higher than the performance quoted. For performance data current to the most recent month end, call us at 1.800.988.8287. The Fund’s total returns should not be expected to be the same as the returns of other funds, whether or not both funds have the same portfolio managers and/or similar names. The Fund’s total returns include changes in share price and reinvested distributions but do not include the charges associated with the separate account products that offer this Fund. Such performance would have been lower if such charges were taken into account. Returns for periods of less than one year are cumulative and not annualized. See Fund prospectuses and summary prospectuses for more information on share classes and sales charges.
TOP HOLDINGS AND ALLOCATIONS
TOP TEN COMMON STOCK HOLDINGS
| | | | | |
Apple, Inc. | | | | 1.3% | |
Johnson & Johnson | | | | 1.2 | |
JPMorgan Chase & Co. | | | | 1.1 | |
Microsoft Corp. | | | | 1.0 | |
Alphabet, Inc., Cl. C | | | | 0.9 | |
Wells Fargo & Co. | | | | 0.7 | |
Facebook, Inc., Cl. A | | | | 0.7 | |
Merck & Co., Inc. | | | | 0.7 | |
Schlumberger Ltd. | | | | 0.6 | |
McDonald’s Corp. | | | | 0.6 | |
Portfolio holdings and allocations are subject to change. Percentages are as of December 31, 2017, and are based on net assets. For more current Fund holdings, please visit oppenheimerfunds.com.
PORTFOLIO ALLOCATION
| | | | | |
Mortgage-Backed Obligations | | | | | |
Government Agency | | | | 23.3% | |
Non-Agency | | | | 9.1 | |
Common Stocks | | | | 29.7 | |
Non-Convertible Corporate Bonds and Notes | | | | 28.0 | |
Asset-Backed Securities | | | | 7.6 | |
Investment Company | | | | | |
Oppenheimer Institutional Government Money Market Fund | | | | 2.1 | |
U.S. Government Obligations | | | | 0.2 | |
Portfolio holdings and allocations are subject to change. Percentages are as of December 31, 2017, and are based on the total market value of investments.
2 OPPENHEIMER CONSERVATIVE BALANCED FUND/VA
Fund Performance Discussion
The Fund’s Non-Service shares produced a return of 9.25% during the reporting period. On a relative basis, the Fund’s Reference Index returned 9.48%. The Fund’s Reference Index is a customized weighted index currently comprised of the following underlying broad-based security indices: 65% of the Bloomberg Barclays U.S. Aggregate Bond Index and 35% of the Russell 3000 Index. Measured separately, the Bloomberg Barclays U.S. Aggregate Bond Index returned 3.54% and the Russell 3000 Index returned 21.13%.
MARKET OVERVIEW
Markets continued their general risk-on mode throughout 2017, with equities climbing and credit spreads tightening in most sectors. During the period, U.S. Treasury yields climbed up from the summer lows, but remained around the levels that have prevailed over the past couple of years.
The U.S. economy outperformed expectations in the second half of 2017, with gross domestic product (GDP) growth exceeding the 2% trend growth rate witnessed so far during the expansion. As of the reporting period’s end, private consumption, the driving force of the U.S. economy in recent years, is growing at a stable rate. In addition, business fixed investment has gained momentum in recent months and headwinds from international trade have turned into tailwinds as the lagged effects from earlier U.S. dollar strength diminish. In fact, U.S. dollar weakness is now leading to increased global growth momentum at period end. Business and consumer confidence are at cyclical highs and the recent tax cut should lead to marginal additional spending in the coming two years, helping to sustain the current momentum. With the economy’s continued expansion, the Federal Reserve (“Fed”) is nearing its dual mandate of full employment and price stability. While inflation has surprised to the downside for a number of months recently, the Fed believes this to be temporary and continues down its prescribed course of gradual tightening. As communicated, the Fed began normalizing its balance sheet during the reporting period by discontinuing its interest reinvestment program and raised rates for a third time this calendar year in December. Despite these tightening measures, by many measures financial conditions eased in 2017.
EQUITY STRATEGY REVIEW
The equity strategy produced positive absolute performance during the reporting period, but underperformed the Russell 3000 Index. The equity strategy’s underperformance stemmed primarily from weaker relative stock selection in the Consumer Staples, Health Care and Utilities sectors. The equity strategy outperformed the Index in the Information Technology, Real Estate and Industrials sectors, as a result of stronger relative stock selection.
Holdings that contributed positively to performance relative to the Index included Facebook and Applied Materials. Facebook continued to perform well this reporting period. The company reported strong financial results and continued to increase its moat versus competitors. Applied Materials continued to see strong fundamentals driven by two distinct growth drivers: 1) the number of chips being made is growing; and 2) increasing manufacturing complexity requires more capital equipment. Strong growth in semiconductor unit demand continues to be driven by electronics content growth (not just iPhones but also autos and industrial), as well as build-outs of cloud data centers that demand the highest performance processors and storage. Chip manufacturing has also grown to be much more complex, requiring many more tools to complete the different steps in the process.
Holdings that detracted from performance relative to the Index included PG&E and AutoZone. PG&E is one of the largest utility companies in California. The stock has been under pressure since the start of the Northern California wildfires due to concerns that some of the company’s equipment may have played a role in some of the fires. The stock saw further pressure after the company announced they would be suspending the dividend to preserve cash for potential future claims. We reduced the position size due to the current level of uncertainty. AutoZone’s underperformance has been driven by a deceleration in same store sales and the narrative that the deceleration was partially being driven by Amazon encroaching on the auto parts retail business. The stock has rebounded more recently after a stabilization of same store sales and lessening concerns about the health of the industry.
FIXED-INCOME STRATEGY REVIEW
The Fund’s fixed-income strategy outperformed the Bloomberg Barclays U.S. Aggregate Bond Index this reporting period. Primarily contributing to the Fund’s relative performance was its underweight to U.S. Treasuries, its allocation to non-agency MBS and allocation to high yield credit. Primarily detracting from relative performance was the Fund’s overweight to asset-backed securities and security selection within agency MBS.
Investors should consider the Fund’s investment objective, risks, charges and expenses carefully before investing. The Fund’s prospectus and summary prospectus contain this and other information about the Fund, and may be obtained by asking your financial advisor or calling us at 1.800.988.8287. Read prospectuses and summary prospectuses carefully before investing.
3 OPPENHEIMER CONSERVATIVE BALANCED FUND/VA
Total returns include changes in share price and reinvestment of dividends and capital gains distributions in a hypothetical investment for the periods shown, but do not include the charges associated with the separate account products that offer this Fund.
The Fund’s investment strategy and focus can change over time. The mention of specific fund holdings does not constitute a recommendation by OppenheimerFunds, Inc. or its affiliates.
Shares of Oppenheimer funds are not deposits or obligations of any bank, are not guaranteed by any bank, are not insured by the FDIC or any other agency, and involve investment risks, including the possible loss of the principal amount invested.
Comparing the Fund’s Performance to the Market. The graphs that follow show the performance of a hypothetical $10,000 investment in each share class of the Fund held until December 31, 2017. Performance is measured over a ten-fiscal-year period for both Classes. Performance information does not reflect charges that apply to separate accounts investing in the Fund. If these charges were taken into account, performance would be lower. The graphs assume that all dividends and capital gains distributions were reinvested in additional shares.
The Fund’s performance is compared to the performance of the Russell 3000 Index, the Bloomberg Barclays U.S. Aggregate Bond Index and the Fund’s Reference Index. The Russell 3000 Index measures the performance of the largest 3,000 U.S. companies, representing approximately 98% of the investable U.S. equity market. The Bloomberg Barclays U.S. Aggregate Bond Index is an index of U.S dollar-denominated, investment-grade U.S. corporate government and mortgage-backed securities. The Fund’s Reference Index is a customized weighted index currently comprised of 65% of the Bloomberg Barclays U.S. Aggregate Bond Index and 35% of the Russell 3000 Index. The indices are unmanaged and cannot be purchased directly by investors. While index comparisons may be useful to provide a benchmark for the Fund’s performance, it must be noted that the Fund’s investments are not limited to the investments comprising the indices. Index performance includes reinvestment of income, but does not reflect transaction costs, fees, expenses or taxes. Index performance is shown for illustrative purposes only as a benchmark for the Fund’s performance, and does not predict or depict performance of the Fund. The Fund’s performance reflects the effects of the Fund’s business and operating expenses.
4 OPPENHEIMER CONSERVATIVE BALANCED FUND/VA
COMPARISON OF CHANGE IN VALUE OF $10,000 HYPOTHETICAL INVESTMENTS IN:
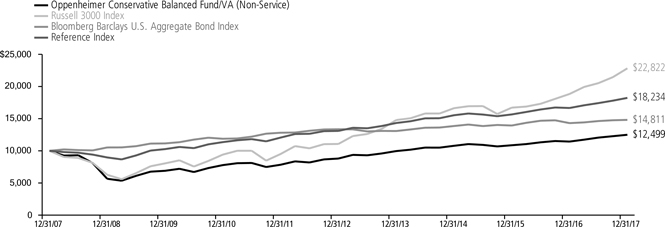
Average Annual Total Returns of Non-Service Shares of the Fund at 12/31/17
| | | | | | | | |
1-Year 9.25% | | 5-Year 7.26% | | | 10-Year 2.26 | % | | |
COMPARISON OF CHANGE IN VALUE OF $10,000 HYPOTHETICAL INVESTMENTS IN:
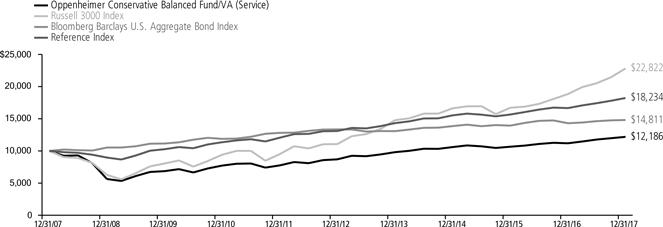
Average Annual Total Returns of Service Shares of the Fund at 12/31/17
| | | | | | | | |
1-Year 8.95% | | 5-Year 6.99% | | | 10-Year 2.00 | % | | |
Performance data quoted represents past performance, which does not guarantee future results. The investment return and principal value of an investment in the Fund will fluctuate so that an investor’s shares, when redeemed, may be worth more or less than their original cost. Current performance may be lower or higher than the performance quoted. For performance data current to the most recent month end, call us at 1.800.988.8287. The Fund’s total returns should not be expected to be the same as the returns of other funds, whether or not both funds have the same portfolio managers and/or similar names. The Fund’s total returns include changes in share price and reinvested distributions but do not include the charges associated with the separate account products that offer this Fund. Such performance would have been lower if such charges were taken into account.
5 OPPENHEIMER CONSERVATIVE BALANCED FUND/VA
Fund Expenses
Fund Expenses. As a shareholder of the Fund, you incur two types of costs: (1) transaction costs and (2) ongoing costs, including management fees; distribution and service fees; and other Fund expenses. These examples are intended to help you understand your ongoing costs (in dollars) of investing in the Fund and to compare these costs with the ongoing costs of investing in other mutual funds.
The examples are based on an investment of $1,000.00 invested at the beginning of the period and held for the entire 6-month period ended December 31, 2017.
Actual Expenses. The first section of the table provides information about actual account values and actual expenses. You may use the information in this section for the class of shares you hold, together with the amount you invested, to estimate the expense that you paid over the period. Simply divide your account value by $1,000.00 (for example, an $8,600.00 account value divided by $1,000.00 = 8.60), then multiply the result by the number in the first section under the heading entitled “Expenses Paid During 6 Months Ended December 31, 2017” to estimate the expenses you paid on your account during this period.
Hypothetical Example for Comparison Purposes.
The second section of the table provides information about hypothetical account values and hypothetical expenses based on the Fund’s actual expense ratio for each class of shares, and an assumed rate of return of 5% per year for each class before expenses, which is not the actual return. The hypothetical account values and expenses may not be used to estimate the actual ending account balance or expenses you paid for the period. You may use this information to compare the ongoing costs of investing in the Fund and other funds. To do so, compare this 5% hypothetical example for the class of shares you hold with the 5% hypothetical examples that appear in the shareholder reports of the other funds.
Please note that the expenses shown in the table are meant to highlight your ongoing costs only and do not reflect any charges associated with the separate accounts that offer this Fund. Therefore, the “hypothetical” lines of the table are useful in comparing ongoing costs only, and will not help you determine the relative total costs of owning different funds. In addition, if these separate account charges were included your costs would have been higher.
| | | | | | | | | | | | |
| Actual | | Beginning Account Value July 1, 2017 | | | Ending Account Value December 31, 2017 | | | Expenses Paid During 6 Months Ended
December 31, 2017 | |
Non-Service shares | | | $ 1,000.00 | | | | $ 1,036.50 | | | | $ 3.44 | |
Service shares | | | 1,000.00 | | | | 1,034.90 | | | | 4.73 | |
| | | |
| Hypothetical | | | | | | | | | |
| (5% return before expenses) | | | | | | | | | |
Non-Service shares | | | 1,000.00 | | | | 1,021.83 | | | | 3.42 | |
Service shares | | | 1,000.00 | | | | 1,020.57 | | | | 4.70 | |
Expenses are equal to the Fund’s annualized expense ratio for that class, multiplied by the average account value over the period, multiplied by 184/365 (to reflect the one-half year period). Those annualized expense ratios, excluding indirect expenses from affiliated funds, based on the 6-month period ended December 31, 2017 are as follows:
| | | | |
| Class | | Expense Ratios | |
Non-Service shares | | | 0.67% | |
Service shares | | | 0.92 | |
The expense ratios reflect voluntary and/or contractual waivers and/or reimbursements of expenses by the Fund’s Manager. Some of these undertakings may be modified or terminated at any time, as indicated in the Fund’s prospectus. The “Financial Highlights” tables in the Fund’s financial statements, included in this report, also show the gross expense ratios, without such waivers or reimbursements and reduction to custodian expenses, if applicable.
6 OPPENHEIMER CONSERVATIVE BALANCED FUND/VA
STATEMENT OF INVESTMENTS December 31, 2017
| | | | | | | | |
| | | Shares | | | Value | |
| |
Common Stocks—34.9% | | | | | | | | |
| |
| Consumer Discretionary—3.4% | |
| |
| Auto Components—0.4% | | | | | | | | |
| |
| Visteon Corp.1 | | | 6,210 | | | $ | 777,119 | |
|
| |
| Diversified Consumer Services—0.0% | |
| |
| Houghton Mifflin Harcourt Co.1 | | | 1,738 | | | | 16,163 | |
|
| |
| Hotels, Restaurants & Leisure—0.8% | |
| |
| Cedar Fair LP2 | | | 5,485 | | | | 356,470 | |
| |
| McDonald’s Corp. | | | 7,636 | | | | 1,314,309 | |
| |
| Starbucks Corp. | | | 254 | | | | 14,587 | |
| | | | | | | | |
| | | | | | | 1,685,366 | |
|
| |
| Household Durables—0.5% | | | | | | | | |
| |
| Mohawk Industries, Inc.1 | | | 2,468 | | | | 680,921 | |
| |
| Newell Brands, Inc. | | | 10,706 | | | | 330,815 | |
| | | | | | | | |
| | | | | | | 1,011,736 | |
|
| |
| Internet & Catalog Retail—0.0% | |
| |
| Amazon.com, Inc.1 | | | 36 | | | | 42,101 | |
| |
| Netflix, Inc.1 | | | 25 | | | | 4,799 | |
| |
| Priceline Group, Inc. (The)1 | | | 5 | | | | 8,689 | |
| | | | | | | | |
| | | | | | | 55,589 | |
|
| |
| Leisure Products—0.0% | | | | | | | | |
| |
| American Outdoor Brands Corp.1 | | | 1,164 | | | | 14,946 | |
| |
| Hasbro, Inc. | | | 78 | | | | 7,089 | |
| | | | | | | | |
| | | | | | | 22,035 | |
|
| |
| Media—0.4% | | | | | | | | |
| |
| Pearson plc, Sponsored ADR | | | 1,667 | | | | 16,370 | |
| |
| Walt Disney Co. (The) | | | 8,386 | | | | 901,579 | |
| | | | | | | | |
| | | | | | | 917,949 | |
|
| |
| Multiline Retail—0.0% | | | | | | | | |
| |
| Dollar General Corp. | | | 165 | | | | 15,347 | |
| |
| Fred’s, Inc., Cl. A | | | 4,783 | | | | 19,371 | |
| | | | | | | | |
| | | | | | | 34,718 | |
|
| |
| Specialty Retail—0.8% | | | | | | | | |
| |
| Bed Bath & Beyond, Inc. | | | 782 | | | | 17,196 | |
| |
| Burlington Stores, Inc.1 | | | 5,706 | | | | 702,009 | |
| |
| GNC Holdings, Inc., Cl. A1 | | | 1,642 | | | | 6,059 | |
| |
| Lowe’s Cos., Inc. | | | 11,046 | | | | 1,026,615 | |
| |
| Office Depot, Inc. | | | 5,174 | | | | 18,316 | |
| |
| Sally Beauty Holdings, Inc.1 | | | 1,015 | | | | 19,042 | |
| |
| TravelCenters of America LLC1 | | | 2,052 | | | | 8,413 | |
| | | | | | | | |
| | | | | | | 1,797,650 | |
|
| |
| Textiles, Apparel & Luxury Goods—0.5% | |
| |
| Fossil Group, Inc.1 | | | 1,450 | | | | 11,267 | |
| |
| Hanesbrands, Inc. | | | 332 | | | | 6,942 | |
| |
| NIKE, Inc., Cl. B | | | 17,282 | | | | 1,080,989 | |
| | | | | | | | |
| | | | | | | 1,099,198 | |
|
| |
| Consumer Staples—2.4% | | | | | | | | |
| |
| Beverages—0.8% | | | | | | | | |
| |
| Boston Beer Co., Inc. (The), Cl. A1 | | | 90 | | | | 17,199 | |
| |
| Constellation Brands, Inc., Cl. A | | | 35 | | | | 8,000 | |
| |
| Molson Coors Brewing Co., Cl. B | | | 8,778 | | | | 720,410 | |
| |
| PepsiCo, Inc. | | | 8,843 | | | | 1,060,453 | |
| | | | | | | | |
| | | | | | | 1,806,062 | |
|
| |
| Food & Staples Retailing—0.2% | | | | | | | | |
| |
| CVS Health Corp. | | | 228 | | | | 16,530 | |
| |
| Kroger Co. (The) | | | 827 | | | | 22,701 | |
| |
| Rite Aid Corp.1 | | | 174,233 | | | | 343,239 | |
| |
| SpartanNash Co. | | | 527 | | | | 14,060 | |
| |
| SUPERVALU, Inc.1 | | | 1,006 | | | | 21,730 | |
| | | | | | | | |
| | | | | | | 418,260 | |
|
| |
| Food Products—0.7% | | | | | | | | |
| |
| Campbell Soup Co. | | | 444 | | | | 21,361 | |
| |
| Dean Foods Co. | | | 1,874 | | | | 21,663 | |
| |
| Kellogg Co. | | | 315 | | | | 21,414 | |
| | | | | | | | |
| | | Shares | | | Value | |
| |
| Food Products (Continued) | | | | | | | | |
| |
| Kraft Heinz Co. (The) | | | 10,190 | | | $ | 792,374 | |
| |
| Pinnacle Foods, Inc. | | | 10,554 | | | | 627,646 | |
| |
| TreeHouse Foods, Inc.1 | | | 371 | | | | 18,350 | |
| | | | | | | | |
| | | | | | | 1,502,808 | |
|
| |
| Household Products—0.3% | | | | | | | | |
| |
| Spectrum Brands Holdings, Inc. | | | 5,960 | | | | 669,904 | |
|
| |
| Personal Products—0.0% | | | | | | | | |
| |
| Avon Products, Inc.1 | | | 9,223 | | | | 19,830 | |
| |
| Coty, Inc., Cl. A | | | 1,151 | | | | 22,893 | |
| | | | | | | | |
| | | | | | | 42,723 | |
|
| |
| Tobacco—0.4% | | | | | | | | |
| |
| Altria Group, Inc. | | | 372 | | | | 26,565 | |
| |
| British American Tobacco plc | | | 10,850 | | | | 732,271 | |
| |
| Philip Morris International, Inc. | | | 119 | | | | 12,572 | |
| |
| Universal Corp. | | | 354 | | | | 18,585 | |
| | | | | | | | |
| | | | | | | 789,993 | |
|
| |
| Energy—2.1% | | | | | | | | |
| |
| Energy Equipment & Services—0.6% | |
| |
| Diamond Offshore Drilling, Inc.1 | | | 819 | | | | 15,225 | |
| |
| Schlumberger Ltd. | | | 20,093 | | | | 1,354,068 | |
| | | | | | | | |
| | | | | | | 1,369,293 | |
|
| |
| Oil, Gas & Consumable Fuels—1.5% | |
| |
| EQT Corp. | | | 15,577 | | | | 886,643 | |
| |
| Matador Resources Co.1 | | | 192 | | | | 5,977 | |
| |
| Noble Energy, Inc. | | | 22,041 | | | | 642,275 | |
| |
| Range Resources Corp. | | | 1,041 | | | | 17,759 | |
| |
| Shell Midstream Partners LP2 | | | 18,205 | | | | 542,873 | |
| |
| Suncor Energy, Inc. | | | 28,860 | | | | 1,059,739 | |
| | | | | | | | |
| | | | | | | 3,155,266 | |
|
| |
| Financials—6.7% | | | | | | | | |
| |
| Capital Markets—0.8% | | | | | | | | |
| |
| Bank of New York Mellon Corp. (The) | | | 12,060 | | | | 649,551 | |
| |
| Charles Schwab Corp. (The) | | | 186 | | | | 9,555 | |
| |
| Intercontinental Exchange, Inc. | | | 15,789 | | | | 1,114,072 | |
| | | | | | | | |
| | | | | | | 1,773,178 | |
|
| |
| Commercial Banks—2.7% | | | | | | | | |
| |
| Citigroup, Inc. | | | 11,360 | | | | 845,298 | |
| |
| IBERIABANK Corp. | | | 7,010 | | | | 543,275 | |
| |
| JPMorgan Chase & Co. | | | 21,510 | | | | 2,300,279 | |
| |
| Signature Bank (New York)1 | | | 4,590 | | | | 630,023 | |
| |
| Wells Fargo & Co. | | | 27,140 | | | | 1,646,584 | |
| | | | | | | | |
| | | | | | | 5,965,459 | |
|
| |
| Consumer Finance—0.5% | | | | | | | | |
| |
| Synchrony Financial | | | 25,510 | | | | 984,941 | |
|
| |
| Insurance—1.2% | | | | | | | | |
| |
| American International Group, Inc. | | | 17,710 | | | | 1,055,162 | |
| |
| Chubb Ltd. | | | 5,200 | | | | 759,876 | |
| |
| Marsh & McLennan Cos., Inc. | | | 101 | | | | 8,220 | |
| |
| Progressive Corp. (The) | | | 12,625 | | | | 711,040 | |
| |
| Validus Holdings Ltd. | | | 421 | | | | 19,753 | |
| |
| XL Group Ltd. | | | 590 | | | | 20,745 | |
| | | | | | | | |
| | | | | | | 2,574,796 | |
|
| |
| Real Estate Investment Trusts (REITs)—1.4% | |
| |
| AGNC Investment Corp. | | | 1,006 | | | | 20,311 | |
| |
| American Tower Corp. | | | 31 | | | | 4,423 | |
| |
| Brandywine Realty Trust | | | 27,160 | | | | 494,040 | |
| |
| Crown Castle International Corp. | | | 4,290 | | | | 476,233 | |
| |
| CubeSmart | | | 24,457 | | | | 707,297 | |
| |
| CYS Investments, Inc. | | | 2,474 | | | | 19,866 | |
| |
| EPR Properties | | | 6,810 | | | | 445,783 | |
| |
| Mid-America Apartment Communities, Inc. | | | 8,620 | | | | 866,827 | |
| | | | | | | | |
| | | | | | | 3,034,780 | |
7 OPPENHEIMER CONSERVATIVE BALANCED FUND/VA
STATEMENT OF INVESTMENTS Continued
| | | | | | | | |
| | |
Shares | | | Value | |
| |
| Real Estate Management & Development—0.1% | |
| |
| Realogy Holdings Corp. | | | 12,240 | | | $ | 324,360 | |
|
| |
| Health Care—3.9% | | | | | | | | |
| |
| Biotechnology—0.6% | | | | | | | | |
| |
| AbbVie, Inc. | | | 166 | | | | 16,054 | |
| |
| Alexion Pharmaceuticals, Inc.1 | | | 39 | | | | 4,664 | |
| |
| BioMarin Pharmaceutical, Inc.1 | | | 3,030 | | | | 270,185 | |
| |
| Celgene Corp.1 | | | 9,000 | | | | 939,240 | |
| |
| Exact Sciences Corp.1 | | | 100 | | | | 5,254 | |
| |
| Exelixis, Inc.1 | | | 137 | | | | 4,165 | |
| | | | | | | | |
| | | | | | | 1,239,562 | |
|
| |
| Health Care Equipment & Supplies—0.6% | | | | | |
| |
| Boston Scientific Corp.1 | | | 353 | | | | 8,751 | |
| |
| CryoPort, Inc.1 | | | 7,880 | | | | 67,689 | |
| |
| IDEXX Laboratories, Inc.1 | | | 36 | | | | 5,630 | |
| |
| Intuitive Surgical, Inc.1 | | | 19 | | | | 6,934 | |
| |
| NuVasive, Inc.1 | | | 7,240 | | | | 423,468 | |
| |
| Stryker Corp. | | | 5,641 | | | | 873,452 | |
| | | | | | | | |
| | | | | | | 1,385,924 | |
|
| |
| Health Care Providers & Services—0.4% | |
| |
| Aceto Corp. | | | 1,590 | | | | 16,425 | |
| |
| Centene Corp.1 | | | 3,200 | | | | 322,816 | |
| |
| Humana, Inc. | | | 39 | | | | 9,675 | |
| |
| LifePoint Health, Inc.1 | | | 217 | | | | 10,806 | |
| |
| UnitedHealth Group, Inc. | | | 104 | | | | 22,928 | |
| |
| WellCare Health Plans, Inc.1 | | | 2,630 | | | | 528,919 | |
| | | | | | | | |
| | | | | | | 911,569 | |
|
| |
| Life Sciences Tools & Services—0.3% | | | | | |
| |
| Agilent Technologies, Inc. | | | 10,601 | | | | 709,949 | |
| |
| Illumina, Inc.1 | | | 29 | | | | 6,336 | |
| | | | | | | | |
| | | | | | | 716,285 | |
|
| |
| Pharmaceuticals—2.0% | | | | | | | | |
| |
| AstraZeneca plc, Sponsored ADR | | | 593 | | | | 20,577 | |
| |
| Johnson & Johnson | | | 18,391 | | | | 2,569,591 | |
| |
| Mallinckrodt plc1 | | | 503 | | | | 11,348 | |
| |
| Merck & Co., Inc. | | | 25,989 | | | | 1,462,401 | |
| |
| Mylan NV1 | | | 408 | | | | 17,262 | |
| |
| Valeant Pharmaceuticals International, Inc.1 | | | 8,230 | | | | 171,019 | |
| | | | | | | | |
| | | | | | | 4,252,198 | |
|
| |
| Industrials—4.3% | | | | | |
| |
| Aerospace & Defense—1.0% | | | | | |
| |
| Boeing Co. (The) | | | 4,158 | | | | 1,226,236 | |
| |
| Lockheed Martin Corp. | | | 3,100 | | | | 995,255 | |
| | | | | | | | |
| | | | | | | 2,221,491 | |
|
| |
| Airlines—0.3% | | | | | | | | |
| |
| Spirit Airlines, Inc.1 | | | 12,853 | | | | 576,457 | |
|
| |
| Commercial Services & Supplies—0.8% | | | | | |
| |
| Essendant, Inc. | | | 1,592 | | | | 14,758 | |
| |
| KAR Auction Services, Inc. | | | 19,839 | | | | 1,002,068 | |
| |
| Pitney Bowes, Inc. | | | 1,141 | | | | 12,756 | |
| |
| RR Donnelley & Sons Co. | | | 1,697 | | | | 15,782 | |
| |
| Waste Connections, Inc. | | | 9,446 | | | | 670,099 | |
| | | | | | | | |
| | | | | | | 1,715,463 | |
|
| |
| Construction & Engineering—0.2% | | | | | |
| |
| Dycom Industries, Inc.1 | | | 4,700 | | | | 523,721 | |
|
| |
| Industrial Conglomerates—0.0% | | | | | |
| |
| General Electric Co. | | | 1,101 | | | | 19,212 | |
|
| |
| Machinery—1.0% | | | | | | | | |
| |
| Cummins, Inc. | | | 4,592 | | | | 811,131 | |
| |
| Stanley Black & Decker, Inc. | | | 4,176 | | | | 708,625 | |
| |
| Wabtec Corp. | | | 8,088 | | | | 658,606 | |
| | | | | | | | |
| | | | | | | 2,178,362 | |
| | | | | | | | |
| | |
Shares | | | Value | |
| |
| Professional Services—0.4% | | | | | |
| |
| Equifax, Inc. | | | 46 | | | $ | 5,424 | |
| |
| Korn/Ferry International | | | 18,020 | | | | 745,668 | |
| |
| On Assignment, Inc.1 | | | 127 | | | | 8,162 | |
| | | | | | | | |
| | | | | | | 759,254 | |
|
| |
| Road & Rail—0.3% | | | | | | | | |
| |
| Canadian Pacific Railway Ltd. | | | 3,860 | | | | 705,454 | |
|
| |
| Trading Companies & Distributors—0.3% | | | | | |
| |
| Fastenal Co. | | | 212 | | | | 11,594 | |
| |
| Watsco, Inc. | | | 3,833 | | | | 651,764 | |
| | | | | | | | |
| | | | | | | 663,358 | |
|
| |
| Information Technology—8.8% | | | | | |
| |
| Communications Equipment—0.4% | | | | | |
| |
| Nokia OYJ, Sponsored ADR | | | 3,225 | | | | 15,028 | |
| |
| Palo Alto Networks, Inc.1 | | | 6,383 | | | | 925,152 | |
| | | | | | | | |
| | | | | | | 940,180 | |
|
| |
| Internet Software & Services—2.5% | | | | | |
| |
| Alphabet, Inc., Cl. C1 | | | 1,935 | | | | 2,024,784 | |
| |
| eBay, Inc.1 | | | 30,463 | | | | 1,149,674 | |
| |
| Envestnet, Inc.1 | | | 96 | | | | 4,785 | |
| |
| Facebook, Inc., Cl. A1 | | | 8,433 | | | | 1,488,087 | |
| |
| Pandora Media, Inc.1 | | | 2,517 | | | | 12,132 | |
| |
| Q2 Holdings, Inc.1 | | | 240 | | | | 8,844 | |
| |
| Yelp, Inc., Cl. A1 | | | 18,002 | | | | 755,364 | |
| | | | | | | | |
| | | | | | | 5,443,670 | |
|
| |
| IT Services—1.5% | | | | | | | | |
| |
| CACI International, Inc., Cl. A1 | | | 35 | | | | 4,632 | |
| |
| DXC Technology Co. | | | 8,450 | | | | 801,905 | |
| |
| Mastercard, Inc., Cl. A | | | 8,325 | | | | 1,260,072 | |
| |
| PayPal Holdings, Inc.1 | | | 176 | | | | 12,957 | |
| |
| Teradata Corp.1 | | | 13,720 | | | | 527,671 | |
| |
| Total System Services, Inc. | | | 8,115 | | | | 641,816 | |
| | | | | | | | |
| | | | | | | 3,249,053 | |
|
| |
| Semiconductors & Semiconductor Equipment—0.7% | |
| |
| Applied Materials, Inc. | | | 269 | | | | 13,752 | |
| |
| Broadcom Ltd. | | | 48 | | | | 12,331 | |
| |
| Microchip Technology, Inc. | | | 10,225 | | | | 898,573 | |
| |
| MKS Instruments, Inc. | | | 7,160 | | | | 676,620 | |
| |
| Texas Instruments, Inc. | | | 130 | | | | 13,577 | |
| | | | | | | | |
| | | | | | | 1,614,853 | |
|
| |
| Software—2.0% | | | | | | | | |
| |
| Microsoft Corp. | | | 24,728 | | | | 2,115,233 | |
| |
| MobileIron, Inc.1 | | | 2,506 | | | | 9,774 | |
| |
| Pegasystems, Inc. | | | 14,647 | | | | 690,606 | |
| |
| PTC, Inc.1 | | | 190 | | | | 11,546 | |
| |
| Snap, Inc., Cl. A1 | | | 45,595 | | | | 666,143 | |
| |
| Zynga, Inc., Cl. A1 | | | 185,962 | | | | 743,848 | |
| | | | | | | | |
| | | | | | | 4,237,150 | |
|
| |
| Technology Hardware, Storage & Peripherals—1.7% | |
| |
| Apple, Inc. | | | 16,227 | | | | 2,746,095 | |
| |
| BlackBerry Ltd.1 | | | 639 | | | | 7,138 | |
| |
| Diebold Nixdorf, Inc. | | | 840 | | | | 13,734 | |
| |
| Eastman Kodak Co.1 | | | 3,291 | | | | 10,202 | |
| |
| Western Digital Corp. | | | 12,107 | | | | 962,870 | |
| | | | | | | | |
| | | | | | | 3,740,039 | |
|
| |
| Materials—1.4% | | | | | | | | |
| |
| Chemicals—0.9% | | | | | | | | |
| |
| DowDuPont, Inc. | | | 16,161 | | | | 1,150,987 | |
| |
| Eastman Chemical Co. | | | 7,610 | | | | 704,990 | |
| | | | | | | | |
| | | | | | | 1,855,977 | |
|
| |
| Construction Materials—0.3% | | | | | |
| |
| Vulcan Materials Co. | | | 4,921 | | | | 631,709 | |
|
| |
| Metals & Mining—0.2% | | | | | | | | |
| |
| Franco-Nevada Corp. | | | 187 | | | | 14,951 | |
8 OPPENHEIMER CONSERVATIVE BALANCED FUND/VA
| | | | | | | | |
| | |
Shares | | | Value | |
| |
| Metals & Mining (Continued) | |
| |
| Kaiser Aluminum Corp. | | | 50 | | | $ | 5,342 | |
| |
| Osisko Gold Royalties Ltd. | | | 34,237 | | | | 395,482 | |
| |
| Tahoe Resources, Inc. | | | 3,521 | | | | 16,866 | |
| | | | | | | | |
| | | | | | | 432,641 | |
|
| |
| Telecommunication Services—0.8% | |
| |
| Diversified Telecommunication Services—0.6% | |
| |
| AT&T, Inc. | | | 693 | | | | 26,944 | |
| |
| ORBCOMM, Inc.1 | | | 375 | | | | 3,817 | |
| |
| Verizon Communications, Inc. | | | 23,374 | | | | 1,237,186 | |
| |
| Zayo Group Holdings, Inc.1 | | | 210 | | | | 7,728 | |
| | | | | | | | |
| | | | | | | 1,275,675 | |
|
| |
| Wireless Telecommunication Services—0.2% | |
| |
| T-Mobile US, Inc.1 | | | 8,179 | | | | 519,449 | |
|
| |
| Utilities—1.1% | | | | | | | | |
| |
| Electric Utilities—0.5% | | | | | |
| |
| Edison International | | | 160 | | | | 10,118 | |
| |
| PG&E Corp. | | | 20,314 | | | | 910,677 | |
| |
| Southern Co. (The) | | | 300 | | | | 14,427 | |
| | | | | | | | |
| | | | | | | 935,222 | |
|
| |
| Gas Utilities—0.2% | | | | | | | | |
| |
| Suburban Propane Partners LP2 | | | 19,456 | | | | 471,224 | |
|
| |
| Multi-Utilities—0.4% | | | | | | | | |
| |
| Centrica plc, Sponsored ADR | | | 2,396 | | | | 17,802 | |
| |
| National Grid plc | | | 46,590 | | | | 547,292 | |
| |
| National Grid plc, Sponsored ADR | | | 277 | | | | 16,291 | |
| |
| SCANA Corp. | | | 8,781 | | | | 349,308 | |
| | | | | | | | |
| | | | | | | 930,693 | |
| | | | | | | | |
| Total Common Stocks (Cost $63,158,647) | | | | 75,975,191 | |
| | |
| | | Principal
Amount | | | | |
| |
Asset-Backed Securities—9.0% | |
| |
American Credit Acceptance Receivables Trust: | |
| Series 2014-4, Cl. D, 5.24%, 2/10/223 | | $ | 60,000 | | | | 60,334 | |
| Series 2015-1, Cl. B, 2.85%, 2/12/213 | | | 20,170 | | | | 20,177 | |
| Series 2015-3, Cl. B, 3.56%, 10/12/213 | | | 92,553 | | | | 92,823 | |
| Series 2015-3, Cl. C, 4.84%, 10/12/213 | | | 470,000 | | | | 479,277 | |
| Series 2015-3, Cl. D, 5.86%, 7/12/223 | | | 135,000 | | | | 137,884 | |
| Series 2017-3, Cl. B, 2.25%, 1/11/213 | | | 70,000 | | | | 69,767 | |
| Series 2017-4, Cl. B, 2.61%, 5/10/213 | | | 69,000 | | | | 68,969 | |
| Series 2017-4, Cl. C, 2.94%, 1/10/243 | | | 195,000 | | | | 194,856 | |
| Series 2017-4, Cl. D, 3.57%, 1/10/243 | | | 166,000 | | | | 165,801 | |
| |
| AmeriCredit Automobile Receivables Trust: | |
| Series 2013-4, Cl. D, 3.31%, 10/8/19 | | | 35,000 | | | | 35,119 | |
| Series 2015-2, Cl. D, 3.00%, 6/8/21 | | | 245,000 | | | | 247,508 | |
| Series 2017-2, Cl. D, 3.42%, 4/18/23 | | | 320,000 | | | | 323,472 | |
| Series 2017-4, Cl. D, 3.08%, 12/18/23 | | | 245,000 | | | | 244,264 | |
| |
| Cabela’s Credit Card Master Note Trust: | |
| Series 2013-2A, Cl. A2, 2.127% | | | | | | | | |
| [LIBOR01M+65], 8/16/213,4 | | | 105,000 | | | | 105,364 | |
| Series 2016-1, Cl. A1, 1.78%, 6/15/22 | | | 340,000 | | | | 338,119 | |
| Series 2016-1, Cl. A2, 2.327% | | | | | | | | |
| [LIBOR01M+85], 6/15/224 | | | 615,000 | | | | 620,930 | |
| |
| Capital Auto Receivables Asset Trust: | |
| Series 2014-1, Cl. D, 3.39%, 7/22/19 | | | 140,000 | | | | 140,395 | |
| Series 2017-1, Cl. D, 3.15%, 2/20/253 | | | 40,000 | | | | 39,810 | |
| |
| Capital One Multi-Asset Execution Trust: | |
| Series 2016-A1, Cl. A1, 1.927% | | | | | | | | |
| [LIBOR01M+45], 2/15/224 | | | 390,000 | | | | 391,918 | |
| Series 2016-A3, Cl. A3, 1.34%, 4/15/22 | | | 560,000 | | | | 554,414 | |
| |
| CarFinance Capital Auto Trust: | |
| Series 2014-1A, Cl. D, 4.90%, 4/15/203 | | | 160,000 | | | | 162,361 | |
| Series 2015-1A, Cl. A, 1.75%, 6/15/213 | | | 36,614 | | | | 36,571 | |
| |
| CarMax Auto Owner Trust: | |
| Series 2015-2, Cl. D, 3.04%, 11/15/21 | | | 115,000 | | | | 115,587 | |
| Series 2015-3, Cl. D, 3.27%, 3/15/22 | | | 330,000 | | | | 331,155 | |
| | | | | | | | |
| | | Principal
Amount | | | Value | |
| |
Asset-Backed Securities (Continued) | |
| |
CarMax Auto Owner Trust: (Continued) | |
| Series 2016-1, Cl. D, 3.11%, 8/15/22 | | $ | 220,000 | | | $ | 221,657 | |
| Series 2016-3, Cl. D, 2.94%, 1/17/23 | | | 125,000 | | | | 123,683 | |
| Series 2016-4, Cl. D, 2.91%, 4/17/23 | | | 275,000 | | | | 271,545 | |
| Series 2017-1, Cl. D, 3.43%, 7/17/23 | | | 245,000 | | | | 245,139 | |
| Series 2017-4, Cl. D, 3.30%, 5/15/24 | | | 110,000 | | | | 109,267 | |
| |
| CCG Receivables Trust, Series 2017-1, Cl. B, 2.75%, 11/14/233 | | | 250,000 | | | | 247,575 | |
| |
| Chase Issuance Trust, Series 2014-A5, Cl. A5, 1.847% [LIBOR01M+37], 4/15/214 | | | 245,000 | | | | 245,967 | |
| |
| CIG Auto Recevables Trust, Series 2017-1A, Cl. A, 2.71%, 5/15/233 | | | 133,352 | | | | 133,169 | |
| |
| Citibank Credit Card Issuance Trust, | | | | | | | | |
| Series 2014-A6, Cl. A6, 2.15%, 7/15/21 | | | 110,000 | | | | 110,139 | |
| |
| CNH Equipment Trust, Series 2017-C, | | | | | | | | |
| Cl. B, 2.54%, 5/15/25 | | | 70,000 | | | | 69,675 | |
| |
| CPS Auto Receivables Trust: | |
| Series 2013-C, Cl. D, 6.59%, 8/15/193 | | | 110,000 | | | | 111,857 | |
| Series 2017-C, Cl. A, 1.78%, 9/15/203 | | | 73,847 | | | | 73,738 | |
| Series 2017-C, Cl. B, 2.30%, 7/15/213 | | | 105,000 | | | | 104,600 | |
| |
| CPS Auto Trust: | | | | | | | | |
| Series 2017-A, Cl. B, 2.68%, 5/17/213 | | | 35,000 | | | | 35,054 | |
| Series 2017-D, Cl. B, 2.43%, 1/18/223 | | | 180,000 | | | | 179,407 | |
| |
| Credit Acceptance Auto Loan Trust, Series 2017-3A, Cl. C, 3.48%, 10/15/265 | | | 220,000 | | | | 218,538 | |
| |
| CWABS Asset-Backed Certificates | |
| Trust, Series 2005-14, Cl. 1A1, 1.782% [US0001M+23], 4/25/364 | | | 105,809 | | | | 106,041 | |
| |
| Dell Equipment Finance Trust, Series 2017-2, Cl. B, 2.47%, 10/24/223 | | | 75,000 | | | | 74,599 | |
| |
| Discover Card Execution Note Trust: | |
| Series 2012-A6, Cl. A6, 1.67%, 1/18/22 | | | 310,000 | | | | 308,302 | |
| Series 2016-A1, Cl. A1, 1.64%, 7/15/21 | | | 615,000 | | | | 613,119 | |
| Series 2016-A4, Cl. A4, 1.39%, 3/15/22 | | | 660,000 | | | | 652,085 | |
| |
| Drive Auto Receivables Trust: | |
| Series 2015-BA, Cl. D, 3.84%, 7/15/213 | | | 20,000 | | | | 20,323 | |
| Series 2015-CA, Cl. D, 4.20%, 9/15/213 | | | 70,000 | | | | 71,519 | |
| Series 2016-BA, Cl. C, 3.19%, 7/15/223 | | | 170,000 | | | | 171,314 | |
| Series 2016-CA, Cl. C, 3.02%, 11/15/213 | | | 150,000 | | | | 151,169 | |
| Series 2016-CA, Cl. D, 4.18%, 3/15/243 | | | 170,000 | | | | 174,650 | |
| Series 2017-1, Cl. B, 2.36%, 3/15/21 | | | 165,000 | | | | 165,179 | |
| Series 2017-2, Cl. B, 2.25%, 6/15/21 | | | 105,000 | | | | 105,066 | |
| Series 2017-2, Cl. C, 2.75%, 9/15/23 | | | 115,000 | | | | 115,211 | |
| Series 2017-3, Cl. C, 2.80%, 7/15/22 | | | 120,000 | | | | 120,106 | |
| Series 2017-AA, Cl. C, 2.98%, 1/18/223 | | | 195,000 | | | | 196,374 | |
| Series 2017-AA, Cl. D, 4.16%, 5/15/243 | | | 225,000 | | | | 230,774 | |
| Series 2017-BA, Cl. D, 3.72%, 10/17/223 | | | 235,000 | | | | 238,235 | |
| |
| DT Auto Owner Trust: | | | | | | | | |
| Series 2014-2A, Cl. D, 3.68%, 4/15/213 | | | 366,345 | | | | 367,540 | |
| Series 2016-1A, Cl. B, 2.79%, 5/15/203 | | | 7,962 | | | | 7,965 | |
| Series 2016-4A, Cl. E, 6.49%, 9/15/233 | | | 75,000 | | | | 77,156 | |
| Series 2017-1A, Cl. C, 2.70%, 11/15/223 | | | 95,000 | | | | 94,789 | |
| Series 2017-1A, Cl. D, 3.55%, 11/15/223 | | | 150,000 | | | | 150,008 | |
| Series 2017-1A, Cl. E, 5.79%, 2/15/243 | | | 160,000 | | | | 162,609 | |
| Series 2017-2A, Cl. B, 2.44%, 2/15/213 | | | 140,000 | | | | 140,260 | |
| Series 2017-2A, Cl. D, 3.89%, 1/15/233 | | | 180,000 | | | | 181,331 | |
| Series 2017-3A, Cl. B, 2.40%, 5/17/213 | | | 200,000 | | | | 199,461 | |
| Series 2017-3A, Cl. E, 5.60%, 8/15/243 | | | 155,000 | | | | 157,332 | |
9 OPPENHEIMER CONSERVATIVE BALANCED FUND/VA
STATEMENT OF INVESTMENTS Continued
| | | | | | | | |
| | | Principal
Amount | | | Value | |
| |
Asset-Backed Securities (Continued) | |
| |
| DT Auto Owner Trust: (Continued) | | | | | |
| Series 2017-4A, Cl. D, 3.47%, 7/17/233 | | $ | 205,000 | | | $ | 204,583 | |
| Series 2017-4A, Cl. E, 5.15%, 11/15/243 | | | 150,000 | | | | 150,122 | |
| |
| Element Rail Leasing I LLC, Series 2014-1A, Cl. A1, 2.299%, 4/19/443 | | | 192,645 | | | | 192,250 | |
| |
| Evergreen Credit Card Trust, | | | | | | | | |
| Series 2016-3, Cl. A, 1.977% | | | | | | | | |
| [LIBOR01M+50], 11/16/203,4 | | | 480,000 | | | | 481,627 | |
| |
| Exeter Automobile Receivables Trust: | | | | | |
| Series 2013-2A, Cl. D, 6.81%, 8/17/203 | | | 292,278 | | | | 294,846 | |
| Series 2014-2A, Cl. C, 3.26%, 12/16/193 | | | 86,639 | | | | 86,964 | |
| Series 2017-3A, Cl. A, 2.05%, 12/15/213 | | | 146,122 | | | | 145,925 | |
| |
| Flagship Credit Auto Trust: | |
| Series 2013-2, Cl. D, 6.26%, 2/16/213 | | | 70,000 | | | | 70,529 | |
| Series 2014-1, Cl. D, 4.83%, 6/15/203 | | | 20,000 | | | | 20,390 | |
| Series 2016-1, Cl. C, 6.22%, 6/15/223 | | | 380,000 | | | | 401,794 | |
| |
| FRS I LLC, Series 2013-1A, Cl. A1, 1.80%, 4/15/433 | | | 17,670 | | | | 17,562 | |
| |
| GM Financial Automobile Leasing Trust, Series 2017-3, Cl. C, 2.73%, 9/20/21 | | | 120,000 | | | | 118,871 | |
| |
| Navistar Financial Dealer Note Master Owner Trust II: | |
| Series 2016-1, Cl. D, 4.852% | | | | | | | | |
| [LIBOR01M+330], 9/27/213,4 | | | 80,000 | | | | 80,134 | |
| Series 2017-1, Cl. C, 3.102% | | | | | | | | |
| [LIBOR01M+155], 6/27/223,4 | | | 60,000 | | | | 60,367 | |
| Series 2017-1, Cl. D, 3.852% | | | | | | | | |
| [LIBOR01M+230], 6/27/223,4 | | | 75,000 | | | | 75,040 | |
| |
| Nissan Auto Lease Trust, Series 2017-A, Cl. A3, 1.91%, 4/15/20 | | | 245,000 | | | | 244,191 | |
| |
| Santander Drive Auto Receivables Trust: | |
| Series 2013-A, Cl. E, 4.71%, 1/15/213 | | | 325,000 | | | | 327,294 | |
| Series 2016-2, Cl. D, 3.39%, 4/15/22 | | | 115,000 | | | | 116,760 | |
| Series 2017-1, Cl. D, 3.17%, 4/17/23 | | | 175,000 | | | | 175,995 | |
| Series 2017-1, Cl. E, 5.05%, 7/15/243 | | | 410,000 | | | | 421,639 | |
| Series 2017-3, Cl. D, 3.20%, 11/15/23 | | | 415,000 | | | | 415,769 | |
| |
| Santander Retail Auto Lease Trust, Series 2017-A, Cl. C, 2.96%, 11/21/223 | | | 195,000 | | | | 194,967 | |
| |
| TCF Auto Receivables Owner Trust, Series 2015-1A, Cl. D, 3.53%, 3/15/223 | | | 190,000 | | | | 189,508 | |
| |
| Verizon Owner Trust, Series 2017-3A, Cl. A1A, 2.06%, 4/20/223 | | | 195,000 | | | | 194,242 | |
| |
| Veros Automobile Receivables Trust, Series 2017-1, Cl. A, 2.84%, 4/17/233 | | | 148,372 | | | | 148,120 | |
| |
| Westlake Automobile Receivables Trust: | |
| Series 2016-1A, Cl. E, 6.52%, 6/15/223 | | | 200,000 | | | | 205,445 | |
| Series 2017-2A, Cl. E, 4.63%, 7/15/243 | | | 265,000 | | | | 265,636 | |
| |
| World Financial Network Credit Card Master Trust: | |
| Series 2012-D, Cl. A, 2.15%, 4/17/23 | | | 150,000 | | | | 149,905 | |
| Series 2016-B, Cl. A, 1.44%, 6/15/22 | | | 380,000 | | | | 378,921 | |
| Series 2017-A, Cl. A, 2.12%, 3/15/24 | | | 430,000 | | | | 428,429 | |
| Series 2017-B, Cl. A, 1.98%, 6/15/23 | | | 325,000 | | | | 324,131 | |
| Series 2017-C, Cl. A, 2.31%, 8/15/24 | | | 430,000 | | | | 428,411 | |
| | | | | | | | |
Total Asset-Backed Securities
(Cost $19,541,054) | | | | 19,540,769 | |
| | | | | | | | |
| |
Mortgage-Backed Obligations—38.0% | |
| |
Government Agency—27.4% | |
| |
FHLMC/FNMA/FHLB/Sponsored—21.1% | |
| |
| Federal Home Loan Mortgage Corp. Gold Pool: | | | | | |
| 4.50%, 10/1/18 | | | 4,279 | | | | 4,342 | |
| 5.00%, 12/1/34 | | | 2,302 | | | | 2,499 | |
| 5.50%, 9/1/39 | | | 305,239 | | | | 334,794 | |
| 6.50%, 4/1/18-4/1/34 | | | 21,106 | | | | 23,394 | |
| 7.00%, 10/1/31-10/1/37 | | | 76,017 | | | | 84,183 | |
| | | | | | | | |
| | | Principal
Amount | | | Value | |
| |
| FHLMC/FNMA/FHLB/Sponsored (Continued) | |
| |
| Federal Home Loan Mortgage Corp. Gold Pool: (Continued) | |
| 9.00%, 8/1/22-5/1/25 | | $ | 1,496 | | | $ | 1,593 | |
| |
| Federal Home Loan Mortgage Corp., Interest-Only Stripped Mtg.-Backed Security: | |
| Series 183,Cl. IO, 61.142%, 4/1/276 | | | 53,584 | | | | 11,264 | |
| Series 192,Cl. IO, 99.999%, 2/1/286 | | | 15,439 | | | | 2,890 | |
| Series 243,Cl. 6, 4.623%, 12/15/326 | | | 41,961 | | | | 7,197 | |
| |
| Federal Home Loan Mortgage Corp., Mtg.-Linked Amortizing Global Debt Securities, Series 2012-1, Cl. A10, 2.06%, 1/15/22 | | | 147,333 | | | | 146,769 | |
| |
| Federal Home Loan Mortgage Corp., Principal-Only Stripped Mtg.-Backed Security, Series 176, Cl. PO, 4.198%, 6/1/267 | | | 16,175 | | | | 15,050 | |
| |
| Federal Home Loan Mortgage Corp., Real Estate Mtg. Investment Conduit Multiclass Pass-Through Certificates: | |
| Series 2427,Cl. ZM, 6.50%, 3/15/32 | | | 92,741 | | | | 102,001 | |
| Series 2461,Cl. PZ, 6.50%, 6/15/32 | | | 37,036 | | | | 40,947 | |
| Series 2564,Cl. MP, 5.00%, 2/15/18 | | | 3,909 | | | | 3,913 | |
| Series 2585,Cl. HJ, 4.50%, 3/15/18 | | | 1,958 | | | | 1,960 | |
| Series 2626,Cl. TB, 5.00%, 6/15/33 | | | 63,311 | | | | 66,540 | |
| Series 2635,Cl. AG, 3.50%, 5/15/32 | | | 31,838 | | | | 32,366 | |
| Series 2707,Cl. QE, 4.50%, 11/15/18 | | | 51,732 | | | | 52,019 | |
| Series 2770,Cl. TW, 4.50%, 3/15/19 | | | 2,712 | | | | 2,739 | |
| Series 3010,Cl. WB, 4.50%, 7/15/20 | | | 11,479 | | | | 11,701 | |
| Series 3025,Cl. SJ, 19.334% [(3.667) x | | | | | | | | |
| LIBOR01M+2,475], 8/15/354 | | | 13,165 | | | | 19,162 | |
| Series 3030,Cl. FL, 1.877% | | | | | | | | |
| [LIBOR01M+40], 9/15/354 | | | 75,349 | | | | 75,700 | |
| Series 3741,Cl. PA, 2.15%, 2/15/35 | | | 69,178 | | | | 69,169 | |
| Series 3815,Cl. BD, 3.00%, 10/15/20 | | | 1,430 | | | | 1,434 | |
| Series 3822,Cl. JA, 5.00%, 6/15/40 | | | 30,892 | | | | 31,721 | |
| Series 3840,Cl. CA, 2.00%, 9/15/18 | | | 1,097 | | | | 1,095 | |
| Series 3848,Cl. WL, 4.00%, 4/15/40 | | | 75,952 | | | | 77,548 | |
| Series 3857,Cl. GL, 3.00%, 5/15/40 | | | 4,689 | | | | 4,737 | |
| Series 4221,Cl. HJ, 1.50%, 7/15/23 | | | 472,971 | | | | 466,094 | |
| |
| Federal Home Loan Mortgage Corp., Real Estate Mtg. Investment Conduit Multiclass Pass-Through Certificates, Interest-Only Stripped Mtg.-Backed Security: | |
| Series 2130,Cl. SC, 62.242%, 3/15/296 | | | 40,382 | | | | 6,468 | |
| Series 2796,Cl. SD, 54.874%, 7/15/266 | | | 73,235 | | | | 10,726 | |
| Series 2920,Cl. S, 7.147%, 1/15/356 | | | 375,335 | | | | 58,315 | |
| Series 2922,Cl. SE, 10.552%, 2/15/356 | | | 23,030 | | | | 3,804 | |
| Series 2981,Cl. AS, 7.463%, 5/15/356 | | | 207,680 | | | | 27,826 | |
| Series 3397,Cl. GS, 0.00%, 12/15/376,8 | | | 23,231 | | | | 3,753 | |
| Series 3424,Cl. EI, 0.00%, 4/15/386,8 | | | 10,620 | | | | 966 | |
| Series 3450,Cl. BI, 13.216%, 5/15/386 | | | 66,319 | | | | 9,855 | |
| Series 3606,Cl. SN, 16.296%, 12/15/396 | | | 36,067 | | | | 5,478 | |
| |
| Federal National Mortgage Assn.: | |
| 2.50%, 1/1/339 | | | 2,270,000 | | | | 2,267,680 | |
| 3.00%, 1/1/339 | | | 7,975,000 | | | | 8,125,553 | |
| 3.50%, 1/1/489 | | | 12,075,000 | | | | 12,405,591 | |
| 4.00%, 1/1/489 | | | 8,180,000 | | | | 8,559,373 | |
| 4.50%, 1/1/489 | | | 7,815,000 | | | | 8,315,600 | |
| 5.00%, 1/1/489 | | | 2,020,000 | | | | 2,171,816 | |
| |
| Federal National Mortgage Assn. Pool: | |
| 5.00%, 3/1/21 | | | 2,291 | | | | 2,334 | |
| 5.50%, 9/1/20 | | | 1,341 | | | | 1,371 | |
| 6.00%, 3/1/37 | | | 117,255 | | | | 131,890 | |
| 6.50%, 10/1/19 | | | 26 | | | | 26 | |
| 7.00%, 10/1/35 | | | 8,361 | | | | 8,655 | |
| 7.50%, 1/1/33 | | | 53,890 | | | | 63,275 | |
| 8.50%, 7/1/32 | | | 3,947 | | | | 4,226 | |
| |
| Federal National Mortgage Assn., Interest-Only Stripped Mtg.-Backed Security: | |
| Series 222,Cl. 2, 99.999%, 6/25/236 | | | 101,242 | | | | 13,018 | |
| Series 233,Cl. 2, 63.993%, 8/25/236 | | | 68,748 | | | | 10,526 | |
| Series 252,Cl. 2, 99.999%, 11/25/236 | | | 91,483 | | | | 13,514 | |
| Series 319,Cl. 2, 8.489%, 2/25/326 | | | 23,380 | | | | 5,289 | |
10 OPPENHEIMER CONSERVATIVE BALANCED FUND/VA
| | | | | | | | |
| | | Principal
Amount | | | Value | |
| |
FHLMC/FNMA/FHLB/Sponsored (Continued) | |
| |
| Federal National Mortgage Assn., Interest-Only Stripped Mtg.-Backed Security: (Continued) | |
| Series 320,Cl. 2, 40.637%, 4/25/326 | | $ | 8,545 | | | $ | 2,127 | |
| Series 321,Cl. 2, 12.992%, 4/25/326 | | | 83,366 | | | | 19,787 | |
| Series 331,Cl. 9, 20.652%, 2/25/336 | | | 100,466 | | | | 20,682 | |
| Series 334,Cl. 17, 17.833%, 2/25/336 | | | 53,806 | | | | 10,553 | |
| Series 339,Cl. 12, 0.00%, 6/25/336,8 | | | 72,595 | | | | 16,813 | |
| Series 339,Cl. 7, 0.00%, 11/25/336,8 | | | 208,488 | | | | 43,340 | |
| Series 343,Cl. 13, 0.00%, 9/25/336,8 | | | 78,263 | | | | 16,729 | |
| Series 345,Cl. 9, 0.00%, 1/25/346,8 | | | 70,699 | | | | 14,691 | |
| Series 351,Cl. 10, 0.00%, 4/25/346,8 | | | 9,354 | | | | 2,027 | |
| Series 351,Cl. 8, 0.00%, 4/25/346,8 | | | 33,297 | | | | 6,630 | |
| Series 356,Cl. 10, 0.00%, 6/25/356,8 | | | 22,984 | | | | 4,743 | |
| Series 356,Cl. 12, 0.00%, 2/25/356,8 | | | 12,348 | | | | 2,700 | |
| Series 362,Cl. 13, 0.00%, 8/25/356,8 | | | 88,984 | | | | 19,734 | |
| Series 364,Cl. 16, 0.00%, 9/25/356,8 | | | 63,379 | | | | 14,068 | |
| |
| Federal National Mortgage Assn., Real Estate Mtg. Investment Conduit Multiclass Pass-Through Certificates: | |
| Series 1998-61,Cl. PL, 6.00%, 11/25/28 | | | 39,234 | | | | 43,254 | |
| Series 2003-100,Cl. PA, 5.00%, 10/25/18 | | | 22,384 | | | | 22,480 | |
| Series 2003-130,Cl. CS, 10.996% [(2) x | | | | | | | | |
| LIBOR01M+1,410], 12/25/334 | | | 5,083 | | | | 5,400 | |
| Series 2003-84,Cl. GE, 4.50%, 9/25/18 | | | 1,869 | | | | 1,878 | |
| Series 2004-25,Cl. PC, 5.50%, 1/25/34 | | | 40,256 | | | | 40,780 | |
| Series 2005-104,Cl. MC, 5.50%, 12/25/25 | | | 153,910 | | | | 164,777 | |
| Series 2005-31,Cl. PB, 5.50%, 4/25/35 | | | 250,000 | | | | 276,677 | |
| Series 2005-73,Cl. DF, 1.802% [LIBOR01M+25], 8/25/354 | | | 89,603 | | | | 89,975 | |
| Series 2006-11,Cl. PS, 18.876% [(3.667) x LIBOR01M+2,456.67], 3/25/364 | | | 54,746 | | | | 85,488 | |
| Series 2006-46,Cl. SW, 18.508% [(3.667) x LIBOR01M+2,419.92], 6/25/364 | | | 36,002 | | | | 53,640 | |
| Series 2006-50,Cl. KS, 18.509% [(3.667) x LIBOR01M+2,420], 6/25/364 | | | 7,571 | | | | 11,499 | |
| Series 2008-75,Cl. DB, 4.50%, 9/25/23 | | | 9,845 | | | | 9,897 | |
| Series 2009-113,Cl. DB, 3.00%, 12/25/20 | | | 35,043 | | | | 35,161 | |
| Series 2009-36,Cl. FA, 2.492% [LIBOR01M+94], 6/25/374 | | | 34,585 | | | | 35,357 | |
| Series 2009-37,Cl. HA, 4.00%, 4/25/19 | | | 3,423 | | | | 3,426 | |
| Series 2009-70,Cl. TL, 4.00%, 8/25/19 | | | 67,078 | | | | 67,223 | |
| Series 2010-43,Cl. KG, 3.00%, 1/25/21 | | | 26,045 | | | | 26,164 | |
| Series 2011-15,Cl. DA, 4.00%, 3/25/41 | | | 19,770 | | | | 20,133 | |
| Series 2011-3,Cl. EL, 3.00%, 5/25/20 | | | 59,688 | | | | 59,817 | |
| Series 2011-3,Cl. KA, 5.00%, 4/25/40 | | | 112,214 | | | | 118,763 | |
| Series 2011-38,Cl. AH, 2.75%, 5/25/20 | | | 1,109 | | | | 1,109 | |
| Series 2011-82,Cl. AD, 4.00%, 8/25/26 | | | 62,655 | | | | 63,188 | |
| |
| Federal National Mortgage Assn., Real Estate Mtg. Investment Conduit Multiclass Pass-Through Certificates, Interest-Only Stripped Mtg.-Backed Security: | |
| Series 2001-65,Cl. S, 8.589%, 11/25/316 | | | 93,070 | | | | 17,926 | |
| Series 2001-81,Cl. S, 19.717%, 1/25/326 | | | 22,735 | | | | 4,251 | |
| Series 2002-47,Cl. NS, 15.974%, 4/25/326 | | | 63,326 | | | | 12,615 | |
| Series 2002-51,Cl. S, 16.355%, 8/25/326 | | | 58,149 | | | | 11,058 | |
| Series 2002-52,Cl. SD, 40.914%, 9/25/326 | | | 91,782 | | | | 18,683 | |
| Series 2002-77,Cl. SH, 25.249%, 12/18/326 | | | 34,127 | | | | 6,530 | |
| Series 2002-84,Cl. SA, 4.687%, 12/25/326 | | | 87,647 | | | | 16,651 | |
| | | | | | | | |
| | | Principal
Amount | | | Value | |
| |
| FHLMC/FNMA/FHLB/Sponsored (Continued) | |
| |
| Federal National Mortgage Assn., Real Estate Mtg. Investment Conduit Multiclass Pass-Through Certificates, Interest-Only Stripped Mtg.-Backed Security: (Continued) | |
| Series 2002-9,Cl. MS, 20.777%, 3/25/326 | | $ | 24,490 | | | $ | 4,518 | |
| Series 2003-33,Cl. SP, 8.861%, 5/25/336 | | | 94,481 | | | | 20,933 | |
| Series 2003-4,Cl. S, 3.086%, 2/25/336 | | | 51,214 | | | | 11,113 | |
| Series 2003-46,Cl. IH, 0.00%, 6/25/236,8 | | | 157,985 | | | | 15,839 | |
| Series 2004-54,Cl. DS, 56.349%, 11/25/306 | | | 72,534 | | | | 12,216 | |
| Series 2004-56,Cl. SE, 4.807%, 10/25/336 | | | 17,897 | | | | 3,532 | |
| Series 2005-12,Cl. SC, 26.626%, 3/25/356 | | | 10,795 | | | | 1,527 | |
| Series 2005-14,Cl. SE, 18.691%, 3/25/356 | | | 34,976 | | | | 4,857 | |
| Series 2005-40,Cl. SA, 27.943%, 5/25/356 | | | 191,838 | | | | 26,417 | |
| Series 2005-52,Cl. JH, 31.505%, 5/25/356 | | | 495,973 | | | | 70,965 | |
| Series 2005-93,Cl. SI, 3.083%, 10/25/356 | | | 42,262 | | | | 5,910 | |
| Series 2007-88,Cl. XI, 0.00%, 6/25/376,8 | | | 93,100 | | | | 14,953 | |
| Series 2008-55,Cl. SA, 0.00%, 7/25/386,8 | | | 34,856 | | | | 3,327 | |
| Series 2009-8,Cl. BS, 0.00%, 2/25/246,8 | | | 746 | | | | 30 | |
| Series 2011-96,Cl. SA, 5.861%, 10/25/416 | | | 123,844 | | | | 18,736 | |
| Series 2012-134,Cl. SA, 4.994%, 12/25/426 | | | 436,054 | | | | 86,357 | |
| Series 2012-40,Cl. PI, 4.32%, 4/25/416 | | | 233,928 | | | | 34,907 | |
| |
| Federal National Mortgage Assn., Real Estate Mtg. Investment Conduit Multiclass Pass-Through Certificates, Principal-Only Stripped Mtg.-Backed | |
| Security, Series 1993-184, Cl. M, 5.343%, 9/25/237 | | | 37,224 | | | | 34,695 | |
| | | | | | | | |
| | | | | | | 45,811,005 | |
|
| |
| GNMA/Guaranteed—6.3% | | | | | | | | |
| |
| Government National Mortgage Assn. I Pool: | | | | | |
| 7.00%, 1/15/24 | | | 12,263 | | | | 12,377 | |
| 7.50%, 1/15/23-6/15/24 | | | 19,591 | | | | 20,392 | |
| 8.00%, 4/15/23 | | | 7,776 | | | | 8,281 | |
| |
| Government National Mortgage Assn. II Pool: | | | | | |
| 3.50%, 1/1/489 | | | 4,240,000 | | | | 4,386,611 | |
| 4.00%, 1/1/489 | | | 8,810,000 | | | | 9,189,518 | |
| |
| Government National Mortgage Assn., Interest-Only Stripped Mtg.-Backed Security: | |
| Series 2002-15,Cl. SM, 99.999%, 2/16/326 | | | 110,883 | | | | 508 | |
| Series 2002-76,Cl. SY, 5.546%, 12/16/266 | | | 198,756 | | | | 23,526 | |
| Series 2007-17,Cl. AI, 46.403%, 4/16/376 | | | 297,222 | | | | 50,114 | |
| Series 2011-52,Cl. HS, 25.052%, 4/16/416 | | | 143,547 | | | | 20,049 | |
| | | | | | | | |
| | | | | | | 13,711,376 | |
|
| |
| Non-Agency—10.6% | | | | | | | | |
| |
| Commercial—5.6% | | | | | | | | |
| |
| BCAP LLC Trust, Series 2011-R11, Cl. 18A5, 3.41% [H15T1Y+210], 9/26/353,4 | | | 83,102 | | | | 83,492 | |
| |
| CD Commercial Mortgage Trust: | | | | | |
| Series 2016-CD2,Cl. AM, 3.668%, 11/10/4910 | | | 155,000 | | | | 158,858 | |
11 OPPENHEIMER CONSERVATIVE BALANCED FUND/VA
STATEMENT OF INVESTMENTS Continued
| | | | | | | | |
| | | Principal
Amount | | | Value | |
| |
| Commercial (Continued) | | | | | | | | |
| |
| CD Commercial Mortgage Trust: (Continued) | |
| Series 2017-CD3,Cl. AS, 3.833%, 2/10/50 | | $ | 210,000 | | | $ | 217,105 | |
| |
| CD Mortgage Trust, Interest-Only Commercial Mtg. Pass-Through Certificates, Series 2017-CD6, Cl. XA, 12.227%, 11/13/506 | | | 889,389 | | | | 59,471 | |
| |
| Chase Mortgage Finance Trust, Series 2005-A2, Cl. 1A3, 3.448%, 1/25/3610 | | | 129,473 | | | | 126,485 | |
| |
| Citigroup Commercial Mortgage Trust: | |
| Series 2012-GC8,Cl. AAB, 2.608%, 9/10/45 | | | 118,911 | | | | 119,598 | |
| Series 2014-GC21,Cl. AAB, 3.477%, 5/10/47 | | | 105,000 | | | | 108,331 | |
| |
| Citigroup Commercial Mortgage Trust, Interest-Only Commercial Mtg. Pass- Through Certificates, Series 2017-C4, Cl. XA, 0.00%, 10/12/506,8 | | | 2,368,047 | | | | 187,483 | |
| |
| COMM Mortgage Trust: | |
| Series 2012-CR3,Cl. ASB, 2.372%, 10/15/45 | | | 24,607 | | | | 24,556 | |
| Series 2012-LC4,Cl. A3, 3.069%, 12/10/44 | | | 46,236 | | | | 46,523 | |
| Series 2013-CR13,Cl. ASB, 3.706%, 11/12/46 | | | 195,000 | | | | 202,306 | |
| Series 2013-CR6,Cl. AM, 3.147%, 3/10/463 | | | 255,000 | | | | 256,587 | |
| Series 2013-CR7,Cl. D, 4.28%, 3/10/463,10 | | | 445,000 | | | | 355,084 | |
| Series 2014-CR20,Cl. ASB, 3.305%, 11/10/47 | | | 70,000 | | | | 71,913 | |
| Series 2014-CR21,Cl. AM, 3.987%, 12/10/47 | | | 865,000 | | | | 905,415 | |
| Series 2014-LC15,Cl. AM, 4.198%, 4/10/47 | | | 140,000 | | | | 147,786 | |
| Series 2014-UBS6,Cl. AM, 4.048%, 12/10/47 | | | 495,000 | | | | 517,335 | |
| Series 2015-CR22,Cl. A2, 2.856%, 3/10/48 | | | 115,000 | | | | 116,179 | |
| Series 2015-CR23,Cl. AM, 3.801%, 5/10/48 | | | 280,000 | | | | 288,665 | |
| |
| COMM Mortgage Trust, Interest-Only Stripped Mtg.-Backed Security, Series 2012-CR5, Cl. XA, 0.00%, 12/10/456,8 | | | 334,813 | | | | 20,705 | |
| |
| CSMC Mortgage-Backed Trust, Series 2006-6, Cl. 1A4, 6.00%, 7/25/36 | | | 140,735 | | | | 119,534 | |
| |
| Deutsche Bank Commercial Mortgage Trust, Series 2016-C1, Cl. AM, 3.539%, 5/10/49 | | | 155,000 | | | | 156,507 | |
| |
| First Horizon Alternative Mortgage Securities Trust, Series 2005-FA8, Cl. 1A6, 2.202% [US0001M+65], 11/25/354 | | | 86,656 | | | | 61,859 | |
| |
| FREMF Mortgage Trust: | |
| Series 2011-K702,Cl. B, 4.774%, 4/25/443,10 | | | 55,000 | | | | 55,016 | |
| Series 2013-K25,Cl. C, 3.619%, 11/25/453,10 | | | 60,000 | | | | 59,161 | |
| Series 2013-K26,Cl. C, 3.598%, 12/25/453,10 | | | 40,000 | | | | 39,475 | |
| Series 2013-K27,Cl. C, 3.495%, 1/25/463,10 | | | 110,000 | | | | 107,981 | |
| Series 2013-K28,Cl. C, 3.49%, 6/25/463,10 | | | 450,000 | | | | 441,408 | |
| Series 2013-K712,Cl. C, 3.362%, 5/25/453,10 | | | 70,000 | | | | 70,131 | |
| Series 2013-K713,Cl. C, 3.165%, 4/25/463,10 | | | 145,000 | | | | 144,544 | |
| | | | | | | | |
| | | Principal
Amount | | | Value | |
| |
| Commercial (Continued) | | | | | | | | |
| |
| FREMF Mortgage Trust: (Continued) | |
| Series 2014-K715,Cl. C, 4.125%, 2/25/463,10 | | $ | 35,000 | | | $ | 35,584 | |
| |
| GS Mortgage Securities Corp. Trust, Series 2012-SHOP, Cl. A, 2.933%, 6/5/313 | | | 150,000 | | | | 151,321 | |
| |
| GS Mortgage Securities Trust: | |
| Series 2013-GC12,Cl. AAB, 2.678%, 6/10/46 | | | 35,000 | | | | 35,114 | |
| Series 2013-GC16,Cl. AS, 4.649%, 11/10/46 | | | 65,000 | | | | 69,830 | |
| Series 2014-GC18,Cl. AAB, 3.648%, 1/10/47 | | | 90,000 | | | | 93,187 | |
| |
| GSMSC Pass-Through Trust, Series 2009-3R, Cl. 1A2, 6.00%, 4/25/373,10 | | | 267,703 | | | | 258,277 | |
| |
| JP Morgan Chase Commercial Mortgage Securities Trust: | |
| Series 2012-LC9,Cl. A4, 2.611%, 12/15/47 | | | 25,000 | | | | 24,943 | |
| Series 2013-C10,Cl. AS, 3.372%, 12/15/47 | | | 325,000 | | | | 328,169 | |
| Series 2013-C16,Cl. AS, 4.517%, 12/15/46 | | | 330,000 | | | | 352,941 | |
| Series 2013-LC11,Cl. AS, 3.216%, 4/15/46 | | | 40,000 | | | | 40,286 | |
| Series 2013-LC11,Cl. ASB, 2.554%, 4/15/46 | | | 55,000 | | | | 55,077 | |
| Series 2014-C20,Cl. AS, 4.043%, 7/15/47 | | | 245,000 | | | | 255,801 | |
| Series 2016-JP3,Cl. A2, 2.435%, 8/15/49 | | | 230,000 | | | | 228,483 | |
| |
| JP Morgan Mortgage Trust, Series 2007-A1, Cl. 5A1, 3.629%, 7/25/3510 | | | 107,493 | | | | 110,416 | |
| |
| JP Morgan Resecuritization Trust, Series 2009-5, Cl. 1A2, 3.387%, 7/26/363,10 | | | 146,137 | | | | 140,160 | |
| |
| JPMBB Commercial Mortgage Securities Trust: | |
| Series 2013-C17,Cl. ASB, 3.705%, 1/15/47 | | | 75,000 | | | | 77,796 | |
| Series 2014-C18,Cl. A3, 3.578%, 2/15/47 | | | 115,000 | | | | 117,519 | |
| Series 2014-C19,Cl. ASB, 3.584%, 4/15/47 | | | 45,000 | | | | 46,456 | |
| Series 2014-C24,Cl. B, 4.116%, 11/15/4710 | | | 270,000 | | | | 276,831 | |
| Series 2014-C25,Cl. AS, 4.065%, 11/15/47 | | | 105,000 | | | | 109,949 | |
| Series 2014-C26,Cl. AS, 3.80%, 1/15/48 | | | 250,000 | | | | 257,722 | |
| |
| JPMDB Commercial Mortgage | | | | | | | | |
| Securities Trust, Series 2016-C4, Cl. AS, 3.385%, 12/15/49 | | | 240,000 | | | | 239,436 | |
| |
| MASTR Adjustable Rate Mortgages Trust, Series 2004-13, Cl. 2A2, 3.595%, 4/21/3410 | | | 38,042 | | | | 38,923 | |
| |
| Morgan Stanley Bank of America Merrill Lynch Trust: | |
| Series 2013-C7,Cl. AAB, 2.469%, 2/15/46 | | | 110,000 | | | | 110,187 | |
| Series 2013-C9,Cl. AS, 3.456%, 5/15/46 | | | 240,000 | | | | 242,876 | |
| Series 2014-C19,Cl. AS, 3.832%, 12/15/47 | | | 720,000 | | | | 742,252 | |
| Series 2016-C30,Cl. AS, 3.175%, 9/15/49 | | | 405,000 | | | | 395,440 | |
| |
| Morgan Stanley Capital I, Inc., Interest- Only Commercial Mtg. Pass-Through Certificates, Series 2017-HR2, Cl. XA, 10.107%, 12/15/506 | | | 775,000 | | | | 47,862 | |
| |
| Morgan Stanley Re-Remic Trust, Series 2012-R3, Cl. 1B, 2.968%, 11/26/363,10 | | | 242,968 | | | | 225,795 | |
12 OPPENHEIMER CONSERVATIVE BALANCED FUND/VA
| | | | | | | | |
| | | Principal
Amount | | | Value | |
| |
Commercial (Continued) | | | | | | | | |
| |
| Morgan Stanley Resecuritization Trust, | | | | | | | | |
| Series 2013-R9, Cl. 3A, 3.149%, 6/26/463,10 | | $ | 224,671 | | | $ | 210,275 | |
| |
| RBSSP Resecuritization Trust, Series 2010-1, Cl. 2A1, 3.446%, 7/26/453,10 | | | 19,841 | | | | 20,329 | |
| |
| Structured Adjustable Rate Mortgage Loan Trust, Series 2004-10, Cl. 2A, 3.399%, 8/25/3410 | | | 180,945 | | | | 182,039 | |
| |
| UBS Commercial Mortgage Trust, Interest-Only Commercial Mtg. Pass- Through Certificates, Series 2017-C5, Cl. XA, 11.683%, 11/15/506 | | | 1,529,172 | | | | 110,609 | |
| |
| Wells Fargo Commercial Mortgage Trust: | |
| Series 2015-C29,Cl. AS, 4.013%, 6/15/4810 | | | 170,000 | | | | 177,144 | |
| Series 2016-C37,Cl. AS, 4.018%, 12/15/49 | | | 390,000 | | | | 409,923 | |
| |
| Wells Fargo Commercial Mortgage Trust, Interest-Only Commercial Mtg. Pass-Through Certificates, Series 2017-C42, Cl. XA, 0.00%, 12/15/506,8 | | | 1,080,000 | | | | 77,853 | |
| |
| WF-RBS Commercial Mortgage Trust: | |
| Series 2012-C7,Cl. E, 4.825%, 6/15/453,10 | | | 80,000 | | | | 65,419 | |
| Series 2013-C14,Cl. AS, 3.488%, 6/15/46 | | | 155,000 | | | | 157,875 | |
| Series 2014-C20,Cl. AS, 4.176%, 5/15/47 | | | 150,000 | | | | 156,443 | |
| Series 2014-C22,Cl. A3, 3.528%, 9/15/57 | | | 45,000 | | | | 46,268 | |
| Series 2014-LC14,Cl. AS, 4.351%, 3/15/4710 | | | 165,000 | | | | 174,182 | |
| |
| WF-RBS Commercial Mortgage Trust, Interest-Only Commercial Mtg. Pass- Through Certificates, Series 2011-C3, Cl. XA, 35.103%, 3/15/443,6 | | | 2,542,088 | | | | 78,573 | |
| | | | | | | | |
| | | | | | | 12,245,058 | |
|
| |
| Residential—5.0% | | | | | | | | |
| |
| Alternative Loan Trust, Series 2005-29CB, Cl. A4, 5.00%, 7/25/35 | | | 243,495 | | | | 216,273 | |
| |
| Banc of America Funding Trust: | |
| Series 2007-1,Cl. 1A3, 6.00%, 1/25/37 | | | 48,619 | | | | 45,477 | |
| Series 2007-C,Cl. 1A4, 3.444%, 5/20/3610 | | | 21,675 | | | | 20,442 | |
| Series 2014-R7,Cl. 3A1, 3.544%, 3/26/363,10,16 | | | 128,302 | | | | 128,201 | |
| |
| Banc of America Mortgage Trust, Series 2004-E, Cl. 2A6, 3.829%, 6/25/3410 | | | 59,783 | | | | 59,675 | |
| |
| Bear Stearns ARM Trust: | |
| Series 2005-2,Cl. A1, 3.26% [H15T1Y+245], 3/25/354 | | | 175,346 | | | | 177,657 | |
| Series 2005-9,Cl. A1, 3.52% [H15T1Y+230], 10/25/354 | | | 497,058 | | | | 507,868 | |
| Series 2006-1,Cl. A1, 3.67% [H15T1Y+225], 2/25/364 | | | 183,807 | | | | 184,622 | |
| |
| CHL Mortgage Pass-Through Trust: | |
| Series 2005-26,Cl. 1A8, 5.50%, 11/25/35 | | | 68,625 | | | | 62,794 | |
| Series 2006-6,Cl. A3, 6.00%, 4/25/36 | | | 40,618 | | | | 35,857 | |
| |
| Citigroup Mortgage Loan Trust, Inc., Series 2006-AR1, Cl. 1A1, 3.21% [H15T1Y+240], 10/25/354 | | | 449,606 | | | | 452,863 | |
| |
| Connecticut Avenue Securities: | |
| Series 2014-C02,Cl. 1M1, 2.502% [US0001M+95], 5/25/244 | | | 137,405 | | | | 137,899 | |
| Series 2014-C03,Cl. 1M2, 4.552% [US0001M+300], 7/25/244 | | | 357,045 | | | | 381,850 | |
| | | | | | | | |
| | | Principal
Amount | | | Value | |
| |
| Residential (Continued) | | | | | | | | |
| |
| Connecticut Avenue Securities: (Continued) | |
| Series 2016-C03,Cl. 1M1, 3.552% [US0001M+200], 10/25/284 | | $ | 15,884 | | | $ | 16,140 | |
| Series 2016-C07,Cl. 2M1, 2.852% [US0001M+130], 5/25/294 | | | 198,858 | | | | 200,129 | |
| Series 2016-C07,Cl. 2M2, 5.902% [US0001M+435], 5/25/294 | | | 140,000 | | | | 155,366 | |
| Series 2017-C02,Cl. 2M1, 2.702% [US0001M+115], 9/25/294 | | | 330,413 | | | | 333,462 | |
| Series 2017-C02,Cl. 2M2, 5.202% [US0001M+365], 9/25/294 | | | 305,000 | | | | 330,362 | |
| Series 2017-C03,Cl. 1M1, 2.502% [US0001M+95], 10/25/294 | | | 199,054 | | | | 200,670 | |
| Series 2017-C04,Cl. 2M2, 4.402% [US0001M+285], 11/25/294 | | | 195,000 | | | | 202,941 | |
| Series 2017-C06,Cl. 1M1, 2.302% [US0001M+75], 2/25/304 | | | 156,407 | | | | 156,969 | |
| Series 2017-C07,Cl. 1M1, 2.202% [US0001M+65], 5/25/304 | | | 228,641 | | | | 229,040 | |
| Series 2017-C07,Cl. 1M2, 3.952% [US0001M+240], 5/25/304 | | | 225,000 | | | | 231,161 | |
| |
| GSR Mortgage Loan Trust, Series 2005- AR4, Cl. 6A1, 3.522%, 7/25/3510 | | | 25,396 | | | | 25,583 | |
| |
| HomeBanc Mortgage Trust, | | | | | | | | |
| Series 2005-3, Cl. A2, 1.862% [US0001M+31], 7/25/354 | | | 29,775 | | | | 29,765 | |
| |
| RALI Trust, Series 2006-QS13, Cl. 1A8, 6.00%, 9/25/36 | | | 8,963 | | | | 8,005 | |
| |
| Structured Agency Credit Risk Debt Nts.: | |
| Series 2013-DN2,Cl. M2, 5.802% [US0001M+425], 11/25/234 | | | 235,000 | | | | 261,634 | |
| Series 2014-DN1,Cl. M3, 6.052% [US0001M+450], 2/25/244 | | | 160,000 | | | | 187,052 | |
| Series 2014-DN2,Cl. M3, 5.152% [US0001M+360], 4/25/244 | | | 185,000 | | | | 206,542 | |
| Series 2014-HQ2,Cl. M2, 3.752% [US0001M+220], 9/25/244 | | | 104,939 | | | | 108,301 | |
| Series 2014-HQ2,Cl. M3, 5.302% [US0001M+375], 9/25/244 | | | 335,000 | | | | 383,214 | |
| Series 2015-HQA2,Cl. M2, 4.352% [US0001M+280], 5/25/284 | | | 6,786 | | | | 7,018 | |
| Series 2016-DNA1,Cl. M2, 4.452% [US0001M+290], 7/25/284 | | | 45,000 | | | | 46,382 | |
| Series 2016-DNA3,Cl. M1, 2.652% [US0001M+110], 12/25/284 | | | 99,219 | | | | 99,371 | |
| Series 2016-DNA4,Cl. M1, 2.352% [US0001M+80], 3/25/294 | | | 110,737 | | | | 110,962 | |
| Series 2016-DNA4,Cl. M3, 5.352% [US0001M+380], 3/25/294 | | | 355,000 | | | | 396,684 | |
| Series 2016-HQA2,Cl. M1, 2.752% [US0001M+120], 11/25/284 | | | 39,719 | | | | 39,764 | |
| Series 2016-HQA3,Cl. M1, 2.352% [US0001M+80], 3/25/294 | | | 448,741 | | | | 449,573 | |
| Series 2016-HQA3,Cl. M3, 5.402% [US0001M+385], 3/25/294 | | | 340,000 | | | | 379,100 | |
| Series 2016-HQA4,Cl. M1, 2.352% [US0001M+80], 4/25/294 | | | 267,579 | | | | 268,122 | |
| Series 2016-HQA4,Cl. M3, 5.452% [US0001M+390], 4/25/294 | | | 350,000 | | | | 389,780 | |
| Series 2017-DNA2,Cl. M2, 5.002% [US0001M+345], 10/25/294 | | | 160,000 | | | | 174,264 | |
| Series 2017-DNA3,Cl. M2, 4.052% [US0001M+250], 3/25/304 | | | 160,000 | | | | 165,913 | |
| Series 2017-HQA1,Cl. M1, 2.752% [US0001M+120], 8/25/294 | | | 224,790 | | | | 227,232 | |
| Series 2017-HQA1,Cl. M2, 5.102% [US0001M+355], 8/25/294 | | | 325,000 | | | | 351,170 | |
| Series 2017-HQA3,Cl. M1, 2.102% [US0001M+55], 4/25/304 | | | 280,248 | | | | 280,291 | |
13 OPPENHEIMER CONSERVATIVE BALANCED FUND/VA
STATEMENT OF INVESTMENTS Continued
| | | | | | | | |
| | | Principal
Amount | | | Value | |
| |
| Residential (Continued) | |
| |
| Structured Agency Credit Risk Debt Nts.: (Continued) | |
| Series 2017-HQA3,Cl. M2, 3.902% | | | | | |
| [US0001M+235], 4/25/304 | | $ | 380,000 | | | $ | 389,452 | |
| |
| WaMu Mortgage Pass-Through Certificates Trust: | |
| Series 2003-AR10,Cl. A7, 3.453%, 10/25/3310 | | | 96,543 | | | | 97,809 | |
| Series 2005-AR14,Cl. 1A4, 3.357%, 12/25/3510 | | | 96,978 | | | | 95,013 | |
| Series 2005-AR16,Cl. 1A1, 3.363%, 12/25/3510 | | | 90,469 | | | | 88,533 | |
| |
| Wells Fargo Mortgage-Backed Securities Trust: | |
| Series 2005-AR1,Cl. 1A1, 3.252%, 2/25/3510 | | | 18,081 | | | | 18,484 | |
| Series 2005-AR15,Cl. 1A2, 3.561%, 9/25/3510 | | | 118,662 | | | | 115,314 | |
| Series 2005-AR15,Cl. 1A6, 3.561%, 9/25/3510 | | | 227,408 | | | | 219,396 | |
| Series 2005-AR4,Cl. 2A2, 3.422%, 4/25/3510 | | | 223,744 | | | | 225,203 | |
| Series 2006-AR10,Cl. 1A1, 3.354%, 7/25/3610 | | | 45,154 | | | | 44,107 | |
| Series 2006-AR10,Cl. 5A5, 3.387%, 7/25/3610 | | | 165,349 | | | | 167,183 | |
| Series 2006-AR2,Cl. 2A3, 3.544%, 3/25/3610 | | | 21,378 | | | | 21,605 | |
| Series 2006-AR7,Cl. 2A4, 3.336%, 5/25/3610 | | | 123,188 | | | | 122,304 | |
| Series 2006-AR8,Cl. 2A1, 3.568%, 4/25/3610 | | | 129,011 | | | | 130,745 | |
| Series 2006-AR8,Cl. 2A4, 3.568%, 4/25/3610 | | | 76,990 | | | | 78,025 | |
| Series 2007-16,Cl. 1A1, 6.00%, 12/28/37 | | | 35,477 | | | | 37,191 | |
| | | | | | | | |
| | | | | | | 10,913,804 | |
| | | | | | | | |
| | |
| Total Mortgage-Backed Obligations (Cost $82,656,498) | | | | | | | 82,681,243 | |
|
| |
U.S. Government Obligation—0.2% | |
| |
| United States Treasury Nts., 1.50%, 5/31/1911,12 (Cost $553,038) | | | 552,000 | | | | 549,279 | |
|
| |
Non-Convertible Corporate Bonds and Notes—32.8% | |
| |
| Consumer Discretionary—5.1% | |
| |
| Auto Components—0.1% | | | | | | | | |
| |
| Lear Corp., 3.80% Sr. Unsec. Nts., 9/15/27 | | | 212,000 | | | | 212,547 | |
|
| |
| Automobiles—1.2% | | | | | | | | |
| |
| Daimler Finance North America LLC: | |
| 2.20% Sr. Unsec. Nts., 5/5/203 | | | 304,000 | | | | 302,358 | |
| 8.50% Sr. Unsec. Unsub. Nts., 1/18/31 | | | 185,000 | | | | 279,756 | |
| |
| Ford Motor Credit Co. LLC: | |
| 2.425% Sr. Unsec. Nts., 6/12/20 | | | 236,000 | | | | 234,725 | |
| 3.664% Sr. Unsec. Nts., 9/8/24 | | | 232,000 | | | | 235,286 | |
| |
| General Motors Co., 6.25% Sr. Unsec. | | | | | | | | |
| Nts., 10/2/43 | | | 92,000 | | | | 109,264 | |
| |
| General Motors Financial Co., Inc., 3.15% Sr. Unsec. Nts., 6/30/22 | | | 321,000 | | | | 321,043 | |
| |
| Harley-Davidson, Inc., 4.625% Sr. Unsec. Nts., 7/28/45 | | | 107,000 | | | | 116,594 | |
| |
| Hyundai Capital America, 1.75% Sr. Unsec. Nts., 9/27/193 | | | 371,000 | | | | 364,079 | |
| |
| Nissan Motor Acceptance Corp., 2.15% Sr. Unsec. Nts., 9/28/203 | | | 225,000 | | | | 223,213 | |
| |
| Volkswagen Group of America Finance LLC, 2.45% Sr. Unsec. Nts., 11/20/193 | | | 351,000 | | | | 350,906 | |
| | | | | | | | |
| | | | | | | 2,537,224 | |
| | | | | | | | |
| | | Principal
Amount | | | Value | |
| |
| Diversified Consumer Services—0.2% | |
| |
| Service Corp. International, 4.625% Sr. | | | | | |
| Unsec. Nts., 12/15/27 | | $ | 362,000 | | | $ | 368,198 | |
| |
| Hotels, Restaurants & Leisure—0.3% | |
| |
| Aramark Services, Inc., 5.00% Sr. Unsec. Nts., 4/1/253 | | | 179,000 | | | | 189,525 | |
| |
| Marriott International, Inc., 3.25% Sr. Unsec. Nts., 9/15/22 | | | 158,000 | | | | 161,046 | |
| |
| Royal Caribbean Cruises Ltd., 2.65% Sr. Unsec. Nts., 11/28/20 | | | 305,000 | | | | 304,963 | |
| | | | | | | | |
| | | | | | | 655,534 | |
|
| |
| Household Durables—0.9% | |
| |
| DR Horton, Inc., 2.55% Sr. Unsec. Nts., 12/1/20 | | | 315,000 | | | | 314,725 | |
| |
| Leggett & Platt, Inc., 3.50% Sr. Unsec. Nts., 11/15/27 | | | 172,000 | | | | 170,631 | |
| |
| Lennar Corp., 4.75% Sr. Unsec. Nts., 5/30/25 | | | 343,000 | | | | 357,577 | |
| |
| Newell Brands, Inc.: | | | | | | | | |
| 5.00% Sr. Unsec. Nts., 11/15/23 | | | 391,000 | | | | 412,746 | |
| 5.50% Sr. Unsec. Nts., 4/1/46 | | | 105,000 | | | | 125,370 | |
| |
| PulteGroup, Inc., 5.00% Sr. Unsec. Nts., 1/15/27 | | | 258,000 | | | | 270,577 | |
| |
| Toll Brothers Finance Corp.: | |
| 4.375% Sr. Unsec. Nts., 4/15/23 | | | 298,000 | | | | 310,293 | |
| 4.875% Sr. Unsec. Nts., 3/15/27 | | | 45,000 | | | | 46,800 | |
| | | | | | | | |
| | | | | | | 2,008,719 | |
|
| |
| Internet & Catalog Retail—0.3% | |
| |
| Amazon.com, Inc., 4.95% Sr. Unsec. Nts., 12/5/44 | | | 106,000 | | | | 129,247 | |
| |
| QVC, Inc., 4.45% Sr. Sec. Nts., 2/15/25 | | | 595,000 | | | | 607,703 | |
| | | | | | | | |
| | | | | | | 736,950 | |
|
| |
| Media—0.9% | | | | | | | | |
| |
| 21st Century Fox America, Inc., 4.75% Sr. Unsec. Nts., 11/15/46 | | | 138,000 | | | | 160,256 | |
| |
| Charter Communications Operating LLC/Charter Communications Operating Capital, 5.375% Sr. Sec. Nts., 5/1/47 | | | 148,000 | | | | 152,188 | |
| |
| Comcast Cable Communications Holdings, Inc., 9.455% Sr. Unsec. Nts., 11/15/22 | | | 318,000 | | | | 415,694 | |
| |
| Interpublic Group of Cos., Inc. (The), 4.20% Sr. Unsec. Nts., 4/15/24 | | | 331,000 | | | | 347,581 | |
| |
| Sky plc: | | | | | | | | |
| 3.75% Sr. Unsec. Nts., 9/16/243 | | | 161,000 | | | | 168,128 | |
| 6.10% Sr. Unsec. Nts., 2/15/183 | | | 125,000 | | | | 125,586 | |
| |
| Time Warner Cable LLC, 4.50% Sr. Unsec. Unsub. Nts., 9/15/42 | | | 185,000 | | | | 174,059 | |
| |
| Virgin Media Secured Finance plc, 5.25% Sr. Sec. Nts., 1/15/263 | | | 337,000 | | | | 341,634 | |
| | | | | | | | |
| | | | | | | 1,885,126 | |
|
| |
| Multiline Retail—0.2% | | | | | | | | |
| |
| Dollar Tree, Inc., 5.75% Sr. Sec. Nts., 3/1/23 | | | 334,000 | | | | 350,491 | |
|
| |
| Specialty Retail—0.7% | | | | | | | | |
| |
| AutoZone, Inc., 1.625% Sr. Unsec. Nts., 4/21/19 | | | 68,000 | | | | 67,450 | |
| |
| Best Buy Co., Inc., 5.50% Sr. Unsec. Nts., 3/15/21 | | | 304,000 | | | | 327,678 | |
| |
| L Brands, Inc., 5.625% Sr. Unsec. Nts., 2/15/22 | | | 333,000 | | | | 356,727 | |
| |
| Ross Stores, Inc., 3.375% Sr. Unsec. Nts., 9/15/24 | | | 314,000 | | | | 318,579 | |
| |
| Sally Holdings LLC/Sally Capital, Inc., 5.625% Sr. Unsec. Nts., 12/1/25 | | | 185,000 | | | | 185,000 | |
14 OPPENHEIMER CONSERVATIVE BALANCED FUND/VA
| | | | | | | | |
| | | Principal
Amount | | | Value | |
| |
| Specialty Retail (Continued) | | | | | | | | |
| |
| Signet UK Finance plc, 4.70% Sr. | | | | | |
| Unsec. Nts., 6/15/24 | | $ | 356,000 | | | $ | 350,935 | |
| | | | | | | | |
| | | | | | | 1,606,369 | |
| |
| Textiles, Apparel & Luxury Goods—0.3% | |
| |
| Hanesbrands, Inc., 4.875% Sr. Unsec. Nts., 5/15/263 | | | 336,000 | | | | 346,080 | |
| |
| Levi Strauss & Co., 5.00% Sr. Unsec. Nts., 5/1/25 | | | 252,000 | | | | 263,970 | |
| |
| PVH Corp., 4.50% Sr. Unsec. Unsub. Nts., 12/15/22 | | | 163,000 | | | | 166,651 | |
| | | | | | | | |
| | | | | | | 776,701 | |
|
| |
| Consumer Staples—3.2% | |
| |
| Beverages—1.0% | |
| |
| Anheuser-Busch InBev Finance, Inc.: | | | | | |
| 1.90% Sr. Unsec. Nts., 2/1/19 | | | 448,000 | | | | 447,159 | |
| 3.65% Sr. Unsec. Nts., 2/1/26 | | | 57,000 | | | | 58,908 | |
| 4.90% Sr. Unsec. Nts., 2/1/46 | | | 72,000 | | | | 83,707 | |
| |
| Anheuser-Busch InBev Worldwide, Inc., 8.20% Sr. Unsec. Unsub. Nts., 1/15/39 | | | 262,000 | | | | 417,674 | |
| |
| Constellation Brands, Inc., 2.25% Sr. Unsec. Nts., 11/6/20 | | | 355,000 | | | | 351,957 | |
| |
| Molson Coors Brewing Co.: | | | | | | | | |
| 2.10% Sr. Unsec. Nts., 7/15/21 | | | 329,000 | | | | 322,702 | |
| 4.20% Sr. Unsec. Nts., 7/15/46 | | | 50,000 | | | | 51,115 | |
| |
| Pernod Ricard SA, 4.25% Sr. Unsec. Nts., 7/15/223 | | | 325,000 | | | | 344,481 | |
| | | | | | | | |
| | | | | | | 2,077,703 | |
|
| |
| Food & Staples Retailing—0.4% | |
| |
| Alimentation Couche-Tard, Inc., 2.35% Sr. Unsec. Nts., 12/13/193 | | | 364,000 | | | | 364,106 | |
| |
| CVS Health Corp.: | | | | | | | | |
| 2.125% Sr. Unsec. Nts., 6/1/21 | | | 356,000 | | | | 347,672 | |
| 5.125% Sr. Unsec. Nts., 7/20/45 | | | 80,000 | | | | 91,963 | |
| |
| Kroger Co. (The): | | | | | | | | |
| 2.00% Sr. Unsec. Nts., 1/15/19 | | | 9,000 | | | | 8,985 | |
| 6.90% Sr. Unsec. Nts., 4/15/38 | | | 86,000 | | | | 111,436 | |
| | | | | | | | |
| | | | | | | 924,162 | |
|
| |
| Food Products—1.0% | | | | | | | | |
| |
| Bunge Ltd. Finance Corp.: | | | | | | | | |
| 3.25% Sr. Unsec. Nts., 8/15/26 | | | 232,000 | | | | 222,066 | |
| 8.50% Sr. Unsec. Nts., 6/15/19 | | | 320,000 | | | | 346,737 | |
| |
| Kraft Heinz Foods Co.: | | | | | | | | |
| 3.95% Sr. Unsec. Nts., 7/15/25 | | | 188,000 | | | | 194,441 | |
| 4.375% Sr. Unsec. Nts., 6/1/46 | | | 125,000 | | | | 124,207 | |
| |
| Lamb Weston Holdings, Inc., 4.875% Sr. Unsec. Nts., 11/1/263 | | | 193,000 | | | | 202,168 | |
| |
| Mondelez International Holdings | | | | | | | | |
| Netherlands BV, 1.625% Sr. Unsec. Nts., 10/28/193 | | | 374,000 | | | | 368,725 | |
| |
| Smithfield Foods, Inc., 2.70% Sr. Unsec. Nts., 1/31/203 | | | 365,000 | | | | 362,962 | |
| |
| TreeHouse Foods, Inc., 6.00% Sr. Unsec. Nts., 2/15/243 | | | 221,000 | | | | 230,945 | |
| |
| Tyson Foods, Inc., 3.55% Sr. Unsec. Nts., 6/2/27 | | | 174,000 | | | | 178,465 | |
| | | | | | | | |
| | | | | | | 2,230,716 | |
|
| |
| Tobacco—0.8% | | | | | | | | |
| |
| Altria Group, Inc., 4.00% Sr. Unsec. Nts., 1/31/24 | | | 238,000 | | | | 252,644 | |
| |
| BAT Capital Corp.: | | | | | | | | |
| 2.297% Sr. Unsec. Nts., 8/14/203 | | | 351,000 | | | | 349,265 | |
| 3.557% Sr. Unsec. Nts., 8/15/273 | | | 177,000 | | | | 177,536 | |
| |
| Imperial Brands Finance plc, 2.05% Sr. Unsec. Nts., 7/20/183 | | | 411,000 | | | | 410,684 | |
| |
| Philip Morris International, Inc., 2.50% Sr. Unsec. Nts., 11/2/22 | | | 313,000 | | | | 310,382 | |
| | | | | | | | |
| | | Principal
Amount | | | Value | |
| |
| Tobacco (Continued) | | | | | | | | |
| |
| Reynolds American, Inc., 5.85% Sr. | | | | | | | | |
| Unsec. Nts., 8/15/45 | | $ | 122,000 | | | $ | 152,794 | |
| | | | | | | | |
| | | | | | | 1,653,305 | |
|
| |
| Energy—2.6% | | | | | | | | |
| |
| Energy Equipment & Services—0.2% | |
| |
| Halliburton Co., 5.00% Sr. Unsec. Nts., 11/15/45 | | | 78,000 | | | | 89,846 | |
| |
| Helmerich & Payne International | | | | | | | | |
| Drilling Co., 4.65% Sr. Unsec. Nts., 3/15/25 | | | 201,000 | | | | 211,850 | |
| |
| Schlumberger Holdings Corp., 4.00% Sr. Unsec. Nts., 12/21/253 | | | 196,000 | | | | 206,257 | |
| | | | | | | | |
| | | | | | | 507,953 | |
|
| |
| Oil, Gas & Consumable Fuels—2.4% | |
| |
| Anadarko Petroleum Corp.: | | | | | | | | |
| 4.50% Sr. Unsec. Nts., 7/15/44 | | | 72,000 | | | | 71,964 | |
| 6.20% Sr. Unsec. Nts., 3/15/40 | | | 68,000 | | | | 82,662 | |
| |
| Andeavor, 5.125% Sr. Unsec. Nts., 12/15/263 | | | 323,000 | | | | 355,489 | |
| |
| Andeavor Logistics LP/Tesoro Logistics Finance Corp.: | |
| 4.25% Sr. Unsec. Nts., 12/1/27 | | | 177,000 | | | | 178,819 | |
| 5.25% Sr. Unsec. Nts., 1/15/25 | | | 120,000 | | | | 126,354 | |
| |
| Apache Corp., 4.75% Sr. Unsec. Nts., 4/15/43 | | | 101,000 | | | | 104,097 | |
| |
| Boardwalk Pipelines LP, 4.95% Sr. Unsec. Nts., 12/15/24 | | | 162,000 | | | | 173,759 | |
| |
| BP Capital Markets plc, 1.676% Sr. Unsec. Nts., 5/3/19 | | | 353,000 | | | | 351,182 | |
| |
| Buckeye Partners LP, 3.95% Sr. Unsec. Nts., 12/1/26 | | | 89,000 | | | | 87,618 | |
| |
| Chevron Corp., 1.561% Sr. Unsec. Nts., 5/16/19 | | | 379,000 | | | | 376,878 | |
| |
| Columbia Pipeline Group, Inc.: | | | | | | | | |
| 3.30% Sr. Unsec. Nts., 6/1/20 | | | 324,000 | | | | 328,791 | |
| 4.50% Sr. Unsec. Nts., 6/1/25 | | | 168,000 | | | | 179,110 | |
| |
| ConocoPhillips Co.: | | | | | | | | |
| 4.95% Sr. Unsec. Nts., 3/15/26 | | | 47,000 | | | | 53,424 | |
| 5.95% Sr. Unsec. Nts., 3/15/46 | | | 75,000 | | | | 101,330 | |
| |
| Devon Energy Corp., 4.75% Sr. Unsec. Nts., 5/15/42 | | | 79,000 | | | | 83,889 | |
| |
| Energy Transfer LP, 5.30% Sr. Unsec. Nts., 4/15/47 | | | 100,000 | | | | 99,658 | |
| |
| EnLink Midstream Partners LP, 4.85% Sr. Unsec. Nts., 7/15/26 | | | 79,000 | | | | 82,902 | |
| |
| Enterprise Products Operating LLC: | | | | | | | | |
| 4.85% Sr. Unsec. Nts., 8/15/42 | | | 80,000 | | | | 88,100 | |
| 4.90% Sr. Unsec. Nts., 5/15/46 | | | 32,000 | | | | 35,366 | |
| |
| EQT Corp., 2.50% Sr. Unsec. Nts., 10/1/20 | | | 353,000 | | | | 350,745 | |
| |
| Kinder Morgan, Inc., 5.55% Sr. Unsec. Nts., 6/1/45 | | | 270,000 | | | | 296,319 | |
| |
| Marathon Oil Corp., 4.40% Sr. Unsec. Nts., 7/15/27 | | | 182,000 | | | | 190,511 | |
| |
| Noble Energy, Inc., 5.05% Sr. Unsec. Nts., 11/15/44 | | | 104,000 | | | | 111,723 | |
| |
| ONEOK Partners LP: | | | | | | | | |
| 4.90% Sr. Unsec. Nts., 3/15/25 | | | 139,000 | | | | 149,227 | |
| 8.625% Sr. Unsec. Nts., 3/1/19 | | | 152,000 | | | | 162,274 | |
| |
| Phillips 66 Partners LP, 3.605% Sr. Unsec. Nts., 2/15/25 | | | 170,000 | | | | 171,496 | |
| |
| Sabine Pass Liquefaction LLC, 4.20% Sr. Sec. Nts., 3/15/28 | | | 180,000 | | | | 182,428 | |
| |
| Shell International Finance BV, 4.00% Sr. Unsec. Nts., 5/10/46 | | | 125,000 | | | | 133,348 | |
| |
| Sunoco Logistics Partners Operations | | | | | |
| LP, 4.00% Sr. Unsec. Nts., 10/1/27 | | | 198,000 | | | | 194,480 | |
15 OPPENHEIMER CONSERVATIVE BALANCED FUND/VA
STATEMENT OF INVESTMENTS Continued
| | | | | | | | |
| | | Principal
Amount | | | Value | |
| |
| Oil, Gas & Consumable Fuels (Continued) | |
| |
| Williams Partners LP: | | | | | | | | |
| 3.75% Sr. Unsec. Nts., 6/15/27 | | $ | 140,000 | | | $ | 140,522 | |
| 5.25% Sr. Unsec. Nts., 3/15/20 | | | 153,000 | | | | 161,693 | |
| |
| Woodside Finance Ltd., 8.75% Sr. Unsec. Nts., 3/1/193 | | | 3,000 | | | | 3,212 | |
| | | | | | | | |
| | | | | | | 5,209,370 | |
|
| |
| Financials—9.0% | |
| |
| Capital Markets—1.9% | |
| |
| Apollo Management Holdings LP, 4.00% Sr. Unsec. Nts., 5/30/243 | | | 208,000 | | | | 213,078 | |
| |
| Blackstone Holdings Finance Co. LLC, 3.15% Sr. Unsec. Nts., 10/2/273 | | | 147,000 | | | | 144,686 | |
| |
| Brookfield Asset Management, Inc., 4.00% Sr. Unsec. Nts., 1/15/25 | | | 373,000 | | | | 383,276 | |
| |
| Credit Suisse AG (New York), 3.625% Sr. Unsec. Nts., 9/9/24 | | | 197,000 | | | | 203,981 | |
| |
| Credit Suisse Group Funding Guernsey Ltd., 4.55% Sr. Unsec. Nts., 4/17/26 | | | 140,000 | | | | 150,117 | |
| |
| E*TRADE Financial Corp., 5.875% [US0003M+443.5] Jr. Sub. Perpetual Bonds4,13 | | | 327,000 | | | | 347,437 | |
| |
| Goldman Sachs Group, Inc. (The): | | | | | |
| 3.50% Sr. Unsec. Nts., 11/16/26 | | | 208,000 | | | | 209,379 | |
| 3.75% Sr. Unsec. Nts., 2/25/26 | | | 200,000 | | | | 205,516 | |
| 4.017% [US0003M+137.3] Sr. Unsec. Nts., 10/31/384 | | | 144,000 | | | | 148,280 | |
| |
| Morgan Stanley: | | | | | | | | |
| 4.375% Sr. Unsec. Nts., 1/22/47 | | | 256,000 | | | | 281,072 | |
| 5.00% Sub. Nts., 11/24/25 | | | 322,000 | | | | 352,840 | |
| |
| MSCI, Inc., 4.75% Sr. Unsec. Nts., 8/1/263 | | | 338,000 | | | | 355,745 | |
| |
| Northern Trust Corp., 3.375% [US0003M+113.1] Sub. Nts., 5/8/324 | | | 155,000 | | | | 154,565 | |
| |
| Raymond James Financial, Inc., 3.625% Sr. Unsec. Nts., 9/15/26 | | | 215,000 | | | | 216,350 | |
| |
| S&P Global, Inc., 2.50% Sr. Unsec. Nts., 8/15/18 | | | 256,000 | | | | 256,778 | |
| |
| TD Ameritrade Holding Corp., 3.30% Sr. Unsec. Nts., 4/1/27 | | | 216,000 | | | | 218,154 | |
| |
| UBS Group Funding Switzerland AG: | | | | | |
| 4.125% Sr. Unsec. Nts., 4/15/263 | | | 134,000 | | | | 140,716 | |
| 4.253% Sr. Unsec. Nts., 3/23/283 | | | 147,000 | | | | 155,145 | |
| | | | | | | | |
| | | | | | | 4,137,115 | |
|
| |
| Commercial Banks—4.4% | |
| |
| ABN AMRO Bank NV, 4.40% [USSW5+219.7] Sub. Nts., 3/27/284 | | | 406,000 | | | | 418,536 | |
| |
| Australia & New Zealand Banking Group Ltd. (New York), 2.625% Sr. Unsec. Nts., 5/19/22 | | | 358,000 | | | | 357,009 | |
| |
| Bank of America Corp.: | | | | | | | | |
| 3.248% Sr. Unsec. Nts., 10/21/27 | | | 277,000 | | | | 275,132 | |
| 3.824% [US0003M+157.5] Sr. Unsec. Nts., 1/20/284 | | | 191,000 | | | | 197,736 | |
| 7.75% Jr. Sub. Nts., 5/14/38 | | | 239,000 | | | | 358,957 | |
| |
| Barclays plc, 4.375% Sr. Unsec. Nts., 1/12/26 | | | 338,000 | | | | 352,364 | |
| |
| BB&T Corp., 2.85% Sr. Unsec. Nts., 10/26/24 | | | 294,000 | | | | 292,058 | |
| |
| BNP Paribas SA, 4.625% Sub. Nts., 3/13/273 | | | 244,000 | | | | 260,712 | |
| |
| BPCE SA, 4.50% Sub. Nts., 3/15/253 | | | 243,000 | | | | 254,317 | |
| |
| Citigroup, Inc., 4.281% | | | | | | | | |
| [US0003M+183.9] Sr. Unsec. Nts., 4/24/484 | | | 356,000 | | | | 387,802 | |
| |
| Citizens Bank NA (Providence RI): | | | | | |
| 2.55% Sr. Unsec. Nts., 5/13/21 | | | 205,000 | | | | 204,385 | |
| 2.65% Sr. Unsec. Nts., 5/26/22 | | | 87,000 | | | | 86,282 | |
| | | | | | | | |
| | | Principal
Amount | | | Value | |
| |
| Commercial Banks (Continued) | |
| |
| Commonwealth Bank of Australia, 3.15% Sr. Unsec. Nts., 9/19/273 | | $ | 288,000 | | | $ | 284,213 | |
| |
| Compass Bank, 2.875% Sr. Unsec. Nts., 6/29/22 | | | 369,000 | | | | 365,477 | |
| |
| Credit Agricole SA, 4.375% Sub. Nts., 3/17/253 | | | 412,000 | | | | 431,095 | |
| |
| Fifth Third Bank (Cincinnati OH), 3.85% Sub. Nts., 3/15/26 | | | 228,000 | | | | 235,561 | |
| |
| First Republic Bank, 4.375% Sub. Nts., 8/1/46 | | | 146,000 | | | | 149,735 | |
| |
| Glencore Funding LLC, 4.00% Sr. Unsec. Nts., 4/16/253 | | | 200,000 | | | | 202,326 | |
| |
| HSBC Holdings plc, 4.041% | | | | | | | | |
| [US0003M+154.6] Sr. Unsec. Nts., 3/13/284 | | | 170,000 | | | | 177,318 | |
| |
| Huntington Bancshares, Inc., 3.15% Sr. Unsec. Nts., 3/14/21 | | | 245,000 | | | | 249,015 | |
| |
| Intesa Sanpaolo SpA, 3.875% Sr. Unsec. Nts., 7/14/273 | | | 289,000 | | | | 289,352 | |
| |
| JPMorgan Chase & Co.: | | | | | | | | |
| 3.54% [US0003M+138] Sr. Unsec. Nts., 5/1/284 | | | 284,000 | | | | 289,185 | |
| 3.782% [US0003M+133.7] Sr. Unsec. Nts., 2/1/284 | | | 563,000 | | | | 583,916 | |
| |
| Lloyds Banking Group plc, 6.657% | | | | | |
| [US0003M+127] Jr. Sub. Perpetual Bonds3,4,13 | | | 400,000 | | | | 469,000 | |
| |
| PNC Financial Services Group, Inc. | | | | | |
| (The), 3.15% Sr. Unsec. Nts., 5/19/27 | | | 323,000 | | | | 324,400 | |
| |
| Regions Bank (Birmingham AL), 2.25% Sr. Unsec. Nts., 9/14/18 | | | 328,000 | | | | 328,406 | |
| |
| Regions Financial Corp., 2.75% Sr. Unsec. Nts., 8/14/22 | | | 238,000 | | | | 237,475 | |
| |
| Royal Bank of Scotland Group plc, 3.498% [US0003M+148] Sr. Unsec. Nts., 5/15/234 | | | 255,000 | | | | 255,781 | |
| |
| SunTrust Bank (Atlanta GA), 3.30% Sub. Nts., 5/15/26 | | | 163,000 | | | | 161,684 | |
| |
| Synovus Financial Corp., 3.125% Sr. Unsec. Nts., 11/1/22 | | | 213,000 | | | | 211,498 | |
| |
| US Bancorp: | | | | | | | | |
| 3.10% Sub. Nts., 4/27/26 | | | 210,000 | | | | 208,693 | |
| 3.15% Sr. Unsec. Nts., 4/27/27 | | | 87,000 | | | | 87,239 | |
| |
| Wells Fargo & Co.: | | | | | | | | |
| 3.584% [US0003M+131] Sr. Unsec. Nts., 5/22/284 | | | 291,000 | | | | 296,929 | |
| 4.75% Sub. Nts., 12/7/46 | | | 207,000 | | | | 231,709 | |
| | | | | | | | |
| | | | | | | 9,515,297 | |
|
| |
| Consumer Finance—0.5% | |
| |
| American Express Co., 2.50% Sr. Unsec. Nts., 8/1/22 | | | 143,000 | | | | 141,407 | |
| |
| American Express Credit Corp., 3.30% Sr. Unsec. Nts., 5/3/27 | | | 217,000 | | | | 220,404 | |
| |
| Capital One Financial Corp., 3.75% Sr. Unsec. Nts., 3/9/27 | | | 143,000 | | | | 144,762 | |
| |
| Discover Financial Services: | | | | | | | | |
| 3.75% Sr. Unsec. Nts., 3/4/25 | | | 143,000 | | | | 144,130 | |
| 4.10% Sr. Unsec. Nts., 2/9/27 | | | 146,000 | | | | 149,788 | |
| |
| Electricite de France SA, 6.50% Sr. | | | | | |
| Unsec. Nts., 1/26/193 | | | 259,000 | | | | 270,944 | |
| | | | | | | | |
| | | | | | | 1,071,435 | |
|
| |
| Diversified Financial Services—0.4% | |
| |
| Berkshire Hathaway Energy Co., 2.00% Sr. Unsec. Nts., 11/15/18 | | | 115,000 | | | | 115,111 | |
| |
| Peachtree Corners Funding Trust, 3.976% Sr. Unsec. Nts., 2/15/253 | | | 139,000 | | | | 143,310 | |
| |
| Precision Castparts Corp., 2.50% Sr. Unsec. Nts., 1/15/23 | | | 212,000 | | | | 210,776 | |
16 OPPENHEIMER CONSERVATIVE BALANCED FUND/VA
| | | | | | | | |
| | | Principal
Amount | | | Value | |
| |
| Diversified Financial Services (Continued) | |
| |
| Voya Financial, Inc., 5.65% | | | | | | | | |
| [US0003M+358] Jr. Sub. Nts., 5/15/534 | | $ | 335,000 | | | $ | 357,613 | |
| | | | | | | | |
| | | | | | | 826,810 | |
|
| |
| Insurance—0.8% | | | | | | | | |
| |
| AXIS Specialty Finance plc, 5.15% Sr. Unsec. Nts., 4/1/45 | | | 179,000 | | | | 192,625 | |
| |
| Brighthouse Financial, Inc., 3.70% Sr. Unsec. Nts., 6/22/273 | | | 93,000 | | | | 91,617 | |
| |
| CNA Financial Corp., 3.45% Sr. Unsec. Nts., 8/15/27 | | | 255,000 | | | | 251,727 | |
| |
| Manulife Financial Corp., 4.061% [USISDA05+164.7] Sub. Nts., 2/24/324 | | | 219,000 | | | | 221,009 | |
| |
| Marsh & McLennan Cos., Inc., 4.35% Sr. Unsec. Nts., 1/30/47 | | | 113,000 | | | | 125,581 | |
| |
| MetLife, Inc., 5.25% [US0003M+357.5] Jr. Sub. Perpetual Bonds4,13 | | | 296,000 | | | | 308,503 | |
| |
| Nuveen Finance LLC, 4.125% Sr. Unsec. Nts., 11/1/243 | | | 267,000 | | | | 282,138 | |
| |
| Prudential Financial, Inc., 5.20% [US0003M+304] Jr. Sub. Nts., 3/15/444 | | | 276,000 | | | | 294,285 | |
| | | | | | | | |
| | | | | | | 1,767,485 | |
|
| |
| Real Estate Investment Trusts (REITs)—0.9% | |
| |
| American Tower Corp.: | | | | | | | | |
| 2.80% Sr. Unsec. Nts., 6/1/20 | | | 312,000 | | | | 314,101 | |
| 3.00% Sr. Unsec. Nts., 6/15/23 | | | 299,000 | | | | 298,544 | |
| |
| Crown Castle International Corp., 3.65% Sr. Unsec. Nts., 9/1/27 | | | 176,000 | | | | 175,872 | |
| |
| Digital Realty Trust LP: | | | | | | | | |
| 3.40% Sr. Unsec. Nts., 10/1/20 | | | 30,000 | | | | 30,610 | |
| 5.875% Sr. Unsec. Nts., 2/1/20 | | | 125,000 | | | | 132,629 | |
| |
| HCP, Inc., 2.625% Sr. Unsec. Nts., 2/1/20 | | | 348,000 | | | | 349,386 | |
| |
| Lamar Media Corp., 5.75% Sr. Unsec. Nts., 2/1/26 | | | 325,000 | | | | 348,156 | |
| |
| Ventas Realty LP/Ventas Capital Corp., 2.00% Sr. Unsec. Nts., 2/15/18 | | | 103,000 | | | | 102,997 | |
| |
| VEREIT Operating Partnership LP, 3.00% Sr. Unsec. Nts., 2/6/19 | | | 134,000 | | | | 134,671 | |
| |
| Welltower, Inc., 2.25% Sr. Unsec. Nts., 3/15/18 | | | 88,000 | | | | 88,038 | |
| | | | | | | | |
| | | | | | | 1,975,004 | |
|
| |
| Thrifts & Mortgage Finance—0.1% | |
| |
| Nationwide Building Society, 4.125% [USISDA05+184.9] Sub. Nts., 10/18/324 | | | 215,000 | | | | 215,440 | |
|
| |
| Health Care—3.1% | | | | | | | | |
| |
| Biotechnology—0.7% | | | | | | | | |
| |
| AbbVie, Inc.: | | | | | | | | |
| 3.60% Sr. Unsec. Nts., 5/14/25 | | | 210,000 | | | | 216,184 | |
| 4.70% Sr. Unsec. Nts., 5/14/45 | | | 64,000 | | | | 71,598 | |
| |
| Biogen, Inc., 5.20% Sr. Unsec. Nts., 9/15/45 | | | 82,000 | | | | 97,635 | |
| |
| Celgene Corp.: | | | | | | | | |
| 3.875% Sr. Unsec. Nts., 8/15/25 | | | 202,000 | | | | 209,373 | |
| 5.00% Sr. Unsec. Nts., 8/15/45 | | | 41,000 | | | | 46,659 | |
| |
| Gilead Sciences, Inc., 4.75% Sr. Unsec. Nts., 3/1/46 | | | 132,000 | | | | 152,924 | |
| |
| Shire Acquisitions Investments Ireland DAC: | | | | | |
| 1.90% Sr. Unsec. Nts., 9/23/19 | | | 376,000 | | | | 372,712 | |
| 3.20% Sr. Unsec. Nts., 9/23/26 | | | 287,000 | | | | 281,066 | |
| | | | | | | | |
| | | | | | | 1,448,151 | |
|
| |
| Health Care Equipment & Supplies—0.7% | |
| |
| Abbott Laboratories: | | | | | | | | |
| 2.35% Sr. Unsec. Nts., 11/22/19 | | | 366,000 | | | | 366,206 | |
| 3.75% Sr. Unsec. Nts., 11/30/26 | | | 300,000 | | | | 308,544 | |
| | | | | | | | |
| | | Principal
Amount | | | Value | |
| |
| Health Care Equipment & Supplies (Continued) | |
| |
| Becton Dickinson & Co.: | | | | | | | | |
| 2.404% Sr. Unsec. Nts., 6/5/20 | | $ | 226,000 | | | $ | 224,891 | |
| 3.70% Sr. Unsec. Nts., 6/6/27 | | | 268,000 | | | | 270,512 | |
| |
| Boston Scientific Corp., 3.85% Sr. Unsec. Nts., 5/15/25 | | | 277,000 | | | | 285,166 | |
| |
| Hologic, Inc., 4.375% Sr. Unsec. Nts., 10/15/253 | | | 15,000 | | | | 15,262 | |
| |
| Medtronic, Inc., 4.625% Sr. Unsec. Nts., 3/15/45 | | | 145,000 | | | | 169,193 | |
| | | | | | | | |
| | | | | | | 1,639,774 | |
|
| |
| Health Care Providers & Services—1.0% | |
| |
| Anthem, Inc., 2.50% Sr. Unsec. Nts., 11/21/20 | | | 351,000 | | | | 350,483 | |
| |
| Cigna Corp., 5.125% Sr. Unsec. Nts., 6/15/20 | | | 303,000 | | | | 321,621 | |
| |
| Fresenius Medical Care US Finance II, Inc., 5.875% Sr. Unsec. Nts., 1/31/223 | | | 450,000 | | | | 495,830 | |
| |
| Humana, Inc., 2.50% Sr. Unsec. Nts., 12/15/20 | | | 91,000 | | | | 90,987 | |
| |
| Laboratory Corp. of America Holdings: | | | | | |
| 2.625% Sr. Unsec. Nts., 2/1/20 | | | 348,000 | | | | 349,073 | |
| 3.60% Sr. Unsec. Nts., 2/1/25 | | | 218,000 | | | | 221,715 | |
| |
| UnitedHealth Group, Inc., 2.75% Sr. Unsec. Nts., 2/15/23 | | | 285,000 | | | | 285,719 | |
| | | | | | | | |
| | | | | | | 2,115,428 | |
|
| |
| Life Sciences Tools & Services—0.4% | |
| |
| Life Technologies Corp., 6.00% Sr. Unsec. Nts., 3/1/20 | | | 259,000 | | | | 277,329 | |
| |
| Quintiles IMS, Inc., 5.00% Sr. Unsec. Nts., 10/15/263 | | | 330,000 | | | | 339,488 | |
| |
| Thermo Fisher Scientific, Inc.: | | | | | | | | |
| 3.20% Sr. Unsec. Nts., 8/15/27 | | | 175,000 | | | | 173,754 | |
| 4.15% Sr. Unsec. Nts., 2/1/24 | | | 125,000 | | | | 132,741 | |
| | | | | | | | |
| | | | | | | 923,312 | |
|
| |
| Pharmaceuticals—0.3% | | | | | | | | |
| |
| Allergan Funding SCS: | | | | | | | | |
| 3.00% Sr. Unsec. Nts., 3/12/20 | | | 348,000 | | | | 351,290 | |
| 3.80% Sr. Unsec. Nts., 3/15/25 | | | 247,000 | | | | 251,784 | |
| |
| Zoetis, Inc., 3.00% Sr. Unsec. Nts., 9/12/27 | | | 86,000 | | | | 84,157 | |
| | | | | | | | |
| | | | | | | 687,231 | |
|
| |
| Industrials—2.3% | |
| |
| Aerospace & Defense—0.5% | |
| |
| BAE Systems Holdings, Inc., 3.85% Sr. Unsec. Nts., 12/15/253 | | | 270,000 | | | | 280,403 | |
| |
| Hexcel Corp., 3.95% Sr. Unsec. Nts., 2/15/27 | | | 135,000 | | | | 137,845 | |
| |
| Huntington Ingalls Industries, Inc., 3.483% Sr. Unsec. Nts., 12/1/273 | | | 134,000 | | | | 133,833 | |
| |
| Northrop Grumman Corp., 4.75% Sr. Unsec. Nts., 6/1/43 | | | 190,000 | | | | 220,100 | |
| |
| Rolls-Royce plc, 2.375% Sr. Unsec. Nts., 10/14/203 | | | 93,000 | | | | 92,444 | |
| |
| Textron, Inc.: | | | | | | | | |
| 3.65% Sr. Unsec. Nts., 3/15/27 | | | 90,000 | | | | 91,615 | |
| 3.875% Sr. Unsec. Nts., 3/1/25 | | | 129,000 | | | | 133,894 | |
| |
| United Technologies Corp., 1.778% Jr. Sub. Nts., 5/4/1810 | | | 67,000 | | | | 66,903 | |
| | | | | | | | |
| | | | | | | 1,157,037 | |
|
| |
| Air Freight & Couriers—0.0% | |
| |
| FedEx Corp., 4.40% Sr. Unsec. Nts., 1/15/47 | | | 69,000 | | | | 73,863 | |
|
| |
| Building Products—0.2% | |
| |
| Allegion US Holding Co., Inc., 3.55% Sec. Nts., 10/1/27 | | | 255,000 | | | | 252,784 | |
17 OPPENHEIMER CONSERVATIVE BALANCED FUND/VA
STATEMENT OF INVESTMENTS Continued
| | | | | | | | |
| | | Principal
Amount | | | Value | |
| |
| Building Products (Continued) | |
| |
| Owens Corning, 3.40% Sr. Unsec. Nts., 8/15/26 | | $ | 242,000 | | | $ | 237,907 | |
| | | | | | | | |
| | | | | | | 490,691 | |
| |
| Commercial Services & Supplies—0.1% | |
| |
| Republic Services, Inc., 3.80% Sr. | | | | | | | | |
Unsec. Nts., 5/15/18 | | | 311,000 | | | | 313,178 | |
| |
| Electrical Equipment—0.2% | |
| |
| Sensata Technologies BV, 4.875% Sr. | | | | | |
Unsec. Nts., 10/15/233 | | | 345,000 | | | | 361,819 | |
| |
| Industrial Conglomerates—0.4% | |
| |
| Carlisle Cos., Inc., 3.75% Sr. Unsec. | | | | | |
| Nts., 12/1/27 | | | 188,000 | | | | 190,279 | |
| |
| Roper Technologies, Inc.: | | | | | | | | |
| 3.00% Sr. Unsec. Nts., 12/15/20 | | | 288,000 | | | | 291,605 | |
| 3.80% Sr. Unsec. Nts., 12/15/26 | | | 263,000 | | | | 271,647 | |
| | | | | | | | |
| | | | | | | 753,531 | |
| |
| Machinery—0.3% | |
| |
| CNH Industrial NV, 3.85% Sr. Unsec. | | | | | |
| Nts., 11/15/27 | | | 189,000 | | | | 188,799 | |
| |
| Fortive Corp., 1.80% Sr. Unsec. Nts., 6/15/19 | | | 385,000 | | | | 382,322 | |
| |
| Wabtec Corp., 3.45% Sr. Unsec. Nts., 11/15/26 | | | 144,000 | | | | 141,053 | |
| | | | | | | | |
| | | | | | | 712,174 | |
| |
| Road & Rail—0.2% | | | | | | | | |
| |
| Canadian Pacific Railway Co., 4.80% | | | | | |
| Sr. Unsec. Nts., 9/15/35 | | | 76,000 | | | | 88,744 | |
| |
| Penske Truck Leasing Co. LP/PTL | | | | | |
| Finance Corp., 3.40% Sr. Unsec. Nts., 11/15/263 | | | 284,000 | | | | 280,869 | |
| | | | | | | | |
| | | | | | | 369,613 | |
| |
| Trading Companies & Distributors—0.4% | |
| |
| Air Lease Corp.: | | | | | | | | |
| 3.00% Sr. Unsec. Nts., 9/15/23 | | | 160,000 | | | | 158,941 | |
| 3.625% Sr. Unsec. Nts., 4/1/27 | | | 156,000 | | | | 156,136 | |
| |
| GATX Corp., 3.50% Sr. Unsec. Nts., 3/15/28 | | | 285,000 | | | | 281,758 | |
| |
| United Rentals North America, Inc., 4.625% Sr. Unsec. Nts., 10/15/25 | | | 178,000 | | | | 179,780 | |
| | | | | | | | |
| | | | | | | 776,615 | |
| |
| Information Technology—1.9% | |
| |
| Electronic Equipment, Instruments, & Components—0.3% | |
| |
| Arrow Electronics, Inc., 3.875% Sr. | | | | | |
| Unsec. Nts., 1/12/28 | | | 248,000 | | | | 247,691 | |
| |
| CDW LLC/CDW Finance Corp., 5.50% | | | | | |
| Sr. Unsec. Nts., 12/1/24 | | | 58,000 | | | | 63,365 | |
| |
| Tech Data Corp., 4.95% Sr. Unsec. Nts., 2/15/27 | | | 271,000 | | | | 286,302 | |
| | | | | | | | |
| | | | | | | 597,358 | |
| |
| Internet Software & Services—0.1% | |
| |
| VeriSign, Inc.: | | | | | | | | |
| 4.75% Sr. Unsec. Nts., 7/15/27 | | | 189,000 | | | | 194,197 | |
| 5.25% Sr. Unsec. Nts., 4/1/25 | | | 105,000 | | | | 114,844 | |
| | | | | | | | |
| | | | | | | 309,041 | |
| |
| IT Services—0.3% | | | | | | | | |
| |
| Broadridge Financial Solutions, Inc., 3.40% Sr. Unsec. Nts., 6/27/26 | | | 164,000 | | | | 162,912 | |
| |
| DXC Technology Co.: | | | | | | | | |
| 2.875% Sr. Unsec. Nts., 3/27/20 | | | 261,000 | | | | 262,395 | |
| 4.75% Sr. Unsec. Nts., 4/15/27 | | | 267,000 | | | | 284,377 | |
| | | | | | | | |
| | | | | | | 709,684 | |
| | | | | | | | |
| | | Principal
Amount | | | Value | |
| |
| Semiconductors & Semiconductor Equipment—0.1% | |
| |
Intel Corp., 3.734% Sr. Unsec. Nts., 12/8/473 | | $ | 116,000 | | | $ | 120,664 | |
| |
| Software—0.8% | | | | | | | | |
| |
| Autodesk, Inc., 4.375% Sr. Unsec. Nts., 6/15/25 | | | 125,000 | | | | 131,342 | |
| |
| Dell International LLC/EMC Corp.: | | | | | | | | |
| 3.48% Sr. Sec. Nts., 6/1/193 | | | 376,000 | | | | 380,807 | |
| 6.02% Sr. Sec. Nts., 6/15/263 | | | 213,000 | | | | 235,185 | |
| |
| Open Text Corp., 5.625% Sr. Unsec. | | | | | |
| Nts., 1/15/233 | | | 174,000 | | | | 182,048 | |
| |
| Oracle Corp.: | | | | | | | | |
| 2.40% Sr. Unsec. Nts., 9/15/23 | | | 214,000 | | | | 211,457 | |
| 2.95% Sr. Unsec. Nts., 5/15/25 | | | 211,000 | | | | 212,067 | |
| |
| VMware, Inc.: | | | | | | | | |
| 2.30% Sr. Unsec. Nts., 8/21/20 | | | 108,000 | | | | 107,448 | |
| 3.90% Sr. Unsec. Nts., 8/21/27 | | | 178,000 | | | | 179,987 | |
| | | | | | | | |
| | | | | | | 1,640,341 | |
| |
| Technology Hardware, Storage & Peripherals—0.3% | |
| |
| Apple, Inc., 4.375% Sr. Unsec. Nts., 5/13/45 | | | 227,000 | | | | 256,132 | |
| |
| Hewlett Packard Enterprise Co., 3.60% | | | | | |
| Sr. Unsec. Nts., 10/15/20 | | | 342,000 | | | | 349,381 | |
| |
| NetApp, Inc., 2.00% Sr. Unsec. Nts., 9/27/19 | | | 160,000 | | | | 158,810 | |
| | | | | | | | |
| | | | | | | 764,323 | |
| |
| Materials—2.0% | | | | | | | | |
| |
| Chemicals—1.1% | | | | | | | | |
| |
| Agrium, Inc.: | | | | | | | | |
| 3.375% Sr. Unsec. Nts., 3/15/25 | | | 104,000 | | | | 104,618 | |
| 4.125% Sr. Unsec. Nts., 3/15/35 | | | 87,000 | | | | 90,090 | |
| |
| CF Industries, Inc., 4.50% Sr. Sec. Nts., 12/1/263 | | | 263,000 | | | | 274,583 | |
| |
| Ecolab, Inc., 2.00% Sr. Unsec. Nts., 1/14/19 | | | 370,000 | | | | 369,455 | |
| |
| LyondellBasell Industries NV, 5.00% Sr. | | | | | |
| Unsec. Nts., 4/15/19 | | | 227,000 | | | | 233,111 | |
| |
| PolyOne Corp., 5.25% Sr. Unsec. Nts., 3/15/23 | | | 308,000 | | | | 325,710 | |
| |
| RPM International, Inc.: | | | | | | | | |
| 3.45% Sr. Unsec. Unsub. Nts., 11/15/22 | | | 304,000 | | | | 311,821 | |
| 3.75% Sr. Unsec. Nts., 3/15/27 | | | 91,000 | | | | 92,230 | |
| 4.25% Sr. Unsec. Nts., 1/15/48 | | | 86,000 | | | | 85,779 | |
| |
| Sherwin-Williams Co. (The): | | | | | | | | |
| 3.30% Sr. Unsec. Nts., 2/1/25 | | | 122,000 | | | | 121,437 | |
| 3.95% Sr. Unsec. Nts., 1/15/26 | | | 174,000 | | | | 181,712 | |
| |
| Yara International ASA, 3.80% Sr. | | | | | | | | |
| Unsec. Nts., 6/6/263 | | | 230,000 | | | | 228,520 | |
| | | | | | | | |
| | | | | | | 2,419,066 | |
| |
| Construction Materials—0.2% | |
| |
| LafargeHolcim Finance US LLC, 3.50% | | | | | |
| Sr. Unsec. Nts., 9/22/263 | | | 80,000 | | | | 79,002 | |
| |
| Martin Marietta Materials, Inc., 3.50% | | | | | |
| Sr. Unsec. Nts., 12/15/27 | | | 171,000 | | | | 170,026 | |
| |
| Vulcan Materials Co., 3.90% Sr. Unsec. | | | | | |
| Nts., 4/1/27 | | | 263,000 | | | | 269,267 | |
| | | | | | | | |
| | | | | | | 518,295 | |
| |
| Containers & Packaging—0.4% | |
| |
| International Paper Co.: | | | | | | | | |
| 3.00% Sr. Unsec. Nts., 2/15/27 | | | 150,000 | | | | 145,677 | |
| 4.80% Sr. Unsec. Nts., 6/15/44 | | | 142,000 | | | | 155,904 | |
| |
| Packaging Corp. of America: | | | | | | | | |
| 3.65% Sr. Unsec. Nts., 9/15/24 | | | 113,000 | | | | 116,008 | |
| 4.50% Sr. Unsec. Nts., 11/1/23 | | | 150,000 | | | | 161,542 | |
18 OPPENHEIMER CONSERVATIVE BALANCED FUND/VA
| | | | | | | | |
| | | Principal
Amount | | | Value | |
| |
| Containers & Packaging (Continued) | |
| |
| Silgan Holdings, Inc., 4.75% Sr. Unsec. Nts., 3/15/253 | | $ | 290,000 | | | $ | 298,700 | |
| | | | | | | | |
| | | | | | | 877,831 | |
| |
| Metals & Mining—0.2% | |
| |
| Anglo American Capital plc: 3.625% Sr. Unsec. Nts., 9/11/243 | | | 86,000 | | | | 85,670 | |
| 4.00% Sr. Unsec. Nts., 9/11/273 | | | 140,000 | | | | 139,245 | |
| |
| Goldcorp, Inc., 5.45% Sr. Unsec. Nts., 6/9/44 | | | 96,000 | | | | 112,070 | |
| | | | | | | | |
| | | | | | | 336,985 | |
| |
| Paper & Forest Products—0.1% | |
| |
| Louisiana-Pacific Corp., 4.875% Sr. Unsec. Nts., 9/15/24 | | | 199,000 | | | | 205,965 | |
| |
| Telecommunication Services—1.5% | |
| |
| Diversified Telecommunication Services—1.5% | |
| |
| AT&T, Inc.: | | | | | | | | |
| 3.40% Sr. Unsec. Nts., 8/14/24 | | | 146,000 | | | | 146,928 | |
| 4.30% Sr. Unsec. Nts., 2/15/303 | | | 331,000 | | | | 331,389 | |
| 4.35% Sr. Unsec. Nts., 6/15/45 | | | 189,000 | | | | 174,895 | |
| 5.15% Sr. Unsec. Nts., 2/14/50 | | | 109,000 | | | | 109,971 | |
| |
| British Telecommunications plc, 9.125% Sr. Unsec. Nts., 12/15/30 | | | 289,000 | | | | 432,583 | |
| |
| Deutsche Telekom International Finance BV, 2.225% Sr. Unsec. Nts., 1/17/203 | | | 355,000 | | | | 353,468 | |
| |
| Telefonica Emisiones SAU: | | | | | | | | |
| 3.192% Sr. Unsec. Nts., 4/27/18 | | | 397,000 | | | | 398,441 | |
| 4.103% Sr. Unsec. Nts., 3/8/27 | | | 98,000 | | | | 101,428 | |
| 5.213% Sr. Unsec. Nts., 3/8/47 | | | 123,000 | | | | 140,016 | |
| 7.045% Sr. Unsec. Unsub. Nts., 6/20/36 | | | 125,000 | | | | 168,077 | |
| |
| T-Mobile USA, Inc., 6.50% Sr. Unsec. Nts., 1/15/26 | | | 317,000 | | | | 346,719 | |
| |
| Verizon Communications, Inc.: | | | | | | | | |
| 1.75% Sr. Unsec. Nts., 8/15/21 | | | 131,000 | | | | 127,579 | |
| 4.125% Sr. Unsec. Nts., 8/15/46 | | | 152,000 | | | | 140,861 | |
| 4.522% Sr. Unsec. Nts., 9/15/48 | | | 281,000 | | | | 277,570 | |
| | | | | | | | |
| | | | | | | 3,249,925 | |
| |
| Utilities—2.1% | | | | | | | | |
| |
| Electric Utilities—1.5% | | | | | | | | |
| |
| AEP Texas, Inc., 3.85% Sr. Unsec. Nts., 10/1/253 | | | 153,000 | | | | 159,995 | |
| |
| Cleco Corporate Holdings LLC, 3.743% Sr. Sec. Nts., 5/1/26 | | | 146,000 | | | | 146,759 | |
| |
| Duke Energy Corp.: | | | | | | | | |
| 3.15% Sr. Unsec. Nts., 8/15/27 | | | 176,000 | | | | 175,035 | |
| 3.75% Sr. Unsec. Nts., 9/1/46 | | | 70,000 | | | | 69,458 | |
| |
| Edison International, 2.95% Sr. Unsec. Nts., 3/15/23 | | | 233,000 | | | | 233,601 | |
| | | | | | | | |
| | | Principal
Amount | | | Value | |
| |
| Electric Utilities (Continued) | | | | | | | | |
| |
| EDP Finance BV, 3.625% Sr. Unsec. Nts., 7/15/243 | | $ | 238,000 | | | $ | 239,883 | |
| |
| Emera US Finance LP, 2.15% Sr. Unsec. Nts., 6/15/19 | | | 241,000 | | | | 240,126 | |
| |
| Enel Finance International NV, 3.625% Sr. Unsec. Nts., 5/25/273 | | | 178,000 | | | | 177,151 | |
| |
| Exelon Corp., 4.45% Sr. Unsec. Nts., 4/15/46 | | | 87,000 | | | | 94,847 | |
| |
| Indiana Michigan Power Co., Series K, 4.55% Sr. Unsec. Nts., 3/15/46 | | | 88,000 | | | | 100,691 | |
| |
| ITC Holdings Corp., 5.30% Sr. Unsec. Nts., 7/1/43 | | | 81,000 | | | | 98,005 | |
| |
| NextEra Energy Operating Partners LP, 4.25% Sr. Unsec. Nts., 9/15/243 | | | 29,000 | | | | 29,580 | |
| |
| Pennsylvania Electric Co., 5.20% Sr. Unsec. Nts., 4/1/20 | | | 88,000 | | | | 92,925 | |
| |
| PPL WEM Ltd./Western Power Distribution Ltd., 5.375% Sr. Unsec. Unsub. Nts., 5/1/213 | | | 317,000 | | | | 339,950 | |
| |
| Public Service Co. of New Mexico, 7.95% Sr. Unsec. Nts., 5/15/18 | | | 347,000 | | | | 354,257 | |
| |
| Southern Co. Gas Capital Corp., 4.40% Sr. Unsec. Nts., 5/30/47 | | | 128,000 | | | | 137,581 | |
| |
| Southern Power Co., 1.95% Sr. Unsec. Nts., 12/15/19 | | | 324,000 | | | | 321,450 | |
| |
| Trans-Allegheny Interstate Line Co., 3.85% Sr. Unsec. Nts., 6/1/253 | | | 187,000 | | | | 194,240 | |
| | | | | | | | |
| | | | | | | 3,205,534 | |
| |
| Multi-Utilities—0.6% | | | | | | | | |
| |
| Black Hills Corp., 2.50% Sr. Unsec. Nts., 1/11/19 | | | 179,000 | | | | 179,532 | |
| |
| Dominion Energy, Inc.: | | | | | | | | |
| 2.579% Jr. Sub. Nts., 7/1/20 | | | 285,000 | | | | 285,272 | |
| 4.90% Sr. Unsec. Nts., 8/1/41 | | | 123,000 | | | | 142,540 | |
| |
| NiSource Finance Corp., 3.49% Sr. Unsec. Nts., 5/15/27 | | | 258,000 | | | | 263,039 | |
| |
| Public Service Enterprise Group, Inc., 1.60% Sr. Unsec. Nts., 11/15/19 | | | 303,000 | | | | 298,109 | |
| |
| Virginia Electric & Power Co., 2.95% Sr. Unsec. Nts., 1/15/22 | | | 242,000 | | | | 245,172 | |
| | | | | | | | |
| | | | | | | 1,413,664 | |
| | | | | | | | |
| Total Non-Convertible Corporate Bonds and Notes (Cost $69,655,947) | | | | | | | 71,440,747 | |
| | |
| | | Shares | | | | |
| |
Investment Company—2.5% | |
| |
| Oppenheimer Institutional Government Money Market Fund, Cl. E, 1.22%14,15 (Cost $5,367,607) | | | 5,367,607 | | | | 5,367,607 | |
| |
| Total Investments, at Value (Cost $240,932,791) | | | 117.4% | | | | 255,554,836 | |
| |
| Net Other Assets (Liabilities) | | | (17.4) | | | | (37,906,837) | |
| | | | |
| Net Assets | | | 100.0% | | | $ | 217,647,999 | |
| | | | |
Footnotes to Statement of Investments
1. Non-income producing security.
2. Security is a Master Limited Partnership.
3. Represents securities sold under Rule 144A, which are exempt from registration under the Securities Act of 1933, as amended. These securities have been determined to be liquid under guidelines established by the Board of Trustees. These securities amount to $28,168,360 or 12.94% of the Fund’s net assets at period end.
4. Represents the current interest rate for a variable or increasing rate security, determined as [Referenced Rate + Basis-point spread].
5. Restricted security. The aggregate value of restricted securities at period end was $218,538, which represents 0.10% of the Fund’s net assets. See Note 4 of the accompanying Notes.
Information concerning restricted securities is as follows:
| | | | | | | | | | | | | | | | |
| Security | | Acquisition
Dates | | | Cost | | | Value | | | Unrealized
Depreciation | |
| |
| Credit Acceptance Auto Loan Trust, Series 2017-3A, Cl. C, 3.48%, 10/15/26 | | | 10/17/17 | | | $ | 219,965 | | | $ | 218,538 | | | $ | 1,427 | |
19 OPPENHEIMER CONSERVATIVE BALANCED FUND/VA
STATEMENT OF INVESTMENTS Continued
Footnotes to Statement of Investments (Continued)
6. Interest-Only Strips represent the right to receive the monthly interest payments on an underlying pool of mortgage loans. These securities typically decline in price as interest rates decline. Most other fixed income securities increase in price when interest rates decline. The principal amount of the underlying pool represents the notional amount on which current interest is calculated. The price of these securities is typically more sensitive to changes in prepayment rates than traditional mortgage-backed securities (for example, GNMA pass-throughs). Interest rates disclosed represent current yields based upon the current cost basis and estimated timing and amount of future cash flows. These securities amount to $1,486,117 or 0.68% of the Fund’s net assets at period end.
7. Principal-Only Strips represent the right to receive the monthly principal payments on an underlying pool of mortgage loans. The value of these securities generally increases as interest rates decline and prepayment rates rise. The price of these securities is typically more volatile than that of coupon-bearing bonds of the same maturity. Interest rates disclosed represent current yields based upon the current cost basis and estimated timing of future cash flows. These securities amount to $49,745 or 0.02% of the Fund’s net assets at period end.
8. Interest rate is less than 0.0005%.
9. All or a portion of the security position is when-issued or delayed delivery to be delivered and settled after period end. See Note 4 of the accompanying Notes.
10. This interest rate resets periodically. Interest rate shown reflects the rate in effect at period end. The rate on this variable rate security is not based on a published reference rate and spread but is determined by the issuer or agent based on current market conditions.
11. All or a portion of the security position has been pledged for collateral in association with forward roll transactions. See Note 4 of the accompanying Notes.
12. All or a portion of the security position is held in accounts at a futures clearing merchant and pledged to cover margin requirements on open futures contracts and written options on futures, if applicable. The aggregate market value of such securities is $141,300. See Note 6 of the accompanying Notes.
13. This bond has no contractual maturity date, is not redeemable and contractually pays an indefinite stream of interest.
14. Rate shown is the 7-day yield at period end.
15. Is or was an affiliate, as defined in the Investment Company Act of 1940, as amended, at or during the reporting period, by virtue of the Fund owning at least 5% of the voting securities of the issuer or as a result of the Fund and the issuer having the same investment adviser. Transactions during the reporting period in which the issuer was an affiliate are as follows:
| | | | | | | | | | | | | | | | |
| | | Shares
December 31, 2016 | | | Gross Additions | | | Gross Reductions | | | Shares
December 31, 2017 | |
| |
| Oppenheimer Institutional Government Money Market Fund, Cl. E | | | 5,367,607 | | | | — | | | | — | | | | 5,367,607 | |
| | | | |
| | | Value | | | Income | | | Realized
Gain (Loss) | | | Change in Unrealized
Gain (Loss) | |
| |
| Oppenheimer Institutional Government Money Market Fund, Cl. E | | $ | 5,367,607 | | | $ | 43,517 | | | $ | — | | | $ | — | |
16. The value of this security was determined using significant unobservable inputs. See Note 3 of the accompanying Notes
| | | | | | | | | | | | | | | | | | | | | | | | | | | | |
| |
| Futures Contracts as of December 31, 2017 | |
| Description | | Buy/Sell | | | Expiration Date | | | Number of
Contracts | | | | | | Notional
Amount
(000’s) | | | Value | | | Unrealized
Appreciation | |
| |
| United States Treasury Long Bonds | | | Buy | | | | 3/20/18 | | | | 18 | | | | USD | | | | 2,751 | | | | $ 2,754,000 | | | | $ 2,847 | |
| United States Treasury Nts., 10 yr. | | | Sell | | | | 3/20/18 | | | | 129 | | | | USD | | | | 16,080 | | | | 16,002,047 | | | | 77,661 | |
| United States Treasury Nts., 2 yr. | | | Buy | | | | 3/29/18 | | | | 11 | | | | USD | | | | 2,355 | | | | 2,355,203 | | | | 36 | |
| United States Treasury Nts., 5 yr. | | | Sell | | | | 3/29/18 | | | | 3 | | | | USD | | | | 349 | | | | 348,492 | | | | 769 | |
| United States Ultra Bonds | | | Buy | | | | 3/20/18 | | | | 50 | | | | USD | | | | 8,334 | | | | 8,382,812 | | | | 48,776 | |
| | | | | | | | | | | | | | | | | | | | | | | | | | | | |
| | | | | | | | | | | | | | | | | | | | | | | | | | | $ 130,089 | |
| | | | | | | | | | | | | | | | | | | | | | | | | | | | |
| | |
| Glossary: | | |
| Definitions | | |
H15T1Y | | US Treasury Yield Curve Rate T Note Constant Maturity 1 Year |
ICE LIBOR | | Intercontinental Exchange London Interbank Offered Rate |
LIBOR01M | | ICE LIBOR USD 1 Month |
US0001M | | ICE LIBOR USD 1 Month |
US0003M | | ICE LIBOR USD 3 Month |
USISDA05 | | USD ICE Swap Rate 11:00am NY 5 Year |
USSW5 | | USD Swap Semi 30/360 5 Year |
See accompanying Notes to Financial Statements.
20 OPPENHEIMER CONSERVATIVE BALANCED FUND/VA
STATEMENT OF ASSETS AND LIABILITIES December 31, 2017
| | | | |
Assets | | | | |
| Investments, at value—see accompanying statement of investments: | | | | |
| Unaffiliated companies (cost $235,565,184) | | $ | 250,187,229 | |
| Affiliated companies (cost $5,367,607) | | | 5,367,607 | |
| | | | |
| | | 255,554,836 | |
| |
| Cash | | | 16,556,911 | |
| |
| Cash used for collateral on futures | | | 277,000 | |
| |
| Receivables and other assets: | | | | |
| Investments sold (including $2,162,782 sold on a when-issued or delayed delivery basis) | | | 2,266,651 | |
| Interest, dividends and principal paydowns | | | 930,051 | |
| Shares of beneficial interest sold | | | 48,216 | |
| Variation margin receivable | | | 26,778 | |
| Other | | | 54,806 | |
| | | | |
Total assets | | | 275,715,249 | |
| |
Liabilities | | | | |
| Payables and other liabilities: | | | | |
| Investments purchased on a when-issued or delayed delivery basis | | | 57,568,656 | |
| Shares of beneficial interest redeemed | | | 335,662 | |
| Trustees’ compensation | | | 46,325 | |
| Variation margin payable | | | 26,205 | |
| Shareholder communications | | | 12,496 | |
| Distribution and service plan fees | | | 10,765 | |
| Other | | | 67,141 | |
| | | | |
Total liabilities | | | 58,067,250 | |
| |
Net Assets | | $ | 217,647,999 | |
| | | | |
|
| |
Composition of Net Assets | | | | |
| Par value of shares of beneficial interest | | $ | 13,717 | |
| |
| Additional paid-in capital | | | 194,520,797 | |
| |
| Accumulated net investment income | | | 3,826,718 | |
| |
| Accumulated net realized gain on investments and foreign currency transactions | | | 4,536,208 | |
| |
| Net unrealized appreciation on investments and translation of assets and liabilities denominated in foreign currencies | | | 14,750,559 | |
| | | | |
Net Assets | | $ | 217,647,999 | |
| | | | |
|
| |
Net Asset Value Per Share | | | | |
| |
| Non-Service Shares: | | | | |
| |
| Net asset value, redemption price per share and offering price per share (based on net assets of $166,014,627 and 10,430,619 shares of beneficial interest outstanding) | | | $15.92 | |
| |
| |
| Service Shares: | | | | |
| |
| Net asset value, redemption price per share and offering price per share (based on net assets of $51,633,372 and 3,286,400 shares of beneficial interest outstanding) | | | $15.71 | |
See accompanying Notes to Financial Statements.
21 OPPENHEIMER CONSERVATIVE BALANCED FUND/VA
STATEMENT OF OPERATIONS For the Year Ended December 31, 2017
| | | | |
| |
Investment Income | | | | |
| Interest | | $ | 4,051,663 | |
| |
| Dividends: | | | | |
| Unaffiliated companies (net of foreign withholding taxes of $7,093) | | | 1,257,309 | |
| Affiliated companies | | | 43,517 | |
| | | | |
Total investment income | | | 5,352,489 | |
| |
Expenses | | | | |
| Management fees | | | 1,656,729 | |
| |
| Distribution and service plan fees — Service shares | | | 128,331 | |
| |
| Transfer and shareholder servicing agent fees: | | | | |
| Non-Service shares | | | 170,426 | |
| Service shares | | | 51,342 | |
| |
| Shareholder communications: | | | | |
| Non-Service shares | | | 38,917 | |
| Service shares | | | 11,731 | |
| |
| Custodian fees and expenses | | | 44,606 | |
| |
| Trustees’ compensation | | | 14,213 | |
| |
| Borrowing fees | | | 6,050 | |
| |
| Other | | | 97,546 | |
| | | | |
| Total expenses | | | 2,219,891 | |
| Less reduction to custodian expenses | | | (932) | |
| Less waivers and reimbursements of expenses | | | (598,734) | |
| | | | |
Net expenses | | | 1,620,225 | |
| |
Net Investment Income | | | 3,732,264 | |
| |
Realized and Unrealized Gain (Loss) | | | | |
| Net realized gain (loss) on: | | | | |
| Investment transactions in unaffiliated companies | | | 11,292,892 | |
| Futures contracts | | | 363,666 | |
| Foreign currency transactions | | | (961) | |
| Swap contracts | | | 101,939 | |
| | | | |
| Net realized gain | | | 11,757,536 | |
| |
| Net change in unrealized appreciation/depreciation on: | | | | |
| Investment transactions in unaffiliated companies | | | 3,849,482 | |
| Translation of assets and liabilities denominated in foreign currencies | | | 1,889 | |
| Futures contracts | | | 165,856 | |
| Swap contracts | | | 843 | |
| | | | |
Net change in unrealized appreciation/depreciation | | | 4,018,070 | |
| |
Net Increase in Net Assets Resulting from Operations | | $ | 19,507,870 | |
| | | | |
See accompanying Notes to Financial Statements.
22 OPPENHEIMER CONSERVATIVE BALANCED FUND/VA
STATEMENTS OF CHANGES IN NET ASSETS
| | | | | | | | |
| | | Year Ended
December 31, 2017 | | | Year Ended
December 31, 2016 | |
| |
Operations | | | | | | | | |
| Net investment income | | $ | 3,732,264 | | | $ | 3,974,985 | |
| |
| Net realized gain | | | 11,757,536 | | | | 6,003,120 | |
| |
| Net change in unrealized appreciation/depreciation | | | 4,018,070 | | | | 1,806,844 | |
| | | | |
Net increase in net assets resulting from operations | | | 19,507,870 | | | | 11,784,949 | |
| |
Dividends and/or Distributions to Shareholders | | | | | | | | |
| Dividends from net investment income: | | | | | | | | |
| Non-Service shares | | | (3,346,883) | | | | (4,214,715) | |
| Service shares | | | (889,490) | | | | (1,155,621) | |
| | | | |
| | | (4,236,373) | | | | (5,370,336) | |
| |
Beneficial Interest Transactions | | | | | | | | |
| Net decrease in net assets resulting from beneficial interest transactions: | | | | | | | | |
| Non-Service shares | | | (18,304,514) | | | | (14,689,603) | |
| Service shares | | | (3,634,518) | | | | (2,041,174) | |
| | | | |
| | | (21,939,032) | | | | (16,730,777) | |
| |
Net Assets | | | | | | | | |
| Total decrease | | | (6,667,535) | | | | (10,316,164) | |
| |
| Beginning of period | | | 224,315,534 | | | | 234,631,698 | |
| | | | |
End of period (including accumulated net investment income of $3,826,718 and $ 4,130,290, respectively) | | $ | 217,647,999 | | | $ | 224,315,534 | |
| | | | |
See accompanying Notes to Financial Statements.
23 OPPENHEIMER CONSERVATIVE BALANCED FUND/VA
FINANCIAL HIGHLIGHTS
| | | | | | | | | | | | | | | | | | | | |
| Non-Service Shares | | Year Ended
December 31,
2017 | | | Year Ended
December 31,
2016 | | | Year Ended
December 31,
2015 | | | Year Ended
December 31,
2014 | | | Year Ended
December 31,
2013 | |
| |
Per Share Operating Data | | | | | | | | | | | | | | | | | | | | |
| Net asset value, beginning of period | | | $14.86 | | | | $14.46 | | | | $14.67 | | | | $13.84 | | | | $12.52 | |
| |
| Income (loss) from investment operations: | | | | | | | | | | | | | | | | | | | | |
| Net investment income1 | | | 0.27 | | | | 0.26 | | | | 0.31 | | | | 0.29 | | | | 0.25 | |
| Net realized and unrealized gain (loss) | | | 1.09 | | | | 0.49 | | | | (0.18) | | | | 0.83 | | | | 1.38 | |
| | | | |
| Total from investment operations | | | 1.36 | | | | 0.75 | | | | 0.13 | | | | 1.12 | | | | 1.63 | |
| |
| Dividends and/or distributions to shareholders: | | | | | | | | | | | | | | | | | | | | |
| Dividends from net investment income | | | (0.30) | | | | (0.35) | | | | (0.34) | | | | (0.29) | | | | (0.31) | |
| |
| Net asset value, end of period | | | $15.92 | | | | $14.86 | | | | $14.46 | | | | $14.67 | | | | $13.84 | |
| | | | |
|
| |
Total Return, at Net Asset Value2 | | | 9.25% | | | | 5.26% | | | | 0.83% | | | | 8.20% | | | | 13.17% | |
| | | | | | | | | | | | | | | | |
| |
Ratios/Supplemental Data | | | | | | | | | | | | | | | | | | | | |
| Net assets, end of period (in thousands) | | | $166,015 | | | | $172,573 | | | | $182,406 | | | | $203,684 | | | | $213,697 | |
| |
| Average net assets (in thousands) | | | $170,438 | | | | $177,368 | | | | $194,208 | | | | $208,556 | | | | $218,090 | |
| |
| Ratios to average net assets:3 | | | | | | | | | | | | | | | | | | | | |
| Net investment income | | | 1.74% | | | | 1.78% | | | | 2.09% | | | | 2.03% | | | | 1.87% | |
| Expenses excluding specific expenses listed below | | | 0.94% | | | | 0.94% | | | | 0.91% | | | | 0.90% | | | | 0.89% | |
| Interest and fees from borrowings | | | 0.00%4 | | | | 0.00%4 | | | | 0.00%4 | | | | 0.00% | | | | 0.00% | |
| | | | |
| Total expenses5 | | | 0.94% | | | | 0.94% | | | | 0.91% | | | | 0.90% | | | | 0.89% | |
| Expenses after payments, waivers and/or reimbursements and reduction to custodian expenses | | | 0.67% | | | | 0.67% | | | | 0.67% | | | | 0.67% | | | | 0.66% | |
| |
| Portfolio turnover rate6 | | | 76% | | | | 68% | | | | 68% | | | | 98% | | | | 187% | |
1. Per share amounts calculated based on the average shares outstanding during the period.
2. Assumes an initial investment on the business day before the first day of the fiscal period, with all dividends and distributions reinvested in additional shares on the reinvestment date, and redemption at the net asset value calculated on the last business day of the fiscal period. Total returns are not annualized for periods less than one full year. Total return information does not reflect expenses that apply at the separate account level or to related insurance products. Inclusion of these charges would reduce the total return figures for all periods shown. Returns do not reflect the deduction of taxes that a shareholder would pay on fund distributions or the redemption of fund shares.
3. Annualized for periods less than one full year.
4. Less than 0.005%.
5. Total expenses including indirect expenses from affiliated fund fees and expenses were as follows:
| | | | | | |
| | | | | | |
Year Ended December 31, 2017 | | | 0.94 | % | |
Year Ended December 31, 2016 | | | 0.94 | % | |
Year Ended December 31, 2015 | | | 0.91 | % | |
Year Ended December 31, 2014 | | | 0.90 | % | |
Year Ended December 31, 2013 | | | 0.90 | % | |
6. The portfolio turnover rate excludes purchase and sale transactions of To Be Announced (TBA) mortgage-related securities as follows:
| | | | | | | | |
| | | Purchase Transactions | | | Sale Transactions | |
| |
Year Ended December 31, 2017 | | | $729,295,309 | | | | $711,803,922 | |
Year Ended December 31, 2016 | | | $737,550,642 | | | | $742,753,245 | |
Year Ended December 31, 2015 | | | $829,988,104 | | | | $849,696,153 | |
Year Ended December 31, 2014 | | | $697,503,637 | | | | $678,765,376 | |
Year Ended December 31, 2013 | | | $794,398,216 | | | | $800,879,825 | |
See accompanying Notes to Financial Statements.
24 OPPENHEIMER CONSERVATIVE BALANCED FUND/VA
| | | | | | | | | | | | | | | | | | | | |
| Service Shares | | Year Ended
December 31,
2017 | | | Year Ended
December 31,
2016 | | | Year Ended
December 31,
2015 | | | Year Ended
December 31,
2014 | | | Year Ended
December 31,
2013 | |
| |
Per Share Operating Data | | | | | | | | | | | | | | | | | | | | |
| Net asset value, beginning of period | | | $14.67 | | | | $14.28 | | | | $14.49 | | | | $13.66 | | | | $12.37 | |
| |
| Income (loss) from investment operations: | | | | | | | | | | | | | | | | | | | | |
| Net investment income1 | | | 0.23 | | | | 0.22 | | | | 0.27 | | | | 0.25 | | | | 0.21 | |
| Net realized and unrealized gain (loss) | | | 1.07 | | | | 0.48 | | | | (0.18) | | | | 0.84 | | | | 1.36 | |
| | | | |
| Total from investment operations | | | 1.30 | | | | 0.70 | | | | 0.09 | | | | 1.09 | | | | 1.57 | |
| |
| Dividends and/or distributions to shareholders: | | | | | | | | | | | | | | | | | | | | |
| Dividends from net investment income | | | (0.26) | | | | (0.31) | | | | (0.30) | | | | (0.26) | | | | (0.28) | |
| |
| Net asset value, end of period | | | $15.71 | | | | $14.67 | | | | $14.28 | | | | $14.49 | | | | $13.66 | |
| | | | |
|
| |
Total Return, at Net Asset Value2 | | | 8.95% | | | | 4.96% | | | | 0.57% | | | | 8.02% | | | | 12.83% | |
| | | | | | | | | | | | | | | | |
| |
Ratios/Supplemental Data | | | | | | | | | | | | | | | | | | | | |
| Net assets, end of period (in thousands) | | | $51,633 | | | | $51,743 | | | | $52,226 | | | | $63,880 | | | | $69,601 | |
| |
| Average net assets (in thousands) | | | $51,345 | | | | $53,914 | | | | $59,085 | | | | $65,450 | | | | $72,332 | |
| |
| Ratios to average net assets:3 | | | | | | | | | | | | | | | | | | | | |
| Net investment income | | | 1.49% | | | | 1.53% | | | | 1.84% | | | | 1.78% | | | | 1.62% | |
| Expenses excluding specific expenses listed below | | | 1.19% | | | | 1.19% | | | | 1.16% | | | | 1.15% | | | | 1.15% | |
| Interest and fees from borrowings | | | 0.00%4 | | | | 0.00%4 | | | | 0.00%4 | | | | 0.00% | | | | 0.00% | |
| | | | |
| Total expenses5 | | | 1.19% | | | | 1.19% | | | | 1.16% | | | | 1.15% | | | | 1.15% | |
| Expenses after payments, waivers and/or reimbursements and reduction to custodian expenses | | | 0.92% | | | | 0.92% | | | | 0.92% | | | | 0.92% | | | | 0.92% | |
| |
| Portfolio turnover rate6 | | | 76% | | | | 68% | | | | 68% | | | | 98% | | | | 187% | |
1. Per share amounts calculated based on the average shares outstanding during the period.
2. Assumes an initial investment on the business day before the first day of the fiscal period, with all dividends and distributions reinvested in additional shares on the reinvestment date, and redemption at the net asset value calculated on the last business day of the fiscal period. Total returns are not annualized for periods less than one full year. Total return information does not reflect expenses that apply at the separate account level or to related insurance products. Inclusion of these charges would reduce the total return figures for all periods shown. Returns do not reflect the deduction of taxes that a shareholder would pay on fund distributions or the redemption of fund shares.
3. Annualized for periods less than one full year.
4. Less than 0.005%.
5. Total expenses including indirect expenses from affiliated fund fees and expenses were as follows:
| | | | | | |
| | | | | | |
Year Ended December 31, 2017 | | | 1.19 | % | |
Year Ended December 31, 2016 | | | 1.19 | % | |
Year Ended December 31, 2015 | | | 1.16 | % | |
Year Ended December 31, 2014 | | | 1.15 | % | |
Year Ended December 31, 2013 | | | 1.16 | % | |
6. The portfolio turnover rate excludes purchase and sale transactions of To Be Announced (TBA) mortgage-related securities as follows:
| | | | | | | | |
| | | Purchase Transactions | | | Sale Transactions | |
| |
Year Ended December 31, 2017 | | | $729,295,309 | | | | $711,803,922 | |
Year Ended December 31, 2016 | | | $737,550,642 | | | | $742,753,245 | |
Year Ended December 31, 2015 | | | $829,988,104 | | | | $849,696,153 | |
Year Ended December 31, 2014 | | | $697,503,637 | | | | $678,765,376 | |
Year Ended December 31, 2013 | | | $794,398,216 | | | | $800,879,825 | |
See accompanying Notes to Financial Statements.
25 OPPENHEIMER CONSERVATIVE BALANCED FUND/VA
NOTES TO FINANCIAL STATEMENTS December 31, 2017
1. Organization
Oppenheimer Conservative Balanced Fund/VA (the “Fund”), a separate series of Oppenheimer Variable Account Funds, is a diversified open-end management investment company registered under the Investment Company Act of 1940 (“1940 Act”), as amended. The Fund’s investment objective is to seek total return. The Fund’s investment adviser is OFI Global Asset Management, Inc. (“OFI Global” or the “Manager”), a wholly-owned subsidiary of OppenheimerFunds, Inc. (“OFI” or the “Sub-Adviser”). The Manager has entered into a sub-advisory agreement with OFI. Shares of the Fund are sold only to separate accounts of life insurance companies.
The Fund offers two classes of shares. Both classes are sold at their offering price, which is the net asset value per share, to separate investment accounts of participating insurance companies as an underlying investment for variable life insurance policies, variable annuity contracts or other investment products. The class of shares designated as Service shares is subject to a distribution and service plan. Both classes of shares have identical rights and voting privileges with respect to the Fund in general and exclusive voting rights on matters that affect that class alone. Earnings, net assets and net asset value per share may differ due to each class having its own expenses, such as transfer and shareholder servicing agent fees and shareholder communications, directly attributable to that class.
The following is a summary of significant accounting policies followed in the Fund’s preparation of financial statements in accordance with accounting principles generally accepted in the United States (“U.S. GAAP”).
2. Significant Accounting Policies
Security Valuation. All investments in securities are recorded at their estimated fair value, as described in Note 3.
Foreign Currency Translation. The books and records of the Fund are maintained in U.S. dollars. Any foreign currency amounts are translated into U.S. dollars on the following basis:
(1) Value of investment securities, other assets and liabilities — at the exchange rates prevailing at Market Close as described in Note 3.
(2) Purchases and sales of investment securities, income and expenses — at the rates of exchange prevailing on the respective dates of such transactions.
Although the net assets and the values are presented at the foreign exchange rates at Market Close, the Fund does not isolate the portion of the results of operations resulting from changes in foreign exchange rates on investments from the fluctuations arising from changes in prices of securities held. Such fluctuations are included with the net realized and unrealized gains or losses from investments shown in the Statement of Operations.
For securities, which are subject to foreign withholding tax upon disposition, realized gains or losses on such securities are recorded net of foreign withholding tax.
Reported net realized foreign exchange gains or losses arise from sales of foreign currencies, currency gains or losses realized between the trade and settlement dates on securities transactions, the difference between the amounts of dividends, interest, and foreign withholding tax reclaims recorded on the Fund’s books, and the U.S. dollar equivalent of the amounts actually received or paid. Net unrealized foreign exchange gains and losses arise from changes in the value of assets and liabilities other than investments in securities, resulting from changes in the exchange rate.
Allocation of Income, Expenses, Gains and Losses. Income, expenses (other than those attributable to a specific class), gains and losses are allocated on a daily basis to each class of shares based upon the relative proportion of net assets represented by such class. Operating expenses directly attributable to a specific class are charged against the operations of that class.
Dividends and Distributions to Shareholders. Dividends and distributions to shareholders, which are determined in accordance with income tax regulations and may differ from U.S. GAAP, are recorded on the ex-dividend date. Income and capital gain distributions, if any, are declared and paid annually or at other times as determined necessary by the Manager.
Investment Income. Dividend income is recorded on the ex-dividend date or upon ex-dividend notification in the case of certain foreign dividends where the ex-dividend date may have passed. Non-cash dividends included in dividend income, if any, are recorded at the fair value of the securities received. Withholding taxes on foreign dividends, if any, and capital gains taxes on foreign investments, if any, have been provided for in accordance with the Fund’s understanding of the applicable tax rules and regulations. Interest income, if any, is recognized on an accrual basis. Discount and premium, which are included in interest income on the Statement of Operations, are amortized or accreted daily.
Return of Capital Estimates. Distributions received from the Fund’s investments in Master Limited Partnerships (MLPs) and Real Estate Investments Trusts (REITs), generally are comprised of income and return of capital. The Fund records investment income and return of capital based on estimates. Such estimates are based on historical information available from each MLP, REIT and other industry sources. These estimates may subsequently be revised based on information received from MLPs and REITs after their tax reporting periods are concluded.
Custodian Fees. “Custodian fees and expenses” in the Statement of Operations may include interest expense incurred by the Fund on any cash overdrafts of its custodian account during the period. Such cash overdrafts may result from the effects of failed trades in portfolio securities and from cash outflows resulting from unanticipated shareholder redemption activity. The Fund pays interest to its custodian on such cash overdrafts, to the extent they are not offset by positive cash balances maintained by the Fund, at a rate equal to the Federal Funds Rate plus 2.00%. The “Reduction to custodian expenses” line item, if applicable, represents earnings on cash balances maintained by the Fund during the period. Such interest expense and other custodian fees may be paid with these earnings.
26 OPPENHEIMER CONSERVATIVE BALANCED FUND/VA
2. Significant Accounting Policies (Continued)
Security Transactions. Security transactions are recorded on the trade date. Realized gains and losses on securities sold are determined on the basis of identified cost.
Indemnifications. The Fund’s organizational documents provide current and former Trustees and officers with a limited indemnification against liabilities arising in connection with the performance of their duties to the Fund. In the normal course of business, the Fund may also enter into contracts that provide general indemnifications. The Fund’s maximum exposure under these arrangements is unknown as this would be dependent on future claims that may be made against the Fund. The risk of material loss from such claims is considered remote.
Federal Taxes. The Fund intends to comply with provisions of the Internal Revenue Code applicable to regulated investment companies and to distribute substantially all of its investment company taxable income, including any net realized gain on investments not offset by capital loss carryforwards, if any, to shareholders. Therefore, no federal income or excise tax provision is required. The Fund files income tax returns in U.S. federal and applicable state jurisdictions. The statute of limitations on the Fund’s tax return filings generally remains open for the three preceding fiscal reporting period ends. The Fund has analyzed its tax positions for the fiscal year ended December 31, 2017, including open tax years, and does not believe there are any uncertain tax positions requiring recognition in the Fund’s financial statements.
The tax components of capital shown in the following table represent distribution requirements the Fund must satisfy under the income tax regulations, losses the Fund may be able to offset against income and gains realized in future years and unrealized appreciation or depreciation of securities and other investments for federal income tax purposes.
| | | | | | | | | | | | |
Undistributed Net Investment Income | | Undistributed
Long-Term
Gain | | | Accumulated
Loss
Carryforward1,2
| | | Net Unrealized
Appreciation
Based on cost of
Securities and
Other Investments
for Federal Income
Tax Purposes | |
| |
$3,873,530 | | | $4,754,290 | | | | $— | | | | $14,531,986 | |
1. During the reporting period, the Fund utilized $5,261,675 of capital loss carryforward to offset capital gains realized in that fiscal year.
2. During the previous reporting period, the Fund utilized $6,632,281 of capital loss carryforward to offset capital gains realized in that fiscal year.
Net investment income (loss) and net realized gain (loss) may differ for financial statement and tax purposes. The character of dividends and distributions made during the fiscal year from net investment income or net realized gains are determined in accordance with federal income tax requirements, which may differ from the character of net investment income or net realized gains presented in those financial statements in accordance with U.S. GAAP. Also, due to timing of dividends and distributions, the fiscal year in which amounts are distributed may differ from the fiscal year in which the income or net realized gain was recorded by the Fund.
Accordingly, the following amounts have been reclassified for the reporting period. Net assets of the Fund were unaffected by the reclassifications.
| | | | | | | | |
Increase to Paid-in Capital | | Increase to Accumulated
Net Investment
Income | | | Reduction to Accumulated Net
Realized Gain on Investments3 | |
| |
$354,657 | | | $200,537 | | | | $555,194 | |
3. $354,657, all of which was long-term capital gain, was distributed in connection with Fund share redemptions.
The tax character of distributions paid during the reporting periods:
| | | | | | | | |
| | | Year Ended
December 31, 2017 | | | Year Ended
December 31, 2016 | |
| |
Distributions paid from: | | | | | | | | |
Ordinary income | | $ | 4,236,373 | | | $ | 5,370,336 | |
The aggregate cost of securities and other investments and the composition of unrealized appreciation and depreciation of securities and other investments for federal income tax purposes at period end are noted in the following table. The primary difference between book and tax appreciation or depreciation of securities and other investments, if applicable, is attributable to the tax deferral of losses or tax realization of financial statement unrealized gain or loss.
| | | | |
Federal tax cost of securities | | $ | 241,021,276 | |
Federal tax cost of other investments | | | (2,858,525) | |
| | | | |
Total federal tax cost | | $ | 238,162,751 | |
| | | | |
Gross unrealized appreciation | | $ | 17,799,742 | |
Gross unrealized depreciation | | | (3,267,756) | |
| | | | |
Net unrealized appreciation | | $ | 14,531,986 | |
| | | | |
27 OPPENHEIMER CONSERVATIVE BALANCED FUND/VA
NOTES TO FINANCIAL STATEMENTS Continued
2. Significant Accounting Policies (Continued)
Use of Estimates. The preparation of financial statements in conformity with U.S. GAAP requires management to make estimates and assumptions that affect the reported amounts of assets and liabilities and disclosure of contingent assets and liabilities at the date of the financial statements and the reported amounts of increases and decreases in net assets from operations during the reporting period. Actual results could differ from those estimates.
3. Securities Valuation
The Fund calculates the net asset value of its shares as of 4:00 P.M. Eastern time, on each day the New York Stock Exchange (the “Exchange”) is open for trading, except in the case of a scheduled early closing of the Exchange, in which case the Fund will calculate net asset value of the shares as of the scheduled early closing time of the Exchange.
The Fund’s Board has adopted procedures for the valuation of the Fund’s securities and has delegated the day-to-day responsibility for valuation determinations under those procedures to the Manager. The Manager has established a Valuation Committee which is responsible for determining a fair valuation for any security for which market quotations are not readily available. The Valuation Committee’s fair valuation determinations are subject to review, approval and ratification by the Fund’s Board at least quarterly or more frequently, if necessary.
Valuation Methods and Inputs
Securities are valued primarily using unadjusted quoted market prices, when available, as supplied by third party pricing services or broker-dealers.
The following methodologies are used to determine the market value or the fair value of the types of securities described below:
Equity securities traded on a securities exchange (including exchange-traded derivatives other than futures and futures options) are valued based on the official closing price on the principal exchange on which the security is traded, as identified by the Manager, prior to the time when the Fund’s assets are valued. If the official closing price is unavailable, the security is valued at the last sale price on the principal exchange on which it is traded, or if no sales occurred, the security is valued at the mean between the quoted bid and asked prices. Over-the-counter equity securities are valued at the last published sale price, or if no sales occurred, at the mean between the quoted bid and asked prices. Events occurring after the close of trading on foreign exchanges may result in adjustments to the valuation of foreign securities to more accurately reflect their fair value as of the time when the Fund’s assets are valued.
Shares of a registered investment company that are not traded on an exchange are valued at that investment company’s net asset value per share.
Corporate and government debt securities (of U.S. or foreign issuers) and municipal debt securities, short-term notes, mortgage-backed securities, collateralized mortgage obligations, and asset-backed securities are valued at the mean between the bid and asked prices utilizing evaluated prices obtained from third party pricing services or broker-dealers who may use matrix pricing methods to determine the evaluated prices. Pricing services generally price debt securities assuming orderly transactions of an institutional “round lot” size, but some trades may occur in smaller, “odd lot” sizes, sometimes at lower prices than institutional round lot trades. Standard inputs generally considered by third-party pricing vendors include reported trade data, broker-dealer price quotations, benchmark yields, issuer spreads on comparable securities, the credit quality, yield, maturity, as well as other appropriate factors.
Futures contracts and futures options traded on a commodities or futures exchange will be valued at the final settlement price or official closing price on the principal exchange as reported by such principal exchange at its trading session ending at, or most recently prior to, the time when the Fund’s assets are valued.
Securities for which market quotations are not readily available, or when a significant event has occurred that would materially affect the value of the security, are fair valued either (i) by a standardized fair valuation methodology applicable to the security type or the significant event as previously approved by the Valuation Committee and the Fund’s Board or (ii) as determined in good faith by the Manager’s Valuation Committee. The Valuation Committee considers all relevant facts that are reasonably available, through either public information or information available to the Manager, when determining the fair value of a security. Those standardized fair valuation methodologies include, but are not limited to, valuing securities at the last sale price or initially at cost and subsequently adjusting the value based on: changes in company specific fundamentals, changes in an appropriate securities index, or changes in the value of similar securities which may be further adjusted for any discounts related to security-specific resale restrictions. When possible, such methodologies use observable market inputs such as unadjusted quoted prices of similar securities, observable interest rates, currency rates and yield curves. The methodologies used for valuing securities are not necessarily an indication of the risks associated with investing in those securities nor can it be assured that the Fund can obtain the fair value assigned to a security if it were to sell the security.
To assess the continuing appropriateness of security valuations, the Manager regularly compares prior day prices and sale prices to the current day prices and challenges those prices exceeding certain tolerance levels with the third party pricing service or broker source. For those securities valued by fair valuations, whether through a standardized fair valuation methodology or a fair valuation determination, the Valuation Committee reviews and affirms the reasonableness of the valuations based on such methodologies and fair valuation determinations on a regular basis after considering all relevant information that is reasonably available.
Classifications
Each investment asset or liability of the Fund is assigned a level at measurement date based on the significance and source of the inputs to its valuation. Various data inputs may be used in determining the value of each of the Fund’s investments as of the reporting period end. These data inputs are categorized in the following hierarchy under applicable financial accounting standards:
1) Level 1-unadjusted quoted prices in active markets for identical assets or liabilities (including securities actively traded on a securities exchange)
2) Level 2-inputs other than unadjusted quoted prices that are observable for the asset or liability (such as unadjusted quoted prices for similar assets
28 OPPENHEIMER CONSERVATIVE BALANCED FUND/VA
3. Securities Valuation (Continued)
and market corroborated inputs such as interest rates, prepayment speeds, credit risks, etc.)
3) Level 3-significant unobservable inputs (including the Manager’s own judgments about assumptions that market participants would use in pricing the asset or liability).
The inputs used for valuing securities are not necessarily an indication of the risks associated with investing in those securities.
The Fund classifies each of its investments in investment companies which are publicly offered as Level 1. Investment companies that are not publicly offered, if any, are classified as Level 2 in the fair value hierarchy.
The table below categorizes amounts that are included in the Fund’s Statement of Assets and Liabilities at period end based on valuation input level:
| | | | | | | | | | | | | | | | |
| | | Level 1— Unadjusted
Quoted Prices | | | Level 2— Other Significant
Observable Inputs | | | Level 3— Significant
Unobservable Inputs | | | Value | |
| |
Assets Table | | | | | | | | | | | | | | | | |
Investments, at Value: | | | | | | | | | | | | | | | | |
Common Stocks | | | | | | | | | | | | | | | | |
Consumer Discretionary | | $ | 7,417,523 | | | $ | — | | | $ | — | | | $ | 7,417,523 | |
Consumer Staples | | | 4,497,479 | | | | 732,271 | | | | — | | | | 5,229,750 | |
Energy | | | 4,524,559 | | | | — | | | | — | | | | 4,524,559 | |
Financials | | | 14,657,514 | | | | — | | | | — | | | | 14,657,514 | |
Health Care | | | 8,505,538 | | | | — | | | | — | | | | 8,505,538 | |
Industrials | | | 9,362,772 | | | | — | | | | — | | | | 9,362,772 | |
Information Technology | | | 19,224,945 | | | | — | | | | — | | | | 19,224,945 | |
Materials | | | 2,920,327 | | | | — | | | | — | | | | 2,920,327 | |
Telecommunication Services | | | 1,795,124 | | | | — | | | | — | | | | 1,795,124 | |
Utilities | | | 1,789,847 | | | | 547,292 | | | | — | | | | 2,337,139 | |
Asset-Backed Securities | | | — | | | | 19,540,769 | | | | — | | | | 19,540,769 | |
Mortgage-Backed Obligations | | | — | | | | 82,553,042 | | | | 128,201 | | | | 82,681,243 | |
U.S. Government Obligation | | | — | | | | 549,279 | | | | — | | | | 549,279 | |
Non-Convertible Corporate Bonds and Notes | | | — | | | | 71,440,747 | | | | — | | | | 71,440,747 | |
Investment Company | | | 5,367,607 | | | | — | | | | — | | | | 5,367,607 | |
| | | | |
Total Investments, at Value | | | 80,063,235 | | | | 175,363,400 | | | | 128,201 | | | | 255,554,836 | |
Other Financial Instruments: | | | | | | | | | | | | | | | | |
Futures contracts | | | 130,089 | | | | — | | | | — | | | | 130,089 | |
| | | | |
Total Assets | | $ | 80,193,324 | | | $ | 175,363,400 | | | $ | 128,201 | | | $ | 255,684,925 | |
| | | | |
Forward currency exchange contracts and futures contracts, if any, are reported at their unrealized appreciation/depreciation at measurement date, which represents the change in the contract’s value from trade date. All additional assets and liabilities included in the above table are reported at their market value at measurement date.
4. Investments and Risks
Investments in Affiliated Funds. The Fund is permitted to invest in other mutual funds advised by the Manager (“Affiliated Funds”). Affiliated Funds are open-end management investment companies registered under the 1940 Act, as amended. The Manager is the investment adviser of, and the Sub-Adviser provides investment and related advisory services to, the Affiliated Funds. When applicable, the Fund’s investments in Affiliated Funds are included in the Statement of Investments. Shares of Affiliated Funds are valued at their net asset value per share. As a shareholder, the Fund is subject to its proportional share of the Affiliated Funds’ expenses, including their management fee. The Manager will waive fees and/or reimburse Fund expenses in an amount equal to the indirect management fees incurred through the Fund’s investment in the Affiliated Funds.
Each of the Affiliated Funds in which the Fund invests has its own investment risks, and those risks can affect the value of the Fund’s investments and therefore the value of the Fund’s shares. To the extent that the Fund invests more of its assets in one Affiliated Fund than in another, the Fund will have greater exposure to the risks of that Affiliated Fund.
Investments in Money Market Instruments. The Fund is permitted to invest its free cash balances in money market instruments to provide liquidity or for defensive purposes. The Fund may invest in money market instruments by investing in Class E shares of Oppenheimer Institutional Government Money Market Fund (“IGMMF”), which is an Affiliated Fund. IGMMF is regulated as a money market fund under the 1940 Act, as amended. The Fund may also invest in money market instruments directly or in other affiliated or unaffiliated money market funds.
Master Limited Partnerships (“MLPs”). MLPs issue common units that represent an equity ownership interest in a partnership and provide limited voting rights. MLP common units are registered with the Securities and Exchange Commission (“SEC”), and are freely tradable on securities exchanges such as the NYSE and the NASDAQ Stock Market (“NASDAQ”), or in the over-the-counter (“OTC”) market. An MLP consists of one or more general partners, who conduct the business, and one or more limited partners, who contribute capital. MLP common unit holders have a limited role in the partnership’s operations and management. The Fund, as a limited partner, normally would not be liable for the debts of the MLP beyond the amounts
29 OPPENHEIMER CONSERVATIVE BALANCED FUND/VA
NOTES TO FINANCIAL STATEMENTS Continued
4. Investments and Risks (Continued)
the Fund has contributed, but would not be shielded to the same extent that a shareholder of a corporation would be. In certain circumstances creditors of an MLP would have the right to seek return of capital distributed to a limited partner. This right of an MLP’s creditors would continue after the Fund sold its investment in the MLP.
Securities on a When-Issued or Delayed Delivery Basis. The Fund may purchase securities on a “when-issued” basis, and may purchase or sell securities on a “delayed delivery” basis. “When-issued” or “delayed delivery” refers to securities whose terms and indenture are available and for which a market exists, but which are not available for immediate delivery. Delivery and payment for securities that have been purchased by the Fund on a when-issued basis normally takes place within six months and possibly as long as two years or more after the trade date. During this period, such securities do not earn interest, are subject to market fluctuation and may increase or decrease in value prior to their delivery. The purchase of securities on a when-issued basis may increase the volatility of the Fund’s net asset value to the extent the Fund executes such transactions while remaining substantially fully invested. When the Fund engages in when-issued or delayed delivery transactions, it relies on the buyer or seller, as the case may be, to complete the transaction. Their failure to do so may cause the Fund to lose the opportunity to obtain or dispose of the security at a price and yield it considers advantageous. The Fund may also sell securities that it purchased on a when-issued basis or forward commitment prior to settlement of the original purchase.
At period end, the Fund had purchased securities issued on a when-issued or delayed delivery basis and sold securities issued on a delayed delivery basis as follows:
| | | | |
| | | When-Issued or
Delayed Delivery
Basis Transactions | |
| |
Purchased securities | | | $57,568,656 | |
Sold securities | | | 2,162,782 | |
The Fund may enter into “forward roll” transactions with respect to mortgage-related securities. In this type of transaction, the Fund sells a mortgage-related security to a buyer and simultaneously agrees to repurchase a similar security (same type, coupon and maturity) at a later date at a set price. During the period between the sale and the repurchase, the Fund will not be entitled to receive interest and principal payments on the securities that have been sold. The Fund records the incremental difference between the forward purchase and sale of each forward roll as realized gain (loss) on investments or as fee income in the case of such transactions that have an associated fee in lieu of a difference in the forward purchase and sale price.
Forward roll transactions may be deemed to entail embedded leverage since the Fund purchases mortgage-related securities with extended settlement dates rather than paying for the securities under a normal settlement cycle. This embedded leverage increases the Fund’s market value of investments relative to its net assets which can incrementally increase the volatility of the Fund’s performance. Forward roll transactions can be replicated over multiple settlement periods.
Risks of entering into forward roll transactions include the potential inability of the counterparty to meet the terms of the agreement; the potential of the Fund to receive inferior securities at redelivery as compared to the securities sold to the counterparty; and counterparty credit risk.
At period end, the Fund pledged $32,837 of collateral to the counterparty for forward roll transactions.
Restricted Securities. At period end, investments in securities included issues that are restricted. A restricted security may have a contractual restriction on its resale and is valued under methods approved by the Board of Trustees as reflecting fair value. Securities that are restricted are marked with an applicable footnote on the Statement of Investments. Restricted securities are reported on a schedule following the Statement of Investments.
Equity Security Risk. Stocks and other equity securities fluctuate in price. The value of the Fund’s portfolio may be affected by changes in the equity markets generally. Equity markets may experience significant short-term volatility and may fall sharply at times. Different markets may behave differently from each other and U.S. equity markets may move in the opposite direction from one or more foreign stock markets. Adverse events in any part of the equity or fixed-income markets may have unexpected negative effects on other market segments.
The prices of individual equity securities generally do not all move in the same direction at the same time and a variety of factors can affect the price of a particular company’s securities. These factors may include, but are not limited to, poor earnings reports, a loss of customers, litigation against the company, general unfavorable performance of the company’s sector or industry, or changes in government regulations affecting the company or its industry.
Shareholder Concentration. At period end, one shareholder owned 20% or more of the Fund’s total outstanding shares.
The shareholder is a related party of the Fund. Related parties may include, but are not limited to, the investment manager and its affiliates, affiliated broker dealers, fund of funds, and directors or employees. The related party owned 43% of the Fund’s total outstanding shares at period end.
5. Market Risk Factors
The Fund’s investments in securities and/or financial derivatives may expose the Fund to various market risk factors:
Commodity Risk. Commodity risk relates to the change in value of commodities or commodity indexes as they relate to increases or decreases in the commodities market. Commodities are physical assets that have tangible properties. Examples of these types of assets are crude oil, heating oil, metals, livestock, and agricultural products.
30 OPPENHEIMER CONSERVATIVE BALANCED FUND/VA
5. Market Risk Factors (Continued)
Credit Risk. Credit risk relates to the ability of the issuer of debt to meet interest and principal payments, or both, as they come due. In general, lower-grade, higher-yield debt securities are subject to credit risk to a greater extent than lower-yield, higher-quality securities.
Equity Risk. Equity risk relates to the change in value of equity securities as they relate to increases or decreases in the general market.
Foreign Exchange Rate Risk. Foreign exchange rate risk relates to the change in the U.S. dollar value of a security held that is denominated in a foreign currency. The U.S. dollar value of a foreign currency denominated security will decrease as the dollar appreciates against the currency, while the U.S. dollar value will increase as the dollar depreciates against the currency.
Interest Rate Risk. Interest rate risk refers to the fluctuations in value of fixed-income securities resulting from the inverse relationship between price and yield. For example, an increase in general interest rates will tend to reduce the market value of already issued fixed-income investments, and a decline in general interest rates will tend to increase their value. In addition, debt securities with longer maturities, which tend to have higher yields, are subject to potentially greater fluctuations in value from changes in interest rates than obligations with shorter maturities.
Volatility Risk. Volatility risk refers to the magnitude of the movement, but not the direction of the movement, in a financial instrument’s price over a defined time period. Large increases or decreases in a financial instrument’s price over a relative time period typically indicate greater volatility risk, while small increases or decreases in its price typically indicate lower volatility risk.
6. Use of Derivatives
The Fund’s investment objective not only permits the Fund to purchase investment securities, it also allows the Fund to enter into various types of derivatives contracts, including, but not limited to, futures contracts, forward currency exchange contracts, credit default swaps, interest rate swaps, total return swaps, variance swaps and purchased and written options. In doing so, the Fund will employ strategies in differing combinations to permit it to increase, decrease, or change the level or types of exposure to market risk factors. These instruments may allow the Fund to pursue its objectives more quickly and efficiently than if it were to make direct purchases or sales of securities capable of effecting a similar response to market factors. Such contracts may be entered into through a bilateral over-the-counter (“OTC”) transaction, or through a securities or futures exchange and cleared through a clearinghouse.
Derivatives may have little or no initial cash investment relative to their market value exposure and therefore can produce significant gains or losses in excess of their cost due to changes in the market risk factors and the overall market. This use of embedded leverage allows the Fund to increase its market value exposure relative to its net assets and can substantially increase the volatility of the Fund’s performance. In instances where the Fund is using derivatives to decrease, or hedge, exposures to market risk factors for securities held by the Fund, there are also risks that those derivatives may not perform as expected resulting in losses for the combined or hedged positions. Some derivatives have the potential for unlimited loss, regardless of the size of the Fund’s initial investment.
Additional associated risks from investing in derivatives also exist and potentially could have significant effects on the valuation of the derivative and the Fund. Typically, the associated risks are not the risks that the Fund is attempting to increase or decrease exposure to, per its investment objectives, but are the additional risks from investing in derivatives. Examples of these associated risks are liquidity risk, which is the risk that the Fund will not be able to sell the derivative in the open market in a timely manner, and counterparty credit risk, which is the risk that the counterparty will not fulfill its obligation to the Fund.
The Fund’s actual exposures to these market risk factors and associated risks during the period are discussed in further detail, by derivative type, below.
Futures Contracts
A futures contract is a commitment to buy or sell a specific amount of a commodity, financial instrument or currency at a negotiated price on a stipulated future date. The Fund may buy and sell futures contracts and may also buy or write put or call options on these futures contracts. Futures contracts and options thereon are generally entered into on a regulated futures exchange and cleared through a clearinghouse associated with the exchange.
Upon entering into a futures contract, the Fund is required to deposit either cash or securities (initial margin) in an amount equal to a certain percentage of the contract value in an account registered in the futures commission merchant’s name. Subsequent payments (variation margin) are paid to or from the futures commission merchant each day equal to the daily changes in the contract value. Such payments are recorded as unrealized gains and losses. Should the Fund fail to make requested variation margin payments, the futures commission merchant can gain access to the initial margin to satisfy the Fund’s payment obligations.
Futures contracts are reported on a schedule following the Statement of Investments. Securities held by a futures commission merchant to cover initial margin requirements on open futures contracts are noted in the Statement of Investments. Cash held by a futures commission merchant to cover initial margin requirements on open futures contracts and the receivable and/or payable for the daily mark to market for the variation margin are noted in the Statement of Assets and Liabilities. The net change in unrealized appreciation and depreciation is reported in the Statement of Operations. Realized gains (losses) are reported in the Statement of Operations at the closing or expiration of futures contracts.
The Fund may purchase and/or sell financial futures contracts and options on futures contracts to gain exposure to, or decrease exposure to interest rate risk, equity risk, foreign exchange rate risk, volatility risk, or commodity risk.
During the reporting period, the Fund had an ending monthly average market value of $24,983,731 and $15,646,786 on futures contracts purchased and sold, respectively.
Additional associated risks of entering into futures contracts (and related options) include the possibility that there may be an illiquid market where the Fund is unable to liquidate the contract or enter into an offsetting position and, if used for hedging purposes, the risk that the price of the contract
31 OPPENHEIMER CONSERVATIVE BALANCED FUND/VA
NOTES TO FINANCIAL STATEMENTS Continued
6. Use of Derivatives (Continued)
will correlate imperfectly with the prices of the Fund’s securities.
Swap Contracts
The Fund may enter into swap contract agreements with a counterparty to exchange a series of cash flows based on either specified reference rates, the price or volatility of asset or non-asset references, or the occurrence of a credit event, over a specified period. Swaps can be executed in a bi-lateral privately negotiated arrangement with a dealer in an OTC transaction (“OTC swaps”) or executed on a regulated market. Certain swaps, regardless of the venue of their execution, are required to be cleared through a clearinghouse (“centrally cleared swaps”). Swap contracts may include interest rate, equity, debt, index, total return, credit default, currency, and volatility swaps.
Swap contracts are reported on a schedule following the Statement of Investments. The values of centrally cleared swap and OTC swap contracts are aggregated by positive and negative values and disclosed separately on the Statement of Assets and Liabilities. The unrealized appreciation (depreciation) related to the change in the valuation of the notional amount of the swap is combined with the accrued interest due to (owed by) the Fund, if any, at termination or settlement. The net change in this amount during the period is included on the Statement of Operations. The Fund also records any periodic payments received from (paid to) the counterparty, including at termination, under such contracts as realized gain (loss) on the Statement of Operations.
Swap contract agreements are exposed to the market risk factor of the specific underlying reference rate or asset. Swap contracts are typically more attractively priced compared to similar investments in related cash securities because they isolate the risk to one market risk factor and eliminate the other market risk factors. Investments in cash securities (for instance bonds) have exposure to multiple risk factors (credit and interest rate risk). Because swaps have embedded leverage, they can expose the Fund to substantial risk in the isolated market risk factor.
Credit Default Swap Contracts. A credit default swap is a contract that enables an investor to buy or sell protection against a defined-issuer credit event, such as the issuer’s failure to make timely payments of interest or principal on a debt security, bankruptcy or restructuring. The Fund may enter into credit default swaps either by buying or selling protection on a corporate issuer, sovereign issuer, or a basket or index of issuers (the “reference asset”).
The buyer of protection pays a periodic fee to the seller of protection based on the notional amount of the swap contract. The seller of protection agrees to compensate the buyer of protection for future potential losses as a result of a credit event on the reference asset. The contract effectively transfers the credit event risk of the reference asset from the buyer of protection to the seller of protection.
The ongoing value of the contract will fluctuate throughout the term of the contract based primarily on the credit risk of the reference asset. If the credit quality of the reference asset improves relative to the credit quality at contract initiation, the buyer of protection may have an unrealized loss greater than the anticipated periodic fee owed. This unrealized loss would be the result of current credit protection being cheaper than the cost of credit protection at contract initiation. If the buyer elects to terminate the contract prior to its maturity, and there has been no credit event, this unrealized loss will become realized. If the contract is held to maturity, and there has been no credit event, the realized loss will be equal to the periodic fee paid over the life of the contract.
If there is a credit event, the buyer of protection can exercise its rights under the contract and receive a payment from the seller of protection equal to the notional amount of the swap less the market value of specified debt securities issued by the reference asset. Upon exercise of the contract the difference between such value and the notional amount is recorded as realized gain (loss) and is included on the Statement of Operations.
The Fund may purchase or sell credit protection through credit default swaps to increase or decrease exposure to the credit risk of individual issuers and/or indexes of issuers that are either unavailable or considered to be less attractive in the bond market.
For the reporting period, the Fund had ending monthly average notional amounts of $1,989,285 on credit default swaps to sell protection.
Additional associated risks to the Fund include counterparty credit risk and liquidity risk.
At period end, the Fund had no credit default swap agreements outstanding.
Counterparty Credit Risk. Derivative positions are subject to the risk that the counterparty will not fulfill its obligation to the Fund. The Fund intends to enter into derivative transactions with counterparties that the Manager believes to be creditworthy at the time of the transaction.
For financial reporting purposes, the Fund does not offset derivative assets and derivative liabilities that are subject to netting arrangements in the Statement of Assets and Liabilities. Bankruptcy or insolvency laws of a particular jurisdiction may impose restrictions on or prohibitions against the right of offset in bankruptcy, insolvency or other events.
The Fund’s risk of loss from counterparty credit risk on exchange-traded derivatives cleared through a clearinghouse and for centrally cleared swaps is generally considered lower than as compared to OTC derivatives. However, counterparty credit risk exists with respect to initial and variation margin deposited/paid by the Fund that is held in futures commission merchant, broker and/or clearinghouse accounts for such exchange-traded derivatives and for centrally cleared swaps.
With respect to centrally cleared swaps, such transactions will be submitted for clearing, and if cleared, will be held in accounts at futures commission merchants or brokers that are members of clearinghouses. While brokers, futures commission merchants and clearinghouses are required to segregate customer margin from their own assets, in the event that a broker, futures commission merchant or clearinghouse becomes insolvent or goes into bankruptcy and at that time there is a shortfall in the aggregate amount of margin held by the broker, futures commission merchant or clearinghouse for all its customers, U.S. bankruptcy laws will typically allocate that shortfall on a pro-rata basis across all the broker’s, futures commission merchant’s or clearinghouse’s customers, potentially resulting in losses to the Fund.
There is the risk that a broker, futures commission merchant or clearinghouse will decline to clear a transaction on the Fund’s behalf, and the Fund may be required to pay a termination fee to the executing broker with whom the Fund initially enters into the transaction. Clearinghouses may also
32 OPPENHEIMER CONSERVATIVE BALANCED FUND/VA
6. Use of Derivatives (Continued)
be permitted to terminate centrally cleared swaps at any time. The Fund is also subject to the risk that the broker or futures commission merchant will improperly use the Fund’s assets deposited/paid as initial or variation margin to satisfy payment obligations of another customer. In the event of a default by another customer of the broker or futures commission merchant, the Fund might not receive its variation margin payments from the clearinghouse, due to the manner in which variation margin payments are aggregated for all customers of the broker/futures commission merchant.
Collateral and margin requirements differ by type of derivative. Margin requirements are established by the broker, futures commission merchant or clearinghouse for exchange-traded and cleared derivatives, including centrally cleared swaps. Brokers, futures commission merchants and clearinghouses can ask for margin in excess of the regulatory minimum, or increase the margin amount, in certain circumstances.
For financial reporting purposes, cash collateral that has been pledged to cover obligations of the Fund, if any, is reported separately on the Statement of Assets and Liabilities as cash pledged as collateral. Non-cash collateral pledged by the Fund, if any, is noted in the Statement of Investments. Generally, the amount of collateral due from or to a party must exceed a minimum transfer amount threshold (e.g. $250,000) before a transfer has to be made. To the extent amounts due to the Fund from its counterparties are not fully collateralized, contractually or otherwise, the Fund bears the risk of loss from counterparty nonperformance.
The following table presents the valuations of derivative instruments by risk exposure as reported within the Statement of Assets and Liabilities at period end:
| | | | | | | | | | | | |
| | | Asset Derivatives | | | Liability Derivatives | |
Derivatives Not Accounted for as Hedging Instruments | | Statement of Assets and Liabilities Location | | Value | | | Statement of Assets and Liabilities Location | | Value | |
| |
Interest rate contracts Variation margin receivable | | $ | 26,778* | | | Variation margin payable | | $ | 26,205* | |
* Includes only the current day’s variation margin. Prior variation margin movements have been reflected in cash on the Statement of Assets and Liabilities upon receipt or payment.
The effect of derivative instruments on the Statement of Operations is as follows:
| | | | | | | | | | | | |
Amount of Realized Gain or (Loss) Recognized on Derivatives | |
Derivatives Not Accounted for as Hedging Instruments | | Futures
contracts | | | Swap
contracts | | | Total | |
| |
Credit contracts | | $ | — | | | $ | 101,939 | | | $ | 101,939 | |
Interest rate contracts | | | 363,666 | | | | — | | | | 363,666 | |
| | | | |
Total | | $ | 363,666 | | | $ | 101,939 | | | $ | 465,605 | |
| | | | |
| | | | | | | | | | | | |
Amount of Change in Unrealized Gain or (Loss) Recognized on Derivatives | |
Derivatives Not Accounted for as Hedging Instruments | | Futures
contracts | | | Swap
contracts | | | Total | |
| |
Credit contracts | | $ | — | | | $ | 843 | | | $ | 843 | |
Interest rate contracts | | | 165,856 | | | | — | | | | 165,856 | |
| | | | |
Total | | $ | 165,856 | | | $ | 843 | | | $ | 166,699 | |
| | | | |
7. Shares of Beneficial Interest
The Fund has authorized an unlimited number of $0.001 par value shares of beneficial interest of each class. Transactions in shares of beneficial interest were as follows:
| | | | | | | | | | | | | | | | |
| | | Year Ended December 31, 2017 | | | Year Ended December 31, 2016 | |
| | | Shares | | | Amount | | | Shares | | | Amount | |
| |
Non-Service Shares | | | | | | | | | | | | | | | | |
Sold | | | 167,674 | | | $ | 2,587,806 | | | | 180,594 | | | $ | 2,654,702 | |
Dividends and/or distributions reinvested | | | 217,048 | | | | 3,346,883 | | | | 289,075 | | | | 4,214,715 | |
Redeemed | | | (1,568,489) | | | | (24,239,203) | | | | (1,468,409) | | | | (21,559,020) | |
| | | | |
Net decrease | | | (1,183,767) | | | $ | (18,304,514) | | | | (998,740) | | | $ | (14,689,603) | |
| | | | |
| | | | | | | | | | | | | | | | |
| |
Service Shares | | | | | | | | | | | | | | | | |
Sold | | | 258,277 | | | $ | 3,974,804 | | | | 707,970 | | | $ | 10,153,873 | |
Dividends and/or distributions reinvested | | | 58,365 | | | | 889,490 | | | | 80,196 | | | | 1,155,621 | |
Redeemed | | | (557,584) | | | | (8,498,812) | | | | (918,852) | | | | (13,350,668) | |
| | | | |
Net decrease | | | (240,942) | | | $ | (3,634,518) | | | | (130,686) | | | $ | (2,041,174) | |
| | | | |
33 OPPENHEIMER CONSERVATIVE BALANCED FUND/VA
NOTES TO FINANCIAL STATEMENTS Continued
8. Purchases and Sales of Securities
The aggregate cost of purchases and proceeds from sales of securities, other than short-term obligations and investments in IGMMF, for the reporting period were as follows:
| | | | | | | | | | | | |
| | | Purchases | | | | | | Sales | |
| |
Investment securities | | | $143,698,419 | | | | | | | | $152,101,459 | |
U.S. government and government agency obligations | | | 191,875 | | | | | | | | 1,195,086 | |
To Be Announced (TBA) mortgage-related securities | | | 729,295,309 | | | | | | | | 711,803,922 | |
9. Fees and Other Transactions with Affiliates
Management Fees. Under the investment advisory agreement, the Fund pays the Manager a management fee based on the daily net assets of the Fund at an annual rate as shown in the following table:
| | | | |
Fee Schedule | |
Up to $200 million | | | 0.75% | |
Next $200 million | | | 0.72 | |
Next $200 million | | | 0.69 | |
Next $200 million | | | 0.66 | |
Over $800 million | | | 0.60 | |
The Fund’s effective management fee for the reporting period was 0.75% of average annual net assets before any applicable waivers.
Sub-Adviser Fees. The Manager has retained the Sub-Adviser to provide the day-to-day portfolio management of the Fund. Under the Sub-Advisory Agreement, the Manager pays the Sub-Adviser an annual fee in monthly installments, equal to a percentage of the investment management fee collected by the Manager from the Fund, which shall be calculated after any investment management fee waivers. The fee paid to the Sub-Adviser is paid by the Manager, not by the Fund.
Transfer Agent Fees. OFI Global (the “Transfer Agent”) serves as the transfer and shareholder servicing agent for the Fund. The Fund pays the Transfer Agent a fee based on annual net assets. Fees incurred and average net assets for each class with respect to these services are detailed in the Statement of Operations and Financial Highlights, respectively.
Sub-Transfer Agent Fees. The Transfer Agent has retained Shareholder Services, Inc., a wholly-owned subsidiary of OFI (the “Sub-Transfer Agent”), to provide the day-to-day transfer agent and shareholder servicing of the Fund. Under the Sub-Transfer Agency Agreement, the Transfer Agent pays the Sub-Transfer Agent an annual fee in monthly installments, equal to a percentage of the transfer agent fee collected by the Transfer Agent from the Fund, which shall be calculated after any applicable fee waivers. The fee paid to the Sub-Transfer Agent is paid by the Transfer Agent, not by the Fund.
Trustees’ Compensation. The Fund’s Board of Trustees (“Board”) has adopted a compensation deferral plan for Independent Trustees that enables Trustees to elect to defer receipt of all or a portion of the annual compensation they are entitled to receive from the Fund. For purposes of determining the amount owed to the Trustees under the plan, deferred amounts are treated as though equal dollar amounts had been invested in shares of the Fund or in other Oppenheimer funds selected by the Trustees. The Fund purchases shares of the funds selected for deferral by the Trustees in amounts equal to his or her deemed investment, resulting in a Fund asset equal to the deferred compensation liability. Such assets are included as a component of “Other” within the asset section of the Statement of Assets and Liabilities. Deferral of Trustees’ fees under the plan will not affect the net assets of the Fund and will not materially affect the Fund’s assets, liabilities or net investment income per share. Amounts will be deferred until distributed in accordance with the compensation deferral plan.
Distribution and Service Plan for Service Shares. The Fund has adopted a Distribution and Service Plan (the “Plan”) pursuant to Rule 12b-1 under the 1940 Act for Service shares to pay OppenheimerFunds Distributor, Inc. (the “Distributor”), for distribution related services, personal service and account maintenance for the Fund’s Service shares. Under the Plan, payments are made periodically at an annual rate of 0.25% of the daily net assets of Service shares of the Fund. The Distributor currently uses all of those fees to compensate sponsors of the insurance product that offers Fund shares, for providing personal service and maintenance of accounts of their variable contract owners that hold Service shares. These fees are paid out of the Fund’s assets on an on-going basis and increase operating expenses of the Service shares, which results in lower performance compared to the Fund’s shares that are not subject to a service fee. Fees incurred by the Fund under the Plan are detailed in the Statement of Operations.
Waivers and Reimbursements of Expenses. The Manager has contractually agreed to limit the Fund’s expenses after payments, waivers and/or reimbursements and reduction to custodian expenses, excluding any applicable dividend expense, taxes, interest and fees from borrowing, any subsidiary expenses, Acquired Fund Fees and Expenses, brokerage commissions, unusual and infrequent expenses and certain other Fund expenses; so that those expenses, as percentages of daily net assets, will not exceed the annual rate of 0.67% for Non-Service shares and 0.92% for Service shares as calculated on the daily net assets of the Fund.
During the reporting period, the Manager waived fees and/or reimbursed the Fund as follows:
| | | | |
Non-Service shares | | $ | 455,950 | |
Service shares | | | 137,430 | |
34 OPPENHEIMER CONSERVATIVE BALANCED FUND/VA
9. Fees and Other Transactions with Affiliates (Continued)
This fee waiver and/or expense reimbursement may not be amended or withdrawn for one year from the date of the Fund’s prospectus, unless approved by the Board.
The Manager will waive fees and/or reimburse Fund expenses in an amount equal to the indirect management fees incurred through the Fund’s investment in IGMMF. During the reporting period, the Manager waived fees and/or reimbursed the Fund $5,354 for IGMMF management fees. This fee waiver and/or expense reimbursement may not be amended or withdrawn for one year from the date of the Fund’s prospectus, unless approved by the Board.
10. Borrowings and Other Financing
Joint Credit Facility. A number of mutual funds managed by the Manager participate in a $1.875 billion revolving credit facility (the “Facility”) intended to provide short-term financing, if necessary, subject to certain restrictions in connection with atypical redemption activity. Expenses and fees related to the Facility are paid by the participating funds and are disclosed separately or as other expenses on the Statement of Operations. The Fund did not utilize the Facility during the reporting period.
35 OPPENHEIMER CONSERVATIVE BALANCED FUND/VA
REPORT OF INDEPENDENT REGISTERED PUBLIC ACCOUNTING FIRM
To the Shareholders and Board of Trustees
Oppenheimer Variable Account Funds:
Opinion on the Financial Statements
We have audited the accompanying statement of assets and liabilities of Oppenheimer Conservative Balanced Fund/VA, a separate series of Oppenheimer Variable Account Funds, (the “Fund”), including the statement of investments, as of December 31, 2017, the related statement of operations for the year then ended, the statements of changes in net assets for each of the years in the two year period then ended, and the related notes (collectively, the “financial statements”) and the financial highlights for each of the years in the five year period then ended. In our opinion, the financial statements and financial highlights present fairly, in all material respects, the financial position of the Fund as of December 31, 2017, the results of its operations for the year then ended, the changes in its net assets for each of the years in the two year period then ended, and the financial highlights for each of the years in the five year period then ended, in conformity with U.S. generally accepted accounting principles.
Basis for Opinion
These financial statements and financial highlights are the responsibility of the Fund’s management. Our responsibility is to express an opinion on these financial statements and financial highlights based on our audits. We are a public accounting firm registered with the Public Company Accounting Oversight Board (United States) (“PCAOB”) and are required to be independent with respect to the Fund in accordance with the U.S. federal securities laws and the applicable rules and regulations of the Securities and Exchange Commission and the PCAOB.
We conducted our audits in accordance with the standards of the PCAOB. Those standards require that we plan and perform the audit to obtain reasonable assurance about whether the financial statements and financial highlights are free of material misstatement, whether due to error or fraud. Our audits included performing procedures to assess the risks of material misstatement of the financial statements and financial highlights, whether due to error or fraud, and performing procedures that respond to those risks. Such procedures included examining, on a test basis, evidence regarding the amounts and disclosures in the financial statements and financial highlights. Such procedures also included confirmation of securities owned as of December 31, 2017, by correspondence with the custodian, brokers and the transfer agent, or by other appropriate auditing procedures. Our audits also included evaluating the accounting principles used and significant estimates made by management, as well as evaluating the overall presentation of the financial statements and financial highlights. We believe that our audits provide a reasonable basis for our opinion.
KPMG LLP
We have not been able to determine the specific year that we began serving as the auditor of one or more Oppenheimer Funds investment companies, however we are aware that we have served as the auditor of one or more Oppenheimer Funds investment companies since at least 1969.
Denver, Colorado
February 13, 2018
36 OPPENHEIMER CONSERVATIVE BALANCED FUND/VA
FEDERAL INCOME TAX INFORMATION
In early 2018, if applicable, shareholders of record received information regarding all dividends and distributions paid to them by the Fund during calendar year 2017.
Dividends, if any, paid by the Fund during the reporting period which are not designated as capital gain distributions should be multiplied by the maximum amount allowable but not less than 25.49% to arrive at the amount eligible for the corporate dividend-received deduction.
The foregoing information is presented to assist shareholders in reporting distributions received from the Fund to the Internal Revenue Service. Because of the complexity of the federal regulations which may affect your individual tax return and the many variations in state and local tax regulations, we recommend that you consult your tax advisor for specific guidance.
37 OPPENHEIMER CONSERVATIVE BALANCED FUND/VA
BOARD APPROVAL OF THE FUND’S INVESTMENT ADVISORY AND SUB-ADVISORY AGREEMENTS Unaudited
The Fund has entered into an investment advisory agreement with OFI Global Asset Management, Inc. (“OFI Global” or the “Adviser”), a wholly-owned subsidiary of OppenheimerFunds, Inc. (“OFI” or the “Sub-Adviser”) (“OFI Global” and “OFI” together, the “Managers”) and OFI Global has entered into a sub-advisory agreement with OFI whereby OFI provides investment sub-advisory services to the Fund (collectively, the “Agreements”). Each year, the Board of Trustees (the “Board”), including a majority of the independent Trustees, is required to determine whether to approve the terms of the Agreements and the renewal thereof. The Investment Company Act of 1940, as amended, requires that the Board request and evaluate, and that the Managers provide, such information as may be reasonably necessary to evaluate the terms of the Agreements. The Board employs an independent consultant to prepare a report that provides information, including comparative information that the Board requests for that purpose. In addition to in-person meetings focused on this evaluation, the Board receives information throughout the year regarding Fund services, fees, expenses and performance.
The Managers and the independent consultant provided information to the Board on the following factors: (i) the nature, quality and extent of the Managers’ services, (ii) the comparative investment performance of the Fund and the Managers, (iii) the fees and expenses of the Fund, including comparative fee and expense information, (iv) the profitability of the Managers and their affiliates, including an analysis of the cost of providing services, (v) whether economies of scale are realized as the Fund grows and whether fee levels reflect these economies of scale for Fund investors and (vi) other benefits to the Managers from their relationship with the Fund. The Board was aware that there are alternatives to retaining the Managers.
Outlined below is a summary of the principal information considered by the Board as well as the Board’s conclusions.
Nature, Quality and Extent of Services. The Board considered information about the nature, quality and extent of the services provided to the Fund and information regarding the Managers’ key personnel who provide such services. The Managers’ duties include providing the Fund with the services of the portfolio managers and the Sub-Adviser’s investment team, who provide research, analysis and other advisory services in regard to the Fund’s investments; and securities trading services. OFI Global is responsible for oversight of third-party service providers; monitoring compliance with applicable Fund policies and procedures and adherence to the Fund’s investment restrictions; risk management; and oversight of the Sub-Adviser. OFI Global is also responsible for providing certain administrative services to the Fund. Those services include providing and supervising all administrative and clerical personnel who are necessary in order to provide effective corporate administration for the Fund; compiling and maintaining records with respect to the Fund’s operations; preparing and filing reports required by the U.S. Securities and Exchange Commission; preparing periodic reports regarding the operations of the Fund for its shareholders; preparing proxy materials for shareholder meetings; and preparing the registration statements required by federal and state securities laws for the sale of the Fund’s shares. OFI Global also provides the Fund with office space, facilities and equipment.
The Board also considered the quality of the services provided and the quality of the Managers’ resources that are available to the Fund. The Board took account of the fact that the Sub-Adviser has over fifty years of experience as an investment adviser and that its assets under management rank it among the top mutual fund managers in the United States. The Board evaluated the Managers’ advisory, administrative, accounting, legal, compliance and risk management services, among other services, and information the Board has received regarding the experience and professional qualifications of the Managers’ key personnel and the size and functions of their staff. In its evaluation of the quality of the portfolio management services provided, the Board considered the experience of Krishna Memani and Magnus Krantz, the portfolio managers for the Fund, and the Sub-Adviser’s investment team and analysts. The Board members also considered the totality of their experiences with the Managers as directors or trustees of the Fund and other funds advised by the Managers. The Board considered information regarding the quality of services provided by affiliates of the Managers, which the Board members have become knowledgeable about through their experiences with the Managers and in connection with the review or renewal of the Fund’s service agreements or service providers. The Board concluded, in light of the Managers’ experience, reputation, personnel, operations and resources that the Fund benefits from the services provided under the Agreements.
Investment Performance of the Managers and the Fund. Throughout the year, the Managers provided information on the investment performance of the Fund, the Adviser and the Sub-Adviser, including comparative performance information. The Board also reviewed information, prepared by the Managers and by the independent consultant, comparing the Fund’s historical performance to relevant market indices and to the performance of other conservative allocation funds. The Board considered that the Fund outperformed its performance category during the three- and five-year periods, but underperformed for the one- and ten-year periods. The Board further noted that the Fund’s recent underperformance occurred in 2016. In that regard, the Board observed that when it considered the Fund’s performance record one year prior the Fund had outperformed its category median for all periods.
Fees and Expenses of the Fund. The Board reviewed the fees paid to the Adviser and the other expenses borne by the Fund. The Board noted that the Adviser, not the Fund, pays the Sub-Adviser’s fee under the sub-advisory agreement. The independent consultant provided comparative data in regard to the fees and expenses of the Fund and other conservative allocation funds . In reviewing the fees and expenses charged to the VA funds, the Board considered the Adviser’s assertion that, because there is much greater disparity in the fees and services that may be provided by a manager to a VA fund as opposed to a retail fund, when comparing the expenses of the various VA funds to those of retail funds, it is most appropriate to focus on total expenses (rather than on the management fees). Accordingly, while the Board reviewed and considered all expenses, it focused on total expenses. The Board considered that the Fund’s total expenses, net of waivers, were lower than its peer group median and category median. The Board also considered that the Fund’s contractual management fee was higher than its peer group median and its category median. The Board noted that the Adviser has contractually agreed to limit the Fund’s total annual operating expenses so that those expenses, as percentages of daily net assets, will not exceed the annual rate of 0.67% for Non-Service Shares and 0.92% for Service Shares. This contractual expense limitation may not be amended or withdrawn for one year after the date of the Fund’s prospectus, unless approved by the Board.
Economies of Scale and Profits Realized by the Managers. The Board considered information regarding the Managers’ costs in serving as the Fund’s investment adviser and sub-adviser, including the costs associated with the personnel and systems necessary to manage the Fund, and information regarding the Managers’ profitability from their relationship with the Fund. The Board also considered that the Managers must be able to pay and retain experienced professional personnel at competitive rates to provide quality services to the Fund. The Board reviewed whether the Managers may realize economies of scale in managing and supporting the Fund. The Board noted that the Fund currently has management fee
38 OPPENHEIMER CONSERVATIVE BALANCED FUND/VA
BOARD APPROVAL OF THE FUND’S INVESTMENT ADVISORY AND SUB-ADVISORY AGREEMENTS Unaudited / Continued
breakpoints, which are intended to share with Fund shareholders economies of scale that may exist as the Fund’s assets grow.
Other Benefits to the Managers. In addition to considering the profits realized by the Managers, the Board considered information that was provided regarding the direct and indirect benefits the Managers receive as a result of their relationship with the Fund, including compensation paid to the Managers’ affiliates and research provided to the Adviser in connection with permissible brokerage arrangements (soft dollar arrangements).
Conclusions. These factors were also considered by the independent Trustees meeting separately from the full Board, assisted by experienced counsel to the Fund and to the independent Trustees. Fund counsel and the independent Trustees’ counsel are independent of the Managers within the meaning and intent of the Securities and Exchange Commission rules.
Based on its review of the information it received and its evaluations described above, the Board, including a majority of the independent Trustees, decided to continue the Agreements through August 31, 2018. In arriving at its decision, the Board did not identify any factor or factors as being more important than others, but considered all of the above information, and considered the terms and conditions of the Agreements, including the management fees, in light of all the surrounding circumstances.
39 OPPENHEIMER CONSERVATIVE BALANCED FUND/VA
PORTFOLIO PROXY VOTING POLICIES AND GUIDELINES; UPDATES TO STATEMENTS OF INVESTMENTS Unaudited
The Fund has adopted Portfolio Proxy Voting Policies and Guidelines under which the Fund votes proxies relating to securities (“portfolio proxies”) held by the Fund. A description of the Fund’s Portfolio Proxy Voting Policies and Guidelines is available (i) without charge, upon request, by calling the Fund toll-free at 1.800.CALL OPP (225.5677), (ii) on the Fund’s website at www.oppenheimerfunds.com, and (iii) on the SEC’s website at www.sec.gov. In addition, the Fund is required to file Form N-PX, with its complete proxy voting record for the 12 months ended June 30th, no later than August 31st of each year. The Fund’s voting record is available (i) without charge, upon request, by calling the Fund toll-free at 1.800.CALL OPP (225.5677), and (ii) in the Form N-PX filing on the SEC’s website at www.sec.gov.
The Fund files its complete schedule of portfolio holdings with the SEC for the first quarter and the third quarter of each fiscal year on Form N-Q. The Fund’s Form N-Q filings are available on the SEC’s website at www.sec.gov. Those forms may be reviewed and copied at the SEC’s Public Reference Room in Washington, D.C. Information on the operation of the Public Reference Room may be obtained by calling 1-800-SEC-0330.
40 OPPENHEIMER CONSERVATIVE BALANCED FUND/VA
TRUSTEES AND OFFICERS Unaudited
| | |
| Name, Position(s) Held with the Fund, Length of Service, Year of Birth | | Principal Occupation(s) During the Past 5 Years; Other Trusteeships/Directorships Held; Number of Portfolios in the Fund Complex Currently Overseen |
| |
| INDEPENDENT TRUSTEES | | The address of each Trustee in the chart below is 6803 S. Tucson Way, Centennial, Colorado 80112-3924. Each Trustee serves for an indefinite term, or until his or her resignation, retirement, death or removal. |
| |
Robert J. Malone, Chairman of the Board of Trustees (since 2016), Trustee (since 2002) Year of Birth: 1944 | | Chairman - Colorado Market of MidFirst Bank (since January 2015); Chairman of the Board (2012-2016) and Director (August 2005-January 2016) of Jones International University (educational organization); Trustee of the Gallagher Family Foundation (non-profit organization) (2000-2016); Chairman, Chief Executive Officer and Director of Steele Street Bank Trust (commercial banking) (August 2003-January 2015); Director of Opera Colorado Foundation (non-profit organization) (2008-2012); Director of Colorado UpLIFT (charitable organization) (1986-2010); Director of Jones Knowledge, Inc. (2006-2010); Former Chairman of U.S. Bank-Colorado (subsidiary of U.S. Bancorp and formerly Colorado National Bank) (July 1996-April 1999); Director of Commercial Assets, Inc. (real estate investment trust) (1993-2000); Director of U.S. Exploration, Inc. (oil and gas exploration) (1997-February 2004); Chairman of the Board (1991-1994) and Trustee (1985-1994) of Regis University; and Chairman of the Board (1990-1991) and Member (1984-1999) of Young Presidents Organization. Oversees 54 portfolios in the OppenheimerFunds complex. Mr. Malone has served on the Boards of certain Oppenheimer funds since 2002, during which time he has become familiar with the Fund’s (and other Oppenheimer funds’) financial, accounting, regulatory and investment matters and has contributed to the Boards’ deliberations. |
| |
Andrew J. Donohue, Trustee (since 2017) Year of Birth: 1950 | | Of Counsel, Shearman & Sterling LLP (since September 2017); Chief of Staff of the U.S. Securities and Exchange Commission (regulator) (June 2015-February 2017); Managing Director and Investment Company General Counsel of Goldman Sachs (investment bank) (November 2012-May 2015); Partner at Morgan Lewis & Bockius, LLP (law firm) (March 2011-October 2012); Director of the Division of Investment Management of U.S. Securities and Exchange Commission (regulator) (May 2006-November 2010); Global General Counsel of Merrill Lynch Investment Managers (investment firm) (May 2003-May 2006); General Counsel (October 1991-November 2001) and Executive Vice President (January 1993-November 2001) of OppenheimerFunds, Inc. (investment firm) (June 1991-November 2001). Oversees 54 portfolios in the OppenheimerFunds complex. Mr. Donohue has served on the Boards of certain Oppenheimer funds since 2017, during which time he has become familiar with the Fund’s (and other Oppenheimer funds’) financial, accounting, regulatory and investment matters and has contributed to the Boards’ deliberations. |
| |
Jon S. Fossel, Trustee (since 1990) Year of Birth: 1942 | | Chairman of the Board of Jack Creek Preserve Foundation (non-profit organization) (2005-2015); Director of Jack Creek Preserve Foundation (non-profit organization) (since March 2005); Chairman of the Board (2006-December 2011) and Director (June 2002-December 2011) of UNUMProvident (insurance company); Director of Northwestern Energy Corp. (public utility corporation) (November 2004-December 2009); Director of P.R. Pharmaceuticals (October 1999-October 2003); Director of Rocky Mountain Elk Foundation (non-profit organization) (February 1998-February 2003 and February 2005-February 2007); Chairman and Director (until October 1996) and President and Chief Executive Officer (until October 1995) of the Sub-Adviser; President, Chief Executive Officer and Director of the following: Oppenheimer Acquisition Corp. (“OAC”) (parent holding company of the Sub-Adviser), Shareholders Services, Inc. and Shareholder Financial Services, Inc. (until October 1995). Oversees 54 portfolios in the OppenheimerFunds complex. Mr. Fossel has served on the Boards of certain Oppenheimer funds since 1990, during which time he has become familiar with the Fund’s (and other Oppenheimer funds’) financial, accounting, regulatory and investment matters and has contributed to the Boards’ deliberations. |
| |
Richard F. Grabish, Trustee (since 2012) Year of Birth: 1948 | | Formerly Senior Vice President and Assistant Director of Sales and Marketing (March 1997-December 2007), Director (March 1987-December 2007) and Manager of Private Client Services (June 1985-June 2005) of A.G. Edwards & Sons, Inc. (broker/dealer and investment firm); Chairman and Chief Executive Officer of A.G. Edwards Trust Company, FSB (March 2001-December 2007); President and Vice Chairman of A.G. Edwards Trust Company, FSB (investment adviser) (April 1987-March 2001); President of A.G. Edwards Trust Company, FSB (investment adviser) (June 2005-December 2007). Oversees 54 portfolios in the OppenheimerFunds complex. Mr. Grabish has served on the Boards of certain Oppenheimer funds since 2001, during which time he has become familiar with the Fund’s (and other Oppenheimer funds’) financial, accounting, regulatory and investment matters and has contributed to the Boards’ deliberations. |
| |
Beverly L. Hamilton, Trustee (since 2002) Year of Birth: 1946 | | Trustee of Monterey Institute for International Studies (educational organization) (2000-2014); Board Member of Middlebury College (educational organization) (December 2005-June 2011); Director (1991-2016), Vice Chairman of the Board (2006- 2009) and Chairman of the Board (2010-2013) of American Funds’ Emerging Markets Growth Fund, Inc. (mutual fund); Director of The California Endowment (philanthropic organization) (April 2002-April 2008); Director (February 2002-2005) and Chairman of Trustees (2006-2007) of the Community Hospital of Monterey Peninsula; President of ARCO Investment Management Company (February 1991-April 2000); Member of the investment committees of The Rockefeller Foundation (2001-2006) and The University of Michigan (since 2000); Advisor at Credit Suisse First Boston’s Sprout venture capital unit (venture capital fund) (1994-January 2005); Trustee of MassMutual Institutional Funds (investment company) (1996-June 2004); Trustee of MML Series Investment Fund (investment company) (April 1989-June 2004); Member of the investment committee of Hartford Hospital (2000-2003); and Advisor to Unilever (Holland) pension fund (2000-2003). Oversees 54 portfolios in the OppenheimerFunds complex. Ms. Hamilton has served on the Boards of certain Oppenheimer funds since 2002, during which time she has become familiar with the Fund’s (and other Oppenheimer funds’) financial, accounting, regulatory and investment matters and has contributed to the Boards’ deliberations. |
| |
Victoria J. Herget, Trustee (since 2012) Year of Birth:1951 | | Board Chair (2008-2015) and Director (2004-Present), United Educators (insurance company); Trustee (since 2000) and Chair (since 2010), Newberry Library (independent research library); Trustee, Mather LifeWays (senior living organization) (since 2001); Independent Director of the First American Funds (mutual fund family) (2003-2011); former Managing Director (1993-2001), Principal (1985-1993), Vice President (1978-1985) and Assistant Vice President (1973-1978) of Zurich Scudder Investments (investment adviser) (and its predecessor firms); Trustee (1992-2007), Chair of the Board of Trustees (1999-2007), Investment Committee Chair (1994-1999) and Investment Committee member (2007-2010) of Wellesley College; Trustee, BoardSource (non-profit organization) (2006-2009) and Chicago City Day School (K-8 School) (1994-2005). Oversees 54 portfolios in the OppenheimerFunds complex. Ms. Herget has served on the Boards of certain Oppenheimer funds since 2012, during which time she has become familiar with the Fund’s (and other Oppenheimer funds’) financial, accounting, regulatory and investment matters and has contributed to the Boards’ deliberations. |
41 OPPENHEIMER CONSERVATIVE BALANCED FUND/VA
TRUSTEES AND OFFICERS Unaudited / Continued
| | |
F. William Marshall, Jr., Trustee (since 2000) Year of Birth: 1942 | | Trustee Emeritus of Worcester Polytech Institute (WPI) (private university) (since 2009); Trustee of MassMutual Select Funds (formerly MassMutual Institutional Funds) (investment company) (1996-2015), MML Series Investment Fund (investment company) (1996-2015) and Mass Mutual Premier Funds (investment company) (January 2012-December 2015); President and Treasurer of the SIS Charitable Fund (private charitable fund) (January 1999-March 2011); Former Trustee of WPI (1985- 2008); Former Chairman of the Board (2004-2006) and Former Chairman of the Investment Committee of WPI (1994-2008); Chairman of SIS Family Bank, F.S.B. (formerly SIS Bank) (commercial bank) (January 1999-July 1999); Executive Vice President of Peoples Heritage Financial Group, Inc. (commercial bank) (January 1999-July 1999); and Former President and Chief Executive Officer of SIS Bancorp. (1993-1999). Oversees 54 portfolios in the OppenheimerFunds complex. Mr. Marshall has served on the Boards of certain Oppenheimer funds since 2000, during which time he has become familiar with the Fund’s (and other Oppenheimer funds’) financial, accounting, regulatory and investment matters and has contributed to the Boards’ deliberations. |
| |
Karen L. Stuckey, Trustee (since 2012) Year of Birth: 1953 | | Member (since May 2015) of Desert Mountain Community Foundation Advisory Board (non-profit organization); Partner (1990-2012) of PricewaterhouseCoopers LLP (professional services firm) (held various positions 1975-1990); Trustee (1992- 2006); member of Executive, Nominating and Audit Committees and Chair of Finance Committee (1992-2006), and Emeritus Trustee (since 2006) of Lehigh University; and member, Women’s Investment Management Forum (professional organization) since inception. Oversees 54 portfolios in the OppenheimerFunds complex. Ms. Stuckey has served on the Boards of certain Oppenheimer funds since 2012, during which time she has become familiar with the Fund’s (and other Oppenheimer funds’) financial, accounting, regulatory and investment matters and has contributed to the Boards’ deliberations. |
| |
James D. Vaughn, Trustee (since 2012) Year of Birth:1945 | | Retired; former managing partner (1994-2001) of Denver office of Deloitte & Touche LLP, (held various positions 1969- 1993); Trustee and Chairman of the Audit Committee of Schroder Funds (2003-2012); Board member and Chairman of Audit Committee of AMG National Trust Bank (since 2005); Trustee and Investment Committee member, University of South Dakota Foundation (since 1996); Board member, Audit Committee Member and past Board Chair, Junior Achievement (since 1993); former Board member, Mile High United Way, Boys and Girls Clubs, Boy Scouts, Colorado Business Committee for the Arts, Economic Club of Colorado and Metro Denver Network. Oversees 54 portfolios in the OppenheimerFunds complex. Mr. Vaughn has served on the Boards of certain Oppenheimer funds since 2012, during which time he has become familiar with the Fund’s (and other Oppenheimer funds’) financial, accounting, regulatory and investment matters and has contributed to the Boards’ deliberations. |
|
| INTERESTED TRUSTEE AND OFFICER | | Mr. Steinmetz is an “Interested Trustee” because he is affiliated with the Manager and the Sub-Adviser by virtue of his positions as Chairman and director of the Sub-Adviser and officer and director of the Manager. Both as a Trustee and as an officer, Mr. Steinmetz serves for an indefinite term, or until his resignation, retirement, death or removal. Mr. Steinmetz’s address is 225 Liberty Street, New York, New York 10281-1008. |
| |
Arthur P. Steinmetz, Trustee (since 2015), President and Principal Executive Officer (since 2014) Year of Birth: 1958 | | Chairman of the Sub-Adviser (since January 2015); CEO and Chairman of the Manager (since July 2014), President of the Manager (since May 2013), a Director of the Manager (since January 2013), Director of the Sub-Adviser (since July 2014), President, Management Director and CEO of Oppenheimer Acquisition Corp. (the Sub-Adviser’s parent holding company) (since July 2014), and President and Director of OFI SteelPath, Inc. (since January 2013). Chief Investment Officer of the OppenheimerFunds advisory entities from (January 2013-December 2013); Executive Vice President of the Manager (January 2013-May 2013); Chief Investment Officer of the Sub-Adviser (October 2010-December 2012); Chief Investment Officer, Fixed- Income, of the Sub-Adviser (April 2009-October 2010); Executive Vice President of the Sub-Adviser (October 2009-December 2012); Director of Fixed Income of the Sub-Adviser (January 2009-April 2009); and a Senior Vice President of the Sub-Adviser (March 1993-September 2009). An officer of 111 portfolios in the OppenheimerFunds complex. |
|
| OTHER OFFICERS OF THE FUND | | The addresses of the Officers in the chart below are as follows: for Messrs. Memani, Krantz, Mss. Lo Bessette, Foxson and Picciotto, 225 Liberty Street, New York, New York 10281-1008, for Mr. Petersen, 6803 S. Tucson Way, Centennial, Colorado 80112-3924. Each Officer serves for an indefinite term or until his or her resignation, retirement, death or removal. |
| |
Krishna Memani, Vice President (since 2009) Year of Birth: 1960 | | President of the Sub-Adviser (since January 2013); Executive Vice President of the Manager (since January 2014) and Chief Investment Officer of the OppenheimerFunds advisory entities (since January 2014). Chief Investment Officer, Fixed Income of the Sub-Adviser (January 2013-December 2013); Head of the Investment Grade Fixed Income Team of the Sub-Adviser (March 2009-January 2014); Director of Fixed Income of the Sub-Adviser (October 2010-December 2012); Senior Vice President of the Sub-Adviser (March 2009-December 2012) and Senior Vice President of OFI Global Institutional, Inc. (April 2009-December 2012). Managing Director and Head of the U.S. and European Credit Analyst Team at Deutsche Bank Securities (June 2006-January 2009). Chief Credit Strategist at Credit Suisse Securities (August 2002-March 2006). Managing Director and Senior Portfolio Manager at Putnam Investments (September 1998-June 2002). A portfolio manager and an officer of other portfolios in the OppenheimerFunds complex. |
| |
Magnus Krantz, Vice President (since 2013) Year of Birth: 1967 | | Vice President of the Sub-Adviser (since May 2009) and a portfolio manager of the Sub-Adviser (since November 2012); sector manager for technology for the Sub-Adviser’s Main Street Investment Team (since May 2009). Prior to joining the Sub-Adviser, Mr. Krantz was a sector manager at RS Investment and Guardian Life Insurance Company. Mr. Krantz joined Guardian Life Insurance Company in December 2005 and transitioned to RS Investments in October 2006 in connection with Guardian Life Insurance Company’s acquisition of an interest in RS Investments. Portfolio manager and analyst at Citigroup Asset Management (1998-2005) and as a consultant at Price Waterhouse (1997-1998). He also served as product development engineer at Newbridge Networks (1993-1996) and as a software engineer at Mitel Corporation (1990-1993). A portfolio manager and officer of other portfolios in the OppenheimerFunds complex. |
42 OPPENHEIMER CONSERVATIVE BALANCED FUND/VA
| | |
| |
Cynthia Lo Bessette, Secretary and Chief Legal Officer (since 2016) Year of Birth: 1969 | | Executive Vice President, General Counsel and Secretary of the Manager (since February 2016); Senior Vice President and Deputy General Counsel of the Manager (March 2015-February 2016); Chief Legal Officer of the Sub-Adviser and the Distributor (since February 2016); Vice President, General Counsel and Secretary of Oppenheimer Acquisition Corp. (since February 2016); General Counsel of OFI SteelPath, Inc., OFI Advisors, LLC and Index Management Solutions, LLC (since February 2016); Chief Legal Officer of OFI Global Institutional, Inc., HarbourView Asset Management Corporation, OFI Global Trust Company, Oppenheimer Real Asset Management, Inc., OFI Private Investments Inc., Shareholder Services, Inc. and Trinity Investment Management Corporation (since February 2016); Corporate Counsel (February 2012-March 2015) and Deputy Chief Legal Officer (April 2013-March 2015) of Jennison Associates LLC; Assistant General Counsel (April 2008-September 2009) and Deputy General Counsel (October 2009-February 2012) of Lord Abbett & Co. LLC. An officer of 111 portfolios in the OppenheimerFunds complex. |
| |
Jennifer Foxson, Vice President and Chief Business Officer (since 2014) Year of Birth: 1969 | | Senior Vice President of OppenheimerFunds Distributor, Inc. (since June 2014); Vice President of OppenheimerFunds Distributor, Inc. (April 2006-June 2014); Vice President of the Sub-Adviser (January 1998-March 2006); Assistant Vice President of the Sub-Adviser (October 1991-December 1998). An officer of 111 portfolios in the OppenheimerFunds complex. |
| |
Mary Ann Picciotto, Chief Compliance Officer and Chief Anti-Money Laundering Officer (since 2014) Year of Birth: 1973 | | Senior Vice President and Chief Compliance Officer of the Manager (since March 2014); Chief Compliance Officer of the Sub- Adviser, OFI SteelPath, Inc., OFI Global Trust Company, OFI Global Institutional, Inc., Oppenheimer Real Asset Management, Inc., OFI Private Investments, Inc., Harborview Asset Management Corporation, Trinity Investment Management Corporation, and Shareholder Services, Inc. (since March 2014); Managing Director of Morgan Stanley Investment Management Inc. and certain of its various affiliated entities; Chief Compliance Officer of various Morgan Stanley Funds (May 2010-January 2014); Chief Compliance Officer of Morgan Stanley Investment Management Inc. (April 2007-January 2014). An officer of 111 portfolios in the OppenheimerFunds complex. |
| |
Brian S. Petersen, Treasurer and Principal Financial & Accounting Officer (since 2016) Year of Birth: 1970 | | Senior Vice President of the Manager (since January 2017); Vice President of the Manager (January 2013-January 2017); Vice President of the Sub-Adviser (February 2007-December 2012); Assistant Vice President of the Sub-Adviser (August 2002- 2007). An officer of 111 portfolios in the OppenheimerFunds complex. |
The Fund’s Statement of Additional Information contains additional information about the Fund’s Trustees and Officers and is available without charge, upon request, by calling 1.800.988.8287.
43 OPPENHEIMER CONSERVATIVE BALANCED FUND/VA
OPPENHEIMER CONSERVATIVE BALANCED FUND/VA
| | |
| A Series of Oppenheimer Variable Account Funds |
| |
| Manager | | OFI Global Asset Management, Inc. |
| |
| Sub-Adviser | | OppenheimerFunds, Inc. |
| |
| Distributor | | OppenheimerFunds Distributor, Inc. |
| |
Transfer and Shareholder Servicing Agent | | OFI Global Asset Management, Inc. |
| |
| Sub-Transfer Agent | | Shareholder Services, Inc. |
| | DBA OppenheimerFunds Services |
| |
Independent Registered Public Accounting Firm | | KPMG LLP |
| |
| Legal Counsel | | Ropes & Gray LLP |
| |
| | Before investing in any of the Oppenheimer funds, investors should carefully consider a fund’s investment objectives, risks, charges and expenses. Fund prospectuses and summary prospectuses contain this and other information about the funds, and may be obtained by asking your financial advisor, visiting oppenheimerfunds.com or calling us at 1.800.988.8287. Read prospectuses and summary prospectuses carefully before investing. |
| |
| | © 2018 OppenheimerFunds, Inc. All rights reserved. Oppenheimer funds are distributed by OppenheimerFunds Distributor, Inc. |

| | | | |
| | 
| | |
| | |
| | | December 31, 2017 | | |
| | | Oppenheimer | | |
| | Capital Appreciation Fund/VA | | Annual Report |
| | A Series of Oppenheimer Variable Account Funds | | |
| | | |
| | ANNUAL REPORT | | |
| | |
| | Listing of Top Holdings | | |
| | |
| | Fund Performance Discussion | | |
| | |
| | Financial Statements | | |
PORTFOLIO MANAGER: Paul Larson
AVERAGE ANNUAL TOTAL RETURNS FOR THE PERIODS ENDED 12/31/17
| | | | | | | | | | | | | | |
| | | Inception
Date | | 1-Year | | | 5-Year | | | 10-Year | |
Non-Service Shares | | 4/3/85 | | | 26.83 | % | | | 13.97 | % | | | 6.45 | % |
Service Shares | | 9/18/01 | | | 26.50 | | | | 13.69 | | | | 6.19 | |
S&P 500 Index | | | | | 21.83 | | | | 15.79 | | | | 8.50 | |
Russell 1000 Growth Index | | | | | 30.21 | | | | 17.33 | | | | 10.00 | |
Performance data quoted represents past performance, which does not guarantee future results. The investment return and principal value of an investment in the Fund will fluctuate so that an investor’s shares, when redeemed, may be worth more or less than their original cost. Current performance may be lower or higher than the performance quoted. For performance data current to the most recent month end, call us at 1.800.988.8287. The Fund’s total returns should not be expected to be the same as the returns of other funds, whether or not both funds have the same portfolio managers and/or similar names. The Fund’s total returns include changes in share price and reinvested distributions but do not include the charges associated with the separate account products that offer this Fund. Such performance would have been lower if such charges were taken into account. Returns for periods of less than one year are cumulative and not annualized. See Fund prospectuses and summary prospectuses for more information on share classes and sales charges.
TOP HOLDINGS AND ALLOCATIONS
TOP TEN COMMON STOCK HOLDINGS
| | | | |
| |
Apple, Inc. | | | 7.1% | |
| |
Alphabet, Inc., Cl. C | | | 6.8 | |
| |
Microsoft Corp. | | | 5.8 | |
| |
Facebook, Inc., Cl. A | | | 5.3 | |
| |
Mastercard, Inc., Cl. A | | | 4.6 | |
| |
Amazon.com, Inc. | | | 3.9 | |
| |
Lowe’s Cos., Inc. | | | 2.8 | |
| |
Comcast Corp., Cl. A | | | 2.6 | |
| |
Oracle Corp. | | | 2.1 | |
| |
eBay, Inc. | | | 2.0 | |
| |
Portfolio holdings and allocations are subject to change. Percentages are as of December 31, 2017, and are based on net assets. For more current Fund holdings, please visit oppenheimerfunds.com.
SECTOR ALLOCATION
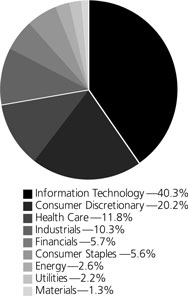
Portfolio holdings and allocations are subject to change. Percentages are as of December 31, 2017, and are based on the total market value of common stocks.
2 OPPENHEIMER CAPITAL APPRECIATION FUND/VA
Fund Performance Discussion
For the one-year reporting period, the Fund’s Non-Service shares generated a total return of 26.83%. In comparison, the Fund underperformed the Russell 1000 Growth Index (the “Index”), which returned 30.21% for the same period. On a sector basis, the largest underperformers included Industrials, Health Care and Consumer Discretionary, where stock selection detracted from performance. The Fund outperformed in Information Technology, Materials and Telecommunication Services. The Fund outperformed the broader U.S. equity market, as measured by the S&P 500 Index, which returned 21.83% this reporting period.
MARKET OVERVIEW
2017 was a banner year in terms of fundamentals for the U.S. economy. One of the longest job expansions in U.S. history continued with more than 2 million jobs added for the seventh consecutive year and unemployment close to an all-time low at period end. There were various other signs of improvement as well, in everything from high consumer confidence scores to declining murder rates in big cities (New York and Los Angeles were at record lows). Despite this, the inflation rate remained low. Most importantly for equity investors, U.S. corporate revenue and earnings growth accelerated.
These trends helped the equity market continue its strong upward trend in the fourth quarter, topping off a year that saw the Russell 1000 Growth Index posted a robust total return of 30.21%. The rally in the market was unusual in several aspects. First, several major indices—including the S&P 500 Index and Russell 1000 Index—posted positive total returns in every single month of the year, which is something they have never done before. (The Fund’s benchmark, the Russell 1000 Growth Index, rose in “only” 11 of the calendar months.) The market was also extremely calm, as market volatility (as measured by the CBOE Volatility Index) hit a new all-time low during the year. Finally, cumulative losses on the down days during 2017 were the lowest on record. For many, the investor experience of 2017 was about as good as it gets. While nearly all parts of the market rose in 2017, there were some notable differences within the market. Namely, large capitalization stocks outperformed smaller capitalization stocks, and companies on the “growth” part of the spectrum vastly outperformed the “value” names.
Several factors drove investors’ increased appetite for risk. For one, the underlying economy remained on the steady growth track that it has been on for several years. And though the Federal Reserve raised rates a couple times during the year, liquidity remained abundant with interest rates still at historically low levels. Last but not least, excitement around corporate tax reform drove expectations for a burst in corporate profitability and overall economic growth.
As investors, it is important to know what is and what is not within one’s circle of competence. As such, we strive to keep the portfolio in an all-weather orientation. Whether rates, commodity prices, currencies or even whole economies go up or down, our goal is to have a portfolio that can out-perform no matter the environment.
If our strategy includes not making oversized macro factor bets, a reasonable question is, “What types of risks are you willing to take?” First, we believe identifying companies with sustainable competitive advantages (or economic moats, if you prefer) is squarely in the middle of our circle of competence.
Second, we believe we have the skills to identify company management teams that are likely to successfully execute on their plans. Lastly, correctly valuing stocks and seeing what expectations the market is pricing in is also within our skillset. It is not by accident that we weight the portfolio more heavily towards companies that we believe have structural competitive advantages and/or management teams that are executing (e.g. gaining market share, expanding profit margins) and with at least reasonable stock valuations. Companies with these qualities generally have more stable earnings.
Allow us to use a metaphor. If managing the portfolio was like betting on horses, we’d readily admit that we cannot predict ahead of time the weather or track conditions. But we do believe we can find the strongest horses (advantaged business models) and the best jockeys (executing management teams), and can see when the payoff odds are in our favor (positive expected returns). To offset our agnostic position on the conditions, we make sure to have some horses in the stable that we believe will win no matter the weather. In short, it boils down to mostly stock selection. This approach has led to consistent positive alpha versus our peers over longer periods of time.
TOP INDIVIDUAL CONTRIBUTORS
Top contributors to the Fund’s relative performance this period included PayPal, Activision Blizzard, and MasterCard.
PayPal has continued to benefit from strong revenue growth driven by impressive customer acquisition and engagement, as well as the secular tailwinds of electronic payments and e-commerce spending.
3 OPPENHEIMER CAPITAL APPRECIATION FUND/VA
Activision Blizzard rallied early in the period after reporting a strong fourth quarter despite disappointing sales for its franchise title Call of Duty. Outperformance was driven by strength in Blizzard titles Overwatch and World of Warcraft. We remain positive on future growth drivers, which include monetization of advertising on “King mobile”, a continued shift towards high margin in-game digital purchases and the opportunity within eSports.
MasterCard continues to show strong and resilient growth demonstrating that the secular trend toward electronic forms of payment remains in early innings globally, particularly in emerging markets. At the company’s annual investor day in September they raised their three year outlook calling for revenue growth at the “high end of low double digits” and constant currency earnings per share (“EPS”) growth of ~20% (previously mid-teens). MasterCard’s services business which includes loyalty, data and analytics and security remains a differentiator versus their primary competitor and presents a compelling growth opportunity particularly within security, following the landmark data breach that occurred recently at Equifax. Additionally, at their investor day, management discussed the massive opportunity for recently acquired fast ACH provider Vocalink, which we believe provides leading technology in the currently over $100 trillion ACH market.
TOP INDIVIDUAL DETRACTORS
Detractors from performance this reporting period included AutoZone, Allergan, and Molson Coors Brewing Company.
During AutoZone’s fiscal third quarter, there was further deceleration of comparable store sales which came in below expectations. This further highlighted that the company may be running at a lower EPS growth rate in the near term (mid-single-digit to high-single-digit) versus double digit growth previously as comparisons are slower and some margin headwinds (some temporary, some not) weigh on earnings. The slowdown appears to be industry-wide as their key competitors have also experienced decelerations. Given the shadow that Amazon is casting in U.S. retail, multiples for AutoZone and its peers have compressed as fears of share losses and price compression at the hands of Amazon have gotten extreme. However, in the company’s most recently reported quarter, sales and EPS accelerated, along with its auto parts retail peers. This quieted concerns that Amazon is taking market share to close the period. Although this was a positive development for AutoZone, it did not offset the losses experienced earlier in the year.
Allergan underperformed due to concerns around losing its patent on Restasis. Also, there is concern for weakening margins in 2018 as a few of their higher margin products will lose exclusivity.
Post Molson Coors’ acquisition of the 50% of the U.S. Miller Coors joint venture that they didn’t own, management shed more light on how much of the significant $550mm in savings shareholders could expect to see flow through to earnings. With these savings equating to 500 basis points of operating margin and Molson Coors’ operating margins at half of the industry leader, AnheiserBusch, the market was disappointed in a 30-60 basis point-guided annual improvement. The stock also sold off on concerns management would needlessly invest to try to drive the top line in a flat to declining industry.
STRATEGY & OUTLOOK
At the moment, the U.S. economy continues its “slow and steady” growth. This is being driven by favorable data around employment, wages and inflation. Rising home prices and innovation also continue to help drive the economy higher. Moreover, we believe corporate tax reform will lead to a jump in earnings and cash flow for most companies, and it will more likely than not lead to a boost in economic growth in the short-term. While the economic expansionary cycle is indeed long in the tooth, the economic growth has been at relatively low rates, suggesting it could continue for a while longer.
We are afraid companies are addicted to low interest rates, which have been low for almost a decade now. We believe the risks inherent to this market include the misallocation of capital if interest rates were to rise materially. As the markets have risen, we find fewer companies with attractive fundamentals that are attractively priced. We intend to maintain our discipline around valuation. Additionally, while innovation is alive and well and continuing to help generate economic growth, fundamental disruptions across market segments have been elevated. We continue to be focused on potential disruption risk to our companies.
Volatility in the markets was unusually low in 2017. We expect heightened uncertainty to return to the equity markets eventually. Traditionally, during periods of economic uncertainty and heightened market volatility, investors favor stocks of higher quality companies—with greater consistency and stability of revenue and earnings—leading to relatively better stock performance of those companies. We think focusing on companies with economic moats and skilled management teams positions us well, should this environment come to pass. During times of economic volatility such companies frequently widen their lead over weaker competitors. We seek to invest in companies, characterized by these qualities, at compelling valuations and believe this disciplined approach is essential to generating superior long-term performance.
4 OPPENHEIMER CAPITAL APPRECIATION FUND/VA
Investors should consider the Fund’s investment objective, risks, charges and expenses carefully before investing. The Fund’s prospectus and summary prospectus contain this and other information about the Fund, and may be obtained by asking your financial advisor or calling us at 1.800.988.8287. Read prospectuses and summary prospectuses carefully before investing.
Total returns include changes in share price and reinvestment of dividends and capital gains distributions in a hypothetical investment for the periods shown, but do not include the charges associated with the separate account products that offer this Fund.
The Fund’s investment strategy and focus can change over time. The mention of specific fund holdings does not constitute a recommendation by OppenheimerFunds, Inc. or its affiliates.
Shares of Oppenheimer funds are not deposits or obligations of any bank, are not guaranteed by any bank, are not insured by the FDIC or any other agency, and involve investment risks, including the possible loss of the principal amount invested.
Comparing the Fund’s Performance to the Market. The graphs that follow show the performance of a hypothetical $10,000 investment in each share class of the Fund held until December 31, 2017. Performance is measured over a ten-fiscal-year period for both Classes. Performance information does not reflect charges that apply to separate accounts investing in the Fund. If these charges were taken into account, performance would be lower. The graphs assume that all dividends and capital gains distributions were reinvested in additional shares.
The Fund’s performance is compared to the performance of the S&P 500 Index and the Russell 1000 Growth Index. The S&P 500 Index is a broad-based measure of domestic stock performance. The Russell 1000 Growth Index measures the performance of the large-cap growth segment of the U.S. equity universe. It includes those Russell 1000 companies with higher price-to-book ratios and higher forecasted growth values. The indices are unmanaged and cannot be purchased directly by investors. While index comparisons may be useful to provide a benchmark for the Fund’s performance, it must be noted that the Fund’s investments are not limited to the investments comprising the indices. Index performance includes reinvestment of income, but does not reflect transaction costs, fees, expenses or taxes. Index performance is shown for illustrative purposes only as a benchmark for the Fund’s performance, and does not predict or depict performance of the Fund. The Fund’s performance reflects the effects of the Fund’s business and operating expenses.
5 OPPENHEIMER CAPITAL APPRECIATION FUND/VA
COMPARISON OF CHANGE IN VALUE OF $10,000 HYPOTHETICAL INVESTMENTS IN:

COMPARISON OF CHANGE IN VALUE OF $10,000 HYPOTHETICAL INVESTMENTS IN:
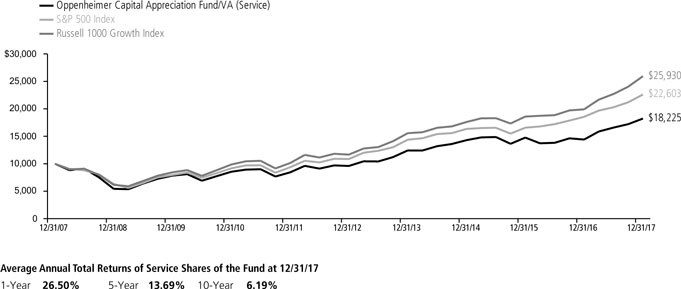
Performance data quoted represents past performance, which does not guarantee future results. The investment return and principal value of an investment in the Fund will fluctuate so that an investor’s shares, when redeemed, may be worth more or less than their original cost. Current performance may be lower or higher than the performance quoted. For performance data current to the most recent month end, call us at 1.800.988.8287. The Fund’s total returns should not be expected to be the same as the returns of other funds, whether or not both funds have the same portfolio managers and/or similar names. The Fund’s total returns include changes in share price and reinvested distributions but do not include the charges associated with the separate account products that offer this Fund. Such performance would have been lower if such charges were taken into account.
6 OPPENHEIMER CAPITAL APPRECIATION FUND/VA
Fund Expenses
Fund Expenses. As a shareholder of the Fund, you incur two types of costs: (1) transaction costs and (2) ongoing costs, including management fees; distribution and service fees; and other Fund expenses. These examples are intended to help you understand your ongoing costs (in dollars) of investing in the Fund and to compare these costs with the ongoing costs of investing in other mutual funds.
The examples are based on an investment of $1,000.00 invested at the beginning of the period and held for the entire 6-month period ended December 31, 2017.
Actual Expenses. The first section of the table provides information about actual account values and actual expenses. You may use the information in this section for the class of shares you hold, together with the amount you invested, to estimate the expense that you paid over the period. Simply divide your account value by $1,000.00 (for example, an $8,600.00 account value divided by $1,000.00 = 8.60), then multiply the result by the number in the first section under the heading entitled “Expenses Paid During 6 Months Ended December 31, 2017” to estimate the expenses you paid on your account during this period.
Hypothetical Example for Comparison Purposes.
The second section of the table provides information about hypothetical account values and hypothetical expenses based on the Fund’s actual expense ratio for each class of shares, and an assumed rate of return of 5% per year for each class before expenses, which is not the actual return. The hypothetical account values and expenses may not be used to estimate the actual ending account balance or expenses you paid for the period. You may use this information to compare the ongoing costs of investing in the Fund and other funds. To do so, compare this 5% hypothetical example for the class of shares you hold with the 5% hypothetical examples that appear in the shareholder reports of the other funds.
Please note that the expenses shown in the table are meant to highlight your ongoing costs only and do not reflect any charges associated with the separate accounts that offer this Fund. Therefore, the “hypothetical” lines of the table are useful in comparing ongoing costs only, and will not help you determine the relative total costs of owning different funds. In addition, if these separate account charges were included your costs would have been higher.
| | | | | | | | | | | | |
| Actual | | Beginning
Account Value July 1, 2017 | | | Ending Account Value December 31, 2017 | | | Expenses Paid During 6 Months Ended December 31, 2017 | |
Non-Service shares | | $ | 1,000.00 | | | $ | 1,100.80 | | | $ | 4.24 | |
Service shares | | | 1,000.00 | | | | 1,099.30 | | | | 5.57 | |
|
| Hypothetical | |
| (5% return before expenses) | | | | | | | | | |
Non-Service shares | | | 1,000.00 | | | | 1,021.17 | | | | 4.08 | |
Service shares | | | 1,000.00 | | | | 1,019.91 | | | | 5.36 | |
Expenses are equal to the Fund’s annualized expense ratio for that class, multiplied by the average account value over the period, multiplied by 184/365 (to reflect the one-half year period). Those annualized expense ratios, excluding indirect expenses from affiliated funds, based on the 6-month period ended December 31, 2017 are as follows:
| | | | |
| Class | | Expense Ratios | |
Non-Service shares | | | 0.80% | |
Service shares | | | 1.05 | |
The expense ratios reflect voluntary and/or contractual waivers and/or reimbursements of expenses by the Fund’s Manager. Some of these undertakings may be modified or terminated at any time, as indicated in the Fund’s prospectus. The “Financial Highlights” tables in the Fund’s financial statements, included in this report, also show the gross expense ratios, without such waivers or reimbursements and reduction to custodian expenses, if applicable.
7 OPPENHEIMER CAPITAL APPRECIATION FUND/VA
STATEMENT OF INVESTMENTS December 31, 2017
| | | | | | | | |
| | | Shares | | | Value | |
| |
Common Stocks—99.8% | |
| |
Consumer Discretionary—20.2% | | | | | |
| |
Hotels, Restaurants & Leisure—3.4% | | | | | |
| |
Cedar Fair LP1 | | | 189,752 | | | $ | 12,331,983 | |
| |
Starbucks Corp. | | | 293,970 | | | | 16,882,697 | |
| | | | | | | | |
| | | | | | | 29,214,680 | |
| |
Household Durables—1.5% | | | | | |
| |
Newell Brands, Inc. | | | 119,940 | | | | 3,706,146 | |
| |
Whirlpool Corp. | | | 58,050 | | | | 9,789,552 | |
| | | | | | | | |
| | | | | | | 13,495,698 | |
| |
Internet & Catalog Retail—5.5% | | | | | |
| |
Amazon.com, Inc.2 | | | 29,394 | | | | 34,375,401 | |
| |
Priceline Group, Inc. (The)2 | | | 7,620 | | | | 13,241,579 | |
| | | | | | | | |
| | | | | | | 47,616,980 | |
| |
Media—2.6% | | | | | |
| |
Comcast Corp., Cl. A | | | 566,542 | | | | 22,690,007 | |
| |
Specialty Retail—7.2% | | | | | |
| |
AutoNation, Inc.2 | | | 225,990 | | | | 11,600,067 | |
| |
AutoZone, Inc.2 | | | 22,460 | | | | 15,977,370 | |
| |
CarMax, Inc.2 | | | 168,520 | | | | 10,807,187 | |
| |
Lowe’s Cos., Inc. | | | 266,170 | | | | 24,737,840 | |
| | | | | | | | |
| | | | | | | 63,122,464 | |
| |
Consumer Staples—5.6% | | | | | |
| |
Beverages—3.1% | | | | | |
| |
Constellation Brands, Inc., Cl. A | | | 42,410 | | | | 9,693,654 | |
| |
Dr Pepper Snapple Group, Inc. | | | 97,830 | | | | 9,495,380 | |
| |
Molson Coors Brewing Co., Cl. B | | | 91,030 | | | | 7,470,832 | |
| | | | | | | | |
| | | | | | | 26,659,866 | |
| |
Food Products—1.3% | | | | | |
| |
Kraft Heinz Co. (The) | | | 84,190 | | | | 6,546,614 | |
| |
Mondelez International, Inc., Cl. A | | | 115,590 | | | | 4,947,252 | |
| | | | | | | | |
| | | | | | | 11,493,866 | |
| |
Household Products—1.2% | | | | | |
| |
HRG Group, Inc.2 | | | 130,350 | | | | 2,209,432 | |
| |
Spectrum Brands Holdings, Inc. | | | 74,550 | | | | 8,379,420 | |
| | | | | | | | |
| | | | | | | 10,588,852 | |
| |
Energy—2.5% | | | | | |
| |
Oil, Gas & Consumable Fuels—2.5% | | | | | |
| |
Husky Energy, Inc.2 | | | 589,536 | | | | 8,324,793 | |
| |
Magellan Midstream Partners LP1 | | | 195,230 | | | | 13,849,616 | |
| | | | | | | | |
| | | | | | | 22,174,409 | |
| |
Financials—5.6% | | | | | |
| |
Capital Markets—4.2% | | | | | |
| |
Charles Schwab Corp. (The) | | | 266,970 | | | | 13,714,249 | |
| |
CME Group, Inc., Cl. A | | | 63,530 | | | | 9,278,557 | |
| |
Intercontinental Exchange, Inc. | | | 190,450 | | | | 13,438,152 | |
| | | | | | | | |
| | | | | | | 36,430,958 | |
| |
Diversified Financial Services—1.0% | | | | | |
| |
Berkshire Hathaway, Inc., Cl. B2 | | | 44,050 | | | | 8,731,591 | |
| |
Real Estate Investment Trusts (REITs)—0.4% | | | | | |
| |
| Mid-America Apartment Communities, Inc. | | | 40,340 | | | | 4,056,590 | |
| |
Health Care—11.8% | | | | | |
| |
Biotechnology—4.5% | | | | | |
| |
Biogen, Inc.2 | | | 40,420 | | | | 12,876,599 | |
| |
Celgene Corp.2 | | | 136,604 | | | | 14,255,994 | |
| |
Galapagos NV2 | | | 43,811 | | | | 4,150,346 | |
| |
Gilead Sciences, Inc. | | | 117,630 | | | | 8,427,013 | |
| | | | | | | | |
| | | | | | | 39,709,952 | |
| |
Health Care Equipment & Supplies—2.3% | | | | | |
| |
Intuitive Surgical, Inc.2 | | | 20,670 | | | | 7,543,310 | |
| |
Medtronic plc | | | 91,960 | | | | 7,425,770 | |
| | | | | | | | |
| | | Shares | | | Value | |
| |
Health Care Equipment & Supplies (Continued) | | | | | |
| |
Stryker Corp. | | | 35,010 | | | $ | 5,420,948 | |
| | | | | | | | |
| | | | | | | 20,390,028 | |
| |
Health Care Providers & Services—2.2% | | | | | |
| |
Humana, Inc. | | | 28,970 | | | | 7,186,588 | |
| |
Laboratory Corp. of America Holdings2 | | | 74,770 | | | | 11,926,563 | |
| | | | | | | | |
| | | | | | | 19,113,151 | |
| |
Health Care Technology—0.8% | | | | | |
| |
Cerner Corp.2 | | | 98,920 | | | | 6,666,219 | |
| |
Pharmaceuticals—2.0% | | | | | |
| |
Allergan plc | | | 58,220 | | | | 9,523,628 | |
| |
Merck & Co., Inc. | | | 88,930 | | | | 5,004,091 | |
| |
| Valeant Pharmaceuticals International, Inc.2 | | | 121,090 | | | | 2,516,250 | |
| | | | | | | | |
| | | | | | | 17,043,969 | |
| |
Industrials—10.3% | | | | | |
| |
Aerospace & Defense—1.0% | | | | | |
| |
Spirit AeroSystems Holdings, Inc., Cl. A | | | 97,270 | | | | 8,486,807 | |
| |
Airlines—1.6% | | | | | |
| |
Spirit Airlines, Inc.2 | | | 319,990 | | | | 14,351,552 | |
| |
Commercial Services & Supplies—2.0% | | | | | |
| |
Johnson Controls International plc | | | 115,830 | | | | 4,414,281 | |
| |
KAR Auction Services, Inc. | | | 256,640 | | | | 12,962,887 | |
| | | | | | | | |
| | | | | | | 17,377,168 | |
| |
Machinery—2.4% | | | | | |
| |
Deere & Co. | | | 42,200 | | | | 6,604,722 | |
| |
Stanley Black & Decker, Inc. | | | 29,500 | | | | 5,005,855 | |
| |
Wabtec Corp. | | | 118,250 | | | | 9,629,097 | |
| | | | | | | | |
| | | | | | | 21,239,674 | |
| |
Professional Services—1.1% | | | | | |
| |
Equifax, Inc. | | | 13,240 | | | | 1,561,261 | |
| |
Nielsen Holdings plc | | | 209,660 | | | | 7,631,624 | |
| | | | | | | | |
| | | | | | | 9,192,885 | |
| |
Road & Rail—1.5% | | | | | |
| |
Canadian National Railway Co. | | | 88,710 | | | | 7,318,575 | |
| |
Canadian Pacific Railway Ltd. | | | 33,890 | | | | 6,193,736 | |
| | | | | | | | |
| | | | | | | 13,512,311 | |
| |
Trading Companies & Distributors—0.7% | | | | | |
| |
Fastenal Co. | | | 103,820 | | | | 5,677,916 | |
| |
Information Technology—40.3% | | | | | |
| |
Internet Software & Services—14.2% | | | | | |
| |
Alphabet, Inc., Cl. C2 | | | 56,850 | | | | 59,487,840 | |
| |
eBay, Inc.2 | | | 474,030 | | | | 17,889,892 | |
| |
Facebook, Inc., Cl. A2 | | | 263,660 | | | | 46,525,444 | |
| | | | | | | | |
| | | | | | | 123,903,176 | |
| |
IT Services—6.5% | | | | | |
| |
Mastercard, Inc., Cl. A | | | 263,590 | | | | 39,896,983 | |
| |
PayPal Holdings, Inc.2 | | | 231,560 | | | | 17,047,447 | |
| | | | | | | | |
| | | | | | | 56,944,430 | |
| |
Semiconductors & Semiconductor Equipment—3.2% | |
| |
Broadcom Ltd. | | | 58,170 | | | | 14,943,873 | |
| |
Texas Instruments, Inc. | | | 125,310 | | | | 13,087,376 | |
| | | | | | | | |
| | | | | | | 28,031,249 | |
| |
Software—9.3% | | | | | |
| |
Activision Blizzard, Inc. | | | 150,360 | | | | 9,520,795 | |
| |
Microsoft Corp. | | | 591,770 | | | | 50,620,006 | |
| |
Oracle Corp. | | | 386,020 | | | | 18,251,025 | |
| |
Snap, Inc., Cl. A2 | | | 146,600 | | | | 2,141,826 | |
| | | | | | | | |
| | | | | | | 80,533,652 | |
| |
Technology Hardware, Storage & Peripherals—7.1% | |
| |
Apple, Inc. | | | 366,670 | | | | 62,051,564 | |
8 OPPENHEIMER CAPITAL APPRECIATION FUND/VA
| | | | | | | | |
| | | Shares | | | Value | |
| |
Materials—1.3% | | | | | | | | |
| |
Chemicals—0.4% | | | | | | | | |
| |
Albemarle Corp. | | | 31,380 | | | $ | 4,013,188 | |
| |
Metals & Mining—0.9% | | | | | | | | |
| |
Compass Minerals International, Inc. | | | 106,180 | | | | 7,671,505 | |
| |
Utilities—2.2% | | | | | | | | |
| |
Electric Utilities—0.3% | | | | | | | | |
| |
PG&E Corp. | | | 64,970 | | | | 2,912,605 | |
| | | | | | | | |
| | | Shares | | | Value | |
| |
Gas Utilities—1.6% | | | | | | | | |
| |
AmeriGas Partners LP1 | | | 295,100 | | | $ | 13,642,473 | |
| |
Multi-Utilities—0.3% | | | | | | | | |
| |
SCANA Corp. | | | 63,970 | | | | 2,544,727 | |
| |
| Total Investments, at Value (Cost $638,825,547) | | | 99.8% | | | | 871,286,162 | |
| |
| Net Other Assets (Liabilities) | | | 0.2 | | | | 1,805,314 | |
| | | | |
Net Assets | | | 100.0% | | | $ | 873,091,476 | |
| | | | |
Footnotes to Statement of Investments
1. Security is a Master Limited Partnership.
2. Non-income producing security.
The following issuer is or was an affiliate, as defined in the Investment Company Act of 1940, as amended, at or during the reporting period, by virtue of the Fund owning at least 5% of the voting securities of the issuer or as a result of the Fund and the issuer having the same investment adviser. There were no affiliate securities held by the Fund at period end. Transactions during the reporting period in which the issuer was an affiliate are as follows:
| | | | | | | | | | | | | | | | |
| | | Shares
December 31, 2016 | | | Gross Additions | | | Gross Reductions | | | Shares
December 31, 2017 | |
| |
| Oppenheimer Institutional Government Money Market Fund, Cl. E | | | 31,306,028 | | | | 117,128,592 | | | | 148,434,620 | | | | — | |
| | | | |
| | | Value | | | Income | | | Realized Gain (Loss) | | | Change in Unrealized
Gain (Loss) | |
| |
| Oppenheimer Institutional Government Money Market Fund, Cl. E | | $ | — | | | $ | 41,558 | | | $ | — | | | $ | — | |
See accompanying Notes to Financial Statements.
9 OPPENHEIMER CAPITAL APPRECIATION FUND/VA
STATEMENT OF ASSETS AND LIABILITIES December 31, 2017
| | | | |
| |
Assets | | | | |
Investments, at value—see accompanying statement of investments—unaffiliated companies (cost $638,825,547) | | $ | 871,286,162 | |
| |
Cash | | | 1,439,596 | |
| |
Receivables and other assets: | | | | |
Dividends | | | 875,451 | |
Shares of beneficial interest sold | | | 90,807 | |
Other | | | 100,564 | |
| | | | |
Total assets | | | 873,792,580 | |
| |
Liabilities | | | | |
Payables and other liabilities: | | | | |
Shares of beneficial interest redeemed | | | 468,976 | |
Trustees’ compensation | | | 88,598 | |
Distribution and service plan fees | | | 67,751 | |
Shareholder communications | | | 34,035 | |
Other | | | 41,744 | |
| | | | |
Total liabilities | | | 701,104 | |
| |
Net Assets | | $ | 873,091,476 | |
| | | | |
|
| |
Composition of Net Assets | | | | |
Par value of shares of beneficial interest | | $ | 15,759 | |
| |
Additional paid-in capital | | | 582,958,371 | |
| |
Accumulated net investment income | | | 313,862 | |
| |
Accumulated net realized gain on investments and foreign currency transactions | | | 57,355,900 | |
| |
Net unrealized appreciation on investments and translation of assets and liabilities denominated in foreign currencies | | | 232,447,584 | |
| | | | |
Net Assets | | $ | 873,091,476 | |
| | | | |
|
| |
Net Asset Value Per Share | | | | |
Non-Service Shares: | | | | |
| Net asset value, redemption price per share and offering price per share (based on net assets of $556,227,631 and 9,986,261 shares of beneficial interest outstanding) | | | $55.70 | |
| |
Service Shares: | | | | |
| Net asset value, redemption price per share and offering price per share (based on net assets of $316,863,845 and 5,772,556 shares of beneficial interest outstanding) | | | $54.89 | |
See accompanying Notes to Financial Statements.
10 OPPENHEIMER CAPITAL APPRECIATION FUND/VA
STATEMENT OF OPERATIONS For the Year Ended December 31, 2017
| | | | |
| |
Investment Income | | | | |
Dividends: | | | | |
Unaffiliated companies (net of foreign withholding taxes of $33,477) | | $ | 9,282,318 | |
Affiliated companies | | | 41,558 | |
| | | | |
Total investment income | | | 9,323,876 | |
| |
Expenses | | | | |
Management fees | | | 5,959,688 | |
| |
Distribution and service plan fees — Service shares | | | 785,869 | |
| |
Transfer and shareholder servicing agent fees: | | | | |
Non-Service shares | | | 538,955 | |
Service shares | | | 314,335 | |
| |
Shareholder communications: | | | | |
Non-Service shares | | | 45,034 | |
Service shares | | | 26,299 | |
| |
Trustees’ compensation | | | 31,813 | |
| |
Borrowing fees | | | 22,848 | |
| |
Custodian fees and expenses | | | 6,179 | |
| |
Other | | | 91,067 | |
| | | | |
Total expenses | | | 7,822,087 | |
Less reduction to custodian expenses | | | (1,528) | |
Less waivers and reimbursements of expenses | | | (185,524) | |
| | | | |
Net expenses | | | 7,635,035 | |
| |
Net Investment Income | | | 1,688,841 | |
| |
Realized and Unrealized Gain (Loss) | | | | |
Net realized gain (loss) on: | | | | |
Investment transactions in unaffiliated companies | | | 62,739,925 | |
Foreign currency transactions | | | (3,432) | |
| | | | |
Net realized gain | | | 62,736,493 | |
| |
Net change in unrealized appreciation/depreciation on: | | | | |
Investment transactions in unaffiliated companies | | | 136,363,366 | |
Translation of assets and liabilities denominated in foreign currencies | | | 10,173 | |
| | | | |
Net change in unrealized appreciation/depreciation | | | 136,373,539 | |
| |
Net Increase in Net Assets Resulting from Operations | | $ | 200,798,873 | |
| | | | |
See accompanying Notes to Financial Statements.
11 OPPENHEIMER CAPITAL APPRECIATION FUND/VA
STATEMENTS OF CHANGES IN NET ASSETS
| | | | | | | | |
| | | Year Ended
December 31, 2017 | | | Year Ended
December 31, 2016 | |
| |
Operations | | | | | | | | |
Net investment income | | $ | 1,688,841 | | | $ | 1,293,960 | |
| |
Net realized gain | | | 62,736,493 | | | | 85,112,682 | |
| |
Net change in unrealized appreciation/depreciation | | | 136,373,539 | | | | (108,416,699) | |
| | | | |
Net increase (decrease) in net assets resulting from operations | | | 200,798,873 | | | | (22,010,057) | |
| |
Dividends and/or Distributions to Shareholders | | | | | | | | |
Dividends from net investment income: | | | | | | | | |
Non-Service shares | | | (1,271,514) | | | | (2,123,971) | |
Service shares | | | (28,819) | | | | (318,481) | |
| | | | |
| | | (1,300,333) | | | | (2,442,452) | |
| |
Distributions from net realized gain: | | | | | | | | |
Non-Service shares | | | (48,408,998) | | | | (53,815,550) | |
Service shares | | | (28,679,944) | | | | (29,108,236) | |
| | | | |
| | | (77,088,942) | | | | (82,923,786) | |
| |
Beneficial Interest Transactions | | | | | | | | |
Net increase (decrease) in net assets resulting from beneficial interest transactions: | | | | | | | | |
Non-Service shares | | | (23,046,014) | | | | 6,630,751 | |
Service shares | | | (23,253,888) | | | | 15,475,883 | |
| | | | |
| | | (46,299,902) | | | | 22,106,634 | |
| |
Net Assets | | | | | | | | |
Total increase (decrease) | | | 76,109,696 | | | | (85,269,661) | |
| |
Beginning of period | | | 796,981,780 | | | | 882,251,441 | |
| | | | |
| End of period (including accumulated net investment income (loss) of $313,862 and $(101,477), respectively) | | $ | 873,091,476 | | | $ | 796,981,780 | |
| | | | |
See accompanying Notes to Financial Statements.
12 OPPENHEIMER CAPITAL APPRECIATION FUND/VA
FINANCIAL HIGHLIGHTS
| | | | | | | | | | | | | | | | | | | | |
| Non-Service Shares | | Year Ended
December 31,
2017 | | | Year Ended
December 31,
2016 | | | Year Ended
December 31,
2015 | | | Year Ended
December 31,
2014 | | | Year Ended
December 31,
2013 | |
| |
Per Share Operating Data | | | | | | | | | | | | | | | | | | | | |
Net asset value, beginning of period | | | $48.36 | | | | $55.49 | | | | $64.87 | | | | $57.88 | | | | $45.06 | |
| |
Income (loss) from investment operations: | | | | | | | | | | | | | | | | | | | | |
Net investment income1 | | | 0.15 | | | | 0.12 | | | | 0.22 | | | | 0.09 | | | | 0.23 | |
Net realized and unrealized gain (loss) | | | 12.33 | | | | (1.57) | | | | 2.25 | | | | 8.64 | | | | 13.09 | |
| | | | |
Total from investment operations | | | 12.48 | | | | (1.45) | | | | 2.47 | | | | 8.73 | | | | 13.32 | |
| |
Dividends and/or distributions to shareholders: | | | | | | | | | | | | | | | | | | | | |
Dividends from net investment income | | | (0.13) | | | | (0.22) | | | | (0.06) | | | | (0.27) | | | | (0.50) | |
Distributions from net realized gain | | | (5.01) | | | | (5.46) | | | | (11.79) | | | | (1.47) | | | | 0.00 | |
| | | | |
Total dividends and/or distributions to shareholders | | | (5.14) | | | | (5.68) | | | | (11.85) | | | | (1.74) | | | | (0.50) | |
| |
Net asset value, end of period | | | $55.70 | | | | $48.36 | | | | $55.49 | | | | $64.87 | | | | $57.88 | |
| | | | |
| | | | |
| |
Total Return, at Net Asset Value2 | | | 26.83% | | | | (2.20)% | | | | 3.54% | | | | 15.41% | | | | 29.74% | |
| |
| |
Ratios/Supplemental Data | | | | | | | | | | | | | | | | | | | | |
Net assets, end of period (in thousands) | | | $556,227 | | | | $501,756 | | | | $564,514 | | | | $616,862 | | | | $626,907 | |
| |
Average net assets (in thousands) | | | $539,255 | | | | $514,525 | | | | $601,110 | | | | $614,272 | | | | $595,912 | |
| |
Ratios to average net assets:3 | | | | | | | | | | | | | | | | | | | | |
Net investment income | | | 0.29% | | | | 0.25% | | | | 0.36% | | | | 0.15% | | | | 0.44% | |
Expenses excluding specific expenses listed below | | | 0.82% | | | | 0.83% | | | | 0.81% | | | | 0.80% | | | | 0.81% | |
Interest and fees from borrowings | | | 0.00%4 | | | | 0.00%4 | | | | 0.00%4 | | | | 0.00% | | | | 0.00% | |
| | | | |
Total expenses5 | | | 0.82% | | | | 0.83% | | | | 0.81% | | | | 0.80% | | | | 0.81% | |
| Expenses after payments, waivers and/or reimbursements and reduction to custodian expenses | | | 0.80% | | | | 0.80% | | | | 0.80% | | | | 0.80%6 | | | | 0.80% | |
| |
Portfolio turnover rate | | | 26% | | | | 114% | | | | 60% | | | | 61% | | | | 77% | |
1. Per share amounts calculated based on the average shares outstanding during the period.
2. Assumes an initial investment on the business day before the first day of the fiscal period, with all dividends and distributions reinvested in additional shares on the reinvestment date, and redemption at the net asset value calculated on the last business day of the fiscal period. Total returns are not annualized for periods less than one full year. Total return information does not reflect expenses that apply at the separate account level or to related insurance products. Inclusion of these charges would reduce the total return figures for all periods shown. Returns do not reflect the deduction of taxes that a shareholder would pay on fund distributions or the redemption of fund shares.
3. Annualized for periods less than one full year.
4. Less than 0.005%.
5. Total expenses including indirect expenses from affiliated fund fees and expenses were as follows:
| | |
Year Ended December 31, 2017 | | 0.82% |
Year Ended December 31, 2016 | | 0.83% |
Year Ended December 31, 2015 | | 0.81% |
Year Ended December 31, 2014 | | 0.80% |
Year Ended December 31, 2013 | | 0.81% |
6. Waivers less than 0.005%.
See accompanying Notes to Financial Statements.
13 OPPENHEIMER CAPITAL APPRECIATION FUND/VA
FINANCIAL HIGHLIGHTS Continued
| | | | | | | | | | | | | | | | | | | | |
| Service Shares | | Year Ended
December 31,
2017 | | | Year Ended
December 31,
2016 | | | Year Ended
December 31,
2015 | | | Year Ended
December 31,
2014 | | | Year Ended
December 31,
2013 | |
| |
Per Share Operating Data | | | | | | | | | | | | | | | | | | | | |
Net asset value, beginning of period | | | $47.73 | | | | $54.80 | | | | $64.30 | | | | $57.37 | | | | $44.66 | |
| |
Income (loss) from investment operations: | | | | | | | | | | | | | | | | | | | | |
Net investment income (loss)1 | | | 0.02 | | | | 0.002 | | | | 0.07 | | | | (0.06) | | | | 0.10 | |
Net realized and unrealized gain (loss) | | | 12.16 | | | | (1.55) | | | | 2.22 | | | | 8.57 | | | | 12.98 | |
| | | | |
Total from investment operations | | | 12.18 | | | | (1.55) | | | | 2.29 | | | | 8.51 | | | | 13.08 | |
| |
Dividends and/or distributions to shareholders: | | | | | | | | | | | | | | | | | | | | |
Dividends from net investment income | | | (0.01) | | | | (0.06) | | | | 0.00 | | | | (0.11) | | | | (0.37) | |
Distributions from net realized gain | | | (5.01) | | | | (5.46) | | | | (11.79) | | | | (1.47) | | | | 0.00 | |
| | | | |
Total dividends and/or distributions to shareholders | | | (5.02) | | | | (5.52) | | | | (11.79) | | | | (1.58) | | | | (0.37) | |
| |
Net asset value, end of period | | | $54.89 | | | | $47.73 | | | | $54.80 | | | | $64.30 | | | | $57.37 | |
| | | | |
|
| |
Total Return, at Net Asset Value3 | | | 26.50% | | | | (2.43)% | | | | 3.27% | | | | 15.13% | | | | 29.43% | |
|
| |
| |
Ratios/Supplemental Data | | | | | | | | | | | | | | | | | | | | |
Net assets, end of period (in thousands) | | | $316,864 | | | | $295,226 | | | | $317,737 | | | | $337,318 | | | | $364,214 | |
| |
Average net assets (in thousands) | | | $314,506 | | | | $287,933 | | | | $332,468 | | | | $343,254 | | | | $367,615 | |
| |
Ratios to average net assets:4 | | | | | | | | | | | | | | | | | | | | |
Net investment income (loss) | | | 0.04% | | | | 0.00%5 | | | | 0.12% | | | | (0.10)% | | | | 0.20% | |
Expenses excluding specific expenses listed below | | | 1.07% | | | | 1.08% | | | | 1.06% | | | | 1.05% | | | | 1.06% | |
Interest and fees from borrowings | | | 0.00%5 | | | | 0.00%5 | | | | 0.00%5 | | | | 0.00% | | | | 0.00% | |
| | | | |
Total expenses6 | | | 1.07% | | | | 1.08% | | | | 1.06% | | | | 1.05% | | | | 1.06% | |
| Expenses after payments, waivers and/or reimbursements and reduction to custodian expenses | | | 1.05% | | | | 1.05% | | | | 1.05% | | | | 1.05%7 | | | | 1.05% | |
| |
Portfolio turnover rate | | | 26% | | | | 114% | | | | 60% | | | | 61% | | | | 77% | |
1. Per share amounts calculated based on the average shares outstanding during the period.
2. Less than $0.005 per share.
3. Assumes an initial investment on the business day before the first day of the fiscal period, with all dividends and distributions reinvested in additional shares on the reinvestment date, and redemption at the net asset value calculated on the last business day of the fiscal period. Total returns are not annualized for periods less than one full year. Total return information does not reflect expenses that apply at the separate account level or to related insurance products. Inclusion of these charges would reduce the total return figures for all periods shown. Returns do not reflect the deduction of taxes that a shareholder would pay on fund distributions or the redemption of fund shares.
4. Annualized for periods less than one full year.
5. Less than 0.005%.
6. Total expenses including indirect expenses from affiliated fund fees and expenses were as follows:
| | |
Year Ended December 31, 2017 | | 1.07% |
Year Ended December 31, 2016 | | 1.08% |
Year Ended December 31, 2015 | | 1.06% |
Year Ended December 31, 2014 | | 1.05% |
Year Ended December 31, 2013 | | 1.06% |
7. Waivers less than 0.005%.
See accompanying Notes to Financial Statements.
14 OPPENHEIMER CAPITAL APPRECIATION FUND/VA
NOTES TO FINANCIAL STATEMENTS December 31, 2017
1. Organization
Oppenheimer Capital Appreciation Fund/VA (the “Fund”), a separate series of Oppenheimer Variable Account Funds, is a diversified open-end management investment company registered under the Investment Company Act of 1940 (“1940 Act”), as amended. The Fund’s investment objective is to seek capital appreciation. The Fund’s investment adviser is OFI Global Asset Management, Inc. (“OFI Global” or the “Manager”), a wholly-owned subsidiary of OppenheimerFunds, Inc. (“OFI” or the “Sub-Adviser”). The Manager has entered into a sub-advisory agreement with OFI. Shares of the Fund are sold only to separate accounts of life insurance companies.
The Fund offers two classes of shares. Both classes are sold at their offering price, which is the net asset value per share, to separate investment accounts of participating insurance companies as an underlying investment for variable life insurance policies, variable annuity contracts or other investment products. The class of shares designated as Service shares is subject to a distribution and service plan. Both classes of shares have identical rights and voting privileges with respect to the Fund in general and exclusive voting rights on matters that affect that class alone. Earnings, net assets and net asset value per share may differ due to each class having its own expenses, such as transfer and shareholder servicing agent fees and shareholder communications, directly attributable to that class.
The following is a summary of significant accounting policies followed in the Fund’s preparation of financial statements in accordance with accounting principles generally accepted in the United States (“U.S. GAAP”).
2. Significant Accounting Policies
Security Valuation. All investments in securities are recorded at their estimated fair value, as described in Note 3.
Foreign Currency Translation. The books and records of the Fund are maintained in U.S. dollars. Any foreign currency amounts are translated into U.S. dollars on the following basis:
(1) Value of investment securities, other assets and liabilities — at the exchange rates prevailing at Market Close as described in Note 3.
(2) Purchases and sales of investment securities, income and expenses — at the rates of exchange prevailing on the respective dates of such transactions.
Although the net assets and the values are presented at the foreign exchange rates at Market Close, the Fund does not isolate the portion of the results of operations resulting from changes in foreign exchange rates on investments from the fluctuations arising from changes in prices of securities held. Such fluctuations are included with the net realized and unrealized gains or losses from investments shown in the Statement of Operations.
For securities, which are subject to foreign withholding tax upon disposition, realized gains or losses on such securities are recorded net of foreign withholding tax.
Reported net realized foreign exchange gains or losses arise from sales of foreign currencies, currency gains or losses realized between the trade and settlement dates on securities transactions, the difference between the amounts of dividends, interest, and foreign withholding tax reclaims recorded on the Fund’s books, and the U.S. dollar equivalent of the amounts actually received or paid. Net unrealized foreign exchange gains and losses arise from changes in the value of assets and liabilities other than investments in securities, resulting from changes in the exchange rate.
Allocation of Income, Expenses, Gains and Losses. Income, expenses (other than those attributable to a specific class), gains and losses are allocated on a daily basis to each class of shares based upon the relative proportion of net assets represented by such class. Operating expenses directly attributable to a specific class are charged against the operations of that class.
Dividends and Distributions to Shareholders. Dividends and distributions to shareholders, which are determined in accordance with income tax regulations and may differ from U.S. GAAP, are recorded on the ex-dividend date. Income and capital gain distributions, if any, are declared and paid annually or at other times as determined necessary by the Manager.
Investment Income. Dividend income is recorded on the ex-dividend date or upon ex-dividend notification in the case of certain foreign dividends where the ex-dividend date may have passed. Non-cash dividends included in dividend income, if any, are recorded at the fair value of the securities received. Withholding taxes on foreign dividends, if any, and capital gains taxes on foreign investments, if any, have been provided for in accordance with the Fund’s understanding of the applicable tax rules and regulations. Interest income, if any, is recognized on an accrual basis. Discount and premium, which are included in interest income on the Statement of Operations, are amortized or accreted daily.
Return of Capital Estimates. Distributions received from the Fund’s investments in Master Limited Partnerships (MLPs) and Real Estate Investments Trusts (REITs), generally are comprised of income and return of capital. The Fund records investment income and return of capital based on estimates. Such estimates are based on historical information available from each MLP, REIT and other industry sources. These estimates may subsequently be revised based on information received from MLPs and REITs after their tax reporting periods are concluded.
Custodian Fees. “Custodian fees and expenses” in the Statement of Operations may include interest expense incurred by the Fund on any cash overdrafts of its custodian account during the period. Such cash overdrafts may result from the effects of failed trades in portfolio securities and from cash outflows resulting from unanticipated shareholder redemption activity. The Fund pays interest to its custodian on such cash overdrafts, to the extent they are not offset by positive cash balances maintained by the Fund, at a rate equal to the Federal Funds Rate plus 2.00%. The “Reduction to custodian expenses” line item, if applicable, represents earnings on cash balances maintained by the Fund during the period. Such interest expense and other custodian fees may be paid with these earnings.
15 OPPENHEIMER CAPITAL APPRECIATION FUND/VA
NOTES TO FINANCIAL STATEMENTS Continued
2. Significant Accounting Policies (Continued)
Security Transactions. Security transactions are recorded on the trade date. Realized gains and losses on securities sold are determined on the basis of identified cost.
Indemnifications. The Fund’s organizational documents provide current and former Trustees and officers with a limited indemnification against liabilities arising in connection with the performance of their duties to the Fund. In the normal course of business, the Fund may also enter into contracts that provide general indemnifications. The Fund’s maximum exposure under these arrangements is unknown as this would be dependent on future claims that may be made against the Fund. The risk of material loss from such claims is considered remote.
Federal Taxes. The Fund intends to comply with provisions of the Internal Revenue Code applicable to regulated investment companies and to distribute substantially all of its investment company taxable income, including any net realized gain on investments not offset by capital loss carryforwards, if any, to shareholders. Therefore, no federal income or excise tax provision is required. The Fund files income tax returns in U.S. federal and applicable state jurisdictions. The statute of limitations on the Fund’s tax return filings generally remains open for the three preceding fiscal reporting period ends. The Fund has analyzed its tax positions for the fiscal year ended December 31, 2017, including open tax years, and does not believe there are any uncertain tax positions requiring recognition in the Fund’s financial statements.
The tax components of capital shown in the following table represent distribution requirements the Fund must satisfy under the income tax regulations, losses the Fund may be able to offset against income and gains realized in future years and unrealized appreciation or depreciation of securities and other investments for federal income tax purposes.
| | | | | | | | | | | | |
Undistributed Net Investment Income | | Undistributed Long-Term Gain | | | Accumulated Loss Carryforward1,2 | | | Net Unrealized Appreciation Based on cost of
Securities and Other Investments for Federal Income
Tax Purposes | |
| |
$25,932,730 | | | $33,304,255 | | | | $— | | | | $232,151,565 | |
1. During the reporting period, the Fund did not utilize any capital loss carryforward.
2. During the previous reporting period, the Fund did not utilize any capital loss carryforward.
Net investment income (loss) and net realized gain (loss) may differ for financial statement and tax purposes. The character of dividends and distributions made during the fiscal year from net investment income or net realized gains are determined in accordance with federal income tax requirements, which may differ from the character of net investment income or net realized gains presented in those financial statements in accordance with U.S. GAAP. Also, due to timing of dividends and distributions, the fiscal year in which amounts are distributed may differ from the fiscal year in which the income or net realized gain was recorded by the Fund.
Accordingly, the following amounts have been reclassified for the reporting period. Net assets of the Fund were unaffected by the reclassifications.
| | | | | | |
Increase to Paid-in Capital | | Increase to Accumulated
Net Investment Income | | Reduction
to Accumulated Net
Realized Gain on
Investments3 | |
| |
$4,929,770 | | $26,831 | | | $4,956,601 | |
3. $4,929,770, including $2,853,254 of long-term capital gain, was distributed in connection with Fund share redemptions.
The tax character of distributions paid during the reporting periods:
| | | | | | | | |
| | | Year Ended
December 31, 2017 | | | Year Ended
December 31, 2016 | |
| |
Distributions paid from: | | | | | | | | |
Ordinary income | | $ | 1,300,333 | | | $ | 2,442,452 | |
Long-term capital gain | | | 77,088,942 | | | | 82,923,786 | |
| | | | |
Total | | $ | 78,389,275 | | | $ | 85,366,238 | |
| | | | |
The aggregate cost of securities and other investments and the composition of unrealized appreciation and depreciation of securities and other investments for federal income tax purposes at period end are noted in the following table. The primary difference between book and tax appreciation or depreciation of securities and other investments, if applicable, is attributable to the tax deferral of losses or tax realization of financial statement unrealized gain or loss.
| | | | |
Federal tax cost of securities | | $ | 639,121,566 | |
| | | | |
Gross unrealized appreciation | | $ | 247,259,374 | |
Gross unrealized depreciation | | | (15,107,809) | |
| | | | |
Net unrealized appreciation | | $ | 232,151,565 | |
| | | | |
16 OPPENHEIMER CAPITAL APPRECIATION FUND/VA
2. Significant Accounting Policies (Continued)
Use of Estimates. The preparation of financial statements in conformity with U.S. GAAP requires management to make estimates and assumptions that affect the reported amounts of assets and liabilities and disclosure of contingent assets and liabilities at the date of the financial statements and the reported amounts of increases and decreases in net assets from operations during the reporting period. Actual results could differ from those estimates.
3. Securities Valuation
The Fund calculates the net asset value of its shares as of 4:00 P.M. Eastern time, on each day the New York Stock Exchange (the “Exchange”) is open for trading, except in the case of a scheduled early closing of the Exchange, in which case the Fund will calculate net asset value of the shares as of the scheduled early closing time of the Exchange.
The Fund’s Board has adopted procedures for the valuation of the Fund’s securities and has delegated the day-to-day responsibility for valuation determinations under those procedures to the Manager. The Manager has established a Valuation Committee which is responsible for determining a fair valuation for any security for which market quotations are not readily available. The Valuation Committee’s fair valuation determinations are subject to review, approval and ratification by the Fund’s Board at least quarterly or more frequently, if necessary.
Valuation Methods and Inputs
Securities are valued primarily using unadjusted quoted market prices, when available, as supplied by third party pricing services or broker-dealers.
The following methodologies are used to determine the market value or the fair value of the types of securities described below:
Equity securities traded on a securities exchange (including exchange-traded derivatives other than futures and futures options) are valued based on the official closing price on the principal exchange on which the security is traded, as identified by the Manager, prior to the time when the Fund’s assets are valued. If the official closing price is unavailable, the security is valued at the last sale price on the principal exchange on which it is traded, or if no sales occurred, the security is valued at the mean between the quoted bid and asked prices. Over-the-counter equity securities are valued at the last published sale price, or if no sales occurred, at the mean between the quoted bid and asked prices. Events occurring after the close of trading on foreign exchanges may result in adjustments to the valuation of foreign securities to more accurately reflect their fair value as of the time when the Fund’s assets are valued.
Securities for which market quotations are not readily available, or when a significant event has occurred that would materially affect the value of the security, are fair valued either (i) by a standardized fair valuation methodology applicable to the security type or the significant event as previously approved by the Valuation Committee and the Fund’s Board or (ii) as determined in good faith by the Manager’s Valuation Committee. The Valuation Committee considers all relevant facts that are reasonably available, through either public information or information available to the Manager, when determining the fair value of a security. Those standardized fair valuation methodologies include, but are not limited to, valuing securities at the last sale price or initially at cost and subsequently adjusting the value based on: changes in company specific fundamentals, changes in an appropriate securities index, or changes in the value of similar securities which may be further adjusted for any discounts related to security-specific resale restrictions. When possible, such methodologies use observable market inputs such as unadjusted quoted prices of similar securities, observable interest rates, currency rates and yield curves. The methodologies used for valuing securities are not necessarily an indication of the risks associated with investing in those securities nor can it be assured that the Fund can obtain the fair value assigned to a security if it were to sell the security.
Classifications
Each investment asset or liability of the Fund is assigned a level at measurement date based on the significance and source of the inputs to its valuation. Various data inputs may be used in determining the value of each of the Fund’s investments as of the reporting period end. These data inputs are categorized in the following hierarchy under applicable financial accounting standards:
1) Level 1-unadjusted quoted prices in active markets for identical assets or liabilities (including securities actively traded on a securities exchange)
2) Level 2-inputs other than unadjusted quoted prices that are observable for the asset or liability (such as unadjusted quoted prices for similar assets and market corroborated inputs such as interest rates, prepayment speeds, credit risks, etc.)
3) Level 3-significant unobservable inputs (including the Manager’s own judgments about assumptions that market participants would use in pricing the asset or liability).
The inputs used for valuing securities are not necessarily an indication of the risks associated with investing in those securities.
The table below categorizes amounts that are included in the Fund’s Statement of Assets and Liabilities at period end based on valuation input level:
| | | | | | | | | | | | | | | | |
| | | Level 1—
Unadjusted
Quoted Prices | | | Level 2— Other Significant
Observable Inputs | | | Level 3—
Significant
Unobservable
Inputs | | | Value | |
| |
Assets Table | | | | | | | | | | | | | | | | |
Investments, at Value: | | | | | | | | | | | | | | | | |
Common Stocks | | | | | | | | | | | | | | | | |
Consumer Discretionary | | $ | 176,139,829 | | | $ | — | | | $ | — | | | $ | 176,139,829 | |
Consumer Staples | | | 48,742,584 | | | | — | | | | — | | | | 48,742,584 | |
Energy | | | 22,174,409 | | | | — | | | | — | | | | 22,174,409 | |
Financials | | | 49,219,139 | | | | — | | | | — | | | | 49,219,139 | |
17 OPPENHEIMER CAPITAL APPRECIATION FUND/VA
NOTES TO FINANCIAL STATEMENTS Continued
3. Securities Valuation (Continued)
| | | | | | | | | | | | | | | | |
| | | Level 1—
Unadjusted
Quoted Prices | | | Level 2—
Other Significant
Observable Inputs | | | Level 3—
Significant
Unobservable
Inputs | | | Value | |
| |
Common Stocks (Continued) | | | | | | | | | | | | | | | | |
Health Care | | $ | 98,772,973 | | | $ | 4,150,346 | | | $ | — | | | $ | 102,923,319 | |
Industrials | | | 89,838,313 | | | | — | | | | — | | | | 89,838,313 | |
Information Technology | | | 351,464,071 | | | | — | | | | — | | | | 351,464,071 | |
Materials | | | 11,684,693 | | | | — | | | | — | | | | 11,684,693 | |
Utilities | | | 19,099,805 | | | | — | | | | — | | | | 19,099,805 | |
| | | | |
Total Assets | | $ | 867,135,816 | | | $ | 4,150,346 | | | $ | — | | | $ | 871,286,162 | |
| | | | |
Forward currency exchange contracts and futures contracts, if any, are reported at their unrealized appreciation/depreciation at measurement date, which represents the change in the contract’s value from trade date. All additional assets and liabilities included in the above table are reported at their market value at measurement date.
4. Investments and Risks
Investments in Affiliated Funds. The Fund is permitted to invest in other mutual funds advised by the Manager (“Affiliated Funds”). Affiliated Funds are open-end management investment companies registered under the 1940 Act, as amended. The Manager is the investment adviser of, and the Sub-Adviser provides investment and related advisory services to, the Affiliated Funds. When applicable, the Fund’s investments in Affiliated Funds are included in the Statement of Investments. Shares of Affiliated Funds are valued at their net asset value per share. As a shareholder, the Fund is subject to its proportional share of the Affiliated Funds’ expenses, including their management fee. The Manager will waive fees and/or reimburse Fund expenses in an amount equal to the indirect management fees incurred through the Fund’s investment in the Affiliated Funds.
Each of the Affiliated Funds in which the Fund invests has its own investment risks, and those risks can affect the value of the Fund’s investments and therefore the value of the Fund’s shares. To the extent that the Fund invests more of its assets in one Affiliated Fund than in another, the Fund will have greater exposure to the risks of that Affiliated Fund.
Investments in Money Market Instruments. The Fund is permitted to invest its free cash balances in money market instruments to provide liquidity or for defensive purposes. The Fund may invest in money market instruments by investing in Class E shares of Oppenheimer Institutional Government Money Market Fund (“IGMMF”), which is an Affiliated Fund. IGMMF is regulated as a money market fund under the 1940 Act, as amended. The Fund may also invest in money market instruments directly or in other affiliated or unaffiliated money market funds. At period end, the Fund had no holdings in IGMMF.
Master Limited Partnerships (“MLPs”). MLPs issue common units that represent an equity ownership interest in a partnership and provide limited voting rights. MLP common units are registered with the Securities and Exchange Commission (“SEC”), and are freely tradable on securities exchanges such as the NYSE and the NASDAQ Stock Market (“NASDAQ”), or in the over-the-counter (“OTC”) market. An MLP consists of one or more general partners, who conduct the business, and one or more limited partners, who contribute capital. MLP common unit holders have a limited role in the partnership’s operations and management. The Fund, as a limited partner, normally would not be liable for the debts of the MLP beyond the amounts the Fund has contributed, but would not be shielded to the same extent that a shareholder of a corporation would be. In certain circumstances creditors of an MLP would have the right to seek return of capital distributed to a limited partner. This right of an MLP’s creditors would continue after the Fund sold its investment in the MLP.
Equity Security Risk. Stocks and other equity securities fluctuate in price. The value of the Fund’s portfolio may be affected by changes in the equity markets generally. Equity markets may experience significant short-term volatility and may fall sharply at times. Different markets may behave differently from each other and U.S. equity markets may move in the opposite direction from one or more foreign stock markets. Adverse events in any part of the equity or fixed-income markets may have unexpected negative effects on other market segments.
The prices of individual equity securities generally do not all move in the same direction at the same time and a variety of factors can affect the price of a particular company’s securities. These factors may include, but are not limited to, poor earnings reports, a loss of customers, litigation against the company, general unfavorable performance of the company’s sector or industry, or changes in government regulations affecting the company or its industry.
Shareholder Concentration. At period end, one shareholder owned 20% or more of the Fund’s total outstanding shares.
The shareholder is a related party of the Fund. Related parties may include, but are not limited to, the investment manager and its affiliates, affiliated broker dealers, fund of funds, and directors or employees. The related party owned 51% of the Fund’s total outstanding shares at period end.
5. Market Risk Factors
The Fund’s investments in securities and/or financial derivatives may expose the Fund to various market risk factors:
Commodity Risk. Commodity risk relates to the change in value of commodities or commodity indexes as they relate to increases or decreases in the commodities market. Commodities are physical assets that have tangible properties. Examples of these types of assets are crude oil, heating oil,
18 OPPENHEIMER CAPITAL APPRECIATION FUND/VA
5. Market Risk Factors (Continued)
metals, livestock, and agricultural products.
Credit Risk. Credit risk relates to the ability of the issuer of debt to meet interest and principal payments, or both, as they come due. In general, lower-grade, higher-yield debt securities are subject to credit risk to a greater extent than lower-yield, higher-quality securities.
Equity Risk. Equity risk relates to the change in value of equity securities as they relate to increases or decreases in the general market.
Foreign Exchange Rate Risk. Foreign exchange rate risk relates to the change in the U.S. dollar value of a security held that is denominated in a foreign currency. The U.S. dollar value of a foreign currency denominated security will decrease as the dollar appreciates against the currency, while the U.S. dollar value will increase as the dollar depreciates against the currency.
Interest Rate Risk. Interest rate risk refers to the fluctuations in value of fixed-income securities resulting from the inverse relationship between price and yield. For example, an increase in general interest rates will tend to reduce the market value of already issued fixed-income investments, and a decline in general interest rates will tend to increase their value. In addition, debt securities with longer maturities, which tend to have higher yields, are subject to potentially greater fluctuations in value from changes in interest rates than obligations with shorter maturities.
Volatility Risk. Volatility risk refers to the magnitude of the movement, but not the direction of the movement, in a financial instrument’s price over a defined time period. Large increases or decreases in a financial instrument’s price over a relative time period typically indicate greater volatility risk, while small increases or decreases in its price typically indicate lower volatility risk.
6. Shares of Beneficial Interest
The Fund has authorized an unlimited number of $0.001 par value shares of beneficial interest of each class. Transactions in shares of beneficial interest were as follows:
| | | | | | | | | | | | | | | | |
| | | Year Ended December 31, 2017 | | | Year Ended December 31, 2016 | |
| | | | |
| | | Shares | | | Amount | | | Shares | | | Amount | |
| |
Non-Service Shares | | | | | | | | | | | | | | | | |
Sold | | | 393,813 | | | $ | 20,493,018 | | | | 575,681 | | | $ | 28,663,769 | |
Dividends and/or distributions reinvested | | | 978,541 | | | | 49,680,512 | | | | 1,203,259 | | | | 55,939,521 | |
Redeemed | | | (1,761,563) | | | | (93,219,544) | | | | (1,577,136) | | | | (77,972,539) | |
| | | | |
Net increase (decrease) | | | (389,209) | | | $ | (23,046,014) | | | | 201,804 | | | $ | 6,630,751 | |
| | | | |
|
| |
Service Shares | | | | | | | | | | | | | | | | |
Sold | | | 127,462 | | | $ | 6,431,379 | | | | 1,273,302 | | | $ | 61,113,815 | |
Dividends and/or distributions reinvested | | | 573,029 | | | | 28,708,763 | | | | 640,546 | | | | 29,426,717 | |
Redeemed | | | (1,113,678) | | | | (58,394,030) | | | | (1,525,798) | | | | (75,064,649) | |
| | | | |
Net increase (decrease) | | | (413,187) | | | $ | (23,253,888) | | | | 388,050 | | | $ | 15,475,883 | |
| | | | |
7. Purchases and Sales of Securities
The aggregate cost of purchases and proceeds from sales of securities, other than short-term obligations and investments in IGMMF, for the reporting period were as follows:
| | | | | | | | |
| | | Purchases | | | Sales | |
| |
Investment securities | | $ | 215,608,894 | | | | $312,341,368 | |
8. Fees and Other Transactions with Affiliates
Management Fees. Under the investment advisory agreement, the Fund pays the Manager a management fee based on the daily net assets of the Fund at an annual rate as shown in the following table:
| | |
| Fee Schedule |
|
Up to $200 million | | 0.75% |
Next $200 million | | 0.72 |
Next $200 million | | 0.69 |
Next $200 million | | 0.66 |
Next $200 million | | 0.60 |
Over $1 billion | | 0.58 |
The Fund’s effective management fee for the reporting period was 0.70% of average annual net assets before any applicable waivers.
Sub-Adviser Fees. The Manager has retained the Sub-Adviser to provide the day-to-day portfolio management of the Fund. Under the Sub-Advisory Agreement, the Manager pays the Sub-Adviser an annual fee in monthly installments, equal to a percentage of the investment management fee collected by the Manager from the Fund, which shall be calculated after any investment management fee waivers. The fee paid to the Sub-Adviser is paid by the Manager, not by the Fund.
Transfer Agent Fees. OFI Global (the “Transfer Agent”) serves as the transfer and shareholder servicing agent for the Fund. The Fund pays the Transfer Agent a fee based on annual net assets. Fees incurred and average net assets for each class with respect to these services are detailed in the Statement
19 OPPENHEIMER CAPITAL APPRECIATION FUND/VA
NOTES TO FINANCIAL STATEMENTS Continued
8. Fees and Other Transactions with Affiliates (Continued)
of Operations and Financial Highlights, respectively.
Sub-Transfer Agent Fees. The Transfer Agent has retained Shareholder Services, Inc., a wholly-owned subsidiary of OFI (the “Sub-Transfer Agent”), to provide the day-to-day transfer agent and shareholder servicing of the Fund. Under the Sub-Transfer Agency Agreement, the Transfer Agent pays the Sub-Transfer Agent an annual fee in monthly installments, equal to a percentage of the transfer agent fee collected by the Transfer Agent from the Fund, which shall be calculated after any applicable fee waivers. The fee paid to the Sub-Transfer Agent is paid by the Transfer Agent, not by the Fund.
Trustees’ Compensation. The Fund’s Board of Trustees (“Board”) has adopted a compensation deferral plan for Independent Trustees that enables Trustees to elect to defer receipt of all or a portion of the annual compensation they are entitled to receive from the Fund. For purposes of determining the amount owed to the Trustees under the plan, deferred amounts are treated as though equal dollar amounts had been invested in shares of the Fund or in other Oppenheimer funds selected by the Trustees. The Fund purchases shares of the funds selected for deferral by the Trustees in amounts equal to his or her deemed investment, resulting in a Fund asset equal to the deferred compensation liability. Such assets are included as a component of “Other” within the asset section of the Statement of Assets and Liabilities. Deferral of Trustees’ fees under the plan will not affect the net assets of the Fund and will not materially affect the Fund’s assets, liabilities or net investment income per share. Amounts will be deferred until distributed in accordance with the compensation deferral plan.
Distribution and Service Plan for Service Shares. The Fund has adopted a Distribution and Service Plan (the “Plan”) pursuant to Rule 12b-1 under the 1940 Act for Service shares to pay OppenheimerFunds Distributor, Inc. (the “Distributor”), for distribution related services, personal service and account maintenance for the Fund’s Service shares. Under the Plan, payments are made periodically at an annual rate of 0.25% of the daily net assets of Service shares of the Fund. The Distributor currently uses all of those fees to compensate sponsors of the insurance product that offers Fund shares, for providing personal service and maintenance of accounts of their variable contract owners that hold Service shares. These fees are paid out of the Fund’s assets on an on-going basis and increase operating expenses of the Service shares, which results in lower performance compared to the Fund’s shares that are not subject to a service fee. Fees incurred by the Fund under the Plan are detailed in the Statement of Operations.
Waivers and Reimbursements of Expenses. The Manager has contractually agreed to limit the Fund’s expenses after payments, waivers and/or reimbursements and reduction to custodian expenses, excluding any applicable dividend expense, taxes, interest and fees from borrowing, any subsidiary expenses, Acquired Fund Fees and Expenses, brokerage commissions, unusual and infrequent expenses and certain other Fund expenses; so that those expenses, as percentages of daily net assets, will not exceed the annual rate of 0.80% for Non-Service shares and 1.05% for Service shares.
During the reporting period, the Manager waived fees and/or reimbursed the Fund as follows:
| | | | |
Non-Service shares | | | $112,801 | |
Service shares | | | 65,648 | |
This fee waiver and/or expense reimbursement may not be amended or withdrawn for one year from the date of the Fund’s prospectus, unless approved by the Board.
The Manager will waive fees and/or reimburse Fund expenses in an amount equal to the indirect management fees incurred through the Fund’s investment in IGMMF. During the reporting period, the Manager waived fees and/or reimbursed the Fund $7,075 for IGMMF management fees. This fee waiver and/or expense reimbursement may not be amended or withdrawn for one year from the date of the Fund’s prospectus, unless approved by the Board.
9. Borrowings and Other Financing
Joint Credit Facility. A number of mutual funds managed by the Manager participate in a $1.875 billion revolving credit facility (the “Facility”) intended to provide short-term financing, if necessary, subject to certain restrictions in connection with atypical redemption activity. Expenses and fees related to the Facility are paid by the participating funds and are disclosed separately or as other expenses on the Statement of Operations. The Fund did not utilize the Facility during the reporting period.
20 OPPENHEIMER CAPITAL APPRECIATION FUND/VA
REPORT OF INDEPENDENT REGISTERED PUBLIC ACCOUNTING FIRM
To the Shareholders and Board of Trustees
Oppenheimer Variable Account Funds:
Opinion on the Financial Statements
We have audited the accompanying statement of assets and liabilities of Oppenheimer Capital Appreciation Fund/VA, a separate series of Oppenheimer Variable Account Funds, (the “Fund”), including the statement of investments, as of December 31, 2017, the related statement of operations for the year then ended, the statements of changes in net assets for each of the years in the two year period then ended, and the related notes (collectively, the “financial statements”) and the financial highlights for each of the years in the five year period then ended. In our opinion, the financial statements and financial highlights present fairly, in all material respects, the financial position of the Fund as of December 31, 2017, the results of its operations for the year then ended, the changes in its net assets for each of the years in the two year period then ended, and the financial highlights for each of the years in the five year period then ended, in conformity with U.S. generally accepted accounting principles.
Basis for Opinion
These financial statements and financial highlights are the responsibility of the Fund’s management. Our responsibility is to express an opinion on these financial statements and financial highlights based on our audits. We are a public accounting firm registered with the Public Company Accounting Oversight Board (United States) (“PCAOB”) and are required to be independent with respect to the Fund in accordance with the U.S. federal securities laws and the applicable rules and regulations of the Securities and Exchange Commission and the PCAOB.
We conducted our audits in accordance with the standards of the PCAOB. Those standards require that we plan and perform the audit to obtain reasonable assurance about whether the financial statements and financial highlights are free of material misstatement, whether due to error or fraud. Our audits included performing procedures to assess the risks of material misstatement of the financial statements and financial highlights, whether due to error or fraud, and performing procedures that respond to those risks. Such procedures included examining, on a test basis, evidence regarding the amounts and disclosures in the financial statements and financial highlights. Such procedures also included confirmation of securities owned as of December 31, 2017, by correspondence with the custodian. Our audits also included evaluating the accounting principles used and significant estimates made by management, as well as evaluating the overall presentation of the financial statements and financial highlights. We believe that our audits provide a reasonable basis for our opinion.
KPMG LLP
We have not been able to determine the specific year that we began serving as the auditor of one or more Oppenheimer Funds investment companies, however we are aware that we have served as the auditor of one or more Oppenheimer Funds investment companies since at least 1969.
Denver, Colorado
February 13, 2018
21 OPPENHEIMER CAPITAL APPRECIATION FUND/VA
FEDERAL INCOME TAX INFORMATION Unaudited
In early 2018, if applicable, shareholders of record received information regarding all dividends and distributions paid to them by the Fund during calendar year 2017.
Capital gain distributions of $5.0057 per share were paid to Non-Service and Service shareholders, respectively, on June 20, 2017. Whether received in stock or in cash, the capital gain distribution should be treated by shareholders as a gain from the sale of the capital assets held for more than one year (long-term capital gains).
Dividends, if any, paid by the Fund during the reporting period which are not designated as capital gain distributions should be multiplied by the maximum amount allowable but not less than 27.26% to arrive at the amount eligible for the corporate dividend-received deduction.
The foregoing information is presented to assist shareholders in reporting distributions received from the Fund to the Internal Revenue Service. Because of the complexity of the federal regulations which may affect your individual tax return and the many variations in state and local tax regulations, we recommend that you consult your tax advisor for specific guidance.
22 OPPENHEIMER CAPITAL APPRECIATION FUND/VA
BOARD APPROVAL OF THE FUND’S INVESTMENT ADVISORY AND SUB-ADVISORY AGREEMENTS Unaudited
The Fund has entered into an investment advisory agreement with OFI Global Asset Management, Inc. (“OFI Global” or the “Adviser”), a wholly-owned subsidiary of OppenheimerFunds, Inc. (“OFI” or the “Sub-Adviser”) (“OFI Global” and “OFI” together, the “Managers”) and OFI Global has entered into a sub-advisory agreement with OFI whereby OFI provides investment sub-advisory services to the Fund (collectively, the “Agreements”).Each year, the Board of Trustees (the “Board”), including a majority of the independent Trustees, is required to determine whether to approve the terms of the Agreements and the renewal thereof. The Investment Company Act of 1940, as amended, requires that the Board request and evaluate, and that the Managers provide, such information as may be reasonably necessary to evaluate the terms of the Agreements. The Board employs an independent consultant to prepare a report that provides information, including comparative information that the Board requests for that purpose. In addition to in-person meetings focused on this evaluation, the Board receives information throughout the year regarding Fund services, fees, expenses and performance.
The Managers and the independent consultant provided information to the Board on the following factors: (i) the nature, quality and extent of the Managers’ services, (ii) the comparative investment performance of the Fund and the Managers, (iii) the fees and expenses of the Fund, including comparative fee and expense information, (iv) the profitability of the Managers and their affiliates, including an analysis of the cost of providing services, (v) whether economies of scale are realized as the Fund grows and whether fee levels reflect these economies of scale for Fund investors and (vi) other benefits to the Managers from their relationship with the Fund. The Board was aware that there are alternatives to retaining the Managers.
Outlined below is a summary of the principal information considered by the Board as well as the Board’s conclusions.
Nature, Quality and Extent of Services. The Board considered information about the nature, quality and extent of the services provided to the Fund and information regarding the Managers’ key personnel who provide such services. The Managers’ duties include providing the Fund with the services of the portfolio manager and the Sub-Adviser’s investment team, who provide research, analysis and other advisory services in regard to the Fund’s investments; and securities trading services. OFI Global is responsible for oversight of third-party service providers; monitoring compliance with applicable Fund policies and procedures and adherence to the Fund’s investment restrictions; risk management; and oversight of the Sub-Adviser. OFI Global is also responsible for providing certain administrative services to the Fund. Those services include providing and supervising all administrative and clerical personnel who are necessary in order to provide effective corporate administration for the Fund; compiling and maintaining records with respect to the Fund’s operations; preparing and filing reports required by the U.S. Securities and Exchange Commission; preparing periodic reports regarding the operations of the Fund for its shareholders; preparing proxy materials for shareholder meetings; and preparing the registration statements required by federal and state securities laws for the sale of the Fund’s shares. OFI Global also provides the Fund with office space, facilities and equipment.
The Board also considered the quality of the services provided and the quality of the Managers’ resources that are available to the Fund. The Board took account of the fact that the Sub-Adviser has over fifty years of experience as an investment adviser and that its assets under management rank it among the top mutual fund managers in the United States. The Board evaluated the Managers’ advisory, administrative, accounting, legal, compliance and risk management services, among other services, and information the Board has received regarding the experience and professional qualifications of the Managers’ key personnel and the size and functions of their staff. In its evaluation of the quality of the portfolio management services provided, the Board considered the experience of Paul Larson, the portfolio manager for the Fund, and the Sub-Adviser’s investment team and analysts. The Board members also considered the totality of their experiences with the Managers as directors or trustees of the Fund and other funds advised by the Managers. The Board considered information regarding the quality of services provided by affiliates of the Managers, which the Board members have become knowledgeable about through their experiences with the Managers and in connection with the review or renewal of the Fund’s service agreements or service providers. The Board concluded, in light of the Managers’ experience, reputation, personnel, operations and resources that the Fund benefits from the services provided under the Agreements.
Investment Performance of the Managers and the Fund. Throughout the year, the Managers provided information on the investment performance of the Fund, the Adviser and the Sub-Adviser, including comparative performance information. The Board also reviewed information, prepared by the Managers and by the independent consultant, comparing the Fund’s historical performance to relevant market indices and to the performance of other large growth category funds underlying variable insurance products. The Board noted that the Fund underperformed its performance category median during all periods. The Board also considered, however, that Paul Larson took over sole portfolio management responsibilities in October 2016. The Board noted that the Fund was repositioned to an “all-weather orientation” from a growth orientation and that the transition was not completed until December 31, 2016.
Fees and Expenses of the Fund. The Board reviewed the fees paid to the Adviser and the other expenses borne by the Fund. The Board noted that the Adviser, not the Fund, pays the Sub-Adviser’s fee under the sub-advisory agreement. The independent consultant provided comparative data in regard to the fees and expenses of the Fund and other large growth funds underlying variable insurance products. In reviewing the fees and expenses charged to the VA funds, the Board considered the Adviser’s assertion that, because there is much greater disparity in the fees and services that may be provided by a manager to a VA fund as opposed to a retail fund, when comparing the expenses of the various VA funds to those of retail funds, it is most appropriate to focus on total expenses (rather than on the management fees). Accordingly, while the Board reviewed and considered all expenses, it focused on total expenses. The Board considered that the Fund’s total expenses were higher than its peer group median and its category median and that its contractual management fee was in line with its peer group median and category median. The Manager has contractually agreed to limit the Fund’s total annual operating expenses so that those expenses, as percentages of daily net assets, will not exceed the annual rate of 0.80% for Non-Service Shares and 1.05% for Service Shares. This waiver and/or reimbursement may not be amended or withdrawn for one year from the date of the Fund’s prospectus, unless approved by the Board.
Economies of Scale and Profits Realized by the Managers. The Board considered information regarding the Managers’ costs in serving as the Fund’s investment adviser and sub-adviser, including the costs associated with the personnel and systems necessary to manage the Fund, and information regarding the Managers’ profitability from their relationship with the Fund. The Board also considered that the Managers must be able to pay and retain experienced professional personnel at competitive rates to provide quality services to the Fund. The Board reviewed whether the
23 OPPENHEIMER CAPITAL APPRECIATION FUND/VA
BOARD APPROVAL OF THE FUND’S INVESTMENT ADVISORY AND SUB-ADVISORY AGREEMENTS Unaudited / Continued
Managers may realize economies of scale in managing and supporting the Fund. The Board noted that the Fund currently has management fee breakpoints, which are intended to share with Fund shareholders economies of scale that may exist as the Fund’s assets grow.
Other Benefits to the Managers. In addition to considering the profits realized by the Managers, the Board considered information that was provided regarding the direct and indirect benefits the Managers receive as a result of their relationship with the Fund, including compensation paid to the Managers’ affiliates and research provided to the Adviser in connection with permissible brokerage arrangements (soft dollar arrangements).
Conclusions. These factors were also considered by the independent Trustees meeting separately from the full Board, assisted by experienced counsel to the Fund and to the independent Trustees. Fund counsel and the independent Trustees’ counsel are independent of the Managers within the meaning and intent of the Securities and Exchange Commission rules.
Based on its review of the information it received and its evaluations described above, the Board, including a majority of the independent Trustees, decided to continue the Agreements through August 31, 2018. In arriving at its decision, the Board did not identify any factor or factors as being more important than others, but considered all of the above information, and considered the terms and conditions of the Agreements, including the management fees, in light of all the surrounding circumstances.
24 OPPENHEIMER CAPITAL APPRECIATION FUND/VA
PORTFOLIO PROXY VOTING POLICIES AND GUIDELINES; UPDATES TO STATEMENTS OF INVESTMENTS Unaudited
The Fund has adopted Portfolio Proxy Voting Policies and Guidelines under which the Fund votes proxies relating to securities (“portfolio proxies”) held by the Fund. A description of the Fund’s Portfolio Proxy Voting Policies and Guidelines is available (i) without charge, upon request, by calling the Fund toll-free at 1.800.CALL OPP (225.5677), (ii) on the Fund’s website at www.oppenheimerfunds.com, and (iii) on the SEC’s website at www.sec.gov. In addition, the Fund is required to file Form N-PX, with its complete proxy voting record for the 12 months ended June 30th, no later than August 31st of each year. The Fund’s voting record is available (i) without charge, upon request, by calling the Fund toll-free at 1.800.CALL OPP (225.5677), and (ii) in the Form N-PX filing on the SEC’s website at www.sec.gov.
The Fund files its complete schedule of portfolio holdings with the SEC for the first quarter and the third quarter of each fiscal year on Form N-Q. The Fund’s Form N-Q filings are available on the SEC’s website at www.sec.gov. Those forms may be reviewed and copied at the SEC’s Public Reference Room in Washington, D.C. Information on the operation of the Public Reference Room may be obtained by calling 1-800-SEC-0330.
25 OPPENHEIMER CAPITAL APPRECIATION FUND/VA
TRUSTEES AND OFFICERS Unaudited
| | |
| Name, Position(s) Held with the Fund, Length of Service, Year of Birth | | Principal Occupation(s) During the Past 5 Years; Other Trusteeships/Directorships Held; Number of Portfolios in the Fund Complex Currently Overseen |
| |
| INDEPENDENT TRUSTEES | | The address of each Trustee in the chart below is 6803 S. Tucson Way, Centennial, Colorado 80112-3924. Each Trustee serves for an indefinite term, or until his or her resignation, retirement, death or removal. |
| |
Robert J. Malone, Chairman of the Board of Trustees (since 2016), Trustee (since 2002) Year of Birth: 1944 | | Chairman - Colorado Market of MidFirst Bank (since January 2015); Chairman of the Board (2012-2016) and Director (August 2005-January 2016) of Jones International University (educational organization); Trustee of the Gallagher Family Foundation (non-profit organization) (2000-2016); Chairman, Chief Executive Officer and Director of Steele Street Bank Trust (commercial banking) (August 2003-January 2015); Director of Opera Colorado Foundation (non-profit organization) (2008-2012); Director of Colorado UpLIFT (charitable organization) (1986-2010); Director of Jones Knowledge, Inc. (2006-2010); Former Chairman of U.S. Bank-Colorado (subsidiary of U.S. Bancorp and formerly Colorado National Bank) (July 1996-April 1999); Director of Commercial Assets, Inc. (real estate investment trust) (1993-2000); Director of U.S. Exploration, Inc. (oil and gas exploration) (1997-February 2004); Chairman of the Board (1991-1994) and Trustee (1985-1994) of Regis University; and Chairman of the Board (1990-1991) and Member (1984-1999) of Young Presidents Organization. Oversees 54 portfolios in the OppenheimerFunds complex. Mr. Malone has served on the Boards of certain Oppenheimer funds since 2002, during which time he has become familiar with the Fund’s (and other Oppenheimer funds’) financial, accounting, regulatory and investment matters and has contributed to the Boards’ deliberations. |
| |
Andrew J. Donohue, Trustee (since 2017) Year of Birth: 1950 | | Of Counsel, Shearman & Sterling LLP (since September 2017); Chief of Staff of the U.S. Securities and Exchange Commission (regulator) (June 2015-February 2017); Managing Director and Investment Company General Counsel of Goldman Sachs (investment bank) (November 2012-May 2015); Partner at Morgan Lewis & Bockius, LLP (law firm) (March 2011-October 2012); Director of the Division of Investment Management of U.S. Securities and Exchange Commission (regulator) (May 2006-November 2010); Global General Counsel of Merrill Lynch Investment Managers (investment firm) (May 2003-May 2006); General Counsel (October 1991-November 2001) and Executive Vice President (January 1993-November 2001) of OppenheimerFunds, Inc. (investment firm) (June 1991-November 2001). Oversees 54 portfolios in the OppenheimerFunds complex. Mr. Donohue has served on the Boards of certain Oppenheimer funds since 2017, during which time he has become familiar with the Fund’s (and other Oppenheimer funds’) financial, accounting, regulatory and investment matters and has contributed to the Boards’ deliberations |
| |
Jon S. Fossel, Trustee (since 1990) Year of Birth: 1942 | | Chairman of the Board of Jack Creek Preserve Foundation (non-profit organization) (2005-2015); Director of Jack Creek Preserve Foundation (non-profit organization) (since March 2005); Chairman of the Board (2006-December 2011) and Director (June 2002-December 2011) of UNUMProvident (insurance company); Director of Northwestern Energy Corp. (public utility corporation) (November 2004-December 2009); Director of P.R. Pharmaceuticals (October 1999-October 2003); Director of Rocky Mountain Elk Foundation (non-profit organization) (February 1998-February 2003 and February 2005-February 2007); Chairman and Director (until October 1996) and President and Chief Executive Officer (until October 1995) of the Sub-Adviser; President, Chief Executive Officer and Director of the following: Oppenheimer Acquisition Corp. (“OAC”) (parent holding company of the Sub- Adviser), Shareholders Services, Inc. and Shareholder Financial Services, Inc. (until October 1995). Oversees 54 portfolios in the OppenheimerFunds complex. Mr. Fossel has served on the Boards of certain Oppenheimer funds since 1990, during which time he has become familiar with the Fund’s (and other Oppenheimer funds’) financial, accounting, regulatory and investment matters and has contributed to the Boards’ deliberations. |
| |
Richard F. Grabish, Trustee (since 2012) Year of Birth: 1948 | | Formerly Senior Vice President and Assistant Director of Sales and Marketing (March 1997-December 2007), Director (March 1987-December 2007) and Manager of Private Client Services (June 1985-June 2005) of A.G. Edwards & Sons, Inc. (broker/dealer and investment firm); Chairman and Chief Executive Officer of A.G. Edwards Trust Company, FSB (March 2001-December 2007); President and Vice Chairman of A.G. Edwards Trust Company, FSB (investment adviser) (April 1987-March 2001); President of A.G. Edwards Trust Company, FSB (investment adviser) (June 2005-December 2007). Oversees 54 portfolios in the OppenheimerFunds complex. Mr. Grabish has served on the Boards of certain Oppenheimer funds since 2001, during which time he has become familiar with the Fund’s (and other Oppenheimer funds’) financial, accounting, regulatory and investment matters and has contributed to the Boards’ deliberations. |
| |
Beverly L. Hamilton, Trustee (since 2002) Year of Birth: 1946 | | Trustee of Monterey Institute for International Studies (educational organization) (2000-2014); Board Member of Middlebury College (educational organization) (December 2005-June 2011); Director (1991-2016), Vice Chairman of the Board (2006- 2009) and Chairman of the Board (2010-2013) of American Funds’ Emerging Markets Growth Fund, Inc. (mutual fund); Director of The California Endowment (philanthropic organization) (April 2002-April 2008); Director (February 2002-2005) and Chairman of Trustees (2006-2007) of the Community Hospital of Monterey Peninsula; President of ARCO Investment Management Company (February 1991-April 2000); Member of the investment committees of The Rockefeller Foundation (2001-2006) and The University of Michigan (since 2000); Advisor at Credit Suisse First Boston’s Sprout venture capital unit (venture capital fund) (1994-January 2005); Trustee of MassMutual Institutional Funds (investment company) (1996-June 2004); Trustee of MML Series Investment Fund (investment company) (April 1989-June 2004); Member of the investment committee of Hartford Hospital (2000-2003); and Advisor to Unilever (Holland) pension fund (2000-2003). Oversees 54 portfolios in the OppenheimerFunds complex. Ms. Hamilton has served on the Boards of certain Oppenheimer funds since 2002, during which time she has become familiar with the Fund’s (and other Oppenheimer funds’) financial, accounting, regulatory and investment matters and has contributed to the Boards’ deliberations. |
| |
Victoria J. Herget, Trustee (since 2012) Year of Birth:1951 | | Board Chair (2008-2015) and Director (2004-Present), United Educators (insurance company); Trustee (since 2000) and Chair (since 2010), Newberry Library (independent research library); Trustee, Mather LifeWays (senior living organization) (since 2001); Independent Director of the First American Funds (mutual fund family) (2003-2011); former Managing Director (1993-2001), Principal (1985-1993), Vice President (1978-1985) and Assistant Vice President (1973-1978) of Zurich Scudder Investments (investment adviser) (and its predecessor firms); Trustee (1992-2007), Chair of the Board of Trustees (1999-2007), Investment Committee Chair (1994-1999) and Investment Committee member (2007-2010) of Wellesley College; Trustee, BoardSource (non-profit organization) (2006-2009) and Chicago City Day School (K-8 School) (1994-2005). Oversees 54 portfolios in the OppenheimerFunds complex. Ms. Herget has served on the Boards of certain Oppenheimer funds since 2012, during which time she has become familiar with the Fund’s (and other Oppenheimer funds’) financial, accounting, regulatory and investment matters and has contributed to the Boards’ deliberations. |
26 OPPENHEIMER CAPITAL APPRECIATION FUND/VA
| | |
F. William Marshall, Jr., Trustee (since 2000) Year of Birth: 1942 | | Trustee Emeritus of Worcester Polytech Institute (WPI) (private university) (since 2009); Trustee of MassMutual Select Funds (formerly MassMutual Institutional Funds) (investment company) (1996-2015), MML Series Investment Fund (investment company) (1996-2015) and Mass Mutual Premier Funds (investment company) (January 2012-December 2015); President and Treasurer of the SIS Charitable Fund (private charitable fund) (January 1999-March 2011); Former Trustee of WPI (1985- 2008); Former Chairman of the Board (2004-2006) and Former Chairman of the Investment Committee of WPI (1994-2008); Chairman of SIS Family Bank, F.S.B. (formerly SIS Bank) (commercial bank) (January 1999-July 1999); Executive Vice President of Peoples Heritage Financial Group, Inc. (commercial bank) (January 1999-July 1999); and Former President and Chief Executive Officer of SIS Bancorp. (1993-1999). Oversees 54 portfolios in the OppenheimerFunds complex. Mr. Marshall has served on the Boards of certain Oppenheimer funds since 2000, during which time he has become familiar with the Fund’s (and other Oppenheimer funds’) financial, accounting, regulatory and investment matters and has contributed to the Boards’ deliberations. |
| |
Karen L. Stuckey, Trustee (since 2012) Year of Birth: 1953 | | Member (since May 2015) of Desert Mountain Community Foundation Advisory Board (non-profit organization); Partner (1990-2012) of PricewaterhouseCoopers LLP (professional services firm) (held various positions 1975-1990); Trustee (1992- 2006); member of Executive, Nominating and Audit Committees and Chair of Finance Committee (1992-2006), and Emeritus Trustee (since 2006) of Lehigh University; and member, Women’s Investment Management Forum (professional organization) since inception. Oversees 54 portfolios in the OppenheimerFunds complex. Ms. Stuckey has served on the Boards of certain Oppenheimer funds since 2012, during which time she has become familiar with the Fund’s (and other Oppenheimer funds’) financial, accounting, regulatory and investment matters and has contributed to the Boards’ deliberations. |
| |
James D. Vaughn, Trustee (since 2012) Year of Birth:1945 | | Retired; former managing partner (1994-2001) of Denver office of Deloitte & Touche LLP, (held various positions 1969- 1993); Trustee and Chairman of the Audit Committee of Schroder Funds (2003-2012); Board member and Chairman of Audit Committee of AMG National Trust Bank (since 2005); Trustee and Investment Committee member, University of South Dakota Foundation (since 1996); Board member, Audit Committee Member and past Board Chair, Junior Achievement (since 1993); former Board member, Mile High United Way, Boys and Girls Clubs, Boy Scouts, Colorado Business Committee for the Arts, Economic Club of Colorado and Metro Denver Network. Oversees 54 portfolios in the OppenheimerFunds complex. Mr. Vaughn has served on the Boards of certain Oppenheimer funds since 2012, during which time he has become familiar with the Fund’s (and other Oppenheimer funds’) financial, accounting, regulatory and investment matters and has contributed to the Boards’ deliberations. |
| | |
| INTERESTED TRUSTEE AND OFFICER | | Mr. Steinmetz is an “Interested Trustee” because he is affiliated with the Manager and the Sub-Adviser by virtue of his positions as Chairman and director of the Sub-Adviser and officer and director of the Manager. Both as a Trustee and as an officer, Mr. Steinmetz serves for an indefinite term, or until his resignation, retirement, death or removal. Mr. Steinmetz’s address is 225 Liberty Street, New York, New York 10281-1008. |
| |
Arthur P. Steinmetz, Trustee (since 2015), President and Principal Executive Officer (since 2014) Year of Birth: 1958 | | Chairman of the Sub-Adviser (since January 2015); CEO and Chairman of the Manager (since July 2014), President of the Manager (since May 2013), a Director of the Manager (since January 2013), Director of the Sub-Adviser (since July 2014), President, Management Director and CEO of Oppenheimer Acquisition Corp. (the Sub-Adviser’s parent holding company) (since July 2014), and President and Director of OFI SteelPath, Inc. (since January 2013). Chief Investment Officer of the OppenheimerFunds advisory entities from (January 2013-December 2013); Executive Vice President of the Manager (January 2013-May 2013); Chief Investment Officer of the Sub-Adviser (October 2010-December 2012); Chief Investment Officer, Fixed- Income, of the Sub-Adviser (April 2009-October 2010); Executive Vice President of the Sub-Adviser (October 2009-December 2012); Director of Fixed Income of the Sub-Adviser (January 2009-April 2009); and a Senior Vice President of the Sub-Adviser (March 1993-September 2009). An officer of 111 portfolios in the OppenheimerFunds complex. |
| | |
| OTHER OFFICERS OF THE FUND | | The addresses of the Officers in the chart below are as follows: for Mr. Larson, Mss. Lo Bessette, Foxson and Picciotto, 225 Liberty Street, New York, New York 10281-1008, for Mr. Petersen, 6803 S. Tucson Way, Centennial, Colorado 80112-3924. Each Officer serves for an indefinite term or until his or her resignation, retirement, death or removal |
| |
Paul Larson, Vice President (since 2016) Year of Birth: 1971 | | Vice President of the Sub-Adviser and Portfolio Manager of the Main Street Team (since January 2013). Prior to joining the Sub-Adviser, he was a portfolio manager and Chief Equity Strategist at Morningstar. He was previously an analyst at Morningstar covering the energy sector and oversaw the firm’s natural resources analysts. Prior to joining Morningstar in 2002, Mr. Larson was an analyst with The Motley Fool. A portfolio manager and officer of other portfolios in the OppenheimerFunds complex. |
| |
Cynthia Lo Bessette, Secretary and Chief Legal Officer (since 2016) Year of Birth: 1969 | | Executive Vice President, General Counsel and Secretary of the Manager (since February 2016); Senior Vice President and Deputy General Counsel of the Manager (March 2015-February 2016); Chief Legal Officer of the Sub-Adviser and the Distributor (since February 2016); Vice President, General Counsel and Secretary of Oppenheimer Acquisition Corp. (since February 2016); General Counsel of OFI SteelPath, Inc., OFI Advisors, LLC and Index Management Solutions, LLC (since February 2016); Chief Legal Officer of OFI Global Institutional, Inc., HarbourView Asset Management Corporation, OFI Global Trust Company, Oppenheimer Real Asset Management, Inc., OFI Private Investments Inc., Shareholder Services, Inc. and Trinity Investment Management Corporation (since February 2016); Corporate Counsel (February 2012-March 2015) and Deputy Chief Legal Officer (April 2013-March 2015) of Jennison Associates LLC; Assistant General Counsel (April 2008-September 2009) and Deputy General Counsel (October 2009-February 2012) of Lord Abbett & Co. LLC. An officer of 111 portfolios in the OppenheimerFunds complex. |
| |
Jennifer Foxson, Vice President and Chief Business Officer (since 2014) Year of Birth: 1969 | | Senior Vice President of OppenheimerFunds Distributor, Inc. (since June 2014); Vice President of OppenheimerFunds Distributor, Inc. (April 2006-June 2014); Vice President of the Sub-Adviser (January 1998-March 2006); Assistant Vice President of the Sub-Adviser (October 1991-December 1998). An officer of 111 portfolios in the OppenheimerFunds complex. |
27 OPPENHEIMER CAPITAL APPRECIATION FUND/VA
TRUSTEES AND OFFICERS Unaudited / Continued
| | |
Mary Ann Picciotto, Chief Compliance Officer and Chief Anti-Money Laundering Officer (since 2014) Year of Birth: 1973 | | Senior Vice President and Chief Compliance Officer of the Manager (since March 2014); Chief Compliance Officer of the Sub- Adviser, OFI SteelPath, Inc., OFI Global Trust Company, OFI Global Institutional, Inc., Oppenheimer Real Asset Management, Inc., OFI Private Investments, Inc., Harborview Asset Management Corporation, Trinity Investment Management Corporation, and Shareholder Services, Inc. (since March 2014); Managing Director of Morgan Stanley Investment Management Inc. and certain of its various affiliated entities; Chief Compliance Officer of various Morgan Stanley Funds (May 2010-January 2014); Chief Compliance Officer of Morgan Stanley Investment Management Inc. (April 2007-January 2014). An officer of 111 portfolios in the OppenheimerFunds complex. |
| |
Brian S. Petersen, Treasurer and Principal Financial & Accounting Officer (since 2016) Year of Birth: 1970 | | Senior Vice President of the Manager (since January 2017); Vice President of the Manager (January 2013-January 2017); Vice President of the Sub-Adviser (February 2007-December 2012); Assistant Vice President of the Sub-Adviser (August 2002- 2007). An officer of 111 portfolios in the OppenheimerFunds complex. |
The Fund’s Statement of Additional Information contains additional information about the Fund’s Trustees and Officers and is available without charge, upon request, by calling 1.800. 988.8287.
28 OPPENHEIMER CAPITAL APPRECIATION FUND/VA
THIS PAGE INTENTIONALLY LEFT BLANK.
29 OPPENHEIMER CAPITAL APPRECIATION FUND/VA
THIS PAGE INTENTIONALLY LEFT BLANK.
30 OPPENHEIMER CAPITAL APPRECIATION FUND/VA
THIS PAGE INTENTIONALLY LEFT BLANK.
31 OPPENHEIMER CAPITAL APPRECIATION FUND/VA
OPPENHEIMER CAPITAL APPRECIATION FUND/VA
A Series of Oppenheimer Variable Account Funds
| | |
| Manager | | OFI Global Asset Management, Inc. |
| |
| Sub-Adviser | | OppenheimerFunds, Inc. |
| |
| Distributor | | OppenheimerFunds Distributor, Inc. |
| |
Transfer and Shareholder Servicing Agent | | OFI Global Asset Management, Inc. |
| |
| Sub-Transfer Agent | | Shareholder Services, Inc. DBA OppenheimerFunds Services |
| |
| Independent Registered Public Accounting Firm | | KPMG LLP |
| |
| Legal Counsel | | Ropes & Gray LLP |
| |
| | Before investing in any of the Oppenheimer funds, investors should carefully consider a fund’s investment objectives, risks, charges and expenses. Fund prospectuses and summary prospectuses contain this and other information about the funds, and may be obtained by asking your financial advisor, visiting oppenheimerfunds.com or calling us at 1.800.988.8287. Read prospectuses and summary prospectuses carefully before investing. |
| |
| | © 2018 OppenheimerFunds, Inc. All rights reserved. Oppenheimer funds are distributed by OppenheimerFunds Distributor, Inc. |

| | | | |
| | 
| | |
| | |
| | | December 31, 2017 | | |
| | Oppenheimer | | |
| | Total Return Bond Fund/VA* | | Annual Report |
| | A Series of Oppenheimer Variable Account Funds | | |
| | | |
| | ANNUAL REPORT | | |
| | |
| | Listing of Top Holdings | | |
| | |
| | Fund Performance Discussion | | |
| | |
| | Financial Statements | | |
| |
| | *Prior to 4/28/17, the Fund’s name was Oppenheimer Core Bond Fund/VA. |
PORTFOLIO MANAGERS: Krishna Memani and Peter A. Strzalkowski, CFA
AVERAGE ANNUAL TOTAL RETURNS FOR THE PERIODS ENDED 12/31/17
| | | | | | | | | | | | | | | | |
| | | Inception
Date | | | 1-Year | | | 5-Year | | | 10-Year | |
Non-Service Shares | | | 4/3/85 | | | | 4.59% | | | | 3.16% | | | | 0.38% | |
Service Shares | | | 5/1/02 | | | | 4.38 | | | | 2.90 | | | | 0.14 | |
Bloomberg Barclays Credit Index | | | | | | | 6.18 | | | | 3.24 | | | | 5.42 | |
Bloomberg Barclays U.S. Aggregate Bond Index | | | | | | | 3.54 | | | | 2.10 | | | | 4.01 | |
Citigroup Broad Investment Grade Bond Index | | | | | | | 3.60 | | | | 2.09 | | | | 4.07 | |
Performance data quoted represents past performance, which does not guarantee future results. The investment return and principal value of an investment in the Fund will fluctuate so that an investor’s shares, when redeemed, may be worth more or less than their original cost. Current performance may be lower or higher than the performance quoted. For performance data current to the most recent month end, call us at 1.800.988.8287. The Fund’s total returns should not be expected to be the same as the returns of other funds, whether or not both funds have the same portfolio managers and/or similar names. The Fund’s total returns include changes in share price and reinvested distributions but do not include the charges associated with the separate account products that offer this Fund. Such performance would have been lower if such charges were taken into account. Returns for periods of less than one year are cumulative and not annualized. See Fund prospectuses and summary prospectuses for more information on share classes and sales charges.
TOP HOLDINGS AND ALLOCATIONS
| | | | |
PORTFOLIO ALLOCATION | | | | |
Mortgage-Backed Obligations | | | | |
Government Agency | | | 30.9% | |
Non-Agency | | | 11.8 | |
Corporate Bonds and Notes | | | 36.9 | |
Asset-Backed Securities | | | 10.1 | |
Short-Term Notes | | | 8.0 | |
Investment Company | | | | |
Oppenheimer Institutional Government Money Market Fund | | | 1.5 | |
U.S. Government Obligations | | | 0.8 | |
Portfolio holdings and allocations are subject to change. Percentages are as of December 31, 2017 and are based on the total market value of investments. For more current Fund holdings, please visit oppenheimerfunds.com.
| | | | |
CORPORATE BONDS & NOTES - TOP TEN INDUSTRIES | |
Commercial Banks | | | 6.7% | |
Oil, Gas & Consumable Fuels | | | 3.7 | |
Capital Markets | | | 2.9 | |
Electric Utilities | | | 2.3 | |
Diversified Telecommunication Services | | | 2.3 | |
Automobiles | | | 1.8 | |
Chemicals | | | 1.7 | |
Food Products | | | 1.6 | |
Health Care Providers & Services | | | 1.5 | |
Beverages | | | 1.5 | |
Portfolio holdings and allocations are subject to change. Percentages are as of December 31, 2017, and are based on net assets.
2 OPPENHEIMER TOTAL RETURN BOND FUND/VA
Fund Performance Discussion
MARKET OVERVIEW
Markets continued their general risk-on mode throughout 2017, with equities climbing and credit spreads tightening in most sectors. During the period, U.S. Treasury yields climbed up from the summer lows, but remained around the levels that have prevailed over the past couple of years.
The U.S. economy outperformed expectations in the second half of 2017, with gross domestic product (GDP) growth exceeding the 2% trend growth rate witnessed so far during the expansion. As of the reporting period’s end, private consumption, the driving force of the U.S. economy in recent years, is growing at a stable rate. In addition, business fixed investment has gained momentum in recent months and headwinds from international trade have turned into tailwinds as the lagged effects from earlier U.S. dollar strength diminish. In fact, U.S. dollar weakness is now leading to increased global growth momentum at period end. Business and consumer confidence are at cyclical highs and the recent tax cut should lead to marginal additional spending in the coming two years, helping to sustain the current momentum. With the economy’s continued expansion, the Federal Reserve (“Fed”) is nearing its dual mandate of full employment and price stability. While inflation has surprised to the downside for a number of months recently, the Fed believes this to be temporary and continues down its prescribed course of gradual tightening. As communicated, the Fed began normalizing its balance sheet during the reporting period by discontinuing its interest reinvestment program and raised rates for a third time this calendar year in December. Despite these tightening measures, by many measures financial conditions eased in 2017.
As alluded to above, market performance was positive for most risk assets in 2017 as the S&P 500 Index increased 21.83% and the MSCI All Country World Index rose 23.97%. U.S. Treasuries (as represented by the Bloomberg Barclays U.S. Treasury Index) generated a positive total return of 3.54%. Credit outperformed U.S. Treasuries for the year, with the Bloomberg Barclays U.S. Credit Index rising 6.18%. Among credit sectors of the investment grade fixed income market, investment grade corporate bonds performed well. Commercial mortgage-backed securities (CMBS) and mortgage-backed securities (MBS) issued by U.S. agencies also posted positive returns, as did asset-backed securities (ABS).
FUND REVIEW
Against this backdrop, the Fund’s Non-Service shares produced a return of 4.59% during the reporting period. In comparison, the Fund outperformed the Bloomberg Barclays U.S. Aggregate Bond Index and the Citigroup Broad Investment Grade Bond Index, which returned 3.54% and 3.60%, respectively, during the reporting period. As mentioned earlier, credit performed well this reporting period, with the Bloomberg Barclays U.S. Credit Index gaining 6.18%. The Fund had its largest allocation to credit assets, but it underperformed the Bloomberg Barclays U.S. Credit Index, which is comprised 100% of credit assets.
Primarily contributing to the Fund’s relative performance versus the Bloomberg Barclays U.S. Aggregate Bond Index (the “Index”) was its underweight to U.S. Treasuries, its allocation to non-agency MBS and allocation to high yield credit. Primarily detracting from relative performance was the Fund’s overweight to asset-backed securities and security selection within agency MBS.
STRATEGY & OUTLOOK
We believe that macroeconomic fundamentals should continue to remain solid, with continued gains in wages and employment. Inflation may creep higher and potential fiscal stimulus could boost consumption at some point in the future. Likewise, we think the Fed is likely to hike rates at least two-to-three times in 2018 and we have been encouraged that the market has taken balance sheet normalization in stride.
The Fund remains neutral duration as near term inflation risks appear to be fully priced into yields and the rise in risk premium consistent with a relative sanguine economic outlook, in our view. We continue to maintain the Fund’s overweight to agency MBS relative to the Index. We believe the sector’s high quality and spread above Treasuries make it an attractive area to add incremental yield potential to the portfolio.
Demand for credit-related securities continues to be very strong. While corporate fundamentals appear stable, we do believe we currently reside in the fourth quarter of the credit cycle and that credit spreads do appear tight. As a result, we remain cautiously engaged in investment grade corporate credit, with the Fund also including a modest exposure to typically high Sharpe ratio BB-rated corporates.
Within structured products, we continue to avoid student loan and more esoteric ABS. We continue to favor auto and to some extent credit card ABS given their attractive fundamentals, carry and solid structures. We continue to have a smaller overweight to CMBS and remain up-in-structure as the issues within the retail sector give us pause at period end.
3 OPPENHEIMER TOTAL RETURN BOND FUND/VA
Investors should consider the Fund’s investment objective, risks, charges and expenses carefully before investing. The Fund’s prospectus and summary prospectus contain this and other information about the Fund, and may be obtained by asking your financial advisor or calling us at 1.800.988.8287. Read prospectuses and summary prospectuses carefully before investing.
Total returns include changes in share price and reinvestment of dividends and capital gains distributions in a hypothetical investment for the periods shown, but do not include the charges associated with the separate account products that offer this Fund.
The Fund’s investment strategy and focus can change over time. The mention of specific fund holdings does not constitute a recommendation by OppenheimerFunds, Inc. or its affiliates.
Shares of Oppenheimer funds are not deposits or obligations of any bank, are not guaranteed by any bank, are not insured by the FDIC or any other agency, and involve investment risks, including the possible loss of the principal amount invested.
Comparing the Fund’s Performance to the Market. The graphs that follow show the performance of a hypothetical $10,000 investment in each share class of the Fund held until December 31, 2017. Performance is measured over a ten-fiscal-year period for both Classes. Performance information does not reflect charges that apply to separate accounts investing in the Fund. If these charges were taken into account, performance would be lower. The graphs assume that all dividends and capital gains distributions were reinvested in additional shares.
The Fund’s performance is compared to the performance of the Bloomberg Barclays Credit Index, an index of non-convertible U.S. investment grade corporate bonds; the Bloomberg Barclays U.S. Aggregate Bond Index, an index of U.S. corporate and government bonds and the Citigroup Broad Investment Grade Bond Index, an index of institutionally traded U.S. Treasury Bonds, government-sponsored bonds, mortgage-backed securities and corporate securities. The indices are unmanaged and cannot be purchased directly by investors. While index comparisons may be useful to provide a benchmark for the Fund’s performance, it must be noted that the Fund’s investments are not limited to the investments comprising the indices. Index performance includes reinvestment of income, but does not reflect transaction costs, fees, expenses or taxes. Index performance is shown for illustrative purposes only as a benchmark for the Fund’s performance, and does not predict or depict performance of the Fund. The Fund’s performance reflects the effects of the Fund’s business and operating expenses.
4 OPPENHEIMER TOTAL RETURN BOND FUND/VA
COMPARISON OF CHANGE IN VALUE OF $10,000 HYPOTHETICAL INVESTMENTS IN:
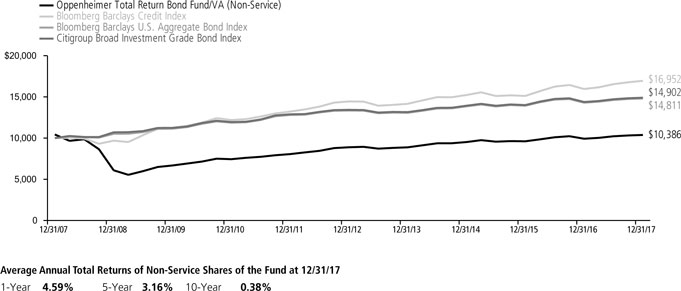
COMPARISON OF CHANGE IN VALUE OF $10,000 HYPOTHETICAL INVESTMENTS IN:
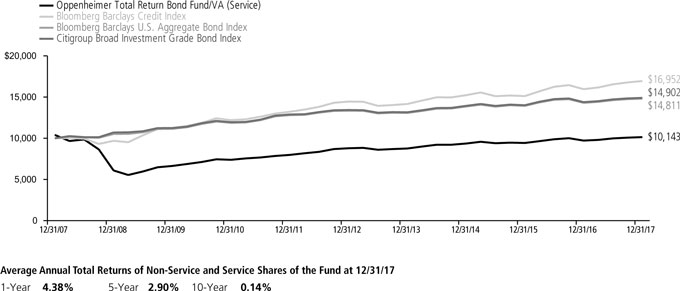
Performance data quoted represents past performance, which does not guarantee future results. The investment return and principal value of an investment in the Fund will fluctuate so that an investor’s shares, when redeemed, may be worth more or less than their original cost. Current performance may be lower or higher than the performance quoted. For performance data current to the most recent month end, call us at 1.800.988.8287. The Fund’s total returns should not be expected to be the same as the returns of other funds, whether or not both funds have the same portfolio managers and/or similar names. The Fund’s total returns include changes in share price and reinvested distributions but do not include the charges associated with the separate account products that offer this Fund. Such performance would have been lower if such charges were taken into account.
5 OPPENHEIMER TOTAL RETURN BOND FUND/VA
Fund Expenses
Fund Expenses. As a shareholder of the Fund, you incur two types of costs: (1) transaction costs and (2) ongoing costs, including management fees; distribution and service fees; and other Fund expenses. These examples are intended to help you understand your ongoing costs (in dollars) of investing in the Fund and to compare these costs with the ongoing costs of investing in other mutual funds.
The examples are based on an investment of $1,000.00 invested at the beginning of the period and held for the entire 6-month period ended December 31, 2017.
Actual Expenses. The first section of the table provides information about actual account values and actual expenses. You may use the information in this section for the class of shares you hold, together with the amount you invested, to estimate the expense that you paid over the period. Simply divide your account value by $1,000.00 (for example, an $8,600.00 account value divided by $1,000.00 = 8.60), then multiply the result by the number in the first section under the heading entitled “Expenses Paid During 6 Months Ended December 31, 2017” to estimate the expenses you paid on your account during this period.
Hypothetical Example for Comparison Purposes.
The second section of the table provides information about hypothetical account values and hypothetical expenses based on the Fund’s actual expense ratio for each class of shares, and an assumed rate of return of 5% per year for each class before expenses, which is not the actual return. The hypothetical account values and expenses may not be used to estimate the actual ending account balance or expenses you paid for the period. You may use this information to compare the ongoing costs of investing in the Fund and other funds. To do so, compare this 5% hypothetical example for the class of shares you hold with the 5% hypothetical examples that appear in the shareholder reports of the other funds.
Please note that the expenses shown in the table are meant to highlight your ongoing costs only and do not reflect any charges associated with the separate accounts that offer this Fund. Therefore, the “hypothetical” lines of the table are useful in comparing ongoing costs only, and will not help you determine the relative total costs of owning different funds. In addition, if these separate account charges were included your costs would have been higher.
| | | | | | | | | | | | | | | | |
| Actual | | Beginning Account Value July 1, 2017 | | | Ending Account Value December 31, 2017 | | | | | | Expenses Paid During 6 Months Ended
December 31, 2017 | |
Non-Service shares | | | $ 1,000.00 | | | | $ 1,015.60 | | | | | | | | $ 3.82 | |
Service shares | | | 1,000.00 | | | | 1,015.80 | | | | | | | | 5.09 | |
| | | | |
| Hypothetical | | | | | | | | | | | | |
| (5% return before expenses) | | | | | | | | | | | | |
Non-Service shares | | | 1,000.00 | | | | 1,021.42 | | | | | | | | 3.83 | |
Service shares | | | 1,000.00 | | | | 1,020.16 | | | | | | | | 5.10 | |
Expenses are equal to the Fund’s annualized expense ratio for that class, multiplied by the average account value over the period, multiplied by 184/365 (to reflect the one-half year period). Those annualized expense ratios, excluding indirect expenses from affiliated funds, based on the 6-month period ended December 31, 2017 are as follows:
| | | | |
| Class | | Expense Ratios | |
Non-Service shares | | | 0.75% | |
Service shares | | | 1.00 | |
The expense ratios reflect voluntary and/or contractual waivers and/or reimbursements of expenses by the Fund’s Manager. Some of these undertakings may be modified or terminated at any time, as indicated in the Fund’s prospectus. The “Financial Highlights” tables in the Fund’s financial statements, included in this report, also show the gross expense ratios, without such waivers or reimbursements and reduction to custodian expenses, if applicable.
6 OPPENHEIMER TOTAL RETURN BOND FUND/VA
STATEMENT OF INVESTMENTS December 31, 2017
| | | | | | | | |
| | | Principal Amount | | | Value | |
| |
Asset-Backed Securities—13.9% | |
| |
| Auto Loan—8.9% | |
| |
| American Credit Acceptance Receivables Trust: | |
| Series 2014-4,Cl. D, 5.24%, 2/10/221 | | $ | 60,000 | | | $ | 60,334 | |
| Series 2015-1,Cl. B, 2.85%, 2/12/211 | | | 17,451 | | | | 17,457 | |
| Series 2015-3,Cl. B, 3.56%, 10/12/211 | | | 85,434 | | | | 85,682 | |
| Series 2015-3,Cl. C, 4.84%, 10/12/211 | | | 315,000 | | | | 321,218 | |
| Series 2015-3,Cl. D, 5.86%, 7/12/221 | | | 125,000 | | | | 127,670 | |
| Series 2016-4,Cl. B, 2.11%, 2/12/211 | | | 65,000 | | | | 64,958 | |
| Series 2017-3,Cl. B, 2.25%, 1/11/211 | | | 65,000 | | | | 64,783 | |
| Series 2017-4,Cl. B, 2.61%, 5/10/211 | | | 64,000 | | | | 63,971 | |
| Series 2017-4,Cl. C, 2.94%, 1/10/241 | | | 183,000 | | | | 182,864 | |
| Series 2017-4,Cl. D, 3.57%, 1/10/241 | | | 157,000 | | | | 156,812 | |
| |
| AmeriCredit Automobile Receivables Trust: | |
| Series 2013-4,Cl. D, 3.31%, 10/8/19 | | | 50,000 | | | | 50,171 | |
| Series 2015-2,Cl. D, 3.00%, 6/8/21 | | | 200,000 | | | | 202,047 | |
| Series 2017-2,Cl. D, 3.42%, 4/18/23 | | | 300,000 | | | | 303,255 | |
| Series 2017-4,Cl. D, 3.08%, 12/18/23 | | | 225,000 | | | | 224,324 | |
| |
| Capital Auto Receivables Asset Trust: | |
| Series 2014-1,Cl. D, 3.39%, 7/22/19 | | | 115,000 | | | | 115,325 | |
| Series 2017-1,Cl. D, 3.15%, 2/20/251 | | | 40,000 | | | | 39,810 | |
| |
| CarFinance Capital Auto Trust: | |
| Series 2014-1A,Cl. D, 4.90%, 4/15/201 | | | 155,000 | | | | 157,287 | |
| Series 2015-1A,Cl. A, 1.75%, 6/15/211 | | | 31,384 | | | | 31,346 | |
| |
| CarMax Auto Owner Trust: | |
| Series 2015-2,Cl. D, 3.04%, 11/15/21 | | | 100,000 | | | | 100,511 | |
| Series 2015-3,Cl. D, 3.27%, 3/15/22 | | | 295,000 | | | | 296,033 | |
| Series 2016-1,Cl. D, 3.11%, 8/15/22 | | | 185,000 | | | | 186,394 | |
| Series 2016-3,Cl. D, 2.94%, 1/17/23 | | | 115,000 | | | | 113,788 | |
| Series 2016-4,Cl. D, 2.91%, 4/17/23 | | | 260,000 | | | | 256,733 | |
| Series 2017-1,Cl. D, 3.43%, 7/17/23 | | | 230,000 | | | | 230,131 | |
| Series 2017-4,Cl. D, 3.30%, 5/15/24 | | | 100,000 | | | | 99,334 | |
| |
| CIG Auto Receivables Trust, Series 2017-1A, Cl. A, 2.71%, 5/15/231 | | | 123,827 | | | | 123,657 | |
| |
| CPS Auto Receivables Trust: | |
| Series 2013-C,Cl. D, 6.59%, 8/15/191 | | | 95,000 | | | | 96,604 | |
| Series 2017-C,Cl. A, 1.78%, 9/15/201 | | | 70,154 | | | | 70,051 | |
| Series 2017-C,Cl. B, 2.30%, 7/15/211 | | | 100,000 | | | | 99,619 | |
| |
| CPS Auto Trust: | |
| Series 2017-A,Cl. B, 2.68%, 5/17/211 | | | 30,000 | | | | 30,046 | |
| Series 2017-D,Cl. B, 2.43%, 1/18/221 | | | 170,000 | | | | 169,440 | |
| Credit Acceptance Auto Loan Trust, Series 2017-3A, Cl. C, 3.48%, 10/15/262 | | | 205,000 | | | | 203,637 | |
| |
| Drive Auto Receivables Trust: | |
| Series 2015-BA,Cl. D, 3.84%, 7/15/211 | | | 20,000 | | | | 20,323 | |
| Series 2015-CA,Cl. D, 4.20%, 9/15/211 | | | 60,000 | | | | 61,302 | |
| Series 2016-CA,Cl. C, 3.02%, 11/15/211 | | | 140,000 | | | | 141,091 | |
| Series 2016-CA,Cl. D, 4.18%, 3/15/241 | | | 160,000 | | | | 164,377 | |
| Series 2017-1,Cl. B, 2.36%, 3/15/21 | | | 155,000 | | | | 155,168 | |
| Series 2017-2,Cl. B, 2.25%, 6/15/21 | | | 100,000 | | | | 100,063 | |
| Series 2017-2,Cl. C, 2.75%, 9/15/23 | | | 110,000 | | | | 110,201 | |
| Series 2017-3,Cl. C, 2.80%, 7/15/22 | | | 115,000 | | | | 115,102 | |
| Series 2017-AA,Cl. C, 2.98%, 1/18/221 | | | 165,000 | | | | 166,162 | |
| Series 2017-AA,Cl. D, 4.16%, 5/15/241 | | | 210,000 | | | | 215,389 | |
| Series 2017-BA,Cl. D, 3.72%, 10/17/221 | | | 215,000 | | | | 217,960 | |
| |
| DT Auto Owner Trust: | |
| Series 2014-2A,Cl. D, 3.68%, 4/15/211 | | | 312,733 | | | | 313,754 | |
| Series 2015-2A,Cl. D, 4.25%, 2/15/221 | | | 40,000 | | | | 40,681 | |
| Series 2016-1A,Cl. B, 2.79%, 5/15/201 | | | 7,276 | | | | 7,278 | |
| Series 2016-4A,Cl. E, 6.49%, 9/15/231 | | | 75,000 | | | | 77,156 | |
| Series 2017-1A,Cl. C, 2.70%, 11/15/221 | | | 90,000 | | | | 89,800 | |
| Series 2017-1A,Cl. D, 3.55%, 11/15/221 | | | 125,000 | | | | 125,006 | |
| Series 2017-1A,Cl. E, 5.79%, 2/15/241 | | | 150,000 | | | | 152,446 | |
| Series 2017-2A,Cl. B, 2.44%, 2/15/211 | | | 135,000 | | | | 135,251 | |
| Series 2017-2A,Cl. D, 3.89%, 1/15/231 | | | 175,000 | | | | 176,294 | |
| Series 2017-3A,Cl. B, 2.40%, 5/17/211 | | | 170,000 | | | | 169,541 | |
| Series 2017-3A,Cl. E, 5.60%, 8/15/241 | | | 155,000 | | | | 157,332 | |
| Series 2017-4A,Cl. D, 3.47%, 7/17/231 | | | 190,000 | | | | 189,614 | |
| Series 2017-4A,Cl. E, 5.15%, 11/15/241 | | | 135,000 | | | | 135,110 | |
| | | | | | | | |
| | | Principal Amount | | | Value | |
| Auto Loan (Continued) | |
| Exeter Automobile Receivables Trust: | |
| Series 2013-2A,Cl. D, 6.81%, 8/17/201 | | $ | 272,259 | | | $ | 274,651 | |
| Series 2014-2A,Cl. C, 3.26%, 12/16/191 | | | 99,474 | | | | 99,847 | |
| Series 2017-3A,Cl. A, 2.05%, 12/15/211 | | | 141,825 | | | | 141,633 | |
| |
| Flagship Credit Auto Trust: | |
| Series 2013-2,Cl. D, 6.26%, 2/16/211 | | | 60,000 | | | | 60,454 | |
| Series 2014-1,Cl. D, 4.83%, 6/15/201 | | | 20,000 | | | | 20,390 | |
| Series 2016-1,Cl. C, 6.22%, 6/15/221 | | | 345,000 | | | | 364,786 | |
| |
| GM Financial Automobile Leasing Trust, Series 2017-3, Cl. C, 2.73%, 9/20/21 | | | 120,000 | | | | 118,871 | |
| |
| Navistar Financial Dealer Note Master Owner Trust II: | |
| Series 2016-1,Cl. D, 4.852% | | | | | | | | |
| [LIBOR01M+330], 9/27/211,3 | | | 75,000 | | | | 75,126 | |
| Series 2017-1,Cl. C, 3.102% | | | | | | | | |
| [LIBOR01M+155], 6/27/221,3 | | | 60,000 | | | | 60,367 | |
| Series 2017-1,Cl. D, 3.852% | | | | | | | | |
| [LIBOR01M+230], 6/27/221,3 | | | 70,000 | | | | 70,038 | |
| |
| Nissan Auto Lease Trust, Series 2017-A, Cl. A3, 1.91%, 4/15/20 | | | 230,000 | | | | 229,240 | |
| |
| Santander Drive Auto Receivables Trust: | |
| Series 2013-4,Cl. E, 4.67%, 1/15/201 | | | 360,000 | | | | 360,781 | |
| Series 2013-A,Cl. E, 4.71%, 1/15/211 | | | 270,000 | | | | 271,906 | |
| Series 2016-2,Cl. D, 3.39%, 4/15/22 | | | 120,000 | | | | 121,837 | |
| Series 2017-1,Cl. D, 3.17%, 4/17/23 | | | 160,000 | | | | 160,910 | |
| Series 2017-1,Cl. E, 5.05%, 7/15/241 | | | 355,000 | | | | 365,078 | |
| Series 2017-2,Cl. D, 3.49%, 7/17/23 | | | 70,000 | | | | 70,751 | |
| Series 2017-3,Cl. D, 3.20%, 11/15/23 | | | 400,000 | | | | 400,741 | |
| |
| Santander Retail Auto Lease Trust, Series 2017-A, Cl. C, 2.96%, 11/21/221 | | | 180,000 | | | | 179,969 | |
| |
| TCF Auto Receivables Owner Trust, Series 2015-1A, Cl. D, 3.53%, 3/15/221 | | | 160,000 | | | | 159,585 | |
| |
| Veros Automobile Receivables Trust, Series 2017-1, Cl. A, 2.84%, 4/17/231 | | | 139,644 | | | | 139,407 | |
| |
| Westlake Automobile Receivables Trust: | |
| Series 2016-1A,Cl. E, 6.52%, 6/15/221 | | | 195,000 | | | | 200,309 | |
| Series 2017-2A,Cl. A1, 1.45%, 8/15/181 | | | 80,111 | | | | 80,102 | |
| Series 2017-2A,Cl. E, 4.63%, 7/15/241 | | | 255,000 | | | | 255,612 | |
| | | | | | | | |
| | | | | | | 11,864,084 | |
| |
| Credit Card—4.3% | |
| |
| Cabela’s Credit Card Master Note Trust: | |
| Series 2013-2A,Cl. A2, 2.127% | | | | | | | | |
| [LIBOR01M+65], 8/16/211,3 | | | 100,000 | | | | 100,347 | |
| Series 2016-1,Cl. A1, 1.78%, 6/15/22 | | | 320,000 | | | | 318,230 | |
| Series 2016-1,Cl. A2, 2.327% | | | | | | | | |
| [LIBOR01M+85], 6/15/223 | | | 560,000 | | | | 565,400 | |
| |
| Capital One Multi-Asset Execution Trust: | |
| Series 2014-A4,Cl. A4, 1.837% | | | | | | | | |
| [LIBOR01M+36], 6/15/223 | | | 55,000 | | | | 55,238 | |
| Series 2016-A1,Cl. A1, 1.927% | | | | | | | | |
| [LIBOR01M+45], 2/15/223 | | | 385,000 | | | | 386,894 | |
| Series 2016-A3,Cl. A3, 1.34%, 4/15/22 | | | 485,000 | | | | 480,162 | |
| |
| Chase Issuance Trust, Series 2014-A5, Cl. A5, 1.847% [LIBOR01M+37], 4/15/213 | | | 240,000 | | | | 240,947 | |
| |
| Citibank Credit Card Issuance Trust, Series 2014-A6, Cl. A6, 2.15%, 7/15/21 | | | 30,000 | | | | 30,038 | |
| |
| Discover Card Execution Note Trust: | |
| Series 2012-A6,Cl. A6, 1.67%, 1/18/22 | | | 275,000 | | | | 273,493 | |
| Series 2016-A1,Cl. A1, 1.64%, 7/15/21 | | | 615,000 | | | | 613,119 | |
| Series 2016-A4,Cl. A4, 1.39%, 3/15/22 | | | 620,000 | | | | 612,565 | |
| |
| Evergreen Credit Card Trust, Series 2016-3, Cl. A, 1.977% [LIBOR01M+50], 11/16/201,3 | | | 455,000 | | | | 456,543 | |
| |
| World Financial Network Credit Card Master Trust: | |
| Series 2012-D,Cl. A, 2.15%, 4/17/23 | | | 145,000 | | | | 144,908 | |
| Series 2016-B,Cl. A, 1.44%, 6/15/22 | | | 360,000 | | | | 358,977 | |
| Series 2017-A,Cl. A, 2.12%, 3/15/24 | | | 405,000 | | | | 403,520 | |
| Series 2017-B,Cl. A, 1.98%, 6/15/23 | | | 315,000 | | | | 314,158 | |
| Series 2017-C,Cl. A, 2.31%, 8/15/24 | | | 395,000 | | | | 393,540 | |
| | | | | | | | |
| | | | | | | 5,748,079 | |
7 OPPENHEIMER TOTAL RETURN BOND FUND/VA
STATEMENT OF INVESTMENTS Continued
| | | | | | | | |
| | | Principal Amount | | | Value | |
| |
| Equipment—0.4% | |
| |
| CCG Receivables Trust, Series 2017-1, Cl. B, 2.75%, 11/14/231 | | $ | 230,000 | | | $ | 227,769 | |
| |
| CNH Equipment Trust, Series 2017-C, Cl. B, 2.54%, 5/15/25 | | | 65,000 | | | | 64,698 | |
| |
| FRS I LLC, Series 2013-1A, Cl. A1, 1.80%, 4/15/431 | | | 25,401 | | | | 25,246 | |
| |
| Verizon Owner Trust, Series 2017-3A, Cl. A1A, 2.06%, 4/20/221 | | | 180,000 | | | | 179,300 | |
| | | | | | | | |
| | | | | | | 497,013 | |
| |
| Home Equity Loan—0.1% | |
| |
| CWABS Asset-Backed Certificates Trust, Series 2005-14, Cl. 1A1, 1.782% [US0001M+23], 4/25/363 | | | 97,837 | | | | 98,051 | |
| |
| Loans: Other—0.2% | |
| |
| Dell Equipment Finance Trust, Series 2017-2, Cl. B, 2.47%, 10/24/221 | | | 70,000 | | | | 69,626 | |
| |
| Element Rail Leasing I LLC, Series 2014-1A, Cl. A1, 2.299%, 4/19/441 | | | 211,213 | | | | 210,780 | |
| | | | | | | | |
| | | | | | | 280,406 | |
| | | | | | | | |
| Total Asset-Backed Securities (Cost $18,489,729) | | | | | | | 18,487,633 | |
| |
Mortgage-Backed Obligations—58.8% | | | | | |
| |
| Government Agency—42.6% | |
| |
| FHLMC/FNMA/FHLB/Sponsored—32.7% | |
| |
| Federal Home Loan Mortgage Corp. Gold Pool: | |
| 5.00%, 12/1/34 | | | 3,914 | | | | 4,248 | |
| 5.50%, 9/1/39 | | | 297,492 | | | | 326,297 | |
| 6.00%, 5/1/18-10/1/29 | | | 387,021 | | | | 435,262 | |
| 6.50%, 4/1/18-4/1/34 | | | 113,080 | | | | 125,391 | |
| 7.00%, 10/1/31-10/1/37 | | | 103,667 | | | | 115,132 | |
| 9.00%, 8/1/22-5/1/25 | | | 6,617 | | | | 7,048 | |
| |
| Federal Home Loan Mortgage Corp. Non Gold Pool, 10.50%, 10/1/20 | | | 463 | | | | 467 | |
| |
| Federal Home Loan Mortgage Corp., Interest-Only Stripped Mtg.-Backed Security: | |
| Series 205,Cl. IO, 61.755%, 9/1/294 | | | 4,983 | | | | 1,064 | |
| Series 206,Cl. IO, 0.00%, 12/15/294,5 | | | 86,003 | | | | 22,595 | |
| Series 243,Cl. 6, 0.00%, 12/15/324,5 | | | 56,851 | | | | 9,751 | |
| |
| Federal Home Loan Mortgage Corp., Mtg.- | | | | | | | | |
| Linked Amortizing Global Debt Securities, | | | | | | | | |
| Series 2012-1, Cl. A10, 2.06%, 1/15/22 | | | 276,900 | | | | 275,839 | |
| |
| Federal Home Loan Mortgage Corp., Principal- Only Stripped Mtg.-Backed Security, Series 176, Cl. PO, 4.108%, 6/1/266 | | | 26,958 | | | | 25,084 | |
| |
| Federal Home Loan Mortgage Corp., Real Estate Mtg. Investment Conduit Multiclass Pass-Through Certificates: | |
| Series 151,Cl. F, 9.00%, 5/15/21 | | | 1,415 | | | | 1,482 | |
| Series 1674,Cl. Z, 6.75%, 2/15/24 | | | 7,941 | | | | 8,556 | |
| Series 2034,Cl. Z, 6.50%, 2/15/28 | | | 1,527 | | | | 1,691 | |
| Series 2042,Cl. N, 6.50%, 3/15/28 | | | 3,123 | | | | 3,412 | |
| Series 2043,Cl. ZP, 6.50%, 4/15/28 | | | 183,082 | | | | 204,852 | |
| Series 2046,Cl. G, 6.50%, 4/15/28 | | | 7,807 | | | | 8,607 | |
| Series 2053,Cl. Z, 6.50%, 4/15/28 | | | 1,647 | | | | 1,825 | |
| Series 2066,Cl. Z, 6.50%, 6/15/28 | | | 172,897 | | | | 191,571 | |
| Series 2195,Cl. LH, 6.50%, 10/15/29 | | | 144,087 | | | | 160,134 | |
| Series 2220,Cl. PD, 8.00%, 3/15/30 | | | 1,000 | | | | 1,165 | |
| Series 2326,Cl. ZP, 6.50%, 6/15/31 | | | 39,687 | | | | 43,562 | |
| Series 2461,Cl. PZ, 6.50%, 6/15/32 | | | 156,428 | | | | 172,949 | |
| Series 2470,Cl. LF, 2.477% | | | | | | | | |
| [LIBOR01M+100], 2/15/323 | | | 1,280 | | | | 1,311 | |
| Series 2564,Cl. MP, 5.00%, 2/15/18 | | | 2,790 | | | | 2,792 | |
| Series 2585,Cl. HJ, 4.50%, 3/15/18 | | | 1,399 | | | | 1,400 | |
| Series 2635,Cl. AG, 3.50%, 5/15/32 | | | 25,241 | | | | 25,660 | |
| Series 2707,Cl. QE, 4.50%, 11/15/18 | | | 2,973 | | | | 2,990 | |
| Series 2770,Cl. TW, 4.50%, 3/15/19 | | | 2,169 | | | | 2,192 | |
| Series 3010,Cl. WB, 4.50%, 7/15/20 | | | 7,653 | | | | 7,800 | |
| Series 3025,Cl. SJ, 19.334% [(3.667) x | | | | | | | | |
| LIBOR01M)+2,475], 8/15/353 | | | 13,165 | | | | 19,162 | |
| | | | | | | | |
| | | Principal Amount | | | Value | |
| |
| FHLMC/FNMA/FHLB/Sponsored (Continued) | |
| |
| Federal Home Loan Mortgage Corp., Real Estate Mtg. Investment Conduit Multiclass | |
| Pass-Through Certificates: (Continued) | |
| Series 3030,Cl. FL, 1.877% | | | | | | | | |
| [LIBOR01M+40], 9/15/353 | | $ | 2,174 | | | $ | 2,184 | |
| Series 3645,Cl. EH, 3.00%, 12/15/20 | | | 21,519 | | | | 21,629 | |
| Series 3741,Cl. PA, 2.15%, 2/15/35 | | | 56,091 | | | | 56,083 | |
| Series 3815,Cl. BD, 3.00%, 10/15/20 | | | 715 | | | | 717 | |
| Series 3822,Cl. JA, 5.00%, 6/15/40 | | | 3,042 | | | | 3,124 | |
| Series 3840,Cl. CA, 2.00%, 9/15/18 | | | 548 | | | | 547 | |
| Series 3848,Cl. WL, 4.00%, 4/15/40 | | | 18,285 | | | | 18,669 | |
| Series 3857,Cl. GL, 3.00%, 5/15/40 | | | 4,019 | | | | 4,061 | |
| Series 4221,Cl. HJ, 1.50%, 7/15/23 | | | 71,361 | | | | 70,323 | |
| |
| Federal Home Loan Mortgage Corp., Real Estate Mtg. Investment Conduit Multiclass Pass-Through Certificates, Interest-Only Stripped Mtg.-Backed Security: | |
| Series 2074,Cl. S, 99.999%, 7/17/284 | | | 1,051 | | | | 139 | |
| Series 2079,Cl. S, 99.999%, 7/17/284 | | | 1,891 | | | | 252 | |
| Series 2130,Cl. SC, 99.999%, 3/15/294 | | | 62,330 | | | | 9,983 | |
| Series 2526,Cl. SE, 70.754%, 6/15/294 | | | 2,362 | | | | 413 | |
| Series 2796,Cl. SD, 99.999%, 7/15/264 | | | 124,397 | | | | 18,220 | |
| Series 2920,Cl. S, 30.588%, 1/15/354 | | | 476,511 | | | | 74,034 | |
| Series 2922,Cl. SE, 12.863%, 2/15/354 | | | 58,707 | | | | 9,698 | |
| Series 2981,Cl. AS, 6.88%, 5/15/354 | | | 77,311 | | | | 10,358 | |
| Series 3004,Cl. SB, 0.00%, 7/15/354,5 | | | 22,016 | | | | 2,235 | |
| Series 3397,Cl. GS, 0.00%, 12/15/374,5 | | | 10,815 | | | | 1,747 | |
| Series 3424,Cl. EI, 0.00%, 4/15/384,5 | | | 9,531 | | | | 867 | |
| Series 3450,Cl. BI, 15.141%, 5/15/384 | | | 289,539 | | | | 43,024 | |
| Series 3606,Cl. SN, 15.331%, 12/15/394 | | | 78,145 | | | | 11,868 | |
| |
| Federal National Mortgage Assn.: | |
| 2.50%, 1/1/337 | | | 2,120,000 | | | | 2,117,834 | |
| 3.00%, 1/1/337 | | | 7,460,000 | | | | 7,600,831 | |
| 3.50%, 1/1/487 | | | 11,095,000 | | | | 11,398,760 | |
| 4.00%, 1/1/487 | | | 7,620,000 | | | | 7,973,401 | |
| 4.50%, 1/1/487 | | | 7,315,000 | | | | 7,783,572 | |
| 5.00%, 1/1/487 | | | 1,380,000 | | | | 1,483,716 | |
| |
| Federal National Mortgage Assn. Pool: | |
| 5.00%, 3/1/21-7/1/22 | | | 2,852 | | | | 2,919 | |
| 5.50%, 2/1/35-5/1/36 | | | 117,081 | | | | 129,926 | |
| 6.50%, 10/1/19-1/1/34 | | | 7,556 | | | | 8,553 | |
| 7.00%, 1/1/30-12/1/32 | | | 16,473 | | | | 18,981 | |
| 7.50%, 1/1/33 | | | 3,444 | | | | 4,043 | |
| 8.50%, 7/1/32 | | | 9,304 | | | | 9,961 | |
| |
| Federal National Mortgage Assn., Interest-Only Stripped Mtg.-Backed Security: | |
| Series 221,Cl. 2, 99.999%, 5/25/234 | | | 1,552 | | | | 222 | |
| Series 222,Cl. 2, 99.999%, 6/25/234 | | | 168,149 | | | | 21,621 | |
| Series 252,Cl. 2, 0.00%, 11/25/234,5 | | | 155,996 | | | | 23,044 | |
| Series 294,Cl. 2, 99.999%, 2/25/284 | | | 21,532 | | | | 5,002 | |
| Series 301,Cl. 2, 12.567%, 4/25/294 | | | 1,736 | | | | 378 | |
| Series 303,Cl. IO, 50.576%, 11/25/294 | | | 39,085 | | | | 9,538 | |
| Series 320,Cl. 2, 48.533%, 4/25/324 | | | 150,509 | | | | 37,455 | |
| Series 321,Cl. 2, 12.866%, 4/25/324 | | | 371,440 | | | | 88,162 | |
| Series 324,Cl. 2, 0.00%, 7/25/324,5 | | | 3,866 | | | | 883 | |
| Series 331,Cl. 5, 0.00%, 2/25/334,8 | | | 5,416 | | | | 1,008 | |
| Series 331,Cl. 9, 26.018%, 2/25/334 | | | 124,556 | | | | 25,641 | |
| Series 334,Cl. 12, 0.00%, 3/25/334,5 | | | 8,827 | | | | 1,922 | |
| Series 334,Cl. 17, 29.028%, 2/25/334 | | | 76,810 | | | | 15,065 | |
| Series 339,Cl. 12, 0.00%, 6/25/334,5 | | | 122,614 | | | | 28,398 | |
| Series 339,Cl. 7, 0.00%, 11/25/334,5 | | | 260,769 | | | | 54,208 | |
| Series 343,Cl. 13, 0.00%, 9/25/334,5 | | | 131,404 | | | | 28,088 | |
| Series 343,Cl. 18, 0.00%, 5/25/344,5 | | | 31,569 | | | | 6,660 | |
| Series 345,Cl. 9, 0.00%, 1/25/344,5 | | | 93,929 | | | | 19,518 | |
| Series 351,Cl. 10, 0.00%, 4/25/344,5 | | | 40,783 | | | | 8,839 | |
| Series 351,Cl. 8, 0.00%, 4/25/344,5 | | | 71,145 | | | | 14,166 | |
| Series 356,Cl. 10, 0.00%, 6/25/354,5 | | | 50,292 | | | | 10,377 | |
| Series 356,Cl. 12, 0.00%, 2/25/354,5 | | | 24,697 | | | | 5,400 | |
| Series 362,Cl. 13, 0.00%, 8/25/354,5 | | | 98,278 | | | | 21,795 | |
| Series 364,Cl. 15, 0.00%, 9/25/354,5 | | | 5,156 | | | | 1,047 | |
| Series 364,Cl. 16, 0.00%, 9/25/354,5 | | | 107,277 | | | | 23,812 | |
| Series 365,Cl. 16, 0.00%, 3/25/364,5 | | | 138,654 | | | | 28,296 | |
8 OPPENHEIMER TOTAL RETURN BOND FUND/VA
| | | | | | | | |
| | | Principal Amount | | | Value | |
| |
| FHLMC/FNMA/FHLB/Sponsored (Continued) | |
| |
| Federal National Mortgage Assn., Real Estate Mtg. Investment Conduit Multiclass Pass- Through Certificates: | |
| Series 1993-87,Cl. Z, 6.50%, 6/25/23 | | $ | 117,608 | | | $ | 125,475 | |
| Series 1998-58,Cl. PC, 6.50%, 10/25/28 | | | 100,335 | | | | 111,002 | |
| Series 1998-61,Cl. PL, 6.00%, 11/25/28 | | | 50,898 | | | | 56,113 | |
| Series 1999-54,Cl. LH, 6.50%, 11/25/29 | | | 82,332 | | | | 91,098 | |
| Series 2001-51,Cl. OD, 6.50%, 10/25/31 | | | 5,769 | | | | 6,218 | |
| Series 2001-74,Cl. QE, 6.00%, 12/25/31 | | | 120,726 | | | | 134,367 | |
| Series 2003-100,Cl. PA, 5.00%, | |
| 10/25/18 | | | 16,619 | | | | 16,690 | |
| Series 2003-28,Cl. KG, 5.50%, 4/25/23 | | | 346,952 | | | | 365,910 | |
| Series 2003-84,Cl. GE, 4.50%, 9/25/18 | | | 863 | | | | 867 | |
| Series 2004-25,Cl. PC, 5.50%, 1/25/34 | | | 1,610 | | | | 1,631 | |
| Series 2005-73,Cl. DF, 1.802% | |
| [LIBOR01M+25], 8/25/353 | | | 3,679 | | | | 3,695 | |
| Series 2006-11,Cl. PS, 18.876% [(3.667) | |
| x LIBOR01M)+2,456.67], 3/25/363 | | | 73,168 | | | | 114,255 | |
| Series 2006-46,Cl. SW, 18.508% | | | | | | | | |
| [(3.667) x LIBOR01M)+2,419.92], 6/25/363 | | | 48,160 | | | | 71,755 | |
| Series 2006-50,Cl. KS, 18.509% | | | | | | | | |
| [(3.667) x LIBOR01M)+2,420], 6/25/363 | | | 65,915 | | | | 100,105 | |
| Series 2008-75,Cl. DB, 4.50%, 9/25/23 | | | 7,705 | | | | 7,745 | |
| Series 2009-113,Cl. DB, 3.00%, | | | | | | | | |
| 12/25/20 | | | 25,789 | | | | 25,877 | |
| Series 2009-36,Cl. FA, 2.492% | | | | | | | | |
| [LIBOR01M+94], 6/25/373 | | | 36,604 | | | | 37,421 | |
| Series 2009-70,Cl. TL, 4.00%, 8/25/19 | | | 7,236 | | | | 7,252 | |
| Series 2010-43,Cl. KG, 3.00%, 1/25/21 | | | 11,125 | | | | 11,176 | |
| Series 2011-3,Cl. EL, 3.00%, 5/25/20 | | | 43,927 | | | | 44,022 | |
| Series 2011-38,Cl. AH, 2.75%, 5/25/20 | | | 597 | | | | 597 | |
| Series 2011-82,Cl. AD, 4.00%, 8/25/26 | | | 24,202 | | | | 24,408 | |
| |
| Federal National Mortgage Assn., Real Estate Mtg. Investment Conduit Multiclass Pass-Through Certificates, Interest-Only Stripped Mtg.-Backed Security: | |
| Series 2001-61,Cl. SH, 21.316%, 11/18/314 | | | 4,943 | | | | 952 | |
| Series 2001-63,Cl. SD, 54.796%, 12/18/314 | | | 1,638 | | | | 291 | |
| Series 2001-65,Cl. S, 33.755%, 11/25/314 | | | 124,014 | | | | 23,887 | |
| Series 2001-68,Cl. SC, 48.086%, 11/25/314 | | | 1,159 | | | | 205 | |
| Series 2001-81,Cl. S, 38.76%, 1/25/324 | | | 34,487 | | | | 6,449 | |
| Series 2002-28,Cl. SA, 32.239%, 4/25/324 | | | 1,081 | | | | 201 | |
| Series 2002-38,Cl. SO, 75.594%, 4/25/324 | | | 3,341 | | | | 588 | |
| Series 2002-39,Cl. SD, 63.086%, 3/18/324 | | | 2,209 | | | | 435 | |
| Series 2002-47,Cl. NS, 43.038%, 4/25/324 | | | 107,616 | | | | 21,437 | |
| Series 2002-48,Cl. S, 48.573%, 7/25/324 | | | 1,774 | | | | 347 | |
| Series 2002-51,Cl. S, 42.124%, 8/25/324 | | | 98,791 | | | | 18,787 | |
| Series 2002-52,Cl. SD, 89.131%, 9/25/324 | | | 155,498 | | | | 31,653 | |
| Series 2002-52,Cl. SL, 41.855%, 9/25/324 | | | 1,118 | | | | 216 | |
| Series 2002-53,Cl. SK, 88.058%, 4/25/324 | | | 7,698 | | | | 1,551 | |
| Series 2002-56,Cl. SN, 45.837%, 7/25/324 | | | 2,418 | | | | 474 | |
| Series 2002-60,Cl. SM, 18.419%, 8/25/324 | | | 15,150 | | | | 2,467 | |
| Series 2002-7,Cl. SK, 22.732%, 1/25/324 | | | 6,979 | | | | 1,224 | |
| Series 2002-77,Cl. BS, 25.06%, 12/18/324 | | | 10,203 | | | | 2,040 | |
| Series 2002-77,Cl. IS, 58.853%, 12/18/324 | | | 5,692 | | | | 1,205 | |
| | | | | | | | |
| | | Principal Amount | | | Value | |
| |
| FHLMC/FNMA/FHLB/Sponsored (Continued) | |
| |
| Federal National Mortgage Assn., Real Estate Mtg. Investment Conduit Multiclass Pass- Through Certificates, Interest-Only Stripped Mtg.-Backed Security: (Continued) | |
| Series 2002-77,Cl. SH, 34.224%, 12/18/324 | | $ | 48,864 | | | $ | 9,351 | |
| Series 2002-84,Cl. SA, 29.042%, 12/25/324 | | | 116,879 | | | | 22,205 | |
| Series 2002-9,Cl. MS, 38.203%, 3/25/324 | | | 1,820 | | | | 336 | |
| Series 2002-90,Cl. SN, 18.737%, 8/25/324 | | | 7,794 | | | | 1,269 | |
| Series 2002-90,Cl. SY, 25.468%, 9/25/324 | | | 5,850 | | | | 974 | |
| Series 2003-26,Cl. DI, 54.496%, 4/25/334 | | | 5,279 | | | | 1,220 | |
| Series 2003-33,Cl. SP, 30.734%, 5/25/334 | | | 119,290 | | | | 26,430 | |
| Series 2003-4,Cl. S, 24.257%, 2/25/334 | | | 73,339 | | | | 15,914 | |
| Series 2004-54,Cl. DS, 99.999%, 11/25/304 | | | 106,679 | | | | 17,966 | |
| Series 2005-12,Cl. SC, 37.475%, 3/25/354 | | | 27,578 | | | | 3,900 | |
| Series 2005-14,Cl. SE, 45.409%, 3/25/354 | | | 83,424 | | | | 11,585 | |
| Series 2005-40,Cl. SA, 99.999%, 5/25/354 | | | 244,692 | | | | 33,695 | |
| Series 2005-40,Cl. SB, 77.813%, 5/25/354 | | | 11,158 | | | | 1,362 | |
| Series 2005-52,Cl. JH, 39.066%, 5/25/354 | | | 64,382 | | | | 9,212 | |
| Series 2005-93,Cl. SI, 7.824%, 10/25/354 | | | 173,839 | | | | 24,310 | |
| Series 2008-55,Cl. SA, 0.00%, 7/25/384,5 | | | 9,254 | | | | 883 | |
| Series 2009-8,Cl. BS, 99.999%, 2/25/244 | | | 2,409 | | | | 98 | |
| Series 2011-96,Cl. SA, 5.871%, 10/25/414 | | | 62,560 | | | | 9,465 | |
| Series 2012-134,Cl. SA, 5.401%, 12/25/424 | | | 156,154 | | | | 30,925 | |
| Series 2012-40,Cl. PI, 8.169%, 4/25/414 | | | 116,964 | | | | 17,453 | |
| |
| Federal National Mortgage Assn., Real Estate Mtg. Investment Conduit Multiclass Pass- Through Certificates, Principal-Only Stripped Mtg.-Backed Security, Series 1993-184, Cl. M, 5.195%, 9/25/236 | | | 53,341 | | | | 49,717 | |
| | | | | | | | |
| | | | | | | 43,344,866 | |
| |
| GNMA/Guaranteed—9.9% | |
| |
| Government National Mortgage Assn. I Pool: | | | | | | | | |
| 7.00%, 12/15/23-3/15/26 | | | 5,412 | | | | 5,686 | |
| |
| Government National Mortgage Assn. II Pool: | | | | | | | | |
| 3.50%, 1/1/487 | | | 4,165,000 | | | | 4,309,018 | |
| 4.00%, 1/1/487 | | | 8,275,000 | | | | 8,631,471 | |
| |
| Government National Mortgage Assn., Interest-Only Stripped Mtg.-Backed Security: | |
| Series 2002-15,Cl. SM, 99.999%, 2/16/324 | | | 170,435 | | | | 780 | |
| Series 2007-17,Cl. AI, 55.764%, 4/16/374 | | | 62,209 | | | | 10,489 | |
| Series 2011-52,Cl. HS, 26.28%, 4/16/414 | | | 408,942 | | | | 57,117 | |
| | | | | | | | |
| | | | | | | 13,014,561 | |
| |
| Non-Agency—16.2% | |
| |
| Commercial—8.7% | |
| |
| Asset Securitization Corp., Interest-Only Stripped Mtg.-Backed Security, Series 1997-D4, Cl. PS1, 99.999%, 4/14/294 | | | 1,128,301 | | | | 762 | |
| |
| BCAP LLC Trust, Series 2011-R11, Cl. 18A5, 3.41% [H15T1Y+210], 9/26/351,3 | | | 62,903 | | | | 63,199 | |
9 OPPENHEIMER TOTAL RETURN BOND FUND/VA
STATEMENT OF INVESTMENTS Continued
| | | | | | | | |
| | | Principal Amount | | | Value | |
| |
| Commercial (Continued) | |
| |
| Capital Lease Funding Securitization LP, Interest-Only Commercial Mtg. Pass-Through Certificates, Series 1997-CTL1, Cl. IO, 0.00%, 6/22/242,4,5,9 | | $ | 240,583 | | | $ | 5,874 | |
| |
| CD Commercial Mortgage Trust: Series 2016-CD2,Cl. AM, 3.668%, 11/10/4910 | | | 150,000 | | | | 153,734 | |
| Series 2017-CD3,Cl. AS, 3.833%, 2/10/50 | | | 140,000 | | | | 144,737 | |
| |
| CD Mortgage Trust, Interest-Only Commercial Mtg. Pass-Through Certificates, Series 2017- CD6, Cl. XA, 12.227%, 11/13/504 | | | 754,482 | | | | 50,450 | |
| |
| Chase Mortgage Finance Trust, Series 2005- A2, Cl. 1A3, 3.448%, 1/25/3610 | | | 101,866 | | | | 99,516 | |
| |
| Citigroup Commercial Mortgage Trust: | | | | | | | | |
| Series 2012-GC8,Cl. AAB, 2.608%, 9/10/45 | | | 109,398 | | | | 110,030 | |
| Series 2014-GC21,Cl. AAB, 3.477%, 5/10/47 | | | 95,000 | | | | 98,013 | |
| |
| Citigroup Commercial Mortgage Trust, Interest-Only Commercial Mtg. Pass-Through Certificates, Series 2017-C4, Cl. XA, 0.00%, 10/12/504,5 | | | 2,078,286 | | | | 164,542 | |
| |
| COMM Mortgage Trust: | |
| Series 2012-CR3,Cl. ASB, 2.372%, 10/15/45 | | | 19,685 | | | | 19,645 | |
| Series 2012-LC4,Cl. A3, 3.069%, 12/10/44 | | | 43,667 | | | | 43,938 | |
| Series 2013-CR13,Cl. ASB, 3.706%, 11/12/46 | | | 185,000 | | | | 191,932 | |
| Series 2013-CR6,Cl. AM, 3.147%, 3/10/461 | | | 245,000 | | | | 246,525 | |
| Series 2013-CR7,Cl. D, 4.28%, 3/10/461,10 | | | 390,000 | | | | 311,197 | |
| Series 2014-CR20,Cl. ASB, 3.305%, 11/10/47 | | | 65,000 | | | | 66,776 | |
| Series 2014-CR21,Cl. AM, 3.987%, 12/10/47 | | | 715,000 | | | | 748,407 | |
| Series 2014-LC15,Cl. AM, 4.198%, 4/10/47 | | | 170,000 | | | | 179,454 | |
| Series 2014-UBS6,Cl. AM, 4.048%, 12/10/47 | | | 475,000 | | | | 496,432 | |
| Series 2015-CR22,Cl. A2, 2.856%, 3/10/48 | | | 110,000 | | | | 111,128 | |
| Series 2015-CR23,Cl. AM, 3.801%, 5/10/48 | | | 280,000 | | | | 288,666 | |
| |
| COMM Mortgage Trust, Interest-Only Stripped Mtg.-Backed Security, Series 2012-CR5, Cl. XA, 0.00%, 12/10/454,5 | | | 2,113,040 | | | | 130,670 | |
| |
| CSMC Mortgage-Backed Trust, Series 2006-6, Cl. 1A4, 6.00%, 7/25/36 | | | 165,282 | | | | 140,383 | |
| |
| Deutsche Bank Commercial Mortgage Trust, Series 2016-C1, Cl. AM, 3.539%, 5/10/49 | | | 140,000 | | | | 141,361 | |
| |
| First Horizon Alternative Mortgage Securities Trust, Series 2005-FA8, Cl. 1A6, 2.202% [US0001M+65], 11/25/353 | | | 131,297 | | | | 93,726 | |
| |
| FREMF Mortgage Trust: | |
| Series 2011-K702,Cl. B, 4.774%, 4/25/441,10 | | | 55,000 | | | | 55,016 | |
| Series 2013-K25,Cl. C, 3.619%, 11/25/451,10 | | | 90,000 | | | | 88,742 | |
| Series 2013-K26,Cl. C, 3.598%, 12/25/451,10 | | | 60,000 | | | | 59,212 | |
| Series 2013-K27,Cl. C, 3.495%, 1/25/461,10 | | | 95,000 | | | | 93,256 | |
| Series 2013-K28,Cl. C, 3.49%, 6/25/461,10 | | | 285,000 | | | | 279,559 | |
| Series 2013-K712,Cl. C, 3.362%, 5/25/451,10 | | | 75,000 | | | | 75,140 | |
| | | | | | | | |
| | | Principal Amount | | | Value | |
| |
| Commercial (Continued) | |
| |
| FREMF Mortgage Trust: (Continued) | |
| Series 2013-K713,Cl. C, 3.165%, 4/25/461,10 | | $ | 115,000 | | | $ | 114,638 | |
| Series 2014-K715,Cl. C, 4.125%, 2/25/461,10 | | | 50,000 | | | | 50,834 | |
| Series 2014-K717,Cl. B, 3.629%, 11/25/471,10 | | | 40,000 | | | | 40,840 | |
| |
| GS Mortgage Securities Corp. Trust, Series 2012-SHOP, Cl. A, 2.933%, 6/5/311 | | | 140,000 | | | | 141,233 | |
| |
| GS Mortgage Securities Trust: | |
| Series 2013-GC12,Cl. AAB, 2.678%, 6/10/46 | | | 35,000 | | | | 35,114 | |
| Series 2013-GC16,Cl. AS, 4.649%, 11/10/46 | | | 45,000 | | | | 48,344 | |
| Series 2014-GC18,Cl. AAB, 3.648%, 1/10/47 | | | 85,000 | | | | 88,010 | |
| |
| GSMSC Pass-Through Trust, Series 2009-3R, Cl. 1A2, 6.00%, 4/25/371,10 | | | 249,080 | | | | 240,310 | |
| |
| JP Morgan Chase Commercial Mortgage Securities Trust: | |
| Series 2012-LC9,Cl. A4, 2.611%, 12/15/47 | | | 20,000 | | | | 19,954 | |
| Series 2013-C10,Cl. AS, 3.372%, 12/15/47 | | | 315,000 | | | | 318,071 | |
| Series 2013-C16,Cl. AS, 4.517%, 12/15/46 | | | 300,000 | | | | 320,856 | |
| Series 2013-LC11,Cl. AS, 3.216%, 4/15/46 | | | 40,000 | | | | 40,286 | |
| Series 2013-LC11,Cl. ASB, 2.554%, 4/15/46 | | | 50,000 | | | | 50,070 | |
| Series 2014-C20,Cl. AS, 4.043%, 7/15/47 | | | 220,000 | | | | 229,699 | |
| Series 2016-JP3,Cl. A2, 2.435%, 8/15/49 | | | 220,000 | | | | 218,549 | |
| |
| JP Morgan Mortgage Trust, Series 2007-A1, Cl. 5A1, 3.629%, 7/25/3510 | | | 76,185 | | | | 78,256 | |
| |
| JP Morgan Resecuritization Trust, Series 2009-5, Cl. 1A2, 3.387%, 7/26/361,10 | | | 233,820 | | | | 224,255 | |
| |
| JPMBB Commercial Mortgage Securities Trust: | |
| Series 2013-C17,Cl. ASB, 3.705%, 1/15/47 | | | 75,000 | | | | 77,796 | |
| Series 2014-C18,Cl. A3, 3.578%, 2/15/47 | | | 105,000 | | | | 107,300 | |
| Series 2014-C19,Cl. ASB, 3.584%, 4/15/47 | | | 40,000 | | | | 41,294 | |
| Series 2014-C24,Cl. B, 4.116%, 11/15/4710 | | | 245,000 | | | | 251,198 | |
| Series 2014-C25,Cl. AS, 4.065%, 11/15/47 | | | 200,000 | | | | 209,427 | |
| Series 2014-C26,Cl. AS, 3.80%, 1/15/48 | | | 255,000 | | | | 262,877 | |
| |
| JPMDB Commercial Mortgage Securities Trust, Series 2016-C4, Cl. AS, 3.385%, 12/15/49 | | | 230,000 | | | | 229,459 | |
| |
| LB Commercial Conduit Mortgage Trust, Interest-Only Stripped Mtg.-Backed Security, Series 1998-C1, Cl. IO, 0.00%, 2/18/304,5 | | | 81,539 | | | | 5 | |
| |
| Lehman Structured Securities Corp., Series 2002-GE1, Cl. A, 2.514%, 7/26/241,9,10 | | | 34,872 | | | | 26,334 | |
| |
| Morgan Stanley Bank of America Merrill Lynch Trust: | |
| Series 2013-C7,Cl. AAB, 2.469%, 2/15/46 | | | 100,000 | | | | 100,170 | |
| Series 2013-C9,Cl. AS, 3.456%, 5/15/46 | | | 225,000 | | | | 227,696 | |
| Series 2014-C19,Cl. AS, 3.832%, 12/15/47 | | | 595,000 | | | | 613,389 | |
| Series 2016-C30,Cl. AS, 3.175%, 9/15/49 | | | 375,000 | | | | 366,148 | |
| |
| Morgan Stanley Capital I, Inc., Interest-Only Commercial Mtg. Pass-Through Certificates, Series 2017-HR2, Cl. XA, 10.107%, 12/15/504 | | | 685,000 | | | | 42,304 | |
| |
| Morgan Stanley Re-Remic Trust, Series 2012- R3, Cl. 1B, 2.968%, 11/26/361,10 | | | 439,048 | | | | 408,015 | |
10 OPPENHEIMER TOTAL RETURN BOND FUND/VA
| | | | | | | | |
| | | Principal Amount | | | Value | |
| Commercial (Continued) | |
| Morgan Stanley Resecuritization Trust, Series 2013-R9, Cl. 3A, 3.149%, 6/26/461,10 | | $ | 124,371 | | | $ | 116,402 | |
| RBSSP Resecuritization Trust, Series 2010-1, Cl. 2A1, 3.446%, 7/26/451,10 | | | 15,664 | | | | 16,049 | |
| UBS Commercial Mortgage Trust, Interest-Only Commercial Mtg. Pass-Through Certificates, Series 2017-C5, Cl. XA, 11.683%, 11/15/504 | | | 1,259,318 | | | | 91,090 | |
| Wells Fargo Commercial Mortgage Trust: | | | | | |
| Series 2015-C29,Cl. AS, 4.013%, 6/15/4810 | | | 245,000 | | | | 255,296 | |
| Series 2016-C37,Cl. AS, 4.018%, 12/15/49 | | | 355,000 | | | | 373,135 | |
| Wells Fargo Commercial Mortgage Trust, | |
| Interest-Only Commercial Mtg. Pass-Through | |
| Certificates, Series 2017-C42, Cl. XA, 0.00%, 12/15/504,5 | | | 900,000 | | | | 64,878 | |
| WF-RBS Commercial Mortgage Trust: | |
| Series 2012-C7,Cl. E, 4.825%, 6/15/451,10 | | | 120,000 | | | | 98,129 | |
| Series 2013-C14,Cl. AS, 3.488%, 6/15/46 | | | 150,000 | | | | 152,782 | |
| Series 2014-C20,Cl. AS, 4.176%, 5/15/47 | | | 130,000 | | | | 135,584 | |
| Series 2014-C22,Cl. A3, 3.528%, 9/15/57 | | | 45,000 | | | | 46,268 | |
| Series 2014-LC14,Cl. AS, 4.351%, 3/15/4710 | | | 145,000 | | | | 153,069 | |
| | | | | 11,477,435 | |
| Residential—7.5% | |
| Banc of America Funding Trust: | |
| Series 2007-1,Cl. 1A3, 6.00%, 1/25/37 | | | 90,756 | | | | 84,891 | |
| Series 2007-C,Cl. 1A4, 3.444%, 5/20/3610 | | | 41,996 | | | | 39,606 | |
| Series 2014-R7,Cl. 3A1, 3.544%, 3/26/361,9,10 | | | 125,513 | | | | 125,414 | |
| Banc of America Mortgage Trust, Series 2007-1, Cl. 1A24, 6.00%, 3/25/37 | | | 63,550 | | | | 61,130 | |
| Bear Stearns ARM Trust: | |
| Series 2005-2,Cl. A1, 3.26% | |
| [H15T1Y+245], 3/25/353 | | | 124,722 | | | | 126,366 | |
| Series 2005-9,Cl. A1, 3.52% | |
| [H15T1Y+230], 10/25/353 | | | 134,007 | | | | 136,922 | |
| Series 2006-1,Cl. A1, 3.67% | |
| [H15T1Y+225], 2/25/363 | | | 166,492 | | | | 167,230 | |
| CHL Mortgage Pass-Through Trust: | |
| Series 2005-17,Cl. 1A8, 5.50%, 9/25/35 | | | 12,926 | | | | 12,899 | |
| Series 2005-26,Cl. 1A8, 5.50%, 11/25/35 | | | 81,266 | | | | 74,362 | |
| Series 2005-J4,Cl. A7, 5.50%, 11/25/35 | | | 10,576 | | | | 10,617 | |
| Citigroup Mortgage Loan Trust, Inc., Series 2006-AR1, Cl. 1A1, 3.21% [H15T1Y+240], 10/25/353 | | | 403,073 | | | | 405,992 | |
| Connecticut Avenue Securities: | |
| Series 2014-C02,Cl. 1M1, 2.502% | |
| [US0001M+95], 5/25/243 | | | 127,432 | | | | 127,890 | |
| Series 2014-C03,Cl. 1M2, 4.552% | |
| [US0001M+300], 7/25/243 | | | 332,250 | | | | 355,333 | |
| Series 2016-C03,Cl. 1M1, 3.552% | |
| [US0001M+200], 10/25/283 | | | 22,238 | | | | 22,596 | |
| Series 2016-C07,Cl. 2M1, 2.852% | |
| [US0001M+130], 5/25/293 | | | 188,392 | | | | 189,596 | |
| Series 2016-C07,Cl. 2M2, 5.902% | |
| [US0001M+435], 5/25/293 | | | 130,000 | | | | 144,269 | |
| Series 2017-C02,Cl. 2M1, 2.702% | |
| [US0001M+115], 9/25/293 | | | 302,092 | | | | 304,880 | |
| Series 2017-C02,Cl. 2M2, 5.202% | |
| [US0001M+365], 9/25/293 | | | 280,000 | | | | 303,283 | |
| Series 2017-C03,Cl. 1M1, 2.502% | |
| [US0001M+95], 10/25/293 | | | 232,230 | | | | 234,115 | |
| | | | | | | | |
| | | Principal Amount | | | Value | |
| Residential (Continued) | |
| Connecticut Avenue Securities: (Continued) | |
| Series 2017-C04,Cl. 2M2, 4.402% | |
| [US0001M+285], 11/25/293 | | $ | 180,000 | | | $ | 187,331 | |
| Series 2017-C06,Cl. 1M1, 2.302% | |
| [US0001M+75], 2/25/303 | | | 139,498 | | | | 139,999 | |
| Series 2017-C07,Cl. 1M1, 2.202% | |
| [US0001M+65], 5/25/303 | | | 203,788 | | | | 204,144 | |
| Series 2017-C07,Cl. 1M2, 3.952% | |
| [US0001M+240], 5/25/303 | | | 210,000 | | | | 215,750 | |
| GSR Mortgage Loan Trust, Series 2005-AR4, | |
| Cl. 6A1, 3.522%, 7/25/3510 | | | 71,758 | | | | 72,286 | |
| HomeBanc Mortgage Trust, Series 2005-3, Cl. | |
| A2, 1.862% [US0001M+31], 7/25/353 | | | 31,399 | | | | 31,388 | |
| MASTR Asset Backed Securities Trust, Series 2006-WMC3, Cl. A3, 1.652% [US0001M+10], 8/25/363 | | | 47,377 | | | | 25,630 | |
| RALI Trust: | |
| Series 2006-QS13,Cl. 1A8, 6.00%, 9/25/36 | | | 709 | | | | 633 | |
| Series 2007-QS6,Cl. A28, 5.75%, 4/25/37 | | | 9,034 | | | | 8,505 | |
| Structured Agency Credit Risk Debt Nts.: | |
| Series 2013-DN2,Cl. M2, 5.802% | |
| [US0001M+425], 11/25/233 | | | 285,000 | | | | 317,300 | |
| Series 2014-DN1,Cl. M3, 6.052% | |
| [US0001M+450], 2/25/243 | | | 210,000 | | | | 245,505 | |
| Series 2014-DN2,Cl. M3, 5.152% | |
| [US0001M+360], 4/25/243 | | | 225,000 | | | | 251,199 | |
| Series 2014-HQ2,Cl. M2, 3.752% | |
| [US0001M+220], 9/25/243 | | | 85,859 | | | | 88,610 | |
| Series 2014-HQ2,Cl. M3, 5.302% | |
| [US0001M+375], 9/25/243 | | | 335,000 | | | | 383,214 | |
| Series 2015-HQA2,Cl. M2, 4.352% | |
| [US0001M+280], 5/25/283 | | | 64,466 | | | | 66,672 | |
| Series 2016-DNA1,Cl. M2, 4.452% | |
| [US0001M+290], 7/25/283 | | | 100,000 | | | | 103,070 | |
| Series 2016-DNA3,Cl. M1, 2.652% | |
| [US0001M+110], 12/25/283 | | | 91,870 | | | | 92,010 | |
| Series 2016-DNA4,Cl. M1, 2.352% | |
| [US0001M+80], 3/25/293 | | | 96,895 | | | | 97,092 | |
| Series 2016-DNA4,Cl. M3, 5.352% | |
| [US0001M+380], 3/25/293 | | | 325,000 | | | | 363,161 | |
| Series 2016-HQA2,Cl. M1, 2.752% | |
| [US0001M+120], 11/25/283 | | | 37,552 | | | | 37,595 | |
| Series 2016-HQA3,Cl. M1, 2.352% | |
| [US0001M+80], 3/25/293 | | | 405,314 | | | | 406,066 | |
| Series 2016-HQA3,Cl. M3, 5.402% | |
| [US0001M+385], 3/25/293 | | | 310,000 | | | | 345,650 | |
| Series 2016-HQA4,Cl. M1, 2.352% | |
| [US0001M+80], 4/25/293 | | | 267,579 | | | | 268,122 | |
| Series 2016-HQA4,Cl. M3, 5.452% | |
| [US0001M+390], 4/25/293 | | | 320,000 | | | | 356,370 | |
| Series 2017-DNA2,Cl. M2, 5.002% | |
| [US0001M+345], 10/25/293 | | | 255,000 | | | | 277,734 | |
| Series 2017-DNA3,Cl. M2, 4.052% | |
| [US0001M+250], 3/25/303 | | | 135,000 | | | | 139,989 | |
| Series 2017-HQA1,Cl. M1, 2.752% | |
| [US0001M+120], 8/25/293 | | | 243,522 | | | | 246,168 | |
| Series 2017-HQA1,Cl. M2, 5.102% | |
| [US0001M+355], 8/25/293 | | | 290,000 | | | | 313,352 | |
| Series 2017-HQA3,Cl. M1, 2.102% | |
| [US0001M+55], 4/25/303 | | | 255,665 | | | | 255,704 | |
| Series 2017-HQA3,Cl. M2, 3.902% | |
| [US0001M+235], 4/25/303 | | | 335,000 | | | | 343,333 | |
| WaMu Mortgage Pass-Through Certificates Trust: | |
| Series 2003-AR10,Cl. A7, 3.453%, 10/25/3310 | | | 85,229 | | | | 86,347 | |
| Series 2005-AR14,Cl. 1A4, 3.357%, 12/25/3510 | | | 167,366 | | | | 163,974 | |
11 OPPENHEIMER TOTAL RETURN BOND FUND/VA
STATEMENT OF INVESTMENTS Continued
| | | | | | | | |
| | | Principal Amount | | | Value | |
| Residential (Continued) | |
| WaMu Mortgage Pass-Through Certificates Trust: (Continued) | |
| Series 2005-AR16,Cl. 1A1, 3.363%, 12/25/3510 | | $ | 74,287 | | | $ | 72,698 | |
| Wells Fargo Mortgage-Backed Securities Trust: | | | | | | | | |
| Series 2005-AR15,Cl. 1A2, 3.561%, 9/25/3510 | | | 82,613 | | | | 80,282 | |
| Series 2005-AR15,Cl. 1A6, 3.561%, 9/25/3510 | | | 32,029 | | | | 30,901 | |
| Series 2005-AR4,Cl. 2A2, 3.422%, 4/25/3510 | | | 190,245 | | | | 191,486 | |
| Series 2006-AR10,Cl. 1A1, 3.354%, 7/25/3610 | | | 56,648 | | | | 55,335 | |
| Series 2006-AR10,Cl. 5A5, 3.387%, 7/25/3610 | | | 149,916 | | | | 151,579 | |
| Series 2006-AR2,Cl. 2A3, 3.544%, 3/25/3610 | | | 68,291 | | | | 69,016 | |
| Series 2006-AR7,Cl. 2A4, 3.336%, 5/25/3610 | | | 5,118 | | | | 5,081 | |
| Series 2006-AR8,Cl. 2A1, 3.568%, 4/25/3610 | | | 163,951 | | | | 166,155 | |
| Series 2006-AR8,Cl. 2A4, 3.568%, 4/25/3610 | | | 71,765 | | | | 72,730 | |
| Series 2007-16,Cl. 1A1, 6.00%, 12/28/37 | | | 54,274 | | | | 56,897 | |
| | | | | | | 10,013,454 | |
| Total Mortgage-Backed Obligations (Cost $78,617,578) | | | | | | | 77,850,316 | |
| U.S. Government Obligation—1.1% | |
United States Treasury Nts., 1.50%, 5/31/1911,12 (Cost $1,440,704) | | | 1,438,000 | | | | 1,430,912 | |
| Corporate Bonds and Notes—50.8% | |
| Consumer Discretionary—8.0% | |
| Auto Components—0.1% | |
| Lear Corp., 3.80% Sr. Unsec. Nts., 9/15/27 | | | 204,000 | | | | 204,526 | |
| Automobiles—1.8% | |
| Daimler Finance North America LLC: | | | | | | | | |
| 2.20% Sr. Unsec. Nts., 5/5/201 | | | 285,000 | | | | 283,461 | |
| 8.50% Sr. Unsec. Unsub. Nts., 1/18/31 | | | 172,000 | | | | 260,098 | |
| Ford Motor Credit Co. LLC: | | | | | | | | |
| 2.425% Sr. Unsec. Nts., 6/12/20 | | | 221,000 | | | | 219,806 | |
| 3.664% Sr. Unsec. Nts., 9/8/24 | | | 219,000 | | | | 222,102 | |
| General Motors Co., 6.25% Sr. Unsec. | | | | | | | | |
| Nts., 10/2/43 | | | 88,000 | | | | 104,513 | |
| General Motors Financial Co., Inc., 3.15% Sr. Unsec. Nts., 6/30/22 | | | 301,000 | | | | 301,040 | |
| Harley-Davidson, Inc., 4.625% Sr. Unsec. Nts., 7/28/45 | | | 93,000 | | | | 101,339 | |
| Hyundai Capital America, 1.75% Sr. Unsec. Nts., 9/27/191 | | | 347,000 | | | | 340,527 | |
| Nissan Motor Acceptance Corp., 2.15% Sr. Unsec. Nts., 9/28/201 | | | 217,000 | | | | 215,276 | |
| Volkswagen Group of America Finance | | | | | | | | |
| LLC, 2.45% Sr. Unsec. Nts., 11/20/191 | | | 338,000 | | | | 337,909 | |
| | | | | | | | 2,386,071 | |
| Diversified Consumer Services—0.3% | |
| Service Corp. International, 4.625% Sr. | | | | | | | | |
Unsec. Nts., 12/15/27 | | | 340,000 | | | | 345,821 | |
| Hotels, Restaurants & Leisure—0.5% | |
| Aramark Services, Inc., 5.00% Sr. Unsec. Nts., 4/1/251 | | | 163,000 | | | | 172,584 | |
| Marriott International, Inc., 3.25% Sr. Unsec. Nts., 9/15/22 | | | 148,000 | | | | 150,854 | |
| Royal Caribbean Cruises Ltd., 2.65% Sr. Unsec. Nts., 11/28/20 | | | 287,000 | | | | 286,965 | |
| | | | | | | 610,403 | |
| | | | | | | | |
| | | Principal Amount | | | Value | |
| Household Durables—1.4% | |
| DR Horton, Inc., 2.55% Sr. Unsec. Nts., 12/1/20 | | $ | 296,000 | | | $ | 295,742 | |
| Leggett & Platt, Inc., 3.50% Sr. Unsec. Nts., 11/15/27 | | | 161,000 | | | | 159,719 | |
| Lennar Corp., 4.75% Sr. Unsec. Nts., 5/30/25 | | | 334,000 | | | | 348,195 | |
| Newell Brands, Inc.: | | | | | | | | |
| 5.00% Sr. Unsec. Nts., 11/15/23 | | | 346,000 | | | | 365,243 | |
| 5.50% Sr. Unsec. Nts., 4/1/46 | | | 98,000 | | | | 117,012 | |
| PulteGroup, Inc., 5.00% Sr. Unsec. Nts., 1/15/27 | | | 251,000 | | | | 263,236 | |
| Toll Brothers Finance Corp.: | | | | | | | | |
| 4.375% Sr. Unsec. Nts., 4/15/23 | | | 257,000 | | | | 267,601 | |
| 4.875% Sr. Unsec. Nts., 3/15/27 | | | 75,000 | | | | 78,000 | |
| | | | | | | | 1,894,748 | |
| Internet & Catalog Retail—0.5% | |
| Amazon.com, Inc., 4.95% Sr. Unsec. Nts., 12/5/44 | | | 100,000 | | | | 121,931 | |
| QVC, Inc., 4.45% Sr. Sec. Nts., 2/15/25 | | | 565,000 | | | | 577,063 | |
| | | | | | | | 698,994 | |
| Media—1.4% | |
| 21st Century Fox America, Inc., 4.75% Sr. Unsec. Nts., 11/15/46 | | | 132,000 | | | | 153,289 | |
| Charter Communications Operating LLC/ Charter Communications Operating Capital, 5.375% Sr. Sec. Nts., 5/1/47 | | | 139,000 | | | | 142,933 | |
| Comcast Cable Communications Holdings, Inc., 9.455% Sr. Unsec. Nts., 11/15/22 | | | 306,000 | | | | 400,008 | |
| Interpublic Group of Cos., Inc. (The), 4.20% Sr. Unsec. Nts., 4/15/24 | | | 311,000 | | | | 326,579 | |
| Sky plc: | | | | | | | | |
| 3.75% Sr. Unsec. Nts., 9/16/241 | | | 152,000 | | | | 158,729 | |
| 6.10% Sr. Unsec. Nts., 2/15/181 | | | 116,000 | | | | 116,544 | |
| Time Warner Cable LLC, 4.50% Sr. Unsec. Unsub. Nts., 9/15/42 | | | 236,000 | | | | 222,043 | |
| Virgin Media Secured Finance plc, 5.25% Sr. Sec. Nts., 1/15/261 | | | 319,000 | | | | 323,386 | |
| | | | | | | | 1,843,511 | |
| Multiline Retail—0.2% | |
| Dollar Tree, Inc., 5.75% Sr. Sec. Nts., 3/1/23 | | | 307,000 | | | | 322,158 | |
| Specialty Retail—1.2% | |
| AutoZone, Inc., 1.625% Sr. Unsec. Nts., 4/21/19 | | | 64,000 | | | | 63,482 | |
| Best Buy Co., Inc., 5.50% Sr. Unsec. Nts., 3/15/21 | | | 286,000 | | | | 308,276 | |
| L Brands, Inc., 5.625% Sr. Unsec. Nts., 2/15/22 | | | 322,000 | | | | 344,943 | |
| Ross Stores, Inc., 3.375% Sr. Unsec. Nts., 9/15/24 | | | 355,000 | | | | 360,177 | |
| Sally Holdings LLC/Sally Capital, Inc., 5.625% Sr. Unsec. Nts., 12/1/25 | | | 170,000 | | | | 170,000 | |
| Signet UK Finance plc, 4.70% Sr. Unsec. | | | | | | | | |
| Nts., 6/15/24 | | | 342,000 | | | | 337,134 | |
| | | | | | | | 1,584,012 | |
| Textiles, Apparel & Luxury Goods—0.6% | |
| Hanesbrands, Inc., 4.875% Sr. Unsec. Nts., 5/15/261 | | | 325,000 | | | | 334,750 | |
| Levi Strauss & Co., 5.00% Sr. Unsec. Nts., 5/1/25 | | | 239,000 | | | | 250,352 | |
| PVH Corp., 4.50% Sr. Unsec. Unsub. Nts., 12/15/22 | | | 154,000 | | | | 157,450 | |
| | | | | | | 742,552 | |
12 OPPENHEIMER TOTAL RETURN BOND FUND/VA
| | | | | | | | |
| | | Principal Amount | | | Value | |
| Consumer Staples—4.9% | |
| Beverages—1.5% | |
| Anheuser-Busch InBev Finance, Inc.: | | | | | | | | |
| 1.90% Sr. Unsec. Nts., 2/1/19 | | $ | 408,000 | | | $ | 407,234 | |
| 3.65% Sr. Unsec. Nts., 2/1/26 | | | 85,000 | | | | 87,845 | |
| 4.90% Sr. Unsec. Nts., 2/1/46 | | | 74,000 | | | | 86,032 | |
| Anheuser-Busch InBev Worldwide, Inc., 8.20% Sr. Unsec. Unsub. Nts., 1/15/39 | | | 230,000 | | | | 366,660 | |
| Constellation Brands, Inc., 2.25% Sr. Unsec. Nts., 11/6/20 | | | 335,000 | | | | 332,129 | |
| Molson Coors Brewing Co.: | | | | | | | | |
| 2.10% Sr. Unsec. Nts., 7/15/21 | | | 309,000 | | | | 303,085 | |
| 4.20% Sr. Unsec. Nts., 7/15/46 | | | 48,000 | | | | 49,070 | |
| Pernod Ricard SA, 4.25% Sr. Unsec. Nts., 7/15/221 | | | 307,000 | | | | 325,403 | |
| | | | | | | | 1,957,458 | |
| Food & Staples Retailing—0.7% | |
| Alimentation Couche-Tard, Inc., 2.35% Sr. Unsec. Nts., 12/13/191 | | | 343,000 | | | | 343,100 | |
| CVS Health Corp.: | | | | | | | | |
| 2.125% Sr. Unsec. Nts., 6/1/21 | | | 334,000 | | | | 326,187 | |
| 5.125% Sr. Unsec. Nts., 7/20/45 | | | 75,000 | | | | 86,215 | |
| Kroger Co. (The): | | | | | | | | |
| 2.00% Sr. Unsec. Nts., 1/15/19 | | | 15,000 | | | | 14,976 | |
| 6.90% Sr. Unsec. Nts., 4/15/38 | | | 79,000 | | | | 102,365 | |
| | | | | | | | 872,843 | |
| Food Products—1.6% | |
| Bunge Ltd. Finance Corp.: | | | | | | | | |
| 3.25% Sr. Unsec. Nts., 8/15/26 | | | 216,000 | | | | 206,751 | |
| 8.50% Sr. Unsec. Nts., 6/15/19 | | | 305,000 | | | | 330,484 | |
| Kraft Heinz Foods Co.: | | | | | | | | |
| 3.95% Sr. Unsec. Nts., 7/15/25 | | | 177,000 | | | | 183,064 | |
| 4.375% Sr. Unsec. Nts., 6/1/46 | | | 117,000 | | | | 116,258 | |
| Lamb Weston Holdings, Inc., 4.875% Sr. Unsec. Nts., 11/1/261 | | | 184,000 | | | | 192,740 | |
| Mondelez International Holdings Netherlands BV, 1.625% Sr. Unsec. Nts., 10/28/191 | | | 353,000 | | | | 348,021 | |
| Smithfield Foods, Inc., 2.70% Sr. Unsec. Nts., 1/31/201 | | | 338,000 | | | | 336,112 | |
| TreeHouse Foods, Inc., 6.00% Sr. Unsec. Nts., 2/15/241 | | | 211,000 | | | | 220,495 | |
| Tyson Foods, Inc., 3.55% Sr. Unsec. Nts., 6/2/27 | | | 164,000 | | | | 168,209 | |
| | | | | | | | 2,102,134 | |
| Tobacco—1.1% | |
| Altria Group, Inc., 4.00% Sr. Unsec. Nts., 1/31/24 | | | 231,000 | | | | 245,213 | |
| BAT Capital Corp.: | | | | | | | | |
| 2.297% Sr. Unsec. Nts., 8/14/201 | | | 330,000 | | | | 328,369 | |
| 3.557% Sr. Unsec. Nts., 8/15/271 | | | 169,000 | | | | 169,512 | |
| Imperial Brands Finance plc, 2.05% Sr. Unsec. Nts., 7/20/181 | | | 357,000 | | | | 356,725 | |
| Philip Morris International, Inc., 2.50% Sr. Unsec. Nts., 11/2/22 | | | 288,000 | | | | 285,591 | |
| Reynolds American, Inc., 5.85% Sr. Unsec. Nts., 8/15/45 | | | 115,000 | | | | 144,027 | |
| | | | | | | | 1,529,437 | |
| Energy—4.1% | |
| Energy Equipment & Services—0.4% | |
| Halliburton Co., 5.00% Sr. Unsec. Nts., 11/15/45 | | | 74,000 | | | | 85,238 | |
| Helmerich & Payne International Drilling Co., 4.65% Sr. Unsec. Nts., 3/15/25 | | | 194,000 | | | | 204,473 | |
| Schlumberger Holdings Corp., 4.00% Sr. Unsec. Nts., 12/21/251 | | | 184,000 | | | | 193,629 | |
| | | | | | | 483,340 | |
| | | | | | | | |
| | | Principal Amount | | | Value | |
| Oil, Gas & Consumable Fuels—3.7% | |
| Anadarko Petroleum Corp.: | | | | | | | | |
| 4.50% Sr. Unsec. Nts., 7/15/44 | | $ | 64,000 | | | $ | 63,968 | |
| 6.20% Sr. Unsec. Nts., 3/15/40 | | | 64,000 | | | | 77,799 | |
| Andeavor, 5.125% Sr. Unsec. Nts., 12/15/261 | | | 311,000 | | | | 342,281 | |
| Andeavor Logistics LP/Tesoro Logistics Finance Corp.: | | | | | | | | |
| 4.25% Sr. Unsec. Nts., 12/1/27 | | | 166,000 | | | | 167,706 | |
| 5.25% Sr. Unsec. Nts., 1/15/25 | | | 107,000 | | | | 112,666 | |
| Apache Corp., 4.75% Sr. Unsec. Nts., 4/15/43 | | | 96,000 | | | | 98,944 | |
| Boardwalk Pipelines LP, 4.95% Sr. Unsec. Nts., 12/15/24 | | | 156,000 | | | | 167,324 | |
| BP Capital Markets plc, 1.676% Sr. Unsec. Nts., 5/3/19 | | | 328,000 | | | | 326,310 | |
| Buckeye Partners LP, 3.95% Sr. Unsec. Nts., 12/1/26 | | | 85,000 | | | | 83,680 | |
| Chevron Corp., 1.561% Sr. Unsec. Nts., 5/16/19 | | | 352,000 | | | | 350,029 | |
| Columbia Pipeline Group, Inc.: | | | | | | | | |
| 3.30% Sr. Unsec. Nts., 6/1/20 | | | 302,000 | | | | 306,466 | |
| 4.50% Sr. Unsec. Nts., 6/1/25 | | | 162,000 | | | | 172,714 | |
| ConocoPhillips Co.: | | | | | | | | |
| 4.95% Sr. Unsec. Nts., 3/15/26 | | | 42,000 | | | | 47,741 | |
| 5.95% Sr. Unsec. Nts., 3/15/46 | | | 70,000 | | | | 94,575 | |
| Devon Energy Corp., 4.75% Sr. Unsec. Nts., 5/15/42 | | | 74,000 | | | | 78,579 | |
| Energy Transfer LP, 5.30% Sr. Unsec. Nts., 4/15/47 | | | 94,000 | | | | 93,679 | |
| EnLink Midstream Partners LP, 4.85% Sr. Unsec. Nts., 7/15/26 | | | 74,000 | | | | 77,655 | |
| Enterprise Products Operating LLC: | | | | | | | | |
| 4.85% Sr. Unsec. Nts., 8/15/42 | | | 79,000 | | | | 86,999 | |
| 4.90% Sr. Unsec. Nts., 5/15/46 | | | 27,000 | | | | 29,840 | |
| EQT Corp., 2.50% Sr. Unsec. Nts., 10/1/20 | | | 340,000 | | | | 337,828 | |
| Kinder Morgan, Inc., 5.55% Sr. Unsec. Nts., 6/1/45 | | | 253,000 | | | | 277,662 | |
| Marathon Oil Corp., 4.40% Sr. Unsec. Nts., 7/15/27 | | | 175,000 | | | | 183,184 | |
| Noble Energy, Inc., 5.05% Sr. Unsec. Nts., 11/15/44 | | | 92,000 | | | | 98,832 | |
| ONEOK Partners LP: | | | | | | | | |
| 4.90% Sr. Unsec. Nts., 3/15/25 | | | 135,000 | | | | 144,933 | |
| 8.625% Sr. Unsec. Nts., 3/1/19 | | | 143,000 | | | | 152,665 | |
| Phillips 66 Partners LP, 3.605% Sr. Unsec. Nts., 2/15/25 | | | 164,000 | | | | 165,443 | |
| Sabine Pass Liquefaction LLC, 4.20% Sr. Sec. Nts., 3/15/28 | | | 176,000 | | | | 178,374 | |
| Shell International Finance BV, 4.00% Sr. Unsec. Nts., 5/10/46 | | | 115,000 | | | | 122,680 | |
| Sunoco Logistics Partners Operations LP, 4.00% Sr. Unsec. Nts., 10/1/27 | | | 190,000 | | | | 186,622 | |
| Williams Partners LP: | | | | | | | | |
| 3.75% Sr. Unsec. Nts., 6/15/27 | | | 131,000 | | | | 131,489 | |
| 5.25% Sr. Unsec. Nts., 3/15/20 | | | 145,000 | | | | 153,238 | |
| Woodside Finance Ltd., 8.75% Sr. Unsec. Nts., 3/1/191 | | | 3,000 | | | | 3,212 | |
| | | | | | | | 4,915,117 | |
| Financials—13.8% | |
| Capital Markets—2.9% | |
| Apollo Management Holdings LP, 4.00% Sr. Unsec. Nts., 5/30/241 | | | 201,000 | | | | 205,907 | |
| Blackstone Holdings Finance Co. LLC, 3.15% Sr. Unsec. Nts., 10/2/271 | | | 142,000 | | | | 139,764 | |
| Brookfield Asset Management, Inc., 4.00% Sr. Unsec. Nts., 1/15/25 | | | 332,000 | | | | 341,146 | |
13 OPPENHEIMER TOTAL RETURN BOND FUND/VA
STATEMENT OF INVESTMENTS Continued
| | | | | | | | |
| | | Principal Amount | | | Value | |
| |
| Capital Markets (Continued) | |
| |
| Credit Suisse AG (New York), 3.625% Sr. | | | | | | | | |
| Unsec. Nts., 9/9/24 | | $ | 189,000 | | | $ | 195,697 | |
| |
| Credit Suisse Group Funding Guernsey | | | | | | | | |
| Ltd., 4.55% Sr. Unsec. Nts., 4/17/26 | | | 130,000 | | | | 139,395 | |
| |
| E*TRADE Financial Corp., 5.875% | | | | | | | | |
| [US0003M+443.5] Jr. Sub. Perpetual | | | | | | | | |
| Bonds3,13 | | | 308,000 | | | | 327,250 | |
| |
| Goldman Sachs Group, Inc. (The): | | | | | | | | |
| 3.50% Sr. Unsec. Nts., 11/16/26 | | | 202,000 | | | | 203,340 | |
| 3.75% Sr. Unsec. Nts., 2/25/26 | | | 194,000 | | | | 199,351 | |
| 4.017% [US0003M+137.3] Sr. Unsec. Nts., 10/31/383 | | | 136,000 | | | | 140,042 | |
| |
| Morgan Stanley: | | | | | | | | |
| 4.375% Sr. Unsec. Nts., 1/22/47 | | | 248,000 | | | | 272,289 | |
| 5.00% Sub. Nts., 11/24/25 | | | 312,000 | | | | 341,882 | |
| |
| MSCI, Inc., 4.75% Sr. Unsec. Nts., 8/1/261 | | | 328,000 | | | | 345,220 | |
| |
| Northern Trust Corp., 3.375% [US0003M+113.1] Sub. Nts., 5/8/323 | | | 145,000 | | | | 144,592 | |
| |
| Raymond James Financial, Inc., 3.625% | | | | | | | | |
| Sr. Unsec. Nts., 9/15/26 | | | 202,000 | | | | 203,269 | |
| |
S&P Global, Inc., 2.50% Sr. Unsec. Nts., 8/15/18 | | | 226,000 | | | | 226,687 | |
| |
| TD Ameritrade Holding Corp., 3.30% Sr. | | | | | | | | |
| Unsec. Nts., 4/1/27 | | | 206,000 | | | | 208,054 | |
| |
| UBS Group Funding Switzerland AG: | | | | | | | | |
| 4.125% Sr. Unsec. Nts., 4/15/261 | | | 128,000 | | | | 134,415 | |
| 4.253% Sr. Unsec. Nts., 3/23/281 | | | 135,000 | | | | 142,480 | |
| | | | | | | | |
| | | | | | | 3,910,780 | |
| |
| Commercial Banks—6.7% | |
|
| |
| ABN AMRO Bank NV, 4.40% [USSW5+219.7] Sub. Nts., 3/27/283 | | | 383,000 | | | | 394,826 | |
| |
| Australia & New Zealand Banking Group | | | | | | | | |
Ltd. (New York), 2.625% Sr. Unsec. Nts., 5/19/22 | | | 335,000 | | | | 334,073 | |
| |
| Bank of America Corp.: | | | | | | | | |
| 3.248% Sr. Unsec. Nts., 10/21/27 | | | 269,000 | | | | 267,186 | |
| 3.824% [US0003M+157.5] Sr. Unsec. | | | | | | | | |
| Nts., 1/20/283 | | | 185,000 | | | | 191,524 | |
| 7.75% Jr. Sub. Nts., 5/14/38 | | | 232,000 | | | | 348,444 | |
| |
Barclays plc, 4.375% Sr. Unsec. Nts., 1/12/26 | | | 326,000 | | | | 339,854 | |
| |
BB&T Corp., 2.85% Sr. Unsec. Nts., 10/26/24 | | | 277,000 | | | | 275,170 | |
| |
BNP Paribas SA, 4.625% Sub. Nts., 3/13/271 | | | 234,000 | | | | 250,027 | |
| |
| BPCE SA, 4.50% Sub. Nts., 3/15/251 | | | 234,000 | | | | 244,897 | |
| |
| Citigroup, Inc., 4.281% | | | | | | | | |
[US0003M+183.9] Sr. Unsec. Nts., 4/24/483 | | | 334,000 | | | | 363,837 | |
| |
| Citizens Bank NA (Providence RI): | | | | | | | | |
| 2.55% Sr. Unsec. Nts., 5/13/21 | | | 192,000 | | | | 191,424 | |
| 2.65% Sr. Unsec. Nts., 5/26/22 | | | 81,000 | | | | 80,332 | |
| |
Commonwealth Bank of Australia, 3.15% Sr. Unsec. Nts., 9/19/271 | | | 278,000 | | | | 274,345 | |
| |
Compass Bank, 2.875% Sr. Unsec. Nts., 6/29/22 | | | 345,000 | | | | 341,706 | |
| |
Credit Agricole SA, 4.375% Sub. Nts., 3/17/251 | | | 395,000 | | | | 413,307 | |
| |
| Fifth Third Bank (Cincinnati OH), 3.85% | | | | | | | | |
| Sub. Nts., 3/15/26 | | | 206,000 | | | | 212,832 | |
| |
First Republic Bank, 4.375% Sub. Nts., 8/1/46 | | | 139,000 | | | | 142,556 | |
| |
| Glencore Funding LLC, 4.00% Sr. Unsec. | | | | | | | | |
| Nts., 4/16/251 | | | 193,000 | | | | 195,244 | |
| |
| HSBC Holdings plc, 4.041% | | | | | | | | |
[US0003M+154.6] Sr. Unsec. Nts., 3/13/283 | | | 156,000 | | | | 162,715 | |
| | | | | | | | |
| | | Principal Amount | | | Value | |
| |
| Commercial Banks (Continued) | |
| |
| Huntington Bancshares, Inc., 3.15% Sr. Unsec. Nts., 3/14/21 | | $ | 218,000 | | | $ | 221,573 | |
| |
| Intesa Sanpaolo SpA, 3.875% Sr. Unsec. Nts., 7/14/271 | | | 279,000 | | | | 279,340 | |
| |
| JPMorgan Chase & Co.: 3.54% [US0003M+138] Sr. Unsec. Nts., 5/1/283 | | | 271,000 | | | | 275,948 | |
| 3.782% [US0003M+133.7] Sr. Unsec. Nts., 2/1/283 | | | 538,000 | | | | 557,987 | |
| |
| Lloyds Banking Group plc, 6.657% [US0003M+127] Jr. Sub. Perpetual Bonds1,3,13 | | | 334,000 | | | | 391,615 | |
| |
| PNC Financial Services Group, Inc. (The), 3.15% Sr. Unsec. Nts., 5/19/27 | | | 301,000 | | | | 302,304 | |
| |
| Regions Bank (Birmingham AL), 2.25% Sr. Unsec. Nts., 9/14/18 | | | 287,000 | | | | 287,355 | |
| |
| Regions Financial Corp., 2.75% Sr. | | | | | | | | |
| Unsec. Nts., 8/14/22 | | | 228,000 | | | | 227,497 | |
| |
| Royal Bank of Scotland Group plc, | | | | | | | | |
| 3.498% [US0003M+148] Sr. Unsec. | | | | | | | | |
| Nts., 5/15/233 | | | 238,000 | | | | 238,729 | |
| |
| SunTrust Bank (Atlanta GA), 3.30% Sub. | | | | | | | | |
| Nts., 5/15/26 | | | 151,000 | | | | 149,780 | |
| |
| Synovus Financial Corp., 3.125% Sr. | | | | | | | | |
| Unsec. Nts., 11/1/22 | | | 201,000 | | | | 199,583 | |
| |
| US Bancorp: | | | | | | | | |
| 3.10% Sub. Nts., 4/27/26 | | | 204,000 | | | | 202,730 | |
| 3.15% Sr. Unsec. Nts., 4/27/27 | | | 82,000 | | | | 82,225 | |
| |
| Wells Fargo & Co.: | | | | | | | | |
| 3.584% [US0003M+131] Sr. Unsec. | | | | | | | | |
| Nts., 5/22/283 | | | 272,000 | | | | 277,542 | |
| 4.75% Sub. Nts., 12/7/46 | | | 194,000 | | | | 217,158 | |
| | | | | | | | |
| | | | | | | 8,935,665 | |
| |
| Consumer Finance—0.8% | |
| |
| American Express Co., 2.50% Sr. Unsec. | | | | | | | | |
| Nts., 8/1/22 | | | 137,000 | | | | 135,474 | |
| |
| American Express Credit Corp., 3.30% | | | | | | | | |
| Sr. Unsec. Nts., 5/3/27 | | | 205,000 | | | | 208,215 | |
| |
| Capital One Financial Corp., 3.75% Sr. | | | | | | | | |
| Unsec. Nts., 3/9/27 | | | 135,000 | | | | 136,664 | |
| |
| Discover Financial Services: | | | | | | | | |
| 3.75% Sr. Unsec. Nts., 3/4/25 | | | 137,000 | | | | 138,082 | |
| 4.10% Sr. Unsec. Nts., 2/9/27 | | | 134,000 | | | | 137,477 | |
| |
| Electricite de France SA, 6.50% Sr. | | | | | | | | |
| Unsec. Nts., 1/26/191 | | | 246,000 | | | | 257,345 | |
| | | | | | | | |
| | | | | | | 1,013,257 | |
| |
| Diversified Financial Services—0.6% | |
| |
| Berkshire Hathaway Energy Co., 2.00% | | | | | | | | |
| Sr. Unsec. Nts., 11/15/18 | | | 102,000 | | | | 102,099 | |
| |
| Peachtree Corners Funding Trust, | | | | | | | | |
| 3.976% Sr. Unsec. Nts., 2/15/251 | | | 134,000 | | | | 138,155 | |
| |
| Precision Castparts Corp., 2.50% Sr. | | | | | | | | |
| Unsec. Nts., 1/15/23 | | | 204,000 | | | | 202,823 | |
| |
| Voya Financial, Inc., 5.65% | | | | | | | | |
| [US0003M+358] Jr. Sub. Nts., 5/15/533 | | | 315,000 | | | | 336,262 | |
| | | | | | | | |
| | | | | | | 779,339 | |
| |
| Insurance—1.2% | |
| |
| AXIS Specialty Finance plc, 5.15% Sr. | | | | | | | | |
| Unsec. Nts., 4/1/45 | | | 167,000 | | | | 179,712 | |
| |
| Brighthouse Financial, Inc., 3.70% Sr. | | | | | | | | |
| Unsec. Nts., 6/22/271 | | | 87,000 | | | | 85,706 | |
| |
| CNA Financial Corp., 3.45% Sr. Unsec. | | | | | | | | |
| Nts., 8/15/27 | | | 239,000 | | | | 235,932 | |
| |
| Manulife Financial Corp., 4.061% | | | | | | | | |
| [USISDA05+164.7] Sub. Nts., 2/24/323 | | | 202,000 | | | | 203,853 | |
| |
| Marsh & McLennan Cos., Inc., 4.35% Sr. | | | | | | | | |
| Unsec. Nts., 1/30/47 | | | 106,000 | | | | 117,801 | |
14 OPPENHEIMER TOTAL RETURN BOND FUND/VA
| | | | | | | | |
| | | Principal Amount | | | Value | |
| |
| Insurance (Continued) | |
| |
| MetLife, Inc., 5.25% [US0003M+357.5] | | | | | | | | |
| Jr. Sub. Perpetual Bonds3,13 | | $ | 258,000 | | | $ | 268,898 | |
| |
| Nuveen Finance LLC, 4.125% Sr. Unsec. | | | | | | | | |
| Nts., 11/1/241 | | | 257,000 | | | | 271,572 | |
| |
| Prudential Financial, Inc., 5.20% | | | | | | | | |
| [US0003M+304] Jr. Sub. Nts., 3/15/443 | | | 253,000 | | | | 269,761 | |
| | | | | | | | |
| | | | | | | 1,633,235 | |
| |
| Real Estate Investment Trusts (REITs)—1.4% | |
| |
| American Tower Corp.: | | | | | | | | |
| 2.80% Sr. Unsec. Nts., 6/1/20 | | | 96,000 | | | | 96,646 | |
| 3.00% Sr. Unsec. Nts., 6/15/23 | | | 281,000 | | | | 280,571 | |
| 5.05% Sr. Unsec. Unsub. Nts., 9/1/20 | | | 185,000 | | | | 196,360 | |
| |
| Crown Castle International Corp., 3.65% | | | | | | | | |
| Sr. Unsec. Nts., 9/1/27 | | | 170,000 | | | | 169,876 | |
| |
| Digital Realty Trust LP: | | | | | | | | |
| 3.40% Sr. Unsec. Nts., 10/1/20 | | | 29,000 | | | | 29,589 | |
| 5.875% Sr. Unsec. Nts., 2/1/20 | | | 118,000 | | | | 125,202 | |
| |
| HCP, Inc., 2.625% Sr. Unsec. Nts., 2/1/20 | | | 326,000 | | | | 327,299 | |
| |
| Lamar Media Corp., 5.75% Sr. Unsec. Nts., 2/1/26 | | | 307,000 | | | | 328,874 | |
| |
| Ventas Realty LP/Ventas Capital Corp., 2.00% Sr. Unsec. Nts., 2/15/18 | | | 95,000 | | | | 94,997 | |
| |
| VEREIT Operating Partnership LP, 3.00% Sr. Unsec. Nts., 2/6/19 | | | 126,000 | | | | 126,631 | |
| |
Welltower, Inc., 2.25% Sr. Unsec. Nts., 3/15/18 | | | 75,000 | | | | 75,033 | |
| | | | | | | | |
| | | | | | | 1,851,078 | |
| |
| Thrifts & Mortgage Finance—0.2% | |
| |
| Nationwide Building Society, 4.125% | | | | | | | | |
| [USISDA05+184.9] Sub. Nts., 10/18/323 | | | 202,000 | | | | 202,413 | |
| |
| Health Care—4.9% | |
| |
| Biotechnology—1.0% | |
| |
| AbbVie, Inc.: | | | | | | | | |
| 3.60% Sr. Unsec. Nts., 5/14/25 | | | 202,000 | | | | 207,948 | |
| 4.70% Sr. Unsec. Nts., 5/14/45 | | | 62,000 | | | | 69,360 | |
| |
| Biogen, Inc., 5.20% Sr. Unsec. Nts., 9/15/45 | | | 77,000 | | | | 91,682 | |
| |
| Celgene Corp.: | | | | | | | | |
| 3.875% Sr. Unsec. Nts., 8/15/25 | | | 195,000 | | | | 202,117 | |
| 5.00% Sr. Unsec. Nts., 8/15/45 | | | 39,000 | | | | 44,383 | |
| |
| Gilead Sciences, Inc., 4.75% Sr. Unsec. Nts., 3/1/46 | | | 124,000 | | | | 143,656 | |
| |
| Shire Acquisitions Investments Ireland DAC: | | | | | | | | |
| 1.90% Sr. Unsec. Nts., 9/23/19 | | | 354,000 | | | | 350,905 | |
| 3.20% Sr. Unsec. Nts., 9/23/26 | | | 276,000 | | | | 270,294 | |
| | | | | | | | |
| | | | | | | 1,380,345 | |
| |
| Health Care Equipment & Supplies—1.2% | |
| |
| Abbott Laboratories: | | | | | | | | |
| 2.35% Sr. Unsec. Nts., 11/22/19 | | | 349,000 | | | | 349,196 | |
| 3.75% Sr. Unsec. Nts., 11/30/26 | | | 292,000 | | | | 300,316 | |
| |
| Becton Dickinson & Co.: | | | | | | | | |
| 2.404% Sr. Unsec. Nts., 6/5/20 | | | 213,000 | | | | 211,955 | |
| 3.70% Sr. Unsec. Nts., 6/6/27 | | | 252,000 | | | | 254,362 | |
| |
| Boston Scientific Corp., 3.85% Sr. Unsec. Nts., 5/15/25 | | | 260,000 | | | | 267,665 | |
| |
| Hologic, Inc., 4.375% Sr. Unsec. Nts., 10/15/251 | | | 13,000 | | | | 13,228 | |
| |
| Medtronic, Inc., 4.625% Sr. Unsec. Nts., 3/15/45 | | | 136,000 | | | | 158,691 | |
| | | | | | | 1,555,413 | |
| |
| Health Care Providers & Services—1.5% | |
| |
Anthem, Inc., 2.50% Sr. Unsec. Nts., 11/21/20 | | | 330,000 | | | | 329,514 | |
| |
| Cigna Corp., 5.125% Sr. Unsec. Nts., 6/15/20 | | | 286,000 | | | | 303,576 | |
| | | | | | | | |
| | | Principal Amount | | | Value | |
| |
| Health Care Providers & Services (Continued) | |
| |
| Fresenius Medical Care US Finance II, Inc., 5.875% Sr. Unsec. Nts., 1/31/221 | | $ | 431,000 | | | $ | 474,895 | |
| |
Humana, Inc., 2.50% Sr. Unsec. Nts., 12/15/20 | | | 86,000 | | | | 85,988 | |
| |
| Laboratory Corp. of America Holdings: | | | | | | | | |
| 2.625% Sr. Unsec. Nts., 2/1/20 | | | 326,000 | | | | 327,005 | |
| 3.60% Sr. Unsec. Nts., 2/1/25 | | | 204,000 | | | | 207,476 | |
| |
| UnitedHealth Group, Inc., 2.75% Sr. | | | | | | | | |
| Unsec. Nts., 2/15/23 | | | 270,000 | | | | 270,681 | |
| | | | | | | | |
| | | | | | | 1,999,135 | |
| |
| Life Sciences Tools & Services—0.7% | |
| |
| Life Technologies Corp., 6.00% Sr. | | | | | | | | |
| Unsec. Nts., 3/1/20 | | | 237,000 | | | | 253,773 | |
| |
| Quintiles IMS, Inc., 5.00% Sr. Unsec. | | | | | | | | |
| Nts., 10/15/261 | | | 319,000 | | | | 328,171 | |
| |
| Thermo Fisher Scientific, Inc.: | | | | | | | | |
| 3.20% Sr. Unsec. Nts., 8/15/27 | | | 168,000 | | | | 166,804 | |
| 4.15% Sr. Unsec. Nts., 2/1/24 | | | 121,000 | | | | 128,493 | |
| | | | | | | | |
| | | | | | | 877,241 | |
| |
| Pharmaceuticals—0.5% | |
| |
| Allergan Funding SCS: | | | | | | | | |
| 3.00% Sr. Unsec. Nts., 3/12/20 | | | 329,000 | | | | 332,110 | |
| 3.80% Sr. Unsec. Nts., 3/15/25 | | | 238,000 | | | | 242,609 | |
| |
Zoetis, Inc., 3.00% Sr. Unsec. Nts., 9/12/27 | | | 83,000 | | | | 81,222 | |
| | | | | | | | |
| | | | | | | 655,941 | |
| |
| Industrials—3.5% | |
| |
| Aerospace & Defense—0.8% | |
| |
| BAE Systems Holdings, Inc., 3.85% Sr. Unsec. Nts., 12/15/251 | | | 258,000 | | | | 267,940 | |
| |
Hexcel Corp., 3.95% Sr. Unsec. Nts., 2/15/27 | | | 124,000 | | | | 126,613 | |
| |
Huntington Ingalls Industries, Inc., 3.483% Sr. Unsec. Nts., 12/1/271 | | | 126,000 | | | | 125,843 | |
| |
| Northrop Grumman Corp., 4.75% Sr. | | | | | | | | |
| Unsec. Nts., 6/1/43 | | | 185,000 | | | | 214,308 | |
| |
| Rolls-Royce plc, 2.375% Sr. Unsec. Nts., 10/14/201 | | | 87,000 | | | | 86,480 | |
| |
| Textron, Inc.: | | | | | | | | |
| 3.65% Sr. Unsec. Nts., 3/15/27 | | | 83,000 | | | | 84,490 | |
| 3.875% Sr. Unsec. Nts., 3/1/25 | | | 111,000 | | | | 115,211 | |
| |
| United Technologies Corp., 1.778% Jr. Sub. Nts., 5/4/1810 | | | 60,000 | | | | 59,913 | |
| | | | | | | | |
| | | | | | | 1,080,798 | |
| |
| Air Freight & Couriers—0.0% | |
| |
FedEx Corp., 4.40% Sr. Unsec. Nts., 1/15/47 | | | 65,000 | | | | 69,581 | |
| |
| Building Products—0.4% | |
| |
| Allegion US Holding Co., Inc., 3.55% | | | | | | | | |
| Sec. Nts., 10/1/27 | | | 246,000 | | | | 243,862 | |
| |
| Owens Corning, 3.40% Sr. Unsec. Nts., 8/15/26 | | | 234,000 | | | | 230,042 | |
| | | | | | | | |
| | | | | | | 473,904 | |
| |
| Commercial Services & Supplies—0.2% | |
| |
| Republic Services, Inc., 3.80% Sr. Unsec. | | | | | | | | |
| Nts., 5/15/18 | | | 294,000 | | | | 296,059 | |
| |
| Electrical Equipment—0.3% | |
| |
Sensata Technologies BV, 4.875% Sr. Unsec. Nts., 10/15/231 | | | 334,000 | | | | 350,283 | |
| |
| Industrial Conglomerates—0.5% | |
| |
| Carlisle Cos., Inc., 3.75% Sr. Unsec. Nts., 12/1/27 | | | 177,000 | | | | 179,146 | |
| |
| Roper Technologies, Inc.: | | | | | | | | |
| 3.00% Sr. Unsec. Nts., 12/15/20 | | | 270,000 | | | | 273,380 | |
15 OPPENHEIMER TOTAL RETURN BOND FUND/VA
STATEMENT OF INVESTMENTS Continued
| | | | | | | | |
| | | Principal Amount | | | Value | |
| |
| Industrial Conglomerates (Continued) | |
| |
| Roper Technologies, Inc.: (Continued) 3.80% Sr. Unsec. Nts., 12/15/26 | | $ | 253,000 | | | $ | 261,318 | |
| | | | | | | | |
| | | | | | | 713,844 | |
| |
| Machinery—0.5% | |
| |
| CNH Industrial NV, 3.85% Sr. Unsec. Nts., 11/15/27 | | | 172,000 | | | | 171,817 | |
| |
Fortive Corp., 1.80% Sr. Unsec. Nts., 6/15/19 | | | 360,000 | | | | 357,496 | |
| |
| Wabtec Corp., 3.45% Sr. Unsec. Nts., 11/15/26 | | | 134,000 | | | | 131,258 | |
| | | | | | | | |
| | | | | | | 660,571 | |
| |
| Road & Rail—0.3% | |
| |
| Canadian Pacific Railway Co., 4.80% Sr. Unsec. Nts., 9/15/35 | | | 68,000 | | | | 79,403 | |
| |
| Penske Truck Leasing Co. LP/PTL Finance Corp., 3.40% Sr. Unsec. Nts., 11/15/261 | | | 276,000 | | | | 272,957 | |
| | | | | | | | |
| | | | | | | 352,360 | |
| |
| Trading Companies & Distributors—0.5% | |
| |
| Air Lease Corp.: | | | | | | | | |
| 3.00% Sr. Unsec. Nts., 9/15/23 | | | 148,000 | | | | 147,021 | |
| 3.625% Sr. Unsec. Nts., 4/1/27 | | | 143,000 | | | | 143,124 | |
| |
| GATX Corp., 3.50% Sr. Unsec. Nts., 3/15/28 | | | 261,000 | | | | 258,031 | |
| |
United Rentals North America, Inc., 4.625% Sr. Unsec. Nts., 10/15/25 | | | 168,000 | | | | 169,680 | |
| | | | | | | | |
| | | | | | | 717,856 | |
| |
| Information Technology—2.9% | |
| |
| Electronic Equipment, Instruments, & Components—0.4% | |
| |
| Arrow Electronics, Inc., 3.875% Sr. | | | | | | | | |
| Unsec. Nts., 1/12/28 | | | 232,000 | | | | 231,711 | |
| |
| CDW LLC/CDW Finance Corp., 5.50% Sr. Unsec. Nts., 12/1/24 | | | 54,000 | | | | 58,995 | |
| |
| Tech Data Corp., 4.95% Sr. Unsec. Nts., 2/15/27 | | | 264,000 | | | | 278,906 | |
| | | | | | | | |
| | | | | | | 569,612 | |
| |
| Internet Software & Services—0.2% | |
| |
| VeriSign, Inc.: | | | | | | | | |
| 4.75% Sr. Unsec. Nts., 7/15/27 | | | 190,000 | | | | 195,225 | |
| 5.25% Sr. Unsec. Nts., 4/1/25 | | | 99,000 | | | | 108,281 | |
| | | | | | | | |
| | | | | | | 303,506 | |
| |
| IT Services—0.5% | |
| |
| Broadridge Financial Solutions, Inc., 3.40% Sr. Unsec. Nts., 6/27/26 | | | 155,000 | | | | 153,971 | |
| |
| DXC Technology Co.: | | | | | | | | |
| 2.875% Sr. Unsec. Nts., 3/27/20 | | | 238,000 | | | | 239,273 | |
| 4.75% Sr. Unsec. Nts., 4/15/27 | | | 255,000 | | | | 271,596 | |
| | | | | | | | |
| | | | | | | 664,840 | |
| |
| Semiconductors & Semiconductor Equipment—0.1% | |
| |
Intel Corp., 3.734% Sr. Unsec. Nts., 12/8/471 | | | 101,000 | | | | 105,061 | |
| |
| Software—1.2% | |
| |
| Autodesk, Inc., 4.375% Sr. Unsec. Nts., 6/15/25 | | | 110,000 | | | | 115,581 | |
| |
| Dell International LLC/EMC Corp.: | | | | | | | | |
| 3.48% Sr. Sec. Nts., 6/1/191 | | | 255,000 | | | | 258,260 | |
| 6.02% Sr. Sec. Nts., 6/15/261 | | | 199,000 | | | | 219,727 | |
| |
| Open Text Corp., 5.625% Sr. Unsec. Nts., 1/15/231 | | | 236,000 | | | | 246,915 | |
| |
| Oracle Corp.: | | | | | | | | |
| 2.40% Sr. Unsec. Nts., 9/15/23 | | | 200,000 | | | | 197,624 | |
| 2.95% Sr. Unsec. Nts., 5/15/25 | | | 203,000 | | | | 204,026 | |
| |
| VMware, Inc.: | | | | | | | | |
| 2.30% Sr. Unsec. Nts., 8/21/20 | | | 104,000 | | | | 103,469 | |
| 3.90% Sr. Unsec. Nts., 8/21/27 | | | 171,000 | | | | 172,909 | |
| | | | | | | 1,518,511 | |
| | | | | | | | |
| | | Principal Amount | | | Value | |
| |
| Technology Hardware, Storage & Peripherals—0.5% | |
| |
Apple, Inc., 4.375% Sr. Unsec. Nts., 5/13/45 | | $ | 198,000 | | | $ | 223,410 | |
| |
| Hewlett Packard Enterprise Co., 3.60% Sr. Unsec. Nts., 10/15/20 | | | 323,000 | | | | 329,971 | |
| |
NetApp, Inc., 2.00% Sr. Unsec. Nts., 9/27/19 | | | 155,000 | | | | 153,848 | |
| | | | | | | | |
| | | | | | | 707,229 | |
| |
| Materials—3.1% | |
| |
| Chemicals—1.7% | |
| |
| Agrium, Inc.: | | | | | | | | |
| 3.375% Sr. Unsec. Nts., 3/15/25 | | | 111,000 | | | | 111,660 | |
| 4.125% Sr. Unsec. Nts., 3/15/35 | | | 75,000 | | | | 77,664 | |
| |
| CF Industries, Inc., 4.50% Sr. Sec. Nts., 12/1/261 | | | 247,000 | | | | 257,879 | |
| |
| Ecolab, Inc., 2.00% Sr. Unsec. Nts., 1/14/19 | | | 338,000 | | | | 337,502 | |
| |
| LyondellBasell Industries NV, 5.00% Sr. Unsec. Nts., 4/15/19 | | | 214,000 | | | | 219,761 | |
| |
| PolyOne Corp., 5.25% Sr. Unsec. Nts., 3/15/23 | | | 299,000 | | | | 316,192 | |
| |
| RPM International, Inc.: | | | | | | | | |
| 3.45% Sr. Unsec. Unsub. Nts., 11/15/22 | | | 285,000 | | | | 292,332 | |
| 3.75% Sr. Unsec. Nts., 3/15/27 | | | 84,000 | | | | 85,136 | |
| 4.25% Sr. Unsec. Nts., 1/15/48 | | | 81,000 | | | | 80,792 | |
| |
| Sherwin-Williams Co. (The): | | | | | | | | |
| 3.30% Sr. Unsec. Nts., 2/1/25 | | | 103,000 | | | | 102,524 | |
| 3.95% Sr. Unsec. Nts., 1/15/26 | | | 152,000 | | | | 158,737 | |
| |
| Yara International ASA, 3.80% Sr. Unsec. Nts., 6/6/261 | | | 215,000 | | | | 213,617 | |
| | | | | | | | |
| | | | | | | 2,253,796 | |
| |
| Construction Materials—0.4% | |
| |
| LafargeHolcim Finance US LLC, 3.50% Sr. Unsec. Nts., 9/22/261 | | | 75,000 | | | | 74,065 | |
| |
| Martin Marietta Materials, Inc., 3.50% Sr. Unsec. Nts., 12/15/27 | | | 161,000 | | | | 160,082 | |
| |
| Vulcan Materials Co., 3.90% Sr. Unsec. Nts., 4/1/27 | | | 254,000 | | | | 260,053 | |
| | | | | | | | |
| | | | | | | 494,200 | |
| |
| Containers & Packaging—0.6% | |
| |
| International Paper Co.: | | | | | | | | |
| 3.00% Sr. Unsec. Nts., 2/15/27 | | | 157,000 | | | | 152,475 | |
| 4.80% Sr. Unsec. Nts., 6/15/44 | | | 131,000 | | | | 143,827 | |
| |
| Packaging Corp. of America: | | | | | | | | |
| 3.65% Sr. Unsec. Nts., 9/15/24 | | | 94,000 | | | | 96,502 | |
| 4.50% Sr. Unsec. Nts., 11/1/23 | | | 168,000 | | | | 180,927 | |
| |
| Silgan Holdings, Inc., 4.75% Sr. Unsec. Nts., 3/15/251 | | | 270,000 | | | | 278,100 | |
| | | | | | | | |
| | | | | | | 851,831 | |
| |
| Metals & Mining—0.3% | |
| |
| Anglo American Capital plc: | | | | | | | | |
| 3.625% Sr. Unsec. Nts., 9/11/241 | | | 83,000 | | | | 82,681 | |
| 4.00% Sr. Unsec. Nts., 9/11/271 | | | 135,000 | | | | 134,272 | |
| |
| Goldcorp, Inc., 5.45% Sr. Unsec. Nts., 6/9/44 | | | 93,000 | | | | 108,568 | |
| | | | | | | | |
| | | | | | | 325,521 | |
| |
| Paper & Forest Products—0.1% | |
| |
| Louisiana-Pacific Corp., 4.875% Sr. | | | | | | | | |
| Unsec. Nts., 9/15/24 | | | 186,000 | | | | 192,510 | |
| |
| Telecommunication Services—2.3% | |
| |
| Diversified Telecommunication Services—2.3% | |
| |
| AT&T, Inc.: | | | | | | | | |
| 3.40% Sr. Unsec. Nts., 8/14/24 | | | 141,000 | | | | 141,897 | |
| 4.30% Sr. Unsec. Nts., 2/15/301 | | | 238,000 | | | | 238,280 | |
| 4.35% Sr. Unsec. Nts., 6/15/45 | | | 281,000 | | | | 260,030 | |
| 5.15% Sr. Unsec. Nts., 2/14/50 | | | 102,000 | | | | 102,909 | |
16 OPPENHEIMER TOTAL RETURN BOND FUND/VA
| | | | | | | | |
| | | Principal Amount | | | Value | |
| |
| Diversified Telecommunication Services (Continued) | |
| |
| British Telecommunications plc, 9.125% Sr. Unsec. Nts., 12/15/30 | | $ | 276,000 | | | $ | 413,124 | |
| |
| Deutsche Telekom International Finance BV, 2.225% Sr. Unsec. Nts., 1/17/201 | | | 336,000 | | | | 334,550 | |
| |
| Telefonica Emisiones SAU: | | | | | | | | |
| 3.192% Sr. Unsec. Nts., 4/27/18 | | | 317,000 | | | | 318,151 | |
| 4.103% Sr. Unsec. Nts., 3/8/27 | | | 90,000 | | | | 93,148 | |
| 5.213% Sr. Unsec. Nts., 3/8/47 | | | 79,000 | | | | 89,929 | |
| 7.045% Sr. Unsec. Unsub. Nts., 6/20/36 | | | 115,000 | | | | 154,630 | |
| |
| T-Mobile USA, Inc., 6.50% Sr. Unsec. Nts., 1/15/26 | | | 300,000 | | | | 328,125 | |
| |
| Verizon Communications, Inc.: | | | | | | | | |
| 1.75% Sr. Unsec. Nts., 8/15/21 | | | 127,000 | | | | 123,683 | |
| 4.125% Sr. Unsec. Nts., 8/15/46 | | | 148,000 | | | | 137,154 | |
| 4.522% Sr. Unsec. Nts., 9/15/48 | | | 264,000 | | | | 260,777 | |
| | | | | | | | |
| | | | | | | 2,996,387 | |
| |
| Utilities—3.3% | |
| |
| Electric Utilities—2.3% | |
| |
| AEP Texas, Inc., 3.85% Sr. Unsec. Nts., 10/1/251 | | | 148,000 | | | | 154,766 | |
| |
| Cleco Corporate Holdings LLC, 3.743% Sr. Sec. Nts., 5/1/26 | | | 142,000 | | | | 142,738 | |
| |
| Duke Energy Corp.: | | | | | | | | |
| 3.15% Sr. Unsec. Nts., 8/15/27 | | | 169,000 | | | | 168,073 | |
| 3.75% Sr. Unsec. Nts., 9/1/46 | | | 68,000 | | | | 67,474 | |
| |
| Edison International, 2.95% Sr. Unsec. Nts., 3/15/23 | | | 208,000 | | | | 208,536 | |
| |
| EDP Finance BV, 3.625% Sr. Unsec. Nts., 7/15/241 | | | 233,000 | | | | 234,844 | |
| |
| Emera US Finance LP, 2.15% Sr. Unsec. Nts., 6/15/19 | | | 226,000 | | | | 225,180 | |
| |
| Enel Finance International NV, 3.625% Sr. Unsec. Nts., 5/25/271 | | | 178,000 | | | | 177,151 | |
| |
Exelon Corp., 4.45% Sr. Unsec. Nts., 4/15/46 | | | 89,000 | | | | 97,027 | |
| |
| Indiana Michigan Power Co., Series K, 4.55% Sr. Unsec. Nts., 3/15/46 | | | 85,000 | | | | 97,258 | |
| |
| ITC Holdings Corp., 5.30% Sr. Unsec. Nts., 7/1/43 | | | 78,000 | | | | 94,376 | |
| |
| NextEra Energy Operating Partners LP, 4.25% Sr. Unsec. Nts., 9/15/241 | | | 30,000 | | | | 30,600 | |
| |
| Pennsylvania Electric Co., 5.20% Sr. | | | | | | | | |
| Unsec. Nts., 4/1/20 | | | 73,000 | | | | 77,085 | |
| |
| PPL WEM Ltd./Western Power Distribution Ltd., 5.375% Sr. Unsec. Unsub. Nts., 5/1/211 | | | 308,000 | | | | 330,298 | |
| |
Public Service Co. of New Mexico, 7.95% Sr. Unsec. Nts., 5/15/18 | | | 307,000 | | | | 313,421 | |
| |
| Southern Co. Gas Capital Corp., 4.40% Sr. Unsec. Nts., 5/30/47 | | | 120,000 | | | | 128,982 | |
| |
| Southern Power Co., 1.95% Sr. Unsec. Nts., 12/15/19 | | | 311,000 | | | | 308,553 | |
| |
| Trans-Allegheny Interstate Line Co., 3.85% Sr. Unsec. Nts., 6/1/251 | | | 181,000 | | | | 188,008 | |
| | | | | | | | |
| | | | | | | 3,044,370 | |
| |
| Multi-Utilities—1.0% | |
| |
| Black Hills Corp., 2.50% Sr. Unsec. Nts., 1/11/19 | | | 168,000 | | | | 168,499 | |
| |
| Dominion Energy, Inc.: | | | | | | | | |
| 2.579% Jr. Sub. Nts., 7/1/20 | | | 255,000 | | | | 255,243 | |
| 4.90% Sr. Unsec. Nts., 8/1/41 | | | 120,000 | | | | 139,063 | |
| |
| NiSource Finance Corp., 3.49% Sr. Unsec. Nts., 5/15/27 | | | 254,000 | | | | 258,961 | |
| |
| Public Service Enterprise Group, Inc., 1.60% Sr. Unsec. Nts., 11/15/19 | | | 295,000 | | | | 290,238 | |
| | | | | | | | |
| | | Principal Amount | | | Value | |
| |
| Multi-Utilities (Continued) | |
| |
| Virginia Electric & Power Co., 2.95% Sr. Unsec. Nts., 1/15/22 | | $ | 233,000 | | | $ | 236,055 | |
| | | | | | | | |
| | | | | | | 1,348,059 | |
| | | | | | | | |
| Total Corporate Bonds and Notes (Cost $65,666,524) | | | | | | | 67,377,656 | |
| |
Short-Term Notes—11.0% | | | | | |
| |
| Personal Products—0.5% | |
| Reckitt Benckiser Group LLC, 1.496%, 1/16/1814,15 | | | 600,000 | | | | 599,552 | |
| |
| Metals & Mining—0.2% | | | | | | | | |
Glencore Funding LLC, 1.617%, 1/18/1814,15 | | | 260,000 | | | | 259,738 | |
| |
| Chemicals—1.1% | | | | | | | | |
Air Liquide US LLC, 1.546%, 1/24/181,14,15 | | | 600,000 | | | | 599,366 | |
| |
| Cabot Corp., 1.951%, 1/9/1814,15 | | | 590,000 | | | | 589,776 | |
| |
Eastman Chemical Co., 1.532%, 1/9/1814,15 | | | 260,000 | | | | 259,866 | |
| | | | | | | | |
| | | | | | | 1,449,008 | |
| |
| Textiles, Apparel & Luxury Goods—0.4% | | | | | |
| VF Corp., 1.455%, 1/22/181,14,15 | | | 530,000 | | | | 529,378 | |
| |
| Electric Utilities—1.4% | | | | | | | | |
| Alliant Energy Corp., 1.951%, 1/9/1815 | | | 590,000 | | | | 589,694 | |
| |
| Kroger Co. (The), 1.70%, 1/2/1814,15 | | | 260,000 | | | | 259,952 | |
| |
| Puget Sound Energy, Inc.: | | | | | | | | |
| 1.524%, 1/3/1815 | | | 320,000 | | | | 319,926 | |
| 1.524%, 1/8/1815 | | | 260,000 | | | | 259,878 | |
| |
Sempra Energy Holdings, 1.983%, 1/22/1814,15 | | | 590,000 | | | | 589,320 | |
| | | | | | | | |
| | | | | | | 2,018,770 | |
| |
| Household Products—0.3% | | | | | | | | |
| Church & Dwight Co., Inc., 1.463%, 1/5/181,14,15 | | | 400,000 | | | | 399,870 | |
| |
| Telephone Utilities—1.6% | | | | | | | | |
| Bell Canada, 1.586%, 2/12/1814,15 | | | 590,000 | | | | 588,683 | |
| |
Deutsche Telekom AG, 1.612%, 1/11/1815 | | | 260,000 | | | | 259,828 | |
| |
| Telus Corp., 1.909%, 3/20/181,15 | | | 590,000 | | | | 587,620 | |
| |
| Vodafone Group plc, 1.672%, 1/5/1815 | | | 590,000 | | | | 589,808 | |
| | | | | | | | |
| | | | | | | 2,025,939 | |
| |
| Software—0.2% | | | | | | | | |
Thomson Reuters Corp., 1.596%, 2/12/1815 | | | 230,000 | | | | 229,487 | |
| |
| Hotels, Restaurants & Leisure—0.3% | | | | | |
| Marriott International, Inc., 1.574%, 1/19/181,14,15 | | | 390,000 | | | | 389,608 | |
| |
| Media—0.4% | | | | | | | | |
| WPP CP LLC, 1.773%, 1/10/1814,15 | | | 590,000 | | | | 589,667 | |
| |
| Computers & Peripherals—0.8% | | | | | | | | |
| Hewlett Packard Enterprise Co., 1.532%, 1/3/1815 | | | 460,000 | | | | 459,909 | |
| |
| NetApp, Inc., 1.462%, 1/3/181,14,15 | | | 530,000 | | | | 529,877 | |
| | | | | | | | |
| | | | | | | 989,786 | |
| |
| Commercial Services & Supplies—0.6% | | | | | |
| Cintas Corp., 1.772%, 1/16/181,14,15 | | | 220,000 | | | | 219,808 | |
| |
Waste Management, Inc., 1.731%, 1/2/18 1,14,15 | | | 460,000 | | | | 459,915 | |
| | | | | | | | |
| | | | | | | 679,723 | |
| |
| Paper, Containers & Packaging—0.4% | | | | | |
Avery Dennison Co., 1.813%, 1/16/1814,15 | | | 590,000 | | | | 589,495 | |
| |
| Beverages—0.4% | | | | | | | | |
| Diageo Capital plc, 1.813%, 1/18/1814,15 | | | 590,000 | | | | 589,437 | |
| |
| Household Durables—0.4% | | | | | | | | |
Mohawk Industries, Inc., 1.931%, 1/5/181,14,15 | | | 590,000 | | | | 589,808 | |
| |
| Leasing & Factoring—0.5% | | | | | | | | |
| Hitachi Capital America Corp., 2.121%, 1/4/1814,15 | | | 590,000 | | | | 589,836 | |
17 OPPENHEIMER TOTAL RETURN BOND FUND/VA
STATEMENT OF INVESTMENTS / Continued
| | | | | | | | |
| | | Principal Amount | | | Value | |
| Food Products—0.2% | |
| Tyson Foods, Inc., 2.052%, 1/8/181,14,15 | | $ | 260,000 | | | $ | 259,878 | |
| Multi-Utilities—0.4% | |
| CenterPoint Energy Resources Corp., 2.052%, 1/16/181,14,15 | | | 590,000 | | | | 589,495 | |
| Health Care Providers & Services—0.4% | |
| McKesson Corp., 1.983%, 1/22/181,14,15 | | | 590,000 | | | | 589,320 | |
| Food & Staples Retailing—0.5% | |
CVS Health Corp., 1.85%, 1/2/181,14,15 | | | 590,000 | | | | 589,891 | |
Total Short-Term Notes (Cost $14,549,459) | | | | 14,547,686 | |
| | | | | | | | |
| | | Shares | | | Value | |
Investment Company—2.1% | | | | | | | | |
Oppenheimer Institutional Government Money Market Fund, Cl. E, 1.22%16,17 (Cost $2,772,340) | | | 2,772,340 | | | $ | 2,772,340 | |
Total Investments, at Value (Cost $181,536,334) | | | 137.7% | | | | 182,466,543 | |
Net Other Assets (Liabilities) | | | (37.7) | | | | (49,955,106 | ) |
Net Assets | | | 100.0% | | | $ | 132,511,437 | |
| | | | | | | | |
Footnotes to Statement of Investments
1. Represents securities sold under Rule 144A, which are exempt from registration under the Securities Act of 1933, as amended. These securities have been determined to be liquid under guidelines established by the Board of Trustees. These securities amount to $33,068,236 or 24.96% of the Fund’s net assets at period end.
2. Restricted security. The aggregate value of restricted securities at period end was $209,511, which represents 0.16% of the Fund’s net assets. See Note 4 of the accompanying Notes. Information concerning restricted securities is as follows:
| | | | | | | | | | | | | | | | |
| Security | | Acquisition
Dates | | | Cost | | | Value | | | Unrealized
Depreciation | |
| |
| Capital Lease Funding Securitization LP, Interest-Only | | | | | | | | | | | | | | | | |
| Commercial Mtg. Pass-Through Certificates, Series 1997-CTL1, Cl. IO, 0.00%, 6/22/24 | | | 4/21/97 | | | $ | 325,285 | | | $ | 5,874 | | | $ | 319,411 | |
| Credit Acceptance Auto Loan Trust, Series 2017-3A, Cl. | | | | | | | | | | | | | | | | |
| C, 3.48%, 10/15/26 | | | 10/17/17 | | | | 204,967 | | | | 203,637 | | | | 1,330 | |
| | | | | | | | |
| | | | | | $ | 530,252 | | | $ | 209,511 | | | $ | 320,741 | |
| | | | | | | | |
3. Represents the current interest rate for a variable or increasing rate security, determined as [Referenced Rate + Basis-point spread].
4. Interest-Only Strips represent the right to receive the monthly interest payments on an underlying pool of mortgage loans. These securities typically decline in price as interest rates decline. Most other fixed income securities increase in price when interest rates decline. The principal amount of the underlying pool represents the notional amount on which current interest is calculated. The price of these securities is typically more sensitive to changes in prepayment rates than traditional mortgage-backed securities (for example, GNMA pass-throughs). Interest rates disclosed represent current yields based upon the current cost basis and estimated timing and amount of future cash flows. These securities amount to $1,668,716 or 1.26% of the Fund’s net assets at period end.
5. Interest rate is less than 0.0005%.
6. Principal-Only Strips represent the right to receive the monthly principal payments on an underlying pool of mortgage loans. The value of these securities generally increases as interest rates decline and prepayment rates rise. The price of these securities is typically more volatile than that of coupon-bearing bonds of the same maturity. Interest rates disclosed represent current yields based upon the current cost basis and estimated timing of future cash flows. These securities amount to $74,801 or 0.06% of the Fund’s net assets at period end.
7. All or a portion of the security position is when-issued or delayed delivery to be delivered and settled after period end. See Note 4 of the accompanying Notes.
8. The current amortization rate of the security’s cost basis exceeds the future interest payments currently estimated to be received. Both the amortization rate and interest payments are contingent on future mortgage pre-payment speeds and are therefore subject to change.
9. The value of this security was determined using significant unobservable inputs. See Note 3 of the accompanying Notes.
10. This interest rate resets periodically. Interest rate shown reflects the rate in effect at period end. The rate on this variable rate security is not based on a published reference rate and spread but is determined by the issuer or agent based on current market conditions.
11. All or a portion of the security position has been pledged for collateral in association with forward roll transactions. See Note 4 of the accompanying Notes.
12. All or a portion of the security position is held in accounts at a futures clearing merchant and pledged to cover margin requirements on open futures contracts and written options on futures, if applicable. The aggregate market value of such securities is $169,162. See Note 6 of the accompanying Notes.
13. This bond has no contractual maturity date, is not redeemable and contractually pays an indefinite stream of interest.
14. Security issued in an exempt transaction without registration under the Securities Act of 1933. Such securities amount to $11,251,536 or 8.49% of the Fund’s net assets, and have been determined to be liquid pursuant to guidelines adopted by the Board of Trustees.
15. Current yield as of period end.
16. Rate shown is the 7-day yield at period end.
17. Is or was an affiliate, as defined in the Investment Company Act of 1940, as amended, at or during the reporting period, by virtue of the Fund owning at least 5% of the voting securities of the issuer or as a result of the Fund and the issuer having the same investment adviser. Transactions during the reporting period in which the issuer was an affiliate are as follows:
| | | | | | | | | | | | | | | | |
| | | Shares
December 31, 2016 | | | Gross Additions | | | Gross Reductions | | | Shares
December 31, 2017 | |
| |
Oppenheimer Institutional Government Money Market Fund, Cl. E | | | 2,688,938 | | | | 193,169,634 | | | | 193,086,232 | | | | 2,772,340 | |
| | | | |
| | | Value | | | Income | | | Realized Gain (Loss) | | | Change in Unrealized Gain (Loss) | |
| |
Oppenheimer Institutional Government Money Market Fund, Cl. E | | $ | 2,772,340 | | | $ | 19,989 | | | $ | — | | | $ | — | |
| | | | | | | | | | | | | | | | | | | | | | | | | | | | |
| |
| Futures Contracts as of December 31, 2017 | | | | | | | | | | | | | |
| Description | | Buy/Sell | | | Expiration Date | | | Number of
Contracts | | | | | | Notional
Amount
(000’s) | | | Value | | | Unrealized
Appreciation/
(Depreciation) | |
| |
United States Treasury Long Bonds | | | Buy | | | | 3/20/18 | | | | 11 | | | | USD | | | | 1,684 | | | | $ 1,683,000 | | | | $ (809) | |
United States Treasury Nts., 10 yr. | | | Sell | | | | 3/20/18 | | | | 106 | | | | USD | | | | 13,216 | | | | 13,148,968 | | | | 67,426 | |
United States Treasury Nts., 2 yr | | | Sell | | | | 3/29/18 | | | | 21 | | | | USD | | | | 4,503 | | | | 4,496,297 | | | | 6,691 | |
United States Treasury Nts., 5 yr. | | | Sell | | | | 3/29/18 | | | | 3 | | | | USD | | | | 349 | | | | 348,492 | | | | 769 | |
United States Ultra Bonds | | | Buy | | | | 3/20/18 | | | | 48 | | | | USD | | | | 8,002 | | | | 8,047,500 | | | | 45,384 | |
| | | | | | | | | | | | | | | | | | | | | | | | | | | | |
| | | | | | | | | | | | | | | | | | | | | | | | | | | $ 119,461 | |
| | | | | | | | | | | | | | | | | | | | | | | | | | | | |
18 OPPENHEIMER TOTAL RETURN BOND FUND/VA
Glossary:
| | |
| |
| Definitions | | |
| H151T1Y | | US Treasury Yield Curve Rate T Note Constant Maturity 1 Year |
| ICE LIBOR | | Intercontinental Exchange London Interbank Offered Rate |
| LIBOR01M | | ICE LIBOR USD 1 Month |
| US0001M | | ICE LIBOR USD 1 Month |
| US0003M | | ICE LIBOR USD 3 Month |
| USISDA05 | | USD ICE Swap Rate 11:00am NY 5 Year |
| USSW5 | | USD Swap Semi 30/360 5 Year |
See accompanying Notes to Financial Statements.
19 OPPENHEIMER TOTAL RETURN BOND FUND/VA
STATEMENT OF ASSETS AND LIABILITIES December 31, 2017
| | | | | | |
| | | |
Assets | | | | | | |
Investments, at value—see accompanying statement of investments: | | | | | | |
Unaffiliated companies (cost $178,763,994) | | | | $ | 179,694,203 | |
Affiliated companies (cost $2,772,340) | | | | | 2,772,340 | |
| | | | | | 182,466,543 | |
Cash | | | | | 500,526 | |
Cash used for collateral on futures | | | | | 220,000 | |
Receivables and other assets: | | | | | | |
Investments sold (including $2,020,231 sold on a when-issued or delayed delivery basis) | | | | | 2,258,381 | |
Interest, dividends and principal paydowns | | | | | 759,583 | |
Shares of beneficial interest sold | | | | | 305,187 | |
Variation margin receivable | | | | | 24,094 | |
Other | | | | | 46,468 | |
Total assets | | | | | 186,580,782 | |
| | | |
Liabilities | | | | | | |
Payables and other liabilities: | | | | | | |
Investments purchased (including $53,301,530 purchased on a when-issued or delayed delivery basis) | | | | | 53,891,306 | |
Trustees’ compensation | | | | | 37,618 | |
Shares of beneficial interest redeemed | | | | | 26,984 | |
Variation margin payable | | | | | 23,125 | |
Distribution and service plan fees | | | | | 10,786 | |
Shareholder communications | | | | | 9,653 | |
Other | | | | | 69,873 | |
Total liabilities | | | | | 54,069,345 | |
Net Assets | | | | $ | 132,511,437 | |
| | | | | | |
| | | | | | | |
| | |
Composition of Net Assets | | | | | | |
Par value of shares of beneficial interest | | | | $ | 17,005 | |
Additional paid-in capital | | | | | 131,423,175 | |
Accumulated net investment income | | | | | 4,041,226 | |
Accumulated net realized loss on investments | | | | | (4,019,639 | ) |
Net unrealized appreciation on investments | | | | | 1,049,670 | |
Net Assets | | | | $ | 132,511,437 | |
| | | | | | |
| | | | | | | |
| | |
Net Asset Value Per Share | | | | | | |
Non-Service Shares: | | | | | | |
| Net asset value, redemption price per share and offering price per share (based on net assets of $81,481,031 and 10,401,595 shares of beneficial interest outstanding) | | | | | $7.83 | |
Service Shares: | | | | | | |
Net asset value, redemption price per share and offering price per share (based on net assets of $51,030,406 and 6,603,427 shares of beneficial interest outstanding) | | | | | $7.73 | |
See accompanying Notes to Financial Statements.
20 OPPENHEIMER TOTAL RETURN BOND FUND/VA
STATEMENT OF OPERATIONS For the Year Ended December 31, 2017
| | | | | | |
| | | |
Investment Income | | | | | | |
Interest – unaffiliated companies | | | | $ | 3,433,032 | |
Fee income on when-issued securities | | | | | 804,432 | |
Dividends – affiliated companies | | | | | 19,989 | |
Total investment income | | | | | 4,257,453 | |
| | | | | | | |
Expenses | | | | | | |
Management fees | | | | | 814,494 | |
Distribution and service plan fees – Service Shares | | | | | 131,266 | |
Transfer and shareholder servicing agent fees: | | | | | | |
Non-Service shares | | | | | 83,230 | |
Service shares | | | | | 52,519 | |
Shareholder communications: | | | | | | |
Non-Service shares | | | | | 23,572 | |
Service shares | | | | | 14,870 | |
Legal, auditing and other professional fees | | | | | 90,088 | |
Custodian fees and expenses | | | | | 44,673 | |
Trustees’ compensation | | | | | 14,811 | |
Borrowing fees | | | | | 3,744 | |
Other | | | | | 12,726 | |
Total expenses | | | | | 1,285,993 | |
Less reduction to custodian expenses | | | | | (242 | ) |
Less waivers and reimbursements of expenses | | | | | (132,624 | ) |
Net expenses | | | | | 1,153,127 | |
| | | | | | | |
Net Investment Income | | | | | 3,104,326 | |
| | | | | | | |
Realized and Unrealized Gain | | | | | | |
Net realized gain on: | | | | | | |
Investment transactions in unaffiliated companies | | | | | 270,610 | |
Futures contracts | | | | | 350,898 | |
Swap contracts | | | | | 94,741 | |
Net realized gain | | | | | 716,249 | |
Net change in unrealized appreciation/depreciation on: | | | | | | |
Investment transactions in unaffiliated companies | | | | | 2,015,295 | |
Futures contracts | | | | | 159,452 | |
Swap contracts | | | | | 776 | |
Net change in unrealized appreciation/depreciation | | | | | 2,175,523 | |
| | | | | | | |
Net Increase in Net Assets Resulting from Operations | | | | $ | 5,996,098 | |
| | | | | | |
See accompanying Notes to Financial Statements.
21 OPPENHEIMER TOTAL RETURN BOND FUND/VA
STATEMENTS OF CHANGES IN NET ASSETS
| | | | | | | | |
| | | Year Ended
December 31, 2017 | | | Year Ended
December 31, 2016 | |
Operations | | | | | | | | |
Net investment income | | | $ 3,104,326 | | | | $ 3,997,167 | |
Net realized gain (loss) | | | 716,249 | | | | (2,634,196) | |
Net change in unrealized appreciation/depreciation | | | 2,175,523 | | | | 3,000,273 | |
Net increase in net assets resulting from operations | | | 5,996,098 | | | | 4,363,244 | |
| | | | | | | | | |
Dividends and/or Distributions to Shareholders | | | | | | | | |
Dividends from net investment income: | | | | | | | | |
Non-Service shares | | | (2,024,420) | | | | (3,248,135) | |
Service shares | | | (1,136,931) | | | | (1,867,358) | |
| | | (3,161,351) | | | | (5,115,493) | |
| | | | | | | | | |
Beneficial Interest Transactions | | | | | | | | |
Net increase (decrease) in net assets resulting from beneficial interest transactions: | | | | | | | | |
Non-Service shares | | | (3,666,983) | | | | (1,355,182) | |
Service shares | | | (3,411,210) | | | | 1,183,323 | |
| | | (7,078,193) | | | | (171,859) | |
| | | | | | | | | |
Net Assets | | | | | | | | |
Total decrease | | | (4,243,446) | | | | (924,108) | |
Beginning of period | | | 136,754,883 | | | | 137,678,991 | |
| End of period (including accumulated net investment income of $4,041,226 and $3,115,545, respectively) | | | $ 132,511,437 | | | | $ 136,754,883 | |
| | | | | | | | |
See accompanying Notes to Financial Statements.
22 OPPENHEIMER TOTAL RETURN BOND FUND/VA
FINANCIAL HIGHLIGHTS
| | | | | | | | | | | | | | | | | | | | |
| Non-Service Shares | | Year Ended
December 31,
2017 | | | Year Ended
December 31,
2016 | | | Year Ended
December 31,
2015 | | | Year Ended
December 31,
2014 | | | Year Ended
December 31,
2013 | |
Per Share Operating Data | | | | | | | | | | | | | | | | | | | | |
Net asset value, beginning of period | | | $7.67 | | | | $7.71 | | | | $7.96 | | | | $7.83 | | | | $8.26 | |
Income (loss) from investment operations: | | | | | | | | | | | | | | | | | | | | |
Net investment income1 | | | 0.19 | | | | 0.23 | | | | 0.27 | | | | 0.30 | | | | 0.36 | |
Net realized and unrealized gain (loss) | | | 0.16 | | | | 0.02 | | | | (0.19) | | | | 0.26 | | | | (0.37) | |
Total from investment operations | | | 0.35 | | | | 0.25 | | | | 0.08 | | | | 0.56 | | | | (0.01) | |
Dividends and/or distributions to shareholders: | | | | | | | | | | | | | | | | | | | | |
Dividends from net investment income | | | (0.19) | | | | (0.29) | | | | (0.33) | | | | (0.43) | | | | (0.42) | |
Net asset value, end of period | | | $7.83 | | | | $7.67 | | | | $7.71 | | | | $7.96 | | | | $7.83 | |
| | | | | | | | | | | | | | | | | | | | |
| | | | | | | | | | | | | | | | | | | | | |
Total Return, at Net Asset Value2 | | | 4.59% | | | | 3.27% | | | | 0.96% | | | | 7.27% | | | | (0.10)% | |
| | | | | | | | | | | | | | | | | | | | | |
Ratios/Supplemental Data | | | | | | | | | | | | | | | | | | | | |
Net assets, end of period (in thousands) | | | $81,481 | | | | $83,405 | | | | $85,160 | | | | $90,757 | | | | $96,785 | |
Average net assets (in thousands) | | | $83,239 | | | | $87,039 | | | | $89,919 | | | | $94,336 | | | | $105,012 | |
Ratios to average net assets:3 | | | | | | | | | | | | | | | | | | | | |
Net investment income | | | 2.38% | | | | 2.96% | | | | 3.46% | | | | 3.72% | | | | 4.51% | |
Expenses excluding specific expenses listed below | | | 0.85% | | | | 0.84% | | | | 0.82% | | | | 0.80% | | | | 0.80% | |
Interest and fees from borrowings | | | 0.00%4 | | | | 0.00%4 | | | | 0.00%4 | | | | 0.00% | | | | 0.00% | |
Total expenses5 | | | 0.85% | | | | 0.84% | | | | 0.82% | | | | 0.80% | | | | 0.80% | |
| Expenses after payments, waivers and/or reimbursements and reduction to custodian expenses | | | 0.75% | | | | 0.75% | | | | 0.75% | | | | 0.75% | | | | 0.75% | |
Portfolio turnover rate6 | | | 86% | | | | 79% | | | | 73% | | | | 127% | | | | 115% | |
1. Per share amounts calculated based on the average shares outstanding during the period.
2. Assumes an initial investment on the business day before the first day of the fiscal period, with all dividends and distributions reinvested in additional shares on the reinvestment date, and redemption at the net asset value calculated on the last business day of the fiscal period. Total returns are not annualized for periods less than one full year. Total return information does not reflect expenses that apply at the separate account level or to related insurance products. Inclusion of these charges would reduce the total return figures for all periods shown. Returns do not reflect the deduction of taxes that a shareholder would pay on fund distributions or the redemption of fund shares.
3. Annualized for periods less than one full year.
4. Less than 0.005%.
5. Total expenses including indirect expenses from affiliated fund fees and expenses were as follows:
| | | | |
Year Ended December 31, 2017 | | | 0.85 | % |
Year Ended December 31, 2016 | | | 0.85 | % |
Year Ended December 31, 2015 | | | 0.83 | % |
Year Ended December 31, 2014 | | | 0.81 | % |
Year Ended December 31, 2013 | | | 0.81 | % |
6. The portfolio turnover rate excludes purchase and sale transactions of To Be Announced (TBA) mortgage-related securities as follows:
| | | | | | | | |
| | | Purchase Transactions | | | Sale Transactions | |
| |
Year Ended December 31, 2017 | | | $679,964,368 | | | | $662,714,451 | |
Year Ended December 31, 2016 | | | $672,031,328 | | | | $673,808,454 | |
Year Ended December 31, 2015 | | | $697,962,198 | | | | $709,720,690 | |
Year Ended December 31, 2014 | | | $560,409,975 | | | | $543,669,748 | |
Year Ended December 31, 2013 | | | $776,927,298 | | | | $806,883,121 | |
See accompanying Notes to Financial Statements.
23 OPPENHEIMER TOTAL RETURN BOND FUND/VA
FINANCIAL HIGHLIGHTS Continued
| | | | | | | | | | | | | | | | | | | | |
| Service Shares | | Year Ended
December 31,
2017 | | | Year Ended
December 31,
2016 | | | Year Ended
December 31,
2015 | | | Year Ended
December 31,
2014 | | | Year Ended
December 31,
2013 | |
Per Share Operating Data | | | | | | | | | | | | | | | | | | | | |
Net asset value, beginning of period | | | $7.57 | | | | $7.61 | | | | $7.86 | | | | $7.74 | | | | $8.17 | |
Income (loss) from investment operations: | | | | | | | | | | | | | | | | | | | | |
Net investment income1 | | | 0.16 | | | | 0.21 | | | | 0.25 | | | | 0.27 | | | | 0.34 | |
Net realized and unrealized gain (loss) | | | 0.17 | | | | 0.02 | | | | (0.19) | | | | 0.26 | | | | (0.37) | |
Total from investment operations | | | 0.33 | | | | 0.23 | | | | 0.06 | | | | 0.53 | | | | (0.03) | |
Dividends and/or distributions to shareholders: | | | | | | | | | | | | | | | | | | | | |
Dividends from net investment income | | | (0.17) | | | | (0.27) | | | | (0.31) | | | | (0.41) | | | | (0.40) | |
Net asset value, end of period | | | $7.73 | | | | $7.57 | | | | $7.61 | | | | $7.86 | | | | $7.74 | |
| | | | | | | | | | | | | | | | | | | | |
| | | | | | | | | | | | | | | | | | | | | |
Total Return, at Net Asset Value2 | | | 4.38% | | | | 3.05% | | | | 0.70% | | | | 6.93% | | | | (0.38)% | |
| | | | | | | | | | | | | | | | | | | | | |
Ratios/Supplemental Data | | | | | | | | | | | | | | | | | | | | |
Net assets, end of period (in thousands) | | | $51,030 | | | | $53,350 | | | | $52,519 | | | | $52,675 | | | | $54,946 | |
Average net assets (in thousands) | | | $52,525 | | | | $52,738 | | | | $54,016 | | | | $55,215 | | | | $59,523 | |
Ratios to average net assets:3 | | | | | | | | | | | | | | | | | | | | |
Net investment income | | | 2.13% | | | | 2.70% | | | | 3.21% | | | | 3.47% | | | | 4.26% | |
Expenses excluding specific expenses listed below | | | 1.10% | | | | 1.09% | | | | 1.07% | | | | 1.04% | | | | 1.05% | |
Interest and fees from borrowings | | | 0.00%4 | | | | 0.00%4 | | | | 0.00%4 | | | | 0.00% | | | | 0.00% | |
Total expenses5 | | | 1.10% | | | | 1.09% | | | | 1.07% | | | | 1.04% | | | | 1.05% | |
| Expenses after payments, waivers and/or reimbursements and reduction to custodian expenses | | | 1.00% | | | | 1.00% | | | | 1.00% | | | | 1.00% | | | | 1.00% | |
Portfolio turnover rate6 | | | 86% | | | | 79% | | | | 73% | | | | 127% | | | | 115% | |
1. Per share amounts calculated based on the average shares outstanding during the period.
2. Assumes an initial investment on the business day before the first day of the fiscal period, with all dividends and distributions reinvested in additional shares on the reinvestment date, and redemption at the net asset value calculated on the last business day of the fiscal period. Total returns are not annualized for periods less than one full year. Total return information does not reflect expenses that apply at the separate account level or to related insurance products. Inclusion of these charges would reduce the total return figures for all periods shown. Returns do not reflect the deduction of taxes that a shareholder would pay on fund distributions or the redemption of fund shares.
3. Annualized for periods less than one full year.
4. Less than 0.005%.
5. Total expenses including indirect expenses from affiliated fund fees and expenses were as follows:
| | | | |
Year Ended December 31, 2017 | | | 1.10 | % |
Year Ended December 31, 2016 | | | 1.10 | % |
Year Ended December 31, 2015 | | | 1.08 | % |
Year Ended December 31, 2014 | | | 1.05 | % |
Year Ended December 31, 2013 | | | 1.06 | % |
6. The portfolio turnover rate excludes purchase and sale transactions of To Be Announced (TBA) mortgage-related securities as follows:
| | | | | | | | |
| | | Purchase Transactions | | | Sale Transactions | |
| |
Year Ended December 31, 2017 | | | $679,964,368 | | | | $662,714,451 | |
Year Ended December 31, 2016 | | | $672,031,328 | | | | $673,808,454 | |
Year Ended December 31, 2015 | | | $697,962,198 | | | | $709,720,690 | |
Year Ended December 31, 2014 | | | $560,409,975 | | | | $543,669,748 | |
Year Ended December 31, 2013 | | | $776,927,298 | | | | $806,883,121 | |
See accompanying Notes to Financial Statements.
24 OPPENHEIMER TOTAL RETURN BOND FUND/VA
NOTES TO FINANCIAL STATEMENTS December 31, 2017
1. Organization
Oppenheimer Total Return Bond Fund/VA (the “Fund”), formerly Oppenheimer Core Bond Fund/VA, a separate series of Oppenheimer Variable Account Funds, is a diversified open-end management investment company registered under the Investment Company Act of 1940 (“1940 Act”), as amended. The Fund’s main investment objective is to seek total return. The Fund’s investment adviser is OFI Global Asset Management, Inc. (“OFI Global” or the “Manager”), a wholly-owned subsidiary of OppenheimerFunds, Inc. (“OFI” or the “Sub-Adviser”). The Manager has entered into a sub-advisory agreement with OFI. Shares of the Fund are sold only to separate accounts of life insurance companies.
The Fund offers two classes of shares. Both classes are sold at their offering price, which is the net asset value per share, to separate investment accounts of participating insurance companies as an underlying investment for variable life insurance policies, variable annuity contracts or other investment products. The class of shares designated as Service shares is subject to a distribution and service plan. Both classes of shares have identical rights and voting privileges with respect to the Fund in general and exclusive voting rights on matters that affect that class alone. Earnings, net assets and net asset value per share may differ due to each class having its own expenses, such as transfer and shareholder servicing agent fees and shareholder communications, directly attributable to that class.
The following is a summary of significant accounting policies followed in the Fund’s preparation of financial statements in accordance with accounting principles generally accepted in the United States (“U.S. GAAP”).
2. Significant Accounting Policies
Security Valuation. All investments in securities are recorded at their estimated fair value, as described in Note 3.
Allocation of Income, Expenses, Gains and Losses. Income, expenses (other than those attributable to a specific class), gains and losses are allocated on a daily basis to each class of shares based upon the relative proportion of net assets represented by such class. Operating expenses directly attributable to a specific class are charged against the operations of that class.
Dividends and Distributions to Shareholders. Dividends and distributions to shareholders, which are determined in accordance with income tax regulations and may differ from U.S. GAAP, are recorded on the ex-dividend date. Income and capital gain distributions, if any, are declared and paid annually or at other times as determined necessary by the Manager.
Investment Income. Dividend income is recorded on the ex-dividend date or upon ex-dividend notification in the case of certain foreign dividends where the ex-dividend date may have passed. Non-cash dividends included in dividend income, if any, are recorded at the fair value of the securities received. Withholding taxes on foreign dividends, if any, and capital gains taxes on foreign investments, if any, have been provided for in accordance with the Fund’s understanding of the applicable tax rules and regulations. Interest income, if any, is recognized on an accrual basis. Discount and premium, which are included in interest income on the Statement of Operations, are amortized or accreted daily.
Custodian Fees. “Custodian fees and expenses” in the Statement of Operations may include interest expense incurred by the Fund on any cash overdrafts of its custodian account during the period. Such cash overdrafts may result from the effects of failed trades in portfolio securities and from cash outflows resulting from unanticipated shareholder redemption activity. The Fund pays interest to its custodian on such cash overdrafts, to the extent they are not offset by positive cash balances maintained by the Fund, at a rate equal to the Federal Funds Rate plus 2.00%. The “Reduction to custodian expenses” line item, if applicable, represents earnings on cash balances maintained by the Fund during the period. Such interest expense and other custodian fees may be paid with these earnings.
Security Transactions. Security transactions are recorded on the trade date. Realized gains and losses on securities sold are determined on the basis of identified cost.
Indemnifications. The Fund’s organizational documents provide current and former Trustees and officers with a limited indemnification against liabilities arising in connection with the performance of their duties to the Fund. In the normal course of business, the Fund may also enter into contracts that provide general indemnifications. The Fund’s maximum exposure under these arrangements is unknown as this would be dependent on future claims that may be made against the Fund. The risk of material loss from such claims is considered remote.
Federal Taxes. The Fund intends to comply with provisions of the Internal Revenue Code applicable to regulated investment companies and to distribute substantially all of its investment company taxable income, including any net realized gain on investments not offset by capital loss carryforwards, if any, to shareholders. Therefore, no federal income or excise tax provision is required. The Fund files income tax returns in U.S. federal and applicable state jurisdictions. The statute of limitations on the Fund’s tax return filings generally remains open for the three preceding fiscal reporting period ends. The Fund has analyzed its tax positions for the fiscal year ended December 31, 2017, including open tax years, and does not believe there are any uncertain tax positions requiring recognition in the Fund’s financial statements.
The tax components of capital shown in the following table represent distribution requirements the Fund must satisfy under the income tax regulations, losses the Fund may be able to offset against income and gains realized in future years and unrealized appreciation or depreciation of securities and other investments for federal income tax purposes.
25 OPPENHEIMER TOTAL RETURN BOND FUND/VA
NOTES TO FINANCIAL STATEMENTS Continued
2. Significant Accounting Policies (Continued)
| | | | | | | | | | | | |
Undistributed
Net Investment
Income | | Undistributed
Long-Term
Gain | | | Accumulated
Loss
Carryforward1,2,3,4
| | | Net Unrealized
Appreciation
Based on cost of
Securities and
Other Investments
for Federal Income
Tax Purposes | |
| |
$4,078,840 | | | $— | | | | $3,898,917 | | | | $928,948 | |
1. At period end, the Fund had $3,898,917 of net capital loss carryforward available to offset future realized capital gains, if any, and thereby reduce future taxable gain distributions. Details of the capital loss carryforwards are included in the table below. Capital loss carryovers with no expiration, if any, must be utilized prior to those with expiration dates.
| | | | |
| Expiring | | | |
| |
No expiration | | $ | 3,898,917 | |
2. During the reporting period, the Fund did not utilize any capital loss carryforward.
3. During the previous reporting period, the Fund did not utilize any capital loss carryforward.
4. During the reporting period, $75,069,850 of unused capital loss carryforward expired.
Net investment income (loss) and net realized gain (loss) may differ for financial statement and tax purposes. The character of dividends and distributions made during the fiscal year from net investment income or net realized gains are determined in accordance with federal income tax requirements, which may differ from the character of net investment income or net realized gains presented in those financial statements in accordance with U.S. GAAP. Also, due to timing of dividends and distributions, the fiscal year in which amounts are distributed may differ from the fiscal year in which the income or net realized gain was recorded by the Fund.
Accordingly, the following amounts have been reclassified for the reporting period. Net assets of the Fund were unaffected by the reclassifications.
| | | | | | | | |
| | | Increase | | | Reduction | |
| | | to Accumulated | | | to Accumulated Net | |
Reduction
to Paid-in Capital | | Net Investment
Income | | | Realized Loss on
Investments | |
| |
$75,068,969 | | | $982,706 | | | | $74,086,263 | |
The tax character of distributions paid during the reporting periods:
| | | | | | | | |
| | | Year Ended
December 31, 2017 | | | Year Ended
December 31, 2016 | |
| |
Distributions paid from: | | | | | | | | |
Ordinary income | | $ | 3,161,351 | | | $ | 5,115,493 | |
The aggregate cost of securities and other investments and the composition of unrealized appreciation and depreciation of securities and other investments for federal income tax purposes at period end are noted in the following table. The primary difference between book and tax appreciation or depreciation of securities and other investments, if applicable, is attributable to the tax deferral of losses or tax realization of financial statement unrealized gain or loss.
| | | | |
| Federal tax cost of securities | | $ | 181,546,288 | |
| Federal tax cost of other investments | | | (8,263,258) | |
| | | | |
| Total federal tax cost | | $ | 173,283,030 | |
| | | | |
| Gross unrealized appreciation | | $ | 3,192,902 | |
| Gross unrealized depreciation | | | (2,263,954) | |
| | | | |
| Net unrealized appreciation | | $ | 928,948 | |
| | | | |
Use of Estimates. The preparation of financial statements in conformity with U.S. GAAP requires management to make estimates and assumptions that affect the reported amounts of assets and liabilities and disclosure of contingent assets and liabilities at the date of the financial statements and the reported amounts of increases and decreases in net assets from operations during the reporting period. Actual results could differ from those estimates.
3. Securities Valuation
The Fund calculates the net asset value of its shares as of 4:00 P.M. Eastern time, on each day the New York Stock Exchange (the “Exchange”) is open for trading, except in the case of a scheduled early closing of the Exchange, in which case the Fund will calculate net asset value of the shares as of the scheduled early closing time of the Exchange.
The Fund’s Board has adopted procedures for the valuation of the Fund’s securities and has delegated the day-to-day responsibility for valuation determinations under those procedures to the Manager. The Manager has established a Valuation Committee which is responsible for determining a fair valuation for any security for which market quotations are not readily available. The Valuation Committee’s fair valuation determinations are subject to review, approval and ratification by the Fund’s Board at least quarterly or more frequently, if necessary.
26 OPPENHEIMER TOTAL RETURN BOND FUND/VA
3. Securities Valuation (Continued)
Valuation Methods and Inputs
Securities are valued primarily using unadjusted quoted market prices, when available, as supplied by third party pricing services or broker-dealers.
The following methodologies are used to determine the market value or the fair value of the types of securities described below:
Shares of a registered investment company that are not traded on an exchange are valued at that investment company’s net asset value per share.
Corporate and government debt securities (of U.S. or foreign issuers) and municipal debt securities, short-term notes, mortgage-backed securities, collateralized mortgage obligations, and asset-backed securities are valued at the mean between the bid and asked prices utilizing evaluated prices obtained from third party pricing services or broker-dealers who may use matrix pricing methods to determine the evaluated prices. Pricing services generally price debt securities assuming orderly transactions of an institutional “round lot” size, but some trades may occur in smaller, “odd lot” sizes, sometimes at lower prices than institutional round lot trades. Standard inputs generally considered by third-party pricing vendors include reported trade data, broker-dealer price quotations, benchmark yields, issuer spreads on comparable securities, the credit quality, yield, maturity, as well as other appropriate factors.
Futures contracts and futures options traded on a commodities or futures exchange will be valued at the final settlement price or official closing price on the principal exchange as reported by such principal exchange at its trading session ending at, or most recently prior to, the time when the Fund’s assets are valued.
Securities for which market quotations are not readily available, or when a significant event has occurred that would materially affect the value of the security, are fair valued either (i) by a standardized fair valuation methodology applicable to the security type or the significant event as previously approved by the Valuation Committee and the Fund’s Board or (ii) as determined in good faith by the Manager’s Valuation Committee. The Valuation Committee considers all relevant facts that are reasonably available, through either public information or information available to the Manager, when determining the fair value of a security. Those standardized fair valuation methodologies include, but are not limited to, valuing securities at the last sale price or initially at cost and subsequently adjusting the value based on: changes in company specific fundamentals, changes in an appropriate securities index, or changes in the value of similar securities which may be further adjusted for any discounts related to security-specific resale restrictions. When possible, such methodologies use observable market inputs such as unadjusted quoted prices of similar securities, observable interest rates, currency rates and yield curves. The methodologies used for valuing securities are not necessarily an indication of the risks associated with investing in those securities nor can it be assured that the Fund can obtain the fair value assigned to a security if it were to sell the security.
To assess the continuing appropriateness of security valuations, the Manager regularly compares prior day prices and sale prices to the current day prices and challenges those prices exceeding certain tolerance levels with the third party pricing service or broker source. For those securities valued by fair valuations, whether through a standardized fair valuation methodology or a fair valuation determination, the Valuation Committee reviews and affirms the reasonableness of the valuations based on such methodologies and fair valuation determinations on a regular basis after considering all relevant information that is reasonably available.
Classifications
Each investment asset or liability of the Fund is assigned a level at measurement date based on the significance and source of the inputs to its valuation.
Various data inputs may be used in determining the value of each of the Fund’s investments as of the reporting period end. These data inputs are categorized in the following hierarchy under applicable financial accounting standards:
1) Level 1-unadjusted quoted prices in active markets for identical assets or liabilities (including securities actively traded on a securities exchange)
2) Level 2-inputs other than unadjusted quoted prices that are observable for the asset or liability (such as unadjusted quoted prices for similar assets and market corroborated inputs such as interest rates, prepayment speeds, credit risks, etc.)
3) Level 3-significant unobservable inputs (including the Manager’s own judgments about assumptions that market participants would use in pricing the asset or liability).
The inputs used for valuing securities are not necessarily an indication of the risks associated with investing in those securities.
The Fund classifies each of its investments in investment companies which are publicly offered as Level 1. Investment companies that are not publicly offered, if any, are classified as Level 2 in the fair value hierarchy.
The table below categorizes amounts that are included in the Fund’s Statement of Assets and Liabilities at period end based on valuation input level:
| | | | | | | | | | | | | | | | |
| | | Level 1—
Unadjusted
Quoted Prices | | | Level 2—
Other Significant
Observable Inputs | | | Level 3—
Significant
Unobservable
Inputs | | | Value | |
| |
Assets Table | | | | | | | | | | | | | | | | |
Investments, at Value: | | | | | | | | | | | | | | | | |
Asset-Backed Securities | | $ | — | | | $ | 18,487,633 | | | $ | — | | | $ | 18,487,633 | |
Mortgage-Backed Obligations | | | — | | | | 77,692,694 | | | | 157,622 | | | | 77,850,316 | |
U.S. Government Obligation | | | — | | | | 1,430,912 | | | | — | | | | 1,430,912 | |
Corporate Bonds and Notes | | | — | | | | 67,377,656 | | | | — | | | | 67,377,656 | |
Short-Term Notes | | | — | | | | 14,547,686 | | | | — | | | | 14,547,686 | |
Investment Company | | | 2,772,340 | | | | — | | | | — | | | | 2,772,340 | |
| | | | |
Total Investments, at Value | | | 2,772,340 | | | | 179,536,581 | | | | 157,622 | | | | 182,466,543 | |
27 OPPENHEIMER TOTAL RETURN BOND FUND/VA
NOTES TO FINANCIAL STATEMENTS Continued
3. Securities Valuation (Continued)
| | | | | | | | | | | | | | | | |
| | | Level 1— Unadjusted Quoted
Prices | | | Level 2—
Other Significant
Observable Inputs | | | Level 3—
Significant
Unobservable
Inputs | | | Value | |
| |
Other Financial Instruments: | | | | | | | | | | | | | | | | |
Futures contracts | | $ | 120,270 | | | $ | — | | | $ | — | | | $ | 120,270 | |
| | | | |
Total Assets | | $ | 2,892,610 | | | $ | 179,536,581 | | | $ | 157,622 | | | $ | 182,586,813 | |
| | | | |
| | | | |
Liabilities Table | | | | | | | | | | | | | | | | |
Other Financial Instruments: | | | | | | | | | | | | | | | | |
Futures contracts | | $ | (809 | ) | | $ | — | | | $ | — | | | $ | (809) | |
| | | | |
Total Liabilities | | $ | (809 | ) | | $ | — | | | $ | — | | | $ | (809) | |
| | | | |
Forward currency exchange contracts and futures contracts, if any, are reported at their unrealized appreciation/depreciation at measurement date, which represents the change in the contract’s value from trade date. All additional assets and liabilities included in the above table are reported at their market value at measurement date.
4. Investments and Risks
Investments in Affiliated Funds. The Fund is permitted to invest in other mutual funds advised by the Manager (“Affiliated Funds”). Affiliated Funds are open-end management investment companies registered under the 1940 Act, as amended. The Manager is the investment adviser of, and the Sub-Adviser provides investment and related advisory services to, the Affiliated Funds. When applicable, the Fund’s investments in Affiliated Funds are included in the Statement of Investments. Shares of Affiliated Funds are valued at their net asset value per share. As a shareholder, the Fund is subject to its proportional share of the Affiliated Funds’ expenses, including their management fee. The Manager will waive fees and/or reimburse Fund expenses in an amount equal to the indirect management fees incurred through the Fund’s investment in the Affiliated Funds.
Each of the Affiliated Funds in which the Fund invests has its own investment risks, and those risks can affect the value of the Fund’s investments and therefore the value of the Fund’s shares. To the extent that the Fund invests more of its assets in one Affiliated Fund than in another, the Fund will have greater exposure to the risks of that Affiliated Fund.
Investments in Money Market Instruments. The Fund is permitted to invest its free cash balances in money market instruments to provide liquidity or for defensive purposes. The Fund may invest in money market instruments by investing in Class E shares of Oppenheimer Institutional Government Money Market Fund (“IGMMF”), which is an Affiliated Fund. IGMMF is regulated as a money market fund under the 1940 Act, as amended. The Fund may also invest in money market instruments directly or in other affiliated or unaffiliated money market funds.
Securities on a When-Issued or Delayed Delivery Basis. The Fund may purchase securities on a “when-issued” basis, and may purchase or sell securities on a “delayed delivery” basis. “When-issued” or “delayed delivery” refers to securities whose terms and indenture are available and for which a market exists, but which are not available for immediate delivery. Delivery and payment for securities that have been purchased by the Fund on a when-issued basis normally takes place within six months and possibly as long as two years or more after the trade date. During this period, such securities do not earn interest, are subject to market fluctuation and may increase or decrease in value prior to their delivery. The purchase of securities on a when-issued basis may increase the volatility of the Fund’s net asset value to the extent the Fund executes such transactions while remaining substantially fully invested. When the Fund engages in when-issued or delayed delivery transactions, it relies on the buyer or seller, as the case may be, to complete the transaction. Their failure to do so may cause the Fund to lose the opportunity to obtain or dispose of the security at a price and yield it considers advantageous. The Fund may also sell securities that it purchased on a when-issued basis or forward commitment prior to settlement of the original purchase.
At period end, the Fund had purchased securities issued on a when-issued or delayed delivery basis and sold securities issued on a delayed delivery basis as follows:
| | |
| | | When-Issued or
Delayed Delivery
Basis Transactions |
|
Purchased securities | | $53,301,530 |
Sold securities | | 2,020,231 |
The Fund may enter into “forward roll” transactions with respect to mortgage-related securities. In this type of transaction, the Fund sells a mortgage-related security to a buyer and simultaneously agrees to repurchase a similar security (same type, coupon and maturity) at a later date at a set price. During the period between the sale and the repurchase, the Fund will not be entitled to receive interest and principal payments on the securities that have been sold. The Fund records the incremental difference between the forward purchase and sale of each forward roll as realized gain (loss) on investments or as fee income in the case of such transactions that have an associated fee in lieu of a difference in the forward purchase and sale price.
Forward roll transactions may be deemed to entail embedded leverage since the Fund purchases mortgage-related securities with extended settlement dates rather than paying for the securities under a normal settlement cycle. This embedded leverage increases the Fund’s market value of investments relative to its net assets which can incrementally increase the volatility of the Fund’s performance. Forward roll transactions can be replicated over multiple settlement periods.
28 OPPENHEIMER TOTAL RETURN BOND FUND/VA
4. Investments and Risks (Continued)
Risks of entering into forward roll transactions include the potential inability of the counterparty to meet the terms of the agreement; the potential of the Fund to receive inferior securities at redelivery as compared to the securities sold to the counterparty; and counterparty credit risk.
At period end, the Fund pledged $22,877 of collateral to the counterparty for forward roll transactions.
Restricted Securities. At period end, investments in securities included issues that are restricted. A restricted security may have a contractual restriction on its resale and is valued under methods approved by the Board of Trustees as reflecting fair value. Securities that are restricted are marked with an applicable footnote on the Statement of Investments. Restricted securities are reported on a schedule following the Statement of Investments.
Shareholder Concentration. At period end, three shareholders each owned 20% or more of the Fund’s total outstanding shares.
A shareholder is a related party of the Fund. Related parties may include, but are not limited to, the investment manager and its affiliates, affiliated broker dealers, fund of funds, and directors or employees. The related party owned 23% of the Fund’s total outstanding shares at period end.
5. Market Risk Factors
The Fund’s investments in securities and/or financial derivatives may expose the Fund to various market risk factors:
Commodity Risk. Commodity risk relates to the change in value of commodities or commodity indexes as they relate to increases or decreases in the commodities market. Commodities are physical assets that have tangible properties. Examples of these types of assets are crude oil, heating oil, metals, livestock, and agricultural products.
Credit Risk. Credit risk relates to the ability of the issuer of debt to meet interest and principal payments, or both, as they come due. In general, lower-grade, higher-yield debt securities are subject to credit risk to a greater extent than lower-yield, higher-quality securities.
Equity Risk. Equity risk relates to the change in value of equity securities as they relate to increases or decreases in the general market.
Foreign Exchange Rate Risk. Foreign exchange rate risk relates to the change in the U.S. dollar value of a security held that is denominated in a foreign currency. The U.S. dollar value of a foreign currency denominated security will decrease as the dollar appreciates against the currency, while the U.S. dollar value will increase as the dollar depreciates against the currency.
Interest Rate Risk. Interest rate risk refers to the fluctuations in value of fixed-income securities resulting from the inverse relationship between price and yield. For example, an increase in general interest rates will tend to reduce the market value of already issued fixed-income investments, and a decline in general interest rates will tend to increase their value. In addition, debt securities with longer maturities, which tend to have higher yields, are subject to potentially greater fluctuations in value from changes in interest rates than obligations with shorter maturities.
Volatility Risk. Volatility risk refers to the magnitude of the movement, but not the direction of the movement, in a financial instrument’s price over a defined time period. Large increases or decreases in a financial instrument’s price over a relative time period typically indicate greater volatility risk, while small increases or decreases in its price typically indicate lower volatility risk.
6. Use of Derivatives
The Fund’s investment objective not only permits the Fund to purchase investment securities, it also allows the Fund to enter into various types of derivatives contracts, including, but not limited to, futures contracts, forward currency exchange contracts, credit default swaps, interest rate swaps, total return swaps, variance swaps and purchased and written options. In doing so, the Fund will employ strategies in differing combinations to permit it to increase, decrease, or change the level or types of exposure to market risk factors. These instruments may allow the Fund to pursue its objectives more quickly and efficiently than if it were to make direct purchases or sales of securities capable of effecting a similar response to market factors. Such contracts may be entered into through a bilateral over-the-counter (“OTC”) transaction, or through a securities or futures exchange and cleared through a clearinghouse.
Derivatives may have little or no initial cash investment relative to their market value exposure and therefore can produce significant gains or losses in excess of their cost due to changes in the market risk factors and the overall market. This use of embedded leverage allows the Fund to increase its market value exposure relative to its net assets and can substantially increase the volatility of the Fund’s performance. In instances where the Fund is using derivatives to decrease, or hedge, exposures to market risk factors for securities held by the Fund, there are also risks that those derivatives may not perform as expected resulting in losses for the combined or hedged positions. Some derivatives have the potential for unlimited loss, regardless of the size of the Fund’s initial investment.
Additional associated risks from investing in derivatives also exist and potentially could have significant effects on the valuation of the derivative and the Fund. Typically, the associated risks are not the risks that the Fund is attempting to increase or decrease exposure to, per its investment objectives, but are the additional risks from investing in derivatives. Examples of these associated risks are liquidity risk, which is the risk that the Fund will not be able to sell the derivative in the open market in a timely manner, and counterparty credit risk, which is the risk that the counterparty will not fulfill its obligation to the Fund.
The Fund’s actual exposures to these market risk factors and associated risks during the period are discussed in further detail, by derivative type, below.
Futures Contracts
A futures contract is a commitment to buy or sell a specific amount of a commodity, financial instrument or currency at a negotiated price on a stipulated future date. The Fund may buy and sell futures contracts and may also buy or write put or call options on these futures contracts. Futures contracts and
29 OPPENHEIMER TOTAL RETURN BOND FUND/VA
NOTES TO FINANCIAL STATEMENTS Continued
6. Use of Derivatives (Continued)
options thereon are generally entered into on a regulated futures exchange and cleared through a clearinghouse associated with the exchange.
Upon entering into a futures contract, the Fund is required to deposit either cash or securities (initial margin) in an amount equal to a certain percentage of the contract value in an account registered in the futures commission merchant’s name. Subsequent payments (variation margin) are paid to or from the futures commission merchant each day equal to the daily changes in the contract value. Such payments are recorded as unrealized gains and losses. Should the Fund fail to make requested variation margin payments, the futures commission merchant can gain access to the initial margin to satisfy the Fund’s payment obligations.
Futures contracts are reported on a schedule following the Statement of Investments. Securities held by a futures commission merchant to cover initial margin requirements on open futures contracts are noted in the Statement of Investments. Cash held by a futures commission merchant to cover initial margin requirements on open futures contracts and the receivable and/or payable for the daily mark to market for the variation margin are noted in the Statement of Assets and Liabilities. The net change in unrealized appreciation and depreciation is reported in the Statement of Operations. Realized gains (losses) are reported in the Statement of Operations at the closing or expiration of futures contracts.
The Fund may purchase and/or sell financial futures contracts and options on futures contracts to gain exposure to, or decrease exposure to interest rate risk, equity risk, foreign exchange rate risk, volatility risk, or commodity risk.
During the reporting period, the Fund had an ending monthly average market value of $21,041,355 and $16,348,119 on futures contracts purchased and sold, respectively.
Additional associated risks of entering into futures contracts (and related options) include the possibility that there may be an illiquid market where the Fund is unable to liquidate the contract or enter into an offsetting position and, if used for hedging purposes, the risk that the price of the contract will correlate imperfectly with the prices of the Fund’s securities.
Swap Contracts
The Fund may enter into swap contract agreements with a counterparty to exchange a series of cash flows based on either specified reference rates, the price or volatility of asset or non-asset references, or the occurrence of a credit event, over a specified period. Swaps can be executed in a bi-lateral privately negotiated arrangement with a dealer in an OTC transaction (“OTC swaps”) or executed on a regulated market. Certain swaps, regardless of the venue of their execution, are required to be cleared through a clearinghouse (“centrally cleared swaps”). Swap contracts may include interest rate, equity, debt, index, total return, credit default, currency, and volatility swaps.
Swap contracts are reported on a schedule following the Statement of Investments. The values of centrally cleared swap and OTC swap contracts are aggregated by positive and negative values and disclosed separately on the Statement of Assets and Liabilities. The unrealized appreciation (depreciation) related to the change in the valuation of the notional amount of the swap is combined with the accrued interest due to (owed by) the Fund, if any, at termination or settlement. The net change in this amount during the period is included on the Statement of Operations. The Fund also records any periodic payments received from (paid to) the counterparty, including at termination, under such contracts as realized gain (loss) on the Statement of Operations.
Swap contract agreements are exposed to the market risk factor of the specific underlying reference rate or asset. Swap contracts are typically more attractively priced compared to similar investments in related cash securities because they isolate the risk to one market risk factor and eliminate the other market risk factors. Investments in cash securities (for instance bonds) have exposure to multiple risk factors (credit and interest rate risk). Because swaps have embedded leverage, they can expose the Fund to substantial risk in the isolated market risk factor.
Credit Default Swap Contracts. A credit default swap is a contract that enables an investor to buy or sell protection against a defined-issuer credit event, such as the issuer’s failure to make timely payments of interest or principal on a debt security, bankruptcy or restructuring. The Fund may enter into credit default swaps either by buying or selling protection on a corporate issuer, sovereign issuer, or a basket or index of issuers (the “reference asset”).
The buyer of protection pays a periodic fee to the seller of protection based on the notional amount of the swap contract. The seller of protection agrees to compensate the buyer of protection for future potential losses as a result of a credit event on the reference asset. The contract effectively transfers the credit event risk of the reference asset from the buyer of protection to the seller of protection.
The ongoing value of the contract will fluctuate throughout the term of the contract based primarily on the credit risk of the reference asset. If the credit quality of the reference asset improves relative to the credit quality at contract initiation, the buyer of protection may have an unrealized loss greater than the anticipated periodic fee owed. This unrealized loss would be the result of current credit protection being cheaper than the cost of credit protection at contract initiation. If the buyer elects to terminate the contract prior to its maturity, and there has been no credit event, this unrealized loss will become realized. If the contract is held to maturity, and there has been no credit event, the realized loss will be equal to the periodic fee paid over the life of the contract.
If there is a credit event, the buyer of protection can exercise its rights under the contract and receive a payment from the seller of protection equal to the notional amount of the swap less the market value of specified debt securities issued by the reference asset. Upon exercise of the contract the difference between such value and the notional amount is recorded as realized gain (loss) and is included on the Statement of Operations.
The Fund may purchase or sell credit protection through credit default swaps to increase or decrease exposure to the credit risk of individual issuers and/or indexes of issuers that are either unavailable or considered to be less attractive in the bond market.
For the reporting period, the Fund had ending monthly average notional amounts of $1,848,685 credit default swaps to sell protection.
Additional associated risks to the Fund include counterparty credit risk and liquidity risk.
At period end, the Fund had no credit default swap agreements outstanding.
30 OPPENHEIMER TOTAL RETURN BOND FUND/VA
6. Use of Derivatives (Continued)
Counterparty Credit Risk. Derivative positions are subject to the risk that the counterparty will not fulfill its obligation to the Fund. The Fund intends to enter into derivative transactions with counterparties that the Manager believes to be creditworthy at the time of the transaction.
For financial reporting purposes, the Fund does not offset derivative assets and derivative liabilities that are subject to netting arrangements in the Statement of Assets and Liabilities. Bankruptcy or insolvency laws of a particular jurisdiction may impose restrictions on or prohibitions against the right of offset in bankruptcy, insolvency or other events.
The Fund’s risk of loss from counterparty credit risk on exchange-traded derivatives cleared through a clearinghouse and for centrally cleared swaps is generally considered lower than as compared to OTC derivatives. However, counterparty credit risk exists with respect to initial and variation margin deposited/paid by the Fund that is held in futures commission merchant, broker and/or clearinghouse accounts for such exchange-traded derivatives and for centrally cleared swaps.
With respect to centrally cleared swaps, such transactions will be submitted for clearing, and if cleared, will be held in accounts at futures commission merchants or brokers that are members of clearinghouses. While brokers, futures commission merchants and clearinghouses are required to segregate customer margin from their own assets, in the event that a broker, futures commission merchant or clearinghouse becomes insolvent or goes into bankruptcy and at that time there is a shortfall in the aggregate amount of margin held by the broker, futures commission merchant or clearinghouse for all its customers, U.S. bankruptcy laws will typically allocate that shortfall on a pro-rata basis across all the broker’s, futures commission merchant’s or clearinghouse’s customers, potentially resulting in losses to the Fund.
There is the risk that a broker, futures commission merchant or clearinghouse will decline to clear a transaction on the Fund’s behalf, and the Fund may be required to pay a termination fee to the executing broker with whom the Fund initially enters into the transaction. Clearinghouses may also be permitted to terminate centrally cleared swaps at any time. The Fund is also subject to the risk that the broker or futures commission merchant will improperly use the Fund’s assets deposited/paid as initial or variation margin to satisfy payment obligations of another customer. In the event of a default by another customer of the broker or futures commission merchant, the Fund might not receive its variation margin payments from the clearinghouse, due to the manner in which variation margin payments are aggregated for all customers of the broker/futures commission merchant.
Collateral and margin requirements differ by type of derivative. Margin requirements are established by the broker, futures commission merchant or clearinghouse for exchange-traded and cleared derivatives, including centrally cleared swaps. Brokers, futures commission merchants and clearinghouses can ask for margin in excess of the regulatory minimum, or increase the margin amount, in certain circumstances.
For financial reporting purposes, cash collateral that has been pledged to cover obligations of the Fund, if any, is reported separately on the Statement of Assets and Liabilities as cash pledged as collateral. Non-cash collateral pledged by the Fund, if any, is noted in the Statement of Investments.
Generally, the amount of collateral due from or to a party must exceed a minimum transfer amount threshold (e.g. $250,000) before a transfer has to be made. To the extent amounts due to the Fund from its counterparties are not fully collateralized, contractually or otherwise, the Fund bears the risk of loss from counterparty nonperformance.
The following table presents the valuations of derivative instruments by risk exposure as reported within the Statement of Assets and Liabilities at period end:
| | | | | | | | | | | | | | |
| | | Asset Derivatives | | | Liability Derivatives | |
Derivatives Not Accounted
for as Hedging
Instruments | | Statement of Assets
and Liabilities Location | | Value | | | Statement of Assets
and Liabilities Location | | | Value | |
Interest rate contracts | | Variation margin receivable | | $ | 24,094* | | | | Variation margin payable | | | $ | 23,125* | |
*Includes only the current day’s variation margin. Prior variation margin movements have been reflected in cash on the Statement of Assets and Liabilities upon receipt or payment.
The effect of derivative instruments on the Statement of Operations is as follows:
| | | | | | | | | | | | |
Amount of Realized Gain or (Loss) Recognized on Derivatives | |
| Derivatives | | | | | | | | | |
Not Accounted
for as Hedging | | Futures | | | | | | | |
| Instruments | | contracts | | | Swap contracts | | | Total | |
| |
Credit contracts | | $ | — | | | $ | 94,741 | | | $ | 94,741 | |
Interest rate contracts | | | 350,898 | | | | — | | | | 350,898 | |
| | | | |
Total | | $ | 350,898 | | | $ | 94,741 | | | $ | 445,639 | |
| | | | |
| | | | | | | | | | | | |
Amount of Change in Unrealized Gain or (Loss) Recognized on Derivatives | |
| Derivatives | | | | | | | | | |
Not Accounted
for as Hedging | | Futures | | | | | | | |
| Instruments | | contracts | | | Swap contracts | | | Total | |
Credit contracts | | $ | — | | | $ | 776 | | | $ | 776 | |
Interest rate contracts | | | 159,452 | | | | — | | | | 159,452 | |
| | | | |
Total | | $ | 159,452 | | | $ | 776 | | | $ | 160,228 | |
| | | | |
31 OPPENHEIMER TOTAL RETURN BOND FUND/VA
NOTES TO FINANCIAL STATEMENTS Continued
7. Shares of Beneficial Interest
The Fund has authorized an unlimited number of $0.001 par value shares of beneficial interest of each class. Transactions in shares of beneficial interest were as follows:
| | | | | | | | | | | | | | | | | | | | |
| | | Year Ended December 31, 2017 | | | | | | Year Ended December 31, 2016 | |
| | | Shares | | | Amount | | | | | | Shares | | | Amount | |
| |
Non-Service Shares | | | | | | | | | | | | | | | | | | | | |
Sold | | | 1,035,605 | | | $ | 8,035,937 | | | | | | | | 1,355,120 | | | $ | 10,666,396 | |
Dividends and/or distributions reinvested | | | 261,553 | | | | 2,024,420 | | | | | | | | 420,198 | | | | 3,248,135 | |
Redeemed | | | (1,765,201) | | | | (13,727,340) | | | | | | | | (1,952,587) | | | | (15,269,713) | |
| | | | |
Net decrease | | | (468,043) | | | $ | (3,666,983) | | | | | | | | (177,269) | | | $ | (1,355,182) | |
| | | | |
|
| |
Service Shares | | | | | | | | | | | | | | | | | | | | |
Sold | | | 1,815,951 | | | $ | 13,919,373 | | | | | | | | 3,050,438 | | | $ | 23,656,300 | |
Dividends and/or distributions reinvested | | | 148,618 | | | | 1,136,931 | | | | | | | | 244,739 | | | | 1,867,358 | |
Redeemed | | | (2,406,983) | | | | (18,467,514) | | | | | | | | (3,149,918) | | | | (24,340,335) | |
| | | | |
Net increase (decrease) | | | (442,414) | | | $ | (3,411,210) | | | | | | | | 145,259 | | | $ | 1,183,323 | |
| | | | |
8. Purchases and Sales of Securities
The aggregate cost of purchases and proceeds from sales of securities, other than short-term obligations and investments in IGMMF, for the reporting period were as follows:
| | | | | | | | |
| | | Purchases | | | Sales | |
| |
Investment securities | | | $97,711,776 | | | | $93,429,943 | |
U.S. government and government agency obligations | | | 253,835 | | | | 1,360,797 | |
To Be Announced (TBA) mortgage-related securities | | | 679,964,368 | | | | 662,714,451 | |
9. Fees and Other Transactions with Affiliates
Management Fees. Under the investment advisory agreement, the Fund pays the Manager a management fee based on the daily net assets of the Fund at an annual rate as shown in the following table:
| | | | |
| Fee Schedule | | | | |
|
Up to $1 billion | | 0.60% | | |
Over $1 billion | | 0.50 | | |
The Fund’s effective management fee for the reporting period was 0.60% of average annual net assets before any applicable waivers.
Sub-Adviser Fees. The Manager has retained the Sub-Adviser to provide the day-to-day portfolio management of the Fund. Under the Sub-Advisory Agreement, the Manager pays the Sub-Adviser an annual fee in monthly installments, equal to a percentage of the investment management fee collected by the Manager from the Fund, which shall be calculated after any investment management fee waivers. The fee paid to the Sub-Adviser is paid by the Manager, not by the Fund.
Transfer Agent Fees. OFI Global (the “Transfer Agent”) serves as the transfer and shareholder servicing agent for the Fund. The Fund pays the Transfer Agent a fee based on annual net assets. Fees incurred and average net assets for each class with respect to these services are detailed in the Statement of Operations and Financial Highlights, respectively.
Sub-Transfer Agent Fees. The Transfer Agent has retained Shareholder Services, Inc., a wholly-owned subsidiary of OFI (the “Sub-Transfer Agent”), to provide the day-to-day transfer agent and shareholder servicing of the Fund. Under the Sub-Transfer Agency Agreement, the Transfer Agent pays the Sub-Transfer Agent an annual fee in monthly installments, equal to a percentage of the transfer agent fee collected by the Transfer Agent from the Fund, which shall be calculated after any applicable fee waivers. The fee paid to the Sub-Transfer Agent is paid by the Transfer Agent, not by the Fund.
Trustees’ Compensation. The Fund’s Board of Trustees (“Board”) has adopted a compensation deferral plan for Independent Trustees that enables Trustees to elect to defer receipt of all or a portion of the annual compensation they are entitled to receive from the Fund. For purposes of determining the amount owed to the Trustees under the plan, deferred amounts are treated as though equal dollar amounts had been invested in shares of the Fund or in other Oppenheimer funds selected by the Trustees. The Fund purchases shares of the funds selected for deferral by the Trustees in amounts equal to his or her deemed investment, resulting in a Fund asset equal to the deferred compensation liability. Such assets are included as a component of “Other” within the asset section of the Statement of Assets and Liabilities. Deferral of Trustees’ fees under the plan will not affect the net assets of the Fund and will not materially affect the Fund’s assets, liabilities or net investment income per share. Amounts will be deferred until distributed in accordance with the compensation deferral plan.
Distribution and Service Plan for Service Shares. The Fund has adopted a Distribution and Service Plan (the “Plan”) pursuant to Rule 12b-1 under the 1940 Act for Service shares to pay OppenheimerFunds Distributor, Inc. (the “Distributor”), for distribution related services, personal service and
32 OPPENHEIMER TOTAL RETURN BOND FUND/VA
9. Fees and Other Transactions with Affiliates (Continued)
account maintenance for the Fund’s Service shares. Under the Plan, payments are made periodically at an annual rate of 0.25% of the daily net assets of Service shares of the Fund. The Distributor currently uses all of those fees to compensate sponsors of the insurance product that offers Fund shares, for providing personal service and maintenance of accounts of their variable contract owners that hold Service shares. These fees are paid out of the Fund’s assets on an on-going basis and increase operating expenses of the Service shares, which results in lower performance compared to the Fund’s shares that are not subject to a service fee. Fees incurred by the Fund under the Plan are detailed in the Statement of Operations.
Waivers and Reimbursements of Expenses. The Manager has contractually agreed to limit the Fund’s expenses after payments, waivers and/or reimbursements and reduction to custodian expenses, excluding any applicable dividend expense, taxes, interest and fees from borrowing, any subsidiary expenses, Acquired Fund Fees and Expenses, brokerage commissions, unusual and infrequent expenses and certain other Fund expenses; so that those expenses, as percentages of daily net assets, will not exceed the annual rate of 0.75% for Non-Service shares and 1.00% for Service shares.
During the reporting period, the Manager waived fees and/or reimbursed the Fund as follows:
| | | | |
Non-Service shares | | $ | 79,706 | |
Service shares | | | 50,424 | |
This fee waiver and/or expense reimbursement may not be amended or withdrawn for one year from the date of the Fund’s prospectus, unless approved by the Board.
The Manager will waive fees and/or reimburse Fund expenses in an amount equal to the indirect management fees incurred through the Fund’s investment in IGMMF. During the reporting period, the Manager waived fees and/or reimbursed the Fund $2,494 for IGMMF management fees. This fee waiver and/or expense reimbursement may not be amended or withdrawn for one year from the date of the Fund’s prospectus, unless approved by the Board.
10. Borrowings and Other Financing
Joint Credit Facility. A number of mutual funds managed by the Manager participate in a $1.875 billion revolving credit facility (the “Facility”) intended to provide short-term financing, if necessary, subject to certain restrictions in connection with atypical redemption activity. Expenses and fees related to the Facility are paid by the participating funds and are disclosed separately or as other expenses on the Statement of Operations. The Fund did not utilize the Facility during the reporting period.
33 OPPENHEIMER TOTAL RETURN BOND FUND/VA
REPORT OF INDEPENDENT REGISTERED PUBLIC ACCOUNTING FIRM
To the Shareholders and Board of Trustees
Oppenheimer Variable Account Funds:
Opinion on the Financial Statements
We have audited the accompanying statement of assets and liabilities of Oppenheimer Total Return Bond Fund/VA, formerly Oppenheimer Core Bond Fund/VA, a separate series of Oppenheimer Variable Account Funds, (the “Fund”), including the statement of investments, as of December 31, 2017, the related statement of operations for the year then ended, the statements of changes in net assets for each of the years in the two year period then ended, and the related notes (collectively, the “financial statements”) and the financial highlights for each of the years in the five year period then ended. In our opinion, the financial statements and financial highlights present fairly, in all material respects, the financial position of the Fund as of December 31, 2017, the results of its operations for the year then ended, the changes in its net assets for each of the years in the two year period then ended, and the financial highlights for each of the years in the five year period then ended, in conformity with U.S. generally accepted accounting principles.
Basis for Opinion
These financial statements and financial highlights are the responsibility of the Fund’s management. Our responsibility is to express an opinion on these financial statements and financial highlights based on our audits. We are a public accounting firm registered with the Public Company Accounting Oversight Board (United States) (“PCAOB”) and are required to be independent with respect to the Fund in accordance with the U.S. federal securities laws and the applicable rules and regulations of the Securities and Exchange Commission and the PCAOB.
We conducted our audits in accordance with the standards of the PCAOB. Those standards require that we plan and perform the audit to obtain reasonable assurance about whether the financial statements and financial highlights are free of material misstatement, whether due to error or fraud. Our audits included performing procedures to assess the risks of material misstatement of the financial statements and financial highlights, whether due to error or fraud, and performing procedures that respond to those risks. Such procedures included examining, on a test basis, evidence regarding the amounts and disclosures in the financial statements and financial highlights. Such procedures also included confirmation of securities owned as of December 31, 2017, by correspondence with the custodian, brokers and the transfer agent, or by other appropriate auditing procedures. Our audits also included evaluating the accounting principles used and significant estimates made by management, as well as evaluating the overall presentation of the financial statements and financial highlights. We believe that our audits provide a reasonable basis for our opinion.
KPMG LLP
We have not been able to determine the specific year that we began serving as the auditor of one or more Oppenheimer Funds investment companies, however we are aware that we have served as the auditor of one or more Oppenheimer Funds investment companies since at least 1969.
Denver, Colorado
February 13, 2018
34 OPPENHEIMER TOTAL RETURN BOND FUND/VA
FEDERAL INCOME TAX INFORMATION Unaudited
In early 2018, if applicable, shareholders of record received information regarding all dividends and distributions paid to them by the Fund during calendar year 2017.
None of the dividends paid by the Fund during the reporting period are eligible for the corporate dividend-received deduction.
The foregoing information is presented to assist shareholders in reporting distributions received from the Fund to the Internal Revenue Service. Because of the complexity of the federal regulations which may affect your individual tax return and the many variations in state and local tax regulations, we recommend that you consult your tax advisor for specific guidance.
35 OPPENHEIMER TOTAL RETURN BOND FUND/VA
BOARD APPROVAL OF THE FUND’S INVESTMENT ADVISORY AND SUB-ADVISORY AGREEMENTS Unaudited
The Fund has entered into an investment advisory agreement with OFI Global Asset Management, Inc. (“OFI Global” or the “Adviser”), a wholly-owned subsidiary of OppenheimerFunds, Inc. (“OFI” or the “Sub-Adviser”) (“OFI Global” and “OFI” together, the “Managers”) and OFI Global has entered into a sub-advisory agreement with OFI whereby OFI provides investment sub-advisory services to the Fund (collectively, the “Agreements”). Each year, the Board of Trustees (the “Board”), including a majority of the independent Trustees, is required to determine whether to approve the terms of the Agreements and the renewal thereof. The Investment Company Act of 1940, as amended, requires that the Board request and evaluate, and that the Managers provide, such information as may be reasonably necessary to evaluate the terms of the Agreements. The Board employs an independent consultant to prepare a report that provides information, including comparative information that the Board requests for that purpose. In addition to in-person meetings focused on this evaluation, the Board receives information throughout the year regarding Fund services, fees, expenses and performance.
The Managers and the independent consultant provided information to the Board on the following factors: (i) the nature, quality and extent of the Managers’ services, (ii) the comparative investment performance of the Fund and the Managers, (iii) the fees and expenses of the Fund, including comparative fee and expense information, (iv) the profitability of the Managers and their affiliates, including an analysis of the cost of providing services, (v) whether economies of scale are realized as the Fund grows and whether fee levels reflect these economies of scale for Fund investors and (vi) other benefits to the Managers from their relationship with the Fund. The Board was aware that there are alternatives to retaining the Managers.
Outlined below is a summary of the principal information considered by the Board as well as the Board’s conclusions.
Nature, Quality and Extent of Services. The Board considered information about the nature, quality and extent of the services provided to the Fund and information regarding the Managers’ key personnel who provide such services. The Managers’ duties include providing the Fund with the services of the portfolio managers and the Sub-Adviser’s investment team, who provide research, analysis and other advisory services in regard to the Fund’s investments; and securities trading services. OFI Global is responsible for oversight of third-party service providers; monitoring compliance with applicable Fund policies and procedures and adherence to the Fund’s investment restrictions; risk management; and oversight of the Sub-Adviser. OFI Global is also responsible for providing certain administrative services to the Fund. Those services include providing and supervising all administrative and clerical personnel who are necessary in order to provide effective corporate administration for the Fund; compiling and maintaining records with respect to the Fund’s operations; preparing and filing reports required by the U.S. Securities and Exchange Commission; preparing periodic reports regarding the operations of the Fund for its shareholders; preparing proxy materials for shareholder meetings; and preparing the registration statements required by federal and state securities laws for the sale of the Fund’s shares. OFI Global also provides the Fund with office space, facilities and equipment.
The Board also considered the quality of the services provided and the quality of the Managers’ resources that are available to the Fund. The Board took account of the fact that the Sub-Adviser has over fifty years of experience as an investment adviser and that its assets under management rank it among the top mutual fund managers in the United States. The Board evaluated the Managers’ advisory, administrative, accounting, legal, compliance and risk management services, among other services, and information the Board has received regarding the experience and professional qualifications of the Managers’ key personnel and the size and functions of their staff. In its evaluation of the quality of the portfolio management services provided, the Board considered the experience of Krishna Memani and Peter Strzalkowski, the portfolio managers for the Fund, and the Sub-Adviser’s investment team and analysts. The Board members also considered the totality of their experiences with the Managers as directors or trustees of the Fund and other funds advised by the Managers. The Board considered information regarding the quality of services provided by affiliates of the Managers, which the Board members have become knowledgeable about through their experiences with the Managers and in connection with the review or renewal of the Fund’s service agreements or service providers. The Board concluded, in light of the Managers’ experience, reputation, personnel, operations and resources that the Fund benefits from the services provided under the Agreements.
Investment Performance of the Managers and the Fund. Throughout the year, the Managers provided information on the investment performance of the Fund, the Adviser and the Sub-Adviser, including comparative performance information. The Board also reviewed information, prepared by the Managers and by the independent consultant, comparing the Fund’s historical performance to relevant market indices and to the performance of other intermediate-term bond funds underlying variable insurance products. The Board considered that the Fund outperformed its category median during the one-, three- and five-year periods, although it underperformed for the ten-year period.
Fees and Expenses of the Fund. The Board reviewed the fees paid to the Adviser and the other expenses borne by the Fund. The Board noted that the Adviser, not the Fund, pays the Sub-Adviser’s fee under the sub-advisory agreement. The independent consultant provided comparative data in regard to the fees and expenses of the Fund and other intermediate-term bond funds underlying variable insurance products. In reviewing the fees and expenses charged to the VA funds, the Board considered the Adviser’s assertion that, because there is much greater disparity in the fees and services that may be provided by a manager to a VA fund as opposed to a retail fund, when comparing the expenses of the various VA funds to those of retail funds, it is most appropriate to focus on total expenses (rather than on the management fees). Accordingly, while the Board reviewed and considered all expenses, it focused on total expenses. The Board considered that the Fund’s total expenses, net of any waivers, and contractual management fee were higher than its peer group medians and its category medians. The Board considered that the Adviser has contractually agreed to limit the Fund’s total annual operating expenses so that those expenses, as percentages of daily net assets, will not exceed that annual rate of 0.75% for Non-Service Shares and 1.00% for Service Shares. The Adviser has also contractually agreed to waive fees and/or reimburse Fund expenses in an amount equal to the indirect management fees incurred through the Fund’s investments in funds managed by the Adviser or its affiliates. Each of these fee waivers and/or expense reimbursements may not be amended or withdrawn for one year from the date of the Fund’s prospectus, unless approved by the Board.
Economies of Scale and Profits Realized by the Managers. The Board considered information regarding the Managers’ costs in serving as the Fund’s investment adviser and sub-adviser, including the costs associated with the personnel and systems necessary to manage the Fund, and information regarding the Managers’ profitability from their relationship with the Fund. The Board also considered that the Managers must be able to pay and retain experienced professional personnel at competitive rates to provide quality services to the Fund. The Board reviewed whether the Managers may realize economies of scale in managing and supporting the Fund. The Board noted that the Fund currently has management fee
36 OPPENHEIMER TOTAL RETURN BOND FUND/VA
BOARD APPROVAL OF THE FUND’S INVESTMENT ADVISORY AND SUB-ADVISORY AGREEMENTS
Unaudited / Continued
breakpoints, which are intended to share with Fund shareholders economies of scale that may exist as the Fund’s assets grow.
Other Benefits to the Managers. In addition to considering the profits realized by the Managers, the Board considered information that was provided regarding the direct and indirect benefits the Managers receive as a result of their relationship with the Fund, including compensation paid to the Managers’ affiliates.
Conclusions. These factors were also considered by the independent Trustees meeting separately from the full Board, assisted by experienced counsel to the Fund and to the independent Trustees. Fund counsel and the independent Trustees’ counsel are independent of the Managers within the meaning and intent of the Securities and Exchange Commission rules.
Based on its review of the information it received and its evaluations described above, the Board, including a majority of the independent Trustees, decided to continue the Agreements through August 31, 2018. In arriving at its decision, the Board did not identify any factor or factors as being more important than others, but considered all of the above information, and considered the terms and conditions of the Agreements, including the management fees, in light of all the surrounding circumstances.
37 OPPENHEIMER TOTAL RETURN BOND FUND/VA
PORTFOLIO PROXY VOTING POLICIES AND GUIDELINES; UPDATES TO STATEMENTS OF INVESTMENTS
The Fund has adopted Portfolio Proxy Voting Policies and Guidelines under which the Fund votes proxies relating to securities (“portfolio proxies”) held by the Fund. A description of the Fund’s Portfolio Proxy Voting Policies and Guidelines is available (i) without charge, upon request, by calling the Fund toll-free at 1.800.CALL OPP (225.5677), (ii) on the Fund’s website at www.oppenheimerfunds.com, and (iii) on the SEC’s website at www.sec.gov. In addition, the Fund is required to file Form N-PX, with its complete proxy voting record for the 12 months ended June 30th, no later than August 31st of each year. The Fund’s voting record is available (i) without charge, upon request, by calling the Fund toll-free at 1.800.CALL OPP (225.5677), and (ii) in the Form N-PX filing on the SEC’s website at www.sec.gov.
The Fund files its complete schedule of portfolio holdings with the SEC for the first quarter and the third quarter of each fiscal year on Form N-Q. The Fund’s Form N-Q filings are available on the SEC’s website at www.sec.gov. Those forms may be reviewed and copied at the SEC’s Public Reference Room in Washington, D.C. Information on the operation of the Public Reference Room may be obtained by calling 1-800-SEC-0330.
38 OPPENHEIMER TOTAL RETURN BOND FUND/VA
TRUSTEES AND OFFICERS Unaudited
| | |
Name, Position(s) Held with the Fund, Length of
Service, Year of Birth | | Principal Occupation(s) During the Past 5 Years; Other Trusteeships/Directorships Held;
Number of Portfolios in the Fund Complex Currently Overseen |
| |
| INDEPENDENT TRUSTEES | | The address of each Trustee in the chart below is 6803 S. Tucson Way, Centennial, Colorado 80112-3924. Each Trustee serves for an indefinite term, or until his or her resignation, retirement, death or removal. |
| |
Robert J. Malone, Chairman of the Board of Trustees (since 2016), Trustee (since 2002) Year of Birth: 1944 | | Chairman - Colorado Market of MidFirst Bank (since January 2015); Chairman of the Board (2012-2016) and Director (August 2005-January 2016) of Jones International University (educational organization); Trustee of the Gallagher Family Foundation (non-profit organization) (2000-2016); Chairman, Chief Executive Officer and Director of Steele Street Bank Trust (commercial banking) (August 2003-January 2015); Director of Opera Colorado Foundation (non-profit organization) (2008-2012); Director of Colorado UpLIFT (charitable organization) (1986-2010); Director of Jones Knowledge, Inc. (2006-2010); Former Chairman of U.S. Bank-Colorado (subsidiary of U.S. Bancorp and formerly Colorado National Bank) (July 1996-April 1999); Director of Commercial Assets, Inc. (real estate investment trust) (1993-2000); Director of U.S. Exploration, Inc. (oil and gas exploration) (1997-February 2004); Chairman of the Board (1991-1994) and Trustee (1985-1994) of Regis University; and Chairman of the Board (1990-1991) and Member (1984-1999) of Young Presidents Organization. Oversees 54 portfolios in the OppenheimerFunds complex. Mr. Malone has served on the Boards of certain Oppenheimer funds since 2002, during which time he has become familiar with the Fund’s (and other Oppenheimer funds’) financial, accounting, regulatory and investment matters and has contributed to the Boards’ deliberations. |
| |
Andrew J. Donohue, Trustee (since 2017) Year of Birth: 1950 | | Of Counsel, Shearman & Sterling LLP (since September 2017); Chief of Staff of the U.S. Securities and Exchange Commission (regulator) (June 2015-February 2017); Managing Director and Investment Company General Counsel of Goldman Sachs (investment bank) (November 2012-May 2015); Partner at Morgan Lewis & Bockius, LLP (law firm) (March 2011-October 2012); Director of the Division of Investment Management of U.S. Securities and Exchange Commission (regulator) (May 2006-November 2010); Global General Counsel of Merrill Lynch Investment Managers (investment firm) (May 2003-May 2006); General Counsel (October 1991-November 2001) and Executive Vice President (January 1993-November 2001) of OppenheimerFunds, Inc. (investment firm) (June 1991-November 2001). Oversees 54 portfolios in the OppenheimerFunds complex. Mr. Donohue has served on the Boards of certain Oppenheimer funds since 2017, during which time he has become familiar with the Fund’s (and other Oppenheimer funds’) financial, accounting, regulatory and investment matters and has contributed to the Boards’ deliberations. |
| |
Jon S. Fossel, Trustee (since 1990) Year of Birth: 1942 | | Chairman of the Board of Jack Creek Preserve Foundation (non-profit organization) (2005-2015); Director of Jack Creek Preserve Foundation (non-profit organization) (since March 2005); Chairman of the Board (2006-December 2011) and Director (June 2002-December 2011) of UNUMProvident (insurance company); Director of Northwestern Energy Corp. (public utility corporation) (November 2004-December 2009); Director of P.R. Pharmaceuticals (October 1999-October 2003); Director of Rocky Mountain Elk Foundation (non-profit organization) (February 1998-February 2003 and February 2005-February 2007); Chairman and Director (until October 1996) and President and Chief Executive Officer (until October 1995) of the Sub-Adviser; President, Chief Executive Officer and Director of the following: Oppenheimer Acquisition Corp. (“OAC”) (parent holding company of the Sub-Adviser), Shareholders Services, Inc. and Shareholder Financial Services, Inc. (until October 1995). Oversees 54 portfolios in the OppenheimerFunds complex. Mr. Fossel has served on the Boards of certain Oppenheimer funds since 1990, during which time he has become familiar with the Fund’s (and other Oppenheimer funds’) financial, accounting, regulatory and investment matters and has contributed to the Boards’ deliberations. |
| |
Richard F. Grabish, Trustee (since 2012) Year of Birth: 1948 | | Formerly Senior Vice President and Assistant Director of Sales and Marketing (March 1997-December 2007), Director (March 1987-December 2007) and Manager of Private Client Services (June 1985-June 2005) of A.G. Edwards & Sons, Inc. (broker/dealer and investment firm); Chairman and Chief Executive Officer of A.G. Edwards Trust Company, FSB (March 2001-December 2007); President and Vice Chairman of A.G. Edwards Trust Company, FSB (investment adviser) (April 1987-March 2001); President of A.G. Edwards Trust Company, FSB (investment adviser) (June 2005-December 2007). Oversees 54 portfolios in the OppenheimerFunds complex. Mr. Grabish has served on the Boards of certain Oppenheimer funds since 2001, during which time he has become familiar with the Fund’s (and other Oppenheimer funds’) financial, accounting, regulatory and investment matters and has contributed to the Boards’ deliberations. |
| |
Beverly L. Hamilton, Trustee (since 2002) Year of Birth: 1946 | | Trustee of Monterey Institute for International Studies (educational organization) (2000-2014); Board Member of Middlebury College (educational organization) (December 2005-June 2011); Director (1991-2016), Vice Chairman of the Board (2006- 2009) and Chairman of the Board (2010-2013) of American Funds’ Emerging Markets Growth Fund, Inc. (mutual fund); Director of The California Endowment (philanthropic organization) (April 2002-April 2008); Director (February 2002-2005) and Chairman of Trustees (2006-2007) of the Community Hospital of Monterey Peninsula; President of ARCO Investment Management Company (February 1991-April 2000); Member of the investment committees of The Rockefeller Foundation (2001-2006) and The University of Michigan (since 2000); Advisor at Credit Suisse First Boston’s Sprout venture capital unit (venture capital fund) (1994-January 2005); Trustee of MassMutual Institutional Funds (investment company) (1996-June 2004); Trustee of MML Series Investment Fund (investment company) (April 1989-June 2004); Member of the investment committee of Hartford Hospital (2000-2003); and Advisor to Unilever (Holland) pension fund (2000-2003). Oversees 54 portfolios in the OppenheimerFunds complex. Ms. Hamilton has served on the Boards of certain Oppenheimer funds since 2002, during which time she has become familiar with the Fund’s (and other Oppenheimer funds’) financial, accounting, regulatory and investment matters and has contributed to the Boards’ deliberations. |
| |
Victoria J. Herget, Trustee (since 2012) Year of Birth: 1951 | | Board Chair (2008-2015) and Director (2004-Present), United Educators (insurance company); Trustee (since 2000) and Chair (since 2010), Newberry Library (independent research library); Trustee, Mather LifeWays (senior living organization) (since 2001); Independent Director of the First American Funds (mutual fund family) (2003-2011); former Managing Director (1993-2001), Principal (1985-1993), Vice President (1978-1985) and Assistant Vice President (1973-1978) of Zurich Scudder Investments (investment adviser) (and its predecessor firms); Trustee (1992-2007), Chair of the Board of Trustees (1999-2007), Investment Committee Chair (1994-1999) and Investment Committee member (2007-2010) of Wellesley College; Trustee, BoardSource (non-profit organization) (2006-2009) and Chicago City Day School (K-8 School) (1994-2005). Oversees 54 portfolios in the OppenheimerFunds complex. Ms. Herget has served on the Boards of certain Oppenheimer funds since 2012, during which time she has become familiar with the Fund’s (and other Oppenheimer funds’) financial, accounting, regulatory and investment matters and has contributed to the Boards’ deliberations. |
39 OPPENHEIMER TOTAL RETURN BOND FUND/VA
TRUSTEES AND OFFICERS Unaudited / Continued
| | |
| |
F. William Marshall, Jr., Trustee (since 2000) Year of Birth: 1942 | | Trustee Emeritus of Worcester Polytech Institute (WPI) (private university) (since 2009); Trustee of MassMutual Select Funds (formerly MassMutual Institutional Funds) (investment company) (1996-2015), MML Series Investment Fund (investment company) (1996-2015) and Mass Mutual Premier Funds (investment company) (January 2012-December 2015); President and Treasurer of the SIS Charitable Fund (private charitable fund) (January 1999-March 2011); Former Trustee of WPI (1985- 2008); Former Chairman of the Board (2004-2006) and Former Chairman of the Investment Committee of WPI (1994-2008); Chairman of SIS Family Bank, F.S.B. (formerly SIS Bank) (commercial bank) (January 1999-July 1999); Executive Vice President of Peoples Heritage Financial Group, Inc. (commercial bank) (January 1999-July 1999); and Former President and Chief Executive Officer of SIS Bancorp. (1993-1999). Oversees 54 portfolios in the OppenheimerFunds complex. Mr. Marshall has served on the Boards of certain Oppenheimer funds since 2000, during which time he has become familiar with the Fund’s (and other Oppenheimer funds’) financial, accounting, regulatory and investment matters and has contributed to the Boards’ deliberations. |
| |
Karen L. Stuckey, Trustee (since 2012) Year of Birth: 1953 | | Member (since May 2015) of Desert Mountain Community Foundation Advisory Board (non-profit organization); Partner (1990-2012) of PricewaterhouseCoopers LLP (professional services firm) (held various positions 1975-1990); Trustee (1992- 2006); member of Executive, Nominating and Audit Committees and Chair of Finance Committee (1992-2006), and Emeritus Trustee (since 2006) of Lehigh University; and member, Women’s Investment Management Forum (professional organization) since inception. Oversees 54 portfolios in the OppenheimerFunds complex. Ms. Stuckey has served on the Boards of certain Oppenheimer funds since 2012, during which time she has become familiar with the Fund’s (and other Oppenheimer funds’) financial, accounting, regulatory and investment matters and has contributed to the Boards’ deliberations. |
| |
James D. Vaughn, Trustee (since 2012) Year of Birth: 1945 | | Retired; former managing partner (1994-2001) of Denver office of Deloitte & Touche LLP, (held various positions 1969- 1993); Trustee and Chairman of the Audit Committee of Schroder Funds (2003-2012); Board member and Chairman of Audit Committee of AMG National Trust Bank (since 2005); Trustee and Investment Committee member, University of South Dakota Foundation (since 1996); Board member, Audit Committee Member and past Board Chair, Junior Achievement (since 1993); former Board member, Mile High United Way, Boys and Girls Clubs, Boy Scouts, Colorado Business Committee for the Arts, Economic Club of Colorado and Metro Denver Network. Oversees 54 portfolios in the OppenheimerFunds complex. Mr. Vaughn has served on the Boards of certain Oppenheimer funds since 2012, during which time he has become familiar with the Fund’s (and other Oppenheimer funds’) financial, accounting, regulatory and investment matters and has contributed to the Boards’ deliberations. |
| |
| INTERESTED TRUSTEE AND OFFICER | | Mr. Steinmetz is an “Interested Trustee” because he is affiliated with the Manager and the Sub-Adviser by virtue of his positions as Chairman and director of the Sub-Adviser and officer and director of the Manager. Both as a Trustee and as an officer, Mr. Steinmetz serves for an indefinite term, or until his resignation, retirement, death or removal. Mr. Steinmetz’s address is 225 Liberty Street, New York, New York 10281-1008. |
| |
Arthur P. Steinmetz, Trustee (since 2015), President and Principal Executive Officer (since 2014) Year of Birth: 1958 | | Chairman of the Sub-Adviser (since January 2015); CEO and Chairman of the Manager (since July 2014), President of the Manager (since May 2013), a Director of the Manager (since January 2013), Director of the Sub-Adviser (since July 2014), President, Management Director and CEO of Oppenheimer Acquisition Corp. (the Sub-Adviser’s parent holding company) (since July 2014), and President and Director of OFI SteelPath, Inc. (since January 2013). Chief Investment Officer of the OppenheimerFunds advisory entities from (January 2013-December 2013); Executive Vice President of the Manager (January 2013-May 2013); Chief Investment Officer of the Sub-Adviser (October 2010-December 2012); Chief Investment Officer, Fixed- Income, of the Sub-Adviser (April 2009-October 2010); Executive Vice President of the Sub-Adviser (October 2009-December 2012); Director of Fixed Income of the Sub-Adviser (January 2009-April 2009); and a Senior Vice President of the Sub-Adviser (March 1993-September 2009). An officer of 111 portfolios in the OppenheimerFunds complex. |
| |
| OTHER OFFICERS OF THE FUND | | The addresses of the Officers in the chart below are as follows: for Messrs. Memani, Strzalkowski, Mss. Lo Bessette, Foxson and Picciotto, 225 Liberty Street, New York, New York 10281-1008, for Mr. Petersen, 6803 S. Tucson Way, Centennial, Colorado 80112-3924. Each Officer serves for an indefinite term or until his or her resignation, retirement, death or removal. |
| |
Krishna Memani, Vice President (since 2009) Year of Birth: 1960 | | President of the Sub-Adviser (since January 2013); Executive Vice President of the Manager (since January 2014) and Chief Investment Officer of the OppenheimerFunds advisory entities (since January 2014). Chief Investment Officer, Fixed Income of the Sub-Adviser (January 2013-December 2013); Head of the Investment Grade Fixed Income Team of the Sub-Adviser (March 2009-January 2014); Director of Fixed Income of the Sub-Adviser (October 2010-December 2012); Senior Vice President of the Sub-Adviser (March 2009-December 2012) and Senior Vice President of OFI Global Institutional, Inc. (April 2009-December 2012). Managing Director and Head of the U.S. and European Credit Analyst Team at Deutsche Bank Securities (June 2006-January 2009). Chief Credit Strategist at Credit Suisse Securities (August 2002-March 2006). Managing Director and Senior Portfolio Manager at Putnam Investments (September 1998-June 2002). A portfolio manager and an officer of other portfolios in the OppenheimerFunds complex. |
| |
Peter A. Strzalkowski, Vice President (since 2009) Year of Birth: 1965 | | Senior Vice President of the Sub-Adviser (since January 2016); Senior Portfolio Manager of the Sub-Adviser (since August 2007); co-Team Leader for the Sub-Adviser’s Investment Grade Fixed Income Team (since January 2014); Vice President of the Sub-Adviser (August 2007-January 2016); a member of the Sub-Adviser’s Investment Grade Fixed Income Team (April 2009-January 2014). Managing Partner and Chief Investment Officer of Vector Capital Management, LLC, a structured products money management firm he founded, (July 2006-August 2007); Senior Portfolio Manager at Highland Capital Management, L.P. (June 2005-July 2006); Senior Fixed Income Portfolio Manager at Microsoft Corp. (June 2003-June 2005); Vice President and Senior Fixed Income Portfolio Manager at First Citizens Bank Trust, Capital Management Group (April 2000-June 2003); a Vice President and Fixed Income Portfolio Manager at Centura Banks (November 1998-April 2000). A portfolio manager and officer of other portfolios in the OppenheimerFunds complex. |
40 OPPENHEIMER TOTAL RETURN BOND FUND/VA
| | |
Cynthia Lo Bessette, Secretary and Chief Legal Officer (since 2016) Year of Birth: 1969 | | Executive Vice President, General Counsel and Secretary of the Manager (since February 2016); Senior Vice President and Deputy General Counsel of the Manager (March 2015-February 2016); Chief Legal Officer of the Sub-Adviser and the Distributor (since February 2016); Vice President, General Counsel and Secretary of Oppenheimer Acquisition Corp. (since February 2016); General Counsel of OFI SteelPath, Inc., OFI Advisors, LLC and Index Management Solutions, LLC (since February 2016); Chief Legal Officer of OFI Global Institutional, Inc., HarbourView Asset Management Corporation, OFI Global Trust Company, Oppenheimer Real Asset Management, Inc., OFI Private Investments Inc., Shareholder Services, Inc. and Trinity Investment Management Corporation (since February 2016); Corporate Counsel (February 2012-March 2015) and Deputy Chief Legal Officer (April 2013-March 2015) of Jennison Associates LLC; Assistant General Counsel (April 2008-September 2009) and Deputy General Counsel (October 2009-February 2012) of Lord Abbett & Co. LLC. An officer of 111 portfolios in the OppenheimerFunds complex. |
| |
Jennifer Foxson, Vice President and Chief Business Officer (since 2014) Year of Birth: 1969 | | Senior Vice President of OppenheimerFunds Distributor, Inc. (since June 2014); Vice President of OppenheimerFunds Distributor, Inc. (April 2006-June 2014); Vice President of the Sub-Adviser (January 1998-March 2006); Assistant Vice President of the Sub-Adviser (October 1991-December 1998). An officer of 111 portfolios in the OppenheimerFunds complex. |
| |
Mary Ann Picciotto, Chief Compliance Officer and Chief Anti- Money Laundering Officer (since 2014) Year of Birth: 1973 | | Senior Vice President and Chief Compliance Officer of the Manager (since March 2014); Chief Compliance Officer of the Sub- Adviser, OFI SteelPath, Inc., OFI Global Trust Company, OFI Global Institutional, Inc., Oppenheimer Real Asset Management, Inc., OFI Private Investments, Inc., Harborview Asset Management Corporation, Trinity Investment Management Corporation, and Shareholder Services, Inc. (since March 2014); Managing Director of Morgan Stanley Investment Management Inc. and certain of its various affiliated entities; Chief Compliance Officer of various Morgan Stanley Funds (May 2010-January 2014); Chief Compliance Officer of Morgan Stanley Investment Management Inc. (April 2007-January 2014). An officer of 111 portfolios in the OppenheimerFunds complex. |
| |
Brian S. Petersen, Treasurer and Principal Financial & Accounting Officer (since 2016) Year of Birth: 1970 | | Senior Vice President of the Manager (since January 2017); Vice President of the Manager (January 2013-January 2017); Vice President of the Sub-Adviser (February 2007-December 2012); Assistant Vice President of the Sub-Adviser (August 2002- 2007). An officer of 111 portfolios in the OppenheimerFunds complex. |
The Fund’s Statement of Additional Information contains additional information about the Fund’s Trustees and Officers and is available without charge, upon request, by calling 1.800.988.8287.
41 OPPENHEIMER TOTAL RETURN BOND FUND/VA
THIS PAGE INTENTIONALLY LEFT BLANK.
42 OPPENHEIMER TOTAL RETURN BOND FUND/VA
THIS PAGE INTENTIONALLY LEFT BLANK.
43 OPPENHEIMER TOTAL RETURN BOND FUND/VA
OPPENHEIMER TOTAL RETURN BOND FUND/VA
A Series of Oppenheimer Variable Account Funds
| | |
| Manager | | OFI Global Asset Management, Inc. |
| |
| Sub-Adviser | | OppenheimerFunds, Inc. |
| |
| Distributor | | OppenheimerFunds Distributor, Inc. |
| |
Transfer and Shareholder Servicing Agent | | OFI Global Asset Management, Inc. |
| |
| Sub-Transfer Agent | | Shareholder Services, Inc. DBA OppenheimerFunds Services |
| |
| Independent Registered Public Accounting Firm | | KPMG LLP |
| |
| Legal Counsel | | Ropes & Gray LLP |
| |
| | Before investing in any of the Oppenheimer funds, investors should carefully consider a fund’s investment objectives, risks, charges and expenses. Fund prospectuses and summary prospectuses contain this and other information about the funds, and may be obtained by asking your financial advisor, visiting oppenheimerfunds.com or calling us at 1.800.988.8287. Read prospectuses and summary prospectuses carefully before investing. |
| |
| | © 2018 OppenheimerFunds, Inc. All rights reserved. Oppenheimer funds are distributed by OppenheimerFunds Distributor, Inc. |

| | | | |
| | 
| | |
| | |
| | | December 31, 2017 | | |
| | Oppenheimer | | |
| | Global Fund/VA | | Annual Report |
| | A Series of Oppenheimer Variable Account Funds | | |
| | | |
| | ANNUAL REPORT | | |
| | |
| | Listing of Top Holdings | | |
| | |
| | Fund Performance Discussion | | |
| | |
| | Financial Statements | | |
PORTFOLIO MANAGERS: Rajeev Bhaman, CFA and John Delano, CFA
AVERAGE ANNUAL TOTAL RETURNS FOR THE PERIODS ENDED 12/31/17
| | | | | | | | | | | | | | | | |
| | | Inception
Date | | | 1-Year | | | 5-Year | | | 10-Year | |
Non-Service Shares | | | 11/12/90 | | | | 36.66 | % | | | 13.11 | % | | | 7.16 | % |
Service Shares | | | 7/13/00 | | | | 36.32 | | | | 12.83 | | | | 6.89 | |
MSCI All Country World Index | | | | | | | 23.97 | | | | 10.80 | | | | 4.65 | |
Performance data quoted represents past performance, which does not guarantee future results. The investment return and principal value of an investment in the Fund will fluctuate so that an investor’s shares, when redeemed, may be worth more or less than their original cost. Current performance may be lower or higher than the performance quoted. For performance data current to the most recent month end, call us at 1.800.988.8287. The Fund’s total returns should not be expected to be the same as the returns of other funds, whether or not both funds have the same portfolio managers and/or similar names. The Fund’s total returns include changes in share price and reinvested distributions but do not include the charges associated with the separate account products that offer this Fund. Such performance would have been lower if such charges were taken into account. Returns for periods of less than one year are cumulative and not annualized. See Fund prospectuses and summary prospectuses for more information on share classes and sales charges.
TOP HOLDINGS AND ALLOCATIONS
TOP TEN COMMON STOCK HOLDINGS
| | | | |
Airbus SE | | | 3.2% | |
Alphabet, Inc., Cl. A | | | 3.0 | |
Alphabet, Inc., Cl. C | | | 2.8 | |
LVMH Moet Hennessy Louis Vuitton SE | | | 2.8 | |
Aetna, Inc. | | | 2.7 | |
Citigroup, Inc. | | | 2.5 | |
Nidec Corp. | | | 2.5 | |
DLF Ltd. | | | 2.5 | |
S&P Global, Inc. | | | 2.4 | |
Facebook, Inc., Cl. A | | | 2.4 | |
Portfolio holdings and allocations are subject to change. Percentages are as of December 31, 2017, and are based on net assets. For more current Fund holdings, please visit oppenheimerfunds.com.
REGIONAL ALLOCATION
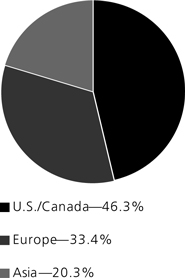
Portfolio holdings and allocations are subject to change. Percentages are as of December 31, 2017, and are based on the total market value of investments.
2 OPPENHEIMER GLOBAL FUND/VA
Fund Performance Discussion
Global equity sentiment was strong in 2017 following economic activity pick up in Europe and China and the election of President Trump in the US, presaging expectations for tax cuts and a lower regulatory burden. Equity markets rose strongly in 2017, with the global benchmark, the MSCI All Country World Index (the “Index”), returning 23.97%. The Fund had an excellent year too, with the Non-Service shares producing returns of 36.66%, outperforming the Index for the year December 31, 2017.
The Portfolio outperformed in 10 out of 11 sectors of the Index this reporting period, with strong contributions from the Consumer Discretionary, Health Care, Real Estate, Financials and Industrials sectors, where our stock selection drove performance. We hold one Real Estate position, DLF, and it rose sharply during the reporting period. Our allocations to Energy and Information Technology also produced material outperformance versus the Index – the Fund has an overweight position in Information Technology and an underweight position in Energy. The Portfolio only slightly underperformed within the Materials sector, where our typical underweight position detracted from performance. As our ability to predict commodities prices is limited, our confidence in the appropriate valuation for these companies is low and hence we are unlikely to be advantaged in our ownership of them.
FUND REVIEW
Top contributors to performance this period included DLF, Alphabet and Kering.
DLF is the largest listed Indian real estate company with a portfolio of residential projects, shopping malls and commercial properties of unmatched quality, in our view, in Delhi and the National Capital region. A soft residential market and regulatory burdens in the past 3 years had challenged cash flow dynamics in the company which have been significantly ameliorated through the sale of a portion of their commercial holdings. The resultant reduction of debt has fueled higher confidence in the future of DLF. We believe that the prospects for housing appreciation should improve with an economic rebound and lower interest rates and a more disciplined supply environment.
Alphabet has been a strong performer, reflecting its advantage in a number of fast growing verticals. We see those advantages holding, and there remains significant optionality for the company, which we do not believe is fully represented in its share value. Our first investment in the company was in 2011.
Kering is a luxury goods powerhouse with its major brands including Gucci, Bottega Veneta, Saint Laurent and Balenciaga. The return to fashion relevance of its largest brand, Gucci, in the past 18 months combined with continued success at Saint Laurent and growth momentum at Balenciaga has led to a major improvement in profits and consequently a significant rise in stock price. The continued demand from the young and fashion forward Chinese consumer for Kering’s brands bodes well for its future.
The most significant detractors from performance this period included TechnipFMC, Earthport, and Shire.
TechnipFMC is the global leader in offshore oil infrastructure equipment and services. The firm’s competitive position strengthened with the FMC combination earlier in the year. The company operates under three reporting segments: Subsea, Surface, and Onshore/Offshore. Share weakness was partially due to lower oil prices earlier in the year, which constrains oil producers’ capital spending budget, which can lead to lower inbound orders for TechnipFMC. We see tangible evidence that its various business segments, particularly in Subsea, are attracting wide customer interest and are poised to gain market share in the coming years.
Earthport provides cross-border payment services to banks and businesses, focused on low value transactions. The company experienced declines after announcing it expected revenue to come in below market expectations for the year, due to several large client implementation delays. Despite this disappointment, the new business pipeline is strong, and we expect the share price will recover.
Shire is a global specialty drug firm with specializing in orphan diseases. Its historic franchise in treating Attention Deficit Disorders funds growth in biologics and new orphan indications. The acquisition of Baxalta and concerns over its haemophilia franchise position hurt stock performance in 2017. We expect the regular approvals of new drugs and a return to growth after the digestion of Baxalta to lead to a better 2018.
POSITIONING AND OUTLOOK
A good starting point for investing in companies that have the capacity to grow at an above average rate for a long period of time is to be thinking carefully about what economic ecosystems are expanding structurally. From this thought process we can develop investment themes, some of which can be populated by
3 OPPENHEIMER GLOBAL FUND/VA
multiple companies/beneficiaries. Some of these themes today include the human desire for status and happiness. Within this broad idea we own some of the world’s best luxury goods companies. The use of technology to advance the treatment of illnesses for which there is no cure, or the deepening electronic content of automobiles and trucks are others. None are present in the portfolio to capitalize on a market regime or cycle; instead they play upon trends which we expect to unfold over the next decade or so.
The market that we see before us continues to carry above average headline valuations, and this is something to be mindful of. However, the level of interest rates today remains low. Equity free cash flow yields relative to bond yields are still in fair territory. Faster economic growth in an environment of low inflation provides valuation support. Meaningfully higher interest rates as a result of higher inflation would hurt valuations and the market however.
We try to assemble a portfolio that is adaptable to most environments by emphasizing the quality and sustainability of purpose for each company we invest in. We believe businesses that have these two traits can weather an uncertain future.
Investors should consider the Fund’s investment objective, risks, charges and expenses carefully before investing. The Fund’s prospectus and summary prospectus contain this and other information about the Fund, and may be obtained by asking your financial advisor or calling us at 1.800.988.8287. Read prospectuses and summary prospectuses carefully before investing.
Total returns include changes in share price and reinvestment of dividends and capital gains distributions in a hypothetical investment for the periods shown, but do not include the charges associated with the separate account products that offer this Fund.
The Fund’s investment strategy and focus can change over time. The mention of specific fund holdings does not constitute a recommendation by OppenheimerFunds, Inc. or its affiliates.
Shares of Oppenheimer funds are not deposits or obligations of any bank, are not guaranteed by any bank, are not insured by the FDIC or any other agency, and involve investment risks, including the possible loss of the principal amount invested.
Comparing the Fund’s Performance to the Market. The graphs that follow show the performance of a hypothetical $10,000 investment in each share class of the Fund held until December 31, 2017. Performance is measured over a ten-fiscal-year period for both Classes. Performance information does not reflect charges that apply to separate accounts investing in the Fund. If these charges were taken into account, performance would be lower. The graphs assume that all dividends and capital gains distributions were reinvested in additional shares.
The Fund’s performance is compared to the performance of the MSCI All Country World Index, a free float-adjusted market capitalization weighted index that is designed to measure the equity market performance of developed and emerging markets. The Index is unmanaged and cannot be purchased directly by investors. While index comparisons may be useful to provide a benchmark for the Fund’s performance, it must be noted that the Fund’s investments are not limited to the investments comprising the Index. Index performance includes reinvestment of income, but does not reflect transaction costs, fees, expenses or taxes. Index performance is shown for illustrative purposes only as a benchmark for the Fund’s performance, and does not predict or depict performance of the Fund. The Fund’s performance reflects the effects of the Fund’s business and operating expenses.
4 OPPENHEIMER GLOBAL FUND/VA
COMPARISON OF CHANGE IN VALUE OF $10,000 HYPOTHETICAL INVESTMENTS IN:
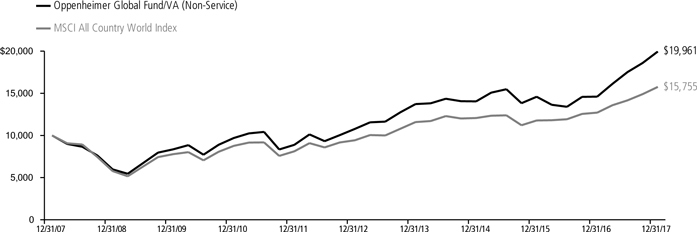
Average Annual Total Returns of Non-Service Shares of the Fund at 12/31/17
1-Year 36.66% 5-Year 13.11% 10-Year 7.16%
COMPARISON OF CHANGE IN VALUE OF $10,000 HYPOTHETICAL INVESTMENTS IN:

Average Annual Total Returns of Service Shares of the Fund at 12/31/17
1-Year 36.32% 5-Year 12.83% 10-Year 6.89%
Performance data quoted represents past performance, which does not guarantee future results. The investment return and principal value of an investment in the Fund will fluctuate so that an investor’s shares, when redeemed, may be worth more or less than their original cost. Current performance may be lower or higher than the performance quoted. For performance data current to the most recent month end, call us at 1.800.988.8287. The Fund’s total returns should not be expected to be the same as the returns of other funds, whether or not both funds have the same portfolio managers and/or similar names. The Fund’s total returns include changes in share price and reinvested distributions but do not include the charges associated with the separate account products that offer this Fund. Such performance would have been lower if such charges were taken into account.
5 OPPENHEIMER GLOBAL FUND/VA
Fund Expenses
Fund Expenses. As a shareholder of the Fund, you incur two types of costs: (1) transaction costs and (2) ongoing costs, including management fees; distribution and service fees; and other Fund expenses. These examples are intended to help you understand your ongoing costs (in dollars) of investing in the Fund and to compare these costs with the ongoing costs of investing in other mutual funds.
The examples are based on an investment of $1,000.00 invested at the beginning of the period and held for the entire 6-month period ended December 31, 2017.
Actual Expenses. The first section of the table provides information about actual account values and actual expenses. You may use the information in this section for the class of shares you hold, together with the amount you invested, to estimate the expense that you paid over the period. Simply divide your account value by $1,000.00 (for example, an $8,600.00 account value divided by $1,000.00 = 8.60), then multiply the result by the number in the first section under the heading entitled “Expenses Paid During 6 Months Ended December 31, 2017” to estimate the expenses you paid on your account during this period.
Hypothetical Example for Comparison Purposes.
The second section of the table provides information about hypothetical account values and hypothetical expenses based on the Fund’s actual expense ratio for each class of shares, and an assumed rate of return of 5% per year for each class before expenses, which is not the actual return. The hypothetical account values and expenses may not be used to estimate the actual ending account balance or expenses you paid for the period. You may use this information to compare the ongoing costs of investing in the Fund and other funds. To do so, compare this 5% hypothetical example for the class of shares you hold with the 5% hypothetical examples that appear in the shareholder reports of the other funds.
Please note that the expenses shown in the table are meant to highlight your ongoing costs only and do not reflect any charges associated with the separate accounts that offer this Fund. Therefore, the “hypothetical” lines of the table are useful in comparing ongoing costs only, and will not help you determine the relative total costs of owning different funds. In addition, if these separate account charges were included your costs would have been higher.
| | | | | | | | | | | | |
| Actual | | Beginning Account Value
July 1, 2017 | | | Ending
Account
Value
December 31, 2017 | | | Expenses
Paid During
6 Months Ended
December 31, 2017 | |
Non-Service shares | | $ | 1,000.00 | | | $ | 1,139.40 | | | $ | 4.11 | |
Service shares | | | 1,000.00 | | | | 1,137.90 | | | | 5.46 | |
| | | |
Hypothetical | | | | | | | | | | | | |
(5% return before expenses) | | | | | | | | | | | | |
Non-Service shares | | | 1,000.00 | | | | 1,021.37 | | | | 3.88 | |
Service shares | | | 1,000.00 | | | | 1,020.11 | | | | 5.16 | |
Expenses are equal to the Fund’s annualized expense ratio for that class, multiplied by the average account value over the period, multiplied by 184/365 (to reflect the one-half year period). Those annualized expense ratios, excluding indirect expenses from affiliated funds, based on the 6-month period ended December 31, 2017 are as follows:
| | | | |
| Class | | Expense Ratios | |
Non-Service shares | | | 0.76% | |
Service shares | | | 1.01 | |
The expense ratios reflect voluntary and/or contractual waivers and/or reimbursements of expenses by the Fund’s Manager. Some of these undertakings may be modified or terminated at any time, as indicated in the Fund’s prospectus. The “Financial Highlights” tables in the Fund’s financial statements, included in this report, also show the gross expense ratios, without such waivers or reimbursements and reduction to custodian expenses, if applicable.
6 OPPENHEIMER GLOBAL FUND/VA
STATEMENT OF INVESTMENTS December 31, 2017
| | | | | | | | |
| | | Shares | | | Value | |
| Common Stocks—97.1% | |
| Consumer Discretionary—14.5% | |
| Automobiles—1.1% | |
| Suzuki Motor Corp. | | | 538,000 | | | $ | 31,161,009 | |
| | | | | | | | | |
| Hotels, Restaurants & Leisure—0.8% | |
| International Game Technology plc | | | 851,991 | | | | 22,586,282 | |
| | | | | | | | | |
| Household Durables—0.5% | |
| Newell Brands, Inc. | | | 390,120 | | | | 12,054,708 | |
| | | | | | | | | |
| Internet & Catalog Retail—1.7% | |
| JD.com, Inc., ADR1 | | | 1,166,110 | | | | 48,300,276 | |
| | | | | | | | | |
| Media—1.8% | |
| Walt Disney Co. (The) | | | 362,400 | | | | 38,961,624 | |
| Zee Entertainment Enterprises Ltd. | | | 1,297,405 | | | | 11,825,092 | |
| | | | | | | 50,786,716 | |
| | | | | | | | | |
| Specialty Retail—3.0% | |
| Industria de Diseno Textil SA | | | 1,390,491 | | | | 48,363,476 | |
| Tiffany & Co. | | | 345,150 | | | | 35,878,342 | |
| | | | | | | 84,241,818 | |
| | | | | | | | | |
| Textiles, Apparel & Luxury Goods—5.6% | |
| Brunello Cucinelli SpA | | | 344,936 | | | | 11,177,081 | |
| Kering | | | 122,320 | | | | 57,664,711 | |
| LVMH Moet Hennessy Louis Vuitton SE | | | 268,330 | | | | 78,821,955 | |
| Tod’s SpA | | | 111,782 | | | | 8,168,579 | |
| | | | | | | 155,832,326 | |
| | | | | | | | | |
| Consumer Staples—4.0% | |
| Food Products—1.8% | |
| Unilever plc | | | 923,822 | | | | 51,179,316 | |
| | | | | | | | | |
| Household Products—2.2% | |
| Colgate-Palmolive Co. | | | 801,700 | | | | 60,488,265 | |
| | | | | | | | | |
| Energy—0.9% | |
| Energy Equipment & Services—0.9% | |
| TechnipFMC plc | | | 826,350 | | | | 25,524,678 | |
| | | | | | | | | |
| Financials—20.0% | |
| Capital Markets—6.5% | |
| Credit Suisse Group AG1 | | | 1,619,322 | | | | 28,824,419 | |
| Goldman Sachs Group, Inc. (The) | | | 165,430 | | | | 42,144,947 | |
| S&P Global, Inc. | | | 395,910 | | | | 67,067,154 | |
| UBS Group AG1 | | | 2,438,956 | | | | 44,813,887 | |
| | | | | | | 182,850,407 | |
| | | | | | | | | |
| Commercial Banks—5.1% | |
| Banco Bilbao Vizcaya Argentaria SA | | | 1,907,764 | | | | 16,239,683 | |
| Citigroup, Inc. | | | 936,960 | | | | 69,719,194 | |
| ICICI Bank Ltd., Sponsored ADR | | | 2,419,204 | | | | 23,538,855 | |
| Societe Generale SA | | | 635,199 | | | | 32,749,382 | |
| | | | | | | 142,247,114 | |
| | | | | | | | | |
| Insurance—5.9% | |
| Allianz SE | | | 228,032 | | | | 52,222,456 | |
| Dai-ichi Life Holdings, Inc. | | | 1,812,400 | | | | 37,394,978 | |
| FNF Group | | | 552,980 | | | | 21,698,935 | |
| Prudential plc | | | 2,026,517 | | | | 52,102,063 | |
| | | | | | | 163,418,432 | |
| | | | | | | | | |
| Real Estate Management & Development—2.5% | |
| DLF Ltd. | | | 16,911,795 | | | | 68,706,902 | |
| | | | | | | | | |
| Health Care—16.1% | |
| Biotechnology—7.4% | |
| ACADIA Pharmaceuticals, Inc.1 | | | 574,960 | | | | 17,312,046 | |
| AnaptysBio, Inc.1 | | | 138,740 | | | | 13,973,893 | |
| Biogen, Inc.1 | | | 87,690 | | | | 27,935,403 | |
| BioMarin Pharmaceutical, Inc.1 | | | 129,640 | | | | 11,559,999 | |
| Bluebird Bio, Inc.1 | | | 125,490 | | | | 22,349,769 | |
| Blueprint Medicines Corp.1 | | | 213,770 | | | | 16,120,396 | |
| Circassia Pharmaceuticals plc1 | | | 4,471,614 | | | | 6,202,803 | |
| Gilead Sciences, Inc. | | | 318,350 | | | | 22,806,594 | |
| | | | | | | | |
| | | Shares | | | Value | |
| Biotechnology (Continued) | |
| Ionis Pharmaceuticals, Inc.1 | | | 351,410 | | | $ | 17,675,923 | |
| Loxo Oncology, Inc.1 | | | 139,180 | | | | 11,716,172 | |
| MacroGenics, Inc.1 | | | 514,790 | | | | 9,781,010 | |
| Sage Therapeutics, Inc.1 | | | 182,640 | | | | 30,082,634 | |
| | | | | | | 207,516,642 | |
| | | | | | | | | |
| Health Care Equipment & Supplies—1.1% | |
| Zimmer Biomet Holdings, Inc. | | | 243,580 | | | | 29,392,799 | |
| | | | | | | | | |
| Health Care Providers & Services—5.5% | |
| Aetna, Inc. | | | 412,980 | | | | 74,497,462 | |
| Anthem, Inc. | | | 260,385 | | | | 58,589,229 | |
| Centene Corp.1 | | | 195,580 | | | | 19,730,110 | |
| | | | | | | 152,816,801 | |
| | | | | | | | | |
| Pharmaceuticals—2.1% | |
| Bayer AG | | | 261,359 | | | | 32,506,553 | |
| Roche Holding AG | | | 56,730 | | | | 14,349,469 | |
| Shire plc | | | 233,940 | | | | 12,134,077 | |
| | | | | | | 58,990,099 | |
| | | | | | | | | |
| Industrials—14.0% | |
| Aerospace & Defense—3.2% | |
| Airbus SE | | | 891,780 | | | | 88,558,851 | |
| | | | | | | | | |
| Air Freight & Couriers—1.0% | |
| United Parcel Service, Inc., Cl. B | | | 238,010 | | | | 28,358,891 | |
| | | | | | | | | |
| Airlines—0.9% | |
| International Consolidated Airlines Group SA | | | 2,857,670 | | | | 25,063,974 | |
| Building Products—1.2% | |
| Assa Abloy AB, Cl. B | | | 1,602,741 | | | | 33,257,530 | |
| | | | | | | | | |
| Construction & Engineering—0.5% | |
| FLSmidth & Co. AS | | | 262,140 | | | | 15,228,249 | |
| | | | | | | | | |
| Electrical Equipment—2.5% | |
| Nidec Corp. | | | 496,500 | | | | 69,695,481 | |
| | | | | | | | | |
| Industrial Conglomerates—2.8% | |
| 3M Co. | | | 183,720 | | | | 43,242,177 | |
| Siemens AG | | | 244,512 | | | | 33,925,820 | |
| | | | | | | 77,167,997 | |
| | | | | | | | | |
| Machinery—1.3% | |
| FANUC Corp. | | | 100,100 | | | | 24,049,895 | |
| MLC MLC, Inc. | | | 622,000 | | | | 13,050,813 | |
| | | | | | | 37,100,708 | |
| | | | | | | | | |
| Professional Services—0.6% | |
| Equifax, Inc. | | | 130,130 | | | | 15,344,929 | |
| | | | | | | | | |
| Information Technology—26.5% | |
| Electronic Equipment, Instruments, & Components—6.7% | |
| Keyence Corp. | | | 115,122 | | | | 64,280,171 | |
| Kyocera Corp. | | | 508,500 | | | | 33,225,886 | |
| Murata Manufacturing Co. Ltd. | | | 342,300 | | | | 45,749,933 | |
| Omron Corp. | | | 237,600 | | | | 14,151,920 | |
| TDK Corp. | | | 371,300 | | | | 29,637,473 | |
| | | | | | | 187,045,383 | |
| | | | | | | | | |
| Internet Software & Services—8.8% | |
| Alphabet, Inc., Cl. A1 | | | 78,240 | | | | 82,418,016 | |
| Alphabet, Inc., Cl. C1 | | | 75,512 | | | | 79,015,757 | |
| Baidu, Inc., Sponsored ADR1 | | | 80,600 | | | | 18,877,326 | |
| Facebook, Inc., Cl. A1 | | | 375,250 | | | | 66,216,615 | |
| | | | | | | 246,527,714 | |
| | | | | | | | | |
| IT Services—1.4% | |
| Earthport plc1 | | | 14,765,253 | | | | 2,055,111 | |
| PayPal Holdings, Inc.1 | | | 481,210 | | | | 35,426,680 | |
| | | | | | | 37,481,791 | |
| | | | | | | | | |
| Semiconductors & Semiconductor Equipment—2.3% | |
| Maxim Integrated Products, Inc. | | | 1,056,665 | | | | 55,242,446 | |
7 OPPENHEIMER GLOBAL FUND/VA
STATEMENT OF INVESTMENTS Continued
| | | | | | | | |
| | | Shares | | | Value | |
| Semiconductors & Semiconductor Equipment (Continued) | |
Renesas Electronics Corp.1 | | | 767,600 | | | $ | 8,885,115 | |
| | | | | | | 64,127,561 | |
| | | | | | | | | |
| Software—7.3% | |
| Adobe Systems, Inc.1 | | | 362,623 | | | | 63,546,055 | |
| Intuit, Inc. | | | 354,040 | | | | 55,860,431 | |
Nintendo Co. Ltd. | | | 71,700 | | | | 26,102,526 | |
SAP SE | | | 528,155 | | | | 59,221,970 | |
| | | | | | | 204,730,982 | |
| | | | | | | | | |
| Materials—1.1% | |
| Chemicals—1.1% | |
Linde AG1 | | | 124,187 | | | | 29,051,917 | |
Total Common Stocks (Cost $1,141,992,739) | | | | | | | 2,706,836,548 | |
| | | | | | | | |
| | | Shares | | | Value | |
Preferred Stocks—1.7% | |
| Bayerische Motoren Werke (BMW) AG, Preference | | | 535,851 | | | $ | 47,848,350 | |
| Zee Entertainment Enterprises Ltd., 6% Cum. Non-Cv. | | | 7,458,110 | | | | 1,168,479 | |
Total Preferred Stocks (Cost $15,686,427) | | | | | | | 49,016,829 | |
| | |
Investment Company—1.0% | |
| Oppenheimer Institutional Government Money Market Fund, Cl. E, 1.22%2,3 (Cost $27,124,866) | | | 27,124,866 | | | | 27,124,866 | |
| Total Investments, at Value (Cost $1,184,804,032) | | | 99.8% | | | | 2,782,978,243 | |
Net Other Assets (Liabilities) | | | 0.2 | | | | 5,645,522 | |
Net Assets | | | 100.0% | | | $ | 2,788,623,765 | |
| | | | | | | | |
Footnotes to Statement of Investments
1. Non-income producing security.
2. Rate shown is the 7-day yield at period end.
3. Is or was an affiliate, as defined in the Investment Company Act of 1940, as amended, at or during the reporting period, by virtue of the Fund owning at least 5% of the voting securities of the issuer or as a result of the Fund and the issuer having the same investment adviser. Transactions during the reporting period in which the issuer was an affiliate are as follows:
| | | | | | | | | | | | | | | | |
| | | Shares
December 31, 2016 | | | Gross Additions | | | Gross
Reductions | | | Shares
December 31, 2017 | |
| Oppenheimer Institutional Government Money Market Fund, Cl. E | | | 32,806,872 | | | | 367,918,279 | | | | 373,600,285 | | | | 27,124,866 | |
| | | | |
| | | Value | | | Income | | | Realized Gain (Loss) | | | Change in Unrealized
Gain (Loss) | |
| Oppenheimer Institutional Government Money Market Fund, Cl. E | | $ | 27,124,866 | | | $ | 196,266 | | | $ | — | | | $ | — | |
| | | | | | | | |
| Distribution of investments representing geographic holdings, as a percentage of total investments at value, is as follows: | | | | |
| Geographic Holdings (Unaudited) | | Value | | | Percent | |
United States | | $ | 1,283,333,472 | | | | 46.3 | % |
Japan | | | 397,385,200 | | | | 14.1 | |
France | | | 257,794,900 | | | | 9.3 | |
Germany | | | 254,777,066 | | | | 9.2 | |
United Kingdom | | | 184,714,226 | | | | 6.6 | |
India | | | 105,239,328 | | | | 3.8 | |
Switzerland | | | 87,987,775 | | | | 3.2 | |
China | | | 67,177,602 | | | | 2.4 | |
Spain | | | 64,603,159 | | | | 2.3 | |
Sweden | | | 33,257,530 | | | | 1.2 | |
Italy | | | 19,345,660 | | | | 0.7 | |
Denmark | | | 15,228,249 | | | | 0.5 | |
Ireland | | | 12,134,076 | | | | 0.4 | |
Total | | $ | 2,782,978,243 | | | | 100.0 | % |
| | | | | | | | |
See accompanying Notes to Financial Statements.
8 OPPENHEIMER GLOBAL FUND/VA
STATEMENT OF ASSETS AND LIABILITIES December 31, 2017
| | | | | | |
| | | |
Assets | | | | | | |
Investments, at value—see accompanying statement of investments: | | | | | | |
Unaffiliated companies (cost $1,157,679,166) | | | | $ | 2,755,853,377 | |
Affiliated companies (cost $27,124,866) | | | | | 27,124,866 | |
| | | | | | 2,782,978,243 | |
Cash | | | | | 1,999,989 | |
Receivables and other assets: | | | | | | |
Dividends | | | | | 4,270,986 | |
Investments sold | | | | | 1,584,658 | |
Shares of beneficial interest sold | | | | | 980,375 | |
Other | | | | | 160,331 | |
Total assets | | | | | 2,791,974,582 | |
| | | |
Liabilities | | | | | | |
Payables and other liabilities: | | | | | | |
Shares of beneficial interest redeemed | | | | | 2,607,826 | |
Distribution and service plan fees | | | | | 277,837 | |
Trustees’ compensation | | | | | 131,124 | |
Foreign capital gains tax | | | | | 70,735 | |
Shareholder communications | | | | | 61,856 | |
Investments purchased | | | | | 53,430 | |
Other | | | | | 148,009 | |
Total liabilities | | | | | 3,350,817 | |
Net Assets | | | | $ | 2,788,623,765 | |
| | | | | | |
| | | | | | | |
| | |
Composition of Net Assets | | | | | | |
Par value of shares of beneficial interest | | | | $ | 59,128 | |
Additional paid-in capital | | | | | 1,008,039,943 | |
Accumulated net investment income | | | | | 11,319,434 | |
Accumulated net realized gain on investments and foreign currency transactions | | | | | 171,191,061 | |
Net unrealized appreciation on investments and translation of assets and liabilities denominated in foreign currencies | | | | | 1,598,014,199 | |
Net Assets | | | | $ | 2,788,623,765 | |
| | | | | | |
| | | | | | | |
| | |
Net Asset Value Per Share | | | | | | |
Non-Service Shares: | | | | | | |
Net asset value, redemption price per share and offering price per share (based on net assets of $1,479,034,142 and 31,191,684 shares of beneficial interest outstanding) | | | | | $47.42 | |
Service Shares: | | | | | | |
| Net asset value, redemption price per share and offering price per share (based on net assets of $1,309,589,623 and 27,936,505 shares of beneficial interest outstanding) | | | | | $46.88 | |
See accompanying Notes to Financial Statements.
9 OPPENHEIMER GLOBAL FUND/VA
STATEMENT OF OPERATIONS For the Year Ended December 31, 2017
| | | | | | |
| | | |
Investment Income | | | | | | |
Dividends: | | | | | | |
Unaffiliated companies (net of foreign withholding taxes of $3,716,023) | | | | $ | 37,108,189 | |
Affiliated companies | | | | | 196,266 | |
Total investment income | | | | | 37,304,455 | |
| | | | | | | |
Expenses | | | | | | |
Management fees | | | | | 16,347,764 | |
Distribution and service plan fees - Service shares | | | | | 3,014,562 | |
Transfer and shareholder servicing agent fees: | | | | | | |
Non-Service shares | | | | | 1,378,678 | |
Service shares | | | | | 1,205,950 | |
Shareholder communications: | | | | | | |
Non-Service shares | | | | | 86,939 | |
Service shares | | | | | 75,984 | |
Borrowing fees | | | | | 68,470 | |
Custodian fees and expenses | | | | | 159,961 | |
Trustees’ compensation | | | | | 74,329 | |
Other | | | | | 232,725 | |
Total expenses | | | | | 22,645,362 | |
Less reduction to custodian expenses | | | | | (927 | ) |
Less waivers and reimbursements of expenses | | | | | (29,436 | ) |
Net expenses | | | | | 22,614,999 | |
| | | | | | | |
Net Investment Income | | | | | 14,689,456 | |
| | | | | | | |
Realized and Unrealized Gain (Loss) | | | | | | |
Net realized gain (loss) on: | | | | | | |
Investment transactions in unaffiliated companies | | | | | 221,757,305 | |
Foreign currency transactions | | | | | (198,987 | ) |
Net realized gain | | | | | 221,558,318 | |
Net change in unrealized appreciation/depreciation on: | | | | | | |
Investment transactions in unaffiliated companies (net of foreign capital gains tax of $56,701) | | | | | 558,303,576 | |
Translation of assets and liabilities denominated in foreign currencies | | | | | 627,498 | |
Net change in unrealized appreciation/depreciation | | | | | 558,931,074 | |
| | | | | | | |
Net Increase in Net Assets Resulting from Operations | | | | $ | 795,178,848 | |
| | | | | | |
See accompanying Notes to Financial Statements.
10 OPPENHEIMER GLOBAL FUND/VA
STATEMENTS OF CHANGES IN NET ASSETS
| | | | | | | | |
| | | Year Ended
December 31, 2017 | | | Year Ended
December 31, 2016 | |
Operations | | | | | | | | |
Net investment income | | $ | 14,689,456 | | | $ | 14,438,224 | |
Net realized gain | | | 221,558,318 | | | | 3,052,676 | |
Net change in unrealized appreciation/depreciation | | | 558,931,074 | | | | (27,858,399) | |
Net increase (decrease) in net assets resulting from operations | | | 795,178,848 | | | | (10,367,499) | |
| | | | | | | | | |
Dividends and/or Distributions to Shareholders | | | | | | | | |
Dividends from net investment income: | | | | | | | | |
Non-Service shares | | | (12,766,011) | | | | (13,598,845) | |
Service shares | | | (8,799,180) | | | | (7,587,430) | |
| | | (21,565,191) | | | | (21,186,275) | |
| | | | | | | | | |
Distributions from net realized gain: | | | | | | | | |
Non-Service shares | | | — | | | | (86,197,755) | |
Service shares | | | — | | | | (67,272,765) | |
| | | — | | | | (153,470,520) | |
| | | | | | | | | |
Beneficial Interest Transactions | | | | | | | | |
Net increase (decrease) in net assets resulting from beneficial interest transactions: | | | | | | | | |
Non-Service shares | | | (179,504,173) | | | | (55,451,479) | |
Service shares | | | (115,703,050) | | | | 62,981,601 | |
| | | (295,207,223) | | | | 7,530,122 | |
| | | | | | | | | |
Net Assets | | | | | | | | |
Total increase (decrease) | | | 478,406,434 | | | | (177,494,172) | |
Beginning of period | | | 2,310,217,331 | | | | 2,487,711,503 | |
| End of period (including accumulated net investment income of $11,319,434 and $17,542,546, respectively) | | $ | 2,788,623,765 | | | $ | 2,310,217,331 | |
| | | | | | | | |
See accompanying Notes to Financial Statements.
11 OPPENHEIMER GLOBAL FUND/VA
FINANCIAL HIGHLIGHTS
| | | | | | | | | | | | | | | | | | | | |
| Non-Service Shares | | Year Ended
December 31,
2017 | | | Year Ended
December 31,
2016 | | | Year Ended
December 31,
2015 | | | Year Ended
December 31,
2014 | | | Year Ended
December 31,
2013 | |
Per Share Operating Data | | | | | | | | | | | | | | | | | | | | |
Net asset value, beginning of period | | | $35.02 | | | | $38.00 | | | | $39.50 | | | | $40.86 | | | | $32.55 | |
Income (loss) from investment operations: | | | | | | | | | | | | | | | | | | | | |
Net investment income1 | | | 0.29 | | | | 0.26 | | | | 0.372 | | | | 0.522 | | | | 0.442 | |
Net realized and unrealized gain (loss) | | | 12.50 | | | | (0.42) | | | | 1.382 | | | | 0.442 | | | | 8.372 | |
Total from investment operations | | | 12.79 | | | | (0.16) | | | | 1.75 | | | | 0.96 | | | | 8.81 | |
Dividends and/or distributions to shareholders: | | | | | | | | | | | | | | | | | | | | |
Dividends from net investment income | | | (0.39) | | | | (0.38) | | | | (0.54) | | | | (0.46) | | | | (0.50) | |
Distributions from net realized gain | | | 0.00 | | | | (2.44) | | | | (2.71) | | | | (1.86) | | | | 0.00 | |
Total dividends and/or distributions to shareholders | | | (0.39) | | | | (2.82) | | | | (3.25) | | | | (2.32) | | | | (0.50) | |
Net asset value, end of period | | | $47.42 | | | | $35.02 | | | | $38.00 | | | | $39.50 | | | | $40.86 | |
| | | | | | | | | | | | | | | | | | | | |
| | | | | | | | | | | | | | | | | | | | | |
Total Return, at Net Asset Value3 | | | 36.66% | | | | 0.08% | | | | 3.94% | | | | 2.29% | | | | 27.31% | |
| | | | | | | | | | | | | | | | | | | | | |
Ratios/Supplemental Data | | | | | | | | | | | | | | | | | | | | |
Net assets, end of period (in thousands) | | | $1,479,034 | | | | $1,245,070 | | | | $1,406,001 | | | | $1,468,107 | | | | $1,397,026 | |
Average net assets (in thousands) | | | $1,379,895 | | | | $1,270,049 | | | | $1,502,338 | | | | $1,532,383 | | | | $1,333,848 | |
Ratios to average net assets:4 | | | | | | | | | | | | | | | | | | | | |
Net investment income | | | 0.69% | | | | 0.75% | | | | 0.92%2 | | | | 1.30%2 | | | | 1.20%2 | |
Expenses excluding specific expenses listed below | | | 0.76% | | | | 0.77% | | | | 0.76% | | | | 0.76% | | | | 0.77% | |
Interest and fees from borrowings | | | 0.00%5 | | | | 0.00%5 | | | | 0.00%5 | | | | 0.00% | | | | 0.00% | |
Total expenses6 | | | 0.76% | | | | 0.77% | | | | 0.76% | | | | 0.76% | | | | 0.77% | |
| Expenses after payments, waivers and/or reimbursements and reduction to custodian expenses | | | 0.76%7 | | | | 0.77%7 | | | | 0.76%7 | | | | 0.76%7 | | | | 0.77%7 | |
Portfolio turnover rate | | | 9% | | | | 14% | | | | 14% | | | | 13% | | | | 11% | |
1. Per share amounts calculated based on the average shares outstanding during the period.
2. Net investment income per share, net realized and unrealized gain (loss) per share and the net investment income ratio include an adjustment for a prior period reclassification for the years ended December 31, 2013, 2014 and 2015. Please see Note 10 of the accompanying Notes to Financial Statements.
3. Assumes an initial investment on the business day before the first day of the fiscal period, with all dividends and distributions reinvested in additional shares on the reinvestment date, and redemption at the net asset value calculated on the last business day of the fiscal period. Total returns are not annualized for periods less than one full year. Total return information does not reflect expenses that apply at the separate account level or to related insurance products. Inclusion of these charges would reduce the total return figures for all periods shown. Returns do not reflect the deduction of taxes that a shareholder would pay on fund distributions or the redemption of fund shares.
4. Annualized for periods less than one full year.
5. Less than 0.005%.
6. Total expenses including indirect expenses from affiliated fund fees and expenses were as follows:
| | | | |
Year Ended December 31, 2017 | | | 0.76 | % |
Year Ended December 31, 2016 | | | 0.77 | % |
Year Ended December 31, 2015 | | | 0.76 | % |
Year Ended December 31, 2014 | | | 0.76 | % |
Year Ended December 31, 2013 | | | 0.77 | % |
7. Waiver was less than 0.005%.
See accompanying Notes to Financial Statements.
12 OPPENHEIMER GLOBAL FUND/VA
| | | | | | | | | | | | | | | | | | | | |
| Service Shares | | Year Ended
December 31,
2017 | | | Year Ended
December 31,
2016 | | | Year Ended
December 31,
2015 | | | Year Ended
December 31,
2014 | | | Year Ended
December 31,
2013 | |
Per Share Operating Data | | | | | | | | | | | | | | | | | | | | |
Net asset value, beginning of period | | | $34.64 | | | | $37.59 | | | | $39.10 | | | | $40.47 | | | | $32.25 | |
Income (loss) from investment operations: | | | | | | | | | | | | | | | | | | | | |
Net investment income1 | | | 0.18 | | | | 0.17 | | | | 0.282 | | | | 0.422 | | | | 0.342 | |
Net realized and unrealized gain (loss) | | | 12.36 | | | | (0.41) | | | | 1.362 | | | | 0.422 | | | | 8.302 | |
Total from investment operations | | | 12.54 | | | | (0.24) | | | | 1.64 | | | | 0.84 | | | | 8.64 | |
Dividends and/or distributions to shareholders: | | | | | | | | | | | | | | | | | | | | |
Dividends from net investment income | | | (0.30) | | | | (0.27) | | | | (0.44) | | | | (0.35) | | | | (0.42) | |
Distributions from net realized gain | | | 0.00 | | | | (2.44) | | | | (2.71) | | | | (1.86) | | | | 0.00 | |
Total dividends and/or distributions to shareholders | | | (0.30) | | | | (2.71) | | | | (3.15) | | | | (2.21) | | | | (0.42) | |
Net asset value, end of period | | | $46.88 | | | | $34.64 | | | | $37.59 | | | | $39.10 | | | | $40.47 | |
| | | | | | | | | | | | | | | | | | | | |
| | | | | | | | | | | | | | | | | | | | | |
Total Return, at Net Asset Value3 | | | 36.32% | | | | (0.16)% | | | | 3.67% | | | | 2.06% | | | | 26.99% | |
| | | | | | | | | | | | | | | | | | | | | |
Ratios/Supplemental Data | | | | | | | | | | | | | | | | | | | | |
Net assets, end of period (in thousands) | | | $1,309,590 | | | | $1,065,147 | | | | $1,081,711 | | | | $1,204,379 | | | | $1,216,285 | |
Average net assets (in thousands) | | | $1,207,002 | | | | $1,016,772 | | | | $1,219,501 | | | | $1,265,528 | | | | $1,174,119 | |
Ratios to average net assets:4 | | | | | | | | | | | | | | | | | | | | |
Net investment income | | | 0.43% | | | | 0.49% | | | | 0.70%2 | | | | 1.05%2 | | | | 0.95%2 | |
Expenses excluding specific expenses listed below | | | 1.01% | | | | 1.02% | | | | 1.01% | | | | 1.01% | | | | 1.02% | |
Interest and fees from borrowings | | | 0.00%5 | | | | 0.00%5 | | | | 0.00%5 | | | | 0.00% | | | | 0.00% | |
Total expenses6 | | | 1.01% | | | | 1.02% | | | | 1.01% | | | | 1.01% | | | | 1.02% | |
| Expenses after payments, waivers and/or reimbursements and reduction to custodian expenses | | | 1.01%7 | | | | 1.02%7 | | | | 1.01%7 | | | | 1.01%7 | | | | 1.02%7 | |
Portfolio turnover rate | | | 9% | | | | 14% | | | | 14% | | | | 13% | | | | 11% | |
1. Per share amounts calculated based on the average shares outstanding during the period.
2. Net investment income per share, net realized and unrealized gain (loss) per share and the net investment income ratio include an adjustment for a prior period reclassification for the years ended December 31, 2013, 2014 and 2015. Please see Note 10 of the accompanying Notes to Financial Statements.
3. Assumes an initial investment on the business day before the first day of the fiscal period, with all dividends and distributions reinvested in additional shares on the reinvestment date, and redemption at the net asset value calculated on the last business day of the fiscal period. Total returns are not annualized for periods less than one full year. Total return information does not reflect expenses that apply at the separate account level or to related insurance products. Inclusion of these charges would reduce the total return figures for all periods shown. Returns do not reflect the deduction of taxes that a shareholder would pay on fund distributions or the redemption of fund shares.
4. Annualized for periods less than one full year.
5. Less than 0.005%.
6. Total expenses including indirect expenses from affiliated fund fees and expenses were as follows:
| | | | |
Year Ended December 31, 2017 | | | 1.01 | % |
Year Ended December 31, 2016 | | | 1.02 | % |
Year Ended December 31, 2015 | | | 1.01 | % |
Year Ended December 31, 2014 | | | 1.01 | % |
Year Ended December 31, 2013 | | | 1.03 | % |
7. Waiver was less than 0.005%.
See accompanying Notes to Financial Statements.
13 OPPENHEIMER GLOBAL FUND/VA
NOTES TO FINANCIAL STATEMENTS December 31, 2017
1. Organization
Oppenheimer Global Fund/VA (the “Fund”), a separate series of Oppenheimer Variable Account Funds, is a diversified open-end management investment company registered under the Investment Company Act of 1940 (“1940 Act”), as amended. The Fund’s main investment objective is to seek capital appreciation. The Fund’s investment adviser is OFI Global Asset Management, Inc. (“OFI Global” or the “Manager”), a wholly-owned subsidiary of OppenheimerFunds, Inc. (“OFI” or the “Sub-Adviser”). The Manager has entered into a sub-advisory agreement with OFI. Shares of the Fund are sold only to separate accounts of life insurance companies.
The Fund offers two classes of shares. Both classes are sold at their offering price, which is the net asset value per share, to separate investment accounts of participating insurance companies as an underlying investment for variable life insurance policies, variable annuity contracts or other investment products. The class of shares designated as Service shares is subject to a distribution and service plan. Both classes of shares have identical rights and voting privileges with respect to the Fund in general and exclusive voting rights on matters that affect that class alone. Earnings, net assets and net asset value per share may differ due to each class having its own expenses, such as transfer and shareholder servicing agent fees and shareholder communications, directly attributable to that class.
The following is a summary of significant accounting policies followed in the Fund’s preparation of financial statements in accordance with accounting principles generally accepted in the United States (“U.S. GAAP”).
2. Significant Accounting Policies
Security Valuation. All investments in securities are recorded at their estimated fair value, as described in Note 3.
Foreign Currency Translation. The books and records of the Fund are maintained in U.S. dollars. Any foreign currency amounts are translated into U.S. dollars on the following basis:
(1) Value of investment securities, other assets and liabilities — at the exchange rates prevailing at Market Close as described in Note 3.
(2) Purchases and sales of investment securities, income and expenses — at the rates of exchange prevailing on the respective dates of such transactions.
Although the net assets and the values are presented at the foreign exchange rates at Market Close, the Fund does not isolate the portion of the results of operations resulting from changes in foreign exchange rates on investments from the fluctuations arising from changes in prices of securities held. Such fluctuations are included with the net realized and unrealized gains or losses from investments shown in the Statement of Operations.
For securities, which are subject to foreign withholding tax upon disposition, realized gains or losses on such securities are recorded net of foreign withholding tax.
Reported net realized foreign exchange gains or losses arise from sales of foreign currencies, currency gains or losses realized between the trade and settlement dates on securities transactions, the difference between the amounts of dividends, interest, and foreign withholding tax reclaims recorded on the Fund’s books, and the U.S. dollar equivalent of the amounts actually received or paid. Net unrealized foreign exchange gains and losses arise from changes in the value of assets and liabilities other than investments in securities, resulting from changes in the exchange rate.
Allocation of Income, Expenses, Gains and Losses. Income, expenses (other than those attributable to a specific class), gains and losses are allocated on a daily basis to each class of shares based upon the relative proportion of net assets represented by such class. Operating expenses directly attributable to a specific class are charged against the operations of that class.
Dividends and Distributions to Shareholders. Dividends and distributions to shareholders, which are determined in accordance with income tax regulations and may differ from U.S. GAAP, are recorded on the ex-dividend date. Income and capital gain distributions, if any, are declared and paid annually or at other times as determined necessary by the Manager.
Investment Income. Dividend income is recorded on the ex-dividend date or upon ex-dividend notification in the case of certain foreign dividends where the ex-dividend date may have passed. Non-cash dividends included in dividend income, if any, are recorded at the fair value of the securities received. Withholding taxes on foreign dividends, if any, and capital gains taxes on foreign investments, if any, have been provided for in accordance with the Fund’s understanding of the applicable tax rules and regulations. Interest income, if any, is recognized on an accrual basis. Discount and premium, which are included in interest income on the Statement of Operations, are amortized or accreted daily.
Custodian Fees. “Custodian fees and expenses” in the Statement of Operations may include interest expense incurred by the Fund on any cash overdrafts of its custodian account during the period. Such cash overdrafts may result from the effects of failed trades in portfolio securities and from cash outflows resulting from unanticipated shareholder redemption activity. The Fund pays interest to its custodian on such cash overdrafts, to the extent they are not offset by positive cash balances maintained by the Fund, at a rate equal to the Federal Funds Rate plus 2.00%. The “Reduction to custodian expenses” line item, if applicable, represents earnings on cash balances maintained by the Fund during the period. Such interest expense and other custodian fees may be paid with these earnings.
Security Transactions. Security transactions are recorded on the trade date. Realized gains and losses on securities sold are determined on the basis of identified cost.
Indemnifications. The Fund’s organizational documents provide current and former Trustees and officers with a limited indemnification against
14 OPPENHEIMER GLOBAL FUND/VA
2. Significant Accounting Policies (Continued)
liabilities arising in connection with the performance of their duties to the Fund. In the normal course of business, the Fund may also enter into contracts that provide general indemnifications. The Fund’s maximum exposure under these arrangements is unknown as this would be dependent on future claims that may be made against the Fund. The risk of material loss from such claims is considered remote.
Federal Taxes. The Fund intends to comply with provisions of the Internal Revenue Code applicable to regulated investment companies and to distribute substantially all of its investment company taxable income, including any net realized gain on investments not offset by capital loss carryforwards, if any, to shareholders. Therefore, no federal income or excise tax provision is required. The Fund files income tax returns in U.S. federal and applicable state jurisdictions. The statute of limitations on the Fund’s tax return filings generally remains open for the three preceding fiscal reporting period ends. The Fund has analyzed its tax positions for the fiscal year ended December 31, 2017, including open tax years, and does not believe there are any uncertain tax positions requiring recognition in the Fund’s financial statements.
The tax components of capital shown in the following table represent distribution requirements the Fund must satisfy under the income tax regulations, losses the Fund may be able to offset against income and gains realized in future years and unrealized appreciation or depreciation of securities and other investments for federal income tax purposes.
| | | | | | | | | | | | |
Undistributed Net Investment Income | | Undistributed
Long-Term
Gain | | | Accumulated
Loss
Carryforward1,2 | | | Net Unrealized
Appreciation
Based on cost of
Securities and
Other Investments
for Federal Income
Tax Purposes | |
$23,167,433 | | | $185,000,660 | | | | $— | | | | $1,572,487,571 | |
1. During the reporting period, the Fund utilized $17,365,953 of capital loss carryforward to offset capital gains realized in that fiscal year.
2. During the previous reporting period, the Fund did not utilize any capital loss carryforward.
Net investment income (loss) and net realized gain (loss) may differ for financial statement and tax purposes. The character of dividends and distributions made during the fiscal year from net investment income or net realized gains are determined in accordance with federal income tax requirements, which may differ from the character of net investment income or net realized gains presented in those financial statements in accordance with U.S. GAAP. Also, due to timing of dividends and distributions, the fiscal year in which amounts are distributed may differ from the fiscal year in which the income or net realized gain was recorded by the Fund.
Accordingly, the following amounts have been reclassified for the reporting period. Net assets of the Fund were unaffected by the reclassifications.
| | | | | | | | |
Increase to Paid-in Capital | | Increase
to Accumulated
Net Investment
Income | | | Reduction
to Accumulated Net
Realized Gain on Investments3 | |
$17,508,374 | | | $652,623 | | | | $18,160,997 | |
3. $17,508,374, all of which was long-term capital gain, was distributed in connection with Fund share redemptions.
The tax character of distributions paid during the reporting periods:
| | | | | | | | |
| | | Year Ended
December 31, 2017 | | | Year Ended
December 31, 2016 | |
Distributions paid from: | | | | | | | | |
Ordinary income | | $ | 21,565,191 | | | $ | 25,033,705 | |
Long-term capital gain | | | — | | | | 149,623,090 | |
Total | | $ | 21,565,191 | | | $ | 174,656,795 | |
| | | | | | | | |
The aggregate cost of securities and other investments and the composition of unrealized appreciation and depreciation of securities and other investments for federal income tax purposes at period end are noted in the following table. The primary difference between book and tax appreciation or depreciation of securities and other investments, if applicable, is attributable to the tax deferral of losses or tax realization of financial statement unrealized gain or loss.
| | | | |
Federal tax cost of securities | | $ | 1,210,330,660 | |
| | | | |
Gross unrealized appreciation | | $ | 1,629,130,606 | |
Gross unrealized depreciation | | | (56,643,035 | ) |
Net unrealized appreciation | | $ | 1,572,487,571 | |
| | | | |
Certain foreign countries impose a tax on capital gains which is accrued by the Fund based on unrealized appreciation, if any, on affected securities. The tax is paid when the gain is realized.
Use of Estimates. The preparation of financial statements in conformity with U.S. GAAP requires management to make estimates and assumptions
15 OPPENHEIMER GLOBAL FUND/VA
NOTES TO FINANCIAL STATEMENTS Continued
2. Significant Accounting Policies (Continued)
that affect the reported amounts of assets and liabilities and disclosure of contingent assets and liabilities at the date of the financial statements and the reported amounts of increases and decreases in net assets from operations during the reporting period. Actual results could differ from those estimates.
3. Securities Valuation
The Fund calculates the net asset value of its shares as of 4:00 P.M. Eastern time, on each day the New York Stock Exchange (the “Exchange”) is open for trading, except in the case of a scheduled early closing of the Exchange, in which case the Fund will calculate net asset value of the shares as of the scheduled early closing time of the Exchange.
The Fund’s Board has adopted procedures for the valuation of the Fund’s securities and has delegated the day-to-day responsibility for valuation determinations under those procedures to the Manager. The Manager has established a Valuation Committee which is responsible for determining a fair valuation for any security for which market quotations are not readily available. The Valuation Committee’s fair valuation determinations are subject to review, approval and ratification by the Fund’s Board at least quarterly or more frequently, if necessary.
Valuation Methods and Inputs
Securities are valued primarily using unadjusted quoted market prices, when available, as supplied by third party pricing services or broker-dealers.
The following methodologies are used to determine the market value or the fair value of the types of securities described below:
Equity securities traded on a securities exchange (including exchange-traded derivatives other than futures and futures options) are valued based on the official closing price on the principal exchange on which the security is traded, as identified by the Manager, prior to the time when the Fund’s assets are valued. If the official closing price is unavailable, the security is valued at the last sale price on the principal exchange on which it is traded, or if no sales occurred, the security is valued at the mean between the quoted bid and asked prices. Over-the-counter equity securities are valued at the last published sale price, or if no sales occurred, at the mean between the quoted bid and asked prices. Events occurring after the close of trading on foreign exchanges may result in adjustments to the valuation of foreign securities to more accurately reflect their fair value as of the time when the Fund’s assets are valued.
Shares of a registered investment company that are not traded on an exchange are valued at that investment company’s net asset value per share.
Securities for which market quotations are not readily available, or when a significant event has occurred that would materially affect the value of the security, are fair valued either (i) by a standardized fair valuation methodology applicable to the security type or the significant event as previously approved by the Valuation Committee and the Fund’s Board or (ii) as determined in good faith by the Manager’s Valuation Committee. The Valuation Committee considers all relevant facts that are reasonably available, through either public information or information available to the Manager, when determining the fair value of a security. Those standardized fair valuation methodologies include, but are not limited to, valuing securities at the last sale price or initially at cost and subsequently adjusting the value based on: changes in company specific fundamentals, changes in an appropriate securities index, or changes in the value of similar securities which may be further adjusted for any discounts related to security-specific resale restrictions. When possible, such methodologies use observable market inputs such as unadjusted quoted prices of similar securities, observable interest rates, currency rates and yield curves. The methodologies used for valuing securities are not necessarily an indication of the risks associated with investing in those securities nor can it be assured that the Fund can obtain the fair value assigned to a security if it were to sell the security.
Classifications
Each investment asset or liability of the Fund is assigned a level at measurement date based on the significance and source of the inputs to its valuation. Various data inputs may be used in determining the value of each of the Fund’s investments as of the reporting period end. These data inputs are categorized in the following hierarchy under applicable financial accounting standards:
1) Level 1-unadjusted quoted prices in active markets for identical assets or liabilities (including securities actively traded on a securities exchange)
2) Level 2-inputs other than unadjusted quoted prices that are observable for the asset or liability (such as unadjusted quoted prices for similar assets and market corroborated inputs such as interest rates, prepayment speeds, credit risks, etc.)
3) Level 3-significant unobservable inputs (including the Manager’s own judgments about assumptions that market participants would use in pricing the asset or liability).
The inputs used for valuing securities are not necessarily an indication of the risks associated with investing in those securities.
The Fund classifies each of its investments in investment companies which are publicly offered as Level 1. Investment companies that are not publicly offered, if any, are classified as Level 2 in the fair value hierarchy.
The table below categorizes amounts that are included in the Fund’s Statement of Assets and Liabilities at period end based on valuation input level:
| | | | | | | | | | | | | | | | |
| | | Level 1— Unadjusted
Quoted Prices | | | Level 2—
Other Significant
Observable Inputs | | | Level 3—
Significant
Unobservable
Inputs | | | Value | |
| |
Assets Table | | | | | | | | | | | | | | | | |
Investments, at Value: | | | | | | | | | | | | | | | | |
Common Stocks | | | | | | | | | | | | | | | | |
Consumer Discretionary | | $ | 157,781,232 | | | $ | 247,181,903 | | | $ | — | | | $ | 404,963,135 | |
Consumer Staples | | | 60,488,265 | | | | 51,179,316 | | | | — | | | | 111,667,581 | |
16 OPPENHEIMER GLOBAL FUND/VA
3. Securities Valuation (Continued)
| | | | | | | | | | | | | | | | |
| | | Level 1— Unadjusted Quoted Prices | | | Level 2— Other Significant Observable Inputs | | | Level 3—
Significant
Unobservable
Inputs | | | Value | |
| |
Common Stocks (Continued) | | | | | | | | | | | | | | | | |
Energy | | $ | — | | | $ | 25,524,678 | | | $ | — | | | $ | 25,524,678 | |
Financials | | | 224,169,085 | | | | 333,053,770 | | | | — | | | | 557,222,855 | |
Health Care | | | 383,523,439 | | | | 65,192,902 | | | | — | | | | 448,716,341 | |
Industrials | | | 86,945,997 | | | | 302,830,613 | | | | — | | | | 389,776,610 | |
Information Technology | | | 456,603,326 | | | | 283,310,105 | | | | — | | | | 739,913,431 | |
Materials | | | — | | | | 29,051,917 | | | | — | | | | 29,051,917 | |
Preferred Stocks | | | 1,168,479 | | | | 47,848,350 | | | | — | | | | 49,016,829 | |
Investment Company | | | 27,124,866 | | | | — | | | | — | | | | 27,124,866 | |
| | | | |
Total Assets | | $ | 1,397,804,689 | | | $ | 1,385,173,554 | | | $ | — | | | $ | 2,782,978,243 | |
| | | | |
Forward currency exchange contracts and futures contracts, if any, are reported at their unrealized appreciation/depreciation at measurement date, which represents the change in the contract’s value from trade date. All additional assets and liabilities included in the above table are reported at their market value at measurement date.
4. Investments and Risks
Risks of Foreign Investing. The Fund may invest in foreign securities which are subject to special risks. Securities traded in foreign markets may be less liquid and more volatile than those traded in U.S. markets. Foreign issuers are usually not subject to the same accounting and disclosure requirements that U.S. companies are subject to, which may make it difficult for the Fund to evaluate a foreign company’s operations or financial condition. A change in the value of a foreign currency against the U.S. dollar will result in a change in the U.S. dollar value of investments denominated in that foreign currency and in the value of any income or distributions the Fund may receive on those investments. The value of foreign investments may be affected by exchange control regulations, foreign taxes, higher transaction and other costs, delays in the settlement of transactions, changes in economic or monetary policy in the United States or abroad, expropriation or nationalization of a company’s assets, or other political and economic factors. In addition, due to the inter-relationship of global economies and financial markets, changes in political and economic factors in one country or region could adversely affect conditions in another country or region. Investments in foreign securities may also expose the Fund to time-zone arbitrage risk. Foreign securities may trade on weekends or other days when the Fund does not price its shares. At times, the Fund may emphasize investments in a particular country or region and may be subject to greater risks from adverse events that occur in that country or region. Foreign securities and foreign currencies held in foreign banks and securities depositories may be subject to limited or no regulatory oversight.
Investments in Affiliated Funds. The Fund is permitted to invest in other mutual funds advised by the Manager (“Affiliated Funds”). Affiliated Funds are open-end management investment companies registered under the 1940 Act, as amended. The Manager is the investment adviser of, and the Sub-Adviser provides investment and related advisory services to, the Affiliated Funds. When applicable, the Fund’s investments in Affiliated Funds are included in the Statement of Investments. Shares of Affiliated Funds are valued at their net asset value per share. As a shareholder, the Fund is subject to its proportional share of the Affiliated Funds’ expenses, including their management fee. The Manager will waive fees and/or reimburse Fund expenses in an amount equal to the indirect management fees incurred through the Fund’s investment in the Affiliated Funds.
Each of the Affiliated Funds in which the Fund invests has its own investment risks, and those risks can affect the value of the Fund’s investments and therefore the value of the Fund’s shares. To the extent that the Fund invests more of its assets in one Affiliated Fund than in another, the Fund will have greater exposure to the risks of that Affiliated Fund.
Investments in Money Market Instruments. The Fund is permitted to invest its free cash balances in money market instruments to provide liquidity or for defensive purposes. The Fund may invest in money market instruments by investing in Class E shares of Oppenheimer Institutional Government Money Market Fund (“IGMMF”), which is an Affiliated Fund. IGMMF is regulated as a money market fund under the 1940 Act, as amended. The Fund may also invest in money market instruments directly or in other affiliated or unaffiliated money market funds.
Equity Security Risk. Stocks and other equity securities fluctuate in price. The value of the Fund’s portfolio may be affected by changes in the equity markets generally. Equity markets may experience significant short-term volatility and may fall sharply at times. Different markets may behave differently from each other and U.S. equity markets may move in the opposite direction from one or more foreign stock markets. Adverse events in any part of the equity or fixed-income markets may have unexpected negative effects on other market segments.
The prices of individual equity securities generally do not all move in the same direction at the same time and a variety of factors can affect the price of a particular company’s securities. These factors may include, but are not limited to, poor earnings reports, a loss of customers, litigation against the company, general unfavorable performance of the company’s sector or industry, or changes in government regulations affecting the company or its industry.
Shareholder Concentration. At period end, one shareholder owned 20% or more of the Fund’s total outstanding shares.
A shareholder is a related party of the Fund. Related parties may include, but are not limited to, the investment manager and its affiliates, affiliated broker dealers, fund of funds, and directors or employees. Related parties owned 28% of the Fund’s total outstanding shares at period end.
17 OPPENHEIMER GLOBAL FUND/VA
NOTES TO FINANCIAL STATEMENTS Continued
5. Market Risk Factors
The Fund’s investments in securities and/or financial derivatives may expose the Fund to various market risk factors:
Commodity Risk. Commodity risk relates to the change in value of commodities or commodity indexes as they relate to increases or decreases in the commodities market. Commodities are physical assets that have tangible properties. Examples of these types of assets are crude oil, heating oil, metals, livestock, and agricultural products.
Credit Risk. Credit risk relates to the ability of the issuer of debt to meet interest and principal payments, or both, as they come due. In general, lower-grade, higher-yield debt securities are subject to credit risk to a greater extent than lower-yield, higher-quality securities.
Equity Risk. Equity risk relates to the change in value of equity securities as they relate to increases or decreases in the general market.
Foreign Exchange Rate Risk. Foreign exchange rate risk relates to the change in the U.S. dollar value of a security held that is denominated in a foreign currency. The U.S. dollar value of a foreign currency denominated security will decrease as the dollar appreciates against the currency, while the U.S. dollar value will increase as the dollar depreciates against the currency.
Interest Rate Risk. Interest rate risk refers to the fluctuations in value of fixed-income securities resulting from the inverse relationship between price and yield. For example, an increase in general interest rates will tend to reduce the market value of already issued fixed-income investments, and a decline in general interest rates will tend to increase their value. In addition, debt securities with longer maturities, which tend to have higher yields, are subject to potentially greater fluctuations in value from changes in interest rates than obligations with shorter maturities.
Volatility Risk. Volatility risk refers to the magnitude of the movement, but not the direction of the movement, in a financial instrument’s price over a defined time period. Large increases or decreases in a financial instrument’s price over a relative time period typically indicate greater volatility risk, while small increases or decreases in its price typically indicate lower volatility risk.
6. Shares of Beneficial Interest
The Fund has authorized an unlimited number of $0.001 par value shares of beneficial interest of each class. Transactions in shares of beneficial interest were as follows:
| | | | | | | | | | | | | | | | |
| | | Year Ended December 31, 2017 | | | Year Ended December 31, 2016 | |
| | | Shares | | | Amount | | | Shares | | | Amount | |
Non-Service Shares | | | | | | | | | | | | | | | | |
Sold | | | 1,449,891 | | | $ | 60,471,325 | | | | 2,580,191 | | | $ | 89,371,624 | |
Dividends and/or distributions reinvested | | | 305,626 | | | | 12,766,011 | | | | 3,043,507 | | | | 99,796,600 | |
Redeemed | | | (6,113,341 | ) | | | (252,741,509 | ) | | | (7,075,696 | ) | | | (244,619,703 | ) |
Net decrease | | | (4,357,824 | ) | | $ | (179,504,173 | ) | | | (1,451,998 | ) | | $ | (55,451,479 | ) |
| | | | | | | | | | | | | | | | |
| | | | | | | | | | | | | | | | | |
Service Shares | | | | | | | | | | | | | | | | |
Sold | | | 2,582,124 | | | $ | 107,475,911 | | | | 5,078,438 | | | $ | 172,658,993 | |
Dividends and/or distributions reinvested | | | 212,797 | | | | 8,799,180 | | | | 2,305,519 | | | | 74,860,195 | |
Redeemed | | | (5,605,593 | ) | | | (231,978,141 | ) | | | (5,412,550 | ) | | | (184,537,587 | ) |
Net increase (decrease) | | | (2,810,672 | ) | | $ | (115,703,050 | ) | | | 1,971,407 | | | $ | 62,981,601 | |
| | | | | | | | | | | | | | | | |
7. Purchases and Sales of Securities
The aggregate cost of purchases and proceeds from sales of securities, other than short-term obligations and investments in IGMMF, for the reporting period were as follows:
| | | | | | | | |
| | | Purchases | | | Sales | |
| |
Investment securities | | | $218,896,774 | | | | $512,932,205 | |
8. Fees and Other Transactions with Affiliates
Management Fees. Under the investment advisory agreement, the Fund pays the Manager a management fee based on the daily net assets of the Fund at an annual rate as shown in the following table:
| | | | |
| Fee Schedule | | | |
Up to $200 million | | | 0.75 | % |
Next $200 million | | | 0.72 | |
Next $200 million | | | 0.69 | |
Next $200 million | | | 0.66 | |
Next $4.2 billion | | | 0.60 | |
Over $5 billion | | | 0.58 | |
The Fund’s effective management fee for the reporting period was 0.63% of average annual net assets before any applicable waivers.
Sub-Adviser Fees. The Manager has retained the Sub-Adviser to provide the day-to-day portfolio management of the Fund. Under the Sub-Advisory Agreement, the Manager pays the Sub-Adviser an annual fee in monthly installments, equal to a percentage of the investment management fee collected by the Manager from the Fund, which shall be calculated after any investment management fee waivers. The fee paid to the Sub-Adviser is paid by the Manager, not by the Fund.
18 OPPENHEIMER GLOBAL FUND/VA
8. Fees and Other Transactions with Affiliates (Continued)
Transfer Agent Fees. OFI Global (the “Transfer Agent”) serves as the transfer and shareholder servicing agent for the Fund. The Fund pays the Transfer Agent a fee based on annual net assets. Fees incurred and average net assets for each class with respect to these services are detailed in the Statement of Operations and Financial Highlights, respectively.
Sub-Transfer Agent Fees. The Transfer Agent has retained Shareholder Services, Inc., a wholly-owned subsidiary of OFI (the “Sub-Transfer Agent”), to provide the day-to-day transfer agent and shareholder servicing of the Fund. Under the Sub-Transfer Agency Agreement, the Transfer Agent pays the Sub-Transfer Agent an annual fee in monthly installments, equal to a percentage of the transfer agent fee collected by the Transfer Agent from the Fund, which shall be calculated after any applicable fee waivers. The fee paid to the Sub-Transfer Agent is paid by the Transfer Agent, not by the Fund.
Trustees’ Compensation. The Fund’s Board of Trustees (“Board”) has adopted a compensation deferral plan for Independent Trustees that enables Trustees to elect to defer receipt of all or a portion of the annual compensation they are entitled to receive from the Fund. For purposes of determining the amount owed to the Trustees under the plan, deferred amounts are treated as though equal dollar amounts had been invested in shares of the Fund or in other Oppenheimer funds selected by the Trustees. The Fund purchases shares of the funds selected for deferral by the Trustees in amounts equal to his or her deemed investment, resulting in a Fund asset equal to the deferred compensation liability. Such assets are included as a component of “Other” within the asset section of the Statement of Assets and Liabilities. Deferral of Trustees’ fees under the plan will not affect the net assets of the Fund and will not materially affect the Fund’s assets, liabilities or net investment income per share. Amounts will be deferred until distributed in accordance with the compensation deferral plan.
Distribution and Service Plan for Service Shares. The Fund has adopted a Distribution and Service Plan (the “Plan”) pursuant to Rule 12b-1 under the 1940 Act for Service shares to pay OppenheimerFunds Distributor, Inc. (the “Distributor”), for distribution related services, personal service and account maintenance for the Fund’s Service shares. Under the Plan, payments are made periodically at an annual rate of 0.25% of the daily net assets of Service shares of the Fund. The Distributor currently uses all of those fees to compensate sponsors of the insurance product that offers Fund shares, for providing personal service and maintenance of accounts of their variable contract owners that hold Service shares. These fees are paid out of the Fund’s assets on an on-going basis and increase operating expenses of the Service shares, which results in lower performance compared to the Fund’s shares that are not subject to a service fee. Fees incurred by the Fund under the Plan are detailed in the Statement of Operations.
Waivers and Reimbursements of Expenses. Prior to May 1, 2017, the Fund was subject to an expense limitation wherein the Fund’s expenses after payments, waivers and/or reimbursements and reduction to custodian expenses, excluding expenses incurred directly or indirectly by the Fund as a result of investments in other investment companies, wholly-owned subsidiaries and pooled investment vehicles; as percentages of daily net assets, would not exceed the annual rate of 1.00% for Non-Service shares and 1.25% for Service shares. The expense limitations do not include interest and fees from borrowing, and other expenses not incurred in the ordinary course of the Fund’s business. Effective May 1, 2017, this expense limitation has been removed.
The Manager will waive fees and/or reimburse Fund expenses in an amount equal to the indirect management fees incurred through the Fund’s investment in IGMMF. During the reporting period, the Manager waived fees and/or reimbursed the Fund $29,436 for IGMMF management fees. This fee waiver and/or expense reimbursement may not be amended or withdrawn for one year from the date of the Fund’s prospectus, unless approved by the Board.
9. Borrowings and Other Financing
Joint Credit Facility. A number of mutual funds managed by the Manager participate in a $1.875 billion revolving credit facility (the “Facility”) intended to provide short-term financing, if necessary, subject to certain restrictions in connection with atypical redemption activity. Expenses and fees related to the Facility are paid by the participating funds and are disclosed separately or as other expenses on the Statement of Operations. The Fund did not utilize the Facility during the reporting period.
10. Prior Period Reclassification
An adjustment to reflect a prior period reclassification between net investment income and net change in unrealized appreciation (depreciation) on investments and/or net realized gain (loss) on investments during the years ending December 31, 2013, 2014 and 2015 has been made to properly reflect income distributions received by the Fund from two of its investments.
The following adjustments are reflected in the respective fiscal years per the Statements of Changes in Net Assets and the Financial Highlights:
| | | | | | | | | | | | |
| | | 2013 | | | 2014 | | | 2015 | |
| |
Net investment income (loss) | | | $ 1,678,655 | | | | $ 1,668,338 | | | | $ 1,749,447 | |
Net realized gain (loss) | | | (163,217 | ) | | | (275,757 | ) | | | (222,558 | ) |
| Net change in unrealized appreciation/ depreciation | | | (1,515,438 | ) | | | (1,392,581 | ) | | | (1,526,889 | ) |
The cumulative impact of these adjustments are also reflected in the respective component of net assets on the Statement of Assets and liabilities and had no impact on total net assets or net asset values per share of the Fund.
19 OPPENHEIMER GLOBAL FUND/VA
REPORT OF INDEPENDENT REGISTERED PUBLIC ACCOUNTING FIRM
To the Shareholders and Board of Trustees
Oppenheimer Variable Account Funds:
Opinion on the Financial Statements
We have audited the accompanying statement of assets and liabilities of Oppenheimer Global Fund/VA, a separate series of Oppenheimer Variable Account Funds, (the “Fund”), including the statement of investments, as of December 31, 2017, the related statement of operations for the year then ended, the statements of changes in net assets for each of the years in the two year period then ended, and the related notes (collectively, the “financial statements”) and the financial highlights for each of the years in the five year period then ended. In our opinion, the financial statements and financial highlights present fairly, in all material respects, the financial position of the Fund as of December 31, 2017, the results of its operations for the year then ended, the changes in its net assets for each of the years in the two year period then ended, and the financial highlights for each of the years in the five year period then ended, in conformity with U.S. generally accepted accounting principles.
Basis for Opinion
These financial statements and financial highlights are the responsibility of the Fund’s management. Our responsibility is to express an opinion on these financial statements and financial highlights based on our audits. We are a public accounting firm registered with the Public Company Accounting Oversight Board (United States) (“PCAOB”) and are required to be independent with respect to the Fund in accordance with the U.S. federal securities laws and the applicable rules and regulations of the Securities and Exchange Commission and the PCAOB.
We conducted our audits in accordance with the standards of the PCAOB. Those standards require that we plan and perform the audit to obtain reasonable assurance about whether the financial statements and financial highlights are free of material misstatement, whether due to error or fraud. Our audits included performing procedures to assess the risks of material misstatement of the financial statements and financial highlights, whether due to error or fraud, and performing procedures that respond to those risks. Such procedures included examining, on a test basis, evidence regarding the amounts and disclosures in the financial statements and financial highlights. Such procedures also included confirmation of securities owned as of December 31, 2017, by correspondence with the custodian, brokers and the transfer agent, or by other appropriate auditing procedures. Our audits also included evaluating the accounting principles used and significant estimates made by management, as well as evaluating the overall presentation of the financial statements and financial highlights. We believe that our audits provide a reasonable basis for our opinion.
KPMG LLP
We have not been able to determine the specific year that we began serving as the auditor of one or more Oppenheimer Funds investment companies, however we are aware that we have served as the auditor of one or more Oppenheimer Funds investment companies since at least 1969.
Denver, Colorado
February 13, 2018
20 OPPENHEIMER GLOBAL FUND/VA
FEDERAL INCOME TAX INFORMATION Unaudited
In early 2018, if applicable, shareholders of record received information regarding all dividends and distributions paid to them by the Fund during calendar year 2017.
Dividends, if any, paid by the Fund during the reporting period which are not designated as capital gain distributions should be multiplied by the maximum amount allowable but not less than 46.20% to arrive at the amount eligible for the corporate dividend-received deduction.
The Fund has elected the application of Section 853 of the Internal Revenue Code to permit shareholders to take a federal income tax credit or deduction, at their option, on a per share basis. The maximum amount allowable but not less than $3,658,795 of foreign income taxes were paid by the Fund during the reporting period. A separate notice will be mailed to each shareholder, which will reflect the proportionate share of such foreign taxes which must be treated by shareholders as gross income for federal income tax purposes.
Gross income of the maximum amount allowable but not less than $15,382,579 was derived from sources within foreign countries or possessions of the United States.
The foregoing information is presented to assist shareholders in reporting distributions received from the Fund to the Internal Revenue Service. Because of the complexity of the federal regulations which may affect your individual tax return and the many variations in state and local tax regulations, we recommend that you consult your tax advisor for specific guidance.
21 OPPENHEIMER GLOBAL FUND/VA
BOARD APPROVAL OF THE FUND’S INVESTMENT ADVISORY AND SUB-ADVISORY AGREEMENTS Unaudited
The Fund has entered into an investment advisory agreement with OFI Global Asset Management, Inc. (“OFI Global” or the “Adviser”), a wholly-owned subsidiary of OppenheimerFunds, Inc. (“OFI” or the “Sub-Adviser”) (“OFI Global” and “OFI” together, the “Managers”) and OFI Global has entered into a sub-advisory agreement with OFI whereby OFI provides investment sub-advisory services to the Fund (collectively, the “Agreements”). Each year, the Board of Trustees (the “Board”), including a majority of the independent Trustees, is required to determine whether to approve the terms of the Agreements and the renewal thereof. The Investment Company Act of 1940, as amended, requires that the Board request and evaluate, and that the Managers provide, such information as may be reasonably necessary to evaluate the terms of the Agreements. The Board employs an independent consultant to prepare a report that provides information, including comparative information that the Board requests for that purpose. In addition to in-person meetings focused on this evaluation, the Board receives information throughout the year regarding Fund services, fees, expenses and performance.
The Managers and the independent consultant provided information to the Board on the following factors: (i) the nature, quality and extent of the Managers’ services, (ii) the comparative investment performance of the Fund and the Managers, (iii) the fees and expenses of the Fund, including comparative fee and expense information, (iv) the profitability of the Managers and their affiliates, including an analysis of the cost of providing services, (v) whether economies of scale are realized as the Fund grows and whether fee levels reflect these economies of scale for Fund investors and (vi) other benefits to the Managers from their relationship with the Fund. The Board was aware that there are alternatives to retaining the Managers.
Outlined below is a summary of the principal information considered by the Board as well as the Board’s conclusions.
Nature, Quality and Extent of Services. The Board considered information about the nature, quality and extent of the services provided to the Fund and information regarding the Managers’ key personnel who provide such services. The Managers’ duties include providing the Fund with the services of the portfolio managers and the Sub-Adviser’s investment team, who provide research, analysis and other advisory services in regard to the Fund’s investments; and securities trading services. OFI Global is responsible for oversight of third-party service providers; monitoring compliance with applicable Fund policies and procedures and adherence to the Fund’s investment restrictions; risk management; and oversight of the Sub-Adviser. OFI Global is also responsible for providing certain administrative services to the Fund. Those services include providing and supervising all administrative and clerical personnel who are necessary in order to provide effective corporate administration for the Fund; compiling and maintaining records with respect to the Fund’s operations; preparing and filing reports required by the U.S. Securities and Exchange Commission; preparing periodic reports regarding the operations of the Fund for its shareholders; preparing proxy materials for shareholder meetings; and preparing the registration statements required by federal and state securities laws for the sale of the Fund’s shares. OFI Global also provides the Fund with office space, facilities and equipment.
The Board also considered the quality of the services provided and the quality of the Managers’ resources that are available to the Fund. The Board took account of the fact that the Sub-Adviser has over fifty years of experience as an investment adviser and that its assets under management rank it among the top mutual fund managers in the United States. The Board evaluated the Managers’ advisory, administrative, accounting, legal, compliance and risk management services, among other services, and information the Board has received regarding the experience and professional qualifications of the Managers’ key personnel and the size and functions of their staff. In its evaluation of the quality of the portfolio management services provided, the Board considered the experience of Rajeev Bhaman and John Delano, the portfolio managers for the Fund, and the Sub-Adviser’s investment team and analysts. The Board members also considered the totality of their experiences with the Managers as directors or trustees of the Fund and other funds advised by the Managers. The Board considered information regarding the quality of services provided by affiliates of the Managers, which the Board members have become knowledgeable about through their experiences with the Managers and in connection with the review or renewal of the Fund’s service agreements or service providers. The Board concluded, in light of the Managers’ experience, reputation, personnel, operations and resources that the Fund benefits from the services provided under the Agreements.
Investment Performance of the Managers and the Fund. Throughout the year, the Managers provided information on the investment performance of the Fund, the Adviser and the Sub-Adviser, including comparative performance information. The Board also reviewed information, prepared by the Managers and by the independent consultant, comparing the Fund’s historical performance to relevant market indices and to the performance of other world stock category funds underlying variable insurance products. The Board considered that the Fund outperformed its category median during the five- and ten-year periods, while it underperformed its category median during the one- and three-year periods. The Board further noted that the Fund’s recent underperformance occurred in 2016. In that regard, the Board observed that when it considered the Fund’s performance record one year prior, the Fund outperformed its category median for all periods.
Fees and Expenses of the Fund. The Board reviewed the fees paid to the Adviser and the other expenses borne by the Fund. The Board noted that the Adviser, not the Fund, pays the Sub-Adviser’s fee under the sub-advisory agreement. The independent consultant provided comparative data in regard to the fees and expenses of the Fund and other world stock funds underlying variable insurance products. In reviewing the fees and expenses charged to the VA funds, the Board considered the Adviser’s assertion that, because there is much greater disparity in the fees and services that may be provided by a manager to a VA fund as opposed to a retail fund, when comparing the expenses of the various VA funds to those of retail funds, it is most appropriate to focus on total expenses (rather than on the management fees). Accordingly, while the Board reviewed and considered all expenses, it focused on total expenses. The Board considered that the Fund’s total expenses and contractual management fee were lower than its peer group medians and category medians.
Economies of Scale and Profits Realized by the Managers. The Board considered information regarding the Managers’ costs in serving as the Fund’s investment adviser and sub-adviser, including the costs associated with the personnel and systems necessary to manage the Fund, and information regarding the Managers’ profitability from their relationship with the Fund. The Board also considered that the Managers must be able to pay and retain experienced professional personnel at competitive rates to provide quality services to the Fund. The Board reviewed whether the
Managers may realize economies of scale in managing and supporting the Fund. The Board noted that the Fund currently has management fee breakpoints, which are intended to share with Fund shareholders economies of scale that may exist as the Fund’s assets grow.
Other Benefits to the Managers. In addition to considering the profits realized by the Managers, the Board considered information that was
22 OPPENHEIMER GLOBAL FUND/VA
BOARD APPROVAL OF THE FUND’S INVESTMENT ADVISORY AND SUB-ADVISORY AGREEMENTS Unaudited / Continued
provided regarding the direct and indirect benefits the Managers receive as a result of their relationship with the Fund, including compensation paid to the Managers’ affiliates and research provided to the Adviser in connection with permissible brokerage arrangements (soft dollar arrangements).
Conclusions. These factors were also considered by the independent Trustees meeting separately from the full Board, assisted by experienced counsel to the Fund and to the independent Trustees. Fund counsel and the independent Trustees’ counsel are independent of the Managers within the meaning and intent of the Securities and Exchange Commission rules.
Based on its review of the information it received and its evaluations described above, the Board, including a majority of the independent Trustees, decided to continue the Agreements through August 31, 2018. In arriving at its decision, the Board did not identify any factor or factors as being more important than others, but considered all of the above information, and considered the terms and conditions of the Agreements, including the management fees, in light of all the surrounding circumstances.
23 OPPENHEIMER GLOBAL FUND/VA
PORTFOLIO PROXY VOTING POLICIES AND GUIDELINES; UPDATES TO STATEMENTS OF INVESTMENTS Unaudited
The Fund has adopted Portfolio Proxy Voting Policies and Guidelines under which the Fund votes proxies relating to securities (“portfolio proxies”) held by the Fund. A description of the Fund’s Portfolio Proxy Voting Policies and Guidelines is available (i) without charge, upon request, by calling the Fund toll-free at 1.800.CALL OPP (225.5677), (ii) on the Fund’s website at www.oppenheimerfunds.com, and (iii) on the SEC’s website at www.sec.gov. In addition, the Fund is required to file Form N-PX, with its complete proxy voting record for the 12 months ended June 30th, no later than August 31st of each year. The Fund’s voting record is available (i) without charge, upon request, by calling the Fund toll-free at 1.800.CALL OPP (225.5677), and (ii) in the Form N-PX filing on the SEC’s website at www.sec.gov.
The Fund files its complete schedule of portfolio holdings with the SEC for the first quarter and the third quarter of each fiscal year on Form N-Q. The Fund’s Form N-Q filings are available on the SEC’s website at www.sec.gov. Those forms may be reviewed and copied at the SEC’s Public Reference Room in Washington, D.C. Information on the operation of the Public Reference Room may be obtained by calling 1-800-SEC-0330.
24 OPPENHEIMER GLOBAL FUND/VA
TRUSTEES AND OFFICERS Unaudited
| | |
Name, Position(s) Held with the Fund, Length of
Service, Year of Birth | | Principal Occupation(s) During the Past 5 Years; Other Trusteeships/Directorships Held;
Number of Portfolios in the Fund Complex Currently Overseen |
| |
| INDEPENDENT TRUSTEES | | The address of each Trustee in the chart below is 6803 S. Tucson Way, Centennial, Colorado 80112-3924. Each Trustee serves for an indefinite term, or until his or her resignation, retirement, death or removal. |
| |
Robert J. Malone, Chairman of the Board of Trustees (since 2016), Trustee (since 2002) Year of Birth: 1944 | | Chairman - Colorado Market of MidFirst Bank (since January 2015); Chairman of the Board (2012-2016) and Director (August 2005-January 2016) of Jones International University (educational organization); Trustee of the Gallagher Family Foundation (non-profit organization) (2000-2016); Chairman, Chief Executive Officer and Director of Steele Street Bank Trust (commercial banking) (August 2003-January 2015); Director of Opera Colorado Foundation (non-profit organization) (2008-2012); Director of Colorado UpLIFT (charitable organization) (1986-2010); Director of Jones Knowledge, Inc. (2006-2010); Former Chairman of U.S. Bank-Colorado (subsidiary of U.S. Bancorp and formerly Colorado National Bank) (July 1996-April 1999); Director of Commercial Assets, Inc. (real estate investment trust) (1993-2000); Director of U.S. Exploration, Inc. (oil and gas exploration) (1997-February 2004); Chairman of the Board (1991-1994) and Trustee (1985-1994) of Regis University; and Chairman of the Board (1990-1991) and Member (1984-1999) of Young Presidents Organization. Oversees 54 portfolios in the OppenheimerFunds complex. Mr. Malone has served on the Boards of certain Oppenheimer funds since 2002, during which time he has become familiar with the Fund’s (and other Oppenheimer funds’) financial, accounting, regulatory and investment matters and has contributed to the Boards’ deliberations. |
| |
Andrew J. Donohue, Trustee (since 2017) Year of Birth: 1950 | | Of Counsel, Shearman & Sterling LLP (since September 2017); Chief of Staff of the U.S. Securities and Exchange Commission (regulator) (June 2015-February 2017); Managing Director and Investment Company General Counsel of Goldman Sachs (investment bank) (November 2012-May 2015); Partner at Morgan Lewis & Bockius, LLP (law firm) (March 2011-October 2012); Director of the Division of Investment Management of U.S. Securities and Exchange Commission (regulator) (May 2006-November 2010); Global General Counsel of Merrill Lynch Investment Managers (investment firm) (May 2003-May 2006); General Counsel (October 1991-November 2001) and Executive Vice President (January 1993-November 2001) of OppenheimerFunds, Inc. (investment firm) (June 1991-November 2001). Oversees 54 portfolios in the OppenheimerFunds complex. Mr. Donohue has served on the Boards of certain Oppenheimer funds since 2017, during which time he has become familiar with the Fund’s (and other Oppenheimer funds’) financial, accounting, regulatory and investment matters and has contributed to the Boards’ deliberations. |
| |
Jon S. Fossel, Trustee (since 1990) Year of Birth: 1942 | | Chairman of the Board of Jack Creek Preserve Foundation (non-profit organization) (2005-2015); Director of Jack Creek Preserve Foundation (non-profit organization) (since March 2005); Chairman of the Board (2006-December 2011) and Director (June 2002-December 2011) of UNUMProvident (insurance company); Director of Northwestern Energy Corp. (public utility corporation) (November 2004-December 2009); Director of P.R. Pharmaceuticals (October 1999-October 2003); Director of Rocky Mountain Elk Foundation (non-profit organization) (February 1998-February 2003 and February 2005-February 2007); Chairman and Director (until October 1996) and President and Chief Executive Officer (until October 1995) of the Sub-Adviser; President, Chief Executive Officer and Director of the following: Oppenheimer Acquisition Corp. (“OAC”) (parent holding company of the Sub-Adviser), Shareholders Services, Inc. and Shareholder Financial Services, Inc. (until October 1995). Oversees 54 portfolios in the OppenheimerFunds complex. Mr. Fossel has served on the Boards of certain Oppenheimer funds since 1990, during which time he has become familiar with the Fund’s (and other Oppenheimer funds’) financial, accounting, regulatory and investment matters and has contributed to the Boards’ deliberations. |
| |
Richard F. Grabish, Trustee (since 2012) Year of Birth: 1948 | | Formerly Senior Vice President and Assistant Director of Sales and Marketing (March 1997-December 2007), Director (March 1987-December 2007) and Manager of Private Client Services (June 1985-June 2005) of A.G. Edwards & Sons, Inc. (broker/dealer and investment firm); Chairman and Chief Executive Officer of A.G. Edwards Trust Company, FSB (March 2001-December 2007); President and Vice Chairman of A.G. Edwards Trust Company, FSB (investment adviser) (April 1987-March 2001); President of A.G. Edwards Trust Company, FSB (investment adviser) (June 2005-December 2007). Oversees 54 portfolios in the OppenheimerFunds complex. Mr. Grabish has served on the Boards of certain Oppenheimer funds since 2001, during which time he has become familiar with the Fund’s (and other Oppenheimer funds’) financial, accounting, regulatory and investment matters and has contributed to the Boards’ deliberations. |
| |
Beverly L. Hamilton, Trustee (since 2002) Year of Birth: 1946 | | Trustee of Monterey Institute for International Studies (educational organization) (2000-2014); Board Member of Middlebury College (educational organization) (December 2005-June 2011); Director (1991-2016), Vice Chairman of the Board (2006- 2009) and Chairman of the Board (2010-2013) of American Funds’ Emerging Markets Growth Fund, Inc. (mutual fund); Director of The California Endowment (philanthropic organization) (April 2002-April 2008); Director (February 2002-2005) and Chairman of Trustees (2006-2007) of the Community Hospital of Monterey Peninsula; President of ARCO Investment Management Company (February 1991-April 2000); Member of the investment committees of The Rockefeller Foundation (2001-2006) and The University of Michigan (since 2000); Advisor at Credit Suisse First Boston’s Sprout venture capital unit (venture capital fund) (1994-January 2005); Trustee of MassMutual Institutional Funds (investment company) (1996-June 2004); Trustee of MML Series Investment Fund (investment company) (April 1989-June 2004); Member of the investment committee of Hartford Hospital (2000-2003); and Advisor to Unilever (Holland) pension fund (2000-2003). Oversees 54 portfolios in the OppenheimerFunds complex. Ms. Hamilton has served on the Boards of certain Oppenheimer funds since 2002, during which time she has become familiar with the Fund’s (and other Oppenheimer funds’) financial, accounting, regulatory and investment matters and has contributed to the Boards’ deliberations. |
| |
Victoria J. Herget, Trustee (since 2012) Year of Birth: 1951 | | Board Chair (2008-2015) and Director (2004-Present), United Educators (insurance company); Trustee (since 2000) and Chair (since 2010), Newberry Library (independent research library); Trustee, Mather LifeWays (senior living organization) (since 2001); Independent Director of the First American Funds (mutual fund family) (2003-2011); former Managing Director (1993-2001), Principal (1985-1993), Vice President (1978-1985) and Assistant Vice President (1973-1978) of Zurich Scudder Investments (investment adviser) (and its predecessor firms); Trustee (1992-2007), Chair of the Board of Trustees (1999-2007), Investment Committee Chair (1994-1999) and Investment Committee member (2007-2010) of Wellesley College; Trustee, BoardSource (non-profit organization) (2006-2009) and Chicago City Day School (K-8 School) (1994-2005). Oversees 54 portfolios in the OppenheimerFunds complex. Ms. Herget has served on the Boards of certain Oppenheimer funds since 2012, during which time she has become familiar with the Fund’s (and other Oppenheimer funds’) financial, accounting, regulatory and investment matters and has contributed to the Boards’ deliberations. |
25 OPPENHEIMER GLOBAL FUND/VA
TRUSTEES AND OFFICERS Unaudited / Continued
| | |
F. William Marshall, Jr., Trustee (since 2000) Year of Birth: 1942 | | Trustee Emeritus of Worcester Polytech Institute (WPI) (private university) (since 2009); Trustee of MassMutual Select Funds (formerly MassMutual Institutional Funds) (investment company) (1996-2015), MML Series Investment Fund (investment company) (1996-2015) and Mass Mutual Premier Funds (investment company) (January 2012-December 2015); President and Treasurer of the SIS Charitable Fund (private charitable fund) (January 1999-March 2011); Former Trustee of WPI (1985- 2008); Former Chairman of the Board (2004-2006) and Former Chairman of the Investment Committee of WPI (1994-2008); Chairman of SIS Family Bank, F.S.B. (formerly SIS Bank) (commercial bank) (January 1999-July 1999); Executive Vice President of Peoples Heritage Financial Group, Inc. (commercial bank) (January 1999-July 1999); and Former President and Chief Executive Officer of SIS Bancorp. (1993-1999). Oversees 54 portfolios in the OppenheimerFunds complex. Mr. Marshall has served on the Boards of certain Oppenheimer funds since 2000, during which time he has become familiar with the Fund’s (and other Oppenheimer funds’) financial, accounting, regulatory and investment matters and has contributed to the Boards’ deliberations. |
| |
Karen L. Stuckey, Trustee (since 2012) Year of Birth: 1953 | | Member (since May 2015) of Desert Mountain Community Foundation Advisory Board (non-profit organization); Partner (1990-2012) of PricewaterhouseCoopers LLP (professional services firm) (held various positions 1975-1990); Trustee (1992- 2006); member of Executive, Nominating and Audit Committees and Chair of Finance Committee (1992-2006), and Emeritus Trustee (since 2006) of Lehigh University; and member, Women’s Investment Management Forum (professional organization) since inception. Oversees 54 portfolios in the OppenheimerFunds complex. Ms. Stuckey has served on the Boards of certain Oppenheimer funds since 2012, during which time she has become familiar with the Fund’s (and other Oppenheimer funds’) financial, accounting, regulatory and investment matters and has contributed to the Boards’ deliberations. |
| |
James D. Vaughn, Trustee (since 2012) Year of Birth: 1945 | | Retired; former managing partner (1994-2001) of Denver office of Deloitte & Touche LLP, (held various positions 1969- 1993); Trustee and Chairman of the Audit Committee of Schroder Funds (2003-2012); Board member and Chairman of Audit Committee of AMG National Trust Bank (since 2005); Trustee and Investment Committee member, University of South Dakota Foundation (since 1996); Board member, Audit Committee Member and past Board Chair, Junior Achievement (since 1993); former Board member, Mile High United Way, Boys and Girls Clubs, Boy Scouts, Colorado Business Committee for the Arts, Economic Club of Colorado and Metro Denver Network. Oversees 54 portfolios in the OppenheimerFunds complex. Mr. Vaughn has served on the Boards of certain Oppenheimer funds since 2012, during which time he has become familiar with the Fund’s (and other Oppenheimer funds’) financial, accounting, regulatory and investment matters and has contributed to the Boards’ deliberations. |
| | | |
| INTERESTED TRUSTEE AND OFFICER | | Mr. Steinmetz is an “Interested Trustee” because he is affiliated with the Manager and the Sub-Adviser by virtue of his positions as Chairman and director of the Sub-Adviser and officer and director of the Manager. Both as a Trustee and as an officer, Mr. Steinmetz serves for an indefinite term, or until his resignation, retirement, death or removal. Mr. Steinmetz’s address is 225 Liberty Street, New York, New York 10281-1008. |
| |
Arthur P. Steinmetz, Trustee (since 2015), President and Principal Executive Officer (since 2014) Year of Birth: 1958 | | Chairman of the Sub-Adviser (since January 2015); CEO and Chairman of the Manager (since July 2014), President of the Manager (since May 2013), a Director of the Manager (since January 2013), Director of the Sub-Adviser (since July 2014), President, Management Director and CEO of Oppenheimer Acquisition Corp. (the Sub-Adviser’s parent holding company) (since July 2014), and President and Director of OFI SteelPath, Inc. (since January 2013). Chief Investment Officer of the OppenheimerFunds advisory entities from (January 2013-December 2013); Executive Vice President of the Manager (January 2013-May 2013); Chief Investment Officer of the Sub-Adviser (October 2010-December 2012); Chief Investment Officer, Fixed- Income, of the Sub-Adviser (April 2009-October 2010); Executive Vice President of the Sub-Adviser (October 2009-December 2012); Director of Fixed Income of the Sub-Adviser (January 2009-April 2009); and a Senior Vice President of the Sub-Adviser (March 1993-September 2009). An officer of 111 portfolios in the OppenheimerFunds complex. |
| | | |
| OTHER OFFICERS OF THE FUND | | The addresses of the Officers in the chart below are as follows: for Mr. Bhaman, Delano, Mss. Lo Bessette, Foxson and Picciotto, 225 Liberty Street, New York, New York 10281-1008, for Mr. Petersen, 6803 S. Tucson Way, Centennial, Colorado 80112-3924. Each Officer serves for an indefinite term or until his or her resignation, retirement, death or removal. |
| |
Rajeev Bhaman, Vice President (since 2004) Year of Birth: 1963 | | Director of Global Equities of the Sub-Adviser (since January 2013); Senior Vice President of the Sub-Adviser (since May 2006); Vice President of the Sub-Adviser (January 1997-May 2006). An officer of other portfolios in the OppenheimerFunds complex. |
| |
John Delano, Vice President (since 2017) Year of Birth: 1972 | | Senior Portfolio Manager of the Sub-Adviser (since January 2017); Vice President and Director of Equity Research, Global Team, of the Sub-Adviser (since October 2010); Director of Equity Research, Growth Team, of the Sub-Adviser since (April 2007 - October 2010). A portfolio manager and an officer of other portfolios in the OppenheimerFunds complex. |
| |
Cynthia Lo Bessette, Secretary and Chief Legal Officer (since 2016) Year of Birth: 1969 | | Executive Vice President, General Counsel and Secretary of the Manager (since February 2016); Senior Vice President and Deputy General Counsel of the Manager (March 2015-February 2016); Chief Legal Officer of the Sub-Adviser and the Distributor (since February 2016); Vice President, General Counsel and Secretary of Oppenheimer Acquisition Corp. (since February 2016); General Counsel of OFI SteelPath, Inc., OFI Advisors, LLC and Index Management Solutions, LLC (since February 2016); Chief Legal Officer of OFI Global Institutional, Inc., HarbourView Asset Management Corporation, OFI Global Trust Company, Oppenheimer Real Asset Management, Inc., OFI Private Investments Inc., Shareholder Services, Inc. and Trinity Investment Management Corporation (since February 2016); Corporate Counsel (February 2012-March 2015) and Deputy Chief Legal Officer (April 2013-March 2015) of Jennison Associates LLC; Assistant General Counsel (April 2008-September 2009) and Deputy General Counsel (October 2009-February 2012) of Lord Abbett & Co. LLC. An officer of 111 portfolios in the OppenheimerFunds complex. |
| |
Jennifer Foxson, Vice President and Chief Business Officer (since 2014) Year of Birth: 1969 | | Senior Vice President of OppenheimerFunds Distributor, Inc. (since June 2014); Vice President of OppenheimerFunds Distributor, Inc. (April 2006-June 2014); Vice President of the Sub-Adviser (January 1998-March 2006); Assistant Vice President of the Sub-Adviser (October 1991-December 1998). An officer of 111 portfolios in the OppenheimerFunds complex. |
26 OPPENHEIMER GLOBAL FUND/VA
| | |
| |
Mary Ann Picciotto, Chief Compliance Officer and Chief Anti-Money Laundering Officer (since 2014) Year of Birth: 1973 | | Senior Vice President and Chief Compliance Officer of the Manager (since March 2014); Chief Compliance Officer of the Sub- Adviser, OFI SteelPath, Inc., OFI Global Trust Company, OFI Global Institutional, Inc., Oppenheimer Real Asset Management, Inc., OFI Private Investments, Inc., Harborview Asset Management Corporation, Trinity Investment Management Corporation, and Shareholder Services, Inc. (since March 2014); Managing Director of Morgan Stanley Investment Management Inc. and certain of its various affiliated entities; Chief Compliance Officer of various Morgan Stanley Funds (May 2010-January 2014); Chief Compliance Officer of Morgan Stanley Investment Management Inc. (April 2007-January 2014). An officer of 111 portfolios in the OppenheimerFunds complex. |
| |
Brian S. Petersen, Treasurer and Principal Financial & Accounting Officer (since 2016) Year of Birth: 1970 | | Senior Vice President of the Manager (since January 2017); Vice President of the Manager (January 2013-January 2017); Vice President of the Sub-Adviser (February 2007-December 2012); Assistant Vice President of the Sub-Adviser (August 2002- 2007). An officer of 111 portfolios in the OppenheimerFunds complex. |
The Fund’s Statement of Additional Information contains additional information about the Fund’s Trustees and Officers and is available without charge, upon request, by calling 1.800.988.8287.
27 OPPENHEIMER GLOBAL FUND/VA
OPPENHEIMER GLOBAL FUND/VA
A Series of Oppenheimer Variable Account Funds
| | |
| Manager | | OFI Global Asset Management, Inc. |
| |
| Sub-Adviser | | OppenheimerFunds, Inc. |
| |
| Distributor | | OppenheimerFunds Distributor, Inc. |
| |
Transfer and Shareholder Servicing Agent | | OFI Global Asset Management, Inc. |
| |
| Sub-Transfer Agent | | Shareholder Services, Inc. |
| | DBA OppenheimerFunds Services |
| |
Independent Registered Public Accounting Firm | | KPMG LLP |
| |
| Legal Counsel | | Ropes & Gray LLP |
| |
| | Before investing in any of the Oppenheimer funds, investors should carefully consider a fund’s investment objectives, risks, charges and expenses. Fund prospectuses and summary prospectuses contain this and other information about the funds, and may be obtained by asking your financial advisor, visiting oppenheimerfunds.com or calling us at 1.800.988.8287. Read prospectuses and summary prospectuses carefully before investing. |
| |
| | © 2018 OppenheimerFunds, Inc. All rights reserved. Oppenheimer funds are distributed by OppenheimerFunds Distributor, Inc. |


December 31, 2017
| | | | | | |
| | | | | | |
| | Oppenheimer | | Annual Report | | |
| | Main Street Fund®/VA | | |
| | A Series of Oppenheimer Variable Account Funds | | |
| | | | | | |
ANNUAL REPORT
Listing of Top Holdings
Fund Performance Discussion
Financial Statements
PORTFOLIO MANAGERS: Manind Govil, CFA, Benjamin Ram and Paul Larson
AVERAGE ANNUAL TOTAL RETURNS FOR THE PERIODS ENDED 12/31/17
| | | | | | | | | | | | | | | | |
| | | Inception
Date | | | 1-Year | | | 5-Year | | | 10-Year | |
Non-Service Shares | | | 7/5/95 | | | | 16.91 | % | | | 14.49 | % | | | 7.74 | % |
Service Shares | | | 7/13/00 | | | | 16.63 | | | | 14.20 | | | | 7.46 | |
S&P 500 Index | | | | | | | 21.83 | | | | 15.79 | | | | 8.50 | |
Performance data quoted represents past performance, which does not guarantee future results. The investment return and principal value of an investment in the Fund will fluctuate so that an investor’s shares, when redeemed, may be worth more or less than their original cost. Current performance may be lower or higher than the performance quoted. For performance data current to the most recent month end, call us at 1.800.988.8287. The Fund’s total returns should not be expected to be the same as the returns of other funds, whether or not both funds have the same portfolio managers and/or similar names. The Fund’s total returns include changes in share price and reinvested distributions but do not include the charges associated with the separate account products that offer this Fund. Such performance would have been lower if such charges were taken into account.
TOP HOLDINGS AND ALLOCATIONS
TOP TEN COMMON STOCK HOLDINGS
| | | | | | | | |
Apple, Inc. | | | 5.7 | % | | | | |
Alphabet, Inc., Cl. C | | | 4.9 | | | | | |
Citigroup, Inc. | | | 3.2 | | | | | |
Comcast Corp., Cl. A | | | 3.1 | | | | | |
PepsiCo, Inc. | | | 3.0 | | | | | |
Facebook, Inc., Cl. A | | | 2.7 | | | | | |
UnitedHealth Group, Inc. | | | 2.7 | | | | | |
Merck & Co., Inc. | | | 2.7 | | | | | |
Berkshire Hathaway, Inc., Cl. B | | | 2.3 | | | | | |
Suncor Energy, Inc. | | | 2.3 | | | | | |
Portfolio holdings and allocations are subject to change. Percentages are as of December 31, 2017, and are based on net assets. For more current Fund holdings, please visit oppenheimerfunds.com.
SECTOR ALLOCATION
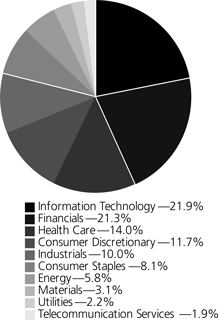
Portfolio holdings and allocations are subject to change. Percentages are as of December 31, 2017, and are based on the total market value of common stocks.
2 OPPENHEIMER MAIN STREET FUND/VA
Fund Performance Discussion
During the reporting period, the Fund’s Non-Service shares produced a return of 16.91%. In comparison, the S&P 500 Index (the “Index”) returned 21.83%. The Fund underperformed the Index in the Industrials, Health Care and Utilities sectors due mainly to stock selection. The Fund outperformed the Index in Energy and Financials due to stock selection, while an underweight position in Telecommunication Services also helped.
MARKET OVERVIEW
2017 was a banner year in terms of fundamentals for the U.S. economy. One of the longest job expansions in U.S. history continued with more than 2 million jobs added for the seventh consecutive year and unemployment close to an all-time low. There were various other signs of improvement as well, in everything from high consumer confidence scores to declining murder rates in big cities (New York and Los Angeles were at record lows). Despite this, the inflation rate remained low. Most importantly for equity investors, U.S. corporate revenues and earnings growth accelerated.
These trends helped the equity market continue its strong upward trend in the fourth quarter, topping off a year that saw the S&P 500 Index post a total return of a robust 21.83%. The rally in the market was unusual in several aspects. First, the Index posted positive total returns in every single month of the year, which is something the Index has never done before. The market was also extremely calm, as market volatility (as measured by the CBOE Volatility Index) hit a new all-time low for the year. Finally, cumulative losses on the down days during 2017 were the lowest on record. For many, the investor experience of 2017 was about as good as it gets.
While nearly all parts of the market rose in 2017, there were some notable differences within the market. Namely, large capitalization stocks outperformed smaller capitalization stocks, and companies on the “growth” part of the spectrum vastly outperformed the “value” names.
Several factors drove investors’ increased appetite for risk. For one, the underlying economy remained on the steady growth track that it has been on for several years. And though the Federal Reserve raised rates a couple times during the year, liquidity remained abundant with interest rates still at historically low levels. Last but not least, excitement around corporate tax reform drove expectations for a burst in corporate profitability and overall economic growth.
As investors, it is important to know what is and what is not within one’s circle of competence. As such, we strive to keep the portfolio in an all-weather orientation. Whether rates, commodity prices, currencies or even whole economies go up or down, our goal is to have a portfolio that is positioned to out-perform no matter the environment.
Second, we believe we have the skills to identify company management teams that are likely to successfully execute on their business plans. Lastly, correctly valuing stocks and seeing what expectations the market is pricing in is also within our skillset. It is not by accident that we weight the portfolio more heavily towards companies that we believe have structural competitive advantages and/or management teams that are executing (e.g., gaining market share, expanding profit margins), with at least reasonable stock valuations. Companies with these qualities generally have more stable earnings.
TOP INDIVIDUAL CONTRIBUTORS
Top contributors to relative performance this period included information technology stocks Apple and PayPal Holdings, and Financials holding Progressive. Apple has done well this year since reporting earnings results that eased prior fears of mediocre product acceptance. Sales of the new iPhone have been strong and the company has displayed pricing power as well. PayPal has continued to benefit from strong revenue growth driven by impressive customer acquisition and engagement, as well as the secular tailwinds of electronic payments and e-commerce spending. Progressive continued to beat consensus earnings expectations during the quarter driven by market share gains in auto insurance, better pricing (higher premiums), and lower than expected auto claims. We continue to view the company favorably and expect management to continue to display superior execution.
TOP INDIVIDUAL DETRACTORS
Top detractors from relative performance included General Electric, PG&E and AutoZone. General Electric underperformed this reporting period and recently underwent a CEO change. During November, there was general investor disappointment regarding the aggressiveness of the restructuring plan outlined by the new CEO. While largely anticipated, the company also announced a cut to the dividend. PG&E is one of the largest utility companies in California. The stock has been under pressure since the start of the Northern California wildfires due to concerns that some of the company’s equipment may have played a role in some of the fires. The stock saw further pressure after the company announced they would be suspending the dividend to preserve cash for potential future claims. AutoZone’s underperformance has been driven by a deceleration in same store sales and the narrative that the deceleration was partially being driven by
3 OPPENHEIMER MAIN STREET FUND/VA
Amazon encroaching on the auto parts retail business. The stock has rebounded more recently after a stabilization of same store sales and lessening concerns about the health of the industry.
STRATEGY & OUTLOOK
At the moment, the U.S. economy continues its “slow and steady” growth. This is being driven by favorable data around employment, wages and inflation. Rising home prices and innovation also continue to help drive the economy higher. Moreover, corporate tax reform will lead to a jump in earnings and cash flow for most companies, and it will more likely than not lead to a boost in economic growth in the short term. While the economic expansionary cycle is indeed long in the tooth, the economic growth has been at relatively low rates, suggesting it could continue for a while longer.
We are afraid companies are addicted to low interest rates, which have been low for almost a decade now. We believe the risks inherent to this market include the misallocation of capital if interest rates were to rise materially. As the markets have risen, we find fewer companies with attractive fundamentals that are attractively priced. We intend to maintain our discipline around valuation. Additionally, while innovation is alive and well and continuing to help generate economic growth, fundamental disruptions across market segments have been elevated. We continue to be focused on potential disruption risk to our companies.
Volatility in the markets was unusually low in 2017. We expect heightened uncertainty to return to the equity markets eventually. Traditionally, during periods of economic uncertainty and heightened market volatility, investors favor stocks of higher quality companies—with greater consistency and stability of revenue and earnings—leading to relatively better stock performance of those companies. We think focusing on companies with economic moats and skilled management teams positions us well, should this environment come to pass. During times of economic volatility such companies frequently widen their lead over weaker competitors. We seek to invest in companies, characterized by these qualities, at compelling valuations and believe this disciplined approach is essential to generating superior long-term performance.
Investors should consider the Fund’s investment objective, risks, charges and expenses carefully before investing. The Fund’s prospectus and summary prospectus contain this and other information about the Fund, and may be obtained by asking your financial advisor or calling us at 1.800.988.8287. Read prospectuses and summary prospectuses carefully before investing.
Total returns include changes in share price and reinvestment of dividends and capital gains distributions in a hypothetical investment for the periods shown, but do not include the charges associated with the separate account products that offer this Fund.
The Fund’s investment strategy and focus can change over time. The mention of specific fund holdings does not constitute a recommendation by OppenheimerFunds, Inc. or its affiliates.
Shares of Oppenheimer funds are not deposits or obligations of any bank, are not guaranteed by any bank, are not insured by the FDIC or any other agency, and involve investment risks, including the possible loss of the principal amount invested.
Comparing the Fund’s Performance to the Market. The graphs that follow show the performance of a hypothetical $10,000 investment in each share class of the Fund held until December 31, 2017. Performance is measured over a ten-fiscal-year period for both Classes. Performance information does not reflect charges that apply to separate accounts investing in the Fund. If these charges were taken into account, performance would be lower. The graphs assume that all dividends and capital gains distributions were reinvested in additional shares.
The Fund’s performance is compared to the performance of the S&P 500 Index. The S&P 500 Index is a broad-based measure of domestic stock performance. The Index is unmanaged and cannot be purchased directly by investors. While index comparisons may be useful to provide a benchmark for the Fund’s performance, it must be noted that the Fund’s investments are not limited to the investments comprising the Index. Index performance includes reinvestment of income, but does not reflect transaction costs, fees, expenses or taxes. Index performance is shown for illustrative purposes only as a benchmark for the Fund’s performance, and does not predict or depict performance of the Fund. The Fund’s performance reflects the effects of the Fund’s business and operating expenses.
4 OPPENHEIMER MAIN STREET FUND/VA
COMPARISON OF CHANGE IN VALUE OF $10,000 HYPOTHETICAL INVESTMENTS IN:
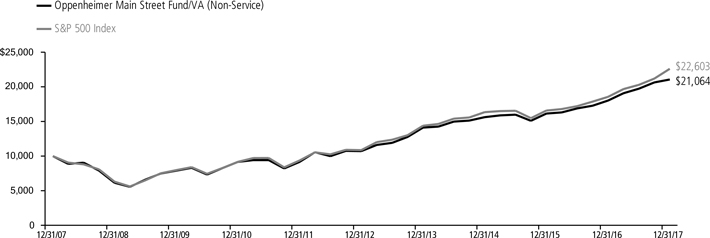
Average Annual Total Returns of Non-Service Shares of the Fund at 12/31/17
1-Year 16.91% 5-Year 14.49% 10-Year 7.74%
COMPARISON OF CHANGE IN VALUE OF $10,000 HYPOTHETICAL INVESTMENTS IN:
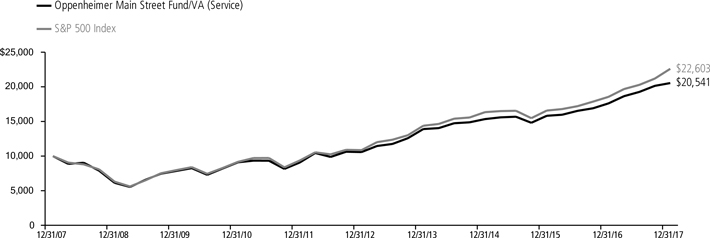
Average Annual Total Returns of Service Shares of the Fund at 12/31/17
1-Year 16.63% 5-Year 14.20% 10-Year 7.46%
Performance data quoted represents past performance, which does not guarantee future results. The investment return and principal value of an investment in the Fund will fluctuate so that an investor’s shares, when redeemed, may be worth more or less than their original cost. Current performance may be lower or higher than the performance quoted. For performance data current to the most recent month end, call us at 1.800.988.8287. The Fund’s total returns should not be expected to be the same as the returns of other funds, whether or not both funds have the same portfolio managers and/or similar names. The Fund’s total returns include changes in share price and reinvested distributions but do not include the charges associated with the separate account products that offer this Fund. Such performance would have been lower if such charges were taken into account.
5 OPPENHEIMER MAIN STREET FUND/VA
Fund Expenses
Fund Expenses. As a shareholder of the Fund, you incur two types of costs: (1) transaction costs and (2) ongoing costs, including management fees; distribution and service fees; and other Fund expenses. These examples are intended to help you understand your ongoing costs (in dollars) of investing in the Fund and to compare these costs with the ongoing costs of investing in other mutual funds.
The examples are based on an investment of $1,000.00 invested at the beginning of the period and held for the entire 6-month period ended December 31, 2017.
Actual Expenses. The first section of the table provides information about actual account values and actual expenses. You may use the information in this section for the class of shares you hold, together with the amount you invested, to estimate the expense that you paid over the period. Simply divide your account value by $1,000.00 (for example, an $8,600.00 account value divided by $1,000.00 = 8.60), then multiply the result by the number in the first section under the heading entitled “Expenses Paid During 6 Months Ended December 31, 2017” to estimate the expenses you paid on your account during this period.
Hypothetical Example for Comparison Purposes.
The second section of the table provides information about hypothetical account values and hypothetical expenses based on the Fund’s actual expense ratio for each class of shares, and an assumed rate of return of 5% per year for each class before expenses, which is not the actual return. The hypothetical account values and expenses may not be used to estimate the actual ending account balance or expenses you paid for the period. You may use this information to compare the ongoing costs of investing in the Fund and other funds. To do so, compare this 5% hypothetical example for the class of shares you hold with the 5% hypothetical examples that appear in the shareholder reports of the other funds.
Please note that the expenses shown in the table are meant to highlight your ongoing costs only and do not reflect any charges associated with the separate accounts that offer this Fund. Therefore, the “hypothetical” lines of the table are useful in comparing ongoing costs only, and will not help you determine the relative total costs of owning different funds. In addition, if these separate account charges were included your costs would have been higher.
| | | | | | | | | | | | |
| Actual | | Beginning Account Value July 1, 2017 | | | Ending Account Value
December 31, 2017 | | | Expenses Paid During 6 Months Ended December 31, 2017 | |
Non-Service shares | | $ | 1,000.00 | | | $ | 1,067.20 | | | $ | 4.07 | |
Service shares | | | 1,000.00 | | | | 1,065.80 | | | | 5.38 | |
| | | |
Hypothetical | | | | | | | | | | | | |
(5% return before expenses) | | | | | | | | | | | | |
Non-Service shares | | | 1,000.00 | | | | 1,021.27 | | | | 3.98 | |
Service shares | | | 1,000.00 | | | | 1,020.01 | | | | 5.26 | |
Expenses are equal to the Fund’s annualized expense ratio for that class, multiplied by the average account value over the period, multiplied by 184/365 (to reflect the one-half year period). Those annualized expense ratios, excluding indirect expenses from affiliated funds, based on the 6-month period ended December 31, 2017 are as follows:
| | | | | | | | | | | | |
| Class | | Expense Ratios | | | | |
Non-Service shares | | | 0.78 | % | | | | | | | | |
Service shares | | | 1.03 | | | | | | | | | |
The expense ratios reflect voluntary and/or contractual waivers and/or reimbursements of expenses by the Fund’s Manager. Some of these undertakings may be modified or terminated at any time, as indicated in the Fund’s prospectus. The “Financial Highlights” tables in the Fund’s financial statements, included in this report, also show the gross expense ratios, without such waivers or reimbursements and reduction to custodian expenses, if applicable.
6 OPPENHEIMER MAIN STREET FUND/VA
STATEMENT OF INVESTMENTS December 31, 2017
| | | | | | | | |
| | | Shares | | | Value | |
| |
Common Stocks—98.5% | | | | | | | | |
| |
Consumer Discretionary—11.5% | |
| |
Auto Components—0.9% | | | | | | | | |
| |
Aptiv plc | | | 115,650 | | | $ | 9,810,590 | |
| |
Delphi Technologies plc1 | | | 38,550 | | | | 2,022,718 | |
| | | | | | | | |
| | | | | | | 11,833,308 | |
| |
Hotels, Restaurants & Leisure—1.9% | |
| |
McDonald’s Corp. | | | 152,420 | | | | 26,234,530 | |
| |
Household Durables—1.1% | |
| |
Whirlpool Corp. | | | 84,340 | | | | 14,223,098 | |
| |
Media—3.1% | |
| |
Comcast Corp., Cl. A | | | 1,047,480 | | | | 41,951,574 | |
| |
Specialty Retail—4.5% | |
| |
CarMax, Inc.1 | | | 221,010 | | | | 14,173,371 | |
| |
Lowe’s Cos., Inc. | | | 277,580 | | | | 25,798,285 | |
| |
O’Reilly Automotive, Inc.1 | | | 85,540 | | | | 20,575,792 | |
| | | | | | | | |
| | | | | | | 60,547,448 | |
| |
Consumer Staples—7.9% | |
| |
Beverages—3.0% | |
| |
PepsiCo, Inc. | | | 343,640 | | | | 41,209,309 | |
| |
Food Products—3.1% | |
| |
Kraft Heinz Co. (The) | | | 283,775 | | | | 22,066,344 | |
| |
Mondelez International, Inc., Cl. A | | | 448,410 | | | | 19,191,948 | |
| | | | | | | | |
| | | | | | | 41,258,292 | |
| |
Tobacco—1.8% | |
| |
Philip Morris International, Inc. | | | 232,669 | | | | 24,581,480 | |
| |
Energy—5.8% | |
| |
Energy Equipment & Services—1.6% | |
| |
Schlumberger Ltd. | | | 316,370 | | | | 21,320,174 | |
| |
Oil, Gas & Consumable Fuels—4.2% | |
| |
Magellan Midstream Partners LP2 | | | 366,575 | | | | 26,004,831 | |
| |
Suncor Energy, Inc. | | | 825,960 | | | | 30,329,251 | |
| | | | | | | | |
| | | | | | | 56,334,082 | |
| |
Financials—21.0% | |
| |
Capital Markets—6.1% | |
| |
Bank of New York Mellon Corp. (The) | | | 399,850 | | | | 21,535,921 | |
| |
CME Group, Inc., Cl. A | | | 131,530 | | | | 19,209,957 | |
| |
Intercontinental Exchange, Inc. | | | 297,220 | | | | 20,971,843 | |
| |
S&P Global, Inc. | | | 117,901 | | | | 19,972,429 | |
| | | | | | | | |
| | | | | | | 81,690,150 | |
| |
Commercial Banks—5.7% | |
| |
Citigroup, Inc. | | | 575,218 | | | | 42,801,971 | |
| |
SunTrust Banks, Inc. | | | 235,620 | | | | 15,218,696 | |
| |
US Bancorp | | | 345,450 | | | | 18,509,211 | |
| | | | | | | | |
| | | | | | | 76,529,878 | |
| |
Consumer Finance—2.1% | |
| |
American Express Co. | | | 163,400 | | | | 16,227,254 | |
| |
Discover Financial Services | | | 166,403 | | | | 12,799,719 | |
| | | | | | | | |
| | | | | | | 29,026,973 | |
| |
Diversified Financial Services—2.3% | |
| |
Berkshire Hathaway, Inc., Cl. B1 | | | 157,290 | | | | 31,178,024 | |
| |
Insurance—3.6% | |
| |
Marsh & McLennan Cos., Inc. | | | 215,670 | | | | 17,553,381 | |
| |
MetLife, Inc. | | | 199,260 | | | | 10,074,586 | |
| |
Progressive Corp. (The) | | | 363,800 | | | | 20,489,216 | |
| | | | | | | | |
| | | | | | | 48,117,183 | |
| |
Real Estate Investment Trusts (REITs)—1.2% | |
| |
| Mid-America Apartment Communities, Inc. | | | 96,700 | | | | 9,724,152 | |
| |
Ventas, Inc. | | | 113,110 | | | | 6,787,731 | |
| | | | | | | | |
| | | | | | | 16,511,883 | |
| | | | | | | | |
| | | Shares | | | Value | |
| |
Health Care—13.8% | |
| |
Biotechnology—2.9% | |
| |
Celgene Corp.1 | | | 223,480 | | | $ | 23,322,373 | |
| |
Gilead Sciences, Inc. | | | 210,330 | | | | 15,068,041 | |
| | | | | | | | |
| | | | | | | 38,390,414 | |
| |
Health Care Equipment & Supplies—1.9% | |
| |
Boston Scientific Corp.1 | | | 446,820 | | | | 11,076,668 | |
| |
Stryker Corp. | | | 94,360 | | | | 14,610,702 | |
| | | | | | | | |
| | | | | | | 25,687,370 | |
| |
Health Care Providers & Services—4.5% | |
| |
DaVita, Inc.1 | | | 131,440 | | | | 9,496,540 | |
| |
Express Scripts Holding Co.1 | | | 204,687 | | | | 15,277,837 | |
| |
UnitedHealth Group, Inc. | | | 164,180 | | | | 36,195,123 | |
| | | | | | | | |
| | | | | | | 60,969,500 | |
| |
Health Care Technology—0.7% | |
| |
Cerner Corp.1 | | | 147,280 | | | | 9,925,199 | |
| |
Life Sciences Tools & Services—0.7% | |
| |
Agilent Technologies, Inc. | | | 132,680 | | | | 8,885,580 | |
| |
Pharmaceuticals—3.1% | |
| |
Merck & Co., Inc. | | | 643,060 | | | | 36,184,986 | |
| |
| Valeant Pharmaceuticals International, Inc.1 | | | 263,510 | | | | 5,475,738 | |
| | | | | | | | |
| �� | | | | | | 41,660,724 | |
| |
Industrials—9.9% | |
| |
Aerospace & Defense—2.0% | |
| |
Lockheed Martin Corp. | | | 85,670 | | | | 27,504,354 | |
| |
Airlines—0.5% | |
| |
Alaska Air Group, Inc. | | | 85,280 | | | | 6,268,933 | |
| |
Commercial Services & Supplies—1.6% | |
| |
Johnson Controls International plc | | | 311,635 | | | | 11,876,410 | |
| |
Republic Services, Inc., Cl. A | | | 143,860 | | | | 9,726,374 | |
| | | | | | | | |
| | | | | | | 21,602,784 | |
| |
Industrial Conglomerates—1.5% | |
| |
General Electric Co. | | | 1,172,245 | | | | 20,455,675 | |
| |
Professional Services—1.5% | |
| |
Equifax, Inc. | | | 54,800 | | | | 6,462,016 | |
| |
Nielsen Holdings plc | | | 362,520 | | | | 13,195,728 | |
| | | | | | | | |
| | | | | | | 19,657,744 | |
| |
Road & Rail—2.1% | |
| |
Canadian National Railway Co. | | | 201,100 | | | | 16,590,750 | |
| |
Canadian Pacific Railway Ltd. | | | 60,900 | | | | 11,130,084 | |
| | | | | | | | |
| | | | | | | 27,720,834 | |
| |
Trading Companies & Distributors—0.7% | |
| |
Fastenal Co. | | | 176,380 | | | | 9,646,222 | |
| |
Information Technology—21.6% | |
| |
Communications Equipment—1.8% | |
| |
Cisco Systems, Inc. | | | 189,350 | | | | 7,252,105 | |
| |
Motorola Solutions, Inc. | | | 185,100 | | | | 16,721,934 | |
| | | | | | | | |
| | | | | | | 23,974,039 | |
| |
Internet Software & Services—8.8% | |
| |
Alphabet, Inc., Cl. C1 | | | 62,506 | | | | 65,406,279 | |
| |
eBay, Inc.1 | | | 430,530 | | | | 16,248,202 | |
| |
Facebook, Inc., Cl. A1 | | | 206,850 | | | | 36,500,751 | |
| | | | | | | | |
| | | | | | | 118,155,232 | |
| |
IT Services—2.6% | |
| |
Amdocs Ltd. | | | 268,300 | | | | 17,568,284 | |
| |
PayPal Holdings, Inc.1 | | | 244,910 | | | | 18,030,274 | |
| | | | | | | | |
| | | | | | | 35,598,558 | |
| |
Semiconductors & Semiconductor Equipment—1.9% | |
| |
Applied Materials, Inc. | | | 349,710 | | | | 17,877,175 | |
| |
Maxim Integrated Products, Inc. | | | 144,800 | | | | 7,570,144 | |
| | | | | | | | |
| | | | | | | 25,447,319 | |
7 OPPENHEIMER MAIN STREET FUND/VA
STATEMENT OF INVESTMENTS Continued
| | | | | | | | |
| | | Shares | | | Value | |
| |
Technology Hardware, Storage & Peripherals—6.5% | |
| |
Apple, Inc. | | | 453,066 | | | $ | 76,672,359 | |
| |
Western Digital Corp. | | | 139,215 | | | | 11,071,769 | |
| | | | | | | | |
| | | | | | | 87,744,128 | |
| |
Materials—3.0% | | | | | | | | |
| |
Chemicals—2.3% | | | | | | | | |
| |
DowDuPont, Inc. | | | 197,107 | | | | 14,037,961 | |
| |
PPG Industries, Inc. | | | 142,420 | | | | 16,637,504 | |
| | | | | | | | |
| | | | | | | 30,675,465 | |
| |
Construction Materials—0.7% | | | | | | | | |
| |
Vulcan Materials Co. | | | 77,140 | | | | 9,902,462 | |
| |
Telecommunication Services—1.9% | | | | | | | | |
| |
Diversified Telecommunication Services—1.9% | |
| |
| Verizon Communications, Inc. | | | 471,935 | | | | 24,979,519 | |
| | | | | | | | |
| | | Shares | | | Value | |
| |
Utilities—2.1% | | | | | | | | |
| |
Electric Utilities—1.0% | | | | | | | | |
| |
PG&E Corp. | | | 305,020 | | | $ | 13,674,047 | |
| |
Multi-Utilities—1.1% | | | | | | | | |
| |
National Grid plc | | | 1,296,690 | | | | 15,232,204 | |
| | | | | | | | |
| Total Common Stocks (Cost $905,140,531) | | | | | | | 1,326,305,692 | |
| | |
| | | | | | | | |
| |
Investment Company—1.4% | | | | | | | | |
| |
Oppenheimer Institutional Government Money Market Fund, Cl. E, 1.22%3,4 (Cost $19,085,774) | | | 19,085,774 | | | | 19,085,774 | |
| |
| Total Investments, at Value (Cost $924,226,305) | | | 99.9 | % | | | 1,345,391,466 | |
| |
Net Other Assets (Liabilities) | | | 0.1 | | | | 1,542,175 | |
| | | | |
Net Assets | | | 100.0 | % | | $ | 1,346,933,641 | |
| | | | |
Footnotes to Statement of Investments
1. Non-income producing security.
2. Security is a Master Limited Partnership.
3. Rate shown is the 7-day yield at period end.
4. Is or was an affiliate, as defined in the Investment Company Act of 1940, as amended, at or during the reporting period, by virtue of the Fund owning at least 5% of the voting securities of the issuer or as a result of the Fund and the issuer having the same investment adviser. Transactions during the reporting period in which the issuer was an affiliate are as follows:
| | | | | | | | | | | | | | | | |
| | | Shares
December 31, 2016 | | | Gross Additions | | | Gross Reductions | | | Shares
December 31, 2017 | |
Oppenheimer Institutional Government Money Market Fund, Cl. E | | | 11,146,627 | | | | 259,690,919 | | | | 251,751,772 | | | | 19,085,774 | |
| | | | |
| | | Value | | | Income | | | Realized Gain (Loss) | | | Change in Unrealized
Gain (Loss) | |
Oppenheimer Institutional Government Money Market Fund, Cl. E | | $ | 19,085,774 | | | $ | 174,107 | | | $ | — | | | $ | — | |
See accompanying Notes to Financial Statements.
8 OPPENHEIMER MAIN STREET FUND/VA
STATEMENT OF ASSETS AND LIABILITIES December 31, 2017
| | | | |
| |
Assets | | | | |
Investments, at value—see accompanying statement of investments: | | | | |
Unaffiliated companies (cost $905,140,531) | | $ | 1,326,305,692 | |
Affiliated companies (cost $19,085,774) | | | 19,085,774 | |
| | | | |
| | | 1,345,391,466 | |
| |
Cash | | | 751,616 | |
| |
Receivables and other assets: | | | | |
Dividends | | | 2,661,998 | |
Investments sold | | | 1,028,334 | |
Shares of beneficial interest sold | | | 385,084 | |
Other | �� | | 141,596 | |
| | | | |
Total assets | | | 1,350,360,094 | |
| |
Liabilities | | | | |
Payables and other liabilities: | | | | |
Investments purchased | | | 2,327,780 | |
Shares of beneficial interest redeemed | | | 708,136 | |
Distribution and service plan fees | | | 168,093 | |
Trustees’ compensation | | | 125,652 | |
Shareholder communications | | | 47,387 | |
Other | | | 49,405 | |
| | | | |
Total liabilities | | | 3,426,453 | |
| |
Net Assets | | $ | 1,346,933,641 | |
| | | | |
| | | | |
| |
Composition of Net Assets | | | | |
Par value of shares of beneficial interest | | $ | 42,022 | |
| |
Additional paid-in capital | | | 802,733,819 | |
| |
Accumulated net investment income | | | 11,535,135 | |
| |
Accumulated net realized gain on investments and foreign currency transactions | | | 111,461,873 | |
| |
Net unrealized appreciation on investments and translation of assets and liabilities denominated in foreign currencies | | | 421,160,792 | |
| | | | |
Net Assets | | $ | 1,346,933,641 | |
| | | | |
| | | | |
| |
Net Asset Value Per Share | | | | |
Non-Service Shares: | | | | |
| Net asset value, redemption price per share and offering price per share (based on net assets of $561,554,490 and 17,412,554 shares of beneficial interest outstanding) | | | $32.25 | |
| |
Service Shares: | | | | |
| Net asset value, redemption price per share and offering price per share (based on net assets of $785,379,151 and 24,609,191 shares of beneficial interest outstanding) | | | $31.91 | |
See accompanying Notes to Financial Statements.
9 OPPENHEIMER MAIN STREET FUND/VA
STATEMENT OF OPERATIONS For the Year Ended December 31, 2017
| | | | |
Investment Income | | | | |
Dividends: | | | | |
Unaffiliated companies (net of foreign withholding taxes of $192,705) | | $ | 24,971,192 | |
Affiliated companies | | | 174,107 | |
| | | | |
Total investment income | | | 25,145,299 | |
| |
Expenses | | | | |
Management fees | | | 8,715,696 | |
| |
Distribution and service plan fees — Service shares | | | 1,970,256 | |
| |
Transfer and shareholder servicing agent fees: | | | | |
Non-Service shares | | | 535,481 | |
Service shares | | | 787,915 | |
| |
Shareholder communications: | | | | |
Non-Service shares | | | 54,320 | |
Service shares | | | 80,041 | |
| |
Trustees’ compensation | | | 45,096 | |
| |
Borrowing fees | | | 35,837 | |
| |
Custodian fees and expenses | | | 9,172 | |
| |
Other | | | 108,874 | |
| | | | |
Total expenses | | | 12,342,688 | |
Less reduction to custodian expenses | | | (307) | |
Less waivers and reimbursements of expenses | | | (19,816) | |
| | | | |
Net expenses | | | 12,322,565 | |
| |
Net Investment Income | | | 12,822,734 | |
| |
Realized and Unrealized Gain (Loss) | | | | |
Net realized gain (loss) on: | | | | |
Investment transactions in unaffiliated companies | | | 121,851,005 | |
Foreign currency transactions | | | (10,983) | |
| | | | |
Net realized gain | | | 121,840,022 | |
| |
Net change in unrealized appreciation/depreciation on: | | | | |
Investment transactions in unaffiliated companies | | | 68,958,567 | |
Translation of assets and liabilities denominated in foreign currencies | | | 13,308 | |
| | | | |
Net change in unrealized appreciation/depreciation | | | 68,971,875 | |
| |
Net Increase in Net Assets Resulting from Operations | | $ | 203,634,631 | |
| | | | |
See accompanying Notes to Financial Statements.
10 OPPENHEIMER MAIN STREET FUND/VA
STATEMENTS OF CHANGES IN NET ASSETS
| | | | | | | | |
| | | Year Ended
December 31, 2017 | | | Year Ended December 31, 2016 | |
| |
Operations | | | | | | | | |
Net investment income | | $ | 12,822,734 | | | $ | 12,636,575 | |
| |
Net realized gain | | | 121,840,022 | | | | 29,438,205 | |
| |
Net change in unrealized appreciation/depreciation | | | 68,971,875 | | | | 88,749,651 | |
| | | | |
Net increase in net assets resulting from operations | | | 203,634,631 | | | | 130,824,431 | |
| |
Dividends and/or Distributions to Shareholders | | | | | | | | |
Dividends from net investment income: | | | | | | | | |
Non-Service shares | | | (6,687,663) | | | | (5,704,267) | |
Service shares | | | (8,150,647) | | | | (6,065,396) | |
| | | | |
| | | (14,838,310) | | | | (11,769,663) | |
| |
Distributions from net realized gain: | | | | | | | | |
Non-Service shares | | | (8,972,517) | | | | (60,632,295) | |
Service shares | | | (13,368,399) | | | | (84,601,632) | |
| | | | |
| | | (22,340,916) | | | | (145,233,927) | |
| |
Beneficial Interest Transactions | | | | | | | | |
Net increase (decrease) in net assets resulting from beneficial interest transactions: | | | | | | | | |
Non-Service shares | | | 9,551,567 | | | | (20,488,952) | |
Service shares | | | (86,863,753) | | | | 70,674,306 | |
| | | | |
| | | (77,312,186) | | | | 50,185,354 | |
| |
Net Assets | | | | | | | | |
Total increase | | | 89,143,219 | | | | 24,006,195 | |
| |
Beginning of period | | | 1,257,790,422 | | | | 1,233,784,227 | |
| | | | |
End of period (including accumulated net investment income of $11,535,135 and $12,234,256, respectively) | | $ | 1,346,933,641 | | | $ | 1,257,790,422 | |
| | | | |
See accompanying Notes to Financial Statements.
11 OPPENHEIMER MAIN STREET FUND/VA
FINANCIAL HIGHLIGHTS
| | | | | | | | | | | | | | | | | | | | |
| Non-Service Shares | | Year Ended
December 31,
2017 | | | Year Ended
December 31,
2016 | | | Year Ended
December 31,
2015 | | | Year Ended
December 31,
2014 | | | Year Ended
December 31,
2013 | |
Per Share Operating Data | | | | | | | | | | | | | | | | | | | | |
Net asset value, beginning of period | | | $28.41 | | | | $29.24 | | | | $33.61 | | | | $31.24 | | | | $23.97 | |
Income (loss) from investment operations: | | | | | | | | | | | | | | | | | | | | |
Net investment income1 | | | 0.34 | | | | 0.33 | | | | 0.33 | | | | 0.28 | | | | 0.24 | |
Net realized and unrealized gain | | | 4.41 | | | | 2.76 | | | | 0.80 | | | | 3.01 | | | | 7.33 | |
| | | | |
Total from investment operations | | | 4.75 | | | | 3.09 | | | | 1.13 | | | | 3.29 | | | | 7.57 | |
Dividends and/or distributions to shareholders: | | | | | | | | | | | | | | | | | | | | |
Dividends from net investment income | | | (0.39) | | | | (0.34) | | | | (0.32) | | | | (0.27) | | | | (0.30) | |
Distributions from net realized gain | | | (0.52) | | | | (3.58) | | | | (5.18) | | | | (0.65) | | | | 0.00 | |
| | | | |
Total dividends and/or distributions to shareholders | | | (0.91) | | | | (3.92) | | | | (5.50) | | | | (0.92) | | | | (0.30) | |
Net asset value, end of period | | | $32.25 | | | | $28.41 | | | | $29.24 | | | | $33.61 | | | | $31.24 | |
| | | | |
| | | | | | | | | | | | | | | | | | | | |
| |
Total Return, at Net Asset Value2 | | | 16.91% | | | | 11.62% | | | | 3.33% | | | | 10.70% | | | | 31.77% | |
| | | | | | | | | | | | | | | | | | | | |
| |
Ratios/Supplemental Data | | | | | | | | | | | | | | | | | | | | |
Net assets, end of period (in thousands) | | | $561,555 | | | | $485,196 | | | | $518,456 | | | | $559,933 | | | | $561,016 | |
Average net assets (in thousands) | | | $535,770 | | | | $502,522 | | | | $541,020 | | | | $554,449 | | | | $517,750 | |
Ratios to average net assets:3 | | | | | | | | | | | | | | | | | | | | |
Net investment income | | | 1.12% | | | | 1.16% | | | | 1.05% | | | | 0.86% | | | | 0.87% | |
Expenses excluding specific expenses listed below | | | 0.78% | | | | 0.79% | | | | 0.78% | | | | 0.77% | | | | 0.78% | |
Interest and fees from borrowings | | | 0.00%4 | | | | 0.00%4 | | | | 0.00%4 | | | | 0.00% | | | | 0.00% | |
| | | | |
Total expenses5 | | | 0.78% | | | | 0.79% | | | | 0.78% | | | | 0.77% | | | | 0.78% | |
Expenses after payments, waivers and/or reimbursements and reduction to custodian expenses | | | 0.78%6 | | | | 0.79%6 | | | | 0.78%6 | | | | 0.77%6 | | | | 0.78%6 | |
Portfolio turnover rate | | | 35% | | | | 33% | | | | 44% | | | | 43% | | | | 49% | |
1. Per share amounts calculated based on the average shares outstanding during the period.
2. Assumes an initial investment on the business day before the first day of the fiscal period, with all dividends and distributions reinvested in additional shares on the reinvestment date, and redemption at the net asset value calculated on the last business day of the fiscal period. Total returns are not annualized for periods less than one full year. Total return information does not reflect expenses that apply at the separate account level or to related insurance products. Inclusion of these charges would reduce the total return figures for all periods shown. Returns do not reflect the deduction of taxes that a shareholder would pay on fund distributions or the redemption of fund shares.
3. Annualized for periods less than one full year.
4. Less than 0.005%.
5. Total expenses including indirect expenses from affiliated fund fees and expenses were as follows:
| | | | |
Year Ended December 31, 2017 | | | 0.78 | % |
Year Ended December 31, 2016 | | | 0.79 | % |
Year Ended December 31, 2015 | | | 0.78 | % |
Year Ended December 31, 2014 | | | 0.77 | % |
Year Ended December 31, 2013 | | | 0.78 | % |
6. Waiver was less than 0.005%.
See accompanying Notes to Financial Statements.
12 OPPENHEIMER MAIN STREET FUND/VA
| | | | | | | | | | | | | | | | | | | | |
Service Shares | |
| Year Ended
December 31,
2017 |
| |
| Year Ended
December 31,
2016 |
| |
| Year Ended
December 31,
2015 |
| |
| Year Ended
December 31,
2014 |
| |
| Year Ended
December 31,
2013 |
|
| |
Per Share Operating Data | | | | | | | | | | | | | | | | | | | | |
Net asset value, beginning of period | | | $28.12 | | | | $28.98 | | | | $33.33 | | | | $30.99 | | | | $23.78 | |
Income (loss) from investment operations: | | | | | | | | | | | | | | | | | | | | |
Net investment income1 | | | 0.26 | | | | 0.26 | | | | 0.25 | | | | 0.19 | | | | 0.17 | |
Net realized and unrealized gain | | | 4.37 | | | | 2.72 | | | | 0.80 | | | | 2.99 | | | | 7.27 | |
| | | | |
Total from investment operations | | | 4.63 | | | | 2.98 | | | | 1.05 | | | | 3.18 | | | | 7.44 | |
Dividends and/or distributions to shareholders: | | | | | | | | | | | | | | | | | | | | |
Dividends from net investment income | | | (0.32) | | | | (0.26) | | | | (0.22) | | | | (0.19) | | | | (0.23) | |
Distributions from net realized gain | | | (0.52) | | | | (3.58) | | | | (5.18) | | | | (0.65) | | | | 0.00 | |
| | | | |
Total dividends and/or distributions to shareholders | | | (0.84) | | | | (3.84) | | | | (5.40) | | | | (0.84) | | | | (0.23) | |
Net asset value, end of period | | | $31.91 | | | | $28.12 | | | | $28.98 | | | | $33.33 | | | | $30.99 | |
| | | | |
| | | | | | | | | | | | | | | | | | | | |
| |
Total Return, at Net Asset Value2 | | | 16.63% | | | | 11.30% | | | | 3.11% | | | | 10.40% | | | | 31.44% | |
| | | | | | | | | | | | | | | | | | | | |
| |
Ratios/Supplemental Data | | | | | | | | | | | | | | | | | | | | |
Net assets, end of period (in thousands) | | | $785,379 | | | | $772,594 | | | | $715,328 | | | | $806,023 | | | | $915,027 | |
Average net assets (in thousands) | | | $788,342 | | | | $725,836 | | | | $757,218 | | | | $856,467 | | | | $895,073 | |
Ratios to average net assets:3 | | | | | | | | | | | | | | | | | | | | |
Net investment income | | | 0.87% | | | | 0.94% | | | | 0.80% | | | | 0.61% | | | | 0.62% | |
Expenses excluding specific expenses listed below | | | 1.03% | | | | 1.04% | | | | 1.03% | | | | 1.02% | | | | 1.04% | |
Interest and fees from borrowings | | | 0.00%4 | | | | 0.00%4 | | | | 0.00%4 | | | | 0.00% | | | | 0.00% | |
| | | | |
Total expenses5 | | | 1.03% | | | | 1.04% | | | | 1.03% | | | | 1.02% | | | | 1.04% | |
Expenses after payments, waivers and/or reimbursements and reduction to custodian expenses | | | 1.03%6 | | | | 1.04%6 | | | | 1.03%6 | | | | 1.02%6 | | | | 1.04%6 | |
Portfolio turnover rate | | | 35% | | | | 33% | | | | 44% | | | | 43% | | | | 49% | |
1. Per share amounts calculated based on the average shares outstanding during the period.
2. Assumes an initial investment on the business day before the first day of the fiscal period, with all dividends and distributions reinvested in additional shares on the reinvestment date, and redemption at the net asset value calculated on the last business day of the fiscal period. Total returns are not annualized for periods less than one full year. Total return information does not reflect expenses that apply at the separate account level or to related insurance products. Inclusion of these charges would reduce the total return figures for all periods shown. Returns do not reflect the deduction of taxes that a shareholder would pay on fund distributions or the redemption of fund shares.
3. Annualized for periods less than one full year.
4. Less than 0.005%.
5. Total expenses including indirect expenses from affiliated fund fees and expenses were as follows:
| | | | |
Year Ended December 31, 2017 | | | 1.03 | % |
Year Ended December 31, 2016 | | | 1.04 | % |
Year Ended December 31, 2015 | | | 1.03 | % |
Year Ended December 31, 2014 | | | 1.02 | % |
Year Ended December 31, 2013 | | | 1.04 | % |
6. Waiver was less than 0.005%.
See accompanying Notes to Financial Statements.
13 OPPENHEIMER MAIN STREET FUND/VA
NOTES TO FINANCIAL STATEMENTS December 31, 2017
1. Organization
Oppenheimer Main Street Fund/VA (the “Fund”), a separate series of Oppenheimer Variable Account Funds, is a diversified open-end management investment company registered under the Investment Company Act of 1940 (“1940 Act”), as amended. The Fund’s investment objective is to seek capital appreciation. The Fund’s investment adviser is OFI Global Asset Management, Inc. (“OFI Global” or the “Manager”), a wholly-owned subsidiary of OppenheimerFunds, Inc. (“OFI” or the “Sub-Adviser”). The Manager has entered into a sub-advisory agreement with OFI. Shares of the Fund are sold only to separate accounts of life insurance companies.
The Fund offers two classes of shares. Both classes are sold at their offering price, which is the net asset value per share, to separate investment accounts of participating insurance companies as an underlying investment for variable life insurance policies, variable annuity contracts or other investment products. The class of shares designated as Service shares is subject to a distribution and service plan. Both classes of shares have identical rights and voting privileges with respect to the Fund in general and exclusive voting rights on matters that affect that class alone. Earnings, net assets and net asset value per share may differ due to each class having its own expenses, such as transfer and shareholder servicing agent fees and shareholder communications, directly attributable to that class.
The following is a summary of significant accounting policies followed in the Fund’s preparation of financial statements in accordance with accounting principles generally accepted in the United States (“U.S. GAAP”).
2. Significant Accounting Policies
Security Valuation. All investments in securities are recorded at their estimated fair value, as described in Note 3.
Foreign Currency Translation. The books and records of the Fund are maintained in U.S. dollars. Any foreign currency amounts are translated into U.S. dollars on the following basis:
(1) Value of investment securities, other assets and liabilities — at the exchange rates prevailing at Market Close as described in Note 3.
(2) Purchases and sales of investment securities, income and expenses — at the rates of exchange prevailing on the respective dates of such transactions.
Although the net assets and the values are presented at the foreign exchange rates at Market Close, the Fund does not isolate the portion of the results of operations resulting from changes in foreign exchange rates on investments from the fluctuations arising from changes in prices of securities held. Such fluctuations are included with the net realized and unrealized gains or losses from investments shown in the Statement of Operations.
For securities, which are subject to foreign withholding tax upon disposition, realized gains or losses on such securities are recorded net of foreign withholding tax.
Reported net realized foreign exchange gains or losses arise from sales of foreign currencies, currency gains or losses realized between the trade and settlement dates on securities transactions, the difference between the amounts of dividends, interest, and foreign withholding tax reclaims recorded on the Fund’s books, and the U.S. dollar equivalent of the amounts actually received or paid. Net unrealized foreign exchange gains and losses arise from changes in the value of assets and liabilities other than investments in securities, resulting from changes in the exchange rate.
Allocation of Income, Expenses, Gains and Losses. Income, expenses (other than those attributable to a specific class), gains and losses are allocated on a daily basis to each class of shares based upon the relative proportion of net assets represented by such class. Operating expenses directly attributable to a specific class are charged against the operations of that class.
Dividends and Distributions to Shareholders. Dividends and distributions to shareholders, which are determined in accordance with income tax regulations and may differ from U.S. GAAP, are recorded on the ex-dividend date. Income and capital gain distributions, if any, are declared and paid annually or at other times as determined necessary by the Manager.
Investment Income. Dividend income is recorded on the ex-dividend date or upon ex-dividend notification in the case of certain foreign dividends where the ex-dividend date may have passed. Non-cash dividends included in dividend income, if any, are recorded at the fair value of the securities received. Withholding taxes on foreign dividends, if any, and capital gains taxes on foreign investments, if any, have been provided for in accordance with the Fund’s understanding of the applicable tax rules and regulations. Interest income, if any, is recognized on an accrual basis. Discount and premium, which are included in interest income on the Statement of Operations, are amortized or accreted daily.
Return of Capital Estimates. Distributions received from the Fund’s investments in Master Limited Partnerships (MLPs) and Real Estate Investments Trusts (REITs), generally are comprised of income and return of capital. The Fund records investment income and return of capital based on estimates. Such estimates are based on historical information available from each MLP, REIT and other industry sources. These estimates may subsequently be revised based on information received from MLPs and REITs after their tax reporting periods are concluded.
Custodian Fees. “Custodian fees and expenses” in the Statement of Operations may include interest expense incurred by the Fund on any cash overdrafts of its custodian account during the period. Such cash overdrafts may result from the effects of failed trades in portfolio securities and from cash outflows resulting from unanticipated shareholder redemption activity. The Fund pays interest to its custodian on such cash overdrafts, to the extent they are not offset by positive cash balances maintained by the Fund, at a rate equal to the Federal Funds Rate plus 2.00%. The “Reduction to custodian expenses” line item, if applicable, represents earnings on cash balances maintained by the Fund during the period. Such interest expense and other custodian fees may be paid with these earnings.
14 OPPENHEIMER MAIN STREET FUND/VA
2. Significant Accounting Policies (Continued)
Security Transactions. Security transactions are recorded on the trade date. Realized gains and losses on securities sold are determined on the basis of identified cost.
Indemnifications. The Fund’s organizational documents provide current and former Trustees and officers with a limited indemnification against liabilities arising in connection with the performance of their duties to the Fund. In the normal course of business, the Fund may also enter into contracts that provide general indemnifications. The Fund’s maximum exposure under these arrangements is unknown as this would be dependent on future claims that may be made against the Fund. The risk of material loss from such claims is considered remote.
Federal Taxes. The Fund intends to comply with provisions of the Internal Revenue Code applicable to regulated investment companies and to distribute substantially all of its investment company taxable income, including any net realized gain on investments not offset by capital loss carryforwards, if any, to shareholders. Therefore, no federal income or excise tax provision is required. The Fund files income tax returns in U.S. federal and applicable state jurisdictions. The statute of limitations on the Fund’s tax return filings generally remains open for the three preceding fiscal reporting period ends. The Fund has analyzed its tax positions for the fiscal year ended December 31, 2017, including open tax years, and does not believe there are any uncertain tax positions requiring recognition in the Fund’s financial statements.
The tax components of capital shown in the following table represent distribution requirements the Fund must satisfy under the income tax regulations, losses the Fund may be able to offset against income and gains realized in future years and unrealized appreciation or depreciation of securities and other investments for federal income tax purposes.
| | | | | | | | | | | | |
Undistributed Net Investment Income | | Undistributed
Long-Term
Gain | | | Accumulated
Loss
Carryforward1,2,3,4 | | | Net Unrealized
Appreciation
Based on cost of
Securities and
Other Investments
for Federal Income
Tax Purposes | |
$27,437,720 | | | $96,895,473 | | | | $21,074 | | | | $419,971,326 | |
1. At period end, the Fund had $16,688 of net capital loss carryforward available to offset future realized capital gains, if any, and thereby reduce future taxable gain distributions. Details of the capital loss carryforwards are included in the table below. Capital loss carryovers with no expiration, if any, must be utilized prior to those with expiration dates.
| | | | |
| Expiring | |
No expiration | | $ | 16,688 | |
Of these losses, $16,688 are subject to loss limitation rules resulting from merger activity. These limitations generally reduce the utilization of these losses to a maximum of $163,657 per year.
2. The Fund had $4,386 of straddle losses which were deferred.
3. During the reporting period, the Fund utilized $109,852 of capital loss carryforward to offset capital gains realized in that fiscal year.
4. During the previous reporting period, the Fund utilized $2,513,988 of capital loss carryforward to offset capital gains realized in that fiscal year.
Net investment income (loss) and net realized gain (loss) may differ for financial statement and tax purposes. The character of dividends and distributions made during the fiscal year from net investment income or net realized gains are determined in accordance with federal income tax requirements, which may differ from the character of net investment income or net realized gains presented in those financial statements in accordance with U.S. GAAP. Also, due to timing of dividends and distributions, the fiscal year in which amounts are distributed may differ from the fiscal year in which the income or net realized gain was recorded by the Fund.
Accordingly, the following amounts have been reclassified for the reporting period. Net assets of the Fund were unaffected by the reclassifications.
| | | | | | | | |
Increase to Paid-in Capital | | Increase
to Accumulated
Net Investment
Income | | | Reduction
to Accumulated Net
Realized Gain
on Investments5 | |
$9,349,839 | | | $1,316,455 | | | | $10,666,294 | |
5. $9,248,917, including $8,033,218 of long-term capital gain, was distributed in connection with Fund share redemptions.
The tax character of distributions paid during the reporting periods:
| | | | | | | | |
| | | Year Ended
December 31, 2017 | | | Year Ended
December 31, 2016 | |
Distributions paid from: | | | | | | | | |
Ordinary income | | $ | 14,838,310 | | | $ | 16,035,719 | |
Long-term capital gain | | | 22,340,916 | | | | 140,967,871 | |
| | | | |
Total | | $ | 37,179,226 | | | $ | 157,003,590 | |
| | | | |
15 OPPENHEIMER MAIN STREET FUND/VA
NOTES TO FINANCIAL STATEMENTS Continued
2. Significant Accounting Policies (Continued)
The aggregate cost of securities and other investments and the composition of unrealized appreciation and depreciation of securities and other investments for federal income tax purposes at period end are noted in the following table. The primary difference between book and tax appreciation or depreciation of securities and other investments, if applicable, is attributable to the tax deferral of losses or tax realization of financial statement unrealized gain or loss.
| | | | |
Federal tax cost of securities | | $ | 925,415,771 | |
| | | | |
Gross unrealized appreciation | | $ | 446,198,069 | |
Gross unrealized depreciation | | | (26,226,743) | |
| | | | |
Net unrealized appreciation | | $ | 419,971,326 | |
| | | | |
Use of Estimates. The preparation of financial statements in conformity with U.S. GAAP requires management to make estimates and assumptions that affect the reported amounts of assets and liabilities and disclosure of contingent assets and liabilities at the date of the financial statements and the reported amounts of increases and decreases in net assets from operations during the reporting period. Actual results could differ from those estimates.
3. Securities Valuation
The Fund calculates the net asset value of its shares as of 4:00 P.M. Eastern time, on each day the New York Stock Exchange (the “Exchange”) is open for trading, except in the case of a scheduled early closing of the Exchange, in which case the Fund will calculate net asset value of the shares as of the scheduled early closing time of the Exchange.
The Fund’s Board has adopted procedures for the valuation of the Fund’s securities and has delegated the day-to-day responsibility for valuation determinations under those procedures to the Manager. The Manager has established a Valuation Committee which is responsible for determining a fair valuation for any security for which market quotations are not readily available. The Valuation Committee’s fair valuation determinations are subject to review, approval and ratification by the Fund’s Board at least quarterly or more frequently, if necessary.
Valuation Methods and Inputs
Securities are valued primarily using unadjusted quoted market prices, when available, as supplied by third party pricing services or broker-dealers.
The following methodologies are used to determine the market value or the fair value of the types of securities described below:
Equity securities traded on a securities exchange (including exchange-traded derivatives other than futures and futures options) are valued based on the official closing price on the principal exchange on which the security is traded, as identified by the Manager, prior to the time when the Fund’s assets are valued. If the official closing price is unavailable, the security is valued at the last sale price on the principal exchange on which it is traded, or if no sales occurred, the security is valued at the mean between the quoted bid and asked prices. Over-the-counter equity securities are valued at the last published sale price, or if no sales occurred, at the mean between the quoted bid and asked prices. Events occurring after the close of trading on foreign exchanges may result in adjustments to the valuation of foreign securities to more accurately reflect their fair value as of the time when the Fund’s assets are valued.
Shares of a registered investment company that are not traded on an exchange are valued at that investment company’s net asset value per share.
Securities for which market quotations are not readily available, or when a significant event has occurred that would materially affect the value of the security, are fair valued either (i) by a standardized fair valuation methodology applicable to the security type or the significant event as previously approved by the Valuation Committee and the Fund’s Board or (ii) as determined in good faith by the Manager’s Valuation Committee. The Valuation Committee considers all relevant facts that are reasonably available, through either public information or information available to the Manager, when determining the fair value of a security. Those standardized fair valuation methodologies include, but are not limited to, valuing securities at the last sale price or initially at cost and subsequently adjusting the value based on: changes in company specific fundamentals, changes in an appropriate securities index, or changes in the value of similar securities which may be further adjusted for any discounts related to security-specific resale restrictions. When possible, such methodologies use observable market inputs such as unadjusted quoted prices of similar securities, observable interest rates, currency rates and yield curves. The methodologies used for valuing securities are not necessarily an indication of the risks associated with investing in those securities nor can it be assured that the Fund can obtain the fair value assigned to a security if it were to sell the security.
Classifications
Each investment asset or liability of the Fund is assigned a level at measurement date based on the significance and source of the inputs to its valuation. Various data inputs may be used in determining the value of each of the Fund’s investments as of the reporting period end. These data inputs are categorized in the following hierarchy under applicable financial accounting standards:
1) Level 1-unadjusted quoted prices in active markets for identical assets or liabilities (including securities actively traded on a securities exchange)
2) Level 2-inputs other than unadjusted quoted prices that are observable for the asset or liability (such as unadjusted quoted prices for similar assets and market corroborated inputs such as interest rates, prepayment speeds, credit risks, etc.)
3) Level 3-significant unobservable inputs (including the Manager’s own judgments about assumptions that market participants would use in pricing the asset or liability).
The inputs used for valuing securities are not necessarily an indication of the risks associated with investing in those securities.
The Fund classifies each of its investments in investment companies which are publicly offered as Level 1. Investment companies that are not publicly
16 OPPENHEIMER MAIN STREET FUND/VA
3. Securities Valuation (Continued)
offered, if any, are classified as Level 2 in the fair value hierarchy.
The table below categorizes amounts that are included in the Fund’s Statement of Assets and Liabilities at period end based on valuation input level:
| | | | | | | | | | | | | | | | |
| | | Level 1— Unadjusted
Quoted Prices | | | Level 2—
Other Significant
Observable Inputs | | | Level 3—
Significant
Unobservable
Inputs | | | Value | |
| |
Assets Table | | | | | | | | | | | | | | | | |
Investments, at Value: | | | | | | | | | | | | | | | | |
Common Stocks | | | | | | | | | | | | | | | | |
Consumer Discretionary | | $ | 154,789,958 | | | $ | — | | | $ | — | | | $ | 154,789,958 | |
Consumer Staples | | | 107,049,081 | | | | — | | | | — | | | | 107,049,081 | |
Energy | | | 77,654,256 | | | | — | | | | — | | | | 77,654,256 | |
Financials | | | 283,054,091 | | | | — | | | | — | | | | 283,054,091 | |
Health Care | | | 185,518,787 | | | | — | | | | — | | | | 185,518,787 | |
Industrials | | | 132,856,546 | | | | — | | | | — | | | | 132,856,546 | |
Information Technology | | | 290,919,276 | | | | — | | | | — | | | | 290,919,276 | |
Materials | | | 40,577,927 | | | | — | | | | — | | | | 40,577,927 | |
Telecommunication Services | | | 24,979,519 | | | | — | | | | — | | | | 24,979,519 | |
Utilities | | | 13,674,047 | | | | 15,232,204 | | | | — | | | | 28,906,251 | |
Investment Company | | | 19,085,774 | | | | — | | | | — | | | | 19,085,774 | |
| | | | |
Total Assets | | $ | 1,330,159,262 | | | $ | 15,232,204 | | | $ | — | | | $ | 1,345,391,466 | |
| | | | |
Forward currency exchange contracts and futures contracts, if any, are reported at their unrealized appreciation/depreciation at measurement date, which represents the change in the contract’s value from trade date. All additional assets and liabilities included in the above table are reported at their market value at measurement date.
4. Investments and Risks
Investments in Affiliated Funds. The Fund is permitted to invest in other mutual funds advised by the Manager (“Affiliated Funds”). Affiliated Funds are open-end management investment companies registered under the 1940 Act, as amended. The Manager is the investment adviser of, and the Sub-Adviser provides investment and related advisory services to, the Affiliated Funds. When applicable, the Fund’s investments in Affiliated Funds are included in the Statement of Investments. Shares of Affiliated Funds are valued at their net asset value per share. As a shareholder, the Fund is subject to its proportional share of the Affiliated Funds’ expenses, including their management fee. The Manager will waive fees and/or reimburse Fund expenses in an amount equal to the indirect management fees incurred through the Fund’s investment in the Affiliated Funds.
Each of the Affiliated Funds in which the Fund invests has its own investment risks, and those risks can affect the value of the Fund’s investments and therefore the value of the Fund’s shares. To the extent that the Fund invests more of its assets in one Affiliated Fund than in another, the Fund will have greater exposure to the risks of that Affiliated Fund.
Investments in Money Market Instruments. The Fund is permitted to invest its free cash balances in money market instruments to provide liquidity or for defensive purposes. The Fund may invest in money market instruments by investing in Class E shares of Oppenheimer Institutional Government Money Market Fund (“IGMMF”), which is an Affiliated Fund. IGMMF is regulated as a money market fund under the 1940 Act, as amended. The Fund may also invest in money market instruments directly or in other affiliated or unaffiliated money market funds.
Master Limited Partnerships (“MLPs”). MLPs issue common units that represent an equity ownership interest in a partnership and provide limited voting rights. MLP common units are registered with the Securities and Exchange Commission (“SEC”), and are freely tradable on securities exchanges such as the NYSE and the NASDAQ Stock Market (“NASDAQ”), or in the over-the-counter (“OTC”) market. An MLP consists of one or more general partners, who conduct the business, and one or more limited partners, who contribute capital. MLP common unit holders have a limited role in the partnership’s operations and management. The Fund, as a limited partner, normally would not be liable for the debts of the MLP beyond the amounts the Fund has contributed, but would not be shielded to the same extent that a shareholder of a corporation would be. In certain circumstances creditors of an MLP would have the right to seek return of capital distributed to a limited partner. This right of an MLP’s creditors would continue after the Fund sold its investment in the MLP.
Equity Security Risk. Stocks and other equity securities fluctuate in price. The value of the Fund’s portfolio may be affected by changes in the equity markets generally. Equity markets may experience significant short-term volatility and may fall sharply at times. Different markets may behave differently from each other and U.S. equity markets may move in the opposite direction from one or more foreign stock markets. Adverse events in any part of the equity or fixed-income markets may have unexpected negative effects on other market segments.
The prices of individual equity securities generally do not all move in the same direction at the same time and a variety of factors can affect the price of a particular company’s securities. These factors may include, but are not limited to, poor earnings reports, a loss of customers, litigation against the company, general unfavorable performance of the company’s sector or industry, or changes in government regulations affecting the company or its industry.
17 OPPENHEIMER MAIN STREET FUND/VA
NOTES TO FINANCIAL STATEMENTS Continued
4. Investments and Risks (Continued)
Shareholder Concentration. At period end, one shareholder owned 20% or more of the Fund’s total outstanding shares.
5. Market Risk Factors
The Fund’s investments in securities and/or financial derivatives may expose the Fund to various market risk factors:
Commodity Risk. Commodity risk relates to the change in value of commodities or commodity indexes as they relate to increases or decreases in the commodities market. Commodities are physical assets that have tangible properties. Examples of these types of assets are crude oil, heating oil, metals, livestock, and agricultural products.
Credit Risk. Credit risk relates to the ability of the issuer of debt to meet interest and principal payments, or both, as they come due. In general, lower-grade, higher-yield debt securities are subject to credit risk to a greater extent than lower-yield, higher-quality securities.
Equity Risk. Equity risk relates to the change in value of equity securities as they relate to increases or decreases in the general market.
Foreign Exchange Rate Risk. Foreign exchange rate risk relates to the change in the U.S. dollar value of a security held that is denominated in a foreign currency. The U.S. dollar value of a foreign currency denominated security will decrease as the dollar appreciates against the currency, while the U.S. dollar value will increase as the dollar depreciates against the currency.
Interest Rate Risk. Interest rate risk refers to the fluctuations in value of fixed-income securities resulting from the inverse relationship between price and yield. For example, an increase in general interest rates will tend to reduce the market value of already issued fixed-income investments, and a decline in general interest rates will tend to increase their value. In addition, debt securities with longer maturities, which tend to have higher yields, are subject to potentially greater fluctuations in value from changes in interest rates than obligations with shorter maturities.
Volatility Risk. Volatility risk refers to the magnitude of the movement, but not the direction of the movement, in a financial instrument’s price over a defined time period. Large increases or decreases in a financial instrument’s price over a relative time period typically indicate greater volatility risk, while small increases or decreases in its price typically indicate lower volatility risk.
6. Shares of Beneficial Interest
The Fund has authorized an unlimited number of $0.001 par value shares of beneficial interest of each class. Transactions in shares of beneficial interest were as follows:
| | | | | | | | | | | | | | | | | | | | |
| | | Year Ended December 31, 2017 | | | | | | Year Ended December 31, 2016 | |
| | | Shares | | | Amount | | | | | | Shares | | | Amount | |
| |
Non-Service Shares | | | | | | | | | | | | | | | | | | | | |
Sold | | | 2,189,995 | | | $ | 66,648,162 | | | | | | | | 1,123,635 | | | $ | 31,497,254 | |
Dividends and/or distributions reinvested | | | 515,816 | | | | 15,660,180 | | | | | | | | 2,522,303 | | | | 66,336,562 | |
Acquisition—Note 10 | | | 14,913 | | | | 454,099 | | | | | | | | — | | | | — | |
Redeemed | | | (2,388,470 | ) | | | (73,210,874 | ) | | | | | | | (4,296,043 | ) | | | (118,322,768) | |
| | | | |
Net increase (decrease) | | | 332,254 | | | $ | 9,551,567 | | | | | | | | (650,105 | ) | | $ | (20,488,952) | |
| | | | |
|
| |
Service Shares | | | | | | | | | | | | | | | | | | | | |
Sold | | | 1,395,024 | | | $ | 42,024,615 | | | | | | | | 4,774,619 | | | $ | 132,212,797 | |
Dividends and/or distributions reinvested | | | 715,394 | | | | 21,519,046 | | | | | | | | 3,477,830 | | | | 90,667,028 | |
Acquisition—Note 10 | | | 244,900 | | | | 7,376,390 | | | | | | | | — | | | | — | |
Redeemed | | | (5,216,278 | ) | | | (157,783,804 | ) | | | | | | | (5,466,756 | ) | | | (152,205,519) | |
| | | | |
Net increase (decrease) | | | (2,860,960 | ) | | $ | (86,863,753 | ) | | | | | | | 2,785,693 | | | $ | 70,674,306 | |
| | | | |
7. Purchases and Sales of Securities
The aggregate cost of purchases and proceeds from sales of securities, other than short-term obligations and investments in IGMMF, for the reporting period were as follows:
| | | | | | | | | | | | |
| | | Purchases | | | | | | Sales | |
Investment securities | | $ | 461,098,565 | | | | | | | $ | 577,122,786 | |
8. Fees and Other Transactions with Affiliates
Management Fees. Under the investment advisory agreement, the Fund pays the Manager a management fee based on the daily net assets of the Fund at an annual rate as shown in the following table:
| | |
| Fee Schedule | | |
Up to $200 million | | 0.75% |
Next $200 million | | 0.72 |
Next $200 million | | 0.69 |
Next $200 million | | 0.66 |
Next $200 million | | 0.60 |
Next $4 billion | | 0.58 |
Over $5 billion | | 0.56 |
18 OPPENHEIMER MAIN STREET FUND/VA
8. Fees and Other Transactions with Affiliates (Continued)
The Fund’s effective management fee for the reporting period was 0.66% of average annual net assets before any applicable waivers.
Sub-Adviser Fees. The Manager has retained the Sub-Adviser to provide the day-to-day portfolio management of the Fund. Under the Sub-Advisory Agreement, the Manager pays the Sub-Adviser an annual fee in monthly installments, equal to a percentage of the investment management fee collected by the Manager from the Fund, which shall be calculated after any investment management fee waivers. The fee paid to the Sub-Adviser is paid by the Manager, not by the Fund.
Transfer Agent Fees. OFI Global (the “Transfer Agent”) serves as the transfer and shareholder servicing agent for the Fund. The Fund pays the Transfer Agent a fee based on annual net assets. Fees incurred and average net assets for each class with respect to these services are detailed in the Statement of Operations and Financial Highlights, respectively.
Sub-Transfer Agent Fees. The Transfer Agent has retained Shareholder Services, Inc., a wholly-owned subsidiary of OFI (the “Sub-Transfer Agent”), to provide the day-to-day transfer agent and shareholder servicing of the Fund. Under the Sub-Transfer Agency Agreement, the Transfer Agent pays the Sub-Transfer Agent an annual fee in monthly installments, equal to a percentage of the transfer agent fee collected by the Transfer Agent from the Fund, which shall be calculated after any applicable fee waivers. The fee paid to the Sub-Transfer Agent is paid by the Transfer Agent, not by the Fund.
Trustees’ Compensation. The Fund’s Board of Trustees (“Board”) has adopted a compensation deferral plan for Independent Trustees that enables Trustees to elect to defer receipt of all or a portion of the annual compensation they are entitled to receive from the Fund. For purposes of determining the amount owed to the Trustees under the plan, deferred amounts are treated as though equal dollar amounts had been invested in shares of the Fund or in other Oppenheimer funds selected by the Trustees. The Fund purchases shares of the funds selected for deferral by the Trustees in amounts equal to his or her deemed investment, resulting in a Fund asset equal to the deferred compensation liability. Such assets are included as a component of “Other” within the asset section of the Statement of Assets and Liabilities. Deferral of Trustees’ fees under the plan will not affect the net assets of the Fund and will not materially affect the Fund’s assets, liabilities or net investment income per share. Amounts will be deferred until distributed in accordance with the compensation deferral plan.
Distribution and Service Plan for Service Shares. The Fund has adopted a Distribution and Service Plan (the “Plan”) pursuant to Rule 12b-1 under the 1940 Act for Service shares to pay OppenheimerFunds Distributor, Inc. (the “Distributor”), for distribution related services, personal service and account maintenance for the Fund’s Service shares. Under the Plan, payments are made periodically at an annual rate of 0.25% of the daily net assets of Service shares of the Fund. The Distributor currently uses all of those fees to compensate sponsors of the insurance product that offers Fund shares, for providing personal service and maintenance of accounts of their variable contract owners that hold Service shares. These fees are paid out of the Fund’s assets on an on-going basis and increase operating expenses of the Service shares, which results in lower performance compared to the Fund’s shares that are not subject to a service fee. Fees incurred by the Fund under the Plan are detailed in the Statement of Operations.
Waivers and Reimbursements of Expenses. Prior to May 1, 2017, the Fund was subject to an expense limitation wherein the Fund’s expenses after payments, waivers and/or reimbursements and reduction to custodian expenses, excluding any applicable dividend expense, taxes, interest and fees from borrowing, any subsidiary expenses, Acquired Fund Fees and Expenses, brokerage commissions, unusual and infrequent expenses and certain other Fund expenses, as percentages of daily net assets, would not exceed the annual rate of 0.80% for Non-Service shares and 1.05% for Service shares. Effective May 1, 2017, this expense limitation has been removed.
The Manager will waive fees and/or reimburse Fund expenses in an amount equal to the indirect management fees incurred through the Fund’s investment in IGMMF. During the reporting period, the Manager waived fees and/or reimbursed the Fund $19,816 for IGMMF management fees. This fee waiver and/or expense reimbursement may not be amended or withdrawn for one year from the date of the Fund’s prospectus, unless approved by the Board.
9. Borrowings and Other Financing
Joint Credit Facility. A number of mutual funds managed by the Manager participate in a $1.875 billion revolving credit facility (the “Facility”) intended to provide short-term financing, if necessary, subject to certain restrictions in connection with atypical redemption activity. Expenses and fees related to the Facility are paid by the participating funds and are disclosed separately or as other expenses on the Statement of Operations. The Fund did not utilize the Facility during the reporting period.
10. Acquisition of Oppenheimer Equity Income Fund/VA
On May 1, 2017, the Fund acquired all of the net assets of Oppenheimer Equity Income Fund/VA, pursuant to an Agreement and Plan of Reorganization approved by the Fund’s Board. The exchange qualified as a tax-free reorganization for federal income tax purposes. The purpose of this acquisition is to combine two funds with similar investment objectives, strategies and risks to allow shareholders to benefit from greater asset growth potential, as well as lowered total expenses.
Details of the merger are shown in the following table:
19 OPPENHEIMER MAIN STREET FUND/VA
NOTES TO FINANCIAL STATEMENTS Continued
10. Acquisition of Oppenheimer Equity Income Fund/VA (Continued)
| | | | | | | | | | | | | | | | |
| | | Exchange
Ratio to One
Share of the
Oppenheimer
Equity Income
Fund/VA | | | Shares of
Beneficial
Interest Issued
by the Fund | | | Value of Issued
Shares of Beneficial
Interest | | | Combined
Net Assets on
May 1, 20171 | |
Non-Service shares | | | 0.347188309 | | | | 14,913 | | | | $ 454,099 | | | $ | 522,307,311 | |
Service shares | | | 0.430279316 | | | | 244,900 | | | | 7,376,390 | | | | 789,160,812 | |
1. The net assets acquired included net unrealized appreciation of $1,182,786 and an unused capital loss carryforward of $126,540, potential utilization subject to tax limitations.
Had the merger occurred at the beginning of the reporting period, the Fund’s pro forma Statement of Operations would have been as follows (Unaudited):
| | | | |
Net investment income | | $ | 12,883,960 | |
Net gain on investments | | | 190,984,944 | |
Net increase in net assets resulting from operations | | | 203,868,904 | |
For financial reporting purposes, assets received and shares issued by the Fund were recorded at fair value; however, the tax cost basis of the investments received from Oppenheimer Equity Income Fund/VA were carried forward to align ongoing reporting of the Fund’s realized and unrealized gains and losses with amounts distributable to shareholders for tax purposes.
Because the combined investment portfolios have been managed as a single integrated portfolio since the acquisition was completed, it is not practicable to separate the amounts of revenue and earnings of Oppenheimer Equity Income Fund/VA that have been included in the Fund’s statement of operations since May 1, 2017.
20 OPPENHEIMER MAIN STREET FUND/VA
REPORT OF INDEPENDENT REGISTERED PUBLIC ACCOUNTING FIRM
To the Shareholders and Board of Trustees
Oppenheimer Variable Account Funds:
Opinion on the Financial Statements
We have audited the accompanying statement of assets and liabilities of Oppenheimer Main Street Fund/VA, a separate series of Oppenheimer Variable Account Funds, (the “Fund”), including the statement of investments, as of December 31, 2017, the related statement of operations for the year then ended, the statements of changes in net assets for each of the years in the two year period then ended, and the related notes (collectively, the “financial statements”) and the financial highlights for each of the years in the five year period then ended. In our opinion, the financial statements and financial highlights present fairly, in all material respects, the financial position of the Fund as of December 31, 2017, the results of its operations for the year then ended, the changes in its net assets for each of the years in the two year period then ended, and the financial highlights for each of the years in the five year period then ended, in conformity with U.S. generally accepted accounting principles.
Basis for Opinion
These financial statements and financial highlights are the responsibility of the Fund’s management. Our responsibility is to express an opinion on these financial statements and financial highlights based on our audits. We are a public accounting firm registered with the Public Company Accounting Oversight Board (United States) (“PCAOB”) and are required to be independent with respect to the Fund in accordance with the U.S. federal securities laws and the applicable rules and regulations of the Securities and Exchange Commission and the PCAOB.
We conducted our audits in accordance with the standards of the PCAOB. Those standards require that we plan and perform the audit to obtain reasonable assurance about whether the financial statements and financial highlights are free of material misstatement, whether due to error or fraud. Our audits included performing procedures to assess the risks of material misstatement of the financial statements and financial highlights, whether due to error or fraud, and performing procedures that respond to those risks. Such procedures included examining, on a test basis, evidence regarding the amounts and disclosures in the financial statements and financial highlights. Such procedures also included confirmation of securities owned as of December 31, 2017, by correspondence with the custodian, brokers and the transfer agent, or by other appropriate auditing procedures. Our audits also included evaluating the accounting principles used and significant estimates made by management, as well as evaluating the overall presentation of the financial statements and financial highlights. We believe that our audits provide a reasonable basis for our opinion.
KPMG LLP
We have not been able to determine the specific year that we began serving as the auditor of one or more Oppenheimer Funds investment companies, however we are aware that we have served as the auditor of one or more Oppenheimer Funds investment companies since at least 1969.
Denver, Colorado
February 13, 2018
21 OPPENHEIMER MAIN STREET FUND/VA
FEDERAL INCOME TAX INFORMATION Unaudited
In early 2018, if applicable, shareholders of record received information regarding all dividends and distributions paid to them by the Fund during calendar year 2017.
Capital gain distributions of $0.51985 per share were paid to Non-Service and Service shareholders, respectively, on June 20, 2017. Whether received in stock or in cash, the capital gain distribution should be treated by shareholders as a gain from the sale of the capital assets held for more than one year (long-term capital gains).
Dividends, if any, paid by the Fund during the reporting period which are not designated as capital gain distributions should be multiplied by the maximum amount allowable but not less than 68.27% to arrive at the amount eligible for the corporate dividend-received deduction.
The foregoing information is presented to assist shareholders in reporting distributions received from the Fund to the Internal Revenue Service. Because of the complexity of the federal regulations which may affect your individual tax return and the many variations in state and local tax regulations, we recommend that you consult your tax advisor for specific guidance.
22 OPPENHEIMER MAIN STREET FUND/VA
BOARD APPROVAL OF THE FUND’S INVESTMENT ADVISORY AND SUB-ADVISORY AGREEMENTS Unaudited
The Fund has entered into an investment advisory agreement with OFI Global Asset Management, Inc. (“OFI Global” or the “Adviser”), a wholly-owned subsidiary of OppenheimerFunds, Inc. (“OFI” or the “Sub-Adviser”) (“OFI Global” and “OFI” together, the “Managers”) and OFI Global has entered into a sub-advisory agreement with OFI whereby OFI provides investment sub-advisory services to the Fund (collectively, the “Agreements”). Each year, the Board of Trustees (the “Board”), including a majority of the independent Trustees, is required to determine whether to approve the terms of the Agreements and the renewal thereof. The Investment Company Act of 1940, as amended, requires that the Board request and evaluate, and that the Managers provide, such information as may be reasonably necessary to evaluate the terms of the Agreements. The Board employs an independent consultant to prepare a report that provides information, including comparative information that the Board requests for that purpose. In addition to in-person meetings focused on this evaluation, the Board receives information throughout the year regarding Fund services, fees, expenses and performance.
The Managers and the independent consultant provided information to the Board on the following factors: (i) the nature, quality and extent of the Managers’ services, (ii) the comparative investment performance of the Fund and the Managers, (iii) the fees and expenses of the Fund, including comparative fee and expense information, (iv) the profitability of the Managers and their affiliates, including an analysis of the cost of providing services, (v) whether economies of scale are realized as the Fund grows and whether fee levels reflect these economies of scale for Fund investors and (vi) other benefits to the Managers from their relationship with the Fund. The Board was aware that there are alternatives to retaining the Managers.
Outlined below is a summary of the principal information considered by the Board as well as the Board’s conclusions.
Nature, Quality and Extent of Services. The Board considered information about the nature, quality and extent of the services provided to the Fund and information regarding the Managers’ key personnel who provide such services. The Managers’ duties include providing the Fund with the services of the portfolio managers and the Sub-Adviser’s investment team, who provide research, analysis and other advisory services in regard to the Fund’s investments; and securities trading services. OFI Global is responsible for oversight of third-party service providers; monitoring compliance with applicable Fund policies and procedures and adherence to the Fund’s investment restrictions; risk management; and oversight of the Sub-Adviser. OFI Global is also responsible for providing certain administrative services to the Fund. Those services include providing and supervising all administrative and clerical personnel who are necessary in order to provide effective corporate administration for the Fund; compiling and maintaining records with respect to the Fund’s operations; preparing and filing reports required by the U.S. Securities and Exchange Commission; preparing periodic reports regarding the operations of the Fund for its shareholders; preparing proxy materials for shareholder meetings; and preparing the registration statements required by federal and state securities laws for the sale of the Fund’s shares. OFI Global also provides the Fund with office space, facilities and equipment.
The Board also considered the quality of the services provided and the quality of the Managers’ resources that are available to the Fund. The Board took account of the fact that the Sub-Adviser has over fifty years of experience as an investment adviser and that its assets under management rank it among the top mutual fund managers in the United States. The Board evaluated the Managers’ advisory, administrative, accounting, legal, compliance and risk management services, among other services, and information the Board has received regarding the experience and professional qualifications of the Managers’ key personnel and the size and functions of their staff. In its evaluation of the quality of the portfolio management services provided, the Board considered the experience of Manind Govil, Benjamin Ram and Paul Larson, the portfolio managers for the Fund, and the Sub-Adviser’s investment team and analysts. The Board members also considered the totality of their experiences with the Managers as directors or trustees of the Fund and other funds advised by the Managers. The Board considered information regarding the quality of services provided by affiliates of the Managers, which the Board members have become knowledgeable about through their experiences with the Managers and in connection with the review or renewal of the Fund’s service agreements or service providers. The Board concluded, in light of the Managers’ experience, reputation, personnel, operations and resources that the Fund benefits from the services provided under the Agreements.
Investment Performance of the Managers and the Fund. Throughout the year, the Managers provided information on the investment performance of the Fund, the Adviser and the Sub-Adviser, including comparative performance information. The Board also reviewed information, prepared by the Managers and by the independent consultant, comparing the Fund’s historical performance to relevant benchmarks or market indices and to the performance of other large blend category funds underlying variable insurance products. The Board considered that the Fund outperformed its performance category median during the one-, three-, five- and ten-year periods.
Fees and Expenses of the Fund. The Board reviewed the fees paid to the Adviser and the other expenses borne by the Fund. The Board noted that the Adviser, not the Fund, pays the Sub-Adviser’s fee under the sub-advisory agreement. The independent consultant provided comparative data in regard to the fees and expenses of the Fund and other large blend funds underlying variable insurance products. In reviewing the fees and expenses charged to the VA funds, the Board considered the Adviser’s assertion that, because there is much greater disparity in the fees and services that may be provided by a manager to a VA fund as opposed to a retail fund, when comparing the expenses of the various VA funds to those of retail funds, it is most appropriate to focus on total expenses (rather than on the management fees). Accordingly, while the Board reviewed and considered all expenses, it focused on total expenses. The Board considered that the Fund’s total expenses were higher than its peer group median and category median. The Board also considered that the Fund’s contractual management fee was lower than its category median and higher than its peer group median.
Economies of Scale and Profits Realized by the Managers. The Board considered information regarding the Managers’ costs in serving as the Fund’s investment adviser and sub-adviser, including the costs associated with the personnel and systems necessary to manage the Fund, and information regarding the Managers’ profitability from their relationship with the Fund. The Board also considered that the Managers must be able to pay and retain experienced professional personnel at competitive rates to provide quality services to the Fund. The Board reviewed whether the Managers may realize economies of scale in managing and supporting the Fund. The Board noted that the Fund currently has management fee breakpoints, which are intended to share with Fund shareholders economies of scale that may exist as the Fund’s assets grow.
Other Benefits to the Managers. In addition to considering the profits realized by the Managers, the Board considered information that was provided regarding the direct and indirect benefits the Managers receive as a result of their relationship with the Fund, including compensation paid to the Managers’ affiliates and research provided to the Adviser in connection with permissible brokerage arrangements (soft dollar arrangements).
23 OPPENHEIMER MAIN STREET FUND/VA
BOARD APPROVAL OF THE FUND’S INVESTMENT ADVISORY AND SUB-ADVISORY AGREEMENTS Unaudited / Continued
Conclusions. These factors were also considered by the independent Trustees meeting separately from the full Board, assisted by experienced counsel to the Fund and to the independent Trustees. Fund counsel and the independent Trustees’ counsel are independent of the Managers within the meaning and intent of the Securities and Exchange Commission rules.
Based on its review of the information it received and its evaluations described above, the Board, including a majority of the independent Trustees, decided to continue the Agreements through August 31, 2018. In arriving at its decision, the Board did not identify any factor or factors as being more important than others, but considered all of the above information, and considered the terms and conditions of the Agreements, including the management fees, in light of all the surrounding circumstances.
24 OPPENHEIMER MAIN STREET FUND/VA
PORTFOLIO PROXY VOTING POLICIES AND GUIDELINES; UPDATES TO STATEMENTS OF INVESTMENTS Unaudited
The Fund has adopted Portfolio Proxy Voting Policies and Guidelines under which the Fund votes proxies relating to securities (“portfolio proxies”) held by the Fund. A description of the Fund’s Portfolio Proxy Voting Policies and Guidelines is available (i) without charge, upon request, by calling the Fund toll-free at 1.800.CALL OPP (225.5677), (ii) on the Fund’s website at www.oppenheimerfunds.com, and (iii) on the SEC’s website at www.sec.gov. In addition, the Fund is required to file Form N-PX, with its complete proxy voting record for the 12 months ended June 30th, no later than August 31st of each year. The Fund’s voting record is available (i) without charge, upon request, by calling the Fund toll-free at 1.800.CALL OPP (225.5677), and (ii) in the Form N-PX filing on the SEC’s website at www.sec.gov.
The Fund files its complete schedule of portfolio holdings with the SEC for the first quarter and the third quarter of each fiscal year on Form N-Q. The Fund’s Form N-Q filings are available on the SEC’s website at www.sec.gov. Those forms may be reviewed and copied at the SEC’s Public Reference Room in Washington, D.C. Information on the operation of the Public Reference Room may be obtained by calling 1-800-SEC-0330.
25 OPPENHEIMER MAIN STREET FUND/VA
TRUSTEES AND OFFICERS Unaudited
| | |
|
| Name, Position(s) Held with the Fund, Length of Service, Year of Birth | | Principal Occupation(s) During the Past 5 Years; Other Trusteeships/Directorships Held; Number of Portfolios in the Fund Complex Currently Overseen |
| |
| INDEPENDENT TRUSTEES | | The address of each Trustee in the chart below is 6803 S. Tucson Way, Centennial, Colorado 80112-3924. Each Trustee serves for an indefinite term, or until his or her resignation, retirement, death or removal. |
| |
Robert J. Malone, Chairman of the Board of Trustees (since 2016), Trustee (since 2002) Year of Birth: 1944 | | Chairman - Colorado Market of MidFirst Bank (since January 2015); Chairman of the Board (2012-2016) and Director (August 2005-January 2016) of Jones International University (educational organization); Trustee of the Gallagher Family Foundation (non-profit organization) (2000-2016); Chairman, Chief Executive Officer and Director of Steele Street Bank Trust (commercial banking) (August 2003-January 2015); Director of Opera Colorado Foundation (non-profit organization) (2008-2012); Director of Colorado UpLIFT (charitable organization) (1986-2010); Director of Jones Knowledge, Inc. (2006-2010); Former Chairman of U.S. Bank-Colorado (subsidiary of U.S. Bancorp and formerly Colorado National Bank) (July 1996-April 1999); Director of Commercial Assets, Inc. (real estate investment trust) (1993-2000); Director of U.S. Exploration, Inc. (oil and gas exploration) (1997-February 2004); Chairman of the Board (1991-1994) and Trustee (1985-1994) of Regis University; and Chairman of the Board (1990-1991) and Member (1984-1999) of Young Presidents Organization. Oversees 54 portfolios in the OppenheimerFunds complex. Mr. Malone has served on the Boards of certain Oppenheimer funds since 2002, during which time he has become familiar with the Fund’s (and other Oppenheimer funds’) financial, accounting, regulatory and investment matters and has contributed to the Boards’ deliberations. |
| |
Andrew J. Donohue, Trustee (since 2017) Year of Birth: 1950 | | Of Counsel, Shearman & Sterling LLP (since September 2017); Chief of Staff of the U.S. Securities and Exchange Commission (regulator) (June 2015-February 2017); Managing Director and Investment Company General Counsel of Goldman Sachs (investment bank) (November 2012-May 2015); Partner at Morgan Lewis & Bockius, LLP (law firm) (March 2011-October 2012); Director of the Division of Investment Management of U.S. Securities and Exchange Commission (regulator) (May 2006-November 2010); Global General Counsel of Merrill Lynch Investment Managers (investment firm) (May 2003-May 2006); General Counsel (October 1991-November 2001) and Executive Vice President (January 1993-November 2001) of OppenheimerFunds, Inc. (investment firm) (June 1991-November 2001). Oversees 54 portfolios in the OppenheimerFunds complex. Mr. Donohue has served on the Boards of certain Oppenheimer funds since 2017, during which time he has become familiar with the Fund’s (and other Oppenheimer funds’) financial, accounting, regulatory and investment matters and has contributed to the Boards’ deliberations. |
| |
Jon S. Fossel, Trustee (since 1990) Year of Birth: 1942 | | Chairman of the Board of Jack Creek Preserve Foundation (non-profit organization) (2005-2015); Director of Jack Creek Preserve Foundation (non-profit organization) (since March 2005); Chairman of the Board (2006-December 2011) and Director (June 2002-December 2011) of UNUMProvident (insurance company); Director of Northwestern Energy Corp. (public utility corporation) (November 2004-December 2009); Director of P.R. Pharmaceuticals (October 1999-October 2003); Director of Rocky Mountain Elk Foundation (non-profit organization) (February 1998-February 2003 and February 2005-February 2007); Chairman and Director (until October 1996) and President and Chief Executive Officer (until October 1995) of the Sub-Adviser; President, Chief Executive Officer and Director of the following: Oppenheimer Acquisition Corp. (“OAC”) (parent holding company of the Sub-Adviser), Shareholders Services, Inc. and Shareholder Financial Services, Inc. (until October 1995). Oversees 54 portfolios in the OppenheimerFunds complex. Mr. Fossel has served on the Boards of certain Oppenheimer funds since 1990, during which time he has become familiar with the Fund’s (and other Oppenheimer funds’) financial, accounting, regulatory and investment matters and has contributed to the Boards’ deliberations. |
| |
Richard F. Grabish, Trustee (since 2012) Year of Birth: 1948 | | Formerly Senior Vice President and Assistant Director of Sales and Marketing (March 1997-December 2007), Director (March 1987-December 2007) and Manager of Private Client Services (June 1985-June 2005) of A.G. Edwards & Sons, Inc. (broker/dealer and investment firm); Chairman and Chief Executive Officer of A.G. Edwards Trust Company, FSB (March 2001-December 2007); President and Vice Chairman of A.G. Edwards Trust Company, FSB (investment adviser) (April 1987-March 2001); President of A.G. Edwards Trust Company, FSB (investment adviser) (June 2005-December 2007). Oversees 54 portfolios in the OppenheimerFunds complex. Mr. Grabish has served on the Boards of certain Oppenheimer funds since 2001, during which time he has become familiar with the Fund’s (and other Oppenheimer funds’) financial, accounting, regulatory and investment matters and has contributed to the Boards’ deliberations. |
| |
Beverly L. Hamilton, Trustee (since 2002) Year of Birth: 1946 | | Trustee of Monterey Institute for International Studies (educational organization) (2000-2014); Board Member of Middlebury College (educational organization) (December 2005-June 2011); Director (1991-2016), Vice Chairman of the Board (2006- 2009) and Chairman of the Board (2010-2013) of American Funds’ Emerging Markets Growth Fund, Inc. (mutual fund); Director of The California Endowment (philanthropic organization) (April 2002-April 2008); Director (February 2002-2005) and Chairman of Trustees (2006-2007) of the Community Hospital of Monterey Peninsula; President of ARCO Investment Management Company (February 1991-April 2000); Member of the investment committees of The Rockefeller Foundation (2001-2006) and The University of Michigan (since 2000); Advisor at Credit Suisse First Boston’s Sprout venture capital unit (venture capital fund) (1994-January 2005); Trustee of MassMutual Institutional Funds (investment company) (1996-June 2004); Trustee of MML Series Investment Fund (investment company) (April 1989-June 2004); Member of the investment committee of Hartford Hospital (2000-2003); and Advisor to Unilever (Holland) pension fund (2000-2003). Oversees 54 portfolios in the OppenheimerFunds complex. Ms. Hamilton has served on the Boards of certain Oppenheimer funds since 2002, during which time she has become familiar with the Fund’s (and other Oppenheimer funds’) financial, accounting, regulatory and investment matters and has contributed to the Boards’ deliberations. |
| |
Victoria J. Herget, Trustee (since 2012) Year of Birth:1951 | | Board Chair (2008-2015) and Director (2004-Present), United Educators (insurance company); Trustee (since 2000) and Chair (since 2010), Newberry Library (independent research library); Trustee, Mather LifeWays (senior living organization) (since 2001); Independent Director of the First American Funds (mutual fund family) (2003-2011); former Managing Director (1993-2001), Principal (1985-1993), Vice President (1978-1985) and Assistant Vice President (1973-1978) of Zurich Scudder Investments (investment adviser) (and its predecessor firms); Trustee (1992-2007), Chair of the Board of Trustees (1999-2007), Investment Committee Chair (1994-1999) and Investment Committee member (2007-2010) of Wellesley College; Trustee, BoardSource (non-profit organization) (2006-2009) and Chicago City Day School (K-8 School) (1994-2005). Oversees 54 portfolios in the OppenheimerFunds complex. Ms. Herget has served on the Boards of certain Oppenheimer funds since 2012, during which time she has become familiar with the Fund’s (and other Oppenheimer funds’) financial, accounting, regulatory and investment matters and has contributed to the Boards’ deliberations. |
26 OPPENHEIMER MAIN STREET FUND/VA
| | |
| |
F. William Marshall, Jr., Trustee (since 2000) Year of Birth: 1942 | | Trustee Emeritus of Worcester Polytech Institute (WPI) (private university) (since 2009); Trustee of MassMutual Select Funds (formerly MassMutual Institutional Funds) (investment company) (1996-2015), MML Series Investment Fund (investment company) (1996-2015) and Mass Mutual Premier Funds (investment company) (January 2012-December 2015); President and Treasurer of the SIS Charitable Fund (private charitable fund) (January 1999-March 2011); Former Trustee of WPI (1985- 2008); Former Chairman of the Board (2004-2006) and Former Chairman of the Investment Committee of WPI (1994-2008); Chairman of SIS Family Bank, F.S.B. (formerly SIS Bank) (commercial bank) (January 1999-July 1999); Executive Vice President of Peoples Heritage Financial Group, Inc. (commercial bank) (January 1999-July 1999); and Former President and Chief Executive Officer of SIS Bancorp. (1993-1999). Oversees 54 portfolios in the OppenheimerFunds complex. Mr. Marshall has served on the Boards of certain Oppenheimer funds since 2000, during which time he has become familiar with the Fund’s (and other Oppenheimer funds’) financial, accounting, regulatory and investment matters and has contributed to the Boards’ deliberations. |
| |
Karen L. Stuckey, Trustee (since 2012) Year of Birth: 1953 | | Member (since May 2015) of Desert Mountain Community Foundation Advisory Board (non-profit organization); Partner (1990-2012) of PricewaterhouseCoopers LLP (professional services firm) (held various positions 1975-1990); Trustee (1992- 2006); member of Executive, Nominating and Audit Committees and Chair of Finance Committee (1992-2006), and Emeritus Trustee (since 2006) of Lehigh University; and member, Women’s Investment Management Forum (professional organization) since inception. Oversees 54 portfolios in the OppenheimerFunds complex. Ms. Stuckey has served on the Boards of certain Oppenheimer funds since 2012, during which time she has become familiar with the Fund’s (and other Oppenheimer funds’) financial, accounting, regulatory and investment matters and has contributed to the Boards’ deliberations. |
| |
James D. Vaughn, Trustee (since 2012) Year of Birth:1945 | | Retired; former managing partner (1994-2001) of Denver office of Deloitte & Touche LLP, (held various positions 1969- 1993); Trustee and Chairman of the Audit Committee of Schroder Funds (2003-2012); Board member and Chairman of Audit Committee of AMG National Trust Bank (since 2005); Trustee and Investment Committee member, University of South Dakota Foundation (since 1996); Board member, Audit Committee Member and past Board Chair, Junior Achievement (since 1993); former Board member, Mile High United Way, Boys and Girls Clubs, Boy Scouts, Colorado Business Committee for the Arts, Economic Club of Colorado and Metro Denver Network. Oversees 54 portfolios in the OppenheimerFunds complex. Mr. Vaughn has served on the Boards of certain Oppenheimer funds since 2012, during which time he has become familiar with the Fund’s (and other Oppenheimer funds’) financial, accounting, regulatory and investment matters and has contributed to the Boards’ deliberations. |
|
| |
| INTERESTED TRUSTEE AND OFFICER | | Mr. Steinmetz is an “Interested Trustee” because he is affiliated with the Manager and the Sub-Adviser by virtue of his positions as Chairman and director of the Sub-Adviser and officer and director of the Manager. Both as a Trustee and as an officer, Mr. Steinmetz serves for an indefinite term, or until his resignation, retirement, death or removal. Mr. Steinmetz’s address is 225 Liberty Street, New York, New York 10281-1008. |
| |
Arthur P. Steinmetz, Trustee (since 2015), President and Principal Executive Officer (since 2014) Year of Birth: 1958 | | Chairman of the Sub-Adviser (since January 2015); CEO and Chairman of the Manager (since July 2014), President of the Manager (since May 2013), a Director of the Manager (since January 2013), Director of the Sub-Adviser (since July 2014), President, Management Director and CEO of Oppenheimer Acquisition Corp. (the Sub-Adviser’s parent holding company) (since July 2014), and President and Director of OFI SteelPath, Inc. (since January 2013). Chief Investment Officer of the OppenheimerFunds advisory entities from (January 2013-December 2013); Executive Vice President of the Manager (January 2013-May 2013); Chief Investment Officer of the Sub-Adviser (October 2010-December 2012); Chief Investment Officer, Fixed- Income, of the Sub-Adviser (April 2009-October 2010); Executive Vice President of the Sub-Adviser (October 2009-December 2012); Director of Fixed Income of the Sub-Adviser (January 2009-April 2009); and a Senior Vice President of the Sub-Adviser (March 1993-September 2009). An officer of 111 portfolios in the OppenheimerFunds complex. |
|
| |
| OTHER OFFICERS OF THE FUND | | The addresses of the Officers in the chart below are as follows: for Messrs. Govil, Ram, Larson, Mss. Lo Bessette, Foxson and Picciotto, 225 Liberty Street, New York, New York 10281-1008, for Mr. Petersen, 6803 S. Tucson Way, Centennial, Colorado 80112-3924. Each Officer serves for an indefinite term or until his or her resignation, retirement, death or removal. |
| |
Manind Govil, Vice President (since 2009) Year of Birth: 1969 | | Senior Vice President, the Main Street Team Leader and a portfolio manager of the Sub-Adviser (since May 2009). Portfolio manager with RS Investment Management Co. LLC (October 2006-March 2009). Head of equity investments at The Guardian Life Insurance Company of America (August 2005-October 2006) when Guardian Life Insurance acquired an interest in RS Investment Management Co. LLC. Lead portfolio manager - large cap blend/core equity, co-head of equities and head of equity research (2001-July 2005), and was lead portfolio manager - core equity (April 1996-July 2005), at Mercantile Capital Advisers, Inc.A portfolio manager and officer of other portfolios in the OppenheimerFunds complex. |
| |
Benjamin Ram, Vice President (since 2009) Year of Birth: 1972 | | Senior Portfolio Manager of the Sub-Adviser (since January 2011); Vice President and Portfolio Manager of the Sub-Adviser (May 2009 - December 2010). Sector Manager for Financial Investments and co-Portfolio Manager for mid-cap portfolios with the RS Core Equity Team of RS Investments Management Co. LLC (October 2006-May 2009); Portfolio Manager of Mid Cap Strategies, Sector Manager Financials at The Guardian Life Insurance Company of America (January 2006-October 2006) when Guardian Life Insurance acquired an interest in RS Investments Management Co. LLC. Financial analyst (2003-2005) and co-portfolio manager (2005-2006) at Mercantile Capital Advisers, Inc.; Bank analyst at Legg Mason Securities (2000-2003); senior financial analyst at the CitiFinancial division of Citigroup, Inc. (1997-2000). A portfolio manager and officer of other portfolios in the OppenheimerFunds complex. |
| |
Paul Larson, Vice President (since 2014) Year of Birth: 1971 | | Vice President of the Sub-Adviser (since January 2013). Prior to joining the Sub-Adviser, he was a portfolio manager and Chief Equity Strategist at Morningstar. He was previously an analyst at Morningstar covering the energy sector and oversaw the firm’s natural resources analysts. Prior to joining Morningstar in 2002, Mr. Larson was an analyst with The Motley Fool. A portfolio manager and officer of other portfolios in the OppenheimerFunds complex. |
27 OPPENHEIMER MAIN STREET FUND/VA
TRUSTEES AND OFFICERS Unaudited / Continued
| | |
| |
Cynthia Lo Bessette, Secretary and Chief Legal Officer (since 2016) Year of Birth: 1969 | | Executive Vice President, General Counsel and Secretary of the Manager (since February 2016); Senior Vice President and Deputy General Counsel of the Manager (March 2015-February 2016); Chief Legal Officer of the Sub-Adviser and the Distributor (since February 2016); Vice President, General Counsel and Secretary of Oppenheimer Acquisition Corp. (since February 2016); General Counsel of OFI SteelPath, Inc., OFI Advisors, LLC and Index Management Solutions, LLC (since February 2016); Chief Legal Officer of OFI Global Institutional, Inc., HarbourView Asset Management Corporation, OFI Global Trust Company, Oppenheimer Real Asset Management, Inc., OFI Private Investments Inc., Shareholder Services, Inc. and Trinity Investment Management Corporation (since February 2016); Corporate Counsel (February 2012-March 2015) and Deputy Chief Legal Officer (April 2013-March 2015) of Jennison Associates LLC; Assistant General Counsel (April 2008-September 2009) and Deputy General Counsel (October 2009-February 2012) of Lord Abbett & Co. LLC. An officer of 111 portfolios in the OppenheimerFunds complex. |
| |
Jennifer Foxson, Vice President and Chief Business Officer (since 2014) Year of Birth: 1969 | | Senior Vice President of OppenheimerFunds Distributor, Inc. (since June 2014); Vice President of OppenheimerFunds Distributor, Inc. (April 2006-June 2014); Vice President of the Sub-Adviser (January 1998-March 2006); Assistant Vice President of the Sub-Adviser (October 1991-December 1998). An officer of 111 portfolios in the OppenheimerFunds complex. |
| |
Mary Ann Picciotto, Chief Compliance Officer and Chief Anti-Money Laundering Officer (since 2014) Year of Birth: 1973 | | Senior Vice President and Chief Compliance Officer of the Manager (since March 2014); Chief Compliance Officer of the Sub- Adviser, OFI SteelPath, Inc., OFI Global Trust Company, OFI Global Institutional, Inc., Oppenheimer Real Asset Management, Inc., OFI Private Investments, Inc., Harborview Asset Management Corporation, Trinity Investment Management Corporation, and Shareholder Services, Inc. (since March 2014); Managing Director of Morgan Stanley Investment Management Inc. and certain of its various affiliated entities; Chief Compliance Officer of various Morgan Stanley Funds (May 2010-January 2014); Chief Compliance Officer of Morgan Stanley Investment Management Inc. (April 2007-January 2014). An officer of 111 portfolios in the OppenheimerFunds complex. |
| |
Brian S. Petersen, Treasurer and Principal Financial & Accounting Officer (since 2016) Year of Birth: 1970 | | Senior Vice President of the Manager (since January 2017); Vice President of the Manager (January 2013-January 2017); Vice President of the Sub-Adviser (February 2007-December 2012); Assistant Vice President of the Sub-Adviser (August 2002- 2007). An officer of 111 portfolios in the OppenheimerFunds complex. |
The Fund’s Statement of Additional Information contains additional information about the Fund’s Trustees and Officers and is available without charge, upon request, by calling 1.800.988.8287.
28 OPPENHEIMER MAIN STREET FUND/VA
THIS PAGE INTENTIONALLY LEFT BLANK.
29 OPPENHEIMER MAIN STREET FUND/VA
THIS PAGE INTENTIONALLY LEFT BLANK.
30 OPPENHEIMER MAIN STREET FUND/VA
THIS PAGE INTENTIONALLY LEFT BLANK.
31 OPPENHEIMER MAIN STREET FUND/VA
OPPENHEIMER MAIN STREET FUND/VA
A Series of Oppenheimer Variable Account Funds
| | |
| Manager | | OFI Global Asset Management, Inc. |
| |
| Sub-Adviser | | OppenheimerFunds, Inc. |
| |
| Distributor | | OppenheimerFunds Distributor, Inc. |
| |
Transfer and Shareholder | | OFI Global Asset Management, Inc. |
| Servicing Agent | | |
| |
| Sub-Transfer Agent | | Shareholder Services, Inc. |
| | DBA OppenheimerFunds Services |
| |
| Independent | | KPMG LLP |
| Registered | | |
| Public | | |
| Accounting | | |
| Firm | | |
| |
| Legal Counsel | | Ropes & Gray LLP |
| |
| | Before investing in any of the Oppenheimer funds, investors should carefully consider a fund’s investment objectives, risks, charges and expenses. Fund prospectuses and summary prospectuses contain this and other information about the funds, and may be obtained by asking your financial advisor, visiting oppenheimerfunds.com or calling us at 1.800.988.8287. Read prospectuses and summary prospectuses carefully before investing. |
| |
| | © 2018 OppenheimerFunds, Inc. All rights reserved. Oppenheimer funds are distributed by OppenheimerFunds Distributor, Inc. |


December 31, 2017
| | | | | | |
| | | | | | |
| | Oppenheimer | | Annual Report | | |
| | Main Street Small Cap Fund/VA | | |
| | A Series of Oppenheimer Variable Account Funds | | |
| | | | | | |
ANNUAL REPORT
Listing of Top Holdings
Fund Performance Discussion
Financial Statements
PORTFOLIO MANAGERS: Matthew P. Ziehl, CFA, Raymond Anello, CFA, Raman Vardharaj, CFA, Joy Budzinski, Kristin Ketner, Magnus Krantz and Adam Weiner.
AVERAGE ANNUAL TOTAL RETURNS FOR THE PERIODS ENDED 12/31/17
| | | | | | | | | | | | | | | | | | | | |
| | | Inception
Date | | | | | | 1-Year | | 5-Year | | 10-Year |
Non-Service Shares | | | 5/1/98 | | | | | | | | 14.15% | | | | 14.89% | | | | 9.29% | |
Service Shares | | | 7/16/01 | | | | | | | | 13.91 | | | | 14.60 | | | | 9.02 | |
Russell 2000 Index | | | | | | | | | | | 14.65 | | | | 14.12 | | | | 8.71 | |
Performance data quoted represents past performance, which does not guarantee future results. The investment return and principal value of an investment in the Fund will fluctuate so that an investor’s shares, when redeemed, may be worth more or less than their original cost. Current performance may be lower or higher than the performance quoted. For performance data current to the most recent month end, call us at 1.800.988.8287. The Fund’s total returns should not be expected to be the same as the returns of other funds, whether or not both funds have the same portfolio managers and/or similar names. The Fund’s total returns include changes in share price and reinvested distributions but do not include the charges associated with the separate account products that offer this Fund. Such performance would have been lower if such charges were taken into account. Returns for periods of less than one year are cumulative and not annualized. See Fund prospectuses and summary prospectuses for more information on share classes and sales charges.
TOP HOLDINGS AND ALLOCATIONS
TOP TEN COMMON STOCK HOLDINGS
| | | | |
Prestige Brands Holdings, Inc. | | | 2.0% | |
Korn/Ferry International | | | 2.0 | |
Visteon Corp. | | | 1.9 | |
On Assignment, Inc. | | | 1.9 | |
CACI International, Inc., Cl. A | | | 1.9 | |
Hostess Brands, Inc., Cl. A | | | 1.8 | |
Group 1 Automotive, Inc. | | | 1.8 | |
Brandywine Realty Trust | | | 1.7 | |
Zynga, Inc., Cl. A | | | 1.7 | |
Four Corners Property Trust, Inc. | | | 1.7 | |
Portfolio holdings and allocations are subject to change. Percentages are as of December 31, 2017, and are based on net assets. For more current Fund holdings, please visit oppenheimerfunds.com.
SECTOR ALLOCATION
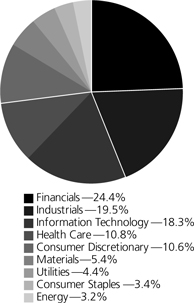
Portfolio holdings and allocations are subject to change. Percentages are as of December 31, 2017, and are based on the total market value of common stocks.
2 OPPENHEIMER MAIN STREET SMALL CAP FUND/VA
Fund Performance Discussion
During the reporting period, the Fund’s Non-Service shares produced a return of 14.15%. In comparison, the Fund underperformed the Russell 2000 Index (the “Index”), which returned 14.65%. During the reporting period, Fund underperformed the Index within the Health Care, Consumer Discretionary and Financials sectors, as a result of weaker relative stock selection. The Fund outperformed the Index primarily within the Information Technology, Real Estate and Materials sectors, due to stronger relative stock selection.
MARKET OVERVIEW
2017 was a banner year in terms of fundamentals for the U.S. economy. One of the longest job expansions in U.S. history continued with more than 2 million jobs added for the seventh consecutive year and unemployment close to an all-time low. There were various other signs of improvement as well, in everything from high consumer confidence scores to declining murder rates in big cities (New York and Los Angeles were at record lows). Despite this, the inflation rate remained low. Most importantly for equity investors, U.S. corporate revenues and earnings growth accelerated.
These trends helped the equity market continue its strong upward trend in the fourth quarter, topping off a year that saw the S&P 500 Index post a total return of a robust 21.83%. The rally in the market was unusual in several aspects. First, the S&P 500 Index posted positive total returns in every single month of the year, which is something the Index has never done before. The market was also extremely calm, as market volatility (as measured by the CBOE Volatility Index) hit a new all-time low for the year. Finally, cumulative losses on the down days during 2017 were the lowest on record. For many, the investor experience of 2017 was about as good as it gets.
While nearly all parts of the market rose in 2017, there were some notable differences within the market. Namely, large capitalization stocks outperformed smaller capitalization stocks, and companies on the “growth” part of the spectrum vastly outperformed the “value” names.
Several factors drove investors’ increased appetite for risk. For one, the underlying economy remained on the steady growth track that it has been on for several years. And though the Federal Reserve raised rates a couple times during the year, liquidity remained abundant with interest rates still at historically low levels. Last but not least, excitement around corporate tax reform drove expectations for a burst in corporate profitability and overall economic growth.
As investors, it is important to know what is and what is not within one’s circle of competence. As such, we strive to keep the portfolio in an all-weather orientation. Whether rates, commodity prices, currencies or even whole economies go up or down, our goal is to have a portfolio that is positioned to outperform no matter the environment.
Second, we believe we have the skills to identify company management teams that are likely to successfully execute on their business plans. Lastly, correctly valuing stocks and seeing what expectations the market is pricing in is also within our skillset. It is not by accident that we weight the portfolio more heavily towards companies that we believe have structural competitive advantages and/or management teams that are executing (e.g., gaining market share, expanding profit margins), with at least reasonable stock valuations. Companies with these qualities generally have more stable earnings.
TOP INDIVIDUAL CONTRIBUTORS
Holdings that were contributors to the Fund’s relative performance this period included Canada Goose Holdings, SiteOne Landscape Supply, and Korn/Ferry International. Canada Goose Holdings is a Canada-based designer, manufacturer, distributor and retailer of outerwear for men, women and children. Shares of Canada Goose rallied strongly late in the reporting period, following excellent fiscal second quarter results. The company posted strong order growth leading into the winter season for its increasingly popular down parkas. Bitterly cold weather at the end of December kept sell-thru to consumers brisk as well. SiteOne Landscape Supply is a national wholesale distributor of landscape supplies in the United States. During the year, the company executed solidly on both internal operations and its aggressive acquisition strategy, and was rewarded with a premium valuation. We exited the stock in December as the share price moved above our fair value estimate. Korn/Ferry is an executive recruiting and talent management company. Korn/Ferry has benefitted from the overall strong global economic environment, as evidenced by strong earnings results and guidance reported during the period. The company is seeing revenue acceleration in all key business units, including the Hay Group organizational consulting practice acquired in 2015.
TOP INDIVIDUAL DETRACTORS
Top detractors from relative performance included Prestige Brands Holdings, Wesco Aircraft Holdings, and Matthews International. Prestige Brands is engaged in the marketing, sales and distribution of over-the-counter healthcare and household cleaning products. Organic revenue growth has been sluggish, but the company continues to execute well on acquiring and integrating products and brands. Wesco materially underperformed in 2017 given market share loss,
3 OPPENHEIMER MAIN STREET SMALL CAP FUND/VA
disappointing execution, senior management turnover, and concerns regarding slower aerospace industry aftermarket growth. Despite 2017’s disappointing results, we continue to hold the shares as we believe they have a favorable risk/reward at current levels. We expect new management to show progress in 2018 toward addressing many of the issues that plagued the company last year. Matthews International is a provider of graphic and imaging solutions, memorialization products and industrial technologies. It experienced declines due partly to a slowdown in demand for graphics services, as regulatory changes in food labeling on packages have been delayed.
STRATEGY & OUTLOOK
The U.S. economy continued its “slow and steady” growth during the reporting period. This has been driven by favorable employment as well as wage and inflation data, while home prices and innovation also continue to help drive the economy higher.
However, while innovation is alive and well and continuing to help generate economic growth, fundamental disruptions across market segments have been elevated. We continue to be focused on potential disruption risk to our companies.
Volatility in the markets was unusually low in 2017. We expect heightened uncertainty to eventually return to the equity markets. Traditionally, during periods of economic uncertainty and heightened market volatility, investors favor stocks of higher quality companies—with greater consistency and stability of revenue and earnings—leading to relatively better stock performance of those companies. We think focusing on companies with strong competitive positions, sound financials and skilled management teams positions us well, should this environment come to pass. During times of economic volatility, such companies frequently widen their lead over weaker competitors. We seek to invest in companies characterized by these qualities, at compelling valuations and believe this disciplined approach is essential to generating superior long-term performance. With the corporate tax rate cut, the onus is on management teams to intelligently allocate any resulting capital “windfall” due to higher profitability. Balancing amongst the competing constituencies of shareholders, employees and capital investment opportunities will demand the utmost in skill and discipline, and we are closely scrutinizing our companies’ capital allocation decisions as we move into 2018.
Investors should consider the Fund’s investment objective, risks, charges and expenses carefully before investing. The Fund’s prospectus and summary prospectus contain this and other information about the Fund, and may be obtained by asking your financial advisor or calling us at 1.800.988.8287. Read prospectuses and summary prospectuses carefully before investing.
Total returns include changes in share price and reinvestment of dividends and capital gains distributions in a hypothetical investment for the periods shown, but do not include the charges associated with the separate account products that offer this Fund.
The Fund’s investment strategy and focus can change over time. The mention of specific fund holdings does not constitute a recommendation by OppenheimerFunds, Inc. or its affiliates.
Shares of Oppenheimer funds are not deposits or obligations of any bank, are not guaranteed by any bank, are not insured by the FDIC or any other agency, and involve investment risks, including the possible loss of the principal amount invested.
Comparing the Fund’s Performance to the Market. The graphs that follow show the performance of a hypothetical $10,000 investment in each share class of the Fund held until December 31, 2017. Performance is measured over a ten-fiscal-year period for both Classes. Performance information does not reflect charges that apply to separate accounts investing in the Fund. If these charges were taken into account, performance would be lower. The graphs assume that all dividends and capital gains distributions were reinvested in additional shares.
The Fund’s performance is compared to the performance of the Russell 2000 Index, which measures the performance of the small-cap segment of the U.S. equity universe. The Russell 2000 Index is a subset of the Russell 3000 Index representing approximately 10% of the total market capitalization of that index. It includes approximately 2000 of the smallest securities based on a combination of their market cap and current index membership. The Index is unmanaged and cannot be purchased directly by investors. While index comparisons may be useful to provide a benchmark for the Fund’s performance, it must be noted that the Fund’s investments are not limited to the investments comprising the Index. Index performance includes reinvestment of income, but does not reflect transaction costs, fees, expenses or taxes. Index performance is shown for illustrative purposes only as a benchmark for the Fund’s performance, and does not predict or depict performance of the Fund. The Fund’s performance reflects the effects of the Fund’s business and operating expenses.
4 OPPENHEIMER MAIN STREET SMALL CAP FUND/VA
COMPARISON OF CHANGE IN VALUE OF $10,000 HYPOTHETICAL INVESTMENTS IN:
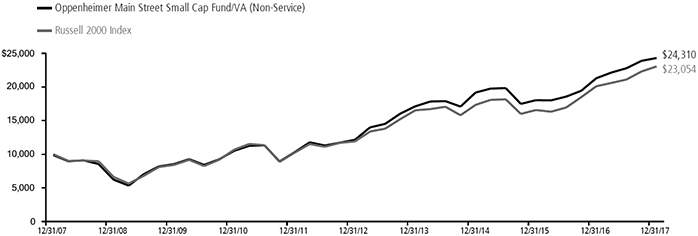
Average Annual Total Returns of Non-Service Shares of the Fund at 12/31/17
1-Year 14.15% 5-Year 14.89% 10-Year 9.29%
COMPARISON OF CHANGE IN VALUE OF $10,000 HYPOTHETICAL INVESTMENTS IN:
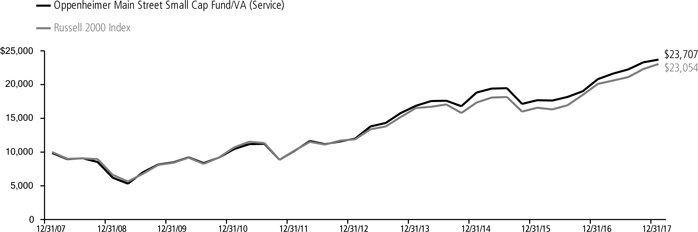
Average Annual Total Returns of Service Shares of the Fund at 12/31/17
1-Year 13.91% 5-Year 14.60% 10-Year 9.02%
Performance data quoted represents past performance, which does not guarantee future results. The investment return and principal value of an investment in the Fund will fluctuate so that an investor’s shares, when redeemed, may be worth more or less than their original cost. Current performance may be lower or higher than the performance quoted. For performance data current to the most recent month end, call us at 1.800.988.8287. The Fund’s total returns should not be expected to be the same as the returns of other funds, whether or not both funds have the same portfolio managers and/or similar names. The Fund’s total returns include changes in share price and reinvested distributions but do not include the charges associated with the separate account products that offer this Fund. Such performance would have been lower if such charges were taken into account.
5 OPPENHEIMER MAIN STREET SMALL CAP FUND/VA
Fund Expenses
Fund Expenses. As a shareholder of the Fund, you incur two types of costs: (1) transaction costs and (2) ongoing costs, including management fees; distribution and service fees; and other Fund expenses. These examples are intended to help you understand your ongoing costs (in dollars) of investing in the Fund and to compare these costs with the ongoing costs of investing in other mutual funds.
The examples are based on an investment of $1,000.00 invested at the beginning of the period and held for the entire 6-month period ended December 31, 2017.
Actual Expenses. The first section of the table provides information about actual account values and actual expenses. You may use the information in this section for the class of shares you hold, together with the amount you invested, to estimate the expense that you paid over the period. Simply divide your account value by $1,000.00 (for example, an $8,600.00 account value divided by $1,000.00 = 8.60), then multiply the result by the number in the first section under the heading entitled “Expenses Paid During 6 Months Ended December 31, 2017” to estimate the expenses you paid on your account during this period.
Hypothetical Example for Comparison Purposes.
The second section of the table provides information about hypothetical account values and hypothetical expenses based on the Fund’s actual expense ratio for each class of shares, and an assumed rate of return of 5% per year for each class before expenses, which is not the actual return. The hypothetical account values and expenses may not be used to estimate the actual ending account balance or expenses you paid for the period. You may use this information to compare the ongoing costs of investing in the Fund and other funds. To do so, compare this 5% hypothetical example for the class of shares you hold with the 5% hypothetical examples that appear in the shareholder reports of the other funds.
Please note that the expenses shown in the table are meant to highlight your ongoing costs only and do not reflect any charges associated with the separate accounts that offer this Fund. Therefore, the “hypothetical” lines of the table are useful in comparing ongoing costs only, and will not help you determine the relative total costs of owning different funds. In addition, if these separate account charges were included your costs would have been higher.
| | | | | | | | | | | | |
| Actual | | Beginning Account Value
July 1, 2017 | | | Ending Account Value
December 31, 2017 | | | Expenses Paid During 6 Months Ended
December 31, 2017 | |
Non-Service shares | | $ | 1,000.00 | | | $ | 1,067.00 | | | $ | 4.18 | |
Service shares | | | 1,000.00 | | | | 1,065.40 | | | | 5.48 | |
| | | |
Hypothetical | | | | | | | | | | | | |
(5% return before expenses) | | | | | | | | | | | | |
Non-Service shares | | | 1,000.00 | | | | 1,021.17 | | | | 4.08 | |
Service shares | | | 1,000.00 | | | | 1,019.91 | | | | 5.36 | |
Expenses are equal to the Fund’s annualized expense ratio for that class, multiplied by the average account value over the period, multiplied by 184/365 (to reflect the one-half year period). Those annualized expense ratios, excluding indirect expenses from affiliated funds, based on the 6-month period ended December 31, 2017 are as follows:
| | | | |
| Class | | Expense Ratios | |
Non-Service shares | | | 0.80% | |
Service shares | | | 1.05 | |
The expense ratios reflect voluntary and/or contractual waivers and/or reimbursements of expenses by the Fund’s Manager. Some of these undertakings may be modified or terminated at any time, as indicated in the Fund’s prospectus. The “Financial Highlights” tables in the Fund’s financial statements, included in this report, also show the gross expense ratios, without such waivers or reimbursements and reduction to custodian expenses, if applicable.
6 OPPENHEIMER MAIN STREET SMALL CAP FUND/VA
STATEMENT OF INVESTMENTS December 31, 2017
| | | | | | | | |
| | | Shares | | | Value | |
Common Stocks—98.0% | |
Consumer Discretionary—10.4% | |
Auto Components—1.9% | |
| Visteon Corp.1 | | | 167,400 | | | $ | 20,948,436 | |
| | | | | | | | | |
| Diversified Consumer Services—0.9% | |
| Houghton Mifflin Harcourt Co.1 | | | 1,032,330 | | | | 9,600,669 | |
| | | | | | | | | |
| Hotels, Restaurants & Leisure—2.7% | |
| Papa John’s International, Inc. | | | 157,550 | | | | 8,840,131 | |
| Sonic Corp. | | | 485,980 | | | | 13,354,730 | |
| Texas Roadhouse, Inc., Cl. A | | | 143,510 | | | | 7,560,107 | |
| | | | | | | 29,754,968 | |
| | | | | | | | | |
| Media—0.6% | |
| WideOpenWest, Inc.1 | | | 602,599 | | | | 6,369,471 | |
| | | | | | | | | |
| Multiline Retail—0.3% | |
Fred’s, Inc., Cl. A | | | 724,440 | | | | 2,933,982 | |
| Specialty Retail—2.9% | |
| DSW, Inc., Cl. A | | | 555,900 | | | | 11,901,819 | |
| Group 1 Automotive, Inc. | | | 271,600 | | | | 19,275,452 | |
| | | | | | | 31,177,271 | |
| | | | | | | | | |
| Textiles, Apparel & Luxury Goods—1.1% | |
| Canada Goose Holdings, Inc.1 | | | 378,853 | | | | 11,956,601 | |
| | | | | | | | | |
| Consumer Staples—3.4% | |
| Food Products—1.8% | |
| Hostess Brands, Inc., Cl. A1 | | | 1,322,466 | | | | 19,585,721 | |
| | | | | | | | | |
| Personal Products—0.8% | |
| elf Beauty, Inc.1 | | | 389,550 | | | | 8,690,860 | |
| | | | | | | | | |
| Tobacco—0.8% | |
| Universal Corp. | | | 165,570 | | | | 8,692,425 | |
| | | | | | | | | |
| Energy—3.2% | |
| Energy Equipment & Services—0.2% | |
| RigNet, Inc.1 | | | 163,302 | | | | 2,441,365 | |
| | | | | | | | | |
| Oil, Gas & Consumable Fuels—3.0% | |
| Cone Midstream Partners LP2 | | | 381,329 | | | | 6,394,887 | |
| Matador Resources Co.1 | | | 268,573 | | | | 8,360,678 | |
| Noble Midstream Partners LP2 | | | 179,531 | | | | 8,976,550 | |
| Renewable Energy Group, Inc.1 | | | 725,349 | | | | 8,559,118 | |
| | | | | | | 32,291,233 | |
| | | | | | | | | |
| Financials—24.0% | |
| Capital Markets—1.2% | |
| Stifel Financial Corp. | | | 222,200 | | | | 13,234,232 | |
| | | | | | | | | |
| Commercial Banks—10.4% | |
| Bank of NT Butterfield & Son Ltd. (The) | | | 229,650 | | | | 8,333,999 | |
| BankUnited, Inc. | | | 399,695 | | | | 16,275,580 | |
| Berkshire Hills Bancorp, Inc. | | | 230,240 | | | | 8,426,784 | |
| Chemical Financial Corp. | | | 205,706 | | | | 10,999,100 | |
| Customers Bancorp, Inc.1 | | | 229,600 | | | | 5,967,304 | |
| FCB Financial Holdings, Inc., Cl. A1 | | | 210,119 | | | | 10,674,045 | |
| IBERIABANK Corp. | | | 141,040 | | | | 10,930,600 | |
| MB Financial, Inc. | | | 297,740 | | | | 13,255,385 | |
| Sterling Bancorp | | | 500,040 | | | | 12,300,984 | |
| Webster Financial Corp. | | | 286,940 | | | | 16,114,550 | |
| | | | | | | 113,278,331 | |
| | | | | | | | | |
| Insurance—0.9% | |
| James River Group Holdings Ltd. | | | 239,562 | | | | 9,584,876 | |
| | | | | | | | | |
| Real Estate Investment Trusts (REITs)—7.8% | |
| Brandywine Realty Trust | | | 1,035,320 | | | | 18,832,471 | |
| CYS Investments, Inc. | | | 1,921,000 | | | | 15,425,630 | |
| DiamondRock Hospitality Co. | | | 1,394,260 | | | | 15,741,195 | |
| Four Corners Property Trust, Inc. | | | 704,470 | | | | 18,104,879 | |
| National Storage Affiliates Trust | | | 609,406 | | | | 16,612,408 | |
| | | | | | | 84,716,583 | |
| | | | | | | | |
| | | Shares | | | Value | |
| Real Estate Management & Development—1.0% | |
| Realogy Holdings Corp. | | | 400,660 | | | $ | 10,617,490 | |
| | | | | | | | | |
| Thrifts & Mortgage Finance—2.7% | |
| Beneficial Bancorp, Inc. | | | 431,750 | | | | 7,102,288 | |
| OceanFirst Financial Corp. | | | 423,593 | | | | 11,119,316 | |
| Oritani Financial Corp. | | | 375,090 | | | | 6,151,476 | |
| WSFS Financial Corp. | | | 107,240 | | | | 5,131,434 | |
| | | | | | | 29,504,514 | |
| | | | | | | | | |
| Health Care—10.5% | |
| Biotechnology—3.3% | |
| Clovis Oncology, Inc.1 | | | 62,440 | | | | 4,245,920 | |
| Emergent BioSolutions, Inc.1 | | | 172,070 | | | | 7,996,093 | |
| Exact Sciences Corp.1 | | | 121,860 | | | | 6,402,524 | |
| Galapagos NV1 | | | 43,605 | | | | 4,130,831 | |
| Ligand Pharmaceuticals, Inc.1 | | | 42,600 | | | | 5,833,218 | |
| Sage Therapeutics, Inc.1 | | | 43,956 | | | | 7,239,993 | |
| | | | | | | 35,848,579 | |
| | | | | | | | | |
| Health Care Equipment & Supplies—3.2% | |
| CryoPort, Inc.1 | | | 213,850 | | | | 1,836,971 | |
| NuVasive, Inc.1 | | | 215,520 | | | | 12,605,765 | |
| NxStage Medical, Inc.1 | | | 204,180 | | | | 4,947,281 | |
| Quidel Corp.1 | | | 181,790 | | | | 7,880,597 | |
| Wright Medical Group NV1 | | | 340,630 | | | | 7,561,986 | |
| | | | | | | 34,832,600 | |
| | | | | | | | | |
| Health Care Providers & Services—1.5% | |
| Addus HomeCare Corp.1 | | | 116,482 | | | | 4,053,574 | |
| Amedisys, Inc.1 | | | 229,240 | | | | 12,083,240 | |
| | | | | | | 16,136,814 | |
| | | | | | | | | |
| Pharmaceuticals—2.5% | |
| Prestige Brands Holdings, Inc.1 | | | 499,186 | | | | 22,168,850 | |
| TherapeuticsMD, Inc.1 | | | 875,090 | | | | 5,285,544 | |
| | | | | | | 27,454,394 | |
| | | | | | | | | |
| Industrials—19.0% | |
| Aerospace & Defense—0.6% | |
| Wesco Aircraft Holdings, Inc.1 | | | 886,480 | | | | 6,559,952 | |
| | | | | | | | | |
| Airlines—1.5% | |
| Spirit Airlines, Inc.1 | | | 360,770 | | | | 16,180,535 | |
| | | | | | | | | |
| Building Products—0.9% | |
| Masonite International Corp.1 | | | 137,861 | | | | 10,222,393 | |
| | | | | | | | | |
| Commercial Services & Supplies—3.2% | |
| ACCO Brands Corp.1 | | | 1,180,727 | | | | 14,404,869 | |
| Advanced Disposal Services, Inc.1 | | | 400,157 | | | | 9,579,759 | |
| Matthews International Corp., Cl. A | | | 197,660 | | | | 10,436,448 | |
| | | | | | | 34,421,076 | |
| | | | | | | | | |
| Construction & Engineering—2.2% | |
| Dycom Industries, Inc.1 | | | 107,280 | | | | 11,954,210 | |
| KBR, Inc. | | | 594,461 | | | | 11,788,162 | |
| | | | | | | 23,742,372 | |
| | | | | | | | | |
| Electrical Equipment—1.5% | |
| Generac Holdings, Inc.1 | | | 340,410 | | | | 16,857,103 | |
| | | | | | | | | |
| Machinery—3.9% | |
| Greenbrier Cos., Inc. (The) | | | 233,090 | | | | 12,423,697 | |
| Manitowoc Co., Inc. (The)1 | | | 231,347 | | | | 9,101,191 | |
| Navistar International Corp.1 | | | 218,560 | | | | 9,371,853 | |
| Rexnord Corp.1 | | | 436,100 | | | | 11,347,322 | |
| | | | | | | 42,244,063 | |
| | | | | | | | | |
| Professional Services—3.9% | |
| Korn/Ferry International | | | 516,805 | | | | 21,385,391 | |
| On Assignment, Inc.1 | | | 322,640 | | | | 20,736,073 | |
| | | | | | | 42,121,464 | |
| | | | | | | | | |
| Road & Rail—1.3% | |
| Genesee & Wyoming, Inc., Cl. A1 | | | 184,350 | | | | 14,513,875 | |
7 OPPENHEIMER MAIN STREET SMALL CAP FUND/VA
STATEMENT OF INVESTMENTS Continued
| | | | | | | | |
| | | Shares | | | Value | |
| Information Technology—17.9% | |
| Internet Software & Services—5.0% | |
| Envestnet, Inc.1 | | | 167,080 | | | $ | 8,328,938 | |
| Etsy, Inc.1 | | | 440,430 | | | | 9,006,794 | |
| j2 Global, Inc. | | | 212,383 | | | | 15,935,096 | |
| Q2 Holdings, Inc.1 | | | 202,210 | | | | 7,451,439 | |
| Yelp, Inc., Cl. A1 | | | 333,840 | | | | 14,007,926 | |
| | | | | | | 54,730,193 | |
| | | | | | | | | |
| IT Services—2.9% | |
| CACI International, Inc., Cl. A1 | | | 156,559 | | | | 20,720,583 | |
| Teradata Corp.1 | | | 297,480 | | | | 11,441,081 | |
| | | | | | | 32,161,664 | |
| | | | | | | | | |
| Semiconductors & Semiconductor Equipment—4.6% | |
| Brooks Automation, Inc. | | | 448,510 | | | | 10,696,963 | |
| MaxLinear, Inc., Cl. A1 | | | 398,550 | | | | 10,529,691 | |
| MKS Instruments, Inc. | | | 150,450 | | | | 14,217,525 | |
| Semtech Corp.1 | | | 438,960 | | | | 15,012,432 | |
| | | | | | | 50,456,611 | |
| | | | | | | | | |
| Software—5.4% | |
| CommVault Systems, Inc.1 | | | 148,630 | | | | 7,803,075 | |
| Paylocity Holding Corp.1 | | | 159,610 | | | | 7,527,208 | |
| Pegasystems, Inc. | | | 283,761 | | | | 13,379,331 | |
| Proofpoint, Inc.1 | | | 135,880 | | | | 12,067,503 | |
| Zynga, Inc., Cl. A1 | | | 4,558,800 | | | | 18,235,200 | |
| | | | | | | 59,012,317 | |
| | | | | | | | |
| | | Shares | | | Value | |
| Materials—5.3% | |
| Construction Materials—1.4% | |
Summit Materials, Inc., Cl. A1 | | | 488,661 | | | $ | 15,363,502 | |
| Metals & Mining—3.2% | |
| Allegheny Technologies, Inc.1 | | | 364,468 | | | | 8,798,258 | |
| Compass Minerals International, Inc. | | | 161,460 | | | | 11,665,485 | |
| Kaiser Aluminum Corp. | | | 134,679 | | | | 14,390,451 | |
| | | | | | | 34,854,194 | |
| | | | | | | | | |
| Paper & Forest Products—0.7% | |
PH Glatfelter Co. | | | 336,470 | | | | 7,213,917 | |
| | | | | | | | | |
| Utilities—4.3% | |
| Gas Utilities—1.3% | |
Suburban Propane Partners LP2 | | | 605,045 | | | | 14,654,190 | |
| | | | | | | | | |
| Multi-Utilities—3.0% | |
| Black Hills Corp. | | | 277,880 | | | | 16,703,367 | |
NorthWestern Corp. | | | 259,320 | | | | 15,481,404 | |
| | | | | | | 32,184,771 | |
Total Common Stocks
(Cost $845,347,345) | | | | | | | 1,067,145,607 | |
| | |
Investment Company—1.9% | | | | | | | | |
| Oppenheimer Institutional Government Money Market Fund, Cl. E, 1.22%3,4 (Cost $20,455,339) | | | 20,455,339 | | | | 20,455,339 | |
Total Investments, at Value
(Cost $865,802,684) | | | 99.9% | | | | 1,087,600,946 | |
Net Other Assets (Liabilities) | | | 0.1 | | | | 809,112 | |
Net Assets | | | 100.0% | | | $ | 1,088,410,058 | |
| | | | | | | | |
Footnotes to Statement of Investments
1. Non-income producing security.
2. Security is a Master Limited Partnership.
3. Rate shown is the 7-day yield at period end.
4. Is or was an affiliate, as defined in the Investment Company Act of 1940, as amended, at or during the reporting period, by virtue of the Fund owning at least 5% of the voting securities of the issuer or as a result of the Fund and the issuer having the same investment adviser. Transactions during the reporting period in which the issuer was an affiliate are as follows:
| | | | | | | | | | | | | | | | |
| | | Shares
December 31, 2016 | | | Gross Additions | | | Gross
Reductions | | | Shares
December 31, 2017 | |
| Oppenheimer Institutional Government Money Market Fund, Cl. E | | | 30,101,780 | | | | 313,568,286 | | | | 323,214,727 | | | | 20,455,339 | |
| | | | |
| | | Value | | | Income | | | Realized
Gain (Loss) | | | Change in Unrealized
Gain (Loss) | |
| Oppenheimer Institutional Government Money Market Fund, Cl. E | | $ | 20,455,339 | | | $ | 123,943 | | | $ | — | | | $ | — | |
See accompanying Notes to Financial Statements.
8 OPPENHEIMER MAIN STREET SMALL CAP FUND/VA
STATEMENT OF ASSETS AND LIABILITIES December 31, 2017
| | | | |
| | |
Assets | | | | |
Investments, at value—see accompanying statement of investments: | | | | |
Unaffiliated companies (cost $845,347,345) | | $ | 1,067,145,607 | |
Affiliated companies (cost $20,455,339) | | | 20,455,339 | |
| | | | 1,087,600,946 | |
Cash | | | 1,000,000 | |
Receivables and other assets: | | | | |
Dividends | | | 555,887 | |
Shares of beneficial interest sold | | | 309,120 | |
Other | | | 71,100 | |
Total assets | | | 1,089,537,053 | |
| | |
Liabilities | | | | |
Payables and other liabilities: | | | | |
Shares of beneficial interest redeemed | | | 408,787 | |
Investments purchased | | | 359,689 | |
Distribution and service plan fees | | | 198,823 | |
Trustees’ compensation | | | 58,233 | |
Shareholder communications | | | 57,627 | |
Other | | | 43,836 | |
Total liabilities | | | 1,126,995 | |
Net Assets | | $ | 1,088,410,058 | |
| | | | |
| | | | |
| | | | | |
| |
Composition of Net Assets | | | | |
Par value of shares of beneficial interest | | $ | 42,730 | |
Additional paid-in capital | | | 733,394,867 | |
Accumulated net investment income | | | 565,267 | |
Accumulated net realized gain on investments and foreign currency transactions | | | 132,608,932 | |
Net unrealized appreciation on investments | | | 221,798,262 | |
Net Assets | | $ | 1,088,410,058 | |
| | | | |
| | | | | |
| |
Net Asset Value Per Share | | | | |
Non-Service Shares: | | | | |
| Net asset value, redemption price per share and offering price per share (based on net assets of $152,617,505 and 5,917,515 shares of beneficial interest outstanding) | | | $25.79 | |
Service Shares: | | | | |
| Net asset value, redemption price per share and offering price per share (based on net assets of $935,792,553 and 36,812,054 shares of beneficial interest outstanding) | | | $25.42 | |
See accompanying Notes to Financial Statements.
9 OPPENHEIMER MAIN STREET SMALL CAP FUND/VA
STATEMENT OF OPERATIONS For the Year Ended December 31, 2017
| | | | | | |
| | | |
Investment Income | | | | | | |
Dividends: | | | | | | |
Unaffiliated companies | | | | $ | 11,457,439 | |
Affiliated companies | | | | | 123,943 | |
Interest | | | | | 35 | |
Total investment income | | | | | 11,581,417 | |
| | | | | | | |
Expenses | | | | | | |
Management fees | | | | | 7,243,026 | |
Distribution and service plan fees – Service shares | | | | | 2,297,899 | |
Transfer and shareholder servicing agent fees: | | | | | | |
Non-Service shares | | | | | 150,326 | |
Service shares | | | | | 919,161 | |
Shareholder communications: | | | | | | |
Non-Service shares | | | | | 21,461 | |
Service shares | | | | | 131,227 | |
Trustees’ compensation | | | | | 38,098 | |
Borrowing fees | | | | | 28,961 | |
Custodian fees and expenses | | | | | 5,586 | |
Other | | | | | 99,607 | |
Total expenses | | | | | 10,935,352 | |
Less reduction to custodian expenses | | | | | (425 | ) |
Less waivers and reimbursements of expenses | | | | | (53,955 | ) |
Net expenses | | | | | 10,880,972 | |
| | | | | | | |
Net Investment Income | | | | | 700,445 | |
Realized and Unrealized Gain (Loss) | | | | | | |
Net realized gain (loss) on: | | | | | | |
Investment transactions in unaffiliated companies | | | | | 146,347,008 | |
Foreign currency transactions | | | | | (865 | ) |
Net realized gain | | | | | 146,346,143 | |
Net change in unrealized appreciation/depreciation on investment transactions in unaffiliated companies | | | | | (7,293,562 | ) |
Net Increase in Net Assets Resulting from Operations | | | | $ | 139,753,026 | |
| | | | | | |
See accompanying Notes to Financial Statements.
10 OPPENHEIMER MAIN STREET SMALL CAP FUND/VA
STATEMENTS OF CHANGES IN NET ASSETS
| | | | | | | | |
| | | Year Ended
December 31, 2017 | | | Year Ended
December 31, 2016 | |
Operations | | | | | | | | |
Net investment income | | $ | 700,445 | | | $ | 5,176,771 | |
Net realized gain | | | 146,346,143 | | | | 64,008,292 | |
Net change in unrealized appreciation/depreciation | | | (7,293,562) | | | | 97,917,019 | |
Net increase in net assets resulting from operations | | | 139,753,026 | | | | 167,102,082 | |
| | | | | | | | | |
Dividends and/or Distributions to Shareholders | | | | | | | | |
Dividends from net investment income: | | | | | | | | |
Non-Service shares | | | (1,318,291) | | | | (682,044) | |
Service shares | | | (5,916,141) | | | | (2,155,681) | |
| | | (7,234,432) | | | | (2,837,725) | |
| | | | | | | | | |
Distributions from net realized gain: | | | | | | | | |
Non-Service shares | | | (8,092,450) | | | | (5,056,400) | |
Service shares | | | (49,338,866) | | | | (33,184,812) | |
| | | (57,431,316) | | | | (38,241,212) | |
| | | | | | | | | |
Beneficial Interest Transactions | | | | | | | | |
Net decrease in net assets resulting from beneficial interest transactions: | | | | | | | | |
Non-Service shares | | | (3,222,317) | | | | (467,642) | |
Service shares | | | (50,919,555) | | | | (43,913,591) | |
| | | (54,141,872) | | | | (44,381,233) | |
| | | | | | | | | |
Net Assets | | | | | | | | |
Total increase | | | 20,945,406 | | | | 81,641,912 | |
Beginning of period | | | 1,067,464,652 | | | | 985,822,740 | |
| End of period (including accumulated net investment income of $ 565,267 and $ 5,127,532, respectively) | | $ | 1,088,410,058 | | | $ | 1,067,464,652 | |
| | | | | | | | |
See accompanying Notes to Financial Statements.
11 OPPENHEIMER MAIN STREET SMALL CAP FUND/VA
FINANCIAL HIGHLIGHTS
| | | | | | | | | | | | | | | | | | | | |
| Non-Service Shares | | Year Ended
December 31,
2017 | | | Year Ended
December 31,
2016 | | | Year Ended
December 31,
2015 | | | Year Ended
December 31,
2014 | | | Year Ended
December 31,
2013 | |
Per Share Operating Data | | | | | | | | | | | | | | | | | | | | |
Net asset value, beginning of period | | | $24.08 | | | | $21.32 | | | | $26.56 | | | | $27.80 | | | | $20.14 | |
Income (loss) from investment operations: | | | | | | | | | | | | | | | | | | | | |
Net investment income1 | | | 0.07 | | | | 0.16 | | | | 0.12 | | | | 0.26 | | | | 0.16 | |
Net realized and unrealized gain (loss) | | | 3.22 | | | | 3.55 | | | | (1.28) | | | | 2.74 | | | | 8.01 | |
Total from investment operations | | | 3.29 | | | | 3.71 | | | | (1.16) | | | | 3.00 | | | | 8.17 | |
Dividends and/or distributions to shareholders: | | | | | | | | | | | | | | | | | | | | |
Dividends from net investment income | | | (0.22) | | | | (0.11) | | | | (0.23) | | | | (0.25) | | | | (0.22) | |
Distributions from net realized gain | | | (1.36) | | | | (0.84) | | | | (3.85) | | | | (3.99) | | | | (0.29) | |
Total dividends and/or distributions to shareholders | | | (1.58) | | | | (0.95) | | | | (4.08) | | | | (4.24) | | | | (0.51) | |
Net asset value, end of period | | | $25.79 | | | | $24.08 | | | | $21.32 | | | | $26.56 | | | | $27.80 | |
| | | | | | | | | | | | | | | | | | | | |
| | | | | | | | | | | | | | | | | | | | | |
Total Return, at Net Asset Value2 | | | 14.15% | | | | 18.05% | | | | (5.90)% | | | | 11.93% | | | | 41.01% | |
| | | | | | | | | | | | | | | | | | | | | |
Ratios/Supplemental Data | | | | | | | | | | | | | | | | | | | | |
Net assets, end of period (in thousands) | | | $152,617 | | | | $145,428 | | | | $129,104 | | | | $136,402 | | | | $134,692 | |
Average net assets (in thousands) | | | $150,376 | | | | $130,889 | | | | $134,932 | | | | $133,864 | | | | $113,522 | |
Ratios to average net assets:3 | | | | | | | | | | | | | | | | | | | | |
Net investment income | | | 0.28% | | | | 0.74% | | | | 0.49% | | | | 0.99% | | | | 0.67% | |
Expenses excluding specific expenses listed below | | | 0.80% | | | | 0.81% | | | | 0.80% | | | | 0.80% | | | | 0.81% | |
Interest and fees from borrowings | | | 0.00%4 | | | | 0.00%4 | | | | 0.00%4 | | | | 0.00% | | | | 0.00% | |
Total expenses5 | | | 0.80% | | | | 0.81% | | | | 0.80% | | | | 0.80% | | | | 0.81% | |
| Expenses after payments, waivers and/or reimbursements and reduction to custodian expenses | | | 0.80%6 | | | | 0.80% | | | | 0.80%6 | | | | 0.79% | | | | 0.80% | |
Portfolio turnover rate | | | 42% | | | | 65% | | | | 43% | | | | 65% | | | | 60% | |
1. Per share amounts calculated based on the average shares outstanding during the period.
2. Assumes an initial investment on the business day before the first day of the fiscal period, with all dividends and distributions reinvested in additional shares on the reinvestment date, and redemption at the net asset value calculated on the last business day of the fiscal period. Total returns are not annualized for periods less than one full year. Total return information does not reflect expenses that apply at the separate account level or to related insurance products. Inclusion of these charges would reduce the total return figures for all periods shown. Returns do not reflect the deduction of taxes that a shareholder would pay on fund distributions or the redemption of fund shares.
3. Annualized for periods less than one full year.
4. Less than 0.005%.
5. Total expenses including indirect expenses from affiliated fund fees and expenses were as follows:
| | | | |
Year Ended December 31, 2017 | | | 0.80 | % |
Year Ended December 31, 2016 | | | 0.81 | % |
Year Ended December 31, 2015 | | | 0.80 | % |
Year Ended December 31, 2014 | | | 0.80 | % |
Year Ended December 31, 2013 | | | 0.81 | % |
6. Waiver was less than 0.005%.
See accompanying Notes to Financial Statements.
12 OPPENHEIMER MAIN STREET SMALL CAP FUND/VA
| | | | | | | | | | | | | | | | | | | | |
Service Shares | | Year Ended
December 31,
2017 | | | Year Ended
December 31,
2016 | | | Year Ended
December 31,
2015 | | | Year Ended
December 31,
2014 | | | Year Ended
December 31,
2013 | |
Per Share Operating Data | | | | | | | | | | | | | | | | | | | | |
Net asset value, beginning of period | | | $23.75 | | | | $21.05 | | | | $26.26 | | | | $27.53 | | | | $19.96 | |
Income (loss) from investment operations: | | | | | | | | | | | | | | | | | | | | |
Net investment income1 | | | 0.01 | | | | 0.10 | | | | 0.06 | | | | 0.19 | | | | 0.10 | |
Net realized and unrealized gain (loss) | | | 3.18 | | | | 3.49 | | | | (1.25) | | | | 2.71 | | | | 7.93 | |
Total from investment operations | | | 3.19 | | | | 3.59 | | | | (1.19) | | | | 2.90 | | | | 8.03 | |
Dividends and/or distributions to shareholders: | | | | | | | | | | | | | | | | | | | | |
Dividends from net investment income | | | (0.16) | | | | (0.05) | | | | (0.17) | | | | (0.18) | | | | (0.17) | |
Distributions from net realized gain | | | (1.36) | | | | (0.84) | | | | (3.85) | | | | (3.99) | | | | (0.29) | |
Total dividends and/or distributions to shareholders | | | (1.52) | | | | (0.89) | | | | (4.02) | | | | (4.17) | | | | (0.46) | |
Net asset value, end of period | | | $25.42 | | | | $23.75 | | | | $21.05 | | | | $26.26 | | | | $27.53 | |
| | | | | | | | | | | | | | | | | | | | |
| | | | | | | | | | | | | | | | | | | | | |
Total Return, at Net Asset Value2 | | | 13.91% | | | | 17.67% | | | | (6.09)% | | | | 11.66% | | | | 40.62% | |
| | | | | | | | | | | | | | | | | | | | | |
Ratios/Supplemental Data | | | | | | | | | | | | | | | | | | | | |
Net assets, end of period (in thousands) | | | $935,793 | | | | $922,037 | | | | $856,719 | | | | $968,637 | | | | $990,168 | |
Average net assets (in thousands) | | | $919,475 | | | | $850,883 | | | | $927,514 | | | | $957,874 | | | | $935,083 | |
Ratios to average net assets:3 | | | | | | | | | | | | | | | | | | | | |
Net investment income | | | 0.03% | | | | 0.49% | | | | 0.24% | | | | 0.75% | | | | 0.43% | |
Expenses excluding specific expenses listed below | | | 1.05% | | | | 1.06% | | | | 1.05% | | | | 1.05% | | | | 1.06% | |
Interest and fees from borrowings | | | 0.00%4 | | | | 0.00%4 | | | | 0.00%4 | | | | 0.00% | | | | 0.00% | |
Total expenses5 | | | 1.05% | | | | 1.06% | | | | 1.05% | | | | 1.05% | | | | 1.06% | |
| Expenses after payments, waivers and/or reimbursements and reduction to custodian expenses | | | 1.05%6 | | | | 1.05% | | | | 1.05%6 | | | | 1.04% | | | | 1.05% | |
Portfolio turnover rate | | | 42% | | | | 65% | | | | 43% | | | | 65% | | | | 60% | |
1. Per share amounts calculated based on the average shares outstanding during the period.
2. Assumes an initial investment on the business day before the first day of the fiscal period, with all dividends and distributions reinvested in additional shares on the reinvestment date, and redemption at the net asset value calculated on the last business day of the fiscal period. Total returns are not annualized for periods less than one full year. Total return information does not reflect expenses that apply at the separate account level or to related insurance products. Inclusion of these charges would reduce the total return figures for all periods shown. Returns do not reflect the deduction of taxes that a shareholder would pay on fund distributions or the redemption of fund shares.
3. Annualized for periods less than one full year.
4. Less than 0.005%.
5. Total expenses including indirect expenses from affiliated fund fees and expenses were as follows:
| | | | |
Year Ended December 31, 2017 | | | 1.05 | % |
Year Ended December 31, 2016 | | | 1.06 | % |
Year Ended December 31, 2015 | | | 1.05 | % |
Year Ended December 31, 2014 | | | 1.05 | % |
Year Ended December 31, 2013 | | | 1.06 | % |
6. Waiver was less than 0.005%.
See accompanying Notes to Financial Statements.
13 OPPENHEIMER MAIN STREET SMALL CAP FUND/VA
NOTES TO FINANCIAL STATEMENTS December 31, 2017
1. Organization
Oppenheimer Main Street Small Cap Fund/VA (the “Fund”), a separate series of Oppenheimer Variable Account Funds, is a diversified open-end management investment company registered under the Investment Company Act of 1940 (“1940 Act”), as amended. The Fund’s investment objective is to seek capital appreciation. The Fund’s investment adviser is OFI Global Asset Management, Inc. (“OFI Global” or the “Manager”), a wholly-owned subsidiary of OppenheimerFunds, Inc. (“OFI” or the “Sub-Adviser”). The Manager has entered into a sub-advisory agreement with OFI. Shares of the Fund are sold only to separate accounts of life insurance companies.
The Fund offers two classes of shares. Both classes are sold at their offering price, which is the net asset value per share, to separate investment accounts of participating insurance companies as an underlying investment for variable life insurance policies, variable annuity contracts or other investment products. The class of shares designated as Service shares is subject to a distribution and service plan. Both classes of shares have identical rights and voting privileges with respect to the Fund in general and exclusive voting rights on matters that affect that class alone. Earnings, net assets and net asset value per share may differ due to each class having its own expenses, such as transfer and shareholder servicing agent fees and shareholder communications, directly attributable to that class.
The following is a summary of significant accounting policies followed in the Fund’s preparation of financial statements in accordance with accounting principles generally accepted in the United States (“U.S. GAAP”).
2. Significant Accounting Policies
Security Valuation. All investments in securities are recorded at their estimated fair value, as described in Note 3.
Foreign Currency Translation. The books and records of the Fund are maintained in U.S. dollars. Any foreign currency amounts are translated into U.S. dollars on the following basis:
(1) Value of investment securities, other assets and liabilities — at the exchange rates prevailing at Market Close as described in Note 3.
(2) Purchases and sales of investment securities, income and expenses — at the rates of exchange prevailing on the respective dates of such transactions.
Although the net assets and the values are presented at the foreign exchange rates at Market Close, the Fund does not isolate the portion of the results of operations resulting from changes in foreign exchange rates on investments from the fluctuations arising from changes in prices of securities held. Such fluctuations are included with the net realized and unrealized gains or losses from investments shown in the Statement of Operations.
For securities, which are subject to foreign withholding tax upon disposition, realized gains or losses on such securities are recorded net of foreign withholding tax.
Reported net realized foreign exchange gains or losses arise from sales of foreign currencies, currency gains or losses realized between the trade and settlement dates on securities transactions, the difference between the amounts of dividends, interest, and foreign withholding tax reclaims recorded on the Fund’s books, and the U.S. dollar equivalent of the amounts actually received or paid. Net unrealized foreign exchange gains and losses arise from changes in the value of assets and liabilities other than investments in securities, resulting from changes in the exchange rate.
Allocation of Income, Expenses, Gains and Losses. Income, expenses (other than those attributable to a specific class), gains and losses are allocated on a daily basis to each class of shares based upon the relative proportion of net assets represented by such class. Operating expenses directly attributable to a specific class are charged against the operations of that class.
Dividends and Distributions to Shareholders. Dividends and distributions to shareholders, which are determined in accordance with income tax regulations and may differ from U.S. GAAP, are recorded on the ex-dividend date. Income and capital gain distributions, if any, are declared and paid annually or at other times as determined necessary by the Manager.
Investment Income. Dividend income is recorded on the ex-dividend date or upon ex-dividend notification in the case of certain foreign dividends where the ex-dividend date may have passed. Non-cash dividends included in dividend income, if any, are recorded at the fair value of the securities received. Withholding taxes on foreign dividends, if any, and capital gains taxes on foreign investments, if any, have been provided for in accordance with the Fund’s understanding of the applicable tax rules and regulations. Interest income, if any, is recognized on an accrual basis. Discount and premium, which are included in interest income on the Statement of Operations, are amortized or accreted daily.
Return of Capital Estimates. Distributions received from the Fund’s investments in Master Limited Partnerships (MLPs) and Real Estate Investments Trusts (REITs), generally are comprised of income and return of capital. The Fund records investment income and return of capital based on estimates. Such estimates are based on historical information available from each MLP, REIT and other industry sources. These estimates may subsequently be revised based on information received from MLPs and REITs after their tax reporting periods are concluded.
Custodian Fees. “Custodian fees and expenses” in the Statement of Operations may include interest expense incurred by the Fund on any cash overdrafts of its custodian account during the period. Such cash overdrafts may result from the effects of failed trades in portfolio securities and from cash outflows resulting from unanticipated shareholder redemption activity. The Fund pays interest to its custodian on such cash overdrafts, to the extent they are not offset by positive cash balances maintained by the Fund, at a rate equal to the Federal Funds Rate plus 2.00%. The “Reduction to custodian expenses” line item, if applicable, represents earnings on cash balances maintained by the Fund during the period. Such interest expense and other custodian fees may be paid with these earnings.
14 OPPENHEIMER MAIN STREET SMALL CAP FUND/VA
2. Significant Accounting Policies (Continued)
Security Transactions. Security transactions are recorded on the trade date. Realized gains and losses on securities sold are determined on the basis of identified cost.
Indemnifications. The Fund’s organizational documents provide current and former Trustees and officers with a limited indemnification against liabilities arising in connection with the performance of their duties to the Fund. In the normal course of business, the Fund may also enter into contracts that provide general indemnifications. The Fund’s maximum exposure under these arrangements is unknown as this would be dependent on future claims that may be made against the Fund. The risk of material loss from such claims is considered remote.
Federal Taxes. The Fund intends to comply with provisions of the Internal Revenue Code applicable to regulated investment companies and to distribute substantially all of its investment company taxable income, including any net realized gain on investments not offset by capital loss carryforwards, if any, to shareholders. Therefore, no federal income or excise tax provision is required. The Fund files income tax returns in U.S. federal and applicable state jurisdictions. The statute of limitations on the Fund’s tax return filings generally remains open for the three preceding fiscal reporting period ends. The Fund has analyzed its tax positions for the fiscal year ended December 31, 2017, including open tax years, and does not believe there are any uncertain tax positions requiring recognition in the Fund’s financial statements.
The tax components of capital shown in the following table represent distribution requirements the Fund must satisfy under the income tax regulations, losses the Fund may be able to offset against income and gains realized in future years and unrealized appreciation or depreciation of securities and other investments for federal income tax purposes.
| | | | | | | | | | | | |
Undistributed Net Investment Income | | Undistributed
Long-Term
Gain | | | Accumulated
Loss
Carryforward1,2 | | | Net Unrealized
Appreciation
Based on Cost of
Securities and
Other Investments
for Federal Income
Tax Purposes | |
$28,598,441 | | | $106,709,787 | | | | $— | | | | $219,722,465 | |
1. During the reporting period, the Fund did not utilize any capital loss carryforward.
2. During the previous reporting period, the Fund did not utilize any capital loss carryforward.
Net investment income (loss) and net realized gain (loss) may differ for financial statement and tax purposes. The character of dividends and distributions made during the fiscal year from net investment income or net realized gains are determined in accordance with federal income tax requirements, which may differ from the character of net investment income or net realized gains presented in those financial statements in accordance with U.S. GAAP. Also, due to timing of dividends and distributions, the fiscal year in which amounts are distributed may differ from the fiscal year in which the income or net realized gain was recorded by the Fund.
Accordingly, the following amounts have been reclassified for the reporting period. Net assets of the Fund were unaffected by the reclassifications.
| | | | | | | | |
Increase to Paid-in Capital | | Reduction
to Accumulated
Net Investment
Loss | | | Reduction
to Accumulated Net
Realized Gain
on Investments3 | |
$11,009,347 | | | $1,971,722 | | | | $12,981,069 | |
3. $11,186,301, including $8,866,269 of long-term capital gain, was distributed in connection with Fund share redemptions.
The tax character of distributions paid during the reporting periods:
| | | | | | | | |
| | | Year Ended
December 31, 2017 | | | Year Ended
December 31, 2016 | |
Distributions paid from: | | | | | | | | |
Ordinary income | | $ | 7,234,432 | | | $ | 2,837,725 | |
Long-term capital gain | | | 57,431,316 | | | | 38,241,212 | |
| | | | | | | | |
Total | | $ | 64,665,748 | | | $ | 41,078,937 | |
| | | | | | | | |
The aggregate cost of securities and other investments and the composition of unrealized appreciation and depreciation of securities and other investments for federal income tax purposes at period end are noted in the following table. The primary difference between book and tax appreciation or depreciation of securities and other investments, if applicable, is attributable to the tax deferral of losses or tax realization of financial statement unrealized gain or loss.
| | | | |
Federal tax cost of securities | | | $ 867,878,481 | |
| | | | |
Gross unrealized appreciation | | | $ 251,468,471 | |
Gross unrealized depreciation | | | (31,746,006) | |
| | | | |
Net unrealized appreciation | | | $ 219,722,465 | |
| | | | |
15 OPPENHEIMER MAIN STREET SMALL CAP FUND/VA
NOTES TO FINANCIAL STATEMENTS Continued
2. Significant Accounting Policies (Continued)
Use of Estimates. The preparation of financial statements in conformity with U.S. GAAP requires management to make estimates and assumptions that affect the reported amounts of assets and liabilities and disclosure of contingent assets and liabilities at the date of the financial statements and the reported amounts of increases and decreases in net assets from operations during the reporting period. Actual results could differ from those estimates.
3. Securities Valuation
The Fund calculates the net asset value of its shares as of 4:00 P.M. Eastern time, on each day the New York Stock Exchange (the “Exchange”) is open for trading, except in the case of a scheduled early closing of the Exchange, in which case the Fund will calculate net asset value of the shares as of the scheduled early closing time of the Exchange.
The Fund’s Board has adopted procedures for the valuation of the Fund’s securities and has delegated the day-to-day responsibility for valuation determinations under those procedures to the Manager. The Manager has established a Valuation Committee which is responsible for determining a fair valuation for any security for which market quotations are not readily available. The Valuation Committee’s fair valuation determinations are subject to review, approval and ratification by the Fund’s Board at least quarterly or more frequently, if necessary.
Valuation Methods and Inputs
Securities are valued primarily using unadjusted quoted market prices, when available, as supplied by third party pricing services or broker-dealers.
The following methodologies are used to determine the market value or the fair value of the types of securities described below:
Equity securities traded on a securities exchange (including exchange-traded derivatives other than futures and futures options) are valued based on the official closing price on the principal exchange on which the security is traded, as identified by the Manager, prior to the time when the Fund’s assets are valued. If the official closing price is unavailable, the security is valued at the last sale price on the principal exchange on which it is traded, or if no sales occurred, the security is valued at the mean between the quoted bid and asked prices. Over-the-counter equity securities are valued at the last published sale price, or if no sales occurred, at the mean between the quoted bid and asked prices. Events occurring after the close of trading on foreign exchanges may result in adjustments to the valuation of foreign securities to more accurately reflect their fair value as of the time when the Fund’s assets are valued.
Shares of a registered investment company that are not traded on an exchange are valued at that investment company’s net asset value per share.
Securities for which market quotations are not readily available, or when a significant event has occurred that would materially affect the value of the security, are fair valued either (i) by a standardized fair valuation methodology applicable to the security type or the significant event as previously approved by the Valuation Committee and the Fund’s Board or (ii) as determined in good faith by the Manager’s Valuation Committee. The Valuation Committee considers all relevant facts that are reasonably available, through either public information or information available to the Manager, when determining the fair value of a security. Those standardized fair valuation methodologies include, but are not limited to, valuing securities at the last sale price or initially at cost and subsequently adjusting the value based on: changes in company specific fundamentals, changes in an appropriate securities index, or changes in the value of similar securities which may be further adjusted for any discounts related to security-specific resale restrictions. When possible, such methodologies use observable market inputs such as unadjusted quoted prices of similar securities, observable interest rates, currency rates and yield curves. The methodologies used for valuing securities are not necessarily an indication of the risks associated with investing in those securities nor can it be assured that the Fund can obtain the fair value assigned to a security if it were to sell the security.
Classifications
Each investment asset or liability of the Fund is assigned a level at measurement date based on the significance and source of the inputs to its valuation.
Various data inputs may be used in determining the value of each of the Fund’s investments as of the reporting period end. These data inputs are categorized in the following hierarchy under applicable financial accounting standards:
1) Level 1-unadjusted quoted prices in active markets for identical assets or liabilities (including securities actively traded on a securities exchange)
2) Level 2-inputs other than unadjusted quoted prices that are observable for the asset or liability (such as unadjusted quoted prices for similar assets and market corroborated inputs such as interest rates, prepayment speeds, credit risks, etc.)
3) Level 3-significant unobservable inputs (including the Manager’s own judgments about assumptions that market participants would use in pricing the asset or liability).
The inputs used for valuing securities are not necessarily an indication of the risks associated with investing in those securities.
The Fund classifies each of its investments in investment companies which are publicly offered as Level 1. Investment companies that are not publicly offered, if any, are classified as Level 2 in the fair value hierarchy.
The table below categorizes amounts that are included in the Fund’s Statement of Assets and Liabilities at period end based on valuation input level:
16 OPPENHEIMER MAIN STREET SMALL CAP FUND/VA
3. Securities Valuation (Continued)
| | | | | | | | | | | | | | | | |
| | | Level 1—
Unadjusted
Quoted Prices | | | Level 2—
Other Significant
Observable Inputs | | | Level 3—
Significant
Unobservable
Inputs | | | Value | |
Assets Table | | | | | | | | | | | | | | | | |
Investments, at Value: | | | | | | | | | | | | | | | | |
Common Stocks | | | | | | | | | | | | | | | | |
Consumer Discretionary | | $ | 112,741,398 | | | $ | — | | | $ | — | | | $ | 112,741,398 | |
Consumer Staples | | | 36,969,006 | | | | — | | | | — | | | | 36,969,006 | |
Energy | | | 34,732,598 | | | | — | | | | — | | | | 34,732,598 | |
Financials | | | 260,936,026 | | | | — | | | | — | | | | 260,936,026 | |
Health Care | | | 110,141,556 | | | | 4,130,831 | | | | — | | | | 114,272,387 | |
Industrials | | | 206,862,833 | | | | — | | | | — | | | | 206,862,833 | |
Information Technology | | | 196,360,785 | | | | — | | | | — | | | | 196,360,785 | |
Materials | | | 57,431,613 | | | | — | | | | — | | | | 57,431,613 | |
Utilities | | | 46,838,961 | | | | — | | | | — | | | | 46,838,961 | |
Investment Company | | | 20,455,339 | | | | — | | | | — | | | | 20,455,339 | |
| | | | | | | | | | | | | | | | |
Total Assets | | $ | 1,083,470,115 | | | $ | 4,130,831 | | | $ | — | | | $ | 1,087,600,946 | |
| | | | | | | | | | | | | | | | |
Forward currency exchange contracts and futures contracts, if any, are reported at their unrealized appreciation/depreciation at measurement date, which represents the change in the contract’s value from trade date. All additional assets and liabilities included in the above table are reported at their market value at measurement date.
4. Investments and Risks
Investments in Affiliated Funds. The Fund is permitted to invest in other mutual funds advised by the Manager (“Affiliated Funds”). Affiliated Funds are open-end management investment companies registered under the 1940 Act, as amended. The Manager is the investment adviser of, and the Sub-Adviser provides investment and related advisory services to, the Affiliated Funds. When applicable, the Fund’s investments in Affiliated Funds are included in the Statement of Investments. Shares of Affiliated Funds are valued at their net asset value per share. As a shareholder, the Fund is subject to its proportional share of the Affiliated Funds’ expenses, including their management fee. The Manager will waive fees and/or reimburse Fund expenses in an amount equal to the indirect management fees incurred through the Fund’s investment in the Affiliated Funds.
Each of the Affiliated Funds in which the Fund invests has its own investment risks, and those risks can affect the value of the Fund’s investments and therefore the value of the Fund’s shares. To the extent that the Fund invests more of its assets in one Affiliated Fund than in another, the Fund will have greater exposure to the risks of that Affiliated Fund.
Investments in Money Market Instruments. The Fund is permitted to invest its free cash balances in money market instruments to provide liquidity or for defensive purposes. The Fund may invest in money market instruments by investing in Class E shares of Oppenheimer Institutional Government Money Market Fund (“IGMMF”), which is an Affiliated Fund. IGMMF is regulated as a money market fund under the 1940 Act, as amended. The Fund may also invest in money market instruments directly or in other affiliated or unaffiliated money market funds.
Master Limited Partnerships (“MLPs”). MLPs issue common units that represent an equity ownership interest in a partnership and provide limited voting rights. MLP common units are registered with the Securities and Exchange Commission (“SEC”), and are freely tradable on securities exchanges such as the NYSE and the NASDAQ Stock Market (“NASDAQ”), or in the over-the-counter (“OTC”) market. An MLP consists of one or more general partners, who conduct the business, and one or more limited partners, who contribute capital. MLP common unit holders have a limited role in the partnership’s operations and management. The Fund, as a limited partner, normally would not be liable for the debts of the MLP beyond the amounts the Fund has contributed, but would not be shielded to the same extent that a shareholder of a corporation would be. In certain circumstances creditors of an MLP would have the right to seek return of capital distributed to a limited partner. This right of an MLP’s creditors would continue after the Fund sold its investment in the MLP.
Equity Security Risk. Stocks and other equity securities fluctuate in price. The value of the Fund’s portfolio may be affected by changes in the equity markets generally. Equity markets may experience significant short-term volatility and may fall sharply at times. Different markets may behave differently from each other and U.S. equity markets may move in the opposite direction from one or more foreign stock markets. Adverse events in any part of the equity or fixed-income markets may have unexpected negative effects on other market segments.
The prices of individual equity securities generally do not all move in the same direction at the same time and a variety of factors can affect the price of a particular company’s securities. These factors may include, but are not limited to, poor earnings reports, a loss of customers, litigation against the company, general unfavorable performance of the company’s sector or industry, or changes in government regulations affecting the company or its industry.
Shareholder Concentration. At period end, one shareholder owned 20% or more of the Fund’s total outstanding shares.
17 OPPENHEIMER MAIN STREET SMALL CAP FUND/VA
NOTES TO FINANCIAL STATEMENTS Continued
5. Market Risk Factors
The Fund’s investments in securities and/or financial derivatives may expose the Fund to various market risk factors:
Commodity Risk. Commodity risk relates to the change in value of commodities or commodity indexes as they relate to increases or decreases in the commodities market. Commodities are physical assets that have tangible properties. Examples of these types of assets are crude oil, heating oil, metals, livestock, and agricultural products.
Credit Risk. Credit risk relates to the ability of the issuer of debt to meet interest and principal payments, or both, as they come due. In general, lower-grade, higher-yield debt securities are subject to credit risk to a greater extent than lower-yield, higher-quality securities.
Equity Risk. Equity risk relates to the change in value of equity securities as they relate to increases or decreases in the general market.
Foreign Exchange Rate Risk. Foreign exchange rate risk relates to the change in the U.S. dollar value of a security held that is denominated in a foreign currency. The U.S. dollar value of a foreign currency denominated security will decrease as the dollar appreciates against the currency, while the U.S. dollar value will increase as the dollar depreciates against the currency.
Interest Rate Risk. Interest rate risk refers to the fluctuations in value of fixed-income securities resulting from the inverse relationship between price and yield. For example, an increase in general interest rates will tend to reduce the market value of already issued fixed-income investments, and a decline in general interest rates will tend to increase their value. In addition, debt securities with longer maturities, which tend to have higher yields, are subject to potentially greater fluctuations in value from changes in interest rates than obligations with shorter maturities.
Volatility Risk. Volatility risk refers to the magnitude of the movement, but not the direction of the movement, in a financial instrument’s price over a defined time period. Large increases or decreases in a financial instrument’s price over a relative time period typically indicate greater volatility risk, while small increases or decreases in its price typically indicate lower volatility risk.
6. Shares of Beneficial Interest
The Fund has authorized an unlimited number of $0.001 par value shares of beneficial interest of each class. Transactions in shares of beneficial interest were as follows:
| | | | | | | | | | | | | | | | |
| | | Year Ended December 31, 2017 | | | Year Ended December 31, 2016 | |
| | | Shares | | | Amount | | | Shares | | | Amount | |
Non-Service Shares | | | | | | | | | | | | | | | | |
Sold | | | 711,775 | | | $ | 17,670,310 | | | | 1,207,275 | | | $ | 26,014,115 | |
Dividends and/or distributions reinvested | | | 392,769 | | | | 9,410,741 | | | | 272,999 | | | | 5,738,444 | |
Redeemed | | | (1,227,568) | | | | (30,303,368) | | | | (1,493,942 | ) | | | (32,220,201) | |
| | | | |
Net decrease | | | (123,024) | | | $ | (3,222,317) | | | | (13,668 | ) | | $ | (467,642) | |
| | | | |
| | | | | | | | | | | | | | | | | |
Service Shares | | | | | | | | | | | | | | | | |
Sold | | | 2,321,546 | | | $ | 56,712,198 | | | | 3,595,856 | | | $ | 73,971,132 | |
Dividends and/or distributions reinvested | | | 2,336,364 | | | | 55,255,007 | | | | 1,701,517 | | | | 35,340,493 | |
Redeemed | | | (6,662,764) | | | | (162,886,760) | | | | (7,186,807 | ) | | | (153,225,216) | |
| | | | |
Net decrease | | | (2,004,854) | | | $ | (50,919,555) | | | | (1,889,434 | ) | | $ | (43,913,591) | |
| | | | |
7. Purchases and Sales of Securities
The aggregate cost of purchases and proceeds from sales of securities, other than short-term obligations and investments in IGMMF, for the reporting period were as follows:
| | | | | | | | | | | | |
| | | Purchases | | | | | | Sales | |
Investment securities | | $ | 443,362,477 | | | | | | | $ | 558,419,815 | |
8. Fees and Other Transactions with Affiliates
Management Fees. Under the investment advisory agreement, the Fund pays the Manager a management fee based on the daily net assets of the Fund at an annual rate as shown in the following table:
| | | | |
| Fee Schedule | | | |
Up to $200 million | | | 0.75% | |
Next $200 million | | | 0.72 | |
Next $200 million | | | 0.69 | |
Next $200 million | | | 0.66 | |
Next $200 million | | | 0.60 | |
Next $4 billion | | | 0.58 | |
Over $5 billion | | | 0.56 | |
The Fund’s effective management fee for the reporting period was 0.68% of average annual net assets before any applicable waivers.
Sub-Adviser Fees. The Manager has retained the Sub-Adviser to provide the day-to-day portfolio management of the Fund. Under the Sub-Advisory Agreement, the Manager pays the Sub-Adviser an annual fee in monthly installments, equal to a percentage of the investment management fee collected by the Manager from the Fund, which shall be calculated after any investment management fee waivers. The fee paid to the Sub-Adviser is paid
18 OPPENHEIMER MAIN STREET SMALL CAP FUND/VA
8. Fees and Other Transactions with Affiliates (Continued)
by the Manager, not by the Fund.
Transfer Agent Fees. OFI Global (the “Transfer Agent”) serves as the transfer and shareholder servicing agent for the Fund. The Fund pays the Transfer Agent a fee based on annual net assets. Fees incurred and average net assets for each class with respect to these services are detailed in the Statement of Operations and Financial Highlights, respectively.
Sub-Transfer Agent Fees. The Transfer Agent has retained Shareholder Services, Inc., a wholly-owned subsidiary of OFI (the “Sub-Transfer Agent”), to provide the day-to-day transfer agent and shareholder servicing of the Fund. Under the Sub-Transfer Agency Agreement, the Transfer Agent pays the Sub-Transfer Agent an annual fee in monthly installments, equal to a percentage of the transfer agent fee collected by the Transfer Agent from the Fund, which shall be calculated after any applicable fee waivers. The fee paid to the Sub-Transfer Agent is paid by the Transfer Agent, not by the Fund.
Trustees’ Compensation. The Fund’s Board of Trustees (“Board”) has adopted a compensation deferral plan for Independent Trustees that enables Trustees to elect to defer receipt of all or a portion of the annual compensation they are entitled to receive from the Fund. For purposes of determining the amount owed to the Trustees under the plan, deferred amounts are treated as though equal dollar amounts had been invested in shares of the Fund or in other Oppenheimer funds selected by the Trustees. The Fund purchases shares of the funds selected for deferral by the Trustees in amounts equal to his or her deemed investment, resulting in a Fund asset equal to the deferred compensation liability. Such assets are included as a component of “Other” within the asset section of the Statement of Assets and Liabilities. Deferral of Trustees’ fees under the plan will not affect the net assets of the Fund and will not materially affect the Fund’s assets, liabilities or net investment income per share. Amounts will be deferred until distributed in accordance with the compensation deferral plan.
Distribution and Service Plan for Service Shares. The Fund has adopted a Distribution and Service Plan (the “Plan”) pursuant to Rule 12b-1 under the 1940 Act for Service shares to pay OppenheimerFunds Distributor, Inc. (the “Distributor”), for distribution related services, personal service and account maintenance for the Fund’s Service shares. Under the Plan, payments are made periodically at an annual rate of 0.25% of the daily net assets of Service shares of the Fund. The Distributor currently uses all of those fees to compensate sponsors of the insurance product that offers Fund shares, for providing personal service and maintenance of accounts of their variable contract owners that hold Service shares. These fees are paid out of the Fund’s assets on an on-going basis and increase operating expenses of the Service shares, which results in lower performance compared to the Fund’s shares that are not subject to a service fee. Fees incurred by the Fund under the Plan are detailed in the Statement of Operations.
Waivers and Reimbursements of Expenses. The Manager has contractually agreed to limit the Fund’s expenses after payments, waivers and/or reimbursements and reduction to custodian expenses, excluding any applicable dividend expense, taxes, interest and fees from borrowing, any subsidiary expenses, Acquired Fund Fees and Expenses, brokerage commissions, unusual and infrequent expenses and certain other Fund expenses; so that those expenses, as percentages of daily net assets, will not exceed the annual rate of 0.80% for Non-Service shares and 1.05% for Service shares.
During the reporting period, the Manager waived fees and/or reimbursed the Fund as follows:
| | | | |
Non-Service shares | | | $5,408 | |
Service shares | | | 33,042 | |
This fee waiver and/or expense reimbursement may not be amended or withdrawn for one year from the date of the Fund’s prospectus, unless approved by the Board.
The Manager will waive fees and/or reimburse Fund expenses in an amount equal to the indirect management fees incurred through the Fund’s investment in IGMMF. During the reporting period, the Manager waived fees and/or reimbursed the Fund $15,505 for IGMMF management fees. This fee waiver and/or expense reimbursement may not be amended or withdrawn for one year from the date of the Fund’s prospectus, unless approved by the Board.
9. Borrowings and Other Financing
Joint Credit Facility. A number of mutual funds managed by the Manager participate in a $1.875 billion revolving credit facility (the “Facility”) intended to provide short-term financing, if necessary, subject to certain restrictions in connection with atypical redemption activity. Expenses and fees related to the Facility are paid by the participating funds and are disclosed separately or as other expenses on the Statement of Operations. The Fund did not utilize the Facility during the reporting period.
19 OPPENHEIMER MAIN STREET SMALL CAP FUND/VA
REPORT OF INDEPENDENT REGISTERED PUBLIC ACCOUNTING FIRM
To the Shareholders and Board of Trustees
Oppenheimer Variable Account Funds:
Opinion on the Financial Statements
We have audited the accompanying statement of assets and liabilities of Oppenheimer Main Street Small Cap Fund/VA, a separate series of Oppenheimer Variable Account Funds, (the “Fund”), including the statement of investments, as of December 31, 2017, the related statement of operations for the year then ended, the statements of changes in net assets for each of the years in the two year period then ended, and the related notes (collectively, the “financial statements”) and the financial highlights for each of the years in the five year period then ended. In our opinion, the financial statements and financial highlights present fairly, in all material respects, the financial position of the Fund as of December 31, 2017, the results of its operations for the year then ended, the changes in its net assets for each of the years in the two year period then ended, and the financial highlights for each of the years in the five year period then ended, in conformity with U.S. generally accepted accounting principles.
Basis for Opinion
These financial statements and financial highlights are the responsibility of the Fund’s management. Our responsibility is to express an opinion on these financial statements and financial highlights based on our audits. We are a public accounting firm registered with the Public Company Accounting Oversight Board (United States) (“PCAOB”) and are required to be independent with respect to the Fund in accordance with the U.S. federal securities laws and the applicable rules and regulations of the Securities and Exchange Commission and the PCAOB.
We conducted our audits in accordance with the standards of the PCAOB. Those standards require that we plan and perform the audit to obtain reasonable assurance about whether the financial statements and financial highlights are free of material misstatement, whether due to error or fraud. Our audits included performing procedures to assess the risks of material misstatement of the financial statements and financial highlights, whether due to error or fraud, and performing procedures that respond to those risks. Such procedures included examining, on a test basis, evidence regarding the amounts and disclosures in the financial statements and financial highlights. Such procedures also included confirmation of securities owned as of December 31, 2017, by correspondence with the custodian, brokers and the transfer agent, or by other appropriate auditing procedures. Our audits also included evaluating the accounting principles used and significant estimates made by management, as well as evaluating the overall presentation of the financial statements and financial highlights. We believe that our audits provide a reasonable basis for our opinion.
KPMGLLP
We have not been able to determine the specific year that we began serving as the auditor of one or more Oppenheimer Funds investment companies, however we are aware that we have served as the auditor of one or more Oppenheimer Funds investment companies since at least 1969.
Denver, Colorado
February 13, 2018
20 OPPENHEIMER MAIN STREET SMALL CAP FUND/VA
FEDERAL INCOME TAX INFORMATION Unaudited
In early 2018, if applicable, shareholders of record received information regarding all dividends and distributions paid to them by the Fund during calendar year 2017.
Capital gain distributions of $1.35712 per share were paid to Non-Service and Service shareholders, respectively, on June 20, 2017. Whether received in stock or in cash, the capital gain distribution should be treated by shareholders as a gain from the sale of the capital assets held for more than one year (long-term capital gains).
Dividends, if any, paid by the Fund during the reporting period which are not designated as capital gain distributions should be multiplied by the maximum amount allowable but not less than 24.41% to arrive at the amount eligible for the corporate dividend-received deduction.
The foregoing information is presented to assist shareholders in reporting distributions received from the Fund to the Internal Revenue Service. Because of the complexity of the federal regulations which may affect your individual tax return and the many variations in state and local tax regulations, we recommend that you consult your tax advisor for specific guidance.
21 OPPENHEIMER MAIN STREET SMALL CAP FUND/VA
BOARD APPROVAL OF THE FUND’S INVESTMENT ADVISORY AND SUB-ADVISORY AGREEMENTS Unaudited
The Fund has entered into an investment advisory agreement with OFI Global Asset Management, Inc. (“OFI Global” or the “Adviser”), a wholly-owned subsidiary of OppenheimerFunds, Inc. (“OFI” or the “Sub-Adviser”) (“OFI Global” and “OFI” together, the “Managers”) and OFI Global has entered into a sub-advisory agreement with OFI whereby OFI provides investment sub-advisory services to the Fund (collectively, the “Agreements”). Each year, the Board of Trustees (the “Board”), including a majority of the independent Trustees, is required to determine whether to approve the terms of the Agreements and the renewal thereof. The Investment Company Act of 1940, as amended, requires that the Board request and evaluate, and that the Managers provide, such information as may be reasonably necessary to evaluate the terms of the Agreements. The Board employs an independent consultant to prepare a report that provides information, including comparative information that the Board requests for that purpose. In addition to in-person meetings focused on this evaluation, the Board receives information throughout the year regarding Fund services, fees, expenses and performance.
The Managers and the independent consultant provided information to the Board on the following factors: (i) the nature, quality and extent of the Managers’ services, (ii) the comparative investment performance of the Fund and the Managers, (iii) the fees and expenses of the Fund, including comparative fee and expense information, (iv) the profitability of the Managers and their affiliates, including an analysis of the cost of providing services, (v) whether economies of scale are realized as the Fund grows and whether fee levels reflect these economies of scale for Fund investors and (vi) other benefits to the Managers from their relationship with the Fund. The Board was aware that there are alternatives to retaining the Managers.
Outlined below is a summary of the principal information considered by the Board as well as the Board’s conclusions.
Nature, Quality and Extent of Services. The Board considered information about the nature, quality and extent of the services provided to the Fund and information regarding the Managers’ key personnel who provide such services. The Managers’ duties include providing the Fund with the services of the portfolio managers and the Sub-Adviser’s investment team, who provide research, analysis and other advisory services in regard to the Fund’s investments; and securities trading services. OFI Global is responsible for oversight of third-party service providers; monitoring compliance with applicable Fund policies and procedures and adherence to the Fund’s investment restrictions; risk management; and oversight of the Sub-Adviser. OFI Global is also responsible for providing certain administrative services to the Fund. Those services include providing and supervising all administrative and clerical personnel who are necessary in order to provide effective corporate administration for the Fund; compiling and maintaining records with respect to the Fund’s operations; preparing and filing reports required by the U.S. Securities and Exchange Commission; preparing periodic reports regarding the operations of the Fund for its shareholders; preparing proxy materials for shareholder meetings; and preparing the registration statements required by federal and state securities laws for the sale of the Fund’s shares. OFI Global also provides the Fund with office space, facilities and equipment.
The Board also considered the quality of the services provided and the quality of the Managers’ resources that are available to the Fund. The Board took account of the fact that the Sub-Adviser has over fifty years of experience as an investment adviser and that its assets under management rank it among the top mutual fund managers in the United States. The Board evaluated the Managers’ advisory, administrative, accounting, legal, compliance and risk management services, among other services, and information the Board has received regarding the experience and professional qualifications of the Managers’ key personnel and the size and functions of their staff. In its evaluation of the quality of the portfolio management services provided, the Board considered the experience of Matthew Ziehl, Raymond Anello, Raman Vardharaj, Joy Budzinski, Kristin Ketner, Magnus Krantz and Adam Weiner, the portfolio managers for the Fund, and the Sub-Adviser’s investment team and analysts. The Board members also considered the totality of their experiences with the Managers as directors or trustees of the Fund and other funds advised by the Managers. The Board considered information regarding the quality of services provided by affiliates of the Managers, which the Board members have become knowledgeable about through their experiences with the Managers and in connection with the review or renewal of the Fund’s service agreements or service providers. The Board concluded, in light of the Managers’ experience, reputation, personnel, operations and resources that the Fund benefits from the services provided under the Agreements.
Investment Performance of the Managers and the Fund. Throughout the year, the Managers provided information on the investment performance of the Fund, the Adviser and the Sub-Adviser, including comparative performance information. The Board also reviewed information, prepared by the Managers and by the independent consultant, comparing the Fund’s historical performance to relevant market indices and to the performance of other small blend underlying variable insurance products. The Board noted that the Fund outperformed its category median for each of the three-, five- and ten-year periods, although it underperformed its category median for the one-year period.
Fees and Expenses of the Fund. The Board reviewed the fees paid to the Adviser and the other expenses borne by the Fund. The Board noted that the Adviser, not the Fund, pays the Sub-Adviser’s fee under the sub-advisory agreement. The independent consultant provided comparative data in regard to the fees and expenses of the Fund and other small blend funds underlying variable insurance products. In reviewing the fees and expenses charged to the VA funds, the Board considered the Adviser’s assertion that, because there is much greater disparity in the fees and services that may be provided by a manager to a VA fund as opposed to a retail fund, when comparing the expenses of the various VA funds to those of retail funds, it is most appropriate to focus on total expenses (rather than on the management fees). Accordingly, while the Board reviewed and considered all expenses, it focused on total expenses. The Board considered that the Fund’s contractual management fee and total expenses were lower than their respective peer group medians and category medians. The Board also considered that the Adviser has contractually agreed to limit the Fund’s total annual operating expenses so that those expenses, as percentages of daily net assets, will not exceed the annual rate of 0.80% for Non-Service Shares and 1.05% for Service Shares. This fee waiver and/or expense reimbursement may not be amended or withdrawn for one year from the date of the Fund’s prospectus, unless approved by the Board.
Economies of Scale and Profits Realized by the Managers. The Board considered information regarding the Managers’ costs in serving as the Fund’s investment adviser and sub-adviser, including the costs associated with the personnel and systems necessary to manage the Fund, and information regarding the Managers’ profitability from their relationship with the Fund. The Board also considered that the Managers must be able to pay and retain experienced professional personnel at competitive rates to provide quality services to the Fund. The Board reviewed whether the Managers may realize economies of scale in managing and supporting the Fund. The Board noted that the Fund currently has management fee
22 OPPENHEIMER MAIN STREET SMALL CAP FUND/VA
BOARD APPROVAL OF THE FUND’S INVESTMENT ADVISORY AND SUB-ADVISORY AGREEMENTS Unaudited / Continued
breakpoints, which are intended to share with Fund shareholders economies of scale that may exist as the Fund’s assets grow.
Other Benefits to the Managers. In addition to considering the profits realized by the Managers, the Board considered information that was provided regarding the direct and indirect benefits the Managers receive as a result of their relationship with the Fund, including compensation paid to the Managers’ affiliates and research provided to the Adviser in connection with permissible brokerage arrangements (soft dollar arrangements).
Conclusions. These factors were also considered by the independent Trustees meeting separately from the full Board, assisted by experienced counsel to the Fund and to the independent Trustees. Fund counsel and the independent Trustees’ counsel are independent of the Managers within the meaning and intent of the Securities and Exchange Commission rules.
Based on its review of the information it received and its evaluations described above, the Board, including a majority of the independent Trustees, decided to continue the Agreements through August 31, 2018. In arriving at its decision, the Board did not identify any factor or factors as being more important than others, but considered all of the above information, and considered the terms and conditions of the Agreements, including the management fees, in light of all the surrounding circumstances.
23 OPPENHEIMER MAIN STREET SMALL CAP FUND/VA
PORTFOLIO PROXY VOTING POLICIES AND GUIDELINES; UPDATES TO STATEMENTS OF INVESTMENTS Unaudited
The Fund has adopted Portfolio Proxy Voting Policies and Guidelines under which the Fund votes proxies relating to securities (“portfolio proxies”) held by the Fund. A description of the Fund’s Portfolio Proxy Voting Policies and Guidelines is available (i) without charge, upon request, by calling the Fund toll-free at 1.800.CALL OPP (225.5677), (ii) on the Fund’s website at www.oppenheimerfunds.com, and (iii) on the SEC’s website at www.sec.gov. In addition, the Fund is required to file Form N-PX, with its complete proxy voting record for the 12 months ended June 30th, no later than August 31st of each year. The Fund’s voting record is available (i) without charge, upon request, by calling the Fund toll-free at 1.800.CALL OPP (225.5677), and (ii) in the Form N-PX filing on the SEC’s website at www.sec.gov.
The Fund files its complete schedule of portfolio holdings with the SEC for the first quarter and the third quarter of each fiscal year on Form N-Q. The Fund’s Form N-Q filings are available on the SEC’s website at www.sec.gov. Those forms may be reviewed and copied at the SEC’s Public Reference Room in Washington, D.C. Information on the operation of the Public Reference Room may be obtained by calling 1-800-SEC-0330.
24 OPPENHEIMER MAIN STREET SMALL CAP FUND/VA
TRUSTEES AND OFFICERS Unaudited
| | |
Name, Position(s) Held with the Fund, Length of
Service, Year of Birth | | Principal Occupation(s) During the Past 5 Years; Other Trusteeships/Directorships Held;
Number of Portfolios in the Fund Complex Currently Overseen |
| |
| INDEPENDENT TRUSTEES | | The address of each Trustee in the chart below is 6803 S. Tucson Way, Centennial, Colorado 80112-3924. Each Trustee serves for an indefinite term, or until his or her resignation, retirement, death or removal. |
| |
Robert J. Malone, Chairman of the Board of Trustees (since 2016), Trustee (since 2002) Year of Birth: 1944 | | Chairman - Colorado Market of MidFirst Bank (since January 2015); Chairman of the Board (2012-2016) and Director (August 2005-January 2016) of Jones International University (educational organization); Trustee of the Gallagher Family Foundation (non-profit organization) (2000-2016); Chairman, Chief Executive Officer and Director of Steele Street Bank Trust (commercial banking) (August 2003-January 2015); Director of Opera Colorado Foundation (non-profit organization) (2008-2012); Director of Colorado UpLIFT (charitable organization) (1986-2010); Director of Jones Knowledge, Inc. (2006-2010); Former Chairman of U.S. Bank-Colorado (subsidiary of U.S. Bancorp and formerly Colorado National Bank) (July 1996-April 1999); Director of Commercial Assets, Inc. (real estate investment trust) (1993-2000); Director of U.S. Exploration, Inc. (oil and gas exploration) (1997-February 2004); Chairman of the Board (1991-1994) and Trustee (1985-1994) of Regis University; and Chairman of the Board (1990-1991) and Member (1984-1999) of Young Presidents Organization. Oversees 54 portfolios in the OppenheimerFunds complex. Mr. Malone has served on the Boards of certain Oppenheimer funds since 2002, during which time he has become familiar with the Fund’s (and other Oppenheimer funds’) financial, accounting, regulatory and investment matters and has contributed to the Boards’ deliberations. |
| |
Andrew J. Donohue, Trustee (since 2017) Year of Birth: 1950 | | Of Counsel, Shearman & Sterling LLP (since September 2017); Chief of Staff of the U.S. Securities and Exchange Commission (regulator) (June 2015-February 2017); Managing Director and Investment Company General Counsel of Goldman Sachs (investment bank) (November 2012-May 2015); Partner at Morgan Lewis & Bockius, LLP (law firm) (March 2011-October 2012); Director of the Division of Investment Management of U.S. Securities and Exchange Commission (regulator) (May 2006-November 2010); Global General Counsel of Merrill Lynch Investment Managers (investment firm) (May 2003-May 2006); General Counsel (October 1991-November 2001) and Executive Vice President (January 1993-November 2001) of OppenheimerFunds, Inc. (investment firm) (June 1991-November 2001). Oversees 54 portfolios in the OppenheimerFunds complex. Mr. Donohue has served on the Boards of certain Oppenheimer funds since 2017, during which time he has become familiar with the Fund’s (and other Oppenheimer funds’) financial, accounting, regulatory and investment matters and has contributed to the Boards’ deliberations. |
| |
Jon S. Fossel, Trustee (since 1990) Year of Birth: 1942 | | Chairman of the Board of Jack Creek Preserve Foundation (non-profit organization) (2005-2015); Director of Jack Creek Preserve Foundation (non-profit organization) (since March 2005); Chairman of the Board (2006-December 2011) and Director (June 2002-December 2011) of UNUMProvident (insurance company); Director of Northwestern Energy Corp. (public utility corporation) (November 2004-December 2009); Director of P.R. Pharmaceuticals (October 1999-October 2003); Director of Rocky Mountain Elk Foundation (non-profit organization) (February 1998-February 2003 and February 2005-February 2007); Chairman and Director (until October 1996) and President and Chief Executive Officer (until October 1995) of the Sub-Adviser; President, Chief Executive Officer and Director of the following: Oppenheimer Acquisition Corp. (“OAC”) (parent holding company of the Sub-Adviser), Shareholders Services, Inc. and Shareholder Financial Services, Inc. (until October 1995). Oversees 54 portfolios in the OppenheimerFunds complex. Mr. Fossel has served on the Boards of certain Oppenheimer funds since 1990, during which time he has become familiar with the Fund’s (and other Oppenheimer funds’) financial, accounting, regulatory and investment matters and has contributed to the Boards’ deliberations. |
| |
Richard F. Grabish, Trustee (since 2012) Year of Birth: 1948 | | Formerly Senior Vice President and Assistant Director of Sales and Marketing (March 1997-December 2007), Director (March 1987-December 2007) and Manager of Private Client Services (June 1985-June 2005) of A.G. Edwards & Sons, Inc. (broker/dealer and investment firm); Chairman and Chief Executive Officer of A.G. Edwards Trust Company, FSB (March 2001-December 2007); President and Vice Chairman of A.G. Edwards Trust Company, FSB (investment adviser) (April 1987-March 2001); President of A.G. Edwards Trust Company, FSB (investment adviser) (June 2005-December 2007). Oversees 54 portfolios in the OppenheimerFunds complex. Mr. Grabish has served on the Boards of certain Oppenheimer funds since 2001, during which time he has become familiar with the Fund’s (and other Oppenheimer funds’) financial, accounting, regulatory and investment matters and has contributed to the Boards’ deliberations. |
| |
Beverly L. Hamilton, Trustee (since 2002) Year of Birth: 1946 | | Trustee of Monterey Institute for International Studies (educational organization) (2000-2014); Board Member of Middlebury College (educational organization) (December 2005-June 2011); Director (1991-2016), Vice Chairman of the Board (2006- 2009) and Chairman of the Board (2010-2013) of American Funds’ Emerging Markets Growth Fund, Inc. (mutual fund); Director of The California Endowment (philanthropic organization) (April 2002-April 2008); Director (February 2002-2005) and Chairman of Trustees (2006-2007) of the Community Hospital of Monterey Peninsula; President of ARCO Investment Management Company (February 1991-April 2000); Member of the investment committees of The Rockefeller Foundation (2001-2006) and The University of Michigan (since 2000); Advisor at Credit Suisse First Boston’s Sprout venture capital unit (venture capital fund) (1994-January 2005); Trustee of MassMutual Institutional Funds (investment company) (1996-June 2004); Trustee of MML Series Investment Fund (investment company) (April 1989-June 2004); Member of the investment committee of Hartford Hospital (2000-2003); and Advisor to Unilever (Holland) pension fund (2000-2003). Oversees 54 portfolios in the OppenheimerFunds complex. Ms. Hamilton has served on the Boards of certain Oppenheimer funds since 2002, during which time she has become familiar with the Fund’s (and other Oppenheimer funds’) financial, accounting, regulatory and investment matters and has contributed to the Boards’ deliberations. |
| |
Victoria J. Herget, Trustee (since 2012) Year of Birth:1951 | | Board Chair (2008-2015) and Director (2004-Present), United Educators (insurance company); Trustee (since 2000) and Chair (since 2010), Newberry Library (independent research library); Trustee, Mather LifeWays (senior living organization) (since 2001); Independent Director of the First American Funds (mutual fund family) (2003-2011); former Managing Director (1993-2001), Principal (1985-1993), Vice President (1978-1985) and Assistant Vice President (1973-1978) of Zurich Scudder Investments (investment adviser) (and its predecessor firms); Trustee (1992-2007), Chair of the Board of Trustees (1999-2007), Investment Committee Chair (1994-1999) and Investment Committee member (2007-2010) of Wellesley College; Trustee, BoardSource (non-profit organization) (2006-2009) and Chicago City Day School (K-8 School) (1994-2005). Oversees 54 portfolios in the OppenheimerFunds complex. Ms. Herget has served on the Boards of certain Oppenheimer funds since 2012, during which time she has become familiar with the Fund’s (and other Oppenheimer funds’) financial, accounting, regulatory and investment matters and has contributed to the Boards’ deliberations. |
25 OPPENHEIMER MAIN STREET SMALL CAP FUND/VA
TRUSTEES AND OFFICERS Unaudited / Continued
| | |
F. William Marshall, Jr., Trustee (since 2000) Year of Birth: 1942 | | Trustee Emeritus of Worcester Polytech Institute (WPI) (private university) (since 2009); Trustee of MassMutual Select Funds (formerly MassMutual Institutional Funds) (investment company) (1996-2015), MML Series Investment Fund (investment company) (1996-2015) and Mass Mutual Premier Funds (investment company) (January 2012-December 2015); President and Treasurer of the SIS Charitable Fund (private charitable fund) (January 1999-March 2011); Former Trustee of WPI (1985- 2008); Former Chairman of the Board (2004-2006) and Former Chairman of the Investment Committee of WPI (1994-2008); Chairman of SIS Family Bank, F.S.B. (formerly SIS Bank) (commercial bank) (January 1999-July 1999); Executive Vice President of Peoples Heritage Financial Group, Inc. (commercial bank) (January 1999-July 1999); and Former President and Chief Executive Officer of SIS Bancorp. (1993-1999). Oversees 54 portfolios in the OppenheimerFunds complex. Mr. Marshall has served on the Boards of certain Oppenheimer funds since 2000, during which time he has become familiar with the Fund’s (and other Oppenheimer funds’) financial, accounting, regulatory and investment matters and has contributed to the Boards’ deliberations. |
| |
Karen L. Stuckey, Trustee (since 2012) Year of Birth: 1953 | | Member (since May 2015) of Desert Mountain Community Foundation Advisory Board (non-profit organization); Partner (1990-2012) of PricewaterhouseCoopers LLP (professional services firm) (held various positions 1975-1990); Trustee (1992- 2006); member of Executive, Nominating and Audit Committees and Chair of Finance Committee (1992-2006), and Emeritus Trustee (since 2006) of Lehigh University; and member, Women’s Investment Management Forum (professional organization) since inception. Oversees 54 portfolios in the OppenheimerFunds complex. Ms. Stuckey has served on the Boards of certain Oppenheimer funds since 2012, during which time she has become familiar with the Fund’s (and other Oppenheimer funds’) financial, accounting, regulatory and investment matters and has contributed to the Boards’ deliberations. |
| |
James D. Vaughn, Trustee (since 2012) Year of Birth:1945 | | Retired; former managing partner (1994-2001) of Denver office of Deloitte & Touche LLP, (held various positions 1969- 1993); Trustee and Chairman of the Audit Committee of Schroder Funds (2003-2012); Board member and Chairman of Audit Committee of AMG National Trust Bank (since 2005); Trustee and Investment Committee member, University of South Dakota Foundation (since 1996); Board member, Audit Committee Member and past Board Chair, Junior Achievement (since 1993); former Board member, Mile High United Way, Boys and Girls Clubs, Boy Scouts, Colorado Business Committee for the Arts, Economic Club of Colorado and Metro Denver Network. Oversees 54 portfolios in the OppenheimerFunds complex. Mr. Vaughn has served on the Boards of certain Oppenheimer funds since 2012, during which time he has become familiar with the Fund’s (and other Oppenheimer funds’) financial, accounting, regulatory and investment matters and has contributed to the Boards’ deliberations. |
| | | |
| INTERESTED TRUSTEE AND OFFICER | | Mr. Steinmetz is an “Interested Trustee” because he is affiliated with the Manager and the Sub-Adviser by virtue of his positions as Chairman and director of the Sub-Adviser and officer and director of the Manager. Both as a Trustee and as an officer, Mr. Steinmetz serves for an indefinite term, or until his resignation, retirement, death or removal. Mr. Steinmetz’s address is 225 Liberty Street, New York, New York 10281-1008. |
| |
Arthur P. Steinmetz, Trustee (since 2015), President and Principal Executive Officer (since 2014) Year of Birth: 1958 | | Chairman of the Sub-Adviser (since January 2015); CEO and Chairman of the Manager (since July 2014), President of the Manager (since May 2013), a Director of the Manager (since January 2013), Director of the Sub-Adviser (since July 2014), President, Management Director and CEO of Oppenheimer Acquisition Corp. (the Sub-Adviser’s parent holding company) (since July 2014), and President and Director of OFI SteelPath, Inc. (since January 2013). Chief Investment Officer of the OppenheimerFunds advisory entities from (January 2013-December 2013); Executive Vice President of the Manager (January 2013-May 2013); Chief Investment Officer of the Sub-Adviser (October 2010-December 2012); Chief Investment Officer, Fixed- Income, of the Sub-Adviser (April 2009-October 2010); Executive Vice President of the Sub-Adviser (October 2009-December 2012); Director of Fixed Income of the Sub-Adviser (January 2009-April 2009); and a Senior Vice President of the Sub-Adviser (March 1993-September 2009). An officer of 111 portfolios in the OppenheimerFunds complex. |
| | | |
| OTHER OFFICERS OF THE FUND | | The addresses of the Officers in the chart below are as follows: for Messrs. Ziehl, Vardharaj, Anello, Krantz, Weiner, Mss. Lo Bessette, Budzinski, Ketner, Foxson and Picciotto, 225 Liberty Street, New York, New York 10281-1008, for Mr. Petersen, 6803 S. Tucson Way, Centennial, Colorado 80112-3924. Each Officer serves for an indefinite term or until his or her resignation, retirement, death or removal. |
| |
Matthew P. Ziehl, Vice President (since 2009) Year of Birth: 1967 | | Vice President and Senior Portfolio Manager of the Sub-Adviser (since May 2009). Portfolio manager with RS Investment Management Co. LLC (October 2006-May 2009); Managing Director at The Guardian Life Insurance Company (December 2001-October 2006) when Guardian Life Insurance acquired an interest in RS Investment Management Co. LLC. Team leader and co portfolio manager with Salomon Brothers Asset Management, Inc. for small growth portfolios (January 2001-December 2001). A portfolio manager and officer of other portfolios in the OppenheimerFunds complex. |
| |
Raman Vardharaj, Vice President (since 2009) Year of Birth: 1971 | | Vice President and portfolio manager of the Sub-Adviser (since May 2009). Sector manager and a senior quantitative analyst creating stock selection models, monitoring portfolio risks and analyzing portfolio performance across the RS Core Equity Team of RS Investment Management Co. LLC (October 2006-May 2009). Quantitative analyst at The Guardian Life Insurance Company of America (1998-October 2006) when Guardian Life Insurance acquired an interest in RS Investment Management Co. LLC. A portfolio manager and officer of other portfolios in the OppenheimerFunds complex. |
| |
Raymond Anello, Vice President (since 2011) Year of Birth: 1964 | | Vice President of the Sub-Adviser (since May 2009) and a portfolio manager of the Sub-Adviser (since April 2011). Sector manager for energy and utilities for the Sub-Adviser’s Main Street Investment Team (since May 2009). Portfolio Manager of the RS All Cap Dividend product (from its inception in July 2007-April 2009) and served as a sector manager for energy and utilities for various other RS Investments products. Guardian Life Insurance Company (October 1999) and transitioned to RS Investments (October 2006) in connection with Guardian Life Insurance Company’s acquisition of an interest in RS Investments. Mr. Anello served as an equity portfolio manager/analyst and high yield analyst at Orion Capital (1995-1998) and an assistant portfolio manager at the Garrison Bradford portfolio management firm (1988-1995). A portfolio manager and officer of other portfolios in the OppenheimerFunds complex. |
26 OPPENHEIMER MAIN STREET SMALL CAP FUND/VA
| | |
Joy Budzinski, Vice President (since 2012) Year of Birth: 1968 | | Vice President of the Sub-Adviser (since May 2009) and a portfolio manager of the Sub-Adviser (since November 2012). Sector manager for healthcare for the Sub-Adviser’s Main Street Investment Team (since May 2009). Healthcare sector manager at RS Investment and Guardian Life Insurance Company. Guardian Life Insurance Company (August 2006) and transitioned to RS Investments (October 2006) in connection with Guardian Life Insurance Company’s acquisition of an interest in RS Investments. Senior equity analyst at Bank of New York BNY Asset Management (2001 -2006); portfolio manager and analyst at Alliance of America (1999-2001); portfolio manager and analyst at JP Morgan Chase (1993-1997); analyst at Prudential Investments (1997-1998). A portfolio manager and officer of other portfolios in the OppenheimerFunds complex. |
| |
Kristin Ketner, Vice President (since 2012) Year of Birth: 1965 | | Vice President of the Sub-Adviser (since June 2009) and a portfolio manager of the Sub-Adviser (since November 2012). Sector manager for consumer discretionary and consumer staples for the Sub-Adviser’s Main Street Investment Team (since May 2009). Sector manager at RS Investment and Guardian Life Insurance Company. Guardian Life Insurance Company in February 2006 and transitioned to RS Investments in October 2006 in connection with Guardian Life Insurance Company’s acquisition of an interest in RS Investments. Portfolio Manager at Solstice Equity Management (2002-2005); retail analyst at Goldman Sachs (1999-2001); Director of Strategy and Integration at Staples (1997-1999); investment banker at Merrill Lynch (1987-1992 and 1995-1997) and Montgomery Securities (1994-1995). A portfolio manager and officer of other portfolios in the OppenheimerFunds complex. |
| |
Magnus Krantz, Vice President (since 2012) Year of Birth: 1967 | | Vice President of the Sub-Adviser (since May 2009) and a portfolio manager of the Sub-Adviser (since November 2012); sector manager for technology for the Sub-Adviser’s Main Street Investment Team (since May 2009). Prior to joining the Sub-Adviser, Mr. Krantz was a sector manager at RS Investment and Guardian Life Insurance Company. Mr. Krantz joined Guardian Life Insurance Company in December 2005 and transitioned to RS Investments in October 2006 in connection with Guardian Life Insurance Company’s acquisition of an interest in RS Investments. Portfolio manager and analyst at Citigroup Asset Management (1998-2005) and as a consultant at Price Waterhouse (1997-1998). He also served as product development engineer at Newbridge Networks (1993-1996) and as a software engineer at Mitel Corporation (1990-1993). A portfolio manager and officer of other portfolios in the OppenheimerFunds complex. |
| |
Adam Weiner, Vice President (since 2012) Year of Birth: 1969 | | Vice President of the Sub-Adviser (since May 2009) and a portfolio manager of the Sub-Adviser (since November 2012). Sector manager for industrials and materials for the Sub-Adviser’s Main Street Investment Team (since May 2009). Sector manager at RS Investment for industrials and materials (January 2007-April 2009). Director and senior equity analyst at Credit Suisse Asset Management (CSAM) (September 2004-December 2006). Equity analyst at Credit Suisse First Boston 2004-2006 (buy-side) and 1999-2004 (sell-side) and Morgan Stanley (1996-1999); internal auditor at Dun and Bradstreet (1992-1996). Budget analyst, Information Resources Division of the Executive Office of the President (1990-1992). A portfolio manager and officer of other portfolios in the OppenheimerFunds complex. |
| |
Cynthia Lo Bessette, Secretary and Chief Legal Officer (since 2016) Year of Birth: 1969 | | Executive Vice President, General Counsel and Secretary of the Manager (since February 2016); Senior Vice President and Deputy General Counsel of the Manager (March 2015-February 2016); Chief Legal Officer of the Sub-Adviser and the Distributor (since February 2016); Vice President, General Counsel and Secretary of Oppenheimer Acquisition Corp. (since February 2016); General Counsel of OFI SteelPath, Inc., OFI Advisors, LLC and Index Management Solutions, LLC (since February 2016); Chief Legal Officer of OFI Global Institutional, Inc., HarbourView Asset Management Corporation, OFI Global Trust Company, Oppenheimer Real Asset Management, Inc., OFI Private Investments Inc., Shareholder Services, Inc. and Trinity Investment Management Corporation (since February 2016); Corporate Counsel (February 2012-March 2015) and Deputy Chief Legal Officer (April 2013-March 2015) of Jennison Associates LLC; Assistant General Counsel (April 2008-September 2009) and Deputy General Counsel (October 2009-February 2012) of Lord Abbett & Co. LLC. An officer of 111 portfolios in the OppenheimerFunds complex. |
| |
Jennifer Foxson, Vice President and Chief Business Officer (since 2014) Year of Birth: 1969 | | Senior Vice President of OppenheimerFunds Distributor, Inc. (since June 2014); Vice President of OppenheimerFunds Distributor, Inc. (April 2006-June 2014); Vice President of the Sub-Adviser (January 1998-March 2006); Assistant Vice President of the Sub-Adviser (October 1991-December 1998). An officer of 111 portfolios in the OppenheimerFunds complex. |
| |
Mary Ann Picciotto, Chief Compliance Officer and Chief Anti-Money Laundering Officer (since 2014) Year of Birth: 1973 | | Senior Vice President and Chief Compliance Officer of the Manager (since March 2014); Chief Compliance Officer of the Sub- Adviser, OFI SteelPath, Inc., OFI Global Trust Company, OFI Global Institutional, Inc., Oppenheimer Real Asset Management, Inc., OFI Private Investments, Inc., Harborview Asset Management Corporation, Trinity Investment Management Corporation, and Shareholder Services, Inc. (since March 2014); Managing Director of Morgan Stanley Investment Management Inc. and certain of its various affiliated entities; Chief Compliance Officer of various Morgan Stanley Funds (May 2010-January 2014); Chief Compliance Officer of Morgan Stanley Investment Management Inc. (April 2007-January 2014). An officer of 111 portfolios in the OppenheimerFunds complex. |
| |
Brian S. Petersen, Treasurer and Principal Financial & Accounting Officer (since 2016) Year of Birth: 1970 | | Senior Vice President of the Manager (since January 2017); Vice President of the Manager (January 2013-January 2017); Vice President of the Sub-Adviser (February 2007-December 2012); Assistant Vice President of the Sub-Adviser (August 2002- 2007). An officer of 111 portfolios in the OppenheimerFunds complex. |
The Fund’s Statement of Additional Information contains additional information about the Fund’s Trustees and Officers and is available without charge, upon request, by calling 1.800.988.8287.
27 OPPENHEIMER MAIN STREET SMALL CAP FUND/VA
OPPENHEIMER MAIN STREET SMALL CAP FUND/VA
A Series of Oppenheimer Variable Account Funds
| | |
| Manager | | OFI Global Asset Management, Inc. |
| |
| Sub-Adviser | | OppenheimerFunds, Inc. |
| |
| Distributor | | OppenheimerFunds Distributor, Inc. |
| |
| Transfer and Shareholder Servicing Agent | | OFI Global Asset Management, Inc. |
| |
| Sub-Transfer Agent | | Shareholder Services, Inc. |
| | DBA OppenheimerFunds Services |
| |
| Independent Registered Public Accounting Firm | | KPMG LLP |
| |
| Legal Counsel | | Ropes & Gray LLP |
| |
| | Before investing in any of the Oppenheimer funds, investors should carefully consider a fund’s investment objectives, risks, charges and expenses. Fund prospectuses and summary prospectuses contain this and other information about the funds, and may be obtained by asking your financial advisor, visiting oppenheimerfunds.com or calling us at 1.800.988.8287. Read prospectuses and summary prospectuses carefully before investing. |
| |
| | © 2018 OppenheimerFunds, Inc. All rights reserved. Oppenheimer funds are distributed by OppenheimerFunds Distributor, Inc. |

|
December 31, 2017 |
. |
ANNUAL REPORT
Listing of Top Holdings
Fund Performance Discussion
Financial Statements
PORTFOLIO MANAGERS: Christopher Proctor, CFA and Adam S. Wilde, CFA
| | | | |
Current Yield | | | | |
For the 7-Day Period Ended 12/31/17 | | |
With Compounding | | 0.82% | | |
Without Compounding | | 0.82% | | |
For the 12-Month Period Ended 12/31/17 | | |
With Compounding | | 0.39% | | |
Without Compounding | | 0.39 | | |
Performance data quoted represents past performance, which does not guarantee future results. Yields include dividends in a hypothetical investment for the periods shown. Current performance may be lower or higher than the performance quoted. For performance data current to the most recent month end, call us at 1.800.988.8287. The yields take into account contractual and voluntary fee waivers and/or expense reimbursements, without which yields would have been lower. Some of these undertakings may be modified at any time, as indicated in the prospectus. There is no guarantee that the Fund will maintain a positive yield. The Fund’s performance should not be expected to be the same as the returns of other funds, whether or not both funds have the same portfolio managers and/or similar names. The Fund’s performance does not include the charges associated with the separate account products that offer this Fund. Such performance would have been lower if such charges were taken into account. See Fund prospectuses and summary prospectuses for more information on share classes and sales charges.
| | | | | | |
PORTFOLIO ALLOCATION | | | | | | |
U.S. Government Agencies | | | 60.2 | % | | |
Repurchase Agreements | | | 31.8 | | | |
Short-Term Notes/Commercial Paper | | | 4.2 | | | |
Investment Company | | | 3.5 | | | |
U.S. Government Obligations | | | 0.3 | | | |
|
| Portfolio holdings and allocations are subject to change. Percentages are as of December 31, 2017, and are based on the total market value of investments. |
2 OPPENHEIMER GOVERNMENT MONEY FUND/VA
Fund Update
On April 29, 2016, the Fund converted from Oppenheimer Money Fund/VA to Oppenheimer Government Money Fund/VA.1 As such, the Fund now operates as a government money market fund, which requires that it invest 99.5 percent or more of its total assets in cash, government securities and/or repurchase agreements that are collateralized solely by government securities or cash. As a government money market fund, the Fund invests primarily in government agency securities, such as Federal Home Loan Bank System obligations, and short-term repurchase agreements collateralized by agency and treasury securities. Under the new rules adopted by the Securities and Exchange Commission (“SEC”) effective in October 14, 2016, the Fund posts current and historical Fund metrics on the oppenheimerfunds.com website. Among these are the market based NAV, Daily Liquid Assets, Weekly Liquid Assets and Fund Net Inflows or Outflows.
FUND PERFORMANCE DISCUSSION
Throughout the reporting period, the Fund continued to offer very strong liquidity and a stable $1.00 net asset value (NAV), while providing competitive income. Short-term government market rates have risen in conjunction with the Federal Reserve (the “Fed”) raising its overnight benchmark Federal Funds rate in December 2016, March 2017, June 2017, and December 2017.
The Fund has benefited from the uptick in rates, as positions matured and we reinvested at higher rates. We would expect that should the Fed raise its overnight rate in March, as projected, the Fund’s yield would increase as well.
Shares of Oppenheimer funds are not deposits or obligations of any bank, are not guaranteed by any bank, are not insured by the FDIC or any other agency, and involve investment risks, including the possible loss of the principal amount invested.
You could lose money by investing in the Fund. Although the Fund seeks to preserve the value of your investment at $1.00 per share, it cannot guarantee it will do so. An investment in the Fund is not insured or guaranteed by the Federal Deposit Insurance Corporation or any other government agency. The Fund’s sponsor has no legal obligation to provide financial support to the Fund, and you should not expect that the sponsor will provide financial support to the Fund at any time.
Investors should consider the Fund’s investment objective, risks, charges and expenses carefully before investing. The Fund’s prospectus and summary prospectus contain this and other information about the Fund, and may be obtained by asking your financial advisor or calling us at 1.800.988.8287. Read prospectuses and summary prospectuses carefully before investing.
1. In connection with new rules governing money market funds fully implemented in October 2016, effective April 29, 2016, Oppenheimer Money Fund/VA changed its name to Oppenheimer Government Money Fund/VA, and made changes to its investment strategies that will enable it to operate as a government money market fund.
3 OPPENHEIMER GOVERNMENT MONEY FUND/VA
Fund Expenses
Fund Expenses. As a shareholder of the Fund, you incur two types of costs: (1) transaction costs and (2) ongoing costs, including management fees; and other Fund expenses. These examples are intended to help you understand your ongoing costs (in dollars) of investing in the Fund and to compare these costs with the ongoing costs of investing in other mutual funds.
The examples are based on an investment of $1,000.00 invested at the beginning of the period and held for the entire 6-month period ended December 31, 2017.
Actual Expenses. The first section of the table provides information about actual account values and actual expenses. You may use the information in this section, together with the amount you invested, to estimate the expense that you paid over the period. Simply divide your account value by $1,000.00 (for example, an $8,600.00 account value divided by $1,000.00 = 8.60), then multiply the result by the number in the first section under the heading entitled “Expenses Paid During During 6 Months Ended December 31, 2017” to estimate the expenses you paid on your account during this period.
Hypothetical Example for Comparison Purposes.
The second section of the table provides information about hypothetical account values and hypothetical expenses based on the Fund’s actual expense ratio, and an assumed rate of return of 5% per year before expenses, which is not the actual return. The hypothetical account values and expenses may not be used to estimate the actual ending account balance or expenses you paid for the period. You may use this information to compare the ongoing costs of investing in the Fund and other funds. To do so, compare this 5% hypothetical example with the 5% hypothetical examples that appear in the shareholder reports of the other funds.
Please note that the expenses shown in the table are meant to highlight your ongoing costs only and do not reflect any charges associated with the separate accounts that offer this Fund. Therefore, the “hypothetical” lines of the table are useful in comparing ongoing costs only, and will not help you determine the relative total costs of owning different funds. In addition, if these separate account charges were included your costs would have been higher.
| | | | | | | | | | | | | | | | | |
| Actual | | Beginning
Account
Value
July 1, 2017 | | Ending
Account
Value
December 31, 2017 | | Expenses
Paid During
6 Months Ended
December 31, 2017 | | |
| | | | $ | 1,000.00 | | | | $ | 1,002.90 | | | | $ | 2.53 | | | |
| | | | |
Hypothetical (5% return before expenses) | | | | | | | | | | | | | | | | | |
| | | | | 1,000.00 | | | | | 1,022.68 | | | | | 2.55 | | | |
Expenses are equal to the Fund’s annualized expense ratio, multiplied by the average account value over the period, multiplied by 184/365 (to reflect the one-half year period). This annualized expense ratio, excluding indirect expenses from affiliated funds, based on the 6-month period ended December 31, 2017 is as follows:
The expense ratio reflects voluntary and/or contractual waivers and/or reimbursements of expenses by the Fund’s Manager. Some of these undertakings may be modified or terminated at any time, as indicated in the Fund’s prospectus. The “Financial Highlights” table in the Fund’s financial statements, included in this report, also shows the gross expense ratio, without such waivers or reimbursements and reduction to custodian expenses, if applicable.
4 OPPENHEIMER GOVERNMENT MONEY FUND/VA
STATEMENT OF INVESTMENTS December 31, 2017
| | | | | | | | | | | | | | | | |
| | | Maturity Date* | | | Final Legal Maturity
Date** | | | Principal
Amount | | | Value | |
Short-Term Notes/Commercial Paper—4.3% | | | | | | | | | | | | | | | | |
New York City Housing Development Corp.: | | | | | | | | | | | | | | | | |
1.56%1 | | | 1/5/18 | | | | 1/5/18 | | | $ | 2,000,000 | | | $ | 2,000,000 | |
1.65%1 | | | 1/5/18 | | | | 1/5/18 | | | | 5,780,000 | | | | 5,780,000 | |
1.70%1 | | | 1/5/18 | | | | 1/5/18 | | | | 3,550,000 | | | | 3,550,000 | |
1.70%1,2 | | | 1/5/18 | | | | 1/5/18 | | | | 1,500,000 | | | | 1,500,000 | |
New York State Housing Finance Agency, 1.70%1,2 | | | 1/5/18 | | | | 1/5/18 | | | | 4,530,000 | | | | 4,530,000 | |
Osceola County, FL Housing Finance Authority, 1.79%1,2 | | | 1/5/18 | | | | 1/5/18 | | | | 1,000,000 | | | | 1,000,000 | |
Total Short-Term Notes/Commercial Paper (Cost $18,360,000) | | | | | | | | | | | | | | | 18,360,000 | |
| | | | |
| | | | | | | | | | | | | |
U.S. Government Agencies—61.4% | | | | | | | | | | | | | | | | |
Federal Agricultural Mortgage Corp., 1.41% [FEDL01+(1)]3 | | | 1/2/18 | | | | 7/3/18 | | | | 3,000,000 | | | | 3,000,000 | |
Federal Farm Credit Bank: | | | | | | | | | | | | | | | | |
1.271% | | | 5/30/18 | | | | 5/30/18 | | | | 3,000,000 | | | | 2,998,524 | |
1.291% | | | 6/1/18 | | | | 6/1/18 | | | | 1,000,000 | | | | 999,212 | |
1.38% [FCPR DLY+(312)]3 | | | 1/2/18 | | | | 1/2/19 | | | | 1,500,000 | | | | 1,500,000 | |
Federal Home Loan Bank: | | | | | | | | | | | | | | | | |
0.75% | | | 1/25/18 | | | | 1/25/18 | | | | 3,500,000 | | | | 3,499,127 | |
0.875% | | | 1/30/18 | | | | 1/30/18 | | | | 1,800,000 | | | | 1,799,609 | |
1.036% [US0003M+(38)]3 | | | 2/15/18 | | | | 2/15/18 | | | | 2,000,000 | | | | 1,999,467 | |
1.118% | | | 2/16/18 | | | | 2/16/18 | | | | 11,000,000 | | | | 10,984,360 | |
1.128% | | | 1/12/18 | | | | 1/12/18 | | | | 16,000,000 | | | | 15,994,488 | |
1.129% [US0003M+(22)]3 | | | 1/9/18 | | | | 7/9/18 | | | | 1,000,000 | | | | 999,926 | |
1.137% | | | 3/19/18 | | | | 3/19/18 | | | | 1,000,000 | | | | 999,415 | |
1.138% | | | 2/28/18 | | | | 2/28/18 | | | | 3,000,000 | | | | 2,994,530 | |
1.143% | | | 1/26/18 | | | | 1/26/18 | | | | 1,000,000 | | | | 999,208 | |
1.148% | | | 1/23/18 | | | | 1/23/18 | | | | 2,000,000 | | | | 1,998,601 | |
1.166% | | | 3/7/18 | | | | 3/7/18 | | | | 2,000,000 | | | | 1,995,811 | |
1.173% | | | 2/9/18 | | | | 2/9/18 | | | | 3,500,000 | | | | 3,495,576 | |
1.187% | | | 3/19/18 | | | | 3/19/18 | | | | 2,000,000 | | | | 1,994,952 | |
1.208% | | | 1/5/18 | | | | 1/5/18 | | | | 3,000,000 | | | | 2,999,598 | |
1.21% | | | 1/3/18 | | | | 1/3/18 | | | | 2,000,000 | | | | 1,999,866 | |
1.212% | | | 1/8/18 | | | | 1/8/18 | | | | 4,000,000 | | | | 3,999,059 | |
1.224% | | | 2/20/18 | | | | 2/20/18 | | | | 4,000,000 | | | | 3,993,222 | |
1.228% | | | 1/10/18 | | | | 1/10/18 | | | | 12,000,000 | | | | 11,996,323 | |
1.241% | | | 1/18/18 | | | | 1/18/18 | | | | 15,000,000 | | | | 14,991,217 | |
1.252% | | | 1/19/18 | | | | 1/19/18 | | | | 10,000,000 | | | | 9,993,751 | |
1.256% | | | 1/22/18 | | | | 1/22/18 | | | | 20,000,000 | | | | 19,985,358 | |
1.259% | | | 1/17/18 | | | | 1/17/18 | | | | 11,000,000 | | | | 10,993,849 | |
1.262% | | | 2/14/18 | | | | 2/14/18 | | | | 2,000,000 | | | | 1,996,925 | |
1.268% | | | 2/2/18 | | | | 2/2/18 | | | | 12,000,000 | | | | 11,986,494 | |
1.273% | | | 1/24/18 | | | | 1/24/18 | | | | 21,800,000 | | | | 21,782,291 | |
1.277% | | | 2/5/18 | | | | 2/5/18 | | | | 10,000,000 | | | | 9,987,604 | |
1.287% | | | 2/15/18 | | | | 2/15/18 | | | | 11,200,000 | | | | 11,182,009 | |
1.292% | | | 1/29/18 | | | | 1/29/18 | | | | 10,000,000 | | | | 9,989,967 | |
1.297% [US0001M+(13.5)]3 | | | 1/9/18 | | | | 5/9/18 | | | | 1,000,000 | | | | 1,000,000 | |
1.302% [US0003M+(16)]3 | | | 2/26/18 | | | | 2/26/18 | | | | 3,000,000 | | | | 3,000,185 | |
1.306% [US0003M+(6.5)]3 | | | 1/26/18 | | | | 1/26/18 | | | | 2,000,000 | | | | 2,000,357 | |
1.309% [US0003M+(4)]3 | | | 1/8/18 | | | | 1/8/18 | | | | 2,000,000 | | | | 2,000,065 | |
1.318% [US0003M+(16.25)]3 | | | 3/1/18 | | | | 3/1/18 | | | | 1,000,000 | | | | 1,000,085 | |
1.328% | | | 3/16/18 | | | | 3/16/18 | | | | 1,000,000 | | | | 997,278 | |
1.346% [US0001M+(14.5)]3 | | | 1/17/18 | | | | 4/17/18 | | | | 1,000,000 | | | | 1,000,000 | |
1.371% [US0001M+(13)]3 | | | 1/20/18 | | | | 8/20/18 | | | | 1,000,000 | | | | 1,000,000 | |
1.375% | | | 3/9/18 | | | | 3/9/18 | | | | 2,000,000 | | | | 2,000,573 | |
1.377% [US0001M+(17.5)]3 | | | 1/25/18 | | | | 1/25/18 | | | | 1,000,000 | | | | 1,000,000 | |
1.384% [US0003M+(19)]3 | | | 3/14/18 | | | | 9/14/18 | | | | 1,000,000 | | | | 1,000,000 | |
1.387% [US0001M+(16.5)]3 | | | 1/25/18 | | | | 1/25/18 | | | | 2,000,000 | | | | 1,999,986 | |
1.392% [US0001M+(14.25)]3 | | | 1/22/18 | | | | 5/22/18 | | | | 1,500,000 | | | | 1,499,982 | |
1.75% | | | 12/14/18 | | | | 12/14/18 | | | | 1,000,000 | | | | 999,605 | |
2.00% | | | 9/14/18 | | | | 9/14/18 | | | | 1,500,000 | | | | 1,502,861 | |
2.375% | | | 3/9/18 | | | | 3/9/18 | | | | 1,600,000 | | | | 1,603,496 | |
Federal Home Loan Mortgage Corp.: | | | | | | | | | | | | | | | | |
0.75% | | | 1/12/18 | | | | 1/12/18 | | | | 3,000,000 | | | | 2,999,601 | |
0.75% | | | 1/26/18 | | | | 1/26/18 | | | | 1,000,000 | | | | 999,687 | |
0.875% | | | 3/7/18 | | | | 3/7/18 | | | | 2,532,000 | | | | 2,530,026 | |
5 OPPENHEIMER GOVERNMENT MONEY FUND/VA
STATEMENT OF INVESTMENTS Continued
| | | | | | | | | | | | | | | | |
| | | Maturity Date* | | | Final Legal Maturity
Date** | | | Principal
Amount | | | Value | |
U.S. Government Agencies (Continued) | | | | | | | | | | | | | | | | |
Federal Home Loan Mortgage Corp.: (Continued) | | | | | | | | | | | | | | | | |
1.05% | | | 2/26/18 | | | | 2/26/18 | | | $ | 500,000 | | | $ | 499,777 | |
1.543% [US0003M+2]3 | | | 3/8/18 | | | | 3/8/18 | | | | 2,000,000 | | | | 2,000,703 | |
Federal National Mortgage Assn.: | | | | | | | | | | | | | | | | |
0.875% | | | 2/8/18 | | | | 2/8/18 | | | | 1,950,000 | | | | 1,949,306 | |
1.00% | | | 2/14/18 | | | | 2/14/18 | | | | 1,400,000 | | | | 1,399,702 | |
1.161% | | | 3/28/18 | | | | 3/28/18 | | | | 2,000,000 | | | | 1,998,192 | |
1.592% [US0003M+(5)]3 | | | 3/21/18 | | | | 3/21/18 | | | | 2,000,000 | | | | 2,000,902 | |
Freddie Mac: | | | | | | | | | | | | | | | | |
1.194% | | | 2/9/18 | | | | 2/9/18 | | | | 2,000,000 | | | | 1,997,422 | |
1.195% | | | 3/1/18 | | | | 3/1/18 | | | | 1,000,000 | | | | 998,050 | |
Tennessee Valley Authority: | | | | | | | | | | | | | | | | |
1.241% | | | 1/2/18 | | | | 1/2/18 | | | | 2,000,000 | | | | 1,999,931 | |
1.287% | | | 1/23/18 | | | | 1/23/18 | | | | 10,000,000 | | | | 9,992,147 | |
Total U.S. Government Agencies (Cost $261,100,258) | | | | | | | | | | | | | | | 261,100,258 | |
| | | | |
| | | | | | | | | | | | | |
U.S. Government Obligations—0.4% | | | | | | | | | | | | | | | | |
United States Treasury Nts., 1.145% (Cost $1,499,654) | | | 1/31/18 | | | | 1/31/18 | | | | 1,500,000 | | | | 1,499,654 | |
| | | | |
| | | | | | | | | | | | | |
Repurchase Agreements—32.4% | | | | | | | | | | | | | | | | |
Repurchase Agreements4 (Cost $138,100,000) | | | | | | | | | | | 138,100,000 | | | | 138,100,000 | |
| | | | |
| | | | | | | | | Shares | | | | |
Investment Company—3.6% | | | | | | | | | | | | | | | | |
Oppenheimer Institutional Government Money Market Fund, Cl. E, 1.22%5,6
(Cost $15,295,885) | | | | 15,295,885 | | | | 15,295,885 | | | | | |
Total Investments, at Value (Cost $434,355,797) | | | | | | | | | | | 102.1% | | | | 434,355,797 | |
Net Other Assets (Liabilities) | | | | | | | | | | | (2.1) | | | | (8,751,513) | |
Net Assets | | | | | | | | | | | 100.0% | | | $ | 425,604,284 | |
| | | | | | | | | | | | |
Footnotes to Statement of Investments
Short-term notes and direct bank obligations are generally traded on a discount basis; the interest rate shown is the discount rate received by the Fund at the time of purchase. Other securities normally bear interest at the rates shown.
* The Maturity Date represents the date used to calculate the Fund’s weighted average maturity as determined under Rule 2a-7.
** If different from the Maturity Date, the Final Legal Maturity Date includes any maturity date extensions which may be affected at the option of the issuer or unconditional payments of principal by the issuer which may be affected at the option of the Fund, and represents the date used to calculate the Fund’s weighted average life as determined under Rule 2a-7.
1. This interest rate resets periodically. Interest rate shown reflects the rate in effect at period end. The rate on this variable rate security is not based on a published reference rate and spread but is determined by the issuer or agent based on current market conditions.
2. All or a portion of the security position is when-issued or delayed delivery to be delivered and settled after period end. See Note 4 of the accompanying Notes.
3. Represents the current interest rate for a variable or increasing rate security, determined as [Referenced Rate + Basis-point spread].
4. Repurchase agreements:
| | | | | | | | | | | | | | | | | | | | | | | | | | | | | | |
| Counterparty | | Lending
Rate | | | Settlement
Date | | | Maturity
Date | | | Principal
Amount | | | Collateralized By | | Collateral
Received, at
Valuea | | | Repurchase
Agreements,
at Value | | | Repurchase
Agreement
Proceeds to be
Receiveda | |
| Credit Agricole Corp. & Investment Bank | | | 1.40% | | | | 12/29/17 | | | | 1/2/18 | | | | $5,900,000 | | | U.S. Treasury Bonds, 5.25%, 2/15/29 and U.S. Treasury Nts., 2.125%-3.50%, 2/15/18-1/31/21 and U.S. Treasury Bills, 0.00%, 4/26/18 | | | $(6,018,938) | | | | $5,900,000 | | | | $5,900,920 | |
| Credit Agricole Corp. & Investment Bank | | | 1.41 | | | | 12/28/17 | | | | 1/4/18 | | | | 4,000,000 | | | U.S. Treasury Nts., 1.375%, 1/31/20 and U.S. Government Agency Mortgages, 3.75%, 3/27/19 | | | (4,081,208) | | | | 4,000,000 | | | | 4,001,185 | |
| Deutsche Bank Securities, Inc. | | | 1.35 | | | | 12/14/17 | | | | 1/16/18 | | | | 5,000,000 | | | U.S. Treasury Nts., 2.625%, 11/15/20 | | | (5,103,657) | | | | 5,000,000 | | | | 5,003,585 | |
| Deutsche Bank Securities, Inc. | | | 1.40 | | | | 12/29/17 | | | | 1/2/18 | | | | 1,000,000 | | | U.S. Treasury Nts., 2.625%, 11/15/20 | | | (1,020,180) | | | | 1,000,000 | | | | 1,000,177 | |
| Deutsche Bank Securities, Inc. | | | 1.41 | | | | 12/29/17 | | | | 1/2/18 | | | | 3,000,000 | | | U.S. Treasury Nts., 2.625%, 11/15/20 | | | (3,060,541) | | | | 3,000,000 | | | | 3,000,530 | |
| INTL FCStone Financial, Inc. | | | 1.35 | | | | 12/26/17 | | | | 1/2/18 | | | | 5,000,000 | | | U.S. Treasury Nts., 0%-3.375%, 2/15/19-5/15/36 and U.S. Government Agency Mortgages, 1.50%-9.50%, 8/1/18-7/25/48 | | | (5,256,549) | | | | 5,000,000 | | | | 5,001,313 | |
6 OPPENHEIMER GOVERNMENT MONEY FUND/VA
Footnotes to Statement of Investments (Continued)
| | | | | | | | | | | | | | | | | | | | | | | | | | | | | | |
| Counterparty | | Lending
Rate | | | Settlement
Date | | | Maturity
Date | | | Principal
Amount | | | Collateralized By | | Collateral
Received, at
Valuea | | | Repurchase
Agreements,
at Value | | | Repurchase
Agreement
Proceeds to be
Receiveda | |
| INTL FCStone Financial, Inc. | | | 1.35% | | | | 12/26/17 | | | | 1/2/18 | | | | $10,000,000 | | | U.S. Government Agency Mortgages, 1.145%- 1.23%, 5/24/19-9/20/19 | | | $(10,203,343) | | | | $10,000,000 | | | | $10,002,625 | |
| RBC Dominion Securities, Inc. | | | 1.34 | | | | 12/26/17 | | | | 1/2/18 | | | | 2,000,000 | | | U.S. Treasury Bonds, 3.125%-8.875%, 2/15/19- 8/15/44 and U.S. Treasury Nts., 0.125%-2.25%, 1/31/19-8/15/27 | | | (2,040,539) | | | | 2,000,000 | | | | 2,000,528 | |
| RBC Dominion Securities, Inc. | | | 1.38 | | | | 12/29/17 | | | | 1/2/18 | | | | 35,200,000 | | | U.S. Government Agency Mortgages, 3.00%- 5.00%, 11/1/32-1/1/47 | | | (35,909,506) | | | | 35,200,000 | | | | 35,205,398 | |
| South Street Securities LLC | | | 1.55 | | | | 12/29/17 | | | | 1/2/18 | | | | 50,000,000 | | | U.S. Government Agency Mortgages, 1.44%- 7.00%, 4/1/18-6/1/47 | | | (51,008,784) | | | | 50,000,000 | | | | 50,008,612 | |
| TD Securities (USA) LLC | | | 1.40 | | | | 12/29/17 | | | | 1/2/18 | | | | 10,000,000 | | | U.S. Treasury Nts., 0.625%-2.125%, 1/15/24-2/29/24 | | | (10,201,602) | | | | 10,000,000 | | | | 10,001,570 | |
| TD Securities (USA) LLC | | | 1.41 | | | | 12/29/17 | | | | 1/5/18 | | | | 7,000,000 | | | U.S. Treasury Nts., 0.625%-2.125%, 6/30/22-1/15/24 | | | (7,141,205) | | | | 7,000,000 | | | | 7,001,182 | |
| | | | | | | | | | | | | | | | | | | | | $(141,046,052) | | | | $138,100,000 | | | | $138,127,625 | |
a. Includes accrued interest.
5. Rate shown is the 7-day yield at period end.
6. Is or was an affiliate, as defined in the Investment Company Act of 1940, as amended, at or during the reporting period, by virtue of the Fund owning at least 5% of the voting securities of the issuer or as a result of the Fund and the issuer having the same investment adviser. Transactions during the reporting period in which the issuer was an affiliate are as follows:
| | | | | | | | | | | | | | | | |
| | | Shares
December 31, 2016 | | | Gross
Additions | | | Gross
Reductions | | | Shares
December 31, 2017 | |
Oppenheimer Institutional Government Money Market Fund, Cl. E | | | — | | | | 15,295,885 | | | | — | | | | 15,295,885 | |
| | | | |
| | | Value | | | Income | | | Realized
Gain (Loss) | | | Change in Unrealized
Gain (Loss) | |
Oppenheimer Institutional Government Money Market Fund, Cl. E | | $ | 15,295,885 | | | $ | 110,266 | | | $ | — | | | $ | — | |
| | |
| Glossary: | | |
| Definitions | | |
FCPR DLY | | Federal Reserve Bank Prime Loan Rate US Daily |
FEDL01 | | US Federal Funds Effective Rate (continuous series) |
ICE LIBOR | | Intercontinental Exchange London Interbank Offered Rate |
US0001M | | ICE LIBOR USD 1 Month |
US0003M | | ICE LIBOR USD 3 Month |
See accompanying Notes to Financial Statements.
7 OPPENHEIMER GOVERNMENT MONEY FUND/VA
STATEMENT OF ASSETS AND LIABILITIES December 31, 2017
| | | | |
Assets | | | | |
Investments, at value—see accompanying statement of investments: | | | | |
Unaffiliated companies (cost $280,959,912) | | $ | 280,959,912 | |
Affiliated companies (cost $15,295,885) | | | 15,295,885 | |
Repurchase agreements (cost $138,100,000) | | | 138,100,000 | |
| | | | 434,355,797 | |
Cash | | | 154,986 | |
Receivables and other assets: | | | | |
Shares of beneficial interest sold | | | 221,519 | |
Interest | | | 182,574 | |
Other | | | 52,438 | |
Total assets | | | 434,967,314 | |
Liabilities | | | | |
Payables and other liabilities: | | | | |
Investments purchased (including $7,031,128 purchased on a when-issued or delayed delivery basis) | | | 8,531,128 | |
Shares of beneficial interest redeemed | | | 598,008 | |
Dividends | | | 135,673 | |
Trustees’ compensation | | | 47,394 | |
Shareholder communications | | | 11,074 | |
Other | | | 39,753 | |
Total liabilities | | | 9,363,030 | |
Net Assets | | $ | 425,604,284 | |
| | | | |
| | | | |
Composition of Net Assets | | | | |
Par value of shares of beneficial interest | | $ | 425,579 | |
Additional paid-in capital | | | 425,185,529 | |
Accumulated net investment loss | | | (6,243 | ) |
Accumulated net realized loss on investments | | | (581 | ) |
Net Assets—applicable to 425,578,820 shares of beneficial interest outstanding | | $ | 425,604,284 | |
| | | | |
| | | | | |
Net Asset Value Per Share, Redemption Price Per Share and Offering Price Per Share | | | $1.00 | |
See accompanying Notes to Financial Statements.
8 OPPENHEIMER GOVERNMENT MONEY FUND/VA
STATEMENT OF OPERATIONS For the Year Ended December 31, 2017
| | | | |
Investment Income | | | | |
Interest | | $ | 4,237,438 | |
Dividends from affiliated companies | | | 110,266 | |
Total investment income | | | 4,347,704 | |
Expenses | | | | |
Management fees | | | 2,196,845 | |
Transfer and shareholder servicing agent fees | | | 488,981 | |
Shareholder communications | | | 38,541 | |
Trustees’ compensation | | | 55,848 | |
Custodian fees and expenses | | | 606 | |
Other | | | 104,376 | |
Total expenses | | | 2,885,197 | |
Less reduction to custodian expenses | | | (219 | ) |
Less waivers and reimbursements of expenses | | | (440,074 | ) |
Net expenses | | | 2,444,904 | |
Net Investment Income | | | 1,902,800 | |
Realized Loss | | | (366 | ) |
Net Increase in Net Assets Resulting from Operations | | $ | 1,902,434 | |
| | | | |
See accompanying Notes to Financial Statements.
9 OPPENHEIMER GOVERNMENT MONEY FUND/VA
STATEMENTS OF CHANGES IN NET ASSETS
| | | | | | | | |
| | | Year Ended
December 31, 2017 | | | Year Ended
December 31, 2016 | |
Operations | | | | | | | | |
Net investment income | | $ | 1,902,800 | | | $ | 147,995 | |
Net realized loss | | | (366 | ) | | | (215 | ) |
Net increase in net assets resulting from operations | | | 1,902,434 | | | | 147,780 | |
Dividends and/or Distributions to Shareholders | | | | | | | | |
Dividends from net investment income | | | (1,903,588 | ) | | | (153,515 | ) |
Beneficial Interest Transactions | | | | | | | | |
Net decrease in net assets resulting from beneficial interest transactions | | | (116,364,487 | ) | | | (2,106,660,389 | ) |
Net Assets | | | | | | | | |
Total decrease | | | (116,365,641 | ) | | | (2,106,666,124 | ) |
Beginning of period | | | 541,969,925 | | | | 2,648,636,049 | |
End of period (including accumulated net investment income (loss) of $(6,243) and $20,133, respectively) | | $ | 425,604,284 | | | $ | 541,969,925 | |
| | | | | | | | |
See accompanying Notes to Financial Statements.
10 OPPENHEIMER GOVERNMENT MONEY FUND/VA
FINANCIAL HIGHLIGHTS
| | | | | | | | | | | | | | | | | | | | |
| | | Year Ended
December 31,
2017 | | | Year Ended
December 31,
2016 | | | Year Ended
December 31,
2015 | | | Year Ended
December 31,
2014 | | | Year Ended
December 31,
2013 | |
Per Share Operating Data | | | | | | | | | | | | | | | | | | | | |
Net asset value, beginning of period | | $ | 1.00 | | | $ | 1.00 | | | $ | 1.00 | | | $ | 1.00 | | | $ | 1.00 | |
Income (loss) from investment operations: | | | | | | | | | | | | | | | | | | | | |
Net investment income1 | | | 0.00 | 2 | | | 0.00 | 2 | | | 0.00 | 2 | | | 0.00 | 2 | | | 0.00 | 2 |
Net realized gain (loss) | | | (0.00 | )2 | | | (0.00 | )2 | | | 0.00 | 2 | | | 0.00 | 2 | | | 0.00 | 2 |
Total from investment operations | | | 0.00 | 2 | | | 0.00 | 2 | | | 0.00 | 2 | | | 0.00 | 2 | | | 0.00 | 2 |
Dividends and/or distributions to shareholders: | | | | | | | | | | | | | | | | | | | | |
Dividends from net investment income | | | (0.00 | )2 | | | (0.00 | )2 | | | (0.00 | )2 | | | (0.00 | )2 | | | (0.00 | )2 |
Net asset value, end of period | | $ | 1.00 | | | $ | 1.00 | | | $ | 1.00 | | | $ | 1.00 | | | $ | 1.00 | |
| | | | |
| | | | |
| | | | | | | | | | | | | | | | | | | | | |
Total Return, at Net Asset Value3 | | | 0.39% | | | | 0.01% | | | | 0.01% | | | | 0.01% | | | | 0.01% | |
| | | | | | | | | | | | | | | | | | | | | |
Ratios/Supplemental Data | | | | | | | | | | | | | | | | | | | | |
Net assets, end of period (in thousands) | | $ | 425,604 | | | $ | 541,970 | | | $ | 2,648,636 | | | $ | 515,297 | | | $ | 177,026 | |
Average net assets (in thousands) | | $ | 488,532 | | | $ | 1,470,447 | | | $ | 1,144,581 | | | $ | 329,045 | | | $ | 178,263 | |
Ratios to average net assets:4 | | | | | | | | | | | | | | | | | | | | |
Net investment income | | | 0.39% | | | | 0.01% | | | | 0.01% | | | | 0.01% | | | | 0.01% | |
Total expenses | | | 0.59% | 5 | | | 0.55% | 5 | | | 0.53% | 5 | | | 0.57% | 5 | | | 0.61% | |
Expenses after payments, waivers and/or reimbursements and reduction to custodian expenses | | | 0.50% | | | | 0.35% | | | | 0.19% | | | | 0.15% | | | | 0.22% | |
1. Per share amounts calculated based on the average shares outstanding during the period.
2. Less than $0.005 per share.
3. Assumes an initial investment on the business day before the first day of the fiscal period, with all dividends and distributions reinvested in additional shares on the reinvestment date, and redemption at the net asset value calculated on the last business day of the fiscal period. Total returns are not annualized for periods less than one full year. Total return information does not reflect expenses that apply at the separate account level or to related insurance products. Inclusion of these charges would reduce the total return figures for all periods shown. Returns do not reflect the deduction of taxes that a shareholder would pay on fund distributions or the redemption of fund shares.
4. Annualized for periods less than one full year.
5. Total expenses including indirect expenses from affiliated fund fees and expenses were as follows:
| | | | | | |
| | Year Ended December 31, 2017 | | | 0.59% | |
| | Year Ended December 31, 2016 | | | 0.55% | |
| | Year Ended December 31, 2015 | | | 0.53% | |
| | Year Ended December 31, 2014 | | | 0.57% | |
See accompanying Notes to Financial Statements.
11 OPPENHEIMER GOVERNMENT MONEY FUND/VA
NOTES TO FINANCIAL STATEMENTS December 31, 2017
1. Organization
Oppenheimer Government Money Fund/VA (the “Fund”), a separate series of Oppenheimer Variable Account Funds, is a diversified open-end management investment company registered under the Investment Company Act of 1940 (“1940 Act”), as amended. The Fund’s investment objective is to seek income consistent with stability of principal. The Fund’s investment adviser is OFI Global Asset Management, Inc. (“OFI Global” or the “Manager”), a wholly-owned subsidiary of OppenheimerFunds, Inc. (“OFI” or the “Sub-Adviser”). The Manager has entered into a sub-advisory agreement with OFI. Shares of the Fund are sold only to separate accounts of life insurance companies.
The following is a summary of significant accounting policies followed in the Fund’s preparation of financial statements in accordance with accounting principles generally accepted in the United States (“U.S. GAAP”).
2. Significant Accounting Policies
Security Valuation. All investments in securities are recorded at their estimated fair value, as described in Note 3.
Dividends and Distributions to Shareholders. Dividends and distributions to shareholders, which are determined in accordance with income tax regulations and may differ from U.S. GAAP, are recorded on the ex-dividend date. Income distributions, if any, are declared daily and paid monthly. Capital gain distributions, if any, are declared and paid annually but may be paid at other times to maintain the net asset value per share at $1.00.
Investment Income. Interest income is recognized on an accrual basis. Discount and premium, which are included in interest income on the Statement of Operations, are amortized or accreted daily.
Custodian Fees. “Custodian fees and expenses” in the Statement of Operations may include interest expense incurred by the Fund on any cash overdrafts of its custodian account during the period. Such cash overdrafts may result from the effects of failed trades in portfolio securities and from cash outflows resulting from unanticipated shareholder redemption activity. The Fund pays interest to its custodian on such cash overdrafts, to the extent they are not offset by positive cash balances maintained by the Fund, at a rate equal to the Federal Funds Rate plus 2.00%. The “Reduction to custodian expenses” line item, if applicable, represents earnings on cash balances maintained by the Fund during the period. Such interest expense and other custodian fees may be paid with these earnings.
Security Transactions. Security transactions are recorded on the trade date. Realized gains and losses on securities sold are determined on the basis of identified cost.
Indemnifications. The Fund’s organizational documents provide current and former Trustees and officers with a limited indemnification against liabilities arising in connection with the performance of their duties to the Fund. In the normal course of business, the Fund may also enter into contracts that provide general indemnifications. The Fund’s maximum exposure under these arrangements is unknown as this would be dependent on future claims that may be made against the Fund. The risk of material loss from such claims is considered remote.
Federal Taxes. The Fund intends to comply with provisions of the Internal Revenue Code applicable to regulated investment companies and to distribute substantially all of its investment company taxable income to shareholders. Therefore, no federal income or excise tax provision is required. The Fund files income tax returns in U.S. federal and applicable state jurisdictions. The statute of limitations on the Fund’s tax return filings generally remains open for the three preceding fiscal reporting period ends. The Fund has analyzed its tax positions for the fiscal year ended December 31, 2017, including open tax years, and does not believe there are any uncertain tax positions requiring recognition in the Fund’s financial statements.
The tax components of capital shown in the following table represent distribution requirements the Fund must satisfy under the income tax regulations, losses the Fund may be able to offset against income and gains realized in future years for federal income tax purposes.
| | | | |
Undistributed Net Investment Income | | Undistributed Long-Term Gain | | Accumulated Loss Carryforward1,2,3 |
| $179,456 | | $— | | $581 |
1. At period end, the Fund had $581 of net capital loss carryforward available to offset future realized capital gains, if any, and thereby reduce future taxable gain distributions. Details of the capital loss carryforwards are included in the table below. Capital loss carryovers with no expiration, if any, must be utilized prior to those with expiration dates.
| | | | |
| Expiring | | | |
No expiration | | | $ 581 | |
2. During the reporting period, the Fund did not utilize any capital loss carryforwards.
3. During the previous reporting period, the Fund did not utilize any capital loss carryforwards.
Net investment income (loss) and net realized gain (loss) may differ for financial statement and tax purposes. The character of dividends and distributions made during the fiscal year from net investment income or net realized gains are determined in accordance with federal income tax requirements, which may differ from the character of net investment income or net realized gains presented in those financial statements in accordance with U.S. GAAP. Also, due to timing of dividends and distributions, the fiscal year in which amounts are distributed may differ from the fiscal year in which the income or net realized gain was recorded by the Fund.
12 OPPENHEIMER GOVERNMENT MONEY FUND/VA
2. Significant Accounting Policies (Continued)
Accordingly, the following amounts have been reclassified for the reporting period. Net assets of the Fund were unaffected by the reclassifications.
| | |
Increase to Paid-in Capital | | Reduction to Accumulated Net Investment Income |
$25,588 | | $25,588 |
The tax character of distributions paid during the reporting periods:
| | | | | | | | |
| | | Year Ended December 31, 2017 | | | Year Ended December 31, 2016 | |
Distributions paid from: Ordinary income | | $ | 1,903,588 | | | $ | 153,515 | |
Use of Estimates. The preparation of financial statements in conformity with U.S. GAAP requires management to make estimates and assumptions that affect the reported amounts of assets and liabilities and disclosure of contingent assets and liabilities at the date of the financial statements and the reported amounts of increases and decreases in net assets from operations during the reporting period. Actual results could differ from those estimates.
3. Securities Valuation
The Fund calculates the net asset value of its shares as of 4:00 P.M. Eastern time, on each day the New York Stock Exchange (the “Exchange”) is open for trading, except in the case of a scheduled early closing of the Exchange, in which case the Fund will calculate net asset value of the shares as of the scheduled early closing time of the Exchange.
The Fund’s Board has adopted procedures for the valuation of the Fund’s securities and has delegated the day-to-day responsibility for valuation determinations under those procedures to the Manager. The Manager has established a Valuation Committee which is responsible for determining a fair valuation for any security for which market quotations are not readily available. The Valuation Committee’s fair valuation determinations are subject to review, approval and ratification by the Fund’s Board at least quarterly or more frequently, if necessary.
Valuation Methods and Inputs
Securities are valued at cost adjusted by the amortization of discount or premium to maturity (amortized cost), which approximates market value. If amortized cost is determined not to approximate market value, the fair value of the portfolio securities will be determined under procedures approved by the Fund’s Board of Trustees.
Securities for which market quotations are not readily available, or when a significant event has occurred that would materially affect the value of the security, are fair valued either (i) by a standardized fair valuation methodology applicable to the security type or the significant event as previously approved by the Valuation Committee and the Fund’s Board or (ii) as determined in good faith by the Manager’s Valuation Committee. The Valuation Committee considers all relevant facts that are reasonably available, through either public information or information available to the Manager, when determining the fair value of a security. Those standardized fair valuation methodologies include, but are not limited to, valuing securities at the last sale price or initially at cost and subsequently adjusting the value based on: changes in company specific fundamentals, changes in an appropriate securities index, or changes in the value of similar securities which may be further adjusted for any discounts related to security-specific resale restrictions. When possible, such methodologies use observable market inputs such as unadjusted quoted prices of similar securities, observable interest rates, currency rates and yield curves. The methodologies used for valuing securities are not necessarily an indication of the risks associated with investing in those securities nor can it be assured that the Fund can obtain the fair value assigned to a security if it were to sell the security.
Classifications
Each investment asset or liability of the Fund is assigned a level at measurement date based on the significance and source of the inputs to its valuation. Various data inputs may be used in determining the value of each of the Fund’s investments as of the reporting period end. These data inputs are categorized in the following hierarchy under applicable financial accounting standards:
1) Level 1-unadjusted quoted prices in active markets for identical assets or liabilities (including securities actively traded on a securities exchange)
2) Level 2-inputs other than unadjusted quoted prices that are observable for the asset or liability (such as unadjusted quoted prices for similar assets and market corroborated inputs such as interest rates, prepayment speeds, credit risks, etc.)
3) Level 3-significant unobservable inputs (including the Manager’s own judgments about assumptions that market participants would use in pricing the asset or liability).
The inputs used for valuing securities are not necessarily an indication of the risks associated with investing in those securities.
The Fund classifies each of its investments in investment companies which are publicly offered as Level 1. Investment companies that are not publicly offered, if any, are measured using net asset value and are classified as Level 2 in the fair value hierarchy.
The table below categorizes amounts that are included in the Fund’s Statement of Assets and Liabilities at period end based on valuation input level:
13 OPPENHEIMER GOVERNMENT MONEY FUND/VA
NOTES TO FINANCIAL STATEMENTS Continued
3. Securities Valuation (Continued)
| | | | | | | | | | | | | | | | |
| | | Level 1—
Unadjusted
Quoted Prices | | | Level 2— Other Significant
Observable
Inputs | | | Level 3—
Significant
Unobservable
Inputs | | | Value | |
Assets Table | | | | | | | | | | | | | | | | |
Investments, at Value: | | | | | | | | | | | | | | | | |
Short-Term Notes/Commercial Paper | | $ | — | | | $ | 18,360,000 | | | $ | — | | | $ | 18,360,000 | |
U.S. Government Agencies | | | — | | | | 261,100,258 | | | | — | | | | 261,100,258 | |
U.S. Government Obligations | | | — | | | | 1,499,654 | | | | — | | | | 1,499,654 | |
Repurchase Agreement | | | — | | | | 138,100,000 | | | | — | | | | 138,100,000 | |
Investment Company | | | 15,295,885 | | | | — | | | | — | | | | 15,295,885 | |
| | | | |
Total Assets | | $ | 15,295,885 | | | $ | 419,059,912 | | | $ | — | | | $ | 434,355,797 | |
| | | | |
4. Investments and Risks
Investments in Affiliated Funds. The Fund is permitted to invest in other mutual funds advised by the Manager (“Affiliated Funds”). Affiliated Funds are open-end management investment companies registered under the 1940 Act, as amended. The Manager is the investment adviser of, and the Sub-Adviser provides investment and related advisory services to, the Affiliated Funds. When applicable, the Fund’s investments in Affiliated Funds are included in the Statement of Investments. Shares of Affiliated Funds are valued at their net asset value per share. As a shareholder, the Fund is subject to its proportional share of the Affiliated Funds’ expenses, including their management fee. The Manager will waive fees and/or reimburse Fund expenses in an amount equal to the indirect management fees incurred through the Fund’s investment in the Affiliated Funds.
Each of the Affiliated Funds in which the Fund invests has its own investment risks, and those risks can affect the value of the Fund’s investments and therefore the value of the Fund’s shares. To the extent that the Fund invests more of its assets in one Affiliated Fund than in another, the Fund will have greater exposure to the risks of that Affiliated Fund.
Investments in Money Market Instruments. The Fund is permitted to invest its free cash balances in money market instruments to provide liquidity or for defensive purposes. The Fund may invest in money market instruments by investing in Class E shares of Oppenheimer Institutional Government Money Market Fund (“IGMMF”), which is an Affiliated Fund. IGMMF is regulated as a money market fund under the 1940 Act, as amended. The Fund may also invest in money market instruments directly or in other affiliated or unaffiliated money market funds.
Securities on a When-Issued or Delayed Delivery Basis. The Fund may purchase securities on a “when-issued” basis, and may purchase or sell securities on a “delayed delivery” basis. “When-issued” or “delayed delivery” refers to securities whose terms and indenture are available and for which a market exists, but which are not available for immediate delivery. Delivery and payment for securities that have been purchased by the Fund on a when-issued basis normally takes place within six months and possibly as long as two years or more after the trade date. During this period, such securities do not earn interest, are subject to market fluctuation and may increase or decrease in value prior to their delivery. The purchase of securities on a when-issued basis may increase the volatility of the Fund’s net asset value to the extent the Fund executes such transactions while remaining substantially fully invested. When the Fund engages in when-issued or delayed delivery transactions, it relies on the buyer or seller, as the case may be, to complete the transaction. Their failure to do so may cause the Fund to lose the opportunity to obtain or dispose of the security at a price and yield it considers advantageous. The Fund may also sell securities that it purchased on a when-issued basis or forward commitment prior to settlement of the original purchase.
At period end, the Fund had purchased securities issued on a when-issued or delayed delivery basis as follows:
| | | | |
| | | When-Issued or
Delayed Delivery
Basis Transactions | |
Purchased securities | | | $7,031,128 | |
Shareholder Concentration. At period end, one shareholder owned 20% or more of the Fund’s total outstanding shares.
5. Market Risk Factors
The Fund’s investments in securities and/or financial derivatives may expose the Fund to various market risk factors:
Commodity Risk. Commodity risk relates to the change in value of commodities or commodity indexes as they relate to increases or decreases in the commodities market. Commodities are physical assets that have tangible properties. Examples of these types of assets are crude oil, heating oil, metals, livestock, and agricultural products.
Credit Risk. Credit risk relates to the ability of the issuer of debt to meet interest and principal payments, or both, as they come due. In general, lower-grade, higher-yield debt securities are subject to credit risk to a greater extent than lower-yield, higher-quality securities.
Equity Risk. Equity risk relates to the change in value of equity securities as they relate to increases or decreases in the general market.
Foreign Exchange Rate Risk. Foreign exchange rate risk relates to the change in the U.S. dollar value of a security held that is denominated in a
14 OPPENHEIMER GOVERNMENT MONEY FUND/VA
5. Market Risk Factors (Continued)
foreign curre.ncy. The U.S. dollar value of a foreign currency denominated security will decrease as the dollar appreciates against the currency, while the U.S. dollar value will increase as the dollar depreciates against the currency.
Interest Rate Risk. Interest rate risk refers to the fluctuations in value of fixed-income securities resulting from the inverse relationship between price and yield. For example, an increase in general interest rates will tend to reduce the market value of already issued fixed-income investments, and a decline in general interest rates will tend to increase their value. In addition, debt securities with longer maturities, which tend to have higher yields, are subject to potentially greater fluctuations in value from changes in interest rates than obligations with shorter maturities.
Volatility Risk. Volatility risk refers to the magnitude of the movement, but not the direction of the movement, in a financial instrument’s price over a defined time period. Large increases or decreases in a financial instrument’s price over a relative time period typically indicate greater volatility risk, while small increases or decreases in its price typically indicate lower volatility risk.
6. Shares of Beneficial Interest
The Fund has authorized an unlimited number of $0.001 par value shares of beneficial interest. Transactions in shares of beneficial interest were as follows:
| | | | | | | | | | | | | | | | |
| | | Year Ended December 31, 2017 | | | Year Ended December 31, 2016 | |
| | | Shares | | | Amount | | | Shares | | | Amount | |
Sold | | | 306,082,431 | | | $ | 306,082,431 | | | | 1,180,358,383 | | | $ | 1,180,358,383 | |
Dividends and/or distributions reinvested | | | 1,769,951 | | | | 1,769,951 | | | | 159,576 | | | | 159,576 | |
Redeemed | | | (424,216,869 | ) | | | (424,216,869 | ) | | | (3,287,178,348 | ) | | | (3,287,178,348 | ) |
| | | | |
Net decrease | | | (116,364,487 | ) | | $ | (116,364,487 | ) | | | (2,106,660,389 | ) | | $ | (2,106,660,389 | ) |
| | | | |
7. Fees and Other Transactions with Affiliates
Management Fees. Under the investment advisory agreement, the Fund pays the Manager a management fee based on the daily net assets of the Fund at an annual rate as shown in the following table:
| | | | |
| Fee Schedule | |
Up to $500 million | | | 0.450 | % |
Next $500 million | | | 0.425 | |
Next $500 million | | | 0.400 | |
Over $1.5 billion | | | 0.375 | |
The Fund’s effective management fee for the reporting period was 0.45% of average annual net assets before any applicable waivers.
Sub-Adviser Fees. The Manager has retained the Sub-Adviser to provide the day-to-day portfolio management of the Fund. Under the Sub-Advisory Agreement, the Manager pays the Sub-Adviser an annual fee in monthly installments, equal to a percentage of the investment management fee collected by the Manager from the Fund, which shall be calculated after any investment management fee waivers. The fee paid to the Sub-Adviser is paid by the Manager, not by the Fund.
Transfer Agent Fees. OFI Global (the “Transfer Agent”) serves as the transfer and shareholder servicing agent for the Fund. The Fund pays the Transfer Agent a fee based on annual net assets. Fees incurred and average net assets with respect to these services are detailed in the Statement of Operations and Financial Highlights, respectively.
Sub-Transfer Agent Fees. The Transfer Agent has retained Shareholder Services, Inc., a wholly-owned subsidiary of OFI (the “Sub-Transfer Agent”), to provide the day-to-day transfer agent and shareholder servicing of the Fund. Under the Sub-Transfer Agency Agreement, the Transfer Agent pays the Sub-Transfer Agent an annual fee in monthly installments, equal to a percentage of the transfer agent fee collected by the Transfer Agent from the Fund, which shall be calculated after any applicable fee waivers. The fee paid to the Sub-Transfer Agent is paid by the Transfer Agent, not by the Fund.
Trustees’ Compensation. The Fund’s Board of Trustees (“Board”) has adopted a compensation deferral plan for Independent Trustees that enables Trustees to elect to defer receipt of all or a portion of the annual compensation they are entitled to receive from the Fund. For purposes of determining the amount owed to the Trustees under the plan, deferred amounts are treated as though equal dollar amounts had been invested in shares of the Fund or in other Oppenheimer funds selected by the Trustees. The Fund purchases shares of the funds selected for deferral by the Trustees in amounts equal to his or her deemed investment, resulting in a Fund asset equal to the deferred compensation liability. Such assets are included as a component of “Other” within the asset section of the Statement of Assets and Liabilities. Deferral of Trustees’ fees under the plan will not affect the net assets of the Fund and will not materially affect the Fund’s assets, liabilities or net investment income per share. Amounts will be deferred until distributed in accordance with the compensation deferral plan.
Waivers and Reimbursements of Expenses. The Manager has voluntarily undertaken to waive fees and/or reimburse expenses to the extent necessary to assist the Fund in attempting to maintain a positive yield. There is no guarantee that the Fund will maintain a positive yield. The Manager has contractually agreed to limit the Fund’s expenses after payments, waivers and/or reimbursements and reduction to custodian expenses, excluding
15 OPPENHEIMER GOVERNMENT MONEY FUND/VA
NOTES TO FINANCIAL STATEMENTS Continued
7. Fees and Other Transactions with Affiliates (Continued)
any applicable dividend expense, taxes, interest and fees from borrowing, any subsidiary expenses, Acquired Fund Fees and Expenses, brokerage commissions, unusual and infrequent expenses and certain other Fund expenses; so that those expenses, as percentages of daily net assets, will not exceed the annual rate of 0.50%. During the reporting period, the Manager waived and/or reimbursed the Fund $427,655.
This fee waiver and/or expense reimbursement may not be amended or withdrawn for one year from the date of the Fund’s prospectus, unless approved by the Board.
The Manager is permitted to recapture previously waived and/or reimbursed fees in any given fiscal year if the recapture would not: 1) cause the Fund to generate a negative daily yield, and 2) exceed amounts previously waived and/or reimbursed under this arrangement during the current and prior three fiscal years. The reimbursement to the Manager of such previous waivers and reimbursements would not include any portion of distribution and/or service fees. At period end, the following waived and/or reimbursed amounts are eligible for recapture:
| | | | |
| Expiration Date | | | |
| |
December 31, 2018 | | $ | 3,773,037 | |
December 31, 2019 | | | 2,982,813 | |
December 31, 2020 | | | 427,655 | |
The Manager has not recaptured any previously waived and/or reimbursed amounts during the reporting period.
The Manager will waive fees and/or reimburse Fund expenses in an amount equal to the indirect management fees incurred through the Fund’s investment in IGMMF. During the reporting period, the Manager waived fees and/or reimbursed the Fund $12,419 for IGMMF management fees. This fee waiver and/or expense reimbursement may not be amended or withdrawn for one year from the date of the Fund’s prospectus, unless approved by the Board.
8. Repurchase Agreements
In a repurchase transaction, a Fund buys a security and simultaneously sells it back to an approved institution for delivery on an agreed-upon future date. The resale price exceeds the purchase price by an amount that reflects an agreed-upon interest rate effective for the period during which the repurchase agreement is in effect. Approved institutions include U.S. commercial banks, U.S. branches of foreign banks or broker-dealers that have been designated as primary dealers in government securities. They must meet credit requirements set by the investment adviser from time to time. Repurchase agreements must be fully collateralized. However, if the seller fails to pay the repurchase price on the delivery date, a Fund may incur costs in disposing of the collateral and may experience losses if there is any delay in its ability to do so. If the default on the part of the seller is due to its bankruptcy, a Fund’s ability to liquidate the collateral may be delayed or limited.
The following is a summary by counterparty of the market value of Borrowings and Other Financing Transactions and collateral (received) as of period end:
| | | | | | | | | | | | |
| Counterparty | | Repurchase Agreement
Proceeds to be Received 1 | | | Collateral Received1 | | | Net Exposure2 | |
| |
Repurchase Agreements | | | | | | | | | | | | |
Credit Agricole Corp. & Investment Bank | | | $5,900,920 | | | | $(6,018,938) | | | | $(118,018) | |
Credit Agricole Corp. & Investment Bank | | | 4,001,185 | | | | (4,081,208) | | | | (80,023) | |
Deutsche Bank Securities, Inc. | | | 5,003,585 | | | | (5,103,657) | | | | (100,072) | |
Deutsche Bank Securities, Inc. | | | 1,000,177 | | | | (1,020,180) | | | | (20,003) | |
Deutsche Bank Securities, Inc. | | | 3,000,530 | | | | (3,060,541) | | | | (60,011) | |
INTL FCStone Financial, Inc. | | | 5,001,313 | | | | (5,256,549) | | | | (255,236) | |
INTL FCStone Financial, Inc. | | | 10,002,625 | | | | (10,203,343) | | | | (200,718) | |
RBC Dominion Securities, Inc. | | | 2,000,528 | | | | (2,040,539) | | | | (40,011) | |
RBC Dominion Securities, Inc. | | | 35,205,398 | | | | (35,909,506) | | | | (704,108) | |
South Street Securities LLC | | | 50,008,612 | | | | (51,008,784) | | | | (1,000,172) | |
TD Securities (USA) LLC | | | 10,001,570 | | | | (10,201,602) | | | | (200,032) | |
TD Securities (USA) LLC | | | 7,001,182 | | | | (7,141,205) | | | | (140,023) | |
| | | | | | | | | | | | |
| | | $138,127,625 | | | | | | | | | |
| | | | | | | | | | | | |
1. Includes accrued interest.
2. Net exposure represents the net receivable/payable that would be due from the counterparty in the event of default.
16 OPPENHEIMER GOVERNMENT MONEY FUND/VA
REPORT OF INDEPENDENT REGISTERED PUBLIC ACCOUNTING FIRM
To the Shareholders and Board of Trustees
Oppenheimer Variable Account Funds:
Opinion on the Financial Statements
We have audited the accompanying statement of assets and liabilities of Oppenheimer Government Money Fund/VA, a separate series of Oppenheimer Variable Account Funds, (the “Fund”), including the statement of investments, as of December 31, 2017, the related statement of operations for the year then ended, the statements of changes in net assets for each of the years in the two year period then ended, and the related notes (collectively, the “financial statements”) and the financial highlights for each of the years in the five year period then ended. In our opinion, the financial statements and financial highlights present fairly, in all material respects, the financial position of the Fund as of December 31, 2017, the results of its operations for the year then ended, the changes in its net assets for each of the years in the two year period then ended, and the financial highlights for each of the years in the five year period then ended, in conformity with U.S. generally accepted accounting principles.
Basis for Opinion
These financial statements and financial highlights are the responsibility of the Fund’s management. Our responsibility is to express an opinion on these financial statements and financial highlights based on our audits. We are a public accounting firm registered with the Public Company Accounting Oversight Board (United States) (“PCAOB”) and are required to be independent with respect to the Fund in accordance with the U.S. federal securities laws and the applicable rules and regulations of the Securities and Exchange Commission and the PCAOB.
We conducted our audits in accordance with the standards of the PCAOB. Those standards require that we plan and perform the audit to obtain reasonable assurance about whether the financial statements and financial highlights are free of material misstatement, whether due to error or fraud. Our audits included performing procedures to assess the risks of material misstatement of the financial statements and financial highlights, whether due to error or fraud, and performing procedures that respond to those risks. Such procedures included examining, on a test basis, evidence regarding the amounts and disclosures in the financial statements and financial highlights. Such procedures also included confirmation of securities owned as of December 31, 2017, by correspondence with the custodian, brokers and the transfer agent, or by other appropriate auditing procedures. Our audits also included evaluating the accounting principles used and significant estimates made by management, as well as evaluating the overall presentation of the financial statements and financial highlights. We believe that our audits provide a reasonable basis for our opinion.
KPMGLLP
We have not been able to determine the specific year that we began serving as the auditor of one or more Oppenheimer Funds investment companies, however we are aware that we have served as the auditor of one or more Oppenheimer Funds investment companies since at least 1969.
Denver, Colorado
February 13, 2018
17 OPPENHEIMER GOVERNMENT MONEY FUND/VA
FEDERAL INCOME TAX INFORMATION Unaudited
In early 2018, if applicable, shareholders of record received information regarding all dividends and distributions paid to them by the Fund during calendar year 2017.
The foregoing information is presented to assist shareholders in reporting distributions received from the Fund to the Internal Revenue Service. Because of the complexity of the federal regulations which may affect your individual tax return and the many variations in state and local tax regulations, we recommend that you consult your tax advisor for specific guidance.
18 OPPENHEIMER GOVERNMENT MONEY FUND/VA
BOARD APPROVAL OF THE FUND’S INVESTMENT ADVISORY AND SUB-ADVISORY AGREEMENTS Unaudited
The Fund has entered into an investment advisory agreement with OFI Global Asset Management, Inc. (“OFI Global” or the “Adviser”), a wholly-owned subsidiary of OppenheimerFunds, Inc. (“OFI” or the “Sub-Adviser”) (“OFI Global” and “OFI” together, the “Managers”) and OFI Global has entered into a sub-advisory agreement with OFI whereby OFI provides investment sub-advisory services to the Fund (collectively, the “Agreements”). Each year, the Board of Trustees (the “Board”), including a majority of the independent Trustees, is required to determine whether to approve the terms of the Agreements and the renewal thereof. The Investment Company Act of 1940, as amended, requires that the Board request and evaluate, and that the Managers provide, such information as may be reasonably necessary to evaluate the terms of the Agreements. The Board employs an independent consultant to prepare a report that provides information, including comparative information that the Board requests for that purpose. In addition to in-person meetings focused on this evaluation, the Board receives information throughout the year regarding Fund services, fees, expenses and performance.
The Managers and the independent consultant provided information to the Board on the following factors: (i) the nature, quality and extent of the Managers’ services, (ii) the comparative investment performance of the Fund and the Managers, (iii) the fees and expenses of the Fund, including comparative fee and expense information, (iv) the profitability of the Managers and their affiliates, including an analysis of the cost of providing services, (v) whether economies of scale are realized as the Fund grows and whether fee levels reflect these economies of scale for Fund investors and (vi) other benefits to the Managers from their relationship with the Fund. The Board was aware that there are alternatives to retaining the Managers.
Outlined below is a summary of the principal information considered by the Board as well as the Board’s conclusions.
Nature, Quality and Extent of Services. The Board considered information about the nature, quality and extent of the services provided to the Fund and information regarding the Managers’ key personnel who provide such services. The Managers’ duties include providing the Fund with the services of the portfolio managers and the Sub-Adviser’s investment team, who provide research, analysis and other advisory services in regard to the Fund’s investments; and securities trading services. OFI Global is responsible for oversight of third-party service providers; monitoring compliance with applicable Fund policies and procedures and adherence to the Fund’s investment restrictions; risk management; and oversight of the Sub-Adviser. OFI Global is also responsible for providing certain administrative services to the Fund. Those services include providing and supervising all administrative and clerical personnel who are necessary in order to provide effective corporate administration for the Fund; compiling and maintaining records with respect to the Fund’s operations; preparing and filing reports required by the U.S. Securities and Exchange Commission; preparing periodic reports regarding the operations of the Fund for its shareholders; preparing proxy materials for shareholder meetings; and preparing the registration statements required by federal and state securities laws for the sale of the Fund’s shares. OFI Global also provides the Fund with office space, facilities and equipment.
The Board also considered the quality of the services provided and the quality of the Managers’ resources that are available to the Fund. The Board took account of the fact that the Sub-Adviser has over fifty years of experience as an investment adviser and that its assets under management rank it among the top mutual fund managers in the United States. The Board evaluated the Managers’ advisory, administrative, accounting, legal, compliance and risk management services, among other services, and information the Board has received regarding the experience and professional qualifications of the Managers’ key personnel and the size and functions of their staff. In its evaluation of the quality of the portfolio management services provided, the Board considered the experience of Christopher Proctor and Adam Wilde, the portfolio managers for the Fund, and the Sub-Adviser’s investment team and analysts. The Board members also considered the totality of their experiences with the Managers as directors or trustees of the Fund and other funds advised by the Managers. The Board considered information regarding the quality of services provided by affiliates of the Managers, which the Board members have become knowledgeable about through their experiences with the Managers and in connection with the review or renewal of the Fund’s service agreements or service providers. The Board concluded, in light of the Managers’ experience, reputation, personnel, operations and resources that the Fund benefits from the services provided under the Agreements.
Investment Performance of the Managers and the Fund. Throughout the year, the Managers provided information on the investment performance of the Fund, the Adviser and the Sub-Adviser, including comparative performance information. The Board also reviewed information, prepared by the Managers and by the independent consultant, comparing the Fund’s historical performance to relevant market indices and to the performance of other money market taxable category funds. The Board considered that the Fund outperformed its category median during the ten-year period, and performed in line with its performance category median during the one-, three- and five-year periods.
Fees and Expenses of the Fund. The Board reviewed the fees paid to the Adviser and the other expenses borne by the Fund. The Board noted that the Adviser, not the Fund, pays the Sub-Adviser’s fee under the sub-advisory agreement. The independent consultant provided comparative data in regard to the fees and expenses of the Fund and other retail front-end load money market taxable money market-taxable funds underlying variable insurance products. In reviewing the fees and expenses charged to the VA funds, the Board considered the Adviser’s assertion that, because there is much greater disparity in the fees and services that may be provided by a manager to a VA fund as opposed to a retail fund, when comparing the expenses of the various VA funds to those of retail funds, it is most appropriate to focus on total expenses (rather than on the management fees). Accordingly, while the Board reviewed and considered all expenses, it focused on total expenses. The Board considered that the Fund’s total expenses, net of waivers, were lower than its peer group median and its category median. The Board also considered that the Fund’s contractual management fee was higher than both its peer group median and its category median. The Board noted that the Adviser has contractually agreed to limit the Fund’s total annual operating expenses so that those expenses, as a percentage of daily net assets, will not exceed the annual rate of 0.50%. This contractual expense limitation may not be amended or withdrawn until one year after the date of the Fund’s prospectus, unless approved by the Board. The Board also considered that the Adviser voluntarily agreed to waive fees to assist the Fund in attempting to maintain a positive yield, although there is no guarantee that the Fund will maintain a positive yield. This voluntary fee waiver may be amended or withdrawn at any time without prior notice to shareholders.
Economies of Scale and Profits Realized by the Managers. The Board considered information regarding the Managers’ costs in serving as the Fund’s investment adviser and sub-adviser, including the costs associated with the personnel and systems necessary to manage the Fund, and information regarding the Managers’ profitability from their relationship with the Fund. The Board also considered that the Managers must be able to pay and retain experienced professional personnel at competitive rates to provide quality services to the Fund. The Board reviewed whether the
19 OPPENHEIMER GOVERNMENT MONEY FUND/VA
BOARD APPROVAL OF THE FUND’S INVESTMENT ADVISORY AND SUB-ADVISORY AGREEMENTS Unaudited / Continued
Managers may realize economies of scale in managing and supporting the Fund. The Board noted that the Fund currently has management fee breakpoints, which are intended to share with Fund shareholders economies of scale that may exist as the Fund’s assets grow.
Other Benefits to the Managers. In addition to considering the profits realized by the Managers, the Board considered information that was provided regarding the direct and indirect benefits the Managers receive as a result of their relationship with the Fund, including compensation paid to the Managers’ affiliates.
Conclusions. These factors were also considered by the independent Trustees meeting separately from the full Board, assisted by experienced counsel to the Fund and to the independent Trustees. Fund counsel and the independent Trustees’ counsel are independent of the Managers within the meaning and intent of the Securities and Exchange Commission rules.
Based on its review of the information it received and its evaluations described above, the Board, including a majority of the independent Trustees, decided to continue the Agreements through August 31, 2018. In arriving at its decision, the Board did not identify any factor or factors as being more important than others, but considered all of the above information, and considered the terms and conditions of the Agreements, including the management fees, in light of all the surrounding circumstances.
20 OPPENHEIMER GOVERNMENT MONEY FUND/VA
PORTFOLIO PROXY VOTING POLICIES AND GUIDELINES; UPDATES TO STATEMENTS OF INVESTMENTS Unaudited
The Fund has adopted Portfolio Proxy Voting Policies and Guidelines under which the Fund votes proxies relating to securities (“portfolio proxies”) held by the Fund. A description of the Fund’s Portfolio Proxy Voting Policies and Guidelines is available (i) without charge, upon request, by calling the Fund toll-free at 1.800.CALL OPP (225.5677), (ii) on the Fund’s website at www.oppenheimerfunds.com, and (iii) on the SEC’s website at www.sec.gov. In addition, the Fund is required to file Form N-PX, with its complete proxy voting record for the 12 months ended June 30th, no later than August 31st of each year. The Fund’s voting record is available (i) without charge, upon request, by calling the Fund toll-free at 1.800.CALL OPP (225.5677), and (ii) in the Form N-PX filing on the SEC’s website at www.sec.gov.
The Fund files its complete schedule of portfolio holdings with the SEC for the first quarter and the third quarter of each fiscal year on Form N-Q. The Fund’s Form N-Q filings are available on the SEC’s website at www.sec.gov. Those forms may be reviewed and copied at the SEC’s Public Reference Room in Washington, D.C. Information on the operation of the Public Reference Room may be obtained by calling 1-800-SEC-0330.
21 OPPENHEIMER GOVERNMENT MONEY FUND/VA
TRUSTEES AND OFFICERS Unaudited
| | |
Name, Position(s) Held with the Fund, Length of Service, Year of Birth | | Principal Occupation(s) During the Past 5 Years; Other Trusteeships/Directorships Held; Number of Portfolios in the Fund Complex Currently Overseen |
| |
| INDEPENDENT TRUSTEES | | The address of each Trustee in the chart below is 6803 S. Tucson Way, Centennial, Colorado 80112-3924. Each Trustee serves for an indefinite term, or until his or her resignation, retirement, death or removal. |
| |
Robert J. Malone, Chairman of the Board of Trustees (since 2016), Trustee (since 2002) Year of Birth: 1944 | | Chairman - Colorado Market of MidFirst Bank (since January 2015); Chairman of the Board (2012-2016) and Director (August 2005-January 2016) of Jones International University (educational organization); Trustee of the Gallagher Family Foundation (non-profit organization) (2000-2016); Chairman, Chief Executive Officer and Director of Steele Street Bank Trust (commercial banking) (August 2003-January 2015); Director of Opera Colorado Foundation (non-profit organization) (2008-2012); Director of Colorado UpLIFT (charitable organization) (1986-2010); Director of Jones Knowledge, Inc. (2006-2010); Former Chairman of U.S. Bank-Colorado (subsidiary of U.S. Bancorp and formerly Colorado National Bank) (July 1996-April 1999); Director of Commercial Assets, Inc. (real estate investment trust) (1993-2000); Director of U.S. Exploration, Inc. (oil and gas exploration) (1997-February 2004); Chairman of the Board (1991-1994) and Trustee (1985-1994) of Regis University; and Chairman of the Board (1990-1991) and Member (1984-1999) of Young Presidents Organization. Oversees 54 portfolios in the OppenheimerFunds complex. Mr. Malone has served on the Boards of certain Oppenheimer funds since 2002, during which time he has become familiar with the Fund’s (and other Oppenheimer funds’) financial, accounting, regulatory and investment matters and has contributed to the Boards’ deliberations. |
| |
Andrew J. Donohue, Trustee (since 2017) Year of Birth: 1950 | | Of Counsel, Shearman & Sterling LLP (since September 2017); Chief of Staff of the U.S. Securities and Exchange Commission (regulator) (June 2015-February 2017); Managing Director and Investment Company General Counsel of Goldman Sachs (investment bank) (November 2012-May 2015); Partner at Morgan Lewis & Bockius, LLP (law firm) (March 2011-October 2012); Director of the Division of Investment Management of U.S. Securities and Exchange Commission (regulator) (May 2006-November 2010); Global General Counsel of Merrill Lynch Investment Managers (investment firm) (May 2003-May 2006); General Counsel (October 1991-November 2001) and Executive Vice President (January 1993-November 2001) of OppenheimerFunds, Inc. (investment firm) (June 1991-November 2001). Oversees 54 portfolios in the OppenheimerFunds complex. Mr. Donohue has served on the Boards of certain Oppenheimer funds since 2017, during which time he has become familiar with the Fund’s (and other Oppenheimer funds’) financial, accounting, regulatory and investment matters and has contributed to the Boards’ deliberations. |
| |
Jon S. Fossel, Trustee (since 1990) Year of Birth: 1942 | | Chairman of the Board of Jack Creek Preserve Foundation (non-profit organization) (2005-2015); Director of Jack Creek Preserve Foundation (non-profit organization) (since March 2005); Chairman of the Board (2006-December 2011) and Director (June 2002-December 2011) of UNUMProvident (insurance company); Director of Northwestern Energy Corp. (public utility corporation) (November 2004-December 2009); Director of P.R. Pharmaceuticals (October 1999-October 2003); Director of Rocky Mountain Elk Foundation (non-profit organization) (February 1998-February 2003 and February 2005-February 2007); Chairman and Director (until October 1996) and President and Chief Executive Officer (until October 1995) of the Sub-Adviser; President, Chief Executive Officer and Director of the following: Oppenheimer Acquisition Corp. (“OAC”) (parent holding company of the Sub-Adviser), Shareholders Services, Inc. and Shareholder Financial Services, Inc. (until October 1995). Oversees 54 portfolios in the OppenheimerFunds complex. Mr. Fossel has served on the Boards of certain Oppenheimer funds since 1990, during which time he has become familiar with the Fund’s (and other Oppenheimer funds’) financial, accounting, regulatory and investment matters and has contributed to the Boards’ deliberations. |
| |
Richard F. Grabish, Trustee (since 2012) Year of Birth: 1948 | | Formerly Senior Vice President and Assistant Director of Sales and Marketing (March 1997-December 2007), Director (March 1987-December 2007) and Manager of Private Client Services (June 1985-June 2005) of A.G. Edwards & Sons, Inc. (broker/dealer and investment firm); Chairman and Chief Executive Officer of A.G. Edwards Trust Company, FSB (March 2001-December 2007); President and Vice Chairman of A.G. Edwards Trust Company, FSB (investment adviser) (April 1987-March 2001); President of A.G. Edwards Trust Company, FSB (investment adviser) (June 2005-December 2007). Oversees 54 portfolios in the OppenheimerFunds complex. Mr. Grabish has served on the Boards of certain Oppenheimer funds since 2001, during which time he has become familiar with the Fund’s (and other Oppenheimer funds’) financial, accounting, regulatory and investment matters and has contributed to the Boards’ deliberations. |
| |
Beverly L. Hamilton, Trustee (since 2002) Year of Birth: 1946 | | Trustee of Monterey Institute for International Studies (educational organization) (2000-2014); Board Member of Middlebury College (educational organization) (December 2005-June 2011); Director (1991-2016), Vice Chairman of the Board (2006- 2009) and Chairman of the Board (2010-2013) of American Funds’ Emerging Markets Growth Fund, Inc. (mutual fund); Director of The California Endowment (philanthropic organization) (April 2002-April 2008); Director (February 2002-2005) and Chairman of Trustees (2006-2007) of the Community Hospital of Monterey Peninsula; President of ARCO Investment Management Company (February 1991-April 2000); Member of the investment committees of The Rockefeller Foundation (2001-2006) and The University of Michigan (since 2000); Advisor at Credit Suisse First Boston’s Sprout venture capital unit (venture capital fund) (1994-January 2005); Trustee of MassMutual Institutional Funds (investment company) (1996-June 2004); Trustee of MML Series Investment Fund (investment company) (April 1989-June 2004); Member of the investment committee of Hartford Hospital (2000-2003); and Advisor to Unilever (Holland) pension fund (2000-2003). Oversees 54 portfolios in the OppenheimerFunds complex. Ms. Hamilton has served on the Boards of certain Oppenheimer funds since 2002, during which time she has become familiar with the Fund’s (and other Oppenheimer funds’) financial, accounting, regulatory and investment matters and has contributed to the Boards’ deliberations. |
| |
Victoria J. Herget, Trustee (since 2012) Year of Birth:1951 | | Board Chair (2008-2015) and Director (2004-Present), United Educators (insurance company); Trustee (since 2000) and Chair (since 2010), Newberry Library (independent research library); Trustee, Mather LifeWays (senior living organization) (since 2001); Independent Director of the First American Funds (mutual fund family) (2003-2011); former Managing Director (1993-2001), Principal (1985-1993), Vice President (1978-1985) and Assistant Vice President (1973-1978) of Zurich Scudder Investments (investment adviser) (and its predecessor firms); Trustee (1992-2007), Chair of the Board of Trustees (1999-2007), Investment Committee Chair (1994-1999) and Investment Committee member (2007-2010) of Wellesley College; Trustee, BoardSource (non-profit organization) (2006-2009) and Chicago City Day School (K-8 School) (1994-2005). Oversees 54 portfolios in the OppenheimerFunds complex. Ms. Herget has served on the Boards of certain Oppenheimer funds since 2012, during which time she has become familiar with the Fund’s (and other Oppenheimer funds’) financial, accounting, regulatory and investment matters and has contributed to the Boards’ deliberations. |
22 OPPENHEIMER GOVERNMENT MONEY FUND/VA
| | |
F. William Marshall, Jr., Trustee (since 2000) Year of Birth: 1942 | | Trustee Emeritus of Worcester Polytech Institute (WPI) (private university) (since 2009); Trustee of MassMutual Select Funds (formerly MassMutual Institutional Funds) (investment company) (1996-2015), MML Series Investment Fund (investment company) (1996-2015) and Mass Mutual Premier Funds (investment company) (January 2012-December 2015); President and Treasurer of the SIS Charitable Fund (private charitable fund) (January 1999-March 2011); Former Trustee of WPI (1985-2008); Former Chairman of the Board (2004-2006) and Former Chairman of the Investment Committee of WPI (1994-2008); Chairman of SIS Family Bank, F.S.B. (formerly SIS Bank) (commercial bank) (January 1999-July 1999); Executive Vice President of Peoples Heritage Financial Group, Inc. (commercial bank) (January 1999-July 1999); and Former President and Chief Executive Officer of SIS Bancorp. (1993-1999). Oversees 54 portfolios in the OppenheimerFunds complex. Mr. Marshall has served on the Boards of certain Oppenheimer funds since 2000, during which time he has become familiar with the Fund’s (and other Oppenheimer funds’) financial, accounting, regulatory and investment matters and has contributed to the Boards’ deliberations. |
| |
Karen L. Stuckey, Trustee (since 2012) Year of Birth: 1953 | | Member (since May 2015) of Desert Mountain Community Foundation Advisory Board (non-profit organization); Partner (1990-2012) of PricewaterhouseCoopers LLP (professional services firm) (held various positions 1975-1990); Trustee (1992-2006); member of Executive, Nominating and Audit Committees and Chair of Finance Committee (1992-2006), and Emeritus Trustee (since 2006) of Lehigh University; and member, Women’s Investment Management Forum (professional organization) since inception. Oversees 54 portfolios in the OppenheimerFunds complex. Ms. Stuckey has served on the Boards of certain Oppenheimer funds since 2012, during which time she has become familiar with the Fund’s (and other Oppenheimer funds’) financial, accounting, regulatory and investment matters and has contributed to the Boards’ deliberations. |
| |
James D. Vaughn, Trustee (since 2012) Year of Birth:1945 | | Retired; former managing partner (1994-2001) of Denver office of Deloitte & Touche LLP, (held various positions 1969-1993); Trustee and Chairman of the Audit Committee of Schroder Funds (2003-2012); Board member and Chairman of Audit Committee of AMG National Trust Bank (since 2005); Trustee and Investment Committee member, University of South Dakota Foundation (since 1996); Board member, Audit Committee Member and past Board Chair, Junior Achievement (since 1993); former Board member, Mile High United Way, Boys and Girls Clubs, Boy Scouts, Colorado Business Committee for the Arts, Economic Club of Colorado and Metro Denver Network. Oversees 54 portfolios in the OppenheimerFunds complex. Mr. Vaughn has served on the Boards of certain Oppenheimer funds since 2012, during which time he has become familiar with the Fund’s (and other Oppenheimer funds’) financial, accounting, regulatory and investment matters and has contributed to the Boards’ deliberations. |
| |
| INTERESTED TRUSTEE AND OFFICER | | Mr. Steinmetz is an “Interested Trustee” because he is affiliated with the Manager and the Sub-Adviser by virtue of his positions as Chairman and director of the Sub-Adviser and officer and director of the Manager. Both as a Trustee and as an officer, Mr. Steinmetz serves for an indefinite term, or until his resignation, retirement, death or removal. Mr. Steinmetz’s address is 225 Liberty Street, New York, New York 10281-1008. |
| |
Arthur P. Steinmetz, Trustee (Since 2015), President and Principal Executive Officer (since 2014) Year of Birth: 1958 | | Chairman of the Sub-Adviser (since January 2015); CEO and Chairman of the Manager (since July 2014), President of the Manager (since May 2013), a Director of the Manager (since January 2013), Director of the Sub-Adviser (since July 2014), President, Management Director and CEO of Oppenheimer Acquisition Corp. (the Sub-Adviser’s parent holding company) (since July 2014), and President and Director of OFI SteelPath, Inc. (since January 2013). Chief Investment Officer of the OppenheimerFunds advisory entities from (January 2013-December 2013); Executive Vice President of the Manager (January 2013-May 2013); Chief Investment Officer of the Sub-Adviser (October 2010-December 2012); Chief Investment Officer, Fixed- Income, of the Sub-Adviser (April 2009-October 2010); Executive Vice President of the Sub-Adviser (October 2009-December 2012); Director of Fixed Income of the Sub-Adviser (January 2009-April 2009); and a Senior Vice President of the Sub-Adviser (March 1993-September 2009). An officer of 111 portfolios in the OppenheimerFunds complex. |
| |
| OTHER OFFICERS OF THE FUND | | The addresses of the Officers in the chart below are as follows: for Mss. Lo Bessette, Foxson and Picciotto, 225 Liberty Street, New York, New York 10281-1008, for Messrs. Proctor, Wilde and Petersen, 6803 S. Tucson Way, Centennial, Colorado 80112-3924. Each Officer serves for an indefinite term or until his or her resignation, retirement, death or removal. |
| |
Christopher Proctor, Vice President (since 2010) Year of Birth: 1968 | | Head of the Cash Strategies Team (since July 2013); Senior Vice President of the Sub-Adviser (since July 2013) and Senior Portfolio Manager of the Sub-Adviser (since January 2010). Vice President of the Sub-Adviser (August 2008-July 2013). Vice President at Calamos Asset Management (January 2007-March 2008) and Scudder-Kemper Investments (1999- 2002). Managing Director and Co-Founder of Elmhurst Capital Management (June 2004-January 2007); Senior Manager of Research for Etrade Global Asset Management (2002-2004). A portfolio manager and officer of other portfolios in the OppenheimerFunds complex. |
| |
Adam S. Wilde, Vice President (since 2013) Year of Birth: 1978 | | Vice President of the Sub-Adviser (since May 2011) and a Portfolio Manager of the Sub-Adviser (since July 2013). He served as the head of credit research for the cash strategies team of the Sub-Adviser (from 2011 to 2013), and as an Assistant Vice President and senior research analyst of the Sub-Adviser (from 2008 to 2011). Mr. Wilde served as an intermediate research analyst of the Sub-Adviser (from 2007 to 2008) and served in other analyst roles of the Sub-Adviser (since 2002). Mr. Wilde joined the Sub-Adviser in 2001. A portfolio manager and officer of other portfolios in the OppenheimerFunds complex. |
| |
Cynthia Lo Bessette, Secretary and Chief Legal Officer (since 2016) Year of Birth: 1969 | | Executive Vice President, General Counsel and Secretary of the Manager (since February 2016); Senior Vice President and Deputy General Counsel of the Manager (March 2015-February 2016); Chief Legal Officer of the Sub-Adviser and the Distributor (since February 2016); Vice President, General Counsel and Secretary of Oppenheimer Acquisition Corp. (since February 2016); General Counsel of OFI SteelPath, Inc., OFI Advisors, LLC and Index Management Solutions, LLC (since February 2016); Chief Legal Officer of OFI Global Institutional, Inc., HarbourView Asset Management Corporation, OFI Global Trust Company, Oppenheimer Real Asset Management, Inc., OFI Private Investments Inc., Shareholder Services, Inc. and Trinity Investment Management Corporation (since February 2016); Corporate Counsel (February 2012-March 2015) and Deputy Chief Legal Officer (April 2013-March 2015) of Jennison Associates LLC; Assistant General Counsel (April 2008-September 2009) and Deputy General Counsel (October 2009-February 2012) of Lord Abbett & Co. LLC. An officer of 111 portfolios in the OppenheimerFunds complex. |
23 OPPENHEIMER GOVERNMENT MONEY FUND/VA
TRUSTEES AND OFFICERS Unaudited / Continued
| | |
Jennifer Foxson, Vice President and Chief Business Officer (since 2014) Year of Birth: 1969 | | Senior Vice President of OppenheimerFunds Distributor, Inc. (since June 2014); Vice President of OppenheimerFunds Distributor, Inc. (April 2006-June 2014); Vice President of the Sub-Adviser (January 1998-March 2006); Assistant Vice President of the Sub-Adviser (October 1991-December 1998). An officer of 111 portfolios in the OppenheimerFunds complex. |
| |
Mary Ann Picciotto, Chief Compliance Officer and Chief Anti-Money Laundering Officer (since 2014) Year of Birth: 1973 | | Senior Vice President and Chief Compliance Officer of the Manager (since March 2014); Chief Compliance Officer of the Sub-Adviser, OFI SteelPath, Inc., OFI Global Trust Company, OFI Global Institutional, Inc., Oppenheimer Real Asset Management, Inc., OFI Private Investments, Inc., Harborview Asset Management Corporation, Trinity Investment Management Corporation, and Shareholder Services, Inc. (since March 2014); Managing Director of Morgan Stanley Investment Management Inc. and certain of its various affiliated entities; Chief Compliance Officer of various Morgan Stanley Funds (May 2010-January 2014); Chief Compliance Officer of Morgan Stanley Investment Management Inc. (April 2007-January 2014). An officer of 111 portfolios in the OppenheimerFunds complex. |
| |
Brian S. Petersen, Treasurer and Principal Financial & Accounting Officer (since 2016) Year of Birth: 1970 | | Senior Vice President of the Manager (since January 2017); Vice President of the Manager (January 2013-January 2017); Vice President of the Sub-Adviser (February 2007-December 2012); Assistant Vice President of the Sub-Adviser (August 2002- 2007). An officer of 111 portfolios in the OppenheimerFunds complex. |
The Fund’s Statement of Additional Information contains additional information about the Fund’s Trustees and Officers and is available without charge, upon request, by calling 1.800.988.8287.
24 OPPENHEIMER GOVERNMENT MONEY FUND/VA
THIS PAGE INTENTIONALLY LEFT BLANK.
25 OPPENHEIMER GOVERNMENT MONEY FUND/VA
THIS PAGE INTENTIONALLY LEFT BLANK.
26 OPPENHEIMER GOVERNMENT MONEY FUND/VA
THIS PAGE INTENTIONALLY LEFT BLANK.
27 OPPENHEIMER GOVERNMENT MONEY FUND/VA
OPPENHEIMER GOVERNMENT MONEY FUND/VA
A Series of Oppenheimer Variable Account Funds
| | |
| |
| Manager | | OFI Global Asset Management, Inc. |
| |
| Sub-Adviser | | OppenheimerFunds, Inc. |
| |
| Distributor | | OppenheimerFunds Distributor, Inc. |
| |
| Transfer and | | OFI Global Asset Management, Inc. |
| Shareholder | | |
| Servicing Agent | | |
| |
| Sub-Transfer Agent | | Shareholder Services, Inc. |
| | DBA OppenheimerFunds Services |
| |
| Independent | | KPMG LLP |
| Registered | | |
| Public | | |
| Accounting | | |
| Firm | | |
| |
| Legal Counsel | | Ropes & Gray LLP |
| |
| | Before investing in any of the Oppenheimer funds, investors should carefully consider a fund’s investment objectives, risks, charges and expenses. Fund prospectuses and summary prospectuses contain this and other information about the funds and may be obtained by asking your financial advisor, visiting oppenheimerfunds.com or calling us at 1.800.988.8287. Read prospectuses and summary prospectuses carefully before investing. |
| |
| | © 2018 OppenheimerFunds, Inc. All rights reserved. Oppenheimer funds are distributed by OppenheimerFunds Distributor, Inc. |
| | | | |
| | 
| | |
| | |
| | | December 31, 2017 | | |
| | Oppenheimer | | |
| | Global Strategic Income Fund/VA | | Annual Report |
| | A Series of Oppenheimer Variable Account Funds | | |
| | | |
| | ANNUAL REPORT | | |
| | |
| | Listing of Top Holdings | | |
| | |
| | Fund Performance Discussion | | |
| | |
| | Financial Statements | | |
PORTFOLIO MANAGERS1: Michael Mata, Krishna Memani, Ruta Ziverte, and Chris Kelly, CFA
AVERAGE ANNUAL TOTAL RETURNS FOR THE PERIODS ENDED 12/31/17
| | | | | | | | | | | | | | |
| | | Inception
Date | | 1-Year | | | 5-Year | | | 10-Year | |
Non-Service Shares | | 5/3/93 | | | 6.27 | % | | | 2.59 | % | | | 4.31 | % |
Service Shares | | 3/19/01 | | | 6.04 | | | | 2.33 | | | | 4.03 | |
Bloomberg Barclays U.S. Aggregate Bond Index | | | | | 3.54 | | | | 2.10 | | | | 4.01 | |
Performance data quoted represents past performance, which does not guarantee future results. The investment return and principal value of an investment in the Fund will fluctuate so that an investor’s shares, when redeemed, may be worth more or less than their original cost. Current performance may be lower or higher than the performance quoted. For performance data current to the most recent month end, call us at 1.800.988.8287. The Fund’s total returns should not be expected to be the same as the returns of other funds, whether or not both funds have the same portfolio managers and/or similar names. The Fund’s total returns include changes in share price and reinvested distributions but do not include the charges associated with the separate account products that offer this Fund. Such performance would have been lower if such charges were taken into account. Returns for periods of less than one year are cumulative and not annualized. See Fund prospectuses and summary prospectuses for more information on share classes and sales charges.
TOP HOLDINGS AND ALLOCATIONS
| | |
PORTFOLIO ALLOCATION | | |
|
| Corporate Bonds and Notes | | 40.4% |
|
Investment Companies | | |
Oppenheimer Institutional Government Money Market Fund | | 2.3 |
Oppenheimer Master Event-Linked Bond Fund, LLC | | 2.1 |
Oppenheimer Master Loan Fund, LLC | | 13.2 |
Oppenheimer Ultra-Short Duration Fund | | 7.4 |
|
Mortgage-Backed Obligations | | |
Government Agency | | 12.1 |
Non-Agency | | 9.6 |
|
Foreign Government Obligations | | 7.6 |
|
Asset-Backed Securities | | 3.5 |
|
Preferred Stocks | | 0.7 |
|
Short-Term Notes | | 0.5 |
|
Structured Securities | | 0.3 |
|
Common Stocks | | 0.2 |
|
Corporate Loans | | 0.1 |
|
| Over-the-Counter Interest Rate Swaptions Purchased | | —* |
|
| Exchange-Traded Options Purchased | | —* |
|
| Rights, Warrants and Certificates | | —* |
|
| Over-the-Counter Options Purchased | | —* |
|
| * | Represents a value of less than 0.05%. |
Portfolio holdings and allocations are subject to change. Percentages are as of December 31, 2017, and are based on total market value of investments. For more current Fund holdings, please visit oppen-heimerfunds.com.
REGIONAL ALLOCATION
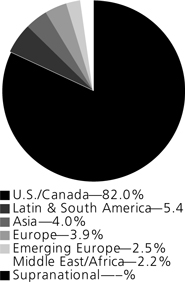
Portfolio holdings and allocations are subject to change. Percentages are as of December 31, 2017, and are based on the total market value of investments.
1. Effective January 24, 2018, the Fund’s Portfolio is managed by Hemant Baijal, the lead portfolio manager, Krishna Memani, Ruta Ziverte and Chris Kelly, CFA, who are primarily responsible for the day-to-day management of the Fund’s investments.
2 OPPENHEIMER GLOBAL STRATEGIC INCOME FUND/VA
Fund Performance Discussion
The Fund’s Non-Service shares produced a return of 6.27% during the reporting period, versus the 3.54% return provided by the Bloomberg Barclays U.S. Aggregate Bond Index.
MARKET OVERVIEW
Global economic data continued to improve during the reporting period. The cyclical uptick is encouraging with
improvements in global investment, trade, and industrial production. Business and consumer confidence are at cyclical highs in many countries. Growth expectations remain upbeat with certain countries, like Canada, exceeding expectations. Latin America (LatAm) is a different story with growth being more challenged overall with the exception of Brazil. LatAm also faces a number of political challenges over the course of the year with elections in several countries and NAFTA negotiations.
In the U.S., the expansion continues as the economy is nearing the Fed’s dual mandate of full employment and price stability. While inflation surprised to the downside for a few months in a row, the Fed sees it as temporary and is moving forward its balance sheet normalization program. In the Fed’s December meeting, the committee continued to signal the expectation for three hikes in 2018 and three to four hikes in 2019. The Treasury curve sold off dramatically as the markets finally began taking the Fed’s message to heart and anticipated a rising interest rate environment. Despite that, credit and equity markets continue to be well-behaved, focusing on improving issuer fundamentals and the prospective benefits from tax reform.
FUND REVIEW
For the one-year reporting period, the Fund’s strongest absolute results stemmed from its exposure to high yield and emerging market credits.
In high yield, the Fund benefited most from its exposure to the healthcare sector. Being overweight the sector along with good security selection added to outperformance. Credit selection was positive during the period and benefited from our exposure to higher beta hospital operators, which outperformed primarily due to event-driven catalysts. Pharmaceutical credits remained topical and were volatile in the period given frequent headlines on potential drug pricing actions from Washington D.C. One of our pharmaceutical holdings in which we have an overweight position benefited from a turn in sentiment as its new management team delivered on asset sales and actions to mitigate the impact of loss of exclusivity (LOE) and encroachment from generics.
Emerging market credit outperformed U.S. and European markets in 2017. The Fund maintained an overall neutral position, but with a greater tilt toward higher-yielding credits, in particular state-owned oil & gas companies that have been repairing their credit profiles, but offered a significant yield advantage over their government bonds. The main contributors to performance included Brazil and Ukraine.
The largest detractors from performance were driven by a small allocation to catastrophe bonds which were affected by the multiple events that struck North America and the Caribbean.
STRATEGY & OUTLOOK
The outlook for the global economy continues to be positive with synchronized global growth close to 3.5%. Credit fundamentals, outside of some distressed sectors like retail and fixed line telecommunications, continue to improve modestly due to earnings growth and a lack of capital expenditures. Higher commodity prices, driven by rising demand, even in oil, have had a positive effect especially on high yield and emerging market credits. Given our expectation that growth will stabilize around current levels, our outlook remains positive. The passage of a tax deal that reduces corporate taxes to 21% will also be positive for most issuers in our view.
There are some potential headwinds to prospective returns. Valuations are rich relative to historical levels, leaving little cushion for potential negative shocks. That valuations appear somewhat rich at this point in the cycle is not unusual in our view, especially when growth is positive and fundamentals are improving. The new Fed Chairman, Jerome Powell, is expected to continue Chair Yellen’s gradual approach to normalization and has been well received by market participants.
Solid economic fundamentals and positive earnings growth lead us to continue to like spread sectors such as corporate credit and securitized credit, though we have reduced our exposure recently based on valuations and have rotated away from some of the higher beta sectors. We like senior floating rate loans for similar reasons. In addition, we believe loans should outperform other credit sectors if the Fed hikes rates at a more aggressive pace than the market expects. In addition, we continue to look for opportunities to add to our positions in mortgage-backed securities (MBS) and commercial mortgage-backed securities (CMBS) on any widening of spreads. Internationally, we expect strong performance from emerging market local bonds over the next few months as we believe
3 OPPENHEIMER GLOBAL STRATEGIC INCOME FUND/VA
the growth differential continues to favor emerging market assets. From a valuation perspective, we believe real yields remain at high enough levels to absorb further modest monetary tightening in developed markets.
Investors should consider the Fund’s investment objective, risks, charges and expenses carefully before investing. The Fund’s prospectus and summary prospectus contain this and other information about the Fund, and may be obtained by asking your financial advisor or calling us at 1.800.988.8287. Read prospectuses and summary prospectuses carefully before investing.
Total returns include changes in share price and reinvestment of dividends and capital gains distributions in a hypothetical investment for the periods shown, but do not include the charges associated with the separate account products that offer this Fund.
The Fund’s investment strategy and focus can change over time. The mention of specific fund holdings does not constitute a recommendation by OppenheimerFunds, Inc. or its affiliates.
Shares of Oppenheimer funds are not deposits or obligations of any bank, are not guaranteed by any bank, are not insured by the FDIC or any other agency, and involve investment risks, including the possible loss of the principal amount invested.
Comparing the Fund’s Performance to the Market. The graphs that follow show the performance of a hypothetical $10,000 investment in each share class of the Fund held until December 31, 2017. Performance is measured over a ten-fiscal-year period for both Classes. Performance information does not reflect charges that apply to separate accounts investing in the Fund. If these charges were taken into account, performance would be lower. The graphs assume that all dividends and capital gains distributions were reinvested in additional shares.
The Fund’s performance is compared to the performance of the Bloomberg Barclays U.S. Aggregate Bond Index, an index of U.S. Government and corporate bonds. The Index is unmanaged and cannot be purchased directly by investors. While index comparisons may be useful to provide a benchmark for the Fund’s performance, it must be noted that the Fund’s investments are not limited to the investments comprising the Index. Index performance includes reinvestment of income, but does not reflect transaction costs, fees, expenses or taxes. Index performance is shown for illustrative purposes only as a benchmark for the Fund’s performance, and does not predict or depict performance of the Fund. The Fund’s performance reflects the effects of the Fund’s business and operating expenses.
4 OPPENHEIMER GLOBAL STRATEGIC INCOME FUND/VA
COMPARISON OF CHANGE IN VALUE OF $10,000 HYPOTHETICAL INVESTMENTS IN:
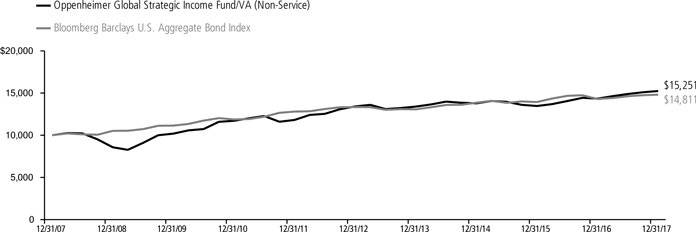
| | | | | | | | | | |
| Average Annual Total Returns of Non-Service Shares of the Fund at 12/31/17 |
| | | | | | | | | | |
| 1-Year | | 6.27% | | 5-Year | | 2.59% | | 10-Year | | 4.31% |
COMPARISON OF CHANGE IN VALUE OF $10,000 HYPOTHETICAL INVESTMENTS IN:
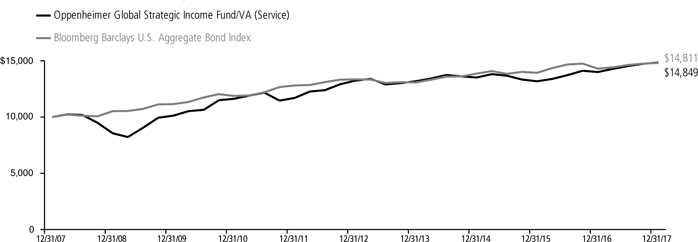
| | | | | | | | | | |
| Average Annual Total Returns of Service Shares of the Fund at 12/31/17 |
| | | | | | | | | | |
| 1-Year | | 6.04% | | 5-Year | | 2.33% | | 10-Year | | 4.03% |
Performance data quoted represents past performance, which does not guarantee future results. The investment return and principal value of an investment in the Fund will fluctuate so that an investor’s shares, when redeemed, may be worth more or less than their original cost. Current performance may be lower or higher than the performance quoted. For performance data current to the most recent month end, call us at 1.800.988.8287. The Fund’s total returns should not be expected to be the same as the returns of other funds, whether or not both funds have the same portfolio managers and/or similar names. The Fund’s total returns include changes in share price and reinvested distributions but do not include the charges associated with the separate account products that offer this Fund. Such performance would have been lower if such charges were taken into account.
5 OPPENHEIMER GLOBAL STRATEGIC INCOME FUND/VA
Fund Expenses
Fund Expenses. As a shareholder of the Fund, you incur two types of costs: (1) transaction costs and (2) ongoing costs, including management fees; distribution and service fees; and other Fund expenses. These examples are intended to help you understand your ongoing costs (in dollars) of investing in the Fund and to compare these costs with the ongoing costs of investing in other mutual funds.
The examples are based on an investment of $1,000.00 invested at the beginning of the period and held for the entire 6-month period ended December 31, 2017.
Actual Expenses. The first section of the table provides information about actual account values and actual expenses. You may use the information in this section for the class of shares you hold, together with the amount you invested, to estimate the expense that you paid over the period. Simply divide your account value by $1,000.00 (for example, an $8,600.00 account value divided by $1,000.00 = 8.60), then multiply the result by the number in the first section under the heading entitled “Expenses Paid During 6 Months Ended December 31, 2017” to estimate the expenses you paid on your account during this period.
Hypothetical Example for Comparison Purposes.
The second section of the table provides information about hypothetical account values and hypothetical expenses based on the Fund’s actual expense ratio for each class of shares, and an assumed rate of return of 5% per year for each class before expenses, which is not the actual return. The hypothetical account values and expenses may not be used to estimate the actual ending account balance or expenses you paid for the period. You may use this information to compare the ongoing costs of investing in the Fund and other funds. To do so, compare this 5% hypothetical example for the class of shares you hold with the 5% hypothetical examples that appear in the shareholder reports of the other funds.
Please note that the expenses shown in the table are meant to highlight your ongoing costs only and do not reflect any charges associated with the separate accounts that offer this Fund. Therefore, the “hypothetical” lines of the table are useful in comparing ongoing costs only, and will not help you determine the relative total costs of owning different funds. In addition, if these separate account charges were included your costs would have been higher.
| | | | | | | | | | | | | | |
| Actual | | Beginning
Account Value
July 1, 2017 | | | Ending Account Value
December 31, 2017 | | | Expenses Paid During 6 Months Ended
December 31, 2017 | | | |
Non-Service shares | | $ | 1,000.00 | | | $ | 1,024.00 | | | $ | 3.83 | | | |
Service shares | | | 1,000.00 | | | | 1,021.30 | | | | 5.11 | | | |
| | | | |
| Hypothetical | | | | | | | | | | | |
(5% return before expenses) | | | | | | | | | | | | | | |
Non-Service shares | | | 1,000.00 | | | | 1,021.42 | | | | 3.83 | | | |
Service shares | | | 1,000.00 | | | | 1,020.16 | | | | 5.10 | | | |
Expenses are equal to the Fund’s annualized expense ratio for that class, multiplied by the average account value over the period, multiplied by 184/365 (to reflect the one-half year period). Those annualized expense ratios, excluding indirect expenses from affiliated funds, based on the 6-month period ended December 31, 2017 are as follows:
| | | | |
| Class | | Expense Ratios | |
Non-Service shares | | | 0.75% | |
Service shares | | | 1.00 | |
The expense ratios reflect voluntary and/or contractual waivers and/or reimbursements of expenses by the Fund’s Manager. Some of these undertakings may be modified or terminated at any time, as indicated in the Fund’s prospectus. The “Financial Highlights” tables in the Fund’s financial statements, included in this report, also show the gross expense ratios, without such waivers or reimbursements and reduction to custodian expenses, if applicable.
6 OPPENHEIMER GLOBAL STRATEGIC INCOME FUND/VA
CONSOLIDATED STATEMENT OF INVESTMENTS December 31, 2017
| | | | | | | | | | | | |
| | | | | | Principal Amount | | | Value | |
| Asset-Backed Securities—3.9% | |
| American Credit Acceptance Receivables Trust: | |
| Series 2014-4, Cl. D, 5.24%, 2/10/221 | | | | | | | $160,000 | | | | $ 160,890 | |
| Series 2015-1, Cl. B, 2.85%, 2/12/211 | | | | | | | 30,142 | | | | 30,152 | |
| Series 2015-3, Cl. B, 3.56%, 10/12/211 | | | | | | | 135,270 | | | | 135,664 | |
| Series 2015-3, Cl. C, 4.84%, 10/12/211 | | | | | | | 580,000 | | | | 591,448 | |
| Series 2015-3, Cl. D, 5.86%, 7/12/221 | | | | | | | 275,000 | | | | 280,874 | |
| Series 2016-4, Cl. B, 2.11%, 2/12/211 | | | | | | | 510,000 | | | | 509,669 | |
| Series 2017-3, Cl. B, 2.25%, 1/11/211 | | | | | | | 135,000 | | | | 134,550 | |
| Series 2017-4, Cl. B, 2.61%, 5/10/211 | | | | | | | 180,000 | | | | 179,919 | |
| Series 2017-4, Cl. C, 2.94%, 1/10/241 | | | | | | | 510,000 | | | | 509,622 | |
| Series 2017-4, Cl. D, 3.57%, 1/10/241 | | | | | | | 438,000 | | | | 437,475 | |
| AmeriCredit Automobile Receivables Trust: | |
| Series 2013-3, Cl. D, 3.00%, 7/8/19 | | | | | | | 410,684 | | | | 411,104 | |
| Series 2013-4, Cl. D, 3.31%, 10/8/19 | | | | | | | 520,000 | | | | 521,775 | |
| Series 2015-2, Cl. D, 3.00%, 6/8/21 | | | | | | | 505,000 | | | | 510,169 | |
| Series 2017-2, Cl. D, 3.42%, 4/18/23 | | | | | | | 830,000 | | | | 839,005 | |
| Series 2017-4, Cl. D, 3.08%, 12/18/23 | | | | | | | 640,000 | | | | 638,077 | |
| Cabela’s Credit Card Master Note Trust: | |
| Series 2013-2A, Cl. A2, 2.127% | |
| [LIBOR01M+65], 8/16/211,2 | | | | | | | 280,000 | | | | 280,972 | |
| Series 2016-1, Cl. A1, 1.78%, 6/15/22 | | | | | | | 870,000 | | | | 865,187 | |
| Series 2016-1, Cl. A2, 2.327% | |
| [LIBOR01M+85], 6/15/222 | | | | | | | 1,690,000 | | | | 1,706,296 | |
| Capital Auto Receivables Asset Trust: | | | | | | | | | | | | |
| Series 2014-1, Cl. D, 3.39%, 7/22/19 | | | | | | | 185,000 | | | | 185,522 | |
| Series 2017-1, Cl. D, 3.15%, 2/20/251 | | | | | | | 110,000 | | | | 109,477 | |
| Capital One Multi-Asset Execution Trust: | |
| Series 2016-A1, Cl. A1, 1.927% | |
| [LIBOR01M+45], 2/15/222 | | | | | | | 1,075,000 | | | | 1,080,288 | |
| Series 2016-A3, Cl. A3, 1.34%, 4/15/22 | | | | | | | 805,000 | | | | 796,971 | |
| CarFinance Capital Auto Trust: | |
| Series 2014-1A, Cl. D, 4.90%, 4/15/201 | | | | | | | 390,000 | | | | 395,755 | |
| Series 2015-1A, Cl. A, 1.75%, 6/15/211 | | | | | | | 54,267 | | | | 54,203 | |
| CarMax Auto Owner Trust: | |
| Series 2014-2, Cl. D, 2.58%, 11/16/20 | | | | | | | 450,000 | | | | 450,980 | |
| Series 2015-2, Cl. D, 3.04%, 11/15/21 | | | | | | | 175,000 | | | | 175,894 | |
| Series 2015-3, Cl. D, 3.27%, 3/15/22 | | | | | | | 610,000 | | | | 612,135 | |
| Series 2016-1, Cl. D, 3.11%, 8/15/22 | | | | | | | 465,000 | | | | 468,503 | |
| Series 2016-3, Cl. D, 2.94%, 1/17/23 | | | | | | | 315,000 | | | | 311,680 | |
| Series 2016-4, Cl. D, 2.91%, 4/17/23 | | | | | | | 710,000 | | | | 701,080 | |
| Series 2017-1, Cl. D, 3.43%, 7/17/23 | | | | | | | 630,000 | | | | 630,359 | |
| Series 2017-4, Cl. D, 3.30%, 5/15/24 | | | | | | | 280,000 | | | | 278,135 | |
| CCG Receivables Trust, Series 2017-1, | |
| Cl. B, 2.75%, 11/14/231 | | | | | | | 635,000 | | | | 628,840 | |
| Chase Issuance Trust, Series 2014- | |
| A5, Cl. A5, 1.847% [LIBOR01M+37], 4/15/212 | | | | | | | 675,000 | | | | 677,664 | |
| CIG Auto Receivables Trust, Series 2017-1A, Cl. A, 2.71%, 5/15/231 | | | | | | | 342,904 | | | | 342,436 | |
| Citibank Credit Card Issuance Trust, | |
| Series 2014-A6, Cl. A6, 2.15%, 7/15/21 | | | | | | | 575,000 | | | | 575,726 | |
| CNH Equipment Trust, Series 2017-C, Cl. | |
| B, 2.54%, 5/15/25 | | | | | | | 185,000 | | | | 184,141 | |
| CPS Auto Receivables Trust: | |
| Series 2013-C, Cl. D, 6.59%, 8/15/191 | | | | | | | 255,000 | | | | 259,305 | |
| Series 2017-C, Cl. A, 1.78%, 9/15/201 | | | | | | | 192,001 | | | | 191,719 | |
| Series 2017-C, Cl. B, 2.30%, 7/15/211 | | | | | | | 275,000 | | | | 273,952 | |
| CPS Auto Trust: | |
| Series 2017-A, Cl. B, 2.68%, 5/17/211 | | | | | | | 60,000 | | | | 60,092 | |
| Series 2017-D, Cl. B, 2.43%, 1/18/221 | | | | | | | 470,000 | | | | 468,453 | |
| Credit Acceptance Auto Loan Trust, | |
| Series 2017-3A, Cl. C, 3.48%, 10/15/263 | | | | | | | 565,000 | | | | 561,245 | |
| CWABS Asset-Backed Certificates | |
| Trust, Series 2005-14, Cl. 1A1, 1.782% | |
| [US0001M+23], 4/25/362 | | | | | | | 274,210 | | | | 274,811 | |
| Dell Equipment Finance Trust, Series 2017-2, Cl. B, 2.47%, 10/24/221 | | | | | | | 190,000 | | | | 188,985 | |
| | | | | | | | | | | | |
| | | | | | Principal Amount | | | Value | |
| Asset-Backed Securities (Continued) | |
| Discover Card Execution Note Trust: | |
| Series 2012-A6, Cl. A6, 1.67%, 1/18/22 | | | | | | | $805,000 | | | | $800,590 | |
| Series 2016-A1, Cl. A1, 1.64%, 7/15/21 | | | | | | | 1,860,000 | | | | 1,854,311 | |
| Series 2016-A4, Cl. A4, 1.39%, 3/15/22 | | | | | | | 1,675,000 | | | | 1,654,913 | |
| Drive Auto Receivables Trust: | |
| Series 2015-BA, Cl. D, 3.84%, 7/15/211 | | | | | | | 1,030,000 | | | | 1,046,630 | |
| Series 2015-CA, Cl. D, 4.20%, 9/15/211 | | | | | | | 1,850,000 | | | | 1,890,132 | |
| Series 2015-DA, Cl. C, 3.38%, 11/15/211 | | | | | | | 1,049,334 | | | | 1,056,140 | |
| Series 2016-CA, Cl. C, 3.02%, 11/15/211 | | | | | | | 395,000 | | | | 398,077 | |
| Series 2016-CA, Cl. D, 4.18%, 3/15/241 | | | | | | | 430,000 | | | | 441,763 | |
| Series 2017-1, Cl. B, 2.36%, 3/15/21 | | | | | | | 425,000 | | | | 425,462 | |
| Series 2017-2, Cl. B, 2.25%, 6/15/21 | | | | | | | 275,000 | | | | 275,173 | |
| Series 2017-2, Cl. C, 2.75%, 9/15/23 | | | | | | | 305,000 | | | | 305,559 | |
| Series 2017-3, Cl. C, 2.80%, 7/15/22 | | | | | | | 315,000 | | | | 315,279 | |
| Series 2017-AA, Cl. C, 2.98%, 1/18/221 | | | | | | | 355,000 | | | | 357,500 | |
| Series 2017-AA, Cl. D, 4.16%, 5/15/241 | | | | | | | 565,000 | | | | 579,500 | |
| Series 2017-BA, Cl. D, 3.72%, 10/17/221 | | | | | | | 610,000 | | | | 618,398 | |
| DT Auto Owner Trust: | |
| Series 2014-2A, Cl. D, 3.68%, 4/15/211 | | | | | | | 1,492,185 | | | | 1,497,054 | |
| Series 2014-3A, Cl. D, 4.47%, 11/15/211 | | | | | | | 2,135,000 | | | | 2,161,273 | |
| Series 2015-1A, Cl. D, 4.26%, 2/15/221 | | | | | | | 3,020,000 | | | | 3,059,351 | |
| Series 2015-2A, Cl. D, 4.25%, 2/15/221 | | | | | | | 915,000 | | | | 930,584 | |
| Series 2015-3A, Cl. D, 4.53%, 10/17/221 | | | | | | | 2,530,000 | | | | 2,586,712 | |
| Series 2016-1A, Cl. B, 2.79%, 5/15/201 | | | | | | | 17,160 | | | | 17,165 | |
| Series 2016-4A, Cl. E, 6.49%, 9/15/231 | | | | | | | 200,000 | | | | 205,749 | |
| Series 2017-1A, Cl. C, 2.70%, 11/15/221 | | | | | | | 180,000 | | | | 179,599 | |
| Series 2017-1A, Cl. D, 3.55%, 11/15/221 | | | | | | | 440,000 | | | | 440,022 | |
| Series 2017-1A, Cl. E, 5.79%, 2/15/241 | | | | | | | 415,000 | | | | 421,767 | |
| Series 2017-2A, Cl. B, 2.44%, 2/15/211 | | | | | | | 280,000 | | | | 280,520 | |
| Series 2017-2A, Cl. D, 3.89%, 1/15/231 | | | | | | | 495,000 | | | | 498,660 | |
| Series 2017-3A, Cl. B, 2.40%, 5/17/211 | | | | | | | 460,000 | | | | 458,759 | |
| Series 2017-3A, Cl. E, 5.60%, 8/15/241 | | | | | | | 380,000 | | | | 385,718 | |
| Series 2017-4A, Cl. D, 3.47%, 7/17/231 | | | | | | | 560,000 | | | | 558,862 | |
| Series 2017-4A, Cl. E, 5.15%, 11/15/241 | | | | | | | 390,000 | | | | 390,318 | |
| Element Rail Leasing I LLC,Series 2014- | |
| 1A, Cl. A1, 2.299%, 4/19/441 | | | | | | | 192,645 | | | | 192,250 | |
| Evergreen Credit Card Trust, Series 2016-3, Cl. A, 1.977% [LIBOR01M+50], 11/16/201,2 | | | | | | | 1,210,000 | | | | 1,214,102 | |
| Exeter Automobile Receivables Trust: | |
| Series 2013-2A, Cl. D, 6.81%, 8/17/201 | | | | | | | 740,704 | | | | 747,212 | |
| Series 2014-2A, Cl. C, 3.26%, 12/16/191 | | | | | | | 115,518 | | | | 115,952 | |
| Series 2017-3A, Cl. A, 2.05%, 12/15/211 | | | | | | | 382,497 | | | | 381,980 | |
| First Investors Auto Owner Trust, Series 2013-3A, Cl. D, 3.67%, 5/15/201 | | | | | | | 890,000 | | | | 891,644 | |
| Flagship Credit Auto Trust: | |
| Series 2013-2, Cl. D, 6.26%, 2/16/211 | | | | | | | 165,000 | | | | 166,248 | |
| Series 2014-1, Cl. D, 4.83%, 6/15/201 | | | | | | | 70,000 | | | | 71,364 | |
| Series 2016-1, Cl. C, 6.22%, 6/15/221 | | | | | | | 980,000 | | | | 1,036,205 | |
| GM Financial Automobile Leasing Trust, | |
| Series 2017-3, Cl. C, 2.73%, 9/20/21 | | | | | | | 320,000 | | | | 316,990 | |
| Navistar Financial Dealer Note Master Owner Trust II: | |
| Series 2016-1, Cl. D, 4.852% | |
| [LIBOR01M+330], 9/27/211,2 | | | | | | | 205,000 | | | | 205,344 | |
| Series 2017-1, Cl. C, 3.102% | |
| [LIBOR01M+155], 6/27/221,2 | | | | | | | 160,000 | | | | 160,980 | |
| Series 2017-1, Cl. D, 3.852% | |
| [LIBOR01M+230], 6/27/221,2 | | | | | | | 185,000 | | | | 185,099 | |
| Nissan Auto Lease Trust, Series 2017-A, | |
| Cl. A3, 1.91%, 4/15/20 | | | | | | | 630,000 | | | | 627,919 | |
| Santander Drive Auto Receivables Trust: | |
| Series 2013-4, Cl. E, 4.67%, 1/15/201 | | | | | | | 520,000 | | | | 521,128 | |
| Series 2013-A, Cl. E, 4.71%, 1/15/211 | | | | | | | 405,000 | | | | 407,859 | |
| Series 2014-1, Cl. E, 3.92%, 5/17/21 | | | | | | | 285,000 | | | | 287,746 | |
| Series 2015-5, Cl. D, 3.65%, 12/15/21 | | | | | | | 915,000 | | | | 929,222 | |
| Series 2016-2, Cl. D, 3.39%, 4/15/22 | | | | | | | 300,000 | | | | 304,591 | |
| Series 2017-1, Cl. D, 3.17%, 4/17/23 | | | | | | | 440,000 | | | | 442,503 | |
| Series 2017-1, Cl. E, 5.05%, 7/15/241 | | | | | | | 1,110,000 | | | | 1,141,511 | |
7 OPPENHEIMER GLOBAL STRATEGIC INCOME FUND/VA
CONSOLIDATED STATEMENT OF INVESTMENTS Continued
| | | | | | | | | | |
| | | | | Principal Amount | | | Value | |
| Asset-Backed Securities (Continued) | |
Santander Drive Auto Receivables Trust: (Continued) | |
| Series 2017-2, Cl. D, 3.49%, 7/17/23 | | | | $ | 190,000 | | | $ | 192,038 | |
| Series 2017-3, Cl. D, 3.20%, 11/15/23 | | | | | 1,080,000 | | | | 1,082,000 | |
| Santander Retail Auto Lease Trust, Series 2017-A, Cl. C, 2.96%, 11/21/221 | | | | | 505,000 | | | | 504,914 | |
| TCF Auto Receivables Owner Trust, Series 2015-1A, Cl. D, 3.53%, 3/15/221 | | | | | 285,000 | | | | 284,261 | |
| Verizon Owner Trust, Series 2017-3A, Cl. A1A, 2.06%, 4/20/221 | | | | | 500,000 | | | | 498,056 | |
| Veros Automobile Receivables Trust, | | | | | | | | | | |
| Series 2017-1, Cl. A, 2.84%, 4/17/231 | | | | | 384,022 | | | | 383,371 | |
| Westlake Automobile Receivables Trust: | | | | | | | | | | |
| Series 2016-1A, Cl. E, 6.52%, 6/15/221 | | | | | 520,000 | | | | 534,157 | |
| Series 2017-2A, Cl. E, 4.63%, 7/15/241 | | | | | 685,000 | | | | 686,645 | |
| World Financial Network Credit Card Master Trust: | |
| Series 2012-D, Cl. A, 2.15%, 4/17/23 | | | | | 420,000 | | | | 419,733 | |
| Series 2016-B, Cl. A, 1.44%, 6/15/22 | | | | | 1,010,000 | | | | 1,007,131 | |
| Series 2017-A, Cl. A, 2.12%, 3/15/24 | | | | | 1,125,000 | | | | 1,120,889 | |
| Series 2017-B, Cl. A, 1.98%, 6/15/23 | | | | | 845,000 | | | | 842,740 | |
| Series 2017-C, Cl. A, 2.31%, 8/15/24 | | | | | 1,130,000 | | | | 1,125,824 | |
| Total Asset-Backed Securities (Cost $64,561,552) | | | | | | | | | 64,802,347 | |
| | | | | | | | | | |
| Mortgage-Backed Obligations—23.8% | |
| Government Agency—13.3% | |
| FHLMC/FNMA/FHLB/Sponsored—11.2% | |
Federal Home Loan Mortgage Corp. Gold Pool: | | | | | |
| 5.00%, 9/1/33 | | | | | 247,800 | | | | 268,251 | |
| 5.50%, 9/1/39 | | | | | 323,832 | | | | 355,187 | |
| 6.00%, 5/1/18-11/1/21 | | | | | 42,385 | | | | 47,383 | |
| 6.50%, 3/1/18-8/1/32 | | | | | 226,464 | | | | 250,892 | |
| 7.00%, 10/1/31-10/1/37 | | | | | 49,901 | | | | 55,335 | |
| 7.50%, 1/1/32 | | | | | 243,724 | | | | 289,375 | |
| Federal Home Loan Mortgage Corp., Interest-Only Stripped Mtg.-Backed Security: | |
| Series 192,Cl. IO, 96.966%, 2/1/284 | | | | | 5,526 | | | | 1,034 | |
| Series 205,Cl. IO, 46.898%, 9/1/294 | | | | | 30,787 | | | | 6,574 | |
| Series 243,Cl. 6, 1.584%, 12/15/324 | | | | | 69,033 | | | | 11,840 | |
| Federal Home Loan Mortgage Corp., Real Estate Mtg. Investment Conduit Multiclass Pass-Through Certificates: | |
| Series 1360,Cl. PZ, 7.50%, 9/15/22 | | | | | 217,645 | | | | 234,771 | |
| Series 151,Cl. F, 9.00%, 5/15/21 | | | | | 2,123 | | | | 2,224 | |
| Series 1674,Cl. Z, 6.75%, 2/15/24 | | | | | 107,208 | | | | 115,509 | |
| Series 1897,Cl. K, 7.00%, 9/15/26 | | | | | 409,122 | | | | 452,801 | |
| Series 2043,Cl. ZP, 6.50%, 4/15/28 | | | | | 162,740 | | | | 182,090 | |
Series 2106,Cl. FG, 1.927% | | | | | |
| [LIBOR01M+45], 12/15/282 | | | | | 280,397 | | | | 281,168 | |
Series 2122,Cl. F, 1.927% | | | | | |
| [LIBOR01M+45], 2/15/292 | | | | | 7,197 | | | | 7,232 | |
| Series 2148,Cl. ZA, 6.00%, 4/15/29 | | | | | 157,281 | | | | 173,172 | |
| Series 2195,Cl. LH, 6.50%, 10/15/29 | | | | | 115,193 | | | | 128,022 | |
| Series 2326,Cl. ZP, 6.50%, 6/15/31 | | | | | 15,264 | | | | 16,754 | |
Series 2344,Cl. FP, 2.427% | | | | | |
| [LIBOR01M+95], 8/15/312 | | | | | 73,203 | | | | 75,230 | |
| Series 2368,Cl. PR, 6.50%, 10/15/31 | | | | | 51,150 | | | | 57,484 | |
Series 2412,Cl. GF, 2.427% | | | | | |
| [LIBOR01M+95], 2/15/322 | | | | | 93,352 | | | | 95,981 | |
Series 2449,Cl. FL, 2.027% | | | | | |
| [LIBOR01M+55], 1/15/322 | | | | | 79,483 | | | | 80,633 | |
Series 2451,Cl. FD, 2.477% | | | | | |
| [LIBOR01M+100], 3/15/322 | | | | | 39,551 | | | | 40,726 | |
| Series 2461,Cl. PZ, 6.50%, 6/15/32 | | | | | 188,429 | | | | 208,330 | |
Series 2464,Cl. FI, 2.477% | | | | | |
| [LIBOR01M+100], 2/15/322 | | | | | 35,413 | | | | 36,264 | |
Series 2470,Cl. AF, 2.477% | | | | | |
| [LIBOR01M+100], 3/15/322 | | | | | 67,860 | | | | 69,875 | |
Series 2470,Cl. LF, 2.477% | | | | | |
| [LIBOR01M+100], 2/15/322 | | | | | 36,240 | | | | 37,111 | |
Series 2477,Cl. FZ, 2.027% | | | | | |
| [LIBOR01M+55], 6/15/312 | | | | | 149,492 | | | | 150,431 | |
| | | | | | | | | | |
| | | | | Principal Amount | | | Value | |
FHLMC/FNMA/FHLB/Sponsored (Continued) | |
| Federal Home Loan Mortgage Corp., Real Estate Mtg. Investment Conduit Multiclass Pass-Through Certificates: (Continued) | |
Series 2517,Cl. GF, 2.477% | | | | | |
| [LIBOR01M+100], 2/15/322 | | | | $ | 31,509 | | | $ | 32,266 | |
| Series 2635,Cl. AG, 3.50%, 5/15/32 | | | | | 48,856 | | | | 49,668 | |
| Series 2668,Cl. AZ, 4.00%, 9/15/18 | | | | | 3,537 | | | | 3,545 | |
| Series 2676,Cl. KY, 5.00%, 9/15/23 | | | | | 499,213 | | | | 525,041 | |
| Series 2707,Cl. QE, 4.50%, 11/15/18 | | | | | 19,325 | | | | 19,433 | |
| Series 2770,Cl. TW, 4.50%, 3/15/19 | | | | | 3,254 | | | | 3,287 | |
Series 3025,Cl. SJ, 19.334% [(3.667) x | | | | | |
| LIBOR01M+2,475], 8/15/352 | | | | | 88,000 | | | | 128,085 | |
| Series 3741,Cl. PA, 2.15%, 2/15/35 | | | | | 138,357 | | | | 138,337 | |
| Series 3815,Cl. BD, 3.00%, 10/15/20 | | | | | 2,234 | | | | 2,240 | |
| Series 3840,Cl. CA, 2.00%, 9/15/18 | | | | | 1,736 | | | | 1,733 | |
| Series 3848,Cl. WL, 4.00%, 4/15/40 | | | | | 134,322 | | | | 137,145 | |
| Series 3857,Cl. GL, 3.00%, 5/15/40 | | | | | 6,028 | | | | 6,091 | |
| Series 3917,Cl. BA, 4.00%, 6/15/38 | | | | | 68,723 | | | | 69,820 | |
| Series 4221,Cl. HJ, 1.50%, 7/15/23 | | | | | 184,210 | | | | 181,531 | |
| Federal Home Loan Mortgage Corp., Real Estate Mtg. Investment Conduit Multiclass Pass-Through Certificates, Interest-Only Stripped Mtg.-Backed Security: | |
| Series 2074,Cl. S, 99.999%, 7/17/284 | | | | | 8,055 | | | | 1,063 | |
| Series 2079,Cl. S, 99.999%, 7/17/284 | | | | | 14,214 | | | | 1,895 | |
| Series 2136,Cl. SG, 36.282%, 3/15/294 | | | | | 406,159 | | | | 62,064 | |
| Series 2399,Cl. SG, 99.999%, 12/15/264 | | | | | 221,321 | | | | 31,552 | |
| Series 2437,Cl. SB, 45.696%, 4/15/324 | | | | | 701,656 | | | | 117,935 | |
| Series 2526,Cl. SE, 54.82%, 6/15/294 | | | | | 14,507 | | | | 2,536 | |
| Series 2682,Cl. TQ, 99.999%, 10/15/334 | | | | | 145,821 | | | | 25,038 | |
| Series 2795,Cl. SH, 87.378%, 3/15/244 | | | | | 279,917 | | | | 23,807 | |
| Series 2920,Cl. S, 43.922%, 1/15/354 | | | | | 155,291 | | | | 24,127 | |
| Series 2922,Cl. SE, 12.635%, 2/15/354 | | | | | 27,194 | | | | 4,492 | |
| Series 2981,Cl. AS, 7.464%, 5/15/354 | | | | | 256,795 | | | | 34,406 | |
| Series 2981,Cl. BS, 99.999%, 5/15/354 | | | | | 310,686 | | | | 46,259 | |
| Series 3397,Cl. GS, 0.00%, 12/15/374,5 | | | | | 100,536 | | | | 16,242 | |
| Series 3424,Cl. EI, 0.00%, 4/15/384,5 | | | | | 36,898 | | | | 3,358 | |
| Series 3450,Cl. BI, 16.463%, 5/15/384 | | | | | 172,268 | | | | 25,598 | |
| Series 3606,Cl. SN, 15.88%, 12/15/394 | | | | | 53,242 | | | | 8,086 | |
| Series 3659,Cl. IE, 0.00%, 3/15/194,5 | | | | | 49,932 | | | | 891 | |
| Series 3685,Cl. EI, 0.00%, 3/15/194,5 | | | | | 7,697 | | | | 73 | |
Federal National Mortgage Assn.: | | | | | |
| 2.50%, 1/1/336 | | | | | 5,925,000 | | | | 5,918,945 | |
| 3.00%, 1/1/336 | | | | | 20,785,000 | | | | 21,177,382 | |
| 3.50%, 1/1/486 | | | | | 31,205,000 | | | | 32,059,334 | |
| 4.00%, 1/1/486 | | | | | 21,250,000 | | | | 22,235,535 | |
| 4.50%, 1/1/486 | | | | | 83,560,000 | | | | 88,912,540 | |
| 5.00%, 1/1/486 | | | | | 3,320,000 | | | | 3,569,519 | |
Federal National Mortgage Assn. Pool: | | | | | |
| 5.00%, 2/1/18-7/1/33 | | | | | 312,599 | | | | 336,448 | |
| 5.50%, 4/1/21-5/1/36 | | | | | 165,494 | | | | 180,965 | |
| 6.00%, 1/1/19 | | | | | 4 | | | | 4 | |
| 6.50%, 12/1/29-1/1/34 | | | | | 467,071 | | | | 527,909 | |
| 7.00%, 1/1/30-6/1/34 | | | | | 586,242 | | | | 675,212 | |
| 7.50%, 2/1/27-3/1/33 | | | | | 779,065 | | | | 909,867 | |
| 8.50%, 7/1/32 | | | | | 1,363 | | | | 1,459 | |
| Federal National Mortgage Assn., Interest-Only Stripped Mtg.-Backed Security: | |
| Series 214,Cl. 2, 99.999%, 3/25/234 | | | | | 78,270 | | | | 10,150 | |
| Series 221,Cl. 2, 99.999%, 5/25/234 | | | | | 9,297 | | | | 1,331 | |
| Series 254,Cl. 2, 99.999%, 1/25/244 | | | | | 161,637 | | | | 24,447 | |
| Series 301,Cl. 2, 11.612%, 4/25/294 | | | | | 31,790 | | | | 6,932 | |
| Series 313,Cl. 2, 99.999%, 6/25/314 | | | | | 315,833 | | | | 68,561 | |
| Series 319,Cl. 2, 0.519%, 2/25/324 | | | | | 152,980 | | | | 34,605 | |
| Series 321,Cl. 2, 15.295%, 4/25/324 | | | | | 45,186 | | | | 10,725 | |
| Series 324,Cl. 2, 0.00%, 7/25/324,5 | | | | | 47,199 | | | | 10,775 | |
| Series 328,Cl. 2, 0.00%, 12/25/324,5 | | | | | 91,217 | | | | 20,908 | |
| Series 331,Cl. 5, 2.642%, 2/25/334 | | | | | 177,148 | | | | 32,959 | |
| Series 332,Cl. 2, 0.00%, 3/25/334,5 | | | | | 736,986 | | | | 170,611 | |
| Series 334,Cl. 12, 0.00%, 3/25/334,5 | | | | | 141,808 | | | | 30,881 | |
| Series 339,Cl. 15, 2.544%, 10/25/334 | | | | | 421,437 | | | | 96,769 | |
| Series 345,Cl. 9, 0.00%, 1/25/344,5 | | | | | 131,512 | | | | 27,328 | |
8 OPPENHEIMER GLOBAL STRATEGIC INCOME FUND/VA
| | | | | | | | | | |
| | | | | Principal Amount | | | Value | |
FHLMC/FNMA/FHLB/Sponsored (Continued) | |
| Federal National Mortgage Assn., Interest-Only Stripped Mtg.-Backed Security: (Continued) | |
| Series 351,Cl. 10, 0.00%, 4/25/344,5 | | | | $ | 80,070 | | | $ | 17,353 | |
| Series 351,Cl. 8, 0.00%, 4/25/344,5 | | | | | 144,978 | | | | 28,867 | |
| Series 356,Cl. 10, 0.00%, 6/25/354,5 | | | | | 102,859 | | | | 21,225 | |
| Series 356,Cl. 12, 0.00%, 2/25/354,5 | | | | | 50,628 | | | | 11,070 | |
| Series 362,Cl. 13, 0.00%, 8/25/354,5 | | | | | 67,925 | | | | 15,064 | |
| Federal National Mortgage Assn., Real Estate Mtg. Investment Conduit Multiclass Pass-Through Certificates: | |
| Series 1999-54,Cl. LH, 6.50%, 11/25/29 | | | | | 99,135 | | | | 109,689 | |
| Series 2001-80,Cl. ZB, 6.00%, 1/25/32 | | | | | 84,872 | | | | 94,370 | |
| Series 2002-29,Cl. F, 2.552% | |
| [LIBOR01M+100], 4/25/322 | | | | | 40,083 | | | | 41,078 | |
| Series 2002-64,Cl. FJ, 2.552% | |
| [LIBOR01M+100], 4/25/322 | | | | | 12,343 | | | | 12,649 | |
| Series 2002-68,Cl. FH, 1.991% | |
| [LIBOR01M+50], 10/18/322 | | | | | 27,852 | | | | 27,984 | |
| Series 2002-84,Cl. FB, 2.552% | |
| [LIBOR01M+100], 12/25/322 | | | | | 174,250 | | | | 178,377 | |
| Series 2002-90,Cl. FH, 2.052% | |
| [LIBOR01M+50], 9/25/322 | | | | | 97,493 | | | | 97,896 | |
| Series 2003-100,Cl. PA, 5.00%, | |
| 10/25/18 | | | | | 18,476 | | | | 18,556 | |
| Series 2003-11,Cl. FA, 2.552% | |
| [LIBOR01M+100], 9/25/322 | | | | | 174,254 | | | | 178,381 | |
| Series 2003-112,Cl. AN, 4.00%, | |
| 11/25/18 | | | | | 7,846 | | | | 7,884 | |
| Series 2003-116,Cl. FA, 1.952% | |
| [LIBOR01M+40], 11/25/332 | | | | | 18,458 | | | | 18,479 | |
| Series 2003-84,Cl. GE, 4.50%, 9/25/18 | | | | | 2,876 | | | | 2,890 | |
| Series 2004-25,Cl. PC, 5.50%, 1/25/34 | | | | | 15,297 | | | | 15,496 | |
| Series 2005-109,Cl. AH, 5.50%, | |
| 12/25/25 | | | | | 670,552 | | | | 707,576 | |
| Series 2005-31,Cl. PB, 5.50%, 4/25/35 | | | | | 560,000 | | | | 619,756 | |
| Series 2005-71,Cl. DB, 4.50%, 8/25/25 | | | | | 98,399 | | | | 101,723 | |
| Series 2006-11,Cl. PS, 18.876% [(3.667) | |
| x LIBOR01M+2,456.67], 3/25/362 | | | | | 84,757 | | | | 132,352 | |
| Series 2006-46,Cl. SW, 18.508% | |
| [(3.667) x LIBOR01M+2,419.92], 6/25/362 | | | | | 126,953 | | | | 189,151 | |
| Series 2008-75,Cl. DB, 4.50%, 9/25/23 | | | | | 12,841 | | | | 12,909 | |
| Series 2009-113,Cl. DB, 3.00%, | |
| 12/25/20 | | | | | 38,593 | | | | 38,724 | |
| Series 2009-36,Cl. FA, 2.492% | |
| [LIBOR01M+94], 6/25/372 | | | | | 25,017 | | | | 25,576 | |
| Series 2009-70,Cl. TL, 4.00%, 8/25/19 | | | | | 29,559 | | | | 29,623 | |
| Series 2010-43,Cl. KG, 3.00%, 1/25/21 | | | | | 29,055 | | | | 29,188 | |
| Series 2011-122,Cl. EC, 1.50%, 1/25/20 | | | | | 25,953 | | | | 25,816 | |
| Series 2011-15,Cl. DA, 4.00%, 3/25/41 | | | | | 65,625 | | | | 66,832 | |
| Series 2011-3,Cl. EL, 3.00%, 5/25/20 | | | | | 65,736 | | | | 65,879 | |
| Series 2011-3,Cl. KA, 5.00%, 4/25/40 | | | | | 155,373 | | | | 164,442 | |
| Series 2011-38,Cl. AH, 2.75%, 5/25/20 | | | | | 1,707 | | | | 1,707 | |
| Series 2011-6,Cl. BA, 2.75%, 6/25/20 | | | | | 29,995 | | | | 30,172 | |
| Series 2011-82,Cl. AD, 4.00%, 8/25/26 | | | | | 64,917 | | | | 65,469 | |
| Series 2012-20,Cl. FD, 1.952% | |
| [LIBOR01M+40], 3/25/422 | | | | | 211,918 | | | | 212,107 | |
| Federal National Mortgage Assn., Real Estate Mtg. Investment Conduit Multiclass Pass-Through Certificates, Interest-Only Stripped Mtg.-Backed Security: | |
| Series 2001-61,Cl. SH, 35.823%, | |
| 11/18/314 | | | | | 45,412 | | | | 8,751 | |
| Series 2001-63,Cl. SD, 58.797%, | |
| 12/18/314 | | | | | 11,763 | | | | 2,086 | |
| Series 2001-68,Cl. SC, 41.415%, | | | | | | | | | | |
| 11/25/314 | | | | | 8,307 | | | | 1,468 | |
| Series 2001-81,Cl. S, 46.829%, 1/25/324 | | | | | 9,382 | | | | 1,754 | |
| Series 2002-28,Cl. SA, 26.322%, | |
| 4/25/324 | | | | | 6,871 | | | | 1,280 | |
| Series 2002-38,Cl. SO, 57.135%, | |
| 4/25/324 | | | | | 47,035 | | | | 8,281 | |
| | | | | | | | | | |
| | | | | Principal Amount | | | Value | |
FHLMC/FNMA/FHLB/Sponsored (Continued) | |
| Federal National Mortgage Assn., Real Estate Mtg. Investment Conduit Multiclass Pass-Through Certificates, Interest-Only Stripped Mtg.-Backed Security: (Continued) | |
| Series 2002-48,Cl. S, 45.949%, 7/25/324 | | | | $ | 10,710 | | | $ | 2,097 | |
| Series 2002-52,Cl. SL, 35.38%, 9/25/324 | | | | | 6,904 | | | | 1,332 | |
| Series 2002-56,Cl. SN, 46.964%, 7/25/324 | | | | | 14,716 | | | | 2,882 | |
| Series 2002-77,Cl. IS, 55.311%, 12/18/324 | | | | | 80,134 | | | | 16,962 | |
| Series 2002-77,Cl. SH, 41.331%, 12/18/324 | | | | | 14,032 | | | | 2,685 | |
| Series 2002-9,Cl. MS, 35.608%, 3/25/324 | | | | | 12,786 | | | | 2,359 | |
| Series 2003-13,Cl. IO, 39.96%, 3/25/334 | | | | | 141,439 | | | | 34,094 | |
| Series 2003-26,Cl. DI, 36.238%, 4/25/334 | | | | | 107,068 | | | | 24,740 | |
| Series 2003-33,Cl. SP, 31.148%, 5/25/334 | | | | | 77,735 | | | | 17,223 | |
| Series 2003-4,Cl. S, 20.378%, 2/25/334 | | | | | 21,920 | | | | 4,757 | |
| Series 2004-56,Cl. SE, 2.324%, 10/25/334 | | | | | 364,722 | | | | 71,974 | |
| Series 2005-12,Cl. SC, 33.82%, 3/25/354 | | | | | 12,777 | | | | 1,807 | |
| Series 2005-14,Cl. SE, 52.435%, 3/25/354 | | | | | 451,576 | | | | 62,708 | |
| Series 2005-40,Cl. SA, 54.139%, 5/25/354 | | | | | 398,521 | | | | 54,878 | |
| Series 2005-40,Cl. SB, 99.999%, 5/25/354 | | | | | 637,485 | | | | 77,827 | |
| Series 2005-52,Cl. JH, 35.919%, 5/25/354 | | | | | 239,270 | | | | 34,235 | |
| Series 2005-63,Cl. SA, 34.807%, 10/25/314 | | | | | 21,639 | | | | 3,434 | |
| Series 2006-90,Cl. SX, 99.999%, 9/25/364 | | | | | 434,354 | | | | 68,021 | |
| Series 2007-88,Cl. XI, 0.00%, 6/25/374,5 | | | | | 423,314 | | | | 67,988 | |
| Series 2008-55,Cl. SA, 0.00%, 7/25/384,5 | | | | | 28,301 | | | | 2,701 | |
| Series 2009-8,Cl. BS, 0.00%, 2/25/244,5 | | | | | 2,384 | | | | 97 | |
| Series 2010-95,Cl. DI, 16.084%, 11/25/204 | | | | | 99,508 | | | | 2,721 | |
| Series 2011-96,Cl. SA, 5.451%, 10/25/414 | | | | | 183,851 | | | | 27,815 | |
| Series 2012-134,Cl. SA, 5.157%, 12/25/424 | | | | | 559,799 | | | | 110,864 | |
| Series 2012-40,Cl. PI, 6.568%, 4/25/414 | | | | | 935,712 | | | | 139,627 | |
| | | | | | | | | 186,787,182 | |
| | | | | | | | | | | |
| GNMA/Guaranteed—2.1% | | | | | | | | | | |
| Government National Mortgage Assn. I Pool: | |
| 7.00%, 4/15/28-7/15/28 | | | | | 51,075 | | | | 55,566 | |
| 8.00%, 5/15/26 | | | | | 8,594 | | | | 8,639 | |
| Government National Mortgage Assn. II Pool: | |
| 2.25% [H15T1Y+150], 11/20/252 | | | | | 2,345 | | | | 2,420 | |
| 3.50%, 1/1/486 | | | | | 11,310,000 | | | | 11,701,079 | |
| 4.00%, 1/1/486 | | | | | 23,015,000 | | | | 24,006,443 | |
| Government National Mortgage Assn., Interest-Only Stripped Mtg.-Backed Security: | |
| Series 2007-17,Cl. AI, 44.476%, 4/16/374 | | | | | 221,957 | | | | 37,423 | |
| Series 2011-52,Cl. HS, 23.213%, 4/16/414 | | | | | 372,220 | | | | 51,988 | |
| | | | | | | | | 35,863,558 | |
| | | | | | | | | | | |
| Non-Agency—10.5% | | | | | | | | | | |
| Commercial—3.9% | | | | | | | | | | |
| BCAP LLC Trust: | |
| Series 2011-R11,Cl. 18A5, 3.41% | |
| [H15T1Y+210], 9/26/351,2 | | | | | 68,674 | | | | 68,997 | |
| Series 2012-RR6,Cl. RR6, 2.054%, 11/26/361 | | | | | 98,148 | | | | 97,595 | |
9 OPPENHEIMER GLOBAL STRATEGIC INCOME FUND/VA
CONSOLIDATED STATEMENT OF INVESTMENTS Continued
| | | | | | | | | | |
| | | | | Principal Amount | | | Value | |
Commercial (Continued) | | | | | | | | | | |
| CD Commercial Mortgage Trust: | |
| Series 2016-CD2,Cl. AM, 3.668%, 11/10/497 | | | | $ | 365,000 | | | $ | 374,085 | |
| Series 2017-CD3,Cl. AS, 3.833%, 2/10/50 | | | | | 530,000 | | | | 547,932 | |
| CD Mortgage Trust, Interest-Only Commercial Mtg. Pass-Through Certificates, Series 2017- CD6, Cl. XA, 12.227%, 11/13/504 | | | | | 2,328,401 | | | | 155,694 | |
| Chase Mortgage Finance Trust, Series 2005-A2, Cl. 1A3, 3.448%, 1/25/367 | | | | | 14,124 | | | | 13,798 | |
| Citigroup Commercial Mortgage Trust: | |
| Series 2012-GC8,Cl. AAB, 2.608%, 9/10/45 | | | | | 309,169 | | | | 310,955 | |
| Series 2014-GC21,Cl. AAB, 3.477%, 5/10/47 | | | | | 270,000 | | | | 278,565 | |
| Citigroup Commercial Mortgage Trust, Interest-Only Commercial Mtg. Pass-Through Certificates, Series 2017-C4, Cl. XA, 0.00%, 10/12/504,5 | | | | | 6,159,919 | | | | 487,693 | |
| COMM Mortgage Trust: | |
| Series 2012-CR3,Cl. ASB, 2.372%, 10/15/45 | | | | | 59,056 | | | | 58,934 | |
| Series 2012-LC4,Cl. A3, 3.069%, 12/10/44 | | | | | 123,296 | | | | 124,061 | |
| Series 2013-CR13,Cl. ASB, 3.706%, 11/12/46 | | | | | 510,000 | | | | 529,109 | |
| Series 2013-CR6,Cl. AM, 3.147%, 3/10/461 | | | | | 960,000 | | | | 965,976 | |
| Series 2013-CR7,Cl. D, 4.28%, 3/10/461,7 | | | | | 3,270,000 | | | | 2,609,265 | |
| Series 2014-CR20,Cl. ASB, 3.305%, 11/10/47 | | | | | 180,000 | | | | 184,919 | |
| Series 2014-CR21,Cl. AM, 3.987%, 12/10/47 | | | | | 25,000 | | | | 26,168 | |
| Series 2014-LC15,Cl. AM, 4.198%, 4/10/47 | | | | | 455,000 | | | | 480,304 | |
| Series 2014-UBS6,Cl. AM, 4.048%, 12/10/47 | | | | | 1,600,000 | | | | 1,672,193 | |
| Series 2015-CR22,Cl. A2, 2.856%, 3/10/48 | | | | | 305,000 | | | | 308,126 | |
| Series 2015-CR23,Cl. AM, 3.801%, 5/10/48 | | | | | 1,100,000 | | | | 1,134,043 | |
| COMM Mortgage Trust, Interest-Only Stripped Mtg.-Backed Security, Series 2012-CR5, Cl. XA, 0.00%, 12/10/454,5 | | | | | 2,663,620 | | | | 164,718 | |
| Deutsche Alt-B Securities, Inc. Mortgage Loan Trust, Series 2006-AB2, Cl. A1, 5.513%, 6/25/367 | | | | | 53,509 | | | | 49,029 | |
| Deutsche Bank Commercial Mortgage Trust, Series 2016-C1, Cl. AM, 3.539%, 5/10/49 | | | | | 600,000 | | | | 605,833 | |
| Deutsche Mortgage Securities, Inc., Series 2013-RS1, Cl. 1A2, 1.721% [US0001M+22], 7/22/361,2 | | | | | 5,060,144 | | | | 4,810,852 | |
| Federal National Mortgage Assn., Stripped | |
| Mtg.-Backed Security, Series 302, Cl. 2, 6.00%, 5/1/29 | | | | | 3 | | | | 1 | |
| FREMF Mortgage Trust: | |
| Series 2011-K702,Cl. B, 4.774%, 4/25/441,7 | | | | | 145,000 | | | | 145,042 | |
| Series 2012-K20,Cl. C, 3.87%, 5/25/451,7 | | | | | 4,165,000 | | | | 4,170,815 | |
| Series 2013-K25,Cl. C, 3.619%, 11/25/451,7 | | | | | 135,000 | | | | 133,113 | |
| Series 2013-K26,Cl. C, 3.598%, 12/25/451,7 | | | | | 95,000 | | | | 93,753 | |
| Series 2013-K27,Cl. C, 3.495%, 1/25/461,7 | | | | | 1,460,000 | | | | 1,433,198 | |
| Series 2013-K28,Cl. C, 3.49%, 6/25/461,7 | | | | | 2,330,000 | | | | 2,285,514 | |
| | | | | | | | | | |
| | | | | Principal Amount | | | Value | |
Commercial (Continued) | | | | | | | | | | |
| FREMF Mortgage Trust: (Continued) | |
| Series 2013-K29,Cl. C, 3.481%, 5/25/461,7 | | | | $ | 2,300,000 | | | $ | 2,254,834 | |
| Series 2013-K712,Cl. C, 3.362%, 5/25/451,7 | | | | | 265,000 | | | | 265,496 | |
| Series 2013-K713,Cl. C, 3.165%, 4/25/461,7 | | | | | 535,000 | | | | 533,318 | |
| Series 2014-K41,Cl. B, 3.832%, 11/25/471,7 | | | | | 2,365,000 | | | | 2,421,946 | |
| Series 2014-K714,Cl. C, 3.849%, 1/25/471,7 | | | | | 400,000 | | | | 401,212 | |
| Series 2015-K44,Cl. B, 3.684%, 1/25/481,7 | | | | | 2,310,000 | | | | 2,344,019 | |
| Series 2015-K45,Cl. B, 3.591%, 4/25/481,7 | | | | | 4,646,000 | | | | 4,650,453 | |
| Series 2015-K721,Cl. B, 3.565%, 11/25/471,7 | | | | | 1,380,000 | | | | 1,397,180 | |
| Series 2017-K62,Cl. B, 3.875%, 1/25/501,7 | | | | | 2,050,000 | | | | 2,073,227 | |
| Series 2017-K724,Cl. B, 3.487%, 11/25/231,7 | | | | | 1,535,000 | | | | 1,533,905 | |
| GS Mortgage Securities Corp. Trust, Series 2012-SHOP, Cl. A, 2.933%, 6/5/311 | | | | | 395,000 | | | | 398,478 | |
| GS Mortgage Securities Trust: | |
| Series 2013-GC12,Cl. AAB, 2.678%, 6/10/46 | | | | | 95,000 | | | | 95,310 | |
| Series 2013-GC16,Cl. AS, 4.649%, 11/10/46 | | | | | 160,000 | | | | 171,889 | |
| Series 2014-GC18,Cl. AAB, 3.648%, 1/10/47 | | | | | 235,000 | | | | 243,322 | |
| JP Morgan Chase Commercial Mortgage Securities Trust: | |
| Series 2012-LC9,Cl. A4, 2.611%, 12/15/47 | | | | | 60,000 | | | | 59,863 | |
| Series 2013-C10,Cl. AS, 3.372%, 12/15/47 | | | | | 855,000 | | | | 863,336 | |
| Series 2013-C16,Cl. AS, 4.517%, 12/15/46 | | | | | 820,000 | | | | 877,006 | |
| Series 2013-LC11,Cl. AS, 3.216%, 4/15/46 | | | | | 110,000 | | | | 110,787 | |
| Series 2013-LC11,Cl. ASB, 2.554%, 4/15/46 | | | | | 140,000 | | | | 140,197 | |
| Series 2014-C20,Cl. AS, 4.043%, 7/15/47 | | | | | 630,000 | | | | 657,773 | |
| Series 2016-JP3,Cl. A2, 2.435%, 8/15/49 | | | | | 600,000 | | | | 596,043 | |
| JP Morgan Mortgage Trust, Series 2007-A1, Cl. 5A1, 3.629%, 7/25/357 | | | | | 62,096 | | | | 63,784 | |
| JP Morgan Resecuritization Trust, Series 2009-5, Cl. 1A2, 3.387%, 7/26/361,7 | | | | | 2,959,943 | | | | 2,838,868 | |
| JPMBB Commercial Mortgage Securities Trust: | |
| Series 2013-C17,Cl. ASB, 3.705%, 1/15/47 | | | | | 200,000 | | | | 207,455 | |
| Series 2014-C18,Cl. A3, 3.578%, 2/15/47 | | | | | 295,000 | | | | 301,461 | |
| Series 2014-C19,Cl. ASB, 3.584%, 4/15/47 | | | | | 110,000 | | | | 113,559 | |
| Series 2014-C24,Cl. B, 4.116%, 11/15/477 | | | | | 680,000 | | | | 697,203 | |
| Series 2014-C25,Cl. AS, 4.065%, 11/15/47 | | | | | 1,720,000 | | | | 1,801,074 | |
| Series 2014-C26,Cl. AS, 3.80%, 1/15/48 | | | | | 1,515,000 | | | | 1,561,797 | |
| JPMDB Commercial Mortgage Securities Trust, | |
| Series 2016-C4, Cl. AS, 3.385%, 12/15/49 | | | | | 610,000 | | | | 608,566 | |
| Morgan Stanley Bank of America Merrill Lynch Trust: | |
| Series 2013-C7,Cl. AAB, 2.469%, 2/15/46 | | | | | 285,000 | | | | 285,484 | |
| Series 2013-C9,Cl. AS, 3.456%, 5/15/46 | | | | | 570,000 | | | | 576,830 | |
| Series 2014-C14,Cl. B, 4.633%, 2/15/477 | | | | | 240,000 | | | | 254,556 | |
10 OPPENHEIMER GLOBAL STRATEGIC INCOME FUND/VA
| | | | | | | | | | |
| | | | | Principal Amount | | | Value | |
Commercial (Continued) | |
| Morgan Stanley Bank of America Merrill Lynch Trust: (Continued) | |
| Series 2016-C30,Cl. AS, 3.175%, 9/15/49 | | | | $ | 1,020,000 | | | $ | 995,923 | |
| Morgan Stanley Capital I, Inc., Interest-Only Commercial Mtg. Pass-Through Certificates, Series 2017-HR2, Cl. XA, 10.107%, 12/15/504 | | | | | 2,025,000 | | | | 125,058 | |
| Morgan Stanley Re-Remic Trust, Series 2012-R3, Cl. 1A, 2.968%, 11/26/361,7 | | | | | 10,444 | | | | 10,429 | |
| Morgan Stanley Resecuritization Trust, Series 2013-R9, Cl. 3A, 3.149%, 6/26/461,7 | | | | | 102,480 | | | | 102,635 | |
| Structured Adjustable Rate Mortgage Loan Trust, Series 2004-10, Cl. 2A, 3.399%, 8/25/347 | | | | | 2,623,703 | | | | 2,639,570 | |
| UBS Commercial Mortgage Trust, Interest-Only | |
| Commercial Mtg. Pass-Through Certificates, | |
| Series 2017-C5, Cl. XA, 11.683%, 11/15/504 | | | | | 3,837,922 | | | | 277,607 | |
| UBS-Barclays Commercial Mortgage Trust, | |
| Series 2012-C2, Cl. E, 4.894%, 5/10/631,7 | | | | | 930,000 | | | | 784,065 | |
| Wells Fargo Commercial Mortgage Trust: | |
| Series 2015-C29,Cl. AS, 4.013%, 6/15/487 | | | | | 780,000 | | | | 812,780 | |
| Series 2016-C37,Cl. AS, 4.018%, 12/15/49 | | | | | 910,000 | | | | 956,486 | |
| Wells Fargo Commercial Mortgage Trust, | |
| Interest-Only Commercial Mtg. Pass-Through | |
| Certificates, Series 2017-C42, Cl. XA, 0.00%, 12/15/504,5 | | | | | 2,810,000 | | | | 202,563 | |
| WF-RBS Commercial Mortgage Trust: | |
| Series 2012-C7,Cl. E, 4.825%, 6/15/451,7 | | | | | 180,000 | | | | 147,193 | |
| Series 2013-C14,Cl. AS, 3.488%, 6/15/46 | | | | | 640,000 | | | | 651,869 | |
| Series 2014-C20,Cl. AS, 4.176%, 5/15/47 | | | | | 490,000 | | | | 511,046 | |
| Series 2014-C22,Cl. A3, 3.528%, 9/15/57 | | | | | 120,000 | | | | 123,382 | |
| Series 2014-LC14,Cl. AS, 4.351%, 3/15/477 | | | | | 395,000 | | | | 416,981 | |
| WF-RBS Commercial Mortgage Trust, | |
| Interest-Only Commercial Mtg. Pass-Through | |
| Certificates, Series 2011-C3, Cl. XA, 32.923%, 3/15/441,4 | | | | | 3,747,677 | | | | 115,837 | |
| | | | | | | | | 64,593,935 | |
| | | | | | | | | | | |
Residential—6.6% | | | | | | | | | | |
| Banc of America Funding Trust, Series 2014- | |
| R7, Cl. 3A1, 3.544%, 3/26/361,7,9 | | | | | 51,600 | | | | 51,559 | |
| Bear Stearns ARM Trust: | |
| Series 2005-2,Cl. A1, 3.26% | |
| [H15T1Y+245], 3/25/352 | | | | | 91,067 | | | | 92,267 | |
| Series 2006-1,Cl. A1, 3.67% | |
| [H15T1Y+225], 2/25/362 | | | | | 51,946 | | | | 52,176 | |
| CHL Mortgage Pass-Through Trust: | |
| Series 2005-17,Cl. 1A8, 5.50%, 9/25/35 | | | | | 604,291 | | | | 603,006 | |
| Series 2005-J4,Cl. A7, 5.50%, 11/25/35 | | | | | 557,859 | | | | 560,043 | |
| Citigroup Mortgage Loan Trust, Inc.: | |
| Series 2005-2,Cl. 1A3, 3.489%, 5/25/357 | | | | | 741,022 | | | | 745,907 | |
| Series 2006-AR1,Cl. 1A1, 3.21% | |
| [H15T1Y+240], 10/25/352 | | | | | 217,594 | | | | 219,170 | |
| Series 2009-8,Cl. 7A2, 3.544%, 3/25/361,7 | | | | | 9,549,770 | | | | 9,538,684 | |
| Series 2012-8,Cl. 1A1, 3.51%, 10/25/351,7 | | | | | 106,200 | | | | 106,738 | |
| Series 2014-8,Cl. 1A2, 1.791% | |
| [US0001M+29], 7/20/361,2 | | | | | 3,400,000 | | | | 3,173,031 | |
| Connecticut Avenue Securities: | |
| Series 2014-C02,Cl. 1M1, 2.502% | |
| [US0001M+95], 5/25/242 | | | | | 341,296 | | | | 342,523 | |
| | | | | | | | | | |
| | | | | Principal Amount | | | Value | |
Residential (Continued) | |
| Connecticut Avenue Securities: (Continued) | |
| Series 2014-C03,Cl. 1M2, 4.552% | |
| [US0001M+300], 7/25/242 | | | | $ | 937,242 | | | $ | 1,002,357 | |
| Series 2015-C03,Cl. 1M2, 6.552% | |
| [US0001M+500], 7/25/252 | | | | | 1,254,857 | | | | 1,416,947 | |
| Series 2016-C03,Cl. 1M1, 3.552% | |
| [US0001M+200], 10/25/282 | | | | | 69,890 | | | | 71,015 | |
| Series 2016-C06,Cl. 1M2, 5.802% | |
| [US0001M+425], 4/25/292 | | | | | 4,295,000 | | | | 4,890,820 | |
| Series 2016-C07,Cl. 2M1, 2.852% | |
| [US0001M+130], 5/25/292 | | | | | 512,845 | | | | 516,122 | |
| Series 2016-C07,Cl. 2M2, 5.902% | |
| [US0001M+435], 5/25/292 | | | | | 4,705,000 | | | | 5,221,424 | |
| Series 2017-C01,Cl. 1M2, 5.102% | |
| [US0001M+355], 7/25/292 | | | | | 4,140,000 | | | | 4,503,698 | |
| Series 2017-C02,Cl. 2M1, 2.702% | |
| [US0001M+115], 9/25/292 | | | | | 873,234 | | | | 881,293 | |
| Series 2017-C02,Cl. 2M2, 5.202% | |
| [US0001M+365], 9/25/292 | | | | | 2,280,000 | | | | 2,469,593 | |
| Series 2017-C03,Cl. 1M1, 2.502% | |
| [US0001M+95], 10/25/292 | | | | | 837,685 | | | | 844,485 | |
| Series 2017-C04,Cl. 2M2, 4.402% | |
| [US0001M+285], 11/25/292 | | | | | 4,190,000 | | | | 4,360,641 | |
| Series 2017-C06,Cl. 1M1, 2.302% | |
| [US0001M+75], 2/25/302 | | | | | 333,950 | | | | 335,150 | |
| Series 2017-C07,Cl. 1M1, 2.202% | |
| [US0001M+65], 5/25/302 | | | | | 596,454 | | | | 597,495 | |
| Series 2017-C07,Cl. 1M2, 3.952% | |
| [US0001M+240], 5/25/302 | | | | | 580,000 | | | | 595,882 | |
| CWHEQ Revolving Home Equity | |
| Loan Trust: Series 2005-G,Cl. 2A, 1.707% | |
| [US0001M+23], 12/15/352 | | | | | 32,174 | | | | 29,147 | |
| Series 2006-H,Cl. 2A1A, 1.627% | |
| [US0001M+15], 11/15/362 | | | | | 23,132 | | | | 17,468 | |
| GSR Mortgage Loan Trust, Series | |
| 2005-AR4, Cl. 6A1, 3.522%, 7/25/357 | | | | | 15,060 | | | | 15,171 | |
| Home Equity Mortgage Trust, Series 2005-1, | |
| Cl. M6, 5.863%, 6/25/357 | | | | | 105,749 | | | | 106,953 | |
| HomeBanc Mortgage Trust, Series | |
| 2005-3, Cl. A2, 1.862% [US0001M+31], 7/25/352 | | | | | 21,654 | | | | 21,647 | |
| MASTR Asset Backed Securities Trust, Series 2006-WMC3, Cl. A3, 1.652% [US0001M+10], 8/25/362 | | | | | 886,635 | | | | 479,646 | |
| RALI Trust: | |
| Series 2005-QA4,Cl. A32, 3.874%, 4/25/357 | | | | | 2,289 | | | | 19 | |
| Series 2006-QS13,Cl. 1A8, 6.00%, 9/25/36 | | | | | 14,187 | | | | 12,669 | |
| Residential Asset Securitization Trust, Series 2005-A6CB, Cl. A7, 6.00%, 6/25/35 | | | | | 1,980,504 | | | | 1,869,471 | |
| Structured Agency Credit Risk Debt Nts.: | |
| Series 2013-DN2,Cl. M2, 5.802% | |
| [US0001M+425], 11/25/232 | | | | | 990,000 | | | | 1,102,201 | |
| Series 2014-DN1,Cl. M3, 6.052% | |
| [US0001M+450], 2/25/242 | | | | | 815,000 | | | | 952,795 | |
| Series 2014-DN2,Cl. M3, 5.152% | |
| [US0001M+360], 4/25/242 | | | | | 840,000 | | | | 937,810 | |
| Series 2014-DN4,Cl. M3, 6.102% | |
| [US0001M+455], 10/25/242 | | | | | 4,406,992 | | | | 4,866,973 | |
| Series 2014-HQ2,Cl. M2, 3.752% | |
| [US0001M+220], 9/25/242 | | | | | 238,498 | | | | 246,138 | |
| Series 2014-HQ2,Cl. M3, 5.302% | |
| [US0001M+375], 9/25/242 | | | | | 6,345,000 | | | | 7,258,189 | |
| Series 2015-HQA2,Cl. M2, 4.352% | |
| [US0001M+280], 5/25/282 | | | | | 407,156 | | | | 421,089 | |
| Series 2016-DNA1,Cl. M2, 4.452% | |
| [US0001M+290], 7/25/282 | | | | | 405,000 | | | | 417,435 | |
| Series 2016-DNA2,Cl. M3, 6.202% | |
| [US0001M+465], 10/25/282 | | | | | 3,674,000 | | | | 4,222,988 | |
11 OPPENHEIMER GLOBAL STRATEGIC INCOME FUND/VA
CONSOLIDATED STATEMENT OF INVESTMENTS Continued
| | | | | | | | | | | | |
| | | | | | Principal
Amount | | | Value | |
Residential (Continued) | |
Structured Agency Credit Risk Debt Nts.: (Continued) | |
| Series 2016-DNA3,Cl. M1, 2.652% | | | | | | | | | | | | |
| [US0001M+110], 12/25/282 | | | | | | | $253,560 | | | | $ 253,948 | |
| Series 2016-DNA3,Cl. M3, 6.552% | | | | | | | | | | | | |
| [US0001M+500], 12/25/282 | | | | | | | 3,845,000 | | | | 4,483,262 | |
| Series 2016-DNA4,Cl. M1, 2.352% | | | | | | | | | | | | |
| [US0001M+80], 3/25/292 | | | | | | | 260,232 | | | | 260,762 | |
| Series 2016-DNA4,Cl. M3, 5.352% | | | | | | | | | | | | |
| [US0001M+380], 3/25/292 | | | | | | | 5,570,000 | | | | 6,224,024 | |
| Series 2016-HQA2,Cl. M1, 2.752% | | | | | | | | | | | | |
| [US0001M+120], 11/25/282 | | | | | | | 103,269 | | | | 103,387 | |
| Series 2016-HQA3,Cl. M1, 2.352% | | | | | | | | | | | | |
| [US0001M+80], 3/25/292 | | | | | | | 1,094,349 | | | | 1,096,378 | |
| Series 2016-HQA3,Cl. M3, 5.402% | | | | | | | | | | | | |
| [US0001M+385], 3/25/292 | | | | | | | 5,500,000 | | | | 6,132,497 | |
| Series 2016-HQA4,Cl. M1, 2.352% | | | | | | | | | | | | |
| [US0001M+80], 4/25/292 | | | | | | | 722,810 | | | | 724,278 | |
| Series 2016-HQA4,Cl. M3, 5.452% | | | | | | | | | | | | |
| [US0001M+390], 4/25/292 | | | | | | | 4,580,000 | | | | 5,100,546 | |
| Series 2017-DNA1,Cl. M2, 4.802% | | | | | | | | | | | | |
| [US0001M+325], 7/25/292 | | | | | | | 4,400,000 | | | | 4,720,917 | |
| Series 2017-DNA2,Cl. M2, 5.002% | | | | | | | | | | | | |
| [US0001M+345], 10/25/292 | | | | | | | 410,000 | | | | 446,552 | |
| Series 2017-DNA3,Cl. M2, 4.052% | | | | | | | | | | | | |
| [US0001M+250], 3/25/302 | | | | | | | 420,000 | | | | 435,521 | |
| Series 2017-HQA1,Cl. M1, 2.752% | | | | | | | | | | | | |
| [US0001M+120], 8/25/292 | | | | | | | 899,160 | | | | 908,926 | |
| Series 2017-HQA1,Cl. M2, 5.102% | | | | | | | | | | | | |
| [US0001M+355], 8/25/292 | | | | | | | 4,870,000 | | | | 5,262,155 | |
| Series 2017-HQA3,Cl. M1, 2.102% | | | | | | | | | | | | |
| [US0001M+55], 4/25/302 | | | | | | | 589,995 | | | | 590,087 | |
| Series 2017-HQA3,Cl. M2, 3.902% | | | | | | | | | | | | |
| [US0001M+235], 4/25/302 | | | | | | | 995,000 | | | | 1,019,749 | |
| WaMu Mortgage Pass-Through Certificates Trust: | | | | | | | | | | | | |
Series 2003-AR10,Cl. A7, 3.453%, 10/25/337 | | | | | | | 70,144 | | | | 71,065 | |
Series 2005-AR16,Cl. 1A1, 3.363%, 12/25/357 | | | | | | | 9,643 | | | | 9,437 | |
| Wells Fargo Mortgage-Backed Securities Trust: | | | | | | | | | | | | |
Series 2005-AR1,Cl. 1A1, 3.252%, 2/25/357 | | | | | | | 1,029,281 | | | | 1,052,258 | |
Series 2005-AR15,Cl. 1A2, 3.561%, 9/25/357 | | | | | | | 159,718 | | | | 155,211 | |
Series 2005-AR15,Cl. 1A6, 3.561%, 9/25/357 | | | | | | | 1,933,503 | | | | 1,865,377 | |
Series 2005-AR4,Cl. 2A2, 3.422%, 4/25/357 | | | | | | | 9,165 | | | | 9,224 | |
Series 2006-AR10,Cl. 1A1, 3.354%, 7/25/367 | | | | | | | 183,079 | | | | 178,835 | |
| Series 2006-AR10,Cl. 5A5, 3.387%, | | | | | | | | | | | | |
| 7/25/367 | | | | | | | 335,107 | | | | 338,824 | |
Series 2006-AR2,Cl. 2A3, 3.544%, 3/25/367 | | | | | | | 1,619,982 | | | | 1,637,185 | |
Series 2006-AR7,Cl. 2A4, 3.336%, 5/25/367 | | | | | | | 870,724 | | | | 864,477 | |
Series 2006-AR8,Cl. 2A1, 3.568%, 4/25/367 | | | | | | | 647,205 | | | | 655,904 | |
| | | | | | | | | | | 110,770,621 | |
| Total Mortgage-Backed Obligations (Cost $388,066,469) | | | | | | | | | | | 398,015,296 | |
| | | |
| | | | | | | | | | | | |
| Foreign Government Obligations—8.4% | |
| Angola—0.0% | | | | | | | | | | | | |
| Republic of Angola, 9.50% Sr. Unsec. | |
| Nts., 11/12/251 | | | | | | | 755,000 | | | | 872,962 | |
| | | | | | | | | | | | | |
| Argentina—0.4% | | | | | | | | | | | | |
| Argentine Republic: | |
| 5.375% Sr. Unsec. Nts., 1/20/231 | | | EUR | | | | 450,000 | | | | 574,278 | |
| 6.50% Sr. Unsec. Nts., 2/15/231 | | | | | | | 595,000 | | | | 640,696 | |
| | | | | | | | | | | | |
| | | | | | Principal
Amount | | | Value | |
Argentina (Continued) | | | | | | | | | | | | |
| Argentine Republic: (Continued) | | | | | | | | | | | | |
| 6.875% Sr. Unsec. Nts., 1/26/27 | | | | | | | $1,650,000 | | | | $ 1,805,100 | |
| 7.50% Sr. Unsec. Nts., 4/22/26 | | | | | | | 645,000 | | | | 731,204 | |
| 7.875% Sr. Unsec. Nts., 6/15/271 | | | | | | | 915,000 | | | | 1,017,773 | |
| 9.125% Sr. Unsec. Nts., 3/16/241 | | | | | | | 485,000 | | | | 568,662 | |
| 16.00% Bonds, 10/17/23 | | | ARS | | | | 9,285,000 | | | | 499,133 | |
| 18.20% Unsec. Nts., 10/3/21 | | | ARS | | | | 9,285,000 | | | | 510,737 | |
| | | | | | | | | | | 6,347,583 | |
| | | | | | | | | | | | | |
| Bahamas—0.0% | | | | | | | | | | | | |
| Commonwealth of the Bahamas, 6.00% | | | | | | | | | | | | |
| Sr. Unsec. Nts., 11/21/281 | | | | | | | 505,000 | | | | 527,725 | |
| | | | | | | | | | | | | |
| Belarus—0.0% | | | | | | | | | | | | |
| Republic of Belarus, 6.875% Sr. Unsec. | | | | | | | | | | | | |
| Nts., 2/28/231 | | | | | | | 540,000 | | | | 582,925 | |
| | | | | | | | | | | | | |
| Brazil—0.7% | | | | | | | | | | | | |
| Federative Republic of Brazil: | | | | | | | | | | | | |
| 4.625% Sr. Unsec. Nts., 1/13/28 | | | | | | | 1,335,000 | | | | 1,342,676 | |
| 10.00% Unsec. Nts., 1/1/19 | | | BRL | | | | 26,900,000 | | | | 8,345,330 | |
| 17.546% Unsec. Nts., 5/15/5513 | | | BRL | | | | 1,735,000 | | | | 1,731,761 | |
| | | | | | | | | | | 11,419,767 | |
| | | | | | | | | | | | | |
| Chile—0.3% | | | | | | | | | | | | |
| Republic of Chile, 4.50% Bonds, 3/1/21 | | | CLP | | | | 2,568,500,000 | | | | 4,276,604 | |
| | | | | | | | | | | | | |
| Colombia—0.3% | | | | | | | | | | | | |
| Republic of Colombia: | | | | | | | | | | | | |
| 4.00% Sr. Unsec. Nts., 2/26/24 | | | | | | | 485,000 | | | | 503,551 | |
| 6.125% Sr. Unsec. Nts., 1/18/41 | | | | | | | 1,915,000 | | | | 2,317,150 | |
| Series B, 10.00% Bonds, 7/24/24 | | | COP | | | | 5,146,000,000 | | | | 2,083,228 | |
| | | | | | | | | | | 4,903,929 | |
| | | | | | | | | | | | | |
| Croatia—0.1% | | | | | | | | | | | | |
| Republic of Croatia, 3.875% Sr. Unsec. | | | | | | | | | | | | |
| Nts., 5/30/22 | | | EUR | | | | 1,430,000 | | | | 1,922,730 | |
| | | | | | | | | | | | | |
| Dominican Republic—0.2% | | | | | | | | | | | | |
| Dominican Republic: | | | | | | | | | | | | |
| 5.95% Sr. Unsec. Nts., 1/25/271 | | | | | | | 2,130,000 | | | | 2,305,725 | |
| 6.85% Sr. Unsec. Nts., 1/27/451 | | | | | | | 1,055,000 | | | | 1,189,523 | |
| | | | | | | | | | | 3,495,248 | |
| | | | | | | | | | | | | |
| Ecuador—0.1% | | | | | | | | | | | | |
| Republic of Ecuador: | | | | | | | | | | | | |
| 9.65% Sr. Unsec. Nts., 12/13/261 | | | | | | | 325,000 | | | | 374,156 | |
| 10.75% Sr. Unsec. Nts., 3/28/221 | | | | | | | 744,000 | | | | 871,410 | |
| | | | | | | | | | | 1,245,566 | |
| | | | | | | | | | | | | |
| Egypt—0.2% | | | | | | | | | | | | |
| Arab Republic of Egypt: | | | | | | | | | | | | |
| 6.125% Sr. Unsec. Nts., 1/31/221 | | | | | | | 1,065,000 | | | | 1,116,306 | |
| 8.50% Sr. Unsec. Nts., 1/31/471 | | | | | | | 1,600,000 | | | | 1,841,136 | |
| | | | | | | | | | | 2,957,442 | |
| | | | | | | | | | | | | |
| Gabon—0.1% | | | | | | | | | | | | |
Gabonese Republic, 6.375% Bonds, 12/12/241 | | | | | | | 965,000 | | | | 982,414 | |
| | | | | | | | | | | | | |
| Honduras—0.1% | | | | | | | | | | | | |
| Republic of Honduras: | | | | | | | | | | | | |
| 6.25% Sr. Unsec. Nts., 1/19/271 | | | | | | | 540,000 | | | | 578,934 | |
| 8.75% Sr. Unsec. Nts., 12/16/201 | | | | | | | 455,000 | | | | 511,511 | |
| | | | | | | | | | | 1,090,445 | |
| | | | | | | | | | | | | |
| Hungary—0.2% | | | | | | | | | | | | |
| Hungary: | | | | | | | | | | | | |
| 5.75% Sr. Unsec. Nts., 11/22/23 | | | | | | | 1,150,000 | | | | 1,317,409 | |
| Series 25/B, 5.50% Bonds, 6/24/25 | | | HUF | | | | 439,000,000 | | | | 2,144,419 | |
| | | | | | | | | | | 3,461,828 | |
| | | | | | | | | | | | | |
| India—0.3% | | | | | | | | | | | | |
Republic of India, 8.20% Sr. Unsec. Nts., 9/24/25 | | | INR | | | | 270,600,000 | | | | 4,408,926 | |
12 OPPENHEIMER GLOBAL STRATEGIC INCOME FUND/VA
| | | | | | | | | | |
| | | | | Principal Amount | | | Value | |
Indonesia—0.9% | | | | | | | | | | |
| Perusahaan Penerbit SBSN Indonesia III: | | | | | | | | | | |
| 4.35% Sr. Unsec. Nts., 9/10/241 | | | | | $ 575,000 | | | | $ 608,724 | |
| 4.55% Sr. Unsec. Nts., 3/29/261 | | | | | 965,000 | | | | 1,021,491 | |
| Republic of Indonesia: | | | | | | | | | | |
| 3.375% Sr. Unsec. Nts., 7/30/251 | | EUR | | | 440,000 | | | | 597,538 | |
| 3.75% Sr. Unsec. Nts., 6/14/281 | | EUR | | | 485,000 | | | | 672,245 | |
| 3.85% Sr. Unsec. Nts., 7/18/271 | | | | | 1,075,000 | | | | 1,104,611 | |
| 4.125% Sr. Unsec. Nts., 1/15/251 | | | | | 540,000 | | | | 561,962 | |
| Series FR53, 8.25% Sr. Unsec. Nts., 7/15/21 | | IDR | | | 33,505,000,000 | | | | 2,661,402 | |
| Series FR56, 8.375% Sr. Unsec. Nts., 9/15/26 | | IDR | | | 69,095,000,000 | | | | 5,770,770 | |
| Series FR74, 7.50% Sr. Unsec. Nts., 8/15/32 | | IDR | | | 20,480,000,000 | | | | 1,600,488 | |
| | | | | | | | | | 14,599,231 | |
Iraq—0.1% | | | | | | | | | | |
| Republic of Iraq: | | | | | | | | | | |
| 5.80% Unsec. Nts., 1/15/281 | | | | | 540,000 | | | | 522,481 | |
| 6.752% Sr. Unsec. Nts., 3/9/231 | | | | | 1,075,000 | | | | 1,101,918 | |
| | | | | | | | | | 1,624,399 | |
Ivory Coast—0.2% | | | | | | | | | | |
| Republic of Cote d’Ivoire: | | | | | | | | | | |
| 5.125% Sr. Unsec. Nts., 6/15/251 | | EUR | | | 1,105,000 | | | | 1,450,564 | |
| 5.75% Sr. Unsec. Nts., 12/31/327 | | | | | 727,610 | | | | 725,419 | |
| 6.125% Sr. Unsec. Nts., 6/15/331 | | | | | 1,290,000 | | | | 1,319,622 | |
| | | | | | | | | | 3,495,605 | |
Jamaica—0.1% | | | | | | | | | | |
| Commonwealth of Jamaica: | | | | | | | | | | |
| 7.875% Sr. Unsec. Nts., 7/28/45 | | | | | 1,075,000 | | | | 1,311,500 | |
| 8.00% Sr. Unsec. Nts., 3/15/39 | | | | | 430,000 | | | | 528,668 | |
| | | | | | | | | | 1,840,168 | |
Kazakhstan—0.1% | | | | | | | | | | |
| Republic of Kazakhstan, 4.875% Sr. Unsec. Nts., 10/14/441 | | | | | 1,035,000 | | | | 1,116,103 | |
Malaysia—0.2% | | | | | | | | | | |
Malaysia, 5.734% Sr. Unsec. Nts., 7/30/19 | | MYR | | | 13,203,000 | | | | 3,397,879 | |
Mexico—0.1% | | | | | | | | | | |
| United Mexican States, Series M, 5.75% | | | | | | | | | | |
Bonds, 3/5/26 | | MXN | | | 54,445,000 | | | | 2,450,433 | |
Mongolia—0.1% | | | | | | | | | | |
Mongolia, 5.625% Sr. Unsec. Nts., 5/1/231 | | | | | 1,480,000 | | | | 1,496,924 | |
Nigeria—0.1% | | | | | | | | | | |
| Federal Republic of Nigeria, 7.625% Sr. | | | | | | | | | | |
Unsec. Nts., 11/28/471 | | | | | 1,075,000 | | | | 1,156,414 | |
Peru—0.2% | | | | | | | | | | |
| Republic of Peru: | | | | | | | | | | |
| 5.70% Unsec. Nts., 8/12/241 | | PEN | | | 5,345,000 | | | | 1,780,314 | |
| 6.15% Sr. Unsec. Nts., 8/12/321 | | PEN | | | 4,370,000 | | | | 1,440,383 | |
| | | | | | | | | | 3,220,697 | |
Poland—0.3% | | | | | | | | | | |
| Republic of Poland: | | | | | | | | | | |
| Series 0422, 2.25% Bonds, 4/25/22 | | PLN | | | 13,800,000 | | | | 3,932,953 | |
| Series 0727, 2.50% Bonds, 7/25/27 | | PLN | | | 6,650,000 | | | | 1,788,933 | |
| | | | | | | | | | 5,721,886 | |
Romania—0.3% | | | | | | | | | | |
| Romania: | | | | | | | | | | |
| 2.375% Sr. Unsec. Nts., 4/19/271 | | EUR | | | 1,075,000 | | | | 1,328,858 | |
| 3.875% Sr. Unsec. Nts., 10/29/351 | | EUR | | | 345,000 | | | | 456,621 | |
| Series 10YR, 5.95% Bonds, 6/11/21 | | RON | | | 9,460,000 | | | | 2,623,151 | |
| | | | | | | | | 4,408,630 | |
| | | | | | | | | | |
| | | | | Principal Amount | | | Value | |
Russia—0.5% | | | | | | | | | | |
| Russian Federation: | | | | | | | | | | |
| Series 6209, 7.60% Bonds, 7/20/22 | | RUB | | | 169,585,000 | | | | $ 3,028,251 | |
| Series 6211, 7.00% Bonds, 1/25/23 | | RUB | | | 96,250,000 | | | | 1,670,950 | |
| Series 6217, 7.50% Bonds, 8/18/21 | | RUB | | | 225,230,000 | | | | 3,980,816 | |
| | | | | | | | | | 8,680,017 | |
Senegal—0.1% | | | | | | | | | | |
| Republic of Senegal: | | | | | | | | | | |
| 6.25% Sr. Unsec. Nts., 7/30/241 | | | | | 540,000 | | | | 584,747 | |
| 6.25% Unsec. Nts., 5/23/331 | | | | | 535,000 | | | | 566,274 | |
| | | | | | | | | | 1,151,021 | |
Serbia—0.1% | | | | | | | | | | |
| Republic of Serbia, 5.875% Unsec. Nts., 12/3/181 | | | | | 2,215,000 | | | | 2,279,696 | |
South Africa—0.5% | | | | | | | | | | |
| Republic of South Africa: | | | | | | | | | | |
| Series 2023, 7.75% Bonds, 2/28/23 | | ZAR | | | 22,500,000 | | | | 1,807,862 | |
| Series R186, 10.50% Bonds, 12/21/26 | | ZAR | | | 65,975,000 | | | | 5,959,223 | |
| | | | | | | | | | 7,767,085 | |
Sri Lanka—0.2% | | | | | | | | | | |
| Democratic Socialist Republic of Sri Lanka: | | | | | | | | | | |
| 5.875% Sr. Unsec. Nts., 7/25/221 | | | | | 1,105,000 | | | | 1,167,068 | |
| 6.00% Sr. Unsec. Nts., 1/14/191 | | | | | 1,515,000 | | | | 1,554,245 | |
| 6.20% Sr. Unsec. Nts., 5/11/271 | | | | | 430,000 | | | | 454,819 | |
| 6.25% Sr. Unsec. Nts., 10/4/201 | | | | | 495,000 | | | | 522,571 | |
| 6.85% Sr. Unsec. Nts., 11/3/251 | | | | | 205,000 | | | | 226,677 | |
| | | | | | | | | | 3,925,380 | |
Thailand—0.1% | | | | | | | | | | |
| Kingdom of Thailand, 1.875% Sr. Unsec. Nts., 6/17/22 | | THB | | | 65,400,000 | | | | 2,017,081 | |
Turkey—0.3% | | | | | | | | | | |
| Republic of Turkey: | | | | | | | | | | |
| 8.80% Bonds, 11/14/18 | | TRY | | | 10,570,000 | | | | 2,690,951 | |
| 10.60% Bonds, 2/11/26 | | TRY | | | 5,000,000 | | | | 1,210,141 | |
| 11.00% Bonds, 2/24/27 | | TRY | | | 4,000,000 | | | | 1,011,750 | |
| | | | | | | | | | 4,912,842 | |
Ukraine—0.7% | | | | | | | | | | |
| Ukraine: | | | | | | | | | | |
| 7.375% Sr. Unsec. Nts., 9/25/321 | | | | | 2,985,000 | | | | 2,940,356 | |
| 7.75% Sr. Unsec. Nts., 9/1/20 | | | | | 1,060,000 | | | | 1,125,571 | |
| 7.75% Sr. Unsec. Nts., 9/1/22 | | | | | 1,070,000 | | | | 1,140,426 | |
| 7.75% Sr. Unsec. Nts., 9/1/23 | | | | | 2,425,000 | | | | 2,580,321 | |
| 7.75% Sr. Unsec. Nts., 9/1/24 | | | | | 1,620,000 | | | | 1,708,938 | |
| 7.75% Sr. Unsec. Nts., 9/1/25 | | | | | 1,075,000 | | | | 1,124,028 | |
| 7.75% Sr. Unsec. Nts., 9/1/27 | | | | | 1,610,000 | | | | 1,666,588 | |
| | | | | | | | | | 12,286,228 | |
Uruguay—0.2% | | | | | | | | | | |
| Oriental Republic of Uruguay: | | | | | | | | | | |
| 5.10% Sr. Unsec. Nts., 6/18/50 | | | | | 3,135,000 | | | | 3,487,688 | |
| 9.875% Sr. Unsec. Nts., 6/20/221 | | UYU | | | 13,555,000 | | | | 500,050 | |
| | | | | | | | | 3,987,738 | |
| Total Foreign Government Obligations (Cost $133,480,637) | | | | 140,031,551 | |
| | | | | |
| Corporate Loans—0.1% | | | | | | | | | | |
| Clear Channel Communications, Inc., Extended Sr. Sec. Credit Facilities 1st Lien Term Loan, Tranche D, 8.083% [LIBOR4+675], 1/30/192 | | | | | 800,000 | | | | 602,332 | |
| Murray Energy Corp., Sr. Sec. Credit Facilities 1st Lien Term Loan, Tranche B2, 7.50% [LIBOR4+725], 4/16/202 | | | | | 264,292 | | | | 233,568 | |
| Neiman Marcus Group Ltd. LLC, Sr. Sec. Credit Facilities 1st Lien Term Loan, 4.492% [LIBOR12+325], 10/25/202 | | | | | 1,054,948 | | | | 864,403 | |
13 OPPENHEIMER GLOBAL STRATEGIC INCOME FUND/VA
CONSOLIDATED STATEMENT OF INVESTMENTS Continued
| | | | | | | | |
| | | Principal Amount | | | Value | |
| Corporate Loans (Continued) | |
| Windstream Services LLC, Sr. Sec. Credit Facilities 1st Lien Term Loan, Tranche B6, 5.50% [LIBOR12+400], 3/29/212 | | | $ 309,217 | | | | $ 291,374 | |
| Total Corporate Loans (Cost $2,068,589) | | | | 1,991,677 | |
| | |
| | | | | | | | |
| Corporate Bonds and Notes—44.4% | |
| Consumer Discretionary—7.9% | |
| Auto Components—0.3% | |
| American Axle & Manufacturing, Inc., 6.25% Sr. Unsec. Nts., 4/1/251 | | | 1,325,000 | | | | 1,397,875 | |
| Cooper-Standard Automotive, Inc., 5.625% Sr. Unsec. Nts., 11/15/261 | | | 250,000 | | | | 258,750 | |
| Dana Financing Luxembourg Sarl, 6.50% Sr. Unsec. Nts., 6/1/261 | | | 1,245,000 | | | | 1,352,381 | |
| Goodyear Tire & Rubber Co. (The), 5.00% Sr. Unsec. Nts., 5/31/26 | | | 665,000 | | | | 688,175 | |
| Grinding Media, Inc./Moly-Cop AltaSteel Ltd., 7.375% Sr. Sec. Nts., 12/15/231 | | | 570,000 | | | | 613,434 | |
| Lear Corp., 3.80% Sr. Unsec. Nts., 9/15/27 | | | 553,000 | | | | 554,427 | |
| Tenneco, Inc., 5.00% Sr. Unsec. Nts., 7/15/26 | | | 495,000 | | | | 508,613 | |
| | | | | | | 5,373,655 | |
| | | | | | | | | |
Automobiles—0.5% | | | | | | | | |
| Daimler Finance North America LLC: 2.20% Sr. Unsec. Nts., 5/5/201 | | | 785,000 | | | | 780,760 | |
| 8.50% Sr. Unsec. Unsub. Nts., 1/18/31 | | | 485,000 | | | | 733,416 | |
| Ford Motor Credit Co. LLC: | | | | | | | | |
| 2.425% Sr. Unsec. Nts., 6/12/20 | | | 608,000 | | | | 604,714 | |
| 3.664% Sr. Unsec. Nts., 9/8/24 | | | 606,000 | | | | 614,583 | |
| General Motors Co., 6.25% Sr. Unsec. Nts., 10/2/43 | | | 235,000 | | | | 279,097 | |
| General Motors Financial Co., Inc., 3.15% Sr. Unsec. Nts., 6/30/22 | | | 823,000 | | | | 823,110 | |
| Harley-Davidson, Inc., 4.625% Sr. Unsec. Nts., 7/28/45 | | | 258,000 | | | | 281,134 | |
| Hyundai Capital America, 1.75% Sr. Unsec. Nts., 9/27/191 | | | 944,000 | | | | 926,390 | |
| Jaguar Land Rover Automotive plc, 4.50% Sr. Unsec. Nts., 10/1/271 | | | 1,600,000 | | | | 1,584,000 | |
| Nissan Motor Acceptance Corp., 2.15% Sr. Unsec. Nts., 9/28/201 | | | 586,000 | | | | 581,345 | |
| Volkswagen Group of America Finance LLC, 2.45% Sr. Unsec. Nts., 11/20/191 | | | 913,000 | | | | 912,756 | |
| ZF North America Capital, Inc., 4.75% | | | | | | | | |
| Sr. Unsec. Nts., 4/29/251 | | | 381,000 | | | | 404,812 | |
| | | | | | | | 8,526,117 | |
| Distributors—0.1% | |
LKQ Corp., 4.75% Sr. Unsec. Nts., 5/15/23 | | | 1,442,000 | | | | 1,481,655 | |
| Diversified Consumer Services—0.2% | |
| Monitronics International, Inc., 9.125% Sr. Unsec. Nts., 4/1/20 | | | 735,000 | | | | 613,725 | |
| Service Corp. International, 4.625% Sr. Unsec. Nts., 12/15/27 | | | 2,866,000 | | | | 2,915,066 | |
| | | | | | | 3,528,791 | |
| | | | | | | | | |
| Hotels, Restaurants & Leisure—1.8% | |
| 1011778 B.C. ULC/New Red Finance, Inc.: | | | | | | | | |
| 4.25% Sr. Sec. Nts., 5/15/241 | | | 785,000 | | | | 785,000 | |
| 5.00% Sec. Nts., 10/15/251 | | | 1,335,000 | | | | 1,351,688 | |
| Aramark Services, Inc.: | | | | | | | | |
| 4.75% Sr. Unsec. Nts., 6/1/26 | | | 745,000 | | | | 758,037 | |
| 5.00% Sr. Unsec. Nts., 4/1/251 | | | 463,000 | | | | 490,224 | |
| Boyd Gaming Corp., 6.375% Sr. | | | | | | | | |
| Unsec. Nts., 4/1/26 | | | 235,000 | | | | 253,800 | |
| | | | | | | | |
| | | Principal Amount | | | Value | |
| Hotels, Restaurants & Leisure (Continued) | |
| CEC Entertainment, Inc., 8.00% Sr. | | | | | | | | |
| Unsec. Nts., 2/15/22 | | | $ 945,000 | | | | $ 893,025 | |
| CRC Escrow Issuer LLC/CRC Finco, Inc., 5.25% Sr. Unsec. Nts., 10/15/251 | | | 1,065,000 | | | | 1,078,632 | |
| Eldorado Resorts, Inc., 6.00% Sr. Unsec. Nts., 4/1/25 | | | 650,000 | | | | 682,500 | |
| Gateway Casinos & Entertainment Ltd., 8.25% Sec. Nts., 3/1/241 | | | 390,000 | | | | 418,275 | |
| Golden Nugget, Inc.: | | | | | | | | |
| 6.75% Sr. Unsec. Nts., 10/15/241 | | | 2,045,000 | | | | 2,085,900 | |
| 8.75% Sr. Sub. Nts., 10/1/251 | | | 1,465,000 | | | | 1,541,912 | |
| Hilton Domestic Operating Co., Inc., 4.25% Sr. Unsec. Nts., 9/1/24 | | | 500,000 | | | | 506,250 | |
| Hilton Grand Vacations Borrower LLC/ | | | | | | | | |
| Hilton Grand Vacations Borrower, Inc., 6.125% Sr. Unsec. Nts., 12/1/241 | | | 1,260,000 | | | | 1,381,275 | |
| International Game Technology plc, 6.25% Sr. Sec. Nts., 2/15/221 | | | 1,700,000 | | | | 1,840,250 | |
| KFC Holding Co./Pizza Hut Holdings LLC/Taco Bell of America LLC: | | | | | | | | |
| 4.75% Sr. Unsec. Nts., 6/1/271 | | | 915,000 | | | | 937,875 | |
| 5.25% Sr. Unsec. Nts., 6/1/261 | | | 995,000 | | | | 1,049,725 | |
| Marriott International, Inc., 3.25% Sr. | | | | | | | | |
| Unsec. Nts., 9/15/22 | | | 388,000 | | | | 395,481 | |
| Melco Resorts Finance Ltd., 4.875% Sr. | | | | | | | | |
| Unsec. Nts., 6/6/251 | | | 1,380,000 | | | | 1,398,335 | |
| MGM Growth Properties Operating | | | | | | | | |
| Partnership LP/MGP Finance Co.-Issuer, | | | | | | | | |
| Inc., 5.625% Sr. Unsec. Nts., 5/1/24 | | | 1,380,000 | | | | 1,476,600 | |
| MGM Resorts International: | | | | | | | | |
| 6.00% Sr. Unsec. Nts., 3/15/23 | | | 1,370,000 | | | | 1,483,025 | |
| 6.625% Sr. Unsec. Nts., 12/15/21 | | | 405,000 | | | | 445,379 | |
| Mohegan Gaming & Entertainment, 7.875% Sr. Unsec. Nts., 10/15/241 | | | 780,000 | | | | 802,425 | |
| Penn National Gaming, Inc., 5.625% | | | | | | | | |
| Sr. Unsec. Nts., 1/15/271 | | | 1,295,000 | | | | 1,346,800 | |
| PF Chang’s China Bistro, Inc., 10.25% | | | | | | | | |
| Sr. Unsec. Nts., 6/30/201 | | | 550,000 | | | | 503,250 | |
| Premier Cruises Ltd., 11.00% Sr. | | | | | | | | |
| Unsec. Nts., 3/15/081,8,9 | | | 250,000 | | | | — | |
| Royal Caribbean Cruises Ltd., 2.65% | | | | | | | | |
| Sr. Unsec. Nts., 11/28/20 | | | 798,000 | | | | 797,903 | |
| Scientific Games International, Inc.: | | | | | | | | |
| 5.00% Sr. Sec. Nts., 10/15/251 | | | 665,000 | | | | 668,325 | |
| 10.00% Sr. Unsec. Nts., 12/1/22 | | | 1,727,000 | | | | 1,901,859 | |
| Silversea Cruise Finance Ltd., 7.25% | | | | | | | | |
| Sr. Sec. Nts., 2/1/251 | | | 510,000 | | | | 552,075 | |
| Six Flags Entertainment Corp., 4.875% | | | | | | | | |
| Sr. Unsec. Nts., 7/31/241 | | | 500,000 | | | | 508,750 | |
| Sugarhouse HSP Gaming Prop Mezz | | | | | | | | |
| LP/ Sugarhouse HSP Gaming Finance Corp., 5.875% Sr. Sec. Nts., 5/15/251 | | | 1,310,000 | | | | 1,247,775 | |
| Viking Cruises Ltd., 5.875% Sr. Unsec. | | | | | | | | |
| Nts., 9/15/271 | | | 535,000 | | | | 545,700 | |
| Wynn Las Vegas LLC/Wynn Las Vegas | | | | | | | | |
| Capital Corp., 5.25% Sr. Unsec. Nts., 5/15/271 | | | 390,000 | | | | 395,850 | |
| Wynn Macau Ltd.: | | | | | | | | |
| 4.875% Sr. Unsec. Nts., 10/1/241 | | | 135,000 | | | | 136,013 | |
| 5.50% Sr. Unsec. Nts., 10/1/271 | | | 135,000 | | | | 136,856 | |
| | | | | | | 30,796,769 | |
| | | | | | | | | |
| Household Durables—1.3% | |
| American Greetings Corp., 7.875% Sr. | | | | | | | | |
| Unsec. Nts., 2/15/253 | | | 1,020,000 | | | | 1,106,700 | |
| AV Homes, Inc., 6.625% Sr. Unsec. Nts., 5/15/22 | | | 1,310,000 | | | | 1,378,775 | |
| Beazer Homes USA, Inc.: | | | | | | | | |
| 5.875% Sr. Unsec. Nts., 10/15/271 | | | 935,000 | | | | 944,350 | |
| 6.75% Sr. Unsec. Nts., 3/15/25 | | | 1,335,000 | | | | 1,413,431 | |
14 OPPENHEIMER GLOBAL STRATEGIC INCOME FUND/VA
| | | | | | | | |
| | | Principal Amount | | | Value | |
Household Durables (Continued) | | | | | |
| Beazer Homes USA, Inc.: (Continued) | | | | | |
| 7.25% Sr. Unsec. Nts., 2/1/23 | | | $ 43,000 | | | | $ 44,935 | |
| DR Horton, Inc., 2.55% Sr. Unsec. Nts., 12/1/20 | | | 821,000 | | | | 820,283 | |
| K Hovnanian Enterprises, Inc., 10.00% Sec. Nts., 7/15/221 | | | 530,000 | | | | 585,650 | |
| KB Home, 7.625% Sr. Unsec. Nts., 5/15/23 | | | 1,075,000 | | | | 1,236,250 | |
| Leggett & Platt, Inc., 3.50% Sr. Unsec. Nts., 11/15/27 | | | 449,000 | | | | 445,426 | |
| Lennar Corp.: | | | | | | | | |
| 4.50% Sr. Unsec. Nts., 4/30/24 | | | 95,000 | | | | 97,641 | |
| 4.75% Sr. Unsec. Nts., 11/29/271 | | | 535,000 | | | | 553,618 | |
| 4.75% Sr. Unsec. Nts., 5/30/25 | | | 2,838,000 | | | | 2,958,615 | |
| M/I Homes, Inc., 5.625% Sr. Unsec. Nts., 8/1/25 | | | 795,000 | | | | 810,836 | |
| Mattamy Group Corp., 6.50% Sr. Unsec. Nts., 10/1/251 | | | 265,000 | | | | 281,563 | |
| MDC Holdings, Inc., 6.00% Sr. Unsec. Nts., 1/15/43 | | | 800,000 | | | | 786,000 | |
| Newell Brands, Inc.: | | | | | | | | |
| 2.15% Sr. Unsec. Nts., 10/15/18 | | | 386,000 | | | | 386,410 | |
| 5.00% Sr. Unsec. Nts., 11/15/23 | | | 628,000 | | | | 662,927 | |
| 5.50% Sr. Unsec. Nts., 4/1/46 | | | 269,000 | | | | 321,186 | |
| PulteGroup, Inc.: | | | | | | | | |
| 5.00% Sr. Unsec. Nts., 1/15/27 | | | 1,355,000 | | | | 1,421,056 | |
| 5.50% Sr. Unsec. Nts., 3/1/26 | | | 740,000 | | | | 807,525 | |
| 6.00% Sr. Unsec. Nts., 2/15/35 | | | 80,000 | | | | 86,400 | |
| Standard Industries, Inc., 4.75% Sr. | | | | | | | | |
| Unsec. Nts., 1/15/281 | | | 805,000 | | | | 810,885 | |
| Taylor Morrison Communities, | | | | | | | | |
| Inc./Taylor Morrison Holdings | | | | | | | | |
| II, Inc., 5.875% Sr. Unsec. Nts., 4/15/233 | | | 1,160,000 | | | | 1,231,050 | |
| Toll Brothers Finance Corp.: | | | | | | | | |
| 4.375% Sr. Unsec. Nts., 4/15/23 | | | 824,000 | | | | 857,990 | |
| 4.875% Sr. Unsec. Nts., 3/15/27 | | | 375,000 | | | | 390,000 | |
| William Lyon Homes, Inc., 5.875% Sr. Unsec. Nts., 1/31/25 | | | 1,020,000 | | | | 1,044,225 | |
| | | | | | | | 21,483,727 | |
Internet & Catalog Retail—0.1% | | | | | |
| Amazon.com, Inc., 4.95% Sr. Unsec. Nts., 12/5/44 | | | 271,000 | | | | 330,433 | |
| QVC, Inc., 4.45% Sr. Sec. Nts., 2/15/25 | | | 1,545,000 | | | | 1,577,986 | |
| | | | | | | | 1,908,419 | |
Leisure Equipment & Products—0.1% | | | | | |
| Mattel, Inc., 6.75% Sr. Unsec. Nts., 12/31/251 | | | 270,000 | | | | 274,306 | |
| Proven Honour Capital Ltd., 4.125% Sr. Unsec. Nts., 5/6/26 | | | 1,400,000 | | | | 1,431,632 | |
| | | | | | | | 1,705,938 | |
Media—2.4% | | | | | |
| 21st Century Fox America, Inc., 4.75% Sr. Unsec. Nts., 11/15/46 | | | 357,000 | | | | 414,576 | |
| Altice Finco SA, 8.125% Sec. Nts., 1/15/241 | | | 695,000 | | | | 729,750 | |
| AMC Entertainment Holdings, Inc.: | | | | | | | | |
| 5.75% Sr. Sub. Nts., 6/15/25 | | | 745,000 | | | | 740,344 | |
| 5.875% Sr. Sub. Nts., 11/15/26 | | | 760,000 | | | | 752,400 | |
| 6.125% Sr. Sub. Nts., 5/15/27 | | | 520,000 | | | | 518,700 | |
| AMC Networks, Inc., 4.75% Sr. Unsec. | | | | | | | | |
| Nts., 8/1/25 | | | 530,000 | | | | 526,687 | |
| Belo Corp., 7.75% Sr. Unsec. Nts., 6/1/27 | | | 1,362,000 | | | | 1,539,060 | |
| Block Communications, Inc., 6.875% Sr. | | | | | | | | |
| Unsec. Nts., 2/15/251 | | | 255,000 | | | | 268,387 | |
| CCO Holdings LLC/CCO Holdings Capital | | | | | | | | |
| Corp.: | | | | | | | | |
| 4.00% Sr. Unsec. Nts., 3/1/231 | | | 265,000 | | | | 263,012 | |
| | | | | | | | |
| | | Principal Amount | | | Value | |
Media (Continued) | | | | | | | | |
| CCO Holdings LLC/CCO Holdings Capital Corp.: (Continued) | | | | | | | | |
| 5.00% Sr. Unsec. Nts., 2/1/281 | | | $ 1,330,000 | | | | $ 1,300,075 | |
| 5.125% Sr. Unsec. Nts., 5/1/271 | | | 1,040,000 | | | | 1,027,000 | |
| 5.75% Sr. Unsec. Nts., 2/15/261 | | | 1,315,000 | | | | 1,369,244 | |
| Cequel Communications Holdings I | | | | | | | | |
| LLC/ Cequel Capital Corp., 6.375% | | | | | | | | |
| Sr. Unsec. Nts., 9/15/201 | | | 532,000 | | | | 541,310 | |
| Charter Communications Operating | | | | | | | | |
| LLC/Charter Communications | | | | | | | | |
| Operating Capital, 5.375% Sr. Sec. Nts., 5/1/47 | | | 386,000 | | | | 396,922 | |
| Cinemark USA, Inc., 4.875% Sr. | | | | | | | | |
| Unsec. Nts., 6/1/23 | | | 495,000 | | | | 503,662 | |
| Clear Channel International BV, 8.75% | | | | | | | | |
| Sr. Unsec. Nts., 12/15/201 | | | 265,000 | | | | 274,937 | |
| Clear Channel Worldwide Holdings, Inc.: | | | | | | | | |
| 6.50% Sr. Unsec. Nts., Series B, 11/15/22 | | | 1,465,000 | | | | 1,496,131 | |
| 7.625% Sr. Sub. Nts., Series B, 3/15/20 | | | 1,505,000 | | | | 1,480,544 | |
| Comcast Cable Communications | | | | | | | | |
| Holdings, Inc., 9.455% Sr. Unsec. Nts., 11/15/22 | | | 838,000 | | | | 1,095,446 | |
| CSC Holdings LLC: | | | | | | | | |
| 5.25% Sr. Unsec. Nts., 6/1/24 | | | 715,000 | | | | 702,487 | |
| 5.50% Sr. Unsec. Nts., 4/15/271 | | | 750,000 | | | | 766,875 | |
| 10.875% Sr. Unsec. Nts., 10/15/251 | | | 722,000 | | | | 859,180 | |
| DISH DBS Corp.: | | | | | | | | |
| 5.875% Sr. Unsec. Nts., 11/15/24 | | | 2,280,000 | | | | 2,225,850 | |
| 7.75% Sr. Unsec. Nts., 7/1/26 | | | 250,000 | | | | 263,750 | |
| Gray Television, Inc.: | | | | | | | | |
| 5.125% Sr. Unsec. Nts., 10/15/241 | | | 760,000 | | | | 760,000 | |
| 5.875% Sr. Unsec. Nts., 7/15/261 | | | 1,770,000 | | | | 1,818,675 | |
| iHeartCommunications, Inc., 9.00% Sr. | | | | | | | | |
| Sec. Nts., 12/15/19 | | | 1,455,000 | | | | 1,087,612 | |
| Interpublic Group of Cos., Inc. (The), 4.20% Sr. Unsec. Nts., 4/15/24 | | | 866,000 | | | | 909,380 | |
| Lions Gate Entertainment Corp., 5.875% | | | | | | | | |
| Sr. Unsec. Nts., 11/1/241 | | | 1,355,000 | | | | 1,437,994 | |
| MDC Partners, Inc., 6.50% Sr. Unsec. | | | | | | | | |
| Nts., 5/1/241 | | | 255,000 | | | | 257,550 | |
| Nexstar Broadcasting, Inc., 5.625% Sr. | | | | | | | | |
| Unsec. Nts., 8/1/241 | | | 1,095,000 | | | | 1,133,325 | |
| Salem Media Group, Inc., 6.75% Sr. Sec. | | | | | | | | |
| Nts., 6/1/241 | | | 775,000 | | | | 775,000 | |
| SFR Group SA, 6.00% Sr. Sec. Nts., 5/15/221 | | | 390,000 | | | | 395,362 | |
| Sinclair Television Group, Inc., 5.625% | | | | | | | | |
| Sr. Unsec. Nts., 8/1/241 | | | 995,000 | | | | 1,028,581 | |
| Sirius XM Radio, Inc., 5.375% Sr. Unsec. | | | | | | | | |
| Nts., 7/15/261 | | | 665,000 | | | | 690,769 | |
| Sky plc: | | | | | | | | |
| 3.75% Sr. Unsec. Nts., 9/16/241 | | | 422,000 | | | | 440,684 | |
| 6.10% Sr. Unsec. Nts., 2/15/181 | | | 317,000 | | | | 318,487 | |
| TEGNA, Inc., 5.50% Sr. Unsec. Nts., 9/15/241 | | | 650,000 | | | | 684,125 | |
| Time Warner Cable LLC, 4.50% Sr. | | | | | | | | |
| Unsec. Unsub. Nts., 9/15/42 | | | 648,000 | | | | 609,677 | |
| Time, Inc., 7.50% Sr. Unsec. Nts., 10/15/251 | | | 265,000 | | | | 313,363 | |
| Townsquare Media, Inc., 6.50% Sr. | | | | | | | | |
| Unsec. Nts., 4/1/231 | | | 265,000 | | | | 260,031 | |
| Tribune Media Co., 5.875% Sr. Unsec. | | | | | | | | |
| Nts., 7/15/22 | | | 725,000 | | | | 748,563 | |
| Univision Communications, Inc.: | | | | | | | | |
| 5.125% Sr. Sec. Nts., 5/15/231 | | | 245,000 | | | | 245,000 | |
| 5.125% Sr. Sec. Nts., 2/15/251 | | | 2,175,000 | | | | 2,126,063 | |
| Virgin Media Secured Finance plc: | | | | | | | | |
| 5.25% Sr. Sec. Nts., 1/15/261 | | | 876,000 | | | | 888,045 | |
| 5.50% Sr. Sec. Nts., 8/15/261 | | | 705,000 | | | | 724,388 | |
15 OPPENHEIMER GLOBAL STRATEGIC INCOME FUND/VA
CONSOLIDATED STATEMENT OF INVESTMENTS Continued
| | | | | | | | |
| | | Principal Amount | | | Value | |
Media (Continued) | | | | | | | | |
| Ziggo Secured Finance BV, 5.50% | |
| Sr. Sec. Nts., 1/15/271 | | | $ 1,930,000 | | | | $ 1,932,413 | |
| | | | | | | 39,641,416 | |
| | | | | | | | | |
Multiline Retail—0.2% | | | | | | | | |
| Dollar Tree, Inc., 5.75% Sr. Sec. Nts., 3/1/23 | | | 1,746,000 | | | | 1,832,209 | |
| JC Penney Corp., Inc., 5.875% Sr. Sec. | |
| Nts., 7/1/231 | | | 665,000 | | | | 630,087 | |
| | | | | | | 2,462,296 | |
| | | | | | | | | |
Specialty Retail—0.7% | | | | | | | | |
| AutoZone, Inc., 1.625% Sr. Unsec. Nts., 4/21/19 | | | 174,000 | | | | 172,593 | |
| Best Buy Co., Inc., 5.50% Sr. Unsec. Nts., 3/15/21 | | | 791,000 | | | | 852,609 | |
| Eurotorg LLC Via Bonitron DAC, 8.75% | |
| Sr. Unsec. Nts., 10/30/221 | | | 745,000 | | | | 755,095 | |
| Freedom Mortgage Corp., 8.125% Sr. | |
| Unsec. Nts., 11/15/241 | | | 400,000 | | | | 408,500 | |
| GameStop Corp.: | | | | | | | | |
| 5.50% Sr. Unsec. Nts., 10/1/191 | | | 685,000 | | | | 698,700 | |
| 6.75% Sr. Unsec. Nts., 3/15/211 | | | 1,425,000 | | | | 1,496,250 | |
| Guitar Center, Inc., 6.50% Sr. Sec. Nts., 4/15/191 | | | 365,000 | | | | 339,450 | |
| L Brands, Inc.: | | | | | | | | |
| 5.625% Sr. Unsec. Nts., 2/15/22 | | | 867,000 | | | | 928,774 | |
| 6.875% Sr. Unsec. Nts., 11/1/35 | | | 2,335,000 | | | | 2,370,025 | |
| Lithia Motors, Inc., 5.25% Sr. Unsec. | |
| Nts., 8/1/251 | | | 530,000 | | | | 553,850 | |
| Murphy Oil USA, Inc., 5.625% Sr. Unsec. | |
| Nts., 5/1/27 | | | 260,000 | | | | 274,027 | |
| Ross Stores, Inc., 3.375% Sr. Unsec. Nts., 9/15/24 | | | 813,000 | | | | 824,856 | |
| Sally Holdings LLC/Sally Capital, Inc., 5.625% Sr. Unsec. Nts., 12/1/25 | | | 475,000 | | | | 475,000 | |
| Signet UK Finance plc, 4.70% Sr. Unsec. | |
| Nts., 6/15/24 | | | 927,000 | | | | 913,811 | |
| Sonic Automotive, Inc., 6.125% Sr. Sub. | |
| Nts., 3/15/27 | | | 650,000 | | | | 648,375 | |
| | | | | | | 11,711,915 | |
| | | | | | | | | |
Textiles, Apparel & Luxury Goods—0.2% | | | | | |
| Hanesbrands, Inc.: | | | | | | | | |
| 4.625% Sr. Unsec. Nts., 5/15/241 | | | 425,000 | | | | 435,625 | |
| 4.875% Sr. Unsec. Nts., 5/15/261 | | | 1,370,000 | | | | 1,411,100 | |
| Levi Strauss & Co., 5.00% Sr. Unsec. | | | | | | | | |
| Nts., 5/1/25 | | | 654,000 | | | | 685,065 | |
| PVH Corp., 4.50% Sr. Unsec. | | | | | | | | |
| Unsub. Nts., 12/15/22 | | | 412,000 | | | | 421,229 | |
| Springs Industries, Inc., 6.25% Sr. Sec. | |
| Nts., 6/1/21 | | | 655,000 | | | | 669,737 | |
| | | | | | | 3,622,756 | |
| | | | | | | | | |
Consumer Staples—2.5% | | | | | | | | |
Beverages—0.4% | | | | | | | | |
| Anheuser-Busch InBev Finance, Inc.: | | | | | | | | |
| 1.90% Sr. Unsec. Nts., 2/1/19 | | | 970,000 | | | | 968,180 | |
| 3.65% Sr. Unsec. Nts., 2/1/26 | | | 533,000 | | | | 550,841 | |
| 4.90% Sr. Unsec. Nts., 2/1/46 | | | 343,000 | | | | 398,770 | |
| Anheuser-Busch InBev Worldwide, Inc., 8.20% Sr. Unsec. Unsub. Nts., 1/15/39 | | | 390,000 | | | | 621,728 | |
| Coca-Cola Icecek AS, 4.215% Sr. Unsec. | |
| Nts., 9/19/241 | | | 555,000 | | | | 564,824 | |
| Constellation Brands, Inc., 2.25% Sr. Unsec. Nts., 11/6/20 | | | 922,000 | | | | 914,097 | |
| Molson Coors Brewing Co.: | | | | | | | | |
| 1.45% Sr. Unsec. Nts., 7/15/19 | | | 348,000 | | | | 343,748 | |
| 2.10% Sr. Unsec. Nts., 7/15/21 | | | 833,000 | | | | 817,055 | |
| 4.20% Sr. Unsec. Nts., 7/15/46 | | | 130,000 | | | | 132,899 | |
| | | | | | | | |
| | | Principal Amount | | | Value | |
Beverages (Continued) | | | | | | | | |
| Pernod Ricard SA, 4.25% Sr. Unsec. Nts., 7/15/221 | | | $ 853,000 | | | | $ 904,131 | |
| | | | | | | 6,216,273 | |
| | | | | | | | | |
Food & Staples Retailing—0.8% | | | | | | | | |
| Albertsons Cos LLC/Safeway, Inc./ | | | | | | | | |
| New Albertson’s, Inc./Albertson’s LLC, 6.625% Sr. Unsec. Nts., 6/15/24 | | | 745,000 | | | | 715,200 | |
| Alimentation Couche-Tard, Inc., 2.35% | | | | | | | | |
| Sr. Unsec. Nts., 12/13/191 | | | 953,000 | | | | 953,277 | |
| CVS Health Corp.: | | | | | | | | |
| 2.125% Sr. Unsec. Nts., 6/1/21 | | | 929,000 | | | | 907,268 | |
| 5.125% Sr. Unsec. Nts., 7/20/45 | | | 208,000 | | | | 239,103 | |
| Fresh Market, Inc. (The), 9.75% Sr. Sec. | |
| Nts., 5/1/231 | | | 705,000 | | | | 440,625 | |
| Ingles Markets, Inc., 5.75% Sr. Unsec. | | | | | | | | |
| Nts., 6/15/23 | | | 1,353,000 | | | | 1,376,677 | |
| Kroger Co. (The): | | | | | | | | |
| 2.00% Sr. Unsec. Nts., 1/15/19 | | | 40,000 | | | | 39,936 | |
| 6.80% Sr. Unsec. Nts., 12/15/18 | | | 287,000 | | | | 299,581 | |
| 6.90% Sr. Unsec. Nts., 4/15/38 | | | 221,000 | | | | 286,364 | |
| New Albertson’s, Inc., 7.45% Sr. Unsec. | | | | | | | | |
| Nts., 8/1/29 | | | 740,000 | | | | 649,350 | |
| Omnicare, Inc., 4.75% Sr. Unsec. Nts., 12/1/22 | | | 1,765,000 | | | | 1,858,914 | |
| Performance Food Group, Inc., 5.50% Sr. | |
| Unsec. Nts., 6/1/241 | | | 495,000 | | | | 512,325 | |
| Rite Aid Corp., 6.125% Sr. Unsec. Nts., 4/1/231 | | | 2,050,000 | | | | 1,857,813 | |
| Simmons Foods, Inc., 5.75% Sec. Nts., 11/1/241 | | | 1,870,000 | | | | 1,855,975 | |
| SUPERVALU, Inc.: | | | | | | | | |
| 6.75% Sr. Unsec. Nts., 6/1/21 | | | 500,000 | | | | 500,625 | |
| 7.75% Sr. Unsec. Nts., 11/15/22 | | | 630,000 | | | | 618,975 | |
| US Foods, Inc., 5.875% Sr. Unsec. Nts., 6/15/241 | | | 125,000 | | | | 131,875 | |
| | | | | | | 13,243,883 | |
| | | | | | | | | |
Food Products—0.8% | | | | | | | | |
| Adecoagro SA, 6.00% Sr. Unsec. Nts., 9/21/271 | | | 575,000 | | | | 572,987 | |
| B&G Foods, Inc., 5.25% Sr. Unsec. Nts., 4/1/25 | | | 260,000 | | | | 265,109 | |
| Bunge Ltd. Finance Corp.: | | | | | | | | |
| 3.25% Sr. Unsec. Nts., 8/15/26 | | | 590,000 | | | | 564,737 | |
| 8.50% Sr. Unsec. Nts., 6/15/19 | | | 823,000 | | | | 891,764 | |
| Dean Foods Co., 6.50% Sr. Unsec. Nts., 3/15/231 | | | 1,780,000 | | | | 1,775,550 | |
| JBS USA LUX SA/JBS USA Finance, Inc., 5.75% Sr. Unsec. Nts., 6/15/251 | | | 1,315,000 | | | | 1,272,263 | |
| Kraft Heinz Foods Co.: | | | | | | | | |
| 3.95% Sr. Unsec. Nts., 7/15/25 | | | 493,000 | | | | 509,891 | |
| 4.375% Sr. Unsec. Nts., 6/1/46 | | | 325,000 | | | | 322,939 | |
| Lamb Weston Holdings, Inc., 4.875% Sr. | |
| Unsec. Nts., 11/1/261 | | | 498,000 | | | | 521,655 | |
| Minerva Luxembourg SA, 5.875% Sr. | | | | | | | | |
| Unsec. Nts., 1/19/281 | | | 535,000 | | | | 521,224 | |
| Mondelez International Holdings | | | | | | | | |
| Netherlands BV, 1.625% Sr. Unsec. Nts., 10/28/191 | | | 966,000 | | | | 952,374 | |
| Pilgrim’s Pride Corp.: | | | | | | | | |
| 5.75% Sr. Unsec. Nts., 3/15/251 | | | 910,000 | | | | 939,575 | |
| 5.875% Sr. Unsec. Nts., 9/30/271 | | | 265,000 | | | | 273,613 | |
| Post Holdings, Inc., 5.75% Sr. Unsec. | | | | | | | | |
| Nts., 3/1/271 | | | 795,000 | | | | 810,900 | |
| Smithfield Foods, Inc., 2.70% Sr. Unsec. | |
| Nts., 1/31/201 | | | 932,000 | | | | 926,795 | |
| TreeHouse Foods, Inc., 6.00% Sr. Unsec. | |
| Nts., 2/15/241 | | | 1,005,000 | | | | 1,050,225 | |
16 OPPENHEIMER GLOBAL STRATEGIC INCOME FUND/VA
| | | | | | | | | | |
| | | | | Principal Amount | | | Value | |
Food Products (Continued) | | | | | |
| Tyson Foods, Inc., 3.55% Sr. Unsec. Nts., 6/2/27 | | | | | $ 454,000 | | | | $ 465,651 | |
| | | | | | | | | 12,637,252 | |
| | | | | | | | | | | |
Household Products—0.1% | | | | | |
| Kronos Acquisition Holdings, | | | | | | | | | | |
| Inc., 9.00% Sr. Unsec. Nts., 8/15/231 | | | | | 645,000 | | | | 604,687 | |
| Spectrum Brands, Inc., 6.125% | | | | | | | | | | |
| Sr. Unsec. Nts., 12/15/24 | | | | | 360,000 | | | | 382,950 | |
| | | | | | | | | 987,637 | |
| | | | | | | | | | | |
Personal Products—0.2% | | | | | |
| Avon International Operations, Inc., 7.875% Sr. Sec. Nts., 8/15/221 | | | | | 2,280,000 | | | | 2,331,300 | |
| Edgewell Personal Care Co., 4.70% | | | | | | | | |
| Sr. Unsec. Nts., 5/24/22 | | | | | 85,000 | | | | 87,550 | |
| Revlon Consumer Products Corp., | | | | | | | | |
| 5.75% Sr. Unsec. Nts., 2/15/21 | | | | | 1,865,000 | | | | 1,417,400 | |
| | | | | | | | | 3,836,250 | |
| | | | | | | | | | | |
Tobacco—0.2% | | | | | |
| Altria Group, Inc., 4.00% Sr. Unsec. Nts., 1/31/24 | | | | | 619,000 | | | | 657,087 | |
| BAT Capital Corp.: | | | | | | | | | | |
| 2.297% Sr. Unsec. Nts., 8/14/201 | | | | | 918,000 | | | | 913,464 | |
| 3.557% Sr. Unsec. Nts., 8/15/271 | | | | | 458,000 | | | | 459,386 | |
| Imperial Brands Finance plc, 2.05% | | | | | | | | |
| Sr. Unsec. Nts., 7/20/181 | | | | | 947,000 | | | | 946,271 | |
| Philip Morris International, Inc., | | | | | | | | |
| 2.50% Sr. Unsec. Nts., 11/2/22 | | | | | 814,000 | | | | 807,192 | |
| Reynolds American, Inc., | | | | | | | | | | |
| 5.85% Sr. Unsec. Nts., 8/15/45 | | | | | 312,000 | | | | 390,751 | |
| | | | | | | | | 4,174,151 | |
| | | | | | | | | | | |
Energy—7.6% | | | | | |
Energy Equipment & Services—0.9% | | | | | |
| Calfrac Holdings LP, 7.50% Sr. | | | | | | | | |
| Unsec. Nts., 12/1/201 | | | | | 925,000 | | | | 915,750 | |
| Ensco plc, 5.20% Sr. Unsec. Nts., 3/15/25 | | | | | 685,000 | | | | 585,675 | |
| Exterran Energy Solutions | | | | | | | | | | |
| LP/EES Finance Corp., 8.125% Sr. Unsec. Nts., 5/1/251 | | | | | 260,000 | | | | 280,150 | |
| Halliburton Co., 5.00% Sr. Unsec. Nts., 11/15/45 | | | | | 203,000 | | | | 233,830 | |
| Helmerich & Payne International | | | | | | | | |
| Drilling Co., 4.65% Sr. Unsec. Nts., 3/15/25 | | | | | 522,000 | | | | 550,179 | |
| McDermott International, Inc., 8.00% | | | | | | | | |
| Sec. Nts., 5/1/211 | | | | | 1,115,000 | | | | 1,151,628 | |
| Noble Holding International | | | | | | | | |
| Ltd., 7.75% Sr. Unsec. Nts., 1/15/24 | | | | | 760,000 | | | | 657,400 | |
| Parker Drilling Co., 6.75% Sr. Unsec. | | | | | | | | |
| Nts., 7/15/22 | | | | | 1,225,000 | | | | 1,010,625 | |
| Pertamina Persero PT, 6.45% Sr. | | | | | | | | |
| Unsec. Nts., 5/30/441 | | | | | 1,235,000 | | | | 1,482,693 | |
| Pioneer Energy Services Corp., 6.125% | | | | | | | | |
| Sr. Unsec. Nts., 3/15/22 | | | | | 1,515,000 | | | | 1,249,420 | |
| Rowan Cos., Inc., 7.375% Sr. Unsec. | | | | | | | | |
| Nts., 6/15/25 | | | | | 1,330,000 | | | | 1,364,912 | |
| Schlumberger Holdings Corp., 4.00% Sr. | | | | | | | | |
| Unsec. Nts., 12/21/251 | | | | | 514,000 | | | | 540,897 | |
| SESI LLC, 7.75% Sr. Unsec. Nts., 9/15/241 | | | | | 795,000 | | | | 846,675 | |
| Transocean, Inc.: | | | | | | | | | | |
| 7.50% Sr. Unsec. Nts., 1/15/261 | | | | | 265,000 | | | | 272,036 | |
| 9.00% Sr. Unsec. Nts., 7/15/231 | | | | | 1,105,000 | | | | 1,198,925 | |
| Trinidad Drilling Ltd., 6.625% Sr. Unsec. | | | | | | | | |
| Nts., 2/15/251 | | | | | 385,000 | | | | 367,675 | |
| Weatherford International Ltd., 9.875% | | | | | | | | |
| Sr. Unsec. Nts., 2/15/24 | | | | | 1,462,000 | | | | 1,560,685 | |
| | | | | | | | | 14,269,155 | |
| | | | | | | | | | |
| | | | | Principal Amount | | | Value | |
Oil, Gas & Consumable Fuels—6.7% | | | | | |
| Alta Mesa Holdings LP/Alta | | | | | | | | | | |
| Mesa Finance Services Corp., | | | | | | | | | | |
| 7.875% Sr. Unsec. Nts., 12/15/24 | | | | | $ 265,000 | | | | $ 291,831 | |
| Anadarko Petroleum Corp.: | | | | | | | | | | |
| 4.50% Sr. Unsec. Nts., 7/15/44 | | | | | 213,000 | | | | 212,893 | |
| 6.20% Sr. Unsec. Nts., 3/15/40 | | | | | 175,000 | | | | 212,733 | |
| Andeavor, 5.125% Sr. Unsec. Nts., 12/15/261 | | | | | 835,000 | | | | 918,987 | |
| Andeavor Logistics LP/Tesoro | | | | | | | | | | |
| Logistics Finance Corp.: | | | | | | | | | | |
| 4.25% Sr. Unsec. Nts., 12/1/27 | | | | | 462,000 | | | | 466,748 | |
| 5.25% Sr. Unsec. Nts., 1/15/25 | | | | | 324,000 | | | | 341,156 | |
| Apache Corp., 4.75% Sr. Unsec. Nts., 4/15/43 | | | | | 263,000 | | | | 271,065 | |
| Ardagh Packaging Finance | | | | | | | | | | |
| plc/Ardagh Holdings USA, Inc., | | | | | | | | | | |
| 6.00% Sr. Unsec. Nts., 2/15/251 | | | | | 1,150,000 | | | | 1,213,250 | |
| Ascent Resources Utica Holdings LLC/ ARU Finance Corp., 10.00% Sr. Unsec. Nts., 4/1/221 | | | | | 425,000 | | | | 457,937 | |
| Baytex Energy Corp., 5.625% Sr. Unsec. Nts., 6/1/241 | | | | | 1,075,000 | | | | 1,006,469 | |
| Bharat Petroleum Corp. Ltd., 4.00% Sr. Unsec. Nts., 5/8/25 | | | | | 1,105,000 | | | | 1,128,808 | |
| Bill Barrett Corp., 8.75% Sr. Unsec. Nts., 6/15/25 | | | | | 795,000 | | | | 882,450 | |
| Boardwalk Pipelines LP, 4.95% Sr. Unsec. Nts., 12/15/24 | | | | | 422,000 | | | | 452,633 | |
| BP Capital Markets plc, 1.676% Sr. Unsec. Nts., 5/3/19 | | | | | 967,000 | | | | 962,019 | |
| Buckeye Partners LP, 3.95% Sr. Unsec. | |
| Nts., 12/1/26 | | | | | 230,000 | | | | 226,428 | |
| California Resources Corp., 8.00% Sec. | |
| Nts., 12/15/221 | | | | | 658,000 | | | | 545,317 | |
| Calumet Specialty Products Partners LP/ | |
| Calumet Finance Corp.: | | | | | | | | | | |
| 6.50% Sr. Unsec. Nts., 4/15/21 | | | | | 630,000 | | | | 630,000 | |
| 7.625% Sr. Unsec. Nts., 1/15/22 | | | | | 1,075,000 | | | | 1,081,719 | |
| Centennial Resource Production LLC, 5.375% Sr. Unsec. Nts., 1/15/261 | | | | | 670,000 | | | | 684,237 | |
| Cheniere Corpus Christi Holdings LLC: | | | | | | | | | | |
| 5.125% Sr. Sec. Nts., 6/30/27 | | | | | 525,000 | | | | 544,372 | |
| 7.00% Sr. Sec. Nts., 6/30/24 | | | | | 1,430,000 | | | | 1,630,200 | |
| Chesapeake Energy Corp.: | | | | | | | | | | |
| 6.125% Sr. Unsec. Nts., 2/15/21 | | | | | 493,000 | | | | 501,627 | |
| 8.00% Sec. Nts., 12/15/221 | | | | | 249,000 | | | | 269,543 | |
| 8.00% Sr. Unsec. Nts., 1/15/251 | | | | | 265,000 | | | | 267,981 | |
| 8.00% Sr. Unsec. Nts., 6/15/271 | | | | | 270,000 | | | | 259,875 | |
| Chevron Corp., 1.561% Sr. Unsec. Nts., 5/16/19 | | | | | 972,000 | | | | 966,557 | |
| Citadel LP, 5.375% Sr. Unsec. Nts., 1/17/231 | | | | | 805,000 | | | | 831,246 | |
| CITGO Petroleum Corp., 6.25% Sr. Sec. | |
| Nts., 8/15/221 | | | | | 70,000 | | | | 70,875 | |
| Cloud Peak Energy Resources LLC/Cloud | |
| Peak Energy Finance Corp., 12.00% Sec. | |
| Nts., 11/1/21 | | | | | 990,000 | | | | 1,071,675 | |
| CNX Resources Corp.: | | | | | | | | | | |
| 5.875% Sr. Unsec. Nts., 4/15/22 | | | | | 445,000 | | | | 456,681 | |
| 8.00% Sr. Unsec. Nts., 4/1/23 | | | | | 625,000 | | | | 671,562 | |
| Columbia Pipeline Group, Inc.: | | | | | | | | | | |
| 3.30% Sr. Unsec. Nts., 6/1/20 | | | | | 833,000 | | | | 845,318 | |
| 4.50% Sr. Unsec. Nts., 6/1/25 | | | | | 438,000 | | | | 466,966 | |
| ConocoPhillips Co.: | | | | | | | | | | |
| 4.95% Sr. Unsec. Nts., 3/15/26 | | | | | 108,000 | | | | 122,763 | |
| 5.95% Sr. Unsec. Nts., 3/15/46 | | | | | 195,000 | | | | 263,459 | |
| Continental Resources, Inc.: | | | | | | | | | | |
| 4.375% Sr. Unsec. Nts., 1/15/281 | | | | | 1,610,000 | | | | 1,591,404 | |
| 5.00% Sr. Unsec. Nts., 9/15/22 | | | | | 520,000 | | | | 529,750 | |
17 OPPENHEIMER GLOBAL STRATEGIC INCOME FUND/VA
CONSOLIDATED STATEMENT OF INVESTMENTS Continued
| | | | | | | | | | | | |
| | | | | | Principal Amount | | | Value | |
Oil, Gas & Consumable Fuels (Continued) | |
| CrownRock LP/CrownRock Finance, Inc., 5.625% Sr. Unsec. Nts., 10/15/251 | | | | | | | $ 530,000 | | | | $ 533,975 | |
| CVR Refining LLC/Coffeyville Finance, Inc., 6.50% Sr. Unsec. Nts., 11/1/22 | | | | | | | 1,400,000 | | | | 1,449,000 | |
| Denbury Resources, Inc.: | | | | | | | | | | | | |
| 4.625% Sr. Sub. Nts., 7/15/23 | | | | | | | 805,000 | | | | 519,225 | |
| 5.50% Sr. Sub. Nts., 5/1/22 | | | | | | | 662,000 | | | | 455,952 | |
| 6.375% Sr. Sub. Nts., 8/15/21 | | | | | | | 805,000 | | | | 611,800 | |
| 9.00% Sec. Nts., 5/15/211 | | | | | | | 1,140,000 | | | | 1,169,925 | |
| Devon Energy Corp., 4.75% Sr. Unsec. Nts., 5/15/42 | | | | | | | 207,000 | | | | 219,810 | |
| Endeavor Energy Resources LP/EER Finance, Inc.: | | | | | | | | | |
| 5.50% Sr. Unsec. Nts., 1/30/261 | | | | | | | 540,000 | | | | 550,800 | |
| 5.75% Sr. Unsec. Nts., 1/30/281 | | | | | | | 540,000 | | | | 556,605 | |
| Energy Transfer LP, 5.30% Sr. Unsec. Nts., 4/15/47 | | | | | | | 255,000 | | | | 254,129 | |
| Energy Transfer Partners LP, 6.625% [US0003M+415.5] Jr. Sub. Perpetual Bonds2,10 | | | | | | | 341,000 | | | | 331,836 | |
| EnLink Midstream Partners LP, 4.85% Sr. Unsec. Nts., 7/15/26 | | | | | | | 206,000 | | | | 216,175 | |
| Enterprise Products Operating LLC: | | | | | | | | | | | | |
| 4.85% Sr. Unsec. Nts., 8/15/42 | | | | | | | 144,000 | | | | 158,580 | |
| 4.90% Sr. Unsec. Nts., 5/15/46 | | | | | | | 151,000 | | | | 166,881 | |
| Enviva Partners LP/Enviva Partners Finance Corp., 8.50% Sr. Unsec. Nts., 11/1/21 | | | | | | | 1,235,000 | | | | 1,319,906 | |
| EP Energy LLC/Everest Acquisition Finance, Inc.: | | | | | | | | | | | | |
| 7.75% Sr. Unsec. Nts., 9/1/22 | | | | | | | 645,000 | | | | 362,812 | |
| 8.00% Sr. Sec. Nts., 11/29/241 | | | | | | | 1,260,000 | | | | 1,307,250 | |
| 8.00% Sec. Nts., 2/15/251 | | | | | | | 1,022,000 | | | | 751,170 | |
| 9.375% Sr. Unsec. Nts., 5/1/20 | | | | | | | 635,000 | | | | 539,750 | |
| EQT Corp., 2.50% Sr. Unsec. Nts., 10/1/20 | | | | | | | 918,000 | | | | 912,136 | |
| Extraction Oil & Gas, Inc., 7.375% Sr. Unsec. Nts., 5/15/241 | | | | | | | 265,000 | | | | 284,212 | |
| Foresight Energy LLC/Foresight Energy | | | | | | | | | | | | |
| Finance Corp., 11.50% Sec. Nts., 4/1/231 | | | | | | | 1,300,000 | | | | 1,069,250 | |
| Gazprom OAO Via Gaz Capital SA, 4.95% Sr. Unsec. Nts., 7/19/221 | | | | | | | 1,265,000 | | | | 1,326,321 | |
| Genesis Energy LP/Genesis Energy Finance Corp.: | | | | | | | | | | | | |
| 6.00% Sr. Unsec. Nts., 5/15/23 | | | | | | | 725,000 | | | | 737,687 | |
| 6.25% Sr. Unsec. Nts., 5/15/26 | | | | | | | 1,070,000 | | | | 1,068,662 | |
| 6.50% Sr. Unsec. Nts., 10/1/25 | | | | | | | 795,000 | | | | 810,900 | |
| Geopark Ltd., 6.50% Sr. Sec. Nts., 9/21/241 | | | | | | | 460,000 | | | | 472,986 | |
| Halcon Resources Corp., 6.75% Sr. Unsec. Nts., 2/15/251 | | | | | | | 530,000 | | | | 553,850 | |
| Hess Infrastructure Partners LP/Hess Infrastructure Partners Finance Corp., 5.625% Sr. Unsec. Nts., 2/15/261 | | | | | | | 805,000 | | | | 835,187 | |
| Holly Energy Partners LP/Holly Energy Finance Corp., 6.00% Sr. Unsec. Nts., 8/1/241 | | | | | | | 265,000 | | | | 277,587 | |
| Indian Oil Corp. Ltd., 5.75% Sr. Unsec. Nts., 8/1/23 | | | | | | | 1,505,000 | | | | 1,679,454 | |
| Jones Energy Holdings LLC/Jones Energy | | | | | | | | | | | | |
| Finance Corp., 6.75% Sr. Unsec. Nts., 4/1/22 | | | | | | | 2,533,000 | | | | 1,912,415 | |
| KazMunayGas National Co. JSC: | | | | | | | | | | | | |
| 4.40% Sr. Unsec. Nts., 4/30/231 | | | | | | | 480,000 | | | | 498,271 | |
| 5.75% Sr. Unsec. Nts., 4/19/471 | | | | | | | 2,060,000 | | | | 2,201,625 | |
| 6.375% Sr. Unsec. Nts., 4/9/211 | | | | | | | 1,685,000 | | | | 1,842,295 | |
| 7.00% Sr. Unsec. Nts., 5/5/201 | | | | | | | 1,580,000 | | | | 1,714,458 | |
| Kinder Morgan, Inc., 5.55% Sr. Unsec. Nts., 6/1/45 | | | | | | | 703,000 | | | | 771,528 | |
| | | | | | | | | | | | |
| | | | | | Principal Amount | | | Value | |
Oil, Gas & Consumable Fuels (Continued) | | | | | |
| LBC Tank Terminals Holding Netherlands BV, 6.875% Sr. Unsec. Nts., 5/15/233 | | | | | | | $ 475,000 | | | | $ 496,969 | |
| Marathon Oil Corp., 4.40% Sr. Unsec. | | | | | | | | | |
| Nts., 7/15/27 | | | | | | | 470,000 | | | | 491,979 | |
| MEG Energy Corp.: | | | | | | | | | | | | |
| 6.50% Sec. Nts., 1/15/251 | | | | | | | 520,000 | | | | 515,450 | |
| 7.00% Sr. Unsec. Nts., 3/31/241 | | | | | | | 1,355,000 | | | | 1,150,056 | |
| Murphy Oil Corp., 6.875% Sr. Unsec. | | | | | | | | | |
| Nts., 8/15/24 | | | | | | | 720,000 | | | | 770,400 | |
| Murray Energy Corp., 11.25% Sec. Nts., 4/15/211 | | | | | | | 3,240,000 | | | | 1,668,600 | |
| Newfield Exploration Co., 5.625% Sr. | | | | | | | | | |
| Unsec. Nts., 7/1/24 | | | | | | | 515,000 | | | | 556,200 | |
| NGL Energy Partners LP/NGL Energy | | | | | | | | | |
| Finance Corp.: | | | | | | | | | | | | |
| 6.125% Sr. Unsec. Nts., 3/1/25 | | | | | | | 1,295,000 | | | | 1,269,100 | |
| 6.875% Sr. Unsec. Nts., 10/15/21 | | | | | | | 385,000 | | | | 394,625 | |
| 7.50% Sr. Unsec. Nts., 11/1/23 | | | | | | | 1,045,000 | | | | 1,086,800 | |
| Noble Energy, Inc., 5.05% Sr. Unsec. | | | | | | | | | |
| Nts., 11/15/44 | | | | | | | 240,000 | | | | 257,822 | |
| Novatek OAO Via Novatek Finance DAC, 4.422% Sr. Unsec. Nts., 12/13/221 | | | | | | | 605,000 | | | | 624,148 | |
| NuStar Logistics LP, 5.625% Sr. Unsec. | | | | | | | | | |
| Nts., 4/28/27 | | | | | | | 785,000 | | | | 800,700 | |
| Oasis Petroleum, Inc., 6.875% Sr. Unsec. | | | | | | | | | | | | |
| Nts., 1/15/23 | | | | | | | 830,000 | | | | 851,788 | |
| ONEOK Partners LP: | | | | | | | | | | | | |
| 4.90% Sr. Unsec. Nts., 3/15/25 | | | | | | | 364,000 | | | | 390,781 | |
| 8.625% Sr. Unsec. Nts., 3/1/19 | | | | | | | 396,000 | | | | 422,765 | |
| Parsley Energy LLC/Parsley Finance | | | | | | | | | |
| Corp., 5.625% Sr. Unsec. Nts., 10/15/271 | | | | | | | 400,000 | | | | 410,000 | |
| PBF Holding Co. LLC/PBF Finance Corp.: | | | | | | | | | |
| 7.00% Sr. Sec. Nts., 11/15/23 | | | | | | | 635,000 | | | | 665,956 | |
| 7.25% Sr. Unsec. Nts., 6/15/25 | | | | | | | 800,000 | | | | 843,000 | |
| PBF Logistics LP/PBF Logistics Finance | | | | | | | | | |
| Corp., 6.875% Sr. Unsec. Nts., 5/15/231 | | | | | | | 265,000 | | | | 274,275 | |
| PDC Energy, Inc., 5.75% Sr. Unsec. Nts., 5/15/261 | | | | | | | 535,000 | | | | 549,044 | |
| Peabody Energy Corp.: | | | | | | | | | | | | |
| 6.00% Sr. Sec. Nts., 11/15/188,9,11 | | | | | | | 1,110,000 | | | | 1 | |
| 6.375% Sr. Sec. Nts., 3/31/251 | | | | | | | 515,000 | | | | 537,531 | |
| 10.00% Sr. Sec. Nts., 3/15/228,9,11 | | | | | | | 2,075,000 | | | | 2 | |
| Petrobras Global Finance BV: | | | | | | | | | | | | |
| 4.375% Sr. Unsec. Nts., 5/20/23 | | | | | | | 2,765,000 | | | | 2,741,415 | |
| 5.299% Sr. Unsec. Nts., 1/27/251 | | | | | | | 1,850,000 | | | | 1,857,863 | |
| 5.999% Sr. Unsec. Nts., 1/27/281 | | | | | | | 4,007,000 | | | | 4,022,026 | |
| 6.125% Sr. Unsec. Nts., 1/17/22 | | | | | | | 920,000 | | | | 978,650 | |
| 6.85% Sr. Unsec. Nts., 6/5/15 | | | | | | | 2,130,000 | | | | 2,058,113 | |
| 7.375% Sr. Unsec. Nts., 1/17/27 | | | | | | | 1,615,000 | | | | 1,781,345 | |
| Petroleos Mexicanos: | | | | | | | | | | | | |
| 3.75% Sr. Unsec. Nts., 2/21/2412 | | | EUR | | | | 205,000 | | | | 267,290 | |
| 3.75% Sr. Unsec. Nts., 4/16/26 | | | EUR | | | | 1,445,000 | | | | 1,816,459 | |
| 4.625% Sr. Unsec. Nts., 9/21/23 | | | | | | | 2,680,000 | | | | 2,763,750 | |
| 6.50% Sr. Unsec. Nts., 3/13/271 | | | | | | | 805,000 | | | | 880,871 | |
| 6.75% Sr. Unsec. Nts., 9/21/471 | | | | | | | 1,950,000 | | | | 2,040,383 | |
| 6.875% Sr. Unsec. Nts., 8/4/26 | | | | | | | 795,000 | | | | 903,319 | |
| Phillips 66 Partners LP, 3.605% Sr. Unsec. Nts., 2/15/25 | | | | | | | 444,000 | | | | 447,907 | |
| Proven Glory Capital Ltd., 4.00% Sr. Unsec. Nts., 2/21/2712 | | | | | | | 290,000 | | | | 293,555 | |
| Puma International Financing SA, 5.125% Sr. Unsec. Nts., 10/6/241 | | | | | | | 445,000 | | | | 454,345 | |
| QEP Resources, Inc., 5.625% Sr. Unsec. Nts., 3/1/26 | | | | | | | 665,000 | | | | 676,638 | |
| Resolute Energy Corp., 8.50% Sr. Unsec. Nts., 5/1/20 | | | | | | | 2,435,000 | | | | 2,489,788 | |
| Sabine Pass Liquefaction LLC, 4.20% Sr. Sec. Nts., 3/15/28 | | | | | | | 465,000 | | | | 471,273 | |
18 OPPENHEIMER GLOBAL STRATEGIC INCOME FUND/VA
| | | | | | | | | | |
| | | | | Principal Amount | | | Value | |
Oil, Gas & Consumable Fuels (Continued) | | | | | |
| Saka Energi Indonesia PT, 4.45% Sr. Unsec. Nts., 5/5/241 | | | | | $ 700,000 | | | | $ 712,006 | |
Sanchez Energy Corp.: 6.125% Sr. Unsec. Nts., 1/15/23 | | | | | 1,600,000 | | | | 1,364,000 | |
| 7.75% Sr. Unsec. Nts., 6/15/21 | | | | | 405,000 | | | | 382,725 | |
| SemGroup Corp./Rose Rock Finance Corp., 5.625% Sr. Unsec. Nts., 11/15/23 | | | | | 545,000 | | | | 534,100 | |
| Shell International Finance BV, 4.00% Sr. | |
| Unsec. Nts., 5/10/46 | | | | | 320,000 | | | | 341,372 | |
| Southwestern Energy Co., 7.50% Sr. | |
| Unsec. Nts., 4/1/26 | | | | | 265,000 | | | | 281,894 | |
| SRC Energy, Inc., 6.25% Sr. Unsec. Nts., 12/1/251 | | | | | 885,000 | | | | 909,338 | |
| Summit Midstream Holdings LLC/Summit | |
| Midstream Finance Corp., 5.75% Sr. | |
| Unsec. Nts., 4/15/25 | | | | | 515,000 | | | | 521,896 | |
| Sunoco Logistics Partners Operations LP, 4.00% Sr. Unsec. Nts., 10/1/27 | | | | | 516,000 | | | | 506,826 | |
| Sunoco LP/Sunoco Finance Corp., 6.375% Sr. Unsec. Nts., 4/1/23 | | | | | 755,000 | | | | 797,469 | |
| SURA Asset Management SA, 4.375% Sr. Unsec. Nts., 4/11/271 | | | | | 735,000 | | | | 744,188 | |
| Tallgrass Energy Partners LP/Tallgrass | | | | | | | | | | |
| Energy Finance Corp.: | | | | | | | | | | |
| 5.50% Sr. Unsec. Nts., 9/15/241 | | | | | 690,000 | | | | 711,562 | |
| 5.50% Sr. Unsec. Nts., 1/15/281 | | | | | 1,075,000 | | | | 1,089,459 | |
| Targa Resources Partners LP/Targa Resources Partners Finance Corp., 5.00% Sr. Unsec. Nts., 1/15/281 | | | | | 800,000 | | | | 801,000 | |
| Topaz Marine SA, 9.125% Sr. Unsec. Nts., 7/26/221 | | | | | 365,000 | | | | 379,008 | |
| Ultra Resources, Inc.: | | | | | | | | | | |
| 6.875% Sr. Unsec. Nts., 4/15/221 | | | | | 390,000 | | | | 392,438 | |
| 7.125% Sr. Unsec. Nts., 4/15/251 | | | | | 520,000 | | | | 520,650 | |
| Ultrapar International SA, 5.25% Sr. | | | | | | | | | | |
| Unsec. Nts., 10/6/261 | | | | | 495,000 | | | | 506,494 | |
| Whiting Petroleum Corp., 6.625% Sr. Unsec. Nts., 1/15/261 | | | | | 535,000 | | | | 546,369 | |
| Williams Partners LP: | | | | | | | | | | |
| 3.75% Sr. Unsec. Nts., 6/15/27 | | | | | 364,000 | | | | 365,358 | |
| 5.25% Sr. Unsec. Nts., 3/15/20 | | | | | 398,000 | | | | 420,612 | |
| Woodside Finance Ltd., 8.75% Sr. Unsec. Nts., 3/1/191 | | | | | 8,000 | | | | 8,566 | |
| WPX Energy, Inc., 8.25% Sr. Unsec. Nts., 8/1/23 | | | | | 1,140,000 | | | | 1,299,600 | |
| YPF SA, 6.95% Sr. Unsec. Nts., 7/21/271 | | | | | 2,130,000 | | | | 2,265,359 | |
| | | | | | | | | 112,168,210 | |
| | | | | | | | | | |
Financials—7.8% | | | | | | | | | | |
Capital Markets—1.6% | | | | | | | | | | |
| Apollo Management Holdings LP, 4.00% Sr. Unsec. Nts., 5/30/241 | | | | | 541,000 | | | | 554,207 | |
| Blackstone Holdings Finance Co. LLC, 3.15% Sr. Unsec. Nts., 10/2/271 | | | | | 383,000 | | | | 376,970 | |
| Brookfield Asset Management, Inc., 4.00% Sr. Unsec. Nts., 1/15/25 | | | | | 923,000 | | | | 948,429 | |
| Charles Schwab Corp. (The), 5.00% [US0003M+257.5] Jr. Sub. Perpetual Bonds2,10 | | | | | 668,000 | | | | 671,373 | |
| Credit Suisse AG (New York), 3.625% Sr. Unsec. Nts., 9/9/24 | | | | | 512,000 | | | | 530,143 | |
| Credit Suisse Group AG, 7.125% [USSW5+510.8] Jr. Sub. Perpetual Bonds2,10 | | | | | 620,000 | | | | 679,365 | |
| Credit Suisse Group Funding Guernsey Ltd., 4.55% Sr. Unsec. Nts., 4/17/26 | | | | | 360,000 | | | | 386,016 | |
| Diamond Resorts International, Inc.: | | | | | | | | | | |
| 7.75% Sr. Sec. Nts., 9/1/231 | | | | | 1,085,000 | | | | 1,182,542 | |
| 10.75% Sr. Unsec. Nts., 9/1/241 | | | | | 665,000 | | | | 715,706 | |
| | | | | | | | | | |
| | | | | Principal Amount | | | Value | |
Capital Markets (Continued) | |
| E*TRADE Financial Corp., 5.875% [US0003M+443.5] Jr. Sub. Perpetual Bonds2,10 | | | | | $ 1,596,000 | | | | $ 1,695,750 | |
| Flex Acquisition Co., Inc., 6.875% Sr. Unsec. Nts., 1/15/251 | | | | | 1,530,000 | | | | 1,587,337 | |
| Goldman Sachs Group, Inc. (The): | | | | | | | | | | |
| 3.50% Sr. Unsec. Nts., 11/16/26 | | | | | 543,000 | | | | 546,602 | |
| 3.75% Sr. Unsec. Nts., 2/25/26 | | | | | 522,000 | | | | 536,397 | |
| 4.017% [US0003M+137.3] Sr. Unsec. Nts., 10/31/382 | | | | | 375,000 | | | | 386,145 | |
| 5.00% [US0003M+287.4] Jr. Sub. Perpetual Bonds2,10 | | | | | 340,000 | | | | 335,410 | |
| 5.70% [US0003M+388.4] Jr. Sub. Perpetual Bonds, Series L2,10 | | | | | 496,000 | | | | 512,046 | |
| Icahn Enterprises LP/Icahn Enterprises Finance Corp., 6.375% Sr. Unsec. Nts., 12/15/251 | | | | | 1,075,000 | | | | 1,077,795 | |
| Koks OAO Via Koks Finance DAC, 7.50% Sr. Unsec. Nts., 5/4/221 | | | | | 730,000 | | | | 776,169 | |
Macquarie Bank Ltd. (London), 6.125% [USSW5+370.3] Jr. Sub. Perpetual Bonds1,2,10 | | | | | 631,000 | | | | 657,029 | |
| Marble II Pte Ltd., 5.30% Sr. Sec. Nts., 6/20/221 | | | | | 340,000 | | | | 345,692 | |
| Morgan Stanley: | | | | | | | | | | |
| 4.375% Sr. Unsec. Nts., 1/22/47 | | | | | 667,000 | | | | 732,325 | |
| 5.00% Sub. Nts., 11/24/25 | | | | | 839,000 | | | | 919,355 | |
| MSCI, Inc., 4.75% Sr. Unsec. Nts., 8/1/261 | | | | | 881,000 | | | | 927,253 | |
Northern Trust Corp., 3.375% [US0003M+113.1] Sub. Nts., 5/8/322 | | | | | 400,000 | | | | 398,876 | |
| Prime Security Services Borrower LLC/Prime Finance, Inc., 9.25% Sec. Nts., 5/15/231 | | | | | 1,070,000 | | | | 1,190,375 | |
| Raymond James Financial, Inc., 3.625% Sr. Unsec. Nts., 9/15/26 | | | | | 543,000 | | | | 546,411 | |
| Rivers Pittsburgh Borrower LP/Rivers Pittsburgh Finance Corp., 6.125% Sr. Sec. Nts., 8/15/211 | | | | | 375,000 | | | | 373,125 | |
| S&P Global, Inc., 2.50% Sr. Unsec. Nts., 8/15/18 | | | | | 941,000 | | | | 943,859 | |
| Staples, Inc., 8.50% Sr. Unsec. Nts., 9/15/251 | | | | | 1,860,000 | | | | 1,725,150 | |
| TD Ameritrade Holding Corp., 3.30% Sr. Unsec. Nts., 4/1/27 | | | | | 562,000 | | | | 567,605 | |
Tempo Acquisition LLC/Tempo Acquisition Finance Corp., 6.75% Sr. Unsec. Nts., 6/1/251 | | | | | 805,000 | | | | 821,100 | |
| Trident Merger Sub, Inc., 6.625% Sr. Unsec. Nts., 11/1/251 | | | | | 805,000 | | | | 805,000 | |
| UBS Group AG, 7.125% [USSW5+588.3] Jr. Sub. Perpetual Bonds2,10 | | | | | 700,000 | | | | 763,540 | |
| UBS Group Funding Switzerland AG: | | | | | | | | | | |
| 4.125% Sr. Unsec. Nts., 4/15/261 | | | | | 347,000 | | | | 364,391 | |
| 4.253% Sr. Unsec. Nts., 3/23/281 | | | | | 377,000 | | | | 397,888 | |
| VFH Parent LLC/Orchestra Co.-Issuer, Inc., 6.75% Sec. Nts., 6/15/221 | | | | | 260,000 | | | | 274,300 | |
| | | | | | | | | 26,251,676 | |
| | | | | | | | | | |
Commercial Banks—2.9% | | | | | | | | | | |
ABN AMRO Bank NV, 4.40% [USSW5+219.7] Sub. Nts., 3/27/282 | | | | | 1,061,000 | | | | 1,093,759 | |
| ACE Cash Express, Inc., 12.00% Sr. Sec. Nts., 12/15/221 | | | | | 135,000 | | | | 140,062 | |
| Astana Finance JSC, 9.16% Sr. Unsec. Nts., 3/14/128,9 | | | | | 315,159 | | | | — | |
| Australia & New Zealand Banking Group Ltd. (New York), 2.625% Sr. Unsec. Nts., 5/19/22 | | | | | 929,000 | | | | 926,428 | |
19 OPPENHEIMER GLOBAL STRATEGIC INCOME FUND/VA
CONSOLIDATED STATEMENT OF INVESTMENTS Continued
| | | | | | | | | | | | |
| | | | | | Principal Amount | | | Value | |
Commercial Banks (Continued) | | | | | |
Australia & New Zealand Banking Group Ltd. (United Kingdom), 6.75% [USISDA05+516.8] Jr. Sub. Perpetual Bonds1,2,10 | | | | | | | $ 735,000 | | | | $ 837,900 | |
Banco Bilbao Vizcaya Argentaria SA: 6.125% [USSW5+387] Jr. Sub. Perpetual Bonds2,10 | | | | | | | 495,000 | | | | 511,706 | |
9.00% [USSW5+826.2] Jr. Sub. Perpetual Bonds2,10 | | | | | | | 495,000 | | | | 507,276 | |
Banco do Brasil SA (Cayman), 6.25% [H15T10Y+439.8] Jr. Sub. Perpetual Bonds1,2,10 | | | | | | | 820,000 | | | | 756,450 | |
| Banco Mercantil del Norte SA (Grand Cayman): | | | | | | | | | | | | |
6.875% [H15T5Y+503.5] Jr. Sub. Perpetual Bonds1,2,10 | | | | | | | 429,000 | | | | 453,131 | |
| 7.625% [H15T10Y+535.3] Jr. Sub. Perpetual Bonds1,2,10 | | | | | | | 395,000 | | | | 434,006 | |
Banco Santander SA, 6.375% [USSW5+478.8] Jr. Sub. Perpetual Bonds2,10 | | | | | | | 650,000 | | | | 666,278 | |
| Bank of America Corp.: | | | | | | | | | | | | |
| 3.248% Sr. Unsec. Nts., 10/21/27 | | | | | | | 723,000 | | | | 718,124 | |
| 3.824% [US0003M+157.5] Sr. Unsec. Nts., 1/20/282 | | | | | | | 497,000 | | | | 514,527 | |
| 6.30% [US0003M+455.3] Jr. Sub. Perpetual Bonds2,10 | | | | | | | 613,000 | | | | 694,222 | |
| 7.75% Jr. Sub. Nts., 5/14/38 | | | | | | | 623,000 | | | | 935,692 | |
Bank of Nova Scotia (The), 4.65% [US0003M+264.8] Jr. Sub. Perpetual Bonds2,10 | | | | | | | 680,000 | | | | 676,379 | |
| Barclays plc: | | | | | | | | | | | | |
| 4.375% Sr. Unsec. Nts., 1/12/26 | | | | | | | 880,000 | | | | 917,397 | |
| 7.875% [USSW5+677.2] Jr. Sub. Perpetual Bonds2,10 | | | | | | | 750,000 | | | | 824,063 | |
| BB&T Corp., 2.85% Sr. Unsec. Nts., 10/26/24 | | | | | | | 764,000 | | | | 758,953 | |
| BNP Paribas SA: | | | | | | | | | | | | |
| 4.625% Sub. Nts., 3/13/271 | | | | | | | 635,000 | | | | 678,493 | |
| 7.625% [USSW5+631.4] Jr. Sub. Perpetual Bonds1,2,10 | | | | | | | 755,000 | | | | 832,387 | |
| BPCE SA, 4.50% Sub. Nts., 3/15/251 | | | | | | | 630,000 | | | | 659,339 | |
| CIT Group, Inc., 5.80% | | | | | | | | | | | | |
[US0003M+397.2] Jr. Sub. Perpetual Bonds2,10 | | | | | | | 688,000 | | | | 710,360 | |
| Citigroup, Inc.: | | | | | | | | | | | | |
4.281% [US0003M+183.9] Sr. Unsec. Nts., 4/24/482 | | | | | | | 916,000 | | | | 997,828 | |
| 4.75% Sub. Nts., 5/18/46 | | | | | | | 440,000 | | | | 486,559 | |
6.125% [US0003M+447.8] Jr. Sub. Perpetual Bonds2,10 | | | | | | | 485,000 | | | | 516,525 | |
| Citizens Bank NA (Providence RI): | | | | | | | | | | | | |
| 2.55% Sr. Unsec. Nts., 5/13/21 | | | | | | | 529,000 | | | | 527,412 | |
| 2.65% Sr. Unsec. Nts., 5/26/22 | | | | | | | 224,000 | | | | 222,152 | |
Commonwealth Bank of Australia, 3.15% Sr. Unsec. Nts., 9/19/271 | | | | | | | 750,000 | | | | 740,139 | |
| Compass Bank, 2.875% Sr. Unsec. Nts., 6/29/22 | | | | | | | 945,000 | | | | 935,977 | |
Credit Agricole SA, 4.375% Sub. Nts., 3/17/251 | | | | | | | 1,066,000 | | | | 1,115,407 | |
Fifth Third Bancorp, 5.10% [US0003M+303.33] Jr. Sub. Perpetual Bonds2,10 | | | | | | | 250,000 | | | | 254,375 | |
Fifth Third Bank (Cincinnati OH), 3.85% Sub. Nts., 3/15/26 | | | | | | | 551,000 | | | | 569,273 | |
First Republic Bank, 4.375% Sub. Nts., 8/1/46 | | | | | | | 380,000 | | | | 389,721 | |
| Glencore Funding LLC, 4.00% Sr. Unsec. Nts., 4/16/251 | | | | | | | 523,000 | | | | 529,082 | |
| | | | | | | | | | | | |
| | | | | | Principal Amount | | | Value | |
Commercial Banks (Continued) | | | | | |
| Global Bank Corp., 4.50% Sr. Unsec. Nts., 10/20/211 | | | | | | | $ 605,000 | | | | $ 617,826 | |
| Globo Comunicacao e Participacoes SA, 5.125% Sr. Sec. Nts., 3/31/271 | | | | | | | 1,110,000 | | | | 1,132,200 | |
| HSBC Holdings plc: | | | | | | | | | | | | |
| 4.041% [US0003M+154.6] Sr. Unsec. Nts., 3/13/282 | | | | | | | 440,000 | | | | 458,940 | |
| 6.375% [USISDA05+370.5] Jr. Sub. Perpetual Bonds2,10 | | | | | | | 615,000 | | | | 656,512 | |
Huntington Bancshares, Inc., 3.15% Sr. Unsec. Nts., 3/14/21 | | | | | | | 528,000 | | | | 536,653 | |
| IDBI Bank Ltd. (DIFC Dubai), 5.00% Sr. Unsec. Nts., 9/25/19 | | | | | | | 430,000 | | | | 441,606 | |
| Intesa Sanpaolo SpA, 3.875% Sr. Unsec. Nts., 7/14/271 | | | | | | | 749,000 | | | | 749,913 | |
| JPMorgan Chase & Co.: | | | | | | | | | | | | |
| 3.54% [US0003M+138] Sr. Unsec. Nts., 5/1/282 | | | | | | | 735,000 | | | | 748,420 | |
| 3.782% [US0003M+133.7] Sr. Unsec. Nts., 2/1/282 | | | | | | | 1,458,000 | | | | 1,512,166 | |
6.125% [US0003M+333] Jr. Sub. Perpetual Bonds2,10 | | | | | | | 640,000 | | | | 701,600 | |
| 7.90% [US0003M+347] Jr. Sub. Perpetual Bonds, Series 12,10 | | | | | | | 492,000 | | | | 498,765 | |
| Kenan Advantage Group, Inc. (The), 7.875% Sr. Unsec. Nts., 7/31/231 | | | | | | | 1,125,000 | | | | 1,170,000 | |
| Krung Thai Bank PCL (Cayman Islands), 5.20% [H15T5Y+353.5] Sub. Nts., 12/26/242 | | | | | | | 540,000 | | | | 556,844 | |
| Lloyds Banking Group plc, 6.413% [US0003M+149.5] Jr. Sub. Perpetual Bonds1,2,10 | | | | | | | 566,000 | | | | 655,145 | |
| PNC Financial Services Group, Inc. (The), 3.15% Sr. Unsec. Nts., 5/19/27 | | | | | | | 835,000 | | | | 838,619 | |
Regions Bank (Birmingham AL), 2.25% Sr. Unsec. Nts., 9/14/18 | | | | | | | 477,000 | | | | 477,591 | |
Regions Financial Corp., 2.75% Sr. Unsec. Nts., 8/14/22 | | | | | | | 618,000 | | | | 616,638 | |
Royal Bank of Scotland Group plc, 3.498% [US0003M+148] Sr. Unsec. Nts., 5/15/232 | | | | | | | 660,000 | | | | 662,023 | |
| Sberbank of Russia Via SB Capital SA, 5.50% [H15T5Y+402.3] Sub. Nts., 2/26/241,2 | | | | | | | 1,580,000 | | | | 1,608,677 | |
| Societe Generale SA, 7.375% [USSW5+623.8] Jr. Sub. Perpetual Bonds1,2,10 | | | | | | | 795,000 | | | | 863,609 | |
| Standard Chartered plc, 7.50% [USSW5+630.1] Jr. Sub. Perpetual Bonds1,2,10 | | | | | | | 805,000 | | | | 873,425 | |
| SunTrust Bank (Atlanta GA), 3.30% Sub. Nts., 5/15/26 | | | | | | | 417,000 | | | | 413,632 | |
| SunTrust Banks, Inc.: | | | | | | | | | | | | |
| 5.05% [US0003M+310.2] Jr. Sub. Perpetual Bonds2,10 | | | | | | | 697,000 | | | | 707,455 | |
| 5.125% [US0003M+278.6] Jr. Sub. Perpetual Bonds2,10 | | | | | | | 104,000 | | | | 102,128 | |
| Synovus Financial Corp., 3.125% Sr. Unsec. Nts., 11/1/22 | | | | | | | 557,000 | | | | 553,073 | |
| Turkiye Garanti Bankasi AS, 6.125% [USSW5+422] Sub. Nts., 5/24/271,2 | | | | | | | 300,000 | | | | 300,171 | |
| Turkiye Is Bankasi, 6.00% Sub. Nts., 10/24/221 | | | | | | | 540,000 | | | | 543,328 | |
Turkiye Vakiflar Bankasi TAO: 5.625% Sr. Unsec. Nts., 5/30/221 | | | | | | | 970,000 | | | | 969,446 | |
| 6.875% [USSW5+543.9] Sub. Nts., 2/3/251,2 | | | | | | | 525,000 | | | | 531,576 | |
| UniCredit SpA, 8.00% [USSW5+518] Jr. | | | | | | | | | | | | |
| Sub. Perpetual Bonds2,10 | | | | | | | 630,000 | | | | 691,406 | |
20 OPPENHEIMER GLOBAL STRATEGIC INCOME FUND/VA
| | | | | | | | | | |
| | | | | Principal Amount | | | Value | |
Commercial Banks (Continued) | | | | | |
| US Bancorp: | | | | | | | | | | |
| 3.10% Sub. Nts., 4/27/26 | | | | | $ 548,000 | | | | $ 544,588 | |
| 3.15% Sr. Unsec. Nts., 4/27/27 | | | | | 225,000 | | | | 225,617 | |
| Wachovia Capital Trust III, 5.57% | | | | | | | | | | |
| [US0003M+93] Jr. Sub. Perpetual Bonds2,10 | | | �� | | 992,000 | | | | 1,000,680 | |
| Wells Fargo & Co.: | | | | | | | | | | |
| 3.584% [US0003M+131] Sr. Unsec. Nts., 5/22/282 | | | | | 754,000 | | | | 769,362 | |
| 4.75% Sub. Nts., 12/7/46 | | | | | 532,000 | | | | 595,504 | |
| Westpac Banking Corp. (New Zealand), 5.00% [USISDA05+288.8] Jr. Sub. Perpetual Bonds2,10 | | | | | 680,000 | | | | 678,748 | |
| Yapi ve Kredi Bankasi AS, 5.85% Sr. Unsec. Nts., 6/21/241 | | | | | 770,000 | | | | 771,456 | |
| Zenith Bank plc, 7.375% Sr. Unsec. Nts., 5/30/221 | | | | | 675,000 | | | | 704,160 | |
| | | | | | | | | 49,010,884 | |
| | | | | | | | | | | |
| Consumer Finance—0.9% | | | | | | | | | | |
| Ahern Rentals, Inc., 7.375% Sec. Nts., 5/15/231 | | | | | 910,000 | | | | 859,950 | |
| Ally Financial, Inc.: | | | | | | | | | | |
| 4.625% Sr. Unsec. Nts., 5/19/22 | | | | | 440,000 | | | | 458,700 | |
| 5.75% Sub. Nts., 11/20/25 | | | | | 1,325,000 | | | | 1,449,219 | |
| 8.00% Sr. Unsec. Nts., 11/1/31 | | | | | 415,000 | | | | 541,575 | |
| American Express Co.: | | | | | | | | | | |
| 2.50% Sr. Unsec. Nts., 8/1/22 | | | | | 371,000 | | | | 366,867 | |
| 4.90% [US0003M+328.5] Jr. Sub. Perpetual Bonds2,10 | | | | | 758,000 | | | | 774,107 | |
| American Express Credit Corp., 3.30% Sr. Unsec. Nts., 5/3/27 | | | | | 562,000 | | | | 570,815 | |
| Capital One Financial Corp., 3.75% Sr. Unsec. Nts., 3/9/27 | | | | | 371,000 | | | | 375,572 | |
| Discover Financial Services: | | | | | | | | | | |
| 3.75% Sr. Unsec. Nts., 3/4/25 | | | | | 371,000 | | | | 373,931 | |
| 4.10% Sr. Unsec. Nts., 2/9/27 | | | | | 374,000 | | | | 383,704 | |
| 5.50% [US0003M+307.6] Jr. Sub. Perpetual Bonds2,10 | | | | | 335,000 | | | | 345,469 | |
| Electricite de France SA, 6.50% Sr. Unsec. Nts., 1/26/191 | | | | | 665,000 | | | | 695,668 | |
| Financiera Independencia SAB de CV | | | | | | | | |
| SOFOM ENR, 8.00% Sr. Unsec. Nts., 7/19/241 | | | | | 365,000 | | | | 373,212 | |
| Minejesa Capital BV, 4.625% Sr. Sec. Nts., 8/10/301 | | | | | 2,635,000 | | | | 2,699,702 | |
| Navient Corp.: | | | | | | | | | | |
| 6.50% Sr. Unsec. Nts., 6/15/22 | | | | | 535,000 | | | | 561,884 | |
| 6.625% Sr. Unsec. Nts., 7/26/21 | | | | | 505,000 | | | | 534,038 | |
| 6.75% Sr. Unsec. Nts., 6/25/25 | | | | | 685,000 | | | | 705,550 | |
Springleaf Finance Corp.: 5.625% Sr. Unsec. Nts., 3/15/23 | | | | | 805,000 | | | | 807,777 | |
| 6.125% Sr. Unsec. Nts., 5/15/22 | | | | | 785,000 | | | | 818,363 | |
| 8.25% Sr. Unsec. Nts., 12/15/20 | | | | | 490,000 | | | | 540,225 | |
| | | | | | | | | 14,236,328 | |
| | | | | | | | | | | |
| Diversified Financial Services—0.3% | |
| Berkshire Hathaway Energy Co., 2.00% Sr. Unsec. Nts., 11/15/18 | | | | | 267,000 | | | | 267,259 | |
| Charming Light Investments Ltd., 4.375% Sr. Unsec. Nts., 12/21/2712 | | | | | 390,000 | | | | 393,064 | |
| JPMorgan Hipotecaria su Casita, 6.47% Sec. Nts., 8/26/353,9,13 | | MXN | | | 5,808,600 | | | | 28,803 | |
| National Savings Bank, 8.875% Sr. Unsec. Nts., 9/18/181 | | | | | 1,000,000 | | | | 1,034,500 | |
| Park Aerospace Holdings Ltd., 5.50% Sr. Unsec. Nts., 2/15/241 | | | | | 1,020,000 | | | | 1,014,900 | |
| Peachtree Corners Funding Trust, 3.976% Sr. Unsec. Nts., 2/15/251 | | | | | 363,000 | | | | 374,255 | |
| | | | | | | | | | |
| | | | | Principal Amount | | | Value | |
Diversified Financial Services (Continued) | |
| Precision Castparts Corp., 2.50% Sr. Unsec. Nts., 1/15/23 | | | | | $ 549,000 | | | | $ 545,831 | |
| Voya Financial, Inc., 5.65% | | | | | | | | | | |
| [US0003M+358] Jr. Sub. Nts., 5/15/532 | | | | | 875,000 | | | | 934,063 | |
| | | | | | | | | 4,592,675 | |
| | | | | | | | | | | |
Insurance—0.3% | | | | | | | | | | |
| AXIS Specialty Finance plc, 5.15% Sr. Unsec. Nts., 4/1/45 | | | | | 464,000 | | | | 499,319 | |
| Brighthouse Financial, Inc., 3.70% Sr. Unsec. Nts., 6/22/271 | | | | | 239,000 | | | | 235,445 | |
CNA Financial Corp., 3.45% Sr. Unsec. Nts., 8/15/27 | | | | | 663,000 | | | | 654,489 | |
| Credivalores-Crediservicios SAS, 9.75% Sr. Unsec. Nts., 7/27/221 | | | | | 370,000 | | | | 385,725 | |
| Genworth Holdings, Inc., 7.70% Sr. Unsec. Nts., 6/15/20 | | | | | 535,000 | | | | 541,019 | |
| Manulife Financial Corp., 4.061% [USISDA05+164.7] Sub. Nts., 2/24/322 | | | | | 565,000 | | | | 570,184 | |
| Marsh & McLennan Cos., Inc., 4.35% Sr. Unsec. Nts., 1/30/47 | | | | | 294,000 | | | | 326,731 | |
| MetLife, Inc., 5.25% [US0003M+357.5] Jr. Sub. Perpetual Bonds2,10 | | | | | 936,000 | | | | 975,537 | |
| Nuveen Finance LLC, 4.125% Sr. Unsec. Nts., 11/1/241 | | | | | 695,000 | | | | 734,405 | |
| Prudential Financial, Inc.: | | | | | | | | | | |
| 5.20% [US0003M+304] Jr. Sub. Nts., 3/15/442 | | | | | 712,000 | | | | 759,170 | |
| 5.375% [US0003M+303.1] Jr. Sub. Nts., 5/15/452 | | | | | 172,000 | | | | 184,728 | |
| | | | | | | | | 5,866,752 | |
| | | | | | | | | | | |
Real Estate Investment Trusts (REITs)—1.3% | | | | | |
| American Tower Corp.: | | | | | | | | | | |
| 2.80% Sr. Unsec. Nts., 6/1/20 | | | | | 817,000 | | | | 822,501 | |
| 3.00% Sr. Unsec. Nts., 6/15/23 | | | | | 782,000 | | | | 780,807 | |
| Banco Invex SA/Hipotecaria Credito y Casa SA de CV, 6.45% Sec. Nts., 3/13/348,9,13 | | MXN | | | 4,830,531 | | | | — | |
| Crown Castle International Corp., 3.65% Sr. Unsec. Nts., 9/1/27 | | | | | 455,000 | | | | 454,669 | |
| Digital Realty Trust LP: | | | | | | | | | | |
| 3.40% Sr. Unsec. Nts., 10/1/20 | | | | | 79,000 | | | | 80,606 | |
| 5.875% Sr. Unsec. Nts., 2/1/20 | | | | | 327,000 | | | | 346,958 | |
Equinix, Inc.: 5.375% Sr. Unsec. Nts., 5/15/27 | | | | | 780,000 | | | | 836,550 | |
| 5.875% Sr. Unsec. Nts., 1/15/26 | | | | | 945,000 | | | | 1,017,056 | |
| FelCor Lodging LP, 6.00% Sr. Unsec. Nts., 6/1/25 | | | | | 635,000 | | | | 673,100 | |
| GLP Capital LP/GLP Financing II, Inc., 5.375% Sr. Unsec. Nts., 11/1/23 | | | | | 810,000 | | | | 867,712 | |
| HCP, Inc., 2.625% Sr. Unsec. Nts., 2/1/20 | | | | | 907,000 | | | | 910,613 | |
| Iron Mountain US Holdings, Inc., 5.375% Sr. Unsec. Nts., 6/1/261 | | | | | 995,000 | | | | 1,027,338 | |
| Iron Mountain, Inc.: | | | | | | | | | | |
| 4.875% Sr. Unsec. Nts., 9/15/271 | | | | | 795,000 | | | | 798,975 | |
| 5.25% Sr. Unsec. Nts., 3/15/281 | | | | | 535,000 | | | | 535,000 | |
| iStar, Inc.: | | | | | | | | | | |
| 5.00% Sr. Unsec. Nts., 7/1/19 | | | | | 405,000 | | | | 407,278 | |
| 5.25% Sr. Unsec. Nts., 9/15/22 | | | | | 800,000 | | | | 807,000 | |
| 6.00% Sr. Unsec. Nts., 4/1/22 | | | | | 1,325,000 | | | | 1,374,687 | |
| Lamar Media Corp., 5.75% Sr. Unsec. Nts., 2/1/26 | | | | | 1,465,000 | | | | 1,569,381 | |
| MPT Operating Partnership LP/MPT Finance Corp.: | | | | | | | | | | |
| 5.00% Sr. Unsec. Nts., 10/15/27 | | | | | 795,000 | | | | 811,894 | |
| 6.375% Sr. Unsec. Nts., 3/1/24 | | | | | 740,000 | | | | 786,250 | |
| Outfront Media Capital LLC/Outfront | | | | | | | | | | |
| Media Capital Corp., 5.875% Sr. Unsec. Nts., 3/15/25 | | | | | 1,090,000 | | | | 1,156,762 | |
21 OPPENHEIMER GLOBAL STRATEGIC INCOME FUND/VA
CONSOLIDATED STATEMENT OF INVESTMENTS Continued
| | | | | | | | | | | | |
| | | | | | Principal Amount | | | Value | |
Real Estate Investment Trusts (REITs) (Continued) | | | | | |
SBA Communications Corp., 4.00% Sr. Unsec. Nts., 10/1/221 | | | | | | | $ 800,000 | | | | $ 805,000 | |
| Starwood Property Trust, Inc.: | | | | | | | | | | | | |
| 4.75% Sr. Unsec. Nts., 3/15/251 | | | | | | | 805,000 | | | | 800,975 | |
| 5.00% Sr. Unsec. Nts., 12/15/21 | | | | | | | 760,000 | | | | 790,400 | |
| Trust F/1401, 5.25% Sr. Unsec. Nts., 1/30/261 | | | | | | | 1,245,000 | | | | 1,316,588 | |
| Uniti Group LP/Uniti Fiber Holdings, Inc./ CSL Capital LLC, 7.125% Sr. Unsec. Nts., 12/15/241 | | | | | | | 530,000 | | | | 484,950 | |
| Uniti Group LP/Uniti Group Finance, Inc./ CSL Capital LLC, 8.25% Sr. Unsec. Nts., 10/15/23 | | | | | | | 1,055,000 | | | | 1,020,712 | |
| Ventas Realty LP/Ventas Capital Corp., 2.00% Sr. Unsec. Nts., 2/15/18 | | | | | | | 269,000 | | | | 268,993 | |
| VEREIT Operating Partnership LP, 3.00% Sr. Unsec. Nts., 2/6/19 | | | | | | | 346,000 | | | | 347,732 | |
| Welltower, Inc., 2.25% Sr. Unsec. Nts., 3/15/18 | | | | | | | 130,000 | | | | 130,057 | |
| | | | | | | | | | | 22,030,544 | |
| | | | | | | | | | | | | |
Real Estate Management & Development—0.3% | | | | | |
| Cleaver-Brooks, Inc., 7.875% Sr. Sec. Nts., 3/1/231 | | | | | | | 400,000 | | | | 411,000 | |
| Greystar Real Estate Partners LLC, 5.75% Sr. Sec. Nts., 12/1/251 | | | | | | | 1,075,000 | | | | 1,109,937 | |
| Mattamy Group Corp., 6.875% Sr. Unsec. Nts., 12/15/231 | | | | | | | 505,000 | | | | 536,563 | |
| Realogy Group LLC/Realogy Co.-Issuer Corp., 4.875% Sr. Unsec. Nts., 6/1/231 | | | | | | | 1,240,000 | | | | 1,230,700 | |
| Shea Homes LP/Shea Homes Funding Corp., 6.125% Sr. Unsec. Nts., 4/1/251 | | | | | | | 1,065,000 | | | | 1,112,925 | |
| | | | | | | | | | | 4,401,125 | |
| | | | | | | | | | | | | |
Thrifts & Mortgage Finance—0.2% | | | | | |
| Nationwide Building Society, 4.125% [USISDA05+184.9] Sub. Nts., 10/18/322 | | | | | | | 557,000 | | | | 558,139 | |
| Provident Funding Associates LP/PFG Finance Corp., 6.375% Sr. Unsec. Nts., 6/15/251 | | | | | | | 395,000 | | | | 415,737 | |
| Quicken Loans, Inc.: | | | | | | | | | | | | |
| 5.25% Sr. Unsec. Nts., 1/15/281 | | | | | | | 1,075,000 | | | | 1,063,928 | |
| 5.75% Sr. Unsec. Nts., 5/1/251 | | | | | | | 1,420,000 | | | | 1,476,814 | |
| Radian Group, Inc., 4.50% Sr. Unsec. Nts., 10/1/24 | | | | | | | 665,000 | | | | 682,955 | |
| | | | | | | | | | | 4,197,573 | |
| | | | | | | | | | | | | |
Health Care—3.5% | | | | | | | | | | | | |
Biotechnology—0.2% | | | | | | | | | | | | |
| AbbVie, Inc.: | | | | | | | | | | | | |
| 3.60% Sr. Unsec. Nts., 5/14/25 | | | | | | | 546,000 | | | | 562,078 | |
| 4.70% Sr. Unsec. Nts., 5/14/45 | | | | | | | 168,000 | | | | 187,943 | |
| Biogen, Inc., 5.20% Sr. Unsec. Nts., 9/15/45 | | | | | | | 212,000 | | | | 252,423 | |
| Celgene Corp.: | | | | | | | | | | | | |
| 3.875% Sr. Unsec. Nts., 8/15/25 | | | | | | | 527,000 | | | | 546,235 | |
| 5.00% Sr. Unsec. Nts., 8/15/45 | | | | | | | 104,000 | | | | 118,355 | |
| Gilead Sciences, Inc., 4.75% Sr. Unsec. Nts., 3/1/46 | | | | | | | 343,000 | | | | 397,370 | |
| Shire Acquisitions Investments Ireland DAC: | | | | | | | | | | | | |
| 1.90% Sr. Unsec. Nts., 9/23/19 | | | | | | | 964,000 | | | | 955,571 | |
| 3.20% Sr. Unsec. Nts., 9/23/26 | | | | | | | 748,000 | | | | 732,535 | |
| | | | | | | | | | | 3,752,510 | |
| | | | | | | | | | | | | |
Health Care Equipment & Supplies—0.4% | | | | | |
| Abbott Laboratories: | | | | | | | | | | | | |
| 2.35% Sr. Unsec. Nts., 11/22/19 | | | | | | | 927,000 | | | | 927,522 | |
| 3.75% Sr. Unsec. Nts., 11/30/26 | | | | | | | 785,000 | | | | 807,357 | |
| Becton Dickinson & Co.: | | | | | | | | | | | | |
| 2.404% Sr. Unsec. Nts., 6/5/20 | | | | | | | 585,000 | | | | 582,130 | |
| | | | | | | | | | |
| | | | | Principal Amount | | | Value | |
Health Care Equipment & Supplies (Continued) | | | | | |
Becton Dickinson & Co.: (Continued) | | | | | |
| 3.70% Sr. Unsec. Nts., 6/6/27 | | | | | $ 692,000 | | | | $ 698,486 | |
| Boston Scientific Corp., 3.85% Sr. Unsec. Nts., 5/15/25 | | | | | 720,000 | | | | 741,225 | |
| DJO Finco, Inc./DJO Finance LLC/ DJO Finance Corp., 8.125% Sec. Nts., 6/15/211 | | | | | 480,000 | | | | 451,200 | |
| Hill-Rom Holdings, Inc., 5.75% Sr. Unsec. Nts., 9/1/231 | | | | | 680,000 | | | | 714,850 | |
| Hologic, Inc., 4.375% Sr. Unsec. Nts., 10/15/251 | | | | | 180,000 | | | | 183,150 | |
| Medtronic, Inc., 4.625% Sr. Unsec. Nts., 3/15/45 | | | | | 377,000 | | | | 439,902 | |
| Teleflex, Inc., 4.625% Sr. Unsec. Nts., 11/15/27 | | | | | 535,000 | | | | 541,580 | |
| | | | | | | | | 6,087,402 | |
| | | | | | | | | | | |
Health Care Providers & Services—1.7% | | | | | |
| Acadia Healthcare Co., Inc.: | | | | | | | | | | |
| 5.625% Sr. Unsec. Nts., 2/15/23 | | | | | 830,000 | | | | 846,600 | |
| 6.50% Sr. Unsec. Nts., 3/1/24 | | | | | 250,000 | | | | 261,250 | |
| Anthem, Inc., 2.50% Sr. Unsec. Nts., 11/21/20 | | | | | 917,000 | | | | 915,649 | |
| Centene Corp.: | | | | | | | | | | |
| 4.75% Sr. Unsec. Nts., 5/15/22 | | | | | 2,110,000 | | | | 2,199,675 | |
| 6.125% Sr. Unsec. Nts., 2/15/24 | | | | | 245,000 | | | | 259,700 | |
| CHS/Community Health Systems, Inc.: | | | | | | | | | | |
| 6.25% Sr. Sec. Nts., 3/31/23 | | | | | 2,265,000 | | | | 2,049,825 | |
| 6.875% Sr. Unsec. Nts., 2/1/22 | | | | | 765,000 | | | | 443,700 | |
| 7.125% Sr. Unsec. Nts., 7/15/20 | | | | | 345,000 | | | | 259,612 | |
| 8.00% Sr. Unsec. Nts., 11/15/19 | | | | | 1,000,000 | | | | 852,500 | |
| Cigna Corp., 5.125% Sr. Unsec. Nts., 6/15/20 | | | | | 794,000 | | | | 842,795 | |
| DaVita, Inc.: | | | | | | | | | | |
| 5.00% Sr. Unsec. Nts., 5/1/25 | | | | | 275,000 | | | | 275,605 | |
| 5.125% Sr. Unsec. Nts., 7/15/24 | | | | | 1,435,000 | | | | 1,452,041 | |
| Fresenius Medical Care US Finance II, Inc., 5.875% Sr. Unsec. Nts., 1/31/221 | | | | | 1,163,000 | | | | 1,281,445 | |
| HCA, Inc.: | | | | | | | | | | |
| 5.375% Sr. Unsec. Nts., 2/1/25 | | | | | 700,000 | | | | 726,250 | |
| 5.50% Sr. Sec. Nts., 6/15/47 | | | | | 1,315,000 | | | | 1,315,000 | |
| 7.50% Sr. Unsec. Nts., 2/15/22 | | | | | 2,405,000 | | | | 2,711,638 | |
| HealthSouth Corp., 5.75% Sr. Unsec. Nts., 11/1/24 | | | | | 1,700,000 | | | | 1,746,750 | |
| Humana, Inc., 2.50% Sr. Unsec. Nts., 12/15/20 | | | | | 238,000 | | | | 237,967 | |
| Kindred Healthcare, Inc., 6.375% Sr. Unsec. Nts., 4/15/22 | | | | | 540,000 | | | | 550,800 | |
| Laboratory Corp. of America Holdings: | | | | | | | | | | |
| 2.625% Sr. Unsec. Nts., 2/1/20 | | | | | 908,000 | | | | 910,799 | |
| 3.60% Sr. Unsec. Nts., 2/1/25 | | | | | 557,000 | | | | 566,491 | |
| LifePoint Health, Inc., 5.375% Sr. Unsec. Nts., 5/1/24 | | | | | 260,000 | | | | 259,025 | |
| OCP SA, 4.50% Sr. Unsec. Nts., 10/22/251 | | | | | 1,160,000 | | | | 1,163,821 | |
| Select Medical Corp., 6.375% Sr. Unsec. Nts., 6/1/21 | | | | | 900,000 | | | | 927,000 | |
| Tenet Healthcare Corp.: | | | | | | | | | | |
| 4.375% Sr. Sec. Nts., 10/1/21 | | | | | 520,000 | | | | 521,300 | |
| 6.75% Sr. Unsec. Nts., 6/15/23 | | | | | 1,685,000 | | | | 1,640,769 | |
| 7.50% Sec. Nts., 1/1/221 | | | | | 505,000 | | | | 532,144 | |
| 8.125% Sr. Unsec. Nts., 4/1/22 | | | | | 1,040,000 | | | | 1,062,100 | |
| UnitedHealth Group, Inc., 2.75% Sr. Unsec. Nts., 2/15/23 | | | | | 735,000 | | | | 736,854 | |
| Universal Hospital Services, Inc., 7.625% Sec. Nts., 8/15/20 | | | | | 755,000 | | | | 758,775 | |
| | | | | | | | | 28,307,880 | |
22 OPPENHEIMER GLOBAL STRATEGIC INCOME FUND/VA
| | | | | | | | | | |
| | | | | Principal Amount | | | Value | |
Health Care Technology—0.0% | | | | | | | | | | |
| Telenet Finance Luxembourg Notes Sarl, 1st Lien Nts., 5.50% Sr. Sec. Nts., 3/1/281 | | | | $ | 805,000 | | | $ | 801,855 | |
Life Sciences Tools & Services—0.2% | | | | | |
| Life Technologies Corp., 6.00% Sr. Unsec. Nts., 3/1/20 | | | | | 673,000 | | | | 720,628 | |
| Quintiles IMS, Inc.: | | | | | | | | | | |
| 4.875% Sr. Unsec. Nts., 5/15/231 | | | | | 732,000 | | | | 757,620 | |
| 5.00% Sr. Unsec. Nts., 10/15/261 | | | | | 861,000 | | | | 885,754 | |
| Thermo Fisher Scientific, Inc.: | | | | | | | | | | |
| 3.20% Sr. Unsec. Nts., 8/15/27 | | | | | 455,000 | | | | 451,762 | |
| 4.15% Sr. Unsec. Nts., 2/1/24 | | | | | 328,000 | | | | 348,312 | |
| West Street Merger Sub, Inc., 6.375% Sr. Unsec. Nts., 9/1/251 | | | | | 415,000 | | | | 418,112 | |
| | | | | | | | | 3,582,188 | |
| | | | | | | | | | | |
Pharmaceuticals—1.0% | | | | | | | | | | |
| Allergan Funding SCS: | | | | | | | | | | |
| 3.00% Sr. Unsec. Nts., 3/12/20 | | | | | 907,000 | | | | 915,575 | |
| 3.80% Sr. Unsec. Nts., 3/15/25 | | | | | 643,000 | | | | 655,453 | |
| Concordia International Corp., 7.00% Sr. Unsec. Nts., 4/15/231 | | | | | 585,000 | | | | 55,575 | |
| Endo Dac/Endo Finance LLC/Endo Finco, Inc.: | | | | | | | | | | |
| 6.00% Sr. Unsec. Nts., 7/15/231 | | | | | 1,255,000 | | | | 991,450 | |
| 6.00% Sr. Unsec. Nts., 2/1/251 | | | | | 210,000 | | | | 163,800 | |
| Endo Finance LLC/Endo Finco, Inc., 5.375% Sr. Unsec. Nts., 1/15/231 | | | | | 1,555,000 | | | | 1,220,675 | |
| Mallinckrodt International Finance | | | | | | | | | | |
| SA/Mallinckrodt CB LLC: | | | | | | | | | | |
| 4.875% Sr. Unsec. Nts., 4/15/201 | | | | | 520,000 | | | | 501,800 | |
| 5.50% Sr. Unsec. Nts., 4/15/251 | | | | | 1,320,000 | | | | 1,082,400 | |
| 5.75% Sr. Unsec. Nts., 8/1/221 | | | | | 930,000 | | | | 848,625 | |
| Prestige Brands, Inc., 6.375% Sr. Unsec. Nts., 3/1/241 | | | | | 370,000 | | | | 385,262 | |
| Valeant Pharmaceuticals International, | | | | | | | | | | |
| Inc.: | | | | | | | | | | |
| 5.375% Sr. Unsec. Nts., 3/15/201 | | | | | 149,000 | | | | 149,931 | |
| 5.50% Sr. Unsec. Nts., 3/1/231 | | | | | 355,000 | | | | 326,600 | |
| 5.50% Sr. Sec. Nts., 11/1/251 | | | | | 935,000 | | | | 956,037 | |
| 5.875% Sr. Unsec. Nts., 5/15/231 | | | | | 1,845,000 | | | | 1,713,544 | |
| 6.125% Sr. Unsec. Nts., 4/15/251 | | | | | 1,535,000 | | | | 1,410,281 | |
| 6.75% Sr. Unsec. Nts., 8/15/211 | | | | | 1,115,000 | | | | 1,127,544 | |
| 7.00% Sr. Sec. Nts., 3/15/241 | | | | | 780,000 | | | | 836,550 | |
| 7.25% Sr. Unsec. Nts., 7/15/221 | | | | | 1,150,000 | | | | 1,167,250 | |
| 7.50% Sr. Unsec. Nts., 7/15/211 | | | | | 935,000 | | | | 954,869 | |
| 9.00% Sr. Unsec. Nts., 12/15/251 | | | | | 670,000 | | | | 699,949 | |
| Zoetis, Inc., 3.00% Sr. Unsec. Nts., 9/12/27 | | | | | 224,000 | | | | 219,200 | |
| | | | | | | | | 16,382,370 | |
| | | | | | | | | | | |
Industrials—4.5% | | | | | | | | | | |
Aerospace & Defense—0.8% | | | | | | | | | | |
| Arconic, Inc., 5.125% Sr. Unsec. Nts., 10/1/24 | | | | | 535,000 | | | | 572,695 | |
| BAE Systems Holdings, Inc., 3.85% Sr. Unsec. Nts., 12/15/251 | | | | | 705,000 | | | | 732,162 | |
| Bombardier, Inc.: | | | | | | | | | | |
| 7.50% Sr. Unsec. Nts., 12/1/241 | | | | | 805,000 | | | | 819,088 | |
| 7.50% Sr. Unsec. Nts., 3/15/251 | | | | | 805,000 | | | | 815,062 | |
| 8.75% Sr. Unsec. Nts., 12/1/211 | | | | | 1,750,000 | | | | 1,933,750 | |
| DAE Funding LLC: | | | | | | | | | | |
| 4.50% Sr. Unsec. Nts., 8/1/221 | | | | | 265,000 | | | | 261,025 | |
| 5.00% Sr. Unsec. Nts., 8/1/241 | | | | | 265,000 | | | | 262,350 | |
| Embraer Netherlands Finance BV, 5.40% Sr. Unsec. Nts., 2/1/27 | | | | | 1,065,000 | | | | 1,151,531 | |
| Hexcel Corp., 3.95% Sr. Unsec. Nts., 2/15/27 | | | | | 350,000 | | | | 357,376 | |
| | | | | | | | | | |
| | | | | Principal Amount | | | Value | |
Aerospace & Defense (Continued) | | | | | |
| Huntington Ingalls Industries, Inc., 3.483% Sr. Unsec. Nts., 12/1/271 | | | | $ | 350,000 | | | $ | 349,562 | |
| Kratos Defense & Security Solutions, Inc., 6.50% Sr. Sec. Nts., 11/30/251 | | | | | 400,000 | | | | 416,500 | |
| Northrop Grumman Corp., 4.75% Sr. Unsec. Nts., 6/1/43 | | | | | 495,000 | | | | 573,420 | |
| Rolls-Royce plc, 2.375% Sr. Unsec. Nts., 10/14/201 | | | | | 242,000 | | | | 240,554 | |
| Textron, Inc.: | | | | | | | | | | |
| 3.65% Sr. Unsec. Nts., 3/15/27 | | | | | 233,000 | | | | 237,181 | |
| 4.30% Sr. Unsec. Nts., 3/1/24 | | | | | 293,000 | | | | 310,194 | |
| TransDigm, Inc.: | | | | | | | | | | |
| 6.375% Sr. Sub. Nts., 6/15/26 | | | | | 1,345,000 | | | | 1,366,856 | |
| 6.50% Sr. Sub. Nts., 7/15/24 | | | | | 535,000 | | | | 549,713 | |
| Triumph Group, Inc.: | | | | | | | | | | |
| 5.25% Sr. Unsec. Nts., 6/1/22 | | | | | 1,355,000 | | | | 1,334,675 | |
| 7.75% Sr. Unsec. Nts., 8/15/251 | | | | | 1,330,000 | | | | 1,414,788 | |
| United Technologies Corp., 1.778% Jr. Sub. Nts., 5/4/187 | | | | | 170,000 | | | | 169,754 | |
| | | | | | | | | 13,868,236 | |
| | | | | | | | | | | |
Air Freight & Couriers—0.1% | | | | | | | | | | |
| CEVA Group plc, 7.00% Sr. Sec. Nts., 3/1/211 | | | | | 775,000 | | | | 755,625 | |
| FedEx Corp., 4.40% Sr. Unsec. Nts., 1/15/47 | | | | | 175,000 | | | | 187,333 | |
| XPO Logistics, Inc., 6.125% Sr. Unsec. Nts., 9/1/231 | | | | | 370,000 | | | | 392,662 | |
| | | | | | | | | 1,335,620 | |
| | | | | | | | | | | |
Airlines—0.2% | | | | | | | | | | |
| American Airlines Group, Inc., 4.625% Sr. Unsec. Nts., 3/1/201 | | | | | 830,000 | | | | 843,487 | |
| Azul Investments LLP, 5.875% Sr. Unsec. Nts., 10/26/241 | | | | | 575,000 | | | | 572,844 | |
| Latam Finance Ltd., 6.875% Sr. Unsec. Nts., 4/11/241 | | | | | 370,000 | | | | 386,650 | |
| United Continental Holdings, Inc., 4.25% Sr. Unsec. Nts., 10/1/22 | | | | | 800,000 | | | | 803,000 | |
| | | | | | | | | 2,605,981 | |
| | | | | | | | | | | |
Building Products—0.2% | | | | | | | | | | |
| Allegion US Holding Co., Inc., 3.55% Sec. Nts., 10/1/27 | | | | | 664,000 | | | | 658,230 | |
| Jeld-Wen, Inc.: | | | | | | | | | | |
| 4.625% Sr. Unsec. Nts., 12/15/251 | | | | | 120,000 | | | | 121,200 | |
| 4.875% Sr. Unsec. Nts., 12/15/271 | | | | | 120,000 | | | | 121,500 | |
| Owens Corning, 3.40% Sr. Unsec. Nts., 8/15/26 | | | | | 631,000 | | | | 620,327 | |
| Standard Industries, Inc., 5.375% Sr. Unsec. Nts., 11/15/241 | | | | | 1,535,000 | | | | 1,612,210 | |
| USG Corp., 4.875% Sr. Unsec. Nts., 6/1/271 | | | | | 450,000 | | | | 467,573 | |
| | | | | | | | | 3,601,040 | |
| | | | | | | | | | | |
Commercial Services & Supplies—0.8% | | | | | |
| ACCO Brands Corp., 5.25% Sr. Unsec. Nts., 12/15/241 | | | | | 490,000 | | | | 504,700 | |
| Affinion Group, Inc., 12.50% Sr. Unsec. Nts., 11/10/223,14 | | | | | 2,312,752 | | | | 2,081,477 | |
| ARD Finance SA, 7.875% Sr. Sec. Nts., 9/15/2314 | | | | | 920,000 | | | | 963,700 | |
| Brink’s Co. (The), 4.625% Sr. Unsec. Nts., 10/15/271 | | | | | 1,065,000 | | | | 1,046,362 | |
| Cenveo Corp., 6.00% Sr. Sec. Nts., 8/1/191 | | | | | 345,000 | | | | 246,675 | |
| Clean Harbors, Inc., 5.125% Sr. Unsec. Nts., 6/1/21 | | | | | 1,230,000 | | | | 1,245,375 | |
| Covanta Holding Corp.: | | | | | | | | | | |
| 5.875% Sr. Unsec. Nts., 3/1/24 | | | | | 1,565,000 | | | | 1,592,387 | |
| 5.875% Sr. Unsec. Nts., 7/1/25 | | | | | 530,000 | | | | 533,975 | |
23 OPPENHEIMER GLOBAL STRATEGIC INCOME FUND/VA
CONSOLIDATED STATEMENT OF INVESTMENTS Continued
| | | | | | | | | | |
| | | | | Principal Amount | | | Value | |
Commercial Services & Supplies (Continued) | | | | | |
| GFL Environmental, Inc., 5.625% Sr. Unsec. Nts., 5/1/221 | | | | | $ 720,000 | | | | $ 750,600 | |
| Matthews International Corp., 5.25% Sr. Unsec. Nts., 12/1/251 | | | | | 730,000 | | | | 739,125 | |
| Republic Services, Inc., 3.80% Sr. Unsec. Nts., 5/15/18 | | | | | 786,000 | | | | 791,505 | |
| RR Donnelley & Sons Co., 7.875% Sr. Unsec. Nts., 3/15/21 | | | | | 1,200,000 | | | | 1,254,000 | |
| TMS International Corp., 7.25% Sr. Unsec. Nts., 8/15/253 | | | | | 265,000 | | | | 277,588 | |
| West Corp.: | | | | | | | | | | |
| 5.375% Sr. Unsec. Nts., 7/15/223 | | | | | 685,000 | | | | 698,769 | |
| 8.50% Sr. Unsec. Nts., 10/15/251 | | | | | 665,000 | | | | 660,012 | |
| | | | | | | | | 13,386,250 | |
| | | | | | | | | | | |
Construction & Engineering—0.1% | | | | | |
| AECOM, 5.125% Sr. Unsec. Nts., 3/15/27 | | | | | 535,000 | | | | 546,315 | |
| Fideicomiso PA Pacifico Tres, 8.25% Sr. Sec. Nts., 1/15/351 | | | | | 535,000 | | | | 620,600 | |
| Tutor Perini Corp., 6.875% Sr. Unsec. Nts., 5/1/251 | | | | | 780,000 | | | | 840,450 | |
| | | | | | | | | 2,007,365 | |
| | | | | | | | | | | |
Electrical Equipment—0.2% | | | | | | | | | | |
| Sensata Technologies BV: | | | | | | | | | | |
| 4.875% Sr. Unsec. Nts., 10/15/231 | | | | | 898,000 | | | | 941,778 | |
| 5.625% Sr. Unsec. Nts., 11/1/241 | | | | | 1,190,000 | | | | 1,311,975 | |
| Vertiv Group Corp., 9.25% Sr. Unsec. Nts., 10/15/241 | | | | | 270,000 | | | | 289,575 | |
| | | | | | | | | 2,543,328 | |
| | | | | | | | | | | |
Industrial Conglomerates—0.2% | | | | | |
| Carlisle Cos., Inc., 3.75% Sr. Unsec. Nts., 12/1/27 | | | | | 492,000 | | | | 497,965 | |
| Citgo Holding, Inc., 10.75% Sr. Sec. Nts., 2/15/201 | | | | | 570,000 | | | | 614,175 | |
| Icahn Enterprises LP/Icahn Enterprises Finance Corp., 5.875% Sr. Unsec. Nts., 2/1/22 | | | | | 490,000 | | | | 497,962 | |
| Roper Technologies, Inc.: | | | | | | | | | | |
| 3.00% Sr. Unsec. Nts., 12/15/20 | | | | | 754,000 | | | | 763,438 | |
| 3.80% Sr. Unsec. Nts., 12/15/26 | | | | | 695,000 | | | | 717,851 | |
| Tupras Turkiye Petrol Rafinerileri AS, 4.50% Sr. Unsec. Nts., 10/18/241 | | | | | 535,000 | | | | 529,750 | |
| | | | | | | | | 3,621,141 | |
| | | | | | | | | | | |
Machinery—0.6% | | | | | | | | | | |
| Allison Transmission, Inc.: | | | | | | | | | | |
| 4.75% Sr. Unsec. Nts., 10/1/271 | | | | | 265,000 | | | | 267,319 | |
| 5.00% Sr. Unsec. Nts., 10/1/241 | | | | | 500,000 | | | | 516,875 | |
| Amsted Industries, Inc., 5.00% Sr. Unsec. Nts., 3/15/223 | | | | | 1,120,000 | | | | 1,149,400 | |
| BlueLine Rental Finance Corp./BlueLine Rental LLC, 9.25% Sec. Nts., 3/15/241 | | | | | 1,305,000 | | | | 1,396,350 | |
| CNH Industrial NV, 3.85% Sr. Unsec. Nts., 11/15/27 | | | | | 491,000 | | | | 490,478 | |
| Fortive Corp., 1.80% Sr. Unsec. Nts., 6/15/19 | | | | | 985,000 | | | | 978,148 | |
| Icahn Enterprises LP/Icahn Enterprises Finance Corp., 6.75% Sr. Unsec. Nts., 2/1/24 | | | | | 1,320,000 | | | | 1,361,250 | |
| Navistar International Corp., 6.625% Sr. Unsec. Nts., 11/1/251 | | | | | 665,000 | | | | 695,510 | |
| Park-Ohio Industries, Inc., 6.625% Sr. Unsec. Nts., 4/15/27 | | | | | 260,000 | | | | 281,450 | |
| Stanley Black & Decker, Inc., 2.451% Sub. Nts., 11/17/18 | | | | | 222,000 | | | | 222,717 | |
| Terex Corp., 5.625% Sr. Unsec. Nts., 2/1/251 | | | | | 255,000 | | | | 266,794 | |
| | | | | | | | | | |
| | | | | Principal Amount | | | Value | |
Machinery (Continued) | | | | | | | | | | |
| Titan International, Inc., 6.50% Sr. Sec. Nts., 11/30/23 | | | | | $ 1,075,000 | | | | $ 1,096,500 | |
| Wabash National Corp., 5.50% Sr. Unsec. Nts., 10/1/251 | | | | | 270,000 | | | | 272,700 | |
| Wabtec Corp., 3.45% Sr. Unsec. Nts., 11/15/26 | | | | | 374,000 | | | | 366,346 | |
| | | | | | | | | 9,361,837 | |
| | | | | | | | | | | |
Marine—0.0% | | | | | | | | | | |
| Global Ship Lease, Inc., 9.875% Sr. Sec. Nts., 11/15/221 | | | | | 270,000 | | | | 279,788 | |
| | | | | | | | | | | |
Professional Services—0.2% | | | | | | | | | | |
| Atento Luxco 1 SA, 6.125% Sr. Sec. Nts., 8/10/221 | | | | | 655,000 | | | | 687,750 | |
| Brand Industrial Services, Inc., 8.50% Sr. Unsec. Nts., 7/15/251 | | | | | 795,000 | | | | 836,737 | |
| FTI Consulting, Inc., 6.00% Sr. Unsec. Nts., 11/15/22 | | | | | 1,720,000 | | | | 1,778,996 | |
| IHS Markit Ltd., 4.00% Sr. Unsec. Nts., 3/1/261 | | | | | 270,000 | | | | 271,013 | |
| | | | | | | | | 3,574,496 | |
| | | | | | | | | | | |
Road & Rail—0.2% | | | | | | | | | | |
| Avis Budget Car Rental LLC/Avis Budget Finance, Inc., 5.25% Sr. Unsec. Nts., 3/15/251 | | | | | 765,000 | | | | 760,219 | |
| Canadian Pacific Railway Co., 4.80% Sr. Unsec. Nts., 9/15/35 | | | | | 111,000 | | | | 129,613 | |
| DAE Funding LLC, 4.00% Sr. Unsec. Nts., 8/1/201 | | | | | 265,000 | | | | 268,312 | |
| Hertz Corp. (The), 7.375% Sr. Unsec. Nts., 1/15/21 | | | | | 265,000 | | | | 268,975 | |
| Kazakhstan Temir Zholy National Co. JSC, 4.85% Sr. Unsec. Nts., 11/17/271 | | | | | 215,000 | | | | 224,593 | |
| Penske Truck Leasing Co. LP/PTL Finance | | | | | | | | | | |
| Corp., 3.40% Sr. Unsec. Nts., 11/15/261 | | | | | 743,000 | | | | 734,809 | |
| | | | | | | | | 2,386,521 | |
| | | | | | | | | | | |
Trading Companies & Distributors—0.6% | | | | | |
| Air Lease Corp.: | | | | | | | | | | |
| 3.00% Sr. Unsec. Nts., 9/15/23 | | | | | 403,000 | | | | 400,335 | |
| 3.625% Sr. Unsec. Nts., 4/1/27 | | | | | 403,000 | | | | 403,351 | |
| Aircastle Ltd., 5.00% Sr. Unsec. Nts., 4/1/23 | | | | | 245,000 | | | | 258,781 | |
| American Builders & Contractors Supply Co., Inc., 5.75% Sr. Unsec. Nts., 12/15/231 | | | | | 340,000 | | | | 358,700 | |
| American Tire Distributors, Inc., 10.25% Sr. Sub. Nts., 3/1/221 | | | | | 405,000 | | | | 419,173 | |
| Fly Leasing Ltd., 5.25% Sr. Unsec. Nts., 10/15/24 | | | | | 530,000 | | | | 531,325 | |
| GATX Corp., 3.50% Sr. Unsec. Nts., 3/15/28 | | | | | 738,000 | | | | 729,604 | |
| H&E Equipment Services, Inc., 5.625% Sr. Unsec. Nts., 9/1/251 | | | | | 800,000 | | | | 838,000 | |
| Herc Rentals, Inc.: | | | | | | | | | | |
| 7.50% Sec. Nts., 6/1/221 | | | | | 596,000 | | | | 645,170 | |
| 7.75% Sec. Nts., 6/1/241 | | | | | 400,000 | | | | 441,000 | |
| ILFC E-Capital Trust I, 4.37% [30YR CMT+155] Jr. Sub. Nts., 12/21/651,2 | | | | | 690,000 | | | | 674,475 | |
| Standard Industries, Inc., 6.00% Sr. Unsec. Nts., 10/15/251 | | | | | 1,435,000 | | | | 1,539,038 | |
| United Rentals North America, Inc.: | | | | | | | | | | |
| 4.625% Sr. Unsec. Nts., 10/15/25 | | | | | 732,000 | | | | 739,320 | |
| 4.875% Sr. Unsec. Nts., 1/15/28 | | | | | 1,330,000 | | | | 1,339,975 | |
| 5.875% Sr. Unsec. Nts., 9/15/26 | | | | | 1,235,000 | | | | 1,326,081 | |
| | | | | | | | | 10,644,328 | |
| | | | | | | | | | | |
Transportation Infrastructure—0.3% | | | | | |
| Adani Abbot Point Terminal Pty Ltd., 4.45% Sr. Sec. Nts., 12/15/221 | | | | | 1,075,000 | | | | 1,046,559 | |
24 OPPENHEIMER GLOBAL STRATEGIC INCOME FUND/VA
| | | | | | | | | | | | |
| | | | | | Principal Amount | | | Value | |
Transportation Infrastructure (Continued) | | | | | |
| DP World Ltd., 6.85% Sr. Unsec. Nts., 7/2/371 | | | | | | | $ 835,000 | | | | $ 1,030,000 | |
| GMR Hyderabad International Airport Ltd., 4.25% Sr. Sec. Nts., 10/27/271 | | | | | | | 1,065,000 | | | | 1,048,308 | |
| Indika Energy Capital III Pte Ltd., 5.875% Sr. Unsec. Nts., 11/9/241 | | | | | | | 1,075,000 | | | | 1,079,002 | |
| Mexico City Airport Trust, 5.50% Sr. Sec. Nts., 7/31/471 | | | | | | | 710,000 | | | | 704,675 | |
| PT Jasa Margo (Persero) Tbk, 7.50% Sr. Unsec. Nts., 12/11/201 IDR | | | | 9,160,000,000 | | | | 683,888 | |
| | | | | | | | | | | 5,592,432 | |
| | | | | | | | | | | | | |
Information Technology—2.4% | | | | | |
Communications Equipment—0.2% | | | | | |
| CommScope Technologies LLC, 6.00% Sr. Unsec. Nts., 6/15/251 | | | | | | | 570,000 | | | | 608,475 | |
| HTA Group Ltd., 9.125% Sr. Unsec. Nts., 3/8/221 | | | | | | | 430,000 | | | | 462,250 | |
| Infor US, Inc., 6.50% Sr. Unsec. Nts., 5/15/22 | | | | | | | 920,000 | | | | 956,800 | |
| Plantronics, Inc., 5.50% Sr. Unsec. Nts., 5/31/231 | | | | | | | 730,000 | | | | 760,112 | |
| Riverbed Technology, Inc., 8.875% Sr. Unsec. Nts., 3/1/231 | | | | | | | 295,000 | | | | 279,513 | |
| ViaSat, Inc., 5.625% Sr. Unsec. Nts., 9/15/251 | | | | | | | 265,000 | | | | 268,313 | |
| | | | | | | | | | | 3,335,463 | |
| | | | | | | | | | | | | |
Electronic Equipment, Instruments, & Components—0.2% | |
| Arrow Electronics, Inc., 3.875% Sr. Unsec. Nts., 1/12/28 | | | | | | | 644,000 | | | | 643,198 | |
| CDW LLC/CDW Finance Corp.: | | | | | | | | | | | | |
| 5.00% Sr. Unsec. Nts., 9/1/23 | | | | | | | 485,000 | | | | 502,581 | |
| 5.50% Sr. Unsec. Nts., 12/1/24 | | | | | | | 147,000 | | | | 160,598 | |
| Itron, Inc., 5.00% Sr. Unsec. Nts., 1/15/261 | | | | | | | 200,000 | | | | 201,250 | |
| Tech Data Corp., 4.95% Sr. Unsec. Nts., 2/15/27 | | | | | | | 702,000 | | | | 741,637 | |
| TTM Technologies, Inc., 5.625% Sr. Unsec. Nts., 10/1/251 | | | | | | | 800,000 | | | | 822,000 | |
| | | | | | | | | | | 3,071,264 | |
| | | | | | | | | | | | | |
Internet Software & Services—0.2% | | | | | |
| j2 Cloud Services LLC/j2 Global Co.- Obligor, Inc., 6.00% Sr. Unsec. Nts., 7/15/251 | | | | | | | 790,000 | | | | 835,425 | |
| Match Group, Inc., 5.00% Sr. Unsec. Nts., 12/15/271 | | | | | | | 535,000 | | | | 544,362 | |
| Rackspace Hosting, Inc., 8.625% Sr. Unsec. Nts., 11/15/241 | | | | | | | 1,395,000 | | | | 1,492,650 | |
| VeriSign, Inc.: | | | | | | | | | | | | |
| 4.75% Sr. Unsec. Nts., 7/15/27 | | | | | | | 1,083,000 | | | | 1,112,783 | |
| 5.25% Sr. Unsec. Nts., 4/1/25 | | | | | | | 268,000 | | | | 293,125 | |
| | | | | | | | | | | 4,278,345 | |
| | | | | | | | | | | | | |
IT Services—0.8% | | | | | | | | | | | | |
| Booz Allen Hamilton, Inc., 5.125% Sr. Unsec. Nts., 5/1/251 | | | | | | | 530,000 | | | | 532,650 | |
| Broadridge Financial Solutions, Inc., 3.40% Sr. Unsec. Nts., 6/27/26 | | | | | | | 425,000 | | | | 422,179 | |
| Conduent Finance, Inc./Conduent Business Services LLC, 10.50% Sr. Unsec. Nts., 12/15/241 | | | | | | | 1,280,000 | | | | 1,505,600 | |
| DXC Technology Co.: | | | | | | | | | | | | |
| 2.875% Sr. Unsec. Nts., 3/27/20 | | | | | | | 672,000 | | | | 675,593 | |
| 4.75% Sr. Unsec. Nts., 4/15/27 | | | | | | | 695,000 | | | | 740,233 | |
| Everi Payments, Inc., 7.50% Sr. Unsec. Nts., 12/15/251 | | | | | | | 1,075,000 | | | | 1,068,281 | |
| Exela Intermediate LLC/Exela Finance, Inc., 10.00% Sr. Sec. Nts., 7/15/231 | | | | | | | 795,000 | | | | 777,112 | |
| | | | | | | | | | | | |
| | | | | | Principal Amount | | | Value | |
IT Services (Continued) | | | | | | | | | | | | |
| Fidelity National Information Services, Inc., 2.85% Sr. Unsec. Nts., 10/15/18 | | | | | | | $ 626,000 | | | | $ 629,918 | |
| First Data Corp.: | | | | | | | | | | | | |
| 5.00% Sr. Sec. Nts., 1/15/241 | | | | | | | 455,000 | | | | 469,787 | |
| 5.75% Sec. Nts., 1/15/241 | | | | | | | 910,000 | | | | 948,448 | |
| 7.00% Sr. Unsec. Nts., 12/1/231 | | | | | | | 1,465,000 | | | | 1,552,900 | |
| Gartner, Inc., 5.125% Sr. Unsec. Nts., 4/1/251 | | | | | | | 780,000 | | | | 817,050 | |
| Harland Clarke Holdings Corp., 6.875% Sr. Sec. Nts., 3/1/203 | | | | | | | 905,000 | | | | 925,363 | |
| Sabre GLBL, Inc., 5.25% Sr. Sec. Nts., 11/15/231 | | | | | | | 1,430,000 | | | | 1,469,754 | |
| Total System Services, Inc., 2.375% Sr. Unsec. Nts., 6/1/18 | | | | | | | 506,000 | | | | 506,202 | |
| | | | | | | | | | | 13,041,070 | |
| | | | | | | | | | | | | |
Semiconductors & Semiconductor Equipment—0.1% | |
| Intel Corp., 3.734% Sr. Unsec. Nts., 12/8/471 | | | | | | | 254,000 | | | | 264,212 | |
| NXP BV/NXP Funding LLC, 4.625% Sr. Unsec. Nts., 6/1/231 | | | | | | | 1,350,000 | | | | 1,415,475 | |
| Versum Materials, Inc., 5.50% Sr. Unsec. Nts., 9/30/241 | | | | | | | 250,000 | | | | 268,125 | |
| | | | | | | | | | | 1,947,812 | |
| | | | | | | | | | | | | |
Software—0.6% | | | | | | | | | | | | |
| Autodesk, Inc., 4.375% Sr. Unsec. Nts., 6/15/25 | | | | | | | 275,000 | | | | 288,953 | |
| BMC Software Finance, Inc., 8.125% Sr. Unsec. Nts., 7/15/211 | | | | | | | 1,355,000 | | | | 1,370,244 | |
| Dell International LLC/EMC Corp.: | | | | | | | | | | | | |
| 3.48% Sr. Sec. Nts., 6/1/191 | | | | | | | 971,000 | | | | 983,415 | |
| 5.875% Sr. Unsec. Nts., 6/15/211 | | | | | | | 215,000 | | | | 223,600 | |
| 6.02% Sr. Sec. Nts., 6/15/261 | | | | | | | 553,000 | | | | 610,598 | |
| 7.125% Sr. Unsec. Nts., 6/15/241 | | | | | | | 745,000 | | | | 815,955 | |
| Informatica LLC, 7.125% Sr. Unsec. Nts., 7/15/231 | | | | | | | 595,000 | | | | 611,362 | |
| Open Text Corp., 5.625% Sr. Unsec. Nts., 1/15/231 | | | | | | | 401,000 | | | | 419,546 | |
| Oracle Corp.: | | | | | | | | | | | | |
| 2.40% Sr. Unsec. Nts., 9/15/23 | | | | | | | 555,000 | | | | 548,405 | |
| 2.95% Sr. Unsec. Nts., 5/15/25 | | | | | | | 547,000 | | | | 549,765 | |
| Symantec Corp., 5.00% Sr. Unsec. Nts., 4/15/251 | | | | | | | 495,000 | | | | 516,038 | |
| TIBCO Software, Inc., 11.375% Sr. Unsec. Nts., 12/1/211 | | | | | | | 625,000 | | | | 682,425 | |
| Veritas US, Inc./Veritas Bermuda Ltd., 7.50% Sr. Sec. Nts., 2/1/231 | | | | | | | 1,155,000 | | | | 1,212,750 | |
| VMware, Inc.: | | | | | | | | | | | | |
| 2.30% Sr. Unsec. Nts., 8/21/20 | | | | | | | 281,000 | | | | 279,565 | |
| 3.90% Sr. Unsec. Nts., 8/21/27 | | | | | | | 462,000 | | | | 467,158 | |
| | | | | | | | | | | 9,579,779 | |
| | | | | | | | | | | | | |
Technology Hardware, Storage & Peripherals—0.3% | | | | | |
| Apple, Inc., 4.375% Sr. Unsec. Nts., 5/13/45 | | | | | | | 535,000 | | | | 603,658 | |
| Harland Clarke Holdings Corp., 8.375% Sr. Sec. Nts., 8/15/221 | | | | | | | 920,000 | | | | 957,674 | |
| Hewlett Packard Enterprise Co., 3.60% Sr. Unsec. Nts., 10/15/20 | | | | | | | 889,000 | | | | 908,186 | |
| NCR Corp., 6.375% Sr. Unsec. Nts., 12/15/23 | | | | | | | 520,000 | | | | 546,000 | |
| NetApp, Inc., 2.00% Sr. Unsec. Nts., 9/27/19 | | | | | | | 418,000 | | | | 414,892 | |
| Western Digital Corp., 10.50% Sr. Unsec. Nts., 4/1/24 | | | | | | | 875,000 | | | | 1,016,094 | |
| | | | | | | | | | | 4,446,504 | |
25 OPPENHEIMER GLOBAL STRATEGIC INCOME FUND/VA
CONSOLIDATED STATEMENT OF INVESTMENTS Continued
| | | | | | | | | | |
| | | | | Principal Amount | | | Value | |
Materials—3.9% | |
Chemicals—1.2% | | | | | | | | | | |
| Agrium, Inc.: | | | | | | | | | | |
| 3.375% Sr. Unsec. Nts., 3/15/25 | | | | $ | 378,000 | | | $ | 380,248 | |
| 4.125% Sr. Unsec. Nts., 3/15/35 | | | | | 154,000 | | | | 159,470 | |
| Ashland LLC, 6.875% Sr. Unsec. Nts., 5/15/43 | | | | | 295,000 | | | | 328,925 | |
| CF Industries, Inc.: | | | | | | | | | | |
| 4.50% Sr. Sec. Nts., 12/1/261 | | | | | 687,000 | | | | 717,258 | |
| 4.95% Sr. Unsec. Nts., 6/1/43 | | | | | 535,000 | | | | 508,250 | |
| 5.15% Sr. Unsec. Nts., 3/15/34 | | | | | 335,000 | | | | 342,956 | |
| Chemours Co. (The): | | | | | | | | | | |
| 5.375% Sr. Unsec. Nts., 5/15/27 | | | | | 395,000 | | | | 409,812 | |
| 6.625% Sr. Unsec. Nts., 5/15/23 | | | | | 450,000 | | | | 478,125 | |
| CVR Partners LP/CVR Nitrogen Finance Corp., 9.25% Sec. Nts., 6/15/231 | | | | | 185,000 | | | | 199,800 | |
| Ecolab, Inc., 2.00% Sr. Unsec. Nts., 1/14/19 | | | | | 803,000 | | | | 801,818 | |
| Hexion, Inc.: | | | | | | | | | | |
| 6.625% Sr. Sec. Nts., 4/15/20 | | | | | 1,850,000 | | | | 1,669,625 | |
| 10.375% Sr. Sec. Nts., 2/1/221 | | | | | 1,050,000 | | | | 982,406 | |
| Inkia Energy Ltd., 5.875% Sr. Unsec. Nts., 11/9/271 | | | | | 965,000 | | | | 972,971 | |
| Kallpa Generacion SA, 4.875% Sr. Unsec. Nts., 5/24/261 | | | | | 370,000 | | | | 386,187 | |
| Koppers, Inc., 6.00% Sr. Unsec. Nts., 2/15/251 | | | | | 510,000 | | | | 541,875 | |
| Kraton Polymers LLC/Kraton Polymers Capital Corp.: | | | | | | | | | | |
| 7.00% Sr. Unsec. Nts., 4/15/251 | | | | | 260,000 | | | | 279,500 | |
| 10.50% Sr. Unsec. Nts., 4/15/231 | | | | | 190,000 | | | | 215,650 | |
| LyondellBasell Industries NV, 5.00% Sr. Unsec. Nts., 4/15/19 | | | 594,000 | | | | 609,990 | |
| NOVA Chemicals Corp.: | | | | | | | | | | |
| 4.875% Sr. Unsec. Nts., 6/1/241 | | | | | 260,000 | | | | 260,000 | |
| 5.25% Sr. Unsec. Nts., 8/1/231 | | | | | 495,000 | | | | 511,087 | |
| Olin Corp., 5.125% Sr. Unsec. Nts., 9/15/27 | | | | | 300,000 | | | | 316,500 | |
| ONGC Videsh Ltd., 2.75% Sr. Unsec. Nts., 7/15/21 | | EUR | | | 1,265,000 | | | | 1,622,287 | |
| Platform Specialty Products Corp.: | | | | | | | | | | |
| 5.875% Sr. Unsec. Nts., 12/1/251 | | | | | 690,000 | | | | 685,688 | |
| 6.50% Sr. Unsec. Nts., 2/1/221 | | | | | 730,000 | | | | 755,550 | |
| PolyOne Corp., 5.25% Sr. Unsec. Nts., 3/15/23 | | | | | 806,000 | | | | 852,345 | |
| PQ Corp., 5.75% Sr. Unsec. Nts., 12/15/251 | | | | | 270,000 | | | | 275,400 | |
| Rain CII Carbon LLC/CII Carbon Corp., 7.25% Sec. Nts., 4/1/251 | | | | | 980,000 | | | | 1,069,425 | |
| RPM International, Inc.: | | | | | | | | | | |
| 3.45% Sr. Unsec. Unsub. Nts., 11/15/22 | | | 692,000 | | | | 709,803 | |
| 3.75% Sr. Unsec. Nts., 3/15/27 | | | | | 234,000 | | | | 237,163 | |
| 4.25% Sr. Unsec. Nts., 1/15/48 | | | | | 223,000 | | | | 222,427 | |
| Sherwin-Williams Co. (The): | | | | | | | | | | |
| 3.45% Sr. Unsec. Nts., 6/1/27 | | | | | 110,000 | | | | 111,946 | |
| 3.95% Sr. Unsec. Nts., 1/15/26 | | | | | 418,000 | | | | 436,526 | |
| Tronox Finance plc, 5.75% Sr. Unsec. Nts., 10/1/251 | | | | | 535,000 | | | | 551,050 | |
| Valvoline, Inc., 4.375% Sr. Unsec. Nts., 8/15/25 | | | | | 530,000 | | | | 535,963 | |
| Venator Finance Sarl/Venator Materials LLC, 5.75% Sr. Unsec. Nts., 7/15/251 | | | 790,000 | | | | 837,400 | |
| Yara International ASA, 3.80% Sr. Unsec. Nts., 6/6/261 | | | 585,000 | | | | 581,236 | |
| | | | | | | | | 20,556,662 | |
| | | | | | | | | | | |
Construction Materials—0.2% | |
| CIMPOR Financial Operations BV, 5.75% Sr. Unsec. Nts., 7/17/241 | | | 535,000 | | | | 520,956 | |
| | | | | | | | | | |
| | | | | Principal Amount | | | Value | |
Construction Materials (Continued) | |
| James Hardie International Finance DAC: | | | | | | | | | | |
| 4.75% Sr. Unsec. Nts., 1/15/251 | | | | $ | 270,000 | | | $ | 273,375 | |
| 5.00% Sr. Unsec. Nts., 1/15/281 | | | | | 265,000 | | | | 268,312 | |
| LafargeHolcim Finance US LLC, 3.50% Sr. Unsec. Nts., 9/22/261 | | | | | 209,000 | | | | 206,393 | |
| Martin Marietta Materials, Inc., 3.50% Sr. Unsec. Nts., 12/15/27 | | | | | 447,000 | | | | 444,453 | |
| St. Marys Cement, Inc., 5.75% Sr. Unsec. Nts., 1/28/271 | | | | | 500,000 | | | | 529,375 | |
| Summit Materials LLC/Summit Materials Finance Corp., 5.125% Sr. Unsec. Nts., 6/1/251 | | | | | 260,000 | | | | 265,850 | |
| US Concrete, Inc., 6.375% Sr. Unsec. Nts., 6/1/24 | | | | | 745,000 | | | | 802,738 | |
| Vulcan Materials Co., 3.90% Sr. Unsec. Nts., 4/1/27 | | | | | 687,000 | | | | 703,371 | |
| | | | | | | | | 4,014,823 | |
| | | | | | | | | | | |
Containers & Packaging—0.7% | |
| BWAY Holding Co., 7.25% Sr. Unsec. Nts., 4/15/251 | | | | | 270,000 | | | | 279,450 | |
| Coveris Holdings SA, 7.875% Sr. Unsec. Nts., 11/1/191 | | | | | 1,140,000 | | | | 1,137,150 | |
| Crown Americas LLC/Crown Americas Capital Corp. IV, 4.50% Sr. Unsec. Nts., 1/15/23 | | | | | 1,000,000 | | | | 1,017,500 | |
| Graphic Packaging International, Inc., 4.125% Sr. Unsec. Nts., 8/15/24 | | | | | 765,000 | | | | 795,600 | |
| International Paper Co.: | | | | | | | | | | |
| 3.00% Sr. Unsec. Nts., 2/15/27 | | | | | 390,000 | | | | 378,761 | |
| 4.80% Sr. Unsec. Nts., 6/15/44 | | | | | 366,000 | | | | 401,837 | |
| Klabin Finance SA, 4.875% Sr. Unsec. Nts., 9/19/271 | | | | | 1,050,000 | | | | 1,038,975 | |
| OI European Group BV, 4.00% Sr. Unsec. Nts., 3/15/231 | | | | | 535,000 | | | | 537,060 | |
| Owens-Brockway Glass Container, Inc., 5.00% Sr. Unsec. Nts., 1/15/221 | | | | | 500,000 | | | | 519,375 | |
| Packaging Corp. of America, 4.50% Sr. Unsec. Nts., 11/1/23 | | | | | 690,000 | | | | 743,092 | |
| Plastipak Holdings, Inc., 6.25% Sr. Unsec. Nts., 10/15/251 | | | | | 800,000 | | | | 826,000 | |
| Reynolds Group Issuer, Inc./Reynolds Group Issuer LLC/Reynolds Group Issuer Luxembourg SA: | | | | | | | | | | |
| 5.125% Sr. Sec. Nts., 7/15/231 | | | | | 745,000 | | | | 772,006 | |
| 7.00% Sr. Unsec. Nts., 7/15/241 | | | | | 1,415,000 | | | | 1,518,118 | |
| Sealed Air Corp.: | | | | | | | | | | |
| 4.875% Sr. Unsec. Nts., 12/1/221 | | | | | 585,000 | | | | 620,100 | |
| 5.125% Sr. Unsec. Nts., 12/1/241 | | | | | 785,000 | | | | 843,875 | |
| 6.875% Sr. Unsec. Nts., 7/15/331 | | | | | 270,000 | | | | 315,225 | |
| Silgan Holdings, Inc., 4.75% Sr. Unsec. Nts., 3/15/251 | | | | | 755,000 | | | | 777,650 | |
| | | | | | | | | 12,521,774 | |
| | | | | | | | | | | |
Metals & Mining—1.5% | |
| ABJA Investment Co. Pte Ltd., 5.95% Sr. Unsec. Nts., 7/31/24 | | | | | 1,070,000 | | | | 1,131,525 | |
| AK Steel Corp.: | | | | | | | | | | |
| 6.375% Sr. Unsec. Nts., 10/15/25 | | | | | 1,325,000 | | | | 1,318,375 | |
| 7.00% Sr. Unsec. Nts., 3/15/27 | | | | | 630,000 | | | | 644,175 | |
| Alcoa Nederland Holding BV: | | | | | | | | | | |
| 6.75% Sr. Unsec. Nts., 9/30/241 | | | | | 245,000 | | | | 268,275 | |
| 7.00% Sr. Unsec. Nts., 9/30/261 | | | | | 240,000 | | | | 270,600 | |
| Aleris International, Inc.: | | | | | | | | | | |
| 7.875% Sr. Unsec. Nts., 11/1/20 | | | | | 947,000 | | | | 942,265 | |
| 9.50% Sr. Sec. Nts., 4/1/211 | | | | | 515,000 | | | | 545,900 | |
| Allegheny Technologies, Inc., 7.875% Sr. Unsec. Nts., 8/15/23 | | | | | 530,000 | | | | 573,391 | |
| Anglo American Capital plc: 3.625% Sr. Unsec. Nts., 9/11/241 | | | | | 224,000 | | | | 223,140 | |
26 OPPENHEIMER GLOBAL STRATEGIC INCOME FUND/VA
| | | | | | | | | | |
| | | | | Principal Amount | | | Value | |
Metals & Mining (Continued) | |
Anglo American Capital plc: (Continued) | |
| 4.00% Sr. Unsec. Nts., 9/11/271 | | | | $ | 365,000 | | | $ | 363,033 | |
| ArcelorMittal: | | | | | | | | | | |
| 7.25% Sr. Unsec. Nts., 3/1/41 | | | | | 295,000 | | | | 374,650 | |
| 7.50% Sr. Unsec. Nts., 10/15/39 | | | | | 475,000 | | | | 610,375 | |
| Coeur Mining, Inc., 5.875% Sr. Unsec. Nts., 6/1/24 | | | | | 785,000 | | | | 778,131 | |
| Constellium NV, 6.625% Sr. Unsec. Nts., 3/1/251 | | | | | 510,000 | | | | 538,687 | |
| First Quantum Minerals Ltd.: | | | | | | | | | | |
| 7.25% Sr. Unsec. Nts., 5/15/221 | | | | | 435,000 | | | | 458,185 | |
| 7.25% Sr. Unsec. Nts., 4/1/231 | | | | | 780,000 | | | | 842,400 | |
| Freeport-McMoRan, Inc.: | | | | | | | | | | |
| 4.55% Sr. Unsec. Nts., 11/14/24 | | | | | 530,000 | | | | 541,501 | |
| 5.40% Sr. Unsec. Nts., 11/14/34 | | | | | 915,000 | | | | 935,587 | |
| 5.45% Sr. Unsec. Nts., 3/15/43 | | | | | 540,000 | | | | 542,025 | |
| Gerdau Trade, Inc., 4.875% Sr. Unsec. Nts., 10/24/271 | | | | | 1,395,000 | | | | 1,389,769 | |
| Goldcorp, Inc., 5.45% Sr. Unsec. Nts., 6/9/44 | | | | | 250,000 | | | | 291,849 | |
| Hudbay Minerals, Inc., 7.625% Sr. Unsec. Nts., 1/15/251 | | | | | 505,000 | | | | 555,500 | |
| JSW Steel Ltd., 4.75% Sr. Unsec. Nts., 11/12/19 | | | | | 1,075,000 | | | | 1,092,340 | |
| Kinross Gold Corp., 4.50% Sr. Unsec. Nts., 7/15/271 | | | | | 790,000 | | | | 796,912 | |
| Metalloinvest Finance DAC, 5.625% Unsec. Nts., 4/17/201 | | | | | 255,000 | | | | 268,519 | |
| Metinvest BV, 9.373% Sr. Sec. Nts., 12/31/2114 | | | | | 535,441 | | | | 561,276 | |
| Mountain Province Diamonds, Inc., 8.00% Sec. Nts., 12/15/221 | | | | | 535,000 | | | | 530,987 | |
| Northwest Acquisitions ULC/Dominion Finco, Inc., 7.125% Sec. Nts., 11/1/221 | | | | | 400,000 | | | | 414,000 | |
| Petropavlovsk 2016 Ltd., 8.125% Sr. Unsec. Nts., 11/14/221 | | | | | 540,000 | | | | 531,900 | |
| Polyus Finance plc, 5.25% Sr. Unsec. Nts., 2/7/231 | | | | | 1,065,000 | | | | 1,119,246 | |
| Southern Copper Corp., 7.50% Sr. Unsec. Nts., 7/27/35 | | | | | 975,000 | | | | 1,329,314 | |
| SunCoke Energy Partners LP/SunCoke Energy Partners Finance Corp., 7.50% Sr. | | | | | | | | | | |
| Unsec. Nts., 6/15/251 | | | | | 330,000 | | | | 346,500 | |
| Teck Resources Ltd.: | | | | | | | | | | |
| 5.20% Sr. Unsec. Nts., 3/1/42 | | | | | 1,225,000 | | | | 1,218,875 | |
| 6.125% Sr. Unsec. Nts., 10/1/35 | | | | | 550,000 | | | | 618,750 | |
| United States Steel Corp., 6.875% Sr. Unsec. Nts., 8/15/25 | | | | | 530,000 | | | | 555,864 | |
| Vedanta Resources plc, 6.375% Sr. Unsec. Nts., 7/30/221 | | | | | 535,000 | | | | 559,771 | |
| Zekelman Industries, Inc., 9.875% Sr. Sec. Nts., 6/15/233 | | | | | 535,000 | | | | 603,213 | |
| | | | | | | | | 24,686,805 | |
| | | | | | | | | | | |
Paper & Forest Products—0.3% | |
| Clearwater Paper Corp., 5.375% Sr. Unsec. Nts., 2/1/251 | | | | | 780,000 | | | | 787,800 | |
| Louisiana-Pacific Corp., 4.875% Sr. Unsec. Nts., 9/15/24 | | | | | 788,000 | | | | 815,580 | |
| Mercer International, Inc.: | | | | | | | | | | |
| 5.50% Sr. Unsec. Nts., 1/15/261 | | | | | 250,000 | | | | 254,375 | |
| 6.50% Sr. Unsec. Nts., 2/1/24 | | | | | 510,000 | | | | 543,150 | |
| 7.75% Sr. Unsec. Nts., 12/1/22 | | | | | 500,000 | | | | 530,000 | |
| Suzano Austria GmbH, 5.75% Sr. Unsec. Nts., 7/14/261 | | | | | 1,150,000 | | | | 1,251,315 | |
| | | | | | | | | 4,182,220 | |
| | | | | | | | | | |
| | | | | Principal Amount | | | Value | |
Telecommunication Services—2.3% | |
Diversified Telecommunication Services—1.4% | |
| AT&T, Inc.: | | | | | | | | | | |
| 3.40% Sr. Unsec. Nts., 8/14/24 | | | | $ | 380,000 | | | $ | 382,417 | |
| 4.30% Sr. Unsec. Nts., 2/15/301 | | | | | 744,000 | | | | 744,874 | |
| 4.35% Sr. Unsec. Nts., 6/15/45 | | | | | 763,000 | | | | 706,059 | |
| 5.15% Sr. Unsec. Nts., 2/14/50 | | | | | 283,000 | | | | 285,522 | |
| Axtel SAB de CV, 6.375% Sr. Unsec. Nts., 11/14/241 | | | | | 755,000 | | | | 781,425 | |
| British Telecommunications plc, 9.125% Sr. Unsec. Nts., 12/15/30 | | | | | 748,000 | | | | 1,119,626 | |
| CB Escrow Corp., 8.00% Sr. Unsec. Nts., 10/15/251 | | | | | 265,000 | | | | 270,300 | |
| CenturyLink, Inc.: | | | | | | | | | | |
| 5.625% Sr. Unsec. Nts., 4/1/25 | | | | | 785,000 | | | | 717,294 | |
| 6.45% Sr. Unsec. Nts., Series S, 6/15/21 | | | | | 1,200,000 | | | | 1,218,000 | |
| 7.50% Sr. Unsec. Nts., Series Y, 4/1/24 | | | | | 1,375,000 | | | | 1,375,000 | |
| Cincinnati Bell Telephone Co. LLC, 6.30% Sr. Unsec. Nts., 12/1/28 | | | | | 520,000 | | | | 520,000 | |
| Deutsche Telekom International Finance | | | | | | | | | | |
| BV, 2.225% Sr. Unsec. Nts., 1/17/201 | | | | | 923,000 | | | | 919,016 | |
| Frontier Communications Corp.: | | | | | | | | | | |
| 8.75% Sr. Unsec. Nts., 4/15/22 | | | | | 590,000 | | | | 426,092 | |
| 10.50% Sr. Unsec. Nts., 9/15/22 | | | | | 2,290,000 | | | | 1,737,537 | |
| Level 3 Financing, Inc.: | | | | | | | | | | |
| 5.25% Sr. Unsec. Nts., 3/15/26 | | | | | 1,195,000 | | | | 1,175,940 | |
| 5.625% Sr. Unsec. Nts., 2/1/23 | | | | | 490,000 | | | | 494,900 | |
| Qwest Capital Funding, Inc., 7.75% Sr. Unsec. Nts., 2/15/31 | | | | | 260,000 | | | | 230,100 | |
| Qwest Corp., 6.875% Sr. Unsec. Nts., 9/15/33 | | | | | 785,000 | | | | 754,122 | |
| Telefonica Emisiones SAU: | | | | | | | | | | |
| 3.192% Sr. Unsec. Nts., 4/27/18 | | | | | 577,000 | | | | 579,095 | |
| 4.103% Sr. Unsec. Nts., 3/8/27 | | | | | 252,000 | | | | 260,815 | |
| 5.213% Sr. Unsec. Nts., 3/8/47 | | | | | 351,000 | | | | 399,558 | |
| 7.045% Sr. Unsec. Unsub. Nts., 6/20/36 | | | | | 289,000 | | | | 388,593 | |
| T-Mobile USA, Inc.: | | | | | | | | | | |
| 4.00% Sr. Unsec. Nts., 4/15/22 | | | | | 780,000 | | | | 801,937 | |
| 5.125% Sr. Unsec. Nts., 4/15/25 | | | | | 780,000 | | | | 812,175 | |
| 5.375% Sr. Unsec. Nts., 4/15/27 | | | | | 390,000 | | | | 416,812 | |
| 6.00% Sr. Unsec. Nts., 4/15/24 | | | | | 985,000 | | | | 1,046,562 | |
| 6.50% Sr. Unsec. Nts., 1/15/26 | | | | | 825,000 | | | | 902,344 | |
| Verizon Communications, Inc.: | | | | | | | | | | |
| 1.75% Sr. Unsec. Nts., 8/15/21 | | | | | 342,000 | | | | 333,069 | |
| 4.125% Sr. Unsec. Nts., 8/15/46 | | | | | 394,000 | | | | 365,126 | |
| 4.522% Sr. Unsec. Nts., 9/15/48 | | | | | 732,000 | | | | 723,065 | |
| Windstream Services LLC/Windstream Finance Corp.: | | | | | | | | | | |
| 8.625% Sr. Sec. Nts., 10/31/25 | | | | | 1,062,000 | | | | 1,027,485 | |
| 8.75% Sr. Unsec. Nts., 12/15/24 | | | | | 454,000 | | | | 319,502 | |
| Zayo Group LLC/Zayo Capital, Inc.: | | | | | | | | | | |
| 5.75% Sr. Unsec. Nts., 1/15/271 | | | | | 265,000 | | | | 270,963 | |
| 6.00% Sr. Unsec. Nts., 4/1/23 | | | | | 1,345,000 | | | | 1,407,610 | |
| | | | | | | | | 23,912,935 | |
| | | | | | | | | | | |
Wireless Telecommunication Services—0.9% | |
| C&W Senior Financing Designated Activity Co., 6.875% Sr. Unsec. Nts., 9/15/271 | | | | | 650,000 | | | | 682,500 | |
| Digicel Group Ltd.: | | | | | | | | | | |
| 7.125% Sr. Unsec. Nts., 4/1/221 | | | | | 535,000 | | | | 497,427 | |
| 8.25% Sr. Unsec. Nts., 9/30/201 | | | | | 325,000 | | | | 320,547 | |
| Drawbridge Special Opportunities Fund LP/Drawbridge Special Opportunities Finance Corp., 5.00% Sr. Unsec. Nts., 8/1/211 | | | | | 1,595,000 | | | | 1,647,166 | |
| Sprint Capital Corp., 6.875% Sr. Unsec. Nts., 11/15/28 | | | | | 267,158 | | | | 269,496 | |
| Sprint Communications, Inc.: 6.00% Sr. Unsec. Nts., 11/15/22 | | | | | 1,975,000 | | | | 1,979,937 | |
27 OPPENHEIMER GLOBAL STRATEGIC INCOME FUND/VA
CONSOLIDATED STATEMENT OF INVESTMENTS Continued
| | | | | | | | | | |
| | | | | Principal Amount | | | Value | |
Wireless Telecommunication Services (Continued) | |
Sprint Communications, Inc.: (Continued) | |
| 7.00% Sr. Unsec. Nts., 3/1/201 | | | | $ | 850,000 | | | $ | 911,625 | |
| Sprint Corp.: | | | | | | | | | | |
| 7.125% Sr. Unsec. Nts., 6/15/24 | | | | | 2,505,000 | | | | 2,555,100 | |
| 7.875% Sr. Unsec. Nts., 9/15/23 | | | | | 2,075,000 | | | | 2,215,063 | |
| Trilogy International Partners LLC/Trilogy International Finance, Inc., 8.875% Sr. Sec. Nts., 5/1/223 | | | | | 1,040,000 | | | | 1,068,600 | |
| VimpelCom Holdings BV, 4.95% Sr. Unsec. Nts., 6/16/241 | | | | | 1,075,000 | | | | 1,092,738 | |
| Wind Tre SpA, 5.00% Sr. Sec. Nts., 1/20/26 | | | | | 805,000 | | | | 769,580 | |
| | | | | | | | | 14,009,779 | |
| | | | | | | | | | | |
Utilities—2.0% | |
Electric Utilities—0.6% | |
| AEP Texas, Inc., 3.85% Sr. Unsec. Nts., 10/1/251 | | | | | 395,000 | | | | 413,059 | |
| Capex SA, 6.875% Sr. Unsec. Nts., 5/15/241 | | | | | 470,000 | | | | 492,198 | |
| Cleco Corporate Holdings LLC, 3.743% Sr. Sec. Nts., 5/1/26 | | | | | 382,000 | | | | 383,986 | |
| Duke Energy Corp.: | | | | | | | | | | |
| 3.15% Sr. Unsec. Nts., 8/15/27 | | | | | 456,000 | | | | 453,499 | |
| 3.75% Sr. Unsec. Nts., 9/1/46 | | | | | 183,000 | | | | 181,584 | |
| Edison International, 2.95% Sr. Unsec. Nts., 3/15/23 | | | | | 539,000 | | | | 540,390 | |
| EDP Finance BV, 3.625% Sr. Unsec. Nts., 7/15/241 | | | | | 608,000 | | | | 612,811 | |
| Emera US Finance LP, 2.15% Sr. Unsec. Nts., 6/15/19 | | | | | 764,000 | | | | 761,228 | |
| Enel Finance International NV, 3.625% Sr. Unsec. Nts., 5/25/271 | | | | | 462,000 | | | | 459,795 | |
| Entergy Texas, Inc., 7.125% Sec. Nts., 2/1/19 | | | | | 263,000 | | | | 276,347 | |
| Exelon Corp., 4.45% Sr. Unsec. Nts., 4/15/46 | | | | | 240,000 | | | | 261,646 | |
| Indiana Michigan Power Co., Series K, 4.55% Sr. Unsec. Nts., 3/15/46 | | | | | 230,000 | | | | 263,169 | |
| Intelsat Jackson Holdings SA, 9.75% Sr. Unsec. Nts., 7/15/251 | | | | | 790,000 | | | | 762,350 | |
| ITC Holdings Corp., 5.30% Sr. Unsec. Nts., 7/1/43 | | | | | 210,000 | | | | 254,088 | |
| NextEra Energy Capital Holdings, Inc., 4.80% [US0003M+240.9] Jr. Sub. Nts., 12/1/772 | | | | | 340,000 | | | | 342,604 | |
| NextEra Energy Operating Partners LP: | | | | | | | | | | |
| 4.25% Sr. Unsec. Nts., 9/15/241 | | | | | 342,000 | | | | 348,840 | |
| 4.50% Sr. Unsec. Nts., 9/15/271 | | | | | 265,000 | | | | 264,338 | |
| PPL Capital Funding, Inc., 4.358% | | | | | | | | | | |
| [US0003M+266.5] Jr. Sub. Nts., 3/30/672 | | | | | 352,000 | | | | 349,360 | |
| PPL WEM Ltd./Western Power | | | | | | | | | | |
| Distribution Ltd., 5.375% Sr. Unsec. Unsub. Nts., 5/1/211 | | | | | 828,000 | | | | 887,945 | |
| Public Service Co. of New Mexico, 7.95% Sr. Unsec. Nts., 5/15/18 | | | | | 523,000 | | | | 533,938 | |
| Southern Co. Gas Capital Corp., 4.40% Sr. Unsec. Nts., 5/30/47 | | | | | 332,000 | | | | 356,850 | |
| Southern Power Co., 1.95% Sr. Unsec. Nts., 12/15/19 | | | | | 829,000 | | | | 822,477 | |
| Trans-Allegheny Interstate Line Co., 3.85% Sr. Unsec. Nts., 6/1/251 | | | | | 488,000 | | | | 506,894 | |
| | | | | | | | | 10,529,396 | |
| | | | | | | | | | | |
Gas Utilities—0.1% | |
| Ferrellgas LP/Ferrellgas Finance Corp.: | | | | | | | | | | |
| 6.50% Sr. Unsec. Nts., 5/1/21 | | | | | 660,000 | | | | 621,225 | |
| 6.75% Sr. Unsec. Nts., 6/15/23 | | | | | 690,000 | | | | 636,525 | |
| | | | | | | | | | |
| | | | | Principal Amount | | | Value | |
Gas Utilities (Continued) | |
| Suburban Propane Partners LP/Suburban | | | | | | | | | | |
| Energy Finance Corp., 5.875% Sr. Unsec. Nts., 3/1/27 | | | | $ | 645,000 | | | $ | 633,713 | |
| | | | | | | | | 1,891,463 | |
| | | | | | | | | | | |
Independent Power and Renewable Electricity Producers—0.8% | |
| AES Andres BV/Dominican Power | | | | | | | | | | |
| Partners/Empresa Generadora de | | | | | | | | | | |
| Electricidad Itabo SA, 7.95% Sr. Unsec. Nts., 5/11/261 | | | | | 565,000 | | | | 614,437 | |
| AES Corp., 6.00% Sr. Unsec. Nts., 5/15/26 | | | | | 980,000 | | | | 1,063,300 | |
| Azure Power Energy Ltd., 5.50% Sr. Sec. Nts., 11/3/221 | | | | | 470,000 | | | | 479,400 | |
| Calpine Corp.: | | | | | | | | | | |
| 5.25% Sr. Sec. Nts., 6/1/261 | | | | | 1,230,000 | | | | 1,210,025 | |
| 5.75% Sr. Unsec. Nts., 1/15/25 | | | | | 1,325,000 | | | | 1,263,719 | |
| Dynegy, Inc.: | | | | | | | | | | |
| 8.00% Sr. Unsec. Nts., 1/15/251 | | | | | 1,465,000 | | | | 1,593,187 | |
| 8.125% Sr. Unsec. Nts., 1/30/261 | | | | | 1,325,000 | | | | 1,452,531 | |
| GenOn Energy, Inc., 9.50% Sr. Unsec. Nts., 10/15/188 | | | | | 610,000 | | | | 488,000 | |
| Miran Mid-Atlantic Trust, 10.06% Sec. Pass-Through Certificates, Series C, 10.06%, 12/30/28 | | | | | 492,019 | | | | 499,399 | |
| NRG Energy, Inc.: | | | | | | | | | | |
| 5.75% Sr. Unsec. Nts., 1/15/281 | | | | | 535,000 | | | | 541,688 | |
| 6.625% Sr. Unsec. Nts., 1/15/27 | | | | | 665,000 | | | | 706,562 | |
| 7.25% Sr. Unsec. Nts., 5/15/26 | | | | | 1,135,000 | | | | 1,241,395 | |
| Talen Energy Supply LLC, 4.60% Sr. Unsec. Nts., 12/15/21 | | | | | 535,000 | | | | 492,200 | |
| TerraForm Power Operating LLC: | | | | | | | | | | |
| 4.25% Sr. Unsec. Nts., 1/31/231 | | | | | 670,000 | | | | 665,813 | |
| 5.00% Sr. Unsec. Nts., 1/31/281 | | | | | 400,000 | | | | 396,500 | |
| | | | | | | | | 12,708,156 | |
| | | | | | | | | | | |
Multi-Utilities—0.5% | |
| AssuredPartners, Inc., 7.00% Sr. Unsec. Nts., 8/15/251 | | | | | 330,000 | | | | 329,175 | |
| Black Hills Corp., 2.50% Sr. Unsec. Nts., 1/11/19 | | | | | 468,000 | | | | 469,390 | |
| Dominion Energy, Inc.: | | | | | | | | | | |
| 2.579% Jr. Sub. Nts., 7/1/20 | | | | | 746,000 | | | | 746,711 | |
| 4.90% Sr. Unsec. Nts., 8/1/41 | | | | | 322,000 | | | | 373,153 | |
| InterGen NV, 7.00% Sr. Sec. Nts., 6/30/231 | | | | | 1,055,000 | | | | 1,023,350 | |
| KazTransGas JSC, 4.375% Sr. Unsec. Nts., 9/26/271 | | | | | 1,280,000 | | | | 1,288,032 | |
| NGPL PipeCo LLC: | | | | | | | | | | |
| 4.875% Sr. Unsec. Nts., 8/15/271 | | | | | 395,000 | | | | 411,294 | |
| 7.768% Sr. Unsec. Nts., 12/15/371 | | | | | 650,000 | | | | 804,375 | |
| NiSource Finance Corp.: | | | | | | | | | | |
| 3.49% Sr. Unsec. Nts., 5/15/27 | | | | | 674,000 | | | | 687,163 | |
| 6.80% Sr. Unsec. Nts., 1/15/19 | | | | | 130,000 | | | | 135,890 | |
| Public Service Enterprise Group, Inc., 1.60% Sr. Unsec. Nts., 11/15/19 | | | | | 784,000 | | | | 771,346 | |
| Virginia Electric & Power Co., 2.95% Sr. Unsec. Nts., 1/15/22 | | | | | 626,000 | | | | 634,207 | |
| | | | | | | | | 7,674,086 | |
| | | | | | | | | | | |
Water Utilities—0.0% | |
Aegea Finance Sarl, 5.75% Sr. Unsec. Nts., 10/10/241 | | | | | 625,000 | | | | 637,500 | |
| Total Corporate Bonds and Notes (Cost $731,873,724) | | | | | | | | | 741,112,226 | |
| | | |
| | | | | | Shares | | | | | |
Preferred Stocks—0.7% | | | | | | | | | | |
| Allstate Corp. (The), 6.625% Non-Cum., Non-Vtg. | | | | | 12,600 | | | | 330,750 | |
| American Homes 4 Rent, 6.50% Cum. Cv., Series D, Non-Vtg. | | | | | 13,000 | | | | 355,940 | |
28 OPPENHEIMER GLOBAL STRATEGIC INCOME FUND/VA
| | | | | | | | | | |
| | | |
| | | | | | Shares | | | | Value | |
Preferred Stocks (Continued) | | | | | | | | | | |
| Arch Capital Group Ltd., 5.25% Non-Cum., Non-Vtg. | | | | | 14,375 | | | $ | 361,100 | |
| Carlyle Group LP (The), 5.875% Non-Cum., Series A, Non-Vtg. | | | | | 13,650 | | | | 346,300 | |
| Citigroup Capital XIII, 7.75% Cum., Non-Vtg. [US0003M+637]2 | | | | | 31,125 | | | | 855,315 | |
| Digital Realty Trust, Inc., 6.625% Cum., Series C, Non-Vtg. | | | | | 3,900 | | | | 107,601 | |
| Digital Realty Trust, Inc., 7.375% Cum., Non-Vtg. | | | | | 9,350 | | | | 249,364 | |
| Dominion Energy, Inc., 5.25% Cum. | | | | | 13,900 | | | | 355,423 | |
| eBay, Inc., 6.00% Cv. | | | | | 12,700 | | | | 342,138 | |
| Fifth Third Bancorp, 6.625% Non-Cum., Non- Vtg. [US0003M+371]2 | | | | | 15,900 | | | | 453,150 | |
| First Republic Bank, 7.00% Non-Cum. | | | | | 9,200 | | | | 240,396 | |
| GMAC Capital Trust I, 7.20% Jr. Sub., Non-Vtg. [US0003M+578.5]2 | | | | | 20,025 | | | | 519,649 | |
| Goldman Sachs Group, Inc. (The), 6.30% Non- Cum., Series N, Non-Vtg. | | | | | 24,775 | | | | 689,736 | |
| Hartford Financial Services Group, Inc. (The), 7.875% Jr. Sub., Non-Vtg. [US0003M+559.6]2 | | | | | 21,750 | | | | 636,405 | |
| Huntington Bancshares, Inc., 6.25% Non- Cum., Non-Vtg. | | | | | 9,800 | | | | 275,772 | |
| KeyCorp, 6.125% Non-Cum., Non-Vtg. [US0003M+389.2]2 | | | | | 28,100 | | | | 812,652 | |
| Morgan Stanley, 5.85% Non-Cum., Non-Vtg. [US0003M+349.1]2 | | | | | 20,200 | | | | 547,420 | |
| Morgan Stanley, 6.375% Non-Cum., Non-Vtg. [US0003M+370.8]2 | | | | | 19,175 | | | | 534,024 | |
| Northern Trust Corp., 5.85% Non-Cum., Non-Vtg. | | | | | 9,775 | | | | 256,691 | |
| Peabody Energy Corp., 8.50% Cv., Series A, Vtg. | | | | | 2,255 | | | | 179,002 | |
| PNC Financial Services Group, Inc. | | | | | | | | | | |
| (The), 6.125% Non-Cum., Non-Vtg. [US0003M+406.7]2 | | | | | 17,900 | | | | 506,570 | |
| Prudential Financial, Inc., 5.75% Jr. Sub. | | | | | 10,125 | | | | 255,656 | |
| Qwest Corp., 7.00% Sr. Unsec. | | | | | 19,525 | | | | 482,463 | |
| Senior Housing Properties Trust, 5.625% Sr. Unsec. | | | | | 13,925 | | | | 351,885 | |
| State Street Corp., 6.00% Non-Cum., Non-Vtg. | | | | | 18,275 | | | | 483,557 | |
| US Bancorp, 6.50% Non-Cum., Non-Vtg. [US0003M+446.8]2 | | | | | 19,100 | | | | 539,002 | |
| Ventas Realty LP/Ventas Capital Corp., 5.45% Sr. Unsec. | | | | | 15,300 | | | | 384,872 | |
| Wells Fargo & Co., 5.625% Non-Cum., Non- Vtg. | | | | | 5,000 | | | | 129,700 | |
| Wells Fargo & Co., 6.625% Non-Cum Non- Vtg. [US0003M+369]2 | | | | | 11,800 | | | | 337,716 | |
| Total Preferred Stocks (Cost $11,700,174) | | | | | | | | | 11,920,249 | |
| | | | | | | | | | | |
Common Stocks—0.2% | | | | | | | | | | |
| Arco Capital Corp. Ltd.1,9,11,15 | | | | | 690,638 | | | | — | |
| Carrizo Oil & Gas, Inc.15 | | | | | 11,001 | | | | 234,101 | |
| Dynegy, Inc.15 | | | | | 68,001 | | | | 805,812 | |
| | | | | | | | | | |
| | | |
| | | | | | Shares | | | | Value | |
Common Stocks (Continued) | | | | | | | | | | |
| JSC Astana Finance, GDR3,9,15 | | | | | 446,838 | | | $ | — | |
| Newfield Exploration Co.15 | | | | | 7,383 | | | | 232,786 | |
| Parsley Energy, Inc., Cl. A15 | | | | | 8,264 | | | | 243,292 | |
| Peabody Energy Corp.15 | | | | | 3,450 | | | | 135,827 | |
| Premier Holdings Ltd.9,15 | | | | | 18,514 | | | | — | |
| Quicksilver Resources, Inc.9,15 | | | | | 4,151,000 | | | | 78,263 | |
| Range Resources Corp. | | | | | 15,901 | | | | 271,271 | |
| RSP Permian, Inc.15 | | | | | 6,836 | | | | 278,088 | |
| Sabine Oil15 | | | | | 822 | | | | 39,045 | |
| Schlumberger Ltd. | | | | | 3,595 | | | | 242,267 | |
| SM Energy Co. | | | | | 12,750 | | | | 281,520 | |
| Valeant Pharmaceuticals International, Inc.15 | | | | | 32,064 | | | | 666,290 | |
| Total Common Stocks (Cost $8,422,948) | | | | | | | | | 3,508,562 | |
| | | |
| | | | | | Units | | | | | |
Rights, Warrants and Certificates—0.0% | |
| Affinion Group Wts., Strike Price $1, Exp. 11/10/229,15 | | | | | 8,584 | | | | 102,922 | |
| Sabine Oil Tranche 1 Wts., Strike Price $4.49, Exp. 8/11/2615 | | | | | 2,611 | | | | 18,277 | |
| Sabine Oil Tranche 2 Wts., Strike Price $2.72, Exp. 8/11/2615 | | | 465 | | | | 2,790 | |
| Total Rights, Warrants and Certificates (Cost $420,786) | | | | | | | 123,989 | |
| | | |
| | | | | | Principal Amount | | | | | |
Structured Securities—0.3% | |
| Deutsche Bank AG, Coriolanus Ltd. Sec. Credit Linked Bonds: | |
| 3.003%, 4/30/251,16 | | | | $ | 1,017,404 | | | | 467,799 | |
| 3.054%, 4/30/251,16 | | | | | 1,296,330 | | | | 596,048 | |
| 3.098%, 4/30/251,16 | | | | | 1,119,173 | | | | 514,592 | |
| 3.131%, 4/30/251,16 | | | | | 1,000,400 | | | | 459,980 | |
| 3.179%, 4/30/251,16 | | | | | 1,245,578 | | | | 572,712 | |
| 3.231%, 4/30/251,16 | | | | | 1,421,639 | | | | 653,664 | |
| 3.265%, 4/30/251,16 | | | | | 1,135,723 | | | | 522,201 | |
| 3.346%, 4/30/251,16 | | | | | 1,067,531 | | | | 490,847 | |
| LB Peru Trust II Certificates, Series 1998-A, 3.796%, 2/28/168,9,16 | | | | | 2,994 | | | | — | |
| Morgan Stanley, Russian Federation Total Return Linked Bonds, Series 007, Cl. VR, 5.00%, 8/22/349 | | RUB | | | 29,185,674 | | | | 223,349 | |
| Total Structured Securities (Cost $8,613,867) | | | | 4,501,192 | |
Short-Term Notes—0.6% | |
| Arab Republic of Egypt Treasury Bills: 17.17%, 8/14/1816 | | EGP | | | 80,500,000 | | | | 4,065,354 | |
| 18.696%, 2/27/1816 | | EGP | | | 54,500,000 | | | | 2,989,806 | |
| 21.693%, 1/16/1816 | | EGP | | | 48,800,000 | | | | 2,734,540 | |
| Total Short-Term Notes (Cost $9,812,961) | | | | | | | | | 9,789,700 | |
| | | |
| | | | | | Shares | | | | | |
Investment Companies—27.4% | |
| Oppenheimer Institutional Government Money Market Fund, Cl. E, 1.22%17,18 | | | | | 41,765,253 | | | | 41,765,253 | |
| Oppenheimer Master Event-Linked Bond Fund, LLC18 | | | | | 2,520,983 | | | | 38,519,475 | |
| Oppenheimer Master Loan Fund, LLC18 | | | | | 14,397,097 | | | | 242,778,840 | |
| Oppenheimer Ultra-Short Duration Fund, Cl. Y18 | | | 27,024,582 | | | | 135,393,154 | |
| Total Investment Companies (Cost $459,630,836) | | | | 458,456,722 | |
| | | | | | | | | | | | | | | | | | | | | | | | |
| | | | | | | Exercise Price | | | Expiration Date | | | | | Contracts | | | Notional Amount
(000’s) | | | |
| |
| Exchange-Traded Option Purchased—0.0% | | | | | | | | | | | | | | | | | |
| |
| S&P 500 Index Put15 (Cost $396,225) | | | | USD | | | 263.000 | | | | 2/16/18 | | | USD | | | 1,904 | | | USD 509,055 | | | 424,592 | |
| | | | | | | | |
| | | Counterparty | | | | Exercise Price | | | Expiration
Date | | | | | Contracts | | | Notional
Amount
(000’s) | | | |
| |
| Over-the-Counter Options Purchased—0.0% | | | | | | | | | | | | | | | | | |
| |
| AUD Currency Call15 | | HSBC | | NZD | | | 1.105 | | | | 3/15/18 | | | AUD | | | 20,800,000 | | | AUD 20,800 | | | 159,874 | |
| |
| BRL Currency Call15 | | BAC | | BRL | | | 3.200 | | | | 2/27/18 | | | BRL | | | 40,800,000 | | | BRL 160,000 | | | 63,281 | |
| |
29 OPPENHEIMER GLOBAL STRATEGIC INCOME FUND/VA
CONSOLIDATED STATEMENT OF INVESTMENTS Continued
| | | | | | | | | | | | | | | | | | | | | | | | |
| | | Counterparty | | | | Exercise Price | | | Expiration Date | | | | | Contracts | | | Notional
Amount
(000’s) | | Value | |
| |
| Over-the-Counter Options Purchased (Continued) | | | | | | | | | | | | | | | | | |
| |
| EUR Currency Call15 | | HSBC | | PLN | | | 4.270 | | | | 3/13/18 | | | EUR | | | 20,624,607 | | | EUR 1,002 | | $ | 79,150 | |
| |
| S&P 500 Index Put15,19 | | DEU | | USD | | | 2521.300 | | | | 3/16/18 | | | USD | | | 20,461 | | | USD 5,470,473 | | | 79,991 | |
| |
| SGD Currency Put15 | | BNP | | SGD | | | 1.354 | | | | 3/2/18 | | | SGD | | | 18,595,000 | | | SGD 67,700 | | | 32,225 | |
| |
| SX5E Index Put15 | | JPM | | EUR | | | 3407.650 | | | | 6/15/18 | | | EUR | | | 7,851 | | | EUR 27,563 | | | 2,826 | |
| | | | | | | | | | | | | | | | | | | | | | | | |
| Total Over-the-Counter Options Purchased (Cost $1,161,955) | | | | | | | | | | | | 417,347 | |
| | | | | | | | | | | | | | | | | | | | | | | | | | | | | | | | |
| | | | | | | |
| | | Counterparty | | | Pay /
Receive
Floating
Rate | | | Floating Rate | | | Fixed
Rate | | | Expiration
Date | | | Notional Amount (000’s) | | | | |
| |
| Over-the-Counter Interest Rate Swaptions Purchased—0.0% | | | | | | | | | | | | | | | | | | | | | |
| |
CAP Swap Maturing 1/24/18 Call15 | | | BAC | | | | Receive | | |
| MAX [0; (FRO1–
FRO2) – Strike
Swap Rate] |
| | | 62.500% | | | | 1/22/18 | | | | EUR | | | | 468,090 | | | | 32,648 | |
| |
| Interest Rate Swap | | | | | | | | | | | Three-Month USD | | | | | | | | | | | | | | | | | | | | | |
| Maturing 1/31/28 Call15 | | | BAC | | | | Receive | | | | BBA LIBOR | | | | 2.576 | | | | 1/25/18 | | | | USD | | | | 39,000 | | | | 27,657 | |
| |
| Interest Rate Swap | | | | | | | | | | | Six-Month GBP BBA | | | | | | | | | | | | | | | | | | | | | |
| Maturing 3/13/28 Call15 | | | BAC | | | | Receive | | | | LIBOR | | | | 1.440 | | | | 3/12/18 | | | | GBP | | | | 24,000 | | | | 125,103 | |
| |
| Interest Rate Swap | | | | | | | | | | | Six-Month EUR | | | | | | | | | | | | | | | | | | | | | |
| Maturing 6/21/48 Call15 | | | UBS | | | | Receive | | | | EURIBOR | | | | 1.610 | | | | 6/19/18 | | | | EUR | | | | 11,700 | | | | 270,130 | |
| Total Over-the-Counter Interest Rate Swaptions Purchased (Cost $1,063,619) | | | | | | | | | | | | | | | | | | | | 455,538 | |
| |
| Total Investments, at Value (Cost $1,821,274,342) | | | | 109.8% | | | | 1,835,550,988 | |
| |
| Net Other Assets (Liabilities) | | | | | | | | | | | | | | | | (9.8) | | | | (164,524,920 | ) |
| | | | | | | | | | | | | | | | | | | | | | | | | | | | |
| Net Assets | | | | | | | | | | | | | | | | | | | | | | | | | | | 100.0 | % | | $ | 1,671,026,068 | |
| | | | | | | | | | | | | | | | | | | | | | | | | | | | | | | | |
Consolidated Footnotes to Statement of Investments
1. Represents securities sold under Rule 144A, which are exempt from registration under the Securities Act of 1933, as amended. These securities have been determined to be liquid under guidelines established by the Board of Trustees. These securities amount to $477,173,775 or 28.56% of the Fund’s net assets at period end.
2. Represents the current interest rate for a variable or increasing rate security, determined as [Referenced Rate + Basis-point spread].
3. Restricted security. The aggregate value of restricted securities at period end was $10,229,177, which represents 0.61% of the Fund’s net assets. See Note 4 of the accompanying Consolidated Notes. Information concerning restricted securities is as follows:
| | | | | | | | | | | | | | | | | | | | |
| Security | | Acquisition
Dates | | | Cost | | | Value | | | | | | Unrealized
Appreciation/
(Depreciation) | |
| |
| Affinion Group, Inc., 12.50% Sr. Unsec. Nts., 11/10/22 | | | 11/8/10 –11/10/17 | | | $ | 2,102,385 | | | $ | 2,081,477 | | | | | | | $ | (20,908 | ) |
| American Greetings Corp., 7.875% Sr. Unsec. Nts., 2/15/25 | | | 2/2/17 | | | | 1,021,899 | | | | 1,106,700 | | | | | | | | 84,801 | |
| Amsted Industries, Inc., 5.00% Sr. Unsec. Nts., 3/15/22 | | | 4/14/14 – 3/1/17 | | | | 1,109,386 | | | | 1,149,400 | | | | | | | | 40,014 | |
| Credit Acceptance Auto Loan Trust, Series 2017-3A, Cl. C, 3.48%, 10/15/26 | | | 10/17/17 | | | | 564,910 | | | | 561,245 | | | | | | | | (3,665 | ) |
| Harland Clarke Holdings Corp., 6.875% Sr. Sec. Nts., 3/1/20 | | | 1/27/14 – 3/2/17 | | | | 911,064 | | | | 925,363 | | | | | | | | 14,299 | |
| JPMorgan Hipotecaria su Casita, 6.47% Sec. Nts., 8/26/35 | | | 3/21/07 | | | | 528,848 | | | | 28,803 | | | | | | | | (500,045 | ) |
| JSC Astana Finance, GDR | | | 6/5/15 | | | | — | | | | — | | | | | | | | — | |
| LBC Tank Terminals Holding Netherlands BV, 6.875% Sr. Unsec. Nts., 5/15/23 | | | 4/17/14 | | | | 491,883 | | | | 496,969 | | | | | | | | 5,086 | |
| Taylor Morrison Communities, Inc./Taylor Morrison Holdings II, Inc., 5.875% Sr. Unsec. Nts., 4/15/23 | | | 1/22/16 – 3/1/17 | | | | 1,115,987 | | | | 1,231,050 | | | | | | | | 115,063 | |
| TMS International Corp., 7.25% Sr. Unsec. Nts., 8/15/25 | | | 8/9/17 | | | | 265,000 | | | | 277,588 | | | | | | | | 12,588 | |
| Trilogy International Partners LLC/Trilogy International Finance, Inc., 8.875% Sr. Sec. Nts., 5/1/22 | | | 4/21/17 | | | | 1,034,863 | | | | 1,068,600 | | | | | | | | 33,737 | |
| West Corp., 5.375% Sr. Unsec. Nts., 7/15/22 | | | 10/30/14 – 11/3/14 | | | | 672,934 | | | | 698,769 | | | | | | | | 25,835 | |
| Zekelman Industries, Inc., 9.875% Sr. Sec. Nts., 6/15/23 | | | 12/8/16 | | | | 580,876 | | | | 603,213 | | | | | | | | 22,337 | |
| | | | | | | | |
| | | | | | $ | 10,400,035 | | | $ | 10,229,177 | | | | | | | | $ (170,858 | ) |
| | | | | | | | |
4. Interest-Only Strips represent the right to receive the monthly interest payments on an underlying pool of mortgage loans. These securities typically decline in price as interest rates decline. Most other fixed income securities increase in price when interest rates decline. The principal amount of the underlying pool represents the notional amount on which current interest is calculated. The price of these securities is typically more sensitive to changes in prepayment rates than traditional mortgage-backed securities (for example, GNMA pass-throughs). Interest rates disclosed represent current yields based upon the current cost basis and estimated timing and amount of future cash flows. These securities amount to $3,567,460 or 0.21% of the
Fund’s net assets at period end.
5. Interest rate is less than 0.0005%.
6. All or a portion of the security position is when-issued or delayed delivery to be delivered and settled after period end. See Note 4 of the accompanying Consolidated Notes.
7. This interest rate resets periodically. Interest rate shown reflects the rate in effect at period end. The rate on this variable rate security is not based on a published reference rate and spread but is determined by the issuer or agent based on current market conditions.
8. This security is not accruing income because the issuer has missed an interest payment on it and/or is not anticipated to make future interest and or principal payments. The rate shown is the contractual interest rate. See Note 4 of the accompanying Consolidated Notes.
9. The value of this security was determined using significant unobservable inputs. See Note 3 of the accompanying Consolidated Notes.
10. This bond has no contractual maturity date, is not redeemable and contractually pays an indefinite stream of interest.
11. Security received as the result of issuer reorganization.
12. All or a portion of this security is owned by the subsidiary. See Note 2 of the accompanying Consolidated Notes.
30 OPPENHEIMER GLOBAL STRATEGIC INCOME FUND/VA
Consolidated Footnotes to Statement of Investments (Continued)
13. Denotes an inflation-indexed security: coupon or principal are indexed to a consumer price index.
14. Interest or dividend is paid-in-kind, when applicable.
15. Non-income producing security.
16. Zero coupon bond reflects effective yield on the original acquisition date.
17. Rate shown is the 7-day yield at period end.
18. Is or was an affiliate, as defined in the Investment Company Act of 1940, as amended, at or during the reporting period, by virtue of the Fund owning at least 5% of the voting securities of the issuer or as a result of the Fund and the issuer having the same investment adviser. Transactions during the reporting period in which the issuer was an affiliate are as follows:
| | | | | | | | | | | | | | | | |
| | | Shares
December 31, 2016 | | | Gross Additions | | | Gross Reductions | | | Shares
December 31, 2017 | |
| |
| Oppenheimer Institutional Government Money Market Fund, Cl. E | | | 38,454,698 | | | | 589,225,400 | | | | 585,914,845 | | | | 41,765,253 | |
| Oppenheimer Master Event-Linked Bond Fund, LLC | | | 2,520,983 | | | | — | | | | — | | | | 2,520,983 | |
| Oppenheimer Master Loan Fund, LLC | | | 12,870,585 | | | | 1,526,512 | | | | — | | | | 14,397,097 | |
| Oppenheimer Ultra-Short Duration Fund, Cl. Y | | | 4,042,818 | | | | 27,692,343 | | | | 4,710,579 | | | | 27,024,582 | |
| | | | |
| | | Value | | | Income | | | Realized Gain (Loss) | | | Change in Unrealized Gain (Loss) | |
| |
| Oppenheimer Institutional Government Money Market Fund, Cl. E | | $ | 41,765,253 | | | $ | 515,600 | | | $ | — | | | $ | — | |
| Oppenheimer Master Event-Linked Bond Fund, LLC | | | 38,519,475 | | | | 2,692,115a | | | | (877,906)a | | | | (3,575,033)a | |
| Oppenheimer Master Loan Fund, LLC | | | 242,778,840 | | | | 14,088,246b | | | | (98)b | | | | (3,124,913)b | |
| Oppenheimer Ultra-Short Duration Fund, Cl. Y | | | 135,393,154 | | | | 931,758 | | | | — | | | | — | |
| | | | | | | | | | | | | | | | |
| Total | | $ | 458,456,722 | | | $ | 18,227,719 | | | $ | (878,004) | | | $ | (6,699,946) | |
| | | | | | | | | | | | | | | | |
a. Represents the amount allocated to the Fund from Oppenheimer Master Event-Linked Bond Fund, LLC.
b. Represents the amount allocated to the Fund from Oppenheimer Master Loan Fund, LLC.
19. Knock-out option becomes ineligible for exercise if at any time the price of the index is equal to or less than 2,255.90 USD.
| | | | | | | | |
| Distribution of investments representing geographic holdings, as a percentage of total investments at value, is as follows: | |
| Geographic Holdings (Unaudited) | | Value | | | Percent | |
| |
| United States | | $ | 1,485,374,148 | | | | 80.7% | |
| Brazil | | | 35,164,379 | | | | 1.9 | |
| Canada | | | 25,414,770 | | | | 1.3 | |
| Indonesia | | | 21,256,522 | | | | 1.2 | |
| United Kingdom | | | 17,829,293 | | | | 1.0 | |
| Russia | | | 16,251,083 | | | | 0.9 | |
| Mexico | | | 15,214,345 | | | | 0.8 | |
| India | | | 13,938,117 | | | | 0.8 | |
| Ukraine | | | 12,847,504 | | | | 0.7 | |
| Egypt | | | 12,747,143 | | | | 0.7 | |
| Argentina | | | 9,678,128 | | | | 0.5 | |
| Peru | | | 9,214,041 | | | | 0.5 | |
| Turkey | | | 9,123,392 | | | | 0.5 | |
| Kazakhstan | | | 8,885,376 | | | | 0.5 | |
| Netherlands | | | 8,598,809 | | | | 0.5 | |
| South Africa | | | 7,767,085 | | | | 0.4 | |
| Colombia | | | 6,654,442 | | | | 0.4 | |
| France | | | 6,144,396 | | | | 0.3 | |
| Poland | | | 5,721,886 | | | | 0.3 | |
| Ireland | | | 5,671,769 | | | | 0.3 | |
| Luxembourg | | | 5,325,039 | | | | 0.3 | |
| Chile | | | 5,136,240 | | | | 0.3 | |
| Australia | | | 5,055,242 | | | | 0.3 | |
| Germany | | | 5,032,205 | | | | 0.3 | |
| Sri Lanka | | | 4,959,880 | | �� | | 0.3 | |
| Romania | | | 4,408,630 | | | | 0.3 | |
| Dominican Republic | | | 4,109,686 | | | | 0.2 | |
| Spain | | | 4,001,072 | | | | 0.2 | |
| Uruguay | | | 3,987,738 | | | | 0.2 | |
| Belgium | | | 3,838,342 | | | | 0.2 | |
| Ivory Coast | | | 3,495,605 | | | | 0.2 | |
| Switzerland | | | 3,470,803 | | | | 0.2 | |
| Hungary | | | 3,461,827 | | | | 0.2 | |
| Malaysia | | | 3,397,879 | | | | 0.2 | |
| Bermuda | | | 2,894,756 | | | | 0.2 | |
| Italy | | | 2,670,694 | | | | 0.2 | |
| Jamaica | | | 2,658,142 | | | | 0.2 | |
| Thailand | | | 2,573,926 | | | | 0.1 | |
| Hong Kong | | | 2,325,130 | | | | 0.1 | |
| New Zealand | | | 2,290,124 | | | | 0.1 | |
| Serbia | | | 2,279,696 | | | | 0.1 | |
| United Arab Emirates | | | 2,200,696 | | | | 0.1 | |
| China | | | 2,118,251 | | | | 0.1 | |
31 OPPENHEIMER GLOBAL STRATEGIC INCOME FUND/VA
CONSOLIDATED STATEMENT OF INVESTMENTS Continued
| | | | | | | | | | | | | | | | |
| Geographic Holdings (Unaudited) (Continued) | | Value | | | | | | Percent | | | | |
| |
Croatia | | $ | 1,922,730 | | | | | | | | 0.1 | % | | | | |
Nigeria | | | 1,860,574 | | | | | | | | 0.1 | | | | | |
Iraq | | | 1,624,399 | | | | | | | | 0.1 | | | | | |
Mongolia | | | 1,496,924 | | | | | | | | 0.1 | | | | | |
Belarus | | | 1,338,019 | | | | | | | | 0.1 | | | | | |
Ecuador | | | 1,245,566 | | | | | | | | 0.1 | | | | | |
Morocco | | | 1,163,821 | | | | | | | | 0.1 | | | | | |
Senegal | | | 1,151,021 | | | | | | | | 0.1 | | | | | |
Honduras | | | 1,090,445 | | | | | | | | 0.1 | | | | | |
Bahamas | | | 1,079,800 | | | | | | | | 0.1 | | | | | |
Gabon | | | 982,414 | | | | | | | | 0.1 | | | | | |
Angola | | | 872,962 | | | | | | | | 0.1 | | | | | |
Israel | | | 729,750 | | | | | | | | 0.0 | | | | | |
Panama | | | 617,826 | | | | | | | | 0.0 | | | | | |
Portugal | | | 612,811 | | | | | | | | 0.0 | | | | | |
Norway | | | 581,236 | | | | | | | | 0.0 | | | | | |
Singapore | | | 486,570 | | | | | | | | 0.0 | | | | | |
Mauritius | | | 462,250 | | | | | | | | 0.0 | | | | | |
Guernsey | | | 386,016 | | | | | | | | 0.0 | | | | | |
Eurozone | | | 384,754 | | | | | | | | 0.0 | | | | | |
Macau | | | 272,869 | | | | | | | | 0.0 | | | | | |
| | | | |
Total | | $ | 1,835,550,988 | | | | | | | | 100.0 | % | | | | |
| | | | |
|
| Forward Currency Exchange Contracts as of December 31, 2017 |
| | | | | | | | | | | | | | | | | | | | | | | | | | | | | | | | | | | | |
| Counterparty | | Settlement Month(s) | | | Currency Purchased (000’s) | | | Currency Sold (000’s) | | | Unrealized
Appreciation | | | Unrealized
Depreciation | |
| |
BAC | | | 03/2018 | | | | AUD | | | | | | | | 21,975 | | | | USD | | | | | | | | 16,628 | | | $ | 515,486 | | | $ | — | |
BAC | | | 03/2018 | | | | CNH | | | | | | | | 9,830 | | | | USD | | | | | | | | 1,474 | | | | 28,213 | | | | — | |
BAC | | | 04/2018 | | | | IDR | | | | | | | | 122,856,000 | | | | USD | | | | | | | | 8,804 | | | | 200,891 | | | | — | |
BAC | | | 03/2018 | | | | MXN | | | | | | | | 78,300 | | | | USD | | | | | | | | 3,952 | | | | — | | | | 24,582 | |
BAC | | | 03/2018 | | | | NZD | | | | | | | | 12,110 | | | | USD | | | | | | | | 8,457 | | | | 117,137 | | | | — | |
BAC | | | 03/2018 | | | | RUB | | | | | | | | 486,900 | | | | USD | | | | | | | | 8,115 | | | | 238,114 | | | | — | |
BAC | | | 03/2018 | | | | USD | | | | | | | | 8,305 | | | | AUD | | | | | | | | 10,930 | | | | — | | | | 222,161 | |
BAC | | | 02/2018 - 04/2018 | | | | USD | | | | | | | | 21,602 | | | | IDR | | | | | | | | 300,470,000 | | | | — | | | | 442,707 | |
BAC | | | 03/2018 | | | | USD | | | | | | | | 25,103 | | | | ILS | | | | | | | | 88,100 | | | | — | | | | 295,830 | |
BAC | | | 03/2018 | | | | USD | | | | | | | | 8,821 | | | | INR | | | | | | | | 567,000 | | | | 2,515 | | | | — | |
BAC | | | 02/2018 | | | | USD | | | | | | | | 1,370 | | | | MYR | | | | | | | | 5,605 | | | | — | | | | 7,174 | |
BAC | | | 03/2018 | | | | USD | | | | | | | | 16,763 | | | | NZD | | | | | | | | 24,170 | | | | — | | | | 349,226 | |
BNP | | | 02/2018 - 06/2018 | | | | ARS | | | | | | | | 157,330 | | | | USD | | | | | | | | 8,251 | | | | — | | | | 289,897 | |
BOA | | | 03/2018 | | | | COP | | | | | | | | 11,250,000 | | | | USD | | | | | | | | 3,706 | | | | 39,163 | | | | — | |
BOA | | | 03/2018 | | | | CZK | | | | | | | | 79,800 | | | | USD | | | | | | | | 3,711 | | | | 49,430 | | | | — | |
BOA | | | 03/2018 | | | | INR | | | | | | | | 631,000 | | | | USD | | | | | | | | 9,678 | | | | 135,715 | | | | — | |
BOA | | | 03/2018 | | | | MXN | | | | | | | | 132,300 | | | | USD | | | | | | | | 6,849 | | | | — | | | | 212,875 | |
BOA | | | 03/2018 | | | | PHP | | | | | | | | 7,000 | | | | USD | | | | | | | | 138 | | | | 1,914 | | | | — | |
BOA | | | 03/2018 | | | | PLN | | | | | | | | 13,230 | | | | USD | | | | | | | | 3,691 | | | | 110,739 | | | | — | |
BOA | | | 03/2018 | | | | USD | | | | | | | | 8,516 | | | | EUR | | | | | | | | 7,040 | | | | 37,400 | | | | — | |
BOA | | | 03/2018 | | | | USD | | | | | | | | 4,448 | | | | INR | | | | | | | | 290,000 | | | | — | | | | 62,373 | |
BOA | | | 03/2018 | | | | USD | | | | | | | | 3,624 | | | | MXN | | | | | | | | 70,000 | | | | 112,632 | | | | — | |
BOA | | | 03/2018 | | | | USD | | | | | | | | 1,165 | | | | PEN | | | | | | | | 3,780 | | | | 2,280 | | | | — | |
BOA | | | 03/2018 | | | | USD | | | | | | | | 13,618 | | | | RUB | | | | | | | | 815,000 | | | | — | | | | 364,070 | |
CITNA-B | | | 01/2018 | | | | BRL | | | | | | | | 26,360 | | | | USD | | | | | | | | 7,955 | | | | 9,519 | | | | 18,018 | |
CITNA-B | | | 03/2018 | | | | EUR | | | | | | | | 7,040 | | | | USD | | | | | | | | 8,451 | | | | 26,930 | | | | — | |
CITNA-B | | | 02/2018 | | | | IDR | | | | | | | | 168,070,000 | | | | USD | | | | | | | | 12,359 | | | | 23,582 | | | | — | |
| CITNA-B | | | 03/2018 | | | | SGD | | | | | | | | 6,560 | | | | USD | | | | | | | | 4,877 | | | | 34,194 | | | | — | |
| CITNA-B | | | 01/2018 | | | | USD | | | | | | | | 7,969 | | | | BRL | | | | | | | | 26,360 | | | | 21,861 | | | | — | |
| CITNA-B | | | 01/2018 | | | | USD | | | | | | | | 2,587 | | | | EGP | | | | | | | | 48,800 | | | | — | | | | 144,612 | |
| CITNA-B | | | 02/2018 | | | | USD | | | | | | | | 690 | | | | IDR | | | | | | | | 9,378,500 | | | | — | | | | 1,316 | |
| CITNA-B | | | 03/2018 | | | | ZAR | | | | | | | | 68,900 | | | | USD | | | | | | | | 5,423 | | | | 81,386 | | | | — | |
| GSCO-OT | | | 02/2018 | | | | MYR | | | | | | | | 17,050 | | | | USD | | | | | | | | 4,173 | | | | 17,232 | | | | — | |
| GSCO-OT | | | 03/2018 | | | | USD | | | | | | | | 268 | | | | RON | | | | | | | | 1,060 | | | | — | | | | 3,823 | |
| HSBC | | | 03/2018 | | | | USD | | | | | | | | 3,946 | | | | MXN | | | | | | | | 78,100 | | | | 28,464 | | | | — | |
| JPM | | | 01/2018 | | | | BRL | | | | | | | | 26,700 | | | | USD | | | | | | | | 8,071 | | | | — | | | | 22,143 | |
| JPM | | | 03/2018 | | | | HUF | | | | | | | | 401,000 | | | | USD | | | | | | | | 1,504 | | | | 50,028 | | | | — | |
| JPM | | | 04/2018 | | | | IDR | | | | | | | | 119,819,000 | | | | USD | | | | | | | | 8,666 | | | | 115,815 | | | | — | |
| JPM | | | 03/2018 | | | | PHP | | | | | | | | 15,000 | | | | USD | | | | | | | | 297 | | | | 2,711 | | | | — | |
| JPM | | | 03/2018 | | | | RUB | | | | | | | | 250,500 | | | | USD | | | | | | | | 4,209 | | | | 88,340 | | | | — | |
| JPM | | | 03/2018 | | | | THB | | | | | | | | 147,200 | | | | USD | | | | | | | | 4,531 | | | | — | | | | 6,239 | |
| JPM | | | 03/2018 | | | | TRY | | | | | | | | 37,380 | | | | USD | | | | | | | | 9,549 | | | | 93,801 | | | | 2,846 | |
| JPM | | | 01/2018 | | | | USD | | | | | | | | 8,014 | | | | BRL | | | | | | | | 26,700 | | | | — | | | | 35,197 | |
32 OPPENHEIMER GLOBAL STRATEGIC INCOME FUND/VA
| | | | | | | | | | | | | | | | | | | | | | | | | | | | | | | | |
| Counterparty | | Settlement Month(s) | | | Currency Purchased (000’s) | | | Currency Sold (000’s) | | | Unrealized
Appreciation | | | Unrealized
Depreciation | |
| |
JPM | | | 03/2018 | | | USD | | | | | 814 | | | | CLP | | | | | | | | 519,000 | | | $ | — | | | $ | 28,688 | |
JPM | | | 03/2018 | | | USD | | | | | 1,010 | | | | CZK | | | | | | | | 21,700 | | | | — | | | | 12,803 | |
JPM | | | 03/2018 | | | USD | | | | | 10,612 | | | | EUR | | | | | | | | 8,760 | | | | 62,757 | | | | 351 | |
JPM | | | 02/2018 | | | USD | | | | | 672 | | | | IDR | | | | | | | | 9,160,000 | | | | — | | | | 2,694 | |
JPM | | | 03/2018 | | | USD | | | | | 7,136 | | | | TRY | | | | | | | | 28,270 | | | | — | | | | 153,957 | |
JPM | | | 03/2018 | | | USD | | | | | 7,040 | | | | ZAR | | | | | | | | 97,430 | | | | — | | | | 743,920 | |
TDB | | | 01/2018 - 02/2018 | | | BRL | | | | | 24,390 | | | | USD | | | | | | | | 7,414 | | | | — | | | | 66,591 | |
TDB | | | 03/2018 | | | EUR | | | | | 765 | | | | USD | | | | | | | | 907 | | | | 14,435 | | | | — | |
TDB | | | 01/2018 - 02/2018 | | | USD | | | | | 10,330 | | | | BRL | | | | | | | | 33,855 | | | | 139,911 | | | | — | |
TDB | | | 03/2018 | | | USD | | | | | 1,140 | | | | CLP | | | | | | | | 747,000 | | | | — | | | | 73,422 | |
| | | | | | | | | | | | | | | | | | | | | | | | | | | | |
| Total Unrealized Appreciation and Depreciation | | | | | | | | | | | | | | | $ | 2,402,595 | | | $ | 3,587,515 | |
| | | | | | | | | | | | | | | | | | | | | | | | | | | | |
|
| Futures Contracts as of December 31, 2017 |
| | | | | | | | | | | | | | | | | | | | | | | | | | | | |
| Description | | Buy/Sell | | | Expiration Date | | | Number of
Contracts | | | | | | Notional
Amount (000’s) | | | Value | | | Unrealized
Appreciation/
(Depreciation) | |
| |
| Euro-BOBL | | | Sell | | | | 3/08/18 | | | | 546 | | | | EUR | | | | 86,906 | | | $ | 86,220,092 | | | $ | 685,631 | |
| Euro-BUND | | | Sell | | | | 3/08/18 | | | | 254 | | | | EUR | | | | 49,663 | | | | 49,273,903 | | | | 389,114 | |
| United States Treasury Long Bonds | | | Buy | | | | 3/20/18 | | | | 138 | | | | USD | | | | 21,114 | | | | 21,114,000 | | | | (206) | |
| United States Treasury Nts., 10 yr. | | | Buy | | | | 3/20/18 | | | | 660 | | | | USD | | | | 82,117 | | | | 81,870,938 | | | | (245,863) | |
| United States Treasury Nts., 10 yr. | | | Sell | | | | 3/20/18 | | | | 324 | | | | USD | | | | 40,343 | | | | 40,191,188 | | | | 152,084 | |
| United States Treasury Nts., 2 yr. | | | Sell | | | | 3/29/18 | | | | 135 | | | | USD | | | | 28,951 | | | | 28,904,766 | | | | 46,202 | |
| United States Treasury Nts., 2 yr. | | | Buy | | | | 3/29/18 | | | | 376 | | | | USD | | | | 80,647 | | | | 80,505,126 | | | | (141,937) | |
| United States Treasury Nts., 5 yr. | | | Sell | | | | 3/29/18 | | | | 16 | | | | USD | | | | 1,861 | | | | 1,858,625 | | | | 2,833 | |
| United States Treasury Nts., 5 yr. | | | Buy | | | | 3/29/18 | | | | 438 | | | | USD | | | | 51,001 | | | | 50,879,860 | | | | (120,847) | |
| United States Ultra Bonds | | | Buy | | | | 3/20/18 | | | | 197 | | | | USD | | | | 32,839 | | | | 33,028,281 | | | | 188,997 | |
| | | | | | | | | | | | | | | | | | | | | | | | | | | | |
| | | | | | | | | | | | | | | | | | | | | | | | | | $ | 956,008 | |
| | | | | | | | | | | | | | | | | | | | | | | | | | | | |
|
| Over-the-Counter Options Written at December 31, 2017 |
| | | | | | | | | | | | | | | | | | | | | | | | | | | | | | | | | | | | |
| Description | | Counterparty | | | | | | Exercise Price | | | Expiration Date | | | | | | Number of
Contracts | | | Notional
Amount (000’s) | | | Premiums Received | | | Value | |
| |
| AUD Currency Call | | | HSBC | | | | NZD | | | | 1.128 | | | | 3/15/18 | | | | AUD | | | | (20,800,000 | ) | | | AUD 80,000 | | | $ | 62,988 | | | $ | (58,713) | |
| |
| AUD Currency Put | | | HSBC | | | | NZD | | | | 1.068 | | | | 3/15/18 | | | | AUD | | | | (20,800,000 | ) | | | AUD 80,000 | | | | 50,630 | | | | (31,947) | |
| |
| BRL Currency Put | | | BAC | | | | BRL | | | | 3.410 | | | | 2/27/18 | | | | BRL | | | | (43,477,500 | ) | | | BRL 170,500 | | | | 118,575 | | | | (146,562) | |
| |
| BRL Currency Call | | | BAC | | | | BRL | | | | 3.140 | | | | 2/27/18 | | | | BRL | | | | (40,035,000 | ) | | | BRL 157,000 | | | | 123,037 | | | | (29,346) | |
| |
| EUR Currency Put | | | HSBC | | | | PLN | | | | 4.170 | | | | 3/13/18 | | | | EUR | | | | (20,624,607 | ) | | | EUR 75,000 | | | | 77,598 | | | | (138,357) | |
| |
| EUR Currency Call | | | HSBC | | | | PLN | | | | 4.320 | | | | 3/13/18 | | | | EUR | | | | (20,624,607 | ) | | | EUR 75,000 | | | | 100,635 | | | | (43,882) | |
| |
| RUB Currency Call | | | BAC | | | | RUB | | | | 56.800 | | | | 1/11/18 | | | | RUB | | | | (774,900,000 | ) | | | RUB 3,075,000 | | | | 125,376 | | | | (14,723) | |
| |
| RUB Currency Put | | | BAC | | | | RUB | | | | 61.500 | | | | 1/11/18 | | | | RUB | | | | (839,000,000 | ) | | | RUB 2,840,000 | | | | 94,677 | | | | (5,034) | |
| |
| SGD Currency Put | | | BNP | | | | SGD | | | | 1.366 | | | | 3/2/18 | | | | SGD | | | | (18,760,000 | ) | | | SGD 68,300 | | | | 38,701 | | | | (14,614) | |
| |
| SGD Currency Call | | | BNP | | | | SGD | | | | 1.329 | | | | 3/2/18 | | | | SGD | | | | (18,250,000 | ) | | | SGD 6,645 | | | | 37,901 | | | | (59,258) | |
| | | | | | | | | | | | | | | | | | | | | | | | | | | | | | | | |
| Total Over-the-Counter Options Written | | | | | | | | | | | | | | | $ | 830,118 | | | $ | (542,436) | |
| | | | | | | | | | | | | | | | | | | | | | | | | | | | | | | | |
|
| Centrally Cleared Credit Default Swaps at December 31, 2017 |
| | | | | | | | | | | | | | | | | | | | | | | | | | | | | | | | |
| Reference Asset | | Buy/Sell
Protection | | | Fixed Rate | | | Maturity Date | | | | | | Notional Amount (000’s) | | | Premiums
Received/(Paid) | | | Value | | | Unrealized
Appreciation/
(Depreciation) | |
| |
| Federative Republic of Brazil | | | Sell | | | | 1.000% | | | | 6/20/22 | | | | USD | | | | 2,500 | | | $ | 154,768 | | | $ | (44,795) | | | $ | 109,973 | |
| |
| People’s Republic of China | | | Buy | | | | 1.000 | | | | 12/20/22 | | | | USD | | | | 4,400 | | | | 70,082 | | | | (104,295) | | | | (34,213) | |
| |
| Petrobras Global Finance BV | | | Sell | | | | 1.000 | | | | 12/20/20 | | | | USD | | | | 1,000 | | | | 10,092 | | | | (7,700) | | | | 2,392 | |
| |
| Petrobras Global Finance BV | | | Sell | | | | 1.000 | | | | 12/20/20 | | | | USD | | | | 1,000 | | | | 10,178 | | | | (7,700) | | | | 2,478 | |
| |
| Republic of Korea | | | Buy | | | | 1.000 | | | | 12/20/22 | | | | USD | | | | 6,600 | | | | 76,440 | | | | (147,108) | | | | (70,668) | |
| |
| Republic of South Africa | | | Buy | | | | 1.000 | | | | 12/20/22 | | | | USD | | | | 3,000 | | | | (133,441) | | | | 77,513 | | | | (55,928) | |
| |
| Republic of South Africa | | | Buy | | | | 1.000 | | | | 12/20/22 | | | | USD | | | | 3,000 | | | | (133,650) | | | | 77,513 | | | | (56,137) | |
| |
| Republic of Turkey | | | Buy | | | | 1.000 | | | | 12/20/22 | | | | USD | | | | 2,000 | | | | (73,364) | | | | 58,401 | | | | (14,963) | |
| | | | | | | | | | | | | | | | | | | | | | | | |
| Total Cleared Credit Default Swaps | | | | | | | $ | (18,895) | | | $ | (98,171) | | | $ | (117,066) | |
| | | | | | | | | | | | | | | | | | | | | | | | |
|
| Over-the-Counter Credit Default Swaps at December 31, 2017 |
| | | | | | | | | | | | | | | | | | | | | | | | | | | | | | | | | | | | |
| Reference Asset | | Counterparty | | | Buy/Sell
Protection | | | Fixed Rate | | | Maturity Date | | | | | | Notional Amount 000’s) | | | Premiums
Received/(Paid) | | | Value | | | Unrealized
Appreciation/
(Depreciation) | |
| |
| Federative Republic of Brazil | | | BNP | | | | Sell | | | | 1.000% | | | | 12/20/18 | | | | USD | | | | 1,190 | | | $ | 94,152 | | | $ | 6,687 | | | $ | 100,839 | |
| |
| Idbi Bank Ltd./difc Dubai | | | BAC | | | | Sell | | | | 1.000 | | | | 12/20/22 | | | | USD | | | | 1,000 | | | | 32,421 | | | | (26,675) | | | | 5,746 | |
| |
| Idbi Bank Ltd./difc Dubai | | | BNP | | | | Sell | | | | 1.000 | | | | 12/20/22 | | | | USD | | | | 1,000 | | | | 30,175 | | | | (26,675) | | | | 3,500 | |
| |
| Oriental Republic of Uruguay | | | BOA | | | | Sell | | | | 1.000 | | | | 12/20/21 | | | | USD | | | | 2,697 | | | | 48,743 | | | | 23,545 | | | | 72,288 | |
| |
| State Bank of India | | | BNP | | | | Sell | | | | 1.000 | | | | 9/20/19 | | | | USD | | | | 1,740 | | | | 71,791 | | | | 21,565 | | | | 93,356 | |
| | | | | | | | | | | | | | | | | | | | | | | | | | | | |
| Total Over-the-Counter Credit Default Swaps | | | | | | | | | | | $ | 277,282 | | | $ | (1,553) | | | $ | 275,729 | |
| | | | | | | | | | | | | | | | | | | | | | | | | | | | |
33 OPPENHEIMER GLOBAL STRATEGIC INCOME FUND/VA
CONSOLIDATED STATEMENT OF INVESTMENTS Continued
The table that follows shows the undiscounted maximum potential payment by the Fund related to selling credit protection in credit default swaps:
| | | | | | | | | | | | |
Type of Reference Asset on which the Fund Sold Protection | | Total Maximum Potential Payments
for Selling Credit Protection
(Undiscounted) | | | Amount Recoverable* | | | Reference Asset Rating
Range**(Unaudited) | |
| |
| Non-Investment Grade Corporate Debt | | $ | 4,000,000 | | | $ | — | | | | BB+ to BB | |
| Investment Grade Single Name Corporate Debt | | | 1,740,000 | | | | — | | | | BBB- | |
| Investment Grade Sovereign Debt | | | 2,697,000 | | | | — | | | | BBB | |
| Non-Investment Grade Sovereign Debt | | | 3,690,000 | | | | — | | | | BB | |
| | | | | | | | | | | | |
| Total USD | | $ | 12,127,000 | | | $ | — | | | | | |
| | | | | | | | | | | | |
*The Fund has no amounts recoverable from related purchased protection. In addition, the Fund has no recourse provisions under the credit derivatives and holds no collateral which can offset or reduce potential payments under a triggering event.
**The period end reference asset security ratings, as rated by any rating organization, are included in the equivalent Standard & Poor’s rating category. The reference asset rating represents the likelihood of a potential credit event on the reference asset which would result in a related payment by the Fund.
|
|
| Centrally Cleared Interest Rate Swaps at December 31, 2017 |
| | | | | | | | | | | | | | | | | | | | | | | | | | | | |
| Counterparty | | Pay/Receive
Floating Rate | | Floating Rate | | Fixed Rate | | | Maturity Date | | | | | | Notional
Amount
(000’s) | | | Value | | | Unrealized
Appreciation/
(Depreciation) | |
| | | | Three-Month USD | | | | | | | | | | | | | | | | | | | | | | | | |
| BAC | | Receive | | BBA LIBOR | | | 1.839% | | | | 8/24/22 | | | | USD | | | | 33,566 | | | $ | 403,984 | | | $ | 403,984 | |
| |
| | | | Six-Month JPY BBA | | | | | | | | | | | | | | | | | | | | | | | | |
| BAC | | Receive | | LIBOR | | | 0.296 | | | | 11/29/27 | | | | JPY | | | | 4,654,000 | | | | 145,880 | | | | 145,880 | |
| |
| | | | Three-Month USD | | | | | | | | | | | | | | | | | | | | | | | | |
| BAC | | Receive | | BBA LIBOR | | | 2.203 | | | | 5/31/22 | | | | USD | | | | 90,985 | | | | 189,524 | | | | 189,524 | |
| |
| | | | Six-Month PLN | | | | | | | | | | | | | | | | | | | | | | | | |
| CITNA-B | | Pay | | WIBOR WIBO | | | 2.990 | | | | 11/17/27 | | | | PLN | | | | 5,770 | | | | 10,181 | | | | 10,181 | |
| |
| CITNA-B | | Pay | | MXN TIIE BANXICO | | | 6.600 | | | | 6/21/22 | | | | MXN | | | | 284,240 | | | | (719,740) | | | | (719,740) | |
| |
| CITNA-B | | Pay | | BZDI | | | 11.710 | | | | 1/4/21 | | | | BRL | | | | 16,750 | | | | 366,685 | | | | 366,685 | |
| |
| | | | Six-Month HUF | | | | | | | | | | | | | | | | | | | | | | | | |
| CITNA-B | | Pay | | BUBOR | | | 1.390 | | | | 1/25/22 | | | | HUF | | | | 784,000 | | | | 136,293 | | | | 136,293 | |
| |
| | | | Three-Month ZAR | | | | | | | | | | | | | | | | | | | | | | | | |
| DEU | | Receive | | JIBAR SAFEX | | | 8.310 | | | | 6/29/26 | | | | ZAR | | | | 28,050 | | | | (74,958) | | | | (74,958) | |
| |
| | | | Three-Month ZAR | | | | | | | | | | | | | | | | | | | | | | | | |
| DEU | | Pay | | JIBAR SAFEX | | | 7.675 | | | | 2/21/22 | | | | ZAR | | | | 26,465 | | | | 36,368 | | | | 36,368 | |
| |
| DEU | | Pay | | BZDI | | | 10.570 | | | | 1/4/21 | | | | BRL | | | | 15,500 | | | | 185,385 | | | | 185,385 | |
| |
| DEU | | Pay | | MXN TIIE BANXICO | | | 7.380 | | | | 2/18/22 | | | | MXN | | | | 182,700 | | | | (163,336) | | | | (163,336) | |
| |
| | | | Three-Month ZAR | | | | | | | | | | | | | | | | | | | | | | | | |
| JPM | | Pay | | JIBAR SAFEX | | | 7.930 | | | | 11/27/22 | | | | ZAR | | | | 55,000 | | | | 117,120 | | | | 117,120 | |
| | | | | | | | | | | | | | | | | | | | | | | | |
| Total of Centrally Cleared Interest Rate Swaps | | | | | | | | | | | | | | | | | | $ | 633,386 | | | $ | 633,386 | |
| | | | | | | | | | | | | | | | | | | | | | | | |
|
|
| Over-the-Counter Interest Rate Swaps at December 31, 2017 |
| | | | | | | | | | | | | | | | | | | | | | | | | | | | | | | | | | | | |
| Counterparty | |
| Pay/Receive
Floating Rate |
| | | Floating Rate | | | | Fixed Rate | | | | Maturity Date | | | | | | |
| Notional
Amount
(000’s) |
| |
| Premiums Received
/ (Paid) |
| | | Value | | |
| Unrealized
Appreciation/
(Depreciation) |
|
| |
| | | | | |
| Six-Month INR
FBIL MIBOR OIS |
| | | | | | | | | | | | | | | | | | | | | | | | | | | | |
| BOA | | | Pay | | | | Compound | | | | 6.330% | | | | 1/31/22 | | | | INR | | | | 210,000 | | | $ | — | | | $ | (12,441) | | | $ | (12,441) | |
| |
| | | | | | | Three-Month KRW CD | | | | | | | | | | | | | | | | | | | | | | | | | | | | | |
| BOA | | | Receive | | | | KSDA | | | | 1.860 | | | | 3/6/24 | | | | KRW | | | | 4,472,500 | | | | 18 | | | | 68,307 | | | | 68,325 | |
| |
| | | | | | | Six-Month THB | | | | | | | | | | | | | | | | | | | | | | | | | | | | | |
| BOA | | | Pay | | | | THBFIX | | | | 1.765 | | | | 10/17/22 | | | | THB | | | | 477,530 | | | | — | | | | (50,005) | | | | (50,005) | |
| |
| | | | | | | Six-Month THB | | | | | | | | | | | | | | | | | | | | | | | | | | | | | |
| BOA | | | Pay | | | | THBFIX | | | | 2.200 | | | | 3/20/22 | | | | THB | | | | 99,500 | | | | — | | | | 62,487 | | | | 62,487 | |
| |
| | | | | | | Three-Month COP IBR | | | | | | | | | | | | | | | | | | | | | | | | | | | | | |
| CITNA-B | | | Pay | | | | OIS Compound | | | | 5.370 | | | | 3/24/20 | | | | COP | | | | 13,032,090 | | | | — | | | | 84,963 | | | | 84,963 | |
| |
| | | | | | | 1 Time COP IBR OIS | | | | | | | | | | | | | | | | | | | | | | | | | | | | | |
| CITNA-B | | | Receive | | | | Compound | | | | 4.490 | | | | 8/14/18 | | | | COP | | | | 53,300,000 | | | | — | | | | (18,169) | | | | (18,169) | |
| |
| | | | | | | 1 Time COP IBR OIS | | | | | | | | | | | | | | | | | | | | | | | | | | | | | |
| CITNA-B | | | Receive | | | | Compound | | | | 5.870 | | | | 3/24/18 | | | | COP | | | | 40,160,110 | | | | — | | | | (77,435) | | | | (77,435) | |
| |
| | | | | | | 1 Time COP IBR OIS | | | | | | | | | | | | | | | | | | | | | | | | | | | | | |
| CITNA-B | | | Pay | | | | Compound | | | | 4.580 | | | | 5/14/19 | | | | COP | | | | 27,560,000 | | | | — | | | | 38,166 | | | | 38,166 | |
| |
| | | | | | | Three-Month KRW CD | | | | | | | | | | | | | | | | | | | | | | | | | | | | | |
| DEU | | | Pay | | | | KSDA | | | | 1.480 | | | | 4/20/18 | | | | KRW | | | | 102,630,000 | | | | (189) | | | | (22,342) | | | | (22,531) | |
| |
| | | | | | | Three-Month COP IBR | | | | | | | | | | | | | | | | | | | | | | | | | | | | | |
| GSCOI | | | Pay | | | | OIS Compound | | | | 5.530 | | | | 1/17/19 | | | | COP | | | | 20,871,770 | | | | — | | | | 109,378 | | | | 109,378 | |
| |
| | | | | | | Six-Month THB | | | | | | | | | | | | | | | | | | | | | | | | | | | | | |
| JPM | | | Pay | | | | THBFIX | | | | 2.603 | | | | 3/24/27 | | | | THB | | | | 53,200 | | | | — | | | | 57,296 | | | | 57,296 | |
| |
| | | | | | | Three-Month MYR | | | | | | | | | | | | | | | | | | | | | | | | | | | | | |
| JPM | | | Receive | | | | KLIBOR BNM | | | | 4.005 | | | | 2/21/22 | | | | MYR | | | | 13,230 | | | | — | | | | (16,445) | | | | (16,445) | |
34 OPPENHEIMER GLOBAL STRATEGIC INCOME FUND/VA
|
|
| Over-the-Counter Interest Rate Swaps (Continued) |
| | | | | | | | | | | | | | | | | | | | | | | | | | | | | | | | | | | | |
| Counterparty | |
| Pay/Receive
Floating Rate |
| | | Floating Rate | | | | Fixed Rate | | | | Maturity Date | | | | | | |
| Notional
Amount
(000’s) |
| |
| Premiums Received
/ (Paid) |
| | | Value | | |
| Unrealized
Appreciation/
(Depreciation) |
|
| |
| | | | | | | Three-Month MYR | | | | | | | | | | | | | | | | | | | | | | | | | | | | | |
| SCB | | | Pay | | | | KLIBOR BNM | | | | 3.310% | | | | 8/19/21 | | | | MYR | | | | 45,000 | | | $ | — | | | $ | (207,924) | | | $ | (207,924) | |
| | | | | | | | | | | | | | | | | | | | | | | | | | | | |
| Total of Over-the-Counter Interest Rate Swaps | | | | | | | | | | | | | | | | | | | $ | (171) | | | $ | 15,836 | | | $ | 15,665 | |
| | | | | | | | | | | | | | | | | | | | | | | | | | | | |
|
|
| Over-the-Counter Total Return Swaps at December 31, 2017 |
| | | | | | | | | | | | | | | | | | | | | | | | | | | | | | | | |
| Reference Asset | | Counterparty | | | Pay/Receive Total
Return* | | | Floating Rate | | | Maturity Date | | | | | | Notional
Amount
(000’s) | | | Value | | | Unrealized
Appreciation/
(Depreciation) | |
| |
| | | | | | | | | | | One-Month USD BBA | | | | | | | | | | | | | | | | | | | | | |
| PowerShares Senior Loan | | | | | | | | | | | LIBOR plus 30 basis | | | | | | | | | | | | | | | | | | | | | |
| Exchange Traded Fund | | | CITNA-B | | | | Receive | | | | points | | | | 1/12/18 | | | | USD | | | | 16,694 | | | $ | 28,394 | | | $ | 28,394 | |
* Fund will pay or receive the total return of the reference asset depending on whether the return is positive or negative. For contracts where the Fund has elected to receive the total return of the reference asset if positive, it will be responsible for paying the floating rate and the total return of the reference asset if negative. If the Fund has elected to pay the total return of the reference asset if positive, it will receive the floating rate and the total return of the reference asset if negative.
|
|
| Over-the-Counter Interest Rate Swaptions Written at December 31, 2017 |
| | | | | | | | | | | | | | | | | | | | | | | | | | | | | | | | | | | | | | | | |
| Description | | Counterparty | | | Pay/Receive
Floating Rate | | | Floating Rate | | | Fixed Rate | | | Expiration
Date | | | | | | | | | Notional Amount
(000’s) | | | Premiums Received | | | Value | |
| |
| Interest Rate Swap Maturing 1/31/28 Call | | | BAC | | | | Pay | | |
| Three-Month
USD BBA
LIBOR |
| | | 2.776% | | | | 1/25/18 | | | | USD | | | | | | | | 78,000 | | | $ | 250,900 | | | $ | (6,919) | |
| |
| Interest Rate Swap Maturing 3/13/28 Call | | | BAC | | | | Pay | | |
| Six-Month GBP
BBA LIBOR |
| | | 1.690 | | | | 3/12/18 | | | | GBP | | | | | | | | 24,000 | | | | 169,234 | | | | (20,998) | |
| | | | | | | | | | | | | | | | | | | | | | | | | | | | | | | | | | | | |
| Total Over-the-Counter Interest Rate Swaptions Written | | | | | | | | | | | | | | | | | | | | | | | $ | 420,134 | | | $ | (27,917) | |
| | | | | | | | | | | | | | | | | | | | | | | | | | | | | | | | | | | | |
| | |
| Glossary: | | |
| Counterparty Abbreviations | | |
| BAC | | Barclays Bank plc |
| BNP | | BNP Paribas |
| BOA | | Bank of America NA |
| CITNA-B | | Citibank NA |
| DEU | | Deutsche Bank AG |
| GSCOI | | Goldman Sachs International |
| GSCO-OT | | Goldman Sachs Bank USA |
| HSBC | | HSBC Bank USA NA |
| JPM | | JPMorgan Chase Bank NA |
| SCB | | Standard Chartered Bank |
| TDB | | Toronto Dominion Bank |
| UBS | | UBS AG |
|
| Currency abbreviations indicate amounts reporting in currencies |
| ARS | | Argentine Peso |
| AUD | | Australian Dollar |
| BRL | | Brazilian Real |
| CLP | | Chilean Peso |
| CNH | | Offshore ChineseRenminbi |
| COP | | Colombian Peso |
| CZK | | Czech Koruna |
| EGP | | Egyptian Pounds |
| EUR | | Euro |
| GBP | | British Pound Sterling |
| HUF | | Hungarian Forint |
| IDR | | Indonesian Rupiah |
| ILS | | Israeli Shekel |
| INR | | Indian Rupee |
| JPY | | Japanese Yen |
| KRW | | South Korean Won |
| MXN | | Mexican Nuevo Peso |
| MYR | | Malaysian Ringgit |
| NZD | | New Zealand Dollar |
| PEN | | Peruvian New Sol |
| PHP | | Philippine Peso |
| PLN | | Polish Zloty |
| RON | | New Romanian Leu |
| RUB | | Russian Ruble |
| SGD | | Singapore Dollar |
35 OPPENHEIMER GLOBAL STRATEGIC INCOME FUND/VA
CONSOLIDATED STATEMENT OF INVESTMENTS Continued
| | |
| Currency abbreviations indicate amounts reporting in currencies (Continued) |
| THB | | Thailand Baht |
| TRY | | New Turkish Lira |
| UYU | | Uruguay Peso |
| ZAR | | South African Rand |
|
| Definitions |
| 30YR CMT | | 30 Year Constant Maturity Treasury |
| BAXICO | | Banco de Mexico |
| BBA LIBOR | | British Bankers’ Association London - Interbank Offered Rate |
| BNM | | Bank Negra Malaysia |
| BOBL | | German Federal Obligation |
| BUBOR | | Budapest Interbank Offered Rate |
| BUND | | German Federal Obligation |
| BZDI | | Brazil Interbank Deposit Rate |
| CD | | Certificate of Deposit |
| EURIBOR | | Euro Interbank Offered Rate |
| FBIL | | Financial Benchmarks India Private Ltd. |
| FRO1 | | Floating Rate Option 30 yr. Rate |
| FRO2 | | Floating Rate Option 10 yr. Rate |
| H15T5Y | | US Treasury Yield Curve Rate T Note Constant Maturity 5 Year |
| H15T10Y | | US Treasury Yield Curve Rate T Note Constant Maturity 10 Year |
| H15T1Y | | US Treasury Yield Curve Rate T Note Constant Maturity 1 Year |
| IBR | | Indicador Bancario de Referencia |
| ICE LIBOR | | Intercontinental Exchange London Interbank Offered Rate |
| KLIBOR | | Kuala Lumpur Interbank Offered Rate |
| KSDA | | Korean Securities Dealers Assn. |
| JIBAR SAFEX | | South Africa Johannesburg Interbank Agreed Rate/Futures Exchange |
| LIBOR | | London Interbank Offered Rate |
| LIBOR01M | | ICE LIBOR USD 1 Month |
| LIBOR12 | | London Interbank Offered Rate-Monthly |
| LIBOR4 | | London Interbank Offered Rate-Quarterly |
| MIBOR | | Mumbai Interbank Offered Rate |
| OIS | | Overnight Index Swap |
| S&P | | Standard & Poor’s |
| SX5E | | The EURO STOXX 50 Index |
| THBFIX | | Thai Baht Interest Rate Fixing |
| TIIE | | Interbank Equilibrium Interest Rate |
| US0001M | | ICE LIBOR USD 1 Month |
| US0003M | | ICE LIBOR USD 3 Month |
| USISDA05 | | USD ICE Swap Rate 11:00am NY 5 Year |
| USSW5 | | USD Swap Semi 30/360 5 Year |
| WIBOR WIBO | | Poland Warsaw Interbank Offer Bid Rate |
See accompanying Notes to Consolidated Financial Statements.
36 OPPENHEIMER GLOBAL STRATEGIC INCOME FUND/VA
CONSOLIDATED STATEMENT OF ASSETS AND LIABILITIES December 31, 2017
| | | | |
| Assets | | | |
| Investments, at value—see accompanying consolidated statement of investments: | | | | |
| Unaffiliated companies (cost $1,361,643,506) | | $ | 1,377,094,266 | |
| Affiliated companies (cost $459,630,836) | | | 458,456,722 | |
| | | | 1,835,550,988 | |
| Cash | | | 16,389,188 | |
| Cash—foreign currencies (cost $2,264,813) | | | 2,282,640 | |
| Cash used for collateral on futures | | | 3,355,000 | |
| Cash used for collateral on OTC derivatives | | | 2,034,000 | |
| Cash used for collateral on centrally cleared swaps | | | 5,833,060 | |
| Unrealized appreciation on forward currency exchange contracts | | | 2,402,595 | |
| Swaps, at value (premiums received $214,704) | | | 500,788 | |
| Centrally cleared swaps, at value (premiums paid $340,455) | | | 1,804,847 | |
| Receivables and other assets: | | | | |
| Interest, dividends and principal paydowns | | | 14,015,916 | |
| Investments sold (including $5,653,450 sold on a when-issued or delayed delivery basis) | | | 10,270,215 | |
| Shares of beneficial interest sold | | | 389,843 | |
| Variation margin receivable | | | 281,132 | |
| Other | | | 161,882 | |
| Total assets | | | 1,895,272,094 | |
| Liabilities | | | |
| Unrealized depreciation on forward currency exchange contracts | | | 3,587,515 | |
| Options written, at value (premiums received $830,118) | | | 542,436 | |
| Swaps, at value (net premiums received $62,407) | | | 458,111 | |
| Centrally cleared swaps, at value (premiums received $321,560) | | | 1,269,632 | |
| Swaptions written, at value (premiums received $420,134) | | | 27,917 | |
| Payables and other liabilities: | | | | |
| Investments purchased (including $215,152,818 purchased on a when-issued or delayed delivery basis) | | | 215,593,387 | |
| Shares of beneficial interest redeemed | | | 625,106 | |
| Distribution and service plan fees | | | 271,386 | |
| Trustees’ compensation | | | 123,615 | |
| Shareholder communications | | | 90,139 | |
| Other | | | 1,656,782 | |
| Total liabilities | | | 224,246,026 | |
Net Assets | | $ | 1,671,026,068 | |
| | | | |
| | | | |
| Composition of Net Assets | | | |
| Par value of shares of beneficial interest | | $ | 318,932 | |
| Additional paid-in capital | | | 1,743,302,732 | |
| Accumulated net investment income | | | 87,377,286 | |
| Accumulated net realized loss on investments and foreign currency transactions | | | (175,527,920 | ) |
| Net unrealized appreciation on investments and translation of assets and liabilities denominated in foreign currencies | | | 15,555,038 | |
Net Assets | | $ | 1,671,026,068 | |
| | | | |
| | | | |
| Net Asset Value Per Share | | | |
| Non-Service Shares: | | | | |
| Net asset value, redemption price per share and offering price per share (based on net assets of $393,336,559 and 76,639,515 shares of beneficial interest outstanding) | | | $5.13 | |
| Service Shares: | | | | |
| Net asset value, redemption price per share and offering price per share (based on net assets of $1,277,689,509 and 242,292,872 shares of beneficial interest outstanding) | | | $5.27 | |
See accompanying Notes to Consolidated Financial Statements.
37 OPPENHEIMER GLOBAL STRATEGIC INCOME FUND/VA
CONSOLIDATED STATEMENT OF OPERATIONS For the Year Ended December 31, 2017
| | | | |
Allocation of Income and Expenses from Master Funds1 | | | | |
| Net investment income allocated from Oppenheimer Master Event-Linked Bond Fund, LLC: | | | | |
| Interest | | $ | 2,685,880 | |
| Dividends | | | 6,235 | |
| Net expenses | | | (183,365 | ) |
| Net investment income allocated from Oppenheimer Master Event-Linked Bond Fund, LLC | | | 2,508,750 | |
| Net investment income allocated from Oppenheimer Master Loan Fund, LLC | | | | |
| Interest | | | 13,735,291 | |
| Dividends | | | 352,955 | |
| Net expenses | | | (821,464 | ) |
| Net investment income allocated from Oppenheimer Master Loan Fund, LLC | | | 13,266,782 | |
| Total allocation of net investment income from master funds | | | 15,775,532 | |
Investment Income | | | | |
| Interest: | | | | |
| Unaffiliated companies (net of foreign withholding taxes of $704,146) | | | 66,535,740 | |
| Fee income on when-issued securities | | | 2,053,139 | |
| Dividends: | | | | |
| Unaffiliated companies | | | 699,059 | |
| Affiliated companies | | | 1,447,358 | |
Total investment income | | | 70,735,296 | |
Expenses | | | | |
| Management fees | | | 10,357,738 | |
| Distribution and service plan fees—Service shares | | | 3,239,860 | |
| Transfer and shareholder servicing agent fees: | | | | |
| Non-Service shares | | | 400,923 | |
| Service shares | | | 1,295,935 | |
| Shareholder communications: | | | | |
| Non-Service shares | | | 53,411 | |
| Service shares | | | 172,590 | |
| Custodian fees and expenses | | | 132,321 | |
| Trustees’ compensation | | | 65,665 | |
| Borrowing fees | | | 46,107 | |
| Other | | | 436,261 | |
| Total expenses | | | 16,200,811 | |
| Less reduction to custodian expenses | | | (5,545 | ) |
| Less waivers and reimbursements of expenses | | | (1,125,339 | ) |
Net expenses | | | 15,069,927 | |
| Net Investment Income | | | 71,440,901 | |
38 OPPENHEIMER GLOBAL STRATEGIC INCOME FUND/VA
| | | | |
Realized and Unrealized Gain (Loss) | | | | |
| Net realized gain (loss) on: | | | | |
| Investment transactions in unaffiliated companies (net of foreign capital gains tax of $ 90,753) | | $ | (3,281,377 | ) |
| Option contracts written | | | 2,909,136 | |
| Futures contracts | | | 2,890,384 | |
| Foreign currency transactions | | | (145,535 | ) |
| Forward currency exchange contracts | | | 3,878,041 | |
| Short Positions | | | 8,408 | |
| Swap contracts | | | (1,700,384 | ) |
| Swaption contracts written | | | 2,568,884 | |
| Net realized loss allocated from: | | | | |
| Oppenheimer Master Event-Linked Bond Fund, LLC | | | (877,906 | ) |
| Oppenheimer Master Loan Fund, LLC | | | (98 | ) |
| Net realized gain | | | 6,249,553 | |
| Net change in unrealized appreciation/depreciation on: | | | | |
| Investment transactions in unaffiliated companies | | | 29,116,304 | |
| Translation of assets and liabilities denominated in foreign currencies | | | 9,535 | |
| Forward currency exchange contracts | | | (2,088,758 | ) |
| Futures contracts | | | 1,389,721 | |
| Option contracts written | | | (347,704 | ) |
| Swap contracts | | | 859,510 | |
| Swaption contracts written | | | 458,019 | |
| Net change in unrealized appreciation/depreciation allocated from: | | | | |
| Oppenheimer Master Event-Linked Bond Fund, LLC | | | (3,575,033 | ) |
| Oppenheimer Master Loan Fund, LLC | | | (3,124,913 | ) |
Net change in unrealized appreciation/depreciation | | | 22,696,681 | |
| Net Increase in Net Assets Resulting from Operations | | $ | 100,387,135 | |
| | | | |
1. The Fund invests in certain affiliated mutual funds that expect to be treated as partnerships for tax purposes. See Note 4 of the accompanying Consolidated Notes.
See accompanying Notes to Consolidated Financial Statements.
39 OPPENHEIMER GLOBAL STRATEGIC INCOME FUND/VA
CONSOLIDATED STATEMENTS OF CHANGES IN NET ASSETS
| | | | | | | | |
| | | Year Ended
December 31, 2017 | | | Year Ended
December 31, 2016 | |
Operations | | | | | | | | |
| Net investment income | | $ | 71,440,901 | | | $ | 66,559,264 | |
| Net realized gain (loss) | | | 6,249,553 | | | | (87,282,592 | ) |
| Net change in unrealized appreciation/depreciation | | | 22,696,681 | | | | 130,129,701 | |
| Net increase in net assets resulting from operations | | | 100,387,135 | | | | 109,406,373 | |
Dividends and/or Distributions to Shareholders | | | | | | | | |
Dividends from net investment income: | | | | | | | | |
| Non-Service shares | | | (9,178,475 | ) | | | (20,719,866 | ) |
| Service shares | | | (25,692,448 | ) | | | (61,256,620 | ) |
| | | (34,870,923 | ) | | | (81,976,486 | ) |
Beneficial Interest Transactions | | | | | | | | |
Net decrease in net assets resulting from beneficial interest transactions: | | | | | | | | |
| Non-Service shares | | | (23,313,057 | ) | | | (34,595,904 | ) |
| Service shares | | | (56,507,178 | ) | | | (112,356,578 | ) |
| | | (79,820,235 | ) | | | (146,952,482 | ) |
Net Assets | | | | | | | | |
| Total decrease | | | (14,304,023 | ) | | | (119,522,595 | ) |
| Beginning of period | | | 1,685,330,091 | | | | 1,804,852,686 | |
| End of period (including accumulated net investment income of $87,377,286 and $ 44,340,175, respectively) | | $ | 1,671,026,068 | | | $ | 1,685,330,091 | |
| | | | | | | | |
See accompanying Notes to Consolidated Financial Statements.
40 OPPENHEIMER GLOBAL STRATEGIC INCOME FUND/VA
CONSOLIDATED FINANCIAL HIGHLIGHTS
| | | | | | | | | | | | | | | | | | | | |
| Non-Service Shares | | Year Ended
December 31,
2017 | | | Year Ended
December 31,
2016 | | | Year Ended
December 31,
2015 | | | Year Ended
December 31,
2014 | | | Year Ended
December 31,
2013 | |
Per Share Operating Data | | | | | | | | | | | | | | | | | | | | |
| Net asset value, beginning of period | | | $4.94 | | | | $4.88 | | | | $5.30 | | | | $5.38 | | | | $5.67 | |
Income (loss) from investment operations: | | | | | | | | | | | | | | | | | | | | |
| Net investment income1 | | | 0.22 | | | | 0.20 | | | | 0.23 | | | | 0.26 | | | | 0.28 | |
| Net realized and unrealized gain (loss) | | | 0.09 | | | | 0.11 | | | | (0.34) | | | | (0.11) | | | | (0.29) | |
| Total from investment operations | | | 0.31 | | | | 0.31 | | | | (0.11) | | | | 0.15 | | | | (0.01) | |
Dividends and/or distributions to shareholders: | | | | | | | | | | | | | | | | | | | | |
| Dividends from net investment income | | | (0.12) | | | | (0.25) | | | | (0.31) | | | | (0.23) | | | | (0.28) | |
| Net asset value, end of period | | | $5.13 | | | | $4.94 | | | | $4.88 | | | | $5.30 | | | | $5.38 | |
| | | | | | | | | | | | | | | | | | | | |
| | | | | | | | | | | | | | | | | | | | |
Total Return, at Net Asset Value2 | | | 6.27% | | | | 6.53% | | | | (2.26)% | | | | 2.84% | | | | (0.13)% | |
| | | | | | | | | | | | | | | | | | | | |
Ratios/Supplemental Data | | | | | | | | | | | | | | | | | | | | |
| Net assets, end of period (in thousands) | | | $393,337 | | | | $401,308 | | | | $429,710 | | | | $586,951 | | | | $738,741 | |
| Average net assets (in thousands) | | | $400,945 | | | | $416,054 | | | | $510,765 | | | | $707,673 | | | | $734,707 | |
Ratios to average net assets:3,4 | | | | | | | | | | | | | | | | | | | | |
| Net investment income | | | 4.40% | | | | 4.00% | | | | 4.51% | | | | 4.73% | | | | 5.12% | |
| Expenses excluding specific expenses listed below | | | 0.82% | | | | 0.79% | | | | 0.76% | | | | 0.74% | | | | 0.74% | |
| Interest and fees from borrowings | | | 0.00%5 | | | | 0.00%5 | | | | 0.00%5 | | | | 0.00% | | | | 0.00% | |
| Total expenses6 | | | 0.82% | | | | 0.79% | | | | 0.76% | | | | 0.74% | | | | 0.74% | |
| Expenses after payments, waivers and/or reimbursements and reduction to custodian expenses | | | 0.76% | | | | 0.74% | | | | 0.73% | | | | 0.71% | | | | 0.72% | |
| Portfolio turnover rate7 | | | 74% | | | | 80% | | | | 79% | | | | 93% | | | | 107% | |
1. Per share amounts calculated based on the average shares outstanding during the period.
2. Assumes an initial investment on the business day before the first day of the fiscal period, with all dividends and distributions reinvested in additional shares on the reinvestment date, and redemption at the net asset value calculated on the last business day of the fiscal period. Total returns are not annualized for periods less than one full year. Total return information does not reflect expenses that apply at the separate account level or to related insurance products. Inclusion of these charges would reduce the total return figures for all periods shown. Returns do not reflect the deduction of taxes that a shareholder would pay on fund distributions or the redemption of fund shares.
3. Annualized for periods less than one full year.
4. Includes the Fund’s share of the allocated expenses and/or net investment income from the master funds.
5. Less than 0.005%.
6. Total expenses including indirect expenses from affiliated fund fees and expenses were as follows:
| | | | | | |
Year Ended December 31, 2017 | | | 0.83 | % | | |
Year Ended December 31, 2016 | | | 0.80 | % | | |
Year Ended December 31, 2015 | | | 0.77 | % | | |
Year Ended December 31, 2014 | | | 0.75 | % | | |
Year Ended December 31, 2013 | | | 0.74 | % | | |
7. The portfolio turnover rate excludes purchase and sale transactions of To Be Announced (TBA) mortgage-related securities as follows:
| | | | | | | | |
| | | Purchase Transactions | | | Sale Transactions | |
| |
Year Ended December 31, 2017 | | | $2,271,944,419 | | | | $2,153,905,799 | |
Year Ended December 31, 2016 | | | $1,798,210,272 | | | | $1,766,445,159 | |
Year Ended December 31, 2015 | | | $1,225,140,927 | | | | $1,266,426,777 | |
Year Ended December 31, 2014 | | | $1,348,552,640 | | | | $1,337,346,996 | |
Year Ended December 31, 2013 | | | $4,294,357,677 | | | | $4,679,296,373 | |
See accompanying Notes to Consolidated Financial Statements.
41 OPPENHEIMER GLOBAL STRATEGIC INCOME FUND/VA
CONSOLIDATED FINANCIAL HIGHLIGHTS Continued
| | | | | | | | | | | | | | | | | | | | |
| Service Shares | | Year Ended
December 31,
2017 | | | Year Ended
December 31,
2016 | | | Year Ended
December 31,
2015 | | | Year Ended
December 31,
2014 | | | Year Ended
December 31,
2013 | |
Per Share Operating Data | | | | | | | | | | | | | | | | | | | | |
| Net asset value, beginning of period | | | $5.07 | | | | $5.00 | | | | $5.42 | | | | $5.50 | | | | $5.79 | |
Income (loss) from investment operations: | | | | | | | | | | | | | | | | | | | | |
| Net investment income1 | | | 0.22 | | | | 0.19 | | | | 0.23 | | | | 0.25 | | | | 0.27 | |
| Net realized and unrealized gain (loss) | | | 0.08 | | | | 0.12 | | | | (0.35) | | | | (0.11) | | | | (0.29) | |
| Total from investment operations | | | 0.30 | | | | 0.31 | | | | (0.12) | | | | 0.14 | | | | (0.02) | |
Dividends and/or distributions to shareholders: | | | | | | | | | | | | | | | | | | | | |
| Dividends from net investment income | | | (0.10) | | | | (0.24) | | | | (0.30) | | | | (0.22) | | | | (0.27) | |
| Net asset value, end of period | | | $5.27 | | | | $5.07 | | | | $5.00 | | | | $5.42 | | | | $5.50 | |
| | | | | | | | | | | | | | | | | | | | |
| | | | | | | | | | | | | | | | | | | | |
Total Return, at Net Asset Value2 | | | 6.04% | | | | 6.27% | | | | (2.49)% | | | | 2.49% | | | | (0.37)% | |
| | | | | | | | | | | | | | | | | | | | |
Ratios/Supplemental Data | | | | | | | | | | | | | | | | | | | | |
| Net assets, end of period (in thousands) | | | $1,277,689 | | | | $1,284,022 | | | | $1,375,143 | | | | $1,551,247 | | | | $1,716,026 | |
| Average net assets (in thousands) | | | $1,295,999 | | | | $1,332,343 | | | | $1,496,350 | | | | $1,646,615 | | | | $1,794,640 | |
Ratios to average net assets:3,4 | | | | | | | | | | | | | | | | | | | | |
| Net investment income | | | 4.15% | | | | 3.75% | | | | 4.26% | | | | 4.48% | | | | 4.88% | |
| Expenses excluding specific expenses listed below | | | 1.07% | | | | 1.04% | | | | 1.01% | | | | 0.99% | | | | 0.99% | |
| Interest and fees from borrowings | | | 0.00%5 | | | | 0.00%5 | | | | 0.00%5 | | | | 0.00% | | | | 0.00% | |
| Total expenses6 | | | 1.07% | | | | 1.04% | | | | 1.01% | | | | 0.99% | | | | 0.99% | |
| Expenses after payments, waivers and/or reimbursements and reduction to custodian expenses | | | 1.01% | | | | 0.99% | | | | 0.98% | | | | 0.96% | | | | 0.97% | |
| Portfolio turnover rate7 | | | 74% | | | | 80% | | | | 79% | | | | 93% | | | | 107% | |
1. Per share amounts calculated based on the average shares outstanding during the period.
2. Assumes an initial investment on the business day before the first day of the fiscal period, with all dividends and distributions reinvested in additional shares on the reinvestment date, and redemption at the net asset value calculated on the last business day of the fiscal period. Total returns are not annualized for periods less than one full year. Total return information does not reflect expenses that apply at the separate account level or to related insurance products. Inclusion of these charges would reduce the total return figures for all periods shown. Returns do not reflect the deduction of taxes that a shareholder would pay on fund distributions or the redemption of fund shares.
3. Annualized for periods less than one full year.
4. Includes the Fund’s share of the allocated expenses and/or net investment income from the master funds.
5. Less than 0.005%.
6. Total expenses including indirect expenses from affiliated fund fees and expenses were as follows:
| | | | | | |
Year Ended December 31, 2017 | | | 1.08 | % | | |
Year Ended December 31, 2016 | | | 1.05 | % | | |
Year Ended December 31, 2015 | | | 1.02 | % | | |
Year Ended December 31, 2014 | | | 1.00 | % | | |
Year Ended December 31, 2013 | | | 0.99 | % | | |
7. The portfolio turnover rate excludes purchase and sale transactions of To Be Announced (TBA) mortgage-related securities as follows:
| | | | | | | | |
| | | Purchase Transactions | | | Sale Transactions | |
| |
Year Ended December 31, 2017 | | | $2,271,944,419 | | | | $2,153,905,799 | |
Year Ended December 31, 2016 | | | $1,798,210,272 | | | | $1,766,445,159 | |
Year Ended December 31, 2015 | | | $1,225,140,927 | | | | $1,266,426,777 | |
Year Ended December 31, 2014 | | | $1,348,552,640 | | | | $1,337,346,996 | |
Year Ended December 31, 2013 | | | $4,294,357,677 | | | | $4,679,296,373 | |
See accompanying Notes to Consolidated Financial Statements.
42 OPPENHEIMER GLOBAL STRATEGIC INCOME FUND/VA
NOTES TO CONSOLIDATED FINANCIAL STATEMENTS December 31, 2017
1. Organization
Oppenheimer Global Strategic Income Fund/VA (the “Fund”), a separate series of Oppenheimer Variable Account Funds, is a diversified open-end management investment company registered under the Investment Company Act of 1940 (“1940 Act”), as amended. The Fund’s main investment objective is to seek total return. The Fund’s investment adviser is OFI Global Asset Management, Inc. (“OFI Global” or the “Manager”), a wholly-owned subsidiary of OppenheimerFunds, Inc. (“OFI” or the “Sub-Adviser”). The Manager has entered into a sub-advisory agreement with OFI. Shares of the Fund are sold only to separate accounts of life insurance companies.
The Fund offers two classes of shares. Both classes are sold at their offering price, which is the net asset value per share, to separate investment accounts of participating insurance companies as an underlying investment for variable life insurance policies, variable annuity contracts or other investment products. The class of shares designated as Service shares is subject to a distribution and service plan. Both classes of shares have identical rights and voting privileges with respect to the Fund in general and exclusive voting rights on matters that affect that class alone. Earnings, net assets and net asset value per share may differ due to each class having its own expenses, such as transfer and shareholder servicing agent fees and shareholder communications, directly attributable to that class.
The following is a summary of significant accounting policies followed in the Fund’s preparation of financial statements in accordance with accounting principles generally accepted in the United States (“U.S. GAAP”).
2. Significant Accounting Policies
Security Valuation. All investments in securities are recorded at their estimated fair value, as described in Note 3.
Basis for Consolidation. The Fund has established a Cayman Islands exempted company, Oppenheimer Global Strategic Income Fund/VA (Cayman) Ltd., which is wholly-owned and controlled by the Fund (the “Subsidiary”). The Fund and Subsidiary are both managed by the Manager. The Fund may invest up to 25% of its total assets in the Subsidiary. The Subsidiary invests primarily in Regulation S securities. The Fund applies its investment restrictions and compliance policies and procedures, on a look-through basis, to the Subsidiary.
The financial statements have been consolidated and include accounts of the Fund and the Subsidiary. Accordingly, all inter-company transactions and balances have been eliminated. At period end, the Fund owned 51,485 shares with net assets of $4,465,296 in the Subsidiary.
Other financial information at period end:
| | | | |
Total market value of investments | | $ | 953,909 | |
Net assets | | $ | 4,465,296 | |
Net income (loss) | | $ | (42,520) | |
Net realized gain (loss) | | $ | 20,225 | |
Net change in unrealized appreciation/depreciation | | $ | 42,830 | |
Foreign Currency Translation. The books and records of the Fund are maintained in U.S. dollars. Any foreign currency amounts are translated into U.S. dollars on the following basis:
(1) Value of investment securities, other assets and liabilities — at the exchange rates prevailing at Market Close as described in Note 3.
(2) Purchases and sales of investment securities, income and expenses — at the rates of exchange prevailing on the respective dates of such transactions.
Although the net assets and the values are presented at the foreign exchange rates at Market Close, the Fund does not isolate the portion of the results of operations resulting from changes in foreign exchange rates on investments from the fluctuations arising from changes in prices of securities held. Such fluctuations are included with the net realized and unrealized gains or losses from investments shown in the Consolidated Statement of Operations.
For securities, which are subject to foreign withholding tax upon disposition, realized gains or losses on such securities are recorded net of foreign withholding tax.
Reported net realized foreign exchange gains or losses arise from sales of foreign currencies, currency gains or losses realized between the trade and settlement dates on securities transactions, the difference between the amounts of dividends, interest, and foreign withholding tax reclaims recorded on the Fund’s books, and the U.S. dollar equivalent of the amounts actually received or paid. Net unrealized foreign exchange gains and losses arise from changes in the value of assets and liabilities other than investments in securities, resulting from changes in the exchange rate.
Allocation of Income, Expenses, Gains and Losses. Income, expenses (other than those attributable to a specific class), gains and losses are allocated on a daily basis to each class of shares based upon the relative proportion of net assets represented by such class. Operating expenses directly attributable to a specific class are charged against the operations of that class.
Dividends and Distributions to Shareholders. Dividends and distributions to shareholders, which are determined in accordance with income tax regulations and may differ from U.S. GAAP, are recorded on the ex-dividend date. Income and capital gain distributions, if any, are declared and paid annually or at other times as determined necessary by the Manager.
Investment Income. Dividend income is recorded on the ex-dividend date or upon ex-dividend notification in the case of certain foreign dividends where the ex-dividend date may have passed. Non-cash dividends included in dividend income, if any, are recorded at the fair value of the securities received. Withholding taxes on foreign dividends, if any, and capital gains taxes on foreign investments, if any, have been provided for in accordance with
43 OPPENHEIMER GLOBAL STRATEGIC INCOME FUND/VA
NOTES TO CONSOLIDATED FINANCIAL STATEMENTS Continued
2. Significant Accounting Policies (Continued)
the Fund’s understanding of the applicable tax rules and regulations. Interest income, if any, is recognized on an accrual basis. Discount and premium, which are included in interest income on the Consolidated Statement of Operations, are amortized or accreted daily.
Return of Capital Estimates. Distributions received from the Fund’s investments in Master Limited Partnerships (MLPs), generally are comprised of income and return of capital. The Fund records investment income and return of capital based on estimates. Such estimates are based on historical information available from each MLP and other industry sources. These estimates may subsequently be revised based on information received from MLPs after their tax reporting periods are concluded.
Custodian Fees. “Custodian fees and expenses” in the Consolidated Statement of Operations may include interest expense incurred by the Fund on any cash overdrafts of its custodian account during the period. Such cash overdrafts may result from the effects of failed trades in portfolio securities and from cash outflows resulting from unanticipated shareholder redemption activity. The Fund pays interest to its custodian on such cash overdrafts, to the extent they are not offset by positive cash balances maintained by the Fund, at a rate equal to the Federal Funds Rate plus 2.00%. The “Reduction to custodian expenses” line item, if applicable, represents earnings on cash balances maintained by the Fund during the period. Such interest expense and other custodian fees may be paid with these earnings.
Security Transactions. Security transactions are recorded on the trade date. Realized gains and losses on securities sold are determined on the basis of identified cost.
Indemnifications. The Fund’s organizational documents provide current and former Trustees and officers with a limited indemnification against liabilities arising in connection with the performance of their duties to the Fund. In the normal course of business, the Fund may also enter into contracts that provide general indemnifications. The Fund’s maximum exposure under these arrangements is unknown as this would be dependent on future claims that may be made against the Fund. The risk of material loss from such claims is considered remote.
Federal Taxes. The Fund intends to comply with provisions of the Internal Revenue Code applicable to regulated investment companies and to distribute substantially all of its investment company taxable income, including any net realized gain on investments not offset by capital loss carryforwards, if any, to shareholders. Therefore, no federal income or excise tax provision is required. The Fund files income tax returns in U.S. federal and applicable state jurisdictions. The statute of limitations on the Fund’s tax return filings generally remains open for the three preceding fiscal reporting period ends. The Fund has analyzed its tax positions for the fiscal year ended December 31, 2017, including open tax years, and does not believe there are any uncertain tax positions requiring recognition in the Fund’s financial statements.
Subchapter M requires, among other things, that at least 90% of the Fund’s gross income be derived from securities or derived with respect to its business of investing in securities (typically referred to as “qualifying income”). Income from commodity-linked derivatives may not be treated as “qualifying income” for purposes of the 90% gross income requirement. The Internal Revenue Service (IRS) has previously issued a number of private letter rulings which conclude that income derived from commodity index-linked notes and investments in a wholly-owned subsidiary will be “qualifying income.” As a result, the Fund will gain exposure to commodities through commodity-linked notes and its wholly-owned subsidiary.
The IRS has suspended the granting of private letter rulings pending further review. As a result, there can be no assurance that the IRS will not change its position with respect to commodity-linked notes and wholly-owned subsidiaries. In addition, future legislation and guidance from the Treasury and the IRS may adversely affect the Fund’s ability to gain exposure to commodities through commodity-linked notes and its wholly-owned subsidiary.
The Fund is required to include in income for federal income tax purposes all of the subsidiary’s net income and gains whether or not such income is distributed by the subsidiary. Net income and gains from the subsidiary are generally treated as ordinary income by the Fund, regardless of the character of the subsidiary’s underlying income. Net losses from the subsidiary do not pass through to the Fund for federal income tax purposes.
The tax components of capital shown in the following table represent distribution requirements the Fund must satisfy under the income tax regulations, losses the Fund may be able to offset against income and gains realized in future years and unrealized appreciation or depreciation of securities and other investments for federal income tax purposes.
| | | | | | | | | | | | |
Undistributed Net Investment Income | | Undistributed
Long-Term
Gain | | | Accumulated
Loss
Carryforward1,2,3 | | | Net Unrealized
Appreciation
Based on cost of
Securities and
Other Investments
for Federal Income
Tax Purposes | |
| $72,639,573 | | | $— | | | | $162,638,535 | | | | $18,160,866 | |
1. At period end, the Fund had $162,638,535 of net capital loss carryforward available to offset future realized capital gains, if any, and thereby reduce future taxable gain distributions. Details of the capital loss carryforwards are included in the table below. Capital loss carryovers with no expiration, if any, must be utilized prior to those with expiration dates.
| | | | |
| Expiring | | | |
| |
| No expiration | | $ | 162,638,535 | |
2. During the reporting period, the Fund utilized $3,016,001 of capital loss carryforward to offset capital gains realized in that fiscal year.
3. During the previous reporting period, the Fund did not utilize any capital loss carryforward.
44 OPPENHEIMER GLOBAL STRATEGIC INCOME FUND/VA
2. Significant Accounting Policies (Continued)
Net investment income (loss) and net realized gain (loss) may differ for financial statement and tax purposes. The character of dividends and distributions made during the fiscal year from net investment income or net realized gains are determined in accordance with federal income tax requirements, which may differ from the character of net investment income or net realized gains presented in those financial statements in accordance with U.S. GAAP. Also, due to timing of dividends and distributions, the fiscal year in which amounts are distributed may differ from the fiscal year in which the income or net realized gain was recorded by the Fund.
Accordingly, the following amounts have been reclassified for the reporting period. Net assets of the Fund were unaffected by the reclassifications.
| | | | | | | | |
Increase to Paid-in Capital | | Increase to Accumulated
Net Investment
Income | | | Increase to Accumulated Net Realized Loss on Investments | |
| |
| $1,825 | | | $6,467,133 | | | | $6,468,958 | |
The tax character of distributions paid during the reporting periods:
| | | | | | | | |
| | | Year Ended
December 31, 2017 | | | Year Ended
December 31, 2016 | |
| |
| Distributions paid from: | | | | | | | | |
| Ordinary income | | $ | 34,870,923 | | | $ | 81,976,486 | |
The aggregate cost of securities and other investments and the composition of unrealized appreciation and depreciation of securities and other investments for federal income tax purposes at period end are noted in the following table. The primary difference between book and tax appreciation or depreciation of securities and other investments, if applicable, is attributable to the tax deferral of losses or tax realization of financial statement unrealized gain or loss.
| | | | |
Federal tax cost of securities | | $ | 1,818,322,421 | |
| Federal tax cost of other investments | | | 61,096,061 | |
| | | | |
| Total federal tax cost | | $ | 1,879,418,482 | |
| | | | |
| Gross unrealized appreciation | | $ | 52,713,199 | |
| Gross unrealized depreciation | | | (34,552,333 | ) |
| | | | |
| Net unrealized appreciation | | $ | 18,160,866 | |
| | | | |
Use of Estimates. The preparation of financial statements in conformity with U.S. GAAP requires management to make estimates and assumptions that affect the reported amounts of assets and liabilities and disclosure of contingent assets and liabilities at the date of the financial statements and the reported amounts of increases and decreases in net assets from operations during the reporting period. Actual results could differ from those estimates.
3. Securities Valuation
The Fund calculates the net asset value of its shares as of 4:00 P.M. Eastern time, on each day the New York Stock Exchange (the “Exchange”) is open for trading, except in the case of a scheduled early closing of the Exchange, in which case the Fund will calculate net asset value of the shares as of the scheduled early closing time of the Exchange.
The Fund’s Board has adopted procedures for the valuation of the Fund’s securities and has delegated the day-to-day responsibility for valuation determinations under those procedures to the Manager. The Manager has established a Valuation Committee which is responsible for determining a fair valuation for any security for which market quotations are not readily available. The Valuation Committee’s fair valuation determinations are subject to review, approval and ratification by the Fund’s Board at least quarterly or more frequently, if necessary.
Valuation Methods and Inputs
Securities are valued primarily using unadjusted quoted market prices, when available, as supplied by third party pricing services or broker-dealers.
The following methodologies are used to determine the market value or the fair value of the types of securities described below:
Equity securities traded on a securities exchange (including exchange-traded derivatives other than futures and futures options) are valued based on the official closing price on the principal exchange on which the security is traded, as identified by the Manager, prior to the time when the Fund’s assets are valued. If the official closing price is unavailable, the security is valued at the last sale price on the principal exchange on which it is traded, or if no sales occurred, the security is valued at the mean between the quoted bid and asked prices. Over-the-counter equity securities are valued at the last published sale price, or if no sales occurred, at the mean between the quoted bid and asked prices. Events occurring after the close of trading on foreign exchanges may result in adjustments to the valuation of foreign securities to more accurately reflect their fair value as of the time when the Fund’s assets are valued.
Shares of a registered investment company that are not traded on an exchange are valued at that investment company’s net asset value per share.
Corporate and government debt securities (of U.S. or foreign issuers) and municipal debt securities, short-term notes, mortgage-backed securities, collateralized mortgage obligations, and asset-backed securities are valued at the mean between the bid and asked prices utilizing evaluated prices obtained from third party pricing services or broker-dealers who may use matrix pricing methods to determine the evaluated prices. Pricing services generally price debt securities assuming orderly transactions of an institutional “round lot” size, but some trades may occur in smaller, “odd lot” sizes,
45 OPPENHEIMER GLOBAL STRATEGIC INCOME FUND/VA
NOTES TO CONSOLIDATED FINANCIAL STATEMENTS Continued
3. Securities Valuation (Continued)
sometimes at lower prices than institutional round lot trades. Standard inputs generally considered by third-party pricing vendors include reported trade data, broker-dealer price quotations, benchmark yields, issuer spreads on comparable securities, the credit quality, yield, maturity, as well as other appropriate factors.
Loans are valued at the mean between the bid and asked prices utilizing evaluated prices obtained from third party pricing services or broker-dealers. Standard inputs generally considered by third-party pricing vendors include information obtained from market participants regarding broker-dealer price quotations.
Structured securities, swaps, swaptions, and other over-the-counter derivatives are valued utilizing evaluated prices obtained from third party pricing services or broker-dealers. Standard inputs generally considered by third-party pricing vendors include market information relevant to the underlying reference asset such as the price of financial instruments, stock market indices, foreign currencies, interest rate spreads, commodities, credit spreads, credit event probabilities, index values, individual security values, forward interest rates, variable interest rates, volatility measures, and forward currency rates, or the occurrence of other specific events.
Forward foreign currency exchange contracts are valued utilizing current and forward currency rates obtained from third party pricing services. When the settlement date of a contract is an interim date for which a quotation is not available, interpolated values are derived using the nearest dated forward currency rate.
Futures contracts and futures options traded on a commodities or futures exchange will be valued at the final settlement price or official closing price on the principal exchange as reported by such principal exchange at its trading session ending at, or most recently prior to, the time when the Fund’s assets are valued.
Securities for which market quotations are not readily available, or when a significant event has occurred that would materially affect the value of the security, are fair valued either (i) by a standardized fair valuation methodology applicable to the security type or the significant event as previously approved by the Valuation Committee and the Fund’s Board or (ii) as determined in good faith by the Manager’s Valuation Committee. The Valuation Committee considers all relevant facts that are reasonably available, through either public information or information available to the Manager, when determining the fair value of a security. Those standardized fair valuation methodologies include, but are not limited to, valuing securities at the last sale price or initially at cost and subsequently adjusting the value based on: changes in company specific fundamentals, changes in an appropriate securities index, or changes in the value of similar securities which may be further adjusted for any discounts related to security-specific resale restrictions. When possible, such methodologies use observable market inputs such as unadjusted quoted prices of similar securities, observable interest rates, currency rates and yield curves. The methodologies used for valuing securities are not necessarily an indication of the risks associated with investing in those securities nor can it be assured that the Fund can obtain the fair value assigned to a security if it were to sell the security.
To assess the continuing appropriateness of security valuations, the Manager regularly compares prior day prices and sale prices to the current day prices and challenges those prices exceeding certain tolerance levels with the third party pricing service or broker source. For those securities valued by fair valuations, whether through a standardized fair valuation methodology or a fair valuation determination, the Valuation Committee reviews and affirms the reasonableness of the valuations based on such methodologies and fair valuation determinations on a regular basis after considering all relevant information that is reasonably available.
Classifications
Each investment asset or liability of the Fund is assigned a level at measurement date based on the significance and source of the inputs to its valuation. Various data inputs may be used in determining the value of each of the Fund’s investments as of the reporting period end. These data inputs are categorized in the following hierarchy under applicable financial accounting standards:
1) Level 1-unadjusted quoted prices in active markets for identical assets or liabilities (including securities actively traded on a securities exchange)
2) Level 2-inputs other than unadjusted quoted prices that are observable for the asset or liability (such as unadjusted quoted prices for similar assets and market corroborated inputs such as interest rates, prepayment speeds, credit risks, etc.)
3) Level 3-significant unobservable inputs (including the Manager’s own judgments about assumptions that market participants would use in pricing the asset or liability).
The inputs used for valuing securities are not necessarily an indication of the risks associated with investing in those securities.
The Fund classifies each of its investments in investment companies which are publicly offered as Level 1. Investment companies that are not publicly offered, if any, are classified as Level 2 in the fair value hierarchy.
The table below categorizes amounts that are included in the Fund’s Consolidated Statement of Assets and Liabilities at period end based on valuation input level:
| | | | | | | | | | | | | | | | |
| | | Level 1—
Unadjusted
Quoted Prices | | | Level 2— Other Significant
Observable Inputs | | | Level 3— Significant
Unobservable Inputs | | | Value | |
| |
Assets Table | | | | | | | | | | | | | | | | |
Investments, at Value: | | | | | | | | | | | | | | | | |
| Asset-Backed Securities | | $ | — | | | $ | 64,802,347 | | | $ | — | | | $ | 64,802,347 | |
| Mortgage-Backed Obligations | | | — | | | | 397,963,737 | | | | 51,559 | | | | 398,015,296 | |
| Foreign Government Obligations | | | — | | | | 140,031,551 | | | | — | | | | 140,031,551 | |
46 OPPENHEIMER GLOBAL STRATEGIC INCOME FUND/VA
3. Securities Valuation (Continued)
| | | | | | | | | | | | | | | | |
| | | Level 1— Unadjusted Quoted Prices | | | Level 2— Other Significant
Observable Inputs | | | Level 3— Significant Unobservable Inputs | | | Value | |
| |
| Corporate Loans | | $ | — | | | $ | 1,991,677 | | | $ | — | | | $ | 1,991,677 | |
| Corporate Bonds and Notes | | | — | | | | 741,083,420 | | | | 28,806 | | | | 741,112,226 | |
| Preferred Stocks | | | 11,920,249 | | | | — | | | | — | | | | 11,920,249 | |
| Common Stocks | | | 3,391,254 | | | | 39,045 | | | | 78,263 | | | | 3,508,562 | |
| Rights, Warrants and Certificates | | | — | | | | 21,067 | | | | 102,922 | | | | 123,989 | |
| Structured Securities | | | — | | | | 4,277,843 | | | | 223,349 | | | | 4,501,192 | |
| Short-Term Notes | | | — | | | | 9,789,700 | | | | — | | | | 9,789,700 | |
| Investment Companies | | | 177,158,407 | | | | 281,298,315 | | | | — | | | | 458,456,722 | |
| Exchange-Traded Option Purchased | | | 424,592 | | | | — | | | | — | | | | 424,592 | |
| Over-the-Counter Options Purchased | | | — | | | | 417,347 | | | | — | | | | 417,347 | |
| Over-the-Counter Interest Rate Swaptions Purchased | | | — | | | | 455,538 | | | | — | | | | 455,538 | |
| | | | |
| Total Investments, at Value | | | 192,894,502 | | | | 1,642,171,587 | | | | 484,899 | | | | 1,835,550,988 | |
| Other Financial Instruments: | | | | | | | | | | | | | | | | |
| Swaps, at value | | | — | | | | 500,788 | | | | — | | | | 500,788 | |
| Centrally cleared swaps, at value | | | — | | | | 1,804,847 | | | | — | | | | 1,804,847 | |
| Futures contracts | | | 1,464,861 | | | | — | | | | — | | | | 1,464,861 | |
| Forward currency exchange contracts | | | — | | | | 2,402,595 | | | | — | | | | 2,402,595 | |
| | | | |
Total Assets | | $ | 194,359,363 | | | $ | 1,646,879,817 | | | $ | 484,899 | | | $ | 1,841,724,079 | |
| | | | |
| | | | |
Liabilities Table | | | | | | | | | | | | | | | | |
Other Financial Instruments: | | | | | | | | | | | | | | | | |
| Swaps, at value | | $ | — | | | $ | (458,111 | ) | | $ | — | | | $ | (458,111 | ) |
| Centrally cleared swaps, at value | | | — | | | | (1,269,632 | ) | | | — | | | | (1,269,632 | ) |
| Futures contracts | | | (508,853 | ) | | | — | | | | — | | | | (508,853 | ) |
| Options written, at value | | | — | | | | (542,436 | ) | | | — | | | | (542,436 | ) |
| Forward currency exchange contracts | | | — | | | | (3,587,515 | ) | | | — | | | | (3,587,515 | ) |
| Swaptions written, at value | | | — | | | | (27,917 | ) | | | — | | | | (27,917 | ) |
| | | | |
Total Liabilities | | $ | (508,853 | ) | | $ | (5,885,611 | ) $ | | | — | | | $ | (6,394,464 | ) |
| | | | |
Forward currency exchange contracts and futures contracts, if any, are reported at their unrealized appreciation/depreciation at measurement date, which represents the change in the contract’s value from trade date. All additional assets and liabilities included in the above table are reported at their market value at measurement date.
4. Investments and Risks
Risks of Foreign Investing. The Fund may invest in foreign securities which are subject to special risks. Securities traded in foreign markets may be less liquid and more volatile than those traded in U.S. markets. Foreign issuers are usually not subject to the same accounting and disclosure requirements that U.S. companies are subject to, which may make it difficult for the Fund to evaluate a foreign company’s operations or financial condition. A change in the value of a foreign currency against the U.S. dollar will result in a change in the U.S. dollar value of investments denominated in that foreign currency and in the value of any income or distributions the Fund may receive on those investments. The value of foreign investments may be affected by exchange control regulations, foreign taxes, higher transaction and other costs, delays in the settlement of transactions, changes in economic or monetary policy in the United States or abroad, expropriation or nationalization of a company’s assets, or other political and economic factors. In addition, due to the inter-relationship of global economies and financial markets, changes in political and economic factors in one country or region could adversely affect conditions in another country or region. Investments in foreign securities may also expose the Fund to time-zone arbitrage risk. Foreign securities may trade on weekends or other days when the Fund does not price its shares. At times, the Fund may emphasize investments in a particular country or region and may be subject to greater risks from adverse events that occur in that country or region. Foreign securities and foreign currencies held in foreign banks and securities depositories may be subject to limited or no regulatory oversight.
Investments in Affiliated Funds. The Fund is permitted to invest in other mutual funds advised by the Manager (“Affiliated Funds”). Affiliated Funds are open-end management investment companies registered under the 1940 Act, as amended. The Manager is the investment adviser of, and the Sub-Adviser provides investment and related advisory services to, the Affiliated Funds. When applicable, the Fund’s investments in Affiliated Funds are included in the Consolidated Statement of Investments. Shares of Affiliated Funds are valued at their net asset value per share. As a shareholder, the Fund is subject to its proportional share of the Affiliated Funds’ expenses, including their management fee. The Manager will waive fees and/or reimburse Fund expenses in an amount equal to the indirect management fees incurred through the Fund’s investment in the Affiliated Funds.
Each of the Affiliated Funds in which the Fund invests has its own investment risks, and those risks can affect the value of the Fund’s investments and therefore the value of the Fund’s shares. To the extent that the Fund invests more of its assets in one Affiliated Fund than in another, the Fund will have greater exposure to the risks of that Affiliated Fund.
Investments in Money Market Instruments. The Fund is permitted to invest its free cash balances in money market instruments to provide liquidity or for defensive purposes. The Fund may invest in money market instruments by investing in Class E shares of Oppenheimer Institutional Government
47 OPPENHEIMER GLOBAL STRATEGIC INCOME FUND/VA
NOTES TO CONSOLIDATED FINANCIAL STATEMENTS Continued
4. Investments and Risks (Continued)
Money Market Fund (“IGMMF”), which is an Affiliated Fund. IGMMF is regulated as a money market fund under the 1940 Act, as amended. The Fund may also invest in money market instruments directly or in other affiliated or unaffiliated money market funds.
Investment in Oppenheimer Master Funds. The Fund is permitted to invest in entities sponsored and/or advised by the Manager or an affiliate. Certain of these entities in which the Fund invests are mutual funds registered under the 1940 Act, as amended, that expect to be treated as partnerships for tax purposes, specifically Oppenheimer Master Loan Fund, LLC (“Master Loan”) and Oppenheimer Master Event-Linked Bond Fund, LLC (“Master Event-Linked Bond”) (the “Master Funds”). Each Master Fund has its own investment risks, and those risks can affect the value of the Fund’s investments and therefore the value of the Fund’s shares. To the extent that the Fund invests more of its assets in one Master Fund than in another, the Fund will have greater exposure to the risks of that Master Fund.
The investment objective of Master Loan is to seek income. The investment objective of Master Event-Linked Bond is to seek total return. The Fund’s investments in the Master Funds are included in the Consolidated Statement of Investments. The Fund recognizes income and gain/(loss) on its investments in each Master Fund according to its allocated pro-rata share, based on its relative proportion of total outstanding Master Fund shares held, of the total net income earned and the net gain/(loss) realized on investments sold by the Master Funds. As a shareholder, the Fund is subject to its proportional share of the Master Funds’ expenses, including their management fee. The Manager will waive fees and/or reimburse Fund expenses in an amount equal to the indirect management fees incurred through the Fund’s investment in the Master Funds. The Fund owns 16.7% of Master Loan and 14.0% of Master Event-Linked Bond at period end.
Structured Securities. The Fund invests in structured securities whose market values, interest rates and/or redemption prices are linked to the performance of underlying foreign currencies, interest rate spreads, stock market indices, prices of individual securities, commodities or other financial instruments or the occurrence of other specific events. The structured securities are often leveraged, increasing the volatility of each note’s market value relative to the change in the underlying linked financial element or event. Fluctuations in value of these securities are recorded as unrealized gains and losses in the accompanying Consolidated Statement of Operations. The Fund records a realized gain or loss when a structured security is sold or matures.
Loans. The Fund invests in loans made to U.S. and foreign borrowers that are corporations, partnerships or other business entities. The Fund will do so directly as an original lender or by assignment or indirectly through participation agreements or certain derivative instruments. While many of these loans will be collateralized, the Fund can also invest in uncollateralized loans. Loans are often issued in connection with recapitalizations, acquisitions, leveraged buyouts, and refinancing of borrowers. The loans often pay interest at rates that float above (or are adjusted periodically based on) a benchmark that reflects current interest rates although the Fund can also invest in loans with fixed interest rates.
When investing in loans, the Fund generally will have a contractual relationship only with the lender, not with the relevant borrower. As a result, the Fund generally will have the right to receive payments of principal, interest, and any fees to which it is entitled only from the lender selling the participation and only upon receipt by the lender of the payments from the relevant borrower. The Fund may not directly benefit from the collateral supporting the debt obligation in which it has purchased the participation. As a result, the Fund will assume the credit risk of both the borrower and the institution selling the participation to the Fund.
Securities on a When-Issued or Delayed Delivery Basis. The Fund may purchase securities on a “when-issued” basis, and may purchase or sell securities on a “delayed delivery” basis. “When-issued” or “delayed delivery” refers to securities whose terms and indenture are available and for which a market exists, but which are not available for immediate delivery. Delivery and payment for securities that have been purchased by the Fund on a when-issued basis normally takes place within six months and possibly as long as two years or more after the trade date. During this period, such securities do not earn interest, are subject to market fluctuation and may increase or decrease in value prior to their delivery. The purchase of securities on a when-issued basis may increase the volatility of the Fund’s net asset value to the extent the Fund executes such transactions while remaining substantially fully invested. When the Fund engages in when-issued or delayed delivery transactions, it relies on the buyer or seller, as the case may be, to complete the transaction. Their failure to do so may cause the Fund to lose the opportunity to obtain or dispose of the security at a price and yield it considers advantageous. The Fund may also sell securities that it purchased on a when-issued basis or forward commitment prior to settlement of the original purchase.
At period end, the Fund had purchased securities issued on a when-issued or delayed delivery basis and sold securities issued on a delayed delivery basis as follows:
| | | | |
| | | When-Issued or
Delayed Delivery
Basis Transactions | |
| |
| Purchased securities | | | $215,152,818 | |
| Sold securities | | | 5,653,450 | |
The Fund may enter into “forward roll” transactions with respect to mortgage-related securities. In this type of transaction, the Fund sells a mortgage-related security to a buyer and simultaneously agrees to repurchase a similar security (same type, coupon and maturity) at a later date at a set price. During the period between the sale and the repurchase, the Fund will not be entitled to receive interest and principal payments on the securities that have been sold. The Fund records the incremental difference between the forward purchase and sale of each forward roll as realized gain (loss) on investments or as fee income in the case of such transactions that have an associated fee in lieu of a difference in the forward purchase and sale price.
48 OPPENHEIMER GLOBAL STRATEGIC INCOME FUND/VA
4. Investments and Risks (Continued)
Forward roll transactions may be deemed to entail embedded leverage since the Fund purchases mortgage-related securities with extended settlement dates rather than paying for the securities under a normal settlement cycle. This embedded leverage increases the Fund’s market value of investments relative to its net assets which can incrementally increase the volatility of the Fund’s performance. Forward roll transactions can be replicated over multiple settlement periods.
Risks of entering into forward roll transactions include the potential inability of the counterparty to meet the terms of the agreement; the potential of the Fund to receive inferior securities at redelivery as compared to the securities sold to the counterparty; and counterparty credit risk.
At period end, the counterparty pledged $18,000 of collateral to the Fund for forward roll transactions.
Restricted Securities. At period end, investments in securities included issues that are restricted. A restricted security may have a contractual restriction on its resale and is valued under methods approved by the Board of Trustees as reflecting fair value. Securities that are restricted are marked with an applicable footnote on the Consolidated Statement of Investments. Restricted securities are reported on a schedule following the Consolidated Statement of Investments.
Equity Security Risk. Stocks and other equity securities fluctuate in price. The value of the Fund’s portfolio may be affected by changes in the equity markets generally. Equity markets may experience significant short-term volatility and may fall sharply at times. Different markets may behave differently from each other and U.S. equity markets may move in the opposite direction from one or more foreign stock markets. Adverse events in any part of the equity or fixed-income markets may have unexpected negative effects on other market segments.
The prices of individual equity securities generally do not all move in the same direction at the same time and a variety of factors can affect the price of a particular company’s securities. These factors may include, but are not limited to, poor earnings reports, a loss of customers, litigation against the company, general unfavorable performance of the company’s sector or industry, or changes in government regulations affecting the company or its industry.
Credit Risk. The Fund invests in high-yield, non-investment-grade bonds, which may be subject to a greater degree of credit risk. Credit risk relates to the ability of the issuer to meet interest or principal payments or both as they become due. The Fund may acquire securities that have missed an interest payment, and is not obligated to dispose of securities whose issuers or underlying obligors subsequently miss an interest and/or principal payment.
Information concerning securities not accruing interest at period end is as follows:
| | | | |
Cost | | | $2,543,506 | |
Market Value | | | $488,003 | |
Market Value as % of Net Assets | | | 0.03% | |
Sovereign Debt Risk. The Fund invests in sovereign debt securities, which are subject to certain special risks. These risks include, but are not limited to, the risk that a governmental entity may delay or refuse, or otherwise be unable, to pay interest or repay the principal on its sovereign debt. There may also be no legal process for collecting sovereign debt that a government does not pay or bankruptcy proceedings through which all or part of such sovereign debt may be collected. In addition, a restructuring or default of sovereign debt may also cause additional impacts to the financial markets, such as downgrades to credit ratings, reduced liquidity and increased volatility, among others.
Shareholder Concentration. At period end, three shareholders each owned 20% or more of the Fund’s total outstanding shares.
Related parties may include, but are not limited to, the investment manager and its affiliates, affiliated broker dealers, fund of funds, and directors or employees. Related parties owned 21% of the Fund’s total outstanding shares at period end.
5. Market Risk Factors
The Fund’s investments in securities and/or financial derivatives may expose the Fund to various market risk factors:
Commodity Risk. Commodity risk relates to the change in value of commodities or commodity indexes as they relate to increases or decreases in the commodities market. Commodities are physical assets that have tangible properties. Examples of these types of assets are crude oil, heating oil, metals, livestock, and agricultural products.
Credit Risk. Credit risk relates to the ability of the issuer of debt to meet interest and principal payments, or both, as they come due. In general, lower-grade, higher-yield debt securities are subject to credit risk to a greater extent than lower-yield, higher-quality securities.
Equity Risk. Equity risk relates to the change in value of equity securities as they relate to increases or decreases in the general market.
Foreign Exchange Rate Risk. Foreign exchange rate risk relates to the change in the U.S. dollar value of a security held that is denominated in a foreign currency. The U.S. dollar value of a foreign currency denominated security will decrease as the dollar appreciates against the currency, while the U.S. dollar value will increase as the dollar depreciates against the currency.
Interest Rate Risk. Interest rate risk refers to the fluctuations in value of fixed-income securities resulting from the inverse relationship between price and yield. For example, an increase in general interest rates will tend to reduce the market value of already issued fixed-income investments, and a decline in general interest rates will tend to increase their value. In addition, debt securities with longer maturities, which tend to have higher yields, are subject to potentially greater fluctuations in value from changes in interest rates than obligations with shorter maturities.
Volatility Risk. Volatility risk refers to the magnitude of the movement, but not the direction of the movement, in a financial instrument’s price over a defined time period. Large increases or decreases in a financial instrument’s price over a relative time period typically indicate greater volatility risk,
49 OPPENHEIMER GLOBAL STRATEGIC INCOME FUND/VA
NOTES TO CONSOLIDATED FINANCIAL STATEMENTS Continued
5. Market Risk Factors (Continued)
while small increases or decreases in its price typically indicate lower volatility risk.
6. Use of Derivatives
The Fund’s investment objective not only permits the Fund to purchase investment securities, it also allows the Fund to enter into various types of derivatives contracts, including, but not limited to, futures contracts, forward currency exchange contracts, credit default swaps, interest rate swaps, total return swaps, variance swaps and purchased and written options. In doing so, the Fund will employ strategies in differing combinations to permit it to increase, decrease, or change the level or types of exposure to market risk factors. These instruments may allow the Fund to pursue its objectives more quickly and efficiently than if it were to make direct purchases or sales of securities capable of effecting a similar response to market factors. Such contracts may be entered into through a bilateral over-the-counter (“OTC”) transaction, or through a securities or futures exchange and cleared through a clearinghouse.
Derivatives may have little or no initial cash investment relative to their market value exposure and therefore can produce significant gains or losses in excess of their cost due to changes in the market risk factors and the overall market. This use of embedded leverage allows the Fund to increase its market value exposure relative to its net assets and can substantially increase the volatility of the Fund’s performance. In instances where the Fund is using derivatives to decrease, or hedge, exposures to market risk factors for securities held by the Fund, there are also risks that those derivatives may not perform as expected resulting in losses for the combined or hedged positions. Some derivatives have the potential for unlimited loss, regardless of the size of the Fund’s initial investment.
Additional associated risks from investing in derivatives also exist and potentially could have significant effects on the valuation of the derivative and the Fund. Typically, the associated risks are not the risks that the Fund is attempting to increase or decrease exposure to, per its investment objectives, but are the additional risks from investing in derivatives. Examples of these associated risks are liquidity risk, which is the risk that the Fund will not be able to sell the derivative in the open market in a timely manner, and counterparty credit risk, which is the risk that the counterparty will not fulfill its obligation to the Fund.
The Fund’s actual exposures to these market risk factors and associated risks during the period are discussed in further detail, by derivative type, below.
Forward Currency Exchange Contracts
The Fund may enter into forward currency exchange contracts (“forward contracts”) for the purchase or sale of a foreign currency at a negotiated rate at a future date. Such contracts are traded in the OTC inter-bank currency dealer market.
Forward contracts are reported on a schedule following the Consolidated Statement of Investments. The unrealized appreciation (depreciation) is reported in the Consolidated Statement of Assets and Liabilities as a receivable (or payable) and in the Consolidated Statement of Operations within the change in unrealized appreciation (depreciation). At contract close, the difference between the original cost of the contract and the value at the close date is recorded as a realized gain (loss) in the Consolidated Statement of Operations.
The Fund may enter into forward foreign currency exchange contracts in order to decrease exposure to foreign exchange rate risk associated with either specific transactions or portfolio instruments or to increase exposure to foreign exchange rate risk.
During the reporting period, the Fund had daily average contract amounts on forward contracts to buy and sell of $352,585,839 and $341,315,541, respectively.
Additional associated risk to the Fund includes counterparty credit risk. Counterparty credit risk arises from the possibility that the counterparty to a forward contract will default and fail to perform its obligations to the Fund.
Futures Contracts
A futures contract is a commitment to buy or sell a specific amount of a commodity, financial instrument or currency at a negotiated price on a stipulated future date. The Fund may buy and sell futures contracts and may also buy or write put or call options on these futures contracts. Futures contracts and options thereon are generally entered into on a regulated futures exchange and cleared through a clearinghouse associated with the exchange.
Upon entering into a futures contract, the Fund is required to deposit either cash or securities (initial margin) in an amount equal to a certain percentage of the contract value in an account registered in the futures commission merchant’s name. Subsequent payments (variation margin) are paid to or from the futures commission merchant each day equal to the daily changes in the contract value. Such payments are recorded as unrealized gains and losses. Should the Fund fail to make requested variation margin payments, the futures commission merchant can gain access to the initial margin to satisfy the Fund’s payment obligations.
Futures contracts are reported on a schedule following the Consolidated Statement of Investments. Securities held by a futures commission merchant to cover initial margin requirements on open futures contracts are noted in the Consolidated Statement of Investments. Cash held by a futures commission merchant to cover initial margin requirements on open futures contracts and the receivable and/or payable for the daily mark to market for the variation margin are noted in the Consolidated Statement of Assets and Liabilities. The net change in unrealized appreciation and depreciation is reported in the Consolidated Statement of Operations. Realized gains (losses) are reported in the Consolidated Statement of Operations at the closing or expiration of futures contracts.
The Fund may purchase and/or sell financial futures contracts and options on futures contracts to gain exposure to, or decrease exposure to interest rate risk, equity risk, foreign exchange rate risk, volatility risk, or commodity risk.
During the reporting period, the Fund had an ending monthly average market value of $241,628,401 and $91,902,278 on futures contracts purchased and sold, respectively.
50 OPPENHEIMER GLOBAL STRATEGIC INCOME FUND/VA
6. Use of Derivatives (Continued)
Additional associated risks of entering into futures contracts (and related options) include the possibility that there may be an illiquid market where the Fund is unable to liquidate the contract or enter into an offsetting position and, if used for hedging purposes, the risk that the price of the contract will correlate imperfectly with the prices of the Fund’s securities.
Option Activity
The Fund may buy and sell put and call options, or write put and call options. When an option is written, the Fund receives a premium and becomes obligated to sell or purchase the underlying security, currency or other underlying financial instrument at a fixed price, upon exercise of the option.
Options can be traded through an exchange or through a privately negotiated arrangement with a dealer in an OTC transaction. Options traded through an exchange are generally cleared through a clearinghouse (such as The Options Clearing Corporation). The difference between the premium received or paid, and market value of the option, is recorded as unrealized appreciation or depreciation. The net change in unrealized appreciation or depreciation is reported in the Consolidated Statement of Operations. When an option is exercised, the cost of the security purchased or the proceeds of the security sale are adjusted by the amount of premium received or paid. Upon the expiration or closing of the option transaction, a gain or loss is reported in the Consolidated Statement of Operations.
Foreign Currency Options. The Fund may purchase or write call and put options on currencies to increase or decrease exposure to foreign exchange rate risk. A purchased call, or written put option becomes more valuable as the price of the underlying financial instrument appreciates relative to the strike price. A purchased put, or written call option becomes more valuable as the price of the underlying financial instrument depreciates relative to the strike price.
Interest Rate Options. The Fund may purchase or write call and put options on treasury and/or euro futures to increase or decrease exposure to interest rate risk. A purchased call or written put option becomes more valuable as the price of the underlying financial instrument appreciates relative to the strike price. A purchased put or written call option becomes more valuable as the price of the underlying financial instrument depreciates relative to the strike price.
Index/Security Options. The Fund may purchase or write call and put options on individual equity securities and/or equity indexes to increase or decrease exposure to equity risk. A purchased call or written put option becomes more valuable as the price of the underlying financial instrument appreciates relative to the strike price. A purchased put or written call option becomes more valuable as the price of the underlying financial instrument depreciates relative to the strike price.
During the reporting period, the Fund had an ending monthly average market value of $499,557 and $676,045 on purchased call options and purchased put options, respectively.
Options written, if any, are reported in a schedule following the Consolidated Statement of Investments and as a liability in the Consolidated Statement of Assets and Liabilities. Securities held in collateral accounts to cover potential obligations with respect to outstanding written options are noted in the Consolidated Statement of Investments.
The risk in writing a call option is the market price of the underlying security increasing above the strike price and the option being exercised. The Fund must then purchase the underlying security at the higher market price and deliver it for the strike price or, if it owns the underlying security, deliver it at the strike price and forego any benefit from the increase in the price of the underlying security above the strike price. The risk in writing a put option is the market price of the underlying security decreasing below the strike price and the option being exercised. The Fund must then purchase the underlying security at the strike price when the market price of the underlying security is below the strike price. Alternatively, the Fund could also close out a written option position, in which case the risk is that the closing transaction will require a premium to be paid by the Fund that is greater than the premium the Fund received. When writing options, the Fund has the additional risk that there may be an illiquid market where the Fund is unable to close the contact. The risk in buying an option is that the Fund pays a premium for the option, and the option may be worth less than the premium paid or expire worthless.
During the reporting period, the Fund had an ending monthly average market value of $746,313 and $501,392 on written call options and written put options, respectively.
Additional associated risks to the Fund include counterparty credit risk and liquidity risk.
Swap Contracts
The Fund may enter into swap contract agreements with a counterparty to exchange a series of cash flows based on either specified reference rates, the price or volatility of asset or non-asset references, or the occurrence of a credit event, over a specified period. Swaps can be executed in a bi-lateral privately negotiated arrangement with a dealer in an OTC transaction (“OTC swaps”) or executed on a regulated market. Certain swaps, regardless of the venue of their execution, are required to be cleared through a clearinghouse (“centrally cleared swaps”). Swap contracts may include interest rate, equity, debt, index, total return, credit default, currency, and volatility swaps.
Swap contracts are reported on a schedule following the Consolidated Statement of Investments. The values of centrally cleared swap and OTC swap contracts are aggregated by positive and negative values and disclosed separately on the Consolidated Statement of Assets and Liabilities. The unrealized appreciation (depreciation) related to the change in the valuation of the notional amount of the swap is combined with the accrued interest due to (owed by) the Fund, if any, at termination or settlement. The net change in this amount during the period is included on the Consolidated Statement of Operations. The Fund also records any periodic payments received from (paid to) the counterparty, including at termination, under such contracts as realized gain (loss) on the Consolidated Statement of Operations.
Swap contract agreements are exposed to the market risk factor of the specific underlying reference rate or asset. Swap contracts are typically more attractively priced compared to similar investments in related cash securities because they isolate the risk to one market risk factor and eliminate the
51 OPPENHEIMER GLOBAL STRATEGIC INCOME FUND/VA
NOTES TO CONSOLIDATED FINANCIAL STATEMENTS Continued
6. Use of Derivatives (Continued)
other market risk factors. Investments in cash securities (for instance bonds) have exposure to multiple risk factors (credit and interest rate risk). Because swaps have embedded leverage, they can expose the Fund to substantial risk in the isolated market risk factor.
Credit Default Swap Contracts. A credit default swap is a contract that enables an investor to buy or sell protection against a defined-issuer credit event, such as the issuer’s failure to make timely payments of interest or principal on a debt security, bankruptcy or restructuring. The Fund may enter into credit default swaps either by buying or selling protection on a corporate issuer, sovereign issuer, or a basket or index of issuers (the “reference asset”).
The buyer of protection pays a periodic fee to the seller of protection based on the notional amount of the swap contract. The seller of protection agrees to compensate the buyer of protection for future potential losses as a result of a credit event on the reference asset. The contract effectively transfers the credit event risk of the reference asset from the buyer of protection to the seller of protection.
The ongoing value of the contract will fluctuate throughout the term of the contract based primarily on the credit risk of the reference asset. If the credit quality of the reference asset improves relative to the credit quality at contract initiation, the buyer of protection may have an unrealized loss greater than the anticipated periodic fee owed. This unrealized loss would be the result of current credit protection being cheaper than the cost of credit protection at contract initiation. If the buyer elects to terminate the contract prior to its maturity, and there has been no credit event, this unrealized loss will become realized. If the contract is held to maturity, and there has been no credit event, the realized loss will be equal to the periodic fee paid over the life of the contract.
If there is a credit event, the buyer of protection can exercise its rights under the contract and receive a payment from the seller of protection equal to the notional amount of the swap less the market value of specified debt securities issued by the reference asset. Upon exercise of the contract the difference between such value and the notional amount is recorded as realized gain (loss) and is included on the Consolidated Statement of Operations.
The Fund may purchase or sell credit protection through credit default swaps to increase or decrease exposure to the credit risk of individual issuers and/or indexes of issuers that are either unavailable or considered to be less attractive in the bond market.
The Fund has engaged in spread curve trades by simultaneously purchasing and selling protection through credit default swaps referenced to the same reference asset but with different maturities. Spread curve trades attempt to gain exposure to credit risk on a forward basis by realizing gains on the expected differences in spreads.
For the reporting period, the Fund had ending monthly average notional amounts of $40,375,769 and $36,750,369 on credit default swaps to buy protection and credit default swaps to sell protection, respectively.
Additional associated risks to the Fund include counterparty credit risk and liquidity risk.
Interest Rate Swap Contracts. An interest rate swap is an agreement between counterparties to exchange periodic payments based on interest rates. One cash flow stream will typically be a floating rate payment based upon a specified floating interest rate while the other is typically a fixed interest rate.
The Fund may enter into interest rate swaps in which it pays the fixed or floating interest rate in order to increase or decrease exposure to interest rate risk. Typically, if relative interest rates rise, floating payments under a swap agreement will be greater than the fixed payments.
For the reporting period, the Fund had ending monthly average notional amounts of $144,712,111 and $273,921,394 on interest rate swaps which pay a fixed rate and interest rate swaps which receive a fixed rate, respectively.
Additional associated risks to the Fund include counterparty credit risk and liquidity risk.
Total Return Swap Contracts. A total return swap is an agreement between counterparties to exchange periodic payments based on the value of asset or non-asset references. One cash flow is typically based on a non-asset reference (such as an interest rate) and the other on the total return of a reference asset (such as a security or a basket of securities or securities index). The total return of the reference asset typically includes appreciation or depreciation on the reference asset, plus any interest or dividend payments.
Total return swap contracts are exposed to the market risk factor of the specific underlying financial instrument or index. Total return swaps are less standard in structure than other types of swaps and can isolate and/or include multiple types of market risk factors including equity risk, credit risk, and interest rate risk.
The Fund may enter into total return swaps to increase or decrease exposure to the credit risk of various indexes or basket of securities. These credit risk related total return swaps require the Fund to pay to, or receive payments from, the counterparty based on the movement of credit spreads of the related indexes or securities.
For the reporting period, the Fund had ending monthly average notional amounts of $15,528,099 on total return swaps which are long the reference asset.
Additional associated risks to the Fund include counterparty credit risk and liquidity risk.
Swaption Transactions
The Fund may enter into a swaption contract which grants the purchaser the right, but not the obligation, to enter into a swap transaction at preset terms detailed in the underlying agreement within a specified period of time. The purchaser pays a premium to the swaption writer who bears the risk of unfavorable changes in the preset terms on the underlying swap.
Purchased swaptions are reported as a component of investments in the Consolidated Statement of Investments and the Consolidated Statement of Assets and Liabilities. Written swaptions are reported on a schedule following the Consolidated Statement of Investments and their value is reported as a separate asset or liability line item in the Consolidated Statement of Assets and Liabilities. The net change in unrealized appreciation or depreciation on written swaptions is separately reported in the Consolidated Statement of Operations. When a swaption is exercised, the cost of the swap is adjusted
52 OPPENHEIMER GLOBAL STRATEGIC INCOME FUND/VA
6. Use of Derivatives (Continued)
by the amount of premium paid or received. Upon the expiration or closing of an unexercised swaption contract, a gain or loss is reported in the Consolidated Statement of Operations for the amount of the premium paid or received.
The Fund generally will incur a greater risk when it writes a swaption than when it purchases a swaption. When the Fund writes a swaption it will become obligated, upon exercise of the swaption, according to the terms of the underlying agreement. Swaption contracts written by the Fund do not give rise to counterparty credit risk prior to exercise as they obligate the Fund, not its counterparty, to perform. When the Fund purchases a swaption it only risks losing the amount of the premium it paid if the swaption expires unexercised. However, when the Fund exercises a purchased swaption there is a risk that the counterparty will fail to perform or otherwise default on its obligations under the swaption contract.
The Fund may purchase swaptions which give it the option to enter into an interest rate swap in which it pays a floating or fixed interest rate and receives a fixed or floating interest rate in order to increase or decrease exposure to interest rate risk. Purchasing the fixed portion of this swaption becomes more valuable as the reference interest rate decreases relative to the preset interest rate. Purchasing the floating portion of this swaption becomes more valuable as the reference interest rate increases relative to the preset interest rate.
The Fund may write swaptions which give it the obligation, if exercised by the purchaser, to enter into an interest rate swap in which it pays a fixed or floating interest rate and receives a floating or fixed interest rate in order to increase or decrease exposure to interest rate risk. A written swaption paying a fixed rate becomes more valuable as the reference interest rate increases relative to the preset interest rate. A written swaption paying a floating rate becomes more valuable as the reference interest rate decreases relative to the preset interest rate.
During the reporting period, the Fund had an ending monthly average market value of $1,369,686 and $1,100,582 on purchased and written swaptions, respectively.
Counterparty Credit Risk. Derivative positions are subject to the risk that the counterparty will not fulfill its obligation to the Fund. The Fund intends to enter into derivative transactions with counterparties that the Manager believes to be creditworthy at the time of the transaction.
The Fund’s risk of loss from counterparty credit risk on OTC derivatives is generally limited to the aggregate unrealized gain netted against any collateral held by the Fund. For OTC options purchased, the Fund bears the risk of loss of the amount of the premiums paid plus the positive change in market values net of any collateral held by the Fund should the counterparty fail to perform under the contracts. Options written by the Fund do not typically give rise to counterparty credit risk, as options written generally obligate the Fund and not the counterparty to perform.
To reduce counterparty risk with respect to OTC transactions, the Fund has entered into master netting arrangements, established within the Fund’s International Swap and Derivatives Association, Inc. (“ISDA”) master agreements, which allow the Fund to make (or to have an entitlement to receive) a single net payment in the event of default (close-out
netting) for outstanding payables and receivables with respect to certain OTC positions in swaps, options, swaptions, and forward currency exchange contracts for each individual counterparty. In addition, the Fund may require that certain counterparties post cash and/or securities in collateral accounts to cover their net payment obligations for those derivative contracts subject to ISDA master agreements. If the counterparty fails to perform under these contracts and agreements, the cash and/or securities will be made available to the Fund.
At period end, the Fund has required certain counterparties to post collateral of $536,155.
ISDA master agreements include credit related contingent features which allow counterparties to OTC derivatives to terminate derivative contracts prior to maturity in the event that, for example, the Fund’s net assets decline by a stated percentage or the Fund fails to meet the terms of its ISDA master agreements, which would cause the Fund to accelerate payment of any net liability owed to the counterparty.
For financial reporting purposes, the Fund does not offset derivative assets and derivative liabilities that are subject to netting arrangements in the Consolidated Statement of Assets and Liabilities. Bankruptcy or insolvency laws of a particular jurisdiction may impose restrictions on or prohibitions against the right of offset in bankruptcy, insolvency or other events.
The Fund’s risk of loss from counterparty credit risk on exchange-traded derivatives cleared through a clearinghouse and for centrally cleared swaps is generally considered lower than as compared to OTC derivatives. However, counterparty credit risk exists with respect to initial and variation margin deposited/paid by the Fund that is held in futures commission merchant, broker and/or clearinghouse accounts for such exchange-traded derivatives and for centrally cleared swaps.
With respect to centrally cleared swaps, such transactions will be submitted for clearing, and if cleared, will be held in accounts at futures commission merchants or brokers that are members of clearinghouses. While brokers, futures commission merchants and clearinghouses are required to segregate customer margin from their own assets, in the event that a broker, futures commission merchant or clearinghouse becomes insolvent or goes into bankruptcy and at that time there is a shortfall in the aggregate amount of margin held by the broker, futures commission merchant or clearinghouse for all its customers, U.S. bankruptcy laws will typically allocate that shortfall on a pro-rata basis across all the broker’s, futures commission merchant’s or clearinghouse’s customers, potentially resulting in losses to the Fund.
There is the risk that a broker, futures commission merchant or clearinghouse will decline to clear a transaction on the Fund’s behalf, and the Fund may be required to pay a termination fee to the executing broker with whom the Fund initially enters into the transaction. Clearinghouses may also be permitted to terminate centrally cleared swaps at any time. The Fund is also subject to the risk that the broker or futures commission merchant will improperly use the Fund’s assets deposited/paid as initial or variation margin to satisfy payment obligations of another customer. In the event of a default by another customer of the broker or futures commission merchant, the Fund might not receive its variation margin payments from the clearinghouse, due to the manner in which variation margin payments are aggregated for all customers of the broker/futures commission merchant.
Collateral and margin requirements differ by type of derivative. Margin requirements are established by the broker, futures commission merchant or clearinghouse for exchange-traded and cleared derivatives, including centrally cleared swaps. Brokers, futures commission merchants and clearinghouses can ask for margin in excess of the regulatory minimum, or increase the margin amount, in certain circumstances.
53 OPPENHEIMER GLOBAL STRATEGIC INCOME FUND/VA
NOTES TO CONSOLIDATED FINANCIAL STATEMENTS Continued
6. Use of Derivatives (Continued)
Collateral terms are contract specific for OTC derivatives. For derivatives traded under an ISDA master agreement, the collateral requirements are typically calculated by netting the mark to market amount for each transaction under such agreement and comparing that amount to the value of any collateral currently pledged by the Fund or the counterparty.
For financial reporting purposes, cash collateral that has been pledged to cover obligations of the Fund, if any, is reported separately on the Consolidated Statement of Assets and Liabilities as cash pledged as collateral. Non-cash collateral pledged by the Fund, if any, is noted in the Consolidated Statement of Investments. Generally, the amount of collateral due from or to a party must exceed a minimum transfer amount threshold (e.g. $250,000) before a transfer has to be made. To the extent amounts due to the Fund from its counterparties are not fully collateralized, contractually or otherwise, the Fund bears the risk of loss from counterparty nonperformance.
The following table presents by counterparty the Fund’s OTC derivative assets net of the related collateral pledged by the Fund at period end:
| | | | | | | | | | | | | | | | | | | | |
| | | | | | Gross Amounts Not Offset in the Consolidated Statement of Assets &
Liabilities | | | | |
| Counterparty | | Gross Amounts Not Offset
in the Consolidated
Statement of Assets &
Liabilities* | | | Financial Instruments
Available for Offset | | | Financial Instruments Collateral Received** | | | Cash Collateral
Received** | | | Net Amount | |
| |
| Bank of America NA | | $ | 643,612 | | | $ | (643,612) | | | $ | – | | | $ | – | | | $ | – | |
| Barclays Bank plc | | | 1,351,045 | | | | (1,351,045) | | | | – | | | | – | | | | – | |
| BNP Paribas | | | 60,477 | | | | (60,477) | | | | – | | | | – | | | | – | |
| Citibank NA | | | 348,995 | | | | (259,550) | | | | – | | | | – | | | | 89,445 | |
| Deutsche Bank AG | | | 79,991 | | | | (22,342) | | | | – | | | | – | | | | 57,649 | |
| Goldman Sachs Bank USA | | | 17,232 | | | | (3,823) | | | | – | | | | – | | | | 13,409 | |
| Goldman Sachs International | | | 109,378 | | | | – | | | | – | | | | – | | | | 109,378 | |
| HSBC Bank USA, NA | | | 267,488 | | | | (267,488) | | | | – | | | | – | | | | – | |
| JPMorgan Chase Bank NA | | | 473,574 | | | | (473,574) | | | | – | | | | – | | | | – | |
| Toronto Dominion Bank | | | 154,346 | | | | (140,013) | | | | – | | | | – | | | | 14,333 | |
| UBS AG | | | 270,130 | | | | – | | | | (270,130) | | | | – | | | | – | |
| | | | |
| | $ | 3,776,268 | | | $ | (3,221,924) | | | $ | (270,130) | | | $ | – | | | $ | 284,214 | |
| | | | |
*OTC derivatives are reported gross on the Consolidated Statement of Assets and Liabilities. Exchange traded options and margin related to centrally cleared swaps and futures are excluded from these reported amounts.
**Reported collateral posted for the benefit of the Fund within this table is limited to the net outstanding amount due from an individual counterparty. The collateral posted for the benefit of the Fund may exceed these amounts.
The following table presents by counterparty the Fund’s OTC derivative liabilities net of the related collateral pledged by the Fund at period end:
| | | | | | | | | | | | | | | | | | | | |
| | | | | | Gross Amounts Not Offset in the Consolidated Statement of Assets &
Liabilities | | | | |
| Counterparty | | Gross Amounts Not Offset
in the Consolidated
Statement of Assets &
Liabilities* | | | Financial Instruments
Available for Offset | | | Financial Instruments Collateral Pledged** | | | Cash Collateral Pledged** | | | Net Amount | |
| |
| Bank of America NA | | $ | (701,764) | | | $ | 643,612 | | | $ | – | | | $ | – | | | $ | (58,152) | |
| Barclays Bank plc | | | (1,591,937) | | | | 1,351,045 | | | | – | | | | 240,892 | | | | – | |
| BNP Paribas | | | (390,444) | | | | 60,477 | | | | – | | | | 329,967 | | | | – | |
| Citibank NA | | | (259,550) | | | | 259,550 | | | | – | | | | – | | | | – | |
| Deutsche Bank AG | | | (22,342) | | | | 22,342 | | | | – | | | | – | | | | – | |
| Goldman Sachs Bank USA | | | (3,823) | | | | 3,823 | | | | – | | | | – | | | | – | |
| HSBC Bank USA, NA | | | (272,899) | | | | 267,488 | | | | – | | | | – | | | | (5,411) | |
| JPMorgan Chase Bank NA | | | (1,025,283) | | | | 473,574 | | | | – | | | | 390,000 | | | | (161,709) | |
| Standard Chartered Bank | | | (207,924) | | | | – | | | | – | | | | 207,924 | | | | – | |
| Toronto Dominion Bank | | | (140,013) | | | | 140,013 | | | | – | | | | – | | | | – | |
| | | | |
| | $ | (4,615,979) | | | $ | 3,221,924 | | | $ | – | | | $ | 1,168,783 | | | $ | (225,272) | |
| | | | |
*OTC derivatives are reported gross on the Consolidated Statement of Assets and Liabilities. Exchange traded options and margin related to centrally cleared swaps and futures are excluded from these reported amounts.
**Reported collateral pledged within this table is limited to the net outstanding amount due from the Fund. The securities pledged as collateral by the Fund as reported on the Consolidated Statements of Investments may exceed these amounts.
The following table presents the valuations of derivative instruments by risk exposure as reported within the Consolidated Statement of Assets and Liabilities at period end:
| | | | | | | | | | | | |
| | | Asset Derivatives | | | Liability Derivatives | |
Derivatives Not Accounted for as Hedging Instruments | | Consolidated Statement of Assets and Liabilities Location | | Value | | | Consolidated Statement of Assets and Liabilities Location | | Value | |
| |
Credit contracts | | Swaps, at value | | $ | 80,191 | | | Swaps, at value | | $ | 53,350 | |
54 OPPENHEIMER GLOBAL STRATEGIC INCOME FUND/VA
6. Use of Derivatives (Continued)
| | | | | | | | | | | | |
| | | Asset Derivatives | | | Liability Derivatives | |
Derivatives Not Accounted for as Hedging Instruments | | Consolidated Statement of Assets and Liabilities Location | | Value | | | Consolidated Statement of Assets and Liabilities Location | | Value | |
| |
Interest rate contracts | | Swaps, at value | | $ | 420,597 | | | Swaps, at value | | $ | 404,761 | |
Credit contracts | | Centrally cleared swaps, at value | | | 213,427 | | | Centrally cleared swaps, at value | | | 311,598 | |
Interest rate contracts | | Centrally cleared swaps, at value | | | 1,591,420 | | | Centrally cleared swaps, at value | | | 958,034 | |
Interest rate contracts | | Variation margin receivable | | | 281,132* | | | | | | | |
| | Unrealized appreciation on | | | | | | Unrealized depreciation on | | | | |
Forward currency | | forward currency exchange | | | | | | forward currency exchange | | | | |
exchange contracts | | contracts | | | 2,402,595 | | | contracts | | | 3,587,515 | |
Forward currency exchange contracts | | | | | | | | Options written, at value | | | 542,436 | |
Interest rate contracts | | | | | | | | Swaptions written, at value | | | 27,917 | |
Equity contracts | | Investments, at value | | | 507,409** | | | | | | | |
Forward currency exchange contracts | | Investments, at value | | | 334,530** | | | | | | | |
Interest rate contracts | | Investments, at value | | | 455,538** | | | | | | | |
| | | | | | | | | | | | |
Total | | | | $ | 6,286,839 | | | | | $ | 5,885,611 | |
| | | | | | | | | | | | |
*Includes only the current day’s variation margin. Prior variation margin movements have been reflected in cash on the Consolidated Statement of Assets and Liabilities upon receipt or payment.
**Amounts relate to purchased option contracts and purchased swaption contracts, if any.
The effect of derivative instruments on the Consolidated Statement of Operations is as follows:
| | | | | | | | | | | | | | | | | | | | | | | | | | | | |
| | | Amount of Realized Gain or (Loss) Recognized on Derivatives | | | | |
| |
Derivatives Not Accounted for as Hedging Instruments | | Investment
transactions in unaffiliated
companies* | | | Swaption
contracts
written | | | Option
contracts
written | | | Futures
contracts | | | Forward
currency
exchange
contracts | | | Swap contracts | | | Total | |
| |
| Credit contracts | | $ | — | | | $ | — | | | $ | — | | | $ | — | | | $ | — | | | $ | (1,414,654) | | | $ | (1,414,654) | |
| Equity contracts | | | (608,745) | | | | — | | | | 441,241 | | | | — | | | | — | | | | (39,257) | | | | (206,761) | |
| Forward currency exchange contracts | | | (1,343,313) | | | | — | | | | 2,623,403 | | | | — | | | | 3,878,041 | | | | — | | | | 5,158,131 | |
| Interest rate contracts | | | (3,254,486) | | | | 2,568,884 | | | | (155,508) | | | | 2,890,384 | | | | — | | | | (246,473) | | | | 1,802,801 | |
| | | | |
Total | | $ | (5,206,544) | | | $ | 2,568,884 | | | $ | 2,909,136 | | | $ | 2,890,384 | | | $ | 3,878,041 | | | $ | (1,700,384) | | | $ | 5,339,517 | |
| | | | |
*Includes purchased option contracts and purchased swaption contracts, if any.
| | | | | | | | | | | | | | | | | | | | | | | | | | | | |
| | | Amount of Change in Unrealized Gain or (Loss) Recognized on Derivatives | | | | |
| |
Derivatives Not Accounted for as Hedging Instruments | | Investment
transactions in unaffiliated
companies* | | | Option
contracts
written | | | Swaption
contracts
written | | | Futures
contracts | | | Forward
currency
exchange
contracts | | | Swap
contracts | | | Total | |
| |
| Credit contracts | | $ | — | | | $ | — | | | $ | — | | | $ | — | | | $ | — | | | $ | 120,447 | | | $ | 120,447 | |
| Equity contracts | | | (412,524) | | | | — | | | | — | | | | — | | | | — | | | | — | | | | (412,524) | |
Forward currency exchange contracts | | | (39,370) | | | | (347,704) | | | | — | | | | — | | | | (2,088,758) | | | | — | | | | (2,475,832) | |
| Interest rate contracts | | | (810,250) | | | | — | | | | 458,019 | | | | 1,389,721 | | | | — | | | | 739,063 | | | | 1,776,553 | |
| | | | |
Total | | $ | (1,262,144) | | | $ | (347,704) | | | $ | 458,019 | | | $ | 1,389,721 | | | $ | (2,088,758) | | | $ | 859,510 | | | $ | (991,356) | |
| | | | |
*Includes purchased option contracts and purchased swaption contracts, if any.
7. Shares of Beneficial Interest
The Fund has authorized an unlimited number of $0.001 par value shares of beneficial interest of each class. Transactions in shares of beneficial interest were as follows:
| | | | | | | | | | | | | | | | |
| | | Year Ended December 31, 2017 | | | Year Ended December 31, 2016 | |
| | | Shares | | | Amount | | | Shares | | | Amount | |
| |
Non-Service Shares | | | | | | | | | | | | | | | | |
| Sold | | | 4,936,516 | | | $ | 24,907,153 | | | | 2,809,997 | | | $ | 13,876,130 | |
| Dividends and/or distributions reinvested | | | 1,828,381 | | | | 9,178,475 | | | | 4,307,664 | | | | 20,719,866 | |
| Redeemed | | | (11,338,330) | | | | (57,398,685) | | | | (14,033,568) | | | | (69,191,900) | |
| | | | |
Net decrease | | | (4,573,433) | | | $ | (23,313,057) | | | | (6,915,907) | | | $ | (34,595,904) | |
| | | | |
55 OPPENHEIMER GLOBAL STRATEGIC INCOME FUND/VA
NOTES TO CONSOLIDATED FINANCIAL STATEMENTS Continued
7. Shares of Beneficial Interest (Continued)
| | | | | | | | | | | | | | | | |
| | | Year Ended December 31, 2017 | | | Year Ended December 31, 2016 | |
| | | Shares | | | Amount | | | Shares | | | Amount | |
| |
Service Shares | | | | | | | | | | | | | | | | |
| Sold | | | 12,450,513 | | | $ | 64,464,791 | | | | 9,843,598 | | | $ | 49,602,452 | |
| Dividends and/or distributions reinvested | | | 4,979,157 | | | | 25,692,448 | | | | 12,375,075 | | | | 61,256,620 | |
| Redeemed | | | (28,206,027 | ) | | | (146,664,417) | | | | (44,290,987 | ) | | | (223,215,650) | |
| | | | |
Net decrease | | | (10,776,357 | ) | | $ | (56,507,178) | | | | (22,072,314 | ) | | $ | (112,356,578) | |
| | | | |
8. Purchases and Sales of Securities
The aggregate cost of purchases and proceeds from sales of securities, other than short-term obligations and investments in IGMMF, for the reporting period were as follows:
| | | | | | | | |
| | | Purchases | | | Sales | |
| |
| Investment securities | | $ | 1,181,187,746 | | | $ | 1,096,521,618 | |
| U.S. government and government agency obligations | | | 22,412,221 | | | | 54,934,450 | |
| To Be Announced (TBA) mortgage-related securities | | | 2,271,944,419 | | | | 2,153,905,799 | |
9. Fees and Other Transactions with Affiliates
Management Fees. Under the investment advisory agreement, the Fund pays the Manager a management fee based on the daily net assets of the Fund at an annual rate as shown in the following table:
| | | | |
| Fee Schedule | | | |
| |
Up to $200 million | | | 0.75% | |
Next $200 million | | | 0.72 | |
Next $200 million | | | 0.69 | |
Next $200 million | | | 0.66 | |
Next $200 million | | | 0.60 | |
Next $4 billion | | | 0.50 | |
Over $5 billion | | | 0.48 | |
The Manager also provides investment management related services to the Subsidiary. The Subsidiary pays the Manager a monthly management fee at an annual rate according to the above schedule. The Subsidiary also pays certain other expenses including custody and directors’ fees.
The Fund’s effective management fee for the reporting period was 0.61% of average annual net assets before any Subsidiary management fees or any applicable waivers.
Sub-Adviser Fees. The Manager has retained the Sub-Adviser to provide the day-to-day portfolio management of the Fund and the Subsidiary. Under the Sub-Advisory Agreement, the Manager pays the Sub-Adviser an annual fee in monthly installments, equal to a percentage of the investment management fee collected by the Manager from the Fund and the Subsidiary, which shall be calculated after any investment management fee waivers. The fee paid to the Sub-Adviser is paid by the Manager, not by the Fund.
Transfer Agent Fees. OFI Global (the “Transfer Agent”) serves as the transfer and shareholder servicing agent for the Fund. The Fund pays the Transfer Agent a fee based on annual net assets. Fees incurred and average net assets for each class with respect to these services are detailed in the Consolidated Statement of Operations and Consolidated Financial Highlights, respectively.
Sub-Transfer Agent Fees. The Transfer Agent has retained Shareholder Services, Inc., a wholly-owned subsidiary of OFI (the “Sub-Transfer Agent”), to provide the day-to-day transfer agent and shareholder servicing of the Fund. Under the Sub-Transfer Agency Agreement, the Transfer Agent pays the Sub-Transfer Agent an annual fee in monthly installments, equal to a percentage of the transfer agent fee collected by the Transfer Agent from the Fund, which shall be calculated after any applicable fee waivers. The fee paid to the Sub-Transfer Agent is paid by the Transfer Agent, not by the Fund.
Trustees’ Compensation. The Fund’s Board of Trustees (“Board”) has adopted a compensation deferral plan for Independent Trustees that enables Trustees to elect to defer receipt of all or a portion of the annual compensation they are entitled to receive from the Fund. For purposes of determining the amount owed to the Trustees under the plan, deferred amounts are treated as though equal dollar amounts had been invested in shares of the Fund or in other Oppenheimer funds selected by the Trustees. The Fund purchases shares of the funds selected for deferral by the Trustees in amounts equal to his or her deemed investment, resulting in a Fund asset equal to the deferred compensation liability. Such assets are included as a component of “Other” within the asset section of the Consolidated Statement of Assets and Liabilities. Deferral of Trustees’ fees under the plan will not affect the net assets of the Fund and will not materially affect the Fund’s assets, liabilities or net investment income per share. Amounts will be deferred until distributed in accordance with the compensation deferral plan.
Distribution and Service Plan for Service Shares. The Fund has adopted a Distribution and Service Plan (the “Plan”) pursuant to Rule 12b-1 under the 1940 Act for Service shares to pay OppenheimerFunds Distributor, Inc. (the “Distributor”), for distribution related services, personal service and account maintenance for the Fund’s Service shares. Under the Plan, payments are made periodically at an annual rate of 0.25% of the daily net assets of
56 OPPENHEIMER GLOBAL STRATEGIC INCOME FUND/VA
9. Fees and Other Transactions with Affiliates (Continued)
Service shares of the Fund. The Distributor currently uses all of those fees to compensate sponsors of the insurance product that offers Fund shares, for providing personal service and maintenance of accounts of their variable contract owners that hold Service shares. These fees are paid out of the Fund’s assets on an on-going basis and increase operating expenses of the Service shares, which results in lower performance compared to the Fund’s shares that are not subject to a service fee. Fees incurred by the Fund under the Plan are detailed in the Consolidated Statement of Operations.
Waivers and Reimbursements of Expenses. Prior to May 1, 2017, the Fund was subject to an expense limitation wherein the Fund’s expenses after payments, waivers and/or reimbursements and reduction to custodian expenses, excluding any applicable dividend expense, taxes, interest and fees from borrowing, any subsidiary expenses, Acquired Fund Fees and Expenses, brokerage commissions, unusual and infrequent expenses and certain other Fund expenses; as percentages of daily net assets, would not exceed the annual rate of 0.75% for Non-Service shares and 1.00% for Service shares. Effective May 1, 2017, this expense limitation has been removed.
During the reporting period, the Manager waived fees and/or reimbursed the Fund as follows:
| | | | |
Non-Service shares | | $ | 2,160 | |
Service shares | | | 6,665 | |
The Manager has contractually agreed to waive the management fee it receives from the Fund in an amount equal to the management fee it receives from the Subsidiary. During the reporting period, the Manager waived $33,447. This fee waiver and/or expense reimbursement may not be amended or withdrawn for one year from the date of the Fund’s prospectus, unless approved by the Board.
The Manager will waive fees and/or reimburse Fund expenses in an amount equal to the indirect management fees incurred through the Fund’s investments in Affiliated Funds. During the reporting period, the Manager waived fees and/or reimbursed the Fund $1,083,067 for these management fees. This fee waiver and/or expense reimbursement may not be amended or withdrawn for one year from the date of the Fund’s prospectus, unless approved by the Board.
10. Borrowings and Other Financing
Joint Credit Facility. A number of mutual funds managed by the Manager participate in a $1.875 billion revolving credit facility (the “Facility”) intended to provide short-term financing, if necessary, subject to certain restrictions in connection with atypical redemption activity. Expenses and fees related to the Facility are paid by the participating funds and are disclosed separately or as other expenses on the Consolidated Statement of Operations. The Fund did not utilize the Facility during the reporting period.
57 OPPENHEIMER GLOBAL STRATEGIC INCOME FUND/VA
REPORT OF INDEPENDENT REGISTERED PUBLIC ACCOUNTING FIRM
To the Shareholders and Board of Trustees
Oppenheimer Variable Account Funds:
Opinion on the Financial Statements
We have audited the accompanying consolidated statement of assets and liabilities of Oppenheimer Global Strategic Income Fund/VA, a separate series of Oppenheimer Variable Account Funds, (the “Fund”) and subsidiary, including the consolidated statement of investments, as of December 31, 2017, the related consolidated statement of operations for the year then ended, the consolidated statements of changes in net assets for each of the years in the two year period then ended, and the related consolidated notes (collectively, the “consolidated financial statements”) and the consolidated financial highlights for each of the years in the five year period then ended. In our opinion, the consolidated financial statements and consolidated financial highlights present fairly, in all material respects, the financial position of the Fund and subsidiary as of December 31, 2017, the results of their consolidated operations for the year then ended, the changes in their consolidated net assets for each of the years in the two year period then ended, and the consolidated financial highlights for each of the years in the five year period then ended, in conformity with U.S. generally accepted accounting principles.
Basis for Opinion
These consolidated financial statements and consolidated financial highlights are the responsibility of the Fund’s management. Our responsibility is to express an opinion on these consolidated financial statements and consolidated financial highlights based on our audits. We are a public accounting firm registered with the Public Company Accounting Oversight Board (United States) (“PCAOB”) and are required to be independent with respect to the Fund and subsidiary in accordance with the U.S. federal securities laws and the applicable rules and regulations of the Securities and Exchange Commission and the PCAOB.
We conducted our audits in accordance with the standards of the PCAOB. Those standards require that we plan and perform the audit to obtain reasonable assurance about whether the consolidated financial statements and consolidated financial highlights are free of material misstatement, whether due to error or fraud. Our audits included performing procedures to assess the risks of material misstatement of the consolidated financial statements and consolidated financial highlights, whether due to error or fraud, and performing procedures that respond to those risks. Such procedures included examining, on a test basis, evidence regarding the amounts and disclosures in the consolidated financial statements and consolidated financial highlights. Such procedures also included confirmation of securities owned as of December 31, 2017, by correspondence with the custodian, brokers and the transfer agent, or by other appropriate auditing procedures. Our audits also included evaluating the accounting principles used and significant estimates made by management, as well as evaluating the overall presentation of the consolidated financial statements and consolidated financial highlights. We believe that our audits provide a reasonable basis for our opinion.
KPMGLLP
We have not been able to determine the specific year that we began serving as the auditor of one or more Oppenheimer Funds investment companies, however we are aware that we have served as the auditor of one or more Oppenheimer Funds investment companies since at least 1969.
Denver, Colorado
February 16, 2018
58 OPPENHEIMER GLOBAL STRATEGIC INCOME FUND/VA
FEDERAL INCOME TAX INFORMATION Unaudited
In early 2018, if applicable, shareholders of record received information regarding all dividends and distributions paid to them by the Fund during calendar year 2017.
Dividends, if any, paid by the Fund during the reporting period which are not designated as capital gain distributions should be multiplied by the maximum amount allowable but not less than 0.70% to arrive at the amount eligible for the corporate dividend-received deduction.
The foregoing information is presented to assist shareholders in reporting distributions received from the Fund to the Internal Revenue Service. Because of the complexity of the federal regulations which may affect your individual tax return and the many variations in state and local tax regulations, we recommend that you consult your tax advisor for specific guidance.
59 OPPENHEIMER GLOBAL STRATEGIC INCOME FUND/VA
BOARD APPROVAL OF THE FUND’S INVESTMENT ADVISORY AND SUB-ADVISORY AGREEMENTS Unaudited
The Fund has entered into an investment advisory agreement with OFI Global Asset Management, Inc. (“OFI Global” or the “Adviser”), a wholly-owned subsidiary of OppenheimerFunds, Inc. (“OFI” or the “Sub-Adviser”) (“OFI Global” and “OFI” together, the “Managers”) and OFI Global has entered into a sub-advisory agreement with OFI whereby OFI provides investment sub-advisory services to the Fund (collectively, the “Agreements”). Each year, the Board of Trustees (the “Board”), including a majority of the independent Trustees, is required to determine whether to approve the terms of the Agreements and the renewal thereof. The Investment Company Act of 1940, as amended, requires that the Board request and evaluate, and that the Managers provide, such information as may be reasonably necessary to evaluate the terms of the Agreements. The Board employs an independent consultant to prepare a report that provides information, including comparative information that the Board requests for that purpose. In addition to in-person meetings focused on this evaluation, the Board receives information throughout the year regarding Fund services, fees, expenses and performance.
The Managers and the independent consultant provided information to the Board on the following factors: (i) the nature, quality and extent of the Managers’ services, (ii) the comparative investment performance of the Fund and the Managers, (iii) the fees and expenses of the Fund, including comparative fee and expense information, (iv) the profitability of the Managers and their affiliates, including an analysis of the cost of providing services, (v) whether economies of scale are realized as the Fund grows and whether fee levels reflect these economies of scale for Fund investors and (vi) other benefits to the Managers from their relationship with the Fund. The Board was aware that there are alternatives to retaining the Managers.
Outlined below is a summary of the principal information considered by the Board as well as the Board’s conclusions.
Nature, Quality and Extent of Services. The Board considered information about the nature, quality and extent of the services provided to the Fund and information regarding the Managers’ key personnel who provide such services. The Managers’ duties include providing the Fund with the services of the portfolio managers and the Sub-Adviser’s investment team, who provide research, analysis and other advisory services in regard to the Fund’s investments; and securities trading services. OFI Global is responsible for oversight of third-party service providers; monitoring compliance with applicable Fund policies and procedures and adherence to the Fund’s investment restrictions; risk management; and oversight of the Sub-Adviser. OFI Global is also responsible for providing certain administrative services to the Fund. Those services include providing and supervising all administrative and clerical personnel who are necessary in order to provide effective corporate administration for the Fund; compiling and maintaining records with respect to the Fund’s operations; preparing and filing reports required by the U.S. Securities and Exchange Commission; preparing periodic reports regarding the operations of the Fund for its shareholders; preparing proxy materials for shareholder meetings; and preparing the registration statements required by federal and state securities laws for the sale of the Fund’s shares. OFI Global also provides the Fund with office space, facilities and equipment.
The Board also considered the quality of the services provided and the quality of the Managers’ resources that are available to the Fund. The Board took account of the fact that the Sub-Adviser has over fifty years of experience as an investment adviser and that its assets under management rank it among the top mutual fund managers in the United States. The Board evaluated the Managers’ advisory, administrative, accounting, legal, compliance and risk management services, among other services, and information the Board has received regarding the experience and professional qualifications of the Managers’ key personnel and the size and functions of their staff. In its evaluation of the quality of the portfolio management services provided, the Board considered the experience of Michael Mata, Krishna Memani, Ruta Ziverte and Chris Kelly, the portfolio managers for the Fund, and the Sub-Adviser’s investment team and analysts. The Board members also considered the totality of their experiences with the Managers as directors or trustees of the Fund and other funds advised by the Managers. The Board considered information regarding the quality of services provided by affiliates of the Managers, which the Board members have become knowledgeable about through their experiences with the Managers and in connection with the review or renewal of the Fund’s service agreements or service providers. The Board concluded, in light of the Managers’ experience, reputation, personnel, operations and resources that the Fund benefits from the services provided under the Agreements.
Investment Performance of the Managers and the Fund. Throughout the year, the Managers provided information on the investment performance of the Fund, the Adviser and the Sub-Adviser, including comparative performance information. The Board also reviewed information, prepared by the Managers and by the independent consultant, comparing the Fund’s historical performance to relevant market indices and to the performance of other multisector bond category funds underlying variable insurance products. The Board considered that the Fund underperformed its category median during the one-, three-, five- and ten-year periods. The Board considered several factors that contributed to the Fund’s underperformance, noting that, as a result of conversations with the Board and in an effort to address performance, two portfolio managers were recently added to the Fund’s investment team in January 2017. The Board further considered that the Adviser recently has made changes to the Fund’s outcome objectives and, corresponding to that, also changed the Fund’s benchmark. The Board also noted that the Fund’s performance improved in 2017 and that the Fund outperformed its benchmark index in the year-to-date period ended June 30, 2017. The Board concluded it was appropriate to permit the Fund’s performance to reflect these changes and additional investments on the part of the Adviser.
Fees and Expenses of the Fund. The Board reviewed the fees paid to the Adviser and the other expenses borne by the Fund. The Board noted that the Adviser, not the Fund, pays the Sub-Adviser’s fee under the sub-advisory agreement. The independent consultant provided comparative data in regard to the fees and expenses of the Fund and other underlying variable insurance products. In reviewing the fees and expenses charged to the VA funds, the Board considered the Adviser’s assertion that, because there is much greater disparity in the fees and services that may be provided by a manager to a VA fund as opposed to a retail fund, when comparing the expenses of the various VA funds to those of retail funds, it is most appropriate to focus on total expenses (rather than on the management fees). Accordingly, while the Board reviewed and considered all expenses, it focused on total expenses. The Board considered that the Fund’s total expenses, net of waivers, were higher than its category median and its peer group median. The Board also considered that the Fund’s contractual management fee was lower than its peer group median and category median. The Board noted that Adviser has voluntarily agreed to waive fees and/or reimburse Fund expenses in an amount equal to the management fees incurred indirectly through the Fund’s investment in funds managed by the Adviser or its affiliates, which may not be amended or withdrawn until April 28, 2018, unless approved by the Board.
Economies of Scale and Profits Realized by the Managers. The Board considered information regarding the Managers’ costs in serving as
60 OPPENHEIMER GLOBAL STRATEGIC INCOME FUND/VA
BOARD APPROVAL OF THE FUND’S INVESTMENT ADVISORY AND SUB-ADVISORY AGREEMENTS Unaudited / Continued
the Fund’s investment adviser and sub-adviser, including the costs associated with the personnel and
systems necessary to manage the Fund, and information regarding the Managers’ profitability from their relationship with the Fund. The Board also considered that the Managers must be able to pay and retain experienced professional personnel at competitive rates to provide quality services to the Fund. The Board reviewed whether the
Managers may realize economies of scale in managing and supporting the Fund. The Board noted that the Fund currently has management fee breakpoints, which are intended to share with Fund shareholders economies of scale that may exist as the Fund’s assets grow.
Other Benefits to the Managers. In addition to considering the profits realized by the Managers, the Board considered information that was provided regarding the direct and indirect benefits the Managers receive as a result of their relationship with the Fund, including compensation paid to the Managers’ affiliates.
Conclusions. These factors were also considered by the independent Trustees meeting separately from the full Board, assisted by experienced counsel to the Fund and to the independent Trustees. Fund counsel and the independent Trustees’ counsel are independent of the Managers within the meaning and intent of the Securities and Exchange Commission rules.
Based on its review of the information it received and its evaluations described above, the Board, including a majority of the independent Trustees, decided to continue the Agreements through August 31, 2018. In arriving at its decision, the Board did not identify any factor or factors as being more important than others, but considered all of the above information, and considered the terms and conditions of the Agreements, including the management fees, in light of all the surrounding circumstances.
61 OPPENHEIMER GLOBAL STRATEGIC INCOME FUND/VA
PORTFOLIO PROXY VOTING POLICIES AND GUIDELINES; UPDATES TO STATEMENTS OF INVESTMENTS Unaudited
The Fund has adopted Portfolio Proxy Voting Policies and Guidelines under which the Fund votes proxies relating to securities (“portfolio proxies”) held by the Fund. A description of the Fund’s Portfolio Proxy Voting Policies and Guidelines is available (i) without charge, upon request, by calling the Fund toll-free at 1.800.CALL OPP (225.5677), (ii) on the Fund’s website at www.oppenheimerfunds.com, and (iii) on the SEC’s website at www.sec.gov. In addition, the Fund is required to file Form N-PX, with its complete proxy voting record for the 12 months ended June 30th, no later than August 31st of each year. The Fund’s voting record is available (i) without charge, upon request, by calling the Fund toll-free at 1.800.CALL OPP (225.5677), and (ii) in the Form N-PX filing on the SEC’s website at www.sec.gov.
The Fund files its complete schedule of portfolio holdings with the SEC for the first quarter and the third quarter of each fiscal year on Form N-Q. The Fund’s Form N-Q filings are available on the SEC’s website at www.sec.gov. Those forms may be reviewed and copied at the SEC’s Public Reference Room in Washington, D.C. Information on the operation of the Public Reference Room may be obtained by calling 1-800-SEC-0330.
62 OPPENHEIMER GLOBAL STRATEGIC INCOME FUND/VA
TRUSTEES AND OFFICERS Unaudited
| | |
| Name, Position(s) Held with the Fund, Length of Service, Year of Birth | | Principal Occupation(s) During the Past 5 Years; Other Trusteeships/Directorships Held; Number of Portfolios in the Fund Complex Currently Overseen |
| |
| INDEPENDENT TRUSTEES | | The address of each Trustee in the chart below is 6803 S. Tucson Way, Centennial, Colorado 80112-3924. Each Trustee serves for an indefinite term, or until his or her resignation, retirement, death or removal. |
| |
Robert J. Malone, Chairman of the Board of Trustees (since 2016), Trustee (since 2002)
Year of Birth: 1944 | | Chairman - Colorado Market of MidFirst Bank (since January 2015); Chairman of the Board (2012-2016) and Director (August 2005-January 2016) of Jones International University (educational organization); Trustee of the Gallagher Family Foundation (non-profit organization) (2000-2016); Chairman, Chief Executive Officer and Director of Steele Street Bank Trust (commercial banking) (August 2003-January 2015); Director of Opera Colorado Foundation (non-profit organization) (2008-2012); Director of Colorado UpLIFT (charitable organization) (1986-2010); Director of Jones Knowledge, Inc. (2006-2010); Former Chairman of U.S. Bank-Colorado (subsidiary of U.S. Bancorp and formerly Colorado National Bank) (July 1996-April 1999); Director of Commercial Assets, Inc. (real estate investment trust) (1993-2000); Director of U.S. Exploration, Inc. (oil and gas exploration) (1997-February 2004); Chairman of the Board (1991-1994) and Trustee (1985-1994) of Regis University; and Chairman of the Board (1990-1991) and Member (1984-1999) of Young Presidents Organization. Oversees 54 portfolios in the OppenheimerFunds complex. Mr. Malone has served on the Boards of certain Oppenheimer funds since 2002, during which time he has become familiar with the Fund’s (and other Oppenheimer funds’) financial, accounting, regulatory and investment matters and has contributed to the Boards’ deliberations. |
| |
Andrew J. Donohue, Trustee (since 2017)
Year of Birth: 1950 | | Of Counsel, Shearman & Sterling LLP (since September 2017); Chief of Staff of the U.S. Securities and Exchange Commission (regulator) (June 2015-February 2017); Managing Director and Investment Company General Counsel of Goldman Sachs (investment bank) (November 2012-May 2015); Partner at Morgan Lewis & Bockius, LLP (law firm) (March 2011-October 2012); Director of the Division of Investment Management of U.S. Securities and Exchange Commission (regulator) (May 2006-November 2010); Global General Counsel of Merrill Lynch Investment Managers (investment firm) (May 2003-May 2006); General Counsel (October 1991-November 2001) and Executive Vice President (January 1993-November 2001) of OppenheimerFunds, Inc. (investment firm) (June 1991-November 2001). Oversees 54 portfolios in the OppenheimerFunds complex. Mr. Donohue has served on the Boards of certain Oppenheimer funds since 2017, during which time he has become familiar with the Fund’s (and other Oppenheimer funds’) financial, accounting, regulatory and investment matters and has contributed to the Boards’ deliberations. |
| |
Jon S. Fossel, Trustee (since 1990)
Year of Birth: 1942 | | Chairman of the Board of Jack Creek Preserve Foundation (non-profit organization) (2005-2015); Director of Jack Creek Preserve Foundation (non-profit organization) (since March 2005); Chairman of the Board (2006-December 2011) and Director (June 2002-December 2011) of UNUMProvident (insurance company); Director of Northwestern Energy Corp. (public utility corporation) (November 2004-December 2009); Director of P.R. Pharmaceuticals (October 1999-October 2003); Director of Rocky Mountain Elk Foundation (non-profit organization) (February 1998-February 2003 and February 2005-February 2007); Chairman and Director (until October 1996) and President and Chief Executive Officer (until October 1995) of the Sub-Adviser; President, Chief Executive Officer and Director of the following: Oppenheimer Acquisition Corp. (“OAC”) (parent holding company of the Sub-Adviser), Shareholders Services, Inc. and Shareholder Financial Services, Inc. (until October 1995). Oversees 54 portfolios in the OppenheimerFunds complex. Mr. Fossel has served on the Boards of certain Oppenheimer funds since 1990, during which time he has become familiar with the Fund’s (and other Oppenheimer funds’) financial, accounting, regulatory and investment matters and has contributed to the Boards’ deliberations. |
| |
Richard F. Grabish, Trustee (since 2012)
Year of Birth: 1948 | | Formerly Senior Vice President and Assistant Director of Sales and Marketing (March 1997-December 2007), Director (March 1987-December 2007) and Manager of Private Client Services (June 1985-June 2005) of A.G. Edwards & Sons, Inc. (broker/dealer and investment firm); Chairman and Chief Executive Officer of A.G. Edwards Trust Company, FSB (March 2001-December 2007); President and Vice Chairman of A.G. Edwards Trust Company, FSB (investment adviser) (April 1987-March 2001); President of A.G. Edwards Trust Company, FSB (investment adviser) (June 2005-December 2007). Oversees 54 portfolios in the OppenheimerFunds complex. Mr. Grabish has served on the Boards of certain Oppenheimer funds since 2001, during which time he has become familiar with the Fund’s (and other Oppenheimer funds’) financial, accounting, regulatory and investment matters and has contributed to the Boards’ deliberations. |
| |
Beverly L. Hamilton, Trustee (since 2002)
Year of Birth: 1946 | | Trustee of Monterey Institute for International Studies (educational organization) (2000-2014); Board Member of Middlebury College (educational organization) (December 2005-June 2011); Director (1991-2016), Vice Chairman of the Board (2006- 2009) and Chairman of the Board (2010-2013) of American Funds’ Emerging Markets Growth Fund, Inc. (mutual fund); Director of The California Endowment (philanthropic organization) (April 2002-April 2008); Director (February 2002-2005) and Chairman of Trustees (2006-2007) of the Community Hospital of Monterey Peninsula; President of ARCO Investment Management Company (February 1991-April 2000); Member of the investment committees of The Rockefeller Foundation (2001-2006) and The University of Michigan (since 2000); Advisor at Credit Suisse First Boston’s Sprout venture capital unit (venture capital fund) (1994-January 2005); Trustee of MassMutual Institutional Funds (investment company) (1996-June 2004); Trustee of MML Series Investment Fund (investment company) (April 1989-June 2004); Member of the investment committee of Hartford Hospital (2000-2003); and Advisor to Unilever (Holland) pension fund (2000-2003). Oversees 54 portfolios in the OppenheimerFunds complex. Ms. Hamilton has served on the Boards of certain Oppenheimer funds since 2002, during which time she has become familiar with the Fund’s (and other Oppenheimer funds’) financial, accounting, regulatory and investment matters and has contributed to the Boards’ deliberations. |
| |
Victoria J. Herget, Trustee (since 2012)
Year of Birth: 1951 | | Board Chair (2008-2015) and Director (2004-Present), United Educators (insurance company); Trustee (since 2000) and Chair (since 2010), Newberry Library (independent research library); Trustee, Mather LifeWays (senior living organization) (since 2001); Independent Director of the First American Funds (mutual fund family) (2003-2011); former Managing Director (1993-2001), Principal (1985-1993), Vice President (1978-1985) and Assistant Vice President (1973-1978) of Zurich Scudder Investments (investment adviser) (and its predecessor firms); Trustee (1992-2007), Chair of the Board of Trustees (1999-2007), Investment Committee Chair (1994-1999) and Investment Committee member (2007-2010) of Wellesley College; Trustee, BoardSource (non-profit organization) (2006-2009) and Chicago City Day School (K-8 School) (1994-2005). Oversees 54 portfolios in the OppenheimerFunds complex. Ms. Herget has served on the Boards of certain Oppenheimer funds since 2012, during which time she has become familiar with the Fund’s (and other Oppenheimer funds’) financial, accounting, regulatory and investment matters and has contributed to the Boards’ deliberations. |
63 OPPENHEIMER GLOBAL STRATEGIC INCOME FUND/VA
TRUSTEES AND OFFICERS Unaudited / Continued
| | |
F. William Marshall, Jr., Trustee (since 2000)
Year of Birth: 1942 | | Trustee Emeritus of Worcester Polytech Institute (WPI) (private university) (since 2009); Trustee of MassMutual Select Funds (formerly MassMutual Institutional Funds) (investment company) (1996-2015), MML Series Investment Fund (investment company) (1996-2015) and Mass Mutual Premier Funds (investment company) (January 2012-December 2015); President and Treasurer of the SIS Charitable Fund (private charitable fund) (January 1999-March 2011); Former Trustee of WPI (1985- 2008); Former Chairman of the Board (2004-2006) and Former Chairman of the Investment Committee of WPI (1994-2008); Chairman of SIS Family Bank, F.S.B. (formerly SIS Bank) (commercial bank) (January 1999-July 1999); Executive Vice President of Peoples Heritage Financial Group, Inc. (commercial bank) (January 1999-July 1999); and Former President and Chief Executive Officer of SIS Bancorp. (1993-1999). Oversees 54 portfolios in the OppenheimerFunds complex. Mr. Marshall has served on the Boards of certain Oppenheimer funds since 2000, during which time he has become familiar with the Fund’s (and other Oppenheimer funds’) financial, accounting, regulatory and investment matters and has contributed to the Boards’ deliberations. |
| |
Karen L. Stuckey, Trustee (since 2012)
Year of Birth: 1953 | | Member (since May 2015) of Desert Mountain Community Foundation Advisory Board (non-profit organization); Partner (1990-2012) of PricewaterhouseCoopers LLP (professional services firm) (held various positions 1975-1990); Trustee (1992- 2006); member of Executive, Nominating and Audit Committees and Chair of Finance Committee (1992-2006), and Emeritus Trustee (since 2006) of Lehigh University; and member, Women’s Investment Management Forum (professional organization) since inception. Oversees 54 portfolios in the OppenheimerFunds complex. Ms. Stuckey has served on the Boards of certain Oppenheimer funds since 2012, during which time she has become familiar with the Fund’s (and other Oppenheimer funds’) financial, accounting, regulatory and investment matters and has contributed to the Boards’ deliberations. |
| |
James D. Vaughn, Trustee (since 2012)
Year of Birth: 1945 | | Retired; former managing partner (1994-2001) of Denver office of Deloitte & Touche LLP, (held various positions 1969- 1993); Trustee and Chairman of the Audit Committee of Schroder Funds (2003-2012); Board member and Chairman of Audit Committee of AMG National Trust Bank (since 2005); Trustee and Investment Committee member, University of South Dakota Foundation (since 1996); Board member, Audit Committee Member and past Board Chair, Junior Achievement (since 1993); former Board member, Mile High United Way, Boys and Girls Clubs, Boy Scouts, Colorado Business Committee for the Arts, Economic Club of Colorado and Metro Denver Network. Oversees 54 portfolios in the OppenheimerFunds complex. Mr. Vaughn has served on the Boards of certain Oppenheimer funds since 2012, during which time he has become familiar with the Fund’s (and other Oppenheimer funds’) financial, accounting, regulatory and investment matters and has contributed to the Boards’ deliberations. |
| INTERESTED TRUSTEE AND OFFICER | | Mr. Steinmetz is an “Interested Trustee” because he is affiliated with the Manager and the Sub-Adviser by virtue of his positions as Chairman and director of the Sub-Adviser and officer and director of the Manager. Both as a Trustee and as an officer, Mr. Steinmetz serves for an indefinite term, or until his resignation, retirement, death or removal. Mr. Steinmetz’s address is 225 Liberty Street, New York, New York 10281-1008. |
| |
Arthur P. Steinmetz, Trustee (since 2015), President and
Principal Executive Officer (since 2014)
Year of Birth: 1958 | | Chairman of the Sub-Adviser (since January 2015); CEO and Chairman of the Manager (since July 2014), President of the Manager (since May 2013), a Director of the Manager (since January 2013), Director of the Sub-Adviser (since July 2014), President, Management Director and CEO of Oppenheimer Acquisition Corp. (the Sub-Adviser’s parent holding company) (since July 2014), and President and Director of OFI SteelPath, Inc. (since January 2013). Chief Investment Officer of the OppenheimerFunds advisory entities from (January 2013-December 2013); Executive Vice President of the Manager (January 2013-May 2013); Chief Investment Officer of the Sub-Adviser (October 2010-December 2012); Chief Investment Officer, Fixed-Income, of the Sub-Adviser (April 2009-October 2010); Executive Vice President of the Sub-Adviser (October 2009-December 2012); Director of Fixed Income of the Sub-Adviser (January 2009-April 2009); and a Senior Vice President of the Sub-Adviser (March 1993-September 2009). An officer of 111 portfolios in the OppenheimerFunds complex. |
| OTHER OFFICERS OF THE FUND | | The addresses of the Officers in the chart below are as follows: for Messrs. Mata, Memani, Kelly, Mss. Ziverte, Lo Bessette, Foxson and Picciotto, 225 Liberty Street, New York, New York 10281-1008, for Mr. Petersen 6803 S. Tucson Way, Centennial, Colorado 80112-3924. Each Officer serves for an indefinite term or until his or her resignation, retirement, death or removal. |
| |
Michael Mata1 , Vice President (since 2014)
Year of Birth: 1963 | | Senior Vice President of the Sub-Adviser and the Head of Multi-Sector Fixed Income (since July 2014). Portfolio manager with ING Investment Management and Head of Multi-Sector Fixed-Income (August 2004-December 2013), managing the Global Bond and Core Plus strategies and the macro and quantitative research teams, along with the emerging markets sovereign team. Senior Vice President and Senior Risk Manager at Putnam Investments (March 2000-August 2004) and a Vice President and Risk Manager for Fixed Income Trading at Lehman Brothers (September 1994-March 2000). A portfolio manager and an officer of other portfolios in the OppenheimerFunds complex. |
| |
Krishna Memani, Vice President (since 2009)
Year of Birth: 1960 | | President of the Sub-Adviser (since January 2013); Executive Vice President of the Manager (since January 2014) and Chief Investment Officer of the OppenheimerFunds advisory entities (since January 2014). Chief Investment Officer, Fixed Income of the Sub-Adviser (January 2013-December 2013); Head of the Investment Grade Fixed Income Team of the Sub-Adviser (March 2009-January 2014); Director of Fixed Income of the Sub-Adviser (October 2010-December 2012); Senior Vice President of the Sub-Adviser (March 2009-December 2012) and Senior Vice President of OFI Global Institutional, Inc. (April 2009-December 2012). Managing Director and Head of the U.S. and European Credit Analyst Team at Deutsche Bank Securities (June 2006-January 2009). Chief Credit Strategist at Credit Suisse Securities (August 2002-March 2006). Managing Director and Senior Portfolio Manager at Putnam Investments (September 1998-June 2002). A portfolio manager and an officer of other portfolios in the OppenheimerFunds complex. |
| |
Chris Kelly, Vice President (since 2017)
Year of Birth: 1967 | | Senior Vice President of the Sub-Adviser (since January 2016); Portfolio Manager of the Sub-Adviser (since March 2015); Co-Head of the Global Debt Team (since March 2015); Vice President of the Sub-Adviser (March 2015-January 2016). Deputy Head of Emerging Markets Fixed Income at BlackRock, Inc. (June 2012 - January 2015); Portfolio Manager and Deputy Chief Investment Officer of Emerging Markets at Fisher Francis Trees and Watts, a BNP Paribas Investment Partner (February 2008 - April 2012). A portfolio manager and an officer of other portfolios in the OppenheimerFunds complex. |
1. Effective January 24, 2018, Michael Mata is no longer an officer of the Fund.
64 OPPENHEIMER GLOBAL STRATEGIC INCOME FUND/VA
| | |
Ruta Ziverte, Vice President (since 2017)
Year of Birth: 1973 | | Vice President and Senior Portfolio Manager of the Sub-Adviser (July 2015). Prior to joining the Sub-Adviser, she was Senior Vice President and Portfolio Manager at GE Asset Management (June 2009 to June 2015). A portfolio manager and an officer of other portfolios in the OppenheimerFunds complex. |
| |
Cynthia Lo Bessette, Secretary and Chief Legal Officer (since 2016)
Year of Birth: 1969 | | Executive Vice President, General Counsel and Secretary of the Manager (since February 2016); Senior Vice President and Deputy General Counsel of the Manager (March 2015-February 2016); Chief Legal Officer of the Sub-Adviser and the Distributor (since February 2016); Vice President, General Counsel and Secretary of Oppenheimer Acquisition Corp. (since February 2016); General Counsel of OFI SteelPath, Inc., OFI Advisors, LLC and Index Management Solutions, LLC (since February 2016); Chief Legal Officer of OFI Global Institutional, Inc., HarbourView Asset Management Corporation, OFI Global Trust Company, Oppenheimer Real Asset Management, Inc., OFI Private Investments Inc., Shareholder Services, Inc. and Trinity Investment Management Corporation (since February 2016); Corporate Counsel (February 2012-March 2015) and Deputy Chief Legal Officer (April 2013-March 2015) of Jennison Associates LLC; Assistant General Counsel (April 2008-September 2009) and Deputy General Counsel (October 2009-February 2012) of Lord Abbett & Co. LLC. An officer of 111 portfolios in the OppenheimerFunds complex. |
| |
Jennifer Foxson, Vice President and Chief Business Officer (since 2014)
Year of Birth: 1969 | | Senior Vice President of OppenheimerFunds Distributor, Inc. (since June 2014); Vice President of OppenheimerFunds Distributor, Inc. (April 2006-June 2014); Vice President of the Sub-Adviser (January 1998-March 2006); Assistant Vice President of the Sub-Adviser (October 1991-December 1998). An officer of 111 portfolios in the OppenheimerFunds complex. |
| |
Mary Ann Picciotto, Chief Compliance Officer and Chief Anti-Money Laundering Officer (since 2014)
Year of Birth: 1973 | | Senior Vice President and Chief Compliance Officer of the Manager (since March 2014); Chief Compliance Officer of the Sub - Adviser, OFI SteelPath, Inc., OFI Global Trust Company, OFI Global Institutional, Inc., Oppenheimer Real Asset Management, Inc., OFI Private Investments, Inc., Harborview Asset Management Corporation, Trinity Investment Management Corporation, and Shareholder Services, Inc. (since March 2014); Managing Director of Morgan Stanley Investment Management Inc. and certain of its various affiliated entities; Chief Compliance Officer of various Morgan Stanley Funds (May 2010-January 2014); Chief Compliance Officer of Morgan Stanley Investment Management Inc. (April 2007-January 2014). An officer of 111 portfolios in the OppenheimerFunds complex. |
| |
Brian S. Petersen, Treasurer and Principal Financial & Accounting Officer (since 2016)
Year of Birth: 1970 | | Senior Vice President of the Manager (since January 2017); Vice President of the Manager (January 2013-January 2017); Vice President of the Sub-Adviser (February 2007-December 2012); Assistant Vice President of the Sub-Adviser (August 2002- 2007). An officer of 111 portfolios in the OppenheimerFunds complex. |
The Fund’s Statement of Additional Information contains additional information about the Fund’s Trustees and Officers and is available without charge, upon request, by calling 1.800.988.8287.
65 OPPENHEIMER GLOBAL STRATEGIC INCOME FUND/VA
THIS PAGE INTENTIONALLY LEFT BLANK.
66 OPPENHEIMER GLOBAL STRATEGIC INCOME FUND/VA
THIS PAGE INTENTIONALLY LEFT BLANK.
67 OPPENHEIMER GLOBAL STRATEGIC INCOME FUND/VA
OPPENHEIMER GLOBAL STRATEGIC INCOME FUND/VA
A Series of Oppenheimer Variable Account Funds
| | | | |
| Manager | | | | OFI Global Asset Management, Inc. |
| | |
| Sub-Adviser | | | | OppenheimerFunds, Inc. |
| | |
| Distributor | | | | OppenheimerFunds Distributor, Inc. |
| | |
| Transfer and Shareholder Servicing Agent | | | | OFI Global Asset Management, Inc. |
| | |
| Sub-Transfer Agent | | | | Shareholder Services, Inc. |
| | | | DBA OppenheimerFunds Services |
| | |
Independent Registered
Public
Accounting
Firm | | | | KPMG LLP |
| | |
| Legal Counsel | | | | Ropes & Gray LLP |
| | |
| | | | Before investing in any of the Oppenheimer funds, investors should carefully consider a fund’s investment objectives, risks, charges and expenses. Fund prospectuses and summary prospectuses contain this and other information about the funds, and may be obtained by asking your financial advisor, visiting oppenheimerfunds.com or calling us at 1.800.988.8287. Read prospectuses and summary prospectuses carefully before investing. |
| | |
| | | | © 2018 OppenheimerFunds, Inc. All rights reserved. Oppenheimer funds are distributed by OppenheimerFunds Distributor, Inc. |


December 31, 2017

ANNUAL REPORT
Listing of Top Holdings
Fund Performance Discussion
Financial Statements
PORTFOLIO MANAGERS: Mark Hamilton, Ben Rockmuller, CFA, Dokyoung Lee, CFA and Alessio de Longis, CFA
AVERAGE ANNUAL TOTAL RETURNS FOR THE PERIODS ENDED 12/31/17
| | | | | | | | | | |
| | | Inception | | | | | | Since |
| | | Date | | | 1-Year | | | Inception |
Non-Service Shares | | | 11/14/13 | | | | 0.56 | % | | 1.43% |
Service Shares | | | 11/14/13 | | | | 0.19 | | | 1.19 |
| ICE Bank of America Merrill Lynch 3-Month U.S. Treasury Bill Index | | | | | | | 0.86 | | | 0.31 |
Performance data quoted represents past performance, which does not guarantee future results. The investment return and principal value of an investment in the Fund will fluctuate so that an investor’s shares, when redeemed, may be worth more or less than their original cost. Current performance may be lower or higher than the performance quoted. For performance data current to the most recent month end, call us at 1.800.988.8287. The Fund’s total returns should not be expected to be the same as the returns of other funds, whether or not both funds have the same portfolio managers and/or similar names. The Fund’s total returns include changes in share price and reinvested distributions but do not include the charges associated with the separate account products that offer this Fund. Such performance would have been lower if such charges were taken into account. Returns for periods of less than one year are cumulative and not annualized. See Fund prospectuses and summary prospectuses for more information on share classes and sales charges.
TOP HOLDINGS AND ALLOCATIONS
TOP TEN COMMON STOCK HOLDINGS
| | | | |
Alphabet, Inc., Cl. A | | 0.8% | | |
Chubb Ltd. | | 0.8 | | |
M&T Bank Corp. | | 0.7 | | |
Apple, Inc. | | 0.6 | | |
Altria Group, Inc. | | 0.6 | | |
Lockheed Martin Corp. | | 0.6 | | |
Cisco Systems, Inc. | | 0.6 | | |
Enterprise Products Partners LP | | 0.6 | | |
Allstate Corp. (The) | | 0.5 | | |
Energy Transfer Partners LP | | 0.5 | | |
Portfolio holdings and allocations are subject to change. Percentages are as of December 31, 2017, and are based on net assets. For more current Fund holdings, please visit oppenheimerfunds.com.
PORTFOLIO ALLOCATION
| | | | | | |
| Common Stocks | | | 43.7 | % | | |
| Short-Term Notes | | | 22.6 | | | |
| Event-Linked Bonds | | | | | | |
Multiple Event | | | 5.0 | | | |
Earthquake | | | 3.5 | | | |
Windstorm | | | 2.2 | | | |
Other | | | 0.7 | | | |
Pandemic | | | 0.1 | | | |
Longevity | | | 0.1 | | | |
| Non-Convertible Corporate Bonds and Notes | | | 8.1 | | | |
| Investment Companies | | | | | | |
Highland/iBoxx Senior Loan Exchange Traded Fund | | | 0.5 | | | |
Oppenheimer Institutional Government Money Market Fund | | | 4.2 | | | |
Scottish Mortgage Investment Trust plc | | | — | * | | |
SPDR Gold Trust Exchange Traded Fund | | | 1.0 | | | |
| Corporate Loans | | | 3.0 | | | |
| Asset-Backed Securities | | | 2.6 | | | |
| Foreign Government Obligations | | | 1.8 | | | |
| Mortgage-Backed Obligations | | | | | | |
Non-Agency | | | 0.5 | | | |
| Preferred Stocks | | | 0.3 | | | |
| Exchange-Traded Options Purchased | | | 0.1 | | | |
| Rights, Warrants and Certificates | | | —* | | | |
| Over-the-Counter Options Purchased | | | —* | | | |
| Convertible Corporate Bonds and Notes | | | —* | | | |
| Over-the-Counter Interest Rate Swaptions Purchased | | | —* | | | |
*Represents a value of less than 0.05%.
Portfolio holdings and allocations are subject to change. Percentages are as of December 31, 2017, and are based on the total market value of investments.
2 OPPENHEIMER GLOBAL MULTI-ALTERNATIVES FUND/VA
Fund Performance Discussion
The Fund’s Non-Service shares returned 0.56% during the reporting period. On a relative basis, the Fund underperformed the ICE Bank of America Merrill Lynch 3-Month U.S. Treasury Bill Index (the “Index”), which returned 0.86% during the same period.
FUND REVIEW
The primary detractors from the Fund’s performance versus the Index included its exposure to income alternatives, particularly master limited partnerships (“MLPs”) and event-linked bonds. Top performing areas included the Fund’s exposure to Alpha alternatives, Global Real Estate through real estate investment trusts (REITs), and its risk management overlays.
In income alternatives, event-linked bonds were impacted negatively as global insurance and reinsurance markets endured an extremely challenging environment amid an unprecedented number of large and impactful natural disaster events that occurred in late August through September. Losses from Hurricanes Harvey, Irma, and Maria, along with a major earthquake in Mexico have contributed to what is expected to be at least the third highest level for insured losses in the market’s history. Our MLP strategy seeks to invest in U.S. midstream MLPs that the investment team believes have attractive risk and reward characteristics. During the reporting period, midstream sector equities continued to be challenged by anemic capital flows and pervasively negative sentiment among market participants toward all things energy. Hurricane Harvey also hit Houston, Texas in August 2017. The hurricane produced an extraordinary amount of flooding, but little wind or storm surge related damage to midstream infrastructure, and thus only transitory disruptions with insignificant sustainable impact upon midstream operators. Offsetting the underperformance in these areas to a degree was the Fund’s exposure to leveraged loans, which performed positively during the reporting period. Credit assets were strong performers on a risk-adjusted basis this year.
Our exposure to Alpha alternatives produced positive results, driven by the Global Multi Strategies and Fundamental Alternatives strategies. Within Global Multi Strategies, which is our systematic alpha strategy, we had positive contribution from the Global Macro, Equity Market Neutral, Fixed Income Alternatives, and Volatility components. This positive performance was partially offset by the Event Driven strategy. Within the Fundamental Alternatives, which is our fundamental alpha strategy, we had positive performance from the Equity and Credit strategies. This positive performance was partially offset by the Global Macro strategy.
Our Currency Alpha Strategy detracted from performance. The strategy can be long and/or short currencies against the U.S. dollar and seeks opportunities regardless of dollar bull or bear market cycles. One of our key market views at the turn of the year was that the U.S. dollar, though already significantly overvalued, would continue to appreciate in light of a shifting U.S. policy landscape. A united Republican Congress and presidency had increased the odds of fiscal stimulus which, coupled with monetary tightening already underway, created the potential for meaningful fiscal and monetary policy divergence between the United States and other major developed countries. In our view, such a policy mix was likely to boost the greenback against other major currencies. In 2017, however, the U.S. dollar has fallen on a trade-weighted basis. This has been a headwind to our currency positioning and has been a detractor during the period. With a few setbacks to the current administration’s agenda and tax reform still an open question, we have reduced our U.S. dollar long position to neutral and continue to express relative relative-value views in high-yielding emerging market currencies such as the Colombian Peso, Chilean Peso, Indonesian Rupiah, and Indian rupee versus their developed-market peers. We have also added long exposure to Japanese yen as a means of balancing risk in this strategy.
The Fund’s exposure to Global Real Estate through real estate investment trusts (REITs) contributed positively to performance for this reporting period. After healthy year-to-date returns through the third quarter of 2016, global-listed securities declined sharply starting in the fourth quarter of 2016, as real estate investment trusts (“REITs”) were negatively impacted by rising interest rates around the world, and we decreased our exposure at that time. However, in early 2017, we increased our position again after interest rate volatility subsided and we witnessed positive momentum in the alternative. This worked in our benefit as Global Real Estate subsequently had positive performance.
The Fund’s risk management overlays were also a positive contributor to performance. Given appropriate market conditions, the Fund periodically utilizes risk management overlays in an attempt to control and manage volatility, hedge unwanted risks, and maximize risk-adjusted returns. With an underweight to real asset alternatives, the Fund was positioned somewhat conservatively versus its peers in terms of fund volatility and sensitivity to equities. To offset this risk, we increased equity market exposure and upside market potential through derivatives. This proved to be a constructive strategy during the period, as these upside hedges were a capital and cost effective way to participate in the equity market upswing. In particular, our emerging market equity exposure was a positive contributor as this market moved higher during the period.
3 OPPENHEIMER GLOBAL MULTI-ALTERNATIVES FUND/VA
STRATEGY & OUTLOOK
The Fund comprises a flexible blend of alternative strategies and assets and is designed to be a turnkey alternative solution that improves the risk/reward tradeoff of a traditional balanced portfolio. We classify alternatives into three categories: Alpha alternatives, such as Global Multi Strategies, Fundamental Alternatives Strategies, and the Currency Alpha Strategy, rely less on the direction of major markets and economic factors to generate returns. Income alternatives (e.g., MLPs, loans, and event-linked bonds) provide exposure to relatively stable income producing assets with less interest rate sensitivity than traditional fixed income allocations. Real asset alternatives, like Global Real Estate and Commodities, could help guard against inflation over the long-term. We combine these strategies and assets to provide a core, alternative exposure that can potentially offset some of the risk from equity drawdowns, rising interest rates and inflationary shocks.
As we look ahead, we see an accelerating growth picture abroad as a potential tailwind to risky assets in the near term. In terms of our asset allocation overlays, we have a relative value preference for European and Emerging equities versus the US equity market, where we see the greatest opportunity in growth and cheaper valuations. We do see some headwinds in credit markets with non-financial corporate leverage nearing previous cyclical peaks and tight spread levels. Given the advanced stage of the credit cycle; we have carry or yield like return expectations for credit. As always, we continue to closely monitor the developments in financial conditions as well as the political and policy landscape to assess risks to the macro outlook and financial markets. While the macro backdrop is positive, valuation in some asset classes are stretched and we believe that diversifying risk, controlling volatility and managing the downside will be a winning strategy going forward. Because the Fund comprises a number of different alternative assets and strategies, with diversifying properties as well as the potential to generate attractive total returns, we believe it can play a particularly valuable role in investors’ portfolios.
Investors should consider the Fund’s investment objective, risks, charges and expenses carefully before investing. The Fund’s prospectus and summary prospectus contain this and other information about the Fund, and may be obtained by asking your financial advisor or calling us at 1.800.988.8287. Read prospectuses and summary prospectuses carefully before investing.
Total returns include changes in share price and reinvestment of dividends and capital gains distributions in a hypothetical investment for the periods shown, but do not include the charges associated with the separate account products that offer this Fund.
The Fund’s investment strategy and focus can change over time. The mention of specific fund holdings does not constitute a recommendation by OppenheimerFunds, Inc. or its affiliates.
Shares of Oppenheimer funds are not deposits or obligations of any bank, are not guaranteed by any bank, are not insured by the FDIC or any other agency, and involve investment risks, including the possible loss of the principal amount invested.
Comparing the Fund’s Performance to the Market. The graphs that follow show the performance of a hypothetical $10,000 investment in each share class of the Fund held until December 31, 2017. Performance is measured over a ten-fiscal-year period for both Classes. Performance information does not reflect charges that apply to separate accounts investing in the Fund. If these charges were taken into account, performance would be lower. The graphs assume that all dividends and capital gains distributions were reinvested in additional shares.
The Fund’s performance is compared to the performance of the ICE Bank of America Merrill Lynch 3-Month U.S. Treasury Bill Index. The ICE Bank of America (BofA) Merrill Lynch 3-month U.S. Treasury Bill Index is an index of short-term U.S. Government securities with a remaining term to final maturity of less than three months. The Index is unmanaged and cannot be purchased directly by investors. While index comparisons may be useful to provide a benchmark for the Fund’s performance, it must be noted that the Fund’s investments are not limited to the investments comprising the Index. Index performance includes reinvestment of income, but does not reflect transaction costs, fees, expenses or taxes. Index performance is shown for illustrative purposes only as a benchmark for the Fund’s performance, and does not predict or depict performance of the Fund. The Fund’s performance reflects the effects of the Fund’s business and operating expenses.
4 OPPENHEIMER GLOBAL MULTI-ALTERNATIVES FUND/VA
COMPARISON OF CHANGE IN VALUE OF $10,000 HYPOTHETICAL INVESTMENTS IN:
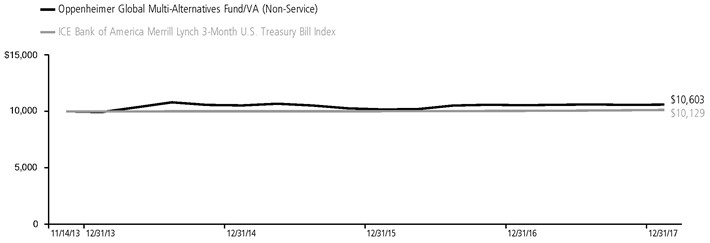
Average Annual Total Returns of Non-Service Shares of the Fund at 12/31/17
1-Year 0.56% Since Inception (11/14/13) 1.43%
COMPARISON OF CHANGE IN VALUE OF $10,000 HYPOTHETICAL INVESTMENTS IN:
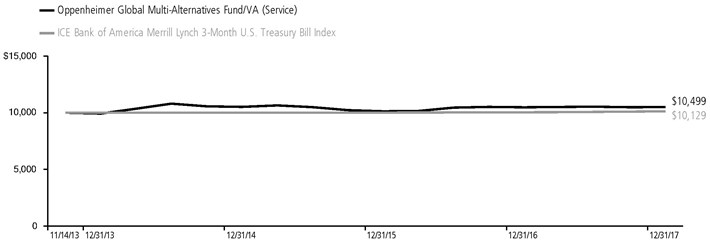
Average Annual Total Returns of Service Shares of the Fund at 12/31/17
1-Year 0.19% Since Inception (11/14/13) 1.19%
Performance data quoted represents past performance, which does not guarantee future results. The investment return and principal value of an investment in the Fund will fluctuate so that an investor’s shares, when redeemed, may be worth more or less than their original cost. Current performance may be lower or higher than the performance quoted. For performance data current to the most recent month end, call us at 1.800.988.8287. The Fund’s total returns should not be expected to be the same as the returns of other funds, whether or not both funds have the same portfolio managers and/or similar names. The Fund’s total returns include changes in share price and reinvested distributions but do not include the charges associated with the separate account products that offer this Fund. Such performance would have been lower if such charges were taken into account.
5 OPPENHEIMER GLOBAL MULTI-ALTERNATIVES FUND/VA
Fund Expenses
Fund Expenses. As a shareholder of the Fund, you incur two types of costs: (1) transaction costs and (2) ongoing costs, including management fees; distribution and service fees; and other Fund expenses. These examples are intended to help you understand your ongoing costs (in dollars) of investing in the Fund and to compare these costs with the ongoing costs of investing in other mutual funds.
The examples are based on an investment of $1,000.00 invested at the beginning of the period and held for the entire 6-month period ended December 31, 2017.
Actual Expenses. The first section of the table provides information about actual account values and actual expenses. You may use the information in this section for the class of shares you hold, together with the amount you invested, to estimate the expense that you paid over the period. Simply divide your account value by $1,000.00 (for example, an $8,600.00 account value divided by $1,000.00 = 8.60), then multiply the result by the number in the first section under the heading entitled “Expenses Paid During 6 Months Ended December 31, 2017” to estimate the expenses you paid on your account during this period.
Hypothetical Example for Comparison Purposes.
The second section of the table provides information about hypothetical account values and hypothetical expenses based on the Fund’s actual expense ratio for each class of shares, and an assumed rate of return of 5% per year for each class before expenses, which is not the actual return. The hypothetical account values and expenses may not be used to estimate the actual ending account balance or expenses you paid for the period. You may use this information to compare the ongoing costs of investing in the Fund and other funds. To do so, compare this 5% hypothetical example for the class of shares you hold with the 5% hypothetical examples that appear in the shareholder reports of the other funds.
Please note that the expenses shown in the table are meant to highlight your ongoing costs only and do not reflect any charges associated with the separate accounts that offer this Fund. Therefore, the “hypothetical” lines of the table are useful in comparing ongoing costs only, and will not help you determine the relative total costs of owning different funds. In addition, if these separate account charges were included your costs would have been higher.
| | | | | | | | | | | | | | | | | | |
| | | Beginning | | | | | Ending | | | | | Expenses | | | |
| | | Account | | | | | Account | | | | | Paid During | | | |
| | | Value | | | | | Value | | | | | 6 Months Ended | | | |
| Actual | | July 1, 2017 | | | | | December 31, 2017 | | December 31, 2017 |
| Non-Service shares | | $ | 1,000.00 | | | | | $ | 999.00 | | | | | $ | 6.72 | | | |
| Service shares | | | 1,000.00 | | | | | | 996.90 | | | | | | 7.98 | | | |
| | | | | | |
| Hypothetical | | | | | | | | | | | | | | | | | | |
| (5% return before expenses) | | | | | | | | | | | | | | | | | | |
| Non-Service shares | | | 1,000.00 | | | | | | 1,018.50 | | | | | | 6.79 | | | |
| Service shares | | | 1,000.00 | | | | | | 1,017.24 | | | | | | 8.07 | | | |
Expenses are equal to the Fund’s annualized expense ratio for that class, multiplied by the average account value over the period, multiplied by 184/365 (to reflect the one-half year period). Those annualized expense ratios, excluding indirect expenses from affiliated funds, based on the 6-month period ended December 31, 2017 are as follows:
| | | | |
| Class | | Expense Ratios | | |
Non-Service shares | | 1.33% | | |
Service shares | | 1.58 | | |
The expense ratios reflect voluntary and/or contractual waivers and/or reimbursements of expenses by the Fund’s Manager. Some of these undertakings may be modified or terminated at any time, as indicated in the Fund’s prospectus. The “Financial Highlights” tables in the Fund’s financial statements, included in this report, also show the gross expense ratios, without such waivers or reimbursements and reduction to custodian expenses, if applicable.
6 OPPENHEIMER GLOBAL MULTI-ALTERNATIVES FUND/VA
CONSOLIDATED STATEMENT OF INVESTMENTS December 31, 2017
| | | | | | | | |
| | | Shares | | | Value | |
| Common Stocks—42.9% | | | | | | | | |
| Consumer Discretionary—2.5% | | | | | |
| Auto Components—0.1% | | | | | |
| American Axle & Manufacturing Holdings, Inc.1 | | | 1,044 | | | $ | 17,779 | |
| Cooper Tire & Rubber Co. | | | 435 | | | | 15,377 | |
| Cooper-Standard Holdings, Inc.1 | | | 147 | | | | 18,008 | |
| Dana, Inc. | | | 1,265 | | | | 40,493 | |
| Dorman Products, Inc.1 | | | 324 | | | | 19,809 | |
| Fox Factory Holding Corp.1 | | | 387 | | | | 15,035 | |
| Gentherm, Inc.1 | | | 323 | | | | 10,255 | |
| GKN plc | | | 12,934 | | | | 55,537 | |
| Horizon Global Corp.1 | | | 272 | | | | 3,814 | |
| LCI Industries | | | 223 | | | | 28,990 | |
| Modine Manufacturing Co.1 | | | 564 | | | | 11,393 | |
| Motorcar Parts of America, Inc.1 | | | 200 | | | | 4,998 | |
| Shiloh Industries, Inc.1 | | | 307 | | | | 2,517 | |
| Standard Motor Products, Inc. | | | 206 | | | | 9,252 | |
| Stoneridge, Inc.1 | | | 342 | | | | 7,818 | |
| Superior Industries International, Inc. | | | 220 | | | | 3,267 | |
| Tenneco, Inc. | | | 482 | | | | 28,216 | |
| Tower International, Inc. | | | 236 | | | | 7,210 | |
| Valeo SA | | | 1,454 | | | | 108,355 | |
| VOXX International Corp., Cl. A1 | | | 227 | | | | 1,271 | |
| | | | | | | | 409,394 | |
| Automobiles—0.0% | | | | | |
| Ford Motor Co. | | | 4,317 | | | | 53,919 | |
| General Motors Co. | | | 1,196 | | | | 49,024 | |
| Winnebago Industries, Inc. | | | 268 | | | | 14,901 | |
| | | | | | | | 117,844 | |
| Distributors—0.0% | | | | | |
| Core-Mark Holding Co., Inc. | | | 449 | | | | 14,179 | |
| Weyco Group, Inc. | | | 93 | | | | 2,764 | |
| | | | | | | | 16,943 | |
| Diversified Consumer Services—0.1% | | | | | |
| Adtalem Global Education, Inc.1 | | | 516 | | | | 21,698 | |
| American Public Education, Inc.1 | | | 115 | | | | 2,881 | |
| Ascent Capital Group, Inc., Cl. A1 | | | 109 | | | | 1,252 | |
| Bridgepoint Education, Inc., Cl. A1 | | | 293 | | | | 2,432 | |
| Cambium Learning Group, Inc.1 | | | 588 | | | | 3,340 | |
| Capella Education Co. | | | 136 | | | | 10,526 | |
| Career Education Corp.1 | | | 526 | | | | 6,354 | |
| Carriage Services, Inc., Cl. A | | | 154 | | | | 3,959 | |
| Chegg, Inc.1 | | | 1,044 | | | | 17,038 | |
| Collectors Universe, Inc. | | | 72 | | | | 2,062 | |
| Grand Canyon Education, Inc.1 | | | 553 | | | | 49,510 | |
| Houghton Mifflin Harcourt Co.1 | | | 1,185 | | | | 11,021 | |
| K12, Inc.1 | | | 494 | | | | 7,855 | |
| Laureate Education, Inc., Cl. A1 | | | 1,739 | | | | 23,581 | |
| Liberty Tax, Inc. | | | 172 | | | | 1,892 | |
| Regis Corp.1 | | | 413 | | | | 6,344 | |
| Rentokil Initial plc | | | 14,386 | | | | 61,548 | |
| Sotheby’s1 | | | 500 | | | | 25,800 | |
| Strayer Education, Inc. | | | 100 | | | | 8,958 | |
| Weight Watchers International, Inc.1 | | | 623 | | | | 27,586 | |
| | | | | | | | 295,637 | |
| Hotels, Restaurants & Leisure—0.9% | | | | | |
| Accor SA | | | 3,776 | | | | 194,637 | |
| Belmond Ltd., Cl. A1 | | | 1,027 | | | | 12,581 | |
| Biglari Holdings, Inc.1 | | | 20 | | | | 8,288 | |
| BJ’s Restaurants, Inc. | | | 174 | | | | 6,334 | |
| Bloomin’ Brands, Inc. | | | 28,026 | | | | 598,075 | |
| Bojangles’, Inc.1 | | | 319 | | | | 3,764 | |
| Boyd Gaming Corp. | | | 977 | | | | 34,244 | |
| Brinker International, Inc. | | | 374 | | | | 14,526 | |
| Buffalo Wild Wings, Inc.1 | | | 4,296 | | | | 671,680 | |
| Caesars Entertainment Corp.1 | | | 8,395 | | | | 106,197 | |
| | | | | | | | |
| | | Shares | | | Value | |
| Hotels, Restaurants & Leisure (Continued) | | | | | |
| Carnival plc | | | 745 | | | $ | 48,984 | |
| Carrols Restaurant Group, Inc.1 | | | 285 | | | | 3,463 | |
| Century Casinos, Inc.1 | | | 272 | | | | 2,483 | |
| Cheesecake Factory, Inc. (The) | | | 398 | | | | 19,176 | |
| Churchill Downs, Inc. | | | 129 | | | | 30,018 | |
| Chuy’s Holdings, Inc.1 | | | 145 | | | | 4,067 | |
| Compass Group plc | | | 2,171 | | | | 46,943 | |
| Dave & Buster’s Entertainment, Inc.1 | | | 354 | | | | 19,530 | |
| Del Frisco’s Restaurant Group, Inc.1 | | | 191 | | | | 2,913 | |
| Del Taco Restaurants, Inc.1 | | | 378 | | | | 4,581 | |
| Denny’s Corp.1 | | | 600 | | | | 7,944 | |
| DineEquity, Inc. | | | 177 | | | | 8,979 | |
| Drive Shack, Inc.1 | | | 374 | | | | 2,068 | |
| El Pollo Loco Holdings, Inc.1 | | | 399 | | | | 3,950 | |
| Eldorado Resorts, Inc.1 | | | 611 | | | | 20,255 | |
| Fiesta Restaurant Group, Inc.1 | | | 223 | | | | 4,237 | |
| Fogo de Chao, Inc.1 | | | 254 | | | | 2,946 | |
| Golden Entertainment, Inc.1 | | | 164 | | | | 5,355 | |
| Habit Restaurants, Inc. (The), Cl. A1 | | | 253 | | | | 2,416 | |
| Hilton Worldwide Holdings, Inc. | | | 4,163 | | | | 332,457 | |
| ILG, Inc. | | | 1,598 | | | | 45,511 | |
| InterContinental Hotels Group plc | | | 849 | | | | 54,002 | |
| International Speedway Corp., Cl. A | | | 503 | | | | 20,045 | |
| J Alexander’s Holdings, Inc.1 | | | 185 | | | | 1,795 | |
| Jack in the Box, Inc. | | | 359 | | | | 35,221 | |
| La Quinta Holdings, Inc.1 | | | 1,418 | | | | 26,176 | |
| Lindblad Expeditions Holdings, Inc.1 | | | 447 | | | | 4,376 | |
| Marcus Corp. (The) | | | 247 | | | | 6,755 | |
| Marriott Vacations Worldwide Corp. | | | 246 | | | | 33,262 | |
| McDonald’s Corp. | | | 657 | | | | 113,083 | |
| Merlin Entertainments plc2 | | | 8,828 | | | | 43,155 | |
| Monarch Casino & Resort, Inc.1 | | | 159 | | | | 7,126 | |
| Nathan’s Famous, Inc. | | | 34 | | | | 2,567 | |
| Paddy Power Betfair plc | | | 606 | | | | 72,180 | |
| Papa John’s International, Inc. | | | 389 | | | | 21,827 | |
| Penn National Gaming, Inc.1 | | | 780 | | | | 24,437 | |
| Pinnacle Entertainment, Inc.1 | | | 455 | | | | 14,892 | |
| Planet Fitness, Inc., Cl. A1 | | | 668 | | | | 23,133 | |
| Potbelly Corp.1 | | | 15,109 | | | | 185,841 | |
| RCI Hospitality Holdings, Inc. | | | 77 | | | | 2,154 | |
| Red Lion Hotels Corp.1 | | | 217 | | | | 2,137 | |
| Red Robin Gourmet Burgers, Inc.1 | | | 160 | | | | 9,024 | |
| Red Rock Resorts, Inc., Cl. A | | | 519 | | | | 17,511 | |
| Ruth’s Hospitality Group, Inc. | | | 280 | | | | 6,062 | |
| Scientific Games Corp., Cl. A1 | | | 767 | | | | 39,347 | |
| Shake Shack, Inc., Cl. A1 | | | 229 | | | | 9,893 | |
| Sodexo SA | | | 1,446 | | | | 194,149 | |
| Sonic Corp. | | | 4,514 | | | | 124,045 | |
| Speedway Motorsports, Inc. | | | 517 | | | | 9,756 | |
| Starbucks Corp. | | | 1,011 | | | | 58,062 | |
| Texas Roadhouse, Inc., Cl. A | | | 659 | | | | 34,716 | |
| TUI AG | | | 2,606 | | | | 53,958 | |
| Whitbread plc | | | 967 | | | | 52,224 | |
| Wingstop, Inc. | | | 238 | | | | 9,277 | |
| Zoe’s Kitchen, Inc.1 | | | 142 | | | | 2,374 | |
| | | | | | | | 3,583,164 | |
| Household Durables—0.1% | | | | | |
| AV Homes, Inc.1 | | | 193 | | | | 3,213 | |
| Bassett Furniture Industries, Inc. | | | 103 | | | | 3,873 | |
| Beazer Homes USA, Inc.1 | | | 315 | | | | 6,051 | |
| Berkeley Group Holdings plc | | | 1,274 | | | | 72,142 | |
| Cavco Industries, Inc.1 | | | 88 | | | | 13,429 | |
| Century Communities, Inc.1 | | | 235 | | | | 7,309 | |
| CSS Industries, Inc. | | | 95 | | | | 2,644 | |
| Ethan Allen Interiors, Inc. | | | 263 | | | | 7,522 | |
| Flexsteel Industries, Inc. | | | 93 | | | | 4,351 | |
| Green Brick Partners, Inc.1 | | | 431 | | | | 4,870 | |
7 OPPENHEIMER GLOBAL MULTI-ALTERNATIVES FUND/VA
CONSOLIDATED STATEMENT OF INVESTMENTS Continued
| | | | | | | | |
| | | Shares | | | Value | |
| Household Durables (Continued) | | | | | |
| Hamilton Beach Brands Holding Co., Cl. A | | | 176 | | | $ | 4,521 | |
| Hamilton Beach Brands Holding Co., Cl. B | | | 61 | | | | 1,567 | |
| Helen of Troy Ltd.1 | | | 268 | | | | 25,822 | |
| Hooker Furniture Corp. | | | 134 | | | | 5,688 | |
| Hovnanian Enterprises, Inc., Cl. A1 | | | 1,186 | | | | 3,973 | |
| Installed Building Products, Inc.1 | | | 273 | | | | 20,734 | |
| iRobot Corp.1 | | | 258 | | | | 19,789 | |
| KB Home | | | 716 | | | | 22,876 | |
| La-Z-Boy, Inc. | | | 369 | | | | 11,513 | |
| LGI Homes, Inc.1 | | | 177 | | | | 13,280 | |
| Libbey, Inc. | | | 210 | | | | 1,579 | |
| Lifetime Brands, Inc. | | | 186 | | | | 3,069 | |
| M/I Homes, Inc.1 | | | 240 | | | | 8,256 | |
| MDC Holdings, Inc. | | | 548 | | | | 17,470 | |
| Meritage Homes Corp.1 | | | 338 | | | | 17,306 | |
| New Home Co., Inc. (The)1 | | | 257 | | | | 3,220 | |
| PICO Holdings, Inc. | | | 316 | | | | 4,045 | |
| Taylor Morrison Home Corp., Cl. A1 | | | 882 | | | | 21,583 | |
| Taylor Wimpey plc | | | 19,157 | | | | 53,366 | |
| TopBuild Corp.1 | | | 327 | | | | 24,767 | |
| TRI Pointe Group, Inc.1 | | | 1,390 | | | | 24,909 | |
| Universal Electronics, Inc.1 | | | 153 | | | | 7,229 | |
| William Lyon Homes, Cl. A1 | | | 280 | | | | 8,142 | |
| ZAGG, Inc.1 | | | 203 | | | | 3,745 | |
| | | | | | | | 453,853 | |
| Internet & Catalog Retail—0.0% | | | | | |
| 1-800-Flowers.com, Inc., Cl. A1 | | | 562 | | | | 6,013 | |
| Amazon.com, Inc.1 | | | 44 | | | | 51,457 | |
| FTD Cos., Inc.1 | | | 418 | | | | 3,005 | |
| Gaia, Inc., Cl. A1 | | | 137 | | | | 1,699 | |
| Groupon, Inc., Cl. A1 | | | 4,466 | | | | 22,777 | |
| HSN, Inc. | | | 460 | | | | 18,561 | |
| Liberty TripAdvisor Holdings, Inc., Cl. A1 | | | 821 | | | | 7,738 | |
| Nutrisystem, Inc. | | | 280 | | | | 14,728 | |
| PetMed Express, Inc. | | | 175 | | | | 7,962 | |
| Priceline Group, Inc. (The)1 | | | 24 | | | | 41,706 | |
| Shutterfly, Inc.1 | | | 300 | | | | 14,925 | |
| | | | | | | | 190,571 | |
| Leisure Products—0.0% | | | | | |
| Acushnet Holdings Corp. | | | 655 | | | | 13,807 | |
| American Outdoor Brands Corp.1 | | | 522 | | | | 6,702 | |
| Callaway Golf Co. | | | 890 | | | | 12,398 | |
| Clarus Corp.1 | | | 270 | | | | 2,120 | |
| Escalade, Inc. | | | 124 | | | | 1,525 | |
| Johnson Outdoors, Inc., Cl. A | | | 125 | | | | 7,761 | |
| Malibu Boats, Inc., Cl. A1 | | | 192 | | | | 5,708 | |
| Marine Products Corp. | | | 315 | | | | 4,013 | |
| MCBC Holdings, Inc.1 | | | 221 | | | | 4,911 | |
| Nautilus, Inc.1 | | | 288 | | | | 3,845 | |
| Vista Outdoor, Inc.1 | | | 695 | | | | 10,126 | |
| | | | | | | | 72,916 | |
| Media—0.9% | | | | | |
| Beasley Broadcast Group, Inc., Cl. A | | | 227 | | | | 3,042 | |
| Central European Media Enterprises Ltd., Cl. A1 | | | 1,274 | | | | 5,924 | |
| Charter Communications, Inc., Cl. A1 | | | 190 | | | | 63,832 | |
| Clear Channel Outdoor Holdings, Inc., Cl. A | | | 2,786 | | | | 12,816 | |
| Comcast Corp., Cl. A | | | 1,494 | | | | 59,835 | |
| Daily Journal Corp.1 | | | 13 | | | | 2,993 | |
| DISH Network Corp., Cl. A1 | | | 19,203 | | | | 916,943 | |
| Emerald Expositions Events, Inc. | | | 712 | | | | 14,482 | |
| Entercom Communications Corp., Cl. A | | | 367 | | | | 3,964 | |
| Entravision Communications Corp., Cl. A | | | 814 | | | | 5,820 | |
| | | | | | | | |
| | | Shares | | | Value | |
| Media (Continued) | | | | | |
| Eros International plc1 | | | 547 | | | $ | 5,279 | |
| EW Scripps Co. (The), Cl. A1 | | | 892 | | | | 13,942 | |
| Gannett Co., Inc. | | | 803 | | | | 9,307 | |
| Global Eagle Entertainment, Inc.1 | | | 720 | | | | 1,649 | |
| Gray Television, Inc.1 | | | 743 | | | | 12,445 | |
| Hemisphere Media Group, Inc., Cl. A1 | | | 428 | | | | 4,943 | |
| IMAX Corp.1 | | | 585 | | | | 13,543 | |
| Informa plc | | | 7,327 | | | | 71,275 | |
| ITV plc | | | 25,760 | | | | 57,352 | |
| Liberty Media Corp.-Liberty Braves, Cl. A1 | | | 486 | | | | 10,716 | |
| Liberty Media Corp.-Liberty Braves, Cl. C1 | | | 488 | | | | 10,843 | |
| Live Nation Entertainment, Inc.1 | | | 14,300 | | | | 608,751 | |
| Loral Space & Communications, Inc.1 | | | 296 | | | | 13,039 | |
| MDC Partners, Inc., Cl. A1 | | | 529 | | | | 5,158 | |
| Media General, Inc.1,3,4 | | | 1,099 | | | | 66 | |
| Meredith Corp. | | | 329 | | | | 21,730 | |
| MSG Networks, Inc., Cl. A1 | | | 692 | | | | 14,013 | |
| National CineMedia, Inc. | | | 767 | | | | 5,262 | |
| New Media Investment Group, Inc. | | | 463 | | | | 7,769 | |
| New York Times Co. (The), Cl. A | | | 1,560 | | | | 28,860 | |
| Nexstar Media Group, Inc., Cl. A | | | 405 | | | | 31,671 | |
| Publicis Groupe SA | | | 3,155 | | | | 214,340 | |
| Reading International, Inc., Cl. A1 | | | 273 | | | | 4,559 | |
| Regal Entertainment Group, Cl. A | | | 28,319 | | | | 651,620 | |
| RELX plc | | | 2,679 | | | | 62,763 | |
| Saga Communications, Inc., Cl. A | | | 54 | | | | 2,184 | |
| Salem Media Group, Inc., Cl. A | | | 426 | | | | 1,917 | |
| Scholastic Corp. | | | 298 | | | | 11,953 | |
| Sinclair Broadcast Group, Inc., Cl. A | | | 896 | | | | 33,914 | |
| Sky plc1 | | | 25,654 | | | | 349,819 | |
| Time Warner, Inc. | | | 1,352 | | | | 123,667 | |
| Time, Inc. | | | 588 | | | | 10,849 | |
| Townsquare Media, Inc., Cl. A1 | | | 296 | | | | 2,273 | |
| tronc, Inc.1 | | | 265 | | | | 4,661 | |
| Twenty-First Century Fox, Inc., Cl. A | | | 1,498 | | | | 51,726 | |
| Twenty-First Century Fox, Inc., Cl. B | | | 1,544 | | | | 52,681 | |
| Walt Disney Co. (The) | | | 730 | | | | 78,482 | |
| WideOpenWest, Inc.1 | | | 1,075 | | | | 11,363 | |
| World Wrestling Entertainment, Inc., Cl. A | | | 680 | | | | 20,794 | |
| WPP plc | | | 3,083 | | | | 55,872 | |
| | | | | | | | 3,782,701 | |
| Multiline Retail—0.1% | | | | | |
| Big Lots, Inc. | | | 347 | | | | 19,484 | |
| Marks & Spencer Group plc | | | 17,866 | | | | 75,771 | |
| Next plc | | | 1,985 | | | | 121,539 | |
| Ollie’s Bargain Outlet Holdings, Inc.1 | | | 546 | | | | 29,074 | |
| Target Corp. | | | 895 | | | | 58,399 | |
| | | | | | | | 304,267 | |
| Specialty Retail—0.2% | | | | | |
| Aaron’s, Inc. | | | 653 | | | | 26,022 | |
| Abercrombie & Fitch Co., Cl. A | | | 499 | | | | 8,698 | |
| American Eagle Outfitters, Inc. | | | 1,356 | | | | 25,493 | |
| America’s Car-Mart, Inc.1 | | | 63 | | | | 2,813 | |
| Asbury Automotive Group, Inc.1 | | | 184 | | | | 11,776 | |
| Ascena Retail Group, Inc.1 | | | 2,362 | | | | 5,551 | |
| At Home Group, Inc.1 | | | 424 | | | | 12,885 | |
| Barnes & Noble Education, Inc.1 | | | 397 | | | | 3,271 | |
| Barnes & Noble, Inc. | | | 698 | | | | 4,677 | |
| Boot Barn Holdings, Inc.1 | | | 140 | | | | 2,325 | |
| Build-A-Bear Workshop, Inc.1 | | | 143 | | | | 1,316 | |
| Caleres, Inc. | | | 341 | | | | 11,417 | |
| Camping World Holdings, Inc., Cl. A | | | 259 | | | | 11,585 | |
| Cato Corp. (The), Cl. A | | | 193 | | | | 3,073 | |
| Chico’s FAS, Inc. | | | 1,096 | | | | 9,667 | |
8 OPPENHEIMER GLOBAL MULTI-ALTERNATIVES FUND/VA
| | | | | | | | |
| | | Shares | | | Value | |
| Specialty Retail (Continued) | | | | | |
| Children’s Place, Inc. (The) | | | 135 | | | $ | 19,622 | |
| Citi Trends, Inc. | | | 110 | | | | 2,911 | |
| Container Store Group, Inc. (The)1 | | | 288 | | | | 1,365 | |
| DSW, Inc., Cl. A | | | 680 | | | | 14,559 | |
| Express, Inc.1 | | | 518 | | | | 5,258 | |
| Finish Line, Inc. (The), Cl. A | | | 327 | | | | 4,751 | |
| Five Below, Inc.1 | | | 467 | | | | 30,971 | |
| Francesca’s Holdings Corp.1 | | | 303 | | | | 2,215 | |
| Genesco, Inc.1 | | | 149 | | | | 4,842 | |
| Group 1 Automotive, Inc. | | | 191 | | | | 13,555 | |
| Guess?, Inc. | | | 774 | | | | 13,065 | |
| Haverty Furniture Cos., Inc. | | | 198 | | | | 4,485 | |
| Hibbett Sports, Inc.1 | | | 126 | | | | 2,570 | |
| Home Depot, Inc. (The) | | | 487 | | | | 92,301 | |
| Kingfisher plc | | | 12,476 | | | | 56,875 | |
| Kirkland’s, Inc.1 | | | 136 | | | | 1,627 | |
| Lithia Motors, Inc., Cl. A | | | 228 | | | | 25,899 | |
| Lowe’s Cos., Inc. | | | 584 | | | | 54,277 | |
| Lumber Liquidators Holdings, Inc.1 | | | 293 | | | | 9,197 | |
| MarineMax, Inc.1 | | | 200 | | | | 3,780 | |
| Monro, Inc. | | | 303 | | | | 17,256 | |
| Office Depot, Inc. | | | 4,632 | | | | 16,397 | |
| Party City Holdco, Inc.1 | | | 909 | | | | 12,681 | |
| Pier 1 Imports, Inc. | | | 675 | | | | 2,794 | |
| Shoe Carnival, Inc. | | | 113 | | | | 3,023 | |
| Sleep Number Corp.1 | | | 348 | | | | 13,081 | |
| Sonic Automotive, Inc., Cl. A | | | 382 | | | | 7,048 | |
| Sportsman’s Warehouse Holdings, Inc.1 | | | 328 | | | | 2,168 | |
| Tailored Brands, Inc. | | | 427 | | | | 9,321 | |
| Tesco plc | | | 24,495 | | | | 69,172 | |
| Tile Shop Holdings, Inc. | | | 508 | | | | 4,877 | |
| Tilly’s, Inc., Cl. A | | | 197 | | | | 2,908 | |
| Vitamin Shoppe, Inc.1 | | | 278 | | | | 1,223 | |
| Winmark Corp. | | | 46 | | | | 5,952 | |
| Zumiez, Inc.1 | | | 194 | | | | 4,040 | |
| | | | | | | | 676,635 | |
| Textiles, Apparel & Luxury Goods—0.1% | | | | | |
| Burberry Group plc | | | 1,865 | | | | 45,088 | |
| Columbia Sportswear Co. | | | 587 | | | | 42,194 | |
| Crocs, Inc.1 | | | 627 | | | | 7,925 | |
| Culp, Inc. | | | 116 | | | | 3,886 | |
| Deckers Outdoor Corp.1 | | | 277 | | | | 22,229 | |
| Delta Apparel, Inc.1 | | | 71 | | | | 1,434 | |
| Fossil Group, Inc.1 | | | 511 | | | | 3,971 | |
| G-III Apparel Group Ltd.1 | | | 379 | | | | 13,981 | |
| Iconix Brand Group, Inc.1 | | | 472 | | | | 609 | |
| Kering | | | 375 | | | | 176,784 | |
| LVMH Moet Hennessy Louis Vuitton SE | | | 524 | | | | 153,925 | |
| Movado Group, Inc. | | | 205 | | | | 6,601 | |
| NIKE, Inc., Cl. B | | | 944 | | | | 59,047 | |
| Oxford Industries, Inc. | | | 149 | | | | 11,203 | |
| Perry Ellis International, Inc.1 | | | 142 | | | | 3,556 | |
| Sequential Brands Group, Inc.1 | | | 878 | | | | 1,563 | |
| Steven Madden Ltd.1 | | | 510 | | | | 23,817 | |
| Superior Uniform Group, Inc. | | | 167 | | | | 4,461 | |
| Unifi, Inc.1 | | | 232 | | | | 8,322 | |
| Vera Bradley, Inc.1 | | | 277 | | | | 3,374 | |
| Wolverine World Wide, Inc. | | | 853 | | | | 27,194 | |
| | | | | | | | 621,164 | |
| Consumer Staples—2.5% | | | | | |
| Beverages—0.5% | | | | | |
| Boston Beer Co., Inc. (The), Cl. A1 | | | 110 | | | | 21,021 | |
| Coca-Cola Bottling Co. Consolidated | | | 92 | | | | 19,804 | |
| Coca-Cola Co. (The) | | | 29,475 | | | | 1,352,313 | |
| Coca-Cola HBC AG1 | | | 2,266 | | | | 73,706 | |
| Craft Brew Alliance, Inc.1 | | | 171 | | | | 3,283 | |
| Diageo plc | | | 1,669 | | | | 61,083 | |
| | | | | | | | |
| | | Shares | | | Value | |
| Beverages (Continued) | | | | | |
| MGP Ingredients, Inc. | | | 145 | | | $ | 11,148 | |
| National Beverage Corp. | | | 396 | | | | 38,586 | |
| PepsiCo, Inc. | | | 906 | | | | 108,647 | |
| Pernod Ricard SA | | | 1,602 | | | | 253,582 | |
| Primo Water Corp.1 | | | 238 | | | | 2,992 | |
| | | | | | | | 1,946,165 | |
| Food & Staples Retailing—0.2% | | | | | |
| Andersons, Inc. (The) | | | 311 | | | | 9,688 | |
| Carrefour SA | | | 12,015 | | | | 260,020 | |
| Chefs’ Warehouse, Inc. (The)1 | | | 248 | | | | 5,084 | |
| Costco Wholesale Corp. | | | 382 | | | | 71,098 | |
| CVS Health Corp. | | | 741 | | | | 53,722 | |
| Ingles Markets, Inc., Cl. A | | | 157 | | | | 5,432 | |
| J Sainsbury plc | | | 20,936 | | | | 68,158 | |
| Natural Grocers by Vitamin Cottage, Inc.1 | | | 133 | | | | 1,188 | |
| Performance Food Group Co.1 | | | 1,176 | | | | 38,926 | |
| PriceSmart, Inc. | | | 282 | | | | 24,280 | |
| Smart & Final Stores, Inc.1 | | | 454 | | | | 3,882 | |
| SpartanNash Co. | | | 339 | | | | 9,044 | |
| SUPERVALU, Inc.1 | | | 321 | | | | 6,934 | |
| United Natural Foods, Inc.1 | | | 387 | | | | 19,067 | |
| Village Super Market, Inc., Cl. A | | | 127 | | | | 2,912 | |
| Walgreens Boots Alliance, Inc. | | | 879 | | | | 63,833 | |
| Wal-Mart Stores, Inc. | | | 1,128 | | | | 111,390 | |
| Weis Markets, Inc. | | | 240 | | | | 9,934 | |
| Wm Morrison Supermarkets plc | | | 16,833 | | | | 49,958 | |
| | | | | | | | 814,550 | |
| Food Products—0.5% | | | | | |
| Admiral Group plc | | | 3,087 | | | | 83,247 | |
| Alico, Inc. | | | 80 | | | | 2,360 | |
| Associated British Foods plc | | | 1,917 | | | | 72,877 | |
| Bob Evans Farms, Inc. | | | 8,634 | | | | 680,532 | |
| Calavo Growers, Inc. | | | 160 | | | | 13,504 | |
| Danone SA | | | 2,143 | | | | 179,664 | |
| Darling Ingredients, Inc.1 | | | 1,585 | | | | 28,736 | |
| Dean Foods Co. | | | 753 | | | | 8,705 | |
| Farmer Brothers Co.1 | | | 158 | | | | 5,080 | |
| Fresh Del Monte Produce, Inc. | | | 430 | | | | 20,498 | |
| Freshpet, Inc.1 | | | 270 | | | | 5,116 | |
| Hostess Brands, Inc., Cl. A1 | | | 776 | | | | 11,493 | |
| J&J Snack Foods Corp. | | | 156 | | | | 23,685 | |
| John B Sanfilippo & Son, Inc. | | | 104 | | | | 6,578 | |
| Kraft Heinz Co. (The) | | | 854 | | | | 66,407 | |
| Lancaster Colony Corp. | | | 244 | | | | 31,527 | |
| Landec Corp.1 | | | 276 | | | | 3,478 | |
| Lifeway Foods, Inc.1 | | | 150 | | | | 1,200 | |
| Limoneira Co. | | | 126 | | | | 2,822 | |
| Mondelez International, Inc., Cl. A | | | 1,352 | | | | 57,866 | |
| Sanderson Farms, Inc. | | | 190 | | | | 26,368 | |
| Seneca Foods Corp., Cl. A1 | | | 97 | | | | 2,983 | |
| Snyder’s-Lance, Inc. | | | 13,874 | | | | 694,810 | |
| Unilever plc | | | 1,203 | | | | 66,646 | |
| | | | | | | | 2,096,182 | |
| Household Products—0.1% | | | | | |
| Central Garden & Pet Co.1 | | | 472 | | | | 18,370 | |
| Central Garden & Pet Co., Cl. A1 | | | 604 | | | | 22,777 | |
| Colgate-Palmolive Co. | | | 1,491 | | | | 112,496 | |
| HRG Group, Inc.1 | | | 1,775 | | | | 30,086 | |
| Oil-Dri Corp. of America | | | 77 | | | | 3,195 | |
| Procter & Gamble Co. (The) | | | 1,095 | | | | 100,609 | |
| Reckitt Benckiser Group plc | | | 545 | | | | 50,908 | |
| WD-40 Co. | | | 123 | | | | 14,514 | |
| | | | | | | | 352,955 | |
| Personal Products—0.2% | | | | | |
| Inter Parfums, Inc. | | | 309 | | | | 13,426 | |
9 OPPENHEIMER GLOBAL MULTI-ALTERNATIVES FUND/VA
CONSOLIDATED STATEMENT OF INVESTMENTS Continued
| | | | | | | | |
| | | Shares | | | Value | |
| Personal Products (Continued) | | | | | |
| L’Oreal SA | | | 872 | | | $ | 193,174 | |
| Medifast, Inc. | | | 103 | | | | 7,191 | |
| Nature’s Sunshine Products, Inc. | | | 138 | | | | 1,594 | |
| Peugeot SA | | | 5,256 | | | | 106,768 | |
| Revlon, Inc., Cl. A1 | | | 29,589 | | | | 645,040 | |
| USANA Health Sciences, Inc.1 | | | 208 | | | | 15,402 | |
| | | | | | | | 982,595 | |
| Tobacco—1.0% | | | | | | | | |
| Altria Group, Inc. | | | 32,524 | | | | 2,322,539 | |
| British American Tobacco plc | | | 774 | | | | 52,238 | |
| Imperial Brands plc | | | 1,730 | | | | 73,931 | |
| Philip Morris International, Inc. | | | 16,605 | | | | 1,754,318 | |
| Turning Point Brands, Inc. | | | 182 | | | | 3,846 | |
| Universal Corp. | | | 256 | | | | 13,440 | |
| Vector Group Ltd. | | | 1,182 | | | | 26,453 | |
| | | | | | | | 4,246,765 | |
| Energy—7.9% | | | | | |
| Energy Equipment & Services—0.6% | | | | | |
| Archrock, Inc. | | | 849 | | | | 8,914 | |
| Basic Energy Services, Inc.1 | | | 14,278 | | | | 335,105 | |
| Bristow Group, Inc. | | | 217 | | | | 2,923 | |
| C&J Energy Services, Inc.1 | | | 546 | | | | 18,275 | |
| Dril-Quip, Inc.1 | | | 315 | | | | 15,026 | |
| Ensco plc, Cl. A | | | 2,887 | | | | 17,062 | |
| Era Group, Inc.1 | | | 197 | | | | 2,118 | |
| Exterran Corp.1 | | | 460 | | | | 14,462 | |
| Forum Energy Technologies, Inc.1 | | | 927 | | | | 14,415 | |
| Frank’s International NV | | | 2,240 | | | | 14,896 | |
| Geospace Technologies Corp.1 | | | 131 | | | | 1,699 | |
| Gulf Island Fabrication, Inc. | | | 146 | | | | 1,960 | |
| Halliburton Co. | | | 11,142 | | | | 544,510 | |
| Helix Energy Solutions Group, Inc.1 | | | 1,434 | | | | 10,812 | |
| Independence Contract Drilling, Inc.1 | | | 328 | | | | 1,305 | |
| Keane Group, Inc.1 | | | 1,093 | | | | 20,778 | |
| Mammoth Energy Services, Inc.1 | | | 441 | | | | 8,657 | |
| Matrix Service Co.1 | | | 209 | | | | 3,720 | |
| McDermott International, Inc.1 | | | 2,451 | | | | 16,128 | |
| Nabors Industries Ltd. | | | 286 | | | | 1,953 | |
| Natural Gas Services Group, Inc.1 | | | 171 | | | | 4,480 | |
| NCS Multistage Holdings, Inc.1 | | | 539 | | | | 7,945 | |
| Newpark Resources, Inc.1 | | | 803 | | | | 6,906 | |
| Noble Corp. plc1 | | | 2,308 | | | | 10,432 | |
| Oil States International, Inc.1 | | | 468 | | | | 13,244 | |
| Parker Drilling Co.1 | | | 1,409 | | | | 1,409 | |
| Pearson plc | | | 7,171 | | | | 71,080 | |
| PHI, Inc.1 | | | 175 | | | | 2,025 | |
| Pioneer Energy Services Corp.1 | | | 666 | | | | 2,031 | |
| ProPetro Holding Corp.1 | | | 638 | | | | 12,862 | |
| RigNet, Inc.1 | | | 241 | | | | 3,603 | |
| Rowan Cos. plc, Cl. A1 | | | 1,165 | | | | 18,244 | |
| Schlumberger Ltd. | | | 11,290 | | | | 760,833 | |
| SEACOR Holdings, Inc.1 | | | 167 | | | | 7,719 | |
| SEACOR Marine Holdings, Inc.1 | | | 193 | | | | 2,258 | |
| Select Energy Services, Inc., Cl. A1 | | | 645 | | | | 11,765 | |
| Smart Sand, Inc.1 | | | 345 | | | | 2,988 | |
| Superior Energy Services, Inc.1 | | | 1,324 | | | | 12,750 | |
| TechnipFMC plc | | | 7,493 | | | | 231,447 | |
| TETRA Technologies, Inc.1 | | | 775 | | | | 3,309 | |
| Unit Corp.1 | | | 438 | | | | 9,636 | |
| US Silica Holdings, Inc. | | | 707 | | | | 23,020 | |
| Vantage Drilling International1 | | | 447 | | | | 87,165 | |
| Willbros Group, Inc.1 | | | 1,387 | | | | 1,970 | |
| | | | | | | | 2,363,839 | |
| Oil, Gas & Consumable Fuels—7.3% | | | | | | | | |
| Abraxas Petroleum Corp.1 | | | 1,616 | | | | 3,975 | |
| Adams Resources & Energy, Inc. | | | 36 | | | | 1,566 | |
| Antero Midstream GP LP | | | 27,441 | | | | 541,137 | |
| | | | | | | | |
| | | Shares | | | Value | |
| Oil, Gas & Consumable Fuels (Continued) | | | | | |
| Arch Coal, Inc., Cl. A | | | 333 | | | $ | 31,022 | |
| Ardmore Shipping Corp.1 | | | 332 | | | | 2,656 | |
| Bill Barrett Corp.1 | | | 609 | | | | 3,124 | |
| Bonanza Creek Energy, Inc.1 | | | 304 | | | | 8,387 | |
| BP plc | | | 10,231 | | | | 72,154 | |
| Buckeye Partners LP5 | | | 28,490 | | | | 1,411,679 | |
| Callon Petroleum Co.1 | | | 1,919 | | | | 23,316 | |
| Canadian Natural Resources Ltd. | | | 14,432 | | | | 515,740 | |
| Carrizo Oil & Gas, Inc.1 | | | 706 | | | | 15,024 | |
| Chevron Corp. | | | 8,890 | | | | 1,112,939 | |
| Clean Energy Fuels Corp.1 | | | 1,493 | | | | 3,031 | |
| Cloud Peak Energy, Inc.1 | | | 730 | | | | 3,249 | |
| ConocoPhillips | | | 17,563 | | | | 964,033 | |
| Contango Oil & Gas Co.1 | | | 395 | | | | 1,860 | |
| Delek US Holdings, Inc. | | | 605 | | | | 21,139 | |
| Denbury Resources, Inc.1 | | | 2,676 | | | | 5,914 | |
| DHT Holdings, Inc. | | | 1,372 | | | | 4,925 | |
| Dorian LPG Ltd.1 | | | 554 | | | | 4,554 | |
| Earthstone Energy, Inc., Cl. A1 | | | 188 | | | | 1,998 | |
| Eclipse Resources Corp.1 | | | 2,226 | | | | 5,342 | |
| Energy Transfer Equity LP5 | | | 105,785 | | | | 1,825,849 | |
| Energy Transfer Partners LP5 | | | 121,949 | | | | 2,185,326 | |
| Energy XXI Gulf Coast, Inc.1 | | | 536 | | | | 3,077 | |
| Enterprise Products Partners LP5 | | | 85,320 | | | | 2,261,833 | |
| EOG Resources, Inc. | | | 8,372 | | | | 903,423 | |
| EQT Corp. | | | 10,329 | | | | 587,927 | |
| EQT Midstream Partners LP5 | | | 8,895 | | | | 650,225 | |
| Evolution Petroleum Corp. | | | 426 | | | | 2,918 | |
| Exxon Mobil Corp. | | | 856 | | | | 71,596 | |
| GasLog Ltd. | | | 732 | | | | 16,287 | |
| Genco Shipping & Trading Ltd.1 | | | 344 | | | | 4,582 | |
| Gener8 Maritime, Inc.1 | | | 796 | | | | 5,270 | |
| Genesis Energy LP5 | | | 15,545 | | | | 347,431 | |
| Green Plains, Inc. | | | 425 | | | | 7,161 | |
| Halcon Resources Corp.1 | | | 8,820 | | | | 66,767 | |
| Hallador Energy Co. | | | 223 | | | | 1,358 | |
| International Seaways, Inc.1 | | | 326 | | | | 6,018 | |
| Jagged Peak Energy, Inc.1 | | | 1,844 | | | | 29,098 | |
| Kinder Morgan, Inc. | | | 2,380 | | | | 43,007 | |
| Magellan Midstream Partners LP5 | | | 21,415 | | | | 1,519,180 | |
| Matador Resources Co.1 | | | 883 | | | | 27,488 | |
| Midstates Petroleum Co., Inc.1 | | | 218 | | | | 3,614 | |
| MPLX LP5 | | | 47,287 | | | | 1,677,270 | |
| NACCO Industries, Inc., Cl. A | | | 62 | | | | 2,334 | |
| Navios Maritime Acquisition Corp. | | | 1,328 | | | | 1,474 | |
| Newfield Exploration Co.1 | | | 10,570 | | | | 333,272 | |
| Noble Energy, Inc.6 | | | 22,617 | | | | 659,059 | |
| Oasis Petroleum, Inc.1 | | | 2,075 | | | | 17,451 | |
| Obsidian Energy Ltd.1 | | | 164,912 | | | | 204,491 | |
| Occidental Petroleum Corp. | | | 14,408 | | | | 1,061,293 | |
| Overseas Shipholding Group, Inc., Cl. A1 | | | 576 | | | | 1,578 | |
| Pacific Ethanol, Inc.1 | | | 444 | | | | 2,020 | |
| Panhandle Oil & Gas, Inc., Cl. A | | | 172 | | | | 3,535 | |
| Par Pacific Holdings, Inc.1 | | | 438 | | | | 8,445 | |
| PDC Energy, Inc.1 | | | 691 | | | | 35,614 | |
| Peabody Energy Corp.1 | | | 902 | | | | 35,512 | |
| Penn Virginia Corp.1 | | | 15,448 | | | | 604,171 | |
| Phillips 66 Partners LP5 | | | 11,400 | | | | 596,790 | |
| Plains All American Pipeline LP5 | | | 23,930 | | | | 493,915 | |
| Plains GP Holdings LP, Cl. A | | | 24,200 | | | | 531,190 | |
| Renault SA | | | 1,685 | | | | 169,356 | |
| Renewable Energy Group, Inc.1 | | | 392 | | | | 4,626 | |
| Resolute Energy Corp.1 | | | 214 | | | | 6,735 | |
| REX American Resources Corp.1 | | | 60 | | | | 4,967 | |
| Rice Midstream Partners LP5 | | | 28,725 | | | | 616,726 | |
| Ring Energy, Inc.1 | | | 463 | | | | 6,436 | |
| Royal Dutch Shell plc, Cl. A | | | 2,567 | | | | 85,935 | |
| Royal Dutch Shell plc, Cl. B | | | 2,456 | | | | 82,833 | |
10 OPPENHEIMER GLOBAL MULTI-ALTERNATIVES FUND/VA
| | | | | | | | |
| | | Shares | | | Value | |
| Oil, Gas & Consumable Fuels (Continued) | | | | | | | | |
| Safe Bulkers, Inc.1 | | | 1,076 | | | $ | 3,475 | |
| SandRidge Energy, Inc.1 | | | 1,470 | | | | 30,973 | |
| Scorpio Bulkers, Inc. | | | 794 | | | | 5,876 | |
| Scorpio Tankers, Inc. | | | 3,056 | | | | 9,321 | |
| SemGroup Corp., Cl. A | | | 808 | | | | 24,402 | |
| Ship Finance International Ltd. | | | 851 | | | | 13,191 | |
| SRC Energy, Inc.1 | | | 2,071 | | | | 17,666 | |
| Stone Energy Corp.1 | | | 220 | | | | 7,075 | |
| Tallgrass Energy GP LP, Cl. A | | | 44,477 | | | | 1,144,838 | |
| Tallgrass Energy Partners LP5 | | | 4,600 | | | | 210,910 | |
| Targa Resources Corp.6 | | | 34,122 | | | | 1,652,187 | |
| TC PipeLines LP5 | | | 26,895 | | | | 1,428,125 | |
| Teekay Tankers Ltd., Cl. A | | | 1,458 | | | | 2,041 | |
| TOTAL SA7 | | | 4,014 | | | | 221,474 | |
| TOTAL SA, Sponsored ADR7 | | | 15,090 | | | | 834,175 | |
| Ultra Petroleum Corp.1 | | | 1,539 | | | | 13,943 | |
| Valero Energy Corp. | | | 6,781 | | | | 623,242 | |
| W&T Offshore, Inc.1 | | | 1,300 | | | | 4,303 | |
| Western Gas Partners LP5 | | | 7,835 | | | | 376,785 | |
| Westmoreland Coal Co.1 | | | 268 | | | | 324 | |
| WildHorse Resource Development Corp.1 | | | 755 | | | | 13,900 | |
| Williams Cos., Inc. (The) | | | 17,570 | | | | 535,709 | |
| Williams Partners LP5 | | | 27,417 | | | | 1,063,231 | |
| | | | | | | | 30,812,393 | |
| Financials—10.4% | | | | | | | | |
| Capital Markets—0.7% | | | | | | | | |
| 3i Group plc | | | 5,281 | | | | 65,096 | |
| Arlington Asset Investment Corp., Cl. A | | | 258 | | | | 3,039 | |
| Artisan Partners Asset Management, Inc., Cl. A | | | 412 | | | | 16,274 | |
| Associated Capital Group, Inc., Cl. A | | | 240 | | | | 8,184 | |
| AXA SA | | | 5,284 | | | | 156,610 | |
| B. Riley Financial, Inc. | | | 232 | | | | 4,199 | |
| Bank of New York Mellon Corp. (The) | | | 792 | | | | 42,657 | |
| BlackRock, Inc., Cl. A | | | 86 | | | | 44,179 | |
| Cohen & Steers, Inc. | | | 409 | | | | 19,342 | |
| Cowen, Inc., Cl. A1 | | | 296 | | | | 4,040 | |
| Diamond Hill Investment Group, Inc. | | | 42 | | | | 8,680 | |
| Donnelley Financial Solutions, Inc.1 | | | 336 | | | | 6,549 | |
| Evercore, Inc., Cl. A | | | 337 | | | | 30,330 | |
| Financial Engines, Inc. | | | 774 | | | | 23,452 | |
| GAIN Capital Holdings, Inc. | | | 417 | | | | 4,170 | |
| GAMCO Investors, Inc., Cl. A | | | 273 | | | | 8,094 | |
| Goldman Sachs Group, Inc. (The) | | | 4,063 | | | | 1,035,090 | |
| Hamilton Lane, Inc., Cl. A | | | 146 | | | | 5,167 | |
| Houlihan Lokey, Inc., Cl. A | | | 588 | | | | 26,713 | |
| INTL. FCStone, Inc.1 | | | 216 | | | | 9,186 | |
| Investment Technology Group, Inc. | | | 408 | | | | 7,854 | |
| Ladenburg Thalmann Financial Services, Inc. | | | 1,648 | | | | 5,208 | |
| Medley Management, Inc., Cl. A | | | 41 | | | | 266 | |
| Moelis & Co., Cl. A | | | 281 | | | | 13,628 | |
| Morgan Stanley | | | 746 | | | | 39,143 | |
| OM Asset Management plc | | | 1,247 | | | | 20,887 | |
| Oppenheimer Holdings, Inc., Cl. A | | | 129 | | | | 3,457 | |
| Piper Jaffray Cos. | | | 114 | | | | 9,833 | |
| PJT Partners, Inc., Cl. A | | | 160 | | | | 7,296 | |
| Pzena Investment Management, Inc., Cl. A | | | 223 | | | | 2,379 | |
| Raymond James Financial, Inc. | | | 5,430 | | | | 484,899 | |
| Safeguard Scientifics, Inc.1 | | | 220 | | | | 2,464 | |
| Schroders plc | | | 1,235 | | | | 58,418 | |
| Silvercrest Asset Management Group, Inc., Cl. A | | | 106 | | | | 1,701 | |
| State Street Corp. | | | 7,710 | | | | 752,573 | |
| Stifel Financial Corp. | | | 611 | | | | 36,391 | |
| Virtus Investment Partners, Inc. | | | 66 | | | | 7,593 | |
| | | | | | | | |
| | | Shares | | | Value | |
| Capital Markets (Continued) | | | | | | | | |
| Waddell & Reed Financial, Inc., Cl. A | | | 727 | | | $ | 16,241 | |
| Westwood Holdings Group, Inc. | | | 103 | | | | 6,820 | |
| WisdomTree Investments, Inc. | | | 1,250 | | | | 15,688 | |
| | | | | | | 3,013,790 | |
| Commercial Banks—1.5% | | | | | | | | |
| 1st Source Corp. | | | 245 | | | | 12,115 | |
| Access National Corp. | | | 191 | | | | 5,317 | |
| ACNB Corp. | | | 82 | | | | 2,423 | |
| Allegiance Bancshares, Inc.1 | | | 123 | | | | 4,631 | |
| American National Bankshares, Inc. | | | 100 | | | | 3,830 | |
| Ameris Bancorp | | | 340 | | | | 16,388 | |
| Arrow Financial Corp. | | | 126 | | | | 4,278 | |
| Atlantic Capital Bancshares, Inc.1 | | | 233 | | | | 4,101 | |
| Banc of California, Inc. | | | 446 | | | | 9,210 | |
| BancFirst Corp. | | | 290 | | | | 14,833 | |
| Banco Latinoamericano de Comercio Exterior SA, Cl. E | | | 332 | | | | 8,931 | |
| Bancorp, Inc. (The)1 | | | 592 | | | | 5,849 | |
| BancorpSouth Bank | | | 813 | | | | 25,569 | |
| Bank of America Corp. | | | 1,368 | | | | 40,383 | |
| Bank of Commerce Holdings | | | 153 | | | | 1,759 | |
| Bank of Marin Bancorp | | | 56 | | | | 3,808 | |
| Bank of NT Butterfield & Son Ltd. (The) | | | 634 | | | | 23,008 | |
| Bankwell Financial Group, Inc. | | | 97 | | | | 3,331 | |
| Banner Corp. | | | 404 | | | | 22,268 | |
| Bar Harbor Bankshares | | | 155 | | | | 4,187 | |
| Barclays plc | | | 24,947 | | | | 68,021 | |
| BCB Bancorp, Inc. | | | 137 | | | | 1,986 | |
| Berkshire Hills Bancorp, Inc. | | | 380 | | | | 13,908 | |
| Blue Hills Bancorp, Inc. | | | 259 | | | | 5,206 | |
| BNP Paribas SA | | | 1,530 | | | | 114,098 | |
| Boston Private Financial Holdings, Inc. | | | 774 | | | | 11,958 | |
| Bridge Bancorp, Inc. | | | 184 | | | | 6,440 | |
| Brookline Bancorp, Inc. | | | 900 | | | | 14,130 | |
| Bryn Mawr Bank Corp. | | | 160 | | | | 7,072 | |
| Byline Bancorp, Inc.1 | | | 336 | | | | 7,718 | |
| C&F Financial Corp. | | | 32 | | | | 1,856 | |
| Cadence BanCorp, Cl. A1 | | | 1,018 | | | | 27,608 | |
| Camden National Corp. | | | 139 | | | | 5,856 | |
| Capital City Bank Group, Inc. | | | 202 | | | | 4,634 | |
| Capstar Financial Holdings, Inc.1 | | | 99 | | | | 2,056 | |
| Carolina Financial Corp. | | | 146 | | | | 5,424 | |
| Cathay General Bancorp | | | 737 | | | | 31,079 | |
| CenterState Bank Corp. | | | 558 | | | | 14,357 | |
| Central Pacific Financial Corp. | | | 356 | | | | 10,619 | |
| Central Valley Community Bancorp | | | 147 | | | | 2,966 | |
| Century Bancorp, Inc., Cl. A | | | 55 | | | | 4,304 | |
| Chemical Financial Corp. | | | 629 | | | | 33,633 | |
| Chemung Financial Corp. | | | 43 | | | | 2,068 | |
| Citigroup, Inc. | | | 640 | | | | 47,622 | |
| Citizens & Northern Corp. | | | 110 | | | | 2,640 | |
| City Holding Co. | | | 146 | | | | 9,851 | |
| Civista Bancshares, Inc. | | | 96 | | | | 2,112 | |
| CNB Financial Corp. | | | 146 | | | | 3,831 | |
| CoBiz Financial, Inc. | | | 382 | | | | 7,636 | |
| Codorus Valley Bancorp, Inc. | | | 119 | | | | 3,276 | |
| Columbia Banking System, Inc. | | | 522 | | | | 22,676 | |
| Community Bank System, Inc. | | | 478 | | | | 25,692 | |
| Community Bankers Trust Corp.1 | | | 208 | | | | 1,695 | |
| Community Financial Corp. (The) | | | 44 | | | | 1,685 | |
| Community Trust Bancorp, Inc. | | | 162 | | | | 7,630 | |
| ConnectOne Bancorp, Inc. | | | 300 | | | | 7,725 | |
| County Bancorp, Inc. | | | 65 | | | | 1,934 | |
| Credit Agricole SA | | | 7,809 | | | | 129,003 | |
| Customers Bancorp, Inc.1 | | | 294 | | | | 7,641 | |
| CVB Financial Corp. | | | 1,012 | | | | 23,843 | |
| DNB Financial Corp. | | | 39 | | | | 1,314 | |
| Eagle Bancorp, Inc.1 | | | 326 | | | | 18,875 | |
11 OPPENHEIMER GLOBAL MULTI-ALTERNATIVES FUND/VA
CONSOLIDATED STATEMENT OF INVESTMENTS Continued
| | | | | | | | |
| | | Shares | | | Value | |
| Commercial Banks (Continued) | | | | | | | | |
| Enterprise Bancorp, Inc. | | | 106 | | | $ | 3,609 | |
| Enterprise Financial Services Corp. | | | 210 | | | | 9,481 | |
| Equity Bancshares, Inc., Cl. A1 | | | 114 | | | | 4,037 | |
| Evans Bancorp, Inc. | | | 44 | | | | 1,844 | |
| Farmers Capital Bank Corp. | | | 93 | | | | 3,581 | |
| Farmers National Banc Corp. | | | 322 | | | | 4,750 | |
| FB Financial Corp.1 | | | 278 | | | | 11,673 | |
| FCB Financial Holdings, Inc., Cl. A1 | | | 366 | | | | 18,593 | |
| Fidelity Southern Corp. | | | 252 | | | | 5,494 | |
| Financial Institutions, Inc. | | | 189 | | | | 5,878 | |
| First BanCorp (Puerto Rico)1 | | | 2,116 | | | | 10,792 | |
| First Bancorp (Southern Pines NC) | | | 227 | | | | 8,015 | |
| First Bancorp, Inc. (Maine) | | | 103 | | | | 2,805 | |
| First Busey Corp. | | | 543 | | | | 16,257 | |
| First Business Financial Services, Inc. | | | 79 | | | | 1,747 | |
| First Citizens BancShares, Inc., Cl. A | | | 139 | | | | 56,017 | |
| First Commonwealth Financial Corp. | | | 890 | | | | 12,745 | |
| First Community Bancshares, Inc. | | | 206 | | | | 5,918 | |
| First Connecticut Bancorp, Inc. (Farmington CT) | | | 193 | | | | 5,047 | |
| First Financial Bancorp | | | 566 | | | | 14,914 | |
| First Financial Bankshares, Inc. | | | 599 | | | | 26,985 | |
| First Financial Corp. | | | 147 | | | | 6,666 | |
| First Financial Northwest, Inc. | | | 129 | | | | 2,001 | |
| First Foundation, Inc.1 | | | 323 | | | | 5,988 | |
| First Horizon National Corp. | | | 591 | | | | 11,814 | |
| First Internet Bancorp | | | 75 | | | | 2,861 | |
| First Interstate BancSystem, Inc., Cl. A | | | 529 | | | | 21,186 | |
| First Merchants Corp. | | | 588 | | | | 24,731 | |
| First Mid-Illinois Bancshares, Inc. | | | 114 | | | | 4,394 | |
| First Midwest Bancorp, Inc. | | | 899 | | | | 21,585 | |
| First Northwest Bancorp1 | | | 137 | | | | 2,233 | |
| First of Long Island Corp. (The) | | | 242 | | | | 6,897 | |
| Flushing Financial Corp. | | | 289 | | | | 7,948 | |
| FNB Bancorp | | | 67 | | | | 2,445 | |
| Franklin Financial Network, Inc.1 | | | 123 | | | | 4,194 | |
| Fulton Financial Corp. | | | 1,588 | | | | 28,425 | |
| German American Bancorp, Inc. | | | 208 | | | | 7,349 | |
| Glacier Bancorp, Inc. | | | 700 | | | | 27,573 | |
| Great Southern Bancorp, Inc. | | | 170 | | | | 8,781 | |
| Great Western Bancorp, Inc. | | | 547 | | | | 21,771 | |
| Green Bancorp, Inc.1 | | | 347 | | | | 7,044 | |
| Guaranty Bancorp | | | 339 | | | | 9,373 | |
| Guaranty Bancshares, Inc. | | | 98 | | | | 3,004 | |
| Hancock Holding Co. | | | 982 | | | | 48,609 | |
| Hanmi Financial Corp. | | | 383 | | | | 11,624 | |
| HarborOne Bancorp, Inc.1 | | | 311 | | | | 5,959 | |
| Heartland Financial USA, Inc. | | | 276 | | | | 14,807 | |
| Heritage Commerce Corp. | | | 453 | | | | 6,940 | |
| Heritage Financial Corp. | | | 265 | | | | 8,162 | |
| Hilltop Holdings, Inc. | | | 1,108 | | | | 28,066 | |
| Home BancShares, Inc. | | | 1,553 | | | | 36,107 | |
| HomeTrust Bancshares, Inc.1 | | | 225 | | | | 5,794 | |
| Hope Bancorp, Inc. | | | 1,262 | | | | 23,032 | |
| Horizon Bancorp | | | 285 | | | | 7,923 | |
| Howard Bancorp, Inc.1 | | | 88 | | | | 1,936 | |
| HSBC Holdings plc | | | 6,511 | | | | 67,148 | |
| IBERIABANK Corp. | | | 623 | | | | 48,283 | |
| Independent Bank Corp. | | | 261 | | | | 5,833 | |
| Independent Bank Corp. (Rockland MA) | | | 258 | | | | 18,021 | |
| Independent Bank Group, Inc. | | | 240 | | | | 16,224 | |
| International Bancshares Corp. | | | 793 | | | | 31,482 | |
| Investors Bancorp, Inc. | | | 2,793 | | | | 38,767 | |
| JPMorgan Chase & Co. | | | 541 | | | | 57,855 | |
| Lakeland Bancorp, Inc. | | | 441 | | | | 8,489 | |
| Lakeland Financial Corp. | | | 226 | | | | 10,959 | |
| LCNB Corp. | | | 119 | | | | 2,434 | |
| LegacyTexas Financial Group, Inc. | | | 433 | | | | 18,277 | |
| | | | | | | | |
| | | Shares | | | Value | |
| Commercial Banks (Continued) | | | | | | | | |
| Live Oak Bancshares, Inc. | | | 347 | | | $ | 8,276 | |
| Lloyds Banking Group plc | | | 105,575 | | | | 96,675 | |
| M&T Bank Corp.6 | | | 15,725 | | | | 2,688,818 | |
| Macatawa Bank Corp. | | | 317 | | | | 3,170 | |
| MainSource Financial Group, Inc. | | | 297 | | | | 10,784 | |
| MB Financial, Inc. | | | 784 | | | | 34,904 | |
| MBT Financial Corp. | | | 270 | | | | 2,862 | |
| Mercantile Bank Corp. | | | 196 | | | | 6,933 | |
| Midland States Bancorp, Inc. | | | 176 | | | | 5,716 | |
| MidSouth Bancorp, Inc. | | | 150 | | | | 1,988 | |
| MidWestOne Financial Group, Inc. | | | 112 | | | | 3,755 | |
| MutualFirst Financial, Inc. | | | 92 | | | | 3,547 | |
| National Bank Holdings Corp., Cl. A | | | 245 | | | | 7,945 | |
| National Commerce Corp.1 | | | 138 | | | | 5,555 | |
| NBT Bancorp, Inc. | | | 405 | | | | 14,904 | |
| Nicolet Bankshares, Inc.1 | | | 91 | | | | 4,981 | |
| Northeast Bancorp | | | 88 | | | | 2,037 | |
| Northrim BanCorp, Inc. | | | 56 | | | | 1,896 | |
| OFG Bancorp | | | 378 | | | | 3,553 | |
| Ohio Valley Banc Corp. | | | 40 | | | | 1,616 | |
| Old Line Bancshares, Inc. | | | 118 | | | | 3,474 | |
| Old National Bancorp | | | 1,279 | | | | 22,319 | |
| Old Second Bancorp, Inc. | | | 286 | | | | 3,904 | |
| Opus Bank1 | | | 317 | | | | 8,654 | |
| Orrstown Financial Services, Inc. | | | 103 | | | | 2,601 | |
| Pacific Mercantile Bancorp1 | | | 214 | | | | 1,873 | |
| Pacific Premier Bancorp, Inc.1 | | | 388 | | | | 15,520 | |
| Paragon Commercial Corp.1 | | | 67 | | | | 3,565 | |
| Park National Corp. | | | 141 | | | | 14,664 | |
| Parke Bancorp, Inc. | | | 75 | | | | 1,541 | |
| Peapack Gladstone Financial Corp. | | | 170 | | | | 5,953 | |
| Penns Woods Bancorp, Inc. | | | 43 | | | | 2,003 | |
| Peoples Bancorp, Inc. | | | 218 | | | | 7,111 | |
| People’s Utah Bancorp | | | 217 | | | | 6,575 | |
| PNC Financial Services Group, Inc. (The) | | | 3,430 | | | | 494,915 | |
| Preferred Bank (Los Angeles CA) | | | 136 | | | | 7,994 | |
| Premier Financial Bancorp, Inc. | | | 135 | | | | 2,711 | |
| QCR Holdings, Inc. | | | 169 | | | | 7,242 | |
| RBB Bancorp | | | 192 | | | | 5,255 | |
| Renasant Corp. | | | 449 | | | | 18,360 | |
| Republic Bancorp, Inc., Cl. A | | | 233 | | | | 8,859 | |
| Republic First Bancorp, Inc.1 | | | 528 | | | | 4,462 | |
| Royal Bank of Scotland Group plc1 | | | 28,425 | | | | 106,021 | |
| S&T Bancorp, Inc. | | | 324 | | | | 12,898 | |
| Sandy Spring Bancorp, Inc. | | | 233 | | | | 9,092 | |
| Seacoast Banking Corp. of Florida1 | | | 505 | | | | 12,731 | |
| ServisFirst Bancshares, Inc. | | | 490 | | | | 20,335 | |
| Shore Bancshares, Inc. | | | 146 | | | | 2,438 | |
| Sierra Bancorp | | | 160 | | | | 4,250 | |
| Simmons First National Corp., Cl. A | | | 304 | | | | 17,358 | |
| SmartFinancial, Inc.1 | | | 82 | | | | 1,779 | |
| Societe Generale SA | | | 1,894 | | | | 97,650 | |
| South State Corp. | | | 339 | | | | 29,544 | |
| Southern First Bancshares, Inc.1 | | | 62 | | | | 2,558 | |
| Southern National Bancorp of Virginia, Inc. | | | 217 | | | | 3,479 | |
| Southside Bancshares, Inc. | | | 273 | | | | 9,195 | |
| Standard Chartered plc1 | | | 6,201 | | | | 65,255 | |
| State Bank Financial Corp. | | | 351 | | | | 10,474 | |
| Sterling Bancorp | | | 1,270 | | | | 31,242 | |
| Stock Yards Bancorp, Inc. | | | 204 | | | | 7,691 | |
| Summit Financial Group, Inc. | | | 118 | | | | 3,106 | |
| Sun Bancorp, Inc. | | | 179 | | | | 4,350 | |
| Sunshine Bancorp, Inc.1 | | | 74 | | | | 1,698 | |
| Texas Capital Bancshares, Inc.1 | | | 447 | | | | 39,738 | |
| Tompkins Financial Corp. | | | 141 | | | | 11,470 | |
| Towne Bank (Portsmouth VA) | | | 593 | | | | 18,235 | |
| TriCo Bancshares | | | 276 | | | | 10,449 | |
12 OPPENHEIMER GLOBAL MULTI-ALTERNATIVES FUND/VA
| | | | | | | | |
| | | Shares | | | Value | |
| Commercial Banks (Continued) | | | | | | | | |
| TriState Capital Holdings, Inc.1 | | | 254 | | | $ | 5,842 | |
| Triumph Bancorp, Inc.1 | | | 184 | | | | 5,796 | |
| Trustmark Corp. | | | 622 | | | | 19,817 | |
| Two River Bancorp | | | 85 | | | | 1,541 | |
| UMB Financial Corp. | | | 462 | | | | 33,227 | |
| Umpqua Holdings Corp. | | | 1,929 | | | | 40,123 | |
| Union Bankshares Corp. | | | 379 | | | | 13,708 | |
| United Bankshares, Inc. | | | 951 | | | | 33,047 | |
| United Community Banks, Inc. | | | 854 | | | | 24,032 | |
| United Security Bancshares (Fresno CA) | | | 153 | | | | 1,683 | |
| Unity Bancorp, Inc. | | | 95 | | | | 1,876 | |
| Univest Corp. of Pennsylvania | | | 263 | | | | 7,377 | |
| US Bancorp | | | 938 | | | | 50,258 | |
| Valley National Bancorp | | | 2,417 | | | | 27,119 | |
| Veritex Holdings, Inc.1 | | | 203 | | | | 5,601 | |
| Washington Trust Bancorp, Inc. | | | 159 | | | | 8,467 | |
| WashingtonFirst Bankshares, Inc. | | | 163 | | | | 5,584 | |
| Wells Fargo & Co. | | | 893 | | | | 54,178 | |
| WesBanco, Inc. | | | 400 | | | | 16,260 | |
| West Bancorporation, Inc. | | | 181 | | | | 4,552 | |
| Westamerica Bancorporation | | | 235 | | | | 13,994 | |
| Wintrust Financial Corp. | | | 512 | | | | 42,173 | |
| Xenith Bankshares, Inc.1 | | | 200 | | | | 6,766 | |
| | | | | | | 6,446,600 | |
| Consumer Finance—0.1% | | | | | | | | |
| American Express Co. | | | 622 | | | | 61,771 | |
| Capital One Financial Corp. | | | 485 | | | | 48,296 | |
| Elevate Credit, Inc.1 | | | 413 | | | | 3,110 | |
| Encore Capital Group, Inc.1 | | | 247 | | | | 10,399 | |
| Enova International, Inc.1 | | | 318 | | | | 4,834 | |
| EZCORP, Inc., Cl. A1 | | | 438 | | | | 5,344 | |
| FirstCash, Inc. | | | 425 | | | | 28,666 | |
| Green Dot Corp., Cl. A1 | | | 439 | | | | 26,454 | |
| LendingClub Corp.1 | | | 5,112 | | | | 21,112 | |
| Nelnet, Inc., Cl. A | | | 423 | | | | 23,172 | |
| PRA Group, Inc.1 | | | 343 | | | | 11,388 | |
| Regional Management Corp.1 | | | 14,607 | | | | 384,310 | |
| World Acceptance Corp.1 | | | 88 | | | | 7,103 | |
| | | | | | | | 635,959 | |
| Diversified Financial Services—0.0% | | | | | | | | |
| Berkshire Hathaway, Inc., Cl. B1 | | | 285 | | | | 56,493 | |
| Cannae Holdings, Inc.1 | | | 3,031 | | | | 51,618 | |
| Marlin Business Services Corp. | | | 140 | | | | 3,136 | |
| NewStar Financial, Inc.1,3,4 | | | 409 | | | | 199 | |
| On Deck Capital, Inc.1 | | | 649 | | | | 3,725 | |
| Tiptree, Inc. | | | 280 | | | | 1,666 | |
| | | | | | | | 116,837 | |
| Insurance—1.6% | | | | | | | | |
| Allstate Corp. (The) | | | 20,738 | | | | 2,171,476 | |
| Ambac Financial Group, Inc.1 | | | 463 | | | | 7,399 | |
| American Equity Investment Life Holding Co. | | | 783 | | | | 24,062 | |
| American International Group, Inc. | | | 931 | | | | 55,469 | |
| AMERISAFE, Inc. | | | 180 | | | | 11,088 | |
| AmTrust Financial Services, Inc. | | | 2,417 | | | | 24,339 | |
| Argo Group International Holdings Ltd. | | | 388 | | | | 23,920 | |
| Atlas Financial Holdings, Inc.1 | | | 145 | | | | 2,980 | |
| Aviva plc | | | 10,654 | | | | 72,810 | |
| Baldwin & Lyons, Inc., Cl. B | | | 173 | | | | 4,143 | |
| Blue Capital Reinsurance Holdings Ltd. | | | 90 | | | | 1,085 | |
| Chubb Ltd. | | | 21,475 | | | | 3,138,142 | |
| CNO Financial Group, Inc. | | | 1,510 | | | | 37,282 | |
| Crawford & Co., Cl. B | | | 621 | | | | 5,974 | |
| Direct Line Insurance Group plc | | | 11,359 | | | | 58,538 | |
| Donegal Group, Inc., Cl. A | | | 317 | | | | 5,484 | |
| eHealth, Inc.1 | | | 195 | | | | 3,387 | |
| EMC Insurance Group, Inc. | | | 248 | | | | 7,115 | |
| | | | | | | | |
| | | Shares | | | Value | |
| Insurance (Continued) | | | | | | | | |
| Employers Holdings, Inc. | | | 385 | | | $ | 17,094 | |
| Enstar Group Ltd.1 | | | 189 | | | | 37,942 | |
| FBL Financial Group, Inc., Cl. A | | | 242 | | | | 16,855 | |
| Federated National Holding Co. | | | 140 | | | | 2,320 | |
| Genworth Financial, Inc., Cl. A1 | | | 5,943 | | | | 18,483 | |
| Global Indemnity Ltd.1 | | | 161 | | | | 6,765 | |
| Greenlight Capital Re Ltd., Cl. A1 | | | 352 | | | | 7,075 | |
| Hallmark Financial Services, Inc.1 | | | 230 | | | | 2,399 | |
| HCI Group, Inc. | | | 107 | | | | 3,199 | |
| Health Insurance Innovations, Inc., Cl. A1 | | | 4,621 | | | | 115,294 | |
| Horace Mann Educators Corp. | | | 465 | | | | 20,506 | |
| Independence Holding Co. | | | 129 | | | | 3,541 | |
| Infinity Property & Casualty Corp. | | | 117 | | | | 12,402 | |
| Investors Title Co. | | | 17 | | | | 3,372 | |
| James River Group Holdings Ltd. | | | 293 | | | | 11,723 | |
| Kemper Corp. | | | 452 | | | | 31,143 | |
| Kingstone Cos., Inc. | | | 84 | | | | 1,579 | |
| Kinsale Capital Group, Inc. | | | 194 | | | | 8,730 | |
| Legal & General Group plc | | | 19,648 | | | | 72,324 | |
| Maiden Holdings Ltd. | | | 1,017 | | | | 6,712 | |
| MetLife, Inc. | | | 837 | | | | 42,319 | |
| National General Holdings Corp. | | | 964 | | | | 18,933 | |
| National Western Life Group, Inc., Cl. A | | | 34 | | | | 11,255 | |
| Navigators Group, Inc. (The) | | | 405 | | | | 19,723 | |
| NI Holdings, Inc.1 | | | 215 | | | | 3,651 | |
| Old Mutual plc | | | 14,374 | | | | 44,953 | |
| Primerica, Inc. | | | 357 | | | | 36,253 | |
| Prudential plc | | | 1,817 | | | | 46,715 | |
| RLI Corp. | | | 413 | | | | 25,053 | |
| RSA Insurance Group plc | | | 7,682 | | | | 65,460 | |
| Safety Insurance Group, Inc. | | | 144 | | | | 11,578 | |
| Selective Insurance Group, Inc. | | | 538 | | | | 31,581 | |
| St James’s Place plc | | | 3,567 | | | | 58,961 | |
| Standard Life Aberdeen plc | | | 6,617 | | | | 38,983 | |
| State Auto Financial Corp. | | | 367 | | | | 10,687 | |
| Stewart Information Services Corp. | | | 273 | | | | 11,548 | |
| Third Point Reinsurance Ltd.1 | | | 965 | | | | 14,137 | |
| United Fire Group, Inc. | | | 291 | | | | 13,264 | |
| United Insurance Holdings Corp. | | | 382 | | | | 6,589 | |
| Universal Insurance Holdings, Inc. | | | 295 | | | | 8,068 | |
| WMIH Corp.1 | | | 1,937 | | | | 1,645 | |
| | | | | | | | 6,575,507 | |
| Real Estate Investment Trusts (REITs)—4.6% | |
| Acadia Realty Trust | | | 9,016 | | | | 246,678 | |
| AG Mortgage Investment Trust, Inc. | | | 265 | | | | 5,038 | |
| Agree Realty Corp. | | | 5,555 | | | | 285,749 | |
| Alexander & Baldwin, Inc. | | | 725 | | | | 20,111 | |
| Alexander’s, Inc. | | | 61 | | | | 24,147 | |
| Allied Properties Real Estate Investment Trust | | | 5,052 | | | | 169,123 | |
| Altisource Residential Corp. | | | 493 | | | | 5,847 | |
| American Assets Trust, Inc. | | | 10,385 | | | | 397,122 | |
| American Tower Corp. | | | 1,110 | | | | 158,364 | |
| Anworth Mortgage Asset Corp. | | | 1,187 | | | | 6,457 | |
| Apollo Commercial Real Estate Finance, Inc. | | | 967 | | | | 17,841 | |
| Ares Commercial Real Estate Corp. | | | 336 | | | | 4,334 | |
| Armada Hoffler Properties, Inc. | | | 393 | | | | 6,103 | |
| ARMOUR Residential REIT, Inc. | | | 390 | | | | 10,031 | |
| Ascendas Real Estate Investment Trust | | | 53,000 | | | | 107,756 | |
| Ashford Hospitality Prime, Inc. | | | 411 | | | | 3,999 | |
| Ashford Hospitality Trust, Inc. | | | 1,283 | | | | 8,635 | |
| Ashtead Group plc | | | 2,213 | | | | 59,060 | |
| AvalonBay Communities, Inc. | | | 1,770 | | | | 315,786 | |
| Blackstone Mortgage Trust, Inc., Cl. A | | | 42,855 | | | | 1,379,074 | |
| Bluerock Residential Growth REIT, Inc., Cl. A | | | 229 | | | | 2,315 | |
13 OPPENHEIMER GLOBAL MULTI-ALTERNATIVES FUND/VA
CONSOLIDATED STATEMENT OF INVESTMENTS Continued
| | | | | | | | |
| | | Shares | | | Value | |
| Real Estate Investment Trusts (REITs) (Continued) | | | | | |
| Boston Properties, Inc. | | | 3,580 | | | $ | 465,507 | |
| British Land Co. plc (The) | | | 7,887 | | | | 73,585 | |
| Camden Property Trust | | | 3,470 | | | | 319,448 | |
| Capstead Mortgage Corp. | | | 885 | | | | 7,655 | |
| CareTrust REIT, Inc. | | | 741 | | | | 12,419 | |
| CatchMark Timber Trust, Inc., Cl. A | | | 460 | | | | 6,040 | |
| CBL & Associates Properties, Inc. | | | 2,255 | | | | 12,763 | |
| Cedar Realty Trust, Inc. | | | 759 | | | | 4,615 | |
| Chatham Lodging Trust | | | 362 | | | | 8,239 | |
| Cherry Hill Mortgage Investment Corp. | | | 120 | | | | 2,159 | |
| Chesapeake Lodging Trust | | | 5,061 | | | | 137,102 | |
| City Office REIT, Inc. | | | 364 | | | | 4,736 | |
| Clipper Realty, Inc. | | | 182 | | | | 1,818 | |
| Community Healthcare Trust, Inc. | | | 172 | | | | 4,833 | |
| CorEnergy Infrastructure Trust, Inc. | | | 116 | | | | 4,431 | |
| Cousins Properties, Inc. | | | 26,258 | | | | 242,887 | |
| Crown Castle International Corp. | | | 1,490 | | | | 165,405 | |
| CYS Investments, Inc. | | | 1,451 | | | | 11,652 | |
| Derwent London plc | | | 1,780 | | | | 74,912 | |
| Dexus | | | 25,600 | | | | 194,415 | |
| DiamondRock Hospitality Co. | | | 1,840 | | | | 20,774 | |
| Digital Realty Trust, Inc. | | | 4,230 | | | | 481,797 | |
| Duke Realty Corp. | | | 14,470 | | | | 393,729 | |
| Dynex Capital, Inc. | | | 474 | | | | 3,323 | |
| Easterly Government Properties, Inc. | | | 394 | | | | 8,408 | |
| EastGroup Properties, Inc. | | | 314 | | | | 27,751 | |
| Education Realty Trust, Inc. | | | 684 | | | | 23,885 | |
| Ellington Residential Mortgage REIT | | | 131 | | | | 1,577 | |
| Equinix, Inc. | | | 460 | | | | 208,481 | |
| Essex Property Trust, Inc. | | | 1,570 | | | | 378,951 | |
| Farmland Partners, Inc. | | | 288 | | | | 2,500 | |
| First Industrial Realty Trust, Inc. | | | 1,387 | | | | 43,649 | |
| Four Corners Property Trust, Inc. | | | 706 | | | | 18,144 | |
| Franklin Street Properties Corp. | | | 932 | | | | 10,010 | |
| Gaming & Leisure Properties, Inc. | | | 4,120 | | | | 152,440 | |
| Gecina SA | | | 1,010 | | | | 186,347 | |
| GEO Group, Inc. (The) | | | 7,804 | | | | 184,174 | |
| Getty Realty Corp. | | | 373 | | | | 10,131 | |
| Gladstone Commercial Corp. | | | 257 | | | | 5,412 | |
| Global Medical REIT, Inc. | | | 182 | | | | 1,492 | |
| Global Net Lease, Inc. | | | 636 | | | | 13,089 | |
| Goodman Group | | | 56,800 | | | | 372,331 | |
| Government Properties Income Trust | | | 914 | | | | 16,946 | |
| Gramercy Property Trust | | | 1,584 | | | | 42,229 | |
| Granite Point Mortgage Trust, Inc. | | | 423 | | | | 7,504 | |
| Great Ajax Corp. | | | 171 | | | | 2,363 | |
| Green REIT plc | | | 93,771 | | | | 174,940 | |
| Hammerson plc | | | 23,523 | | | | 173,629 | |
| Hannon Armstrong Sustainable Infrastructure Capital, Inc. | | | 495 | | | | 11,910 | |
| Healthcare Realty Trust, Inc. | | | 5,433 | | | | 174,508 | |
| Hersha Hospitality Trust, Cl. A | | | 397 | | | | 6,908 | |
| Hispania Activos Inmobiliarios SOCIMI SA | | | 6,232 | | | | 117,255 | |
| ICADE | | | 2,040 | | | | 200,506 | |
| Independence Realty Trust, Inc. | | | 20,522 | | | | 207,067 | |
| InfraREIT, Inc. | | | 567 | | | | 10,535 | |
| Invesco Mortgage Capital, Inc. | | | 1,030 | | | | 18,365 | |
| Investa Office Fund | | | 44,300 | | | | 157,153 | |
| Investors Real Estate Trust | | | 1,102 | | | | 6,259 | |
| Invincible Investment Corp. | | | 257 | | | | 109,237 | |
| Invitation Homes, Inc. | | | 24,353 | | | | 574,000 | |
| iStar, Inc.1 | | | 657 | | | | 7,424 | |
| Japan Retail Fund Investment Corp. | | | 59 | | | | 108,154 | |
| Jernigan Capital, Inc. | | | 134 | | | | 2,547 | |
| Keppel REIT | | | 191,000 | | | | 180,229 | |
| Kilroy Realty Corp. | | | 6,670 | | | | 497,916 | |
| Kimco Realty Corp. | | | 12,680 | | | | 230,142 | |
| | | | | | | | |
| | | Shares | | | Value | |
| Real Estate Investment Trusts (REITs) (Continued) | |
| Kite Realty Group Trust | | | 769 | | | $ | 15,072 | |
| KKR Real Estate Finance Trust, Inc. | | | 501 | | | | 10,025 | |
| Ladder Capital Corp., Cl. A | | | 1,034 | | | | 14,093 | |
| Land Securities Group plc | | | 24,332 | | | | 329,994 | |
| LaSalle Hotel Properties | | | 1,063 | | | | 29,838 | |
| LaSalle Logiport REIT | | | 165 | | | | 168,852 | |
| Lexington Realty Trust | | | 2,840 | | | | 27,406 | |
| Link REIT | | | 27,500 | | | | 254,831 | |
| LondonMetric Property plc | | | 40,080 | | | | 100,589 | |
| LTC Properties, Inc. | | | 380 | | | | 16,549 | |
| Mack-Cali Realty Corp. | | | 876 | | | | 18,887 | |
| MedEquities Realty Trust, Inc. | | | 402 | | | | 4,510 | |
| Medical Properties Trust, Inc. | | | 9,230 | | | | 127,189 | |
| Monmouth Real Estate Investment Corp. | | | 880 | | | | 15,664 | |
| MTGE Investment Corp. | | | 545 | | | | 10,083 | |
| National Health Investors, Inc. | | | 384 | | | | 28,946 | |
| National Storage Affiliates Trust | | | 390 | | | | 10,631 | |
| New Senior Investment Group, Inc. | | | 848 | | | | 6,411 | |
| New York Mortgage Trust, Inc. | | | 998 | | | | 6,158 | |
| NexPoint Residential Trust, Inc. | | | 169 | | | | 4,722 | |
| NIPPON REIT Investment Corp. | | | 72 | | | | 206,633 | |
| NorthStar Realty Europe Corp. | | | 626 | | | | 8,407 | |
| One Liberty Properties, Inc. | | | 200 | | | | 5,184 | |
| Owens Realty Mortgage, Inc. | | | 136 | | | | 2,177 | |
| Paramount Group, Inc. | | | 11,080 | | | | 175,618 | |
| Park Hotels & Resorts, Inc. | | | 4,340 | | | | 124,775 | |
| Pebblebrook Hotel Trust | | | 604 | | | | 22,451 | |
| Pennsylvania Real Estate Investment Trust | | | 580 | | | | 6,896 | |
| PennyMac Mortgage Investment Trust | | | 640 | | | | 10,285 | |
| Physicians Realty Trust | | | 24,030 | | | | 432,300 | |
| Potlatch Corp. | | | 386 | | | | 19,261 | |
| Preferred Apartment Communities, Inc., Cl. A | | | 315 | | | | 6,379 | |
| Prologis, Inc. | | | 12,790 | | | | 825,083 | |
| PS Business Parks, Inc. | | | 332 | | | | 41,530 | |
| Pure Industrial Real Estate Trust | | | 53,173 | | | | 286,381 | |
| QTS Realty Trust, Inc., Cl. A | | | 496 | | | | 26,863 | |
| Quality Care Properties, Inc.1 | | | 1,233 | | | | 17,028 | |
| RAIT Financial Trust | | | 1,386 | | | | 520 | |
| Ramco-Gershenson Properties Trust | | | 658 | | | | 9,692 | |
| Realty Income Corp. | | | 2,300 | | | | 131,146 | |
| Redwood Trust, Inc. | | | 764 | | | | 11,322 | |
| Regency Centers Corp. | | | 7,742 | | | | 535,592 | |
| Resource Capital Corp. | | | 305 | | | | 2,858 | |
| Retail Opportunity Investments Corp. | | | 954 | | | | 19,032 | |
| Rexford Industrial Realty, Inc. | | | 896 | | | | 26,127 | |
| RLJ Lodging Trust | | | 1,654 | | | | 36,338 | |
| Ryman Hospitality Properties, Inc. | | | 456 | | | | 31,473 | |
| Sabra Health Care REIT, Inc. | | | 1,723 | | | | 32,341 | |
| Saul Centers, Inc. | | | 254 | | | | 15,685 | |
| Scentre Group | | | 41,600 | | | | 135,758 | |
| Segro plc | | | 8,016 | | | | 63,489 | |
| Select Income REIT | | | 1,051 | | | | 26,412 | |
| Simon Property Group, Inc. | | | 4,699 | | | | 807,006 | |
| STAG Industrial, Inc. | | | 857 | | | | 23,422 | |
| Starwood Property Trust, Inc. | | | 28,840 | | | | 615,734 | |
| STORE Capital Corp. | | | 5,470 | | | | 142,439 | |
| Summit Hotel Properties, Inc. | | | 1,033 | | | | 15,733 | |
| Sunstone Hotel Investors, Inc. | | | 2,083 | | | | 34,432 | |
| Sutherland Asset Management Corp. | | | 300 | | | | 4,545 | |
| Terreno Realty Corp. | | | 650 | | | | 22,789 | |
| Tier REIT, Inc. | | | 440 | | | | 8,972 | |
| TPG RE Finance Trust, Inc. | | | 757 | | | | 14,421 | |
| UMH Properties, Inc. | | | 319 | | | | 4,753 | |
| Unibail-Rodamco SE | | | 2,921 | | | | 735,878 | |
| Universal Health Realty Income Trust | | | 127 | | | | 9,539 | |
14 OPPENHEIMER GLOBAL MULTI-ALTERNATIVES FUND/VA
| | | | | | | | |
| | | Shares | | | Value | |
| Real Estate Investment Trusts (REITs) (Continued) | | | | | |
| Urban Edge Properties | | | 989 | | | $ | 25,210 | |
| Urstadt Biddle Properties, Inc., Cl. A | | | 428 | | | | 9,305 | |
| Ventas, Inc. | | | 2,870 | | | | 172,229 | |
| Vicinity Centres | | | 110,100 | | | | 233,926 | |
| Washington Prime Group, Inc. | | | 1,937 | | | | 13,791 | |
| Washington Real Estate Investment Trust | | | 740 | | | | 23,029 | |
| Welltower, Inc. | | | 7,340 | | | | 468,072 | |
| Western Asset Mortgage Capital Corp. | | | 398 | | | | 3,960 | |
| Weyerhaeuser Co. | | | 5,940 | | | | 209,444 | |
| Wheeler Real Estate Investment Trust, Inc. | | | 36,137 | | | | 360,647 | |
| Whitestone REIT, Cl. B | | | 330 | | | | 4,755 | |
| Worldpay Group plc2 | | | 18,311 | | | | 104,943 | |
| Xenia Hotels & Resorts, Inc. | | | 1,000 | | | | 21,590 | |
| | | | | | | | 19,160,362 | |
| Real Estate Management & Development—1.7% | | | | | |
| Ayala Land, Inc. | | | 116,500 | | | | 103,844 | |
| Barratt Developments plc | | | 5,562 | | | | 48,607 | |
| Carmila SA | | | 3,850 | | | | 107,236 | |
| Castellum AB | | | 10,424 | | | | 175,781 | |
| Central Pattana PCL | | | 39,500 | | | | 103,176 | |
| China Overseas Land & Investment Ltd. | | | 112,000 | | | | 360,479 | |
| China Vanke Co. Ltd., Cl. H | | | 76,999 | | | | 306,614 | |
| Ciputra Development Tbk PT | | | 403,900 | | | | 35,272 | |
| City Developments Ltd. | | | 40,000 | | | | 371,990 | |
| CK Asset Holdings Ltd. | | | 49,000 | | | | 428,304 | |
| Consolidated-Tomoka Land Co. | | | 50 | | | | 3,175 | |
| Country Garden Holdings Co. Ltd. | | | 127,000 | | | | 241,312 | |
| Deutsche Wohnen SE | | | 2,543 | | | | 110,877 | |
| Fabege AB | | | 8,926 | | | | 189,729 | |
| FRP Holdings, Inc.1 | | | 92 | | | | 4,071 | |
| Griffin Industrial Realty, Inc. | | | 48 | | | | 1,762 | |
| HFF, Inc., Cl. A | | | 355 | | | | 17,267 | |
| Hongkong Land Holdings Ltd. | | | 16,000 | | | | 112,510 | |
| Hulic Co. Ltd. | | | 21,200 | | | | 237,318 | |
| Inmobiliaria Colonial SA | | | 19,466 | | | | 193,041 | |
| Kennedy-Wilson Holdings, Inc. | | | 1,098 | | | | 19,050 | |
| Marcus & Millichap, Inc.1 | | | 321 | | | | 10,468 | |
| Maui Land & Pineapple Co., Inc.1 | | | 177 | | | | 3,062 | |
| Mitsubishi Estate Co. Ltd. | | | 15,100 | | | | 262,368 | |
| Mitsui Fudosan Co. Ltd. | | | 25,000 | | | | 560,449 | |
| New World Development Co. Ltd. | | | 113,000 | | | | 169,779 | |
| Persimmon plc | | | 1,195 | | | | 44,130 | |
| RE/MAX Holdings, Inc., Cl. A | | | 209 | | | | 10,137 | |
| RMR Group, Inc. (The), Cl. A | | | 133 | | | | 7,887 | |
| Safety Income & Growth, Inc. | | | 169 | | | | 2,974 | |
| SM Prime Holdings, Inc. | | | 126,000 | | | | 94,646 | |
| St Joe Co. (The)1 | | | 596 | | | | 10,758 | |
| StorageVault Canada, Inc. | | | 70,058 | | | | 146,581 | |
| Stratus Properties, Inc. | | | 73 | | | | 2,168 | |
| Sumitomo Realty & Development Co. Ltd. | | | 13,000 | | | | 426,695 | |
| Sun Hung Kai Properties Ltd. | | | 26,000 | | | | 433,104 | |
| Tejon Ranch Co.1 | | | 171 | | | | 3,550 | |
| Trinity Place Holdings, Inc.1 | | | 304 | | | | 2,113 | |
| Unite Group plc (The) | | | 23,400 | | | | 254,193 | |
| Vonovia SE | | | 18,351 | | | | 908,377 | |
| Wharf Holdings Ltd. (The) | | | 31,000 | | | | 107,196 | |
| Wharf Real Estate Investment Co. Ltd.1 | | | 45,000 | | | | 299,507 | |
| | | | | | | | 6,931,557 | |
| Thrifts & Mortgage Finance—0.2% | | | | | | | | |
| Bank Mutual Corp. | | | 554 | | | | 5,900 | |
| BankFinancial Corp. | | | 212 | | | | 3,252 | |
| Bear State Financial, Inc. | | | 358 | | | | 3,662 | |
| Beneficial Bancorp, Inc. | | | 698 | | | | 11,482 | |
| BofI Holding, Inc.1 | | | 586 | | | | 17,521 | |
| | | | | | | | |
| | | Shares | | | Value | |
| Thrifts & Mortgage Finance (Continued) | | | | | |
| BSB Bancorp, Inc.1 | | | 87 | | | $ | 2,545 | |
| Capitol Federal Financial, Inc. | | | 1,283 | | | | 17,205 | |
| Charter Financial Corp. | | | 191 | | | | 3,350 | |
| Clifton Bancorp, Inc. | | | 205 | | | | 3,506 | |
| Dime Community Bancshares, Inc. | | | 354 | | | | 7,416 | |
| Entegra Financial Corp.1 | | | 57 | | | | 1,667 | |
| ESSA Bancorp, Inc. | | | 111 | | | | 1,739 | |
| Essent Group Ltd.1 | | | 897 | | | | 38,948 | |
| Federal Agricultural Mortgage Corp., Cl. C | | | 100 | | | | 7,824 | |
| First Defiance Financial Corp. | | | 124 | | | | 6,444 | |
| Flagstar Bancorp, Inc.1 | | | 532 | | | | 19,908 | |
| Hingham Institution for Savings | | | 17 | | | | 3,519 | |
| Home Bancorp, Inc. | | | 91 | | | | 3,933 | |
| HomeStreet, Inc.1 | | | 8,050 | | | | 233,048 | |
| Kearny Financial Corp. | | | 785 | | | | 11,343 | |
| LendingTree, Inc.1 | | | 101 | | | | 34,386 | |
| Meridian Bancorp, Inc. | | | 475 | | | | 9,785 | |
| Meta Financial Group, Inc. | | | 85 | | | | 7,875 | |
| MGIC Investment Corp.1 | | | 3,431 | | | | 48,411 | |
| Nationstar Mortgage Holdings, Inc.1 | | | 997 | | | | 18,445 | |
| NMI Holdings, Inc., Cl. A1 | | | 484 | | | | 8,228 | |
| Northfield Bancorp, Inc. | | | 445 | | | | 7,601 | |
| Northwest Bancshares, Inc. | | | 967 | | | | 16,178 | |
| OceanFirst Financial Corp. | | | 308 | | | | 8,085 | |
| Ocwen Financial Corp.1 | | | 1,355 | | | | 4,241 | |
| Oritani Financial Corp. | | | 430 | | | | 7,052 | |
| PCSB Financial Corp.1 | | | 163 | | | | 3,105 | |
| PennyMac Financial Services, Inc., Cl. A1 | | | 197 | | | | 4,403 | |
| PHH Corp.1 | | | 358 | | | | 3,687 | |
| Provident Bancorp, Inc.1 | | | 91 | | | | 2,407 | |
| Provident Financial Holdings, Inc. | | | 72 | | | | 1,325 | |
| Provident Financial Services, Inc. | | | 626 | | | | 16,883 | |
| Prudential Bancorp, Inc. | | | 84 | | | | 1,478 | |
| Radian Group, Inc. | | | 2,085 | | | | 42,972 | |
| Riverview Bancorp, Inc. | | | 264 | | | | 2,289 | |
| SI Financial Group, Inc. | | | 148 | | | | 2,176 | |
| Southern Missouri Bancorp, Inc. | | | 96 | | | | 3,609 | |
| Territorial Bancorp, Inc. | | | 119 | | | | 3,674 | |
| Timberland Bancorp, Inc. | | | 74 | | | | 1,965 | |
| TrustCo Bank Corp. (New York) | | | 893 | | | | 8,216 | |
| United Community Financial Corp. | | | 572 | | | | 5,222 | |
| United Financial Bancorp, Inc. | | | 609 | | | | 10,743 | |
| Walker & Dunlop, Inc.1 | | | 316 | | | | 15,010 | |
| Washington Federal, Inc. | | | 825 | | | | 28,256 | |
| Waterstone Financial, Inc. | | | 365 | | | | 6,223 | |
| Western New England Bancorp, Inc. | | | 288 | | | | 3,139 | |
| WSFS Financial Corp. | | | 292 | | | | 13,972 | |
| | | | | | | | 755,253 | |
| Health Care—4.9% | | | | | | | | |
| Biotechnology—0.7% | | | | | | | | |
| AbbVie, Inc. | | | 572 | | | | 55,318 | |
| Abeona Therapeutics, Inc.1 | | | 402 | | | | 6,372 | |
| Acceleron Pharma, Inc.1 | | | 449 | | | | 19,056 | |
| Achaogen, Inc.1 | | | 426 | | | | 4,575 | |
| Achillion Pharmaceuticals, Inc.1 | | | 1,681 | | | | 4,841 | |
| Acorda Therapeutics, Inc.1 | | | 579 | | | | 12,420 | |
| Adamas Pharmaceuticals, Inc.1 | | | 143 | | | | 4,846 | |
| Aduro Biotech, Inc.1 | | | 610 | | | | 4,575 | |
| Agenus, Inc.1 | | | 879 | | | | 2,866 | |
| Aimmune Therapeutics, Inc.1 | | | 365 | | | | 13,804 | |
| Akebia Therapeutics, Inc.1 | | | 522 | | | | 7,762 | |
| Alder Biopharmaceuticals, Inc.1 | | | 656 | | | | 7,511 | |
| AMAG Pharmaceuticals, Inc.1 | | | 377 | | | | 4,995 | |
| Amgen, Inc. | | | 190 | | | | 33,041 | |
| Amicus Therapeutics, Inc.1 | | | 1,603 | | | | 23,067 | |
| Anavex Life Sciences Corp.1 | | | 443 | | | | 1,426 | |
| Ardelyx, Inc.1 | | | 362 | | | | 2,389 | |
15 OPPENHEIMER GLOBAL MULTI-ALTERNATIVES FUND/VA
CONSOLIDATED STATEMENT OF INVESTMENTS Continued
| | | | | | | | |
| | | Shares | | | Value | |
| Biotechnology (Continued) | | | | | | | | |
| Arena Pharmaceuticals, Inc.1 | | | 336 | | | $ | 11,414 | |
| Array BioPharma, Inc.1 | | | 1,725 | | | | 22,080 | |
| Atara Biotherapeutics, Inc.1 | | | 285 | | | | 5,159 | |
| Audentes Therapeutics, Inc.1 | | | 259 | | | | 8,094 | |
| Avexis, Inc.1 | | | 334 | | | | 36,964 | |
| Axovant Sciences Ltd.1 | | | 968 | | | | 5,101 | |
| Bellicum Pharmaceuticals, Inc.1 | | | 296 | | | | 2,489 | |
| BioCryst Pharmaceuticals, Inc.1 | | | 825 | | | | 4,051 | |
| Biogen, Inc.1 | | | 103 | | | | 32,813 | |
| Biohaven Pharmaceutical Holding Co. Ltd.1 | | | 442 | | | | 11,925 | |
| BioSpecifics Technologies Corp.1 | | | 69 | | | | 2,990 | |
| BioTime, Inc.1 | | | 982 | | | | 2,111 | |
| Bluebird Bio, Inc.1 | | | 349 | | | | 62,157 | |
| Blueprint Medicines Corp.1 | | | 328 | | | | 24,735 | |
| Calithera Biosciences, Inc.1 | | | 515 | | | | 4,300 | |
| Cascadian Therapeutics, Inc.1 | | | 516 | | | | 1,909 | |
| Catalyst Pharmaceuticals, Inc.1 | | | 537 | | | | 2,100 | |
| Celgene Corp.1 | | | 230 | | | | 24,003 | |
| Celldex Therapeutics, Inc.1 | | | 1,017 | | | | 2,888 | |
| Chelsea Therapeutics, Inc.1,3,4 | | | 10,531 | | | | — | |
| ChemoCentryx, Inc.1 | | | 467 | | | | 2,779 | |
| Chimerix, Inc.1 | | | 491 | | | | 2,273 | |
| Clovis Oncology, Inc.1 | | | 556 | | | | 37,808 | |
| Coherus Biosciences, Inc.1 | | | 689 | | | | 6,063 | |
| Concert Pharmaceuticals, Inc.1 | | | 163 | | | | 4,217 | |
| Corvus Pharmaceuticals, Inc.1 | | | 240 | | | | 2,486 | |
| Curis, Inc.1 | | | 3,084 | | | | 2,159 | |
| Cytokinetics, Inc.1 | | | 809 | | | | 6,593 | |
| CytomX Therapeutics, Inc.1 | | | 339 | | | | 7,156 | |
| Dyax Corp.1,3,4 | | | 10,770 | | | | 108 | |
| Dynavax Technologies Corp.1 | | | 631 | | | | 11,800 | |
| Eagle Pharmaceuticals, Inc.1 | | | 129 | | | | 6,891 | |
| Edge Therapeutics, Inc.1 | | | 314 | | | | 2,942 | |
| Editas Medicine, Inc.1 | | | 340 | | | | 10,448 | |
| Emergent BioSolutions, Inc.1 | | | 366 | | | | 17,008 | |
| Enanta Pharmaceuticals, Inc.1 | | | 181 | | | | 10,621 | |
| Epizyme, Inc.1 | | | 912 | | | | 11,446 | |
| Esperion Therapeutics, Inc.1 | | | 184 | | | | 12,115 | |
| Exact Sciences Corp.1 | | | 1,047 | | | | 55,009 | |
| Fate Therapeutics, Inc.1 | | | 425 | | | | 2,597 | |
| FibroGen, Inc.1 | | | 911 | | | | 43,181 | |
| Five Prime Therapeutics, Inc.1 | | | 452 | | | | 9,908 | |
| Foundation Medicine, Inc.1 | | | 290 | | | | 19,778 | |
| G1 Therapeutics, Inc.1 | | | 309 | | | | 6,131 | |
| Genocea Biosciences, Inc.1 | | | 258 | | | | 299 | |
| Genomic Health, Inc.1 | | | 356 | | | | 12,175 | |
| Geron Corp.1 | | | 1,704 | | | | 3,067 | |
| Gilead Sciences, Inc. | | | 696 | | | | 49,861 | |
| Global Blood Therapeutics, Inc.1 | | | 414 | | | | 16,291 | |
| Halozyme Therapeutics, Inc.1 | | | 1,279 | | | | 25,913 | |
| Heron Therapeutics, Inc.1 | | | 450 | | | | 8,145 | |
| Idera Pharmaceuticals, Inc.1 | | | 1,000 | | | | 2,110 | |
| Ignyta, Inc.1 | | | 24,862 | | | | 663,815 | |
| Immune Design Corp.1 | | | 293 | | | | 1,143 | |
| ImmunoGen, Inc.1 | | | 999 | | | | 6,404 | |
| Immunomedics, Inc.1 | | | 1,420 | | | | 22,947 | |
| Inovio Pharmaceuticals, Inc.1 | | | 1,086 | | | | 4,485 | |
| Insmed, Inc.1 | | | 628 | | | | 19,581 | |
| Intellia Therapeutics, Inc.1 | | | 472 | | | | 9,072 | |
| Invitae Corp.1 | | | 459 | | | | 4,168 | |
| Iovance Biotherapeutics, Inc.1 | | | 585 | | | | 4,680 | |
| Ironwood Pharmaceuticals, Inc., Cl. A1 | | | 1,262 | | | | 18,917 | |
| Jounce Therapeutics, Inc.1 | | | 271 | | | | 3,455 | |
| Karyopharm Therapeutics, Inc.1 | | | 407 | | | | 3,907 | |
| Keryx Biopharmaceuticals, Inc.1 | | | 1,526 | | | | 7,096 | |
| Kindred Biosciences, Inc.1 | | | 260 | | | | 2,457 | |
| La Jolla Pharmaceutical Co.1 | | | 216 | | | | 6,951 | |
| | | | | | | | |
| | | Shares | | | Value | |
| Biotechnology (Continued) | | | | | | | | |
| Lexicon Pharmaceuticals, Inc.1 | | | 997 | | | $ | 9,850 | |
| Ligand Pharmaceuticals, Inc.1 | | | 220 | | | | 30,125 | |
| Loxo Oncology, Inc.1 | | | 318 | | | | 26,769 | |
| MacroGenics, Inc.1 | | | 357 | | | | 6,783 | |
| Madrigal Pharmaceuticals, Inc.1 | | | 117 | | | | 10,739 | |
| Merrimack Pharmaceuticals, Inc. | | | 128 | | | | 1,312 | |
| Mersana Therapeutics, Inc.1 | | | 184 | | | | 3,023 | |
| Minerva Neurosciences, Inc.1 | | | 401 | | | | 2,426 | |
| Momenta Pharmaceuticals, Inc.1 | | | 739 | | | | 10,309 | |
| Myriad Genetics, Inc.1 | | | 648 | | | | 22,256 | |
| Natera, Inc.1 | | | 574 | | | | 5,160 | |
| Novavax, Inc.1 | | | 2,353 | | | | 2,918 | |
| Otonomy, Inc.1 | | | 160 | | | | 888 | |
| PDL BioPharma, Inc.1 | | | 1,486 | | | | 4,072 | |
| Pieris Pharmaceuticals, Inc.1 | | | 346 | | | | 2,612 | |
| Portola Pharmaceuticals, Inc.1 | | | 601 | | | | 29,257 | |
| Progenics Pharmaceuticals, Inc.1 | | | 712 | | | | 4,236 | |
| Prothena Corp. plc1 | | | 454 | | | | 17,020 | |
| PTC Therapeutics, Inc.1 | | | 461 | | | | 7,689 | |
| Puma Biotechnology, Inc.1 | | | 425 | | | | 42,011 | |
| Ra Pharmaceuticals, Inc.1 | | | 197 | | | | 1,675 | |
| Recro Pharma, Inc.1 | | | 162 | | | | 1,499 | |
| REGENXBIO, Inc.1 | | | 314 | | | | 10,441 | |
| Repligen Corp.1 | | | 433 | | | | 15,709 | |
| Retrophin, Inc.1 | | | 410 | | | | 8,639 | |
| Rigel Pharmaceuticals, Inc.1 | | | 1,250 | | | | 4,850 | |
| Sage Therapeutics, Inc.1 | | | 243 | | | | 40,025 | |
| Sangamo Therapeutics, Inc.1 | | | 609 | | | | 9,988 | |
| Sarepta Therapeutics, Inc.1 | | | 541 | | | | 30,101 | |
| Selecta Biosciences, Inc.1 | | | 417 | | | | 4,091 | |
| Seres Therapeutics, Inc.1 | | | 367 | | | | 3,721 | |
| Shire plc7 | | | 1,106 | | | | 57,366 | |
| Shire plc, ADR7 | | | 6,050 | | | | 938,476 | |
| Spark Therapeutics, Inc.1 | | | 386 | | | | 19,848 | |
| Spectrum Pharmaceuticals, Inc.1 | | | 890 | | | | 16,866 | |
| Stemline Therapeutics, Inc.1 | | | 212 | | | | 3,307 | |
| Syndax Pharmaceuticals, Inc.1 | | | 270 | | | | 2,365 | |
| Syros Pharmaceuticals, Inc.1 | | | 288 | | | | 2,802 | |
| TG Therapeutics, Inc.1 | | | 634 | | | | 5,199 | |
| Trevena, Inc.1 | | | 528 | | | | 845 | |
| Ultragenyx Pharmaceutical, Inc.1 | | | 367 | | | | 17,021 | |
| Vanda Pharmaceuticals, Inc.1 | | | 612 | | | | 9,302 | |
| VBI Vaccines, Inc.1 | | | 250 | | | | 1,068 | |
| Veracyte, Inc.1 | | | 523 | | | | 3,415 | |
| Versartis, Inc.1 | | | 313 | | | | 689 | |
| Voyager Therapeutics, Inc.1 | | | 358 | | | | 5,943 | |
| vTv Therapeutics, Inc., Cl. A1 | | | 138 | | | | 829 | |
| Xencor, Inc.1 | | | 405 | | | | 8,878 | |
| | | | | | | | 3,129,016 | |
| Health Care Equipment & Supplies—0.9% | | | | | | | | |
| Abaxis, Inc. | | | 213 | | | | 10,548 | |
| Abbott Laboratories | | | 9,310 | | | | 531,322 | |
| Accuray, Inc.1 | | | 731 | | | | 3,143 | |
| Analogic Corp. | | | 114 | | | | 9,548 | |
| AngioDynamics, Inc.1 | | | 346 | | | | 5,754 | |
| Anika Therapeutics, Inc.1 | | | 138 | | | | 7,440 | |
| Antares Pharma, Inc.1 | | | 1,457 | | | | 2,899 | |
| AtriCure, Inc.1 | | | 378 | | | | 6,895 | |
| Atrion Corp. | | | 17 | | | | 10,720 | |
| AxoGen, Inc.1 | | | 243 | | | | 6,877 | |
| Cantel Medical Corp. | | | 364 | | | | 37,445 | |
| Cardiovascular Systems, Inc.1 | | | 400 | | | | 9,476 | |
| Cerus Corp.1 | | | 785 | | | | 2,653 | |
| ConforMIS, Inc.1 | | | 476 | | | | 1,133 | |
| CONMED Corp. | | | 258 | | | | 13,150 | |
| CryoLife, Inc.1 | | | 303 | | | | 5,802 | |
| Cutera, Inc.1 | | | 126 | | | | 5,714 | |
16 OPPENHEIMER GLOBAL MULTI-ALTERNATIVES FUND/VA
| | | | | | | | |
| | | Shares | | | Value | |
| Health Care Equipment & Supplies (Continued) | | | | | |
| Danaher Corp. | | | 799 | | | $ | 74,163 | |
| Endologix, Inc.1 | | | 762 | | | | 4,077 | |
| Entellus Medical, Inc.1 | | | 27,632 | | | | 673,945 | |
| Essilor International Cie Generale d’Optique SA | | | 1,410 | | | | 194,432 | |
| Exactech, Inc.1 | | | 175 | | | | 8,654 | |
| FONAR Corp.1 | | | 78 | | | | 1,899 | |
| GenMark Diagnostics, Inc.1 | | | 866 | | | | 3,611 | |
| Glaukos Corp.1 | | | 431 | | | | 11,055 | |
| Globus Medical, Inc., Cl. A1 | | | 765 | | | | 31,442 | |
| Haemonetics Corp.1 | | | 410 | | | | 23,813 | |
| Halyard Health, Inc.1 | | | 385 | | | | 17,779 | |
| Heska Corp.1 | | | 78 | | | | 6,256 | |
| ICU Medical, Inc.1 | | | 170 | | | | 36,720 | |
| Inogen, Inc.1 | | | 152 | | | | 18,100 | |
| Insulet Corp.1 | | | 451 | | | | 31,119 | |
| Integer Holdings Corp.1 | | | 301 | | | | 13,635 | |
| Integra LifeSciences Holdings Corp.1 | | | 714 | | | | 34,172 | |
| Invacare Corp. | | | 275 | | | | 4,634 | |
| iRhythm Technologies, Inc.1 | | | 200 | | | | 11,210 | |
| K2M Group Holdings, Inc.1 | | | 411 | | | | 7,398 | |
| Lantheus Holdings, Inc.1 | | | 315 | | | | 6,442 | |
| LeMaitre Vascular, Inc. | | | 177 | | | | 5,636 | |
| Masimo Corp.1 | | | 483 | | | | 40,958 | |
| Medtronic plc | | | 14,059 | | | | 1,135,264 | |
| Meridian Bioscience, Inc. | | | 397 | | | | 5,558 | |
| Merit Medical Systems, Inc.1 | | | 536 | | | | 23,155 | |
| Natus Medical, Inc.1 | | | 332 | | | | 12,682 | |
| Neogen Corp.1 | | | 346 | | | | 28,445 | |
| Nevro Corp.1 | | | 328 | | | | 22,645 | |
| NuVasive, Inc.1 | | | 474 | | | | 27,724 | |
| NxStage Medical, Inc.1 | | | 22,555 | | | | 546,508 | |
| OraSure Technologies, Inc.1 | | | 685 | | | | 12,919 | |
| Orthofix International NV1 | | | 220 | | | | 12,034 | |
| Oxford Immunotec Global plc1 | | | 215 | | | | 3,004 | |
| Penumbra, Inc.1 | | | 307 | | | | 28,889 | |
| Quidel Corp.1 | | | 347 | | | | 15,042 | |
| RTI Surgical, Inc.1 | | | 688 | | | | 2,821 | |
| Smith & Nephew plc | | | 2,917 | | | | 50,474 | |
| STAAR Surgical Co.1 | | | 298 | | | | 4,619 | |
| Surmodics, Inc.1 | | | 144 | | | | 4,032 | |
| Tactile Systems Technology, Inc.1 | | | 161 | | | | 4,666 | |
| Utah Medical Products, Inc. | | | 42 | | | | 3,419 | |
| Varex Imaging Corp.1 | | | 330 | | | | 13,256 | |
| Viveve Medical, Inc.1 | | | 200 | | | | 994 | |
| Wright Medical Group NV1 | | | 1,072 | | | | 23,798 | |
| | | | | | | | 3,913,617 | |
| Health Care Providers & Services—1.6% | | | | | | | | |
| AAC Holdings, Inc.1 | | | 197 | | | | 1,773 | |
| Aceto Corp. | | | 275 | | | | 2,841 | |
| Addus HomeCare Corp.1 | | | 153 | | | | 5,325 | |
| Almost Family, Inc.1 | | | 98 | | | | 5,424 | |
| Amedisys, Inc.1 | | | 286 | | | | 15,075 | |
| American Renal Associates Holdings, Inc.1 | | | 248 | | | | 4,315 | |
| AMN Healthcare Services, Inc.1 | | | 395 | | | | 19,454 | |
| BioScrip, Inc.1 | | | 1,166 | | | | 3,393 | |
| BioTelemetry, Inc.1 | | | 307 | | | | 9,179 | |
| Capital Senior Living Corp.1 | | | 236 | | | | 3,184 | |
| Chemed Corp. | | | 137 | | | | 33,294 | |
| Cigna Corp. | | | 7,670 | | | | 1,557,700 | |
| Civitas Solutions, Inc.1 | | | 339 | | | | 5,797 | |
| Community Health Systems, Inc.1 | | | 1,407 | | | | 5,994 | |
| ConvaTec Group plc2 | | | 16,795 | | | | 46,415 | |
| CorVel Corp.1 | | | 249 | | | | 13,172 | |
| Cross Country Healthcare, Inc.1 | | | 338 | | | | 4,313 | |
| Diplomat Pharmacy, Inc.1 | | | 765 | | | | 15,354 | |
| Ensign Group, Inc. (The) | | | 460 | | | | 10,212 | |
| | | | | | | | |
| | | Shares | | | Value | |
| Health Care Providers & Services (Continued) | | | | | |
| Genesis Healthcare, Inc., Cl. A1 | | | 1,270 | | | $ | 969 | |
| HCA Healthcare, Inc.1 | | | 7,385 | | | | 648,698 | |
| HealthEquity, Inc.1 | | | 554 | | | | 25,850 | |
| HealthSouth Corp. | | | 860 | | | | 42,493 | |
| Kindred Healthcare, Inc. | | | 70,989 | | | | 688,593 | |
| LHC Group, Inc.1 | | | 171 | | | | 10,474 | |
| Magellan Health, Inc.1 | | | 230 | | | | 22,207 | |
| Mediclinic International plc | | | 5,826 | | | | 50,865 | |
| MEDNAX, Inc.1 | | | 5,935 | | | | 317,166 | |
| Molina Healthcare, Inc.1 | | | 468 | | | | 35,886 | |
| National HealthCare Corp. | | | 179 | | | | 10,908 | |
| National Research Corp., Cl. A | | | 442 | | | | 16,487 | |
| NMC Health plc | | | 1,699 | | | | 66,171 | |
| Novocure Ltd.1 | | | 949 | | | | 19,170 | |
| Owens & Minor, Inc. | | | 744 | | | | 14,047 | |
| PetIQ, Inc., Cl. A1 | | | 136 | | | | 2,970 | |
| Premier, Inc., Cl. A1 | | | 19,570 | | | | 571,248 | |
| Providence Service Corp. (The)1 | | | 151 | | | | 8,960 | |
| R1 RCM, Inc.1 | | | 969 | | | | 4,273 | |
| RadNet, Inc.1 | | | 469 | | | | 4,737 | |
| Select Medical Holdings Corp.1 | | | 1,375 | | | | 24,269 | |
| Surgery Partners, Inc.1 | | | 454 | | | | 5,493 | |
| Teladoc, Inc.1 | | | 480 | | | | 16,728 | |
| Tivity Health, Inc.1 | | | 471 | | | | 17,215 | |
| Triple-S Management Corp., Cl. B1 | | | 191 | | | | 4,746 | |
| UnitedHealth Group, Inc.6 | | | 9,576 | | | | 2,111,125 | |
| US Physical Therapy, Inc. | | | 111 | | | | 8,014 | |
| | | | | | | | 6,511,976 | |
| Health Care Technology—0.0% | | | | | | | | |
| Allscripts Healthcare Solutions, Inc.1 | | | 1,612 | | | | 23,455 | |
| Castlight Health, Inc., Cl. B1 | | | 1,245 | | | | 4,669 | |
| Cotiviti Holdings, Inc.1 | | | 941 | | | | 30,310 | |
| Evolent Health, Inc., Cl. A1 | | | 894 | | | | 10,996 | |
| HealthStream, Inc.1 | | | 311 | | | | 7,203 | |
| HMS Holdings Corp.1 | | | 926 | | | | 15,696 | |
| Inovalon Holdings, Inc., Cl. A1 | | | 1,455 | | | | 21,825 | |
| Medidata Solutions, Inc.1 | | | 625 | | | | 39,606 | |
| Omnicell, Inc.1 | | | 341 | | | | 16,538 | |
| Quality Systems, Inc.1 | | | 588 | | | | 7,985 | |
| Simulations Plus, Inc. | | | 171 | | | | 2,753 | |
| Tabula Rasa HealthCare, Inc.1 | | | 141 | | | | 3,955 | |
| Vocera Communications, Inc.1 | | | 266 | | | | 8,038 | |
| | | | | | | | 193,029 | |
| Life Sciences Tools & Services—0.1% | | | | | | | | |
| Cambrex Corp.1 | | | 275 | | | | 13,200 | |
| CHC Group LLC1 | | | 697 | | | | 6,273 | |
| Enzo Biochem, Inc.1 | | | 570 | | | | 4,646 | |
| Fluidigm Corp.1 | | | 356 | | | | 2,097 | |
| INC Research Holdings, Inc., Cl. A1 | | | 1,472 | | | | 64,179 | |
| Luminex Corp. | | | 410 | | | | 8,077 | |
| Medpace Holdings, Inc.1 | | | 398 | | | | 14,431 | |
| NanoString Technologies, Inc.1 | | | 312 | | | | 2,331 | |
| NeoGenomics, Inc.1 | | | 714 | | | | 6,326 | |
| Pacific Biosciences of California, Inc.1 | | | 1,459 | | | | 3,852 | |
| PRA Health Sciences, Inc.1 | | | 764 | | | | 69,577 | |
| | | | | | | | 194,989 | |
| Pharmaceuticals—1.6% | | | | | | | | |
| Aclaris Therapeutics, Inc.1 | | | 310 | | | | 7,645 | |
| Aerie Pharmaceuticals, Inc.1 | | | 331 | | | | 19,777 | |
| Allergan plc6 | | | 3,318 | | | | 542,758 | |
| Ambit Biosciences Corp.1,3,4 | | | 10,347 | | | | 6,208 | |
| Amphastar Pharmaceuticals, Inc.1 | | | 401 | | | | 7,715 | |
| ANI Pharmaceuticals, Inc.1 | | | 90 | | | | 5,801 | |
| Aratana Therapeutics, Inc.1 | | | 394 | | | | 2,072 | |
| Assembly Biosciences, Inc.1 | | | 97 | | | | 4,389 | |
| AstraZeneca plc | | | 996 | | | | 68,349 | |
| Bristol-Myers Squibb Co. | | | 7,855 | | | | 481,354 | |
17 OPPENHEIMER GLOBAL MULTI-ALTERNATIVES FUND/VA
CONSOLIDATED STATEMENT OF INVESTMENTS Continued
| | | | | | | | |
| | | Shares | | | Value | |
| Pharmaceuticals (Continued) | | | | | | | | |
| Catalent, Inc.1 | | | 1,734 | | | $ | 71,233 | |
| Corcept Therapeutics, Inc.1 | | | 1,185 | | | | 21,401 | |
| Corium International, Inc.1 | | | 292 | | | | 2,806 | |
| Depomed, Inc.1 | | | 421 | | | | 3,389 | |
| Dermira, Inc.1 | | | 412 | | | | 11,458 | |
| Durata Therapeutics1,3,4 | | | 6,530 | | | | — | |
| Durect Corp.1 | | | 1,068 | | | | 984 | |
| Eli Lilly & Co. | | | 783 | | | | 66,132 | |
| GlaxoSmithKline plc | | | 3,259 | | | | 57,645 | |
| Horizon Pharma plc1 | | | 1,463 | | | | 21,360 | |
| Impax Laboratories, Inc.1 | | | 765 | | | | 12,737 | |
| Innoviva, Inc.1 | | | 954 | | | | 13,537 | |
| Intersect ENT, Inc.1 | | | 270 | | | | 8,748 | |
| Intra-Cellular Therapies, Inc., Cl. A1 | | | 413 | | | | 5,980 | |
| Johnson & Johnson | | | 558 | | | | 77,964 | |
| Kala Pharmaceuticals, Inc.1 | | | 193 | | | | 3,569 | |
| Medicines Co. (The)1 | | | 683 | | | | 18,673 | |
| Melinta Therapeutics, Inc.1 | | | 67 | | | | 1,059 | |
| Merck & Co., Inc. | | | 18,399 | | | | 1,035,312 | |
| Mylan NV1 | | | 19,280 | | | | 815,737 | |
| MyoKardia, Inc.1 | | | 354 | | | | 14,903 | |
| Nektar Therapeutics, Cl. A1 | | | 663 | | | | 39,594 | |
| Novartis AG, Sponsored ADR | | | 13,530 | | | | 1,135,979 | |
| Pacira Pharmaceuticals, Inc.1 | | | 266 | | | | 12,143 | |
| Paratek Pharmaceuticals, Inc.1 | | | 300 | | | | 5,370 | |
| Pfizer, Inc. | | | 2,201 | | | | 79,720 | |
| Phibro Animal Health Corp., Cl. A | | | 413 | | | | 13,836 | |
| Prestige Brands Holdings, Inc.1 | | | 521 | | | | 23,138 | |
| Revance Therapeutics, Inc.1 | | | 274 | | | | 9,796 | |
| Roche Holding AG | | | 4,251 | | | | 1,075,262 | |
| Sanofi | | | 2,309 | | | | 198,813 | |
| Sucampo Pharmaceuticals, Inc., Cl. A1 | | | 36,896 | | | | 662,283 | |
| Supernus Pharmaceuticals, Inc.1 | | | 534 | | | | 21,280 | |
| Teligent, Inc.1 | | | 714 | | | | 2,592 | |
| Tetraphase Pharmaceuticals, Inc.1 | | | 454 | | | | 2,860 | |
| Teva Pharmaceutical Industries Ltd.1,4 | | | 10 | | | | — | |
| Theravance Biopharma, Inc.1 | | | 519 | | | | 14,475 | |
| Zogenix, Inc.1 | | | 243 | | | | 9,732 | |
| | | | | | | | 6,717,568 | |
| Industrials—5.3% | | | | | | | | |
| Aerospace & Defense—2.2% | | | | | | | | |
| AAR Corp. | | | 395 | | | | 15,520 | |
| Aerojet Rocketdyne Holdings, Inc.1 | | | 665 | | | | 20,748 | |
| Aerovironment, Inc.1 | | | 253 | | | | 14,208 | |
| Airbus SE | | | 1,401 | | | | 139,127 | |
| Astronics Corp.1 | | | 220 | | | | 9,123 | |
| Axon Enterprise, Inc.1 | | | 462 | | | | 12,243 | |
| BAE Systems plc | | | 8,245 | | | | 63,414 | |
| Boeing Co. (The) | | | 269 | | | | 79,331 | |
| Cubic Corp. | | | 226 | | | | 13,323 | |
| Curtiss-Wright Corp. | | | 398 | | | | 48,496 | |
| Ducommun, Inc.1 | | | 126 | | | | 3,585 | |
| Engility Holdings, Inc.1 | | | 402 | | | | 11,405 | |
| Esterline Technologies Corp.1 | | | 490 | | | | 36,603 | |
| General Dynamics Corp. | | | 328 | | | | 66,732 | |
| KeyW Holding Corp. (The)1 | | | 648 | | | | 3,804 | |
| KLX, Inc.1 | | | 476 | | | | 32,487 | |
| Kratos Defense & Security Solutions, Inc.1 | | | 1,129 | | | | 11,956 | |
| L3 Technologies, Inc. | | | 5,750 | | | | 1,137,637 | |
| Lockheed Martin Corp. | | | 7,089 | | | | 2,275,923 | |
| Mercury Systems, Inc.1 | | | 428 | | | | 21,978 | |
| Moog, Inc., Cl. A1 | | | 455 | | | | 39,517 | |
| National Presto Industries, Inc. | | | 79 | | | | 7,857 | |
| Northrop Grumman Corp. | | | 5,520 | | | | 1,694,143 | |
| Orbital ATK, Inc. | | | 4,848 | | | | 637,512 | |
| Raytheon Co. | | | 8,913 | | | | 1,674,307 | |
| Rolls-Royce Holdings plc1 | | | 3,969 | | | | 45,171 | |
| | | | | | | | |
| | | Shares | | | Value | |
| Aerospace & Defense (Continued) | | | | | | | | |
| Safran SA | | | 1,328 | | | $ | 136,558 | |
| Sparton Corp.1 | | | 27,946 | | | | 644,435 | |
| Triumph Group, Inc. | | | 472 | | | | 12,838 | |
| United Technologies Corp. | | | 562 | | | | 71,694 | |
| Vectrus, Inc.1 | | | 128 | | | | 3,949 | |
| Wesco Aircraft Holdings, Inc.1 | | | 1,151 | | | | 8,517 | |
| | | | | | | | 8,994,141 | |
| Air Freight & Couriers—0.1% | | | | | | | | |
| Air Transport Services Group, Inc.1 | | | 559 | | | | 12,935 | |
| Atlas Air Worldwide Holdings, Inc.1 | | | 254 | | | | 14,897 | |
| Echo Global Logistics, Inc.1 | | | 229 | | | | 6,412 | |
| FedEx Corp. | | | 1,775 | | | | 442,934 | |
| Forward Air Corp. | | | 364 | | | | 20,908 | |
| Hub Group, Inc., Cl. A1 | | | 377 | | | | 18,059 | |
| Radiant Logistics, Inc.1 | | | 472 | | | | 2,171 | |
| United Parcel Service, Inc., Cl. B | | | 474 | | | | 56,477 | |
| | | | | | | | 574,793 | |
| Airlines—0.1% | | | | | | | | |
| Allegiant Travel Co., Cl. A | | | 137 | | | | 21,201 | |
| Hawaiian Holdings, Inc. | | | 386 | | | | 15,382 | |
| International Consolidated Airlines Group SA | | | 6,007 | | | | 52,686 | |
| SkyWest, Inc. | | | 444 | | | | 23,576 | |
| United Continental Holdings, Inc.1 | | | 5,500 | | | | 370,700 | |
| | | | | | | | 483,545 | |
| Building Products—0.1% | | | | | | | | |
| AAON, Inc. | | | 477 | | | | 17,506 | |
| Advanced Drainage Systems, Inc. | | | 433 | | | | 10,327 | |
| American Woodmark Corp.1 | | | 150 | | | | 19,537 | |
| Apogee Enterprises, Inc. | | | 259 | | | | 11,844 | |
| Armstrong Flooring, Inc.1 | | | 206 | | | | 3,486 | |
| Builders FirstSource, Inc.1 | | | 944 | | | | 20,570 | |
| Continental Building Products, Inc.1 | | | 440 | | | | 12,386 | |
| CSW Industrials, Inc.1 | | | 198 | | | | 9,098 | |
| Gibraltar Industries, Inc.1 | | | 303 | | | | 9,999 | |
| Griffon Corp. | | | 431 | | | | 8,771 | |
| Insteel Industries, Inc. | | | 167 | | | | 4,729 | |
| JELD-WEN Holding, Inc.1 | | | 1,210 | | | | 47,638 | |
| Masonite International Corp.1 | | | 316 | | | | 23,431 | |
| NCI Building Systems, Inc.1 | | | 826 | | | | 15,942 | |
| Patrick Industries, Inc.1 | | | 219 | | | | 15,210 | |
| PGT Innovations, Inc.1 | | | 522 | | | | 8,796 | |
| Ply Gem Holdings, Inc.1 | | | 793 | | | | 14,670 | |
| Quanex Building Products Corp. | | | 330 | | | | 7,722 | |
| Simpson Manufacturing Co., Inc. | | | 416 | | | | 23,883 | |
| Trex Co., Inc.1 | | | 259 | | | | 28,073 | |
| Universal Forest Products, Inc. | | | 557 | | | | 20,954 | |
| | | | | | | | 334,572 | |
| Commercial Services & Supplies—0.8% | | | | | | | | |
| ABM Industries, Inc. | | | 518 | | | | 19,539 | |
| ACCO Brands Corp.1 | | | 1,001 | | | | 12,212 | |
| Advanced Disposal Services, Inc.1 | | | 894 | | | | 21,402 | |
| ARC Document Solutions, Inc.1 | | | 907 | | | | 2,313 | |
| Brady Corp., Cl. A | | | 612 | | | | 23,195 | |
| Brink’s Co. (The) | | | 450 | | | | 35,415 | |
| Casella Waste Systems, Inc., Cl. A1 | | | 444 | | | | 10,221 | |
| CECO Environmental Corp. | | | 530 | | | | 2,719 | |
| CompX International, Inc. | | | 130 | | | | 1,729 | |
| Covanta Holding Corp. | | | 1,313 | | | | 22,190 | |
| Deluxe Corp. | | | 446 | | | | 34,271 | |
| Ennis, Inc. | | | 228 | | | | 4,731 | |
| Essendant, Inc. | | | 366 | | | | 3,393 | |
| G4S plc | | | 14,262 | | | | 51,270 | |
| Healthcare Services Group, Inc. | | | 706 | | | | 37,220 | |
| Heritage-Crystal Clean, Inc.1 | | | 285 | | | | 6,199 | |
| Herman Miller, Inc. | | | 532 | | | | 21,307 | |
18 OPPENHEIMER GLOBAL MULTI-ALTERNATIVES FUND/VA
| | | | | | | | |
| | | Shares | | | Value | |
| Commercial Services & Supplies (Continued) | |
| HNI Corp. | | | 402 | | | $ | 15,505 | |
| Hudson Technologies, Inc.1 | | | 410 | | | | 2,489 | |
| InnerWorkings, Inc.1 | | | 513 | | | | 5,145 | |
| Interface, Inc., Cl. A | | | 521 | | | | 13,103 | |
| Johnson Controls International plc6 | | | 21,200 | | | | 807,932 | |
| Kimball International, Inc., Cl. B | | | 473 | | | | 8,831 | |
| Knoll, Inc. | | | 455 | | | | 10,483 | |
| LSC Communications, Inc. | | | 322 | | | | 4,878 | |
| Matthews International Corp., Cl. A | | | 338 | | | | 17,846 | |
| McGrath RentCorp | | | 274 | | | | 12,873 | |
| Mobile Mini, Inc. | | | 387 | | | | 13,351 | |
| MSA Safety, Inc. | | | 429 | | | | 33,256 | |
| Multi-Color Corp. | | | 175 | | | | 13,099 | |
| NL Industries, Inc.1 | | | 391 | | | | 5,572 | |
| Quad/Graphics, Inc. | | | 496 | | | | 11,210 | |
| Republic Services, Inc., Cl. A6 | | | 26,230 | | | | 1,773,410 | |
| RR Donnelley & Sons Co. | | | 649 | | | | 6,036 | |
| SP Plus Corp.1 | | | 271 | | | | 10,054 | |
| Steelcase, Inc., Cl. A | | | 1,051 | | | | 15,975 | |
| Team, Inc.1 | | | 253 | | | | 3,770 | |
| Tetra Tech, Inc. | | | 521 | | | | 25,086 | |
| UniFirst Corp. | | | 176 | | | | 29,022 | |
| US Ecology, Inc. | | | 191 | | | | 9,741 | |
| Viad Corp. | | | 251 | | | | 13,905 | |
| VSE Corp. | | | 105 | | | | 5,085 | |
| | | | | | | | 3,176,983 | |
| Construction & Engineering—0.3% | |
| Aegion Corp., Cl. A1 | | | 261 | | | | 6,637 | |
| Ameresco, Inc., Cl. A1 | | | 390 | | | | 3,354 | |
| Argan, Inc. | | | 171 | | | | 7,695 | |
| Cie de Saint-Gobain | | | 2,097 | | | | 115,410 | |
| Comfort Systems USA, Inc. | | | 467 | | | | 20,385 | |
| Dycom Industries, Inc.1 | | | 240 | | | | 26,743 | |
| EMCOR Group, Inc. | | | 715 | | | | 58,451 | |
| Granite Construction, Inc. | | | 8,362 | | | | 530,402 | |
| Great Lakes Dredge & Dock Corp.1 | | | 595 | | | | 3,213 | |
| HC2 Holdings, Inc.1 | | | 405 | | | | 2,410 | |
| IES Holdings, Inc.1 | | | 214 | | | | 3,692 | |
| KBR, Inc. | | | 1,388 | | | | 27,524 | |
| Layne Christensen Co.1 | | | 192 | | | | 2,410 | |
| MasTec, Inc.1 | | | 761 | | | | 37,251 | |
| MYR Group, Inc.1 | | | 140 | | | | 5,002 | |
| Northwest Pipe Co.1 | | | 91 | | | | 1,742 | |
| NV5 Global, Inc.1 | | | 107 | | | | 5,794 | |
| Orion Group Holdings, Inc.1 | | | 247 | | | | 1,934 | |
| Primoris Services Corp. | | | 634 | | | | 17,238 | |
| Sterling Construction Co., Inc.1 | | | 266 | | | | 4,330 | |
| Tutor Perini Corp.1 | | | 527 | | | | 13,359 | |
| Vinci SA | | | 1,543 | | | | 157,428 | |
| | | | | | | | 1,052,404 | |
| Electrical Equipment—0.3% | | | | | | | | |
| Allied Motion Technologies, Inc. | | | 103 | | | | 3,408 | |
| Atkore International Group, Inc.1 | | | 701 | | | | 15,036 | |
| AZZ, Inc. | | | 244 | | | | 12,468 | |
| Babcock & Wilcox Enterprises, Inc.1 | | | 17,391 | | | | 98,781 | |
| Emerson Electric Co. | | | 674 | | | | 46,971 | |
| Encore Wire Corp. | | | 246 | | | | 11,968 | |
| EnerSys | | | 516 | | | | 35,929 | |
| Generac Holdings, Inc.1 | | | 623 | | | | 30,851 | |
| General Cable Corp. | | | 21,856 | | | | 646,938 | |
| Legrand SA | | | 2,096 | | | | 161,145 | |
| LSI Industries, Inc. | | | 310 | | | | 2,133 | |
| Powell Industries, Inc. | | | 112 | | | | 3,209 | |
| Preformed Line Products Co. | | | 41 | | | | 2,913 | |
| Schneider Electric SE | | | 1,371 | | | | 116,276 | |
| Severn Trent plc | | | 2,599 | | | | 75,833 | |
| Sunrun, Inc.1 | | | 1,035 | | | | 6,107 | |
| | | | | | | | |
| | | Shares | | | Value | |
| Electrical Equipment (Continued) | |
| Thermon Group Holdings, Inc.1 | | | 284 | | | $ | 6,722 | |
| TPI Composites, Inc.1 | | | 426 | | | | 8,716 | |
| Vicor Corp.1 | | | 356 | | | | 7,440 | |
| | | | | | | | 1,292,844 | |
| Industrial Conglomerates—0.8% | | | | | | | | |
| 3M Co. | | | 300 | | | | 70,611 | |
| DCC plc | | | 571 | | | | 57,535 | |
| General Electric Co.6 | | | 67,312 | | | | 1,174,595 | |
| Honeywell International, Inc.6 | | | 13,356 | | | | 2,048,276 | |
| Raven Industries, Inc. | | | 298 | | | | 10,236 | |
| Smiths Group plc | | | 3,157 | | | | 63,156 | |
| | | | | | | | 3,424,409 | |
| Machinery—0.2% | | | | | | | | |
| Actuant Corp., Cl. A | | | 546 | | | | 13,814 | |
| Alamo Group, Inc. | | | 126 | | | | 14,222 | |
| Albany International Corp., Cl. A | | | 284 | | | | 17,452 | |
| Altra Industrial Motion Corp. | | | 349 | | | | 17,590 | |
| American Railcar Industries, Inc. | | | 177 | | | | 7,370 | |
| Astec Industries, Inc. | | | 205 | | | | 11,992 | |
| Barnes Group, Inc. | | | 498 | | | | 31,508 | |
| Blue Bird Corp.1 | | | 238 | | | | 4,736 | |
| Briggs & Stratton Corp. | | | 410 | | | | 10,402 | |
| Caterpillar, Inc. | | | 445 | | | | 70,123 | |
| Chart Industries, Inc.1 | | | 260 | | | | 12,184 | |
| CIRCOR International, Inc. | | | 142 | | | | 6,913 | |
| Columbus McKinnon Corp. | | | 278 | | | | 11,114 | |
| Commercial Vehicle Group, Inc.1 | | | 199 | | | | 2,127 | |
| DMC Global, Inc. | | | 151 | | | | 3,783 | |
| Douglas Dynamics, Inc. | | | 220 | | | | 8,316 | |
| Eastern Co. (The) | | | 59 | | | | 1,543 | |
| Energy Recovery, Inc.1 | | | 348 | | | | 3,045 | |
| EnPro Industries, Inc. | | | 252 | | | | 23,565 | |
| ESCO Technologies, Inc. | | | 217 | | | | 13,074 | |
| Federal Signal Corp. | | | 727 | | | | 14,605 | |
| Franklin Electric Co., Inc. | | | 433 | | | | 19,875 | |
| FreightCar America, Inc. | | | 131 | | | | 2,237 | |
| Gencor Industries, Inc.1 | | | 177 | | | | 2,929 | |
| Global Brass & Copper Holdings, Inc. | | | 270 | | | | 8,937 | |
| Gorman-Rupp Co. (The) | | | 240 | | | | 7,490 | |
| Graham Corp. | | | 116 | | | | 2,428 | |
| Greenbrier Cos., Inc. (The) | | | 282 | | | | 15,031 | |
| Hardinge, Inc. | | | 153 | | | | 2,665 | |
| Harsco Corp.1 | | | 1,155 | | | | 21,541 | |
| Hillenbrand, Inc. | | | 519 | | | | 23,199 | |
| Hurco Cos., Inc. | | | 81 | | | | 3,418 | |
| Hyster-Yale Materials Handling, Inc. | | | 144 | | | | 12,263 | |
| John Bean Technologies Corp. | | | 267 | | | | 29,584 | |
| Kadant, Inc. | | | 116 | | | | 11,646 | |
| Kennametal, Inc. | | | 718 | | | | 34,758 | |
| LB Foster Co., Cl. A1 | | | 106 | | | | 2,878 | |
| Lindsay Corp. | | | 99 | | | | 8,732 | |
| Lydall, Inc.1 | | | 221 | | | | 11,216 | |
| Manitowoc Co., Inc. (The)1 | | | 316 | | | | 12,431 | |
| Meritor, Inc.1 | | | 873 | | | | 20,481 | |
| Milacron Holdings Corp.1 | | | 862 | | | | 16,499 | |
| Miller Industries, Inc. | | | 141 | | | | 3,638 | |
| Mueller Industries, Inc. | | | 522 | | | | 18,494 | |
| Mueller Water Products, Inc., Cl. A | | | 1,849 | | | | 23,168 | |
| Navistar International Corp.1 | | | 966 | | | | 41,422 | |
| NN, Inc. | | | 276 | | | | 7,618 | |
| Omega Flex, Inc. | | | 95 | | | | 6,784 | |
| Park-Ohio Holdings Corp. | | | 120 | | | | 5,514 | |
| Proto Labs, Inc.1 | | | 229 | | | | 23,587 | |
| RBC Bearings, Inc.1 | | | 213 | | | | 26,923 | |
| REV Group, Inc. | | | 571 | | | | 18,575 | |
| Rexnord Corp.1 | | | 1,007 | | | | 26,202 | |
| Spartan Motors, Inc. | | | 336 | | | | 5,292 | |
19 OPPENHEIMER GLOBAL MULTI-ALTERNATIVES FUND/VA
CONSOLIDATED STATEMENT OF INVESTMENTS Continued
| | | | | | | | |
| | | Shares | | | Value | |
| Machinery (Continued) | | | | | | | | |
| SPX Corp.1 | | | 370 | | | $ | 11,614 | |
| SPX FLOW, Inc.1 | | | 369 | | | | 17,546 | |
| Standex International Corp. | | | 150 | | | | 15,277 | |
| Sun Hydraulics Corp. | | | 243 | | | | 15,720 | |
| Tennant Co. | | | 178 | | | | 12,932 | |
| Titan International, Inc. | | | 460 | | | | 5,925 | |
| TriMas Corp.1 | | | 572 | | | | 15,301 | |
| Twin Discount, Inc.1 | | | 83 | | | | 2,205 | |
| Wabash National Corp. | | | 623 | | | | 13,519 | |
| Watts Water Technologies, Inc., Cl. A | | | 293 | | | | 22,253 | |
| Woodward, Inc. | | | 744 | | | | 56,946 | |
| | | | | | | | 966,171 | |
| Marine—0.0% | | | | | | | | |
| Costamare, Inc. | | | 1,094 | | | | 6,312 | |
| Matson, Inc. | | | 375 | | | | 11,190 | |
| | | | | | | | 17,502 | |
| Professional Services—0.1% | | | | | | | | |
| Barrett Business Services, Inc. | | | 63 | | | | 4,063 | |
| BG Staffing, Inc. | | | 89 | | | | 1,419 | |
| CBIZ, Inc.1 | | | 769 | | | | 11,881 | |
| CRA International, Inc. | | | 71 | | | | 3,191 | |
| Experian plc | | | 2,611 | | | | 57,383 | |
| Exponent, Inc. | | | 308 | | | | 21,899 | |
| Forrester Research, Inc. | | | 205 | | | | 9,061 | |
| Franklin Covey Co.1 | | | 125 | | | | 2,594 | |
| FTI Consulting, Inc.1 | | | 357 | | | | 15,337 | |
| GP Strategies Corp.1 | | | 259 | | | | 6,009 | |
| Heidrick & Struggles International, Inc. | | | 228 | | | | 5,597 | |
| Hill International, Inc.1 | | | 457 | | | | 2,491 | |
| Huron Consulting Group, Inc.1 | | | 187 | | | | 7,564 | |
| ICF International, Inc.1 | | | 226 | | | | 11,865 | |
| Insperity, Inc. | | | 410 | | | | 23,513 | |
| Intertek Group plc | | | 618 | | | | 43,290 | |
| Kelly Services, Inc., Cl. A | | | 328 | | | | 8,945 | |
| Kforce, Inc. | | | 262 | | | | 6,615 | |
| Korn/Ferry International | | | 666 | | | | 27,559 | |
| Mistras Group, Inc.1 | | | 245 | | | | 5,750 | |
| Navigant Consulting, Inc.1 | | | 394 | | | | 7,648 | |
| On Assignment, Inc.1 | | | 471 | | | | 30,271 | |
| Pendrell Corp. | | | 2 | | | | 1,170 | |
| Resources Connection, Inc. | | | 278 | | | | 4,295 | |
| RPX Corp. | | | 596 | | | | 8,010 | |
| TriNet Group, Inc.1 | | | 511 | | | | 22,658 | |
| TrueBlue, Inc.1 | | | 480 | | | | 13,200 | |
| WageWorks, Inc.1 | | | 373 | | | | 23,126 | |
| Willdan Group, Inc.1 | | | 98 | | | | 2,346 | |
| | | | | | | | 388,750 | |
| Road & Rail—0.2% | | | | | | | | |
| ArcBest Corp. | | | 209 | | | | 7,472 | |
| Avis Budget Group, Inc.1 | | | 840 | | | | 36,859 | |
| Covenant Transportation Group, Inc., Cl. A1 | | | 172 | | | | 4,942 | |
| Daseke, Inc.1 | | | 459 | | | | 6,559 | |
| Heartland Express, Inc. | | | 736 | | | | 17,178 | |
| Hertz Global Holdings, Inc.1 | | | 1,044 | | | | 23,072 | |
| Knight-Swift Transportation Holdings, Inc., Cl. A | | | 1,635 | | | | 71,482 | |
| Marten Transport Ltd. | | | 503 | | | | 10,211 | |
| Roadrunner Transportation Systems, Inc.1 | | | 373 | | | | 2,876 | |
| Saia, Inc.1 | | | 238 | | | | 16,839 | |
| Schneider National, Inc., Cl. B | | | 1,672 | | | | 47,752 | |
| Union Pacific Corp. | | | 3,548 | | | | 475,787 | |
| Universal Logistics Holdings, Inc. | | | 321 | | | | 7,624 | |
| Werner Enterprises, Inc. | | | 639 | | | | 24,697 | |
| | | | | | | | |
| | | Shares | | | Value | |
| Road & Rail (Continued) | | | | | | | | |
| YRC Worldwide, Inc.1 | | | 339 | | | $ | 4,875 | |
| | | | | | | | 758,225 | |
| Trading Companies & Distributors—0.1% | |
| Aircastle Ltd. | | | 912 | | | | 21,332 | |
| Applied Industrial Technologies, Inc. | | | 366 | | | | 24,925 | |
| Beacon Roofing Supply, Inc.1 | | | 554 | | | | 35,323 | |
| BMC Stock Holdings, Inc.1 | | | 588 | | | | 14,876 | |
| Bunzl plc | | | 2,055 | | | | 57,462 | |
| CAI International, Inc.1 | | | 254 | | | | 7,193 | |
| DXP Enterprises, Inc.1 | | | 190 | | | | 5,618 | |
| Ferguson plc | | | 695 | | | | 49,729 | |
| Foundation Building Materials, Inc.1 | | | 359 | | | | 5,310 | |
| GATX Corp. | | | 341 | | | | 21,197 | |
| GMS, Inc.1 | | | 456 | | | | 17,164 | |
| H&E Equipment Services, Inc. | | | 299 | | | | 12,154 | |
| Herc Holdings, Inc.1 | | | 219 | | | | 13,712 | |
| Huttig Building Products, Inc.1 | | | 241 | | | | 1,603 | |
| Kaman Corp. | | | 247 | | | | 14,533 | |
| Lawson Products, Inc.1 | | | 82 | | | | 2,029 | |
| MRC Global, Inc.1 | | | 977 | | | | 16,531 | |
| Nexeo Solutions, Inc.1 | | | 788 | | | | 7,171 | |
| NOW, Inc.1 | | | 1,238 | | | | 13,655 | |
| Rush Enterprises, Inc., Cl. A1 | | | 506 | | | | 25,710 | |
| Rush Enterprises, Inc., Cl. B1 | | | 502 | | | | 24,201 | |
| SiteOne Landscape Supply, Inc.1 | | | 320 | | | | 24,544 | |
| Textainer Group Holdings Ltd.1 | | | 458 | | | | 9,847 | |
| Titan Machinery, Inc.1 | | | 163 | | | | 3,451 | |
| Triton International Ltd.1 | | | 992 | | | | 37,150 | |
| Veritiv Corp.1 | | | 175 | | | | 5,058 | |
| Willis Lease Finance Corp.1 | | | 58 | | | | 1,448 | |
| | | | | | | | 472,926 | |
| Transportation Infrastructure—0.0% | |
easyJet plc | | | 4,378 | | | | 86,539 | |
| Information Technology—4.9% | |
| Communications Equipment—0.8% | |
| ADTRAN, Inc. | | | 415 | | | | 8,030 | |
| Aerohive Networks, Inc.1 | | | 372 | | | | 2,169 | |
| CalAmp Corp.1 | | | 335 | | | | 7,179 | |
| Calix, Inc.1 | | | 397 | | | | 2,362 | |
| Ciena Corp.1 | | | 1,321 | | | | 27,649 | |
| Cisco Systems, Inc. | | | 57,131 | | | | 2,188,117 | |
| Clearfield, Inc.1 | | | 123 | | | | 1,507 | |
| CommScope Holding Co., Inc.1 | | | 22,040 | | | | 833,773 | |
| Comtech Telecommunications Corp. | | | 222 | | | | 4,911 | |
| Digi International, Inc.1 | | | 329 | | | | 3,142 | |
| EMCORE Corp.1 | | | 269 | | | | 1,735 | |
| Extreme Networks, Inc.1 | | | 1,002 | | | | 12,545 | |
| Finisar Corp.1 | | | 1,268 | | | | 25,804 | |
| Harmonic, Inc.1 | | | 681 | | | | 2,860 | |
| Infinera Corp.1 | | | 1,634 | | | | 10,343 | |
| InterDigital, Inc. | | | 317 | | | | 24,140 | |
| KVH Industries, Inc.1 | | | 173 | | | | 1,791 | |
| Lumentum Holdings, Inc.1 | | | 686 | | | | 33,545 | |
| NETGEAR, Inc.1 | | | 270 | | | | 15,862 | |
| NetScout Systems, Inc.1 | | | 754 | | | | 22,959 | |
| Oclaro, Inc.1 | | | 1,856 | | | | 12,509 | |
| Plantronics, Inc. | | | 271 | | | | 13,653 | |
| Quantenna Communications, Inc.1 | | | 421 | | | | 5,136 | |
| Ribbon Communications, Inc.1 | | | 475 | | | | 3,672 | |
| ViaSat, Inc.1 | | | 483 | | | | 36,153 | |
| Viavi Solutions, Inc.1 | | | 2,138 | | | | 18,686 | |
| | | | | | | | 3,320,232 | |
| Electronic Equipment, Instruments, & Components—0.2% | |
| Anixter International, Inc.1 | | | 306 | | | | 23,256 | |
| AVX Corp. | | | 1,654 | | | | 28,614 | |
| Badger Meter, Inc. | | | 260 | | | | 12,428 | |
20 OPPENHEIMER GLOBAL MULTI-ALTERNATIVES FUND/VA
| | | | | | | | |
| | | Shares | | | Value | |
| Electronic Equipment, Instruments, & Components (Continued) | |
| Bel Fuse, Inc., Cl. B | | | 134 | | | $ | 3,373 | |
| Belden, Inc. | | | 377 | | | | 29,093 | |
| Benchmark Electronics, Inc.1 | | | 479 | | | | 13,939 | |
| Control4 Corp.1 | | | 212 | | | | 6,309 | |
| CTS Corp. | | | 311 | | | | 8,008 | |
| Daktronics, Inc. | | | 449 | | | | 4,099 | |
| Electro Scientific Industries, Inc.1 | | | 241 | | | | 5,165 | |
| ePlus, Inc.1 | | | 158 | | | | 11,882 | |
| Fabrinet1 | | | 414 | | | | 11,882 | |
| FARO Technologies, Inc.1 | | | 157 | | | | 7,379 | |
| Fitbit, Inc., Cl. A1 | | | 2,003 | | | | 11,437 | |
| II-VI, Inc.1 | | | 561 | | | | 26,339 | |
| Insight Enterprises, Inc.1 | | | 504 | | | | 19,298 | |
| Iteris, Inc.1 | | | 335 | | | | 2,335 | |
| Itron, Inc.1 | | | 444 | | | | 30,281 | |
| KEMET Corp.1 | | | 888 | | | | 13,373 | |
| Kimball Electronics, Inc.1 | | | 345 | | | | 6,296 | |
| Knowles Corp.1 | | | 888 | | | | 13,018 | |
| Littelfuse, Inc. | | | 221 | | | | 43,718 | |
| LivaNova plc1 | | | 387 | | | | 30,929 | |
| Maxwell Technologies, Inc.1 | | | 304 | | | | 1,751 | |
| Mesa Laboratories, Inc. | | | 42 | | | | 5,221 | |
| Methode Electronics, Inc. | | | 347 | | | | 13,915 | |
| MTS Systems Corp. | | | 157 | | | | 8,431 | |
| Napco Security Technologies, Inc.1 | | | 181 | | | | 1,584 | |
| Novanta, Inc.1 | | | 415 | | | | 20,750 | |
| OSI Systems, Inc.1 | | | 183 | | | | 11,781 | |
| Park Electrochemical Corp. | | | 189 | | | | 3,714 | |
| PC Connection, Inc. | | | 250 | | | | 6,552 | |
| PCM, Inc.1 | | | 159 | | | | 1,574 | |
| Plexus Corp.1 | | | 311 | | | | 18,884 | |
| Radisys Corp.1 | | | 655 | | | | 658 | |
| Rogers Corp.1 | | | 163 | | | | 26,393 | |
| Sanmina Corp.1 | | | 653 | | | | 21,549 | |
| ScanSource, Inc.1 | | | 287 | | | | 10,275 | |
| SYNNEX Corp. | | | 478 | | | | 64,984 | |
| Systemax, Inc. | | | 328 | | | | 10,913 | |
| Tech Data Corp.1 | | | 346 | | | | 33,898 | |
| TTM Technologies, Inc.1 | | | 931 | | | | 14,589 | |
| VeriFone Systems, Inc.1 | | | 1,169 | | | | 20,703 | |
| Vishay Intertechnology, Inc. | | | 1,385 | | | | 28,739 | |
| Vishay Precision Group, Inc.1 | | | 112 | | | | 2,817 | |
| | | | | | | | 692,126 | |
| Internet Software & Services—1.1% | | | | | | | | |
| 2U, Inc.1 | | | 490 | | | | 31,610 | |
| Actua Corp.1 | | | 398 | | | | 6,209 | |
| Akamai Technologies, Inc.1 | | | 4,199 | | | | 273,103 | |
| Alarm.com Holdings, Inc.1 | | | 508 | | | | 19,177 | |
| Alphabet, Inc., Cl. A1,6 | | | 3,101 | | | | 3,266,593 | |
| Alphabet, Inc., Cl. C1 | | | 57 | | | | 59,645 | |
| Alteryx, Inc., Cl. A1 | | | 507 | | | | 12,812 | |
| Amber Road, Inc.1 | | | 337 | | | | 2,474 | |
| Appfolio, Inc., Cl. A1 | | | 342 | | | | 14,193 | |
| Apptio, Inc., Cl. A1 | | | 415 | | | | 9,761 | |
| Bazaarvoice, Inc.1 | | | 929 | | | | 5,063 | |
| Benefitfocus, Inc.1 | | | 299 | | | | 8,073 | |
| Blucora, Inc.1 | | | 461 | | | | 10,188 | |
| Box, Inc., Cl. A1 | | | 1,345 | | | | 28,406 | |
| Brightcove, Inc.1 | | | 354 | | | | 2,513 | |
| Carbonite, Inc.1 | | | 250 | | | | 6,275 | |
| Care.com, Inc.1 | | | 230 | | | | 4,149 | |
| Cars.com, Inc.1 | | | 666 | | | | 19,208 | |
| ChannelAdvisor Corp.1 | | | 423 | | | | 3,807 | |
| Cimpress NV1 | | | 263 | | | | 31,529 | |
| CommerceHub, Inc., Cl. A1 | | | 401 | | | | 8,818 | |
| CommerceHub, Inc., Cl. C1 | | | 525 | | | | 10,810 | |
| Cornerstone OnDemand, Inc.1 | | | 567 | | | | 20,032 | |
| | | | | | | | |
| | | Shares | | | Value | |
| Internet Software & Services (Continued) | |
| Coupa Software, Inc.1 | | | 497 | | | $ | 15,516 | |
| DHI Group, Inc.1 | | | 729 | | | | 1,385 | |
| Endurance International Group Holdings, Inc.1 | | | 1,146 | | | | 9,626 | |
| Envestnet, Inc.1 | | | 455 | | | | 22,682 | |
| Etsy, Inc.1 | | | 1,163 | | | | 23,783 | |
| Facebook, Inc., Cl. A1 | | | 261 | | | | 46,056 | |
| Five9, Inc.1 | | | 542 | | | | 13,485 | |
| GrubHub, Inc.1 | | | 740 | | | | 53,132 | |
| GTT Communications, Inc.1 | | | 371 | | | | 17,419 | |
| Hortonworks, Inc.1 | | | 571 | | | | 11,483 | |
| Instructure, Inc.1 | | | 282 | | | | 9,334 | |
| Internap Corp.1 | | | 203 | | | | 3,189 | |
| j2 Global, Inc. | | | 443 | | | | 33,238 | |
| Leaf Group Ltd.1 | | | 168 | | | | 1,663 | |
| Limelight Networks, Inc.1 | | | 1,362 | | | | 6,007 | |
| Liquidity Services, Inc.1 | | | 295 | | | | 1,431 | |
| LivePerson, Inc.1 | | | 878 | | | | 10,097 | |
| London Stock Exchange Group plc | | | 1,171 | | | | 59,957 | |
| Meet Group, Inc. (The)1 | | | 907 | | | | 2,558 | |
| MINDBODY, Inc., Cl. A1 | | | 434 | | | | 13,215 | |
| MuleSoft, Inc., Cl. A1 | | | 1,248 | | | | 29,029 | |
| New Relic, Inc.1 | | | 475 | | | | 27,441 | |
| NIC, Inc. | | | 642 | | | | 10,657 | |
| Nutanix, Inc., Cl. A1 | | | 1,272 | | | | 44,876 | |
| Okta, Inc., Cl. A1 | | | 895 | | | | 22,921 | |
| Q2 Holdings, Inc.1 | | | 401 | | | | 14,777 | |
| QuinStreet, Inc.1 | | | 464 | | | | 3,888 | |
| Quotient Technology, Inc.1 | | | 1,154 | | | | 13,560 | |
| Reis, Inc. | | | 91 | | | | 1,879 | |
| Shutterstock, Inc.1 | | | 301 | | | | 12,952 | |
| SPS Commerce, Inc.1 | | | 205 | | | | 9,961 | |
| Stamps.com, Inc.1 | | | 219 | | | | 41,172 | |
| TechTarget, Inc.1 | | | 300 | | | | 4,176 | |
| Trade Desk, Inc. (The), Cl. A1 | | | 521 | | | | 23,825 | |
| TrueCar, Inc.1 | | | 1,255 | | | | 14,056 | |
| Twilio, Inc., Cl. A1 | | | 1,054 | | | | 24,874 | |
| Web.com Group, Inc.1 | | | 483 | | | | 10,529 | |
| XO Group, Inc.1 | | | 324 | | | | 5,981 | |
| Yelp, Inc., Cl. A1 | | | 821 | | | | 34,449 | |
| | | | | | | | 4,560,707 | |
| IT Services—0.2% | | | | | | | | |
| Accenture plc, Cl. A | | | 350 | | | | 53,582 | |
| Acxiom Corp.1 | | | 691 | | | | 19,044 | |
| Atos SE | | | 972 | | | | 141,485 | |
| Blackhawk Network Holdings, Inc., Cl. A1 | | | 497 | | | | 17,718 | |
| CACI International, Inc., Cl. A1 | | | 327 | | | | 43,278 | |
| Capgemini SE | | | 1,163 | | | | 137,632 | |
| Cardtronics plc, Cl. A1 | | | 529 | | | | 9,797 | |
| Cass Information Systems, Inc. | | | 110 | | | | 6,403 | |
| Convergys Corp. | | | 912 | | | | 21,432 | |
| CSG Systems International, Inc. | | | 378 | | | | 16,564 | |
| EPAM Systems, Inc.1 | | | 448 | | | | 48,129 | |
| Everi Holdings, Inc.1 | | | 832 | | | | 6,273 | |
| EVERTEC, Inc. | | | 739 | | | | 10,087 | |
| ExlService Holdings, Inc.1 | | | 419 | | | | 25,287 | |
| Hackett Group, Inc. (The) | | | 330 | | | | 5,184 | |
| Information Services Group, Inc.1 | | | 477 | | | | 1,989 | |
| International Business Machines Corp. | | | 586 | | | | 89,904 | |
| ManTech International Corp., Cl. A | | | 433 | | | | 21,732 | |
| Mastercard, Inc., Cl. A | | | 313 | | | | 47,376 | |
| MAXIMUS, Inc. | | | 593 | | | | 42,447 | |
| MoneyGram International, Inc.1 | | | 653 | | | | 8,607 | |
| PayPal Holdings, Inc.1 | | | 558 | | | | 41,080 | |
| Perficient, Inc.1 | | | 410 | | | | 7,819 | |
| Presidio, Inc.1 | | | 831 | | | | 15,930 | |
| Science Applications International Corp. | | | 412 | | | | 31,547 | |
21 OPPENHEIMER GLOBAL MULTI-ALTERNATIVES FUND/VA
CONSOLIDATED STATEMENT OF INVESTMENTS Continued
| | | | | | | | |
| | | Shares | | | Value | |
| IT Services (Continued) | | | | | | | | |
| ServiceSource International, Inc.1 | | | 1,035 | | | $ | 3,198 | |
| StarTek, Inc.1 | | | 186 | | | | 1,854 | |
| Sykes Enterprises, Inc.1 | | | 475 | | | | 14,939 | |
| Syntel, Inc.1 | | | 715 | | | | 16,438 | |
| TeleTech Holdings, Inc. | | | 446 | | | | 17,951 | |
| Travelport Worldwide Ltd. | | | 1,779 | | | | 23,252 | |
| Unisys Corp.1 | | | 540 | | | | 4,401 | |
| Virtusa Corp.1 | | | 228 | | | | 10,050 | |
| Visa, Inc., Cl. A | | | 581 | | | | 66,246 | |
| | | | | | | | 1,028,655 | |
| Semiconductors & Semiconductor Equipment—1.3% | |
| Advanced Energy Industries, Inc.1 | | | 546 | | | | 36,844 | |
| Alpha & Omega Semiconductor Ltd.1 | | | 307 | | | | 5,023 | |
| Ambarella, Inc.1 | | | 327 | | | | 19,211 | |
| Amkor Technology, Inc.1 | | | 2,477 | | | | 24,894 | |
| Axcelis Technologies, Inc.1 | | | 306 | | | | 8,782 | |
| AXT, Inc.1 | | | 355 | | | | 3,089 | |
| Brooks Automation, Inc. | | | 913 | | | | 21,775 | |
| Cabot Microelectronics Corp. | | | 310 | | | | 29,165 | |
| CEVA, Inc.1 | | | 211 | | | | 9,738 | |
| Cirrus Logic, Inc.1 | | | 611 | | | | 31,686 | |
| Cohu, Inc. | | | 390 | | | | 8,561 | |
| Cree, Inc.1 | | | 932 | | | | 34,614 | |
| CyberOptics Corp.1 | | | 60 | | | | 900 | |
| Diodes, Inc.1 | | | 545 | | | | 15,625 | |
| DSP Group, Inc.1 | | | 279 | | | | 3,488 | |
| Entegris, Inc. | | | 1,865 | | | | 56,789 | |
| FormFactor, Inc.1 | | | 988 | | | | 15,462 | |
| GSI Technology, Inc.1 | | | 173 | | | | 1,377 | |
| Hanergy Thin Film Power Group Ltd.1,4 | | | 161,121 | | | | 2 | |
| Ichor Holdings Ltd.1 | | | 265 | | | | 6,519 | |
| Inphi Corp.1 | | | 401 | | | | 14,677 | |
| Integrated Device Technology, Inc.1 | | | 1,300 | | | | 38,649 | |
| Intel Corp. | | | 1,259 | | | | 58,115 | |
| IXYS Corp.1 | | | 406 | | | | 9,724 | |
| Kopin Corp.1 | | | 745 | | | | 2,384 | |
| Lattice Semiconductor Corp.1 | | | 1,497 | | | | 8,653 | |
| MACOM Technology Solutions Holdings, Inc.1 | | | 763 | | | | 24,828 | |
| MaxLinear, Inc., Cl. A1 | | | 587 | | | | 15,509 | |
| Mellanox Technologies Ltd.1 | | | 5,740 | | | | 371,378 | |
| MKS Instruments, Inc. | | | 592 | | | | 55,944 | |
| Monolithic Power Systems, Inc. | | | 404 | | | | 45,393 | |
| Nanometrics, Inc.1 | | | 350 | | | | 8,722 | |
| NVE Corp. | | | 47 | | | | 4,042 | |
| NXP Semiconductors NV1 | | | 6,540 | | | | 765,769 | |
| PDF Solutions, Inc.1 | | | 244 | | | | 3,831 | |
| Photronics, Inc.1 | | | 652 | | | | 5,558 | |
| Pixelworks, Inc.1 | | | 315 | | | | 1,994 | |
| Power Integrations, Inc. | | | 288 | | | | 21,182 | |
| QUALCOMM, Inc.6 | | | 12,554 | | | | 803,707 | |
| Rambus, Inc.1 | | | 1,033 | | | | 14,689 | |
| Rudolph Technologies, Inc.1 | | | 439 | | | | 10,492 | |
| Semtech Corp.1 | | | 757 | | | | 25,889 | |
| Sigma Designs, Inc.1 | | | 93,790 | | | | 651,841 | |
| Silicon Laboratories, Inc.1 | | | 420 | | | | 37,086 | |
| STMicroelectronics NV | | | 5,312 | | | | 115,361 | |
| Synaptics, Inc.1 | | | 314 | | | | 12,541 | |
| Texas Instruments, Inc. | | | 449 | | | | 46,894 | |
| Ultra Clean Holdings, Inc.1 | | | 387 | | | | 8,936 | |
| Veeco Instruments, Inc.1 | | | 511 | | | | 7,588 | |
| Xcerra Corp.1 | | | 659 | | | | 6,452 | |
| Xilinx, Inc.6 | | | 26,405 | | | | 1,780,225 | |
| Xperi Corp. | | | 556 | | | | 13,566 | |
| | | | | | | | 5,325,163 | |
| Software—0.6% | | | | | | | | |
| 8x8, Inc.1 | | | 824 | | | | 11,618 | |
| | | | | | | | |
| | | Shares | | | Value | |
| Software (Continued) | | | | | | | | |
| A10 Networks, Inc.1 | | | 785 | | | $ | 6,060 | |
| ACI Worldwide, Inc.1 | | | 1,179 | | | | 26,728 | |
| Agilysys, Inc.1 | | | 285 | | | | 3,500 | |
| American Software, Inc., Cl. A | | | 349 | | | | 4,059 | |
| Aspen Technology, Inc.1 | | | 664 | | | | 43,957 | |
| Barracuda Networks, Inc.1 | | | 424 | | | | 11,660 | |
| Blackbaud, Inc. | | | 468 | | | | 44,221 | |
| Blackline, Inc.1 | | | 485 | | | | 15,908 | |
| Bottomline Technologies de, Inc.1 | | | 351 | | | | 12,173 | |
| BroadSoft, Inc.1 | | | 12,245 | | | | 672,250 | |
| Callidus Software, Inc.1 | | | 539 | | | | 15,442 | |
| CommVault Systems, Inc.1 | | | 418 | | | | 21,945 | |
| Ebix, Inc. | | | 262 | | | | 20,763 | |
| Ellie Mae, Inc.1 | | | 333 | | | | 29,770 | |
| Everbridge, Inc.1 | | | 268 | | | | 7,965 | |
| Fair Isaac Corp. | | | 341 | | | | 52,241 | |
| Glu Mobile, Inc.1 | | | 1,322 | | | | 4,812 | |
| HubSpot, Inc.1 | | | 378 | | | | 33,415 | |
| Imperva, Inc.1 | | | 333 | | | | 13,220 | |
| Majesco1 | | | 387 | | | | 2,078 | |
| Micro Focus International plc | | | 2,516 | | | | 85,388 | |
| Microsoft Corp. | | | 645 | | | | 55,173 | |
| MicroStrategy, Inc., Cl. A1 | | | 135 | | | | 17,726 | |
| Mitek Systems, Inc.1 | | | 316 | | | | 2,828 | |
| MobileIron, Inc.1 | | | 898 | | | | 3,502 | |
| Model N, Inc.1 | | | 249 | | | | 3,922 | |
| Monotype Imaging Holdings, Inc. | | | 362 | | | | 8,724 | |
| Oracle Corp. | | | 1,281 | | | | 60,566 | |
| Paycom Software, Inc.1 | | | 552 | | | | 44,342 | |
| Paylocity Holding Corp.1 | | | 567 | | | | 26,740 | |
| Pegasystems, Inc. | | | 851 | | | | 40,125 | |
| Progress Software Corp. | | | 7,250 | | | | 308,633 | |
| Proofpoint, Inc.1 | | | 435 | | | | 38,632 | |
| PROS Holdings, Inc.1 | | | 272 | | | | 7,194 | |
| QAD, Inc., Cl. A | | | 276 | | | | 10,723 | |
| Qualys, Inc.1 | | | 322 | | | | 19,111 | |
| Rapid7, Inc.1 | | | 397 | | | | 7,408 | |
| RealNetworks, Inc.1 | | | 399 | | | | 1,365 | |
| RealPage, Inc.1 | | | 751 | | | | 33,269 | |
| RingCentral, Inc., Cl. A1 | | | 655 | | | | 31,702 | |
| Rosetta Stone, Inc.1 | | | 232 | | | | 2,893 | |
| Rubicon Project, Inc. (The)1 | | | 932 | | | | 1,743 | |
| Sage Group plc (The) | | | 6,089 | | | | 65,432 | |
| Silver Spring Networks, Inc.1 | | | 41,125 | | | | 667,870 | |
| Synchronoss Technologies, Inc.1 | | | 366 | | | | 3,272 | |
| Telenav, Inc.1 | | | 634 | | | | 3,487 | |
| TiVo Corp. | | | 1,177 | | | | 18,361 | |
| Varonis Systems, Inc.1 | | | 294 | | | | 14,274 | |
| VASCO Data Security International, Inc.1 | | | 497 | | | | 6,908 | |
| Verint Systems, Inc.1 | | | 750 | | | | 31,388 | |
| Workiva, Inc., Cl. A1 | | | 408 | | | | 8,731 | |
| Zendesk, Inc.1 | | | 883 | | | | 29,881 | |
| Zix Corp.1 | | | 740 | | | | 3,241 | |
| | | | | | | | 2,718,339 | |
| Technology Hardware, Storage & Peripherals—0.7% | | | | | |
| Apple, Inc. | | | 15,852 | | | | 2,682,634 | |
| Avid Technology, Inc.1 | | | 257 | | | | 1,385 | |
| Cray, Inc.1 | | | 347 | | | | 8,398 | |
| Diebold Nixdorf, Inc. | | | 719 | | | | 11,756 | |
| Eastman Kodak Co.1 | | | 654 | | | | 2,027 | |
| Electronics for Imaging, Inc.1 | | | 441 | | | | 13,023 | |
| Immersion Corp.1 | | | 17,584 | | | | 124,143 | |
| Intevac, Inc.1 | | | 300 | | | | 2,055 | |
| Pure Storage, Inc., Cl. A1 | | | 1,776 | | | | 28,167 | |
| Quantum Corp.1 | | | 30,270 | | | | 170,420 | |
| Stratasys Ltd.1 | | | 521 | | | | 10,399 | |
| Super Micro Computer, Inc.1 | | | 416 | | | | 8,705 | |
22 OPPENHEIMER GLOBAL MULTI-ALTERNATIVES FUND/VA
| | | | | | | | |
| | | Shares | | | Value | |
| Technology Hardware, Storage & Peripherals (Continued) | |
| USA Technologies, Inc.1 | | | 347 | | | $ | 3,383 | |
| | | | | | | | 3,066,495 | |
| Materials—2.2% | | | | | | | | |
| Chemicals—1.0% | | | | | | | | |
| A. Schulman, Inc. | | | 6,823 | | | | 254,157 | |
| AdvanSix, Inc.1 | | | 400 | | | | 16,828 | |
| AgroFresh Solutions, Inc.1 | | | 462 | | | | 3,419 | |
| Air Liquide SA | | | 1,085 | | | | 136,462 | |
| American Vanguard Corp. | | | 319 | | | | 6,268 | |
| Balchem Corp. | | | 293 | | | | 23,616 | |
| Calgon Carbon Corp. | | | 30,982 | | | | 659,917 | |
| Celanese Corp., Cl. A6 | | | 14,620 | | | | 1,565,510 | |
| Chase Corp. | | | 107 | | | | 12,893 | |
| Codexis, Inc.1 | | | 408 | | | | 3,407 | |
| Core Molding Technologies, Inc. | | | 79 | | | | 1,714 | |
| Croda International plc | | | 1,399 | | | | 83,538 | |
| DowDuPont, Inc. | | | 502 | | | | 35,752 | |
| Ferro Corp.1 | | | 961 | | | | 22,670 | |
| Flotek Industries, Inc.1 | | | 560 | | | | 2,610 | |
| FutureFuel Corp. | | | 419 | | | | 5,904 | |
| GCP Applied Technologies, Inc.1 | | | 606 | | | | 19,331 | |
| H.B. Fuller Co. | | | 479 | | | | 25,804 | |
| Hawkins, Inc. | | | 129 | | | | 4,541 | |
| Ingevity Corp.1 | | | 460 | | | | 32,416 | |
| Innophos Holdings, Inc. | | | 252 | | | | 11,776 | |
| Innospec, Inc. | | | 255 | | | | 18,003 | |
| Intrepid Potash, Inc.1 | | | 1,266 | | | | 6,026 | |
| Johnson Matthey plc | | | 2,025 | | | | 83,726 | |
| KMG Chemicals, Inc. | | | 147 | | | | 9,714 | |
| Koppers Holdings, Inc.1 | | | 246 | | | | 12,521 | |
| Kraton Corp.1 | | | 397 | | | | 19,123 | |
| Kronos Worldwide, Inc. | | | 1,034 | | | | 26,646 | |
| LSB Industries, Inc.1 | | | 225 | | | | 1,971 | |
| Minerals Technologies, Inc. | | | 332 | | | | 22,858 | |
| Monsanto Co. | | | 1,176 | | | | 137,333 | |
| OMNOVA Solutions, Inc.1 | | | 566 | | | | 5,660 | |
| PolyOne Corp. | | | 983 | | | | 42,760 | |
| Quaker Chemical Corp. | | | 119 | | | | 17,944 | |
| Rayonier Advanced Materials, Inc. | | | 313 | | | | 6,401 | |
| Sensient Technologies Corp. | | | 520 | | | | 38,038 | |
| Solvay SA | | | 1,004 | | | | 139,425 | |
| Stepan Co. | | | 264 | | | | 20,848 | |
| Trecora Resources1 | | | 223 | | | | 3,011 | |
| Tredegar Corp. | | | 395 | | | | 7,584 | |
| Trinseo SA | | | 513 | | | | 37,244 | |
| Valhi, Inc. | | | 2,069 | | | | 12,766 | |
| Westlake Chemical Partners LP5 | | | 19,812 | | | | 494,309 | |
| | | | | | | | 4,092,444 | |
| Construction Materials—0.1% | | | | | |
| Caesarstone Ltd.1 | | | 369 | | | | 8,118 | |
| CRH plc | | | 1,013 | | | | 36,307 | |
| LafargeHolcim Ltd.1 | | | 3,057 | | | | 172,192 | |
| Summit Materials, Inc., Cl. A1 | | | 1,062 | | | | 33,389 | |
| United States Lime & Minerals, Inc. | | | 72 | | | | 5,551 | |
| US Concrete, Inc.1 | | | 152 | | | | 12,715 | |
| | | | | | | | 268,272 | |
| Containers & Packaging—0.6% | | | | | |
| Greif, Inc., Cl. A | | | 567 | | | | 34,349 | |
| Greif, Inc., Cl. B | | | 562 | | | | 38,975 | |
| Myers Industries, Inc. | | | 290 | | | | 5,655 | |
| Packaging Corp. of America | | | 10,580 | | | | 1,275,419 | |
| Sonoco Products Co.6 | | | 23,870 | | | | 1,268,452 | |
| UFP Technologies, Inc.1 | | | 99 | | | | 2,752 | |
| | | | | | | | 2,625,602 | |
| Metals & Mining—0.4% | | | | | | | | |
| AK Steel Holding Corp.1 | | | 2,809 | | | | 15,899 | |
| | | | | | | | |
| | | Shares | | | Value | |
| Metals & Mining (Continued) | | | | | |
| Allegheny Technologies, Inc.1 | | | 1,140 | | | $ | 27,520 | |
| Ampco-Pittsburgh Corp. | | | 135 | | | | 1,674 | |
| Anglo American plc | | | 2,286 | | | | 47,778 | |
| Antofagasta plc | | | 2,555 | | | | 34,640 | |
| ArcelorMittal1 | | | 4,130 | | | | 133,751 | |
| BHP Billiton plc | | | 2,559 | | | | 52,379 | |
| Carpenter Technology Corp. | | | 446 | | | | 22,742 | |
| Century Aluminum Co.1 | | | 873 | | | | 17,146 | |
| Cie Generale des Etablissements Michelin | | | 1,267 | | | | 181,491 | |
| Cleveland-Cliffs, Inc.1 | | | 2,512 | | | | 18,112 | |
| Coeur Mining, Inc.1 | | | 1,711 | | | | 12,832 | |
| Commercial Metals Co. | | | 1,076 | | | | 22,940 | |
| Compass Minerals International, Inc. | | | 301 | | | | 21,747 | |
| Fresnillo plc | | | 2,683 | | | | 51,800 | |
| Glencore plc1 | | | 8,020 | | | | 42,196 | |
| Gold Resource Corp. | | | 491 | | | | 2,160 | |
| Hargreaves Lansdown plc | | | 3,142 | | | | 76,430 | |
| Haynes International, Inc. | | | 132 | | | | 4,231 | |
| Hecla Mining Co. | | | 4,767 | | | | 18,925 | |
| Kaiser Aluminum Corp. | | | 164 | | | | 17,523 | |
| Klondex Mines Ltd.1 | | | 2,002 | | | | 5,225 | |
| Materion Corp. | | | 199 | | | | 9,671 | |
| Olympic Steel, Inc. | | | 127 | | | | 2,729 | |
| Randgold Resources Ltd. | | | 1,588 | | | | 157,539 | |
| Rio Tinto plc | | | 789 | | | | 41,641 | |
| Ryerson Holding Corp.1 | | | 335 | | | | 3,484 | |
| Schnitzer Steel Industries, Inc., Cl. A | | | 258 | | | | 8,643 | |
| Steel Dynamics, Inc. | | | 14,760 | | | | 636,599 | |
| SunCoke Energy, Inc.1 | | | 593 | | | | 7,110 | |
| TimkenSteel Corp.1 | | | 390 | | | | 5,924 | |
| Warrior Met Coal, Inc. | | | 592 | | | | 14,889 | |
| Worthington Industries, Inc. | | | 643 | | | | 28,331 | |
| | | | | | | | 1,745,701 | |
| Paper & Forest Products—0.1% | | | | | |
| Boise Cascade Co. | | | 336 | | | | 13,406 | |
| Clearwater Paper Corp.1 | | | 151 | | | | 6,855 | |
| Deltic Timber Corp. | | | 116 | | | | 10,620 | |
| KapStone Paper & Packaging Corp. | | | 927 | | | | 21,034 | |
| Louisiana-Pacific Corp.1 | | | 1,350 | | | | 35,451 | |
| Mondi plc | | | 2,146 | | | | 55,949 | |
| Neenah Paper, Inc. | | | 199 | | | | 18,039 | |
| PH Glatfelter Co. | | | 416 | | | | 8,919 | |
| Schweitzer-Mauduit International, Inc. | | | 349 | | | | 15,831 | |
| Smurfit Kappa Group plc | | | 1,641 | | | | 55,633 | |
| Verso Corp., Cl. A1 | | | 200 | | | | 3,514 | |
| | | | | | | | 245,251 | |
| Telecommunication Services—0.9% | | | | | |
| Diversified Telecommunication Services—0.9% | |
| AT&T, Inc.6 | | | 23,842 | | | | 926,977 | |
| ATN International, Inc. | | | 138 | | | | 7,626 | |
| Babcock International Group plc | | | 7,187 | | | | 68,123 | |
| BCE, Inc. | | | 28,885 | | | | 1,386,769 | |
| BT Group plc, Cl. A | | | 18,147 | | | | 66,444 | |
| Cincinnati Bell, Inc.1 | | | 351 | | | | 7,318 | |
| Cogent Communications Holdings, Inc. | | | 500 | | | | 22,650 | |
| Consolidated Communications Holdings, Inc. | | | 909 | | | | 11,081 | |
| General Communication, Inc., Cl. A1 | | | 350 | | | | 13,657 | |
| Hawaiian Telcom Holdco, Inc.1 | | | 135 | | | | 4,166 | |
| IDT Corp., Cl. B1 | | | 198 | | | | 2,099 | |
| Intelsat SA1 | | | 1,373 | | | | 4,654 | |
| Iridium Communications, Inc.1 | | | 901 | | | | 10,632 | |
| Ooma, Inc.1 | | | 166 | | | | 1,984 | |
| Orange SA | | | 12,893 | | | | 223,731 | |
| ORBCOMM, Inc.1 | | | 737 | | | | 7,503 | |
23 OPPENHEIMER GLOBAL MULTI-ALTERNATIVES FUND/VA
CONSOLIDATED STATEMENT OF INVESTMENTS Continued
| | | | | | | | |
| | | Shares | | | Value | |
| Diversified Telecommunication Services (Continued) | |
| Straight Path Communications, Inc., Cl. B1 | | | 120 | | | $ | 21,815 | |
| Verizon Communications, Inc. | | | 17,298 | | | | 915,583 | |
| Vivendi SA | | | 4,564 | | | | 122,726 | |
| Vonage Holdings Corp.1 | | | 1,727 | | | | 17,563 | |
| Windstream Holdings, Inc. | | | 1,238 | | | | 2,290 | |
| | | | | | | | 3,845,391 | |
| Wireless Telecommunication Services—0.0% | |
| Boingo Wireless, Inc.1 | | | 365 | | | | 8,212 | |
| NII Holdings, Inc.1 | | | 605 | | | | 257 | |
| Shenandoah Telecommunications Co. | | | 462 | | | | 15,616 | |
| Spok Holdings, Inc. | | | 183 | | | | 2,864 | |
| Vodafone Group plc | | | 16,884 | | | | 53,338 | |
| | | | | | | | 80,287 | |
| Utilities—1.4% | | | | | | | | |
| Electric Utilities—0.6% | | | | | | | | |
| ALLETE, Inc. | | | 470 | | | | 34,949 | |
| Bouygues SA | | | 2,711 | | | | 140,833 | |
| Duke Energy Corp. | | | 2,789 | | | | 234,583 | |
| Edison International | | | 15,535 | | | | 982,433 | |
| El Paso Electric Co. | | | 363 | | | | 20,092 | |
| Exelon Corp. | | | 3,885 | | | | 153,108 | |
| Genie Energy Ltd., Cl. B | | | 311 | | | | 1,356 | |
| IDACORP, Inc. | | | 573 | | | | 52,349 | |
| MGE Energy, Inc. | | | 328 | | | | 20,697 | |
| NextEra Energy, Inc. | | | 964 | | | | 150,567 | |
| Otter Tail Corp. | | | 356 | | | | 15,824 | |
| PG&E Corp. | | | 8,390 | | | | 376,124 | |
| PNM Resources, Inc. | | | 719 | | | | 29,084 | |
| Portland General Electric Co. | | | 1,045 | | | | 47,631 | |
| Southern Co. (The) | | | 2,334 | | | | 112,242 | |
| SSE plc | | | 5,894 | | | | 105,000 | |
| | | | | | | | 2,476,872 | |
| Gas Utilities—0.1% | | | | | | | | |
| Chesapeake Utilities Corp. | | | 146 | | | | 11,468 | |
| New Jersey Resources Corp. | | | 817 | | | | 32,843 | |
| Northwest Natural Gas Co. | | | 261 | | | | 15,569 | |
| ONE Gas, Inc. | | | 619 | | | | 45,348 | |
| South Jersey Industries, Inc. | | | 755 | | | | 23,579 | |
| Southwest Gas Holdings, Inc. | | | 558 | | | | 44,908 | |
| Spire, Inc. | | | 439 | | | | 32,991 | |
| WGL Holdings, Inc. | | | 491 | | | | 42,147 | |
| | | | | | | | 248,853 | |
| Independent Power and Renewable Electricity Producers—0.2% | |
| Atlantic Power Corp.1 | | | 1,368 | | | | 3,215 | |
| Calpine Corp.1 | | | 43,104 | | | | 652,163 | |
| Dynegy, Inc.1 | | | 1,276 | | | | 15,121 | |
| NRG Energy, Inc. | | | 171 | | | | 4,877 | |
| NRG Yield, Inc., Cl. A | | | 917 | | | | 17,285 | |
| NRG Yield, Inc., Cl. C | | | 918 | | | | 17,350 | |
| Ormat Technologies, Inc. | | | 474 | | | | 30,317 | |
| Pattern Energy Group, Inc., Cl. A | | | 857 | | | | 18,417 | |
| TerraForm Power, Inc., Cl. A | | | 973 | | | | 11,637 | |
| | | | | | | | 770,382 | |
| Multi-Utilities—0.5% | | | | | | | | |
| Avista Corp. | | | 12,776 | | | | 657,836 | |
| Black Hills Corp. | | | 566 | | | | 34,022 | |
| Centrica plc | | | 28,720 | | | | 53,177 | |
| CMS Energy Corp. | | | 16,080 | | | | 760,584 | |
| Engie SA | | | 10,217 | | | | 175,543 | |
| National Grid plc | | | 7,068 | | | | 83,028 | |
| NorthWestern Corp. | | | 546 | | | | 32,596 | |
| Unitil Corp. | | | 171 | | | | 7,801 | |
| Veolia Environnement SA | | | 12,974 | | | | 331,017 | |
| | | | | | | 2,135,604 | |
| | | | | | | | |
| | | Shares | | | Value | |
| Water Utilities—0.0% | | | | | | | | |
| American States Water Co. | | | 323 | | | $ | 18,705 | |
| AquaVenture Holdings Ltd.1 | | | 199 | | | | 3,088 | |
| Artesian Resources Corp., Cl. A | | | 83 | | | | 3,200 | |
| California Water Service Group | | | 419 | | | | 19,002 | |
| Connecticut Water Service, Inc. | | | 112 | | | | 6,430 | |
| Consolidated Water Co. Ltd. | | | 132 | | | | 1,663 | |
| Middlesex Water Co. | | | 146 | | | | 5,827 | |
| Pure Cycle Corp.1 | | | 246 | | | | 2,054 | |
| SJW Group | | | 169 | | | | 10,787 | |
| United Utilities Group plc | | | 6,768 | | | | 75,750 | |
| York Water Co. (The) | | | 115 | | | | 3,899 | |
| | | | | | | 150,405 | |
Total Common Stocks (Cost $153,089,270) | | | | 179,857,178 | |
| Preferred Stocks—0.3% | | | | | | | | |
| Kinesis 2017 Sidecar, Preferred1 | | | 49,261 | | | | 240,517 | |
| M&T Bank Corp., 6.375% Cum., Series A, Non-Vtg. | | | 340 | | | | 348,500 | |
| M&T Bank Corp., 6.375% Cum., Series C, Non-Vtg. | | | 475 | | | | 486,875 | |
| Total Preferred Stocks (Cost $1,294,384) | | | | 1,075,892 | |
| | |
| | | Units | | | | |
| Rights, Warrants and Certificates—0.0% | | | | | |
| Halcon Resources Corp. Wts., Strike Price $14.04, Exp. 9/9/201 | | | 2,038 | | | | 1,447 | |
| Kaisa Group Holdings Ltd. Rts., Strike Price 1SGD, Exp. 12/31/491,4 | | | 231 | | | | 2 | |
| SandRidge Energy, Inc. Wts., Strike Price $41.34, Exp. 10/4/221 | | | 977 | | | | 1,759 | |
| SandRidge Energy, Inc. Wts., Strike Price $42.03, Exp. 10/4/221 | | | 411 | | | | 616 | |
| Total Rights, Warrants and Certificates (Cost $70,284) | | | | | | | 3,824 | |
| | | | | | |
| | |
| | | Principal Amount | | | |
| Asset-Backed Securities—2.5% | | | | | | |
| Bear Stearns Structured Products Trust, | | | | |
| Series 2007-EMX1, Cl. A2, 2.852% | | | | | | |
| [US0001M+130], 3/25/372,10 | | $ 1,600,000 | | | 1,619,529 | |
GSAMP Trust, Series 2005-HE4, Cl. M3, 2.332% [US0001M+78], 7/25/4510 | | 1,400,000 | | | 1,393,320 | |
| Morgan Stanley ABS Capital I, Inc. | | | | | | |
Trust, Series 2006-NC1, Cl. M1, 1.932% [US0001M+38], 12/25/3510 | | 1,780,000 | | | 1,742,304 | |
| New Century Home Equity Loan | | | | | | |
| Trust, Series 2005-1, Cl. M2, 2.272% | | | | | | |
| [US0001M+72], 3/25/3510 | | 397,953 | | | 378,409 | |
Raspro Trust, Series 2005-1A, Cl. G, 2.025% [LIBOR03M+40], 3/23/242,10 | | 1,396,674 | | | 1,381,069 | |
| SG Mortgage Securities Trust, | | | | | | |
| Series 2005-OPT1, Cl. M2, 2.002% | | | | | | |
| [US0001M+45], 10/25/3510 | | 4,250,000 | | | 4,116,496 | |
| Total Asset-Backed Securities (Cost | | | | | | |
| $9,622,612) | | | | | 10,631,127 | |
| Mortgage-Backed Obligation—0.5% | |
| RAMP Trust, Series 2005-RS6, Cl. | | | | | | |
M4, 2.527% [US0001M+97.5], 6/25/3510(Cost $2,079,986) | | 2,300,000 | | | 2,306,933 | |
| Foreign Government Obligations—1.8% | |
| Federative Republic of Brazil, 6.193% | |
| Sr. Unsec. Nts., 4/1/1814 | | BRL 9,700,000 | | | 2,878,401 | |
24 OPPENHEIMER GLOBAL MULTI-ALTERNATIVES FUND/VA
| | | | | | | | | | |
| | | | | Principal
Amount | | | Value | |
| Foreign Government Obligations (Continued) | |
| Republic of Singapore, 0.50% Sr. Unsec. Nts., 4/1/18 | | SGD | | | 6,300,000 | | | $ | 4,700,183 | |
Total Foreign Government Obligations (Cost $7,519,500) | | | | | | | 7,578,584 | |
| Non-Convertible Corporate Bonds and Notes—7.9% | |
| Altice US Finance I Corp., 5.50% Sr. Sec. Nts., 5/15/262 | | | | | 350,000 | | | | 357,437 | |
| American Express Co., 7.00% Sr. Unsec. Nts., 3/19/18 | | | | | 500,000 | | | | 505,382 | |
| Arconic, Inc., 5.40% Sr. Unsec. Nts., 4/15/21 | | | | | 450,000 | | | | 479,137 | |
| Ardagh Packaging Finance plc/Ardagh Holdings USA, Inc., 7.25% Sr. Unsec. Nts., 5/15/242 | | | 350,000 | | | | 382,375 | |
| Bancolombia SA, 5.125% Unsec. Sub. Nts., 9/11/22 | | | 195,000 | | | | 204,266 | |
| Bank of America Corp., 6.25% [US0003M+370.5] Jr. Sub. Perpetual Bonds10,11 | | | | | 1,149,000 | | | | 1,271,139 | |
| BAT International Finance plc, 1.85% Sr. Unsec. Nts., 6/15/182 | | | 500,000 | | | | 499,616 | |
| BMC Software Finance, Inc., 8.125% Sr. Unsec. Nts., 7/15/212 | | | | | 450,000 | | | | 455,062 | |
| CCO Holdings LLC/CCO Holdings Capital Corp., 5.125% Sr. Unsec. Nts., 5/1/232 | | | | | 450,000 | | | | 460,125 | |
| Cemex Finance LLC, 6.00% Sr. Sec. Nts., 4/1/242 | | | | | 350,000 | | | | 371,000 | |
| Cenovus Energy, Inc., 6.75% Sr. Unsec. Nts., 11/15/39 | | | 450,000 | | | | 545,267 | |
| Centene Corp., 5.625% Sr. Unsec. Nts., 2/15/21 | | | | | 450,000 | | | | 463,500 | |
| Cequel Communications Holdings I LLC/Cequel Capital Corp., 6.375% Sr. Unsec. Nts., 9/15/202 | | | | | 315,000 | | | | 320,512 | |
| Charter Communications Operating LLC/Charter Communications Operating Capital, 4.908% Sr. Sec. Nts., 7/23/25 | | | | | 450,000 | | | | 479,061 | |
| Cheniere Corpus Christi Holdings LLC, 5.875% Sr. Sec. Nts., 3/31/25 | | | | | 350,000 | | | | 379,969 | |
| Citgo Holding, Inc., 10.75% Sr. Sec. Nts., 2/15/202 | | | | | 350,000 | | | | 377,125 | |
| Citigroup, Inc., 5.875% [US0003M+405.9] Jr. Sub. Perpetual Bonds10,11 | | | | | 1,783,000 | | | | 1,852,091 | |
| CNX Resources Corp., 5.875% Sr. Unsec. Nts., 4/15/22 | | | | | 450,000 | | | | 461,812 | |
| CommScope Technologies LLC, 6.00% Sr. Unsec. Nts., 6/15/252 | | | 450,000 | | | | 480,375 | |
| Continental Resources, Inc., 5.00% Sr. Unsec. Nts., 9/15/22 | | | 450,000 | | | | 458,437 | |
| Crown Castle International Corp., 5.25% Sr. Unsec. Nts., 1/15/23 | | | | | 450,000 | | | | 493,206 | |
| Daimler Finance North America LLC, 2.00% Sr. Unsec. Nts., 8/3/182 | | | | | 500,000 | | | | 500,100 | |
DaVita, Inc.: 5.125% Sr. Unsec. Nts., 7/15/24 | | | | | 550,000 | | | | 556,531 | |
| 5.75% Sr. Unsec. Nts., 8/15/22 | | | | | 200,000 | | | | 205,875 | |
| Dollar Tree, Inc., 5.75% Sr. Sec. Nts., 3/1/23 | | | | | 450,000 | | | | 472,219 | |
| Duke Energy Corp., 6.25% Sr. Unsec. Nts., 6/15/18 | | | | | 500,000 | | | | 509,767 | |
| FirstEnergy Corp., 7.375% Sr. Unsec. Nts., 11/15/31 | | | | | 450,000 | | | | 608,141 | |
| FMG Resources August 2006 Pty Ltd., 9.75% Sr. Sec. Nts., 3/1/222 | | | | | 450,000 | | | | 499,050 | |
| | | | | | | | |
| | | Principal
Amount | | | Value | |
| Non-Convertible Corporate Bonds and Notes (Continued) | |
| Freeport-McMoRan, Inc., 2.375% Sr. Unsec. Nts., 3/15/18 | | $ | 450,000 | | | $ | 449,662 | |
| Gazprom OAO Via Gaz Capital SA, 9.25% Sr. Unsec. Nts., 4/23/192 | | | 300,000 | | | | 324,176 | |
| Goldman Sachs Capital II, 4.00% [US0003M+76.75] Jr. Sub. Perpetual Bonds10,11 | | | 8,000 | | | | 7,092 | |
| Goldman Sachs Group, Inc. (The), 5.70% [US0003M+388.4] Jr. Sub. Perpetual Bonds, Series L10,11 | | | 1,400,000 | | | | 1,445,290 | |
| HBOS plc, 6.75% Sub. Nts., 5/21/182 | | | 450,000 | | | | 457,672 | |
| HCA, Inc., 6.50% Sr. Sec. Nts., 2/15/20 | | | 450,000 | | | | 478,125 | |
| Hexagon Reinsurance DAC, 6.50% [EUR003M+650] Unsec. Nts., 1/19/222,10 | | | 250,000 | | | | 300,112 | |
| HUB International Ltd., 7.875% Sr. Unsec. Nts., 10/1/212 | | | 450,000 | | | | 469,125 | |
| Icahn Enterprises LP/Icahn Enterprises Finance Corp., 6.00% Sr. Unsec. Nts., 8/1/20 | | | 450,000 | | | | 463,072 | |
| Itau Unibanco Holding SA (Cayman Islands), 5.125% Sub. Nts., 5/13/232 | | | 300,000 | | | | 307,800 | |
| JPMorgan Chase & Co., 6.10% [US0003M+333] Jr. Sub. Perpetual Bonds10,11 | | | 1,181,000 | | | | 1,299,159 | |
| Lukoil International Finance BV: 4.563% Sr. Unsec. Unsub. Nts., 4/24/232 | | | 500,000 | | | | 520,498 | |
| 6.125% Sr. Unsec. Nts., 11/9/202 | | | 2,074,000 | | | | 2,240,905 | |
| MGM Resorts International, 7.75% Sr. Unsec. Nts., 3/15/22 | | | 450,000 | | | | 514,125 | |
| MMC Energy, Inc., 8.875% Sr. Unsec. Nts., 10/15/203,4,9 | | | 100,000 | | | | — | |
| Momentive Performance Materials, Inc., 3.88% Sr. Sec. Nts., 10/24/21 | | | 450,000 | | | | 471,375 | |
| Nielsen Finance LLC/Nielsen Finance Co., 5.00% Sr. Unsec. Nts., 4/15/222 | | | 450,000 | | | | 464,063 | |
| Offshore Group Investment Ltd., 7.50% 1st Lien Nts., 11/1/193,4,9 | | | 250,000 | | | | — | |
| Ortho-Clinical Diagnostics, Inc./Ortho- Clinical Diagnostics SA, 6.625% Sr. Unsec. Nts., 5/15/222 | | | 400,000 | | | | 404,000 | |
| Post Holdings, Inc., 5.00% Sr. Unsec. Nts., 8/15/262 | | | 450,000 | | | | 443,813 | |
| Reynolds Group Issuer, Inc./Reynolds Group Issuer LLC/Reynolds Group Issuer Luxembourg SA, 5.75% Sr. Sec. Nts., 10/15/20 | | | 339,188 | | | | 344,700 | |
| Rio Oil Finance Trust, 9.25% Sr. Sec. Nts., 7/6/242 | | | 247,944 | | | | 269,019 | |
| Sabine Pass Liquefaction LLC, 5.625% Sr. Sec. Nts., 2/1/21 | | | 400,000 | | | | 429,070 | |
| Samson Investment Co., 9.75% Sr. Unsec. Nts., 2/15/203,4,9 | | | 300,000 | | | | 17,850 | |
| SandRidge Energy, Inc., 7.50% Sr. Unsec. Nts., 3/15/213,4,9 | | | 500,000 | | | | 50 | |
| Sirius XM Radio, Inc., 6.00% Sr. Unsec. Nts., 7/15/242 | | | 450,000 | | | | 477,000 | |
| Solera LLC/Solera Finance, Inc., 10.50% Sr. Unsec. Nts., 3/1/242 | | | 450,000 | | | | 508,491 | |
| T-Mobile USA, Inc., 6.625% Sr. Unsec. Nts., 4/1/23 | | | 450,000 | | | | 470,250 | |
| TransDigm, Inc., 6.50% Sr. Sub. Nts., 7/15/24 | | | 450,000 | | | | 462,375 | |
| Univision Communications, Inc., 5.125% Sr. Sec. Nts., 2/15/252 | | | 450,000 | | | | 439,875 | |
| Vantage Drilling International, 10.00% Sec. Nts., 12/31/20 | | | 407,000 | | | | 400,895 | |
25 OPPENHEIMER GLOBAL MULTI-ALTERNATIVES FUND/VA
CONSOLIDATED STATEMENT OF INVESTMENTS Continued
| | | | | | | | |
| | | Principal Amount | | | Value | |
| Non-Convertible Corporate Bonds and Notes (Continued) | |
| VTR Finance BV, 6.875% Sr. Sec. Nts., 1/15/242 | | $ | 400,000 | | | $ | 423,000 | |
| Wells Fargo & Co., 5.90% [US0003M+311] Jr. Sub. Perpetual Bonds, Series S10,11 | | | 1,205,000 | | | | 1,290,495 | |
| Western Digital Corp., 10.50% Sr. Unsec. Nts., 4/1/24 | | | 450,000 | | | | 522,563 | |
| Wynn Las Vegas LLC/Wynn Las Vegas Capital Corp., 5.50% Sr. Unsec. Nts., 3/1/252 | | | 450,000 | | | | 464,625 | |
| Zayo Group LLC/Zayo Capital, Inc., 6.00% Sr. Unsec. Nts., 4/1/23 | | | 450,000 | | | | 470,948 | |
| ZF North America Capital, Inc., 4.75% Sr. Unsec. Nts., 4/29/252 | | | 164,000 | | | | 174,250 | |
| Ziggo Secured Finance BV, 5.50% Sr. Sec. Nts., 1/15/272 | | | 350,000 | | | | 350,438 | |
Total Non-Convertible Corporate Bonds and Notes (Cost $32,217,630) | | | | | | | 33,224,535 | |
| Convertible Corporate Bond and Note—0.0% | |
CHC Group LLC/CHC Finance Ltd., 10.78% Cv. Sec. Nts., 10/1/2014(Cost $27,294) | | | 35,887 | | | | 48,268 | |
| Corporate Loans—2.9% | |
| Axalta Coating Systems US Holdings, Inc., Sr. Sec. Credit Facilities 1st Lien Term Loan, 3.693% [LIBOR4+200], 6/1/2410,12 | | | 2,314,221 | | | | 2,326,452 | |
| Delos Finance Sarl, Sr. Sec. Credit Facilities 1st Lien Term Loan, 3.693% [LIBOR4+200], 10/6/2310,12 | | | 2,310,000 | | | | 2,330,420 | |
| Hilton Wordwide Finance LLC, Sr. Sec. Credit Facilities 1st Lien Term Loan, 3.432% [LIBOR12+200], 10/25/2310,12 | | | 2,194,472 | | | | 2,207,771 | |
| Hilton Wordwide Finance LLC, Sr. Sec. Credit Facilities 1st Lien Term Loan, 3.552% [LIBOR12+200], 10/25/2310 | | | 109,724 | | | | 110,389 | |
| Neiman Marcus Group Ltd. LLC, Sr. Sec. Credit Facilities 1st Lien Term Loan, 4.642% [LIBOR12+325], 10/25/2010 | | | 763,107 | | | | 625,275 | |
| TransDigm, Inc., Sr. Sec. Credit Facilities 1st Lien Term Loan, 4.319% [LIBOR12+275], 5/14/2210,12 | | | 2,311,542 | | | | 2,320,869 | |
| Vistra Operations Co. LLC, Sr. Sec. Credit Facilities 1st Lien Term Loan, 4.08% [LIBOR12+275], 12/14/2310,12 | | | 2,299,194 | | | | 2,318,289 | |
Total Corporate Loans (Cost $12,313,306) | | | | | | | 12,239,465 | |
| Event-Linked Bonds—11.4% | |
| Earthquake—3.5% | | | | | | | | |
| Acorn Re Ltd. Catastrophe Linked Nts., 4.546% [US0006M+329], 7/17/182,10 | | | 750,000 | | | | 756,262 | |
| Azzurro Re I Ltd. Catastrophe Linked Nts., 2.15% [EUR003M+215], 1/16/192,10 | | | EUR 800,000 | | | | 963,648 | |
| Bosphorus Ltd. Catastrophe Linked Nts., 4.761% [US0006M+325], 8/17/1810,13 | | | 500,000 | | | | 505,875 | |
| Buffalo Re Ltd. Catastrophe Linked Nts.: | | | | | | | | |
| 4.641% [US0006M+325], 4/7/202,10 | | | 750,000 | | | | 744,562 | |
| 8.141% [US0006M+675], 4/7/202,10 | | | 250,000 | | | | 246,775 | |
| Golden State Re II Ltd. Catastrophe Linked Nts., 3.591% [T-BILL 3MO+220], 1/8/192,10 | | | 1,000,000 | | | | 1,006,150 | |
| | | | | | |
| | | Principal
Amount | | | Value |
| Earthquake (Continued) |
| Kilimanjaro Re Ltd. Catastrophe Linked Nts., 5.144% [T-BILL 3MO+375], 11/25/192,10 | | $ | 250,000 | | | $ 252,112 |
|
| Kizuna Re II Ltd. Catastrophe Linked Nts.: | | | | | | |
| 3.638% [T-BILL 3MO+225], 4/6/182,10 | | | 950,000 | | | 951,662 |
| 3.888% [T-BILL 3MO+250], 4/6/182,10 | | | 750,000 | | | 750,937 |
|
| Merna Re Ltd. Catastrophe Linked Nts.: | | | | | | |
| 3.383% [T-BILL 3MO+200], 4/9/182,10 | | | 250,000 | | | 249,812 |
| 3.383% [T-BILL 3MO+200], 4/8/2010,13 | | | 750,000 | | | 750,413 |
| 3.633% [T-BILL 3MO+225], 4/8/192,10 | | | 500,000 | | | 501,175 |
|
| Nakama Re Ltd. Catastrophe Linked Nts.: | | | | | | |
| 3.329% [US0006M+220], 10/13/212,10 | | | 650,000 | | | 661,538 |
| 3.508% [T-BILL 3MO+212.5], 1/16/192,10 | | | 750,000 | | | 752,287 |
| 3.633% [T-BILL 3MO+225], 4/13/182,10 | | | 250,000 | | | 251,137 |
| 3.883% [T-BILL 3MO+250], 4/13/182,10 | | | 500,000 | | | 500,375 |
| 4.258% [T-BILL 3MO+287.5], 1/16/2010,13 | | | 750,000 | | | 757,612 |
| 4.258% [T-BILL 3MO+287.5], 1/14/212,10 | | | 250,000 | | | 251,888 |
| 4.379% [US0006M+325], 10/13/212,10 | | | 500,000 | | | 509,125 |
| 4.633% [T-BILL 3MO+325], 1/14/2110,13 | | | 250,000 | | | 256,488 |
|
Panda Re Ltd. Catastrophe Linked Nts., 5.433% [T-BILL 3MO+405], 7/9/182,10 | | | 500,000 | | | 507,325 |
|
| Torrey Pines Re Ltd. Catastrophe Linked Nts.: | | | | | | |
| 4.323% [US0006M+300], 6/9/202,10 | | | 375,000 | | | 375,544 |
| 5.073% [US0006M+375], 6/9/202,10 | | | 250,000 | | | 251,238 |
| 7.573% [US0006M+625], 6/9/202,10 | | | 500,000 | | | 504,725 |
|
| Ursa Re Ltd. Catastrophe Linked Nts.: | | | | | | |
| 4.00% [MM+400], 12/10/19-12/10/202,10 | | | 500,000 | | | 498,288 |
| 5.00% [MM+500], 9/21/1810,13 | | | 250,000 | | | 248,463 |
| 5.25% [MM+525], 12/10/202,10 | | | 250,000 | | | 250,750 |
| 6.00% [MM+600], 5/27/202,10 | | | 250,000 | | | 251,613 |
| | | | | | |
| | | | | | 14,507,779 |
|
| Longevity—0.1% |
|
| Vita Capital VI Ltd. Catastrophe Linked Nts., 3.647% [US0006M+290], 1/8/212,10 | | | 250,000 | | | 257,187 |
| Multiple Event—4.9% |
| Atlas IX Capital DAC Catastrophe Linked Nts.: | | | | | | |
| 4.525% [US0003M+325], 1/17/192,10 | | | 750,000 | | | 760,912 |
| 9.36% [US0003M+783], 1/7/192,10 | | | 250,000 | | | 175,450 |
| Blue Halo Re Ltd. Catastrophe Linked Nts.: | | | | | | |
| 9.633% [T-BILL 3MO+825], 7/26/192,10 | | | 250,000 | | | 238,225 |
| 15.383% [T-BILL 3MO+1400], 6/21/192,10 | | | 500,000 | | | 426,200 |
| Bonanza Re Ltd. Catastrophe Linked Nts.: | | | | | | |
| 5.254% [US0006M+375], 12/31/192,10 | | | 250,000 | | | 236,337 |
| 6.504% [US0006M+500], 12/31/192,10 | | | 250,000 | | | 233,487 |
| Caelus Re IV Ltd. Catastrophe Linked Nts., 6.876% [T-BILL 3MO+549], 3/6/202,10 | | | 500,000 | | | 518,775 |
| Caelus Re V Ltd. Catastrophe Linked Nts.: | | | | | | |
| 4.636% [T-BILL 3MO+325], 6/5/202,10 | | | 750,000 | | | 740,437 |
| 5.886% [T-BILL 3MO+450], 6/5/202,10 | | | 250,000 | | | 238,700 |
| 10.636% [T-BILL 3MO+925], 6/5/202,10 | | | 500,000 | | | 46,550 |
| Citrus Re Ltd. Catastrophe Linked Nts., 7.076% [US0006M+600], 3/18/202,10 | | | 250,000 | | | 237,975 |
| Cranberry Re Ltd. Catastrophe Linked Nts.: | | | | | | |
| 3.335% [US0006M+200], 7/13/202,10 | | | 250,000 | | | 251,112 |
| 5.283% [T-BILL 3MO+390], 7/6/182,10 | | | 500,000 | | | 506,025 |
| East Lane Re VI Ltd. Catastrophe Linked Nts.: | | | | | | |
| 4.033% [T-BILL 3MO+265], 3/14/182,10 | | | 500,000 | | | 501,625 |
| 4.773% [T-BILL 3MO+339], 3/13/202,10 | | | 500,000 | | | 503,675 |
26 OPPENHEIMER GLOBAL MULTI-ALTERNATIVES FUND/VA
| | | | | | | | | | |
| | | | | Principal
Amount | | | Value | |
| Multiple Event (Continued) | |
| Eden Re II Ltd. Catastrophe Linked Nts., 0.00%, 3/22/2113,14 | | | | $ | 500,000 | | | $ | 450,000 | |
| Fortius Re II Ltd. Catastrophe Linked Nts., 4.803% [US0006M+375], 7/7/212,10 | | | | | 750,000 | | | | 759,413 | |
| Galilei Re Ltd. Catastrophe Linked Nts.: | | | | | | | | | | |
| 5.625% [US0006M+450], 1/8/202,10 | | | | | 500,000 | | | | 506,875 | |
| 5.645% [US0006M+450], 1/8/212,10 | | | | | 500,000 | | | | 508,225 | |
| 6.395% [US0006M+525], 1/8/212,10 | | | | | 250,000 | | | | 250,875 | |
| 14.375% [US0006M+1,325], 1/8/202,10 | | | | | 250,000 | | | | 234,350 | |
| Galileo Re Ltd. Catastrophe Linked Nts.: | | | | | | | | | | |
| 14.631% [T-BILL 3MO+1,324], 1/8/192,10 | | | | | 500,000 | | | | 458,600 | |
| 18.705% [US0003M+1,750], 11/6/202,10 | | | | | 250,000 | | | | 248,925 | |
| Kilimanjaro II Re Ltd. Catastrophe | | | | | | | | | | |
| Linked Nts., 11.544% | | | | | | | | | | |
| [US0006M+1000], 4/20/212,10 | | | | | 250,000 | | | | 226,850 | |
| Kilimanjaro Re Ltd. Catastrophe Linked Nts.: | | | | | | | | | | |
| 5.894% [T-BILL 3MO+450], 4/30/182,10 | | | | | 250,000 | | | | 246,100 | |
| 6.144% [T-BILL 3MO+475], 4/30/182,10 | | | | | 250,000 | | | | 251,687 | |
| 8.144% [T-BILL 3MO+675], 12/6/192,10 | | | | | 250,000 | | | | 251,262 | |
| 10.644% [T-BILL 3MO+925], 12/6/192,10 | | | | | 250,000 | | | | 244,175 | |
| Lion II RE DAC Catastrophe Linked Nts., | | | | | | | | | | |
| 3.00% [EUR003M+300], 7/15/212,10 | | EUR | | | 750,000 | | | | 900,472 | |
| Loma Reinsurance Bermuda Ltd. Catastrophe Linked Nts.: | | | | | | | | | | |
| 13.706% [T-BILL 3MO+1,232], 1/8/182,10 | | | | | 200,000 | | | | 125,620 | |
| 18.676% [T-BILL 3MO+1,729], 1/8/182,10 | | | | | 500,000 | | | | 42,550 | |
| Long Point Re III Ltd. Catastrophe | | | | | | | | | | |
| Linked Nts., 3.50% [MM+350], 5/23/182,10 | | | | | 250,000 | | | | 251,737 | |
| MetroCat Re Ltd. Catastrophe Linked | | | | | | | | | | |
| Nts., 5.083% [T-BILL 3MO+370], 5/8/202,10 | | | | | 500,000 | | | | 503,575 | |
| PennUnion Re Ltd. Catastrophe Linked | | | | | | | | | | |
| Nts., 5.883% [T-BILL 3MO+450], 12/7/182,10 | | | | | 500,000 | | | | 503,325 | |
| Residential Reinsurance 2013 Ltd., | | | | | | | | | | |
| 4.383% [T-BILL 3MO+300], 3/6/182,10 | | | | | 250,000 | | | | 116,250 | |
| Residential Reinsurance 2014 Ltd. Catastrophe Linked Nts.: | | | | | | | | | | |
| 4.943% [T-BILL 3MO+356], 6/6/182,10 | | | | | 500,000 | | | | 500,275 | |
| 16.363% [T-BILL 3MO+1,498], 6/6/182,10 | | | | | 750,000 | | | | 318,975 | |
| Residential Reinsurance 2015 Ltd. | | | | | | | | | | |
| Catastrophe Linked Nts., 12.353% | | | | | | | | | | |
| [T-BILL 3MO+1097], 6/6/192,10 | | | | | 500,000 | | | | 352,200 | |
| Residential Reinsurance 2016 Ltd. Catastrophe Linked Nts.: | | | | | | | | | | |
| 4.633% [T-BILL 3MO+325], 6/6/202,10 | | | | | 750,000 | | | | 749,213 | |
| 5.313% [T-BILL 3MO+393], 12/6/202,10 | | | | | 250,000 | | | | 250,713 | |
| 12.933% [T-BILL 3MO+1,155], 6/6/202,10 | | | | | 750,000 | | | | 394,050 | |
| Residential Reinsurance 2017 Ltd. Catastrophe Linked Nts.: | | | | | | | | | | |
| 4.383% [T-BILL 3MO+300], 6/6/212,10 | | | | | 375,000 | | | | 371,606 | |
| 17.761%, 6/6/182,14 | | | | | 250,000 | | | | 65,150 | |
| 22.802%, 12/6/182,14 | | | | | 250,000 | | | | 199,413 | |
| Riverfront Re Ltd. Catastrophe Linked Nts.: | | | | | | | | | | |
| 5.883% [T-BILL 3MO+450], 1/15/212,10 | | | | | 750,000 | | | | 747,188 | |
| 7.633% [T-BILL 3MO+625], 1/15/212,10 | | | | | 250,000 | | | | 248,100 | |
| Sanders Re Ltd. Catastrophe Linked Nts.: | | | | | | | | | | |
| 4.343% [T-BILL 3MO+296], 5/25/182,10 | | | | | 250,000 | | | | 250,763 | |
| 4.514% [US0006M+300], 12/6/212,10 | | | | | 500,000 | | | | 500,625 | |
| 4.633% [T-BILL 3MO+325], 5/25/182,10 | | | | | 250,000 | | | | 251,038 | |
| 4.704% [US0006M+325], 6/5/202,10 | | | | | 750,000 | | | | 749,813 | |
| | | | | | | | | | |
| | | | | Principal
Amount | | | Value | |
| Multiple Event (Continued) | |
| Spectrum Capital Ltd. Catastrophe Linked Nts.: | | | | | | | | | | |
| 4.861% [US0006M+350], 6/8/212,10 | | | | $ | 250,000 | | | $ | 250,988 | |
| 7.111% [US0006M+575], 6/8/212,10 | | | | | 250,000 | | | | 243,925 | |
| Tailwind Re Ltd. 2017-1 Catastrophe | | | | | | | | | | |
| Linked Nts., 12.383% [T-BILL 3MO+1100], 1/8/222,10 | | | | | 250,000 | | | | 250,381 | |
| Tradewynd Re Ltd. Catastrophe Linked Nts.: | | | | | | | | | | |
| 5.40% [MM+540], 1/8/182,10 | | | | | 500,000 | | | | 501,275 | |
| 7.43% [MM+743], 1/8/182,10 | | | | | 500,000 | | | | 501,275 | |
| Tramline Re II Ltd. Catastrophe Linked | | | | | | | | | | |
| Nts., 9.633% [T-BILL 3MO+825], 1/4/192,10 | | | | | 400,000 | | | | 400,660 | |
| | | | | | | | | | 20,793,977 | |
| Other—0.7% | | | | | | | | | | |
| Benu Capital Ltd. Catastrophe Linked Nts.: | | | | | | | | | | |
| 2.55% [EUR003M+255], 1/8/202,10 | | EUR | | | 250,000 | | | | 303,172 | |
| 3.35% [EUR003M+335], 1/8/2010,13 | | EUR | | | 500,000 | | | | 610,124 | |
| Horse Capital I DAC Catastrophe Linked | | | | | | | | | | |
| Nts., 12.00% [EUR003M+1200], 6/15/202,10 | | EUR | | | 500,000 | | | | 603,480 | |
| Vitality Re V Ltd. Catastrophe Linked | | | | | | | | | | |
| Nts., 3.883% [T-BILL 3MO+250], 1/7/192,10 | | | | | 250,000 | | | | 251,637 | |
| Vitality Re VI Ltd. Catastrophe Linked | | | | | | | | | | |
| Nts., 3.483% [T-BILL 3MO+210], 1/8/182,10 | | | | | 250,000 | | | | 250,687 | |
| Vitality Re VII Ltd. Catastrophe Linked | | | | | | | | | | |
| Nts., 4.033% [T-BILL 3MO+265], 1/7/202,10 | | | | | 250,000 | | | | 254,013 | |
| Vitality Re VIII Ltd. Catastrophe Linked | | | | | | | | | | |
| Nts., 3.383% [T-BILL 3MO+200], 1/8/212,10 | | | | | 500,000 | | | | 502,575 | |
| | | | | | | | | | 2,775,688 | |
| Pandemic—0.1% | |
| International Bank for Reconstruction & Development Catastrophe Linked Nts.: | |
| 7.957% [US0006M-40+690], 7/15/202,10 | | | | | 250,000 | | | | 251,700 | |
| 12.557% [US0006M-40+1,150], 7/15/202,10 | | | | | 125,000 | | | | 125,575 | |
| | | | | | | | | | 377,275 | |
| Windstorm—2.1% | |
| Akibare Re Ltd. Catastrophe Linked | | | | | | | | | | |
| Nts., 3.689% [US0006M+234], 4/7/202,10 | | | | | 500,000 | | | | 507,275 | |
| Alamo Re Ltd. Catastrophe Linked Nts.: | | | | | | | | | | |
| 5.133% [T-BILL 3MO+375], 6/8/202,10 | | | | | 500,000 | | | | 506,375 | |
| 5.783% [T-BILL 3MO+440], 6/7/192,10 | | | | | 500,000 | | | | 509,425 | |
| 6.193% [T-BILL 3MO+481], 6/7/182,10 | | | | | 500,000 | | | | 503,925 | |
| Aozora Re Ltd. Catastrophe Linked Nts.: | | | | | | | | | | |
| 3.219% [US0006M+200], 4/7/212,10 | | | | | 250,000 | | | | 251,312 | |
| 3.549% [US0006M+220], 4/7/202,10 | | | | | 500,000 | | | | 503,975 | |
| Calypso Capital II Ltd. Catastrophe | | | | | | | | | | |
| Linked Nts., 3.66% [EUR003M+366], 1/8/182,10 | | EUR | | | 500,000 | | | | 599,970 | |
| Casablanca Re Ltd. Catastrophe Linked Nts.: | | | | | | | | | | |
| 6.508% [US0006M+525], 6/4/2010,13 | | | | | 250,000 | | | | 250,175 | |
| 17.258% [US0006M+1600], 6/4/204,10,13 | | | | | 250,000 | | | | 181,625 | |
| Citrus Re Ltd. Catastrophe Linked Nts.: | | | | | | | | | | |
| 7.50% [T-BILL 3MO+774], 2/25/192,10 | | | | | 500,000 | | | | 480,900 | |
| 11.523% [T-BILL 3MO+1,014], 4/9/182,10 | | | | | 250,000 | | | | 203,825 | |
| 12.413% [T-BILL 3MO+1,103], 2/25/192,10 | | | | | 500,000 | | | | 371,400 | |
| Everglades Re II Ltd. Catastrophe | | | | | | | | | | |
| Linked Nts., 6.383% [T-BILL 3MO+500], 5/8/202,10 | | | | | 250,000 | | | | 244,262 | |
27 OPPENHEIMER GLOBAL MULTI-ALTERNATIVES FUND/VA
CONSOLIDATED STATEMENT OF INVESTMENTS Continued
| | | | | | | | | | | | |
| | | | | | Principal Amount | | | Value | |
| Windstorm (Continued) | | | | | | | | | | | | |
| First Coast Re 2016 Ltd. Catastrophe | |
| Linked Nts., 5.304% [T-BILL 3MO+391], 6/7/192,10 | | | | | | $ | 250,000 | | | $ | 249,387 | |
| First Coast Re 2017-1 Ltd. Catastrophe | |
| Linked Nts., 5.644% [T-BILL 3MO+425], 6/7/212,10 | | | | | | | 250,000 | | | | 243,313 | |
| Integrity Re Ltd. Catastrophe Linked | |
| Nts., 5.573% [US0006M+425], 6/10/202,10 | | | | | | | 500,000 | | | | 499,125 | |
| International Bank for Reconstruction & Development Catastrophe Linked Nts.: | |
| 6.972% [US0006M+590], 12/20/192,10 | | | | | | | 375,000 | | | | 377,700 | |
| 10.372% [US0006M+930], 12/20/192,10 | | | | | | | 250,000 | | | | 249,831 | |
| Manatee Re Ltd. Catastrophe Linked | |
| Nts., 1.899% [T-BILL 3MO+50], 3/10/1910,13 | | | | | | | 500,000 | | | | 13,000 | |
| Pelican IV Re Ltd. Catastrophe Linked | |
| Nts., 3.534% [US0006M+225], 5/5/202,10 | | | | | | | 750,000 | | | | 755,588 | |
| Queen Street X Re Ltd. Catastrophe | |
| Linked Nts., 7.133% [T-BILL 3MO+575], 6/8/182,10 | | | | | | | 750,000 | | | | 750,263 | |
| Queen Street XI Re DAC Catastrophe | |
| Linked Nts., 7.533% [T-BILL 3MO+615], 6/7/192,10 | | | | | | | 250,000 | | | | 251,738 | |
| Queen Street XII Re Designated Activity Co. Catastrophe Linked Nts., 6.872% | | | | | | | | | | | | |
| [US0006M+525], 4/8/202,10 | | | | | | | 500,000 | | | | 504,375 | |
| | | | | | | | | | | 9,008,764 | |
| Total Event-Linked Bonds (Cost $50,607,287) | | | | | | | | | | | 47,720,670 | |
| Short-Term Notes—22.2% | |
| Canada—0.2% | | | | | | | | | | | | |
| Bell Canada, 1.516%, 1/17/1815,16 | | | USD | | | | 500,000 | | | | 499,539 | |
| Telus Corp., 1.526%, 2/1/182,16 | | | USD | | | | 500,000 | | | | 499,175 | |
| | | | | | | | | | | | 998,714 | |
| Italy—3.4% | | | | | | | | | | | | |
| Eni Finance USA, Inc., 1.967%, 10/5/1815,16 | | | USD | | | | 500,000 | | | | 491,965 | |
| Italian Republic Bills: | | | | | | | | | | | | |
| 0.00%, 1/31/1814 | | | EUR | | | | 2,100,000 | | | | 2,520,587 | |
| 0.00%, 2/14/1814 | | | EUR | | | | 9,500,000 | | | | 11,405,380 | |
| | | | | | | | | | | | 14,417,932 | |
| Japan—3.7% | | | | | | | | | | | | |
| Hitachi Capital America Corp., 2.102%, 1/11/1815,16 | | | USD | | | | 500,000 | | | | 499,693 | |
| Japan Treasury Bills, 0.00%, 3/12/1814 | | | JPY | | | | 1,673,000,000 | | | | 14,852,083 | |
| | | | | | | | | | | 15,351,776 | |
| | | | | | | | | | | | |
| | | | | | Principal Amount | | | Value | |
| Portugal—1.2% | |
| Portuguese Republic Treasury Bills, 0.00%, 3/16/1814 | | | EUR | | | | 4,030,000 | | | $ | 4,839,486 | |
| Singapore—0.7% | |
| Republic of Singapore Bills, 1.227%, 2/19/1814 | | | SGD | | | | 4,220,000 | | | | 3,148,774 | |
| Sweden—3.9% | | | | | | | | | | | | |
| Assa Abloy Financial Services AB, 2.071%, 1/4/182,15,16 | | | USD | | | | 500,000 | | | | 499,914 | |
| Kingdom of Sweden Treasury Bills, 0.00%, 1/17/1814 | | | SEK | | | | 130,000,000 | | | | 15,853,547 | |
| | | | | | | | | | | | 16,353,461 | |
| United Kingdom—0.4% | | | | | | | | | | | | |
| Reckitt Benckiser Treasury Services plc, 1.496%, 1/16/1815,16 | | | USD | | | | 500,000 | | | | 499,627 | |
| Vodafone Group plc, 1.727%, 9/13/1816 | | | USD | | | | 500,000 | | | | 492,654 | |
| WPP CP LLC, 1.766%, 1/24/182,15,16 | | | USD | | | | 500,000 | | | | 499,374 | |
| | | | | | | | | | | | 1,491,655 | |
| United States—8.7% | | | | | | | | | | | | |
| Amphenol Corp., 2.001%, 1/4/1816 | | | USD | | | | 500,000 | | | | 499,861 | |
| CenterPoint Energy Resources Corp., 1.536%, 1/18/182,15,16 | | | USD | | | | 500,000 | | | | 499,523 | |
| Church & Dwight Co., Inc., 1.463%, 1/2/182,15,16 | | | USD | | | | 500,000 | | | | 499,908 | |
| Ford Motor Credit Co. LLC, 1.663%, 4/10/1815,16 | | | USD | | | | 500,000 | | | | 497,342 | |
| Glencore Funding LLC, 1.617%, 1/23/1815,16 | | | USD | | | | 500,000 | | | | 499,363 | |
| Magna International, Inc., 1.901%, 1/3/182,15,16 | | | USD | | | | 500,000 | | | | 499,947 | |
| NetApp, Inc., 1.881%, 1/4/182,15,16 | | | USD | | | | 500,000 | | | | 499,861 | |
| Puget Sound Energy, Inc., 1.524%, 1/8/1816 | | | USD | | | | 500,000 | | | | 499,766 | |
| Toyota Motor Credit Corp., 1.671%, 7/23/1816 | | | USD | | | | 500,000 | | | | 495,047 | |
| United States Treasury Bills, 1.185%, 3/1/1814,17 | | | USD | | | | 31,435,000 | | | | 31,370,807 | |
| United Technologies Corp., 1.951%, 1/11/182,15,16 | | | USD | | | | 500,000 | | | | 499,693 | |
| | | | | | | | | | | 36,361,118 | |
| Total Short-Term Notes (Cost $92,553,634) | | | | | | | | 92,962,916 | |
| | | |
| | | | | | Shares | | | | |
| Investment Companies—5.6% | | | | | | | | | | | | |
| Highland/iBoxx Senior Loan Exchange Traded Fund | | | | | | | 111,516 | | | | 2,028,476 | |
| Oppenheimer Institutional Government Money Market Fund, Cl. E, 1.22%8,18,19 | | | | | | | 17,082,111 | | | | 17,082,111 | |
| Scottish Mortgage Investment Trust plc | | | | | | | 7,591 | | | | 46,009 | |
| SPDR Gold Trust Exchange Traded Fund1,19 | | | | | | | 34,231 | | | | 4,232,663 | |
| Total Investment Companies (Cost $23,189,150) | | | | | | | | | | | 23,389,259 | |
| | | | | | | | | | | | | | | | | | | | | | | | | | | | |
| | | | | | | | Exercise Price | | | Expiration Date | | | | | Contracts | | | Notional Amount (000’s) | | | | |
| Exchange-Traded Options Purchased—0.1% | | | | | | | | | | | | | | | | | | | | | | | | | |
| S&P 500 Index Call1 | | | | | | USD | | | 2,750.000 | | | | 3/16/18 | | | USD | | | 118 | | | | USD 31,549 | | | | 136,054 | |
| S&P 500 Index Call1 | | | | | | USD | | | 2,640.000 | | | | 2/16/18 | | | USD | | | 14 | | | | USD 3,743 | | | | 90,062 | |
| Total Exchange-Traded Options Purchased (Cost $238,546) | | | | | | | | | | | | | | | | | | | | | | | | 226,116 | |
| | | | | | | | |
| | | Counterparty | | | | | Exercise Price | | | Expiration Date | | | | | Contracts | | | Notional Amount (000’s) | | | | |
| Over-the-Counter Option Purchased—0.0% | | | | | | | | | | | | | | | | | | | | | | | | | |
| CNH Currency Put1(Cost $69,274) | | | GSCO-OT | | | CNH | | | 6.787 | | | | 11/15/18 | | | CNH | | | 22,200,000 | | | | CNH 762,760 | | | | 31,724 | |
28 OPPENHEIMER GLOBAL MULTI-ALTERNATIVES FUND/VA
| | | | | | | | | | | | | | | | | | | | | | | | | | | | | | |
| | | Counterparty | | | Pay / Receive
Floating Rate | | | Floating Rate | | | Fixed Rate | | | Expiration Date | | | Notional Amount (000’s) | | | Value |
| Over-the-Counter Interest Rate Swaptions Purchased—0.0% | | | | | | | | | | | | | | | | | | | |
| Interest Rate Swap maturing | | | | | | | | | | | Three-Month USD | | | | | | | | | | | | | | | | | | | |
| 1/28/30 Call1 | | | GSCOI | | | | Receive | | | | BBA LIBOR | | | | 2.974% | | | | 1/24/20 | | | | USD | | | | 8,550 | | | $ 143,230 |
| Interest Rate Swap maturing | | | | | | | | | | | Three-Month USD | | | | | | | | | | | | | | | | | | | |
| 11/24/30 Call1 | | | BAC | | | | Receive | | | | BBA LIBOR | | | | 2.595 | | | | 11/20/20 | | | | USD | | | | 1,000 | | | 35,847 |
| Interest Rate Swap maturing | | | | | | | | | |
| Six-Month JPY
BBA |
| | | | | | | | | | | | | | | | | | |
| 7/25/28 Call1 | | | GSCOI | | | | Receive | | | | LIBOR | | | | 1.050 | | | | 7/23/18 | | | | JPY | | | | 630,000 | | | 2,107 |
| Total Over-the-Counter Interest Rate Swaptions Purchased (Cost $529,388) | | | | | | | | | | | | | | | | | | | 181,184 |
| Total Investments, at Value (Cost $385,421,545) | | | | | | | | | | | | | | | | | | | | | | | | 98.1% | | | 411,477,675 |
| Net Other Assets (Liabilities) | | | | | | | | | | | | | | | | | | | | | | | | | | | 1.9 | | | 7,800,092 |
| | | | | | | | | | | | | | | | | | | | | | | | | | | |
| Net Assets | | | | | | | | | | | | | | | | | | | | | | | | | | | 100.0% | | | $ 419,277,767 |
| | | | | | | | | | | | | | | | | | | | | | | | | | | |
Footnotes to Consolidated Statement of Investments
1. Non-income producing security.
2. Represents securities sold under Rule 144A, which are exempt from registration under the Securities Act of 1933, as amended. These securities have been determined to be liquid under guidelines established by the Board of Trustees. These securities amount to $64,631,040 or 15.41% of the Fund’s net assets at period end.
3. Security received as the result of issuer reorganization.
4. The value of this security was determined using significant unobservable inputs. See Note 3 of the accompanying Consolidated Notes.
5. Security is a Master Limited Partnership.
6. All or portion of the security position is held in segregated accounts and pledged to cover margin requirements with respect to securities sold short. The aggregate market value of such securities is $10,700,858. See Note 10 of the accompanying Consolidated Notes.
7. The Fund holds securities which have been issued by the same entity and that trade on separate exchanges.
8. Is or was an affiliate, as defined in the Investment Company Act of 1940, as amended, at or during the reporting period, by virtue of the Fund owning at least 5% of the voting securities of the issuer or as a result of the Fund and the issuer having the same investment adviser. Transactions during the reporting period in which the issuer was an affiliate are as follows:
| | | | | | | | | | | | | | | | |
| | | Shares
December 31, 2016 | | | Gross Additions | | | Gross
Reductions | | | Shares
December 31, 2017 | |
| Oppenheimer Institutional Government Money Market Fund, Cl. E | | | 57,727,699 | | | | 400,218,708 | | | | 440,864,296 | | | | 17,082,111 | |
| | | | |
| | | Value | | | Income | | | Realized
Gain (Loss) | | | Change in Unrealized
Gain (Loss) | |
| Oppenheimer Institutional Government Money Market Fund, Cl. E | | $ | 17,082,111 | | | $ | 249,601 | | | $ | — | | | $ | — | |
9. This security is not accruing income because the issuer has missed an interest payment on it and/or is not anticipated to make future interest and or principal payments. The rate shown is the contractual interest rate. See Note 4 of the accompanying Consolidated Notes.
10. Represents the current interest rate for a variable or increasing rate security, determined as [Referenced Rate + Basis-point spread].
11. This bond has no contractual maturity date, is not redeemable and contractually pays an indefinite stream of interest.
12. All or a portion of the security position is when-issued or delayed delivery to be delivered and settled after period end. See Note 4 of the accompanying Consolidated Notes.
13. Restricted security. The aggregate value of restricted securities at period end was $4,023,775, which represents 0.96% of the Fund’s net assets. See Note 4 of the accompanying Consolidated Notes. Information concerning restricted securities is as follows:
| | | | | | | | | | | | | | | | |
| Security | | Acquisition Dates | | | Cost | | | Value | | | Unrealized
Appreciation/
(Depreciation) | |
| Benu Capital Ltd. Catastrophe Linked Nts., 3.35% [EUR003M+335], 1/8/20 | | | 4/21/15-6/30/15 | | | $ | 547,686 | | | $ | 610,124 | | | $ | 62,438 | |
| Bosphorus Ltd. Catastrophe Linked Nts., 4.761% [US0006M+325], 8/17/18 | | | 8/11/15 | | | | 500,000 | | | | 505,875 | | | | 5,875 | |
| Casablanca Re Ltd. Catastrophe Linked Nts., 6.508%, 6/4/20 | | | 5/26/17 | | | | 250,000 | | | | 250,175 | | | | 175 | |
| Casablanca Re Ltd. Catastrophe Linked Nts., 17.258%, 6/4/20 | | | 5/26/17 | | | | 250,000 | | | | 181,625 | | | | (68,375 | ) |
| Eden Re II Ltd. Catastrophe Linked Nts., 0.00%, 3/22/21 | | | 12/13/16 | | | | 500,000 | | | | 450,000 | | | | (50,000 | ) |
| Manatee Re Ltd. Catastrophe Linked Nts., 1.899%, 3/10/19 | | | 3/2/16 | | | | 500,000 | | | | 13,000 | | | | (487,000 | ) |
| Merna Re Ltd. Catastrophe Linked Nts., 3.383% [T-BILL 3MO+200], 4/8/20 | | | 3/22/17-10/5/17 | | | | 751,025 | | | | 750,413 | | | | (612 | ) |
| Nakama Re Ltd. Catastrophe Linked Nts., 4.258% [T-BILL 3MO+287.5], 1/16/20 | | | 12/12/14-5/11/17 | | | | 755,017 | | | | 757,612 | | | | 2,595 | |
| Nakama Re Ltd. Catastrophe Linked Nts., 4.633% [T-BILL 3MO+325], 1/14/21 | | | 12/14/15 | | | | 250,000 | | | | 256,488 | | | | 6,488 | |
| Ursa Re Ltd. Catastrophe Linked Nts., 5.00% [MM+500], 9/21/18 | | | 12/16/15 | | | | 249,700 | | | | 248,463 | | | | (1,237 | ) |
| | | | | | $ | 4,553,428 | | | $ | 4,023,775 | | | $ | (529,653 | ) |
| | | | | | | | |
14. Zero coupon bond reflects effective yield on the original acquisition date.
15. Security issued in an exempt transaction without registration under the Securities Act of 1933. Such securities amount to $6,485,749 or 1.55% of the Fund’s net assets, and have been determined to be liquid pursuant to guidelines adopted by the Board of Trustees.
16. Current yield as of period end.
17. All or a portion of the security position is held in segregated accounts and pledged to cover margin requirements under certain derivative contracts. The aggregate market value of such securities is $1,512,904. See Note 5 of the accompanying Consolidated Notes.
18. Rate shown is the 7-day yield at period end.
29 OPPENHEIMER GLOBAL MULTI-ALTERNATIVES FUND/VA
CONSOLIDATED STATEMENT OF INVESTMENTS Continued
Footnotes to Consolidated Statement of Investments (Continued)
19. All or a portion of this security is owned by the subsidiary. See Note 2 of the accompanying Consolidated Notes.
Distribution of investments representing geographic holdings, as a percentage of total investments at value, is as follows:
| | | | | | | | | | |
| Geographic Holdings (Unaudited) | | Value | | | Percent | | | |
| United States | | $ | 267,339,500 | | | | 65.0 | % | | |
| Japan | | | 23,587,514 | | | | 5.7 | | | |
| Sweden | | | 16,718,971 | | | | 4.1 | | | |
| Bermuda | | | 15,992,851 | | | | 3.9 | | | |
| Italy | | | 14,417,932 | | | | 3.5 | | | |
| United Kingdom | | | 9,251,292 | | | | 2.3 | | | |
| France | | | 8,711,134 | | | | 2.1 | | | |
| Singapore | | | 8,508,932 | | | | 2.1 | | | |
| Supranational | | | 5,084,655 | | | | 1.2 | | | |
| Portugal | | | 4,839,486 | | | | 1.2 | | | |
| Cayman Islands | | | 4,836,210 | | | | 1.2 | | | |
| Canada | | | 4,286,739 | | | | 1.1 | | | |
| Ireland | | | 4,198,523 | | | | 1.0 | | | |
| Netherlands | | | 3,576,124 | | | | 0.9 | | | |
| Brazil | | | 3,455,220 | | | | 0.8 | | | |
| Russia | | | 3,085,578 | | | | 0.8 | | | |
| Switzerland | | | 2,614,696 | | | | 0.6 | | | |
| Hong Kong | | | 1,805,231 | | | | 0.4 | | | |
| Germany | | | 1,747,562 | | | | 0.4 | | | |
| Australia | | | 1,645,013 | | | | 0.4 | | | |
| Mexico | | | 998,531 | | | | 0.3 | | | |
| Eurozone | | | 963,648 | | | | 0.2 | | | |
| China | | | 908,408 | | | | 0.2 | | | |
| Turkey | | | 505,875 | | | | 0.1 | | | |
| Chile | | | 457,640 | | | | 0.1 | | | |
| Israel | | | 379,496 | | | | 0.1 | | | |
| Spain | | | 310,295 | | | | 0.1 | | | |
| Colombia | | | 204,266 | | | | 0.1 | | | |
| Philippines | | | 198,490 | | | | 0.1 | | | |
| Jersey, Channel Islands | | | 157,539 | | | | 0.0 | | | |
| Belgium | | | 139,425 | | | | 0.0 | | | |
| Luxembourg | | | 133,751 | | | | 0.0 | | | |
| Thailand | | | 115,058 | | | | 0.0 | | | |
| South Africa | | | 106,814 | | | | 0.0 | | | |
| United Arab Emirates | | | 66,171 | | | | 0.0 | | | |
| Indonesia | | | 35,272 | | | | 0.0 | | | |
| China Offshore | | | 31,724 | | | | 0.0 | | | |
| Puerto Rico | | | 20,879 | | | | 0.0 | | | |
| Norway | | | 13,191 | | | | 0.0 | | | |
| Monaco | | | 12,796 | | | | 0.0 | | | |
| Panama | | | 8,931 | | | | 0.0 | | | |
| Greece | | | 6,312 | | | | 0.0 | | | |
| Total | | $ | 411,477,675 | | | | 100.0 | % | | |
| | | |
| | | | | | |
| | | Shares Sold Short | | | Value |
| Securities Sold Short—(9.9)% | | | | | | |
| Common Stock Securities Sold Short—(9.9)% | | | | | | |
| AGCO Corp. | | | (15,110 | ) | | $ (1,079,307) |
| Air Lease Corp., Cl. A | | | (13,855 | ) | | (666,287) |
| Aircastle Ltd. | | | (26,860 | ) | | (628,255) |
| Aker Solutions ASA1 | | | (74,869 | ) | | (420,410) |
| Ally Financial, Inc. | | | (55,950 | ) | | (1,631,502) |
| Boeing Co. (The) | | | (1,822 | ) | | (537,326) |
| Camden Property Trust | | | (3,580 | ) | | (329,575) |
| Caterpillar, Inc. | | | (6,170 | ) | | (972,269) |
| Church & Dwight Co., Inc. | | | (19,420 | ) | | (974,301) |
| Cie Financiere Richemont SA | | | (13,775 | ) | | (1,247,229) |
| CNH Industrial NV | | | (41,200 | ) | | (552,080) |
| Colgate-Palmolive Co. | | | (22,050 | ) | | (1,663,673) |
| Corning, Inc. | | | (42,120 | ) | | (1,347,419) |
| Digital Realty Trust, Inc. | | | (10,280 | ) | | (1,170,892) |
| Equity Residential | | | (18,020 | ) | | (1,149,135) |
| Fastenal Co. | | | (13,050 | ) | | (713,705) |
| Franklin Resources, Inc. | | | (28,510 | ) | | (1,235,338) |
| General Mills, Inc. | | | (27,360 | ) | | (1,622,174) |
30 OPPENHEIMER GLOBAL MULTI-ALTERNATIVES FUND/VA
| | | | | | | | |
| Securities Sold Short—(Continued) | | | | | | | | |
| Common Stock Securities Sold Short (Continued) | | | | | | | | |
| GlaxoSmithKline plc, Sponsored ADR | | | (8,590 | ) | | $ | (304,687 | ) |
| HP, Inc. | | | (63,660 | ) | | | (1,337,497 | ) |
| Intel Corp. | | | (35,120 | ) | | | (1,621,139 | ) |
| International Business Machines Corp. | | | (9,070 | ) | | | (1,391,519 | ) |
| Jones Lang LaSalle, Inc. | | | (10,390 | ) | | | (1,547,383 | ) |
| Kirby Corp.1 | | | (9,330 | ) | | | (623,244 | ) |
| Koninklijke Ahold Delhaize NV | | | (80,003 | ) | | | (1,755,891 | ) |
| Neste OYJ | | | (10,238 | ) | | | (655,181 | ) |
| Novo Nordisk AS, Sponsored ADR | | | (16,840 | ) | | | (903,803 | ) |
| Pennsylvania Real Estate Investment Trust | | | (136,650 | ) | | | (1,624,769 | ) |
| Procter & Gamble Co. (The) | | | (17,340 | ) | | | (1,593,199 | ) |
| ResMed, Inc. | | | (11,370 | ) | | | (962,925 | ) |
| Rio Tinto plc, Sponsored ADR | | | (13,210 | ) | | | (699,205 | ) |
| RLJ Lodging Trust | | | (18,240 | ) | | | (400,733 | ) |
| Rowan Cos. plc, Cl. A1 | | | (22,980 | ) | | | (359,867 | ) |
| Sanofi, ADR | | | (12,230 | ) | | | (525,890 | ) |
| SAP SE, Sponsored ADR | | | (10,920 | ) | | | (1,226,971 | ) |
| Southern Copper Corp. | | | (25,010 | ) | | | (1,186,725 | ) |
| Subsea 7 SA | | | (26,625 | ) | | | (398,914 | ) |
| Transocean Ltd.1 | | | (38,674 | ) | | | (413,038 | ) |
| W.W. Grainger, Inc. | | | (3,035 | ) | | | (717,019 | ) |
| Wacker Chemie AG | | | (4,490 | ) | | | (873,433 | ) |
| Western Union Co. (The) | | | (83,100 | ) | | | (1,579,731 | ) |
| William Demant Holding AS1 | | | (29,630 | ) | | | (824,831 | ) |
| | | | | | | | |
| Total Securities Sold Short (Proceeds $37,169,462) | | | | | | $ | (41,468,471 | ) |
| | | | | | | | |
| | | | | | | | | | | | | | | | | | | | | | | | |
| Forward Currency Exchange Contracts as of December 31, 2017 | |
| Counterparty | | Settlement Month(s) | | | Currency Purchased (000’s) | | | Currency Sold (000’s) | | | Unrealized Appreciation | | | Unrealized Depreciation | |
| BAC | | | 01/2018 | | | BRL | | | 6,840 | | | USD | | | 2,093 | | | $ | — | | | $ | 31,301 | |
| BAC | | | 03/2018 | | | CLP | | | 3,909,000 | | | USD | | | 5,972 | | | | 376,064 | | | | — | |
| BAC | | | 03/2018 | | | COP | | | 24,982,000 | | | USD | | | 8,238 | | | | 78,070 | | | | — | |
| BAC | | | 03/2018 | | | MYR | | | 24,195 | | | USD | | | 5,943 | | | | 5,601 | | | | — | |
| BAC | | | 01/2018 | | | USD | | | 2,068 | | | BRL | | | 6,840 | | | | 5,672 | | | | — | |
| BAC | | | 03/2018 | | | USD | | | 1,524 | | | CAD | | | 1,960 | | | | — | | | | 36,480 | |
| BAC | | | 03/2018 | | | USD | | | 4,707 | | | EUR | | | 4,030 | | | | — | | | | 149,633 | |
| BAC | | | 03/2018 | | | USD | | | 1,648 | | | JPY | | | 186,400 | | | | — | | | | 12,676 | |
| BAC | | | 03/2018 | | | USD | | | 2,461 | | | THB | | | 80,000 | | | | 1,626 | | | | — | |
| BOA | | | 01/2018 | | | BRL | | | 6,930 | | | USD | | | 2,146 | | | | — | | | | 56,469 | |
| BOA | | | 03/2018 | | | CAD | | | 1,670 | | | USD | | | 1,317 | | | | 12,874 | | | | — | |
| BOA | | | 03/2018 | | | IDR | | | 73,802,000 | | | USD | | | 5,394 | | | | 32,500 | | | | — | |
| BOA | | | 03/2018 | | | INR | | | 329,000 | | | USD | | | 5,039 | | | | 78,247 | | | | — | |
| BOA | | | 03/2018 | | | KRW | | | 746,000 | | | USD | | | 681 | | | | 18,475 | | | | — | |
| BOA | | | 01/2018 | | | SEK | | | 130,000 | | | USD | | | 16,067 | | | | — | | | | 205,546 | |
| BOA | | | 03/2018 | | | TRY | | | 2,560 | | | USD | | | 642 | | | | 18,183 | | | | — | |
| BOA | | | 03/2018 | | | TWD | | | 32,000 | | | USD | | | 1,072 | | | | 15,869 | | | | — | |
| BOA | | | 03/2018 | | | USD | | | 1,717 | | | AUD | | | 2,275 | | | | — | | | | 57,999 | |
| BOA | | | 01/2018 | | | USD | | | 2,095 | | | BRL | | | 6,930 | | | | 5,747 | | | | — | |
| BOA | | | 03/2018 | | | USD | | | 5,748 | | | ILS | | | 20,130 | | | | — | | | | 54,748 | |
| BOA | | | 03/2018 | | | USD | | | 919 | | | KRW | | | 1,007,000 | | | | — | | | | 24,939 | |
| BOA | | | 03/2018 | | | USD | | | 10,286 | | | NZD | | | 14,982 | | | | — | | | | 321,570 | |
| CITNA-B | | | 01/2018 | | | BRL | | | 11,260 | | | USD | | | 3,419 | | | | — | | | | 24,875 | |
| CITNA-B | | | 03/2018 | | | NZD | | | 4,485 | | | USD | | | 3,085 | | | | 90,111 | | | | — | |
| CITNA-B | | | 03/2018 | | | SEK | | | 10,930 | | | USD | | | 1,319 | | | | 19,215 | | | | — | |
| CITNA-B | | | 03/2018 | | | USD | | | 3,054 | | | AUD | | | 4,060 | | | | — | | | | 113,742 | |
| CITNA-B | | | 01/2018 | | | USD | | | 3,391 | | | BRL | | | 11,260 | | | | 10,851 | | | | 14,344 | |
| CITNA-B | | | 11/2018 | | | USD | | | 1,513 | | | CNH | | | 10,270 | | | | — | | | | 35,267 | |
| CITNA-B | | | 03/2018 | | | USD | | | 1,618 | | | EUR | | | 1,365 | | | | — | | | | 27,358 | |
| CITNA-B | | | 03/2018 | | | USD | | | 15,042 | | | JPY | | | 1,673,000 | | | | 143,273 | | | | — | |
| DEU | | | 03/2018 | | | EUR | | | 1,372 | | | USD | | | 1,629 | | | | 24,619 | | | | — | |
| DEU | | | 03/2018 | | | JPY | | | 150,000 | | | USD | | | 1,343 | | | | — | | | | 6,362 | |
| DEU | | | 03/2018 | | | USD | | | 10,550 | | | EUR | | | 8,885 | | | | — | | | | 159,398 | |
| DEU | | | 03/2018 | | | USD | | | 1,322 | | | HUF | | | 349,000 | | | | — | | | | 30,410 | |
| DEU | | | 01/2018 - 03/2018 | | | USD | | | 16,697 | | | SEK | | | 135,400 | | | | 189,915 | | | | 15,413 | |
| GSCO-OT | | | 01/2018 | | | BRL | | | 9,700 | | | USD | | | 2,938 | | | | — | | | | 13,373 | |
| GSCO-OT | | | 03/2018 | | | HUF | | | 172,000 | | | USD | | | 648 | | | | 18,877 | | | | — | |
| GSCO-OT | | | 01/2018 - 04/2018 | | | USD | | | 5,841 | | | BRL | | | 19,400 | | | | 20,850 | | | | — | |
31 OPPENHEIMER GLOBAL MULTI-ALTERNATIVES FUND/VA
CONSOLIDATED STATEMENT OF INVESTMENTS Continued
| | | | | | | | | | | | | | | | | | | | | | |
| Forward Currency Exchange Contracts (Continued) |
| Counterparty | | Settlement Month(s) | | | Currency Purchased (000’s) | | | Currency Sold (000’s) | | | Unrealized Appreciation | | | Unrealized
Depreciation |
| GSCO-OT | | | 03/2018 | | | USD | | | 2,082 | | | COP | | | 6,294,000 | | | $ | — | | | $ 13,415 |
| GSCO-OT | | | 01/2018 | | | USD | | | 2,507 | | | EUR | | | 2,100 | | | | — | | | 16,644 |
| GSCO-OT | | | 03/2018 | | | USD | | | 1,312 | | | JPY | | | 148,000 | | | | — | | | 6,680 |
| GSCO-OT | | | 03/2018 | | | USD | | | 638 | | | NOK | | | 5,270 | | | | — | | | 5,277 |
| GSCO-OT | | | 01/2018 | | | USD | | | 15,999 | | | SEK | | | 130,000 | | | | 137,048 | | | — |
| HSBC | | | 03/2018 | | | AUD | | | 1,675 | | | USD | | | 1,293 | | | | 13,357 | | | — |
| HSBC | | | 01/2018 | | | BRL | | | 9,700 | | | USD | | | 2,932 | | | | — | | | 8,044 |
| HSBC | | | 03/2018 | | | CHF | | | 1,960 | | | USD | | | 1,997 | | | | 25,775 | | | — |
| HSBC | | | 03/2018 | | | CZK | | | 100 | | | USD | | | 5 | | | | 66 | | | — |
| HSBC | | | 03/2018 | | | EUR | | | 1,125 | | | USD | | | 1,344 | | | | 11,922 | | | — |
| HSBC | | | 03/2018 | | | GBP | | | 485 | | | USD | | | 652 | | | | 4,601 | | | — |
| HSBC | | | 03/2018 | | | JPY | | | 836,000 | | | USD | | | 7,495 | | | | — | | | 46,557 |
| HSBC | | | 03/2018 | | | USD | | | 4,473 | | | AUD | | | 5,905 | | | | — | | | 133,762 |
| HSBC | | | 01/2018 | | | USD | | | 3,040 | | | BRL | | | 9,700 | | | | 115,273 | | | — |
| HSBC | | | 03/2018 | | | USD | | | 6,539 | | | CAD | | | 8,275 | | | | — | | | 50,138 |
| HSBC | | | 03/2018 | | | USD | | | 13,696 | | | GBP | | | 10,190 | | | | — | | | 96,672 |
| JPM | | | 03/2018 | | | EUR | | | 3,540 | | | USD | | | 4,205 | | | | 62,471 | | | — |
| JPM | | | 03/2018 | | | PLN | | | 17,970 | | | USD | | | 5,028 | | | | 135,673 | | | — |
| JPM | | | 03/2018 | | | USD | | | 8,020 | | | CHF | | | 7,875 | | | | — | | | 106,405 |
| JPM | | | 03/2018 | | | USD | | | 4,104 | | | CNH | | | 27,380 | | | | — | | | 82,056 |
| JPM | | | 02/2018 | | | USD | | | 11,076 | | | EUR | | | 9,500 | | | | — | | | 351,524 |
| JPM | | | 03/2018 | | | USD | | | 1,280 | | | MXN | | | 24,700 | | | | 40,445 | | | — |
| JPM | | | 02/2018 - 04/2018 | | | USD | | | 7,765 | | | SGD | | | 10,520 | | | | — | | | 109,957 |
| JPM | | | 03/2018 | | | USD | | | 2,153 | | | ZAR | | | 29,640 | | | | — | | | 215,783 |
| JPM | | | 03/2018 | | | ZAR | | | 9,080 | | | USD | | | 660 | | | | 66,103 | | | — |
| TDB | | | 01/2018 - 02/2018 | | | BRL | | | 15,770 | | | USD | | | 4,764 | | | | — | | | 17,812 |
| TDB | | | 03/2018 | | | MXN | | | 91,100 | | | USD | | | 4,747 | | | | — | | | 176,763 |
| TDB | | | 03/2018 | | | NZD | | | 1,845 | | | USD | | | 1,291 | | | | 14,883 | | | — |
| TDB | | | 01/2018 - 02/2018 | | | USD | | | 3,370 | | | BRL | | | 11,140 | | | | 14,104 | | | — |
| Total Unrealized Appreciation and Depreciation | | | $ | 1,808,360 | | | $ 2,829,392 |
| | | | | | | | | | | | | | | | | | | |
| | | | | | | | | | | | | | | | | | | | | | | | | | |
| Futures Contracts as of December 31, 2017 |
| Description | | Buy/Sell | | | Expiration Date | | | Number of Contracts | | | | | | Notional Amount (000’s) | | | Value | | | Unrealized Appreciation/ (Depreciation) |
| CAC 40 10 Index | | | Sell | | | | 1/19/18 | | | | 104 | | | | EUR | | | | 6,741 | | | $ | 6,626,675 | | | $ 114,672 |
| CBOE Volatility Index* | | | Sell | | | | 1/17/18 | | | | 102 | | | | USD | | | | 1,215 | | | | 1,170,450 | | | 44,763 |
| Coffee* | | | Sell | | | | 3/19/18 | | | | 14 | | | | USD | | | | 657 | | | | 662,550 | | | (5,817) |
| Cotton No. 2* | | | Buy | | | | 3/07/18 | | | | 18 | | | | USD | | | | 660 | | | | 707,670 | | | 47,657 |
| Euro-BONO | | | Sell | | | | 3/08/18 | | | | 10 | | | | EUR | | | | 1,746 | | | | 1,728,864 | | | 17,164 |
| Euro-BTP | | | Sell | | | | 3/08/18 | | | | 20 | | | | EUR | | | | 3,349 | | | | 3,266,952 | | | 82,527 |
| Euro-BUND | | | Buy | | | | 3/08/18 | | | | 33 | | | | EUR | | | | 6,455 | | | | 6,401,728 | | | (53,095) |
| Euro-OAT | | | Sell | | | | 3/08/18 | | | | 9 | | | | EUR | | | | 1,697 | | | | 1,675,734 | | | 21,587 |
| FTSE 100 Index | | | Sell | | | | 3/16/18 | | | | 67 | | | | GBP | | | | 6,710 | | | | 6,909,338 | | | (199,549) |
| Gas Oil* | | | Buy | | | | 1/31/18 | | | | 9 | | | | USD | | | | 669 | | | | 678,812 | | | 9,693 |
| Gold (100 oz.) * | | | Buy | | | | 2/26/18 | | | | 7 | | | | USD | | | | 925 | | | | 916,510 | | | (8,941) |
| Lead* | | | Sell | | | | 1/15/18 | | | | 11 | | | | USD | | | | 693 | | | | 682,756 | | | 10,209 |
| Lean Hogs* | | | Buy | | | | 2/14/18 | | | | 24 | | | | USD | | | | 674 | | | | 689,040 | | | 15,222 |
| Live Cattle* | | | Buy | | | | 2/28/18 | | | | 13 | | | | USD | | | | 644 | | | | 632,060 | | | (12,274) |
| Low Sulphur Gas Oil* | | | Buy | | | | 1/11/18 | | | | 12 | | | | USD | | | | 681 | | | | 720,300 | | | 39,279 |
| MSCI Emerging Market Index | | | Buy | | | | 3/16/18 | | | | 161 | | | | USD | | | | 9,029 | | | | 9,367,785 | | | 338,649 |
| Natural Gas* | | | Sell | | | | 1/29/18 | | | | 21 | | | | USD | | | | 647 | | | | 620,130 | | | 27,039 |
| Nikkei 225 Index | | | Buy | | | | 3/08/18 | | | | 23 | | | | JPY | | | | 4,621 | | | | 4,643,887 | | | 22,487 |
| Russell 2000 Mini Index | | | Sell | | | | 3/16/18 | | | | 300 | | | | USD | | | | 22,882 | | | | 23,047,500 | | | (165,468) |
| S&P 500 E-Mini Index | | | Buy | | | | 3/16/18 | | | | 256 | | | | USD | | | | 34,014 | | | | 34,252,800 | | | 238,375 |
| S&P/TSX 60 Index | | | Buy | | | | 3/15/18 | | | | 14 | | | | CAD | | | | 2,127 | | | | 2,132,633 | | | 5,991 |
| SPI 200 Index | | | Buy | | | | 3/15/18 | | | | 18 | | | | AUD | | | | 2,113 | | | | 2,113,697 | | | 324 |
| Stoxx Europe 600 Index | | | Buy | | | | 3/16/18 | | | | 636 | | | | EUR | | | | 14,774 | | | | 14,750,812 | | | (23,006) |
| Sugar #11 World* | | | Sell | | | | 2/28/18 | | | | 39 | | | | USD | | | | 643 | | | | 662,189 | | | (18,900) |
| United States Treasury Long Bonds | | | Buy | | | | 3/20/18 | | | | 43 | | | | USD | | | | 6,565 | | | | 6,579,000 | | | 13,889 |
| United States Treasury Nts., 10 yr. | | | Sell | | | | 3/20/18 | | | | 48 | | | | USD | | | | 5,994 | | | | 5,954,250 | | | 39,295 |
| United States Treasury Nts., 5 yr. | | | Sell | | | | 3/29/18 | | | | 75 | | | | USD | | | | 8,760 | | | | 8,712,305 | | | 47,484 |
| WTI Crude Oil* | | | Buy | | | | 1/22/18 | | | | 19 | | | | USD | | | | 1,076 | | | | 1,147,980 | | | 71,958 |
| Zinc* | | | Sell | | | | 1/15/18 | | | | 8 | | | | USD | | | | 640 | | | | 667,000 | | | (27,026) |
| | | | | | | | | | | | | | | | | | | | | | | | | | $ 694,188 |
| | | | | | | | | | | | | | | | | | | | | | | | | | |
*All or a portion of this security is owned by the subsidiary. See Note 2 of the accompanying Consolidated Notes.
32 OPPENHEIMER GLOBAL MULTI-ALTERNATIVES FUND/VA
| | | | | | | | | | | | | | | | | | | | | | | | | | | | | | | | | | | | |
| Centrally Cleared Credit Default Swaps at December 31, 2017 | | | | | | | | | | | | | | | | | | | | | |
| Reference Asset | | | | | Buy/Sell
Protection | | | Fixed Rate | | | Maturity Date | | | | | | Notional Amount
(000’s) | | | Premiums
Received/(Paid) | | Value | | Unrealized Appreciation/ (Depreciation) |
| CDX.HY.27 | | | | | | | Buy | | | | 5.000% | | | | 12/20/21 | | | | USD | | | | 11,243 | | | $ | 772,301 | | | $ | (969,584 | ) | | $ | (197,283 | ) |
| CDX.HY.27 | | | | | | | Buy | | | | 5.000 | | | | 12/20/21 | | | | USD | | | | 8,698 | | | | 705,145 | | | | (750,092 | ) | | | (44,947 | ) |
| CDX.HY.27 | | | | | | | Buy | | | | 5.000 | | | | 12/20/21 | | | | USD | | | | 188 | | | | 12,354 | | | | (16,227 | ) | | | (3,873 | ) |
| CDX.HY.28 | | | | | | | Buy | | | | 5.000 | | | | 6/20/22 | | | | USD | | | | 2,030 | | | | 141,749 | | | | (177,372 | ) | | | (35,623 | ) |
| CDX.IG.28 | | | | | | | Sell | | | | 1.000 | | | | 6/20/22 | | | | USD | | | | 5,655 | | | | (102,346 | ) | | | 127,896 | | | | 25,550 | |
| CDX.IG.28 | | | | | | | Sell | | | | 1.000 | | | | 6/20/22 | | | | USD | | | | 300 | | | | (5,377 | ) | | | 6,785 | | | | 1,408 | |
| iTraxx.Main.27 | | | | | | | Buy | | | | 1.000 | | | | 6/20/22 | | | | EUR | | | | 5,040 | | | | 107,520 | | | | (172,866 | ) | | | (65,346 | ) |
Neiman Marcus Group LLC (The) | | | | Buy | | | | 5.000 | | | | 12/20/20 | | | | USD | | | | 715 | | | | 41,431 | | | | 145,873 | | | | 187,304 | |
| | | | | | | | | | | | | | | | | | | | | | | | | | | | |
Total Cleared Credit Default Swaps | | | | | | | | | | | | | | | | | | | | | | | $ | 1,672,777 | | | $ | (1,805,587 | ) | | $ | (132,810 | ) |
| | | | | | | | | | | | | | | | | | | | | | | | | | | | |
| | | | | | | | | | | | | | | | | | | | | | | | | | | | | | | | | | | | |
| Over-the-Counter Credit Default Swaps at December 31, 2017 | | | | | | | | | | | | | | | | | |
| Reference Asset | | Counterparty | | | Buy/Sell
Protection | | | Fixed Rate | | | Maturity Date | | | | | | Notional Amount
(000’s) | | | Premiums
Received/(Paid) | | Value | | Unrealized
Appreciation/
(Depreciation) |
| CDX.NA.HY.21 | | | CITNA-B | | | | Buy | | | | 5.000% | | | | 12/20/18 | | | | USD | | | | 1,125 | | | $ | (34,531 | ) | | $ | (54,906 | ) | | $ | (89,437 | ) |
| CDX.NA.HY.21 | | | CITNA-B | | | | Sell | | | | 5.000 | | | | 12/20/18 | | | | USD | | | | 253 | | | | 141,398 | | | | (32,119 | ) | | | 109,279 | |
| CDX.NA.HY.21 | | | GSCOI | | | | Sell | | | | 5.000 | | | | 12/20/18 | | | | USD | | | | 74 | | | | 40,610 | | | | (9,422 | ) | | | 31,188 | |
| CDX.NA.HY.25 | | | GSCOI | | | | Buy | | | | 5.000 | | | | 12/20/20 | | | | USD | | | | 1,125 | | | | (194,688 | ) | | | (100,730 | ) | | | (295,418 | ) |
| CDX.NA.HY.25 | | | GSCOI | | | | Sell | | | | 5.000 | | | | 12/20/20 | | | | USD | | | | 318 | | | | 211,133 | | | | (109,800 | ) | | | 101,333 | |
| Federation of Malaysia | | | BNP | | | | Buy | | | | 1.000 | | | | 12/20/20 | | | | USD | | | | 1,700 | | | | (110,691 | ) | | | (33,385 | ) | | | (144,076 | ) |
| Federation of Malaysia | | | BNP | | | | Buy | | | | 1.000 | | | | 6/20/21 | | | | USD | | | | 775 | | | | (22,856 | ) | | | (15,810 | ) | | | (38,666 | ) |
| Federation of Malaysia | | | MOS-A | | | | Buy | | | | 1.000 | | | | 12/20/20 | | | | USD | | | | 1,700 | | | | (85,394 | ) | | | (33,386 | ) | | | (118,780 | ) |
| | | | | | | | | | | | | | | | | | | | | | | | | | | | |
| Total Over-the-Counter Credit Default Swaps | | | | | | | | | | | $ | (55,019 | ) | | $ | (389,558 | ) | | $ | (444,577 | ) |
| | | | | | | | | | | | | | | | | | | | | | | | | | | | |
The table that follows shows the undiscounted maximum potential payment by the Fund related to selling credit protection in credit default swaps:
| | | | | | | | | | |
Type of Reference Asset on which the Fund Sold Protection | | Total Maximum Potential Payments for Selling Credit Protection (Undiscounted) | | | Amount Recoverable* | | | Reference Asset Rating Range**(Unaudited) |
| Investment Grade Corporate Debt Indexes | | | $5,955,000 | | | | $ — | | | BBB |
| Non-Investment Grade Corporate Debt Indexes | | | 645,743 | | | | 2,250,000 | | | BB |
| | | | | | | | | | |
| Total | | | $6,600,743 | | | | $2,250,000 | | | |
| | | | | | | | | | |
* Amounts recoverable includes potential payments from related purchased protection for instances where the Fund is the seller of protection. In addition, the Fund has no recourse provisions under the credit derivatives and holds no collateral which can offset or reduce potential payments under a triggering event.
** The period end reference asset security ratings, as rated by any rating organization, are included in the equivalent Standard & Poor’s rating category. The reference asset rating represents the likelihood of a potential credit event on the reference asset which would result in a related payment by the Fund.
| | | | | | | | | | | | | | | | | | | | | | | | | | | | | | | | |
| Centrally Cleared Interest Rate Swaps at December 31, 2017 | | | | | | | | | | | | | | | | | | | |
| Counterparty | | Pay/Receive
Floating Rate | | | Floating Rate | | Fixed Rate | | | Maturity Date | | | | | | Notional Amount (000’s) | | | Premiums Received / (Paid) | | | Value | | | Unrealized
Appreciation/
(Depreciation) |
| | | | | | Six-Month JPY BBA | | | | | | | | | | | | | | | | | | | | | | | | | | |
| BAC | | | Receive | | | LIBOR | | | 0.468% | | | | 11/12/25 | | | | JPY | | | | 23,000 | | | $ | — | | | $ | (4,633 | ) | | $ (4,633) |
| | | | | | Three-Month SEK | | | | | | | | | | | | | | | | | | | | | | | | | | |
| BAC | | | Pay | | | STIBOR SIDE | | | 1.418 | | | | 11/12/25 | | | | SEK | | | | 1,840 | | | | — | | | | 8,646 | | | 8,646 |
| | | | | | Three-Month SEK | | | | | | | | | | | | | | | | | | | | | | | | | | |
| BAC | | | Pay | | | STIBOR SIDE | | | 1.501 | | | | 12/9/25 | | | | SEK | | | | 5,120 | | | | — | | | | 26,937 | | | 26,937 |
| | | | | | Six-Month GBP BBA | | | | | | | | | | | | | | | | | | | | | | | | | | |
| BAC | | | Receive | | | LIBOR | | | 1.196 | | | | 3/1/27 | | | | GBP | | | | 7,435 | | | | — | | | | 7,884 | | | 7,884 |
| | | | | | Six-Month GBP BBA | | | | | | | | | | | | | | | | | | | | | | | | | | |
| BAC | | | Receive | | | LIBOR | | | 1.353 | | | | 12/4/27 | | | | GBP | | | | 7,200 | | | | — | | | | (80,711 | ) | | (80,711) |
| | | | | | Three-Month SEK | | | | | | | | | | | | | | | | | | | | | | | | | | |
| BAC | | | Pay | | | STIBOR SIDE | | | 1.102 | | | | 12/6/27 | | | | SEK | | | | 84,735 | | | | — | | | | (75,852 | ) | | (75,852) |
| | | | | | Three-Month SEK | | | | | | | | | | | | | | | | | | | | | | | | | | |
| BAC | | | Pay | | | STIBOR SIDE | | | 1.278 | | | | 10/5/27 | | | | SEK | | | | 5,735 | | | | — | | | | 9,597 | | | 9,597 |
| | | | | | Three-Month SEK | | | | | | | | | | | | | | | | | | | | | | | | | | |
| BAC | | | Pay | | | STIBOR SIDE | | | 1.365 | | | | 8/10/25 | | | | SEK | | | | 4,580 | | | | — | | | | 22,132 | | | 22,132 |
| | | | | | Three-Month SEK | | | | | | | | | | | | | | | | | | | | | | | | | | |
| BAC | | | Pay | | | STIBOR SIDE | | | 1.630 | | | | 7/3/25 | | | | SEK | | | | 27,305 | | | | 7,919 | | | | 208,793 | | | 216,712 |
| | | | | | Three-Month SEK | | | | | | | | | | | | | | | | | | | | | | | | | | |
| BAC | | | Pay | | | STIBOR SIDE | | | 0.628 | | | | 7/8/26 | | | | SEK | | | | 2,340 | | | | — | | | | (8,448 | ) | | (8,448) |
| | | | | | Six-Month JPY BBA | | | | | | | | | | | | | | | | | | | | | | | | | | |
| BOA | | | Receive | | | LIBOR | | | 0.208 | | | | 12/8/26 | | | | JPY | | | | 49,000 | | | | — | | | | 550 | | | 550 |
| | | | | | Six-Month JPY BBA | | | | | | | | | | | | | | | | | | | | | | | | | | |
| CITNA-B | | | Receive | | | LIBOR | | | 0.251 | | | | 1/6/27 | | | | JPY | | | | 386,000 | | | | — | | | | (11,662 | ) | | (11,662) |
33 OPPENHEIMER GLOBAL MULTI-ALTERNATIVES FUND/VA
CONSOLIDATED STATEMENT OF INVESTMENTS Continued
| | | | | | | | | | | | | | | | | | | | | | | | | | | | | | |
| Centrally Cleared Interest Rate Swaps (Continued) | | | | | | | | | | | | | | | | | | | | | | | | |
| Counterparty | | Pay/Receive
Floating Rate | | Floating Rate | | Fixed Rate | | Maturity Date | | | | | | Notional Amount (000’s) | | | Premiums
Received / (Paid) | | Value | | Unrealized Appreciation/ (Depreciation) |
| | | | Six-Month DKK | | | | | | | | | | | | | | | | | | | | | | | | | | |
| GSCOI | | Pay | | CIBOR2 DKNA13 | | 0.975% | | | 12/6/27 | | | | DKK | | | | 123,560 | | | $ | — | | | $ | (96,644 | ) | | $ | (96,644 | ) |
| | | | Three-Month SEK | | | | | | | | | | | | | | | | | | | | | | | | | | |
| GSCOI | | Pay | | STIBOR SIDE | | 1.118 | | | 1/9/27 | | | | SEK | | | | 26,100 | | | | — | | | | 44,180 | | | | 44,180 | |
| | | | Six-Month JPY BBA | | | | | | | | | | | | | | | | | | | | | | | | | | |
| JPM | | Receive | | LIBOR | | 0.593 | | | 7/10/25 | | | | JPY | | | | 483,000 | | | | — | | | | (145,741 | ) | | | (145,741 | ) |
| | | | Six-Month JPY BBA | | | | | | | | | | | | | | | | | | | | | | | | | | |
| JPM | | Receive | | LIBOR | | 0.566 | | | 8/6/25 | | | | JPY | | | | 13,000 | | | | — | | | | (3,648 | ) | | | (3,648 | ) |
| | | | Six-Month JPY BBA | | | | | | | | | | | | | | | | | | | | | | | | | | |
| JPM | | Receive | | LIBOR | | 0.100 | | | 6/6/26 | | | | JPY | | | | 35,000 | | | | — | | | | 2,739 | | | | 2,739 | |
| | | | Six-Month JPY BBA | | | | | | | | | | | | | | | | | | | | | | | | | | |
| JPM | | Receive | | LIBOR | | 0.299 | | | 12/6/27 | | | | JPY | | | | 1,097,000 | | | | — | | | | (40,586 | ) | | | (40,586 | ) |
| | | | Six-Month JPY BBA | | | | | | | | | | | | | | | | | | | | | | | | | | |
| JPM | | Receive | | LIBOR | | 0.461 | | | 12/9/25 | | | | JPY | | | | 28,000 | | | | — | | | | (5,407 | ) | | | (5,407 | ) |
| | | | Six-Month JPY BBA | | | | | | | | | | | | | | | | | | | | | | | | | | |
| JPM | | Receive | | LIBOR | | 0.295 | | | 11/6/27 | | | | JPY | | | | 77,000 | | | | — | | | | (2,996 | ) | | | (2,996 | ) |
| | | | Three-Month SEK | | | | | | | | | | | | | | | | | | | | | | | | | | |
| JPM | | Pay | | STIBOR SIDE | | 1.136 | | | 3/3/27 | | | | SEK | | | | 3,895 | | | | — | | | | 5,874 | | | | 5,874 | |
| | | | Three-Month SEK | | | | | | | | | | | | | | | | | | | | | | | | | | |
| JPM | | Pay | | STIBOR SIDE | | 1.070 | | | 6/7/26 | | | | SEK | | | | 3,550 | | | | — | | | | 4,510 | | | | 4,510 | |
| | | | Six-Month JPY BBA | | | | | | | | | | | | | | | | | | | | | | | | | | |
| JPM | | Receive | | LIBOR | | 0.595 | | | 8/11/25 | | | | JPY | | | | 29,000 | | | | — | | | | (8,717 | ) | | | (8,717 | ) |
| | | | | | | | | | | | | | | | | | | | | | |
Total of Centrally Cleared Interest Rate Swaps | | | | | | | | | | | | | | | | $ | 7,919 | | | $ | (143,203 | ) | | $ | (135,284 | ) |
| | | | | | | | | | | | | | | | | | | | | | |
| | | | | | | | | | | | | | | | | | | | | | | | | | |
| Over-the-Counter Total Return Swaps at December 31, 2017 | | | | | | | | | | | | | | | | | | | | |
| Reference Asset | | Counterparty | | Pay/Receive Total
Return* | | Floating Rate | | Maturity Date | | | | | | Notional Amount (000’s) | | | Value | | Unrealized Appreciation/ (Depreciation) |
| | | | | | One-Month HKD HIBOR | | | | | | | | | | | | | | | | | | | | |
0998.HK-China Citic Bank Corp. | | | | | | HKAB minus 50 basis | | | | | | | | | | | | | | | | | | | | |
| Ltd., ORD H | | GSCOI | | Pay | | points | | | 5/24/18 | | | | HKD | | | | 2,801 | | | $ | (12,775 | ) | | $ | (12,775 | ) |
| | | | | | One-Month HKD HIBOR | | | | | | | | | | | | | | | | | | | | |
1988.HK-China Ninsheng Banking | | | | | | HKAB minus 50 basis | | | | | | | | | | | | | | | | | | | | |
| Corp. Ltd., ORD H | | GSCOI | | Pay | | points | | | 5/24/18 | | | | HKD | | | | 2,885 | | | | (17,407 | ) | | | (17,407 | ) |
| | | | | | One-Month HKD HIBOR | | | | | | | | | | | | | | | | | | | | |
3328.HK-Bank of | | | | | | HKAB minus 50 basis | | | | | | | | | | | | | | | | | | | | |
| Communications Co. Ltd., ORD H | | GSCOI | | Pay | | points | | | 5/24/18 | | | | HKD | | | | 3,403 | | | | (22,371 | ) | | | (22,371 | ) |
| | | | | | One-Month HKD HIBOR | | | | | | | | | | | | | | | | | | | | |
3968.HK-China Merchants Bank, | | | | | | HKAB minus 50 basis | | | | | | | | | | | | | | | | | | | | |
| ORD H | | GSCOI | | Pay | | points | | | 5/24/18 | | | | HKD | | | | 3,791 | | | | (189,793 | ) | | | (189,793 | ) |
| | | | | | One-Month HKD HIBOR | | | | | | | | | | | | | | | | | | | | |
6818.HK-China Everbright Bank, | | | | | | HKAB minus 50 basis | | | | | | | | | | | | | | | | | | | | |
| ORD H | | GSCOI | | Pay | | points | | | 5/24/18 | | | | HKD | | | | 1,478 | | | | (7,908 | ) | | | (7,908 | ) |
| | | | | | One-Month USD BBA | | | | | | | | | | | | | | | | | | | | |
| | | | | | LIBOR plus 30 basis | | | | | | | | | | | | | | | | | | | | |
| JPCMOLNG Custom Basketa | | JPM | | Receive | | points | | | 1/8/19 | | | | USD | | | | 4,914 | | | | 134,530 | | | | 134,530 | |
| | | | | | One-Month HKD HIBOR | | | | | | | | | | | | | | | | | | | | |
| | | | | | HKAB minus 85 basis | | | | | | | | | | | | | | | | | | | | |
| JPCMOSHR Custom Basketb | | JPM | | Pay | | points | | | 1/8/19 | | | | USD | | | | 4,913 | | | | (113,538 | ) | | | (113,538 | ) |
| | | | | | One-Month USD BBA | | | | | | | | | | | | | | | | | | | | |
| | | | | | LIBOR minus 35 basis | | | | | | | | | | | | | | | | | | | | |
| OEX Index | | GSCOI | | Pay | | points | | | 4/9/18 | | | | USD | | | | 6,872 | | | | (101,692 | ) | | | (101,692 | ) |
| | | | | | One-Month USD BBA | | | | | | | | | | | | | | | | | | | | |
SPDR Blackston/GSO Senior Loan | | | | | | LIBOR plus 50 basis | | | | | | | | | | | | | | | | | | | | |
Exchange Traded Fund | | GSCOI | | Receive | | points | | | 11/29/18 | | | | USD | | | | 60,537 | | | | (60,941 | ) | | | (60,941 | ) |
| | | | | | | | | | | | | | | | | | | | | | |
Total Over-the-Counter Total Return Swaps | | | | | | | | | | | | | | | | | | $ | (391,895 | ) | | $ | (391,895 | ) |
| | | | | | | | | | | | | | | | | | | | | | |
* Fund will pay or receive the total return of the reference asset depending on whether the return is positive or negative. For contracts where the Fund has elected to receive the total return of the reference asset if positive, it will be responsible for paying the floating rate and the total return of the reference asset if negative. If the Fund has elected to pay the total return of the reference asset if positive, it will receive the floating rate and the total return of the reference asset if negative.
| | | | | | | | | | | | |
| | | | | | | | | | | | | |
| Custom baskets of securities: The following are the components and weights of the underlying basket of securities | |
| Description | | Shares | | | Value | | | % of Basket | |
| JPCMOLNGa: | | | | | | | | | | | | |
Activision Blizzar, Inc. | | | 3,872 | | | | $135,337 | | | | 2.69% | |
Allstate Corp. | | | 2,353 | | | | 136,003 | | | | 2.69 | |
Altria Group, Inc. | | | 3,562 | | | | 140,408 | | | | 2.78 | |
Ameriprise Financial, Inc. | | | 1,480 | | | | 138,450 | | | | 2.75 | |
Anthem, Inc. | | | 1,029 | | | | 127,808 | | | | 2.53 | |
34 OPPENHEIMER GLOBAL MULTI-ALTERNATIVES FUND/VA
| | | | | | | | | | |
| | | | | | | | | | | |
| Custom baskets of securities: The following are the components and weights of the underlying basket of securities (Continued) |
| Description | | Shares | | | Value | | | % of Basket |
| JPCMOLNGa: (Continued) | | | | | | | | | | |
At&T, Inc. | | | 6,640 | | | | $142,506 | | | 2.82% |
Best Buy Co., Inc. | | | 4,053 | | | | 153,185 | | | 3.04 |
Boeing Co. (The) | | | 873 | | | | 142,116 | | | 2.81 |
Centene Corp. | | | 2,366 | | | | 131,753 | | | 2.61 |
Constellation Brands, Inc., Cl. A | | | 1,110 | | | | 140,050 | | | 2.77 |
Corning, Inc. | | | 7,459 | | | | 131,715 | | | 2.61 |
CVS Health Corp. | | | 3,154 | | | | 126,223 | | | 2.50 |
Delta Air Lines, Inc. | | | 4,565 | | | | 141,113 | | | 2.80 |
Eastman Chemical Co. | | | 2,616 | | | | 133,775 | | | 2.65 |
Eaton Corp. plc | | | 3,106 | | | | 135,464 | | | 2.68 |
ebay, Inc. | | | 6,968 | | | | 145,161 | | | 2.88 |
Estee Lauder Cos., Cl. A | | | 1,935 | | | | 135,908 | | | 2.69 |
Gap, Inc. (The) | | | 7,477 | | | | 140,576 | | | 2.78 |
General Motors Co. | | | 5,607 | | | | 126,867 | | | 2.51 |
LyondelBbasell Industries, Cl. A | | | 2,308 | | | | 140,550 | | | 2.78 |
Marathon Petroleum Corp. | | | 3,857 | | | | 140,476 | | | 2.78 |
McKesson Corp. | | | 1,636 | | | | 140,834 | | | 2.80 |
Mettler-Toledo International | | | 384 | | | | 131,319 | | | 2.60 |
Micron Technology, Inc. | | | 5,699 | | | | 129,357 | | | 2.56 |
Morgan Stanley | | | 4,681 | | | | 135,578 | | | 2.69 |
Nextera Energy, Inc. | | | 1,529 | | | | 131,826 | | | 2.61 |
NRG Energy, Inc. | | | 8,738 | | | | 137,370 | | | 2.72 |
PayPal Holdings, Inc. | | | 3,190 | | | | 129,636 | | | 2.57 |
Progressive Corp. | | | 4,542 | | | | 141,205 | | | 2.80 |
PulteGroup, Inc. | | | 7,078 | | | | 129,910 | | | 2.57 |
Robert Half International, Inc. | | | 4,236 | | | | 129,868 | | | 2.57 |
Royal Caribbean Cruises Ltd. | | | 1,950 | | | | 128,393 | | | 2.54 |
Scripps Networks Interactive, Cl. A | | | 2,952 | | | | 139,127 | | | 2.76 |
Stanley Black & Decker, Inc. | | | 1,424 | | | | 133,385 | | | 2.64 |
United Rentals, Inc. | | | 1,515 | | | | 143,765 | | | 2.85 |
Valero Energy Corp. | | | 2,821 | | | | 143,122 | | | 2.83 |
Vertex Pharmaceuticals, Inc. | | | 1,674 | | | | 138,478 | | | 2.74 |
| | | 130,439 | | | | $5,048,617 | | | 100.00% |
| JPCMOSHRb: | | | | | | | | | | |
Acuity Brands, Inc. | | | 1,409 | | | | $136,886 | | | 2.73% |
Advance Auto Parts, Inc. | | | 2,392 | | | | 131,628 | | | 2.62 |
Akamai Technologies | | | 4,331 | | | | 155,491 | | | 3.11 |
Allergan plc | | | 1,390 | | | | 125,511 | | | 2.50 |
American International Group | | | 4,029 | | | | 132,505 | | | 2.64 |
AmerisourceBergen Corp. | | | 2,848 | | | | 144,349 | | | 2.87 |
Arconic, Inc. | | | 9,816 | | | | 147,651 | | | 2.94 |
CenturyLink, Inc. | | | 16,558 | | | | 152,454 | | | 3.04 |
CF Industries Holdings, Inc. | | | 6,448 | | | | 151,411 | | | 3.02 |
CH Robinson Worldwide, Inc. | | | 2,788 | | | | 137,106 | | | 2.73 |
Chesapeake Energy Corp. | | | 59,357 | | | | 129,749 | | | 2.58 |
Chipotle Mexican Grill, Inc. | | | 794 | | | | 126,677 | | | 2.52 |
Cincinnati Financial Corp. | | | 3,232 | | | | 133,750 | | | 2.66 |
Coty, Inc., Cl. A | | | 14,021 | | | | 153,939 | | | 3.07 |
Dentsply Sirona, Inc. | | | 3,605 | | | | 130,998 | | | 2.61 |
Envision Healthcare Corp. | | | 7,566 | | | | 144,336 | | | 2.87 |
FirstEnergy Corp. | | | 7,076 | | | | 119,599 | | | 2.38 |
Fluor Corp. | | | 4,990 | | | | 142,268 | | | 2.83 |
Ford Motor Co. | | | 19,295 | | | | 133,028 | | | 2.65 |
Gartner, Inc. | | | 1,998 | | | | 135,821 | | | 2.70 |
General Electric Co. | | | 13,209 | | | | 127,233 | | | 2.53 |
Hess Corp. | | | 5,265 | | | | 137,960 | | | 2.75 |
Hewlett Packard Enterprise | | | 17,318 | | | | 137,274 | | | 2.73 |
JM Smucker Co. (The) | | | 2,071 | | | | 142,029 | | | 2.83 |
Kellogg Co. | | | 3,651 | | | | 137,003 | | | 2.73 |
Mattel, Inc. | | | 13,238 | | | | 112,387 | | | 2.24 |
Mosaic Co. (The) | | | 9,946 | | | | 140,877 | | | 2.81 |
Nasdaq, Inc. | | | 3,051 | | | | 129,392 | | | 2.58 |
News Corp., Cl. B | | | 14,731 | | | | 134,982 | | | 2.69 |
Perrigo Co. plc | | | 2,770 | | | | 133,270 | | | 2.65 |
Qualcomm, Inc. | | | 3,642 | | | | 128,704 | | | 2.56 |
Scana Corp. | | | 5,596 | | | | 122,879 | | | 2.45 |
Schwab (Charles) Corp. | | | 4,951 | | | | 140,391 | | | 2.80 |
35 OPPENHEIMER GLOBAL MULTI-ALTERNATIVES FUND/VA
CONSOLIDATED STATEMENT OF INVESTMENTS Continued
| | | | | | |
| |
| Custom baskets of securities: The following are the components and weights of the underlying basket of securities (Continued) |
| Description | | Shares | | Value | | % of Basket |
| JPCMOSHRb: (Continued) | | | | | | |
Stericycle, Inc. | | 3,643 | | $136,722 | | 2.72% |
Symantec Corp. | | 8,339 | | 129,163 | | 2.57 |
TripAdvisor, Inc. | | 6,978 | | 132,734 | | 2.64 |
Walgreens Boots Alliance, Inc. | | 3,321 | | 133,125 | | 2.65 |
| | 295,663 | | $5,021,282 | | 100.00% |
| | | | | | | | | | | | | | | | | | | | | | | | | | | | |
| Over-the-Counter Volatility Swaps at December 31, 2017 | | | |
| | | | | | | | | | | | | | | | | | | | | | | Unrealized |
| | | | | | Pay/Receive | | | | | | | | | | | | | | | | | Appreciation/ |
| Reference Asset | | Counterparty | | | Volatility* | | | Strike Price | | | Maturity Date | | | | | Notional Amount | | | Value | | | (Depreciation) |
| AUD/CHF spot exchange rate | | | CITNA-B | | | | Pay | | | | $ 6.300 | | | | 1/16/18 | | | AUD | | | (8,500 | ) | | $ | 929 | | | $ 929 |
| AUD/CHF spot exchange rate | | | BOA | | | | Pay | | | | 6.625 | | | | 1/16/18 | | | AUD | | | (8,500 | ) | | | 2,984 | | | 2,984 |
| CAD/CHF spot exchange rate | | | BOA | | | | Receive | | | | 7.050 | | | | 1/29/18 | | | CAD | | | 8,200 | | | | (1,239 | ) | | (1,239) |
| CAD/CHF spot exchange rate | | �� | GSCO-OT | | | | Receive | | | | 7.650 | | | | 1/29/18 | | | CAD | | | 8,100 | | | | (5,800 | ) | | (5,800) |
| CAD/JPY spot exchange rate | | | CITNA-B | | | | Receive | | | | 8.700 | | | | 1/9/18 | | | CAD | | | 8,200 | | | | (21,136 | ) | | (21,136) |
| CHF/NOK spot exchange rate | | | CITNA-B | | | | Receive | | | | 8.750 | | | | 1/18/18 | | | CHF | | | 6,300 | | | | (7,176 | ) | | (7,176) |
| CHF/SEK spot exchange rate | | | BOA | | | | Pay | | | | 7.750 | | | | 1/12/18 | | | CHF | | | (6,400 | ) | | | 919 | | | 919 |
| EUR/CAD spot exchange rate | | | BOA | | | | Receive | | | | 6.700 | | | | 1/11/18 | | | EUR | | | 5,400 | | | | (3,693 | ) | | (3,693) |
| EUR/CAD spot exchange rate | | | BOA | | | | Receive | | | | 6.900 | | | | 1/8/18 | | | EUR | | | 5,400 | | | | (6,868 | ) | | (6,868) |
| EUR/CHF spot exchange rate | | | GSCO-OT | | | | Pay | | | | 5.050 | | | | 1/22/18 | | | EUR | | | (5,400 | ) | | | 3,823 | | | 3,823 |
| EUR/CHF spot exchange rate | | | BOA | | | | Pay | | | | 4.700 | | | | 1/22/18 | | | EUR | | | (5,400 | ) | | | 518 | | | 518 |
| EUR/CHF spot exchange rate | | | CITNA-B | | | | Pay | | | | 4.700 | | | | 1/29/18 | | | EUR | | | (5,400 | ) | | | (4,535 | ) | | (4,535) |
| EUR/CHF spot exchange rate | | | CITNA-B | | | | Pay | | | | 4.600 | | | | 1/31/18 | | | EUR | | | (5,400 | ) | | | (5,507 | ) | | (5,507) |
| EUR/CHF spot exchange rate | | | GSCO-OT | | | | Pay | | | | 5.425 | | | | 2/5/18 | | | EUR | | | (5,300 | ) | | | (1,272 | ) | | (1,272) |
| EUR/CHF spot exchange rate | | | DEU | | | | Pay | | | | 5.100 | | | | 1/16/18 | | | EUR | | | (5,400 | ) | | | 4,341 | | | 4,341 |
| EUR/CHF spot exchange rate | | | GSCO-OT | | | | Pay | | | | 4.750 | | | | 1/22/18 | | | EUR | | | (5,400 | ) | | | 65 | | | 65 |
| GBP/CAD spot exchange rate | | | CITNA-B | | | | Receive | | | | 8.600 | | | | 1/5/18 | | | GBP | | | 4,700 | | | | (13,009 | ) | | (13,009) |
| GBP/CAD spot exchange rate | | | GSCO-OT | | | | Receive | | | | 8.650 | | | | 1/8/18 | | | GBP | | | 4,800 | | | | (12,054 | ) | | (12,054) |
| GBP/NZD spot exchange rate | | | BOA | | | | Receive | | | | 9.850 | | | | 1/4/18 | | | GBP | | | 4,700 | | | | 2,729 | | | 2,729 |
| GBP/NZD spot exchange rate | | | JPM | | | | Receive | | | | 9.000 | | | | 1/19/18 | | | GBP | | | 4,800 | | | | (14,387 | ) | | (14,387) |
| Total Over-the-Counter Volatility Swaps | | | | | | | | | | | | | | | | | $ | (80,368 | ) | | $ (80,368) |
| | | | | | | | | | | | | | | | | | | | | | | | | | | | |
* Fund will pay or receive the volatility of the reference asset depending on whether the realized volatility of the reference asset exceeds or is less than the strike price. For contracts where the Fund has elected to receive the volatility of the reference asset, it will receive a net payment of the difference between the realized volatility and the strike price multiplied by the notional amount if the realized volatility exceeds the strike price; the Fund will make a net payment of the absolute value of the difference of the realized volatility and the strike price multiplied by the notional amount if the realized volatility is less than the strike price. For contracts where the Fund has elected to pay the volatility of the reference asset, it will make a net payment of the difference between the realized volatility and the strike price multiplied by the notional amount if the realized volatility exceeds the strike price; the Fund will receive a net payment of the absolute value of the difference of the realized and the strike price multiplied by the notional amount if the realized volatility is less than the strike price.
| | |
| Glossary: | | |
| Counterparty Abbreviations | | |
| BAC | | Barclays Bank plc |
| BNP | | BNP Paribas |
| BOA | | Bank of America NA |
| CITNA-B | | Citibank NA |
| DEU | | Deutsche Bank AG |
| GSCOI | | Goldman Sachs International |
| GSCO-OT | | Goldman Sachs Bank USA |
| HSBC | | HSBC Bank USA NA |
| JPM | | JPMorgan Chase Bank NA |
| MOS-A | | Morgan Stanley |
| TDB | | Toronto Dominion Bank |
Currency abbreviations indicate amounts reporting in currencies |
| AUD | | Australian Dollar |
| BRL | | Brazilian Real |
| CAD | | Canadian Dollar |
| CHF | | Swiss Franc |
| CLP | | Chilean Peso |
| CNH | | Offshore Chinese Renminbi |
| COP | | Colombian Peso |
| CZK | | Czech Koruna |
| DKK | | Danish Krone |
| EUR | | Euro |
| GBP | | British Pound Sterling |
| HKD | | Hong Kong Dollar |
| HUF | | Hungarian Forint |
| IDR | | Indonesian Rupiah |
| ILS | | Israeli Shekel |
36 OPPENHEIMER GLOBAL MULTI-ALTERNATIVES FUND/VA
| | |
| Currency abbreviations indicate amounts reporting in currencies (Continued) |
| INR | | Indian Rupee |
| JPY | | Japanese Yen |
| KRW | | South Korean Won |
| MXN | | Mexican Nuevo Peso |
| MYR | | Malaysian Ringgit |
| NOK | | Norwegian Krone |
| NZD | | New Zealand Dollar |
| PLN | | Polish Zloty |
| SEK | | Swedish Krona |
| SGD | | Singapore Dollar |
| THB | | Thailand Baht |
| TRY | | New Turkish Lira |
| TWD | | New Taiwan Dollar |
| ZAR | | South African Rand |
Definitions | | |
| BBA LIBOR | | British Bankers’ Association London - Interbank Offered Rate |
| BONO | | Spanish Government Bonds |
| BTP | | Italian Treasury Bonds |
| BUND | | German Federal Obligation |
| CAC | | French Options Market |
| CDX.HY.27 | | Markit CDX High Yield Index |
| CDX.HY.28 | | Markit CDX High Yield Index |
| CDX.IG.28 | | Markit CDX Investment Grade Index |
| CDX.NA.HY.21 | | Markit CDX North American High Yield |
| CDX.NA.HY.25 | | Markit CDX North American High Yield |
| CIBOR2 | | Two banking days preceding reset date of Copenhagen Interbank Offered Rate |
| DKNA13 | | Reuters 12 - Month CIBOR |
| EUR003M | | EURIBOR 3 Month ACT/360 |
| FTSE 100 | | United Kingdom 100 most highly capitalized companies on the London Stock Exchange |
| HIBOR | | Hong Kong Interbank Offered Rate |
| HKAB | | Hong Kong Association of Banks |
| ICE LIBOR | | Intercontinental Exchange London Interbank Offered Rate |
| itraxx.main.27 | | Credit Default Swap Trading Index for a Specific Basket of Securities |
| LIBOR03M | | ICE LIBOR USD 3 Month |
| LIBOR12 | | London Interbank Offered Rate-Monthly |
| LIBOR4 | | London Interbank Offered Rate-Quarterly |
| MM | | Money Market Reference Rate |
| MSCI | | Morgan Stanley Capital International |
| NIKKEI 225 | | 225 top-rated Japanese Companies listed on the Tokyo Stock Exchange |
| OAT | | French Government Bonds |
| OEX | | S&P 100 Index |
| S&P | | Standard & Poor’s |
| STIBOR SIDE | | Stockholm Interbank Offered Rate |
| T-BILL 3MO | | US Treasury Bill 3 Month |
| TSX 60 | | 60 largest companies on the Toronto Stock Exchange |
| US0001M | | ICE LIBOR USD 1 Month |
| US0003M | | ICE LIBOR USD 3 Month |
| US0006M | | ICE LIBOR USD 6 Month |
See accompanying Notes to Consolidated Financial Statements. |
37 OPPENHEIMER GLOBAL MULTI-ALTERNATIVES FUND/VA
CONSOLIDATED STATEMENT OF ASSETS AND LIABILITIES December 31, 2017
| | |
Assets | | |
| Investments, at value—see accompanying consolidated statement of investments: | | |
| Unaffiliated companies (cost $368,339,434) | | $ 394,395,564 |
| Affiliated companies (cost $17,082,111) | | 17,082,111 |
| | |
| | | 411,477,675 |
| Cash | | 316,013 |
| Cash used for collateral on futures | | 4,906,000 |
| Cash used for collateral on OTC derivatives | | 272,000 |
| Cash used for collateral on centrally cleared swaps | | 3,860,001 |
| Deposits with broker for securities sold short | | 38,416,826 |
| Deposits with broker for foreign securities sold short (cost $5,567,029) | | 5,795,984 |
| Unrealized appreciation on forward currency exchange contracts | | 1,808,360 |
| Swaps, at value | | 150,838 |
| Centrally cleared swaps, at value (net premiums paid $58,373) | | 622,396 |
| Receivables and other assets: | | |
| Investments sold (including $4,673,441 sold on a when-issued or delayed delivery basis) | | 4,753,598 |
| Interest and dividends | | 1,347,467 |
| Variation margin receivable | | 346,721 |
| Shares of beneficial interest sold | | 1,336 |
| Other | | 40,621 |
| | |
Total assets | | 474,115,836 |
Liabilities | | |
| Securities sold short, at value (proceeds $37,169,462)—see accompanying consolidated statement of investments | | 41,468,471 |
| Unrealized depreciation on forward currency exchange contracts | | 2,829,392 |
| Swaps, at value (net premiums paid $55,019) | | 1,012,659 |
| Centrally cleared swaps, at value (premiums received $1,739,069) | | 2,571,186 |
| Payables and other liabilities: | | |
| Investments purchased (including $6,016,863 purchased on a when-issued or delayed delivery basis) | | 6,360,166 |
| Variation margin payable | | 312,906 |
| Dividends on short sales | | 30,613 |
| Trustees’ compensation | | 8,727 |
| Foreign capital gains tax | | 5,175 |
| Shareholder communications | | 3,568 |
| Distribution and service plan fees | | 740 |
| Shares of beneficial interest redeemed | | 116 |
| Other | | 234,350 |
| | |
Total liabilities | | 54,838,069 |
Net Assets | | $ 419,277,767 |
| | |
| | |
Composition of Net Assets | | |
| Par value of shares of beneficial interest | | $ 42,621 |
| Additional paid-in capital | | 431,921,721 |
| Accumulated net investment loss | | (32,366) |
| Accumulated net realized loss on investments and foreign currency transactions | | (33,041,174) |
| Net unrealized appreciation on investments and translation of assets and liabilities denominated in foreign currencies | | 20,386,965 |
| Net Assets | | $ 419,277,767 |
| | |
| | |
Net Asset Value Per Share | | |
| |
| Non-Service Shares: | | |
| |
| Net asset value, redemption price per share and offering price per share (based on net assets of $415,811,372 and 42,267,700 shares of beneficial interest outstanding) | | $9.84 |
| |
| Service Shares: | | |
| |
| Net asset value, redemption price per share and offering price per share (based on net assets of $3,466,395 and 353,209 shares of beneficial interest outstanding) | | $9.81 |
See accompanying Notes to Consolidated Financial Statements.
38 OPPENHEIMER GLOBAL MULTI-ALTERNATIVES FUND/VA
CONSOLIDATED STATEMENT OF OPERATIONS For the Year Ended December 31, 2017
| | |
Investment Income | | |
| Interest (net of foreign withholding taxes of $2,598) | | $ 6,290,040 |
| Dividends: | | |
| Unaffiliated companies (net of foreign withholding taxes of $94,041) | | 3,617,251 |
| Affiliated companies | | 249,601 |
| Other income | | 156,542 |
| | |
| Total investment income | | 10,313,434 |
| | |
| Expenses | | |
| Management fees | | 4,226,165 |
| Distribution and service plan fees — Service shares | | 7,651 |
| Transfer and shareholder servicing agent fees: | | |
| Non-Service shares | | 408,210 |
| Service shares | | 3,062 |
| Shareholder communications: | | |
| Non-Service shares | | 12,827 |
| Service shares | | 98 |
| Dividends on short sales | | 465,730 |
| Custodian fees and expenses | | 133,592 |
| Trustees’ compensation | | 31,606 |
| Borrowing fees | | 11,188 |
| Other | | 274,727 |
| | |
| Total expenses | | 5,574,856 |
| Less reduction to custodian expenses | | (836) |
| Less waivers and reimbursements of expenses | | (149,076) |
| | |
Net expenses | | 5,424,944 |
| Net Investment Income | | 4,888,490 |
| Realized and Unrealized Gain (Loss) | | |
| Net realized gain (loss) on: | | |
| Investment transactions in unaffiliated companies | | 789,102 |
| Option contracts written | | 2,006,900 |
| Futures contracts | | (3,157,374) |
| Foreign currency transactions | | 166,016 |
| Forward currency exchange contracts | | (4,191,909) |
| Short Positions | | (7,054,954) |
| Swap contracts | | (1,182,880) |
| | |
| Net realized loss | | (12,625,099) |
| Net change in unrealized appreciation/depreciation on: | | |
| Investment transactions in unaffiliated companies (net of foreign capital gains tax of $5,175) | | 16,180,991 |
| Translation of assets and liabilities denominated in foreign currencies | | 329,688 |
| Forward currency exchange contracts | | (4,306,116) |
| Futures contracts | | 966,849 |
| Option contracts written | | (44,280) |
| Short positions | | (1,887,016) |
| Swap contracts | | (1,520,839) |
| | |
Net change in unrealized appreciation/depreciation | | 9,719,277 |
| Net Increase in Net Assets Resulting from Operations | | $ 1,982,668 |
| | |
See accompanying Notes to Consolidated Financial Statements.
39 OPPENHEIMER GLOBAL MULTI-ALTERNATIVES FUND/VA
CONSOLIDATED STATEMENTS OF CHANGES IN NET ASSETS
| | | | |
| | | Year Ended December 31, 2017 | | Year Ended December 31, 2016 |
| Operations | | | | |
| Net investment income | | $ 4,888,490 | | $ 4,569,279 |
| Net realized loss | | (12,625,099) | | (15,226,380) |
| Net change in unrealized appreciation/depreciation | | 9,719,277 | | 25,813,743 |
| Net increase in net assets resulting from operations | | 1,982,668 | | 15,156,642 |
| Dividends and/or Distributions to Shareholders | | | | |
| Dividends from net investment income: | | | | |
| Non-Service shares | | (3,921,732) | | (5,549,952) |
| Service shares | | (24,086) | | (29,481) |
| | (3,945,818) | | (5,579,433) |
| Beneficial Interest Transactions | | | | |
| Net increase (decrease) in net assets resulting from beneficial interest transactions: | | | | |
| Non-Service shares | | 17,307,626 | | (15,372,890) |
| Service shares | | 940,121 | | 657,532 |
| | 18,247,747 | | (14,715,358) |
| Net Assets | | | | |
| Total increase (decrease) | | 16,284,597 | | (5,138,149) |
| Beginning of period | | 402,993,170 | | 408,131,319 |
| End of period (including accumulated net investment loss of $32,366 and $1,020,555, respectively) | | $ 419,277,767 | | $ 402,993,170 |
| | |
See accompanying Notes to Consolidated Financial Statements.
40 OPPENHEIMER GLOBAL MULTI-ALTERNATIVES FUND/VA
CONSOLIDATED FINANCIAL HIGHLIGHTS
| | | | | | | | | | | | | | | | | | | | |
| Non-Service Shares | | Year Ended December 31, 2017 | | | Year Ended December 31, 2016 | | | Year Ended December 31, 20151 | | | Year Ended December 31, 20141 | | | Period Ended December 31, 20132 | |
| Per Share Operating Data | | | | | | | | | | | | | | | | | | | | |
| Net asset value, beginning of period | | | $9.88 | | | | $9.66 | | | | $10.04 | | | | $9.92 | | | | $10.00 | |
| Income (loss) from investment operations: | | | | | | | | | | | | | | | | | | | | |
| Net investment income (loss)3 | | | 0.12 | | | | 0.11 | | | | 0.11 | | | | 0.08 | | | | (0.02) | |
| Net realized and unrealized gain (loss) | | | (0.06) | | | | 0.25 | | | | (0.46) | | | | 0.52 | | | | (0.05) | |
| Total from investment operations | | | 0.06 | | | | 0.36 | | | | (0.35) | | | | 0.60 | | | | (0.07) | |
| Dividends and/or distributions to shareholders: | | | | | | | | | | | | | | | | | | | | |
| Dividends from net investment income | | | (0.10) | | | | (0.14) | | | | (0.03) | | | | (0.25) | | | | (0.01) | |
| Distributions from net realized gain | | | 0.00 | | | | 0.00 | | | | 0.00 | | | | (0.21) | | | | 0.00 | |
| Tax return of capital distribution | | | 0.00 | | | | 0.00 | | | | 0.00 | | | | (0.02) | | | | 0.00 | |
| Total dividends and/or distributions to shareholders | | | (0.10) | | | | (0.14) | | | | (0.03) | | | | (0.48) | | | | (0.01) | |
| Net asset value, end of period | | | $9.84 | | | | $9.88 | | | | $9.66 | | | | $10.04 | | | | $9.92 | |
| | | | | | | | | | | | | | | | | | | | |
| | | | | | | | | | | | | | | | | | | | |
| Total Return, at Net Asset Value4 | | | 0.56% | | | | 3.71% | | | | (3.45)% | | | | 6.02% | | | | (0.69)% | |
| | | | | | | | | | | | | | | | | | | | |
| Ratios/Supplemental Data | | | | | | | | | | | | | | | | | | | | |
| Net assets, end of period (in thousands) | | | $415,811 | | | | $400,449 | | | | $406,286 | | | | $262,573 | | | | $9,917 | |
| Average net assets (in thousands) | | | $408,282 | | | | $408,810 | | | | $363,975 | | | | $161,988 | | | | $9,827 | |
| Ratios to average net assets:5 | | | | | | | | | | | | | | | | | | | | |
| Net investment income (loss) | | | 1.19% | | | | 1.11% | | | | 1.11% | | | | 0.77%6 | | | | (1.85)%6 | |
| Expenses excluding specific expenses listed below | | | 1.24% | | | | 1.23% | | | | 1.24% | | | | 1.33% | | | | 7.16% | |
| Dividends and/or interest expense on securities sold short | | | 0.11% | | | | 0.22% | | | | 0.17% | | | | 0.08% | | | | 0.00% | |
| Borrowing expenses on securities sold short | | | 0.00% | | | | 0.02% | | | | 0.05% | | | | 0.02% | | | | 0.00% | |
| Interest and fees from borrowings | | | 0.00%7 | | | | 0.00%7 | | | | 0.00%7 | | | | 0.00% | | | | 0.00% | |
| Total expenses8 | | | 1.35% | | | | 1.47% | | | | 1.46% | | | | 1.43%6 | | | | 7.16%6 | |
| Expenses after payments, waivers and/or reimbursements and reduction to custodian expenses | | | 1.32% | | | | 1.43% | | | | 1.41% | | | | 1.31%6 | | | | 3.33%6 | |
| Portfolio turnover rate | | | 129% | | | | 93% | | | | 67% | | | | 147% | | | | 11% | |
1. Net investment income per share, net realized and unrealized gain (loss) per share and the net investment income ratio include an adjustment for a prior period reclassification for the years ended December 31, 2014 and 2015. Please see Note 11 of the accompanying Notes to Financial Statements.
2. For the period from November 14, 2013 (inception of offering) to December 31, 2013.
3. Per share amounts calculated based on the average shares outstanding during the period.
4. Assumes an initial investment on the business day before the first day of the fiscal period, with all dividends and distributions reinvested in additional shares on the reinvestment date, and redemption at the net asset value calculated on the last business day of the fiscal period. Total returns are not annualized for periods less than one full year. Total return information does not reflect expenses that apply at the separate account level or to related insurance products. Inclusion of these charges would reduce the total return figures for all periods shown. Returns do not reflect the deduction of taxes that a shareholder would pay on fund distributions or the redemption of fund shares.
5. Annualized for periods less than one full year.
6. Includes the Fund’s share of the allocated expenses and/or net investment income from the master funds.
7. Less than 0.005%.
8. Total expenses including indirect expenses from affiliated fund fees and expenses were as follows:
| | | | | | | | |
| | Year Ended December 31, 2017 | | | 1.36 | % | | |
| | Year Ended December 31, 2016 | | | 1.48 | % | | |
| | Year Ended December 31, 2015 | | | 1.47 | % | | |
| | Year Ended December 31, 2014 | | | 1.45 | % | | |
| | Period Ended December 31, 2013 | | | 7.18 | % | | |
See accompanying Notes to Consolidated Financial Statements.
41 OPPENHEIMER GLOBAL MULTI-ALTERNATIVES FUND/VA
CONSOLIDATED FINANCIAL HIGHLIGHTS Continued
| | | | | | | | | | |
| Service Shares | | Year Ended
December 31,
2017 | | Year Ended
December 31,
2016 | | Year Ended
December 31,
20151 | | Year Ended
December 31,
20141 | | Period Ended
December 31,
20132 |
| Per Share Operating Data | | | | | | | | | | |
| Net asset value, beginning of period | | $9.87 | | $9.65 | | $10.03 | | $9.92 | | $10.00 |
| Income (loss) from investment operations: | | | | | | | | | | |
| Net investment income (loss)3 | | 0.09 | | 0.08 | | 0.08 | | 0.08 | | (0.03) |
| Net realized and unrealized gain (loss) | | (0.07) | | 0.26 | | (0.45) | | 0.50 | | (0.04) |
| Total from investment operations | | 0.02 | | 0.34 | | (0.37) | | 0.58 | | (0.07) |
| Dividends and/or distributions to shareholders: | | | | | | | | | | |
| Dividends from net investment income | | (0.08) | | (0.12) | | (0.01) | | (0.25) | | (0.01) |
| Distributions from net realized gain | | 0.00 | | 0.00 | | 0.00 | | (0.21) | | 0.00 |
| Tax return of capital distribution | | 0.00 | | 0.00 | | 0.00 | | (0.01) | | 0.00 |
| Total dividends and/or distributions to shareholders | | (0.08) | | (0.12) | | (0.01) | | (0.47) | | (0.01) |
| Net asset value, end of period | | $9.81 | | $9.87 | | $9.65 | | $10.03 | | $9.92 |
| | | | | | | | | | |
| | | | | | | | | | |
| Total Return, at Net Asset Value4 | | 0.19% | | 3.49% | | (3.68)% | | 5.90% | | (0.72)% |
| | | | | | | | | | |
| Ratios/Supplemental Data | | | | | | | | | | |
| Net assets, end of period (in thousands) | | $3,467 | | $2,544 | | $1,845 | | $1,332 | | $10 |
| Average net assets (in thousands) | | $3,063 | | $2,054 | | $1,695 | | $335 | | $10 |
| Ratios to average net assets:5 | | | | | | | | | | |
| Net investment income (loss) | | 0.92% | | 0.85% | | 0.85% | | 0.78%6 | | (2.12)%6 |
| Expenses excluding specific expenses listed below | | 1.49% | | 1.48% | | 1.48% | | 1.68% | | 7.43% |
| Dividends and/or interest expense on securities sold short | | 0.11% | | 0.22% | | 0.17% | | 0.08% | | 0.00% |
| Borrowing expenses on securities sold short | | 0.00% | | 0.02% | | 0.05% | | 0.02% | | 0.00% |
| Interest and fees from borrowings | | 0.00%7 | | 0.00%7 | | 0.00%7 | | 0.00% | | 0.00% |
| Total expenses8 | | 1.60% | | 1.72% | | 1.70% | | 1.78%6 | | 7.43%6 |
| Expenses after payments, waivers and/or reimbursements and reduction to custodian expenses | | 1.57% | | 1.68% | | 1.65% | | 1.67%6 | | 3.50%6 |
| Portfolio turnover rate | | 129% | | 93% | | 67% | | 147% | | 11% |
1. Net investment income per share, net realized and unrealized gain (loss) per share and the net investment income ratio include an adjustment for a prior period reclassification for the years ended December 31, 2014 and 2015. Please see Note 11 of the accompanying Notes to Financial Statements.
2. For the period from November 14, 2013 (inception of offering) to December 31, 2013.
3. Per share amounts calculated based on the average shares outstanding during the period.
4. Assumes an initial investment on the business day before the first day of the fiscal period, with all dividends and distributions reinvested in additional shares on the reinvestment date, and redemption at the net asset value calculated on the last business day of the fiscal period. Total returns are not annualized for periods less than one full year. Total return information does not reflect expenses that apply at the separate account level or to related insurance products. Inclusion of these charges would reduce the total return figures for all periods shown. Returns do not reflect the deduction of taxes that a shareholder would pay on fund distributions or the redemption of fund shares.
5. Annualized for periods less than one full year.
6. Includes the Fund’s share of the allocated expenses and/or net investment income from the master funds.
7. Less than 0.005%.
8. Total expenses including indirect expenses from affiliated fund fees and expenses were as follows:
| | | | | | | | |
| | Year Ended December 31, 2017 | | | 1.61 | % | | |
| | Year Ended December 31, 2016 | | | 1.73 | % | | |
| | Year Ended December 31, 2015 | | | 1.71 | % | | |
| | Year Ended December 31, 2014 | | | 1.80 | % | | |
| | Period Ended December 31, 2013 | | | 7.45 | % | | |
See accompanying Notes to Consolidated Financial Statements.
42 OPPENHEIMER GLOBAL MULTI-ALTERNATIVES FUND/VA
NOTES TO CONSOLIDATED FINANCIAL STATEMENTS December 31, 2017
1. Organization
Oppenheimer Global Multi-Alternatives Fund/VA (the “Fund”) is a separate series of Oppenheimer Variable Account Funds, a diversified open-end management investment company registered under the Investment Company Act of 1940 (“1940 Act”), as amended. The Fund’s investment objective is to seek total return. The Fund’s investment adviser is OFI Global Asset Management, Inc. (“OFI Global” or the “Manager”), a wholly-owned subsidiary of OppenheimerFunds, Inc. (“OFI” or the “Sub-Adviser”). The Manager has entered into a sub-advisory agreement with OFI. The Sub-Adviser has entered into sub-sub-advisory agreements with Barings LLC and OFI SteelPath, Inc. (collectively, the “Sub-Sub-Advisers”). Shares of the Fund are sold only to separate accounts of life insurance companies.
The Fund offers two classes of shares. Both classes are sold at their offering price, which is the net asset value per share, to separate investment accounts of participating insurance companies as an underlying investment for variable life insurance policies, variable annuity contracts or other investment products. The class of shares designated as Service shares is subject to a distribution and service plan. Both classes of shares have identical rights and voting privileges with respect to the Fund in general and exclusive voting rights on matters that affect that class alone. Earnings, net assets and net asset value per share may differ due to each class having its own expenses, such as transfer and shareholder servicing agent fees and shareholder communications, directly attributable to that class.
The following is a summary of significant accounting policies followed in the Fund’s preparation of financial statements in accordance with accounting principles generally accepted in the United States (“U.S. GAAP”).
2. Significant Accounting Policies
Security Valuation. All investments in securities are recorded at their estimated fair value, as described in Note 3.
Basis for Consolidation. The Fund has established a Cayman Islands exempted company, Oppenheimer Global Multi-Alternatives Fund/VA (Cayman) Ltd., which is wholly-owned and controlled by the Fund (the “Subsidiary”). The Fund and Subsidiary are both managed by the Manager. The Fund may invest up to 25% of its total assets in the Subsidiary. The Subsidiary invests primarily in commodity-linked derivatives (including commodity futures, financial futures, options and swap contracts) and certain fixed-income securities and other investments that may serve as margin or collateral for its derivatives positions. The Fund applies its investment restrictions and compliance policies and procedures, on a look-through basis, to the Subsidiary.
The financial statements have been consolidated and include accounts of the Fund and the Subsidiary. Accordingly, all inter-company transactions and balances have been eliminated. At period end, the Fund owned 21,023 shares with net assets of $11,767,262 in the Subsidiary.
Other financial information at period end:
| | | | |
| Total market value of investments | | $ | 10,734,020 | |
| Net assets | | $ | 11,767,262 | |
| Net income (loss) | | $ | (98,024) | |
| Net realized gain (loss) | | $ | 323,162 | |
| Net change in unrealized appreciation/depreciation | | $ | 718,651 | |
Foreign Currency Translation. The books and records of the Fund are maintained in U.S. dollars. Any foreign currency amounts are translated into U.S. dollars on the following basis:
(1) Value of investment securities, other assets and liabilities — at the exchange rates prevailing at Market Close as described in Note 3.
(2) Purchases and sales of investment securities, income and expenses — at the rates of exchange prevailing on the respective dates of such transactions.
Although the net assets and the values are presented at the foreign exchange rates at Market Close, the Fund does not isolate the portion of the results of operations resulting from changes in foreign exchange rates on investments from the fluctuations arising from changes in prices of securities held. Such fluctuations are included with the net realized and unrealized gains or losses from investments shown in the Consolidated Statement of Operations.
For securities, which are subject to foreign withholding tax upon disposition, realized gains or losses on such securities are recorded net of foreign withholding tax.
Reported net realized foreign exchange gains or losses arise from sales of foreign currencies, currency gains or losses realized between the trade and settlement dates on securities transactions, the difference between the amounts of dividends, interest, and foreign withholding tax reclaims recorded on the Fund’s books, and the U.S. dollar equivalent of the amounts actually received or paid. Net unrealized foreign exchange gains and losses arise from changes in the value of assets and liabilities other than investments in securities, resulting from changes in the exchange rate.
Allocation of Income, Expenses, Gains and Losses. Income, expenses (other than those attributable to a specific class), gains and losses are allocated on a daily basis to each class of shares based upon the relative proportion of net assets represented by such class. Operating expenses directly attributable to a specific class are charged against the operations of that class.
Dividends and Distributions to Shareholders. Dividends and distributions to shareholders, which are determined in accordance with income tax regulations and may differ from U.S. GAAP, are recorded on the ex-dividend date. Income and capital gain distributions, if any, are declared and paid annually or at other times as determined necessary by the Manager.
43 OPPENHEIMER GLOBAL MULTI-ALTERNATIVES FUND/VA
NOTES TO CONSOLIDATED FINANCIAL STATEMENTS Continued
2. Significant Accounting Policies (Continued)
Investment Income. Dividend income is recorded on the ex-dividend date or upon ex-dividend notification in the case of certain foreign dividends where the ex-dividend date may have passed. Non-cash dividends included in dividend income, if any, are recorded at the fair value of the securities received. Withholding taxes on foreign dividends, if any, and capital gains taxes on foreign investments, if any, have been provided for in accordance with the Fund’s understanding of the applicable tax rules and regulations. Interest income, if any, is recognized on an accrual basis. Discount and premium, which are included in interest income on the Consolidated Statement of Operations, are amortized or accreted daily.
Return of Capital Estimates. Distributions received from the Fund’s investments in Master Limited Partnerships (MLPs) and Real Estate Investments Trusts (REITs), generally are comprised of income and return of capital. The Fund records investment income and return of capital based on estimates. Such estimates are based on historical information available from each MLP, REIT and other industry sources. These estimates may subsequently be revised based on information received from MLPs and REITs after their tax reporting periods are concluded.
Custodian Fees. “Custodian fees and expenses” in the Consolidated Statement of Operations may include interest expense incurred by the Fund on any cash overdrafts of its custodian account during the period. Such cash overdrafts may result from the effects of failed trades in portfolio securities and from cash outflows resulting from unanticipated shareholder redemption activity. The Fund pays interest to its custodian on such cash overdrafts, to the extent they are not offset by positive cash balances maintained by the Fund, at a rate equal to the Federal Funds Rate plus 2.00%. The “Reduction to custodian expenses” line item, if applicable, represents earnings on cash balances maintained by the Fund during the period. Such interest expense and other custodian fees may be paid with these earnings.
Security Transactions. Security transactions are recorded on the trade date. Realized gains and losses on securities sold are determined on the basis of identified cost.
Indemnifications. The Fund’s organizational documents provide current and former Trustees and officers with a limited indemnification against liabilities arising in connection with the performance of their duties to the Fund. In the normal course of business, the Fund may also enter into contracts that provide general indemnifications. The Fund’s maximum exposure under these arrangements is unknown as this would be dependent on future claims that may be made against the Fund. The risk of material loss from such claims is considered remote.
Federal Taxes. The Fund intends to comply with provisions of the Internal Revenue Code applicable to regulated investment companies and to distribute substantially all of its investment company taxable income, including any net realized gain on investments not offset by capital loss carryforwards, if any, to shareholders. Therefore, no federal income or excise tax provision is required, however, during the reporting period, the Fund paid federal excise tax of $19,555. The Fund files income tax returns in U.S. federal and applicable state jurisdictions. The statute of limitations on the Fund’s tax return filings generally remains open for the three preceding fiscal reporting period ends. The Fund has analyzed its tax positions for the fiscal year ended December 31, 2017, including open tax years, and does not believe there are any uncertain tax positions requiring recognition in the Fund’s financial statements.
Subchapter M requires, among other things, that at least 90% of the Fund’s gross income be derived from securities or derived with respect to its business of investing in securities (typically referred to as “qualifying income”). Income from commodity-linked derivatives may not be treated as “qualifying income” for purposes of the 90% gross income requirement. The Internal Revenue Service (IRS) has previously issued a number of private letter rulings which conclude that income derived from commodity index-linked notes and investments in a wholly-owned subsidiary will be “qualifying income.” As a result, the Fund will gain exposure to commodities through commodity-linked notes and its wholly-owned subsidiary.
The IRS has suspended the granting of private letter rulings pending further review. As a result, there can be no assurance that the IRS will not change its position with respect to commodity-linked notes and wholly-owned subsidiaries. In addition, future legislation and guidance from the Treasury and the IRS may adversely affect the Fund’s ability to gain exposure to commodities through commodity-linked notes and its wholly-owned subsidiary.
The Fund is required to include in income for federal income tax purposes all of the subsidiary’s net income and gains whether or not such income is distributed by the subsidiary. Net income and gains from the subsidiary are generally treated as ordinary income by the Fund, regardless of the character of the subsidiary’s underlying income. Net losses from the subsidiary do not pass through to the Fund for federal income tax purposes.
The tax components of capital shown in the following table represent distribution requirements the Fund must satisfy under the income tax regulations, losses the Fund may be able to offset against income and gains realized in future years and unrealized appreciation or depreciation of securities and other investments for federal income tax purposes.
| | | | | | | | | | | | |
Undistributed Net Investment Income | | Undistributed Long-Term Gain | | | Accumulated Loss Carryforward1,2,3,4 | | | Net Unrealized Appreciation Based on cost of Securities and Other Investments for Federal Income Tax Purposes | |
| $— | | | $— | | | | $20,924,253 | | | | $11,122,140 | |
1. At period end, the Fund had $20,101,917 of net capital loss carryforward available to offset future realized capital gains, if any, and thereby reduce future taxable gain distributions. Details of the capital loss carryforwards are included in the table below. Capital loss carryovers with no expiration, if any, must be utilized prior to those with expiration dates.
44 OPPENHEIMER GLOBAL MULTI-ALTERNATIVES FUND/VA
2. Significant Accounting Policies (Continued)
| | | | |
| Expiring | | | |
| No expiration | | $ | 20,101,917 | |
2. The Fund had $822,336 of post-October foreign currency losses which were deferred.
3. During the reporting period, the Fund did not utilize any capital loss carryforward.
4. During the previous reporting period, the Fund did not utilize any capital loss carryforward.
Net investment income (loss) and net realized gain (loss) may differ for financial statement and tax purposes. The character of dividends and distributions made during the fiscal year from net investment income or net realized gains are determined in accordance with federal income tax requirements, which may differ from the character of net investment income or net realized gains presented in those financial statements in accordance with U.S. GAAP. Also, due to timing of dividends and distributions, the fiscal year in which amounts are distributed may differ from the fiscal year in which the income or net realized gain was recorded by the Fund.
Accordingly, the following amounts have been reclassified for the reporting period. Net assets of the Fund were unaffected by the reclassifications.
| | | | | | | | |
Reduction to Paid-in Capital | | Reduction to Accumulated Net Investment Loss | | | Increase to Accumulated Net Realized Loss on Investments | |
| $21,266 | | | $45,517 | | | | $24,251 | |
The tax character of distributions paid during the reporting periods:
| | | | | | | | |
| | | Year Ended December 31, 2017 | | | Year Ended December 31, 2016 | |
| Distributions paid from: | | | | | | | | |
| Ordinary income | | $ | 3,945,818 | | | $ | 5,579,433 | |
The aggregate cost of securities and other investments and the composition of unrealized appreciation and depreciation of securities and other investments for federal income tax purposes at period end are noted in the following table. The primary difference between book and tax appreciation or depreciation of securities and other investments, if applicable, is attributable to the tax deferral of losses or tax realization of financial statement unrealized gain or loss.
| | | | |
| Federal tax cost of securities | | $ | 395,617,220 | |
| Federal tax cost of other investments | | | (11,505,127 | ) |
| | | | |
| Total federal tax cost | | $ | 384,112,093 | |
| | | | |
| Gross unrealized appreciation | | $ | 28,867,591 | |
| Gross unrealized depreciation | | | (17,745,451 | ) |
| | | | |
| Net unrealized appreciation | | $ | 11,122,140 | |
| | | | |
Certain foreign countries impose a tax on capital gains which is accrued by the Fund based on unrealized appreciation, if any, on affected securities. The tax is paid when the gain is realized.
Use of Estimates. The preparation of financial statements in conformity with U.S. GAAP requires management to make estimates and assumptions that affect the reported amounts of assets and liabilities and disclosure of contingent assets and liabilities at the date of the financial statements and the reported amounts of increases and decreases in net assets from operations during the reporting period. Actual results could differ from those estimates.
3. Securities Valuation
The Fund calculates the net asset value of its shares as of 4:00 P.M. Eastern time, on each day the New York Stock Exchange (the “Exchange”) is open for trading, except in the case of a scheduled early closing of the Exchange, in which case the Fund will calculate net asset value of the shares as of the scheduled early closing time of the Exchange.
The Fund’s Board has adopted procedures for the valuation of the Fund’s securities and has delegated the day-to-day responsibility for valuation determinations under those procedures to the Manager. The Manager has established a Valuation Committee which is responsible for determining a fair valuation for any security for which market quotations are not readily available. The Valuation Committee’s fair valuation determinations are subject to review, approval and ratification by the Fund’s Board at least quarterly or more frequently, if necessary.
Valuation Methods and Inputs
Securities are valued primarily using unadjusted quoted market prices, when available, as supplied by third party pricing services or broker-dealers.
The following methodologies are used to determine the market value or the fair value of the types of securities described below:
Equity securities traded on a securities exchange (including exchange-traded derivatives other than futures and futures options) are valued based on the official closing price on the principal exchange on which the security is traded, as identified by the Manager, prior to the time when the Fund’s assets
45 OPPENHEIMER GLOBAL MULTI-ALTERNATIVES FUND/VA
NOTES TO CONSOLIDATED FINANCIAL STATEMENTS Continued
3. Securities Valuation (Continued)
are valued. If the official closing price is unavailable, the security is valued at the last sale price on the principal exchange on which it is traded, or if no sales occurred, the security is valued at the mean between the quoted bid and asked prices. Over-the-counter equity securities are valued at the last published sale price, or if no sales occurred, at the mean between the quoted bid and asked prices. Events occurring after the close of trading on foreign exchanges may result in adjustments to the valuation of foreign securities to more accurately reflect their fair value as of the time when the Fund’s assets are valued.
Shares of a registered investment company that are not traded on an exchange are valued at that investment company’s net asset value per share.
Corporate and government debt securities (of U.S. or foreign issuers) and municipal debt securities, short-term notes, mortgage-backed securities, collateralized mortgage obligations, and asset-backed securities are valued at the mean between the bid and asked prices utilizing evaluated prices obtained from third party pricing services or broker-dealers who may use matrix pricing methods to determine the evaluated prices. Pricing services generally price debt securities assuming orderly transactions of an institutional “round lot” size, but some trades may occur in smaller, “odd lot” sizes, sometimes at lower prices than institutional round lot trades. Standard inputs generally considered by third-party pricing vendors include reported trade data, broker-dealer price quotations, benchmark yields, issuer spreads on comparable securities, the credit quality, yield, maturity, as well as other appropriate factors.
Event-linked bonds, are valued at the mean between the bid and asked prices utilizing evaluated prices obtained from third party pricing services or broker-dealers. Standard inputs generally considered by third-party pricing vendors include reported trade data and broker-dealer price quotations.
Loans are valued at the mean between the bid and asked prices utilizing evaluated prices obtained from third party pricing services or broker-dealers. Standard inputs generally considered by third-party pricing vendors include information obtained from market participants regarding broker-dealer price quotations.
Structured securities, swaps, swaptions, and other over-the-counter derivatives are valued utilizing evaluated prices obtained from third party pricing services or broker-dealers. Standard inputs generally considered by third-party pricing vendors include market information relevant to the underlying reference asset such as the price of financial instruments, stock market indices, foreign currencies, interest rate spreads, commodities, credit spreads, credit event probabilities, index values, individual security values, forward interest rates, variable interest rates, volatility measures, and forward currency rates, or the occurrence of other specific events.
Forward foreign currency exchange contracts are valued utilizing current and forward currency rates obtained from third party pricing services. When the settlement date of a contract is an interim date for which a quotation is not available, interpolated values are derived using the nearest dated forward currency rate.
Futures contracts and futures options traded on a commodities or futures exchange will be valued at the final settlement price or official closing price on the principal exchange as reported by such principal exchange at its trading session ending at, or most recently prior to, the time when the Fund’s assets are valued.
Securities for which market quotations are not readily available, or when a significant event has occurred that would materially affect the value of the security, are fair valued either (i) by a standardized fair valuation methodology applicable to the security type or the significant event as previously approved by the Valuation Committee and the Fund’s Board or (ii) as determined in good faith by the Manager’s Valuation Committee. The Valuation Committee considers all relevant facts that are reasonably available, through either public information or information available to the Manager, when determining the fair value of a security. Those standardized fair valuation methodologies include, but are not limited to, valuing securities at the last sale price or initially at cost and subsequently adjusting the value based on: changes in company specific fundamentals, changes in an appropriate securities index, or changes in the value of similar securities which may be further adjusted for any discounts related to security-specific resale restrictions. When possible, such methodologies use observable market inputs such as unadjusted quoted prices of similar securities, observable interest rates, currency rates and yield curves. The methodologies used for valuing securities are not necessarily an indication of the risks associated with investing in those securities nor can it be assured that the Fund can obtain the fair value assigned to a security if it were to sell the security.
To assess the continuing appropriateness of security valuations, the Manager regularly compares prior day prices and sale prices to the current day prices and challenges those prices exceeding certain tolerance levels with the third party pricing service or broker source. For those securities valued by fair valuations, whether through a standardized fair valuation methodology or a fair valuation determination, the Valuation Committee reviews and affirms the reasonableness of the valuations based on such methodologies and fair valuation determinations on a regular basis after considering all relevant information that is reasonably available.
Classifications
Each investment asset or liability of the Fund is assigned a level at measurement date based on the significance and source of the inputs to its valuation.
Various data inputs may be used in determining the value of each of the Fund’s investments as of the reporting period end. These data inputs are categorized in the following hierarchy under applicable financial accounting standards:
1) Level 1-unadjusted quoted prices in active markets for identical assets or liabilities (including securities actively traded on a securities exchange)
2) Level 2-inputs other than unadjusted quoted prices that are observable for the asset or liability (such as unadjusted quoted prices for similar assets and market corroborated inputs such as interest rates, prepayment speeds, credit risks, etc.)
3) Level 3-significant unobservable inputs (including the Manager’s own judgments about assumptions that market participants would use in pricing the asset or liability).
The inputs used for valuing securities are not necessarily an indication of the risks associated with investing in those securities.
The Fund classifies each of its investments in investment companies which are publicly offered as Level 1. Investment companies that are not publicly
46 OPPENHEIMER GLOBAL MULTI-ALTERNATIVES FUND/VA
3. Securities Valuation (Continued)
offered, if any, are classified as Level 2 in the fair value hierarchy.
The table below categorizes amounts that are included in the Fund’s Consolidated Statement of Assets and Liabilities at period end based on valuation input level:
| | | | | | | | | | | | | | | | |
| | Level 1— Unadjusted Quoted Prices | | | Level 2— Other Significant Observable Inputs | | | Level 3— Significant Unobservable Inputs | | | Value | |
| Assets Table | | | | | | | | | | | | | | | | |
| Investments, at Value: | | | | | | | | | | | | | | | | |
| Common Stocks | | | | | | | | | | | | | | | | |
Consumer Discretionary | | $ | 7,901,701 | | | $ | 2,623,322 | | | $ | 66 | | | $ | 10,525,089 | |
Consumer Staples | | | 8,793,252 | | | | 1,645,960 | | | | — | | | | 10,439,212 | |
Energy | | | 32,154,788 | | | | 1,021,444 | | | | — | | | | 33,176,232 | |
Financials | | | 30,841,991 | | | | 12,793,675 | | | | 199 | | | | 43,635,865 | |
Health Care | | | 18,781,814 | | | | 1,872,065 | | | | 6,316 | | | | 20,660,195 | |
Industrials | | | 20,494,392 | | | | 1,529,412 | | | | — | | | | 22,023,804 | |
Information Technology | | | 20,106,460 | | | | 605,255 | | | | 2 | | | | 20,711,717 | |
Materials | | | 7,450,342 | | | | 1,526,928 | | | | — | | | | 8,977,270 | |
Telecommunication Services | | | 3,391,316 | | | | 534,362 | | | | — | | | | 3,925,678 | |
Utilities | | | 4,817,768 | | | | 964,348 | | | | — | | | | 5,782,116 | |
| Preferred Stocks | | | — | | | | 1,075,892 | | | | — | | | | 1,075,892 | |
| Rights, Warrants and Certificates | | | 3,822 | | | | — | | | | 2 | | | | 3,824 | |
| Asset-Backed Securities | | | — | | | | 10,631,127 | | | | — | | | | 10,631,127 | |
| Mortgage-Backed Obligation | | | — | | | | 2,306,933 | | | | — | | | | 2,306,933 | |
| Foreign Government Obligations | | | — | | | | 7,578,584 | | | | — | | | | 7,578,584 | |
| Non-Convertible Corporate Bonds and Notes | | | — | | | | 33,206,635 | | | | 17,900 | | | | 33,224,535 | |
| Convertible Corporate Bond and Note | | | — | | | | 48,268 | | | | — | | | | 48,268 | |
| Corporate Loans | | | — | | | | 12,239,465 | | | | — | | | | 12,239,465 | |
| Event-Linked Bonds | | | — | | | | 47,539,045 | | | | 181,625 | | | | 47,720,670 | |
| Short-Term Notes | | | — | | | | 92,962,916 | | | | — | | | | 92,962,916 | |
| Investment Companies | | | 23,343,250 | | | | 46,009 | | | | — | | | | 23,389,259 | |
| Exchange-Traded Options Purchased | | | 226,116 | | | | — | | | | — | | | | 226,116 | |
| Over-the-Counter Option Purchased | | | — | | | | 31,724 | | | | — | | | | 31,724 | |
| Over-the-Counter Interest Rate Swaptions Purchased | | | — | | | | 181,184 | | | | — | | | | 181,184 | |
| Total Investments, at Value | | | 178,307,012 | | | | 232,964,553 | | | | 206,110 | | | | 411,477,675 | |
| Other Financial Instruments: | | | | | | | | | | | | | | | | |
| Swaps, at value | | | — | | | | 150,838 | | | | — | | | | 150,838 | |
| Centrally cleared swaps, at value | | | — | | | | 622,396 | | | | — | | | | 622,396 | |
| Futures contracts | | | 1,208,264 | | | | — | | | | — | | | | 1,208,264 | |
| Forward currency exchange contracts | | | — | | | | 1,808,360 | | | | — | | | | 1,808,360 | |
| Total Assets | | $ | 179,515,276 | | | $ | 235,546,147 | | | $ | 206,110 | | | $ | 415,267,533 | |
| | | | |
| Liabilities Table | | | | | | | | | | | | | | | | |
| Other Financial Instruments: | | | | | | | | | | | | | | | | |
| Common Stock Securities Sold Short | | $ | (35,292,582 | ) | | $ | (6,175,889 | ) | | $ | — | | | $ | (41,468,471 | ) |
| Other Financial Instruments: | | | | | | | | | | | | | | | | |
| Swaps, at value | | | — | | | | (1,012,659 | ) | | | — | | | | (1,012,659 | ) |
| Centrally cleared swaps, at value | | | — | | | | (2,571,186 | ) | | | — | | | | (2,571,186 | ) |
| Futures contracts | | | (514,076 | ) | | | — | | | | — | | | | (514,076 | ) |
| Forward currency exchange contracts | | | — | | | | (2,829,392 | ) | | | — | | | | (2,829,392 | ) |
| Total Liabilities | | $ | (35,806,658 | ) | | $ | (12,589,126 | ) | | $ | — | | | $ | (48,395,784 | ) |
Forward currency exchange contracts and futures contracts, if any, are reported at their unrealized appreciation/depreciation at measurement date, which represents the change in the contract’s value from trade date. All additional assets and liabilities included in the above table are reported at their market value at measurement date.
The table below shows the transfers between Level 1, Level 2 and Level 3. The Fund’s policy is to recognize transfers in and transfers out as of the beginning of the reporting period.
| | | | | | | | | | | | | | | | | | | | | | | | |
| | Transfers into Level 1 | | | Transfers out of Level 1 | | | Transfers into Level 2 | | | Transfers out of
Level 2 | | | Transfers into Level 3 | | | Transfers out of Level 3 | |
| Assets Table | | | | | | | | | | | | | | | | | | | | | | | | |
| Investments, at Value: | | | | | | | | | | | | | | | | | | | | | | | | |
| Asset-Backed Securities | | $ | – | | | $ | – | | | $ | 1,923,696 | * | | $ | – | | | $ | – | | | $ | (1,923,696 | )* |
| Preferred Stocks | | | – | | | | (482,758 | )** | | | 482,758 | ** | | | – | | | | – | | | | – | |
47 OPPENHEIMER GLOBAL MULTI-ALTERNATIVES FUND/VA
NOTES TO CONSOLIDATED FINANCIAL STATEMENTS Continued
3. Securities Valuation (Continued)
| | | | | | | | | | | | | | | | | | | | | | | | |
| Assets Table (Continued) | | | | | | | | | | | | | | | | | | | | | | | | |
| Rights, Warrants and Certificates | | $ | 1,665 | *** | | $ | (2 | )**** | | $ | – | | | $ | (1,665 | )*** | | $ | 2 | **** | | $ | – | |
| Total Assets | | $ | 1,665 | | | $ | (482,760 | ) | | $ | 2,406,454 | | | $ | (1,665 | ) | | $ | 2 | | | $ | (1,923,696 | ) |
* Transferred from Level 3 to Level 2 due to the availability of market data for this security.
** Transfers from Level 1 to Level 2 are a result of a change in pricing methodology to the use of a valuation determined based on observable market information other than quoted prices from an active market due to a lack of available unadjusted quoted prices.
*** Transfers from Level 2 to Level 1 are a result of the availability of quoted prices from an active market which were not available and have become available.
**** Transferred from Level 1 to Level 3 because of the lack of observable market data.
4. Investments and Risks
Risks of Foreign Investing. The Fund may invest in foreign securities which are subject to special risks. Securities traded in foreign markets may be less liquid and more volatile than those traded in U.S. markets. Foreign issuers are usually not subject to the same accounting and disclosure requirements that U.S. companies are subject to, which may make it difficult for the Fund to evaluate a foreign company’s operations or financial condition. A change in the value of a foreign currency against the U.S. dollar will result in a change in the U.S. dollar value of investments denominated in that foreign currency and in the value of any income or distributions the Fund may receive on those investments. The value of foreign investments may be affected by exchange control regulations, foreign taxes, higher transaction and other costs, delays in the settlement of transactions, changes in economic or monetary policy in the United States or abroad, expropriation or nationalization of a company’s assets, or other political and economic factors. In addition, due to the inter-relationship of global economies and financial markets, changes in political and economic factors in one country or region could adversely affect conditions in another country or region. Investments in foreign securities may also expose the Fund to time-zone arbitrage risk. Foreign securities may trade on weekends or other days when the Fund does not price its shares. At times, the Fund may emphasize investments in a particular country or region and may be subject to greater risks from adverse events that occur in that country or region. Foreign securities and foreign currencies held in foreign banks and securities depositories may be subject to limited or no regulatory oversight.
Investments in Affiliated Funds. The Fund is permitted to invest in other mutual funds advised by the Manager (“Affiliated Funds”). Affiliated Funds are open-end management investment companies registered under the 1940 Act, as amended. The Manager is the investment adviser of, and the Sub-Adviser provides investment and related advisory services to, the Affiliated Funds. When applicable, the Fund’s investments in Affiliated Funds are included in the Consolidated Statement of Investments. Shares of Affiliated Funds are valued at their net asset value per share. As a shareholder, the Fund is subject to its proportional share of the Affiliated Funds’ expenses, including their management fee. The Manager will waive fees and/or reimburse Fund expenses in an amount equal to the indirect management fees incurred through the Fund’s investment in the Affiliated Funds.
Each of the Affiliated Funds in which the Fund invests has its own investment risks, and those risks can affect the value of the Fund’s investments and therefore the value of the Fund’s shares. To the extent that the Fund invests more of its assets in one Affiliated Fund than in another, the Fund will have greater exposure to the risks of that Affiliated Fund.
Investments in Money Market Instruments. The Fund is permitted to invest its free cash balances in money market instruments to provide liquidity or for defensive purposes. The Fund may invest in money market instruments by investing in Class E shares of Oppenheimer Institutional Government Money Market Fund (“IGMMF”), which is an Affiliated Fund. IGMMF is regulated as a money market fund under the 1940 Act, as amended. The Fund may also invest in money market instruments directly or in other affiliated or unaffiliated money market funds.
Master Limited Partnerships (“MLPs”). MLPs issue common units that represent an equity ownership interest in a partnership and provide limited voting rights. MLP common units are registered with the Securities and Exchange Commission (“SEC”), and are freely tradable on securities exchanges such as the NYSE and the NASDAQ Stock Market (“NASDAQ”), or in the over-the-counter (“OTC”) market. An MLP consists of one or more general partners, who conduct the business, and one or more limited partners, who contribute capital. MLP common unit holders have a limited role in the partnership’s operations and management. The Fund, as a limited partner, normally would not be liable for the debts of the MLP beyond the amounts the Fund has contributed, but would not be shielded to the same extent that a shareholder of a corporation would be. In certain circumstances creditors of an MLP would have the right to seek return of capital distributed to a limited partner. This right of an MLP’s creditors would continue after the Fund sold its investment in the MLP.
Event-Linked Bonds. The Fund may invest in “event-linked” bonds. Event-linked bonds, which are sometimes referred to as “catastrophe” bonds, are fixed income securities for which the return of principal and payment of interest is contingent on the non-occurrence of a specific trigger event, such as a hurricane, earthquake, or other occurrence that leads to physical or economic loss. If the trigger event occurs prior to maturity, the Fund may lose all or a portion of its principal in addition to interest otherwise due from the security. Event-linked bonds may expose the Fund to certain other risks, including issuer default, adverse regulatory or jurisdictional interpretations, liquidity risk and adverse tax consequences. The Fund records the net change in market value of event-linked bonds on the Consolidated Statement of Operations as a change in unrealized appreciation or depreciation on investments. The Fund records a realized gain or loss on the Consolidated Statement of Operations upon the sale or maturity of such securities.
Loans. The Fund invests in loans made to U.S. and foreign borrowers that are corporations, partnerships or other business entities. The Fund will do
48 OPPENHEIMER GLOBAL MULTI-ALTERNATIVES FUND/VA
4. Investments and Risks (Continued)
so directly as an original lender or by assignment or indirectly through participation agreements or certain derivative instruments. While many of these loans will be collateralized, the Fund can also invest in uncollateralized loans. Loans are often issued in connection with recapitalizations, acquisitions, leveraged buyouts, and refinancing of borrowers. The loans often pay interest at rates that float above (or are adjusted periodically based on) a benchmark that reflects current interest rates although the Fund can also invest in loans with fixed interest rates.
When investing in loans, the Fund generally will have a contractual relationship only with the lender, not with the relevant borrower. As a result, the Fund generally will have the right to receive payments of principal, interest, and any fees to which it is entitled only from the lender selling the participation and only upon receipt by the lender of the payments from the relevant borrower. The Fund may not directly benefit from the collateral supporting the debt obligation in which it has purchased the participation. As a result, the Fund will assume the credit risk of both the borrower and the institution selling the participation to the Fund.
Securities on a When-Issued or Delayed Delivery Basis. The Fund may purchase securities on a “when-issued” basis, and may purchase or sell securities on a “delayed delivery” basis. “When-issued” or “delayed delivery” refers to securities whose terms and indenture are available and for which a market exists, but which are not available for immediate delivery. Delivery and payment for securities that have been purchased by the Fund on a when-issued basis normally takes place within six months and possibly as long as two years or more after the trade date. During this period, such securities do not earn interest, are subject to market fluctuation and may increase or decrease in value prior to their delivery. The purchase of securities on a when-issued basis may increase the volatility of the Fund’s net asset value to the extent the Fund executes such transactions while remaining substantially fully invested. When the Fund engages in when-issued or delayed delivery transactions, it relies on the buyer or seller, as the case may be, to complete the transaction. Their failure to do so may cause the Fund to lose the opportunity to obtain or dispose of the security at a price and yield it considers advantageous. The Fund may also sell securities that it purchased on a when-issued basis or forward commitment prior to settlement of the original purchase.
At period end, the Fund had purchased securities issued on a when-issued or delayed delivery basis and sold securities issued on a delayed delivery basis as follows:
| | | | |
| | | When-Issued or Delayed Delivery Basis Transactions | |
| Purchased securities | | | $6,016,863 | |
| Sold securities | | | 4,673,441 | |
Restricted Securities. At period end, investments in securities included issues that are restricted. A restricted security may have a contractual restriction on its resale and is valued under methods approved by the Board of Trustees as reflecting fair value. Securities that are restricted are marked with an applicable footnote on the Consolidated Statement of Investments. Restricted securities are reported on a schedule following the Consolidated Statement of Investments.
Equity Security Risk. Stocks and other equity securities fluctuate in price. The value of the Fund’s portfolio may be affected by changes in the equity markets generally. Equity markets may experience significant short-term volatility and may fall sharply at times. Different markets may behave differently from each other and U.S. equity markets may move in the opposite direction from one or more foreign stock markets. Adverse events in any part of the equity or fixed-income markets may have unexpected negative effects on other market segments.
The prices of individual equity securities generally do not all move in the same direction at the same time and a variety of factors can affect the price of a particular company’s securities. These factors may include, but are not limited to, poor earnings reports, a loss of customers, litigation against the company, general unfavorable performance of the company’s sector or industry, or changes in government regulations affecting the company or its industry.
Credit Risk. The Fund invests in high-yield, non-investment-grade bonds, which may be subject to a greater degree of credit risk. Credit risk relates to the ability of the issuer to meet interest or principal payments or both as they become due. The Fund may acquire securities that have missed an interest payment, and is not obligated to dispose of securities whose issuers or underlying obligors subsequently miss an interest and/or principal payment.
Information concerning securities not accruing interest at period end is as follows:
| | | | |
| Cost | | $ | 5,761 | |
| Market Value | | $ | 17,900 | |
| Market Value as % of Net Assets | | | Less than 0.005% | |
Sovereign Debt Risk. The Fund invests in sovereign debt securities, which are subject to certain special risks. These risks include, but are not limited to, the risk that a governmental entity may delay or refuse, or otherwise be unable, to pay interest or repay the principal on its sovereign debt. There may also be no legal process for collecting sovereign debt that a government does not pay or bankruptcy proceedings through which all or part of such sovereign debt may be collected. In addition, a restructuring or default of sovereign debt may also cause additional impacts to the financial markets, such as downgrades to credit ratings, reduced liquidity and increased volatility, among others.
49 OPPENHEIMER GLOBAL MULTI-ALTERNATIVES FUND/VA
NOTES TO CONSOLIDATED FINANCIAL STATEMENTS Continued
4. Investments and Risks (Continued)
Shareholder Concentration. At period end, one shareholder owned 20% or more of the Fund’s total outstanding shares.
The shareholder is a related party of the Fund. Related parties may include, but are not limited to, the investment manager and its affiliates, affiliated broker dealers, fund of funds, and directors or employees. The related party owned 96% of the Fund’s total outstanding shares at period end.
5. Market Risk Factors
The Fund’s investments in securities and/or financial derivatives may expose the Fund to various market risk factors:
Commodity Risk. Commodity risk relates to the change in value of commodities or commodity indexes as they relate to increases or decreases in the commodities market. Commodities are physical assets that have tangible properties. Examples of these types of assets are crude oil, heating oil, metals, livestock, and agricultural products.
Credit Risk. Credit risk relates to the ability of the issuer of debt to meet interest and principal payments, or both, as they come due. In general, lower-grade, higher-yield debt securities are subject to credit risk to a greater extent than lower-yield, higher-quality securities.
Equity Risk. Equity risk relates to the change in value of equity securities as they relate to increases or decreases in the general market.
Foreign Exchange Rate Risk. Foreign exchange rate risk relates to the change in the U.S. dollar value of a security held that is denominated in a foreign currency. The U.S. dollar value of a foreign currency denominated security will decrease as the dollar appreciates against the currency, while the U.S. dollar value will increase as the dollar depreciates against the currency.
Interest Rate Risk. Interest rate risk refers to the fluctuations in value of fixed-income securities resulting from the inverse relationship between price and yield. For example, an increase in general interest rates will tend to reduce the market value of already issued fixed-income investments, and a decline in general interest rates will tend to increase their value. In addition, debt securities with longer maturities, which tend to have higher yields, are subject to potentially greater fluctuations in value from changes in interest rates than obligations with shorter maturities.
Volatility Risk. Volatility risk refers to the magnitude of the movement, but not the direction of the movement, in a financial instrument’s price over a defined time period. Large increases or decreases in a financial instrument’s price over a relative time period typically indicate greater volatility risk, while small increases or decreases in its price typically indicate lower volatility risk.
6. Use of Derivatives
The Fund’s investment objective not only permits the Fund to purchase investment securities, it also allows the Fund to enter into various types of derivatives contracts, including, but not limited to, futures contracts, forward currency exchange contracts, credit default swaps, interest rate swaps, total return swaps, variance swaps and purchased and written options. In doing so, the Fund will employ strategies in differing combinations to permit it to increase, decrease, or change the level or types of exposure to market risk factors. These instruments may allow the Fund to pursue its objectives more quickly and efficiently than if it were to make direct purchases or sales of securities capable of effecting a similar response to market factors. Such contracts may be entered into through a bilateral over-the-counter (“OTC”) transaction, or through a securities or futures exchange and cleared through a clearinghouse.
Derivatives may have little or no initial cash investment relative to their market value exposure and therefore can produce significant gains or losses in excess of their cost due to changes in the market risk factors and the overall market. This use of embedded leverage allows the Fund to increase its market value exposure relative to its net assets and can substantially increase the volatility of the Fund’s performance. In instances where the Fund is using derivatives to decrease, or hedge, exposures to market risk factors for securities held by the Fund, there are also risks that those derivatives may not perform as expected resulting in losses for the combined or hedged positions. Some derivatives have the potential for unlimited loss, regardless of the size of the Fund’s initial investment.
Additional associated risks from investing in derivatives also exist and potentially could have significant effects on the valuation of the derivative and the Fund. Typically, the associated risks are not the risks that the Fund is attempting to increase or decrease exposure to, per its investment objectives, but are the additional risks from investing in derivatives. Examples of these associated risks are liquidity risk, which is the risk that the Fund will not be able to sell the derivative in the open market in a timely manner, and counterparty credit risk, which is the risk that the counterparty will not fulfill its obligation to the Fund.
The Fund’s actual exposures to these market risk factors and associated risks during the period are discussed in further detail, by derivative type, below.
Forward Currency Exchange Contracts
The Fund may enter into forward currency exchange contracts (“forward contracts”) for the purchase or sale of a foreign currency at a negotiated rate at a future date. Such contracts are traded in the OTC inter-bank currency dealer market.
Forward contracts are reported on a schedule following the Consolidated Statement of Investments. The unrealized appreciation (depreciation) is reported in the Consolidated Statement of Assets and Liabilities as a receivable (or payable) and in the Consolidated Statement of Operations within the change in unrealized appreciation (depreciation). At contract close, the difference between the original cost of the contract and the value at the close date is recorded as a realized gain (loss) in the Consolidated Statement of Operations.
The Fund may enter into forward foreign currency exchange contracts in order to decrease exposure to foreign exchange rate risk associated with either specific transactions or portfolio instruments or to increase exposure to foreign exchange rate risk.
During the reporting period, the Fund had daily average contract amounts on forward contracts to buy and sell of $133,949,196 and $205,194,968, respectively.
50 OPPENHEIMER GLOBAL MULTI-ALTERNATIVES FUND/VA
6. Use of Derivatives (Continued)
Additional associated risk to the Fund includes counterparty credit risk. Counterparty credit risk arises from the possibility that the counterparty to a forward contract will default and fail to perform its obligations to the Fund.
Futures Contracts
A futures contract is a commitment to buy or sell a specific amount of a commodity, financial instrument or currency at a negotiated price on a stipulated future date. The Fund may buy and sell futures contracts and may also buy or write put or call options on these futures contracts. Futures contracts and options thereon are generally entered into on a regulated futures exchange and cleared through a clearinghouse associated with the exchange.
Upon entering into a futures contract, the Fund is required to deposit either cash or securities (initial margin) in an amount equal to a certain percentage of the contract value in an account registered in the futures commission merchant’s name. Subsequent payments (variation margin) are paid to or from the futures commission merchant each day equal to the daily changes in the contract value. Such payments are recorded as unrealized gains and losses. Should the Fund fail to make requested variation margin payments, the futures commission merchant can gain access to the initial margin to satisfy the Fund’s payment obligations.
Futures contracts are reported on a schedule following the Consolidated Statement of Investments. Securities held by a futures commission merchant to cover initial margin requirements on open futures contracts are noted in the Consolidated Statement of Investments. Cash held by a futures commission merchant to cover initial margin requirements on open futures contracts and the receivable and/or payable for the daily mark to market for the variation margin are noted in the Consolidated Statement of Assets and Liabilities. The net change in unrealized appreciation and depreciation is reported in the Consolidated Statement of Operations. Realized gains (losses) are reported in the Consolidated Statement of Operations at the closing or expiration of futures contracts.
The Fund may purchase and/or sell financial futures contracts and options on futures contracts to gain exposure to, or decrease exposure to interest rate risk, equity risk, foreign exchange rate risk, volatility risk, or commodity risk.
During the reporting period, the Fund had an ending monthly average market value of $59,230,511 and $92,698,031 on futures contracts purchased and sold, respectively.
Additional associated risks of entering into futures contracts (and related options) include the possibility that there may be an illiquid market where the Fund is unable to liquidate the contract or enter into an offsetting position and, if used for hedging purposes, the risk that the price of the contract will correlate imperfectly with the prices of the Fund’s securities.
Option Activity
The Fund may buy and sell put and call options, or write put and call options. When an option is written, the Fund receives a premium and becomes obligated to sell or purchase the underlying security, currency or other underlying financial instrument at a fixed price, upon exercise of the option.
Options can be traded through an exchange or through a privately negotiated arrangement with a dealer in an OTC transaction. Options traded through an exchange are generally cleared through a clearinghouse (such as The Options Clearing Corporation). The difference between the premium received or paid, and market value of the option, is recorded as unrealized appreciation or depreciation. The net change in unrealized appreciation or depreciation is reported in the Consolidated Statement of Operations. When an option is exercised, the cost of the security purchased or the proceeds of the security sale are adjusted by the amount of premium received or paid. Upon the expiration or closing of the option transaction, a gain or loss is reported in the Consolidated Statement of Operations.
Foreign Currency Options. The Fund may purchase or write call and put options on currencies to increase or decrease exposure to foreign exchange rate risk. A purchased call, or written put option becomes more valuable as the price of the underlying financial instrument appreciates relative to the strike price. A purchased put, or written call option becomes more valuable as the price of the underlying financial instrument depreciates relative to the strike price.
Index/Security Options. The Fund may purchase or write call and put options on individual equity securities and/or equity indexes to increase or decrease exposure to equity risk. A purchased call or written put option becomes more valuable as the price of the underlying financial instrument appreciates relative to the strike price. A purchased put or written call option becomes more valuable as the price of the underlying financial instrument depreciates relative to the strike price.
During the reporting period, the Fund had an ending monthly average market value of $159,378 and $478,567 on purchased call options and purchased put options, respectively.
Options written, if any, are reported in a schedule following the Consolidated Statement of Investments and as a liability in the Consolidated Statement of Assets and Liabilities. Securities held in collateral accounts to cover potential obligations with respect to outstanding written options are noted in the Consolidated Statement of Investments.
The risk in writing a call option is the market price of the underlying security increasing above the strike price and the option being exercised. The Fund must then purchase the underlying security at the higher market price and deliver it for the strike price or, if it owns the underlying security, deliver it at the strike price and forego any benefit from the increase in the price of the underlying security above the strike price. The risk in writing a put option is the market price of the underlying security decreasing below the strike price and the option being exercised. The Fund must then purchase the underlying security at the strike price when the market price of the underlying security is below the strike price. Alternatively, the Fund could also close out a written option position, in which case the risk is that the closing transaction will require a premium to be paid by the Fund that is greater than the premium the Fund received. When writing options, the Fund has the additional risk that there may be an illiquid market where the Fund is unable to close the contact. The risk in buying an option is that the Fund pays a premium for the option, and the option may be worth less than the premium paid or expire worthless.
51 OPPENHEIMER GLOBAL MULTI-ALTERNATIVES FUND/VA
NOTES TO CONSOLIDATED FINANCIAL STATEMENTS Continued
6. Use of Derivatives (Continued)
During the reporting period, the Fund had an ending monthly average market value of $549,192 and $228,127 on written call options and written put options, respectively.
Additional associated risks to the Fund include counterparty credit risk and liquidity risk.
At period end, the Fund had no written options outstanding.
Swap Contracts
The Fund may enter into swap contract agreements with a counterparty to exchange a series of cash flows based on either specified reference rates, the price or volatility of asset or non-asset references, or the occurrence of a credit event, over a specified period. Swaps can be executed in a bi-lateral privately negotiated arrangement with a dealer in an OTC transaction (“OTC swaps”) or executed on a regulated market. Certain swaps, regardless of the venue of their execution, are required to be cleared through a clearinghouse (“centrally cleared swaps”). Swap contracts may include interest rate, equity, debt, index, total return, credit default, currency, and volatility swaps.
Swap contracts are reported on a schedule following the Consolidated Statement of Investments. The values of centrally cleared swap and OTC swap contracts are aggregated by positive and negative values and disclosed separately on the Consolidated Statement of Assets and Liabilities. The unrealized appreciation (depreciation) related to the change in the valuation of the notional amount of the swap is combined with the accrued interest due to (owed by) the Fund, if any, at termination or settlement. The net change in this amount during the period is included on the Consolidated Statement of Operations. The Fund also records any periodic payments received from (paid to) the counterparty, including at termination, under such contracts as realized gain (loss) on the Consolidated Statement of Operations.
Swap contract agreements are exposed to the market risk factor of the specific underlying reference rate or asset. Swap contracts are typically more attractively priced compared to similar investments in related cash securities because they isolate the risk to one market risk factor and eliminate the other market risk factors. Investments in cash securities (for instance bonds) have exposure to multiple risk factors (credit and interest rate risk). Because swaps have embedded leverage, they can expose the Fund to substantial risk in the isolated market risk factor.
Credit Default Swap Contracts. A credit default swap is a contract that enables an investor to buy or sell protection against a defined-issuer credit event, such as the issuer’s failure to make timely payments of interest or principal on a debt security, bankruptcy or restructuring. The Fund may enter into credit default swaps either by buying or selling protection on a corporate issuer, sovereign issuer, or a basket or index of issuers (the “reference asset”).
The buyer of protection pays a periodic fee to the seller of protection based on the notional amount of the swap contract. The seller of protection agrees to compensate the buyer of protection for future potential losses as a result of a credit event on the reference asset. The contract effectively transfers the credit event risk of the reference asset from the buyer of protection to the seller of protection.
The ongoing value of the contract will fluctuate throughout the term of the contract based primarily on the credit risk of the reference asset. If the credit quality of the reference asset improves relative to the credit quality at contract initiation, the buyer of protection may have an unrealized loss greater than the anticipated periodic fee owed. This unrealized loss would be the result of current credit protection being cheaper than the cost of credit protection at contract initiation. If the buyer elects to terminate the contract prior to its maturity, and there has been no credit event, this unrealized loss will become realized. If the contract is held to maturity, and there has been no credit event, the realized loss will be equal to the periodic fee paid over the life of the contract.
If there is a credit event, the buyer of protection can exercise its rights under the contract and receive a payment from the seller of protection equal to the notional amount of the swap less the market value of specified debt securities issued by the reference asset. Upon exercise of the contract the difference between such value and the notional amount is recorded as realized gain (loss) and is included on the Consolidated Statement of Operations.
The Fund may purchase or sell credit protection through credit default swaps to increase or decrease exposure to the credit risk of individual issuers and/or indexes of issuers that are either unavailable or considered to be less attractive in the bond market.
The Fund has engaged in spread curve trades by simultaneously purchasing and selling protection through credit default swaps referenced to the same reference asset but with different maturities. Spread curve trades attempt to gain exposure to credit risk on a forward basis by realizing gains on the expected differences in spreads.
For the reporting period, the Fund had ending monthly average notional amounts of $39,367,277 and $7,300,606 on credit default swaps to buy protection and credit default swaps to sell protection, respectively.
Additional associated risks to the Fund include counterparty credit risk and liquidity risk.
Interest Rate Swap Contracts. An interest rate swap is an agreement between counterparties to exchange periodic payments based on interest rates. One cash flow stream will typically be a floating rate payment based upon a specified floating interest rate while the other is typically a fixed interest rate.
The Fund may enter into interest rate swaps in which it pays the fixed or floating interest rate in order to increase or decrease exposure to interest rate risk. Typically, if relative interest rates rise, floating payments under a swap agreement will be greater than the fixed payments.
For the reporting period, the Fund had ending monthly average notional amounts of $20,497,509 and $20,540,780 on interest rate swaps which pay a fixed rate and interest rate swaps which receive a fixed rate, respectively.
Additional associated risks to the Fund include counterparty credit risk and liquidity risk.
Total Return Swap Contracts. A total return swap is an agreement between counterparties to exchange periodic payments based on the value of asset or non-asset references. One cash flow is typically based on a non-asset reference (such as an interest rate) and the other on the total return of a reference asset (such as a security or a basket of securities or securities index). The total return of the reference asset typically includes appreciation
52 OPPENHEIMER GLOBAL MULTI-ALTERNATIVES FUND/VA
6. Use of Derivatives (Continued)
or depreciation on the reference asset, plus any interest or dividend payments.
Total return swap contracts are exposed to the market risk factor of the specific underlying financial instrument or index. Total return swaps are less standard in structure than other types of swaps and can isolate and/or include multiple types of market risk factors including equity risk, credit risk, and interest rate risk.
The Fund may enter into total return swaps on various equity securities or indexes to increase or decrease exposure to equity risk. These equity risk related total return swaps require the Fund to pay or receive a floating reference interest rate, and an amount equal to the opposite price movement of securities or an index (expressed as a percentage) multiplied by the notional amount of the contract. Equity leg payments equal to the positive price movement of the same securities or index (expressed as a percentage) multiplied by the notional amount of the contract and, in some cases, dividends paid on the securities. Reference leg payments equal a floating reference interest rate and an amount equal to the negative price movement of the same securities or index (expressed as a percentage) multiplied by the notional amount of the contract.
The Fund may enter into total return swaps to increase or decrease exposure to the credit risk of various indexes or basket of securities. These credit risk related total return swaps require the Fund to pay to, or receive payments from, the counterparty based on the movement of credit spreads of the related indexes or securities.
For the reporting period, the Fund had ending monthly average notional amounts of $83,222,985 and $14,004,365 on total return swaps which are long the reference asset and total return swaps which are short the reference asset, respectively.
Additional associated risks to the Fund include counterparty credit risk and liquidity risk.
Volatility Swap Contracts. A volatility swap is an agreement between counterparties to exchange periodic payments based on the measured volatility of a reference security, index, currency or other reference investment over a specified time frame. One cash flow is typically based on the realized volatility of the reference investment as measured by changes in its price or level over the specified time period while the other cash flow is based on a specified rate representing expected volatility for the reference investment at the time the swap is executed, or the measured volatility of a different reference investment over the specified time period. The appreciation or depreciation on a volatility swap will typically depend on the magnitude of the reference investment’s volatility, or size of the movements in its price, over the specified time period, rather than general directional increases or decreases in its price.
Volatility swaps are less standard in structure than other types of swaps and provide pure, or isolated, exposure to volatility risk of the specific underlying reference investment. Volatility swaps are typically used to speculate on future volatility levels, to trade the spread between realized and expected volatility, or to decrease the volatility exposure of investments held by the Fund.
The Fund may enter into volatility/variance swaps to increase or decrease exposure to the volatility risk of various reference investments. These types of volatility swaps require the Fund to either pay the measured volatility, or price variance or the fixed rate payment then receive a fixed rate payment or the measured volatility or price variance. If the measured volatility of the related reference investment increases over the period, the measured volatility payment will depreciate in value. Conversely, if the measured volatility of the related reference investment decreases over the period, the fixed rate swap payment will appreciate in value.
For the reporting period, the Fund had ending monthly average notional amounts of $67,608 and $37,924 on volatility swaps which pay measured volatility/variance and volatility swaps which receive measured volatility/variance, respectively.
Additional associated risks to the Fund include counterparty credit risk and liquidity risk.
Swaption Transactions
The Fund may enter into a swaption contract which grants the purchaser the right, but not the obligation, to enter into a swap transaction at preset terms detailed in the underlying agreement within a specified period of time. The purchaser pays a premium to the swaption writer who bears the risk of unfavorable changes in the preset terms on the underlying swap.
Purchased swaptions are reported as a component of investments in the Consolidated Statement of Investments and the Consolidated Statement of Assets and Liabilities. Written swaptions are reported on a schedule following the Consolidated Statement of Investments and their value is reported as a separate asset or liability line item in the Consolidated Statement of Assets and Liabilities. The net change in unrealized appreciation or depreciation on written swaptions is separately reported in the Consolidated Statement of Operations. When a swaption is exercised, the cost of the swap is adjusted by the amount of premium paid or received. Upon the expiration or closing of an unexercised swaption contract, a gain or loss is reported in the Consolidated Statement of Operations for the amount of the premium paid or received.
The Fund generally will incur a greater risk when it writes a swaption than when it purchases a swaption. When the Fund writes a swaption it will become obligated, upon exercise of the swaption, according to the terms of the underlying agreement. Swaption contracts written by the Fund do not give rise to counterparty credit risk prior to exercise as they obligate the Fund, not its counterparty, to perform. When the Fund purchases a swaption it only risks losing the amount of the premium it paid if the swaption expires unexercised. However, when the Fund exercises a purchased swaption there is a risk that the counterparty will fail to perform or otherwise default on its obligations under the swaption contract.
The Fund may purchase swaptions which give it the option to enter into an interest rate swap in which it pays a floating or fixed interest rate and receives a fixed or floating interest rate in order to increase or decrease exposure to interest rate risk. Purchasing the fixed portion of this swaption becomes more valuable as the reference interest rate decreases relative to the preset interest rate. Purchasing the floating portion of this swaption becomes more valuable as the reference interest rate increases relative to the preset interest rate.
During the reporting period, the Fund had an ending monthly average market value of $268,782 on purchased swaptions.
At period end, the Fund had no written swaption contracts outstanding.
53 OPPENHEIMER GLOBAL MULTI-ALTERNATIVES FUND/VA
NOTES TO CONSOLIDATED FINANCIAL STATEMENTS Continued
6. Use of Derivatives (Continued)
Counterparty Credit Risk. Derivative positions are subject to the risk that the counterparty will not fulfill its obligation to the Fund. The Fund intends to enter into derivative transactions with counterparties that the Manager believes to be creditworthy at the time of the transaction.
The Fund’s risk of loss from counterparty credit risk on OTC derivatives is generally limited to the aggregate unrealized gain netted against any collateral held by the Fund. For OTC options purchased, the Fund bears the risk of loss of the amount of the premiums paid plus the positive change in market values net of any collateral held by the Fund should the counterparty fail to perform under the contracts. Options written by the Fund do not typically give rise to counterparty credit risk, as options written generally obligate the Fund and not the counterparty to perform.
To reduce counterparty risk with respect to OTC transactions, the Fund has entered into master netting arrangements, established within the Fund’s International Swap and Derivatives Association, Inc. (“ISDA”) master agreements, which allow the Fund to make (or to have an entitlement to receive) a single net payment in the event of default (close-out netting) for outstanding payables and receivables with respect to certain OTC positions in swaps, options, swaptions, and forward currency exchange contracts for each individual counterparty. In addition, the Fund may require that certain counterparties post cash and/or securities in collateral accounts to cover their net payment obligations for those derivative contracts subject to ISDA master agreements. If the counterparty fails to perform under these contracts and agreements, the cash and/or securities will be made available to the Fund.
At period end, the Fund has required certain counterparties to post collateral of $919,218.
ISDA master agreements include credit related contingent features which allow counterparties to OTC derivatives to terminate derivative contracts prior to maturity in the event that, for example, the Fund’s net assets decline by a stated percentage or the Fund fails to meet the terms of its ISDA master agreements, which would cause the Fund to accelerate payment of any net liability owed to the counterparty.
For financial reporting purposes, the Fund does not offset derivative assets and derivative liabilities that are subject to netting arrangements in the Consolidated Statement of Assets and Liabilities. Bankruptcy or insolvency laws of a particular jurisdiction may impose restrictions on or prohibitions against the right of offset in bankruptcy, insolvency or other events.
The Fund’s risk of loss from counterparty credit risk on exchange-traded derivatives cleared through a clearinghouse and for centrally cleared swaps is generally considered lower than as compared to OTC derivatives. However, counterparty credit risk exists with respect to initial and variation margin deposited/paid by the Fund that is held in futures commission merchant, broker and/or clearinghouse accounts for such exchange-traded derivatives and for centrally cleared swaps.
With respect to centrally cleared swaps, such transactions will be submitted for clearing, and if cleared, will be held in accounts at futures commission merchants or brokers that are members of clearinghouses. While brokers, futures commission merchants and clearinghouses are required to segregate customer margin from their own assets, in the event that a broker, futures commission merchant or clearinghouse becomes insolvent or goes into bankruptcy and at that time there is a shortfall in the aggregate amount of margin held by the broker, futures commission merchant or clearinghouse for all its customers, U.S. bankruptcy laws will typically allocate that shortfall on a pro-rata basis across all the broker’s, futures commission merchant’s or clearinghouse’s customers, potentially resulting in losses to the Fund.
There is the risk that a broker, futures commission merchant or clearinghouse will decline to clear a transaction on the Fund’s behalf, and the Fund may be required to pay a termination fee to the executing broker with whom the Fund initially enters into the transaction. Clearinghouses may also be permitted to terminate centrally cleared swaps at any time. The Fund is also subject to the risk that the broker or futures commission merchant will improperly use the Fund’s assets deposited/paid as initial or variation margin to satisfy payment obligations of another customer. In the event of a default by another customer of the broker or futures commission merchant, the Fund might not receive its variation margin payments from the clearinghouse, due to the manner in which variation margin payments are aggregated for all customers of the broker/futures commission merchant.
Collateral and margin requirements differ by type of derivative. Margin requirements are established by the broker, futures commission merchant or clearinghouse for exchange-traded and cleared derivatives, including centrally cleared swaps. Brokers, futures commission merchants and clearinghouses can ask for margin in excess of the regulatory minimum, or increase the margin amount, in certain circumstances.
Collateral terms are contract specific for OTC derivatives. For derivatives traded under an ISDA master agreement, the collateral requirements are typically calculated by netting the mark to market amount for each transaction under such agreement and comparing that amount to the value of any collateral currently pledged by the Fund or the counterparty.
For financial reporting purposes, cash collateral that has been pledged to cover obligations of the Fund, if any, is reported separately on the Consolidated Statement of Assets and Liabilities as cash pledged as collateral. Non-cash collateral pledged by the Fund, if any, is noted in the Consolidated Statement of Investments. Generally, the amount of collateral due from or to a party must exceed a minimum transfer amount threshold (e.g. $250,000) before a transfer has to be made. To the extent amounts due to the Fund from its counterparties are not fully collateralized, contractually or otherwise, the Fund bears the risk of loss from counterparty nonperformance.
The following table presents by counterparty the Fund’s OTC derivative assets net of the related collateral pledged by the Fund at period end:
| | | | | | | | | | | | | | | | | | | | |
| | | | | | Gross Amounts Not Offset in the Consolidated Statement of Assets & Liabilities | | | | |
| Counterparty | | Gross Amounts Not Offset
in the Consolidated
Statement of Assets &
Liabilities* | | | Financial Instruments
Available for Offset | | | Financial Instruments
Collateral Received** | | | Cash Collateral
Received** | | | Net Amount | |
| Bank of America NA | | $ | 189,045 | | | $ | (189,045 | ) | | $ | – | | | $ | – | | | $ | – | |
| Barclays Bank plc | | | 502,880 | | | | (230,090 | ) | | | (272,790) | | | | – | | | | – | |
| Citibank NA | | | 264,379 | | | | (264,379 | ) | | | – | | | | – | | | | – | |
54 OPPENHEIMER GLOBAL MULTI-ALTERNATIVES FUND/VA
6. Use of Derivatives (Continued)
| | | | | | | | | | | | | | | | | | | | |
| | | | | Gross Amounts Not Offset in the Consolidated Statement of Assets & Liabilities | | |
| Counterparty | | Gross Amounts Not Offset
in the Consolidated
Statement of Assets &
Liabilities* | | Financial Instruments
Available for Offset | | Financial Instruments
Collateral Received** | | Cash Collateral
Received** | | Net Amount |
| Deutsche Bank AG | | $ | 218,875 | | | $ | (211,583) | | | $ | – | | | $ | (7,292) | | | $ | – | |
| Goldman Sachs Bank USA | | | 212,387 | | | | (74,515) | | | | – | | | | (137,872) | | | | – | |
| Goldman Sachs International | | | 145,337 | | | | (145,337) | | | | – | | | | – | | | | – | |
| HSBC Bank USA NA | | | 170,994 | | | | (170,994) | | | | – | | | | – | | | | – | |
| JPMorgan Chase Bank NA | | | 439,222 | | | | (439,222) | | | | – | | | | – | | | | – | |
| Toronto Dominion Bank | | | 28,987 | | | | (28,987) | | | | – | | | | – | | | | – | |
| | $ | 2,172,106 | | | $ | (1,754,152) | | | $ | (272,790) | | | $ | (145,164) | | | $ | – | |
| | | | | | | | | | | | | | | | | | | | |
*OTC derivatives are reported gross on the Consolidated Statement of Assets and Liabilities. Exchange traded options and margin related to centrally cleared swaps and futures are excluded from these reported amounts.
**Reported collateral posted for the benefit of the Fund within this table is limited to the net outstanding amount due from an individual counterparty. The collateral posted for the benefit of the Fund may exceed these amounts.
The following table presents by counterparty the Fund’s OTC derivative liabilities net of the related collateral pledged by the Fund at period end:
| | | | | | | | | | | | | | | | | | | | |
| | | | | Gross Amounts Not Offset in the Consolidated Statement of Assets &
Liabilities | | |
| Counterparty | | Gross Amounts Not Offset
in the Consolidated
Statement of Assets &
Liabilities* | | Financial Instruments
Available for Offset | | Financial Instruments
Collateral Pledged** | | Cash Collateral Pledged** | | Net Amount |
| Bank of America NA | | $ | (733,071) | | | $ | 189,045 | | | $ | 544,026 | | | $ | – | | | $ | – | |
| Barclays Bank plc | | | (230,090) | | | | 230,090 | | | | – | | | | – | | | | – | |
| BNP Paribas | | | (49,195) | | | | – | | | | – | | | | 11,000 | | | | (38,195) | |
| Citibank NA | | | (353,974) | | | | 264,379 | | | | – | | | | – | | | | (89,595) | |
| Deutsche Bank AG | | | (211,583) | | | | 211,583 | | | | – | | | | – | | | | – | |
| Goldman Sachs Bank USA | | | (74,515) | | | | 74,515 | | | | – | | | | – | | | | – | |
| Goldman Sachs International | | | (632,839) | | | | 145,337 | | | | 311,363 | | | | 176,139 | | | | – | |
| HSBC Bank USA, NA | | | (335,173) | | | | 170,994 | | | | – | | | | – | | | | (164,179) | |
| JPMorgan Chase Bank NA | | | (993,650) | | | | 439,222 | | | | 287,412 | | | | – | | | | (267,016) | |
| Morgan Stanley | | | (33,386) | | | | – | | | | – | | | | – | | | | (33,386) | |
| Toronto Dominion Bank | | | (194,575) | | | | 28,987 | | | | – | | | | – | | | | (165,588) | |
| | $ | (3,842,051) | | | $ | 1,754,152 | | | $ | 1,142,801 | | | $ | 187,139 | | | $ | (757,959) | |
| | | | | | | | | | | | | | | | | | | | |
*OTC derivatives are reported gross on the Consolidated Statement of Assets and Liabilities. Exchange traded options and margin related to centrally cleared swaps and futures are excluded from these reported amounts.
**Reported collateral pledged within this table is limited to the net outstanding amount due from the Fund. The securities pledged as collateral by the Fund as reported on the Consolidated Statements of Investments may exceed these amounts.
The following table presents the valuations of derivative instruments by risk exposure as reported within the Consolidated Statement of Assets and Liabilities at period end:
| | | | | | | | | | | | |
| | | Asset Derivatives | | | Liability Derivatives | |
Derivatives Not Accounted for as Hedging Instruments | | Consolidated
Statement of Assets
and Liabilities Location | | Value | | | Consolidated
Statement of Assets
and Liabilities Location | | Value | |
| Credit contracts | | | | | | | | Swaps, at value | | $ | 389,558 | |
| Equity contracts | | Swaps, at value | | $ | 134,530 | | | Swaps, at value | | | 526,425 | |
| Volatility contracts | | Swaps, at value | | | 16,308 | | | Swaps, at value | | | 96,676 | |
| Credit contracts | | Centrally cleared swaps, at value | | | 280,554 | | | Centrally cleared swaps, at value | | | 2,086,141 | |
| Interest rate contracts | | Centrally cleared swaps, at value | | | 341,842 | | | Centrally cleared swaps, at value | | | 485,045 | |
| Commodity contracts | | Variation margin receivable | | | 26,004 | * | | Variation margin payable | | | 63,352 | * |
| Equity contracts | | Variation margin receivable | | | 274,718 | * | | Variation margin payable | | | 202,919 | * |
| Interest rate contracts | | Variation margin receivable | | | 45,999 | * | | Variation margin payable | | | 21,135 | * |
| Volatility contracts | | | | | | | | Variation margin payable | | | 25,500 | * |
| Forward currency exchange contracts | | Unrealized appreciation on forward currency exchange contracts | | | 1,808,360 | | | Unrealized depreciation on forward currency exchange contracts | | | 2,829,392 | |
| Equity contracts | | Investments, at value | | | 226,116 | ** | | | | | | |
| Forward currency exchange contracts | | Investments, at value | | | 31,724 | ** | | | | | | |
55 OPPENHEIMER GLOBAL MULTI-ALTERNATIVES FUND/VA
NOTES TO CONSOLIDATED FINANCIAL STATEMENTS Continued
6. Use of Derivatives (Continued)
| | | | | | | | | | | | |
| | | Asset Derivatives | | | Liability Derivatives | |
Derivatives Not Accounted for as Hedging Instruments | | Consolidated
Statement of Assets
and Liabilities Location | | Value | | | Consolidated
Statement of Assets
and Liabilities Location | | Value | |
| Interest rate contracts Investments, at value | | $ | 181,184** | | | | | | | |
| | | | | | | | | | | | |
| Total | | | | $ | 3,367,339 | | | | | $ | 6,726,143 | |
| | | | | | | | | | | | |
*Includes only the current day’s variation margin. Prior variation margin movements have been reflected in cash on the Consolidated Statement of Assets and Liabilities upon receipt or payment.
**Amounts relate to purchased option contracts and purchased swaption contracts, if any.
The effect of derivative instruments on the Consolidated Statement of Operations is as follows:
| | | | | | | | | | | | | | | | | | | | | | |
| Amount of Realized Gain or (Loss) Recognized on Derivatives |
Derivatives Not Accounted for as Hedging Instruments | | Investment transactions in unaffiliated companies* | | | Option �� contracts written | | | Futures contracts | | | Forward currency exchange contracts | | | Swap contracts | | | Total |
| Commodity contracts | | $ | — | | | $ | — | | | $ | 415,415 | | | $ | — | | | $ | — | | | $ 415,415 |
| Credit contracts | | | — | | | | — | | | | — | | | | — | | | | (2,248,678 | ) | | (2,248,678) |
| Equity contracts | | | 795,789 | | | | — | | | | (1,263,488 | ) | | | — | | | | 401,289 | | | (66,410) |
| Forward currency exchange contracts | | | (1,999,882 | ) | | | 2,006,900 | | | | — | | | | (4,191,909 | ) | | | — | | | (4,184,891) |
| Interest rate contracts | | | (7,865 | ) | | | — | | | | (2,313,062 | ) | | | — | | | | 847,134 | | | (1,473,793) |
| Volatility contracts | | | — | | | | — | | | | 3,761 | | | | — | | | | (182,625 | ) | | (178,864) |
| Total | | $ | (1,211,958 | ) | | $ | 2,006,900 | | | $ | (3,157,374 | ) | | $ | (4,191,909 | ) | | $ | (1,182,880 | ) | | $ (7,737,221) |
| | | | | | | | | | | | | | | | | | | | | | |
*Includes purchased option contracts and purchased swaption contracts, if any.
| | | | | | | | | | | | | | | | | | | | | | |
| Amount of Change in Unrealized Gain or (Loss) Recognized on Derivatives |
Derivatives Not Accounted for as Hedging Instruments | | Investment transactions in unaffiliated companies* | | | Option contracts written | | | Futures contracts | | | Forward currency exchange contracts | | | Swap contracts | | | Total |
| Commodity contracts | | $ | — | | | $ | — | | | $ | 193,284 | | | $ | — | | | $ | — | | | $ 193,284 |
| Credit contracts | | | — | | | | — | | | | — | | | | — | | | | 1,014,652 | | | 1,014,652 |
| Equity contracts | | | 27,721 | | | | — | | | | 767,197 | | | | — | | | | (1,956,173 | ) | | (1,161,255) |
| Forward currency exchange contracts | | | (452,357 | ) | | | (44,280 | ) | | | — | | | | (4,306,116 | ) | | | — | | | (4,802,753) |
| Interest rate contracts | | | (213,016 | ) | | | — | | | | 36,656 | | | | — | | | | (552,683 | ) | | (729,043) |
| Volatility contracts | | | — | | | | — | | | | (30,288 | ) | | | — | | | | (26,635 | ) | | (56,923) |
| Total | | $ | (637,652 | ) | | $ | (44,280 | ) | | $ | 966,849 | | | $ | (4,306,116 | ) | | $ | (1,520,839 | ) | | $ (5,542,038) |
| | | | | | | | | | | | | | | | | | | | | | |
*Includes purchased option contracts and purchased swaption contracts, if any.
7. Shares of Beneficial Interest
The Fund has authorized an unlimited number of $0.001 par value shares of beneficial interest of each class. Transactions in shares of beneficial interest were as follows:
| | | | | | | | | | | | | | | | |
| | | Year Ended December 31, 2017 | | | Year Ended December 31, 2016 | |
| | | Shares | | | Amount | | | Shares | | | Amount | |
| Non-Service Shares | | | | | | | | | | | | | | | | |
| Sold | | | 1,734,875 | | | $ | 17,157,352 | | | | 133,545 | | | $ | 1,338,377 | |
| Dividends and/or distributions reinvested | | | 397,645 | | | | 3,921,732 | | | | 560,049 | | | | 5,544,486 | |
| Redeemed | | | (380,193 | ) | | | (3,771,458 | ) | | | (2,232,493 | ) | | | (22,255,753 | ) |
| Net increase (decrease) | | | 1,752,327 | | | $ | 17,307,626 | | | | (1,538,899 | ) | | $ | (15,372,890 | ) |
| | | | | | | | | | | | | | | | |
| | | | | | | | | | | | | | | | | |
| Service Shares | | | | | | | | | | | | | | | | |
| Sold | | | 151,036 | | | $ | 1,490,635 | | | | 103,428 | | | $ | 1,019,688 | |
| Dividends and/or distributions reinvested | | | 2,437 | | | | 24,086 | | | | 2,972 | | | | 29,364 | |
| Redeemed | | | (58,070 | ) | | | (574,600 | ) | | | (39,783 | ) | | | (391,520 | ) |
| Net increase | | | 95,403 | | | $ | 940,121 | | | | 66,617 | | | $ | 657,532 | |
| | | | | | | | | | | | | | | | |
8. Purchases and Sales of Securities
The aggregate cost of purchases and proceeds from sales of securities, other than short-term obligations and investments in IGMMF, for the reporting period were as follows:
56 OPPENHEIMER GLOBAL MULTI-ALTERNATIVES FUND/VA
8. Purchases and Sales of Securities (Continued)
| | | | | | | | |
| | | Purchases | | | Sales | |
| Investment securities | | $ | 372,996,971 | | | $ | 333,032,179 | |
9. Fees and Other Transactions with Affiliates
Management Fees. Under the investment advisory agreement, the Fund pays the Manager a management fee based on the daily net assets of the Fund at an annual rate as shown in the following table:
| | | | | | |
| | | Fee Schedule | | | | |
| | Up to $500 million | | 1.00% | | |
| | Next $500 million | | 0.95 | | |
| | Next $4 billion | | 0.90 | | |
| | Over $5 billion | | 0.88 | | |
The Manager also provides investment management related services to the Subsidiary. The Subsidiary pays the Manager a monthly management fee at an annual rate according to the above schedule. The Subsidiary also pays certain other expenses including custody and directors’ fees.
The Fund’s effective management fee for the reporting period was 1.00% of average annual net assets before any Subsidiary management fees or any applicable waivers.
Sub-Adviser Fees. The Manager has retained the Sub-Adviser to provide the day-to-day portfolio management of the Fund and the Subsidiary. Under the Sub-Advisory Agreement, the Manager pays the Sub-Adviser an annual fee in monthly installments, equal to a percentage of the investment management fee collected by the Manager from the Fund and the Subsidiary, which shall be calculated after any investment management fee waivers. The fee paid to the Sub-Adviser is paid by the Manager, not by the Fund.
Sub-Sub-Adviser Fees. The Sub-Adviser retains the Sub-Sub-Advisers to provide the day-to-day portfolio management of the Fund. Under the Sub-Sub-Advisory Agreement, the Sub-Adviser pays the Sub-Sub-Advisers an annual fee in monthly installments, based on the average daily net assets of the Fund. The fee paid to the Sub-Sub-Advisers under the Sub-Sub-Advisory agreement is paid by the Sub-Adviser, not by the Fund.
Transfer Agent Fees. OFI Global (the “Transfer Agent”) serves as the transfer and shareholder servicing agent for the Fund. The Fund pays the Transfer Agent a fee based on annual net assets. Fees incurred and average net assets for each class with respect to these services are detailed in the Consolidated Statement of Operations and Consolidated Financial Highlights, respectively.
Sub-Transfer Agent Fees. The Transfer Agent has retained Shareholder Services, Inc., a wholly-owned subsidiary of OFI (the “Sub-Transfer Agent”), to provide the day-to-day transfer agent and shareholder servicing of the Fund. Under the Sub-Transfer Agency Agreement, the Transfer Agent pays the Sub-Transfer Agent an annual fee in monthly installments, equal to a percentage of the transfer agent fee collected by the Transfer Agent from the Fund, which shall be calculated after any applicable fee waivers. The fee paid to the Sub-Transfer Agent is paid by the Transfer Agent, not by the Fund.
Trustees’ Compensation. The Fund’s Board of Trustees (“Board”) has adopted a compensation deferral plan for Independent Trustees that enables Trustees to elect to defer receipt of all or a portion of the annual compensation they are entitled to receive from the Fund. For purposes of determining the amount owed to the Trustees under the plan, deferred amounts are treated as though equal dollar amounts had been invested in shares of the Fund or in other Oppenheimer funds selected by the Trustees. The Fund purchases shares of the funds selected for deferral by the Trustees in amounts equal to his or her deemed investment, resulting in a Fund asset equal to the deferred compensation liability. Such assets are included as a component of “Other” within the asset section of the Consolidated Statement of Assets and Liabilities. Deferral of Trustees’ fees under the plan will not affect the net assets of the Fund and will not materially affect the Fund’s assets, liabilities or net investment income per share. Amounts will be deferred until distributed in accordance with the compensation deferral plan.
Distribution and Service Plan for Service Shares. The Fund has adopted a Distribution and Service Plan (the “Plan”) pursuant to Rule 12b-1 under the 1940 Act for Service shares to pay OppenheimerFunds Distributor, Inc. (the “Distributor”), for distribution related services, personal service and account maintenance for the Fund’s Service shares. Under the Plan, payments are made periodically at an annual rate of 0.25% of the daily net assets of Service shares of the Fund. The Distributor currently uses all of those fees to compensate sponsors of the insurance product that offers Fund shares, for providing personal service and maintenance of accounts of their variable contract owners that hold Service shares. These fees are paid out of the Fund’s assets on an on-going basis and increase operating expenses of the Service shares, which results in lower performance compared to the Fund’s shares that are not subject to a service fee. Fees incurred by the Fund under the Plan are detailed in the Consolidated Statement of Operations.
Waivers and Reimbursements of Expenses. The Manager has contractually agreed to waive fees and/or reimburse expenses to limit the Fund’s “Expenses after payments, waivers and/or reimbursements and reduction to custodian expenses” (excluding any applicable dividends tied to short sales expense, taxes, interest and fees from borrowing, any subsidiary expenses, Acquired Fund Fees and Expenses, brokerage commissions, unusual and infrequent expenses and certain other Fund expenses) so that, as percentages of average daily net assets, those expenses will not exceed the annual rate of 1.20% for Non-Service shares and 1.45% for Service shares as calculated on the daily net assets of the Fund.
During the reporting period, the Manager waived fees and/or reimbursed the Fund as follows:
57 OPPENHEIMER GLOBAL MULTI-ALTERNATIVES FUND/VA
NOTES TO CONSOLIDATED FINANCIAL STATEMENTS Continued
9. Fees and Other Transactions with Affiliates (Continued)
| | | | | | | | |
| | Non-Service shares | | $ | 5,672 | | | |
| | Service shares | | | 37 | | | |
This fee waiver and/or expense reimbursement may not be amended or withdrawn for one year from the date of the Fund’s prospectus, unless approved by the Board.
The Manager has contractually agreed to waive the management fee it receives from the Fund in an amount equal to the management fee it receives from the Subsidiary. During the reporting period, the Manager waived $113,408. This fee waiver and/or expense reimbursement may not be amended or withdrawn for one year from the date of the Fund’s prospectus, unless approved by the Board.
The Manager will waive fees and/or reimburse Fund expenses in an amount equal to the indirect management fees incurred through the Fund’s investment in IGMMF. During the reporting period, the Manager waived fees and/or reimbursed the Fund $29,959 for IGMMF management fees. This fee waiver and/or expense reimbursement may not be amended or withdrawn for one year from the date of the Fund’s prospectus, unless approved by the Board.
10. Borrowings and Other Financing
Securities Sold Short. The Fund sells securities that it does not own, and it will therefore be obligated to purchase such securities at a future date. Upon entering into a short position, the Fund is required to segregate cash or securities at its custodian which are pledged for the benefit of the lending broker and/or to deposit and pledge cash directly at the lending broker, with a value equal to a certain percentage, exceeding 100%, of the value of the securities that it sold short. Cash that has been segregated and pledged for this purpose will be disclosed on the Consolidated Statement of Assets and Liabilities; securities that have been segregated and pledged for this purpose are disclosed as such in the Consolidated Statement of Investments. The aggregate market value of such cash and securities at period end is $54,913,668. The value of the open short position is recorded as a liability, and the Fund records an unrealized gain or loss to the extent of the difference between the proceeds received and the change in value of the open short position. The Fund records a realized gain or loss when the short position is closed out. By entering into short sales, the Fund bears the risk of an unlimited loss, since the price of the security sold short could theoretically increase without limit. Purchasing securities previously sold short to close out a short position can itself cause the price of the securities to rise further, thereby increasing the loss. Further, there is no assurance that a security the Fund needs to buy to cover a short position will be available for purchase at a reasonable price. Until the security is replaced, the Fund is required to pay the lender any dividend or interest earned. Dividend expense on short sales is treated as an expense in the Consolidated Statement of Operations.
Joint Credit Facility. A number of mutual funds managed by the Manager participate in a $1.875 billion revolving credit facility (the “Facility”) intended to provide short-term financing, if necessary, subject to certain restrictions in connection with atypical redemption activity. Expenses and fees related to the Facility are paid by the participating funds and are disclosed separately or as other expenses on the Consolidated Statement of Operations. The Fund did not utilize the Facility during the reporting period.
11. Prior Period Reclassification
An adjustment to reflect a prior period reclassification between net investment income and net change in unrealized appreciation (depreciation) on investments and/or net realized gain (loss) on investments during the years ending December 31, 2014 and 2015 has been made to properly reflect income distributions received by the Fund from two of its investments.
The following adjustments are reflected in the respective fiscal years per the Consolidated Statements of Changes in Net Assets and the Consolidated Financial Highlights:
| | | | | | | | |
| | | 2014 | | | 2015 | |
| Net investment income (loss) | | | $3,699 | | | | $696,112 | |
| Net realized gain (loss) | | | 360 | | | | 3,812 | |
| Net change in unrealized appreciation/depreciation | | | (4,059) | | | | (699,924) | |
The cumulative impact of these adjustments are also reflected in the respective component of net assets on the Consolidated Statement of Assets and liabilities and had no impact on total net assets or net asset values per share of the Fund.
58 OPPENHEIMER GLOBAL MULTI-ALTERNATIVES FUND/VA
REPORT OF INDEPENDENT REGISTERED PUBLIC ACCOUNTING FIRM
To the Shareholders and Board of Trustees
Oppenheimer Variable Account Funds:
Opinion on the Financial Statements
We have audited the accompanying consolidated statement of assets and liabilities of Oppenheimer Global Multi-Alternatives Fund/VA, a separate series of Oppenheimer Variable Account Funds, (the “Fund”) and subsidiary, including the consolidated statement of investments, as of December 31, 2017, the related consolidated statement of operations for the year then ended, the consolidated statements of changes in net assets for each of the years in the two year period then ended, and the related consolidated notes (collectively, the “consolidated financial statements”) and the consolidated financial highlights for each of the years or periods in the five year period then ended. In our opinion, the consolidated financial statements and consolidated financial highlights present fairly, in all material respects, the financial position of the Fund and subsidiary as of December 31, 2017, the results of their consolidated operations for the year then ended, the changes in their consolidated net assets for each of the years in the two year period then ended, and the consolidated financial highlights for each of the years or periods in the five year period then ended, in conformity with U.S. generally accepted accounting principles.
Basis for Opinion
These consolidated financial statements and consolidated financial highlights are the responsibility of the Fund’s management. Our responsibility is to express an opinion on these consolidated financial statements and consolidated financial highlights based on our audits. We are a public accounting firm registered with the Public Company Accounting Oversight Board (United States) (“PCAOB”) and are required to be independent with respect to the Fund and subsidiary in accordance with the U.S. federal securities laws and the applicable rules and regulations of the Securities and Exchange Commission and the PCAOB.
We conducted our audits in accordance with the standards of the PCAOB. Those standards require that we plan and perform the audit to obtain reasonable assurance about whether the consolidated financial statements and consolidated financial highlights are free of material misstatement, whether due to error or fraud. Our audits included performing procedures to assess the risks of material misstatement of the consolidated financial statements and consolidated financial highlights, whether due to error or fraud, and performing procedures that respond to those risks. Such procedures included examining, on a test basis, evidence regarding the amounts and disclosures in the consolidated financial statements and consolidated financial highlights. Such procedures also included confirmation of securities owned as of December 31, 2017, by correspondence with the custodian, brokers and the transfer agent, or by other appropriate auditing procedures. Our audits also included evaluating the accounting principles used and significant estimates made by management, as well as evaluating the overall presentation of the consolidated financial statements and consolidated financial highlights. We believe that our audits provide a reasonable basis for our opinion.
KPMG LLP
We have not been able to determine the specific year that we began serving as the auditor of one or more Oppenheimer Funds investment companies, however we are aware that we have served as the auditor of one or more Oppenheimer Funds investment companies since at least 1969.
Denver, Colorado
February 16, 2018
59 OPPENHEIMER GLOBAL MULTI-ALTERNATIVES FUND/VA
FEDERAL INCOME TAX INFORMATION Unaudited
In early 2018, if applicable, shareholders of record received information regarding all dividends and distributions paid to them by the Fund during calendar year 2017.
None of the dividends paid by the Fund during the reporting period are eligible for the corporate dividend-received deduction.
The foregoing information is presented to assist shareholders in reporting distributions received from the Fund to the Internal Revenue Service. Because of the complexity of the federal regulations which may affect your individual tax return and the many variations in state and local tax regulations, we recommend that you consult your tax advisor for specific guidance.
60 OPPENHEIMER GLOBAL MULTI-ALTERNATIVES FUND/VA
BOARD APPROVAL OF THE FUND’S INVESTMENT ADVISORY, SUB-ADVISORY AND SUB-SUB ADVISORY AGREEMENTS Unaudited
The Fund has entered into an investment advisory agreement with OFI Global Asset Management, Inc. (“OFI Global” or the “Adviser”), a wholly-owned subsidiary of OppenheimerFunds, Inc. (“OFI” or the “Sub-Adviser”). OFI Global has entered into a sub-advisory agreement with OFI whereby OFI provides investment sub-advisory services to the Fund, and OFI has entered into sub-sub-advisory agreements with Barings, LLC (“Barings”) and OFI SteelPath, Inc. (“OFI SteelPath”), whereby OFI SteelPath and Barings provide investment sub-sub-advisory services to the Fund (collectively, all the investment advisory agreements are referred to as the “Agreements”, “OFI Global” and “OFI” are referred to as the “Managers” and “OFI SteelPath” and “Barings” are referred to as the “Sub-Sub Advisers”). Each year, the Board of Trustees (the “Board”), including a majority of the independent Trustees, is required to determine whether to approve the terms of the Agreements and the renewal thereof. The Investment Company Act of 1940, as amended, requires that the Board request and evaluate, and that the Managers and Sub-Sub Advisers provide, such information as may be reasonably necessary to evaluate the terms of the Agreements. The Board employs an independent consultant to prepare a report that provides information, including comparative information that the Board requests for that purpose. In addition to in-person meetings focused on this evaluation, the Board receives information throughout the year regarding Fund services, fees, expenses and performance.
The Managers and Sub-Sub Advisers and the independent consultant provided information to the Board on the following factors: (i) the nature, quality and extent of the Managers’ and Sub-Sub Advisers’ services, (ii) the comparative investment performance of the Fund and the Managers and Sub-Sub Advisers, (iii) the fees and expenses of the Fund, including comparative fee and expense information, (iv) the profitability of the Managers, Sub-Sub Advisers and their affiliates, including an analysis of the cost of providing services, (v) whether economies of scale are realized as the Fund grows and whether fee levels reflect these economies of scale for Fund investors and (vi) other benefits to the Managers and Sub-Sub Advisers from their relationship with the Fund. The Board was aware that there are alternatives to retaining the Managers and Sub-Sub Advisers.
Outlined below is a summary of the principal information considered by the Board as well as the Board’s conclusions.
Nature, Quality and Extent of Services. The Board considered information about the nature, quality and extent of the services provided to the Fund and information regarding the Managers’ and the Sub-Sub Advisers’ key personnel who provide such services. The Sub-Sub Advisers duties include providing the Fund with the services of the portfolio managers and the Sub-Sub-Advisers’ investment team, who provide research, analysis and other advisory services in regard to the Fund’s investments. OFI, among other duties, provides full portfolio management and investment advice, oversight of the Sub-Sub Advisers, securities trading, and clearance and settlement support services to the Funds, which, among other things, involve the management of large pools of cash and require expertise in analyzing and selecting investments and instruments. OFI Global is responsible for oversight of other third-party service providers; monitoring compliance with applicable Fund policies and procedures and adherence to the Fund’s investment restrictions; risk management; and oversight of the Sub-Adviser. OFI Global is also responsible for providing certain administrative services to the Fund. Those services include providing and supervising all administrative and clerical personnel who are necessary in order to provide effective corporate administration for the Fund; compiling and maintaining records with respect to the Fund’s operations; preparing and filing reports required by the U.S. Securities and Exchange Commission; preparing periodic reports regarding the operations of the Fund for its shareholders; preparing proxy materials for shareholder meetings; and preparing the registration statements required by federal and state securities laws for the sale of the Fund’s shares. OFI Global also provides the Fund with office space, facilities and equipment.
The Board also considered the quality of the services provided and the quality of the Managers’ and Sub-Sub Advisers’ resources that are available to the Fund. The Board took account of the fact that the Sub-Adviser has over fifty years of experience as an investment adviser and that its assets under management rank it among the top mutual fund managers in the United States. The Board evaluated the Managers’ advisory, administrative, accounting, legal, compliance and risk management services, among other services, and information the Board has received regarding the experience and professional qualifications of the Managers’ key personnel and the size and functions of their staff. In its evaluation of the quality of the portfolio management services provided, the Board considered the experience of Mark Hamilton, Benjamin Rockmuller, Dokyoung Lee and Alessio de Longis, the portfolio managers for the Fund, and the Sub-Sub-Advisers’ investment team and analysts. The Board members also considered the totality of their experiences with the Managers and Sub-Sub Advisers as directors or trustees of the Fund and other funds advised by the Managers and Sub- Sub Advisers. The Board considered information regarding the quality of services provided by affiliates of the Managers, which the Board members have become knowledgeable about through their experiences with the Managers and in connection with the review or renewal of the Fund’s service agreements or service providers. The Board concluded, in light of the Managers’ and Sub-Sub Advisers’ experience, reputation, personnel, operations and resources that the Fund benefits from the services provided under the Agreements.
Investment Performance of the Managers, Sub-Sub Advisers and the Fund. Throughout the year, the Managers provided information on the investment performance of the Fund, the Adviser, the Sub-Adviser and the Sub-Sub-Advisers, including comparative performance information. The Board also reviewed information, prepared by the Managers and by the independent consultant, comparing the Fund’s historical performance to relevant market indices and to the performance of other multi-alternative funds. The Board considered that the Fund outperformed its category median for the one- and three-year periods. The Board also considered that the Fund was launched on November 14, 2013, and therefore has a relatively short performance record.
Fees and Expenses of the Fund. The Board reviewed the fees paid to the Managers and the other expenses borne by the Fund. The Board noted that the Adviser, not the Fund, pays the Sub-Adviser’s fee under the sub-advisory agreement, and the Sub-Adviser pays the Sub-Sub-Advisers’ fees under the sub-sub-advisory agreements. The independent consultant provided comparative data in regard to the fees and expenses of the Fund and other multi-alternative funds. In reviewing the fees and expenses charged to the Fund, the Board considered the Adviser’s assertion that, because there is much greater disparity in the fees and services that may be provided by a manager to a VA fund as opposed to a retail fund, when comparing the expenses of the Fund to those of retail funds, it is most appropriate to focus on total expenses (rather than on the management fees). Accordingly, while the Board reviewed and considered all expenses, it focused on total expenses. The Board considered that the Fund’s contractual management fees and total expenses were lower than their respective peer group medians and category medians. The Board further considered that the Adviser has contractually agreed to limit the Fund’s total annual operating expenses so that those expenses, as percentages of daily net assets, will not exceed the annual rate of 1.20% for Non-Service Shares and 1.45% for Service Shares. This waiver and/or reimbursement may not be amended or withdrawn for
61 OPPENHEIMER GLOBAL MULTI-ALTERNATIVES FUND/VA
BOARD APPROVAL OF THE FUND’S INVESTMENT ADVISORY, SUB-ADVISORY AND SUB-SUB ADVISORY
AGREEMENTS Unaudited / Continued
one year from the date of the Fund’s prospectus, unless approved by the Board.
Economies of Scale and Profits Realized by the Managers and the Sub-Sub Advisers. The Board considered information regarding the Managers’ and Sub-Sub Advisers’ costs in serving as the Fund’s investment adviser, sub-adviser and sub-sub-advisers, including the costs associated with the personnel and systems necessary to manage the Fund, and information regarding the Managers’ and Sub-Sub Advisers’ profitability from their relationship with the Fund. The Board also considered that the Managers and Sub-Sub Advisers must be able to pay and retain experienced professional personnel at competitive rates to provide quality services to the Fund. The Board reviewed whether the Managers and Sub-Sub Advisers may realize economies of scale in managing and supporting the Fund. The Board noted that the Fund currently has management fee breakpoints, which are intended to share with Fund shareholders economies of scale that may exist as the Fund’s assets grow.
Other Benefits to the Managers and Sub-Sub Advisers. In addition to considering the profits realized by the Managers and Sub-Sub Advisers, the Board considered information that was provided regarding the direct and indirect benefits the Managers and Sub-Sub Advisers receive as a result of their relationship with the Fund, including compensation paid to the Managers’ affiliates and research provided to the Adviser in connection with permissible brokerage arrangements (soft dollar arrangements).
Conclusions. These factors were also considered by the independent Trustees meeting separately from the full Board, assisted by experienced counsel to the Fund and to the independent Trustees. Fund counsel and the independent Trustees’ counsel are independent of the Managers and Sub-Sub Advisers within the meaning and intent of the Securities and Exchange Commission rules.
Based on its review of the information it received and its evaluations described above, the Board, including a majority of the independent Trustees, decided to continue the Agreements through August 31, 2018. In arriving at its decision, the Board did not identify any factor or factors as being more important than others, but considered all of the above information, and considered the terms and conditions of the Agreements, including the management fees, in light of all the surrounding circumstances.
62 OPPENHEIMER GLOBAL MULTI-ALTERNATIVES FUND/VA
PORTFOLIO PROXY VOTING POLICIES AND GUIDELINES; UPDATES TO STATEMENTS OF INVESTMENTS Unaudited
The Fund has adopted Portfolio Proxy Voting Policies and Guidelines under which the Fund votes proxies relating to securities (“portfolio proxies”) held by the Fund. A description of the Fund’s Portfolio Proxy Voting Policies and Guidelines is available (i) without charge, upon request, by calling the Fund toll-free at 1.800.CALL OPP (225.5677), (ii) on the Fund’s website at www.oppenheimerfunds.com, and (iii) on the SEC’s website at www.sec.gov. In addition, the Fund is required to file Form N-PX, with its complete proxy voting record for the 12 months ended June 30th, no later than August 31st of each year. The Fund’s voting record is available (i) without charge, upon request, by calling the Fund toll-free at 1.800.CALL OPP (225.5677), and (ii) in the Form N-PX filing on the SEC’s website at www.sec.gov.
The Fund files its complete schedule of portfolio holdings with the SEC for the first quarter and the third quarter of each fiscal year on Form N-Q. The Fund’s Form N-Q filings are available on the SEC’s website at www.sec.gov. Those forms may be reviewed and copied at the SEC’s Public Reference Room in Washington, D.C. Information on the operation of the Public Reference Room may be obtained by calling 1-800-SEC-0330.
63 OPPENHEIMER GLOBAL MULTI-ALTERNATIVES FUND/VA
TRUSTEES AND OFFICERS Unaudited
| | |
| Name, Position(s) Held with the Fund, Length of Service, Year of Birth | | Principal Occupation(s) During the Past 5 Years; Other Trusteeships/Directorships Held; Number of Portfolios in the Fund Complex Currently Overseen |
| |
| INDEPENDENT TRUSTEES | | The address of each Trustee in the chart below is 6803 S. Tucson Way, Centennial, Colorado 80112-3924. Each Trustee serves for an indefinite term, or until his or her resignation, retirement, death or removal. |
| |
Robert J. Malone, Chairman of the Board of Trustees (since 2016), Trustee (since 2002) Year of Birth: 1944 | | Chairman - Colorado Market of MidFirst Bank (since January 2015); Chairman of the Board (2012-2016) and Director (August 2005-January 2016) of Jones International University (educational organization); Trustee of the Gallagher Family Foundation (non-profit organization) (2000-2016); Chairman, Chief Executive Officer and Director of Steele Street Bank Trust (commercial banking) (August 2003-January 2015); Director of Opera Colorado Foundation (non-profit organization) (2008-2012); Director of Colorado UpLIFT (charitable organization) (1986-2010); Director of Jones Knowledge, Inc. (2006-2010); Former Chairman of U.S. Bank-Colorado (subsidiary of U.S. Bancorp and formerly Colorado National Bank) (July 1996-April 1999); Director of Commercial Assets, Inc. (real estate investment trust) (1993-2000); Director of U.S. Exploration, Inc. (oil and gas exploration) (1997-February 2004); Chairman of the Board (1991-1994) and Trustee (1985-1994) of Regis University; and Chairman of the Board (1990-1991) and Member (1984-1999) of Young Presidents Organization. Oversees 54 portfolios in the OppenheimerFunds complex. Mr. Malone has served on the Boards of certain Oppenheimer funds since 2002, during which time he has become familiar with the Fund’s (and other Oppenheimer funds’) financial, accounting, regulatory and investment matters and has contributed to the Boards’ deliberations. |
| |
Andrew J. Donohue, Trustee (since 2017) Year of Birth: 1950 | | Of Counsel, Shearman & Sterling LLP (since September 2017); Chief of Staff of the U.S. Securities and Exchange Commission (regulator) (June 2015-February 2017); Managing Director and Investment Company General Counsel of Goldman Sachs (investment bank) (November 2012-May 2015); Partner at Morgan Lewis & Bockius, LLP (law firm) (March 2011-October 2012); Director of the Division of Investment Management of U.S. Securities and Exchange Commission (regulator) (May 2006-November 2010); Global General Counsel of Merrill Lynch Investment Managers (investment firm) (May 2003-May 2006); General Counsel (October 1991-November 2001) and Executive Vice President (January 1993-November 2001) of OppenheimerFunds, Inc. (investment firm) (June 1991-November 2001). Oversees 54 portfolios in the OppenheimerFunds complex. Mr. Donohue has served on the Boards of certain Oppenheimer funds since 2017, during which time he has become familiar with the Fund’s (and other Oppenheimer funds’) financial, accounting, regulatory and investment matters and has contributed to the Boards’ deliberations. |
| |
Jon S. Fossel, Trustee (since 1990) Year of Birth: 1942 | | Chairman of the Board of Jack Creek Preserve Foundation (non-profit organization) (2005-2015); Director of Jack Creek Preserve Foundation (non-profit organization) (since March 2005); Chairman of the Board (2006-December 2011) and Director (June 2002-December 2011) of UNUMProvident (insurance company); Director of Northwestern Energy Corp. (public utility corporation) (November 2004-December 2009); Director of P.R. Pharmaceuticals (October 1999-October 2003); Director of Rocky Mountain Elk Foundation (non-profit organization) (February 1998-February 2003 and February 2005-February 2007); Chairman and Director (until October 1996) and President and Chief Executive Officer (until October 1995) of the Sub-Adviser; President, Chief Executive Officer and Director of the following: Oppenheimer Acquisition Corp. (“OAC”) (parent holding company of the Sub-Adviser), Shareholders Services, Inc. and Shareholder Financial Services, Inc. (until October 1995). Oversees 54 portfolios in the OppenheimerFunds complex. Mr. Fossel has served on the Boards of certain Oppenheimer funds since 1990, during which time he has become familiar with the Fund’s (and other Oppenheimer funds’) financial, accounting, regulatory and investment matters and has contributed to the Boards’ deliberations. |
| |
Richard F. Grabish, Trustee (since 2012) Year of Birth: 1948 | | Formerly Senior Vice President and Assistant Director of Sales and Marketing (March 1997-December 2007), Director (March 1987-December 2007) and Manager of Private Client Services (June 1985-June 2005) of A.G. Edwards & Sons, Inc. (broker/dealer and investment firm); Chairman and Chief Executive Officer of A.G. Edwards Trust Company, FSB (March 2001-December 2007); President and Vice Chairman of A.G. Edwards Trust Company, FSB (investment adviser) (April 1987-March 2001); President of A.G. Edwards Trust Company, FSB (investment adviser) (June 2005-December 2007). Oversees 54 portfolios in the OppenheimerFunds complex. Mr. Grabish has served on the Boards of certain Oppenheimer funds since 2001, during which time he has become familiar with the Fund’s (and other Oppenheimer funds’) financial, accounting, regulatory and investment matters and has contributed to the Boards’ deliberations. |
| |
Beverly L. Hamilton, Trustee (since 2002) Year of Birth: 1946 | | Trustee of Monterey Institute for International Studies (educational organization) (2000-2014); Board Member of Middlebury College (educational organization) (December 2005-June 2011); Director (1991-2016), Vice Chairman of the Board (2006- 2009) and Chairman of the Board (2010-2013) of American Funds’ Emerging Markets Growth Fund, Inc. (mutual fund); Director of The California Endowment (philanthropic organization) (April 2002-April 2008); Director (February 2002-2005) and Chairman of Trustees (2006-2007) of the Community Hospital of Monterey Peninsula; President of ARCO Investment Management Company (February 1991-April 2000); Member of the investment committees of The Rockefeller Foundation (2001-2006) and The University of Michigan (since 2000); Advisor at Credit Suisse First Boston’s Sprout venture capital unit (venture capital fund) (1994-January 2005); Trustee of MassMutual Institutional Funds (investment company) (1996-June 2004); Trustee of MML Series Investment Fund (investment company) (April 1989-June 2004); Member of the investment committee of Hartford Hospital (2000-2003); and Advisor to Unilever (Holland) pension fund (2000-2003). Oversees 54 portfolios in the OppenheimerFunds complex. Ms. Hamilton has served on the Boards of certain Oppenheimer funds since 2002, during which time she has become familiar with the Fund’s (and other Oppenheimer funds’) financial, accounting, regulatory and investment matters and has contributed to the Boards’ deliberations. |
| |
Victoria J. Herget, Trustee (since 2012) Year of Birth:1951 | | Board Chair (2008-2015) and Director (2004-Present), United Educators (insurance company); Trustee (since 2000) and Chair (since 2010), Newberry Library (independent research library); Trustee, Mather LifeWays (senior living organization) (since 2001); Independent Director of the First American Funds (mutual fund family) (2003-2011); former Managing Director (1993-2001), Principal (1985-1993), Vice President (1978-1985) and Assistant Vice President (1973-1978) of Zurich Scudder Investments (investment adviser) (and its predecessor firms); Trustee (1992-2007), Chair of the Board of Trustees (1999-2007), Investment Committee Chair (1994-1999) and Investment Committee member (2007-2010) of Wellesley College; Trustee, BoardSource (non-profit organization) (2006-2009) and Chicago City Day School (K-8 School) (1994-2005). Oversees 54 portfolios in the OppenheimerFunds complex. Ms. Herget has served on the Boards of certain Oppenheimer funds since 2012, during which time she has become familiar with the Fund’s (and other Oppenheimer funds’) financial, accounting, regulatory and investment matters and has contributed to the Boards’ deliberations. |
64 OPPENHEIMER GLOBAL MULTI-ALTERNATIVES FUND/VA
| | |
F. William Marshall, Jr., Trustee (since 2000) Year of Birth: 1942 | | Trustee Emeritus of Worcester Polytech Institute (WPI) (private university) (since 2009); Trustee of MassMutual Select Funds (formerly MassMutual Institutional Funds) (investment company) (1996-2015), MML Series Investment Fund (investment company) (1996-2015) and Mass Mutual Premier Funds (investment company) (January 2012-December 2015); President and Treasurer of the SIS Charitable Fund (private charitable fund) (January 1999-March 2011); Former Trustee of WPI (1985- 2008); Former Chairman of the Board (2004-2006) and Former Chairman of the Investment Committee of WPI (1994-2008); Chairman of SIS Family Bank, F.S.B. (formerly SIS Bank) (commercial bank) (January 1999-July 1999); Executive Vice President of Peoples Heritage Financial Group, Inc. (commercial bank) (January 1999-July 1999); and Former President and Chief Executive Officer of SIS Bancorp. (1993-1999). Oversees 54 portfolios in the OppenheimerFunds complex. Mr. Marshall has served on the Boards of certain Oppenheimer funds since 2000, during which time he has become familiar with the Fund’s (and other Oppenheimer funds’) financial, accounting, regulatory and investment matters and has contributed to the Boards’ deliberations. |
| |
Karen L. Stuckey, Trustee (since 2012) Year of Birth: 1953 | | Member (since May 2015) of Desert Mountain Community Foundation Advisory Board (non-profit organization); Partner (1990-2012) of PricewaterhouseCoopers LLP (professional services firm) (held various positions 1975-1990); Trustee (1992- 2006); member of Executive, Nominating and Audit Committees and Chair of Finance Committee (1992-2006), and Emeritus Trustee (since 2006) of Lehigh University; and member, Women’s Investment Management Forum (professional organization) since inception. Oversees 54 portfolios in the OppenheimerFunds complex. Ms. Stuckey has served on the Boards of certain Oppenheimer funds since 2012, during which time she has become familiar with the Fund’s (and other Oppenheimer funds’) financial, accounting, regulatory and investment matters and has contributed to the Boards’ deliberations. |
| |
James D. Vaughn, Trustee (since 2012) Year of Birth:1945 | | Retired; former managing partner (1994-2001) of Denver office of Deloitte & Touche LLP, (held various positions 1969- 1993); Trustee and Chairman of the Audit Committee of Schroder Funds (2003-2012); Board member and Chairman of Audit Committee of AMG National Trust Bank (since 2005); Trustee and Investment Committee member, University of South Dakota Foundation (since 1996); Board member, Audit Committee Member and past Board Chair, Junior Achievement (since 1993); former Board member, Mile High United Way, Boys and Girls Clubs, Boy Scouts, Colorado Business Committee for the Arts, Economic Club of Colorado and Metro Denver Network. Oversees 54 portfolios in the OppenheimerFunds complex. Mr. Vaughn has served on the Boards of certain Oppenheimer funds since 2012, during which time he has become familiar with the Fund’s (and other Oppenheimer funds’) financial, accounting, regulatory and investment matters and has contributed to the Boards’ deliberations. |
| INTERESTED TRUSTEE AND OFFICER | | Mr. Steinmetz is an “Interested Trustee” because he is affiliated with the Manager and the Sub-Adviser by virtue of his positions as Chairman and director of the Sub-Adviser and officer and director of the Manager. Both as a Trustee and as an officer, Mr. Steinmetz serves for an indefinite term, or until his resignation, retirement, death or removal. Mr. Steinmetz’s address is 225 Liberty Street, New York, New York 10281-1008. |
| |
Arthur P. Steinmetz, Trustee (since 2015), President and Principal Executive Officer (since 2014) Year of Birth: 1958 | | Chairman of the Sub-Adviser (since January 2015); CEO and Chairman of the Manager (since July 2014), President of the Manager (since May 2013), a Director of the Manager (since January 2013), Director of the Sub-Adviser (since July 2014), President, Management Director and CEO of Oppenheimer Acquisition Corp. (the Sub-Adviser’s parent holding company) (since July 2014), and President and Director of OFI SteelPath, Inc. (since January 2013). Chief Investment Officer of the OppenheimerFunds advisory entities from (January 2013-December 2013); Executive Vice President of the Manager (January 2013-May 2013); Chief Investment Officer of the Sub-Adviser (October 2010-December 2012); Chief Investment Officer, Fixed- Income, of the Sub-Adviser (April 2009-October 2010); Executive Vice President of the Sub-Adviser (October 2009-December 2012); Director of Fixed Income of the Sub-Adviser (January 2009-April 2009); and a Senior Vice President of the Sub-Adviser (March 1993-September 2009). An officer of 111 portfolios in the OppenheimerFunds complex. |
| OTHER OFFICERS OF THE FUND | | The addresses of the Officers in the chart below are as follows: for Messrs. Hamilton, Lee, Rockmuller, de Longis, Mss. Lo Bessette, Foxson and Picciotto, 225 Liberty Street, New York, New York 10281-1008, for Mr. Petersen, 6803 S. Tucson Way, Centennial, Colorado 80112-3924. Each Officer serves for an indefinite term or until his or her resignation, retirement, death or removal. |
| |
Mark Hamilton, Vice President (since 2013) Year of Birth: 1965 | | Chief Investment Officer, Asset Allocation of the Sub-Adviser (since April 2013) and a Senior Vice President of the Sub-Adviser (since April 2013). Mr. Hamilton served at AllianceBernstein L.P. (from 1994-2013), as an Investment Director of Dynamic Asset Allocation (from 2010-2013), Head of North American Blend Team (from 2009-2010), and Senior Portfolio Manager of Blend Strategies (from 2006-2010). A portfolio manager and officer of other portfolios in the OppenheimerFunds complex. |
| |
Dokyoung Lee, Vice President (since 2014) Year of Birth: 1965 | | Director of Research, Global Multi-Asset Group (since October 2013) and a Senior Vice President of the Sub-Adviser (since October 2013). Mr. Lee served at Alliance Bernstein L.P. (1994-2013): Director of Research for Strategic Asset Allocation (2011-2013), Director of Research for Blend Strategies (2008-2011), Head of Asia Pacific Blend Strategies (2005-2008), Head of Quantitative Research and Senior Portfolio Manager for Japan Value Equities (2001-2005), Portfolio Manager for Emerging Markets Value Equities (1997-2001), and Quantitative Analyst for US Value Equities (1994-1997). A portfolio manager and officer of other portfolios in the OppenheimerFunds complex. |
| |
Benjamin H. Rockmuller, Vice President (since 2014) Year of Birth: 1979 | | Vice President of the Sub-Adviser (since September 2010); Assistant Vice President of the Sub-Adviser (January 2010-August 2010); Portfolio Manager of the Sub-Adviser (since July 2010); Senior Analyst of the Sub-Adviser for the Global Debt Team (January 2010-July 2010); Intermediate Analyst of the Sub-Adviser for the Global Debt Team (January 2007-January 2010); Junior Analyst of the Sub-Adviser for the Global Debt Team (April 2004-January 2007) and Junior Analyst of the Sub-Adviser for the High Yield Team (June 2003-April 2004). A portfolio manager and an officer in the OppenheimerFunds complex. |
| |
Alessio de Longis, Vice President (since 2016) Year of Birth: 1978 | | Vice President of the Sub-Adviser (since June 2010); Assistant Vice President of the Sub-Adviser (May 2009-June 2010); Senior Research Analyst of the Sub-Adviser (January 2008-June 2010); Intermediate Research Analyst of the Sub-Adviser (January 2006-January 2008) Junior Analyst of the Sub-Adviser (February 2004-January 2006). A portfolio manager and an officer in the OppenheimerFunds complex. |
65 OPPENHEIMER GLOBAL MULTI-ALTERNATIVES FUND/VA
TRUSTEES AND OFFICERS Unaudited / Continued
| | |
Cynthia Lo Bessette, Secretary and Chief Legal Officer (since 2016) Year of Birth: 1969 | | Executive Vice President, General Counsel and Secretary of the Manager (since February 2016); Senior Vice President and Deputy General Counsel of the Manager (March 2015-February 2016); Chief Legal Officer of the Sub-Adviser and the Distributor (since February 2016); Vice President, General Counsel and Secretary of Oppenheimer Acquisition Corp. (since February 2016); General Counsel of OFI SteelPath, Inc., OFI Advisors, LLC and Index Management Solutions, LLC (since February 2016); Chief Legal Officer of OFI Global Institutional, Inc., HarbourView Asset Management Corporation, OFI Global Trust Company, Oppenheimer Real Asset Management, Inc., OFI Private Investments Inc., Shareholder Services, Inc. and Trinity Investment Management Corporation (since February 2016); Corporate Counsel (February 2012-March 2015) and Deputy Chief Legal Officer (April 2013-March 2015) of Jennison Associates LLC; Assistant General Counsel (April 2008-September 2009) and Deputy General Counsel (October 2009-February 2012) of Lord Abbett & Co. LLC. An officer of 111 portfolios in the OppenheimerFunds complex. |
| |
Jennifer Foxson, Vice President and Chief Business Officer (since 2014) Year of Birth: 1969 | | Senior Vice President of OppenheimerFunds Distributor, Inc. (since June 2014); Vice President of OppenheimerFunds Distributor, Inc. (April 2006-June 2014); Vice President of the Sub-Adviser (January 1998-March 2006); Assistant Vice President of the Sub-Adviser (October 1991-December 1998). An officer of 111 portfolios in the OppenheimerFunds complex. |
| |
Mary Ann Picciotto, Chief Compliance Officer and Chief Anti-Money Laundering Officer (since 2014) Year of Birth: 1973 | | Senior Vice President and Chief Compliance Officer of the Manager (since March 2014); Chief Compliance Officer of the Sub- Adviser, OFI SteelPath, Inc., OFI Global Trust Company, OFI Global Institutional, Inc., Oppenheimer Real Asset Management, Inc., OFI Private Investments, Inc., Harborview Asset Management Corporation, Trinity Investment Management Corporation, and Shareholder Services, Inc. (since March 2014); Managing Director of Morgan Stanley Investment Management Inc. and certain of its various affiliated entities; Chief Compliance Officer of various Morgan Stanley Funds (May 2010-January 2014); Chief Compliance Officer of Morgan Stanley Investment Management Inc. (April 2007-January 2014). An officer of 111 portfolios in the OppenheimerFunds complex. |
| |
Brian S. Petersen, Treasurer and Principal Financial & Accounting Officer (since 2016) Year of Birth: 1970 | | Senior Vice President of the Manager (since January 2017); Vice President of the Manager (January 2013-January 2017); Vice President of the Sub-Adviser (February 2007-December 2012); Assistant Vice President of the Sub-Adviser (August 2002- 2007). An officer of 111 portfolios in the OppenheimerFunds complex. |
The Fund’s Statement of Additional Information contains additional information about the Fund’s Trustees and Officers and is available without charge, upon request, by calling 1.800.988.8287.
66 OPPENHEIMER GLOBAL MULTI-ALTERNATIVES FUND/VA
THIS PAGE INTENTIONALLY LEFT BLANK.
67 OPPENHEIMER GLOBAL MULTI-ALTERNATIVES FUND/VA
OPPENHEIMER GLOBAL MULTI-ALTERNATIVES FUND/VA
| | |
| A Series of Oppenheimer Variable Account Funds |
| |
| Manager | | OFI Global Asset Management, Inc. |
| |
| Sub-Adviser | | OppenheimerFunds, Inc. |
| |
| Distributor | | OppenheimerFunds Distributor, Inc. |
| |
| Transfer and | | OFI Global Asset Management, Inc. |
| Shareholder | | |
| Servicing Agent | | |
| |
| Sub-Transfer Agent | | Shareholder Services, Inc. DBA OppenheimerFunds Services |
| |
| Independent | | KPMG LLP |
| Registered | | |
| Public | | |
| Accounting | | |
| Firm | | |
| |
| Legal Counsel | | Ropes & Gray LLP |
| |
| | Before investing in any of the Oppenheimer funds, investors should carefully consider a fund’s investment objectives, risks, charges and expenses. Fund prospectuses and summary prospectuses contain this and other information about the funds and may be obtained by asking your financial advisor, visiting oppenheimerfunds.com or calling us at 1.800.988.8287. Read prospectuses and summary prospectuses carefully before investing. |
| |
| | © 2018 OppenheimerFunds, Inc. All rights reserved. Oppenheimer funds are distributed by OppenheimerFunds Distributor, Inc. |

| | | | |
| | 
| | |
| | |
| | | December 31, 2017 | | |
| | | Oppenheimer | | |
| | International Growth Fund/VA | | Annual Report |
| | A Series of Oppenheimer Variable Account Funds | | |
| | | |
| | ANNUAL REPORT | | |
| | |
| | Listing of Top Holdings | | |
| | |
| | Fund Performance Discussion | | |
| | |
| | Financial Statements | | |
PORTFOLIO MANAGERS: George R. Evans, CFA, and Robert B. Dunphy, CFA
AVERAGE ANNUAL TOTAL RETURNS FOR THE PERIODS ENDED 12/31/17
| | | | | | | | | | | | | | | | |
| | | Inception
Date | | | 1-Year | | | 5-Year | | | 10-Year | |
Non-Service Shares | | | 5/13/92 | | | | 26.29 | % | | | 8.35 | % | | | 4.50 | % |
Service Shares | | | 3/19/01 | | | | 26.44 | | | | 8.16 | | | | 4.21 | |
MSCI AC World ex-U.S. Index | | | | | | | 27.19 | | | | 6.80 | | | | 1.84 | |
Performance data quoted represents past performance, which does not guarantee future results. The investment return and principal value of an investment in the Fund will fluctuate so that an investor’s shares, when redeemed, may be worth more or less than their original cost. Current performance may be lower or higher than the performance quoted. For performance data current to the most recent month end, call us at 1.800.988.8287. The Fund’s total returns should not be expected to be the same as the returns of other funds, whether or not both funds have the same portfolio managers and/or similar names. The Fund’s total returns include changes in share price and reinvested distributions but do not include the charges associated with the separate account products that offer this Fund. Such performance would have been lower if such charges were taken into account.
TOP HOLDINGS AND ALLOCATIONS
TOP TEN COMMON STOCK HOLDINGS
| | |
Infineon Technologies AG | | 2.6% |
SAP SE | | 2.0 |
Temenos Group AG | | 2.0 |
Valeo SA | | 1.8 |
Keyence Corp. | | 1.8 |
Nippon Telegraph & Telephone Corp. | | 1.8 |
Continental AG | | 1.8 |
Reckitt Benckiser Group plc | | 1.7 |
Nidec Corp. | | 1.7 |
Hero MotoCorp Ltd. | | 1.6 |
Portfolio holdings and allocations are subject to change. Percentages are as of December 31, 2017, and are based on net assets. For more current Fund holdings, please visit oppenheimerfunds.com.
REGIONAL ALLOCATION
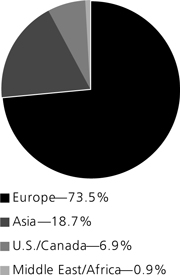
Portfolio holdings and allocations are subject to change. Percentages are as of December 31, 2017, and are based on the total market value of investments.
2 OPPENHEIMER INTERNATIONAL GROWTH FUND/VA
Fund Performance Discussion
It has been a very good year for the Fund in absolute terms: the Fund’s Non-Service shares rose 26.29% over the one-year reporting period ended December 31, 2017. In relative terms, the Fund slipped from out to underperformance in the final few days of the year when markets surged sharply. For the one-year ended December 31, 2017, the MSCI AC World ex-U.S. Index (the “Index”) rose 27.19%.
This was obviously disappointing to us, if not surprising, given the stability of our low beta portfolio. However we have always focused on long-term value creation for the portfolio, rather than market timing, and have performed well relative to the Index over the medium and long term.
We seek to hold stocks over the long term and allow the wealth they can create for us to compound over time. The entry price we pay is the key component to the magnitude of returns. Therefore, we focus rigorously on valuation, ignore market timing, and eschew tactical trading.
With our long-term approach, we will not always outperform. This year, for instance, we lagged the Index due partly to our relatively low direct investment exposure to emerging market companies, particularly those in China. However, our portfolio earns roughly a quarter of its revenues in emerging markets through the global companies we own that do business there. While we do not benefit from the cyclical fund flows into emerging markets that we see every five to seven years – and that we saw this year – we do benefit from the growth of those economies.
During the one-year period, on a sector basis, the Fund outperformed the Index within the Health Care, Industrials and Financials sectors, due mainly to stock selection. The Fund’s underperformance stemmed from weaker relative stock selection in the Consumer Discretionary, Telecommunication Services, and Consumer Staples sectors.
With regard to countries, we remind investors that we are fundamental, bottom-up investors who view the world as one marketplace. Our geographic exposure is purely the result of our stock selection and does not reflect any views regarding the general economy of any country. During this reporting period, we outperformed the Index mainly in Switzerland on the strength of our stocks’ performance. An underweight position and stock selection in Japan along with an overweight position and stock selection in France also contributed positively to relative performance. Our portfolio underperformed the Index the most in China due mainly to our underweight position in that market. The Fund also underperformed in the UK due to an overweight position and stock selection, and in South Korea due to our lack of exposure there.
MARKET OVERVIEW
During the reporting period, world equity markets rose strongly. Europe began outperforming in early 2017 and continued to do so as growth expectations improved. Electoral surprises also continued over the course of the year. The French handed a presidential victory to Emmanuel Macron, a pro-Europe centrist, along with a landslide vote for his new political party in the national legislative elections. In the UK, Prime Minister Theresa May narrowly emerged victorious, albeit under a coalition government, and the Conservative Party failed to enlarge its majority. Taken together, these events improved the outlook for European cooperation and a softer “Brexit.”
TOP INDIVIDUAL CONTRIBUTORS
Top contributors to performance this period included Infineon Technologies AG, Temenos Group AG and Dollarama Inc.
Infineon Technologies AG, a German semiconductor company, supplies the automotive industry. We added it to the portfolio in late 2014 as part of our investment theme focused on the evolution of the car. The accelerating pace of that evolution is increasing demand for Infineon’s chips. The company is performing well and the share price appreciated in response.
Temenos Group AG is an enterprise software company focused on the banking industry. Modern regulatory requirements and the replacement of legacy IT systems are providing a tailwind for the company. In 2017, the company struck several groundbreaking deals with large banks. Results have exceeded consensus and its shares rose strongly over the course of the year.
Dollarama is a discount retailer based in Canada. In our opinion, it has headroom for substantial growth over the coming five years. During the year, Dollarama reported strong sales results and continued to execute well against its expansion plan. The stock price reacted favorably.
3 OPPENHEIMER INTERNATIONAL GROWTH FUND/VA
TOP INDIVIDUAL DETRACTORS
Top detractors from performance included Aryzta AG, Technicolor SA and SES SA.
Aryzta AG is a Swiss-based provider of par-baked goods to casual and fast food restaurants. During 2015, Aryzta acquired Picard, a French frozen food retailer, which deviated from its core business. In our opinion, Aryzta’s management has demonstrated that they do not have the retail channel experience necessary to produce the returns that we require from their acquisition. We exited our position during the reporting period.
Technicolor SA is a French company that has long been a leader in imaging technology. We view the company as a play on the trend toward ever more and more immersive video. The stock price fell after the company revised its FY 2016 Earnings Before Interest, Tax, Depreciation and Amortization (“EBITDA”) guidance downward primarily due to weaker shipments in the Connected Home segment. We remain positive on the long term outlook of the company.
SES is one of the three leaders in the world’s oligopolistic satellite operator market. Roughly two thirds of SES’ revenue comes from video transmission. Fears over the potential deterioration of the television broadcast market in Europe, which are overdone in our opinion, have weighed upon the stock.
STRATEGY & OUTLOOK
We have seen a reversal of the leadership of the S&P 500 Index to the European markets after years of waiting - in fact, after the longest U.S. market leadership period in the last 50 years. History suggests that after such a reversal, new market leadership persists for an average of four years.
Outside of Europe, we are encouraged by the sea change in behavior of Japanese corporates. We are finding an increasing number of Japanese companies who are paying more than lip service to the rational allocation of capital and good treatment of shareholders. Rather than inserting a token page in a presentation book, they are implementing key performance measures and employee incentives to improve capital returns. For the first time since we have been managing this portfolio, we see a growing opportunity set of companies in Japan in which to invest.
As mentioned earlier, we derive roughly a quarter of the portfolio’s earnings from emerging markets and we benefit from the growth of those economies. In our opinion, the outlook for that growth over the coming year is good.
During 2017, the ability of most active managers to beat the performance of market indices was again demonstrated. We remain firm believers in active portfolio management and will continue to practice the same long-term investment discipline that we have since the inception of this portfolio.
Investors should consider the Fund’s investment objective, risks, charges and expenses carefully before investing. The Fund’s prospectus and summary prospectus contain this and other information about the Fund, and may be obtained by asking your financial advisor or calling us at 1.800.988.8287. Read prospectuses and summary prospectuses carefully before investing.
Total returns include changes in share price and reinvestment of dividends and capital gains distributions in a hypothetical investment for the periods shown, but do not include the charges associated with the separate account products that offer this Fund.
The Fund’s investment strategy and focus can change over time. The mention of specific fund holdings does not constitute a recommendation by OppenheimerFunds, Inc. or its affiliates.
Shares of Oppenheimer funds are not deposits or obligations of any bank, are not guaranteed by any bank, are not insured by the FDIC or any other agency, and involve investment risks, including the possible loss of the principal amount invested.
4 OPPENHEIMER INTERNATIONAL GROWTH FUND/VA
Comparing the Fund’s Performance to the Market. The graphs that follow show the performance of a hypothetical $10,000 investment in each share class of the Fund held until December 31, 2017. Performance is measured over a ten-fiscal-year period for both Classes. Performance information does not reflect charges that apply to separate accounts investing in the Fund. If these charges were taken into account, performance would be lower. The graphs assume that all dividends and capital gains distributions were reinvested in additional shares.
The Fund’s performance is compared to the performance of the MSCI AC World ex-U.S. Index. The MSCI AC World ex-U.S. Index is designed to measure the equity market performance of developed and emerging markets and excludes the U.S. The Index is unmanaged and cannot be purchased directly by investors. The Index is unmanaged and cannot be purchased directly by investors. While index comparisons may be useful to provide a benchmark for the Fund’s performance, it must be noted that the Fund’s investments are not limited to the investments comprising the Index. Index performance includes reinvestment of income, but does not reflect transaction costs, fees, expenses or taxes. Index performance is shown for illustrative purposes only as a benchmark for the Fund’s performance, and does not predict or depict performance of the Fund. The Fund’s performance reflects the effects of the Fund’s business and operating expenses.
COMPARISON OF CHANGE IN VALUE OF $10,000 HYPOTHETICAL INVESTMENTS IN:
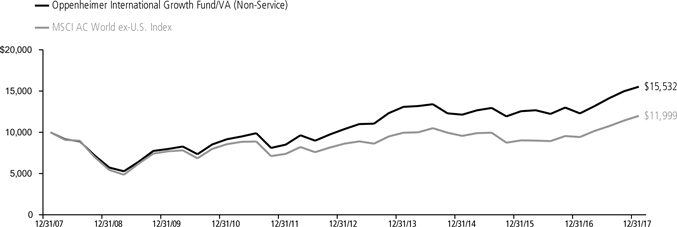
Average Annual Total Returns of Non-Service Shares of the Fund at 12/31/17
1-Year 26.29% 5-Year 8.35% 10-Year 4.50%
COMPARISON OF CHANGE IN VALUE OF $10,000 HYPOTHETICAL INVESTMENTS IN:
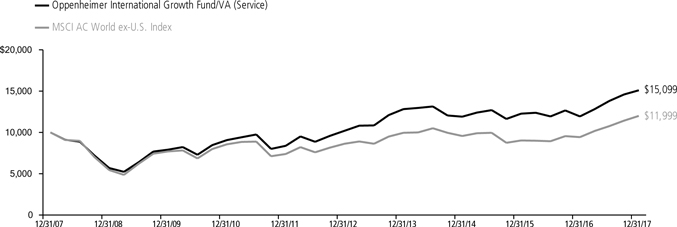
Average Annual Total Returns of Service Shares of the Fund at 12/31/17
1-Year 26.44% 5-Year 8.16% 10-Year 4.21%
Performance data quoted represents past performance, which does not guarantee future results. The investment return and principal value of an investment in the Fund will fluctuate so that an investor’s shares, when redeemed, may be worth more or less than their original cost. Current performance may be lower or higher than the performance quoted. For performance data current to the most recent month end, call us at 1.800.988.8287. The Fund’s total returns should not be expected to be the same as the returns of other funds, whether or not both funds have the same portfolio managers and/or similar names. The Fund’s total returns include changes in share price and reinvested distributions but do not include the charges associated with the separate account products that offer this Fund. Such performance would have been lower if such charges were taken into account.
5 OPPENHEIMER INTERNATIONAL GROWTH FUND/VA
Fund Expenses
Fund Expenses. As a shareholder of the Fund, you incur two types of costs: (1) transaction costs and (2) ongoing costs, including management fees; distribution and service fees; and other Fund expenses. These examples are intended to help you understand your ongoing costs (in dollars) of investing in the Fund and to compare these costs with the ongoing costs of investing in other mutual funds.
The examples are based on an investment of $1,000.00 invested at the beginning of the period and held for the entire 6-month period ended December 31, 2017.
Actual Expenses. The first section of the table provides information about actual account values and actual expenses. You may use the information in this section for the class of shares you hold, together with the amount you invested, to estimate the expense that you paid over the period. Simply divide your account value by $1,000.00 (for example, an $8,600.00 account value divided by $1,000.00 = 8.60), then multiply the result by the number in the first section under the heading entitled “Expenses Paid During 6 Months Ended December 31, 2017” to estimate the expenses you paid on your account during this period.
Hypothetical Example for Comparison Purposes.
The second section of the table provides information about hypothetical account values and hypothetical expenses based on the Fund’s actual expense ratio for each class of shares, and an assumed rate of return of 5% per year for each class before expenses, which is not the actual return. The hypothetical account values and expenses may not be used to estimate the actual ending account balance or expenses you paid for the period. You may use this information to compare the ongoing costs of investing in the Fund and other funds. To do so, compare this 5% hypothetical example for the class of shares you hold with the 5% hypothetical examples that appear in the shareholder reports of the other funds.
Please note that the expenses shown in the table are meant to highlight your ongoing costs only and do not reflect any charges associated with the separate accounts that offer this Fund. Therefore, the “hypothetical” lines of the table are useful in comparing ongoing costs only, and will not help you determine the relative total costs of owning different funds. In addition, if these separate account charges were included your costs would have been higher.
| | | | | | | | | | | | | | | | |
| Actual | | Beginning Account Value July 1, 2017 | | | Ending Account Value December 31, 2017 | | | Expenses Paid During 6 Months Ended
December 31, 2017 | |
Non-Service shares | | | $ 1,000.00 | | | | $ 1,097.50 | | | | $ 5.30 | | | | | |
Service shares | | | 1,000.00 | | | | 1,093.10 | | | | 6.61 | | | | | |
| | | | |
| Hypothetical | | | | | | | | | | | | |
| (5% return before expenses) | | | | | | | | | | | | |
Non-Service shares | | | 1,000.00 | | | | 1,020.16 | | | | 5.10 | | | | | |
Service shares | | | 1,000.00 | | | | 1,018.90 | | | | 6.38 | | | | | |
Expenses are equal to the Fund’s annualized expense ratio for that class, multiplied by the average account value over the period, multiplied by 184/365 (to reflect the one-half year period). Those annualized expense ratios, excluding indirect expenses from affiliated funds, based on the 6-month period ended December 31, 2017 are as follows:
| | | | | | | | |
| Class | | Expense Ratios | | | | |
Non-Service shares | | | 1.00% | | | | | |
Service shares | | | 1.25 | | | | | |
The expense ratios reflect voluntary and/or contractual waivers and/or reimbursements of expenses by the Fund’s Manager. Some of these undertakings may be modified or terminated at any time, as indicated in the Fund’s prospectus. The “Financial Highlights” tables in the Fund’s financial statements, included in this report, also show the gross expense ratios, without such waivers or reimbursements and reduction to custodian expenses, if applicable.
6 OPPENHEIMER INTERNATIONAL GROWTH FUND/VA
STATEMENT OF INVESTMENTS December 31, 2017
| | | | | | |
| | | Shares | | | Value |
|
Common Stocks—98.2% | | | | | | |
|
Consumer Discretionary—23.8% | | | |
|
Auto Components—5.0% | | | |
|
Continental AG | | | 39,631 | | | $ 10,699,387 |
|
Koito Manufacturing Co. Ltd. | | | 122,900 | | | 8,641,953 |
|
Valeo SA | | | 145,793 | | | 10,864,782 |
| | | | | | 30,206,122 |
|
Automobiles—3.7% | | | |
|
Bayerische Motoren Werke AG | | | 57,538 | | | 5,976,622 |
|
Hero MotoCorp Ltd. | | | 161,201 | | | 9,555,906 |
|
Subaru Corp. | | | 204,200 | | | 6,465,144 |
| | | | | | 21,997,672 |
|
Diversified Consumer Services—0.4% | | | |
|
Dignity plc | | | 103,507 | | | 2,538,291 |
|
Hotels, Restaurants & Leisure—3.1% | | | |
|
Carnival Corp. | | | 138,680 | | | 9,204,192 |
|
Domino’s Pizza Group plc | | | 1,072,904 | | | 5,004,816 |
|
Whitbread plc | | | 78,046 | | | 4,214,935 |
| | | | | | 18,423,943 |
|
Household Durables—1.2% | | | |
|
SEB SA | | | 39,200 | | | 7,262,938 |
|
Media—2.5% | | | |
|
ProSiebenSat.1 Media SE | | | 193,633 | | | 6,666,901 |
|
SES SA, Cl. A, FDR | | | 384,570 | | | 5,992,711 |
|
Technicolor SA | | | 728,530 | | | 2,498,799 |
| | | | | | 15,158,411 |
|
Multiline Retail—1.5% | | | |
|
Dollarama, Inc. | | | 70,332 | | | 8,787,303 |
|
Specialty Retail—1.7% | | | |
|
Industria de Diseno Textil SA | | | 145,158 | | | 5,048,825 |
|
Nitori Holdings Co. Ltd. | | | 36,800 | | | 5,247,172 |
| | | | | | 10,295,997 |
|
Textiles, Apparel & Luxury Goods—4.7% | | | |
|
Cie Financiere Richemont SA | | | 71,311 | | | 6,456,705 |
|
Hermes International | | | 12,806 | | | 6,854,966 |
|
| LVMH Moet Hennessy Louis Vuitton SE | | | 27,690 | | | 8,133,939 |
|
Pandora AS | | | 60,393 | | | 6,572,544 |
| | | | | | 28,018,154 |
|
Consumer Staples—11.5% | | | |
|
Beverages—2.4% | | | |
|
Heineken NV | | | 75,358 | | | 7,854,898 |
|
Pernod Ricard SA | | | 41,760 | | | 6,610,222 |
| | | | | | 14,465,120 |
|
Food & Staples Retailing—3.0% | | | |
|
| Alimentation Couche-Tard, Inc., Cl. B | | | 118,884 | | | 6,203,343 |
|
CP ALL PCL | | | 2,777,100 | | | 6,556,231 |
|
SPAR Group Ltd. (The) | | | 317,064 | | | 5,208,757 |
| | | | | | 17,968,331 |
|
Food Products—3.4% | | | |
|
Barry Callebaut AG1 | | | 3,909 | | | 8,143,827 |
|
Saputo, Inc. | | | 212,966 | | | 7,654,577 |
|
Unilever plc | | | 85,402 | | | 4,731,232 |
| | | | | | 20,529,636 |
|
Household Products—1.7% | | | |
|
Reckitt Benckiser Group plc | | | 111,074 | | | 10,375,314 |
|
Tobacco—1.0% | | | |
|
Swedish Match AB | | | 142,314 | | | 5,601,595 |
|
Energy—1.2% | | | |
|
| Energy Equipment & Services—0.6% | | | |
|
TechnipFMC plc | | | 108,702 | | | 3,357,637 |
|
Oil, Gas & Consumable Fuels—0.6% | | | |
|
Koninklijke Vopak NV | | | 83,184 | | | 3,648,815 |
| | | | | | |
| | | Shares | | | Value |
|
Financials—6.2% | | | |
|
Capital Markets—2.1% | | | |
|
NEX Group plc | | | 500,356 | | | $ 4,096,315 |
|
TP ICAP plc | | | 665,291 | | | 4,765,031 |
|
UBS Group AG1 | | | 205,468 | | | 3,775,312 |
| | | | | | 12,636,658 |
|
Commercial Banks—1.3% | | | |
|
ICICI Bank Ltd., Sponsored ADR | | | 803,443 | | | 7,817,500 |
|
Consumer Finance—0.7% | | | |
|
Prosegur Cash SA2 | | | 1,305,641 | | | 4,188,759 |
|
Insurance—1.1% | | | |
|
Prudential plc | | | 250,724 | | | 6,446,153 |
|
Real Estate Management & Development—1.0% | | | |
|
Scout24 AG2 | | | 144,572 | | | 5,904,672 |
|
Health Care—10.5% | | | |
|
Biotechnology—2.6% | | | |
|
CSL Ltd. | | | 65,300 | | | 7,187,013 |
|
Grifols SA | | | 286,116 | | | 8,366,280 |
| | | | | | 15,553,293 |
|
Health Care Equipment & Supplies—2.8% | | | |
|
| Essilor International Cie Generale d’Optique SA | | | 46,733 | | | 6,444,261 |
|
Sonova Holding AG | | | 32,317 | | | 5,045,691 |
|
William Demant Holding AS1 | | | 191,486 | | | 5,330,537 |
| | | | | | 16,820,489 |
|
Life Sciences Tools & Services—1.4% | | | |
|
Lonza Group AG1 | | | 32,130 | | | 8,679,414 |
|
Pharmaceuticals—3.7% | | | |
|
Bayer AG | | | 59,722 | | | 7,427,930 |
|
Novo Nordisk AS, Cl. B | | | 168,105 | | | 9,034,834 |
|
Roche Holding AG | | | 22,510 | | | 5,693,752 |
| | | | | | 22,156,516 |
|
Industrials—16.1% | | | |
|
Aerospace & Defense—1.0% | | | |
|
Airbus SE | | | 62,110 | | | 6,167,878 |
|
Commercial Services & Supplies—2.2% | | | |
|
Edenred | | | 204,814 | | | 5,933,571 |
|
Prosegur Cia de Seguridad SA | | | 893,706 | | | 7,019,999 |
| | | | | | 12,953,570 |
|
Construction & Engineering—0.7% | | | |
|
Boskalis Westminster | | | 110,876 | | | 4,179,232 |
|
Electrical Equipment—2.8% | | | |
|
Legrand SA | | | 86,540 | | | 6,653,373 |
|
Nidec Corp. | | | 73,800 | | | 10,359,570 |
| | | | | | 17,012,943 |
|
Machinery—4.6% | | | |
|
Aalberts Industries NV | | | 148,849 | | | 7,557,741 |
|
Atlas Copco AB, Cl. A | | | 175,234 | | | 7,547,281 |
|
Kubota Corp. | | | 367,000 | | | 7,186,487 |
|
VAT Group AG1,2 | | | 16,857 | | | 2,493,568 |
|
Weir Group plc (The) | | | 88,287 | | | 2,521,222 |
| | | | | | 27,306,299 |
|
Professional Services—1.0% | | | |
|
Intertek Group plc | | | 85,600 | | | 5,996,161 |
|
Trading Companies & Distributors—3.8% | | | |
|
Brenntag AG | | | 94,214 | | | 5,943,148 |
|
Bunzl plc | | | 253,565 | | | 7,090,153 |
|
Ferguson plc | | | 49,100 | | | 3,513,235 |
|
Travis Perkins plc | | | 306,132 | | | 6,472,864 |
| | | | | | 23,019,400 |
7 OPPENHEIMER INTERNATIONAL GROWTH FUND/VA
STATEMENT OF INVESTMENTS Continued
| | | | | | | | |
| | | Shares | | | Value | |
| |
| Information Technology—21.6% | | | | | |
| |
| Communications Equipment—1.1% | | | | | |
| |
Nokia OYJ | | | 1,352,985 | | | $ | 6,319,573 | |
| |
Electronic Equipment, Instruments, & Components—4.7% | |
| |
Hitachi Ltd. | | | 945,000 | | | | 7,351,243 | |
| |
Hoya Corp. | | | 118,193 | | | | 5,905,856 | |
| |
Keyence Corp. | | | 19,212 | | | | 10,727,321 | |
| |
Spectris plc | | | 134,195 | | | | 4,486,168 | |
| | | | | | | 28,470,588 | |
| |
Internet Software & Services—2.1% | | | | | |
| |
Baidu, Inc., Sponsored ADR1 | | | 29,530 | | | | 6,916,221 | |
| |
United Internet AG | | | 79,532 | | | | 5,470,430 | |
| | | | | | | 12,386,651 | |
| |
IT Services—2.5% | | | | | |
| |
Amadeus IT Group SA | | | 85,977 | | | | 6,188,342 | |
| |
Atos SE | | | 59,240 | | | | 8,623,027 | |
| | | | | | | 14,811,369 | |
| |
Semiconductors & Semiconductor Equipment—6.2% | |
| |
ams AG1 | | | 49,248 | | | | 4,462,649 | |
| |
ASML Holding NV | | | 47,240 | | | | 8,195,576 | |
| |
Infineon Technologies AG | | | 559,048 | | | | 15,268,885 | |
| |
STMicroelectronics NV | �� | | 426,790 | | | | 9,268,651 | |
| | | | | | | 37,195,761 | |
| |
Software—5.0% | | | | | |
| |
Dassault Systemes SE | | | 55,547 | | | | 5,899,451 | |
| |
SAP SE | | | 111,109 | | | | 12,458,642 | |
| |
Temenos Group AG | | | 93,003 | | | | 11,901,929 | |
| | | | | | | 30,260,022 | |
| | | | | | |
| | | Shares | | | Value |
|
Materials—4.5% | | | |
|
Chemicals—2.7% | | | |
|
Essentra plc | | | 477,362 | | | $ 3,411,010 |
|
Novozymes AS, Cl. B | | | 115,420 | | | 6,593,746 |
|
Sika AG | | | 787 | | | 6,238,387 |
| | | | | | 16,243,143 |
|
Construction Materials—0.6% | | | |
|
James Hardie Industries plc | | | 204,000 | | | 3,591,159 |
|
Containers & Packaging—1.2% | | | |
|
CCL Industries, Inc., Cl. B | | | 154,779 | | | 7,151,602 |
|
Telecommunication Services—2.8% | | | |
|
Diversified Telecommunication Services—2.8% | | | |
|
Iliad SA | | | 25,710 | | | 6,161,011 |
|
Nippon Telegraph & Telephone Corp. | | | 227,900 | | | 10,723,963 |
| | | | | | 16,884,974 |
| Total Common Stocks (Cost $358,939,205) | | | 588,789,058 |
|
Preferred Stock—0.0% | | | |
|
Zee Entertainment Enterprises Ltd., 6% Cum. Non-Cv. (Cost $12,272) | | | 599,541 | | | 93,931 |
|
Investment Company—0.3% | | | |
|
Oppenheimer Institutional Government Money Market Fund, Cl. E, 1.22%3,4 (Cost $1,843,768) | | | 1,843,768 | | | 1,843,768 |
|
| Total Investments, at Value (Cost $360,795,245) | | | 98.5% | | | 590,726,757 |
|
Net Other Assets (Liabilities) | | | 1.5 | | | 8,732,019 |
| | | |
Net Assets | | | 100.0% | | | $ 599,458,776 |
| | | |
Footnotes to Statement of Investments
1. Non-income producing security.
2. Represents securities sold under Rule 144A, which are exempt from registration under the Securities Act of 1933, as amended. These securities have been determined to be liquid under guidelines established by the Board of Trustees. These securities amount to $12,586,999 or 2.10% of the Fund’s net assets at period end.
3. Rate shown is the 7-day yield at period end.
4. Is or was an affiliate, as defined in the Investment Company Act of 1940, as amended, at or during the reporting period, by virtue of the Fund owning at least 5% of the voting securities of the issuer or as a result of the Fund and the issuer having the same investment adviser. Transactions during the reporting period in which the issuer was an affiliate are as follows:
| | | | | | | | | | | | | | | | |
| | | Shares December 31, 2016 | | | Gross Additions | | | Gross
Reductions | | | Shares
December 31, 2017 | |
| |
| Oppenheimer Institutional Government Money Market Fund, Cl. E | | | 9,483,349 | | | | 102,687,457 | | | | 110,327,038 | | | | 1,843,768 | |
| | | | |
| | | Value | | | Income | | | Realized Gain
(Loss) | | | Change in Unrealized Gain (Loss) | |
| |
| Oppenheimer Institutional Government Money Market Fund, Cl. E | | | $ 1,843,768 | | | | $ 116,912 | | | $ | — | | | $ | — | |
Distribution of investments representing geographic holdings, as a percentage of total investments at value, is as follows:
| | | | | | | | |
| Geographic Holdings (Unaudited) | | Value | | | Percent | |
France | | $ | 94,100,929 | | | | 15.9% | |
United Kingdom | | | 79,020,537 | | | | 13.4 | |
Germany | | | 75,816,617 | | | | 12.8 | |
Japan | | | 72,608,710 | | | | 12.3 | |
Switzerland | | �� | 67,697,235 | | | | 11.5 | |
Netherlands | | | 31,436,263 | | | | 5.3 | |
Spain | | | 30,812,204 | | | | 5.2 | |
Canada | | | 29,796,826 | | | | 5.0 | |
Denmark | | | 27,531,661 | | | | 4.7 | |
India | | | 17,467,337 | | | | 3.0 | |
Sweden | | | 13,148,876 | | | | 2.2 | |
United States | | | 11,047,959 | | | | 1.9 | |
Australia | | | 7,187,013 | | | | 1.2 | |
China | | | 6,916,221 | | | | 1.2 | |
Thailand | | | 6,556,231 | | | | 1.1 | |
Finland | | | 6,319,573 | | | | 1.1 | |
South Africa | | | 5,208,757 | | | | 0.9 | |
Austria | | | 4,462,649 | | | | 0.7 | |
8 OPPENHEIMER INTERNATIONAL GROWTH FUND/VA
| | | | | | | | |
| Geographic Holdings (Unaudited) (Continued) | | Value | | | Percent | |
Ireland | | $ | 3,591,159 | | | | 0.6% | |
| | | | |
Total | | $ | 590,726,757 | | | | 100.0% | |
| | | | |
See accompanying Notes to Financial Statements.
9 OPPENHEIMER INTERNATIONAL GROWTH FUND/VA
STATEMENT OF ASSETS AND LIABILITIES December 31, 2017
| | | | |
| |
Assets | | | | |
| Investments, at value—see accompanying statement of investments: | | | | |
| Unaffiliated companies (cost $358,951,477) | | $ | 588,882,989 | |
| Affiliated companies (cost $1,843,768) | | | 1,843,768 | |
| | | | |
| | | 590,726,757 | |
| |
| Cash | | | 501,653 | |
| |
| Cash—foreign currencies (cost $8) | | | 9 | |
| |
| Receivables and other assets: | | | | |
| Investments sold | | | 8,418,102 | |
| Dividends | | | 1,494,353 | |
| Shares of beneficial interest sold | | | 374,846 | |
| Other | | | 41,126 | |
| | | | |
| Total assets | | | 601,556,846 | |
| |
Liabilities | | | | |
| Payables and other liabilities: | | | | |
| Shares of beneficial interest redeemed | | | 1,349,126 | |
| Foreign capital gains tax | | | 509,870 | |
| Investments purchased | | | 78,432 | |
| Distribution and service plan fees | | | 50,938 | |
| Trustees’ compensation | | | 29,943 | |
| Shareholder communications | | | 5,818 | |
| Other | | | 73,943 | |
| | | | |
| Total liabilities | | | 2,098,070 | |
|
| |
Net Assets | | $ | 599,458,776 | |
| | | | |
|
| |
Composition of Net Assets | | | | |
| Par value of shares of beneficial interest | | $ | 227,710 | |
| |
| Additional paid-in capital | | | 361,432,186 | |
| |
| Accumulated net investment income | | | 1,831,554 | |
| |
| Accumulated net realized gain on investments and foreign currency transactions | | | 6,519,356 | |
| |
| Net unrealized appreciation on investments and translation of assets and liabilities denominated in foreign currencies | | | 229,447,970 | |
| | | | |
| Net Assets | | $ | 599,458,776 | |
| | | | |
|
| |
Net Asset Value Per Share | | | | |
| Non-Service Shares: | | | | |
| Net asset value, redemption price per share and offering price per share (based on net assets of $360,416,783 and 139,124,477 shares of beneficial interest outstanding) | | | $2.59 | |
| |
| |
| Service Shares: | | | | |
| Net asset value, redemption price per share and offering price per share (based on net assets of $239,041,993 and 88,585,834 shares of beneficial interest outstanding) | | | $2.70 | |
See accompanying Notes to Financial Statements.
10 OPPENHEIMER INTERNATIONAL GROWTH FUND/VA
STATEMENT OF OPERATIONS For the Year Ended December 31, 2017
| | | | |
| |
Investment Income | | | | |
Dividends: | | | | |
| Unaffiliated companies (net of foreign withholding taxes of $1,187,747) | | $ | 10,216,524 | |
| Affiliated companies | | | 116,912 | |
| | | | |
Total investment income | | | 10,333,436 | |
| |
Expenses | | | | |
Management fees | | | 5,198,559 | |
| |
Distribution and service plan fees — Service shares | | | 532,815 | |
| |
Transfer and shareholder servicing agent fees: | | | | |
Non-Service shares | | | 339,637 | |
Service shares | | | 213,216 | |
| |
Shareholder communications: | | | | |
Non-Service shares | | | 13,240 | |
Service shares | | | 8,261 | |
| |
Custodian fees and expenses | | | 53,905 | |
| |
Trustees’ compensation | | | 22,192 | |
| |
Borrowing fees | | | 14,639 | |
| |
Other | | | 129,655 | |
| | | | |
Total expenses | | | 6,526,119 | |
Less reduction to custodian expenses | | | (200) | |
Less waivers and reimbursements of expenses | | | (448,394) | |
| | | | |
Net expenses | | | 6,077,525 | |
| |
Net Investment Income | | | 4,255,911 | |
| |
Realized and Unrealized Gain (Loss) | | | | |
Net realized gain (loss) on: | | | | |
Investment transactions in unaffiliated companies (net of foreign capital gains tax of $46,251) | | | 14,315,859 | |
Foreign currency transactions | | | (36,487) | |
| | | | |
| Net realized gain | | | 14,279,372 | |
| |
Net change in unrealized appreciation/depreciation on: | | | | |
Investment transactions in unaffiliated companies (net of foreign capital gains tax of $192,571) | | | 108,170,814 | |
Translation of assets and liabilities denominated in foreign currencies | | | 126,323 | |
| | | | |
| Net change in unrealized appreciation/depreciation | | | 108,297,137 | |
| |
Net Increase in Net Assets Resulting from Operations | | $ | 126,832,420 | |
| | | | |
See accompanying Notes to Financial Statements.
11 OPPENHEIMER INTERNATIONAL GROWTH FUND/VA
STATEMENTS OF CHANGES IN NET ASSETS
| | | | | | | | |
| | | Year Ended
December 31, 2017 | | | Year Ended
December 31, 2016 | |
| |
Operations | | | | | | | | |
Net investment income | | $ | 4,255,911 | | | $ | 5,530,716 | |
| |
Net realized gain (loss) | | | 14,279,372 | | | | (21,315) | |
| |
Net change in unrealized appreciation/depreciation | | | 108,297,137 | | | | (15,794,847) | |
| | | | |
Net increase (decrease) in net assets resulting from operations | | | 126,832,420 | | | | (10,285,446) | |
| |
Dividends and/or Distributions to Shareholders | | | | | | | | |
Dividends from net investment income: | | | | | | | | |
Non-Service shares | | | (4,868,321) | | | | (3,398,644) | |
Service shares | | | (2,425,707) | | | | (1,459,515) | |
| | | | |
| | | (7,294,028) | | | (4,858,159) | |
| |
Distributions from net realized gain: | | | | | | | | |
Non-Service shares | | | — | | | | (7,229,895) | |
Service shares | | | — | | | | (4,021,530) | |
| | | | |
| | | — | | | (11,251,425) | |
| |
Beneficial Interest Transactions | | | | | | | | |
Net increase (decrease) in net assets resulting from beneficial interest transactions: | | | | | | | | |
Non-Service shares | | | (14,779,318) | | | | 788,912 | |
Service shares | | | 17,507,241 | | | | 15,959,227 | |
| | | | | | | | |
| | | 2,727,923 | | | | 16,748,139 | |
| |
Net Assets | | | | | | | | |
Total increase (decrease) | | | 122,266,315 | | | | (9,646,891) | |
| |
Beginning of period | | | 477,192,461 | | | | 486,839,352 | |
| | | | |
| End of period (including accumulated net investment income of $1,831,554 and $4,952,410, respectively) | | $ | 599,458,776 | | | $ | 477,192,461 | |
| | | | |
See accompanying Notes to Financial Statements.
12 OPPENHEIMER INTERNATIONAL GROWTH FUND/VA
FINANCIAL HIGHLIGHTS
| | | | | | | | | | | | | | | | | | | | |
Non-Service Shares | | Year Ended
December 31,
2017 | | | Year Ended
December 31,
2016 | | | Year Ended
December 31,
2015 | | | Year Ended
December 31,
2014 | | | Year Ended
December 31,
2013 | |
| |
Per Share Operating Data | | | | | | | | | | | | | | | | | | | | |
| Net asset value, beginning of period | | | $2.08 | | | | $2.20 | | | | $2.31 | | | | $2.57 | | | | $2.07 | |
| |
| Income (loss) from investment operations: | | | | | | | | | | | | | | | | | | | | |
| Net investment income1 | | | 0.02 | | | | 0.03 | | | | 0.03 | | | | 0.03 | | | | 0.03 | |
| Net realized and unrealized gain (loss) | | | 0.52 | | | | (0.08) | | | | 0.06 | | | | (0.21) | | | | 0.50 | |
| | | | |
Total from investment operations | | | 0.54 | | | | (0.05) | | | | 0.09 | | | | (0.18) | | | | 0.53 | |
| |
| Dividends and/or distributions to shareholders: | | | | | | | | | | | | | | | | | | | | |
| Dividends from net investment income | | | (0.03) | | | | (0.02) | | | | (0.03) | | | | (0.03) | | | | (0.03) | |
| Distributions from net realized gain | | | 0.00 | | | | (0.05) | | | | (0.17) | | | | (0.05) | | | | 0.00 | |
| | | | |
| Total dividends and/or distributions to shareholders | | | (0.03) | | | | (0.07) | | | | (0.20) | | | | (0.08) | | | | (0.03) | |
| |
| Net asset value, end of period | | | $2.59 | | | | $2.08 | | | | $2.20 | | | | $2.31 | | | | $2.57 | |
| | | | |
| | | | | | | | | | | | | | | | | | | | |
| |
Total Return, at Net Asset Value2 | | | 26.29% | | | | (2.12)% | | | | 3.43% | | | | (7.22)% | | | | 25.87% | |
| | | | | | | | | | | | | | | | | | | | | |
| |
Ratios/Supplemental Data | | | | | | | | | | | | | | | | | | | | |
| Net assets, end of period (in thousands) | | | $360,417 | | | | $301,559 | | | | $317,547 | | | | $358,756 | | | | $458,038 | |
| |
| Average net assets (in thousands) | | | $339,999 | | | | $305,269 | | | | $343,347 | | | | $400,556 | | | | $404,859 | |
| |
| Ratios to average net assets:3 | | | | | | | | | | | | | | | | | | | | |
| Net investment income | | | 0.87% | | | | 1.24% | | | | 1.08% | | | | 1.13% | | | | 1.24% | |
| Expenses excluding specific expenses listed below | | | 1.08% | | | | 1.09% | | | | 1.08% | | | | 1.07% | | | | 1.09% | |
Interest and fees from borrowings | | | 0.00%4 | | | | 0.00%4 | | | | 0.00%4 | | | | 0.00% | | | | 0.00% | |
| | | | |
| Total expenses5 | | | 1.08% | | | | 1.09% | | | | 1.08% | | | | 1.07% | | | | 1.09% | |
| Expenses after payments, waivers and/or reimbursements and reduction to custodian expenses | | | 1.00% | | | | 1.00% | | | | 1.00% | | | | 1.00% | | | | 1.00% | |
| |
| Portfolio turnover rate | | | 27% | | | | 15% | | | | 24% | | | | 41% | | | | 32% | |
1. Per share amounts calculated based on the average shares outstanding during the period.
2. Assumes an initial investment on the business day before the first day of the fiscal period, with all dividends and distributions reinvested in additional shares on the reinvestment date, and redemption at the net asset value calculated on the last business day of the fiscal period. Total returns are not annualized for periods less than one full year. Total return information does not reflect expenses that apply at the separate account level or to related insurance products. Inclusion of these charges would reduce the total return figures for all periods shown. Returns do not reflect the deduction of taxes that a shareholder would pay on fund distributions or the redemption of fund shares.
3. Annualized for periods less than one full year.
4. Less than 0.005%.
5. Total expenses including indirect expenses from affiliated fund fees and expenses were as follows:
| | | | |
Year Ended December 31, 2017 | | | 1.08 | % |
Year Ended December 31, 2016 | | | 1.09 | % |
Year Ended December 31, 2015 | | | 1.08 | % |
Year Ended December 31, 2014 | | | 1.07 | % |
Year Ended December 31, 2013 | | | 1.09 | % |
See accompanying Notes to Financial Statements.
13 OPPENHEIMER INTERNATIONAL GROWTH FUND/VA
FINANCIAL HIGHLIGHTS Continued
| | | | | | | | | | | | | | | | | | | | |
Service Shares | | Year Ended
December 31,
2017 | | | Year Ended
December 31,
2016 | | | Year Ended
December 31,
2015 | | | Year Ended
December 31,
2014 | | | Year Ended
December 31,
2013 | |
| |
Per Share Operating Data | | | | | | | | | | | | | | | | | | | | |
Net asset value, beginning of period | | | $2.16 | | | | $2.29 | | | | $2.40 | | | | $2.66 | | | | $2.14 | |
| |
Income (loss) from investment operations: | | | | | | | | | | | | | | | | | | | | |
Net investment income1 | | | 0.01 | | | | 0.02 | | | | 0.02 | | | | 0.02 | | | | 0.02 | |
Net realized and unrealized gain (loss) | | | 0.56 | | | | (0.08) | | | | 0.06 | | | | (0.21) | | | | 0.53 | |
| | | | |
Total from investment operations | | | 0.57 | | | | (0.06) | | | | 0.08 | | | | (0.19) | | | | 0.55 | |
| |
Dividends and/or distributions to shareholders: | | | | | | | | | | | | | | | | | | | | |
Dividends from net investment income | | | (0.03) | | | | (0.02) | | | | (0.02) | | | | (0.02) | | | | (0.03) | |
Distributions from net realized gain | | | 0.00 | | | | (0.05) | | | | (0.17) | | | | (0.05) | | | | 0.00 | |
| | | | |
Total dividends and/or distributions to shareholders | | | (0.03) | | | | (0.07) | | | | (0.19) | | | | (0.07) | | | | (0.03) | |
| |
Net asset value, end of period | | | $2.70 | | | | $2.16 | | | | $2.29 | | | | $2.40 | | | | $2.66 | |
| | | | |
| | | | | | | | | | | | | | | | | | | | | |
| |
Total Return, at Net Asset Value2 | | | 26.44% | | | | (2.72)% | | | | 3.11% | | | | (7.15)% | | | | 25.71% | |
| | | | | | | | | | | | | | | | | | | | | |
| |
Ratios/Supplemental Data | | | | | | | | | | | | | | | | | | | | |
Net assets, end of period (in thousands) | | | $239,042 | | | | $175,633 | | | | $169,292 | | | | $145,515 | | | | $118,060 | |
| |
Average net assets (in thousands) | | | $213,440 | | | | $174,834 | | | | $165,226 | | | | $128,694 | | | | $88,647 | |
| |
Ratios to average net assets:3 | | | | | | | | | | | | | | | | | | | | |
Net investment income | | | 0.60% | | | | 0.99% | | | | 0.79% | | | | 0.85% | | | | 0.89% | |
Expenses excluding specific expenses listed below | | | 1.33% | | | | 1.34% | | | | 1.33% | | | | 1.32% | | | | 1.34% | |
Interest and fees from borrowings | | | 0.00%4 | | | | 0.00%4 | | | | 0.00%4 | | | | 0.00% | | | | 0.00% | |
| | | | |
Total expenses5 | | | 1.33% | | | | 1.34% | | | | 1.33% | | | | 1.32% | | | | 1.34% | |
| Expenses after payments, waivers and/or reimbursements and reduction to custodian expenses | | | 1.25% | | | | 1.25% | | | | 1.25% | | | | 1.25% | | | | 1.25% | |
| |
Portfolio turnover rate | | | 27% | | | | 15% | | | | 24% | | | | 41% | | | | 32% | |
1. Per share amounts calculated based on the average shares outstanding during the period.
2. Assumes an initial investment on the business day before the first day of the fiscal period, with all dividends and distributions reinvested in additional shares on the reinvestment date, and redemption at the net asset value calculated on the last business day of the fiscal period. Total returns are not annualized for periods less than one full year. Total return information does not reflect expenses that apply at the separate account level or to related insurance products. Inclusion of these charges would reduce the total return figures for all periods shown. Returns do not reflect the deduction of taxes that a shareholder would pay on fund distributions or the redemption of fund shares.
3. Annualized for periods less than one full year.
4. Less than 0.005%.
5. Total expenses including indirect expenses from affiliated fund fees and expenses were as follows:
| | | | |
Year Ended December 31, 2017 | | | 1.33 | % |
Year Ended December 31, 2016 | | | 1.34 | % |
Year Ended December 31, 2015 | | | 1.33 | % |
Year Ended December 31, 2014 | | | 1.32 | % |
Year Ended December 31, 2013 | | | 1.34 | % |
See accompanying Notes to Financial Statements.
14 OPPENHEIMER INTERNATIONAL GROWTH FUND/VA
NOTES TO FINANCIAL STATEMENTS December 31, 2017
1. Organization
Oppenheimer International Growth Fund/VA (the “Fund”), is a separate series of Oppenheimer Variable Account Funds, which is registered under the Investment Company Act of 1940 (“1940 Act”), as amended, as a diversified open-end management investment company. The Fund’s investment objective is to seek capital appreciation. The Fund’s investment adviser is OFI Global Asset Management, Inc. (“OFI Global” or the “Manager”), a wholly-owned subsidiary of OppenheimerFunds, Inc. (“OFI” or the “Sub-Adviser”). The Manager has entered into a sub-advisory agreement with OFI.
Shares of the Fund are sold only to separate accounts of life insurance companies.
The Fund offers two classes of shares. Both classes are sold at their offering price, which is the net asset value per share, to separate investment accounts of participating insurance companies as an underlying investment for variable life insurance policies, variable annuity contracts or other investment products. The class of shares designated as Service shares is subject to a distribution and service plan. Both classes of shares have identical rights and voting privileges with respect to the Fund in general and exclusive voting rights on matters that affect that class alone. Earnings, net assets and net asset value per share may differ due to each class having its own expenses, such as transfer and shareholder servicing agent fees and shareholder communications, directly attributable to that class.
The following is a summary of significant accounting policies followed in the Fund’s preparation of financial statements in accordance with accounting principles generally accepted in the United States (“U.S. GAAP”).
2. Significant Accounting Policies
Security Valuation. All investments in securities are recorded at their estimated fair value, as described in Note 3.
Foreign Currency Translation. The books and records of the Fund are maintained in U.S. dollars. Any foreign currency amounts are translated into U.S. dollars on the following basis:
(1) Value of investment securities, other assets and liabilities — at the exchange rates prevailing at Market Close as described in Note 3.
(2) Purchases and sales of investment securities, income and expenses — at the rates of exchange prevailing on the respective dates of such transactions.
Although the net assets and the values are presented at the foreign exchange rates at Market Close, the Fund does not isolate the portion of the results of operations resulting from changes in foreign exchange rates on investments from the fluctuations arising from changes in prices of securities held. Such fluctuations are included with the net realized and unrealized gains or losses from investments shown in the Statement of Operations.
For securities, which are subject to foreign withholding tax upon disposition, realized gains or losses on such securities are recorded net of foreign withholding tax.
Reported net realized foreign exchange gains or losses arise from sales of foreign currencies, currency gains or losses realized between the trade and settlement dates on securities transactions, the difference between the amounts of dividends, interest, and foreign withholding tax reclaims recorded on the Fund’s books, and the U.S. dollar equivalent of the amounts actually received or paid. Net unrealized foreign exchange gains and losses arise from changes in the value of assets and liabilities other than investments in securities, resulting from changes in the exchange rate.
Allocation of Income, Expenses, Gains and Losses. Income, expenses (other than those attributable to a specific class), gains and losses are allocated on a daily basis to each class of shares based upon the relative proportion of net assets represented by such class. Operating expenses directly attributable to a specific class are charged against the operations of that class.
Dividends and Distributions to Shareholders. Dividends and distributions to shareholders, which are determined in accordance with income tax regulations and may differ from U.S. GAAP, are recorded on the ex-dividend date. Income and capital gain distributions, if any, are declared and paid annually or at other times as determined necessary by the Manager.
Investment Income. Dividend income is recorded on the ex-dividend date or upon ex-dividend notification in the case of certain foreign dividends where the ex-dividend date may have passed. Non-cash dividends included in dividend income, if any, are recorded at the fair value of the securities received. Withholding taxes on foreign dividends, if any, and capital gains taxes on foreign investments, if any, have been provided for in accordance with the Fund’s understanding of the applicable tax rules and regulations. Interest income, if any, is recognized on an accrual basis. Discount and premium, which are included in interest income on the Statement of Operations, are amortized or accreted daily.
Custodian Fees. “Custodian fees and expenses” in the Statement of Operations may include interest expense incurred by the Fund on any cash overdrafts of its custodian account during the period. Such cash overdrafts may result from the effects of failed trades in portfolio securities and from cash outflows resulting from unanticipated shareholder redemption activity. The Fund pays interest to its custodian on such cash overdrafts, to the extent they are not offset by positive cash balances maintained by the Fund, at a rate equal to the Federal Funds Rate plus 2.00%. The “Reduction to custodian expenses” line item, if applicable, represents earnings on cash balances maintained by the Fund during the period. Such interest expense and other custodian fees may be paid with these earnings.
Security Transactions. Security transactions are recorded on the trade date. Realized gains and losses on securities sold are determined on the basis of identified cost.
Indemnifications. The Fund’s organizational documents provide current and former Trustees and officers with a limited indemnification against
15 OPPENHEIMER INTERNATIONAL GROWTH FUND/VA
NOTES TO FINANCIAL STATEMENTS Continued
2. Significant Accounting Policies (Continued)
liabilities arising in connection with the performance of their duties to the Fund. In the normal course of business, the Fund may also enter into contracts that provide general indemnifications. The Fund’s maximum exposure under these arrangements is unknown as this would be dependent on future claims that may be made against the Fund. The risk of material loss from such claims is considered remote.
Federal Taxes. The Fund intends to comply with provisions of the Internal Revenue Code applicable to regulated investment companies and to distribute substantially all of its investment company taxable income, including any net realized gain on investments not offset by capital loss carryforwards, if any, to shareholders. Therefore, no federal income or excise tax provision is required. The Fund files income tax returns in U.S. federal and applicable state jurisdictions. The statute of limitations on the Fund’s tax return filings generally remains open for the three preceding fiscal reporting period ends. The Fund has analyzed its tax positions for the fiscal year ended December 31, 2017, including open tax years, and does not believe there are any uncertain tax positions requiring recognition in the Fund’s financial statements.
The tax components of capital shown in the following table represent distribution requirements the Fund must satisfy under the income tax regulations, losses the Fund may be able to offset against income and gains realized in future years and unrealized appreciation or depreciation of securities and other investments for federal income tax purposes.
| | | | | | | | | | | | |
Undistributed Net Investment Income | | Undistributed
Long-Term
Gain | | | Accumulated
Loss
Carryforward1,2 | | | Net Unrealized
Appreciation
Based on cost of
Securities and
Other Investments
for Federal Income
Tax Purposes | |
| |
$4,562,242 | | | $10,181,143 | | | | $— | | | | $223,085,439 | |
1. During the reporting period, the Fund utilized $417,148 of capital loss carryforward to offset capital gains realized in that fiscal year.
2. During the previous reporting period, the Fund did not utilize any capital loss carryforward.
Net investment income (loss) and net realized gain (loss) may differ for financial statement and tax purposes. The character of dividends and distributions made during the fiscal year from net investment income or net realized gains are determined in accordance with federal income tax requirements, which may differ from the character of net investment income or net realized gains presented in those financial statements in accordance with U.S. GAAP. Also, due to timing of dividends and distributions, the fiscal year in which amounts are distributed may differ from the fiscal year in which the income or net realized gain was recorded by the Fund.
Accordingly, the following amounts have been reclassified for the reporting period. Net assets of the Fund were unaffected by the reclassifications.
| | | | | | | | |
Increase to Paid-in Capital | | Reduction to Accumulated
Net Investment
Income | | | Reduction to Accumulated Net
Realized Gain on
Investments3 | |
| |
$1,073,985 | | | $82,739 | | | | $991,246 | |
3. $1,073,984, including $1,031,538 of long-term capital gain, was distributed in connection with Fund share redemptions.
The tax character of distributions paid during the reporting periods:
| | | | | | | | |
| | | Year Ended
December 31, 2017 | | | Year Ended
December 31, 2016 | |
| |
Distributions paid from: | | | | | | | | |
Ordinary income | | $ | 7,294,028 | | | $ | 4,858,159 | |
Long-term capital gain | | | — | | | | 11,251,425 | |
| | | | |
Total | | $ | 7,294,028 | | | $ | 16,109,584 | |
| | | | |
The aggregate cost of securities and other investments and the composition of unrealized appreciation and depreciation of securities and other investments for federal income tax purposes at period end are noted in the following table. The primary difference between book and tax appreciation or depreciation of securities and other investments, if applicable, is attributable to the tax deferral of losses or tax realization of financial statement unrealized gain or loss.
| | | | |
Federal tax cost of securities | | $ | 367,157,776 | |
Federal tax cost of other investments | | | 8 | |
| | | | |
Total federal tax cost | | $ | 367,157,784 | |
| | | | |
Gross unrealized appreciation | | $ | 247,421,551 | |
Gross unrealized depreciation | | | (24,336,112 | ) |
| | | | |
Net unrealized appreciation | | $ | 223,085,439 | |
| | | | |
Certain foreign countries impose a tax on capital gains which is accrued by the Fund based on unrealized appreciation, if any, on affected securities. The tax is paid when the gain is realized.
16 OPPENHEIMER INTERNATIONAL GROWTH FUND/VA
2.. Significant Accounting Policies (Continued)
Use of Estimates. The preparation of financial statements in conformity with U.S. GAAP requires management to make estimates and assumptions that affect the reported amounts of assets and liabilities and disclosure of contingent assets and liabilities at the date of the financial statements and the reported amounts of increases and decreases in net assets from operations during the reporting period. Actual results could differ from those estimates.
3. Securities Valuation
The Fund calculates the net asset value of its shares as of 4:00 P.M. Eastern time, on each day the New York Stock Exchange (the “Exchange”) is open for trading, except in the case of a scheduled early closing of the Exchange, in which case the Fund will calculate net asset value of the shares as of the scheduled early closing time of the Exchange.
The Fund’s Board has adopted procedures for the valuation of the Fund’s securities and has delegated the day-to-day responsibility for valuation determinations under those procedures to the Manager. The Manager has established a Valuation Committee which is responsible for determining a fair valuation for any security for which market quotations are not readily available. The Valuation Committee’s fair valuation determinations are subject to review, approval and ratification by the Fund’s Board at least quarterly or more frequently, if necessary.
Valuation Methods and Inputs
Securities are valued primarily using unadjusted quoted market prices, when available, as supplied by third party pricing services or broker-dealers.
The following methodologies are used to determine the market value or the fair value of the types of securities described below:
Equity securities traded on a securities exchange (including exchange-traded derivatives other than futures and futures options) are valued based on the official closing price on the principal exchange on which the security is traded, as identified by the Manager, prior to the time when the Fund’s assets are valued. If the official closing price is unavailable, the security is valued at the last sale price on the principal exchange on which it is traded, or if no sales occurred, the security is valued at the mean between the quoted bid and asked prices. Over-the-counter equity securities are valued at the last published sale price, or if no sales occurred, at the mean between the quoted bid and asked prices. Events occurring after the close of trading on foreign exchanges may result in adjustments to the valuation of foreign securities to more accurately reflect their fair value as of the time when the Fund’s assets are valued.
Shares of a registered investment company that are not traded on an exchange are valued at that investment company’s net asset value per share.
Securities for which market quotations are not readily available, or when a significant event has occurred that would materially affect the value of the security, are fair valued either (i) by a standardized fair valuation methodology applicable to the security type or the significant event as previously approved by the Valuation Committee and the Fund’s Board or (ii) as determined in good faith by the Manager’s Valuation Committee. The Valuation Committee considers all relevant facts that are reasonably available, through either public information or information available to the Manager, when determining the fair value of a security. Those standardized fair valuation methodologies include, but are not limited to, valuing securities at the last sale price or initially at cost and subsequently adjusting the value based on: changes in company specific fundamentals, changes in an appropriate securities index, or changes in the value of similar securities which may be further adjusted for any discounts related to security-specific resale restrictions. When possible, such methodologies use observable market inputs such as unadjusted quoted prices of similar securities, observable interest rates, currency rates and yield curves. The methodologies used for valuing securities are not necessarily an indication of the risks associated with investing in those securities nor can it be assured that the Fund can obtain the fair value assigned to a security if it were to sell the security.
Classifications
Each investment asset or liability of the Fund is assigned a level at measurement date based on the significance and source of the inputs to its valuation. Various data inputs may be used in determining the value of each of the Fund’s investments as of the reporting period end. These data inputs are categorized in the following hierarchy under applicable financial accounting standards:
1) Level 1-unadjusted quoted prices in active markets for identical assets or liabilities (including securities actively traded on a securities exchange)
2) Level 2-inputs other than unadjusted quoted prices that are observable for the asset or liability (such as unadjusted quoted prices for similar assets and market corroborated inputs such as interest rates, prepayment speeds, credit risks, etc.)
3) Level 3-significant unobservable inputs (including the Manager’s own judgments about assumptions that market participants would use in pricing the asset or liability).
The inputs used for valuing securities are not necessarily an indication of the risks associated with investing in those securities.
The Fund classifies each of its investments in investment companies which are publicly offered as Level 1. Investment companies that are not publicly offered, if any, are classified as Level 2 in the fair value hierarchy.
The table below categorizes amounts that are included in the Fund’s Statement of Assets and Liabilities at period end based on valuation input level:
| | | | | | | | | | | | | | | | |
| | | Level 1— Unadjusted
Quoted Prices | | | Level 2—
Other Significant
Observable Inputs | | | Level 3—
Significant
Unobservable
Inputs | | | Value | |
| |
Assets Table | | | | | | | | | | | | | | | | |
Investments, at Value: | | | | | | | | | | | | | | | | |
Common Stocks | | | | | | | | | | | | | | | | |
Consumer Discretionary | | | $ 17,991,495 | | | | $ 124,697,336 | | | | $ — | | | | $142,688,831 | |
17 OPPENHEIMER INTERNATIONAL GROWTH FUND/VA
NOTES TO FINANCIAL STATEMENTS Continued
3. Securities Valuation (Continued)
| | | | | | | | | | | | | | | | |
| | | Level 1—
Unadjusted
Quoted Prices | | | Level 2—
Other Significant
Observable Inputs | | | Level 3—
Significant
Unobservable
Inputs | | | Value | |
| |
Common Stocks (Continued) | | | | | | | | | | | | | | | | |
Consumer Staples | | $ | 13,857,920 | | | $ | 55,082,076 | | | $ | — | | | $ | 68,939,996 | |
Energy | | | — | | | | 7,006,452 | | | | — | | | | 7,006,452 | |
Financials | | | 7,817,500 | | | | 29,176,242 | | | | — | | | | 36,993,742 | |
Health Care | | | — | | | | 63,209,712 | | | | — | | | | 63,209,712 | |
Industrials | | | — | | | | 96,635,483 | | | | — | | | | 96,635,483 | |
Information Technology | | | 6,916,221 | | | | 122,527,743 | | | | — | | | | 129,443,964 | |
Materials | | | 7,151,602 | | | | 19,834,302 | | | | — | | | | 26,985,904 | |
Telecommunication Services | | | — | | | | 16,884,974 | | | | — | | | | 16,884,974 | |
Preferred Stock | | | 93,931 | | | | — | | | | — | | | | 93,931 | |
Investment Company | | | 1,843,768 | | | | — | | | | — | | | | 1,843,768 | |
| | | | |
Total Assets | | $ | 55,672,437 | | | $ | 535,054,320 | | | $ | — | | | $ | 590,726,757 | |
| | | | |
Forward currency exchange contracts and futures contracts, if any, are reported at their unrealized appreciation/depreciation at measurement date, which represents the change in the contract’s value from trade date. All additional assets and liabilities included in the above table are reported at their market value at measurement date.
The table below shows the transfers between Level 1 and Level 2. The Fund’s policy is to recognize transfers in and transfers out as of the beginning of the reporting period.
| | | | | | | | |
| | | Transfers out of Level 1* | | | Transfers into Level 2* | |
| |
Assets Table | | | | | | | | |
Investments, at Value: | | | | | | | | |
Financials | | $ | (2,706,840 | ) | | $ | 2,706,840 | |
| | | | |
Total Assets | | $ | (2,706,840 | ) | | $ | 2,706,840 | |
| | | | |
* Transfers from Level 1 to Level 2 are a result of a change in pricing methodology to the use of a valuation determined based on observable market information other than quoted prices from an active market due to a lack of available unadjusted quoted prices.
4. Investments and Risks
Risks of Foreign Investing. The Fund may invest in foreign securities which are subject to special risks. Securities traded in foreign markets may be less liquid and more volatile than those traded in U.S. markets. Foreign issuers are usually not subject to the same accounting and disclosure requirements that U.S. companies are subject to, which may make it difficult for the Fund to evaluate a foreign company’s operations or financial condition. A change in the value of a foreign currency against the U.S. dollar will result in a change in the U.S. dollar value of investments denominated in that foreign currency and in the value of any income or distributions the Fund may receive on those investments. The value of foreign investments may be affected by exchange control regulations, foreign taxes, higher transaction and other costs, delays in the settlement of transactions, changes in economic or monetary policy in the United States or abroad, expropriation or nationalization of a company’s assets, or other political and economic factors. In addition, due to the inter-relationship of global economies and financial markets, changes in political and economic factors in one country or region could adversely affect conditions in another country or region. Investments in foreign securities may also expose the Fund to time-zone arbitrage risk. Foreign securities may trade on weekends or other days when the Fund does not price its shares. At times, the Fund may emphasize investments in a particular country or region and may be subject to greater risks from adverse events that occur in that country or region. Foreign securities and foreign currencies held in foreign banks and securities depositories may be subject to limited or no regulatory oversight.
Investments in Affiliated Funds. The Fund is permitted to invest in other mutual funds advised by the Manager (“Affiliated Funds”). Affiliated Funds are open-end management investment companies registered under the 1940 Act, as amended. The Manager is the investment adviser of, and the Sub-Adviser provides investment and related advisory services to, the Affiliated Funds. When applicable, the Fund’s investments in Affiliated Funds are included in the Statement of Investments. Shares of Affiliated Funds are valued at their net asset value per share. As a shareholder, the Fund is subject to its proportional share of the Affiliated Funds’ expenses, including their management fee. The Manager will waive fees and/or reimburse Fund expenses in an amount equal to the indirect management fees incurred through the Fund’s investment in the Affiliated Funds.
Each of the Affiliated Funds in which the Fund invests has its own investment risks, and those risks can affect the value of the Fund’s investments and therefore the value of the Fund’s shares. To the extent that the Fund invests more of its assets in one Affiliated Fund than in another, the Fund will have greater exposure to the risks of that Affiliated Fund.
Investments in Money Market Instruments. The Fund is permitted to invest its free cash balances in money market instruments to provide liquidity or for defensive purposes. The Fund may invest in money market instruments by investing in Class E shares of Oppenheimer Institutional Government Money Market Fund (“IGMMF”), which is an Affiliated Fund. IGMMF is regulated as a money market fund under the 1940 Act, as amended. The Fund may also invest in money market instruments directly or in other affiliated or unaffiliated money market funds.
18 OPPENHEIMER INTERNATIONAL GROWTH FUND/VA
4. Investments and Risks (Continued)
Equity Security Risk. Stocks and other equity securities fluctuate in price. The value of the Fund’s portfolio may be affected by changes in the equity markets generally. Equity markets may experience significant short-term volatility and may fall sharply at times. Different markets may behave differently from each other and U.S. equity markets may move in the opposite direction from one or more foreign stock markets. Adverse events in any part of the equity or fixed-income markets may have unexpected negative effects on other market segments.
The prices of individual equity securities generally do not all move in the same direction at the same time and a variety of factors can affect the price of a particular company’s securities. These factors may include, but are not limited to, poor earnings reports, a loss of customers, litigation against the company, general unfavorable performance of the company’s sector or industry, or changes in government regulations affecting the company or its industry.
Shareholder Concentration. At period end, one shareholder owned 20% or more of the Fund’s total outstanding shares.
The shareholder is a related party of the Fund. Related parties may include, but are not limited to, the investment manager and its affiliates, affiliated broker dealers, fund of funds, and directors or employees. Related parties owned 38% of the Fund’s total outstanding shares at period end.
5. Market Risk Factors
The Fund’s investments in securities and/or financial derivatives may expose the Fund to various market risk factors:
Commodity Risk. Commodity risk relates to the change in value of commodities or commodity indexes as they relate to increases or decreases in the commodities market. Commodities are physical assets that have tangible properties. Examples of these types of assets are crude oil, heating oil, metals, livestock, and agricultural products.
Credit Risk. Credit risk relates to the ability of the issuer of debt to meet interest and principal payments, or both, as they come due. In general, lower-grade, higher-yield debt securities are subject to credit risk to a greater extent than lower-yield, higher-quality securities.
Equity Risk. Equity risk relates to the change in value of equity securities as they relate to increases or decreases in the general market.
Foreign Exchange Rate Risk. Foreign exchange rate risk relates to the change in the U.S. dollar value of a security held that is denominated in a foreign currency. The U.S. dollar value of a foreign currency denominated security will decrease as the dollar appreciates against the currency, while the U.S. dollar value will increase as the dollar depreciates against the currency.
Interest Rate Risk. Interest rate risk refers to the fluctuations in value of fixed-income securities resulting from the inverse relationship between price and yield. For example, an increase in general interest rates will tend to reduce the market value of already issued fixed-income investments, and a decline in general interest rates will tend to increase their value. In addition, debt securities with longer maturities, which tend to have higher yields, are subject to potentially greater fluctuations in value from changes in interest rates than obligations with shorter maturities.
Volatility Risk. Volatility risk refers to the magnitude of the movement, but not the direction of the movement, in a financial instrument’s price over a defined time period. Large increases or decreases in a financial instrument’s price over a relative time period typically indicate greater volatility risk, while small increases or decreases in its price typically indicate lower volatility risk.
6. Shares of Beneficial Interest
The Fund has authorized an unlimited number of $0.001 par value shares of beneficial interest of each class. Transactions in shares of beneficial interest were as follows:
| | | | | | | | | | | | | | | | | | | | | | | | |
| | | | | | | | | Year Ended December 31, 2017 | | | Year Ended December 31, 2016 | |
| | | | | | | | | Shares | | | Amount | | | Shares | | | Amount | |
| |
| Non-Service Shares | | | | | | | | | | | | | | | | | | | | | | | | |
| Sold | | | | | | | | | | | 22,026,198 | | | $ | 51,090,812 | | | | 22,953,697 | | | $ | 47,962,883 | |
| Dividends and/or distributions reinvested | | | | | | | | | | | 2,045,409 | | | | 4,868,321 | | | | 4,989,924 | | | | 10,628,539 | |
| Redeemed | | | | | | | | | | | (30,252,278 | ) | | | (70,738,451 | ) | | | (27,048,722 | ) | | | (57,802,510 | ) |
| | | | |
| Net increase (decrease) | | | | | | | | | | | (6,180,671 | ) | | $ | (14,779,318 | ) | | | 894,899 | | | $ | 788,912 | |
| | | | |
| |
| Service Shares | | | | | | | | | | | | | | | | | | | | | | | | |
| Sold | | | | | | | | | | | 23,171,844 | | | $ | 56,773,388 | | | | 20,232,575 | | | $ | 45,018,434 | |
| Dividends and/or distributions reinvested | | | | | | | | | | | 978,108 | | | | 2,425,707 | | | | 2,468,939 | | | | 5,481,045 | |
| Redeemed | | | | | | | | | | | (16,813,549 | ) | | | (41,691,854 | ) | | | (15,460,315 | ) | | | (34,540,252 | ) |
| | | | |
| Net increase | | | | | | | | | | | 7,336,403 | | | $ | 17,507,241 | | | | 7,241,199 | | | $ | 15,959,227 | |
| | | | |
7. Purchases and Sales of Securities
The aggregate cost of purchases and proceeds from sales of securities, other than short-term obligations and investments in IGMMF, for the reporting period were as follows:
| | | | | | | | |
| | | Purchases | | | Sales | |
| |
Investment securities | | $ | 143,344,952 | | | $ | 144,326,694 | |
19 OPPENHEIMER INTERNATIONAL GROWTH FUND/VA
NOTES TO FINANCIAL STATEMENTS Continued
8. Fees and Other Transactions with Affiliates
Management Fees. Under the investment advisory agreement, the Fund pays the Manager a management fee based on the daily net assets of the Fund at an annual rate as shown in the following table:
| | | | |
| Fee Schedule | | | | |
| |
Up to $250 million | | | 1.00% | |
Next $250 million | | | 0.90 | |
Next $500 million | | | 0.85 | |
Over $1 billion | | | 0.82 | |
The Fund’s effective management fee for the reporting period was 0.94% of average annual net assets before any applicable waivers.
Sub-Adviser Fees. The Manager has retained the Sub-Adviser to provide the day-to-day portfolio management of the Fund. Under the Sub-Advisory Agreement, the Manager pays the Sub-Adviser an annual fee in monthly installments, equal to a percentage of the investment management fee collected by the Manager from the Fund, which shall be calculated after any investment management fee waivers. The fee paid to the Sub-Adviser is paid by the Manager, not by the Fund.
Transfer Agent Fees. OFI Global (the “Transfer Agent”) serves as the transfer and shareholder servicing agent for the Fund. The Fund pays the Transfer Agent a fee based on annual net assets. Fees incurred and average net assets for each class with respect to these services are detailed in the Statement of Operations and Financial Highlights, respectively.
Sub-Transfer Agent Fees. The Transfer Agent has retained Shareholder Services, Inc., a wholly-owned subsidiary of OFI (the “Sub-Transfer Agent”), to provide the day-to-day transfer agent and shareholder servicing of the Fund. Under the Sub-Transfer Agency Agreement, the Transfer Agent pays the Sub-Transfer Agent an annual fee in monthly installments, equal to a percentage of the transfer agent fee collected by the Transfer Agent from the Fund, which shall be calculated after any applicable fee waivers. The fee paid to the Sub-Transfer Agent is paid by the Transfer Agent, not by the Fund.
Trustees’ Compensation. The Fund’s Board of Trustees (“Board”) has adopted a compensation deferral plan for Independent Trustees that enables Trustees to elect to defer receipt of all or a portion of the annual compensation they are entitled to receive from the Fund. For purposes of determining the amount owed to the Trustees under the plan, deferred amounts are treated as though equal dollar amounts had been invested in shares of the Fund or in other Oppenheimer funds selected by the Trustees. The Fund purchases shares of the funds selected for deferral by the Trustees in amounts equal to his or her deemed investment, resulting in a Fund asset equal to the deferred compensation liability. Such assets are included as a component of “Other” within the asset section of the Statement of Assets and Liabilities. Deferral of Trustees’ fees under the plan will not affect the net assets of the Fund and will not materially affect the Fund’s assets, liabilities or net investment income per share. Amounts will be deferred until distributed in accordance with the compensation deferral plan.
Distribution and Service Plan for Service Shares. The Fund has adopted a Distribution and Service Plan (the “Plan”) pursuant to Rule 12b-1 under the 1940 Act for Service shares to pay OppenheimerFunds Distributor, Inc. (the “Distributor”), for distribution related services, personal service and account maintenance for the Fund’s Service shares. Under the Plan, payments are made periodically at an annual rate of 0.25% of the daily net assets of Service shares of the Fund. The Distributor currently uses all of those fees to compensate sponsors of the insurance product that offers Fund shares, for providing personal service and maintenance of accounts of their variable contract owners that hold Service shares. These fees are paid out of the Fund’s assets on an on-going basis and increase operating expenses of the Service shares, which results in lower performance compared to the Fund’s shares that are not subject to a service fee. Fees incurred by the Fund under the Plan are detailed in the Statement of Operations.
Waivers and Reimbursements of Expenses. The Manager has contractually agreed to limit the Fund’s expenses after payments, waivers and/or reimbursements and reduction to custodian expenses, excluding any applicable dividend expense, taxes, interest and fees from borrowing, any subsidiary expenses, Acquired Fund Fees and Expenses, brokerage commissions, unusual and infrequent expenses and certain other Fund expenses; so that those expenses, as percentages of daily net assets, will not exceed the annual rate of 1.00% for Non-Service shares and 1.25% for Service shares.
During the reporting period, the Manager waived fees and/or reimbursed the Fund as follows:
| | | | |
Non-Service shares | | $ | 266,359 | |
Service shares | | | 167,890 | |
This fee waiver and/or expense reimbursement may not be amended or withdrawn for one year from the date of the Fund’s prospectus, unless approved by the Board.
The Manager will waive fees and/or reimburse Fund expenses in an amount equal to the indirect management fees incurred through the Fund’s investment in IGMMF. During the reporting period, the Manager waived fees and/or reimbursed the Fund $14,145 for IGMMF management fees. This fee waiver and/or expense reimbursement may not be amended or withdrawn for one year from the date of the Fund’s prospectus, unless approved by the Board.
20 OPPENHEIMER INTERNATIONAL GROWTH FUND/VA
9. Borrowings and Other Financing
Joint Credit Facility. A number of mutual funds managed by the Manager participate in a $1.875 billion revolving credit facility (the “Facility”) intended to provide short-term financing, if necessary, subject to certain restrictions in connection with atypical redemption activity. Expenses and fees related to the Facility are paid by the participating funds and are disclosed separately or as other expenses on the Statement of Operations. The Fund did not utilize the Facility during the reporting period.
21 OPPENHEIMER INTERNATIONAL GROWTH FUND/VA
REPORT OF INDEPENDENT REGISTERED PUBLIC ACCOUNTING FIRM
To the Shareholders and Board of Trustees
Oppenheimer Variable Account Funds:
Opinion on the Financial Statements
We have audited the accompanying statement of assets and liabilities of Oppenheimer International Growth Fund/VA, a separate series of Oppenheimer Variable Account Funds, (the “Fund”), including the statement of investments, as of December 31, 2017, the related statement of operations for the year then ended, the statements of changes in net assets for each of the years in the two year period then ended, and the related notes (collectively, the “financial statements”) and the financial highlights for each of the years in the five year period then ended. In our opinion, the financial statements and financial highlights present fairly, in all material respects, the financial position of the Fund as of December 31, 2017, the results of its operations for the year then ended, the changes in its net assets for each of the years in the two year period then ended, and the financial highlights for each of the years in the five year period then ended, in conformity with U.S. generally accepted accounting principles.
Basis for Opinion
These financial statements and financial highlights are the responsibility of the Fund’s management. Our responsibility is to express an opinion on these financial statements and financial highlights based on our audits. We are a public accounting firm registered with the Public Company Accounting Oversight Board (United States) (“PCAOB”) and are required to be independent with respect to the Fund in accordance with the U.S. federal securities laws and the applicable rules and regulations of the Securities and Exchange Commission and the PCAOB.
We conducted our audits in accordance with the standards of the PCAOB. Those standards require that we plan and perform the audit to obtain reasonable assurance about whether the financial statements and financial highlights are free of material misstatement, whether due to error or fraud. Our audits included performing procedures to assess the risks of material misstatement of the financial statements and financial highlights, whether due to error or fraud, and performing procedures that respond to those risks. Such procedures included examining, on a test basis, evidence regarding the amounts and disclosures in the financial statements and financial highlights. Such procedures also included confirmation of securities owned as of December 31, 2017, by correspondence with the custodian, brokers and the transfer agent, or by other appropriate auditing procedures. Our audits also included evaluating the accounting principles used and significant estimates made by management, as well as evaluating the overall presentation of the financial statements and financial highlights. We believe that our audits provide a reasonable basis for our opinion.
KPMG LLP
We have not been able to determine the specific year that we began serving as the auditor of one or more Oppenheimer Funds investment companies, however we are aware that we have served as the auditor of one or more Oppenheimer Funds investment companies since at least 1969.
Denver, Colorado
February 13, 2018
22 OPPENHEIMER INTERNATIONAL GROWTH FUND/VA
FEDERAL INCOME TAX INFORMATION Unaudited
In early 2018, if applicable, shareholders of record received information regarding all dividends and distributions paid to them by the Fund during calendar year 2017.
None of the dividends paid by the Fund during the reporting period are eligible for the corporate dividend-received deduction.
The foregoing information is presented to assist shareholders in reporting distributions received from the Fund to the Internal Revenue Service. Because of the complexity of the federal regulations which may affect your individual tax return and the many variations in state and local tax regulations, we recommend that you consult your tax advisor for specific guidance.
23 OPPENHEIMER INTERNATIONAL GROWTH FUND/VA
BOARD APPROVAL OF THE FUND’S INVESTMENT ADVISORY AND SUB-ADVISORY AGREEMENTS Unaudited
The Fund has entered into an investment advisory agreement with OFI Global Asset Management, Inc. (“OFI Global” or the “Adviser”), a wholly-owned subsidiary of OppenheimerFunds, Inc. (“OFI” or the “Sub-Adviser”) (“OFI Global” and “OFI” together, the “Managers”) and OFI Global has entered into a sub-advisory agreement with OFI whereby OFI provides investment sub-advisory services to the Fund (collectively, the “Agreements”). Each year, the Board of Trustees (the “Board”), including a majority of the independent Trustees, is required to determine whether to approve the terms of the Agreements and the renewal thereof. The Investment Company Act of 1940, as amended, requires that the Board request and evaluate, and that the Managers provide, such information as may be reasonably necessary to evaluate the terms of the Agreements. The Board employs an independent consultant to prepare a report that provides information, including comparative information that the Board requests for that purpose. In addition to in-person meetings focused on this evaluation, the Board receives information throughout the year regarding Fund services, fees, expenses and performance.
The Managers and the independent consultant provided information to the Board on the following factors: (i) the nature, quality and extent of the Managers’ services, (ii) the comparative investment performance of the Fund and the Managers, (iii) the fees and expenses of the Fund, including comparative fee and expense information, (iv) the profitability of the Managers and their affiliates, including an analysis of the cost of providing services, (v) whether economies of scale are realized as the Fund grows and whether fee levels reflect these economies of scale for Fund investors and (vi) other benefits to the Managers from their relationship with the Fund. The Board was aware that there are alternatives to retaining the Managers.
Outlined below is a summary of the principal information considered by the Board as well as the Board’s conclusions.
Nature, Quality and Extent of Services. The Board considered information about the nature, quality and extent of the services provided to the Fund and information regarding the Managers’ key personnel who provide such services. The Managers’ duties include providing the Fund with the services of the portfolio managers and the Sub-Adviser’s investment team, who provide research, analysis and other advisory services in regard to the Fund’s investments; and securities trading services. OFI Global is responsible for oversight of third-party service providers; monitoring compliance with applicable Fund policies and procedures and adherence to the Fund’s investment restrictions; risk management; and oversight of the Sub-Adviser. OFI Global is also responsible for providing certain administrative services to the Fund. Those services include providing and supervising all administrative and clerical personnel who are necessary in order to provide effective corporate administration for the Fund; compiling and maintaining records with respect to the Fund’s operations; preparing and filing reports required by the U.S. Securities and Exchange Commission; preparing periodic reports regarding the operations of the Fund for its shareholders; preparing proxy materials for shareholder meetings; and preparing the registration statements required by federal and state securities laws for the sale of the Fund’s shares. OFI Global also provides the Fund with office space, facilities and equipment.
The Board also considered the quality of the services provided and the quality of the Managers’ resources that are available to the Fund. The Board took account of the fact that the Sub-Adviser has over fifty years of experience as an investment adviser and that its assets under management rank it among the top mutual fund managers in the United States. The Board evaluated the Managers’ advisory, administrative, accounting, legal, compliance and risk management services, among other services, and information the Board has received regarding the experience and professional qualifications of the Managers’ key personnel and the size and functions of their staff. In its evaluation of the quality of the portfolio management services provided, the Board considered the experience of George Evans and Robert Dunphy, the portfolio managers for the Fund, and the Sub-Adviser’s investment team and analysts. The Board members also considered the totality of their experiences with the Managers as directors or trustees of the Fund and other funds advised by the Managers. The Board considered information regarding the quality of services provided by affiliates of the Managers, which the Board members have become knowledgeable about through their experiences with the Managers and in connection with the review or renewal of the Fund’s service agreements or service providers. The Board concluded, in light of the Managers’ experience, reputation, personnel, operations and resources that the Fund benefits from the services provided under the Agreements.
Investment Performance of the Managers and the Fund. Throughout the year, the Managers provided information on the investment performance of the Fund, the Adviser and the Sub-Adviser, including comparative performance information. The Board also reviewed information, prepared by the Managers and by the independent consultant, comparing the Fund’s historical performance to relevant market indices and to the performance of other foreign large growth funds underlying variable insurance products. The Board noted that the Fund outperformed its performance category median during the one-, five- and ten-year periods, while it underperformed is category mean during the three-year period.
Fees and Expenses of the Fund. The Board reviewed the fees paid to the Adviser and the other expenses borne by the Fund. The Board noted that the Adviser, not the Fund, pays the Sub-Adviser’s fee under the sub-advisory agreement. The independent consultant provided comparative data in regard to the fees and expenses of the Fund and other foreign large growth underlying variable insurance products. In reviewing the fees and expenses charged to the VA funds, the Board considered the Adviser’s assertion that, because there is much greater disparity in the fees and services that may be provided by a manager to a VA fund as opposed to a retail fund, when comparing the expenses of the various VA funds to those of retail funds, it is most appropriate to focus on total expenses (rather than on the management fees). Accordingly, while the Board reviewed and considered all expenses, it focused on total expenses. The Board considered that the Fund’s total expenses and contractual management fee were higher than its respective peer group medians and its category medians.. The Board noted that the Adviser has contractually agreed to limit the Fund’s total annual operating expenses so that those expenses, as percentages of daily net assets, will not exceed the annual rate of 1.00% for Non-Service Shares and 1.25% for Service Shares. This contractual expense limitation may not be amended or withdrawn until one year from the date of the Fund’s prospectus, unless approved by the Board.
Economies of Scale and Profits Realized by the Managers. The Board considered information regarding the Managers’ costs in serving as the Fund’s investment adviser and sub-adviser, including the costs associated with the personnel and systems necessary to manage the Fund, and information regarding the Managers’ profitability from their relationship with the Fund. The Board also considered that the Managers must be able to pay and retain experienced professional personnel at competitive rates to provide quality services to the Fund. The Board reviewed whether the Managers may realize economies of scale in managing and supporting the Fund. The Board noted that the Fund currently has management fee breakpoints, which are intended to share with Fund shareholders economies of scale that may exist as the Fund’s assets grow.
24 OPPENHEIMER INTERNATIONAL GROWTH FUND/VA
BOARD APPROVAL OF THE FUND’S INVESTMENT ADVISORY AND SUB-ADVISORY AGREEMENTS Unaudited / Continued
Other Benefits to the Managers. In addition to considering the profits realized by the Managers, the Board considered information that was provided regarding the direct and indirect benefits the Managers receive as a result of their relationship with the Fund, including compensation paid to the Managers’ affiliates and research provided to the Adviser in connection with permissible brokerage arrangements (soft dollar arrangements).
Conclusions. These factors were also considered by the independent Trustees meeting separately from the full Board, assisted by experienced counsel to the Fund and to the independent Trustees. Fund counsel and the independent Trustees’ counsel are independent of the Managers within the meaning and intent of the Securities and Exchange Commission rules.
Based on its review of the information it received and its evaluations described above, the Board, including a majority of the independent Trustees, decided to continue the Agreements through August 31, 2018. In arriving at its decision, the Board did not identify any factor or factors as being more important than others, but considered all of the above information, and considered the terms and conditions of the Agreements, including the management fees, in light of all the surrounding circumstances.
25 OPPENHEIMER INTERNATIONAL GROWTH FUND/VA
PORTFOLIO PROXY VOTING POLICIES AND GUIDELINES; UPDATES TO STATEMENTS OF INVESTMENTS Unaudited
The Fund has adopted Portfolio Proxy Voting Policies and Guidelines under which the Fund votes proxies relating to securities (“portfolio proxies”) held by the Fund. A description of the Fund’s Portfolio Proxy Voting Policies and Guidelines is available (i) without charge, upon request, by calling the Fund toll-free at 1.800. CALL OPP (225.5677), (ii) on the Fund’s website at www.oppenheimerfunds.com, and (iii) on the SEC’s website at www.sec.gov. In addition, the Fund is required to file Form N-PX, with its complete proxy voting record for the 12 months ended June 30th, no later than August 31st of each year. The Fund’s voting record is available (i) without charge, upon request, by calling the Fund toll-free at 1.800. CALL OPP (225.5677), and (ii) in the Form N-PX filing on the SEC’s website at www.sec.gov.
The Fund files its complete schedule of portfolio holdings with the SEC for the first quarter and the third quarter of each fiscal year on Form N-Q. The Fund’s Form N-Q filings are available on the SEC’s website at www.sec.gov. Those forms may be reviewed and copied at the SEC’s Public Reference Room in Washington, D.C. Information on the operation of the Public Reference Room may be obtained by calling 1-800-SEC-0330.
26 OPPENHEIMER INTERNATIONAL GROWTH FUND/VA
TRUSTEES AND OFFICERS Unaudited
| | |
Name, Position(s) Held with the Fund, Length of Service, Year of Birth | | Principal Occupation(s) During the Past 5 Years; Other Trusteeships/Directorships
Held; Number of Portfolios in the Fund Complex Currently Overseen |
| |
| INDEPENDENT TRUSTEES | | The address of each Trustee in the chart below is 6803 S. Tucson Way, Centennial, Colorado 80112-3924. Each Trustee serves for an indefinite term, or until his or her resignation, retirement, death or removal. |
| |
Robert J. Malone, Chairman of the Board of Trustees (since 2016), Trustee (since 2002) Year of Birth: 1944 | | Chairman - Colorado Market of MidFirst Bank (since January 2015); Chairman of the Board (2012-2016) and Director (August 2005-January 2016) of Jones International University (educational organization); Trustee of the Gallagher Family Foundation (non-profit organization) (2000-2016); Chairman, Chief Executive Officer and Director of Steele Street Bank Trust (commercial banking) (August 2003-January 2015); Director of Opera Colorado Foundation (non-profit organization) (2008-2012); Director of Colorado UpLIFT (charitable organization) (1986-2010); Director of Jones Knowledge, Inc. (2006-2010); Former Chairman of U.S. Bank-Colorado (subsidiary of U.S. Bancorp and formerly Colorado National Bank) (July 1996-April 1999); Director of Commercial Assets, Inc. (real estate investment trust) (1993-2000); Director of U.S. Exploration, Inc. (oil and gas exploration) (1997-February 2004); Chairman of the Board (1991-1994) and Trustee (1985-1994) of Regis University; and Chairman of the Board (1990-1991) and Member (1984-1999) of Young Presidents Organization. Oversees 54 portfolios in the OppenheimerFunds complex. Mr. Malone has served on the Boards of certain Oppenheimer funds since 2002, during which time he has become familiar with the Fund’s (and other Oppenheimer funds’) financial, accounting, regulatory and investment matters and has contributed to the Boards’ deliberations. |
| |
Andrew J. Donohue, Trustee (since 2017) Year of Birth: 1950 | | Of Counsel, Shearman & Sterling LLP (since September 2017); Chief of Staff of the U.S. Securities and Exchange Commission (regulator) (June 2015-February 2017); Managing Director and Investment Company General Counsel of Goldman Sachs (investment bank) (November 2012-May 2015); Partner at Morgan Lewis & Bockius, LLP (law firm) (March 2011-October 2012); Director of the Division of Investment Management of U.S. Securities and Exchange Commission (regulator) (May 2006-November 2010); Global General Counsel of Merrill Lynch Investment Managers (investment firm) (May 2003-May 2006); General Counsel (October 1991-November 2001) and Executive Vice President (January 1993-November 2001) of OppenheimerFunds, Inc. (investment firm) (June 1991-November 2001). Oversees 54 portfolios in the OppenheimerFunds complex. Mr. Donohue has served on the Boards of certain Oppenheimer funds since 2017, during which time he has become familiar with the Fund’s (and other Oppenheimer funds’) financial, accounting, regulatory and investment matters and has contributed to the Boards’ deliberations. |
| |
Jon S. Fossel, Trustee (since 1990) Year of Birth: 1942 | | Chairman of the Board of Jack Creek Preserve Foundation (non-profit organization) (2005-2015); Director of Jack Creek Preserve Foundation (non-profit organization) (since March 2005); Chairman of the Board (2006-December 2011) and Director (June 2002-December 2011) of UNUMProvident (insurance company); Director of Northwestern Energy Corp. (public utility corporation) (November 2004-December 2009); Director of P.R. Pharmaceuticals (October 1999-October 2003); Director of Rocky Mountain Elk Foundation (non-profit organization) (February 1998-February 2003 and February 2005-February 2007); Chairman and Director (until October 1996) and President and Chief Executive Officer (until October 1995) of the Sub-Adviser; President, Chief Executive Officer and Director of the following: Oppenheimer Acquisition Corp. (“OAC”) (parent holding company of the Sub-Adviser), Shareholders Services, Inc. and Shareholder Financial Services, Inc. (until October 1995). Oversees 54 portfolios in the OppenheimerFunds complex. Mr. Fossel has served on the Boards of certain Oppenheimer funds since 1990, during which time he has become familiar with the Fund’s (and other Oppenheimer funds’) financial, accounting, regulatory and investment matters and has contributed to the Boards’ deliberations. |
| |
Richard F. Grabish, Trustee (since 2012) Year of Birth: 1948 | | Formerly Senior Vice President and Assistant Director of Sales and Marketing (March 1997-December 2007), Director (March 1987-December 2007) and Manager of Private Client Services (June 1985-June 2005) of A.G. Edwards & Sons, Inc. (broker/dealer and investment firm); Chairman and Chief Executive Officer of A.G. Edwards Trust Company, FSB (March 2001-December 2007); President and Vice Chairman of A.G. Edwards Trust Company, FSB (investment adviser) (April 1987-March 2001); President of A.G. Edwards Trust Company, FSB (investment adviser) (June 2005-December 2007). Oversees 54 portfolios in the OppenheimerFunds complex. Mr. Grabish has served on the Boards of certain Oppenheimer funds since 2001, during which time he has become familiar with the Fund’s (and other Oppenheimer funds’) financial, accounting, regulatory and investment matters and has contributed to the Boards’ deliberations. |
| |
Beverly L. Hamilton, Trustee (since 2002) Year of Birth: 1946 | | Trustee of Monterey Institute for International Studies (educational organization) (2000-2014); Board Member of Middlebury College (educational organization) (December 2005-June 2011); Director (1991-2016), Vice Chairman of the Board (2006- 2009) and Chairman of the Board (2010-2013) of American Funds’ Emerging Markets Growth Fund, Inc. (mutual fund); Director of The California Endowment (philanthropic organization) (April 2002-April 2008); Director (February 2002-2005) and Chairman of Trustees (2006-2007) of the Community Hospital of Monterey Peninsula; President of ARCO Investment Management Company (February 1991-April 2000); Member of the investment committees of The Rockefeller Foundation (2001-2006) and The University of Michigan (since 2000); Advisor at Credit Suisse First Boston’s Sprout venture capital unit (venture capital fund) (1994-January 2005); Trustee of MassMutual Institutional Funds (investment company) (1996-June 2004); Trustee of MML Series Investment Fund (investment company) (April 1989-June 2004); Member of the investment committee of Hartford Hospital (2000-2003); and Advisor to Unilever (Holland) pension fund (2000-2003). Oversees 54 portfolios in the OppenheimerFunds complex. Ms. Hamilton has served on the Boards of certain Oppenheimer funds since 2002, during which time she has become familiar with the Fund’s (and other Oppenheimer funds’) financial, accounting, regulatory and investment matters and has contributed to the Boards’ deliberations. |
| |
Victoria J. Herget, Trustee (since 2012) Year of Birth: 1951 | | Board Chair (2008-2015) and Director (2004-Present), United Educators (insurance company); Trustee (since 2000) and Chair (since 2010), Newberry Library (independent research library); Trustee, Mather LifeWays (senior living organization) (since 2001); Independent Director of the First American Funds (mutual fund family) (2003-2011); former Managing Director (1993-2001), Principal (1985-1993), Vice President (1978-1985) and Assistant Vice President (1973-1978) of Zurich Scudder Investments (investment adviser) (and its predecessor firms); Trustee (1992-2007), Chair of the Board of Trustees (1999-2007), Investment Committee Chair (1994-1999) and Investment Committee member (2007-2010) of Wellesley College; Trustee, BoardSource (non-profit organization) (2006-2009) and Chicago City Day School (K-8 School) (1994-2005). Oversees 54 portfolios in the OppenheimerFunds complex. Ms. Herget has served on the Boards of certain Oppenheimer funds since 2012, during which time she has become familiar with the Fund’s (and other Oppenheimer funds’) financial, accounting, regulatory and investment matters and has contributed to the Boards’ deliberations. |
27 OPPENHEIMER INTERNATIONAL GROWTH FUND/VA
TRUSTEES AND OFFICERS Unaudited / Continued
| | |
F. William Marshall, Jr., Trustee (since 2000) Year of Birth: 1942 | | Trustee Emeritus of Worcester Polytech Institute (WPI) (private university) (since 2009); Trustee of MassMutual Select Funds (formerly MassMutual Institutional Funds) (investment company) (1996-2015), MML Series Investment Fund (investment company) (1996-2015) and Mass Mutual Premier Funds (investment company) (January 2012-December 2015); President and Treasurer of the SIS Charitable Fund (private charitable fund) (January 1999-March 2011); Former Trustee of WPI (1985- 2008); Former Chairman of the Board (2004-2006) and Former Chairman of the Investment Committee of WPI (1994-2008); Chairman of SIS Family Bank, F.S.B. (formerly SIS Bank) (commercial bank) (January 1999-July 1999); Executive Vice President of Peoples Heritage Financial Group, Inc. (commercial bank) (January 1999-July 1999); and Former President and Chief Executive Officer of SIS Bancorp. (1993-1999). Oversees 54 portfolios in the OppenheimerFunds complex. Mr. Marshall has served on the Boards of certain Oppenheimer funds since 2000, during which time he has become familiar with the Fund’s (and other Oppenheimer funds’) financial, accounting, regulatory and investment matters and has contributed to the Boards’ deliberations. |
| |
Karen L. Stuckey, Trustee (since 2012) Year of Birth: 1953 | | Member (since May 2015) of Desert Mountain Community Foundation Advisory Board (non-profit organization); Partner (1990-2012) of PricewaterhouseCoopers LLP (professional services firm) (held various positions 1975-1990); Trustee (1992- 2006); member of Executive, Nominating and Audit Committees and Chair of Finance Committee (1992-2006), and Emeritus Trustee (since 2006) of Lehigh University; and member, Women’s Investment Management Forum (professional organization) since inception. Oversees 54 portfolios in the OppenheimerFunds complex. Ms. Stuckey has served on the Boards of certain Oppenheimer funds since 2012, during which time she has become familiar with the Fund’s (and other Oppenheimer funds’) financial, accounting, regulatory and investment matters and has contributed to the Boards’ deliberations. |
| |
James D. Vaughn, Trustee (since 2012) Year of Birth: 1945 | | Retired; former managing partner (1994-2001) of Denver office of Deloitte & Touche LLP, (held various positions 1969- 1993); Trustee and Chairman of the Audit Committee of Schroder Funds (2003-2012); Board member and Chairman of Audit Committee of AMG National Trust Bank (since 2005); Trustee and Investment Committee member, University of South Dakota Foundation (since 1996); Board member, Audit Committee Member and past Board Chair, Junior Achievement (since 1993); former Board member, Mile High United Way, Boys and Girls Clubs, Boy Scouts, Colorado Business Committee for the Arts, Economic Club of Colorado and Metro Denver Network. Oversees 54 portfolios in the OppenheimerFunds complex. Mr. Vaughn has served on the Boards of certain Oppenheimer funds since 2012, during which time he has become familiar with the Fund’s (and other Oppenheimer funds’) financial, accounting, regulatory and investment matters and has contributed to the Boards’ deliberations. |
| INTERESTED TRUSTEE AND OFFICER | | Mr. Steinmetz is an “Interested Trustee” because he is affiliated with the Manager and the Sub-Adviser by virtue of his positions as Chairman and director of the Sub-Adviser and officer and director of the Manager. Both as a Trustee and as an officer, Mr. Steinmetz serves for an indefinite term, or until his resignation, retirement, death or removal. Mr. Steinmetz’s address is 225 Liberty Street, New York, New York 10281-1008. |
| |
Arthur P. Steinmetz, Trustee (since 2015), President and Principal Executive Officer (since 2014) Year of Birth: 1958 | | Chairman of the Sub-Adviser (since January 2015); CEO and Chairman of the Manager (since July 2014), President of the Manager (since May 2013), a Director of the Manager (since January 2013), Director of the Sub-Adviser (since July 2014), President, Management Director and CEO of Oppenheimer Acquisition Corp. (the Sub-Adviser’s parent holding company) (since July 2014), and President and Director of OFI SteelPath, Inc. (since January 2013). Chief Investment Officer of the OppenheimerFunds advisory entities from (January 2013-December 2013); Executive Vice President of the Manager (January 2013-May 2013); Chief Investment Officer of the Sub-Adviser (October 2010-December 2012); Chief Investment Officer, Fixed-Income, of the Sub-Adviser (April 2009-October 2010); Executive Vice President of the Sub-Adviser (October 2009-December 2012); Director of Fixed Income of the Sub-Adviser (January 2009-April 2009); and a Senior Vice President of the Sub-Adviser (March 1993-September 2009). An officer of 111 portfolios in the OppenheimerFunds complex. |
| OTHER OFFICERS OF THE FUND | | The addresses of the Officers in the chart below are as follows: for Messrs. Evans, Dunphy, Mss. Foxson and Picciotto, 225 Liberty Street, New York, New York 10281-1008, for Mr. Petersen, 6803 S. Tucson Way, Centennial, Colorado 80112-3924. Each Officer serves for an indefinite term or until his or her resignation, retirement, death or removal. |
| |
George R. Evans, Vice President (since 1999) Year of Birth: 1959 | | CIO Equities of the Sub-Adviser (since January 2013); Senior Vice President of the Sub-Adviser (since July 2004). Director of International Equities of the Sub-Adviser (since July 2004); Director of Equities of the Sub-Adviser (October 2010-December 2012); Vice President of HarbourView Asset Management Corporation (July 1994-November 2001) and Vice President of the Sub-Adviser (October 1993-July 2004). A portfolio manager and officer of other portfolios in the OppenheimerFunds complex. |
| |
Robert B. Dunphy, Vice President (since 2012) Year of Birth: 1979 | | Vice President of the Sub-Adviser (since January 2011); Senior Portfolio Manager (since May 2011); Senior Research Analyst and Assistant Vice President of the Sub-Adviser (May 2009-January 2011), and an Intermediate Research Analyst of the Sub-Adviser (January 2006-May 2009). A portfolio manager of other portfolios in the OppenheimerFunds complex. |
| |
Cynthia Lo Bessette, Secretary and Chief Legal Officer (since 2016) Year of Birth: 1969 | | Executive Vice President, General Counsel and Secretary of the Manager (since February 2016); Senior Vice President and Deputy General Counsel of the Manager (March 2015-February 2016); Chief Legal Officer of the Sub-Adviser and the Distributor (since February 2016); Vice President, General Counsel and Secretary of Oppenheimer Acquisition Corp. (since February 2016); General Counsel of OFI SteelPath, Inc., OFI Advisors, LLC and Index Management Solutions, LLC (since February 2016); Chief Legal Officer of OFI Global Institutional, Inc., HarbourView Asset Management Corporation, OFI Global Trust Company, Oppenheimer Real Asset Management, Inc., OFI Private Investments Inc., Shareholder Services, Inc. and Trinity Investment Management Corporation (since February 2016); Corporate Counsel (February 2012-March 2015) and Deputy Chief Legal Officer (April 2013-March 2015) of Jennison Associates LLC; Assistant General Counsel (April 2008-September 2009) and Deputy General Counsel (October 2009-February 2012) of Lord Abbett & Co. LLC. An officer of 111 portfolios in the OppenheimerFunds complex. |
| |
Jennifer Foxson, Vice President and Chief Business Officer (since 2014) Year of Birth: 1969 | | Senior Vice President of OppenheimerFunds Distributor, Inc. (since June 2014); Vice President of OppenheimerFunds Distributor, Inc. (April 2006-June 2014); Vice President of the Sub-Adviser (January 1998-March 2006); Assistant Vice President of the Sub-Adviser (October 1991-December 1998). An officer of 111 portfolios in the OppenheimerFunds complex. |
28 OPPENHEIMER INTERNATIONAL GROWTH FUND/VA
| | |
| |
Mary Ann Picciotto, Chief Compliance Officer and Chief Anti-Money Laundering Officer (since 2014) Year of Birth: 1973 | | Senior Vice President and Chief Compliance Officer of the Manager (since March 2014); Chief Compliance Officer of the Sub-Adviser, OFI SteelPath, Inc., OFI Global Trust Company, OFI Global Institutional, Inc., Oppenheimer Real Asset Management, Inc., OFI Private Investments, Inc., Harborview Asset Management Corporation, Trinity Investment Management Corporation, and Shareholder Services, Inc. (since March 2014); Managing Director of Morgan Stanley Investment Management Inc. and certain of its various affiliated entities; Chief Compliance Officer of various Morgan Stanley Funds (May 2010-January 2014); Chief Compliance Officer of Morgan Stanley Investment Management Inc. (April 2007-January 2014). An officer of 111 portfolios in the OppenheimerFunds complex. |
| |
Brian S. Petersen, Treasurer and Principal Financial & Accounting Officer (since 2016) Year of Birth: 1970 | | Senior Vice President of the Manager (since January 2017); Vice President of the Manager (January 2013-January 2017); Vice President of the Sub-Adviser (February 2007-December 2012); Assistant Vice President of the Sub-Adviser (August 2002- 2007). An officer of 111 portfolios in the OppenheimerFunds complex. |
The Fund’s Statement of Additional Information contains additional information about the Fund’s Trustees and Officers and is available without charge, upon request, by calling 1.800.988.8287.
29 OPPENHEIMER INTERNATIONAL GROWTH FUND/VA
THIS PAGE INTENTIONALLY LEFT BLANK.
30 OPPENHEIMER INTERNATIONAL GROWTH FUND/VA
THIS PAGE INTENTIONALLY LEFT BLANK.
31 OPPENHEIMER INTERNATIONAL GROWTH FUND/VA
OPPENHEIMER INTERNATIONAL GROWTH FUND/VA
A Series of Oppenheimer Variable Account Funds
| | |
| Manager | | OFI Global Asset Management, Inc. |
| |
| Sub-Adviser | | OppenheimerFunds, Inc. |
| |
| Distributor | | OppenheimerFunds Distributor, Inc. |
| |
| Transfer and | | OFI Global Asset Management, Inc. |
Shareholder | | |
Servicing Agent | | |
| |
| Sub-Transfer Agent | | Shareholder Services, Inc. |
| | DBA OppenheimerFunds Services |
| |
| Independent | | KPMG LLP |
Registered | | |
Public | | |
Accounting | | |
Firm | | |
| |
| Legal Counsel | | Ropes & Gray LLP |
| |
| | Before investing in any of the Oppenheimer funds, investors should carefully consider a fund’s investment objectives, risks, charges and expenses. Fund prospectuses and summary prospectuses contain this and other information about the funds and may be obtained by asking your financial advisor, visiting oppenheimerfunds.com or calling us at 1.800.988.8287. Read prospectuses and summary prospectuses carefully before investing. |
| |
| | © 2018 OppenheimerFunds, Inc. All rights reserved. Oppenheimer funds are distributed by OppenheimerFunds Distributor, Inc. |

Item 2. Code of Ethics.
The registrant has adopted a code of ethics that applies to the registrant’s principal executive officer, principal financial officer, principal accounting officer or controller or persons performing similar functions.
Item 3. Audit Committee Financial Expert.
The Board of Trustees of the registrant has determined that Karen L. Stuckey, the Chairwoman of the Board’s Audit Committee, is the audit committee financial expert and that Ms. Stuckey is “independent” for purposes of this Item 3.
Item 4. Principal Accountant Fees and Services.
The principal accountant for the audit of the registrant’s annual financial statements billed $453,400 in fiscal 2017 and $473,600 in fiscal 2016.
The principal accountant for the audit of the registrant’s annual financial statements billed $35,000 in fiscal 2017 and $84,100 in fiscal 2016.
The principal accountant for the audit of the registrant’s annual financial statements billed $386,986 in fiscal 2017 and $232,185 in fiscal 2016 to the registrant’s investment adviser or any entity controlling, controlled by, or under common control with the adviser that provides ongoing services to the registrant.
Such services include: Internal control reviews, GIPS attestation procedures, and additional audit services.
The principal accountant for the audit of the registrant’s annual financial statements billed $14,903 in fiscal 2017 and $20,375 in fiscal 2016.
The principal accountant for the audit of the registrant’s annual financial statements billed $591,136 in fiscal 2017 and $645,284 in fiscal 2016 to the registrant’s investment adviser or any entity controlling, controlled by, or under common control with the adviser that provides ongoing services to the registrant.
Such services include: tax compliance, tax planning and tax advice. Tax compliance generally involves preparation of original and amended tax returns, claims for a refund and tax payment-
planning services. Tax planning and tax advice includes assistance with tax audits and appeals, tax advice related to mergers and acquisitions and requests for rulings or technical advice from taxing authorities.
The principal accountant for the audit of the registrant’s annual financial statements billed no such fees in fiscal 2017 and no such fees in fiscal 2016.
The principal accountant for the audit of the registrant’s annual financial statements billed no such fees in fiscal 2017 and no such fees in fiscal 2016 to the registrant’s investment adviser or any entity controlling, controlled by, or under common control with the adviser that provides ongoing services to the registrant.
Such fees would include the cost to the principal accountant of attending audit committee meetings and consultations regarding the registrant’s retirement plan with respect to its Trustees.
| (e) | (1) During its regularly scheduled periodic meetings, the registrant’s audit committee will pre-approve all audit, audit-related, tax and other services to be provided by the principal accountants of the registrant. |
The audit committee has delegated pre-approval authority to its Chairman for any subsequent new engagements that arise between regularly scheduled meeting dates provided that any fees such pre-approved are presented to the audit committee at its next regularly scheduled meeting.
Under applicable laws, pre-approval of non-audit services may be waived provided that: 1) the aggregate amount of all such services provided constitutes no more than five percent of the total amount of fees paid by the registrant to its principal accountant during the fiscal year in which services are provided 2) such services were not recognized by the registrant at the time of engagement as non-audit services and 3) such services are promptly brought to the attention of the audit committee of the registrant and approved prior to the completion of the audit.
(2) 0%
| (f) | Not applicable as less than 50%. |
| (g) | The principal accountant for the audit of the registrant’s annual financial statements billed $1,028,025 in fiscal 2017 and $981,944 in fiscal 2016 to the registrant and the registrant’s investment adviser or any entity controlling, controlled by, or under common control with the adviser that provides ongoing services to the registrant related to non-audit fees. Those billings did not include any prohibited non-audit services as defined by the Securities Exchange Act of 1934. |
| (h) | The registrant’s audit committee of the board of Trustees has considered whether the provision of non-audit services that were rendered to the registrant’s investment adviser, and any entity controlling, controlled by, or under common control with the investment adviser that provides ongoing services to the registrant that were not pre-approved pursuant to paragraph (c)(7)(ii) of Rule 2-01 of Regulation S-X is compatible with maintaining the principal accountant’s independence. No such services were rendered. |
Item 5. Audit Committee of Listed Registrants
Not applicable.
Item 6. Schedule of Investments.
a) Not applicable. The complete schedule of investments is included in Item 1 of this Form N-CSR.
b) Not applicable.
Item 7. Disclosure of Proxy Voting Policies and Procedures for Closed-End Management Investment Companies.
Not applicable.
Item 8. Portfolio Managers of Closed-End Management Investment Companies.
Not applicable.
Item 9. Purchases of Equity Securities by Closed-End Management Investment Company and Affiliated Purchasers.
Not applicable.
Item 10. Submission of Matters to a Vote of Security Holders.
The Fund’s Governance Committee Provisions with Respect to Nominations of Directors/Trustees to the Respective Boards
None
Item 11. Controls and Procedures.
Based on their evaluation of the registrant’s disclosure controls and procedures (as defined in rule 30a-3(c) under the Investment Company Act of 1940 (17 CFR 270.30a-3(c)) as of 12/31/2017, the registrant’s principal executive officer and principal financial officer found the registrant’s disclosure controls and procedures to provide reasonable assurances that information required to be disclosed by the registrant in the reports that it files under the Securities Exchange Act of 1934 (a) is accumulated and communicated to registrant’s management, including its principal executive officer and principal financial officer, to allow timely decisions regarding required disclosure, and (b) is recorded, processed, summarized and reported, within the time periods specified in the rules and forms adopted by the U.S. Securities and Exchange Commission.
There have been no changes in the registrant’s internal controls over financial reporting that occurred during the registrant’s second fiscal quarter of the period covered by this report that have materially affected, or are reasonably likely to materially affect, the registrant’s internal control over financial reporting.
Item 12. Disclosure of Securities Lending Activities for Closed-End Management Investment Companies.
Not applicable.
Item 13. Exhibits.
| (a) | (1) Exhibit attached hereto. |
| | (2) Exhibits attached hereto. |
SIGNATURES
Pursuant to the requirements of the Securities Exchange Act of 1934 and the Investment Company Act of 1940, the registrant has duly caused this report to be signed on its behalf by the undersigned, thereunto duly authorized.
Oppenheimer Variable Account Funds
| | |
| By: | | /s/ Arthur P. Steinmetz |
| | Arthur P. Steinmetz |
| | Principal Executive Officer |
| Date: | | 2/16/2018 |
Pursuant to the requirements of the Securities Exchange Act of 1934 and the Investment Company Act of 1940, this report has been signed below by the following persons on behalf of the registrant and in the capacities and on the dates indicated.
| | |
| By: | | /s/ Arthur P. Steinmetz |
| | Arthur P. Steinmetz |
| | Principal Executive Officer |
| Date: | | 2/16/2018 |
| | |
| By: | | /s/ Brian S. Petersen |
| | Brian S. Petersen |
| | Principal Financial Officer |
| Date: | | 2/16/2018 |