UNITED STATES
SECURITIES AND EXCHANGE COMMISSION
WASHINGTON, D.C. 20549
FORM N-CSR
CERTIFIED SHAREHOLDER REPORT OF REGISTERED MANAGEMENT
INVESTMENT COMPANIES
Investment Company Act file number 811-4108
Oppenheimer Variable Account Funds
(Exact name of registrant as specified in charter)
6803 South Tucson Way, Centennial, Colorado 80112-3924
(Address of principal executive offices) (Zip code)
Cynthia Lo Bessette
OFI Global Asset Management, Inc.
225 Liberty Street, New York, New York 10281-1008
(Name and address of agent for service)
Registrant’s telephone number, including area code: (303) 768-3200
Date of fiscal year end: December 31
Date of reporting period: 12/31/2016
Item 1. Reports to Stockholders.
| | | | |
| | 
| | |
| | |
| | | December 31, 2016 | | |
| | Oppenheimer | | |
| | Discovery Mid Cap Growth Fund/VA | | Annual Report |
| | A Series of Oppenheimer Variable Account Funds | | |
| | | |
| | ANNUAL REPORT | | |
| | |
| | Listing of Top Holdings | | |
| | |
| | Fund Performance Discussion | | |
| | |
| | Financial Statements | | |
PORTFOLIO MANAGERS: Ronald J. Zibelli, Jr., CFA and Justin Livengood, CFA
AVERAGE ANNUAL TOTAL RETURNS FOR THE PERIODS ENDED 12/31/16
| | | | | | | | | | | | | | | | |
| | | Inception
Date | | | 1-Year | | | 5-Year | | | 10-Year | |
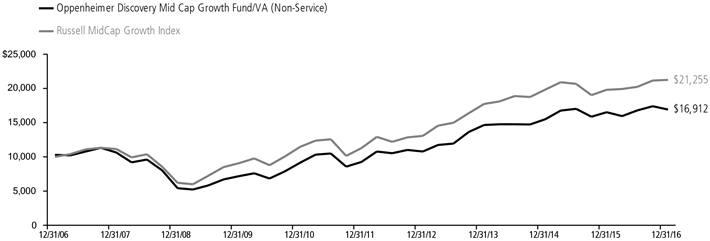
Non-Service Shares | | | 8/15/86 | | | | 2.34% | | | | 12.82% | | | | 5.40 | % |
Service Shares | | | 10/16/00 | | | | 2.08 | | | | 12.53 | | | | 5.12 | |
Russell MidCap Growth Index | | | | | | | 7.33 | | | | 13.51 | | | | 7.83 | |
Performance data quoted represents past performance, which does not guarantee future results. The investment return and principal value of an investment in the Fund will fluctuate so that an investor’s shares, when redeemed, may be worth more or less than their original cost. Current performance may be lower or higher than the performance quoted. For performance data current to the most recent month end, call us at 1.800.988.8287. The Fund’s total returns should not be expected to be the same as the returns of other funds, whether or not both funds have the same portfolio managers and/or similar names. The Fund’s total returns include changes in share price and reinvested distributions but do not include the charges associated with the separate account products that offer this Fund. Such performance would have been lower if such charges were taken into account.
TOP HOLDINGS AND ALLOCATIONS
TOP TEN COMMON STOCK HOLDINGS
| | |
First Republic Bank | | 2.4% |
Microchip Technology, Inc. | | 2.4 |
O’Reilly Automotive, Inc. | | 2.0 |
SVB Financial Group | | 1.9 |
A.O. Smith Corp. | | 1.8 |
Vail Resorts, Inc. | | 1.8 |
Raymond James Financial, Inc. | | 1.8 |
Domino’s Pizza, Inc. | | 1.8 |
Lam Research Corp. | | 1.8 |
PTC, Inc. | | 1.8 |
Portfolio holdings and allocations are subject to change. Percentages are as of December 31, 2016, and are based on net assets. For more current Fund holdings, please visit oppenheimerfunds.com.
SECTOR ALLOCATION
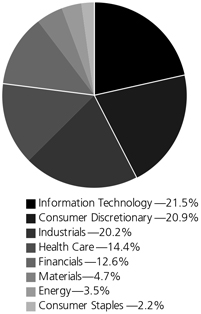
Portfolio holdings and allocations are subject to change. Percentages are as of December 31, 2016, and are based on the total market value of common stocks.
2 OPPENHEIMER DISCOVERY MID CAP GROWTH FUND/VA
Fund Performance Discussion
The Fund’s Non-Service shares produced a return of 2.34% during the reporting period, underperforming the Russell Midcap Growth Index (the “Index”) return of 7.33%.
The Fund’s Non-Service shares ranked in the 74th percentile (64 out of 92 funds) in Morningstar’s U.S. Insurance Fund Mid-Cap Growth peer group over the 1-year period ended December 31, 2016. Over the longer-term, Fund’s Non-Service shares ranked in the 36th (35 out of 89 funds), 30th (32 out of 88 funds), and 82nd (62 out of 73 funds) percentiles for the 3-, 5- and 10-year periods ended December 31, 2016, respectively. Note that we have managed the Fund under the current investment process for six and a half years.
The Fund’s underperformance versus the Index stemmed from weaker relative stock selection in the information technology, consumer staples and industrials sectors. The Fund outperformed the Index in the health care sector due to stock selection and the financials sector as the result of an overweight position.
MARKET OVERVIEW
2016 was a volatile year for global equity markets. The year was off to a strong start around commodity price recoveries, but growth concerns continued to weigh on equity markets. Global equity markets were both surprised and experienced a short-term sell-off around the United Kingdom’s vote to leave the European Union (commonly known as “Brexit”) in June. Markets staged an impressive rebound in July, as investor fears receded, particularly over the immediate implications of the Brexit vote. U.S. investors instead focused their attention on two tug-of-wars: Federal Reserve (“Fed”) policy and anticipated interest rate moves and secondly, the Presidential election. Improved economic data and outlook led the Fed to hike its policy rates by 0.25% in December 2016. With a pronounced move happening after the November election, markets finished the year with a strong quarter. The unanticipated victory of the Republican nominee, Donald Trump, propelled cyclicals again into a leadership position as investors foresaw an administration friendly to the economy and markets; specifically, less regulation, tax reform and other policies favorable to domestic economic growth.
TOP INDIVIDUAL CONTRIBUTORS
Top performing stocks for the Fund this reporting period included NVIDIA, Ulta Salon, Cosmetics & Fragrance, and First Republic Bank. NVIDIA is a visual computing company that develops graphics chips for use in PCs, mobile devices, servers, automobiles and supercomputers. The company soared after it reported a solid July 2016 quarter and issued a better than expected outlook. The company is seeing one of the most successful product launches ever with its Pascal-based chips that are targeting markets including gaming, automotive, datacenters, machine learning and artificial intelligence. Ulta Salon, Cosmetics & Fragrance, Inc., a leading specialty retailer of beauty products, had a solid reporting period. In what was a treacherous first quarter of 2016 for many retailers, Ulta delivered a significantly better-than-expected quarter and guided for a double-digit trend to continue through its second quarter. First Republic Bank is a commercial bank with more than $60bln of assets that focuses on serving high net worth customers on the east and west coasts. First Republic reported strong quarterly financial results throughout the year, including greater than 20% EPS growth for the June and September quarters. Financials generally rallied after the Presidential election, as markets anticipate faster economic growth, higher interest rates, and less onerous financial regulation.
TOP INDIVIDUAL DETRACTORS
Detractors from performance this reporting period included ServiceNow, Palo Alto Networks and Tableau Software, Inc. Shares of ServiceNow, a SaaS (software as a service) provider of services to automate and manage IT services for enterprises, traded down sharply on disappointing fourth quarter billings results and slightly lower than expected guidance for fiscal year 2016. Palo Alto Networks, a provider of network security solutions, reported fourth quarter guidance that missed consensus estimates, with management pointing to longer sales cycles and a weak economic picture. Tableau Software, a leading data visualization software vendor, reported disappointing license revenue for the first time in its history as a public company at the start of the year. These results, combined with weak 2016 guidance, caused the stock to decline. We exited our position in both Palo Alto Networks and Tableau Software during the period.
STRATEGY & OUTLOOK
Our long-term investment process remains the same. We seek dynamic companies with above-average and sustainable revenue and earnings growth that we believe are positioned to outperform. This includes leading firms in structurally attractive industries with experienced management teams that have proven records of performance.
We have adopted a more constructive economic and corporate earnings outlook following the November election. This is due to President Trump’s proposals to reduce taxes and regulations while increasing fiscal stimulus. While it is too soon to know how much of this agenda will be implemented, we have shifted our
3 OPPENHEIMER DISCOVERY MID CAP GROWTH FUND/VA
portfolio strategy consistent with a more pro-cyclical outlook. As always, our focus remains on delivering portfolios of higher quality growth companies with the potential to provide both upside participation and a degree of downside protection over the long term.
At the end of the period, the Fund was overweight the financials, industrials and energy sectors. The Fund was underweight the consumer staples, consumer discretionary and health care sectors.
We look forward to providing another update in six months.
Investors should consider the Fund’s investment objective, risks, charges and expenses carefully before investing. The Fund’s prospectus and summary prospectus contain this and other information about the Fund, and may be obtained by asking your financial advisor or calling us at 1.800.988.8287. Read prospectuses and summary prospectuses carefully before investing.
Total returns include changes in share price and reinvestment of dividends and capital gains distributions in a hypothetical investment for the periods shown, but do not include the charges associated with the separate account products that offer this Fund.
The Fund’s investment strategy and focus can change over time. The mention of specific fund holdings does not constitute a recommendation by OppenheimerFunds, Inc. or its affiliates.
Shares of Oppenheimer funds are not deposits or obligations of any bank, are not guaranteed by any bank, are not insured by the FDIC or any other agency, and involve investment risks, including the possible loss of the principal amount invested.
Comparing the Fund’s Performance to the Market. The graphs that follow show the performance of a hypothetical $10,000 investment in each share class of the Fund held until December 31, 2016. Performance is measured over a ten-fiscal-year period for both Classes. Performance information does not reflect charges that apply to separate accounts investing in the Fund. If these charges were taken into account, performance would be lower. The graphs assume that all dividends and capital gains distributions were reinvested in additional shares.
Morningstar ranking is for Non-Service shares and ranking may include more than one share class of funds in the category, including other share classes of this Fund. Ranking is based on total return as of 12/31/16, without considering sales charges. Different share classes may have different expenses and performance characteristics. Fund rankings are subject to change monthly. The Fund’s total-return percentile rank is relative to all funds that are in the Morningstar U.S. Insurance Fund Mid-Cap Growth Funds category. The highest (or most favorable) percentile rank is 1 and the lowest (or least favorable) percentile rank is 100. The top-performing fund in a category will always receive a rank of 1.
The Fund’s performance is compared to the performance of the Russell MidCap Growth Index. The Russell MidCap Growth Index measures the performance of the mid-cap growth segment of the U.S. equity universe. It includes those Russell MidCap Index companies with higher price-to-book ratios and higher forecasted growth values. The Index is unmanaged and cannot be purchased directly by investors. While index comparisons may be useful to provide a benchmark for the Fund’s performance, it must be noted that the Fund’s investments are not limited to the investments comprising the Index. Index performance includes reinvestment of income, but does not reflect transaction costs, fees, expenses or taxes. Index performance is shown for illustrative purposes only as a benchmark for the Fund’s performance, and does not predict or depict performance of the Fund. The Fund’s performance reflects the effects of the Fund’s business and operating expenses.
4 OPPENHEIMER DISCOVERY MID CAP GROWTH FUND/VA
COMPARISON OF CHANGE IN VALUE OF $10,000 HYPOTHETICAL INVESTMENTS IN:
COMPARISON OF CHANGE IN VALUE OF $10,000 HYPOTHETICAL INVESTMENTS IN:
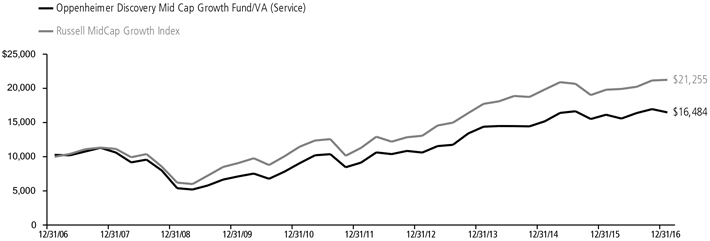
Performance data quoted represents past performance, which does not guarantee future results. The investment return and principal value of an investment in the Fund will fluctuate so that an investor’s shares, when redeemed, may be worth more or less than their original cost. Current performance may be lower or higher than the performance quoted. For performance data current to the most recent month end, call us at 1.800.988.8287. The Fund’s total returns should not be expected to be the same as the returns of other funds, whether or not both funds have the same portfolio managers and/or similar names. The Fund’s total returns include changes in share price and reinvested distributions but do not include the charges associated with the separate account products that offer this Fund. Such performance would have been lower if such charges were taken into account.
5 OPPENHEIMER DISCOVERY MID CAP GROWTH FUND/VA
Fund Expenses
Fund Expenses. As a shareholder of the Fund, you incur two types of costs: (1) transaction costs and (2) ongoing costs, including management fees; distribution and service fees; and other Fund expenses. These examples are intended to help you understand your ongoing costs (in dollars) of investing in the Fund and to compare these costs with the ongoing costs of investing in other mutual funds.
The examples are based on an investment of $1,000.00 invested at the beginning of the period and held for the entire 6-month period ended December 31, 2016.
Actual Expenses. The first section of the table provides information about actual account values and actual expenses. You may use the information in this section for the class of shares you hold, together with the amount you invested, to estimate the expense that you paid over the period. Simply divide your account value by $1,000.00 (for example, an $8,600.00 account value divided by $1,000.00 = 8.60), then multiply the result by the number in the first section under the heading entitled “Expenses Paid During 6 Months Ended December 31, 2016” to estimate the expenses you paid on your account during this period.
Hypothetical Example for Comparison Purposes.
The second section of the table provides information about hypothetical account values and hypothetical expenses based on the Fund’s actual expense ratio for each class of shares, and an assumed rate of return of 5% per year for each class before expenses, which is not the actual return. The hypothetical account values and expenses may not be used to estimate the actual ending account balance or expenses you paid for the period. You may use this information to compare the ongoing costs of investing in the Fund and other funds. To do so, compare this 5% hypothetical example for the class of shares you hold with the 5% hypothetical examples that appear in the shareholder reports of the other funds.
Please note that the expenses shown in the table are meant to highlight your ongoing costs only and do not reflect any charges associated with the separate accounts that offer this Fund. Therefore, the “hypothetical” lines of the table are useful in comparing ongoing costs only, and will not help you determine the relative total costs of owning different funds. In addition, if these separate account charges were included your costs would have been higher.
| | | | | | | | | | | | | | | | |
| Actual | | Beginning Account Value July 1, 2016 | | | Ending Account Value December 31, 2016 | | | Expenses Paid During 6 Months Ended December 31, 2016 | |
Non-Service shares | | | $ 1,000.00 | | | | $ 1,006.90 | | | | $ 4.04 | | | | | |
Service shares | | | 1,000.00 | | | | 1,005.60 | | | | 5.31 | | | | | |
| | | | |
| Hypothetical | | | | | | | | | | | | |
| (5% return before expenses) | | | | | | | | | | | | |
Non-Service shares | | | 1,000.00 | | | | 1,021.11 | | | | 4.07 | | | | | |
Service shares | | | 1,000.00 | | | | 1,019.86 | | | | 5.35 | | | | | |
Expenses are equal to the Fund’s annualized expense ratio for that class, multiplied by the average account value over the period, multiplied by 184/366 (to reflect the one-half year period). Those annualized expense ratios, excluding indirect expenses from affiliated funds, based on the 6-month period ended December 31, 2016 are as follows:
| | | | | | | | |
| Class | | Expense Ratios | | | | |
Non-Service shares | | | 0.80% | | | | | |
Service shares | | | 1.05 | | | | | |
The expense ratios reflect voluntary and/or contractual waivers and/or reimbursements of expenses by the Fund’s Manager. Some of these undertakings may be modified or terminated at any time, as indicated in the Fund’s prospectus. The “Financial Highlights” tables in the Fund’s financial statements, included in this report, also show the gross expense ratios, without such waivers or reimbursements and reduction to custodian expenses, if applicable.
6 OPPENHEIMER DISCOVERY MID CAP GROWTH FUND/VA
STATEMENT OF INVESTMENTS December 31, 2016
| | | | | | | | | | | | |
| | | Shares | | | Value | | | | |
| | | | | |
| Common Stocks—97.9% | | | | | | | | | |
| | | | | |
| Consumer Discretionary—20.5% | | | | | | | | | |
| | | | | |
| Automobiles—0.5% | | | | | | | | | |
| | | | | |
| Thor Industries, Inc. | | | 31,350 | | | $ | 3,136,567 | | | | | |
| |
| | | | | |
| Distributors—1.4% | | | | | | | | | |
| | | | | |
| Pool Corp. | | | 88,160 | | | | 9,198,614 | | | | | |
| |
| | | | | |
| Diversified Consumer Services—0.9% | | | | | | | | | |
| | | | | |
| Bright Horizons Family Solutions, Inc.1 | | | 84,430 | | | | 5,911,789 | | | | | |
| |
| | | | | |
| Hotels, Restaurants & Leisure—7.1% | | | | | | | | | |
| | | | | |
| Domino’s Pizza, Inc. | | | 72,670 | | | | 11,571,970 | | | | | |
| | | | | |
| Hilton Worldwide Holdings, Inc. | | | 124,600 | | | | 3,389,120 | | | | | |
| | | | | |
| MGM Resorts International1 | | | 342,400 | | | | 9,871,392 | | | | | |
| | | | | |
| Restaurant Brands International, Inc. | | | 180,830 | | | | 8,618,358 | | | | | |
| | | | | |
| Vail Resorts, Inc. | | | 72,090 | | | | 11,628,838 | | | | | |
| | | | | | | | | | | | |
| | | | | | | 45,079,678 | | | | | |
| |
| | | | | |
| Household Durables—0.6% | | | | | | | | | |
| | | | | |
| Mohawk Industries, Inc.1 | | | 19,720 | | | | 3,937,690 | | | | | |
| |
| | | | | |
| Internet & Direct Marketing Retail—0.8% | | | | | | | | | |
| | | | | |
| Expedia, Inc. | | | 42,970 | | | | 4,867,642 | | | | | |
| |
| | | | | |
| Leisure Products—0.5% | | | | | | | | | |
| | | | | |
| Hasbro, Inc. | | | 39,870 | | | | 3,101,487 | | | | | |
| |
| | | | | |
| Specialty Retail—8.7% | | | | | | | | | |
| | | | | |
| Burlington Stores, Inc.1 | | | 65,650 | | | | 5,563,837 | | | | | |
| | | | | |
| Dick’s Sporting Goods, Inc. | | | 62,240 | | | | 3,304,944 | | | | | |
| | | | | |
| Foot Locker, Inc. | | | 118,080 | | | | 8,370,691 | | | | | |
| | | | | |
| O’Reilly Automotive, Inc.1 | | | 46,650 | | | | 12,987,827 | | | | | |
| | | | | |
| Ross Stores, Inc. | | | 153,170 | | | | 10,047,952 | | | | | |
| | | | | |
| Tiffany & Co. | | | 62,670 | | | | 4,852,538 | | | | | |
| | | | | |
| Ulta Salon, Cosmetics & Fragrance, Inc.1 | | | 39,320 | | | | 10,024,241 | | | | | |
| | | | | | | | | | | | |
| | | | | | | 55,152,030 | | | | | |
| |
| | | | | |
| Consumer Staples—2.2% | | | | | | | | | |
| | | | | |
| Beverages—1.0% | | | | | | | | | |
| | | | | |
| Constellation Brands, Inc., Cl. A | | | 42,700 | | | | 6,546,337 | | | | | |
| |
| | | | | |
| Food Products—0.6% | | | | | | | | | |
| | | | | |
| Ingredion, Inc. | | | 30,870 | | | | 3,857,515 | | | | | |
| |
| | | | | |
| Household Products—0.6% | | | | | | | | | |
| | | | | |
| Spectrum Brands Holdings, Inc. | | | 28,090 | | | | 3,436,250 | | | | | |
| |
| | | | | |
| Energy—3.4% | | | | | | | | | |
| | | | | |
| Energy Equipment & Services—1.2% | | | | | | | | | |
| | | | | |
| RPC, Inc. | | | 161,270 | | | | 3,194,758 | | | | | |
| | | | | |
| US Silica Holdings, Inc. | | | 76,260 | | | | 4,322,417 | | | | | |
| | | | | | | | | | | | |
| | | | | | | 7,517,175 | | | | | |
| |
| | | | | |
| Oil, Gas & Consumable Fuels—2.2% | | | | | | | | | |
| | | | | |
| Concho Resources, Inc.1 | | | 48,522 | | | | 6,434,017 | | | | | |
| | | | | |
| Parsley Energy, Inc., Cl. A1 | | | 157,412 | | | | 5,547,199 | | | | | |
| | | | | |
| Rice Energy, Inc.1 | | | 107,510 | | | | 2,295,339 | | | | | |
| | | | | | | | | | | | |
| | | | | | | 14,276,555 | | | | | |
| |
| | | | | |
| Financials—12.3% | | | | | | | | | |
| | | | | |
| Capital Markets—4.8% | | | | | | | | | |
| | | | | |
| E*TRADE Financial Corp.1 | | | 186,240 | | | | 6,453,216 | | | | | |
| | | | | |
| MarketAxess Holdings, Inc. | | | 48,370 | | | | 7,106,520 | | | | | |
| | | | | |
| Nasdaq, Inc. | | | 52,570 | | | | 3,528,498 | | | | | |
| | | | | |
| Raymond James Financial, Inc. | | | 167,480 | | | | 11,601,340 | | | | | |
| | | | | |
| T. Rowe Price Group, Inc. | | | 22,680 | | | | 1,706,897 | | | | | |
| | | | | | | | | | | | |
| | | | | | | 30,396,471 | | | | | |
| |
| | | | | |
| Commercial Banks—5.1% | | | | | | | | | |
| | | | | |
| First Republic Bank | | | 165,510 | | | | 15,250,091 | | | | | |
| | | | | |
| SVB Financial Group1 | | | 69,670 | | | | 11,959,552 | | | | | |
| | | | | |
| Western Alliance Bancorp1 | | | 108,570 | | | | 5,288,445 | | | | | |
| | | | | | | | | | | | |
| | | | | | | 32,498,088 | | | | | |
| |
| | | | | |
| Consumer Finance—0.5% | | | | | | | | | |
| | | | | |
| SLM Corp.1 | | | 309,050 | | | | 3,405,731 | | | | | |
| | | | | | | | | | | | |
| | | Shares | | | Value | | | | |
| | | | | |
| Insurance—0.8% | | | | | | | | | |
| | | | | |
| Arthur J. Gallagher & Co. | | | 103,830 | | | $ | 5,395,007 | | | | | |
| |
| | | | | |
| Real Estate Investment Trusts (REITs)—1.1% | | | | | |
| | | | | |
| Equinix, Inc. | | | 18,730 | | | | 6,694,289 | | | | | |
| |
| | | | | |
| Health Care—14.1% | | | | | | | | | |
| | | | | |
| Biotechnology—2.5% | | | | | | | | | |
| | | | | |
| BioMarin Pharmaceutical, Inc.1 | | | 84,620 | | | | 7,009,921 | | | | | |
| | | | | |
| Incyte Corp.1 | | | 68,160 | | | | 6,834,403 | | | | | |
| | | | | |
| Neurocrine Biosciences, Inc.1 | | | 56,950 | | | | 2,203,965 | | | | | |
| | | | | | | | | | | | |
| | | | | | | 16,048,289 | | | | | |
| |
| | | | | |
| Health Care Equipment & Supplies—6.8% | | | | | | | | | |
| | | | | |
| Align Technology, Inc.1 | | | 51,900 | | | | 4,989,147 | | | | | |
| | | | | |
| Cooper Cos., Inc. (The) | | | 20,990 | | | | 3,671,781 | | | | | |
| | | | | |
| Edwards Lifesciences Corp.1 | | | 69,410 | | | | 6,503,717 | | | | | |
| | | | | |
| Hologic, Inc.1 | | | 124,630 | | | | 5,000,155 | | | | | |
| | | | | |
| IDEXX Laboratories, Inc.1 | | | 69,500 | | | | 8,150,265 | | | | | |
| | | | | |
| Intuitive Surgical, Inc.1 | | | 13,310 | | | | 8,440,803 | | | | | |
| | | | | |
| West Pharmaceutical Services, Inc. | | | 76,110 | | | | 6,456,411 | | | | | |
| | | | | | | | | | | | |
| | | | | | | 43,212,279 | | | | | |
| |
| | | | | |
| Health Care Providers & Services—1.8% | | | | | | | | | |
| | | | | |
| VCA, Inc.1 | | | 98,810 | | | | 6,783,306 | | | | | |
| | | | | |
| WellCare Health Plans, Inc.1 | | | 36,160 | | | | 4,956,813 | | | | | |
| | | | | | | | | | | | |
| | | | | | | 11,740,119 | | | | | |
| |
| | | | | |
| Health Care Technology—1.1% | | | | | | | | | |
| | | | | |
| Veeva Systems, Inc., Cl. A1 | | | 164,600 | | | | 6,699,220 | | | | | |
| |
| | | | | |
| Life Sciences Tools & Services—1.1% | | | | | | | | | |
| | | | | |
| Mettler-Toledo International, Inc.1 | | | 16,210 | | | | 6,784,858 | | | | | |
| |
| | | | | |
| Pharmaceuticals—0.8% | | | | | | | | | |
| | | | | |
| Zoetis, Inc., Cl. A | | | 93,550 | | | | 5,007,732 | | | | | |
| |
| | | | | |
| Industrials—19.8% | | | | | | | | | |
| | | | | |
| Aerospace & Defense—0.8% | | | | | | | | | |
| | | | | |
| L-3 Communications Holdings, Inc. | | | 32,560 | | | | 4,952,702 | | | | | |
| |
| | | | | |
| Air Freight & Couriers—0.7% | | | | | | | | | |
| | | | | |
| XPO Logistics, Inc.1 | | | 105,130 | | | | 4,537,411 | | | | | |
| |
| | | | | |
| Airlines—0.8% | | | | | | | | | |
| | | | | |
| Alaska Air Group, Inc. | | | 55,080 | | | | 4,887,248 | | | | | |
| |
| | | | | |
| Building Products—2.9% | | | | | | | | | |
| | | | | |
| A.O. Smith Corp. | | | 247,180 | | | | 11,703,973 | | | | | |
| | | | | |
| Lennox International, Inc. | | | 44,850 | | | | 6,869,674 | | | | | |
| | | | | | | | | | | | |
| | | | | | | 18,573,647 | | | | | |
| |
| | | | | |
| Commercial Services & Supplies—2.7% | | | | | | | | | |
| | | | | |
| Cintas Corp. | | | 28,190 | | | | 3,257,636 | | | | | |
| | | | | |
| Copart, Inc.1 | | | 98,780 | | | | 5,473,400 | | | | | |
| | | | | |
| Waste Connections, Inc. | | | 105,830 | | | | 8,317,180 | | | | | |
| | | | | | | | | | | | |
| | | | | | | 17,048,216 | | | | | |
| |
| | | | | |
| Construction & Engineering—1.1% | | | | | | | | | |
| | | | | |
| Quanta Services, Inc.1 | | | 200,950 | | | | 7,003,108 | | | | | |
| |
| | | | | |
| Electrical Equipment—2.1% | | | | | | | | | |
| | | | | |
| Acuity Brands, Inc. | | | 27,420 | | | | 6,330,181 | | | | | |
| | | | | |
| Rockwell Automation, Inc. | | | 50,500 | | | | 6,787,200 | | | | | |
| | | | | | | | | | | | |
| | | | | | | 13,117,381 | | | | | |
| |
| | | | | |
| Machinery—5.2% | | | | | | | | | |
| | | | | |
| Middleby Corp. (The)1 | | | 66,250 | | | | 8,533,662 | | | | | |
| | | | | |
| Nordson Corp. | | | 43,400 | | | | 4,862,970 | | | | | |
| | | | | |
| Oshkosh Corp. | | | 99,840 | | | | 6,450,662 | | | | | |
| | | | | |
| Wabtec Corp. | | | 39,580 | | | | 3,285,932 | | | | | |
| | | | | |
| Xylem, Inc. | | | 204,240 | | | | 10,113,965 | | | | | |
| | | | | | | | | | | | |
| | | | | | | 33,247,191 | | | | | |
| |
| | | | | |
| Road & Rail—2.4% | | | | | | | | | |
| | | | | |
| J.B. Hunt Transport Services, Inc. | | | 89,570 | | | | 8,694,560 | | | | | |
| | | | | |
| Old Dominion Freight Line, Inc.1 | | | 79,910 | | | | 6,855,479 | | | | | |
| | | | | | | | | | | | |
| | | | | | | 15,550,039 | | | | | |
|
| 7 OPPENHEIMER DISCOVERY MID CAP GROWTH FUND/VA |
STATEMENT OF INVESTMENTS Continued
| | | | | | | | | | | | |
| | | Shares | | | Value | | | | |
| | | | | |
Trading Companies & Distributors—1.1% | | | | | | | | | |
| | | | | |
United Rentals, Inc.1 | | | 64,510 | | | | $ 6,810,966 | | | | | |
| |
| | | | | |
Information Technology—21.0% | | | | | | | | | |
| | | | | |
Internet Software & Services—1.0% | | | | | | | | | |
| | | | | |
CoStar Group, Inc.1 | | | 8,520 | | | | 1,605,935 | | | | | |
| | | | | |
MercadoLibre, Inc. | | | 31,470 | | | | 4,913,726 | | | | | |
| | | | | | | | | | | | |
| | | | | | | 6,519,661 | | | | | |
| |
| | | | | |
IT Services—1.7% | | | | | | | | | | | | |
| | | | | |
Global Payments, Inc. | | | 46,340 | | | | 3,216,459 | | | | | |
| | | | | |
Vantiv, Inc., Cl. A1 | | | 129,780 | | | | 7,737,484 | | | | | |
| | | | | | | | | | | | |
| | | | | | | 10,953,943 | | | | | |
| |
| | | | | |
| Semiconductors & Semiconductor Equipment—9.9% | | | | | |
| | | | | |
Analog Devices, Inc. | | | 67,290 | | | | 4,886,600 | | | | | |
| | | | | |
Applied Materials, Inc. | | | 306,210 | | | | 9,881,397 | | | | | |
| | | | | |
Lam Research Corp. | | | 108,550 | | | | 11,476,991 | | | | | |
| | | | | |
Microchip Technology, Inc. | | | 234,660 | | | | 15,053,439 | | | | | |
| | | | | |
Microsemi Corp.1 | | | 71,810 | | | | 3,875,586 | | | | | |
| | | | | |
NVIDIA Corp. | | | 72,620 | | | | 7,751,459 | | | | | |
| | | | | |
Skyworks Solutions, Inc. | | | 64,900 | | | | 4,845,434 | | | | | |
| | | | | |
Xilinx, Inc. | | | 82,520 | | | | 4,981,732 | | | | | |
| | | | | | | | | | | | |
| | | | | | | 62,752,638 | | | | | |
| |
| | | | | |
Software—8.4% | | | | | | | | | |
| | | | | |
Autodesk, Inc.1 | | | 122,690 | | | | 9,080,287 | | | | | |
| | | | | |
Electronic Arts, Inc.1 | | | 134,250 | | | | 10,573,530 | | | | | |
| | | | | |
PTC, Inc.1 | | | 243,990 | | | | 11,289,417 | | | | | |
| | | | | | | | |
| | | Shares | | | Value | |
| |
Software (Continued) | | | | | |
| |
ServiceNow, Inc.1 | | | 64,042 | | | | $ 4,760,882 | |
| |
Splunk, Inc.1 | | | 96,770 | | | | 4,949,786 | |
| |
Tyler Technologies, Inc.1 | | | 34,820 | | | | 4,971,251 | |
| |
Ultimate Software Group, Inc. (The)1 | | | 44,220 | | | | 8,063,517 | |
| | | | | | | | |
| | | | | | | 53,688,670 | |
|
| |
Materials—4.6% | | | | | |
| |
Chemicals—1.2% | | | | | |
| |
Albemarle Corp. | | | 91,700 | | | | 7,893,536 | |
|
| |
Construction Materials—1.2% | | | | | |
| |
Vulcan Materials Co. | | | 61,640 | | | | 7,714,246 | |
|
| |
Containers & Packaging—1.0% | | | | | |
| |
Berry Plastics Group, Inc.1 | | | 130,740 | | | | 6,370,960 | |
|
| |
Metals & Mining—1.2% | | | | | |
| |
Freeport-McMoRan, Inc.1 | | | 115,530 | | | | 1,523,841 | |
| |
Steel Dynamics, Inc. | | | 165,150 | | | | 5,876,037 | |
| | | | | | | | |
| | | | | | | 7,399,878 | |
| | | | | | | | |
| Total Common Stocks (Cost $522,045,840) | | | | | | | 622,922,853 | |
|
| | |
| |
| Investment Company—3.4% | | | | | |
| |
| Oppenheimer Institutional Government Money Market Fund, Cl. E, 0.43%2,3 (Cost $21,498,967) | | | 21,498,967 | | | | 21,498,967 | |
| |
| Total Investments, at Value (Cost $543,544,807) | | | 101.3% | | | | 644,421,820 | |
| |
Net Other Assets (Liabilities) | | | (1.3) | | | | (8,461,628) | |
| | | | |
Net Assets | | | 100.0% | | | | $ 635,960,192 | |
| | | | |
Footnotes to Statement of Investments
1. Non-income producing security.
2. Rate shown is the 7-day yield at period end.
3. Is or was an affiliate, as defined in the Investment Company Act of 1940, as amended, at or during the reporting period, by virtue of the Fund owning at least 5% of the voting securities of the issuer or as a result of the Fund and the issuer having the same investment adviser. Transactions during the reporting period in which the issuer was an affiliate are as follows:
| | | | | | | | | | | | | | | | |
| | | Shares
December 31, 2015 | | | Gross
Additions | | | Gross Reductions | | | Shares
December 31, 2016 | |
| |
| Oppenheimer Institutional Government Money Market Fund, Cl. Ea | | | 20,396,181 | | | | 353,791,966 | | | | 352,689,180 | | | | 21,498,967 | |
| | | | |
| | | | | | | | | Value | | | Income | |
| |
| Oppenheimer Institutional Government Money Market Fund, Cl. Ea | | | | | | | | | | $ | 21,498,967 | | | $ | 75,504 | |
| | a. | Prior to September 28, 2016 this fund was named Oppenheimer Institutional Money Market Fund. |
See accompanying Notes to Financial Statements.
8 OPPENHEIMER DISCOVERY MID CAP GROWTH FUND/VA
STATEMENT OF ASSETS AND LIABILITIES December 31, 2016
| | | | |
| |
| |
Assets | | | | |
Investments, at value—see accompanying statement of investments: | | | | |
Unaffiliated companies (cost $522,045,840) | | $ | 622,922,853 | |
Affiliated companies (cost $21,498,967) | | | 21,498,967 | |
| | | | |
| | | 644,421,820 | |
| |
Cash | | | 500,000 | |
| |
Receivables and other assets: | | | | |
Investments sold | | | 3,934,242 | |
Dividends | | | 305,270 | |
Shares of beneficial interest sold | | | 84,024 | |
Other | | | 53,436 | |
| | | | |
Total assets | | | 649,298,792 | |
| |
Liabilities | | | | |
Payables and other liabilities: | | | | |
Investments purchased | | | 12,885,797 | |
Shares of beneficial interest redeemed | | | 353,393 | |
Trustees’ compensation | | | 47,368 | |
Shareholder communications | | | 22,538 | |
Distribution and service plan fees | | | 6,976 | |
Other | | | 22,528 | |
| | | | |
Total liabilities | | | 13,338,600 | |
| |
Net Assets | | $ | 635,960,192 | |
| | | | |
| |
Composition of Net Assets | | | | |
Par value of shares of beneficial interest | | $ | 8,774 | |
| |
Additional paid-in capital | | | 466,894,652 | |
| |
Accumulated net investment income | | | 154,168 | |
| |
Accumulated net realized gain on investments | | | 68,025,585 | |
| |
Net unrealized appreciation on investments | | | 100,877,013 | |
| | | | |
Net Assets | | $ | 635,960,192 | |
| | | | |
|
| |
Net Asset Value Per Share | | | | |
Non-Service Shares: | | | | |
| Net asset value, redemption price per share and offering price per share (based on net assets of $603,708,174 and 8,309,727 shares of beneficial interest outstanding) | | | $72.65 | |
| |
| |
Service Shares: | | | | |
| |
| Net asset value, redemption price per share and offering price per share (based on net assets of $32,252,018 and 464,539 shares of beneficial interest outstanding) | | | $69.43 | |
See accompanying Notes to Financial Statements.
9 OPPENHEIMER DISCOVERY MID CAP GROWTH FUND/VA
STATEMENT OF OPERATIONS For the Year Ended December 31, 2016
| | | | |
| |
Investment Income | | | | |
| |
Dividends: | | | | |
Unaffiliated companies (net of foreign withholding taxes of $20,422) | | $ | 5,456,512 | |
Affiliated companies | | | 75,504 | |
| | | | |
Total investment income | | | 5,532,016 | |
|
| |
Expenses | | | | |
Management fees | | | 4,685,009 | |
| |
Distribution and service plan fees - Service shares | | | 84,519 | |
| |
Transfer and shareholder servicing agent fees: | | | | |
Non-Service shares | | | 621,509 | |
Service shares | | | 33,820 | |
| |
Shareholder communications: | | | | |
Non-Service shares | | | 48,315 | |
Service shares | | | 2,622 | |
| |
Trustees’ compensation | | | 30,116 | |
| |
Borrowing fees | | | 11,964 | |
| |
Custodian fees and expenses | | | 4,544 | |
| |
Other | | | 76,592 | |
| | | | |
Total expenses | | | 5,599,010 | |
Less reduction to custodian expenses | | | (360) | |
Less waivers and reimbursements of expenses | | | (259,476) | |
| | | | |
Net expenses | | | 5,339,174 | |
| |
Net Investment Income | | | 192,842 | |
| |
Realized and Unrealized Gain (Loss) | | | | |
Net realized gain on investment transactions in unaffiliated companies | | | 74,319,102 | |
| |
Net change in unrealized appreciation/depreciation on investment transactions | | | (60,542,760) | |
| |
Net Increase in Net Assets Resulting from Operations | | $ | 13,969,184 | |
| | | | |
See accompanying Notes to Financial Statements.
10 OPPENHEIMER DISCOVERY MID CAP GROWTH FUND/VA
STATEMENTS OF CHANGES IN NET ASSETS
| | | | | | | | |
| | | Year Ended
December 31, 2016 | | | Year Ended
December 31, 2015 | |
| |
Operations | | | | | | | | |
Net investment income (loss) | | $ | 192,842 | | | $ | (1,807,584) | |
| |
Net realized gain | | | 74,319,102 | | | | 54,533,950 | |
| |
Net change in unrealized appreciation/depreciation | | | (60,542,760) | | | | (5,614,443) | |
| | | | |
Net increase in net assets resulting from operations | | | 13,969,184 | | | | 47,111,923 | |
|
| |
Dividends and/or Distributions to Shareholders | | | | | | | | |
Distributions from net realized gain: | | | | | | | | |
Non-Service shares | | | (48,415,668) | | | | (61,563,484) | |
Service shares | | | (2,737,189) | | | | (2,875,460) | |
| | | | |
| | | (51,152,857) | | | | (64,438,944) | |
|
| |
Beneficial Interest Transactions | | | | | | | | |
Net increase (decrease) in net assets resulting from beneficial interest transactions: | | | | | | | | |
Non-Service shares | | | (21,717,260) | | | | (5,761,632) | |
Service shares | | | (2,617,902) | | | | 7,088,846 | |
| | | | |
| | | (24,335,162) | | | | 1,327,214 | |
|
| |
Net Assets | | | | | | | | |
Total decrease | | | (61,518,835) | | | | (15,999,807) | |
| |
Beginning of period | | | 697,479,027 | | | | 713,478,834 | |
| | | | |
End of period (including accumulated net investment income of $154,168 and $233,299, respectively) | | $ | 635,960,192 | | | $ | 697,479,027 | |
| | | | |
See accompanying Notes to Financial Statements.
11 OPPENHEIMER DISCOVERY MID CAP GROWTH FUND/VA
FINANCIAL HIGHLIGHTS
| | | | | | | | | | | | | | | | | | |
| Non-Service Shares | | Year Ended
December 31,
2016 | | | Year Ended
December 31,
2015 | | | Year Ended
December 31,
2014 | | | Year Ended
December 31,
2013 | | | Year Ended
December 31,
2012 |
|
Per Share Operating Data | | | | | | | | | | | | | | | | | | |
Net asset value, beginning of period | | | $76.85 | | | | $78.82 | | | | $74.51 | | | | $54.80 | | | $47.06 |
|
Income (loss) from investment operations: | | | | | | | | | | | | | | | | | | |
Net investment income (loss)1 | | | 0.03 | | | | (0.19) | | | | (0.29) | | | | (0.16) | | | 0.01 |
Net realized and unrealized gain | | | 1.69 | | | | 5.67 | | | | 4.60 | | | | 19.88 | | | 7.73 |
| | | |
Total from investment operations | | | 1.72 | | | | 5.48 | | | | 4.31 | | | | 19.72 | | | 7.74 |
|
Dividends and/or distributions to shareholders: | | | | | | | | | | | | | | | | | | |
Dividends from net investment income | | | 0.00 | | | | 0.00 | | | | 0.00 | | | | (0.01) | | | 0.00 |
Distributions from net realized gain | | | (5.92) | | | | (7.45) | | | | 0.00 | | | | 0.00 | | | 0.00 |
| | | |
Total dividends and/or distributions to shareholders | | | (5.92) | | | | (7.45) | | | | 0.00 | | | | (0.01) | | | 0.00 |
|
Net asset value, end of period | | | $72.65 | | | | $76.85 | | | | $78.82 | | | | $74.51 | | | $54.80 |
| | | |
| | | | | | | | | | | | | | | | | | | |
|
Total Return, at Net Asset Value2 | | | 2.34% | | | | 6.61% | | | | 5.78% | | | | 35.98% | | | 16.45% |
| | | | | | | | | | | | | | | | | | |
|
Ratios/Supplemental Data | | | | | | | | | | | | | | | | | | |
Net assets, end of period (in thousands) | | | $603,708 | | | | $660,450 | | | | $682,515 | | | | $725,406 | | | $558,934 |
|
Average net assets (in thousands) | | | $621,110 | | | | $695,736 | | | | $688,259 | | | | $618,970 | | | $575,072 |
|
Ratios to average net assets:3 | | | | | | | | | | | | | | | | | | |
Net investment income (loss) | | | 0.04% | | | | (0.24)% | | | | (0.39)% | | | | (0.24)% | | | 0.03% |
Expenses excluding specific expenses listed below | | | 0.84% | | | | 0.83% | | | | 0.83% | | | | 0.84% | | | 0.85% |
Interest and fees from borrowings | | | 0.00%4 | | | | 0.00%4 | | | | 0.00% | | | | 0.00% | | | 0.00% |
| | | |
Total expenses5 | | | 0.84% | | | | 0.83% | | | | 0.83% | | | | 0.84% | | | 0.85% |
| Expenses after payments, waivers and/or reimbursements and reduction to custodian expenses | | | 0.80% | | | | 0.80% | | | | 0.80% | | | | 0.80% | | | 0.80% |
|
Portfolio turnover rate | | | 141% | | | | 81% | | | | 113% | | | | 84% | | | 66% |
1. Per share amounts calculated based on the average shares outstanding during the period.
2. Assumes an initial investment on the business day before the first day of the fiscal period, with all dividends and distributions reinvested in additional shares on the reinvestment date, and redemption at the net asset value calculated on the last business day of the fiscal period. Total returns are not annualized for periods less than one full year. Total return information does not reflect expenses that apply at the separate account level or to related insurance products. Inclusion of these charges would reduce the total return figures for all periods shown. Returns do not reflect the deduction of taxes that a shareholder would pay on fund distributions or the redemption of fund shares.
3. Annualized for periods less than one full year.
4. Less than 0.005%.
5. Total expenses including indirect expenses from affiliated fund fees and expenses were as follows:
| | | | |
Year Ended December 31, 2016 | | | 0.84 | % |
Year Ended December 31, 2015 | | | 0.83 | % |
Year Ended December 31, 2014 | | | 0.83 | % |
Year Ended December 31, 2013 | | | 0.84 | % |
Year Ended December 31, 2012 | | | 0.85 | % |
See accompanying Notes to Financial Statements.
12 OPPENHEIMER DISCOVERY MID CAP GROWTH FUND/VA
| | | | | | | | | | | | | | | | | | |
| Service Shares | | Year Ended
December 31,
2016 | | | Year Ended
December 31,
2015 | | | Year Ended
December 31,
2014 | | | Year Ended
December 31,
2013 | | | Year Ended
December 31,
2012 |
|
Per Share Operating Data | | | | | | | | | | | | | | | | | | |
Net asset value, beginning of period | | | $73.88 | | | | $76.21 | | | | $72.22 | | | | $53.25 | | | $45.84 |
|
Income (loss) from investment operations: | | | | | | | | | | | | | | | | | | |
Net investment loss1 | | | (0.15) | | | | (0.38) | | | | (0.46) | | | | (0.30) | | | (0.12) |
Net realized and unrealized gain | | | 1.62 | | | | 5.50 | | | | 4.45 | | | | 19.27 | | | 7.53 |
| | | |
Total from investment operations | | | 1.47 | | | | 5.12 | | | | 3.99 | | | | 18.97 | | | 7.41 |
|
Dividends and/or distributions to shareholders: | | | | | | | | | | | | | | | | | | |
Dividends from net investment income | | | 0.00 | | | | 0.00 | | | | 0.00 | | | | 0.00 | | | 0.00 |
Distributions from net realized gain | | | (5.92) | | | | (7.45) | | | | 0.00 | | | | 0.00 | | | 0.00 |
| | | |
Total dividends and/or distributions to shareholders | | | (5.92) | | | | (7.45) | | | | 0.00 | | | | 0.00 | | | 0.00 |
|
Net asset value, end of period | | | $69.43 | | | | $73.88 | | | | $76.21 | | | | $72.22 | | | $53.25 |
| | | |
| | | | | | | | | | | | | | | | | | | |
|
Total Return, at Net Asset Value2 | | | 2.08% | | | | 6.35% | | | | 5.53% | | | | 35.62% | | | 16.17% |
| | | | | | | | | | | | | | | | | | |
|
Ratios/Supplemental Data | | | | | | | | | | | | | | | | | | |
Net assets, end of period (in thousands) | | | $32,252 | | | | $37,029 | | | | $30,964 | | | | $36,549 | | | $35,942 |
|
Average net assets (in thousands) | | | $33,797 | | | | $32,812 | | | | $32,927 | | | | $35,905 | | | $37,842 |
|
Ratios to average net assets:3 | | | | | | | | | | | | | | | | | | |
Net investment loss | | | (0.21)% | | | | (0.49)% | | | | (0.64)% | | | | (0.49)% | | | (0.22)% |
Expenses excluding specific expenses listed below | | | 1.09% | | | | 1.08% | | | | 1.08% | | | | 1.09% | | | 1.10% |
Interest and fees from borrowings | | | 0.00%4 | | | | 0.00%4 | | | | 0.00% | | | | 0.00% | | | 0.00% |
| | | |
Total expenses5 | | | 1.09% | | | | 1.08% | | | | 1.08% | | | | 1.09% | | | 1.10% |
| Expenses after payments, waivers and/or reimbursements and reduction to custodian expenses | | | 1.05% | | | | 1.05% | | | | 1.05% | | | | 1.05% | | | 1.05% |
|
Portfolio turnover rate | | | 141% | | | | 81% | | | | 113% | | | | 84% | | | 66% |
1. Per share amounts calculated based on the average shares outstanding during the period.
2. Assumes an initial investment on the business day before the first day of the fiscal period, with all dividends and distributions reinvested in additional shares on the reinvestment date, and redemption at the net asset value calculated on the last business day of the fiscal period. Total returns are not annualized for periods less than one full year. Total return information does not reflect expenses that apply at the separate account level or to related insurance products. Inclusion of these charges would reduce the total return figures for all periods shown. Returns do not reflect the deduction of taxes that a shareholder would pay on fund distributions or the redemption of fund shares.
3. Annualized for periods less than one full year.
4. Less than 0.005%.
5. Total expenses including indirect expenses from affiliated fund fees and expenses were as follows:
| | | | |
Year Ended December 31, 2016 | | | 1.09 | % |
Year Ended December 31, 2015 | | | 1.08 | % |
Year Ended December 31, 2014 | | | 1.08 | % |
Year Ended December 31, 2013 | | | 1.09 | % |
Year Ended December 31, 2012 | | | 1.10 | % |
See accompanying Notes to Financial Statements.
13 OPPENHEIMER DISCOVERY MID CAP GROWTH FUND/VA
NOTES TO FINANCIAL STATEMENTS December 31, 2016
1. Organization
Oppenheimer Discovery Mid Cap Growth Fund/VA (the “Fund”), a separate series of Oppenheimer Variable Account Funds, is a diversified open-end management investment company registered under the Investment Company Act of 1940 (“1940 Act”), as amended. The Fund’s investment objective is to seek capital appreciation. The Fund’s investment adviser is OFI Global Asset Management, Inc. (“OFI Global” or the “Manager”), a wholly-owned subsidiary of OppenheimerFunds, Inc. (“OFI” or the “Sub-Adviser”). The Manager has entered into a sub-advisory agreement with OFI. Shares of the Fund are sold only to separate accounts of life insurance companies.
The Fund offers two classes of shares. Both classes are sold at their offering price, which is the net asset value per share, to separate investment accounts of participating insurance companies as an underlying investment for variable life insurance policies, variable annuity contracts or other investment products. The class of shares designated as Service shares is subject to a distribution and service plan. Both classes of shares have identical rights and voting privileges with respect to the Fund in general and exclusive voting rights on matters that affect that class alone. Earnings, net assets and net asset value per share may differ due to each class having its own expenses, such as transfer and shareholder servicing agent fees and shareholder communications, directly attributable to that class.
The following is a summary of significant accounting policies followed in the Fund’s preparation of financial statements in accordance with accounting principles generally accepted in the United States (“U.S. GAAP”).
2. Significant Accounting Policies
Security Valuation. All investments in securities are recorded at their estimated fair value, as described in Note 3.
Allocation of Income, Expenses, Gains and Losses. Income, expenses (other than those attributable to a specific class), gains and losses are allocated on a daily basis to each class of shares based upon the relative proportion of net assets represented by such class. Operating expenses directly attributable to a specific class are charged against the operations of that class.
Dividends and Distributions to Shareholders. Dividends and distributions to shareholders, which are determined in accordance with income tax regulations and may differ from U.S. GAAP, are recorded on the ex-dividend date. Income and capital gain distributions, if any, are declared and paid annually or at other times as deemed necessary by the Manager.
Investment Income. Dividend income is recorded on the ex-dividend date or upon ex-dividend notification in the case of certain foreign dividends where the ex-dividend date may have passed. Non-cash dividends included in dividend income, if any, are recorded at the fair market value of the securities received. Interest income is recognized on an accrual basis. Discount and premium, which are included in interest income on the Statement of Operations, are amortized or accreted daily.
Return of Capital Estimates. Distributions received from the Fund’s investments in Real Estate Investments Trusts (REITs), generally are comprised of income and return of capital. The Fund records investment income and return of capital based on estimates. Such estimates are based on historical information available from each REIT and other industry sources. These estimates may subsequently be revised based on information received from REITs after their tax reporting periods are concluded.
Custodian Fees. “Custodian fees and expenses” in the Statement of Operations may include interest expense incurred by the Fund on any cash overdrafts of its custodian account during the period. Such cash overdrafts may result from the effects of failed trades in portfolio securities and from cash outflows resulting from unanticipated shareholder redemption activity. The Fund pays interest to its custodian on such cash overdrafts, to the extent they are not offset by positive cash balances maintained by the Fund, at a rate equal to the Federal Funds Rate plus 0.50%. This rate will increase to 2.00% effective January 1, 2017. The “Reduction to custodian expenses” line item, if applicable, represents earnings on cash balances maintained by the Fund during the period. Such interest expense and other custodian fees may be paid with these earnings.
Security Transactions. Security transactions are recorded on the trade date. Realized gains and losses on securities sold are determined on the basis of identified cost.
Indemnifications. The Fund’s organizational documents provide current and former Trustees and officers with a limited indemnification against liabilities arising in connection with the performance of their duties to the Fund. In the normal course of business, the Fund may also enter into contracts that provide general indemnifications. The Fund’s maximum exposure under these arrangements is unknown as this would be dependent on future claims that may be made against the Fund. The risk of material loss from such claims is considered remote.
Federal Taxes. The Fund intends to comply with provisions of the Internal Revenue Code applicable to regulated investment companies and to distribute substantially all of its investment company taxable income, including any net realized gain on investments not offset by capital loss carryforwards, if any, to shareholders. Therefore, no federal income or excise tax provision is required. The Fund files income tax returns in U.S. federal and applicable state jurisdictions. The statute of limitations on the Fund’s tax return filings generally remains open for the three preceding fiscal reporting period ends. The Fund has analyzed its tax positions for the fiscal year ended December 31, 2016, including open tax years, and does not believe there are any uncertain tax positions requiring recognition in the Fund’s financial statements.
14 OPPENHEIMER DISCOVERY MID CAP GROWTH FUND/VA
2. Significant Accounting Policies (Continued)
The tax components of capital shown in the following table represent distribution requirements the Fund must satisfy under the income tax regulations, losses the Fund may be able to offset against income and gains realized in future years and unrealized appreciation or depreciation of securities and other investments for federal income tax purposes.
| | | | | | | | | | | | |
Undistributed Net Investment Income | | Undistributed
Long-Term
Gain | | | Accumulated
Loss
Carryforward1,2 | | | Net Unrealized
Appreciation
Based on cost of
Securities and
Other Investments
for Federal Income
Tax Purposes | |
| |
$201,536 | | | $69,774,468 | | | | $— | | | | $99,128,121 | |
1. During the reporting period, the Fund did not utilize any capital loss carryforward.
2. During the previous reporting period, the Fund did not utilize any capital loss carryforward.
Net investment income (loss) and net realized gain (loss) may differ for financial statement and tax purposes. The character of dividends and distributions made during the fiscal year from net investment income or net realized gains are determined in accordance with federal income tax requirements, which may differ from the character of net investment income or net realized gains presented in those financial statements in accordance with U.S. GAAP. Also, due to timing of dividends and distributions, the fiscal year in which amounts are distributed may differ from the fiscal year in which the income or net realized gain was recorded by the Fund.
Accordingly, the following amounts have been reclassified for the reporting period. Net assets of the Fund were unaffected by the reclassifications.
| | | | | | | | |
Increase to Paid-in Capital | | Reduction
to Accumulated
Net Investment
Income | | | Reduction
to Accumulated Net
Realized Gain
on Investments3 | |
| |
$5,342,270 | | | $271,973 | | | | $5,070,297 | |
3. $5,071,576, all of which was long-term capital gain, was distributed in connection with Fund share redemptions.
The tax character of distributions paid during the reporting periods:
| | | | | | | | |
| | | Year Ended
December 31, 2016 | | | Year Ended
December 31, 2015 | |
| |
Distributions paid from: | | | | | | | | |
Long-term capital gain | | $ | 51,152,857 | | | $ | 64,438,944 | |
The aggregate cost of securities and other investments and the composition of unrealized appreciation and depreciation of securities and other investments for federal income tax purposes at period end are noted in the following table. The primary difference between book and tax appreciation or depreciation of securities and other investments, if applicable, is attributable to the tax deferral of losses or tax realization of financial statement unrealized gain or loss.
| | | | |
Federal tax cost of securities | | $ | 545,293,699 | |
| | | | |
Gross unrealized appreciation | | $ | 105,813,482 | |
| |
Gross unrealized depreciation | | | (6,685,361) | |
| | | | |
Net unrealized appreciation | | $ | 99,128,121 | |
| | | | |
Use of Estimates. The preparation of financial statements in conformity with U.S. GAAP requires management to make estimates and assumptions that affect the reported amounts of assets and liabilities and disclosure of contingent assets and liabilities at the date of the financial statements and the reported amounts of increases and decreases in net assets from operations during the reporting period. Actual results could differ from those estimates.
3. Securities Valuation
The Fund calculates the net asset value of its shares as of 4:00 P.M. Eastern time, on each day the New York Stock Exchange (the “Exchange”) is open for trading, except in the case of a scheduled early closing of the Exchange, in which case the Fund will calculate net asset value of the shares as of the scheduled early closing time of the Exchange.
The Fund’s Board has adopted procedures for the valuation of the Fund’s securities and has delegated the day-to-day responsibility for valuation determinations under those procedures to the Manager. The Manager has established a Valuation Committee which is responsible for determining a “fair valuation” for any security for which market quotations are not “readily available.” The Valuation Committee’s fair valuation determinations are subject to review, approval and ratification by the Fund’s Board at its next regularly scheduled meeting covering the calendar quarter in which the fair valuation was determined.
15 OPPENHEIMER DISCOVERY MID CAP GROWTH FUND/VA
NOTES TO FINANCIAL STATEMENTS Continued
3. Securities Valuation (Continued)
Valuation Methods and Inputs
Securities are valued using unadjusted quoted market prices, when available, as supplied primarily by third party pricing services or dealers.
The following methodologies are used to determine the market value or the fair value of the types of securities described below:
Equity securities traded on a securities exchange (including exchange-traded derivatives other than futures and futures options) are valued based on the official closing price on the principal exchange on which the security is traded, as identified by the Manager, prior to the time when the Fund’s assets are valued. If the official closing price is unavailable, the security is valued at the last sale price on the principal exchange on which it is traded. If the official closing price or last sales price for a foreign security is not available, the security is valued at the mean between the bid and asked price per the exchange or, if not available from the exchange, obtained from two dealers. If bid and asked prices are not available from either the exchange or two dealers, the security is valued by using one of the following methodologies (listed in order of priority): (1) a bid from the exchange, (2) the mean between the bid and asked price as provided by a single dealer, or (3) a bid from a single dealer.
Shares of a registered investment company that are not traded on an exchange are valued at that investment company’s net asset value per share.
Corporate and government debt securities (of U.S. or foreign issuers) and municipal debt securities, event-linked bonds, loans, mortgage-backed securities, collateralized mortgage obligations, and asset-backed securities are valued at the mean between the “bid” and “asked” prices utilizing evaluated prices obtained from third party pricing services or broker-dealers who may use matrix pricing methods to determine the evaluated prices.
Short-term money market type debt securities are valued at the mean between the “bid” and “asked” prices utilizing evaluated prices obtained from third party pricing services or broker-dealers.
A description of the standard inputs that may generally be considered by the third party pricing vendors in determining their evaluated prices is provided below.
| | |
| Security Type | | Standard inputs generally considered by third-party pricing vendors |
| Corporate debt, government debt, municipal, mortgage- backed and asset-backed securities | | Reported trade data, broker-dealer price quotations, benchmark yields, issuer spreads on comparable securities, the credit quality, yield, maturity, and other appropriate factors. |
| Loans | | Information obtained from market participants regarding reported trade data and broker-dealer price quotations. |
| Event-linked bonds | | Information obtained from market participants regarding reported trade data and broker-dealer price quotations. |
If a market value or price cannot be determined for a security using the methodologies described above, or if, in the “good faith” opinion of the Manager, the market value or price obtained does not constitute a “readily available market quotation,” or a significant event has occurred that would materially affect the value of the security, the security is fair valued either (i) by a standardized fair valuation methodology applicable to the security type or the significant event as previously approved by the Valuation Committee and the Fund’s Board or (ii) as determined in good faith by the Manager’s Valuation Committee. The Valuation Committee considers all relevant facts that are reasonably available, through either public information or information available to the Manager, when determining the fair value of a security. Fair value determinations by the Manager are subject to review, approval and ratification by the Fund’s Board at its next regularly scheduled meeting covering the calendar quarter in which the fair valuation was determined. Those fair valuation standardized methodologies include, but are not limited to, valuing securities at the last sale price or initially at cost and subsequently adjusting the value based on: changes in company specific fundamentals, changes in an appropriate securities index, or changes in the value of similar securities which may be further adjusted for any discounts related to security-specific resale restrictions. When possible, such methodologies use observable market inputs such as unadjusted quoted prices of similar securities, observable interest rates, currency rates and yield curves. The methodologies used for valuing securities are not necessarily an indication of the risks associated with investing in those securities nor can it be assured that the Fund can obtain the fair value assigned to a security if it were to sell the security.
To assess the continuing appropriateness of security valuations, the Manager, or its third party service provider who is subject to oversight by the Manager, regularly compares prior day prices, prices on comparable securities, and sale prices to the current day prices and challenges those prices exceeding certain tolerance levels with the third party pricing service or broker source. For those securities valued by fair valuations, whether through a standardized fair valuation methodology or a fair valuation determination, the Valuation Committee reviews and affirms the reasonableness of the valuations based on such methodologies and fair valuation determinations on a regular basis after considering all relevant information that is reasonably available.
Classifications
Each investment asset or liability of the Fund is assigned a level at measurement date based on the significance and source of the inputs to its valuation. Various data inputs are used in determining the value of each of the Fund’s investments as of the reporting period end. These data inputs are categorized in the following hierarchy under applicable financial accounting standards:
1) Level 1-unadjusted quoted prices in active markets for identical assets or liabilities (including securities actively traded on a securities exchange)
2) Level 2-inputs other than unadjusted quoted prices that are observable for the asset or liability (such as unadjusted quoted prices for similar assets and market corroborated inputs such as interest rates, prepayment speeds, credit risks, etc.)
3) Level 3-significant unobservable inputs (including the Manager’s own judgments about assumptions that market participants would use in pricing the asset or liability).
16 OPPENHEIMER DISCOVERY MID CAP GROWTH FUND/VA
3. Securities Valuation (Continued)
The inputs used for valuing securities are not necessarily an indication of the risks associated with investing in those securities.
The Fund classifies each of its investments in investment companies which are publicly offered as Level 1. Investment companies that are not publicly offered are measured using net asset value as a practical expedient, and are not classified in the fair value hierarchy.
The table below categorizes amounts that are included in the Fund’s Statement of Assets and Liabilities at period end based on valuation input level:
| | | | | | | | | | | | | | | | |
| | | Level 1— Unadjusted
Quoted Prices | | | Level 2— Other Significant
Observable Inputs | | | Level 3— Significant
Unobservable Inputs | | | Value | |
| |
Assets Table | | | | | | | | | | | | | | | | |
Investments, at Value: | | | | | | | | | | | | | | | | |
Common Stocks | | | | | | | | | | | | | | | | |
Consumer Discretionary | | $ | 130,385,497 | | | $ | — | | | $ | — | | | $ | 130,385,497 | |
Consumer Staples | | | 13,840,102 | | | | — | | | | — | | | | 13,840,102 | |
Energy | | | 21,793,730 | | | | — | | | | — | | | | 21,793,730 | |
Financials | | | 78,389,586 | | | | — | | | | — | | | | 78,389,586 | |
Health Care | | | 89,492,497 | | | | — | | | | — | | | | 89,492,497 | |
Industrials | | | 125,727,909 | | | | — | | | | — | | | | 125,727,909 | |
Information Technology | | | 133,914,912 | | | | — | | | | — | | | | 133,914,912 | |
Materials | | | 29,378,620 | | | | — | | | | — | | | | 29,378,620 | |
Investment Company | | | 21,498,967 | | | | — | | | | — | | | | 21,498,967 | |
| | | | |
Total Assets | | $ | 644,421,820 | | | $ | — | | | $ | — | | | $ | 644,421,820 | |
| | | | |
Forward currency exchange contracts and futures contracts, if any, are reported at their unrealized appreciation/depreciation at measurement date, which represents the change in the contract’s value from trade date. All additional assets and liabilities included in the above table are reported at their market value at measurement date.
4. Investments and Risks
Investments in Affiliated Funds. The Fund is permitted to invest in other mutual funds advised by the Manager (“Affiliated Funds”). Affiliated Funds are open-end management investment companies registered under the 1940 Act, as amended. The Manager is the investment adviser of, and the Sub-Adviser provides investment and related advisory services to, the Affiliated Funds. When applicable, the Fund’s investments in Affiliated Funds are included in the Statement of Investments. Shares of Affiliated Funds are valued at their net asset value per share. As a shareholder, the Fund is subject to its proportional share of the Affiliated Funds’ expenses, including their management fee. The Manager will waive fees and/or reimburse Fund expenses in an amount equal to the indirect management fees incurred through the Fund’s investment in the Affiliated Funds.
Each of the Affiliated Funds in which the Fund invests has its own investment risks, and those risks can affect the value of the Fund’s investments and therefore the value of the Fund’s shares. To the extent that the Fund invests more of its assets in one Affiliated Fund than in another, the Fund will have greater exposure to the risks of that Affiliated Fund.
Investments in Money Market Instruments. The Fund is permitted to invest its free cash balances in money market instruments to provide liquidity or for defensive purposes. The Fund may invest in money market instruments by investing in Class E shares of Oppenheimer Institutional Government Money Market Fund (“IGMMF”), formerly known as Oppenheimer Institutional Money Market Fund, which is an Affiliated Fund. IGMMF is regulated as a money market fund under the 1940 Act, as amended. The Fund may also invest in money market instruments directly or in other affiliated or unaffiliated money market funds.
Equity Security Risk. Stocks and other equity securities fluctuate in price. The value of the Fund’s portfolio may be affected by changes in the equity markets generally. Equity markets may experience significant short-term volatility and may fall sharply at times. Different markets may behave differently from each other and U.S. equity markets may move in the opposite direction from one or more foreign stock markets. Adverse events in any part of the equity or fixed-income markets may have unexpected negative effects on other market segments.
The prices of individual equity securities generally do not all move in the same direction at the same time and a variety of factors can affect the price of a particular company’s securities. These factors may include, but are not limited to, poor earnings reports, a loss of customers, litigation against the company, general unfavorable performance of the company’s sector or industry, or changes in government regulations affecting the company or its industry.
Shareholder Concentration. At period end, one shareholder owned 20% or more of the Fund’s total outstanding shares.
The shareholder is a related party of the Fund. Related parties may include, but are not limited to, the investment manager and its affiliates, affiliated broker dealers, fund of funds, and directors or employees. The related party owned 66% of the Fund’s total outstanding shares at period end.
5. Market Risk Factors
The Fund’s investments in securities and/or financial derivatives may expose the Fund to various market risk factors:
17 OPPENHEIMER DISCOVERY MID CAP GROWTH FUND/VA
NOTES TO FINANCIAL STATEMENTS Continued
5. Market Risk Factors (Continued)
Commodity Risk. Commodity risk relates to the change in value of commodities or commodity indexes as they relate to increases or decreases in the commodities market. Commodities are physical assets that have tangible properties. Examples of these types of assets are crude oil, heating oil, metals, livestock, and agricultural products.
Credit Risk. Credit risk relates to the ability of the issuer of debt to meet interest and principal payments, or both, as they come due. In general, lower-grade, higher-yield debt securities are subject to credit risk to a greater extent than lower-yield, higher-quality securities.
Equity Risk. Equity risk relates to the change in value of equity securities as they relate to increases or decreases in the general market.
Foreign Exchange Rate Risk. Foreign exchange rate risk relates to the change in the U.S. dollar value of a security held that is denominated in a foreign currency. The U.S. dollar value of a foreign currency denominated security will decrease as the dollar appreciates against the currency, while the U.S. dollar value will increase as the dollar depreciates against the currency.
Interest Rate Risk. Interest rate risk refers to the fluctuations in value of fixed-income securities resulting from the inverse relationship between price and yield. For example, an increase in general interest rates will tend to reduce the market value of already issued fixed-income investments, and a decline in general interest rates will tend to increase their value. In addition, debt securities with longer maturities, which tend to have higher yields, are subject to potentially greater fluctuations in value from changes in interest rates than obligations with shorter maturities.
Volatility Risk. Volatility risk refers to the magnitude of the movement, but not the direction of the movement, in a financial instrument’s price over a defined time period. Large increases or decreases in a financial instrument’s price over a relative time period typically indicate greater volatility risk, while small increases or decreases in its price typically indicate lower volatility risk.
6. Shares of Beneficial Interest
The Fund has authorized an unlimited number of $0.001 par value shares of beneficial interest of each class. Transactions in shares of beneficial interest were as follows:
| | | | | | | | | | | | | | | | | | | | | | | | | | | | |
| | | Year Ended December 31, 2016 | | | | | | | | | Year Ended December 31, 2015 | | | | |
| | | Shares | | | Amount | | | | | | | | | Shares | | | Amount | | | | |
| |
Non-Service Shares | | | | | | | | | | | | | | | | | | | | | | | | | | | | |
Sold | | | 260,318 | | | $ | 19,152,890 | | | | | | | | | | | | 316,843 | | | $ | 25,835,263 | | | | | |
Dividends and/or distributions reinvested | | | 674,971 | | | | 48,415,668 | | | | | | | | | | | | 772,150 | | | | 61,563,484 | | | | | |
Redeemed | | | (1,219,400 | ) | | | (89,285,818 | ) | | | | | | | | | | | (1,154,717 | ) | | | (93,160,379 | ) | | | | |
| | | | |
Net decrease | | | (284,111 | ) | | $ | (21,717,260 | ) | | | | | | | | | | | (65,724 | ) | | $ | (5,761,632 | ) | | | | |
| | | | |
| | | | |
| |
Service Shares | | | | | | | | | | | | | | | | | | | | | | | | | | | | |
Sold | | | 50,885 | | | $ | 3,568,573 | | | | | | | | | | | | 153,951 | | | $ | 11,748,349 | | | | | |
Dividends and/or distributions reinvested | | | 39,878 | | | | 2,737,189 | | | | | | | | | | | | 37,465 | | | | 2,875,460 | | | | | |
Redeemed | | | (127,436 | ) | | | (8,923,664 | ) | | | | | | | | | | | (96,510 | ) | | | (7,534,963 | ) | | | | |
| | | | |
Net increase (decrease) | | | (36,673 | ) | | $ | (2,617,902 | ) | | | | | | | | | | | 94,906 | | | $ | 7,088,846 | | | | | |
| | | | |
7. Purchases and Sales of Securities
The aggregate cost of purchases and proceeds from sales of securities, other than short-term obligations and investments in IGMMF, for the reporting period were as follows:
| | | | |
| | | Purchases | | Sales |
|
Investment securities | | $903,515,062 | | $970,773,692 |
8. Fees and Other Transactions with Affiliates
Management Fees. Under the investment advisory agreement, the Fund pays the Manager a management fee based on the daily net assets of the Fund at an annual rate as shown in the following table:
| | | | |
| Fee Schedule | | | |
| |
Up to $200 million | | | 0.75% | |
Next $200 million | | | 0.72 | |
Next $200 million | | | 0.69 | |
Next $200 million | | | 0.66 | |
Next $700 million | | | 0.60 | |
Over $1.5 billion | | | 0.58 | |
The Fund’s effective management fee for the reporting period was 0.72% of average annual net assets before any applicable waivers.
Sub-Adviser Fees. The Manager has retained the Sub-Adviser to provide the day-to-day portfolio management of the Fund. Under the Sub-Advisory Agreement, the Manager pays the Sub-Adviser an annual fee in monthly installments, equal to a percentage of the investment management fee collected by the Manager from the Fund, which shall be calculated after any investment management fee waivers. The fee paid to the Sub-Adviser is paid by the Manager, not by the Fund.
18 OPPENHEIMER DISCOVERY MID CAP GROWTH FUND/VA
8. Fees and Other Transactions with Affiliates (Continued)
Transfer Agent Fees. OFI Global (the “Transfer Agent”) serves as the transfer and shareholder servicing agent for the Fund. The Fund pays the Transfer Agent a fee based on annual net assets. Fees incurred and average net assets for each class with respect to these services are detailed in the Statement of Operations and Financial Highlights, respectively.
Sub-Transfer Agent Fees. The Transfer Agent has retained Shareholder Services, Inc., a wholly-owned subsidiary of OFI (the “Sub-Transfer Agent”), to provide the day-to-day transfer agent and shareholder servicing of the Fund. Under the Sub-Transfer Agency Agreement, the Transfer Agent pays the Sub-Transfer Agent an annual fee in monthly installments, equal to a percentage of the transfer agent fee collected by the Transfer Agent from the Fund, which shall be calculated after any applicable fee waivers. The fee paid to the Sub-Transfer Agent is paid by the Transfer Agent, not by the Fund.
Trustees’ Compensation. The Fund’s Board of Trustees (“Board”) has adopted a compensation deferral plan for Independent Trustees that enables Trustees to elect to defer receipt of all or a portion of the annual compensation they are entitled to receive from the Fund. For purposes of determining the amount owed to the Trustees under the plan, deferred amounts are treated as though equal dollar amounts had been invested in shares of the Fund or in other Oppenheimer funds selected by the Trustees. The Fund purchases shares of the funds selected for deferral by the Trustees in amounts equal to his or her deemed investment, resulting in a Fund asset equal to the deferred compensation liability. Such assets are included as a component of “Other” within the asset section of the Statement of Assets and Liabilities. Deferral of Trustees’ fees under the plan will not affect the net assets of the Fund and will not materially affect the Fund’s assets, liabilities or net investment income per share. Amounts will be deferred until distributed in accordance with the compensation deferral plan.
Distribution and Service Plan for Service Shares. The Fund has adopted a Distribution and Service Plan (the “Plan”) pursuant to Rule 12b-1 under the 1940 Act for Service shares to pay OppenheimerFunds Distributor, Inc. (the “Distributor”), for distribution related services, personal service and account maintenance for the Fund’s Service shares. Under the Plan, payments are made periodically at an annual rate of 0.25% of the daily net assets of Service shares of the Fund. The Distributor currently uses all of those fees to compensate sponsors of the insurance product that offers Fund shares, for providing personal service and maintenance of accounts of their variable contract owners that hold Service shares. These fees are paid out of the Fund’s assets on an on-going basis and increase operating expenses of the Service shares, which results in lower performance compared to the Fund’s shares that are not subject to a service fee. Fees incurred by the Fund under the Plan are detailed in the Statement of Operations.
Waivers and Reimbursements of Expenses. The Manager has contractually agreed to limit the Fund’s expenses after payments, waivers and/or reimbursements and reduction to custodian expenses, excluding any applicable dividend expense, taxes, interest and fees from borrowing, any subsidiary expenses, Acquired Fund Fees and Expenses, brokerage commissions, unusual and infrequent expenses and certain other Fund expenses; so that those expenses, as percentages of daily net assets, will not exceed the annual rate of 0.80% for Non-Service shares and 1.05% for Service shares. During the reporting period, the Manager waived fees and/or reimbursed the Fund $228,340 and $12,261 for Non-Service and Service shares, respectively.
The Manager will waive fees and/or reimburse Fund expenses in an amount equal to the indirect management fees incurred through the Fund’s investment in IGMMF. During the reporting period, the Manager waived fees and/or reimbursed the Fund $18,875 for IGMMF management fees.
Waivers and/or reimbursements may be modified or terminated as set forth according to the terms in the prospectus.
9. Borrowings and Other Financing
Joint Credit Facility. A number of mutual funds managed by the Manager participate in a $1.3 billion revolving credit facility (the “Facility”) intended to provide short-term financing, if necessary, subject to certain restrictions in connection with atypical redemption activity. Expenses and fees related to the Facility are paid by the participating funds and are disclosed separately or as other expenses on the Statement of Operations. The Fund did not utilize the Facility during the reporting period.
10. Pending Litigation
In 2009, several putative class action lawsuits were filed and later consolidated before the U.S. District Court for the District of Colorado in connection with the investment performance of Oppenheimer Rochester California Municipal Fund (the “California Fund”), a fund advised by OppenheimerFunds, Inc. (“OFI”) and distributed by OppenheimerFunds Distributor, Inc. (“OFDI”). The plaintiffs asserted claims against OFI, OFDI and certain present and former trustees and officers of the California Fund under the federal securities laws, alleging, among other things, that the disclosure documents of the California Fund contained misrepresentations and omissions and the investment policies of the California Fund were not followed. An amended complaint and a motion to dismiss were filed, and in 2011, the court issued an order which granted in part and denied in part the defendants’ motion to dismiss. In October 2015, following a successful appeal by defendants and a subsequent hearing, the court granted plaintiffs’ motion for class certification and appointed class representatives and class counsel.
OFI and OFDI believe the suit is without merit; that it is premature to render any opinion as to the likelihood of an outcome unfavorable to them in the suit; and that no estimate can yet be made as to the amount or range of any potential loss. Furthermore, OFI believes that the suit should not impair the ability of OFI or OFDI to perform their respective duties to the Fund and that the outcome of the suit should not have any material effect on the operations of any of the Oppenheimer funds.
19 OPPENHEIMER DISCOVERY MID CAP GROWTH FUND/VA
REPORT OF INDEPENDENT REGISTERED PUBLIC ACCOUNTING FIRM
The Board of Trustees and Shareholders of Oppenheimer Variable Account Funds:
We have audited the accompanying statement of assets and liabilities of Oppenheimer Discovery Mid Cap Growth Fund/VA (a separate series of Oppenheimer Variable Account Funds), including the statement of investments, as of December 31, 2016, and the related statement of operations for the year then ended, the statements of changes in net assets for each of the years in the two-year period then ended, and the financial highlights for each of the years in the five-year period then ended. These financial statements and financial highlights are the responsibility of the Fund’s management. Our responsibility is to express an opinion on these financial statements and financial highlights based on our audits.
We conducted our audits in accordance with the standards of the Public Company Accounting Oversight Board (United States). Those standards require that we plan and perform the audit to obtain reasonable assurance about whether the financial statements and financial highlights are free of material misstatement. An audit includes examining, on a test basis, evidence supporting the amounts and disclosures in the financial statements. Our procedures included confirmation of securities owned as of December 31, 2016, by correspondence with the custodian, transfer agent and brokers, or by other appropriate auditing procedures where replies from brokers were not received. An audit also includes assessing the accounting principles used and significant estimates made by management, as well as evaluating the overall financial statement presentation. We believe that our audits provide a reasonable basis for our opinion.
In our opinion, the financial statements and financial highlights referred to above present fairly, in all material respects, the financial position of Oppenheimer Discovery Mid Cap Growth Fund/VA as of December 31, 2016, the results of its operations for the year then ended, the changes in its net assets for each of the years in the two-year period then ended, and the financial highlights for each of the years in the five-year period then ended, in conformity with U.S. generally accepted accounting principles.
KPMG LLP
Denver, Colorado
February 15, 2017
20 OPPENHEIMER DISCOVERY MID CAP GROWTH FUND/VA
FEDERAL INCOME TAX INFORMATION Unaudited
In early 2017, if applicable, shareholders of record received information regarding all dividends and distributions paid to them by the Fund during calendar year 2016.
Capital gain distributions of $5.91798 per share were paid Non-Service and Service shareholders, respectively, on June 21, 2016. Whether received in stock or in cash, the capital gain distribution should be treated by shareholders as a gain from the sale of the capital assets held for more than one year (long-term capital gains).
Dividends, if any, paid by the Fund during the reporting period which are not designated as capital gain distributions should be multiplied by the maximum amount allowable but not less than 100% to arrive at the amount eligible for the corporate dividend-received deduction.
The foregoing information is presented to assist shareholders in reporting distributions received from the Fund to the Internal Revenue Service. Because of the complexity of the federal regulations which may affect your individual tax return and the many variations in state and local tax regulations, we recommend that you consult your tax advisor for specific guidance.
21 OPPENHEIMER DISCOVERY MID CAP GROWTH FUND/VA
BOARD APPROVAL OF THE FUND’S INVESTMENT ADVISORY AND SUB-ADVISORY AGREEMENTS Unaudited
The Fund has entered into an investment advisory agreement with OFI Global Asset Management, Inc. (“OFI Global” or the “Adviser”), a wholly-owned subsidiary of OppenheimerFunds, Inc. (“OFI” or the “Sub-Adviser”) (“OFI Global” and “OFI” together the “Managers”) and OFI Global has entered into a sub-advisory agreement with OFI whereby OFI provides investment sub-advisory services to the Fund (collectively, the “Agreements”). Each year, the Board of Trustees (the “Board”), including a majority of the independent Trustees, is required to determine whether to approve the terms of the Agreements and the renewal thereof. The Investment Company Act of 1940, as amended, requires that the Board request and evaluate, and that the Managers provide, such information as may be reasonably necessary to evaluate the terms of the Agreements. The Board employs an independent consultant to prepare a report that provides information, including comparative information that the Board requests for that purpose. In addition to in-person meetings focused on this evaluation, the Board receives information throughout the year regarding Fund services, fees, expenses and performance.
The Managers and the independent consultant provided information to the Board on the following factors: (i) the nature, quality and extent of the Managers’ services, (ii) the comparative investment performance of the Fund and the Managers, (iii) the fees and expenses of the Fund, including comparative fee and expense information, (iv) the profitability of the Managers and their affiliates, including an analysis of the cost of providing services, (v) whether economies of scale are realized as the Fund grows and whether fee levels reflect these economies of scale for Fund investors and (vi) other benefits to the Managers from their relationship with the Fund. The Board was aware that there are alternatives to retaining the Managers.
Outlined below is a summary of the principal information considered by the Board as well as the Board’s conclusions.
Nature, Quality and Extent of Services. The Board considered information about the nature, quality and extent of the services provided to the Fund and information regarding the Managers’ key personnel who provide such services. The Managers’ duties include providing the Fund with the services of the portfolio managers and the Sub-Adviser’s investment team, who provide research, analysis and other advisory services in regard to the Fund’s investments; and securities trading services. OFI Global is responsible for oversight of third-party service providers; monitoring compliance with applicable Fund policies and procedures and adherence to the Fund’s investment restrictions; risk management; and oversight of the Sub-Adviser. OFI Global is also responsible for providing certain administrative services to the Fund. Those services include providing and supervising all administrative and clerical personnel who are necessary in order to provide effective corporate administration for the Fund; compiling and maintaining records with respect to the Fund’s operations; preparing and filing reports required by the U.S. Securities and Exchange Commission; preparing periodic reports regarding the operations of the Fund for its shareholders; preparing proxy materials for shareholder meetings; and preparing the registration statements required by federal and state securities laws for the sale of the Fund’s shares. OFI Global also provides the Fund with office space, facilities and equipment.
The Board also considered the quality of the services provided and the quality of the Managers’ resources that are available to the Fund. The Board took account of the fact that the Sub-Adviser has over fifty years of experience as an investment adviser and that its assets under management rank it among the top mutual fund managers in the United States. The Board evaluated the Managers’ advisory, administrative, accounting, legal, compliance and risk management services, and information the Board has received regarding the experience and professional qualifications of the Managers’ key personnel and the size and functions of its staff. In its evaluation of the quality of the portfolio management services provided, the Board considered the experience of Ronald Zibelli and Justin Livengood, the portfolio managers for the Fund, and the Sub-Adviser’s investment team and analysts. The Board members also considered the totality of their experiences with the Managers as directors or trustees of the Fund and other funds advised by the Managers. The Board considered information regarding the quality of services provided by affiliates of the Managers, which the Board members have become knowledgeable about through their experiences with the Managers and in connection with the renewal of the Fund’s service agreements. The Board concluded, in light of the Managers’ experience, reputation, personnel, operations and resources that the Fund benefits from the services provided under the Agreements.
Investment Performance of the Managers and the Fund. Throughout the year, the Managers provided information on the investment performance of the Fund, the Adviser and the Sub-Adviser, including comparative performance information. The Board also reviewed information, prepared by the Managers and by the independent consultant, comparing the Fund’s historical performance to relevant market indices and to the performance of other mid-cap growth funds underlying variable insurance products. The Board considered that the Fund outperformed its performance category median for the one-, three- and five-year periods but underperformed for the ten-year period.
Fees and Expenses of the Fund. The Board reviewed the fees paid to the Adviser and the other expenses borne by the Fund. The independent consultant provided comparative data in regard to the fees and expenses of the Fund and other mid-cap growth funds underlying variable insurance products. In reviewing the fees and expenses charged to the VA funds, the Board considered the Adviser’s assertion that, because there is much greater disparity in the fees and services that may be provided by a manager to a VA fund as opposed to a retail fund, when comparing the expenses of the various VA funds to those of retail funds, it is most appropriate to focus on total expenses (rather than on the management fees). Accordingly, while the Board reviewed and considered all expenses, it focused on total expenses. The Board considered that the Fund’s contractual management fees and total expenses were lower than their respective peer group medians and category medians. The Board noted that the Adviser has contractually agreed to limit the Fund’s total annual operating expenses so that those expenses, as percentages of daily net assets, will not exceed the annual rate of 0.80% for Non-Service Shares and 1.05% for Service Shares. This contractual expense limitation may not be amended or withdrawn for one year from the date of the Fund’s prospectus, unless approved by the Board.
Economies of Scale and Profits Realized by the Managers. The Board considered information regarding the Managers’ costs in serving as the Fund’s investment adviser and sub-adviser, including the costs associated with the personnel and systems necessary to manage the Fund, and information regarding the Managers’ profitability from their relationship with the Fund. The Board also considered that the Managers must be able to pay and retain experienced professional personnel at competitive rates to provide quality services to the Fund. The Board reviewed whether the Managers may realize economies of scale in managing and supporting the Fund. The Board noted that the Fund currently has management fee breakpoints, which are intended to share with Fund shareholders economies of scale that may exist as the Fund’s assets grow.
Other Benefits to the Managers. In addition to considering the profits realized by the Managers, the Board considered information that was provided regarding the direct and indirect benefits the Managers receive as a result of their relationship with the Fund, including compensation paid to
22 OPPENHEIMER DISCOVERY MID CAP GROWTH FUND/VA
BOARD APPROVAL OF THE FUND’S INVESTMENT ADVISORY AND SUB-ADVISORY AGREEMENTS Unaudited / Continued
the Managers’ affiliates and research provided to the Adviser in connection with permissible brokerage arrangements (soft dollar arrangements).
Conclusions. These factors were also considered by the independent Trustees meeting separately from the full Board, assisted by experienced counsel to the Fund and to the independent Trustees. Fund counsel and the independent Trustees’ counsel are independent of the Managers within the meaning and intent of the Securities and Exchange Commission Rules.
Based on its review of the information it received and its evaluations described above, the Board, including a majority of the independent Trustees, decided to continue the Agreements through August 31, 2017. In arriving at its decision, the Board did not identify any factor or factors as being more important than others, but considered all of the above information, and considered the terms and conditions of the Agreements, including the management fees, in light of all the surrounding circumstances.
23 OPPENHEIMER DISCOVERY MID CAP GROWTH FUND/VA
PORTFOLIO PROXY VOTING POLICIES AND GUIDELINES; UPDATES TO STATEMENTS OF INVESTMENTS Unaudited
The Fund has adopted Portfolio Proxy Voting Policies and Guidelines under which the Fund votes proxies relating to securities (“portfolio proxies”) held by the Fund. A description of the Fund’s Portfolio Proxy Voting Policies and Guidelines is available (i) without charge, upon request, by calling the Fund toll-free at 1.800. CALL OPP (225.5677), (ii) on the Fund’s website at www.oppenheimerfunds.com, and (iii) on the SEC’s website at www.sec.gov. In addition, the Fund is required to file Form N-PX, with its complete proxy voting record for the 12 months ended June 30th, no later than August 31st of each year. The Fund’s voting record is available (i) without charge, upon request, by calling the Fund toll-free at 1.800. CALL OPP (225.5677), and (ii) in the Form N-PX filing on the SEC’s website at www.sec.gov.
The Fund files its complete schedule of portfolio holdings with the SEC for the first quarter and the third quarter of each fiscal year on Form N-Q. The Fund’s Form N-Q filings are available on the SEC’s website at www.sec.gov. Those forms may be reviewed and copied at the SEC’s Public Reference Room in Washington, D.C. Information on the operation of the Public Reference Room may be obtained by calling 1-800-SEC-0330.
24 OPPENHEIMER DISCOVERY MID CAP GROWTH FUND/VA
TRUSTEES AND OFFICERS Unaudited
| | |
Name, Position(s) Held with the Fund, Length of
Service, Age | | Principal Occupation(s) During the Past 5 Years; Other Trusteeships/Directorships
Held; Number of Portfolios in the Fund Complex Currently Overseen |
| |
| INDEPENDENT TRUSTEES | | The address of each Trustee in the chart below is 6803 S. Tucson Way, Centennial, Colorado 80112-3924. Each Trustee serves for an indefinite term, or until his or her resignation, retirement, death or removal. |
| |
Robert J. Malone, Chairman of the Board of Trustees (since 2016), Trustee (since 2002) Year of Birth: 1944 | | Chairman - Colorado Market of MidFirst Bank (since January 2015); Chairman of the Board (2012-2016) and Director (August 2005-March 2016) of Jones International University (educational organization); Trustee of the Gallagher Family Foundation (non-profit organization) (2000-2015); Chairman, Chief Executive Officer and Director of Steele Street Bank Trust (commercial banking) (August 2003-January 2015); Board of Directors of Opera Colorado Foundation (non-profit organization) (2008- 2012); Director of Colorado UpLIFT (charitable organization) (1986-2010); Director of Jones Knowledge, Inc. (2006-2010); Former Chairman of U.S. Bank-Colorado (subsidiary of U.S. Bancorp and formerly Colorado National Bank) (July 1996-April 1999); Director of Commercial Assets, Inc. (real estate investment trust) (1993-2000); Director of U.S. Exploration, Inc. (oil and gas exploration) (1997-February 2004); Chairman of the Board (1991-1994) and Trustee (1985-1994) of Regis University; and Chairman of the Board (1990-1991) and Trustee (1984-1999) of Young Presidents Organization. Oversees 47 portfolios in the OppenheimerFunds complex. Mr. Malone has served on the Boards of certain Oppenheimer funds since 2002, during which time he has become familiar with the Fund’s (and other Oppenheimer funds’) financial, accounting, regulatory and investment matters and has contributed to the Boards’ deliberations. |
| |
Jon S. Fossel, Trustee (since 1990) Year of Birth: 1942 | | Chairman of the Board of Jack Creek Preserve Foundation (non-profit organization) (since March 2005); Director of Jack Creek Preserve Foundation (non-profit organization) (March 2005-December 2014); Chairman of the Board (2006-December 2011) and Director (June 2002-December 2011) of UNUMProvident (insurance company); Director of Northwestern Energy Corp. (public utility corporation) (November 2004-December 2009); Director of P.R. Pharmaceuticals (October 1999-October 2003); Director of Rocky Mountain Elk Foundation (non-profit organization) (February 1998-February 2003 and February 2005-February 2007); Chairman and Director (until October 1996) and President and Chief Executive Officer (until October 1995) of OppenheimerFunds, Inc.; President, Chief Executive Officer and Director of the following: Oppenheimer Acquisition Corp. (“OAC”) (parent holding company of OppenheimerFunds, Inc.), Shareholders Services, Inc. and Shareholder Financial Services, Inc. (until October 1995). Oversees 47 portfolios in the OppenheimerFunds complex. Mr. Fossel has served on the Boards of certain Oppenheimer funds since 1990, during which time he has become familiar with the Fund’s (and other Oppenheimer funds’) financial, accounting, regulatory and investment matters and has contributed to the Boards’ deliberations. |
| |
Richard F. Grabish, Trustee (since 2012) Year of Birth: 1948 | | Formerly Senior Vice President and Assistant Director of Sales and Marketing (March 1997-December 2007), Director (March 1987-December 2007) and Manager of Private Client Services (June 1985-June 2005) of A.G. Edwards & Sons, Inc. (broker/dealer and investment firm); Chairman and Chief Executive Officer of A.G. Edwards Trust Company, FSB (March 2001-December 2007); President and Vice Chairman of A.G. Edwards Trust Company, FSB (investment adviser) (April 1987-March 2001); President of A.G. Edwards Trust Company, FSB (investment adviser) (June 2005-December 2007). Oversees 47 portfolios in the OppenheimerFunds complex. Mr. Grabish has served on the Boards of certain Oppenheimer funds since 2001, during which time he has become familiar with the Fund’s (and other Oppenheimer funds’) financial, accounting, regulatory and investment matters and has contributed to the Boards’ deliberations. |
| |
Beverly L. Hamilton, Trustee (since 2002) Year of Birth: 1946 | | Trustee of Monterey Institute for International Studies (educational organization) (2000-2014); Board Member of Middlebury College (educational organization) (December 2005-June 2011); Chairman (2010-2016) of American Funds’ Emerging Markets Growth Fund, Inc. (mutual fund); Director of The California Endowment (philanthropic organization) (April 2002-April 2008); Director (February 2002-2005) and Chairman of Trustees (2006-2007) of the Community Hospital of Monterey Peninsula; Director (October 1991-2005) and Vice Chairman (2006-2009) of American Funds’ Emerging Markets Growth Fund, Inc. (mutual fund); President of ARCO Investment Management Company (February 1991-April 2000); Member of the investment committees of The Rockefeller Foundation (2001-2006) and The University of Michigan (since 2000); Advisor at Credit Suisse First Boston’s Sprout venture capital unit (venture capital fund) (1994-January 2005); Trustee of MassMutual Institutional Funds (investment company) (1996-June 2004); Trustee of MML Series Investment Fund (investment company) (April 1989-June 2004); Member of the investment committee of Hartford Hospital (2000-2003); and Advisor to Unilever (Holland) pension fund (2000-2003). Oversees 47 portfolios in the OppenheimerFunds complex. Ms. Hamilton has served on the Boards of certain Oppenheimer funds since 2002, during which time she has become familiar with the Fund’s (and other Oppenheimer funds’) financial, accounting, regulatory and investment matters and has contributed to the Boards’ deliberations. |
| |
Victoria J. Herget, Trustee (since 2012) Year of Birth:1951 | | Board Chair (2008-2015) and Director (2004-Present), United Educators (insurance company); Trustee (since 2000) and Chair (since 2010), Newberry Library (independent research library); Trustee, Mather LifeWays (senior living organization) (since 2001); Independent Director of the First American Funds (mutual fund family) (2003-2011); former Managing Director (1993-2001), Principal (1985-1993), Vice President (1978-1985) and Assistant Vice President (1973-1978) of Zurich Scudder Investments (investment adviser) (and its predecessor firms); Trustee (1992-2007), Chair of the Board of Trustees (1999-2007), Investment Committee Chair (1994-1999) and Investment Committee member (2007-2010) of Wellesley College; Trustee, BoardSource (non-profit organization) (2006-2009) and Chicago City Day School (K-8 School) (1994-2005). Oversees 47 portfolios in the OppenheimerFunds complex. Ms. Herget has served on the Boards of certain Oppenheimer funds since 2012, during which time she has become familiar with the Fund’s (and other Oppenheimer funds’) financial, accounting, regulatory and investment matters and has contributed to the Boards’ deliberations. |
25 OPPENHEIMER DISCOVERY MID CAP GROWTH FUND/VA
TRUSTEES AND OFFICERS Unaudited / Continued
| | |
F. William Marshall, Jr., Trustee (since 2000) Year of Birth: 1942 | | Trustee Emeritus of Worcester Polytech Institute (WPI) (private university) (since 2009); Trustee of MassMutual Select Funds (formerly MassMutual Institutional Funds) (investment company) (1996-2015), MML Series Investment Fund (investment company) (1996-2015) and Mass Mutual Premier Funds (investment company) (January 2012-December 2015); President and Treasurer of the SIS Fund (private charitable fund) (January 1999-March 2011); Former Trustee of WPI (1985-2008); Former Chairman of the Board (2004-2006) and Former Chairman of the Investment Committee of WPI (1994-2008); Chairman of SIS Family Bank, F.S.B. (formerly SIS Bank) (commercial bank) (January 1999-July 1999); Executive Vice President of Peoples Heritage Financial Group, Inc. (commercial bank) (January 1999-July 1999); and Former President and Chief Executive Officer of SIS Bancorp. (1993-1999). Oversees 47 portfolios in the OppenheimerFunds complex. Mr. Marshall has served on the Boards of certain Oppenheimer funds since 2000, during which time he has become familiar with the Fund’s (and other Oppenheimer funds’) financial, accounting, regulatory and investment matters and has contributed to the Boards’ deliberations. |
| |
Karen L. Stuckey, Trustee (since 2012) Year of Birth: 1953 | | Member (since May 2015) of Desert Mountain Community Foundation Advisory Board (non-profit organization); Partner (1990-2012) of PricewaterhouseCoopers LLP (professional services firm) (held various positions 1975-1990); Trustee (1992- 2006), member of Executive, Nominating and Audit Committees and Chair of Finance Committee (1992-2006), and Emeritus Trustee (since 2006) of Lehigh University; and member, Women’s Investment Management Forum (professional organization) since inception. Oversees 47 portfolios in the OppenheimerFunds complex. Ms. Stuckey has served on the Boards of certain Oppenheimer funds since 2012, during which time she has become familiar with the Fund’s (and other Oppenheimer funds’) financial, accounting, regulatory and investment matters and has contributed to the Boards’ deliberations. |
| |
James D. Vaughn, Trustee (since 2012) Year of Birth: 1945 | | Retired; former managing partner (1994-2001) of Denver office of Deloitte & Touche LLP, (held various positions 1969- 1993); Trustee and Chairman of the Audit Committee of Schroder Funds (2003-2012); Board member and Chairman of Audit Committee of AMG National Trust Bank (since 2005); Trustee and Investment Committee member, University of South Dakota Foundation (since 1996); Board member, Audit Committee Member and past Board Chair, Junior Achievement (since 1993); former Board member, Mile High United Way, Boys and Girls Clubs, Boy Scouts, Colorado Business Committee for the Arts, Economic Club of Colorado and Metro Denver Network. Oversees 47 portfolios in the OppenheimerFunds complex. Mr. Vaughn has served on the Boards of certain Oppenheimer funds since 2012, during which time he has become familiar with the Fund’s (and other Oppenheimer funds’) financial, accounting, regulatory and investment matters and has contributed to the Boards’ deliberations. |
INTERESTED TRUSTEE AND OFFICER | | Mr. Steinmetz is an “Interested Trustee” because he is affiliated with the Manager and the Sub-Adviser by virtue of his positions as Chairman and director of the Sub-Adviser and officer and director of the Manager. Both as a Trustee and as an officer, Mr. Steinmetz serves for an indefinite term, or until his resignation, retirement, death or removal. Mr. Steinmetz’s address is 225 Liberty Street, New York, New York 10281-1008. |
| |
Arthur P. Steinmetz, Trustee (Since 2015), President and Principal Executive Officer (since 2014) Year of Birth: 1958 | | Chairman of OppenheimerFunds, Inc. (since January 2015); CEO and Chairman of OFI Global Asset Management, Inc. (since July 2014), President of OFI Global Asset Management, Inc. (since May 2013), a Director of OFI Global Asset Management, Inc. (since January 2013), Director of OppenheimerFunds, Inc. (since July 2014), President, Management Director and CEO of Oppenheimer Acquisition Corp. (OppenheimerFunds, Inc.’s parent holding company) (since July 2014), and President and Director of OFI SteelPath, Inc. (since January 2013). Chief Investment Officer of the OppenheimerFunds advisory entities from (January 2013-December 2013); Executive Vice President of OFI Global Asset Management, Inc. (January 2013-May 2013); Chief Investment Officer of OppenheimerFunds, Inc. (October 2010-December 2012); Chief Investment Officer, Fixed- Income, of OppenheimerFunds, Inc. (April 2009-October 2010); Executive Vice President of OppenheimerFunds, Inc. (October 2009-December 2012); Director of Fixed Income of OppenheimerFunds, Inc. (January 2009-April 2009); and a Senior Vice President of OppenheimerFunds, Inc. (March 1993-September 2009). An officer of 103 portfolios in the OppenheimerFunds complex. |
OTHER OFFICERS OF THE FUND | | The addresses of the Officers in the chart below are as follows: for Messrs. Zibelli, Jr., Livengood, Mss. Lo Bessette, Foxson and Picciotto, 225 Liberty Street, New York, New York 10281-1008, for Mr. Petersen, 6803 S. Tucson Way, Centennial, Colorado 80112-3924. Each Officer serves for an indefinite term or until his or her resignation, retirement, death or removal |
| |
Ronald J. Zibelli, Jr., Vice President (since 2008) Year of Birth: 1959 | | Senior Vice President of the Sub-Adviser (since January 2014); Senior Portfolio Manager of the Sub-Adviser (since May 2006) and Vice President of the Sub-Adviser (May 2006-January 2014). Prior to joining the Sub-Adviser, he spent six years at Merrill Lynch Investment Managers, during which time he was a Managing Director and Small Cap Growth Team Leader, responsible for managing 11 portfolios. Prior to joining Merrill Lynch Investment Managers, Mr. Zibelli spent 12 years with Chase Manhattan Bank, including two years as Senior Portfolio Manager (U.S. Small Cap Equity) at Chase Asset Management. A portfolio manager and an officer of other portfolios in the OppenheimerFunds complex. |
| |
Justin Livengood, Vice President (since 2014) Year of Birth: 1974 | | Vice President (since May 2006) and Senior Portfolio (since January 2014) of the Sub-Adviser. Senior Research Analyst of the Sub-Adviser (May 2006-January 2014), responsible for the health care, energy and financial services sectors for mid- and small-cap growth accounts. Before joining the Sub-Adviser in May 2006, Mr. Livengood was a vice president and fund analyst with Merrill Lynch Investment Managers, where he specialized in financial services, health care, energy and basic materials for the Merrill Lynch Small Cap Growth Fund. During his tenure at Merrill Lynch he also worked as an investment banking analyst in the Global Media Group and as an associate with Merrill Lynch Ventures. A portfolio manager and an officer of other portfolios in the OppenheimerFunds complex. |
26 OPPENHEIMER DISCOVERY MID CAP GROWTH FUND/VA
| | |
| |
Cynthia Lo Bessette, Secretary and Chief Legal Officer (since 2016) Year of Birth: 1969 | | Executive Vice President, General Counsel and Secretary of the Manager (since February 2016); Chief Legal Officer of the Sub-Adviser and the Distributor (since February 2016); Vice President, General Counsel and Secretary of Oppenheimer Acquisition Corp. (since February 2016); General Counsel of OFI SteelPath, Inc., VTL Associates, LLC and Index Management Solutions, LLC (since February 2016); Chief Legal Officer of OFI Global Institutional, Inc., HarbourView Asset Management Corporation, OFI Global Trust Company, Oppenheimer Real Asset Management, Inc., OFI Private Investments Inc., Shareholder Services, Inc. and Trinity Investment Management Corporation (since February 2016); Senior Vice President and Deputy General Counsel (March 2015-February 2016) and Executive Vice President, Vice President, Corporate Counsel (February 2012-March 2015) and Deputy Chief Legal Officer (April 2013-March 2015) of Jennison Associates LLC; Assistant General Counsel (April 2008-September 2009) and Deputy General Counsel (October 2009-February 2012) of Lord Abbett & Co. LLC. An officer of 103 portfolios in the OppenheimerFunds complex. |
| |
Jennifer Foxson, Vice President and Chief Business Officer (since 2014) Year of Birth: 1969 | | Senior Vice President of OppenheimerFunds Distributor, Inc. (since June 2014); Vice President of OppenheimerFunds Distributor, Inc. (April 2006-June 2014); Vice President of the Sub-Adviser (January 1998-March 2006); Assistant Vice President of the Sub-Adviser (October 1991-December 1998). An officer of 103 portfolios in the OppenheimerFunds complex. |
| |
Mary Ann Picciotto, Chief Compliance Officer and Chief Anti-Money Laundering Officer (since 2014) Year of Birth: 1973 | | Senior Vice President and Chief Compliance Officer of the Manager (since March 2014); Chief Compliance Officer of the Sub- Adviser, OFI SteelPath, Inc., OFI Global Trust Company, OFI Global Institutional, Inc., Oppenheimer Real Asset Management, Inc., OFI Private Investments, Inc., Harborview Asset Management Corporation, Trinity Investment Management Corporation, and Shareholder Services, Inc. (since March 2014); Managing Director of Morgan Stanley Investment Management Inc. and certain of its various affiliated entities; Chief Compliance Officer of various Morgan Stanley Funds (May 2010-January 2014); Chief Compliance Officer of Morgan Stanley Investment Management Inc. (April 2007-January 2014). An officer of 103 portfolios in the OppenheimerFunds complex. |
| |
Brian S. Petersen, Treasurer and Principal Financial & Accounting Officer (since 2016) Year of Birth: 1970 | | Vice President of the Manager (since January 2013); Vice President of the Sub-Adviser (February 2007-December 2012); Assistant Vice President of the Sub-Adviser (August 2002-2007). An officer of 103 portfolios in the OppenheimerFunds complex. |
The Fund’s Statement of Additional Information contains additional information about the Fund’s Trustees and Officers and is available without charge, upon request, by calling 1.800.988.8287.
27 OPPENHEIMER DISCOVERY MID CAP GROWTH FUND/VA
OPPENHEIMER DISCOVERY MID CAP GROWTH FUND/VA
A Series of Oppenheimer Variable Account Funds
| | |
Manager | | OFI Global Asset Management, Inc. |
| |
Sub-Adviser | | OppenheimerFunds, Inc. |
| |
Distributor | | OppenheimerFunds Distributor, Inc. |
| |
Transfer and | | OFI Global Asset Management, Inc. |
Shareholder | | |
Servicing Agent | | |
| |
Sub-Transfer Agent | | Shareholder Services, Inc. |
| | DBA OppenheimerFunds Services |
| |
Independent | | KPMG LLP |
Registered | | |
Public | | |
Accounting | | |
Firm | | |
| |
Legal Counsel | | Ropes & Gray LLP |
| |
| | Before investing in any of the Oppenheimer funds, investors should carefully consider a fund’s investment objectives, risks, charges and expenses. Fund prospectuses and summary prospectuses contain this and other information about the funds, and may be obtained by asking your financial advisor, or calling us at 1.800.988.8287. Read prospectuses and summary prospectuses carefully before investing. |
| |
| | © 2017 OppenheimerFunds, Inc. All rights reserved. Oppenheimer funds are distributed by OppenheimerFunds Distributor, Inc. |


December 31, 2016
| | | | | | |
| | | | | | |
| | Oppenheimer | | Annual Report | | |
| | Conservative Balanced Fund/VA | | |
| | A Series of Oppenheimer Variable Account Funds | | |
| | | | | | |
ANNUAL REPORT
Listing of Top Holdings
Fund Performance Discussion
Financial Statements
PORTFOLIO MANAGERS: Krishna Memani and Magnus Krantz
AVERAGE ANNUAL TOTAL RETURNS FOR THE PERIODS ENDED 12/31/16
| | | | | | | | | | | | | | | | | | | | |
| | | Inception
Date | | | | | | 1-Year | | | 5-Year | | | 10-Year | |
Non-Service Shares | | | 2/9/87 | | | | | | | | 5.26 | % | | | 7.86 | % | | | 1.73 | % |
Service Shares | | | 5/1/02 | | | | | | | | 4.96 | | | | 7.60 | | | | 1.47 | |
Russell 3000 Index | | | | | | | | | | | 12.74 | | | | 14.67 | | | | 7.07 | |
Bloomberg Barclays U.S. Aggregate Bond Index | | | | | | | | | | | 2.65 | | | | 2.23 | | | | 4.34 | |
Reference Index | | | | | | | | | | | 6.34 | | | | 6.67 | | | | 5.92 | |
Performance data quoted represents past performance, which does not guarantee future results. The investment return and principal value of an investment in the Fund will fluctuate so that an investor’s shares, when redeemed, may be worth more or less than their original cost. Current performance may be lower or higher than the performance quoted. For performance data current to the most recent month end, call us at 1.800.988.8287. The Fund’s total returns should not be expected to be the same as the returns of other funds, whether or not both funds have the same portfolio managers and/or similar names. The Fund’s total returns include changes in share price and reinvested distributions but do not include the charges associated with the separate account products that offer this Fund. Such performance would have been lower if such charges were taken into account.
TOP HOLDINGS AND ALLOCATIONS
TOP TEN COMMON STOCK HOLDINGS
| | | | | |
Alphabet, Inc., Cl. C | | | | 1.3% | |
Microsoft Corp. | | | | 1.2 | |
Citigroup, Inc. | | | | 1.1 | |
Johnson & Johnson | | | | 1.0 | |
PG&E Corp. | | | | 1.0 | |
Suncor Energy, Inc. | | | | 0.9 | |
Chevron Corp. | | | | 0.9 | |
Facebook, Inc., Cl. A | | | | 0.8 | |
JPMorgan Chase & Co. | | | | 0.8 | |
General Electric Co. | | | | 0.8 | |
Portfolio holdings and allocations are subject to change. Percentages are as of December 31, 2016, and are based on net assets. For more current Fund holdings, please visit oppenheimerfunds.com.
PORTFOLIO ALLOCATION
| | | | | |
Common Stocks | | | | 32.3% | |
Non-Convertible Corporate Bonds and Notes | | | | 29.2 | |
Mortgage-Backed Obligations | | | | | |
Government Agency | | | | 18.6 | |
Non-Agency | | | | 8.2 | |
Asset-Backed Securities | | | | 8.9 | |
Investment Company | | | | | |
Oppenheimer Institutional Government Money Market Fund | | | | 2.3 | |
U.S. Government Obligations | | | | 0.5 | |
Portfolio holdings and allocations are subject to change. Percentages are as of December 31, 2016, and are based on the total market value of investments.
2 OPPENHEIMER CONSERVATIVE BALANCED FUND/VA
Fund Performance Discussion
The Fund’s Non-Service shares produced a return of 5.26% during the reporting period. On a relative basis, the Fund’s Reference Index returned 6.34%. The Fund’s Reference Index is a customized weighted index currently comprised of the following underlying broad-based security indices: 65% of the Bloomberg Barclays U.S. Aggregate Bond Index and 35% of the Russell 3000 Index. Measured separately, the Bloomberg Barclays U.S. Aggregate Bond Index returned 2.65% and the Russell 3000 Index returned 12.74%.
MARKET OVERVIEW
Markets were volatile this reporting period. Central Bank policy was a major focus this reporting period, with statements and actions from the Federal Reserve (the “Fed”), Bank of Japan (BoJ), European Central Bank (“ECB”), and more, fueling movements in global capital markets. Throughout most of the year, the question of when the Fed would raise interest rates remained. It finally did in the closing month of the reporting period. Improved economic data and outlook led the Fed to hike its policy rates by 0.25% in December, meeting market expectations. The Fed’s policy making Federal Open Market Committee noted they will continue to be cautious and will hike rates gradually, but posted a modestly optimistic outlook. By year end, markets were pricing for slightly more than two hikes by the end of 2017.
Other major events that created volatility during the year were the United Kingdom’s (“UK”) vote to leave the European Union (commonly referred to as Brexit) and the U.S. Presidential election. After Brexit, U.S. markets became extremely volatile for two days. However, the event came and went with most financial assets rallying strong early in the third quarter.
Markets turned to general risk on mode after the surprise election of Donald Trump with equities climbing, credit spreads narrowing to the tightest levels since early 2015, and U.S. Treasury yields climbing to levels not experienced since 2014. The dollar rallied strongly against many currencies, particularly after Mr. Trump’s victory.
EQUITY STRATEGY REVIEW
The equity strategy produced positive absolute performance during the reporting period, but underperformed the Russell 3000 Index. The equity strategy’s underperformance stemmed primarily from weaker relative stock selection in the information technology, health care and consumer discretionary sectors. The equity strategy outperformed the Russell 3000 Index in the real estate and utilities sectors due to stock selection and underweight positions.
The equity strategy’s top contributors to performance included Microsoft Corp., Applied Materials, Inc. and Chevron Corp. Microsoft develops and supports software products. Over the third quarter of 2016, the company reported profit and sales better than analysts’ estimates, as a result of their aggressive push into Internet-based software and services for businesses. Revenue from Azure, the company’s corporate cloud platform, doubled in the quarter ending September 30. Shares of Applied Materials, maker of semiconductor equipment, rallied over the third quarter of 2016 as the company reported better than expected earnings. The company has successfully gained market share in existing businesses and could benefit from rapid growth in the organic light emitting diode (OLED) display market. Chevron benefited from the sharp bounce off the oil price lows seen in the first quarter of 2016. Furthermore, Chevron’s attractive yield and more focused capital spending plans were rewarded by the market.
The equity strategy’s top detractors from performance included Apple, Inc., McKesson Corp. and Diplomat Pharmacy, Inc. We exited our position in these three stocks during the period. Apple experienced declines over the first half of the reporting period after reporting a disappointing quarter and outlook, as the iPhone 6S was lapping very difficult prior year results in addition to a decelerating global macro-economy. McKesson is engaged in delivering pharmaceuticals, medical supplies and healthcare information technology. In October, the company reported earnings and revenue that missed forecasts, and also cut its outlook. Shares of Diplomat Pharmacy fell after the company reported weak third quarter earnings.
FIXED-INCOME STRATEGY REVIEW
The Fund’s fixed-income strategy outperformed the Bloomberg Barclays U.S. Aggregate Bond Index this reporting period. The strategy’s outperformance versus the Index this reporting period stemmed from its underweight position in U.S. Treasuries, which sold off this reporting period. In addition, the strategy’s exposure to high yield credit benefited performance. The top detractor from the strategy’s performance versus the Index was its overweight exposure to agency mortgage-backed securities (“MBS”). While the strategy had a larger allocation to agency MBS, its exposure to non-agency MBS produced slight outperformance this reporting period.
3 OPPENHEIMER CONSERVATIVE BALANCED FUND/VA
Investors should consider the Fund’s investment objective, risks, charges and expenses carefully before investing. The Fund’s prospectus and summary prospectus contain this and other information about the Fund, and may be obtained by asking your financial advisor or calling us at 1.800.988.8287. Read prospectuses and summary prospectuses carefully before investing.
Total returns include changes in share price and reinvestment of dividends and capital gains distributions in a hypothetical investment for the periods shown, but do not include the charges associated with the separate account products that offer this Fund.
The Fund’s investment strategy and focus can change over time. The mention of specific fund holdings does not constitute a recommendation by OppenheimerFunds, Inc. or its affiliates.
Shares of Oppenheimer funds are not deposits or obligations of any bank, are not guaranteed by any bank, are not insured by the FDIC or any other agency, and involve investment risks, including the possible loss of the principal amount invested.
Comparing the Fund’s Performance to the Market. The graphs that follow show the performance of a hypothetical $10,000 investment in each share class of the Fund held until December 31, 2016. Performance is measured over a ten-fiscal-year period for both Classes. Performance information does not reflect charges that apply to separate accounts investing in the Fund. If these charges were taken into account, performance would be lower. The graphs assume that all dividends and capital gains distributions were reinvested in additional shares.
The Fund’s performance is compared to the performance of the Russell 3000 Index, the Bloomberg Barclays U.S. Aggregate Bond Index, and the Fund’s Reference Index. The Russell 3000 Index measures the performance of the largest 3,000 U.S. companies, representing approximately 98% of the investable U.S. equity market. The Bloomberg Barclays U.S. Aggregate Bond Index is an index of U.S dollar-denominated, investment-grade U.S. corporate government and mortgage-backed securities. The Fund’s Reference Index is a customized weighted index currently comprised of 65% of the Bloomberg Barclays U.S. Aggregate Bond Index and 35% of the Russell 3000 Index. The Indices are unmanaged and cannot be purchased directly by investors. Index performance is shown for illustrative purposes only and does not predict or depict the performance of the Fund. While index comparisons may be useful to provide a benchmark for the Fund’s performance, it must be noted that the Fund’s investments are not limited to the investments comprising the indices. Index performance includes reinvestment of income, but does not reflect transaction costs, fees, expenses or taxes. Index performance is shown for illustrative purposes only as a benchmark for the Fund’s performance, and does not predict or depict performance of the Fund. The Fund’s performance reflects the effects of the Fund’s business and operating expenses.
4 OPPENHEIMER CONSERVATIVE BALANCED FUND/VA
COMPARISON OF CHANGE IN VALUE OF $10,000 HYPOTHETICAL INVESTMENTS IN:
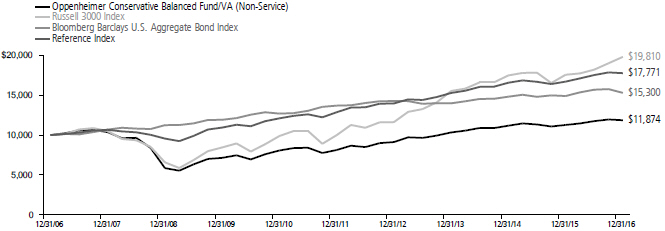
COMPARISON OF CHANGE IN VALUE OF $10,000 HYPOTHETICAL INVESTMENTS IN:
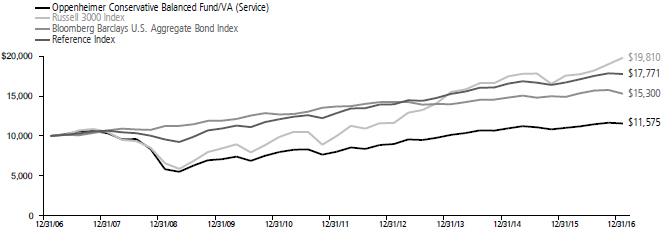
Performance data quoted represents past performance, which does not guarantee future results. The investment return and principal value of an investment in the Fund will fluctuate so that an investor’s shares, when redeemed, may be worth more or less than their original cost. Current performance may be lower or higher than the performance quoted. For performance data current to the most recent month end, call us at 1.800.988.8287. The Fund’s total returns should not be expected to be the same as the returns of other funds, whether or not both funds have the same portfolio managers and/or similar names. The Fund’s total returns include changes in share price and reinvested distributions but do not include the charges associated with the separate account products that offer this Fund. Such performance would have been lower if such charges were taken into account.
5 OPPENHEIMER CONSERVATIVE BALANCED FUND/VA
Fund Expenses
Fund Expenses. As a shareholder of the Fund, you incur two types of costs: (1) transaction costs and (2) ongoing costs, including management fees; distribution and service fees; and other Fund expenses. These examples are intended to help you understand your ongoing costs (in dollars) of investing in the Fund and to compare these costs with the ongoing costs of investing in other mutual funds.
The examples are based on an investment of $1,000.00 invested at the beginning of the period and held for the entire 6-month period ended December 31, 2016.
Actual Expenses. The first section of the table provides information about actual account values and actual expenses. You may use the information in this section for the class of shares you hold, together with the amount you invested, to estimate the expense that you paid over the period. Simply divide your account value by $1,000.00 (for example, an $8,600.00 account value divided by $1,000.00 = 8.60), then multiply the result by the number in the first section under the heading entitled “Expenses Paid During 6 Months Ended December 31, 2016” to estimate the expenses you paid on your account during this period.
Hypothetical Example for Comparison Purposes.
The second section of the table provides information about hypothetical account values and hypothetical expenses based on the Fund’s actual expense ratio for each class of shares, and an assumed rate of return of 5% per year for each class before expenses, which is not the actual return. The hypothetical account values and expenses may not be used to estimate the actual ending account balance or expenses you paid for the period. You may use this information to compare the ongoing costs of investing in the Fund and other funds. To do so, compare this 5% hypothetical example for the class of shares you hold with the 5% hypothetical examples that appear in the shareholder reports of the other funds.
Please note that the expenses shown in the table are meant to highlight your ongoing costs only and do not reflect any charges associated with the separate accounts that offer this Fund. Therefore, the “hypothetical” lines of the table are useful in comparing ongoing costs only, and will not help you determine the relative total costs of owning different funds. In addition, if these separate account charges were included your costs would have been higher.
| | | | | | | | | | | | |
| Actual | | Beginning Account Value July 1, 2016 | | | Ending Account Value December 31, 2016 | | | Expenses Paid During
6 Months Ended
December 31, 2016 | |
Non-Service shares | | | $ 1,000.00 | | | | $ 1,010.20 | | | | $ 3.39 | |
Service shares | | | 1,000.00 | | | | 1,008.90 | | | | 4.66 | |
| | | |
| Hypothetical | | | | | | | | | |
| (5% return before expenses) | | | | | | | | | |
Non-Service shares | | | 1,000.00 | | | | 1,021.77 | | | | 3.41 | |
Service shares | | | 1,000.00 | | | | 1,020.51 | | | | 4.68 | |
Expenses are equal to the Fund’s annualized expense ratio for that class, multiplied by the average account value over the period, multiplied by 184/366 (to reflect the one-half year period). Those annualized expense ratios, excluding indirect expenses from affiliated funds, based on the 6-month period ended December 31, 2016 are as follows:
| | | | |
| Class | | Expense Ratios | |
Non-Service shares | | | 0.67% | |
Service shares | | | 0.92 | |
The expense ratios reflect voluntary and/or contractual waivers and/or reimbursements of expenses by the Fund’s Manager. Some of these undertakings may be modified or terminated at any time, as indicated in the Fund’s prospectus. The “Financial Highlights” tables in the Fund’s financial statements, included in this report, also show the gross expense ratios, without such waivers or reimbursements and reduction to custodian expenses, if applicable.
6 OPPENHEIMER CONSERVATIVE BALANCED FUND/VA
STATEMENT OF INVESTMENTS December 31, 2016
| | | | | | | | |
| | | Shares | | | Value | |
| |
Common Stocks—33.8% | | | | | | | | |
| |
| Consumer Discretionary—3.8% | |
| |
| Auto Components—0.2% | | | | | | | | |
| |
| Adient plc1 | | | 9,058 | | | $ | 530,799 | |
|
| |
| |
| Hotels, Restaurants & Leisure—1.1% | |
| |
| Cedar Fair LP2 | | | 7,190 | | | | 461,598 | |
| |
International Speedway Corp., Cl. A | | | 3,380 | | | | 124,384 | |
| |
| McDonald’s Corp. | | | 10,240 | | | | 1,246,413 | |
| |
| Norwegian Cruise Line Holdings Ltd.1 | | | 16,980 | | | | 722,159 | |
| | | | | | | | |
| | | | | | | 2,554,554 | |
|
| |
| |
| Household Durables—0.3% | | | | | | | | |
| |
| Mohawk Industries, Inc.1 | | | 3,000 | | | | 599,040 | |
|
| |
| |
| Media—1.0% | | | | | | | | |
| |
| Comcast Corp., Cl. A | | | 24,600 | | | | 1,698,630 | |
| |
| Madison Square Garden Co. (The), | | | | | | | | |
| Cl. A1 | | | 2,880 | | | | 493,949 | |
| | | | | | | | |
| | | | | | | 2,192,579 | |
|
| |
| |
| Specialty Retail—1.2% | | | | | | | | |
| |
| AutoZone, Inc.1 | | | 1,200 | | | | 947,748 | |
| |
| Home Depot, Inc. (The) | | | 9,090 | | | | 1,218,787 | |
| |
| Ross Stores, Inc. | | | 6,270 | | | | 411,312 | |
| | | | | | | | |
| | | | | | | 2,577,847 | |
|
| |
| |
| Consumer Staples—3.1% | | | | | | | | |
| |
| Beverages—1.2% | | | | | | | | |
| |
| Coca-Cola European Partners plc | | | 18,700 | | | | 587,180 | |
| |
| Molson Coors Brewing Co., Cl. B | | | 8,760 | | | | 852,436 | |
| |
| PepsiCo, Inc. | | | 11,300 | | | | 1,182,319 | |
| | | | | | | | |
| | | | | | | 2,621,935 | |
|
| |
| |
| Food & Staples Retailing—0.4% | | | | | | | | |
| |
| Kroger Co. (The) | | | 22,660 | | | | 781,996 | |
| |
| Food Products—1.2% | | | | | | | | |
| |
| Kraft Heinz Co. (The) | | | 11,320 | | | | 988,462 | |
| |
| Mondelez International, Inc., Cl. A | | | 20,540 | | | | 910,538 | |
| |
| Pinnacle Foods, Inc. | | | 16,650 | | | | 889,943 | |
| | | | | | | | |
| | | | | | | 2,788,943 | |
|
| |
| |
| Household Products—0.3% | | | | | | | | |
| |
| Spectrum Brands Holdings, Inc. | | | 6,140 | | | | 751,106 | |
|
| |
| |
| Energy—2.8% | | | | | | | | |
| |
| Oil, Gas & Consumable Fuels—2.8% | |
| |
| Chevron Corp. | | | 17,583 | | | | 2,069,519 | |
| |
| HollyFrontier Corp. | | | 25,626 | | | | 839,508 | |
| |
| Noble Energy, Inc. | | | 33,037 | | | | 1,257,388 | |
| |
| Suncor Energy, Inc. | | | 64,380 | | | | 2,104,582 | |
| | | | | | | | |
| | | | | | | 6,270,997 | |
|
| |
| |
| Financials—5.6% | | | | | | | | |
| |
| Commercial Banks—3.0% | | | | | | | | |
| |
| Citigroup, Inc. | | | 41,680 | | | | 2,477,042 | |
| |
| JPMorgan Chase & Co. | | | 21,120 | | | | 1,822,445 | |
| |
| Signature Bank (New York)1 | | | 5,270 | | | | 791,554 | |
| |
| Wells Fargo & Co. | | | 27,730 | | | | 1,528,200 | |
| | | | | | | | |
| | | | | | | 6,619,241 | |
|
| |
| |
| Consumer Finance—0.7% | | | | | | | | |
| |
Synchrony Financial | | | 44,650 | | | | 1,619,456 | |
| |
| Insurance—0.9% | | | | | | | | |
| |
| Chubb Ltd. | | | 7,400 | | | | 977,688 | |
| |
| FNF Group | | | 33,760 | | | | 1,146,490 | |
| | | | | | | | |
| | | | | | | 2,124,178 | |
|
| |
| |
| Real Estate Investment Trusts (REITs)—1.0% | |
| |
| Digital Realty Trust, Inc. | | | 10,460 | | | | 1,027,799 | |
| |
| Lamar Advertising Co., Cl. A | | | 6,340 | | | | 426,302 | |
| |
| Mid-America Apartment Communities, Inc. | | | 7,000 | | | | 685,440 | |
| | | | | | | | |
| | | | | | | 2,139,541 | |
| | | | | | | | |
| | | Shares | | | Value | |
| |
| Health Care—4.4% | | | | | | | | |
| |
| Biotechnology—0.7% | | | | | | | | |
| |
| BioMarin Pharmaceutical, Inc.1 | | | 4,690 | | | $ | 388,520 | |
| |
| Celgene Corp.1 | | | 9,130 | | | | 1,056,797 | |
| | | | | | | | |
| | | | | | | 1,445,317 | |
|
| |
| |
| Health Care Equipment & Supplies—0.9% | |
| |
| Medtronic plc | | | 13,609 | | | | 969,369 | |
| |
| NuVasive, Inc.1 | | | 6,390 | | | | 430,431 | |
| |
| Stryker Corp. | | | 5,730 | | | | 686,511 | |
| | | | | | | | |
| | | | | | | 2,086,311 | |
|
| |
| |
| Health Care Providers & Services—0.4% | |
| |
| Centene Corp.1 | | | 8,140 | | | | 459,992 | |
| |
| WellCare Health Plans, Inc.1 | | | 3,640 | | | | 498,971 | |
| | | | | | | | |
| | | | | | | 958,963 | |
|
| |
| |
| Life Sciences Tools & Services—0.2% | |
| |
Agilent Technologies, Inc. | | | 10,800 | | | | 492,048 | |
| |
| Pharmaceuticals—2.2% | | | | | | | | |
| |
| Johnson & Johnson | | | 19,780 | | | | 2,278,854 | |
| |
| Merck & Co., Inc. | | | 20,150 | | | | 1,186,230 | |
| |
| Mylan NV1 | | | 10,410 | | | | 397,141 | |
| |
| Prestige Brands Holdings, Inc.1 | | | 18,180 | | | | 947,178 | |
| |
| Valeant Pharmaceuticals International, Inc.1 | | | 6,830 | | | | 99,172 | |
| | | | | | | | |
| | | | | | | 4,908,575 | |
|
| |
| |
| Industrials—4.4% | | | | | | | | |
| |
| Aerospace & Defense—1.1% | | | | | | | | |
| |
| L-3 Communications Holdings, Inc. | | | 5,540 | | | | 842,689 | |
| |
| Lockheed Martin Corp. | | | 3,150 | | | | 787,311 | |
| |
| Spirit AeroSystems Holdings, Inc., Cl. A | | | 13,950 | | | | 813,983 | |
| | | | | | | | |
| | | | | | | 2,443,983 | |
|
| |
| |
| Airlines—0.4% | | | | | | | | |
| |
Spirit Airlines, Inc.1 | | | 14,760 | | | | 854,014 | |
| |
| Building Products—0.3% | | | | | | | | |
| |
Masonite International Corp.1 | | | 10,530 | | | | 692,874 | |
| |
| Commercial Services & Supplies—1.2% | |
| |
| Johnson Controls International plc | | | 18,993 | | | | 782,322 | |
| |
| KAR Auction Services, Inc. | | | 25,080 | | | | 1,068,910 | |
| |
| Waste Connections, Inc. | | | 12,280 | | | | 965,085 | |
| | | | | | | | |
| | | | | | | 2,816,317 | |
|
| |
| |
| Construction & Engineering—0.3% | |
| |
| AECOM1 | | | 16,370 | | | | 595,213 | |
|
| |
| |
| Industrial Conglomerates—0.8% | |
| |
General Electric Co. | | | 53,950 | | | | 1,704,820 | |
| |
| Road & Rail—0.3% | | | | | | | | |
| |
| Canadian Pacific Railway Ltd. | | | 4,920 | | | | 702,428 | |
|
| |
| |
| Information Technology—6.5% | |
| |
| Communications Equipment—0.3% | |
| |
| Palo Alto Networks, Inc.1 | | | 5,250 | | | | 656,512 | |
|
| |
| |
| Internet Software & Services—2.3% | |
| |
| Alphabet, Inc., Cl. C1 | | | 3,730 | | | | 2,878,889 | |
| |
| Facebook, Inc., Cl. A1 | | | 16,410 | | | | 1,887,970 | |
| |
| j2 Global, Inc. | | | 6,490 | | | | 530,882 | |
| | | | | | | | |
| | | | | | | 5,297,741 | |
|
| |
| |
| IT Services—0.4% | | | | | | | | |
| |
| PayPal Holdings, Inc.1 | | | 22,250 | | | | 878,208 | |
|
| |
| |
| Semiconductors & Semiconductor Equipment—0.9% | |
| |
| Applied Materials, Inc. | | | 36,920 | | | | 1,191,408 | |
| |
| Microchip Technology, Inc. | | | 12,640 | | | | 810,856 | |
| | | | | | | | |
| | | | | | | 2,002,264 | |
|
| |
| |
| Software—2.1% | | | | | | | | |
| |
| Activision Blizzard, Inc. | | | 26,980 | | | | 974,248 | |
| |
| Guidewire Software, Inc.1 | | | 6,710 | | | | 331,004 | |
7 OPPENHEIMER CONSERVATIVE BALANCED FUND/VA
STATEMENT OF INVESTMENTS Continued
| | | | | | | | |
| | |
Shares | | | Value | |
| |
| Software (Continued) | | | | | | | | |
| |
| Microsoft Corp. | | | 43,290 | | | $ | 2,690,041 | |
| |
| ServiceNow, Inc.1 | | | 5,724 | | | | 425,522 | |
| |
| Zynga, Inc., Cl. A1 | | | 150,220 | | | | 386,065 | |
| | | | | | | | |
| | | | | | | 4,806,880 | |
|
| |
| |
Technology Hardware, Storage & Peripherals—0.5% | |
| |
| Western Digital Corp. | | | 15,670 | | | | 1,064,777 | |
|
| |
| |
Materials—1.3% | | | | | | | | |
| |
Chemicals—0.9% | | | | | | | | |
| |
| Eastman Chemical Co. | | | 8,750 | | | | 658,087 | |
| |
| EI du Pont de Nemours & Co. | | | 11,720 | | | | 860,248 | |
| |
| PPG Industries, Inc. | | | 6,580 | | | | 623,521 | |
| | | | | | | | |
| | | | | | | 2,141,856 | |
|
| |
| |
Construction Materials—0.4% | |
| |
| Vulcan Materials Co. | | | 7,120 | | | | 891,068 | |
|
| |
| |
Telecommunication Services—0.7% | |
| |
Diversified Telecommunication Services—0.7% | |
| |
| ORBCOMM, Inc.1 | | | 375 | | | | 3,101 | |
| |
| Verizon Communications, Inc. | | | 30,180 | | | | 1,611,009 | |
| | | | | | | | |
| | | | | | | 1,614,110 | |
|
| |
| |
Utilities—1.2% | | | | | | | | |
| |
Electric Utilities—1.0% | | | | | |
| |
| PG&E Corp. | | | 36,800 | | | | 2,236,336 | |
|
| |
| |
Gas Utilities—0.2% | | | | | | | | |
| |
| Suburban Propane Partners LP2 | | | 14,400 | | | | 432,864 | |
| | | | | | | | |
| Total Common Stocks (Cost $65,411,689) | | | | | | | 75,895,691 | |
| | |
| | | Principal
Amount | | | | |
| |
Asset-Backed Securities—9.3% | |
| |
American Credit Acceptance Receivables Trust: | |
| Series 2014-3, Cl. B, 2.43%, 6/10/203 | | $ | 109,340 | | | | 109,440 | |
| Series 2014-4, Cl. B, 2.60%, 10/10/173 | | | 86,998 | | | | 87,269 | |
| Series 2015-1, Cl. B, 2.85%, 2/12/213 | | | 445,000 | | | | 447,190 | |
| Series 2015-3, Cl. B, 3.56%, 10/12/213 | | | 360,000 | | | | 365,116 | |
| |
American Express Credit Account Master Trust: | |
| Series 2014-2, Cl. A, 1.26%, 1/15/20 | | | 80,000 | | | | 80,055 | |
| Series 2014-3, Cl. A, 1.49%, 4/15/20 | | | 305,000 | | | | 305,714 | |
| Series 2014-5, Cl. A, 0.994%, 5/15/204 | | | 400,000 | | | | 400,457 | |
| Series 2015-1, Cl. A, 0.994%, 1/15/204 | | | 595,000 | | | | 595,574 | |
| |
AmeriCredit Automobile Receivables Trust: | |
| Series 2012-4, Cl. D, 2.68%, 10/9/18 | | | 115,000 | | | | 115,064 | |
| Series 2013-2, Cl. E, 3.41%, 10/8/203 | | | 415,000 | | | | 418,831 | |
| Series 2013-3, Cl. E, 3.74%, 12/8/203 | | | 180,000 | | | | 182,563 | |
| Series 2013-4, Cl. D, 3.31%, 10/8/19 | | | 35,000 | | | | 35,610 | |
| Series 2014-1, Cl. E, 3.58%, 8/9/21 | | | 355,000 | | | | 360,884 | |
| Series 2014-2, Cl. E, 3.37%, 11/8/21 | | | 440,000 | | | | 445,182 | |
| |
Cabela’s Credit Card Master Note Trust: | |
| Series 2013-2A, Cl. A2, 1.354%, 8/16/213,4 | | | 105,000 | | | | 105,481 | |
| Series 2016-1, Cl. A1, 1.78%, 6/15/22 | | | 340,000 | | | | 339,087 | |
| |
| Capital Auto Receivables Asset Trust: | |
| Series 2013-1, Cl. D, 2.19%, 9/20/21 | | | 125,000 | | | | 125,462 | |
| Series 2014-1, Cl. D, 3.39%, 7/22/19 | | | 140,000 | | | | 143,267 | |
| Series 2014-3, Cl. D, 3.14%, 2/20/20 | | | 305,000 | | | | 309,606 | |
| Series 2015-1, Cl. D, 3.16%, 8/20/20 | | | 195,000 | | | | 197,408 | |
| Series 2015-4, Cl. D, 3.62%, 5/20/21 | | | 295,000 | | | | 300,986 | |
| Series 2016-2, Cl. D, 3.16%, 11/20/23 | | | 65,000 | | | | 64,949 | |
| Series 2016-3, Cl. D, 2.65%, 1/20/24 | | | 105,000 | | | | 103,402 | |
| |
| Capital One Multi-Asset Execution Trust: | |
| Series 2007-A1, Cl. A1, 0.754%, 11/15/194 | | | 310,000 | | | | 310,001 | |
| Series 2014-A2, Cl. A2, 1.26%, 1/15/20 | | | 480,000 | | | | 480,277 | |
| Series 2014-A5, Cl. A5, 1.48%, 7/15/20 | | | 660,000 | | | | 661,415 | |
| | | | | | | | |
| | | Principal
Amount | | | Value | |
| |
Asset-Backed Securities (Continued) | |
| |
CarFinance Capital Auto Trust, Series | |
| 2015-1A, Cl. A, 1.75%, 6/15/213 | | $ | 97,691 | | | $ | 97,769 | |
| |
CarMax Auto Owner Trust: | |
| Series 2013-2, Cl. D, 2.06%, 11/15/19 | | | 30,000 | | | | 29,994 | |
| Series 2015-2, Cl. D, 3.04%, 11/15/21 | | | 115,000 | | | | 115,178 | |
| Series 2015-3, Cl. D, 3.27%, 3/15/22 | | | 330,000 | | | | 332,660 | |
| Series 2016-1, Cl. D, 3.11%, 8/15/22 | | | 220,000 | | | | 218,441 | |
| Series 2016-3, Cl. D, 2.94%, 1/17/23 | | | 125,000 | | | | 122,640 | |
| Series 2016-4, Cl. D, 2.91%, 4/17/23 | | | 275,000 | | | | 269,033 | |
| |
Chase Issuance Trust: | | | | | | | | |
| Series 2007-A3, Cl. A3, 5.23%, 4/15/19 | | | 105,000 | | | | 105,489 | |
| Series 2014-A1, Cl. A1, 1.15%, 1/15/19 | | | 595,000 | | | | 595,007 | |
| Series 2014-A6, Cl. A6, 1.26%, 7/15/19 | | | 480,000 | | | | 480,326 | |
| Series 2014-A7, Cl. A7, 1.38%, 11/15/19 | | | 595,000 | | | | 595,579 | |
| Series 2016-A6, Cl. A6, 1.10%, 1/15/20 | | | 605,000 | | | | 603,629 | |
| |
CPS Auto Receivables Trust: | |
| Series 2014-A, Cl. A, 1.21%, 8/15/183 | | | 17,508 | | | | 17,500 | |
| Series 2014-C, Cl. A, 1.31%, 2/15/193 | | | 59,912 | | | | 59,897 | |
| |
CPS Auto Trust, Series 2012-C, Cl. A, 1.82%, 12/16/193 | | | 12,147 | | | | 12,149 | |
| |
Credit Acceptance Auto Loan Trust: | |
| Series 2014-1A, Cl. B, 2.29%, 4/15/223 | | | 270,000 | | | | 270,734 | |
| Series 2014-2A, Cl. B, 2.67%, 9/15/223 | | | 195,000 | | | | 195,820 | |
| |
Discover Card Execution Note Trust, | |
| Series 2014-A5, Cl. A, 1.39%, 4/15/20 | | | 585,000 | | | | 585,914 | |
| |
| Drive Auto Receivables Trust: | |
| Series 2015-BA, Cl. C, 2.76%, 7/15/213 | | | 345,000 | | | | 347,254 | |
| Series 2015-DA, Cl. D, 4.59%, 1/17/233 | | | 55,000 | | | | 56,487 | |
| Series 2016-BA, Cl. C, 3.19%, 7/15/223 | | | 170,000 | | | | 171,334 | |
| Series 2016-CA, Cl. D, 4.18%, 3/15/243 | | | 170,000 | | | | 168,792 | |
| |
DT Auto Owner Trust: | |
| Series 2013-2A, Cl. D, 4.18%, 6/15/203 | | | 341,179 | | | | 344,167 | |
| Series 2014-2A, Cl. D, 3.68%, 4/15/213 | | | 615,000 | | | | 621,036 | |
| Series 2014-3A, Cl. D, 4.47%, 11/15/213 | | | 425,000 | | | | 433,513 | |
| Series 2015-1A, Cl. C, 2.87%, 11/16/203 | | | 203,411 | | | | 204,099 | |
| Series 2016-1A, Cl. B, 2.79%, 5/15/203 | | | 290,000 | | | | 291,784 | |
| Series 2016-4A, Cl. B, 2.02%, 8/17/203 | | | 255,000 | | | | 254,098 | |
| |
| Element Rail Leasing I LLC, Series 2014-1A, Cl. A1, 2.299%, 4/19/443 | | | 250,983 | | | | 244,360 | |
| |
| Evergreen Credit Card Trust, Series 2016-3, Cl. A, 1.204%, 11/16/203,4 | | | 480,000 | | | | 480,406 | |
| |
Exeter Automobile Receivables Trust: | |
| Series 2014-1A, Cl. B, 2.42%, 1/15/193 | | | 74,586 | | | | 74,651 | |
| Series 2014-1A, Cl. C, 3.57%, 7/15/193 | | | 280,000 | | | | 281,842 | |
| Series 2014-2A, Cl. C, 3.26%, 12/16/193 | | | 135,000 | | | | 135,779 | |
| |
First Investors Auto Owner Trust: | |
| Series 2013-3A, Cl. B, 2.32%, 10/15/193 | | | 465,000 | | | | 465,863 | |
| Series 2013-3A, Cl. D, 3.67%, 5/15/203 | | | 165,000 | | | | 166,183 | |
| |
| Flagship Credit Auto Trust: | |
| Series 2014-1, Cl. A, 1.21%, 4/15/193 | | | 13,777 | | | | 13,773 | |
| Series 2014-2, Cl. A, 1.43%, 12/16/193 | | | 74,255 | | | | 74,251 | |
| Series 2016-4, Cl. A1, 1.47%, 3/16/203 | | | 298,498 | | | | 298,261 | |
| |
| Ford Credit Floorplan Master Owner Trust A, Series 2016-3, Cl. A1, 1.55%, 7/15/21 | | | 395,000 | | | | 390,994 | |
| |
| FRS I LLC, Series 2013-1A, Cl. A1, 1.80%, 4/15/433 | | | 30,895 | | | | 30,267 | |
| |
| GM Financial Automobile Leasing Trust, Series 2015-1, Cl. D, 3.01%, 3/20/20 | | | 280,000 | | | | 283,309 | |
8 OPPENHEIMER CONSERVATIVE BALANCED FUND/VA
| | | | | | | | |
| | | Principal
Amount | | | Value | |
| |
Asset-Backed Securities (Continued) | |
| |
Navistar Financial Dealer Note Master Owner Trust II: | |
| Series 2015-1, Cl. B, 2.456%, 6/25/203,4 | | $ | 70,000 | | | $ | 70,063 | |
| Series 2015-1, Cl. D, 3.906%, 6/25/203,4 | | | 30,000 | | | | 30,042 | |
| Series 2016-1, Cl. D, 4.056%, 9/27/213,4 | | | 80,000 | | | | 80,526 | |
| |
Santander Drive Auto Receivables Trust: | |
| Series 2013-A, Cl. E, 4.71%, 1/15/213 | | | 325,000 | | | | 333,329 | |
| Series 2014-2, Cl. D, 2.76%, 2/18/20 | | | 200,000 | | | | 202,448 | |
| Series 2016-2, Cl. D, 3.39%, 4/15/22 | | | 115,000 | | | | 115,915 | |
| |
| SNAAC Auto Receivables Trust, | |
| Series 2014-1A, Cl. D, 2.88%, 1/15/203 | | | 165,000 | | | | 164,288 | |
| |
| Synchrony Credit Card Master Note Trust, | |
| Series 2012-6, Cl. A, 1.36%, 8/17/20 | | | 165,000 | | | | 165,108 | |
| |
TCF Auto Receivables Owner Trust: | |
| Series 2014-1A, Cl. C, 3.12%, 4/15/213 | | | 115,000 | | | | 115,061 | |
| Series 2015-1A, Cl. D, 3.53%, 3/15/223 | | | 190,000 | | | | 190,377 | |
| |
| Trip Rail Master Funding LLC, | |
| Series 2014-1A, Cl. A1, 2.863%, 4/15/443 | | | 121,421 | | | | 118,556 | |
| |
United Auto Credit Securitization Trust, | |
| Series 2015-1, Cl. D, 2.92%, 6/17/193 | | | 260,000 | | | | 260,770 | |
| |
Westlake Automobile Receivables Trust: | |
| Series 2014-2A, Cl. D, 2.86%, 7/15/213 | | | 195,000 | | | | 195,943 | |
| Series 2015-1A, Cl. C, 2.29%, 11/16/203 | | | 205,000 | | | | 205,579 | |
| Series 2015-2A, Cl. C, 2.45%, 1/15/213 | | | 250,000 | | | | 251,717 | |
| |
World Financial Network Credit Card Master Trust: | |
| Series 2014-C, Cl. A, 1.60%, 8/16/21 | | | 300,000 | | | | 300,464 | |
| Series 2015-C, Cl. A, 1.26%, 3/15/21 | | | 220,000 | | | | 220,145 | |
| Series 2016-B, Cl. A, 1.44%, 6/15/22 | | | 220,000 | | | | 219,296 | |
| | | | | | | | |
| Total Asset-Backed Securities (Cost $20,825,130) | | | | 20,870,179 | |
| | | | | | | | |
| |
Mortgage-Backed Obligations—28.1% | |
| |
Government Agency—19.5% | |
| |
FHLMC/FNMA/FHLB/Sponsored—16.6% | |
| |
Federal Home Loan Mortgage Corp. Gold Pool: | |
| 4.50%, 10/1/18 | | | 13,894 | | | | 14,260 | |
| 5.00%, 12/1/34 | | | 2,699 | | | | 2,952 | |
| 5.50%, 9/1/39 | | | 374,492 | | | | 416,061 | |
| 6.50%, 4/1/18-4/1/34 | | | 27,027 | | | | 30,462 | |
| 7.00%, 10/1/31-10/1/37 | | | 113,399 | | | | 129,001 | |
| 9.00%, 8/1/22-5/1/25 | | | 2,089 | | | | 2,269 | |
| |
| Federal Home Loan Mortgage Corp., Interest-Only Stripped Mtg.-Backed Security: | |
| Series 183,Cl. IO, 44.692%, 4/1/275 | | | 62,957 | | | | 14,324 | |
| Series 192,Cl. IO, 95.567%, 2/1/285 | | | 18,708 | | | | 4,491 | |
| Series 243,Cl. 6, 3.673%, 12/15/325 | | | 52,328 | | | | 9,686 | |
| |
Federal Home Loan Mortgage Corp., | |
Mtg.-Linked Amortizing Global Debt | |
| Securities, Series 2012-1, Cl. A10, 2.06%, 1/15/22 | | | 196,117 | | | | 197,952 | |
| |
Federal Home Loan Mortgage Corp., | |
Principal-Only Stripped Mtg.-Backed | |
| Security, Series 176, Cl. PO, 4.198%, 6/1/266 | | | 20,803 | | | | 18,950 | |
| |
| Federal Home Loan Mortgage Corp., Real Estate Mtg. Investment Conduit Multiclass Pass-Through Certificates: | |
| Series 2426,Cl. BG, 6.00%, 3/15/17 | | | 2,481 | | | | 2,506 | |
| Series 2427,Cl. ZM, 6.50%, 3/15/32 | | | 110,008 | | | | 123,741 | |
| Series 2461,Cl. PZ, 6.50%, 6/15/32 | | | 45,574 | | | | 53,165 | |
| Series 2564,Cl. MP, 5.00%, 2/15/18 | | | 40,460 | | | | 41,118 | |
| Series 2585,Cl. HJ, 4.50%, 3/15/18 | | | 20,835 | | | | 21,367 | |
| Series 2626,Cl. TB, 5.00%, 6/15/33 | | | 90,332 | | | | 96,390 | |
| Series 2635,Cl. AG, 3.50%, 5/15/32 | | | 38,781 | | | | 39,956 | |
| Series 2707,Cl. QE, 4.50%, 11/15/18 | | | 154,343 | | | | 157,741 | |
| | | | | | | | |
| | | Principal
Amount | | | Value | |
| |
| FHLMC/FNMA/FHLB/Sponsored (Continued) | |
| |
| Federal Home Loan Mortgage Corp., Real Estate Mtg. Investment Conduit Multiclass Pass-Through Certificates: (Continued) | |
| Series 2770,Cl. TW, 4.50%, 3/15/19 | | $ | 7,024 | | | $ | 7,239 | |
| Series 3010,Cl. WB, 4.50%, 7/15/20 | | | 22,499 | | | | 23,194 | |
| Series 3025,Cl. SJ, 22.169%, 8/15/354 | | | 16,980 | | | | 25,403 | |
| Series 3030,Cl. FL, 1.104%, 9/15/354 | | | 90,115 | | | | 89,710 | |
| Series 3741,Cl. PA, 2.15%, 2/15/35 | | | 179,346 | | | | 180,509 | |
| Series 3815,Cl. BD, 3.00%, 10/15/20 | | | 4,982 | | | | 5,039 | |
| Series 3822,Cl. JA, 5.00%, 6/15/40 | | | 52,702 | | | | 55,159 | |
| Series 3840,Cl. CA, 2.00%, 9/15/18 | | | 3,759 | | | | 3,773 | |
| Series 3848,Cl. WL, 4.00%, 4/15/40 | | | 107,637 | | | | 111,616 | |
| Series 3857,Cl. GL, 3.00%, 5/15/40 | | | 6,358 | | | | 6,504 | |
| Series 4221,Cl. HJ, 1.50%, 7/15/23 | | | 639,214 | | | | 635,608 | |
| |
| Federal Home Loan Mortgage Corp., Real Estate Mtg. Investment Conduit Multiclass Pass-Through Certificates, Interest-Only Stripped Mtg.-Backed Security: | |
| Series 2130,Cl. SC, 70.907%, 3/15/295 | | | 55,414 | | | | 10,015 | |
| Series 2796,Cl. SD, 59.87%, 7/15/265 | | | 89,600 | | | | 13,793 | |
| Series 2920,Cl. S, 18.421%, 1/15/355 | | | 459,941 | | | | 74,302 | |
| Series 2922,Cl. SE, 23.67%, 2/15/355 | | | 28,032 | | | | 4,335 | |
| Series 2981,Cl. AS, 11.50%, 5/15/355 | | | 253,772 | | | | 42,490 | |
| Series 3397,Cl. GS, 0.00%, 12/15/375,7 | | | 27,999 | | | | 4,868 | |
| Series 3424,Cl. EI, 0.00%, 4/15/385,7 | | | 15,252 | | | | 1,717 | |
| Series 3450,Cl. BI, 21.117%, 5/15/385 | | | 84,928 | | | | 12,172 | |
| Series 3606,Cl. SN, 24.05%, 12/15/395 | | | 44,286 | | | | 7,000 | |
| |
Federal National Mortgage Assn.: | |
| 2.50%, 1/1/328 | | | 2,525,000 | | | | 2,527,975 | |
| 3.00%, 1/1/328 | | | 5,430,000 | | | | 5,570,518 | |
| 3.50%, 1/1/478 | | | 7,455,000 | | | | 7,636,739 | |
| 4.00%, 1/15/478 | | | 8,815,000 | | | | 9,263,491 | |
| 4.50%, 1/1/478 | | | 2,880,000 | | | | 3,097,026 | |
| 5.00%, 1/1/478 | | | 2,685,000 | | | | 2,924,653 | |
| |
Federal National Mortgage Assn. Pool: | |
| 5.00%, 3/1/21 | | | 7,000 | | | | 7,194 | |
| 5.50%, 9/1/20 | | | 2,238 | | | | 2,345 | |
| 6.00%, 11/1/17-3/1/37 | | | 169,123 | | | | 191,534 | |
| 6.50%, 5/1/17-10/1/19 | | | 3,855 | | | | 3,875 | |
| 7.00%, 11/1/17-10/1/35 | | | 8,701 | | | | 9,106 | |
| 7.50%, 1/1/33 | | | 65,264 | | | | 78,444 | |
| 8.50%, 7/1/32 | | | 4,258 | | | | 4,623 | |
| |
| Federal National Mortgage Assn., Interest-Only Stripped Mtg.-Backed Security: | |
| Series 222,Cl. 2, 99.999%, 6/25/235 | | | 137,237 | | | | 20,556 | |
| Series 233,Cl. 2, 99.999%, 8/25/235 | | | 93,457 | | | | 16,939 | |
| Series 252,Cl. 2, 99.999%, 11/25/235 | | | 125,944 | | | | 21,653 | |
| Series 319,Cl. 2, 0.00%, 2/25/325,7 | | | 29,529 | | | | 7,157 | |
| Series 320,Cl. 2, 27.804%, 4/25/325 | | | 10,262 | | | | 2,974 | |
| Series 321,Cl. 2, 0.00%, 4/25/325,7 | | | 102,491 | | | | 24,163 | |
| Series 331,Cl. 9, 22.188%, 2/25/335 | | | 121,875 | | | | 26,003 | |
| Series 334,Cl. 17, 10.754%, 2/25/335 | | | 67,513 | | | | 13,930 | |
| Series 339,Cl. 12, 0.00%, 6/25/335,7 | | | 91,608 | | | | 18,938 | |
| Series 339,Cl. 7, 0.00%, 11/25/335,7 | | | 259,782 | | | | 52,475 | |
| Series 343,Cl. 13, 0.00%, 9/25/335,7 | | | 95,156 | | | | 18,992 | |
| Series 345,Cl. 9, 0.00%, 1/25/345,7 | | | 87,080 | | | | 16,718 | |
| Series 351,Cl. 10, 0.00%, 4/25/345,7 | | | 11,771 | | | | 2,418 | |
| Series 351,Cl. 8, 0.00%, 4/25/345,7 | | | 40,979 | | | | 8,408 | |
| Series 356,Cl. 10, 0.00%, 6/25/355,7 | | | 28,738 | | | | 5,817 | |
| Series 356,Cl. 12, 0.00%, 2/25/355,7 | | | 15,249 | | | | 3,453 | |
| Series 362,Cl. 13, 0.00%, 8/25/355,7 | | | 110,966 | | | | 22,980 | |
| Series 364,Cl. 16, 0.00%, 9/25/355,7 | | | 78,985 | | | | 15,399 | |
| |
| Federal National Mortgage Assn., Real Estate Mtg. Investment Conduit Multiclass | |
Pass-Through Certificates: | | | | | | | | |
| Series 1998-61,Cl. PL, 6.00%, 11/25/28 | | | 48,985 | | | | 55,594 | |
| Series 2003-100,Cl. PA, 5.00%, 10/25/18 | | | 100,168 | | | | 102,423 | |
| Series 2003-130,Cl. CS, 12.588%, 12/25/334 | | | 8,867 | | | | 9,823 | |
| Series 2003-84,Cl. GE, 4.50%, 9/25/18 | | | 7,611 | | | | 7,811 | |
9 OPPENHEIMER CONSERVATIVE BALANCED FUND/VA
STATEMENT OF INVESTMENTS Continued
| | | | | | | | |
| | | Principal
Amount | | | Value | |
| |
| FHLMC/FNMA/FHLB/Sponsored (Continued) | |
| |
| Federal National Mortgage Assn., Real Estate Mtg. Investment Conduit Multiclass | |
Pass-Through Certificates: (Continued) | |
| Series 2004-101,Cl. BG, 5.00%, 1/25/20 | | $ | 1,783 | | | $ | 1,786 | |
| Series 2004-25,Cl. PC, 5.50%, 1/25/34 | | | 87,113 | | | | 89,870 | |
| Series 2005-104,Cl. MC, 5.50%, 12/25/25 | | | 206,626 | | | | 224,358 | |
| Series 2005-31,Cl. PB, 5.50%, 4/25/35 | | | 250,000 | | | | 282,596 | |
| Series 2005-73,Cl. DF, 1.006%, 8/25/354 | | | 161,539 | | | | 162,225 | |
| Series 2006-11,Cl. PS, 21.794%, 3/25/364 | | | 62,618 | | | | 93,203 | |
| Series 2006-46,Cl. SW, 21.427%, 6/25/364 | | | 45,527 | | | | 61,253 | |
| Series 2006-50,Cl. KS, 21.428%, 6/25/364 | | | 9,385 | | | | 13,731 | |
| Series 2008-75,Cl. DB, 4.50%, 9/25/23 | | | 32,146 | | | | 32,786 | |
| Series 2009-113,Cl. DB, 3.00%, 12/25/20 | | | 113,625 | | | | 115,063 | |
| Series 2009-36,Cl. FA, 1.696%, 6/25/374 | | | 65,431 | | | | 66,923 | |
| Series 2009-37,Cl. HA, 4.00%, 4/25/19 | | | 27,283 | | | | 27,662 | |
| Series 2009-70,Cl. TL, 4.00%, 8/25/19 | | | 304,236 | | | | 308,186 | |
| Series 2010-43,Cl. KG, 3.00%, 1/25/21 | | | 62,160 | | | | 63,143 | |
| Series 2011-15,Cl. DA, 4.00%, 3/25/41 | | | 28,545 | | | | 29,427 | |
| Series 2011-3,Cl. EL, 3.00%, 5/25/20 | | | 185,734 | | | | 188,046 | |
| Series 2011-3,Cl. KA, 5.00%, 4/25/40 | | | 147,761 | | | | 159,065 | |
| Series 2011-38,Cl. AH, 2.75%, 5/25/20 | | | 4,051 | | | | 4,089 | |
| Series 2011-82,Cl. AD, 4.00%, 8/25/26 | | | 133,379 | | | | 136,170 | |
| |
| Federal National Mortgage Assn., Real Estate Mtg. Investment Conduit Multiclass Pass-Through Certificates, Interest-Only Stripped Mtg.-Backed Security: | |
| Series 2001-65,Cl. S, 7.946%, 11/25/315 | | | 115,825 | | | | 22,638 | |
| Series 2001-81,Cl. S, 10.827%, 1/25/325 | | | 30,217 | | | | 8,549 | |
| Series 2002-47,Cl. NS, 5.349%, 4/25/325 | | | 77,854 | | | | 18,940 | |
| Series 2002-51,Cl. S, 5.475%, 8/25/325 | | | 71,488 | | | | 13,679 | |
| Series 2002-52,Cl. SD, 30.059%, 9/25/325 | | | 110,216 | | | | 22,313 | |
| Series 2002-77,Cl. SH, 24.093%, 12/18/325 | | | 42,876 | | | | 8,990 | |
| Series 2002-84,Cl. SA, 6.409%, 12/25/325 | | | 109,294 | | | | 22,108 | |
| Series 2002-9,Cl. MS, 7.986%, 3/25/325 | | | 30,931 | | | | 6,346 | |
| Series 2003-33,Cl. SP, 12.776%, 5/25/335 | | | 120,221 | | | | 24,257 | |
| Series 2003-4,Cl. S, 2.828%, 2/25/335 | | | 64,795 | | | | 14,510 | |
| Series 2003-46,Cl. IH, 0.00%, 6/25/235,7 | | | 215,327 | | | | 25,875 | |
| Series 2004-54,Cl. DS, 63.309%, 11/25/305 | | | 89,503 | | | | 16,027 | |
| Series 2004-56,Cl. SE, 10.246%, 10/25/335 | | | 22,719 | | | | 5,037 | |
| Series 2005-12,Cl. SC, 31.957%, 3/25/355 | | | 13,154 | | | | 2,055 | |
| Series 2005-14,Cl. SE, 25.943%, 3/25/355 | | | 43,940 | | | | 6,819 | |
| Series 2005-40,Cl. SA, 36.661%, 5/25/355 | | | 237,341 | | | | 42,604 | |
| Series 2005-52,Cl. JH, 40.584%, 5/25/355 | | | 622,040 | | | | 96,550 | |
| Series 2005-93,Cl. SI, 5.344%, 10/25/355 | | | 51,024 | | | | 9,097 | |
| Series 2007-88,Cl. XI, 0.00%, 6/25/375,7 | | | 132,556 | | | | 22,841 | |
| | | | | | | | |
| | | Principal
Amount | | | Value | |
| |
| FHLMC/FNMA/FHLB/Sponsored (Continued) | |
| |
| Federal National Mortgage Assn., Real Estate Mtg. Investment Conduit Multiclass Pass-Through Certificates, Interest-Only Stripped Mtg.-Backed Security: (Continued) | |
| Series 2008-55,Cl. SA, 0.00%, 7/25/385,7 | | $ | 59,953 | | | $ | 6,477 | |
| Series 2009-8,Cl. BS, 7.807%, 2/25/245 | | | 4,522 | | | | 133 | |
| Series 2011-96,Cl. SA, 14.27%, 10/25/415 | | | 128,925 | | | | 22,764 | |
| Series 2012-134,Cl. SA, 9.234%, 12/25/425 | | | 495,383 | | | | 103,342 | |
| Series 2012-40,Cl. PI, 0.00%, 4/25/415,7 | | | 279,280 | | | | 37,461 | |
| |
| Federal National Mortgage Assn., Real Estate Mtg. Investment Conduit Multiclass Pass-Through Certificates, Principal-Only Stripped Mtg.-Backed Security, Series 1993-184, Cl. M, 5.343%, 9/25/236 | | | 49,858 | | | | 46,312 | |
| | | | | | | | |
| | | | | | | 37,148,291 | |
| |
GNMA/Guaranteed—2.9% | | | | | | | | |
| |
| Government National Mortgage Assn. I Pool: | |
| 7.00%, 1/15/24 | | | 16,679 | | | | 17,097 | |
| 7.50%, 1/15/23-6/15/24 | | | 23,348 | | | | 24,649 | |
| 8.00%, 5/15/17-4/15/23 | | | 15,957 | | | | 17,328 | |
| 8.50%, 8/15/17-12/15/17 | | | 263 | | | | 263 | |
| |
| Government National Mortgage Assn. II Pool: | |
| 3.50%, 1/21/478 | | | 4,180,000 | | | | 4,342,511 | |
| 4.00%, 1/1/478 | | | 1,965,000 | | | | 2,085,804 | |
| |
| Government National Mortgage Assn., Interest-Only Stripped Mtg.-Backed Security: | |
| Series 2002-15,Cl. SM, 99.999%, 2/16/325 | | | 139,269 | | | | 19,663 | |
| Series 2002-76,Cl. SY, 12.18%, 12/16/265 | | | 270,928 | | | | 42,843 | |
| Series 2007-17,Cl. AI, 54.719%, 4/16/375 | | | 349,107 | | | | 61,175 | |
| Series 2011-52,Cl. HS, 32.556%, 4/16/415 | | | 170,245 | | | | 27,904 | |
| | | | | | | | |
| | | | | | | 6,639,237 | |
| |
Non-Agency—8.6% | | | | | | | | |
| |
Commercial—5.7% | | | | | | | | |
| |
| Banc of America Funding Trust, Series 2014-R7, Cl. 3A1, 3.003%, 3/26/364 | | | 218,740 | | | | 219,117 | |
| |
| BCAP LLC Trust, Series 2011-R11, Cl. 18A5, 2.69%, 9/26/353,4 | | | 130,174 | | | | 130,097 | |
| |
| CD Commercial Mortgage Trust, Series 2016-CD2, Cl. AM, 3.668%, 11/10/494 | | | 155,000 | | | | 158,974 | |
| |
| Chase Mortgage Finance Trust, Series 2005-A2, Cl. 1A3, 2.966%, 1/25/364 | | | 158,749 | | | | 150,229 | |
| |
COMM Mortgage Trust: | | | | | | | | |
| Series 2013-CR6,Cl. AM, 3.147%, 3/10/463 | | | 255,000 | | | | 254,997 | |
| Series 2013-CR7,Cl. D, 4.354%, 3/10/463,4 | | | 445,000 | | | | 405,092 | |
| Series 2014-CR21,Cl. AM, 3.987%, 12/10/47 | | | 865,000 | | | | 895,720 | |
| Series 2014-LC15,Cl. AM, 4.198%, 4/10/47 | | | 95,000 | | | | 99,902 | |
| Series 2014-UBS6,Cl. AM, 4.048%, 12/10/47 | | | 495,000 | | | | 507,536 | |
| Series 2015-CR23,Cl. AM, 3.801%, 5/10/48 | | | 280,000 | | | | 285,599 | |
| |
| COMM Mortgage Trust, Interest-Only Stripped Mtg.-Backed Security, Series 2012-CR5, Cl. XA, 0.00%, 12/10/455,7 | | | 393,738 | | | | 26,353 | |
| |
| CSMC, Series 2006-6, Cl. 1A4, 6%, 7/25/36 | | | 163,746 | | | | 122,837 | |
| |
| Deutsche Bank Commercial Mortgage Trust, Series 2016-C1, Cl. AM, 3.539%, 5/10/49 | | | 155,000 | | | | 156,477 | |
10 OPPENHEIMER CONSERVATIVE BALANCED FUND/VA
| | | | | | | | |
| | | Principal
Amount | | | Value | |
| |
| Commercial (Continued) | | | | | | | | |
| |
| First Horizon Alternative Mortgage Securities Trust: | |
| Series 2004-FA2,Cl. 3A1, 6.00%, 1/25/35 | | $ | 86,159 | | | $ | 79,261 | |
| Series 2005-FA8,Cl. 1A6, 1.406%, 11/25/354 | | | 103,750 | | | | 69,797 | |
| |
FREMF Mortgage Trust: | | | | | | | | |
| Series 2013-K25,Cl. C, 3.743%, 11/25/453,4 | | | 60,000 | | | | 57,662 | |
| Series 2013-K26,Cl. C, 3.599%, 12/25/453,4 | | | 40,000 | | | | 37,962 | |
| Series 2013-K27,Cl. C, 3.616%, 1/25/463,4 | | | 110,000 | | | | 105,161 | |
| Series 2013-K28,Cl. C, 3.494%, 6/25/463,4 | | | 450,000 | | | | 426,581 | |
| Series 2013-K502,Cl. C, 3.077%, 3/25/453,4 | | | 220,000 | | | | 220,360 | |
| Series 2013-K712,Cl. C, 3.365%, 5/25/453,4 | | | 70,000 | | | | 70,071 | |
| Series 2013-K713,Cl. C, 3.165%, 4/25/463,4 | | | 145,000 | | | | 142,342 | |
| Series 2014-K715,Cl. C, 4.126%, 2/25/463,4 | | | 35,000 | | | | 34,548 | |
| |
| GSMSC Pass-Through Trust, Series 2009-3R, Cl. 1A2, 6%, 4/25/373,4 | | | 383,140 | | | | 362,402 | |
| |
| GSR Mortgage Loan Trust, Series 2005- AR4, Cl. 6A1, 3.209%, 7/25/354 | | | 33,291 | | | | 32,836 | |
| |
| JP Morgan Chase Commercial Mortgage Securities Trust: | |
| Series 2013-C10,Cl. AS, 3.372%, 12/15/47 | | | 325,000 | | | | 329,944 | |
| Series 2013-C16,Cl. AS, 4.517%, 12/15/46 | | | 330,000 | | | | 355,671 | |
| Series 2013-LC11,Cl. AS, 3.216%, 4/15/46 | | | 40,000 | | | | 40,175 | |
| Series 2014-C20,Cl. AS, 4.043%, 7/15/47 | | | 225,000 | | | | 235,061 | |
| |
| JP Morgan Mortgage Trust, Series 2007-A1, Cl. 5A1, 3.178%, 7/25/354 | | | 138,947 | | | | 139,281 | |
| |
| JP Morgan Resecuritization Trust, Series 2009-5, Cl. 1A2, 3.08%, 7/26/363,4 | | | 206,871 | | | | 187,434 | |
| |
| JPMBB Commercial Mortgage Securities Trust: | |
| Series 2014-C19,Cl. AS, 4.243%, 4/15/474 | | | 140,000 | | | | 148,313 | |
| Series 2014-C25,Cl. AS, 4.065%, 11/15/47 | | | 385,000 | | | | 402,918 | |
| Series 2014-C26,Cl. AS, 3.80%, 1/15/48 | | | 190,000 | | | | 195,371 | |
| |
| JPMDB Commercial Mortgage Securities Trust, Series 2016-C4, Cl. AS, 3.385%, 12/15/49 | | | 240,000 | | | | 239,035 | |
| |
| MASTR Adjustable Rate Mortgages Trust, Series 2004-13, Cl. 2A2, 3.034%, 4/21/344 | | | 52,463 | | | | 53,222 | |
| |
| Morgan Stanley Bank of America Merrill Lynch Trust: | |
| Series 2013-C9,Cl. AS, 3.456%, 5/15/46 | | | 240,000 | | | | 242,818 | |
| Series 2014-C19,Cl. AS, 3.832%, 12/15/47 | | | 720,000 | | | | 738,515 | |
| Series 2016-C30,Cl. AS, 3.175%, 9/15/49 | | | 405,000 | | | | 391,755 | |
| |
| Morgan Stanley Re-Remic Trust, Series 2012-R3, Cl. 1B, 2.615%, 11/26/363,4 | | | 249,329 | | | | 191,312 | |
| |
| Morgan Stanley Resecuritization Trust, Series 2013-R9, Cl. 3A, 2.756%, 6/26/463,4 | | | 387,494 | | | | 387,179 | |
| |
| RBSSP Resecuritization Trust, Series 2010-1, Cl. 2A1, 2.625%, 7/26/453,4 | | | 28,921 | | | | 28,938 | |
| |
| Structured Adjustable Rate Mortgage Loan Trust, Series 2004-10, Cl. 2A, 3.032%, 8/25/344 | | | 241,927 | | | | 242,289 | |
| | | | | | | | |
| | | Principal
Amount | | | Value | |
| |
| Commercial (Continued) | |
| |
Structured Agency Credit Risk Debt Nts.: | |
| Series 2013-DN1,Cl. M1, 4.156%, 7/25/234 | | $ | 228,597 | | | $ | 232,100 | |
| Series 2014-DN1,Cl. M1, 1.756%, 2/25/244 | | | 17,372 | | | | 17,379 | |
| Series 2014-HQ2,Cl. M1, 2.206%, 9/25/244 | | | 50,026 | | | | 50,211 | |
| Series 2015-DNA3,Cl. M1, 2.106%, 4/25/284 | | | 16,036 | | | | 16,044 | |
| Series 2015-HQA2,Cl. M2, 3.556%, 5/25/284 | | | 10,000 | | | | 10,268 | |
| Series 2016-DNA2,Cl. M1, 2.006%, 10/25/284 | | | 280,242 | | | | 280,613 | |
| Series 2016-DNA3,Cl. M1, 1.856%, 12/25/284 | | | 281,442 | | | | 282,111 | |
| Series 2016-DNA4,Cl. M1, 1.556%, 3/25/294 | | | 195,780 | | | | 195,744 | |
| Series 2016-HQA2,Cl. M1, 1.956%, 11/25/284 | | | 192,155 | | | | 192,384 | |
| Series 2016-HQA3,Cl. M1, 1.556%, 3/25/294 | | | 235,611 | | | | 235,893 | |
| Series 2016-HQA4,Cl. M1, 1.556%, 4/25/294 | | | 380,028 | | | | 379,572 | |
| |
| Wells Fargo Commercial Mortgage Trust: Series 2015-C29,Cl. AS, 4.013%, 6/15/484 | | | 165,000 | | | | 169,490 | |
| Series 2016-C37,Cl. AS, 4.018%, 12/15/49 | | | 390,000 | | | | 402,855 | |
| |
| WF-RBS Commercial Mortgage Trust: | |
| Series 2012-C7,Cl. E, 4.835%, 6/15/453,4 | | | 80,000 | | | | 75,364 | |
| Series 2013-C14,Cl. AS, 3.488%, 6/15/46 | | | 155,000 | | | | 158,046 | |
| Series 2014-C20,Cl. AS, 4.176%, 5/15/47 | | | 150,000 | | | | 158,160 | |
| Series 2014-LC14,Cl. AS, 4.351%, 3/15/474 | | | 160,000 | | | | 170,038 | |
| |
| WF-RBS Commercial Mortgage Trust, Interest-Only Commercial Mtg. Pass- Through Certificates, Series 2011-C3, Cl. XA, 0.00%, 3/15/443,5,7 | | | 2,657,822 | | | | 114,090 | |
| | | | | | | | |
| | | | | | | 12,741,506 | |
| |
Residential—2.9% | | | | | | | | |
| |
| Alternative Loan Trust, Series 2005- 29CB, Cl. A4, 5%, 7/25/35 | | | 285,764 | | | | 250,900 | |
| |
| Banc of America Funding Trust: Series 2007-1,Cl. 1A3, 6.00%, 1/25/37 | | | 65,501 | | | | 58,458 | |
| Series 2007-C,Cl. 1A4, 3.096%, 5/20/364 | | | 28,838 | | | | 26,085 | |
| |
| Banc of America Mortgage Trust, Series 2004-E, Cl. 2A6, 3.342%, 6/25/344 | | | 82,952 | | | | 82,153 | |
| |
Bear Stearns ARM Trust: | | | | | | | | |
| Series 2005-2,Cl. A1, 2.92%, 3/25/354 | | | 239,436 | | | | 241,188 | |
| Series 2005-9,Cl. A1, 2.83%, 10/25/354 | | | 630,956 | | | | 611,211 | |
| Series 2006-1,Cl. A1, 2.91%, 2/25/364 | | | 242,423 | | | | 241,068 | |
| |
| Carrington Mortgage Loan Trust, Series 2006-FRE1, Cl. A2, 0.866%, 7/25/364 | | | 2,740 | | | | 2,740 | |
| |
| CHL Mortgage Pass-Through Trust: | |
| Series 2005-26,Cl. 1A8, 5.50%, 11/25/35 | | | 84,514 | | | | 78,673 | |
| Series 2006-6,Cl. A3, 6.00%, 4/25/36 | | | 46,113 | | | | 41,272 | |
| |
| Citigroup Mortgage Loan Trust, Inc., | |
| Series 2006-AR1, Cl. 1A1, 2.87%, 10/25/354 | | | 533,478 | | | | 532,534 | |
| |
| Connecticut Avenue Securities: | |
| Series 2014-C01,Cl. M1, 2.356%, 1/25/244 | | | 29,292 | | | | 29,452 | |
11 OPPENHEIMER CONSERVATIVE BALANCED FUND/VA
STATEMENT OF INVESTMENTS Continued
| | | | | | | | |
| | | Principal
Amount | | | Value | |
| |
| Residential (Continued) | | | | | |
| |
Connecticut Avenue Securities: (Continued) | | | | | |
| Series 2014-C02,Cl. 2M1, 1.706%, 5/25/244 | | $ | 107,264 | | | $ | 107,426 | |
| Series 2014-C03,Cl. 1M1, 1.956%, 7/25/244 | | | 343,382 | | | | 344,312 | |
| Series 2014-C03,Cl. 2M1, 1.956%, 7/25/244 | | | 158,877 | | | | 159,053 | |
| Series 2014-C04,Cl. 2M1, 2.856%, 11/25/244 | | | 2,808 | | | | 2,809 | |
| Series 2015-C02,Cl. 1M1, 1.906%, 5/25/254 | | | 13,346 | | | | 13,348 | |
| Series 2015-C03,Cl. 1M1, 2.256%, 7/25/254 | | | 100,821 | | | | 101,016 | |
| Series 2015-C03,Cl. 2M1, 2.256%, 7/25/254 | | | 29,289 | | | | 29,350 | |
| Series 2016-C02,Cl. 1M1, 2.906%, 9/25/284 | | | 18,942 | | | | 19,143 | |
| Series 2016-C03,Cl. 1M1, 2.756%, 10/25/284 | | | 9,647 | | | | 9,780 | |
| Series 2016-C03,Cl. 2M1, 2.956%, 10/25/284 | | | 9,508 | | | | 9,608 | |
| Series 2016-C06,Cl. 1M1, 2.056%, 4/25/294 | | | 351,640 | | | | 352,464 | |
| Series 2016-C07,Cl. 2M1, 2.056%, 4/25/294 | | | 203,693 | | | | 203,948 | |
| |
| HomeBanc Mortgage Trust, Series 2005-3, Cl. A2, 1.066%, 7/25/354 | | | 40,478 | | | | 39,876 | |
| |
| RALI Trust, Series 2006-QS13, Cl. 1A8, 6%, 9/25/36 | | | 11,106 | | | | 9,083 | |
| |
| WaMu Mortgage Pass-Through Certificates Trust: | |
| Series 2003-AR10,Cl. A7, 2.825%, 10/25/334 | | | 122,402 | | | | 124,989 | |
| Series 2005-AR14,Cl. 1A4, 2.792%, 12/25/354 | | | 125,339 | | | | 121,380 | |
| Series 2005-AR16,Cl. 1A1, 2.85%, 12/25/354 | | | 114,413 | | | | 107,776 | |
| |
| Wells Fargo Mortgage-Backed Securities Trust: | |
| Series 2005-AR1,Cl. 1A1, 2.807%, 2/25/354 | | | 24,840 | | | | 25,233 | |
| Series 2005-AR10,Cl. 1A1, 3.022%, 6/25/354 | | | 475,103 | | | | 494,224 | |
| Series 2005-AR13,Cl. 1A5, 3.058%, 5/25/354 | | | 85,087 | | | | 85,334 | |
| Series 2005-AR15,Cl. 1A2, 2.983%, 9/25/354 | | | 167,729 | | | | 163,231 | |
| Series 2005-AR15,Cl. 1A6, 2.983%, 9/25/354 | | | 326,957 | | | | 310,974 | |
| Series 2005-AR4,Cl. 2A2, 3.067%, 4/25/354 | | | 324,691 | | | | 325,045 | |
| Series 2006-AR10,Cl. 1A1, 3.027%, 7/25/364 | | | 57,639 | | | | 55,500 | |
| Series 2006-AR10,Cl. 5A5, 3.08%, 7/25/364 | | | 234,066 | | | | 230,706 | |
| Series 2006-AR14,Cl. 1A2, 3.062%, 10/25/364 | | | 55,551 | | | | 52,026 | |
| Series 2006-AR2,Cl. 2A3, 3.003%, 3/25/364 | | | 29,453 | | | | 28,967 | |
| Series 2006-AR7,Cl. 2A4, 3.089%, 5/25/364 | | | 170,315 | | | | 162,524 | |
| Series 2006-AR8,Cl. 2A1, 3.083%, 4/25/364 | | | 186,588 | | | | 184,049 | |
| Series 2006-AR8,Cl. 2A4, 3.083%, 4/25/364 | | | 111,350 | | | | 109,836 | |
| Series 2007-16,Cl. 1A1, 6.00%, 12/28/37 | | | 60,196 | | | | 62,578 | |
| | | | | | | | |
| | | Principal
Amount | | | Value | |
| |
| Residential (Continued) | | | | | | | | |
| |
Wells Fargo Mortgage-Backed Securities Trust: (Continued) | |
| Series 2007-AR8,Cl. A1, 3.15%, 11/25/374 | | $ | 386,191 | | | $ | 346,435 | |
| | | | | | | | |
| | | | | | | 6,587,757 | |
| | | | | | | | |
| Total Mortgage-Backed Obligations (Cost $63,246,473) | | | | | | | 63,116,791 | |
| | | | | | | | |
| |
U.S. Government Obligations—0.6% | |
| |
| Federal Home Loan Bank Nts., 1.375%, 11/15/19 | | | 75,000 | | | | 74,695 | |
| |
| Federal National Mortgage Assn. Nts.: | |
| 1.00%, 10/24/19 | | | 117,000 | | | | 115,371 | |
| 1.875%, 9/24/26 | | | 536,000 | | | | 492,392 | |
| |
| United States Treasury Nts., 1.50%, 5/31/199,10 | | | 552,000 | | | | 554,444 | |
| | | | | | | | |
| Total U.S. Government Obligations (Cost $1,278,033) | | | | | | | 1,236,902 | |
| | | | | | | | |
| |
Non-Convertible Corporate Bonds and Notes—30.6% | |
| |
Consumer Discretionary—5.3% | |
| |
Auto Components—0.1% | | | | | | | | |
| |
BorgWarner, Inc., 4.375% Sr. Unsec. Nts., 3/15/45 | | | 128,000 | | | | 123,277 | |
| |
Automobiles—1.4% | | | | | | | | |
| |
| Daimler Finance North America LLC, 8.50% Sr. Unsec. Unsub. Nts., 1/18/31 | | | 185,000 | | | | 278,553 | |
| |
| Ford Motor Credit Co. LLC, 3.664% Sr. Unsec. Nts., 9/8/24 | | | 807,000 | | | | 787,787 | |
| |
| General Motors Co., 6.25% Sr. Unsec. Nts., 10/2/43 | | | 322,000 | | | | 356,573 | |
| |
| General Motors Financial Co., Inc., 3% Sr. Unsec. Nts., 9/25/17 | | | 401,000 | | | | 404,896 | |
| |
| Harley-Davidson, Inc., 4.625% Sr. Unsec. Nts., 7/28/45 | | | 107,000 | | | | 105,738 | |
| |
| Hyundai Capital America, 2.40% Sr. Unsec. Nts., 10/30/183 | | | 392,000 | | | | 393,664 | |
| |
| Nissan Motor Acceptance Corp.: | |
| 1.55% Sr. Unsec. Nts., 9/13/193 | | | 91,000 | | | | 89,621 | |
| 2.00% Sr. Unsec. Nts., 3/8/193 | | | 279,000 | | | | 278,368 | |
| |
| ZF North America Capital, Inc., 4.75% Sr. Unsec. Nts., 4/29/253 | | | 363,000 | | | | 370,714 | |
| | | | | | | | |
| | | | | | | 3,065,914 | |
| |
Diversified Consumer Services—0.2% | |
| |
| Service Corp. International, 5.375% Sr. Unsec. Nts., 5/15/24 | | | 350,000 | | | | 366,625 | |
| |
Hotels, Restaurants & Leisure—0.3% | |
| |
Marriott International, Inc.: | | | | | | | | |
| 3.25% Sr. Unsec. Nts., 9/15/22 | | | 158,000 | | | | 159,351 | |
| 6.375% Sr. Unsec. Nts., 6/15/17 | | | 354,000 | | | | 361,717 | |
| |
| McDonald’s Corp., 2.75% Sr. Unsec. Nts., 12/9/20 | | | 173,000 | | | | 175,717 | |
| | | | | | | | |
| | | | | | | 696,785 | |
| |
Household Durables—0.8% | |
| |
| Lennar Corp., 4.75% Sr. Unsec. Nts., 5/30/25 | | | 373,000 | | | | 365,540 | |
| |
Newell Brands, Inc.: | | | | | | | | |
| 5.00% Sr. Unsec. Nts., 11/15/23 | | | 391,000 | | | | 419,396 | |
| 5.50% Sr. Unsec. Nts., 4/1/46 | | | 91,000 | | | | 104,512 | |
| |
| PulteGroup, Inc., 5% Sr. Unsec. Nts., 1/15/27 | | | 384,000 | | | | 366,240 | |
| |
| Toll Brothers Finance Corp., 4.375% Sr. Unsec. Nts., 4/15/23 | | | 410,000 | | | | 410,512 | |
| |
Whirlpool Corp.: 1.35% Sr. Unsec. Nts., 3/1/17 | | | 123,000 | | | | 123,028 | |
12 OPPENHEIMER CONSERVATIVE BALANCED FUND/VA
| | | | | | | | |
| | | Principal
Amount | | | Value | |
| |
| Household Durables (Continued) | |
| |
Whirlpool Corp.: (Continued) 1.65% Sr. Unsec. Nts., 11/1/17 | | $ | 105,000 | | | $ | 105,166 | |
| | | | | | | | |
| | | | | | | 1,894,394 | |
| |
Leisure Equipment & Products—0.2% | |
| |
| Mattel, Inc., 1.70% Sr. Unsec. Nts., 3/15/18 | | | 433,000 | | | | 432,099 | |
| |
Media—1.3% | | | | | | | | |
| |
| 21st Century Fox America, Inc., 4.75% Sr. Unsec. Nts., 11/15/463 | | | 148,000 | | | | 148,737 | |
| |
| Charter Communications Operating LLC/Charter Communications Operating Capital: | |
| 4.464% Sr. Sec. Nts., 7/23/22 | | | 165,000 | | | | 172,460 | |
| 6.484% Sr. Sec. Nts., 10/23/45 | | | 237,000 | | | | 274,471 | |
| |
| Comcast Cable Communications Holdings, Inc., 9.455% Sr. Unsec. Nts., 11/15/22 | | | 211,000 | | | | 285,502 | |
| |
| Comcast Corp., 2.35% Sr. Unsec. Nts., 1/15/27 | | | 170,000 | | | | 157,077 | |
| |
| Historic TW, Inc., 9.15% Debs., 2/1/23 | | | 118,000 | | | | 151,355 | |
| |
| Interpublic Group of Cos., Inc. (The), 4.20% Sr. Unsec. Nts., 4/15/24 | | | 123,000 | | | | 126,435 | |
| |
Sky plc: | | | | | | | | |
| 3.75% Sr. Unsec. Nts., 9/16/243 | | | 167,000 | | | | 167,605 | |
| 6.10% Sr. Unsec. Nts., 2/15/183 | | | 125,000 | | | | 130,443 | |
| |
| Thomson Reuters Corp., 1.65% Sr. Unsec. Nts., 9/29/17 | | | 416,000 | | | | 416,524 | |
| |
| Time Warner Cable LLC, 4.50% Sr. Unsec. Unsub. Nts., 9/15/42 | | | 145,000 | | | | 131,561 | |
| |
| Time Warner, Inc., 2.95% Sr. Unsec. Nts., 7/15/26 | | | 180,000 | | | | 167,766 | |
| |
Viacom, Inc.: | | | | | | | | |
| 2.25% Sr. Unsec. Nts., 2/4/22 | | | 75,000 | | | | 70,493 | |
| 3.45% Sr. Unsec. Nts., 10/4/26 | | | 90,000 | | | | 83,223 | |
| 4.375% Sr. Unsec. Nts., 3/15/43 | | | 114,000 | | | | 90,969 | |
| |
| Virgin Media Secured Finance plc, 5.25% Sr. Sec. Nts., 1/15/263 | | | 246,000 | | | | 243,848 | |
| | | | | | | | |
| | | | | | | 2,818,469 | |
| |
Multiline Retail—0.1% | | | | | | | | |
| |
Dollar Tree, Inc., 5.75% Sr. Sec. Nts., 3/1/23 | | | 300,000 | | | | 319,146 | |
| |
Specialty Retail—0.6% | | | | | | | | |
| |
AutoZone, Inc.: | | | | | | | | |
| 1.30% Sr. Unsec. Nts., 1/13/17 | | | 63,000 | | | | 63,002 | |
| 1.625% Sr. Unsec. Nts., 4/21/19 | | | 68,000 | | | | 67,400 | |
| |
| Best Buy Co., Inc., 5.50% Sr. Unsec. Nts., 3/15/21 | | | 223,000 | | | | 245,073 | |
| |
| L Brands, Inc., 5.625% Sr. Unsec. Nts., 2/15/22 | | | 128,000 | | | | 136,800 | |
| |
| Lowe’s Cos., Inc., 3.70% Sr. Unsec. Nts., 4/15/46 | | | 163,000 | | | | 152,220 | |
| |
| Ross Stores, Inc., 3.375% Sr. Unsec. Nts., 9/15/24 | | | 225,000 | | | | 226,670 | |
| |
Sally Holdings LLC/Sally Capital, Inc., | | | | | | | | |
| 5.625% Sr. Unsec. Nts., 12/1/25 | | | 350,000 | | | | 365,750 | |
| |
| Signet UK Finance plc, 4.70% Sr. Unsec. Nts., 6/15/24 | | | 119,000 | | | | 114,089 | |
| | | | | | | | |
| | | | | | | 1,371,004 | |
| |
Textiles, Apparel & Luxury Goods—0.3% | |
| |
| Hanesbrands, Inc., 4.875% Sr. Unsec. Nts., 5/15/263 | | | 256,000 | | | | 251,520 | |
| |
| Levi Strauss & Co., 5% Sr. Unsec. Nts., 5/1/25 | | | 322,000 | | | | 323,610 | |
| |
| PVH Corp., 4.50% Sr. Unsec. Unsub. Nts., 12/15/22 | | | 163,000 | | | | 166,260 | |
| | | | | | | | |
| | | | | | | 741,390 | |
| | | | | | | | |
| | | Principal
Amount | | | Value | |
| |
| Consumer Staples—3.7% | | | | | | | | |
| |
| Beverages—1.1% | | | | | | | | |
| |
Anheuser-Busch InBev Finance, Inc.: | | | | | | | | |
| 1.90% Sr. Unsec. Nts., 2/1/19 | | $ | 448,000 | | | $ | 448,770 | |
| 3.65% Sr. Unsec. Nts., 2/1/26 | | | 57,000 | | | | 57,885 | |
| 4.90% Sr. Unsec. Nts., 2/1/46 | | | 86,000 | | | | 92,706 | |
| |
| Anheuser-Busch InBev Worldwide, Inc., 8.20% Sr. Unsec. Unsub. Nts., 1/15/39 | | | 262,000 | | | | 394,630 | |
| |
| Constellation Brands, Inc., 4.75% Sr. Unsec. Nts., 11/15/24 | | | 355,000 | | | | 378,608 | |
| |
Molson Coors Brewing Co.: | | | | | | | | |
| 2.10% Sr. Unsec. Nts., 7/15/21 | | | 329,000 | | | | 320,467 | |
| 4.20% Sr. Unsec. Nts., 7/15/46 | | | 87,000 | | | | 81,279 | |
| |
Pernod Ricard SA: | | | | | | | | |
| 2.95% Sr. Unsec. Nts., 1/15/173 | | | 423,000 | | | | 423,231 | |
| 4.25% Sr. Unsec. Nts., 7/15/223 | | | 260,000 | | | | 272,101 | |
| | | | | | | | |
| | | | | | | 2,469,677 | |
| |
Food & Staples Retailing—0.9% | | | | | | | | |
| |
| CVS Health Corp., 2.875% Sr. Unsec. Nts., 6/1/26 | | | 359,000 | | | | 342,374 | |
| |
| Koninklijke Ahold Delhaize NV, 6.50% Sr. Unsec. Nts., 6/15/17 | | | 242,000 | | | | 247,273 | |
| |
Kroger Co. (The): | | | | | | | | |
| 2.00% Sr. Unsec. Nts., 1/15/19 | | | 9,000 | | | | 9,023 | |
| 6.40% Sr. Unsec. Nts., 8/15/17 | | | 386,000 | | | | 397,515 | |
| 6.90% Sr. Unsec. Nts., 4/15/38 | | | 109,000 | | | | 139,589 | |
| |
Walgreens Boots Alliance, Inc.: | | | | | | | | |
| 1.75% Sr. Unsec. Nts., 5/30/18 | | | 260,000 | | | | 260,310 | |
| 3.10% Sr. Unsec. Nts., 6/1/23 | | | 395,000 | | | | 392,520 | |
| |
| Wal-Mart Stores, Inc., 4.30% Sr. Unsec. Nts., 4/22/44 | | | 195,000 | | | | 205,865 | |
| | | | | | | | |
| | | | | | | 1,994,469 | |
| |
Food Products—1.3% | | | | | | | | |
| |
Bunge Ltd. Finance Corp.: | | | | | | | | |
| 3.20% Sr. Unsec. Nts., 6/15/17 | | | 140,000 | | | | 141,066 | |
| 3.25% Sr. Unsec. Nts., 8/15/26 | | | 232,000 | | | | 222,906 | |
| 8.50% Sr. Unsec. Nts., 6/15/19 | | | 320,000 | | | | 366,874 | |
| |
| Ingredion, Inc., 1.80% Sr. Unsec. Nts., 9/25/17 | | | 424,000 | | | | 424,591 | |
| |
| JM Smucker Co. (The), 1.75% Sr. Unsec. Nts., 3/15/18 | | | 334,000 | | | | 334,491 | |
| |
Kraft Heinz Foods Co.: | | | | | | | | |
| 2.80% Sr. Unsec. Nts., 7/2/20 | | | 342,000 | | | | 345,290 | |
| 4.375% Sr. Unsec. Nts., 6/1/46 | | | 208,000 | | | | 196,119 | |
| |
| Lamb Weston Holdings, Inc., 4.875% Sr. Unsec. Nts., 11/1/263 | | | 193,000 | | | | 191,432 | |
| |
| Mondelez International Holdings Netherlands BV, 1.625% Sr. Unsec. Nts., 10/28/193 | | | 374,000 | | | | 366,701 | |
| |
| TreeHouse Foods, Inc., 6% Sr. Unsec. Nts., 2/15/243 | | | 180,000 | | | | 189,450 | |
| | | | | | | | |
| | | | | | | 2,778,920 | |
| |
Tobacco—0.4% | | | | | | | | |
| |
| Altria Group, Inc., 3.875% Sr. Unsec. Nts., 9/16/46 | | | 230,000 | | | | 212,721 | |
| |
| Imperial Brands Finance plc, 2.05% Sr. Unsec. Nts., 7/20/183 | | | 411,000 | | | | 410,994 | |
| |
| Reynolds American, Inc., 5.85% Sr. Unsec. Nts., 8/15/45 | | | 290,000 | | | | 344,040 | |
| | | | | | | | |
| | | | | | | 967,755 | |
| |
Energy—2.6% | | | | | | | | |
| |
Energy Equipment & Services—0.5% | | | | | | | | |
| |
| Halliburton Co., 5% Sr. Unsec. Nts., 11/15/45 | | | 102,000 | | | | 110,839 | |
| |
| Helmerich & Payne International Drilling Co., 4.65% Sr. Unsec. Nts., 3/15/25 | | | 165,000 | | | | 170,566 | |
13 OPPENHEIMER CONSERVATIVE BALANCED FUND/VA
STATEMENT OF INVESTMENTS Continued
| | | | | | | | |
| | | Principal
Amount | | | Value | |
| |
| Energy Equipment & Services (Continued) | |
| |
| Schlumberger Holdings Corp.: | | | | | | | | |
| 1.90% Sr. Unsec. Nts., 12/21/173 | | $ | 368,000 | | | $ | 369,437 | |
| 4.00% Sr. Unsec. Nts., 12/21/253 | | | 206,000 | | | | 215,834 | |
| |
| Sinopec Group Overseas Development 2014 Ltd., 1.75% Sr. Unsec. Nts., 4/10/173 | | | 431,000 | | | | 430,988 | |
| | | | | | | | |
| | | | | | | 1,297,664 | |
| |
| Oil, Gas & Consumable Fuels—2.1% | |
| |
| Anadarko Petroleum Corp.: | | | | | | | | |
| 4.50% Sr. Unsec. Nts., 7/15/44 | | | 72,000 | | | | 67,778 | |
| 6.20% Sr. Unsec. Nts., 3/15/40 | | | 68,000 | | | | 78,007 | |
| |
| Apache Corp., 4.75% Sr. Unsec. Nts., 4/15/43 | | | 124,000 | | | | 127,964 | |
| |
| Boardwalk Pipelines LP, 4.95% Sr. Unsec. Nts., 12/15/24 | | | 188,000 | | | | 193,115 | |
| |
| BP Capital Markets plc, 1.676% Sr. Unsec. Nts., 5/3/19 | | | 353,000 | | | | 350,534 | |
| |
| Buckeye Partners LP, 3.95% Sr. Unsec. Nts., 12/1/26 | | | 89,000 | | | | 86,873 | |
| |
| Chevron Corp., 1.561% Sr. Unsec. Nts., 5/16/19 | | | 379,000 | | | | 377,645 | |
| |
| CNOOC Nexen Finance 2014 ULC, 1.625% Sr. Unsec. Nts., 4/30/17 | | | 444,000 | | | | 443,738 | |
| |
| Columbia Pipeline Group, Inc., 4.50% Sr. Unsec. Nts., 6/1/25 | | | 179,000 | | | | 188,138 | |
| |
| ConocoPhillips Co.: | | | | | | | | |
| 4.95% Sr. Unsec. Nts., 3/15/26 | | | 47,000 | | | | 51,914 | |
| 5.95% Sr. Unsec. Nts., 3/15/46 | | | 99,000 | | | | 122,743 | |
| |
| Devon Energy Corp., 4.75% Sr. Unsec. Nts., 5/15/42 | | | 115,000 | | | | 108,836 | |
| |
| EnLink Midstream Partners LP, 4.85% Sr. Unsec. Nts., 7/15/26 | | | 92,000 | | | | 92,850 | |
| |
| Enterprise Products Operating LLC: | |
| 4.85% Sr. Unsec. Nts., 8/15/42 | | | 119,000 | | | | 119,197 | |
| 4.90% Sr. Unsec. Nts., 5/15/46 | | | 42,000 | | | | 43,197 | |
| |
| EQT Midstream Partners LP, 4.125% Sr. Unsec. Nts., 12/1/26 | | | 208,000 | | | | 202,857 | |
| |
| Kinder Morgan, Inc., 5.55% Sr. Unsec. Nts., 6/1/45 | | | 294,000 | | | | 309,785 | |
| |
| Noble Energy, Inc., 5.05% Sr. Unsec. Nts., 11/15/44 | | | 104,000 | | | | 104,501 | |
| |
| ONEOK Partners LP, 4.90% Sr. Unsec. Nts., 3/15/25 | | | 166,000 | | | | 178,134 | |
| |
| Phillips 66 Partners LP, 3.605% Sr. Unsec. Nts., 2/15/25 | | | 323,000 | | | | 316,485 | |
| |
| Regency Energy Partners LP/Regency Energy Finance Corp., 5% Sr. Unsec. Nts., 10/1/22 | | | 255,000 | | | | 270,270 | |
| |
| Shell International Finance BV: | | | | | | | | |
| 1.375% Sr. Unsec. Nts., 5/10/19 | | | 284,000 | | | | 281,168 | |
| 4.00% Sr. Unsec. Nts., 5/10/46 | | | 140,000 | | | | 133,935 | |
| |
| Tesoro Logistics LP, 5.25% Sr. Unsec. Nts., 1/15/25 | | | 63,000 | | | | 64,575 | |
| |
| TransCanada PipeLines Ltd., 1.625% Sr. Unsec. Nts., 11/9/17 | | | 349,000 | | | | 348,767 | |
| | | | | | | | |
| | | | | | | 4,663,006 | |
| |
| Financials—6.9% | | | | | | | | |
| |
| Capital Markets—1.5% | | | | | | | | |
| |
| Apollo Management Holdings LP, 4% Sr. Unsec. Nts., 5/30/243 | | | 290,000 | | | | 287,478 | |
| |
| Bank of New York Mellon Corp. (The), 3% Sub. Nts., 10/30/28 | | | 155,000 | | | | 147,332 | |
| |
| Brookfield Asset Management, Inc., 4% Sr. Unsec. Nts., 1/15/25 | | | 373,000 | | | | 366,036 | |
| |
| Credit Suisse AG (New York), 3.625% Sr. Unsec. Nts., 9/9/24 | | | 221,000 | | | | 222,428 | |
| | | | | | | | |
| | | Principal
Amount | | | Value | |
| |
| Capital Markets (Continued) | | | | | | | | |
| |
| Credit Suisse Group Funding Guernsey Ltd., 4.55% Sr. Unsec. Nts., 4/17/26 | | $ | 140,000 | | | $ | 145,475 | |
| |
| Deutsche Bank AG (London), 6% Sr. Unsec. Nts., 9/1/17 | | | 184,000 | | | | 188,375 | |
| |
| E*TRADE Financial Corp., 5.875% Jr. Sub. Perpetual Bonds4,11 | | | 384,000 | | | | 382,752 | |
| |
| Goldman Sachs Group, Inc. (The): | |
| 3.50% Sr. Unsec. Nts., 11/16/26 | | | 218,000 | | | | 213,972 | |
| 3.75% Sr. Unsec. Nts., 2/25/26 | | | 215,000 | | | | 215,741 | |
| |
| Morgan Stanley, 5% Sub. Nts., 11/24/25 | | | 335,000 | | | | 358,050 | |
| |
| Raymond James Financial, Inc., 3.625% Sr. Unsec. Nts., 9/15/26 | | | 215,000 | | | | 209,787 | |
| |
| S&P Global, Inc., 2.50% Sr. Unsec. Nts., 8/15/18 | | | 256,000 | | | | 258,194 | |
| |
| UBS Group Funding Jersey Ltd., 4.125% Sr. Unsec. Nts., 4/15/263 | | | 228,000 | | | | 233,302 | |
| | | | | | | | |
| | | | | | | 3,228,922 | |
| |
| Commercial Banks—3.1% | | | | | | | | |
| |
| Bank of America Corp.: | | | | | | | | |
| 3.248% Sr. Unsec. Nts., 10/21/27 | | | 311,000 | | | | 297,091 | |
| 7.75% Jr. Sub. Nts., 5/14/38 | | | 253,000 | | | | 348,858 | |
| |
| BB&T Corp., 2.05% Sr. Unsec. Nts., 5/10/21 | | | 388,000 | | | | 380,701 | |
| |
| BPCE SA: | | | | | | | | |
| 2.65% Sr. Unsec. Nts., 2/3/21 | | | 356,000 | | | | 355,970 | |
| 3.375% Sr. Unsec. Nts., 12/2/26 | | | 148,000 | | | | 145,089 | |
| |
| Citizens Bank NA (Providence RI), 2.55% Sr. Unsec. Nts., 5/13/21 | | | 302,000 | | | | 300,190 | |
| |
| Danske Bank AS, 2.80% Sr. Unsec. Nts., 3/10/213 | | | 227,000 | | | | 228,553 | |
| |
| Fifth Third Bank (Cincinnati OH), 3.85% Sub. Nts., 3/15/26 | | | 228,000 | | | | 229,559 | |
| |
| First Republic Bank, 4.375% Sub. Nts., 8/1/46 | | | 160,000 | | | | 145,699 | |
| |
| FirstMerit Bank NA (Akron OH), 4.27% Sub. Nts., 11/25/26 | | | 432,000 | | | | 438,712 | |
| |
| HSBC Holdings plc, 2.65% Sr. Unsec. Nts., 1/5/22 | | | 312,000 | | | | 305,203 | |
| |
| Huntington Bancshares, Inc., 3.15% Sr. Unsec. Nts., 3/14/21 | | | 245,000 | | | | 248,489 | |
| |
| ING Bank NV, 2.75% Sr. Unsec. Nts., 3/22/213 | | | 303,000 | | | | 304,222 | |
| |
| JPMorgan Chase & Co.: | | | | | | | | |
| 2.295% Sr. Unsec. Nts., 8/15/21 | | | 84,000 | | | | 82,421 | |
| 2.70% Sr. Unsec. Nts., 5/18/23 | | | 163,000 | | | | 159,438 | |
| |
| KeyBank NA (Cleveland OH), 3.40% Sub. Nts., 5/20/26 | | | 325,000 | | | | 316,130 | |
| |
| Lloyds Banking Group plc, 6.657% Jr. Sub. Perpetual Bonds3,4,11 | | | 400,000 | | | | 432,000 | |
| |
| PNC Bank NA, 2.55% Sr. Unsec. Nts., 12/9/21 | | | 157,000 | | | | 157,087 | |
| |
| Regions Bank (Birmingham AL), 2.25% Sr. Unsec. Nts., 9/14/18 | | | 328,000 | | | | 329,149 | |
| |
| Royal Bank of Scotland Group plc, 7.64% Jr. Sub. Perpetual Bonds4,11 | | | 380,000 | | | | 354,350 | |
| |
| Skandinaviska Enskilda Banken AB, 2.625% Sr. Unsec. Nts., 3/15/21 | | | 227,000 | | | | 227,171 | |
| |
| Standard Chartered plc, 6.409% Jr. Sub. Perpetual Bonds3,4,11 | | | 400,000 | | | | 307,000 | |
| |
| SunTrust Bank (Atlanta GA), 3.30% Sub. Nts., 5/15/26 | | | 163,000 | | | | 157,411 | |
| |
| Swedbank AB, 2.65% Sr. Unsec. Nts., 3/10/213 | | | 241,000 | | | | 241,296 | |
| |
| US Bancorp, 3.10% Sub. Nts., 4/27/26 | | | 230,000 | | | | 223,860 | |
14 OPPENHEIMER CONSERVATIVE BALANCED FUND/VA
| | | | | | | | |
| | | Principal
Amount | | | Value | |
| |
| Commercial Banks (Continued) | |
| |
| Wells Fargo & Co., 4.75% Sub. Nts., 12/7/46 | | $ | 220,000 | | | $ | 222,589 | |
| | | | | | | | |
| | | | | | | 6,938,238 | |
| |
| Consumer Finance—0.6% | | | | | | | | |
| |
| Ally Financial, Inc., 4.25% Sr. Unsec. Nts., 4/15/21 | | | 379,000 | | | | 383,501 | |
| |
| Capital One Financial Corp., 3.20% Sr. Unsec. Nts., 2/5/25 | | | 306,000 | | | | 296,727 | |
| |
| Discover Financial Services: | | | | | | | | |
| 3.75% Sr. Unsec. Nts., 3/4/25 | | | 209,000 | | | | 204,427 | |
| 3.95% Sr. Unsec. Nts., 11/6/24 | | | 331,000 | | | | 328,188 | |
| |
| Synchrony Financial, 4.50% Sr. Unsec. Nts., 7/23/25 | | | 114,000 | | | | 117,151 | |
| | | | | | | | |
| | | | | | | 1,329,994 | |
| |
| Diversified Financial Services—0.3% | |
| |
| Berkshire Hathaway Energy Co., 2% Sr. Unsec. Nts., 11/15/18 | | | 115,000 | | | | 115,524 | |
| |
| Peachtree Corners Funding Trust, 3.976% Sr. Unsec. Nts., 2/15/253 | | | 221,000 | | | | 215,732 | |
| |
| Voya Financial, Inc., 5.65% Jr. Sub. Nts., 5/15/534 | | | 380,000 | | | | 374,775 | |
| | | | | | | | |
| | | | | | | 706,031 | |
| |
| Equity Real Estate Investment Trusts (REITs)—0.5% | |
| |
| American Tower Corp., 5.90% Sr. Unsec. Nts., 11/1/21 | | | 233,000 | | | | 260,938 | |
| |
| HCP, Inc., 5.625% Sr. Unsec. Nts., 5/1/17 | | | 125,000 | | | | 126,670 | |
| |
| Highwoods Realty LP, 5.85% Sr. Unsec. Nts., 3/15/17 | | | 159,000 | | | | 160,352 | |
| |
| Ventas Realty LP, 1.25% Sr. Unsec. Nts., 4/17/17 | | | 178,000 | | | | 177,928 | |
| |
| WEA Finance LLC/Westfield UK & Europe Finance plc, 1.75% Sr. Unsec. Nts., 9/15/173 | | | 369,000 | | | | 369,280 | |
| |
| Welltower, Inc., 2.25% Sr. Unsec. Nts., 3/15/18 | | | 88,000 | | | | 88,391 | |
| | | | | | | | |
| | | | | | | 1,183,559 | |
| |
| Insurance—0.9% | | | | | | | | |
| |
| Arch Capital Finance LLC, 4.011% Sr. Unsec. Nts., 12/15/26 | | | 220,000 | | | | 223,108 | |
| |
| AXIS Specialty Finance plc, 5.15% Sr. Unsec. Nts., 4/1/45 | | | 235,000 | | | | 232,916 | |
| |
| Five Corners Funding Trust, 4.419% Unsec. Nts., 11/15/233 | | | 284,000 | | | | 300,353 | |
| |
| Manulife Financial Corp., 4.15% Sr. Unsec. Nts., 3/4/26 | | | 227,000 | | | | 236,932 | |
| |
| MetLife, Inc., 5.25% Jr. Sub. Perpetual Bonds4,11 | | | 296,000 | | | | 300,440 | |
| |
| Principal Financial Group, Inc., 4.30% Sr. Unsec. Nts., 11/15/46 | | | 155,000 | | | | 152,182 | |
| |
| TIAA Asset Management Finance Co. LLC, 4.125% Sr. Unsec. Nts., 11/1/243 | | | 362,000 | | | | 365,796 | |
| |
| XLIT Ltd., 6.50% Jr. Sub. Perpetual Bonds4,11 | | | 243,000 | | | | 190,147 | |
| | | | | | | | |
| | | | | | | 2,001,874 | |
| |
| Health Care—2.4% | | | | | | | | |
| |
| Biotechnology—0.5% | | | | | | | | |
| |
| AbbVie, Inc.: | | | | | | | | |
| 3.60% Sr. Unsec. Nts., 5/14/25 | | | 172,000 | | | | 170,446 | |
| 4.70% Sr. Unsec. Nts., 5/14/45 | | | 58,000 | | | | 57,016 | |
| |
| Biogen, Inc., 5.20% Sr. Unsec. Nts., 9/15/45 | | | 110,000 | | | | 118,346 | |
| |
| Celgene Corp.: | | | | | | | | |
| 3.875% Sr. Unsec. Nts., 8/15/25 | | | 167,000 | | | | 169,471 | |
| 5.00% Sr. Unsec. Nts., 8/15/45 | | | 41,000 | | | | 42,711 | |
| | | | | | | | |
| | | Principal
Amount | | | Value | |
| |
| Biotechnology (Continued) | |
| |
| Shire Acquisitions Investments Ireland DAC: | |
| 1.90% Sr. Unsec. Nts., 9/23/19 | | $ | 376,000 | | | $ | 371,303 | |
| 3.20% Sr. Unsec. Nts., 9/23/26 | | | 288,000 | | | | 269,308 | |
| | | | | | | | |
| | | | | | | 1,198,601 | |
| |
| Health Care Equipment & Supplies—0.5% | |
| |
| Abbott Laboratories: | | | | | | | | |
| 2.35% Sr. Unsec. Nts., 11/22/19 | | | 366,000 | | | | 366,504 | |
| 4.90% Sr. Unsec. Nts., 11/30/46 | | | 151,000 | | | | 155,283 | |
| |
| Baxter International, Inc., 2.60% Sr. Unsec. Nts., 8/15/26 | | | 180,000 | | | | 166,265 | |
| |
| Boston Scientific Corp., 3.85% Sr. Unsec. Nts., 5/15/25 | | | 292,000 | | | | 292,715 | |
| |
| Stryker Corp., 3.50% Sr. Unsec. Nts., 3/15/26 | | | 137,000 | | | | 138,365 | |
| | | | | | | | |
| | | | | | | 1,119,132 | |
| |
| Health Care Providers & Services—0.7% | |
| |
| Aetna, Inc., 3.20% Sr. Unsec. Nts., 6/15/26 | | | 280,000 | | | | 277,146 | |
| |
| Cardinal Health, Inc., 3.50% Sr. Unsec. Nts., 11/15/24 | | | 168,000 | | | | 169,938 | |
| |
| Express Scripts Holding Co., 4.50% Sr. Unsec. Nts., 2/25/26 | | | 247,000 | | | | 254,405 | |
| |
| Fresenius Medical Care US Finance II, Inc., 5.875% Sr. Unsec. Nts., 1/31/223 | | | 145,000 | | | | 159,500 | |
| |
| Laboratory Corp. of America Holdings, 3.60% Sr. Unsec. Nts., 2/1/25 | | | 499,000 | | | | 497,047 | |
| |
| McKesson Corp., 4.883% Sr. Unsec. Nts., 3/15/44 | | | 142,000 | | | | 144,723 | |
| |
| Quest Diagnostics, Inc., 3.45% Sr. Unsec. Nts., 6/1/26 | | | 155,000 | | | | 152,965 | |
| | | | | | | | |
| | | | | | | 1,655,724 | |
| |
| Life Sciences Tools & Services—0.3% | |
| |
| Thermo Fisher Scientific, Inc.: | |
| 2.15% Sr. Unsec. Nts., 12/14/18 | | | 156,000 | | | | 156,758 | |
| 3.00% Sr. Unsec. Nts., 4/15/23 | | | 160,000 | | | | 157,310 | |
| 4.15% Sr. Unsec. Nts., 2/1/24 | | | 125,000 | | | | 130,218 | |
| 5.30% Sr. Unsec. Nts., 2/1/44 | | | 111,000 | | | | 124,425 | |
| | | | | | | | |
| | | | | | | 568,711 | |
| |
| Pharmaceuticals—0.4% | | | | | | | | |
| |
| Actavis Funding SCS: | | | | | | | | |
| 3.80% Sr. Unsec. Nts., 3/15/25 | | | 227,000 | | | | 227,375 | |
| 4.75% Sr. Unsec. Nts., 3/15/45 | | | 99,000 | | | | 97,379 | |
| |
| Perrigo Finance Unlimited Co., 4.375% Sr. Unsec. Nts., 3/15/26 | | | 103,000 | | | | 103,157 | |
| |
| Teva Pharmaceutical Finance Netherlands III BV, 1.70% Sr. Unsec. Nts., 7/19/19 | | | 347,000 | | | | 340,998 | |
| | | | | | | | |
| | | | | | | 768,909 | |
| |
| Industrials—2.5% | | | | | | | | |
| |
| Aerospace & Defense—0.4% | |
| |
| BAE Systems Holdings, Inc., 3.85% Sr. Unsec. Nts., 12/15/253 | | | 292,000 | | | | 297,952 | |
| |
| L-3 Communications Corp., 3.85% Sr. Unsec. Nts., 12/15/26 | | | 94,000 | | | | 93,489 | |
| |
| Lockheed Martin Corp., 3.55% Sr. Unsec. Nts., 1/15/26 | | | 184,000 | | | | 188,090 | |
| |
| Northrop Grumman Corp., 4.75% Sr. Unsec. Nts., 6/1/43 | | | 200,000 | | | | 218,325 | |
| |
| Textron, Inc., 3.875% Sr. Unsec. Nts., 3/1/25 | | | 129,000 | | | | 129,768 | |
| |
| United Technologies Corp., 1.778% Jr. Sub. Nts., 5/4/184 | | | 67,000 | | | | 67,027 | |
| | | | | | | | |
| | | | | | | 994,651 | |
| |
| Building Products—0.2% | | | | | | | | |
| |
| Johnson Controls International plc, 1.40%, 11/2/17 | | | 77,000 | | | | 77,135 | |
15 OPPENHEIMER CONSERVATIVE BALANCED FUND/VA
STATEMENT OF INVESTMENTS Continued
| | | | | | | | |
| | | Principal
Amount | | | Value | |
| |
| Building Products (Continued) | |
| |
| Owens Corning, 3.40% Sr. Unsec. Nts., 8/15/26 | | $ | 259,000 | | | $ | 246,166 | |
| | | | | | | | |
| | | | | | | 323,301 | |
| |
| Commercial Services & Supplies—0.4% | |
| |
| Pitney Bowes, Inc., 4.625% Sr. Unsec. Nts., 3/15/24 | | | 288,000 | | | | 283,799 | |
| |
| Republic Services, Inc.: | | | | | | | | |
| 2.90% Sr. Unsec. Nts., 7/1/26 | | | 185,000 | | | | 177,448 | |
| 3.80% Sr. Unsec. Nts., 5/15/18 | | | 311,000 | | | | 319,707 | |
| |
| Waste Management, Inc., 4.10% Sr. Unsec. Nts., 3/1/45 | | | 92,000 | | | | 91,240 | |
| | | | | | | | |
| | | | | | | 872,194 | |
| |
| Electrical Equipment—0.2% | | | | | | | | |
| |
Sensata Technologies BV, 4.875% Sr. Unsec. Nts., 10/15/233 | | | 369,000 | | | | 378,686 | |
| |
| Industrial Conglomerates—0.1% | |
| |
| Roper Technologies, Inc.: | | | | | | | | |
| 3.80% Sr. Unsec. Nts., 12/15/26 | | | 43,000 | | | | 43,355 | |
| 3.85% Sr. Unsec. Nts., 12/15/25 | | | 192,000 | | | | 194,455 | |
| | | | | | | | |
| | | | | | | 237,810 | |
| |
| Machinery—0.3% | | | | | | | | |
| |
| Fortive Corp., 1.80% Sr. Unsec. Nts., 6/15/193 | | | 385,000 | | | | 382,733 | |
| |
| Ingersoll-Rand Global Holding Co. Ltd., 4.25% Sr. Unsec. Nts., 6/15/23 | | | 120,000 | | | | 126,965 | |
| |
| Wabtec Corp., 3.45% Sr. Unsec. Nts., 11/15/263 | | | 149,000 | | | | 143,308 | |
| | | | | | | | |
| | | | | | | 653,006 | |
| |
| Professional Services—0.2% | | | | | | | | |
| |
Experian Finance plc, 2.375% Sr. Unsec. Nts., 6/15/173 | | | 427,000 | | | | 428,636 | |
| |
| Road & Rail—0.5% | | | | | | | | |
| |
| Canadian Pacific Railway Co., 4.80% Sr. Unsec. Nts., 9/15/35 | | | 76,000 | | | | 82,162 | |
| |
| CSX Corp., 3.80% Sr. Unsec. Nts., 11/1/46 | | | 90,000 | | | | 83,618 | |
| |
| ERAC USA Finance LLC, 6.375% Sr. Unsec. Nts., 10/15/173 | | | 312,000 | | | | 323,322 | |
| |
| Norfolk Southern Corp., 4.65% Sr. Unsec. Nts., 1/15/46 | | | 124,000 | | | | 132,113 | |
| |
| Penske Truck Leasing Co. LP/PTL Finance Corp.: | | | | | | | | |
| 3.40% Sr. Unsec. Nts., 11/15/263 | | | 305,000 | | | | 291,978 | |
| 3.75% Sr. Unsec. Nts., 5/11/173 | | | 220,000 | | | | 221,725 | |
| | | | | | | | |
| | | | | | | 1,134,918 | |
| |
| Trading Companies & Distributors—0.2% | |
| |
| AerCap Ireland Capital Ltd./AerCap Global Aviation Trust, 3.95% Sr. Unsec. Nts., 2/1/22 | | | 379,000 | | | | 383,264 | |
| |
| Air Lease Corp., 3% Sr. Unsec. Nts., 9/15/23 | | | 160,000 | | | | 152,914 | |
| | | | | | | | |
| | | | | | | 536,178 | |
| |
| Information Technology—1.6% | |
| |
| Electronic Equipment, Instruments, & Components—0.1% | |
| |
Flex Ltd., 4.75% Sr. Unsec. Nts., 6/15/25 | | | 290,000 | | | | 306,967 | |
| |
| IT Services—0.3% | | | | | | | | |
| |
| Broadridge Financial Solutions, Inc., 3.40% Sr. Unsec. Nts., 6/27/26 | | | 185,000 | | | | 178,625 | |
| |
| Fidelity National Information Services, Inc., 1.45% Sr. Unsec. Nts., 6/5/17 | | | 351,000 | | | | 351,170 | |
| |
| Xerox Corp.: | | | | | | | | |
| 2.95% Sr. Unsec. Nts., 3/15/17 | | | 149,000 | | | | 149,454 | |
| 6.75% Sr. Unsec. Nts., 2/1/17 | | | 75,000 | | | | 75,272 | |
| | | | | | | | |
| | | | | | | 754,521 | |
| | | | | | | | |
| | | Principal
Amount | | | Value | |
| |
| Semiconductors & Semiconductor Equipment—0.1% | |
| |
| Intel Corp., 4.90% Sr. Unsec. Nts., 7/29/45 | | $ | 107,000 | | | $ | 119,748 | |
| |
| Software—0.8% | | | | | | | | |
| |
| Activision Blizzard, Inc., 2.30% Sr. Unsec. Nts., 9/15/213 | | | 355,000 | | | | 346,481 | |
| |
| Autodesk, Inc.: | | | | | | | | |
| 1.95% Sr. Unsec. Nts., 12/15/17 | | | 313,000 | | | | 313,591 | |
| 4.375% Sr. Unsec. Nts., 6/15/25 | | | 125,000 | | | | 128,466 | |
| |
| Diamond 1 Finance Corp./Diamond 2 Finance Corp.: | |
| 3.48% Sr. Sec. Nts., 6/1/193 | | | 376,000 | | | | 383,947 | |
| 6.02% Sr. Sec. Nts., 6/15/263 | | | 225,000 | | | | 243,858 | |
| |
| Open Text Corp., 5.625% Sr. Unsec. Nts., 1/15/233 | | | 174,000 | | | | 182,265 | |
| |
| Oracle Corp., 2.40% Sr. Unsec. Nts., 9/15/23 | | | 225,000 | | | | 217,924 | |
| | | | | | | | |
| | | | | | | 1,816,532 | |
| |
| Technology Hardware, Storage & Peripherals—0.3% | |
| |
| Apple, Inc., 4.375% Sr. Unsec. Nts., 5/13/45 | | | 227,000 | | | | 233,301 | |
| |
| Hewlett Packard Enterprise Co.: | |
| 2.45% Sr. Unsec. Nts., 10/5/17 | | | 267,000 | | | | 268,520 | |
| 6.35% Sr. Unsec. Nts., 10/15/45 | | | 159,000 | | | | 160,872 | |
| | | | | | | | |
| | | | | | | 662,693 | |
| |
| Materials—2.1% | | | | | | | | |
| |
| Chemicals—1.0% | | | | | | | | |
| |
| Agrium, Inc.: | | | | | | | | |
| 3.375% Sr. Unsec. Nts., 3/15/25 | | | 174,000 | | | | 168,624 | |
| 4.125% Sr. Unsec. Nts., 3/15/35 | | | 87,000 | | | | 79,894 | |
| |
| CF Industries, Inc., 4.50% Sr. Sec. Nts., 12/1/263 | | | 170,000 | | | | 167,181 | |
| |
| Eastman Chemical Co., 4.65% Sr. Unsec. Nts., 10/15/44 | | | 112,000 | | | | 111,292 | |
| |
| Ecolab, Inc.: | | | | | | | | |
| 2.00% Sr. Unsec. Nts., 1/14/19 | | | 370,000 | | | | 370,387 | |
| 3.70% Sr. Unsec. Nts., 11/1/46 | | | 60,000 | | | | 54,675 | |
| |
| PolyOne Corp., 5.25% Sr. Unsec. Nts., 3/15/23 | | | 365,000 | | | | 372,300 | |
| |
| RPM International, Inc., 3.45% Sr. Unsec. Unsub. Nts., 11/15/22 | | | 304,000 | | | | 301,501 | |
| |
| Valspar Corp. (The): | | | | | | | | |
| 3.30% Sr. Unsec. Nts., 2/1/25 | | | 122,000 | | | | 117,164 | |
| 3.95% Sr. Unsec. Nts., 1/15/26 | | | 174,000 | | | | 174,037 | |
| |
| Yara International ASA, 3.80% Sr. Unsec. Nts., 6/6/263 | | | 230,000 | | | | 225,580 | |
| | | | | | | | |
| | | | | | | 2,142,635 | |
| |
| Construction Materials—0.3% | | | | | | | | |
| |
| CRH America, Inc., 5.125% Sr. Unsec. Nts., 5/18/453 | | | 282,000 | | | | 294,220 | |
| |
| James Hardie International Finance Ltd., 5.875% Sr. Unsec. Nts., 2/15/233 | | | 171,000 | | | | 177,840 | |
| |
| LafargeHolcim Finance US LLC, 3.50% Sr. Unsec. Nts., 9/22/263 | | | 90,000 | | | | 87,523 | |
| | | | | | | | |
| | | | | | | 559,583 | |
| |
| Containers & Packaging—0.3% | |
| |
| Ball Corp., 5.25% Sr. Unsec. Nts., 7/1/25 | | | 16,000 | | | | 16,780 | |
| |
| International Paper Co.: | | | | | | | | |
| 3.00% Sr. Unsec. Nts., 2/15/27 | | | 177,000 | | | | 167,085 | |
| 4.80% Sr. Unsec. Nts., 6/15/44 | | | 183,000 | | | | 182,112 | |
| |
| Packaging Corp. of America: | | | | | | | | |
| 3.65% Sr. Unsec. Nts., 9/15/24 | | | 113,000 | | | | 113,513 | |
| 4.50% Sr. Unsec. Nts., 11/1/23 | | | 270,000 | | | | 286,101 | |
| | | | | | | | |
| | | | | | | 765,591 | |
16 OPPENHEIMER CONSERVATIVE BALANCED FUND/VA
| | | | | | | | |
| | | Principal
Amount | | | Value | |
| |
| Metals & Mining—0.4% | |
| |
| BHP Billiton Finance USA Ltd., 1.625% Sr. Unsec. Nts., 2/24/17 | | $ | 379,000 | | | $ | 379,293 | |
| |
| Glencore Finance Canada Ltd., 3.60% Sr. Unsec. Nts., 1/15/173 | | | 348,000 | | | | 348,161 | |
| |
| Goldcorp, Inc., 5.45% Sr. Unsec. Nts., 6/9/44 | | | 116,000 | | | | 113,984 | |
| |
| Rio Tinto Finance USA Ltd., 3.75% Sr. Unsec. Nts., 6/15/25 | | | 154,000 | | | | 158,665 | |
| | | | | | | | |
| | | | | | | 1,000,103 | |
| |
| Paper & Forest Products—0.1% | |
| |
| Georgia-Pacific LLC, 2.539% Sr. Unsec. Nts., 11/15/193 | | | 83,000 | | | | 83,744 | |
| |
| Louisiana-Pacific Corp., 4.875% Sr. Unsec. Nts., 9/15/24 | | | 199,000 | | | | 193,527 | |
| | | | | | | | |
| | | | | | | 277,271 | |
| |
| Telecommunication Services—1.3% | |
| |
| Diversified Telecommunication Services—1.3% | |
| |
| AT&T, Inc.: | | | | | | | | |
| 2.80% Sr. Unsec. Nts., 2/17/21 | | | 392,000 | | | | 388,940 | |
| 4.35% Sr. Unsec. Nts., 6/15/45 | | | 299,000 | | | | 266,937 | |
| |
| British Telecommunications plc, 9.375% Sr. Unsec. Nts., 12/15/30 | | | 288,000 | | | | 439,666 | |
| |
| Deutsche Telekom International Finance BV, 2.25% Sr. Unsec. Nts., 3/6/173 | | | 373,000 | | | | 373,545 | |
| |
| Telefonica Emisiones SAU: | |
| 3.192% Sr. Unsec. Nts., 4/27/18 | | | 397,000 | | | | 402,781 | |
| 7.045% Sr. Unsec. Unsub. Nts., 6/20/36 | | | 104,000 | | | | 120,884 | |
| |
| Verizon Communications, Inc.: | |
| 1.75% Sr. Unsec. Nts., 8/15/21 | | | 263,000 | | | | 252,336 | |
| 4.125% Sr. Unsec. Nts., 8/15/46 | | | 152,000 | | | | 137,846 | |
| 4.50% Sr. Unsec. Nts., 9/15/20 | | | 440,000 | | | | 470,908 | |
| 4.522% Sr. Unsec. Nts., 9/15/48 | | | 191,000 | | | | 183,532 | |
| | | | | | | | |
| | | | | | | 3,037,375 | |
| |
| Utilities—2.2% | | | | | | | | |
| |
| Electric Utilities—1.7% | | | | | | | | |
| |
| AEP Texas Central Co., 3.85% Sr. Unsec. Nts., 10/1/253 | | | 198,000 | | | | 203,386 | |
| |
| Cleco Corporate Holdings LLC, 3.743% Sr. Sec. Nts., 5/1/263 | | | 188,000 | | | | 185,248 | |
| |
| Duke Energy Corp., 3.75% Sr. Unsec. Nts., 9/1/46 | | | 175,000 | | | | 157,876 | |
| |
| Edison International, 2.95% Sr. Unsec. Nts., 3/15/23 | | | 233,000 | | | | 230,584 | |
| | | | | | | | |
| | | Principal
Amount | | | Value | |
| |
| Electric Utilities (Continued) | |
| |
| Enel Finance International NV, 6.25% Sr. Unsec. Nts., 9/15/173 | | $ | 389,000 | | | $ | 400,982 | |
| |
| Exelon Corp., 4.45% Sr. Unsec. Nts., 4/15/46 | | | 96,000 | | | | 94,168 | |
| |
| Indiana Michigan Power Co., Series K, 4.55% Sr. Unsec. Nts., 3/15/46 | | | 77,000 | | | | 80,025 | |
| |
| ITC Holdings Corp., 5.30% Sr. Unsec. Nts., 7/1/43 | | | 93,000 | | | | 101,918 | |
| |
| NextEra Energy Capital Holdings, Inc., 1.586% Sr. Unsec. Nts., 6/1/17 | | | 419,000 | | | | 419,282 | |
| |
| Pennsylvania Electric Co., 5.20% Sr. Unsec. Nts., 4/1/20 | | | 88,000 | | | | 94,249 | |
| |
| PPL WEM Ltd./Western Power Distribution Ltd., 5.375% Sr. Unsec. Unsub. Nts., 5/1/213 | | | 600,000 | | | | 647,496 | |
| |
| Public Service Co. of New Mexico, 7.95% Sr. Unsec. Nts., 5/15/18 | | | 347,000 | | | | 374,673 | |
| |
| Southern Power Co., 1.95% Sr. Unsec. Nts., 12/15/19 | | | 324,000 | | | | 320,971 | |
| |
| Trans-Allegheny Interstate Line Co., 3.85% Sr. Unsec. Nts., 6/1/253 | | | 223,000 | | | | 226,012 | |
| |
| Xcel Energy, Inc., 3.30% Sr. Unsec. Nts., 6/1/25 | | | 186,000 | | | | 186,145 | |
| | | | | | | | |
| | | | | | | 3,723,015 | |
| |
| Multi-Utilities—0.5% | | | | | | | | |
| |
| CenterPoint Energy, Inc., 5.95% Sr. Unsec. Nts., 2/1/17 | | | 386,000 | | | | 387,320 | |
| |
| CMS Energy Corp., 3.875% Sr. Unsec. Nts., 3/1/24 | | | 240,000 | | | | 249,708 | |
| |
| NiSource Finance Corp., 4.80% Sr. Unsec. Nts., 2/15/44 | | | 164,000 | | | | 172,990 | |
| |
| Public Service Enterprise Group, Inc., 1.60% Sr. Unsec. Nts., 11/15/19 | | | 337,000 | | | | 332,347 | |
| | | | | | | | |
| | | | | | | 1,142,365 | |
| | | | | | | | |
| Total Non-Convertible Corporate Bonds and Notes (Cost $68,153,744) | | | | 68,568,068 | |
| | |
| | | Shares | | | | |
| |
Investment Company—2.4% | |
| |
| Oppenheimer Institutional Government Money Market Fund, Cl. E, 0.43%12,13 (Cost $5,367,607) | | | 5,367,607 | | | | 5,367,607 | |
| |
| Total Investments, at Value (Cost $224,282,676) | | | 104.8% | | | | 235,055,238 | |
| | | | |
| Net Other Assets (Liabilities) | | | (4.8) | | | | (10,739,704 | ) |
| | | | |
| Net Assets | | | 100.0% | | | $ | 224,315,534 | |
| | | | |
Footnotes to Statement of Investments
1. Non-income producing security.
2. Security is a Master Limited Partnership.
3. Represents securities sold under Rule 144A, which are exempt from registration under the Securities Act of 1933, as amended. These securities have been determined to be liquid under guidelines established by the Board of Trustees. These securities amount to $28,210,811 or 12.58% of the Fund’s net assets at period end.
4. Represents the current interest rate for a variable or increasing rate security.
5. Interest-Only Strips represent the right to receive the monthly interest payments on an underlying pool of mortgage loans. These securities typically decline in price as interest rates decline.
Most other fixed income securities increase in price when interest rates decline. The principal amount of the underlying pool represents the notional amount on which current interest is calculated. The price of these securities is typically more sensitive to changes in prepayment rates than traditional mortgage-backed securities (for example, GNMA pass-throughs). Interest rates disclosed represent current yields based upon the current cost basis and estimated timing and amount of future cash flows. These securities amount to $1,349,606 or 0.60% of the Fund’s net assets at period end.
6. Principal-Only Strips represent the right to receive the monthly principal payments on an underlying pool of mortgage loans. The value of these securities generally increases as interest rates decline and prepayment rates rise. The price of these securities is typically more volatile than that of coupon-bearing bonds of the same maturity. Interest rates disclosed represent current yields based upon the current cost basis and estimated timing of future cash flows. These securities amount to $65,262 or 0.03% of the Fund’s net assets at period end.
7. Interest rate is less than 0.0005%.
8. All or a portion of the security position is when-issued or delayed delivery to be delivered and settled after period end. See Note 4 of the accompanying Notes.
9. All or a portion of the security position is held in accounts at a futures clearing merchant and pledged to cover margin requirements on open futures contracts and written options on futures, if applicable. The aggregate market value of such securities is $72,319. See Note 6 of the accompanying Notes.
10. All or a portion of the security position has been pledged for collateral in association with forward roll transactions. See Note 4 of the accompanying Notes.
11. This bond has no contractual maturity date, is not redeemable and contractually pays an indefinite stream of interest.
| 12. | Rate shown is the 7-day yield at period end. |
17 OPPENHEIMER CONSERVATIVE BALANCED FUND/VA
STATEMENT OF INVESTMENTS Continued
Footnotes to Statement of Investments (Continued)
13. Is or was an affiliate, as defined in the Investment Company Act of 1940, as amended, at or during the reporting period, by virtue of the Fund owning at least 5% of the voting securities of the issuer or as a result of the Fund and the issuer having the same investment adviser. Transactions during the reporting period in which the issuer was an affiliate are as follows:
| | | | | | | | | | | | | | | | |
| | | Shares
December 31, 2015 | | | Gross
Additions | | | Gross
Reductions | | | Shares
December 31, 2016 | |
| |
Oppenheimer Institutional Government Money Market Fund, Cl. E a | | | 5,367,607 | | | | — | | | | — | | | | 5,367,607 | |
| | | | | | | | | Value | | | Income | |
| |
Oppenheimer Institutional Government Money Market Fund, Cl. E a | | | | | | | | | | $ | 5,367,607 | | | $ | 21,187 | |
a. Prior to September 28, 2016, this fund was named Oppenheimer Institutional Money Market Fund.
|
|
| Futures Contracts as of December 31, 2016 |
| | | | | | | | | | | | | | | | | | | | | | | | |
| Description | | Exchange | | | Buy/Sell | | | Expiration Date | | | Number of Contracts | | | Value | | | Unrealized Appreciation
(Depreciation) | |
| |
| United States Treasury Long Bonds | | | CBT | | | | Buy | | | | 3/22/17 | | | | 6 | | | $ | 903,937 | | | $ | 15,234 | |
| United States Treasury Nts., 2 yr. | | | CBT | | | | Buy | | | | 3/31/17 | | | | 104 | | | | 22,535,500 | | | | (5,596) | |
| United States Treasury Nts., 5 yr. | | | CBT | | | | Sell | | | | 3/31/17 | | | | 7 | | | | 823,648 | | | | 1,398 | |
| United States Treasury Nts., 10 yr. | | | CBT | | | | Sell | | | | 3/22/17 | | | | 23 | | | | 2,858,469 | | | | 16,947 | |
| United States Ultra Bonds | | | CBT | | | | Buy | | | | 3/22/17 | | | | 50 | | | | 8,012,500 | | | | (63,750) | |
| | | | | | | | | | | | | | | | | | | | | | | | |
| | | | | | | | | | | | | | | | | | | | | | $ | (35,767) | |
| | | | | | | | | | | | | | | | | | | | | | | | |
|
|
| Centrally Cleared Credit Default Swaps at December 31, 2016 |
| | | | | | | | | | | | | | | | | | | | | | | | | | | | |
| Reference Asset | | Buy/Sell
Protection | | | Fixed
Rate | | | Maturity
Date | | | | | | Notional Amount (000’s) | | | Premiums Received/(Paid) | | | Value | |
| |
CDX.HY.27 | | | Sell | | | | 5.000 | % | | | 12/20/21 | | | | USD | | | | 1,030 | | | $ | (63,339 | ) | | $ | 63,931 | |
| |
CDX.HY.27 | | | Sell | | | | 5.000 | | | | 12/20/21 | | | | USD | | | | 1,030 | | | | (65,222 | ) | | | 63,787 | |
| | | | | | | | | | | | | | | | | | | | | | | | |
Total of Cleared Credit Default Swaps | | | | | | | | | | | | | | | | | | | | | | $ | (128,561 | ) | | $ | 127,718 | |
| | | | | | | | | | | | | | | | | | | | | | | | |
The table that follows shows the undiscounted maximum potential payment by the Fund related to selling credit protection in credit default swaps:
| | | | | | |
Type of Reference Asset on which
the Fund Sold Protection | | Total Maximum Potential Payments for Selling
Credit Protection (Undiscounted) | | Amount Recoverable* | | Reference Asset Rating Range** |
|
Non-Investment Grade Corporate Debt | | $ 2,060,000 | | $ — | | BB- |
Indexes | | | | | | |
*The Fund has no amounts recoverable from related purchased protection. In addition, the Fund has no recourse provisions under the credit derivatives and holds no collateral which can offset or reduce potential payments under a triggering event.
**The period end reference asset security ratings, as rated by any rating organization, are included in the equivalent Standard & Poor’s rating category. The reference asset rating represents the likelihood of a potential credit event on the reference asset which would result in a related payment by the Fund.
| | |
Glossary: | | |
| |
Definitions | | |
CDX.HY.27 | | Markit CDX High Yield Index |
| |
Exchange Abbreviations | | |
CBT | | Chicago Board of Trade |
See accompanying Notes to Financial Statements.
18 OPPENHEIMER CONSERVATIVE BALANCED FUND/VA
STATEMENT OF ASSETS AND LIABILITIES December 31, 2016
| | | | |
| Assets | | | | |
| Investments, at value—see accompanying statement of investments: | | | | |
| Unaffiliated companies (cost $218,915,069) | | $ | 229,687,631 | |
| Affiliated companies (cost $5,367,607) | | | 5,367,607 | |
| | | | |
| | | 235,055,238 | |
| |
| Cash | | | 25,168,495 | |
| |
| Cash used for collateral on futures | | | 277,000 | |
| |
| Cash used for collateral on forward roll transactions | | | 76,000 | |
| |
| Centrally cleared swaps, at value (premiums paid $128,561) | | | 127,718 | |
| |
| Receivables and other assets: | | | | |
| Investments sold (including $5,886,791 sold on a when-issued or delayed delivery basis) | | | 6,279,024 | |
| Interest, dividends and principal paydowns | | | 882,041 | |
| Variation margin receivable | | | 59,438 | |
| Shares of beneficial interest sold | | | 37,273 | |
| Other | | | 46,003 | |
| | | | |
| Total assets | | | 268,008,230 | |
| |
Liabilities | | | | |
| Centrally cleared swap collateral due | | | 35,268 | |
| |
| Payables and other liabilities: | | | | |
| Investments purchased (including $43,426,705 purchased on a when-issued or delayed delivery basis) | | | 43,491,584 | |
| Shares of beneficial interest redeemed | | | 65,993 | |
| Trustees’ compensation | | | 38,545 | |
| Shareholder communications | | | 12,197 | |
| Distribution and service plan fees | | | 11,011 | |
| Variation margin payable | | | 9,055 | |
| Other | | | 29,043 | |
| | | | |
| Total liabilities | | | 43,692,696 | |
| |
Net Assets | | $ | 224,315,534 | |
| | | | |
|
| |
Composition of Net Assets | | | | |
| Par value of shares of beneficial interest | | $ | 15,142 | |
| |
| Additional paid-in capital | | | 216,103,747 | |
| |
| Accumulated net investment income | | | 4,130,290 | |
| |
| Accumulated net realized loss on investments | | | (6,666,134) | |
| |
| Net unrealized appreciation on investments and translation of assets and liabilities denominated in foreign currencies | | | 10,732,489 | |
| | | | |
Net Assets | | $ | 224,315,534 | |
| | | | |
|
| |
Net Asset Value Per Share | | | | |
| |
| Non-Service Shares: | | | | |
| |
| Net asset value, redemption price per share and offering price per share (based on net assets of $172,572,400 and 11,614,386 shares of beneficial interest outstanding) | | | $14.86 | |
| |
| |
| Service Shares: | | | | |
| |
| Net asset value, redemption price per share and offering price per share (based on net assets of $51,743,134 and 3,527,342 shares of beneficial interest outstanding) | | | $14.67 | |
See accompanying Notes to Financial Statements.
19 OPPENHEIMER CONSERVATIVE BALANCED FUND/VA
STATEMENT OF OPERATIONS For the Year Ended December 31, 2016
| | | | |
| |
Investment Income | | | | |
| Interest (net of foreign withholding taxes of $1,617) | | $ | 4,218,680 | |
| |
| Dividends: | | | | |
| Unaffiliated companies (net of foreign withholding taxes of $10,620) | | | 1,424,135 | |
| Affiliated companies | | | 21,187 | |
| | | | |
| Total investment income | | | 5,664,002 | |
| |
Expenses | | | | |
| Management fees | | | 1,725,757 | |
| |
| Distribution and service plan fees - Service shares | | | 134,733 | |
| |
| Transfer and shareholder servicing agent fees: | | | | |
| Non-Service shares | | | 177,425 | |
| Service shares | | | 53,930 | |
| |
| Shareholder communications: | | | | |
| Non-Service shares | | | 44,205 | |
| Service shares | | | 13,441 | |
| |
| Custodian fees and expenses | | | 46,888 | |
| |
| Trustees’ compensation | | | 15,153 | |
| |
| Borrowing fees | | | 4,111 | |
| |
| Other | | | 90,332 | |
| | | | |
| |
| Total expenses | | | 2,305,975 | |
| Less waivers and reimbursements of expenses | | | (616,958) | |
| | | | |
| Net expenses | | | 1,689,017 | |
| |
Net Investment Income | | | 3,974,985 | |
| |
Realized and Unrealized Gain (Loss) | | | | |
| Net realized gain (loss) on: | | | | |
| Investment transactions in unaffiliated companies (including premiums on options exercised) | | | 6,026,715 | |
| Closing and expiration of futures contracts | | | (57,460) | |
| Swap contracts | | | (3,290) | |
| Swaption contracts | | | 37,155 | |
| | | | |
| Net realized gain | | | 6,003,120 | |
| |
| Net change in unrealized appreciation/depreciation on: | | | | |
| Investment transactions | | | 1,870,619 | |
| Translation of assets and liabilities denominated in foreign currencies | | | (520) | |
| Futures contracts | | | (62,412) | |
| Swap contracts | | | (843) | |
| | | | |
| Net change in unrealized appreciation/depreciation | | | 1,806,844 | |
| |
Net Increase in Net Assets Resulting from Operations | | $ | 11,784,949 | |
| | | | |
See accompanying Notes to Financial Statements.
20 OPPENHEIMER CONSERVATIVE BALANCED FUND/VA
STATEMENTS OF CHANGES IN NET ASSETS
| | | | | | | | |
| | | Year Ended
December 31, 2016 | | | Year Ended
December 31, 2015 | |
| |
Operations | | | | | | | | |
| Net investment income | | $ | 3,974,985 | | | $ | 5,143,739 | |
| |
| Net realized gain | | | 6,003,120 | | | | 8,011,492 | |
| |
| Net change in unrealized appreciation/depreciation | | | 1,806,844 | | | | (10,889,422) | |
| | | | |
| Net increase in net assets resulting from operations | | | 11,784,949 | | | | 2,265,809 | |
| |
Dividends and/or Distributions to Shareholders | | | | | | | | |
| Dividends from net investment income: | | | | | | | | |
| Non-Service shares | | | (4,214,715) | | | | (4,370,338) | |
| Service shares | | | (1,155,621) | | | | (1,196,499) | |
| | | | |
| | | (5,370,336) | | | | (5,566,837) | |
| |
Beneficial Interest Transactions | | | | | | | | |
| Net decrease in net assets resulting from beneficial interest transactions: | | | | | | | | |
| Non-Service shares | | | (14,689,603) | | | | (18,739,351) | |
| Service shares | | | (2,041,174) | | | | (10,891,668) | |
| | | | |
| | | (16,730,777) | | | | (29,631,019) | |
| |
Net Assets | | | | | | | | |
| Total decrease | | | (10,316,164) | | | | (32,932,047) | |
| |
| Beginning of period | | | 234,631,698 | | | | 267,563,745 | |
| | | | |
End of period (including accumulated net investment income of
$4,130,290 and $ 5,254,734,respectively) | | $ | 224,315,534 | | | $ | 234,631,698 | |
| | | | |
See accompanying Notes to Financial Statements.
21 OPPENHEIMER CONSERVATIVE BALANCED FUND/VA
FINANCIAL HIGHLIGHTS
| | | | | | | | | | | | | | | | | | | | |
| Non-Service Shares | | Year Ended
December 31,
2016 | | | Year Ended
December 31,
2015 | | | Year Ended
December 31,
2014 | | | Year Ended
December 31,
2013 | | | Year Ended
December 31,
2012 | |
| |
Per Share Operating Data | | | | | | | | | | | | | | | | | | | | |
| Net asset value, beginning of period | | | $14.46 | | | | $14.67 | | | | $13.84 | | | | $12.52 | | | | $11.30 | |
| |
| Income (loss) from investment operations: | | | | | | | | | | | | | | | | | | | | |
| Net investment income1 | | | 0.26 | | | | 0.31 | | | | 0.29 | | | | 0.25 | | | | 0.29 | |
| Net realized and unrealized gain (loss) | | | 0.49 | | | | (0.18) | | | | 0.83 | | | | 1.38 | | | | 1.09 | |
| | | | |
| Total from investment operations | | | 0.75 | | | | 0.13 | | | | 1.12 | | | | 1.63 | | | | 1.38 | |
| |
| Dividends and/or distributions to shareholders: | | | | | | | | | | | | | | | | | | | | |
| Dividends from net investment income | | | (0.35) | | | | (0.34) | | | | (0.29) | | | | (0.31) | | | | (0.16) | |
| |
| Net asset value, end of period | | | $14.86 | | | | $14.46 | | | | $14.67 | | | | $13.84 | | | | $12.52 | |
| | | | |
| | | | | | | | | | | | | | | | |
| |
Total Return, at Net Asset Value2 | | | 5.26% | | | | 0.83% | | | | 8.20% | | | | 13.17% | | | | 12.34% | |
| | | | | | | | | | | | | | | | |
| |
Ratios/Supplemental Data | | | | | | | | | | | | | | | | | | | | |
| Net assets, end of period (in thousands) | | | $172,573 | | | | $182,406 | | | | $203,684 | | | | $213,697 | | | | $218,032 | |
| |
| Average net assets (in thousands) | | | $177,368 | | | | $194,208 | | | | $208,556 | | | | $218,090 | | | | $191,416 | |
| |
| Ratios to average net assets:3 | | | | | | | | | | | | | | | | | | | | |
| Net investment income | | | 1.78% | | | | 2.09% | | | | 2.03% | | | | 1.87% | | | | 2.46% | |
| Expenses excluding specific expenses listed below | | | 0.94% | | | | 0.91% | | | | 0.90% | | | | 0.89% | | | | 0.90% | |
| Interest and fees from borrowings | | | 0.00% | 4 | | | 0.00% | 4 | | | 0.00% | | | | 0.00% | | | | 0.00% | |
| | | | |
| Total expenses5 | | | 0.94% | | | | 0.91% | | | | 0.90% | | | | 0.89% | | | | 0.90% | |
| Expenses after payments, waivers and/or reimbursements and reduction to custodian expenses | | | 0.67% | | | | 0.67% | | | | 0.67% | | | | 0.66% | | | | 0.66% | |
| |
| Portfolio turnover rate6 | | | 68% | | | | 68% | | | | 98% | | | | 187% | | | | 110% | |
1. Per share amounts calculated based on the average shares outstanding during the period.
2. Assumes an initial investment on the business day before the first day of the fiscal period, with all dividends and distributions reinvested in additional shares on the reinvestment date, and redemption at the net asset value calculated on the last business day of the fiscal period. Total returns are not annualized for periods less than one full year. Total return information does not reflect expenses that apply at the separate account level or to related insurance products. Inclusion of these charges would reduce the total return figures for all periods shown. Returns do not reflect the deduction of taxes that a shareholder would pay on fund distributions or the redemption of fund shares.
3. Annualized for periods less than one full year.
4. Less than 0.005%.
5. Total expenses including indirect expenses from affiliated fund fees and expenses were as follows:
| | | | | | |
| | | | | | |
Year Ended December 31, 2016 | | | 0.94 | % | |
Year Ended December 31, 2015 | | | 0.91 | % | |
Year Ended December 31, 2014 | | | 0.90 | % | |
Year Ended December 31, 2013 | | | 0.90 | % | |
Year Ended December 31, 2012 | | | 0.91 | % | |
6. The portfolio turnover rate excludes purchase and sale transactions of To Be Announced (TBA) mortgage-related securities as follows:
| | | | | | | | |
| | | Purchase Transactions | | | Sale Transactions | |
| |
Year Ended December 31, 2016 | | | $737,550,642 | | | | $742,753,245 | |
Year Ended December 31, 2015 | | | $829,988,104 | | | | $849,696,153 | |
Year Ended December 31, 2014 | | | $697,503,637 | | | | $678,765,376 | |
Year Ended December 31, 2013 | | | $794,398,216 | | | | $800,879,825 | |
Year Ended December 31, 2012 | | | $555,111,600 | | | | $549,805,766 | |
See accompanying Notes to Financial Statements.
22 OPPENHEIMER CONSERVATIVE BALANCED FUND/VA
| | | | | | | | | | | | | | | | | | | | |
| Service Shares | | Year Ended
December 31,
2016 | | | Year Ended
December 31,
2015 | | | Year Ended
December 31,
2014 | | | Year Ended
December 31,
2013 | | | Year Ended
December 31,
2012 | |
| |
Per Share Operating Data | | | | | | | | | | | | | | | | | | | | |
| Net asset value, beginning of period | | | $14.28 | | | | $14.49 | | | | $13.66 | | | | $12.37 | | | | $11.17 | |
| |
| Income (loss) from investment operations: | | | | | | | | | | | | | | | | | | | | |
| Net investment income1 | | | 0.22 | | | | 0.27 | | | | 0.25 | | | | 0.21 | | | | 0.26 | |
| Net realized and unrealized gain (loss) | | | 0.48 | | | | (0.18) | | | | 0.84 | | | | 1.36 | | | | 1.08 | |
| | | | |
| Total from investment operations | | | 0.70 | | | | 0.09 | | | | 1.09 | | | | 1.57 | | | | 1.34 | |
| |
| Dividends and/or distributions to shareholders: | | | | | | | | | | | | | | | | | | | | |
| Dividends from net investment income | | | (0.31) | | | | (0.30) | | | | (0.26) | | | | (0.28) | | | | (0.14) | |
| |
| Net asset value, end of period | | | $14.67 | | | | $14.28 | | | | $14.49 | | | | $13.66 | | | | $12.37 | |
| | | | |
| | | | | | | | | | | | | | | | |
| |
Total Return, at Net Asset Value2 | | | 4.96% | | | | 0.57% | | | | 8.02% | | | | 12.83% | | | | 12.11% | |
| | | | | | | | | | | | | | | | |
| |
Ratios/Supplemental Data | | | | | | | | | | | | | | | | | | | | |
| Net assets, end of period (in thousands) | | | $51,743 | | | | $52,226 | | | | $63,880 | | | | $69,601 | | | | $72,872 | |
| |
| Average net assets (in thousands) | | | $53,914 | | | | $59,085 | | | | $65,450 | | | | $72,332 | | | | $76,257 | |
| |
| Ratios to average net assets:3 | | | | | | | | | | | | | | | | | | | | |
| Net investment income | | | 1.53% | | | | 1.84% | | | | 1.78% | | | | 1.62% | | | | 2.18% | |
| Expenses excluding specific expenses listed below | | | 1.19% | | | | 1.16% | | | | 1.15% | | | | 1.15% | | | | 1.16% | |
| Interest and fees from borrowings | | | 0.00% | 4 | | | 0.00% | 4 | | | 0.00% | | | | 0.00% | | | | 0.00% | |
| | | | |
| Total expenses5 | | | 1.19% | | | | 1.16% | | | | 1.15% | | | | 1.15% | | | | 1.16% | |
| Expenses after payments, waivers and/or reimbursements and reduction to custodian expenses | | | 0.92% | | | | 0.92% | | | | 0.92% | | | | 0.92% | | | | 0.92% | |
| |
| Portfolio turnover rate6 | | | 68% | | | | 68% | | | | 98% | | | | 187% | | | | 110% | |
1. Per share amounts calculated based on the average shares outstanding during the period.
2. Assumes an initial investment on the business day before the first day of the fiscal period, with all dividends and distributions reinvested in additional shares on the reinvestment date, and redemption at the net asset value calculated on the last business day of the fiscal period. Total returns are not annualized for periods less than one full year. Total return information does not reflect expenses that apply at the separate account level or to related insurance products. Inclusion of these charges would reduce the total return figures for all periods shown. Returns do not reflect the deduction of taxes that a shareholder would pay on fund distributions or the redemption of fund shares.
3. Annualized for periods less than one full year.
4. Less than 0.005%.
5. Total expenses including indirect expenses from affiliated fund fees and expenses were as follows:
| | | | | | |
| | | | | | |
Year Ended December 31, 2016 | | | 1.19 | % | |
Year Ended December 31, 2015 | | | 1.16 | % | |
Year Ended December 31, 2014 | | | 1.15 | % | |
Year Ended December 31, 2013 | | | 1.16 | % | |
Year Ended December 31, 2012 | | | 1.17 | % | |
6. The portfolio turnover rate excludes purchase and sale transactions of To Be Announced (TBA) mortgage-related securities as follows:
| | | | | | | | |
| | | Purchase Transactions | | | Sale Transactions | |
| |
Year Ended December 31, 2016 | | | $737,550,642 | | | | $742,753,245 | |
Year Ended December 31, 2015 | | | $829,988,104 | | | | $849,696,153 | |
Year Ended December 31, 2014 | | | $697,503,637 | | | | $678,765,376 | |
Year Ended December 31, 2013 | | | $794,398,216 | | | | $800,879,825 | |
Year Ended December 31, 2012 | | | $555,111,600 | | | | $549,805,766 | |
See accompanying Notes to Financial Statements.
23 OPPENHEIMER CONSERVATIVE BALANCED FUND/VA
NOTES TO FINANCIAL STATEMENTS December 31, 2016
1. Organization
Oppenheimer Conservative Balanced Fund/VA (the “Fund”), a separate series of Oppenheimer Variable Account Funds, is a diversified open-end management investment company registered under the Investment Company Act of 1940 (“1940 Act”), as amended. The Fund’s main investment objective is to seek total return. The Fund’s investment adviser is OFI Global Asset Management, Inc. (“OFI Global” or the “Manager”), a wholly-owned subsidiary of OppenheimerFunds, Inc. (“OFI” or the “Sub-Adviser”). The Manager has entered into a sub-advisory agreement with OFI. Shares of the Fund are sold only to separate accounts of life insurance companies.
The Fund offers two classes of shares. Both classes are sold at their offering price, which is the net asset value per share, to separate investment accounts of participating insurance companies as an underlying investment for variable life insurance policies, variable annuity contracts or other investment products. The class of shares designated as Service shares is subject to a distribution and service plan. Both classes of shares have identical rights and voting privileges with respect to the Fund in general and exclusive voting rights on matters that affect that class alone. Earnings, net assets and net asset value per share may differ due to each class having its own expenses, such as transfer and shareholder servicing agent fees and shareholder communications, directly attributable to that class.
The following is a summary of significant accounting policies followed in the Fund’s preparation of financial statements in accordance with accounting principles generally accepted in the United States (“U.S. GAAP”).
2. Significant Accounting Policies
Security Valuation. All investments in securities are recorded at their estimated fair value, as described in Note 3.
Foreign Currency Translation. The books and records of the Fund are maintained in U.S. dollars. Any foreign currency amounts are translated into U.S. dollars on the following basis:
(1) Market value of investment securities, other assets and liabilities — at the exchange rates prevailing at Market Close as described in Note 3.
(2) Purchases and sales of investment securities, income and expenses — at the rates of exchange prevailing on the respective dates of such transactions.
Although the net assets and the market values are presented at the foreign exchange rates at Market Close, the Fund does not isolate the portion of the results of operations resulting from changes in foreign exchange rates on investments from the fluctuations arising from changes in market prices of securities held. Such fluctuations are included with the net realized and unrealized gains or losses from investments shown in the Statement of Operations.
For securities, which are subject to foreign withholding tax upon disposition, realized gains or losses on such securities are recorded net of foreign withholding tax.
Reported net realized foreign exchange gains or losses arise from sales of foreign currencies, currency gains or losses realized between the trade and settlement dates on securities transactions, the difference between the amounts of dividends, interest, and foreign withholding tax reclaims recorded on Fund’s books, and the U.S. dollar equivalent of the amounts actually received or paid. Net unrealized foreign exchange gains and losses arise from changes in the value of assets and liabilities other than investments in securities, resulting from changes in the exchange rate.
Allocation of Income, Expenses, Gains and Losses. Income, expenses (other than those attributable to a specific class), gains and losses are allocated on a daily basis to each class of shares based upon the relative proportion of net assets represented by such class. Operating expenses directly attributable to a specific class are charged against the operations of that class.
Dividends and Distributions to Shareholders. Dividends and distributions to shareholders, which are determined in accordance with income tax regulations and may differ from U.S. GAAP, are recorded on the ex-dividend date. Income and capital gain distributions, if any, are declared and paid annually or at other times as deemed necessary by the Manager.
Investment Income. Dividend income is recorded on the ex-dividend date or upon ex-dividend notification in the case of certain foreign dividends where the ex-dividend date may have passed. Non-cash dividends included in dividend income, if any, are recorded at the fair market value of the securities received. Interest income is recognized on an accrual basis. Discount and premium, which are included in interest income on the Statement of Operations, are amortized or accreted daily.
Return of Capital Estimates. Distributions received from the Fund’s investments in Master Limited Partnerships (MLPs) and Real Estate Investments Trusts (REITs), generally are comprised of income and return of capital. The Fund records investment income and return of capital based on estimates. Such estimates are based on historical information available from each MLP, REIT and other industry sources. These estimates may subsequently be revised based on information received from MLPs and REITs after their tax reporting periods are concluded.
Custodian Fees. “Custodian fees and expenses” in the Statement of Operations may include interest expense incurred by the Fund on any cash overdrafts of its custodian account during the period. Such cash overdrafts may result from the effects of failed trades in portfolio securities and from cash outflows resulting from unanticipated shareholder redemption activity. The Fund pays interest to its custodian on such cash overdrafts, to the extent they are not offset by positive cash balances maintained by the Fund, at a rate equal to the Federal Funds Rate plus 0.50%. This rate will increase to 2.00% effective January 1, 2017. The “Reduction to custodian expenses” line item, if applicable, represents earnings on cash balances maintained by the Fund during the period. Such interest expense and other custodian fees may be paid with these earnings.
24 OPPENHEIMER CONSERVATIVE BALANCED FUND/VA
2. Significant Accounting Policies (Continued)
Security Transactions. Security transactions are recorded on the trade date. Realized gains and losses on securities sold are determined on the basis of identified cost.
Indemnifications. The Fund’s organizational documents provide current and former Trustees and officers with a limited indemnification against liabilities arising in connection with the performance of their duties to the Fund. In the normal course of business, the Fund may also enter into contracts that provide general indemnifications. The Fund’s maximum exposure under these arrangements is unknown as this would be dependent on future claims that may be made against the Fund. The risk of material loss from such claims is considered remote.
Federal Taxes. The Fund intends to comply with provisions of the Internal Revenue Code applicable to regulated investment companies and to distribute substantially all of its investment company taxable income, including any net realized gain on investments not offset by capital loss carryforwards, if any, to shareholders. Therefore, no federal income or excise tax provision is required. The Fund files income tax returns in U.S. federal and applicable state jurisdictions. The statute of limitations on the Fund’s tax return filings generally remains open for the three preceding fiscal reporting period ends. The Fund has analyzed its tax positions for the fiscal year ended December 31, 2016, including open tax years, and does not believe there are any uncertain tax positions requiring recognition in the Fund’s financial statements.
The tax components of capital shown in the following table represent distribution requirements the Fund must satisfy under the income tax regulations, losses the Fund may be able to offset against income and gains realized in future years and unrealized appreciation or depreciation of securities and other investments for federal income tax purposes.
| | | | | | | | | | | | |
Undistributed Net Investment Income | | Undistributed
Long-Term
Gain | | | Accumulated
Loss
Carryforward1,2,3,4,5 | | | Net Unrealized
Appreciation
Based on cost of
Securities and
Other Investments
for Federal Income
Tax Purposes | |
| |
$4,167,690 | | | $— | | | | $6,446,399 | | | | $10,513,894 | |
1. At period end, the Fund had $5,261,675 of net capital loss carryforward available to offset future realized capital gains, if any, and thereby reduce future taxable gain distributions. Details of the capital loss carryforwards are included in the table below. Capital loss carryovers with no expiration, if any, must be utilized prior to those with expiration dates.
| | | | |
| Expiring | | | |
| |
2017 | | $ | 5,261,675 | |
2. At period end, the Fund had $1,184,042 of post-October losses available to offset future realized capital gains, if any.
3. The Fund had $682 of straddle losses which were deferred.
4. During the reporting period, the Fund utilized $6,632,281 of capital loss carryforward to offset capital gains realized in that fiscal year.
5. During the previous reporting period, the Fund utilized $7,633,681 of capital loss carryforward to offset capital gains realized in that fiscal year.
Net investment income (loss) and net realized gain (loss) may differ for financial statement and tax purposes. The character of dividends and distributions made during the fiscal year from net investment income or net realized gains are determined in accordance with federal income tax requirements, which may differ from the character of net investment income or net realized gains presented in those financial statements in accordance with U.S. GAAP. Also, due to timing of dividends and distributions, the fiscal year in which amounts are distributed may differ from the fiscal year in which the income or net realized gain was recorded by the Fund.
Accordingly, the following amounts have been reclassified for the reporting period. Net assets of the Fund were unaffected by the reclassifications.
| | | | | | | | |
Increase to Paid-in Capital | | Increase
to Accumulated
Net Investment
Income | | | Increase
to Accumulated Net
Realized Loss on Investments | |
| |
$58 | | | $270,907 | | | | $270,965 | |
The tax character of distributions paid during the reporting periods:
| | | | | | | | |
| | | Year Ended
December 31, 2016 | | | Year Ended
December 31, 2015 | |
| |
Distributions paid from: | | | | | | | | |
Ordinary income | | $ | 5,370,336 | | | $ | 5,566,837 | |
The aggregate cost of securities and other investments and the composition of unrealized appreciation and depreciation of securities and other investments for federal income tax purposes at period end are noted in the following table. The primary difference between book and tax appreciation or depreciation of securities and other investments, if applicable, is attributable to the tax deferral of losses or tax realization of financial statement unrealized gain or loss.
25 OPPENHEIMER CONSERVATIVE BALANCED FUND/VA
NOTES TO FINANCIAL STATEMENTS Continued
2. Significant Accounting Policies (Continued)
| | | | |
Federal tax cost of securities | | $ | 224,537,883 | |
Federal tax cost of other investments | | | 27,897,535 | |
| | | | |
Total federal tax cost | | $ | 252,435,418 | |
| | | | |
Gross unrealized appreciation | | $ | 13,873,756 | |
Gross unrealized depreciation | | | (3,359,862) | |
| | | | |
Net unrealized appreciation | | $ | 10,513,894 | |
| | | | |
Certain foreign countries impose a tax on capital gains which is accrued by the Fund based on unrealized appreciation, if any, on affected securities. The tax is paid when the gain is realized.
Use of Estimates. The preparation of financial statements in conformity with U.S. GAAP requires management to make estimates and assumptions that affect the reported amounts of assets and liabilities and disclosure of contingent assets and liabilities at the date of the financial statements and the reported amounts of increases and decreases in net assets from operations during the reporting period. Actual results could differ from those estimates.
3. Securities Valuation
The Fund calculates the net asset value of its shares as of 4:00 P.M. Eastern time, on each day the New York Stock Exchange (the “Exchange”) is open for trading, except in the case of a scheduled early closing of the Exchange, in which case the Fund will calculate net asset value of the shares as of the scheduled early closing time of the Exchange.
The Fund’s Board has adopted procedures for the valuation of the Fund’s securities and has delegated the day-to-day responsibility for valuation determinations under those procedures to the Manager. The Manager has established a Valuation Committee which is responsible for determining a “fair valuation” for any security for which market quotations are not “readily available.” The Valuation Committee’s fair valuation determinations are subject to review, approval and ratification by the Fund’s Board at its next regularly scheduled meeting covering the calendar quarter in which the fair valuation was determined.
Valuation Methods and Inputs
Securities are valued using unadjusted quoted market prices, when available, as supplied primarily by third party pricing services or dealers.
The following methodologies are used to determine the market value or the fair value of the types of securities described below:
Equity securities traded on a securities exchange (including exchange-traded derivatives other than futures and futures options) are valued based on the official closing price on the principal exchange on which the security is traded, as identified by the Manager, prior to the time when the Fund’s assets are valued. If the official closing price is unavailable, the security is valued at the last sale price on the principal exchange on which it is traded. If the official closing price or last sales price for a foreign security is not available, the security is valued at the mean between the bid and asked price per the exchange or, if not available from the exchange, obtained from two dealers. If bid and asked prices are not available from either the exchange or two dealers, the security is valued by using one of the following methodologies (listed in order of priority): (1) a bid from the exchange, (2) the mean between the bid and asked price as provided by a single dealer, or (3) a bid from a single dealer.
Shares of a registered investment company that are not traded on an exchange are valued at that investment company’s net asset value per share.
Corporate and government debt securities (of U.S. or foreign issuers) and municipal debt securities, event-linked bonds, loans, mortgage-backed securities, collateralized mortgage obligations, and asset-backed securities are valued at the mean between the “bid” and “asked” prices utilizing evaluated prices obtained from third party pricing services or broker-dealers who may use matrix pricing methods to determine the evaluated prices.
Short-term money market type debt securities are valued at the mean between the “bid” and “asked” prices utilizing evaluated prices obtained from third party pricing services or broker-dealers.
Structured securities, swaps, swaptions, and other over-the-counter derivatives are valued utilizing evaluated prices obtained from third party pricing services or broker-dealers.
Futures contracts and futures options traded on a commodities or futures exchange will be valued at the final settlement price or official closing price on the principal exchange as reported by such principal exchange at its trading session ending at, or most recently prior to, the time when the Fund’s assets are valued.
A description of the standard inputs that may generally be considered by the third party pricing vendors in determining their evaluated prices is provided below.
| | |
| Security Type | | Standard inputs generally considered by third-party pricing vendors |
|
| Corporate debt, government debt, municipal, mortgage- backed and asset-backed securities | | Reported trade data, broker-dealer price quotations, benchmark yields, issuer spreads on comparable securities, the credit quality, yield, maturity, and other appropriate factors. |
|
| Loans | | Information obtained from market participants regarding reported trade data and broker-dealer price quotations. |
|
| Event-linked bonds | | Information obtained from market participants regarding reported trade data and broker-dealer price quotations. |
26 OPPENHEIMER CONSERVATIVE BALANCED FUND/VA
3. Securities Valuation (Continued)
| | |
| Security Type (Continued) | | Standard inputs generally considered by third-party pricing vendors |
|
| Structured securities | | Relevant market information such as the price of underlying financial instruments, stock market indices, foreign currencies, interest rate spreads, commodities, or the occurrence of other specific events. |
|
| Swaps | | Relevant market information, including underlying reference assets such as credit spreads, credit event probabilities, index values, individual security values, forward interest rates, variable interest rates, volatility measures, and forward currency rates. |
If a market value or price cannot be determined for a security using the methodologies described above, or if, in the “good faith” opinion of the Manager, the market value or price obtained does not constitute a “readily available market quotation,” or a significant event has occurred that would materially affect the value of the security, the security is fair valued either (i) by a standardized fair valuation methodology applicable to the security type or the significant event as previously approved by the Valuation Committee and the Fund’s Board or (ii) as determined in good faith by the Manager’s Valuation Committee. The Valuation Committee considers all relevant facts that are reasonably available, through either public information or information available to the Manager, when determining the fair value of a security. Fair value determinations by the Manager are subject to review, approval and ratification by the Fund’s Board at its next regularly scheduled meeting covering the calendar quarter in which the fair valuation was determined. Those fair valuation standardized methodologies include, but are not limited to, valuing securities at the last sale price or initially at cost and subsequently adjusting the value based on: changes in company specific fundamentals, changes in an appropriate securities index, or changes in the value of similar securities which may be further adjusted for any discounts related to security-specific resale restrictions. When possible, such methodologies use observable market inputs such as unadjusted quoted prices of similar securities, observable interest rates, currency rates and yield curves. The methodologies used for valuing securities are not necessarily an indication of the risks associated with investing in those securities nor can it be assured that the Fund can obtain the fair value assigned to a security if it were to sell the security.
To assess the continuing appropriateness of security valuations, the Manager, or its third party service provider who is subject to oversight by the Manager, regularly compares prior day prices, prices on comparable securities, and sale prices to the current day prices and challenges those prices exceeding certain tolerance levels with the third party pricing service or broker source. For those securities valued by fair valuations, whether through a standardized fair valuation methodology or a fair valuation determination, the Valuation Committee reviews and affirms the reasonableness of the valuations based on such methodologies and fair valuation determinations on a regular basis after considering all relevant information that is reasonably available.
Classifications
Each investment asset or liability of the Fund is assigned a level at measurement date based on the significance and source of the inputs to its valuation. Various data inputs are used in determining the value of each of the Fund’s investments as of the reporting period end. These data inputs are categorized in the following hierarchy under applicable financial accounting standards:
1) Level 1-unadjusted quoted prices in active markets for identical assets or liabilities (including securities actively traded on a securities exchange)
2) Level 2-inputs other than unadjusted quoted prices that are observable for the asset or liability (such as unadjusted quoted prices for similar assets and market corroborated inputs such as interest rates, prepayment speeds, credit risks, etc.)
3) Level 3-significant unobservable inputs (including the Manager’s own judgments about assumptions that market participants would use in pricing the asset or liability).
The inputs used for valuing securities are not necessarily an indication of the risks associated with investing in those securities.
The Fund classifies each of its investments in investment companies which are publicly offered as Level 1. Investment companies that are not publicly offered are measured using net asset value as a practical expedient, and are not classified in the fair value hierarchy.
The table below categorizes amounts that are included in the Fund’s Statement of Assets and Liabilities at period end based on valuation input level:
| | | | | | | | | | | | | | | | |
| | | Level 1— Unadjusted Quoted Prices | | | Level 2— Other Significant Observable Inputs | | | Level 3— Significant Unobservable Inputs | | | Value | |
| |
Assets Table | | | | | | | | | | | | | | | | |
Investments, at Value: | | | | | | | | | | | | | | | | |
Common Stocks | | | | | | | | | | | | | | | | |
Consumer Discretionary | | $ | 8,454,819 | | | $ | — | | | $ | — | | | $ | 8,454,819 | |
Consumer Staples | | | 6,943,980 | | | | — | | | | — | | | | 6,943,980 | |
Energy | | | 6,270,997 | | | | — | | | | — | | | | 6,270,997 | |
Financials | | | 12,502,416 | | | | — | | | | — | | | | 12,502,416 | |
Health Care | | | 9,891,214 | | | | — | | | | — | | | | 9,891,214 | |
Industrials | | | 9,809,649 | | | | — | | | | — | | | | 9,809,649 | |
Information Technology | | | 14,706,382 | | | | — | | | | — | | | | 14,706,382 | |
Materials | | | 3,032,924 | | | | — | | | | — | | | | 3,032,924 | |
Telecommunication Services | | | 1,614,110 | | | | — | | | | — | | | | 1,614,110 | |
Utilities | | | 2,669,200 | | | | — | | | | — | | | | 2,669,200 | |
Asset-Backed Securities | | | — | | | | 20,870,179 | | | | — | | | | 20,870,179 | |
27 OPPENHEIMER CONSERVATIVE BALANCED FUND/VA
NOTES TO FINANCIAL STATEMENTS Continued
3. Securities Valuation (Continued)
| | | | | | | | | | | | | | | | |
| | | Level 1— Unadjusted Quoted Prices | | | Level 2— Other Significant Observable Inputs | | | Level 3— Significant Unobservable Inputs | | | Value | |
| |
Investments, at Value: (Continued) | | | | | | | | | | | | | | | | |
Mortgage-Backed Obligations | | $ | — | | | $ | 62,897,674 | | | $ | 219,117 | | | $ | 63,116,791 | |
U.S. Government Obligations | | | — | | | | 1,236,902 | | | | — | | | | 1,236,902 | |
Non-Convertible Corporate Bonds and Notes | | | — | | | | 68,568,068 | | | | — | | | | 68,568,068 | |
Investment Company | | | 5,367,607 | | | | — | | | | — | | | | 5,367,607 | |
| | | | |
Total Investments, at Value | | | 81,263,298 | | | | 153,572,823 | | | | 219,117 | | | | 235,055,238 | |
Other Financial Instruments: | | | | | | | | | | | | | | | | |
Centrally cleared swaps, at value | | | — | | | | 127,718 | | | | — | | | | 127,718 | |
Futures contracts | | | 33,579 | | | | — | | | | — | | | | 33,579 | |
| | | | |
Total Assets | | $ | 81,296,877 | | | $ | 153,700,541 | | | $ | 219,117 | | | $ | 235,216,535 | |
| | | | |
| | | | |
Liabilities Table | | | | | | | | | | | | | | | | |
Other Financial Instruments: | | | | | | | | | | | | | | | | |
Futures contracts | | $ | (69,346 | ) | | $ | — | | | $ | — | | | $ | (69,346) | |
| | | | |
Total Liabilities | | $ | (69,346 | ) | | $ | — | | | $ | — | | | $ | (69,346) | |
| | | | |
Forward currency exchange contracts and futures contracts, if any, are reported at their unrealized appreciation/depreciation at measurement date, which represents the change in the contract’s value from trade date. All additional assets and liabilities included in the above table are reported at their market value at measurement date.
The table below shows the transfers between Level 2 and Level 3. The Fund’s policy is to recognize transfers in and transfers out as of the beginning of the reporting period.
| | | | | | | | |
| | | Transfers out of Level 2* | | | Transfers into Level 3* | |
| |
Assets Table | | | | | | | | |
Investments, at Value: | | | | | | | | |
Mortgage-Backed Obligations | | | $ (353,498) | | | | $ 353,498 | |
| | | | |
Total Assets | | | $ (353,498) | | | | $ 353,498 | |
| | | | |
* Transferred from Level 2 to Level 3 because of the lack of observable market data due to a decrease in market activity for these securities.
4. Investments and Risks
Investments in Affiliated Funds. The Fund is permitted to invest in other mutual funds advised by the Manager (“Affiliated Funds”). Affiliated Funds are open-end management investment companies registered under the 1940 Act, as amended. The Manager is the investment adviser of, and the Sub-Adviser provides investment and related advisory services to, the Affiliated Funds. When applicable, the Fund’s investments in Affiliated Funds are included in the Statement of Investments. Shares of Affiliated Funds are valued at their net asset value per share. As a shareholder, the Fund is subject to its proportional share of the Affiliated Funds’ expenses, including their management fee. The Manager will waive fees and/or reimburse Fund expenses in an amount equal to the indirect management fees incurred through the Fund’s investment in the Affiliated Funds.
Each of the Affiliated Funds in which the Fund invests has its own investment risks, and those risks can affect the value of the Fund’s investments and therefore the value of the Fund’s shares. To the extent that the Fund invests more of its assets in one Affiliated Fund than in another, the Fund will have greater exposure to the risks of that Affiliated Fund.
Investments in Money Market Instruments. The Fund is permitted to invest its free cash balances in money market instruments to provide liquidity or for defensive purposes. The Fund may invest in money market instruments by investing in Class E shares of Oppenheimer Institutional Government Money Market Fund (“IGMMF”), formerly known as Oppenheimer Institutional Money Market Fund, which is an Affiliated Fund. IGMMF is regulated as a money market fund under the 1940 Act, as amended. The Fund may also invest in money market instruments directly or in other affiliated or unaffiliated money market funds.
Master Limited Partnerships (“MLPs”). MLPs issue common units that represent an equity ownership interest in a partnership and provide limited voting rights. MLP common units are registered with the Securities and Exchange Commission (“SEC”), and are freely tradable on securities exchanges such as the NYSE and the NASDAQ Stock Market (“NASDAQ”), or in the over-the-counter (“OTC”) market. An MLP consists of one or more general partners, who conduct the business, and one or more limited partners, who contribute capital. MLP common unit holders have a limited role in the partnership’s operations and management. The Fund, as a limited partner, normally would not be liable for the debts of the MLP beyond the amounts the Fund has contributed, but would not be shielded to the same extent that a shareholder of a corporation would be. In certain circumstances creditors of an MLP would have the right to seek return of capital distributed to a limited partner. This right of an MLP’s creditors would continue after the Fund sold its investment in the MLP.
28 OPPENHEIMER CONSERVATIVE BALANCED FUND/VA
4. Investments and Risks (Continued)
Securities on a When-Issued or Delayed Delivery Basis. The Fund may purchase securities on a “when-issued” basis, and may purchase or sell securities on a “delayed delivery” basis. “When-issued” or “delayed delivery” refers to securities whose terms and indenture are available and for which a market exists, but which are not available for immediate delivery. Delivery and payment for securities that have been purchased by the Fund on a when-issued basis normally takes place within six months and possibly as long as two years or more after the trade date. During this period, such securities do not earn interest, are subject to market fluctuation and may increase or decrease in value prior to their delivery. The purchase of securities on a when-issued basis may increase the volatility of the Fund’s net asset value to the extent the Fund executes such transactions while remaining substantially fully invested. When the Fund engages in when-issued or delayed delivery transactions, it relies on the buyer or seller, as the case may be, to complete the transaction. Their failure to do so may cause the Fund to lose the opportunity to obtain or dispose of the security at a price and yield it considers advantageous. The Fund may also sell securities that it purchased on a when-issued basis or forward commitment prior to settlement of the original purchase.
At period end, the Fund had purchased securities issued on a when-issued or delayed delivery basis and sold securities issued on a delayed delivery basis as follows:
| | | | |
| | | When-Issued or
Delayed Delivery
Basis Transactions | |
| |
Purchased securities | | | $43,426,705 | |
Sold securities | | | 5,886,791 | |
The Fund may enter into “forward roll” transactions with respect to mortgage-related securities. In this type of transaction, the Fund sells a mortgage-related security to a buyer and simultaneously agrees to repurchase a similar security (same type, coupon and maturity) at a later date at a set price. During the period between the sale and the repurchase, the Fund will not be entitled to receive interest and principal payments on the securities that have been sold. The Fund records the incremental difference between the forward purchase and sale of each forward roll as realized gain (loss) on investments or as fee income in the case of such transactions that have an associated fee in lieu of a difference in the forward purchase and sale price.
Forward roll transactions may be deemed to entail embedded leverage since the Fund purchases mortgage-related securities with extended settlement dates rather than paying for the securities under a normal settlement cycle. This embedded leverage increases the Fund’s market value of investments relative to its net assets which can incrementally increase the volatility of the Fund’s performance. Forward roll transactions can be replicated over multiple settlement periods.
Risks of entering into forward roll transactions include the potential inability of the counterparty to meet the terms of the agreement; the potential of the Fund to receive inferior securities at redelivery as compared to the securities sold to the counterparty; and counterparty credit risk.
At period end, the Fund pledged $558,125 of collateral to the counterparty for forward roll transactions.
Equity Security Risk. Stocks and other equity securities fluctuate in price. The value of the Fund’s portfolio may be affected by changes in the equity markets generally. Equity markets may experience significant short-term volatility and may fall sharply at times. Different markets may behave differently from each other and U.S. equity markets may move in the opposite direction from one or more foreign stock markets. Adverse events in any part of the equity or fixed-income markets may have unexpected negative effects on other market segments.
The prices of individual equity securities generally do not all move in the same direction at the same time and a variety of factors can affect the price of a particular company’s securities. These factors may include, but are not limited to, poor earnings reports, a loss of customers, litigation against the company, general unfavorable performance of the company’s sector or industry, or changes in government regulations affecting the company or its industry.
Shareholder Concentration. At period end, one shareholder owned 20% or more of the Fund’s total outstanding shares.
The shareholder is a related party of the Fund. Related parties may include, but are not limited to, the investment manager and its affiliates, affiliated broker dealers, fund of funds, and directors or employees. The related party owned 44% of the Fund’s total outstanding shares at period end.
5. Market Risk Factors
The Fund’s investments in securities and/or financial derivatives may expose the Fund to various market risk factors:
Commodity Risk. Commodity risk relates to the change in value of commodities or commodity indexes as they relate to increases or decreases in the commodities market. Commodities are physical assets that have tangible properties. Examples of these types of assets are crude oil, heating oil, metals, livestock, and agricultural products.
Credit Risk. Credit risk relates to the ability of the issuer of debt to meet interest and principal payments, or both, as they come due. In general, lower-grade, higher-yield debt securities are subject to credit risk to a greater extent than lower-yield, higher-quality securities.
Equity Risk. Equity risk relates to the change in value of equity securities as they relate to increases or decreases in the general market.
Foreign Exchange Rate Risk. Foreign exchange rate risk relates to the change in the U.S. dollar value of a security held that is denominated in a foreign currency. The U.S. dollar value of a foreign currency denominated security will decrease as the dollar appreciates against the currency, while the U.S. dollar value will increase as the dollar depreciates against the currency.
Interest Rate Risk. Interest rate risk refers to the fluctuations in value of fixed-income securities resulting from the inverse relationship between price and yield. For example, an increase in general interest rates will tend to reduce the market value of already issued fixed-income investments, and
29 OPPENHEIMER CONSERVATIVE BALANCED FUND/VA
NOTES TO FINANCIAL STATEMENTS Continued
5. Market Risk Factors (Continued)
a decline in general interest rates will tend to increase their value. In addition, debt securities with longer maturities, which tend to have higher yields, are subject to potentially greater fluctuations in value from changes in interest rates than obligations with shorter maturities.
Volatility Risk. Volatility risk refers to the magnitude of the movement, but not the direction of the movement, in a financial instrument’s price over a defined time period. Large increases or decreases in a financial instrument’s price over a relative time period typically indicate greater volatility risk, while small increases or decreases in its price typically indicate lower volatility risk.
6. Use of Derivatives
The Fund’s investment objective not only permits the Fund to purchase investment securities, it also allows the Fund to enter into various types of derivatives contracts, including, but not limited to, futures contracts, forward currency exchange contracts, credit default swaps, interest rate swaps, total return swaps, variance swaps and purchased and written options. In doing so, the Fund will employ strategies in differing combinations to permit it to increase, decrease, or change the level or types of exposure to market risk factors. These instruments may allow the Fund to pursue its objectives more quickly and efficiently than if it were to make direct purchases or sales of securities capable of effecting a similar response to market factors. Such contracts may be entered into through a bilateral over-the-counter (“OTC”) transaction, or through a securities or futures exchange and cleared through a clearinghouse.
Derivatives may have little or no initial cash investment relative to their market value exposure and therefore can produce significant gains or losses in excess of their cost due to unanticipated changes in the market risk factors and the overall market. This use of embedded leverage allows the Fund to increase its market value exposure relative to its net assets and can substantially increase the volatility of the Fund’s performance. In instances where the Fund is using derivatives to decrease, or hedge, exposures to market risk factors for securities held by the Fund, there are also risks that those derivatives may not perform as expected resulting in losses for the combined or hedged positions. Some derivatives have the potential for unlimited loss, regardless of the size of the Fund’s initial investment.
Additional associated risks from investing in derivatives also exist and potentially could have significant effects on the valuation of the derivative and the Fund. Typically, the associated risks are not the risks that the Fund is attempting to increase or decrease exposure to, per its investment objectives, but are the additional risks from investing in derivatives. Examples of these associated risks are liquidity risk, which is the risk that the Fund will not be able to sell the derivative in the open market in a timely manner, and counterparty credit risk, which is the risk that the counterparty will not fulfill its obligation to the Fund.
The Fund’s actual exposures to these market risk factors and associated risks during the period are discussed in further detail, by derivative type, below.
Futures Contracts
A futures contract is a commitment to buy or sell a specific amount of a commodity, financial instrument or currency at a negotiated price on a stipulated future date. The Fund may buy and sell futures contracts and may also buy or write put or call options on these futures contracts. Futures contracts and options thereon are generally entered into on a regulated futures exchange and cleared through a clearinghouse associated with the exchange.
Upon entering into a futures contract, the Fund is required to deposit either cash or securities (initial margin) in an amount equal to a certain percentage of the contract value in an account registered in the futures commission merchant’s name. Subsequent payments (variation margin) are paid to or from the futures commission merchant each day equal to the daily changes in the contract value. Such payments are recorded as unrealized gains and losses. Should the Fund fail to make requested variation margin payments, the futures commission merchant can gain access to the initial margin to satisfy the Fund’s payment obligations.
Futures contracts are reported on a schedule following the Statement of Investments. Securities held by a futures commission merchant to cover initial margin requirements on open futures contracts are noted in the Statement of Investments. Cash held by a futures commission merchant to cover initial margin requirements on open futures contracts and the receivable and/or payable for the daily mark to market for the variation margin are noted in the Statement of Assets and Liabilities. The net change in unrealized appreciation and depreciation is reported in the Statement of Operations. Realized gains (losses) are reported in the Statement of Operations at the closing or expiration of futures contracts.
The Fund has purchased futures contracts on various bonds and notes to increase exposure to interest rate risk.
The Fund has sold futures contracts on various bonds and notes to decrease exposure to interest rate risk.
During the reporting period, the Fund had an ending monthly average market value of $19,953,069 and $11,095,736 on futures contracts purchased and sold, respectively.
Additional associated risks of entering into futures contracts (and related options) include the possibility that there may be an illiquid market where the Fund is unable to liquidate the contract or enter into an offsetting position and, if used for hedging purposes, the risk that the price of the contract will correlate imperfectly with the prices of the Fund’s securities.
Option Activity
The Fund may buy and sell put and call options, or write put and call options. When an option is written, the Fund receives a premium and becomes obligated to sell or purchase the underlying security, currency or other underlying financial instrument at a fixed price, upon exercise of the option.
Options can be traded through an exchange or through a privately negotiated arrangement with a dealer in an OTC transaction. Options traded through an exchange are generally cleared through a clearinghouse (such as The Options Clearing Corporation). The difference between the premium received or paid, and market value of the option, is recorded as unrealized appreciation or depreciation. The net change in unrealized appreciation or
30 OPPENHEIMER CONSERVATIVE BALANCED FUND/VA
6. Use of Derivatives (Continued)
depreciation is reported in the Statement of Operations. When an option is exercised, the cost of the security purchased or the proceeds of the security sale are adjusted by the amount of premium received or paid. Upon the expiration or closing of the option transaction, a gain or loss is reported in the Statement of Operations.
The Fund has purchased call options on treasury and/or euro futures to increase exposure to interest rate risk. A purchased call option becomes more valuable as the price of the underlying financial instrument appreciates relative to the strike price.
The Fund has purchased put options on treasury and/or euro futures to decrease exposure to interest rate risk. A purchased put option becomes more valuable as the price of the underlying financial instrument depreciates relative to the strike price.
During the reporting period, the Fund had an ending monthly average market value of $49,414 and $4,637 on purchased call options and purchased put options, respectively.
Options written, if any, are reported in a schedule following the Statement of Investments and as a liability in the Statement of Assets and Liabilities. Securities held in collateral accounts to cover potential obligations with respect to outstanding written options are noted in the Statement of Investments.
The risk in writing a call option is that the market price of the security increases and if the option is exercised, the Fund must either purchase the security at a higher price for delivery or, if the Fund owns the underlying security, give up the opportunity for profit. The risk in writing a put option is that the Fund may incur a loss if the market price of the security decreases and the option is exercised. The risk in buying an option is that the Fund pays a premium whether or not the option is exercised. The Fund also has the additional risk that there may be an illiquid market where the Fund is unable to close the contract.
The Fund has written put options on treasury and/or euro futures to increase exposure to interest rate risk. A written put option becomes more valuable as the price of the underlying financial instrument appreciates relative to the strike price.
During the reporting period, the Fund had an ending monthly average market value of $3,759 on written put options.
At period end, the Fund had no purchased or written options outstanding.
Additional associated risks to the Fund include counterparty credit risk and liquidity risk.
Written option activity for the reporting period was as follows:
| | | | | | | | |
| | | Number of Contracts | | | Amount of
Premiums | |
| |
| Options outstanding as of December 31, 2015 | | | — | | | $ | — | |
Options written | | | 4,140,924 | | | | 66,162 | |
Options exercised | | | (4,140,924) | | | | (66,162) | |
| | | | |
| Options outstanding as of December 31, 2016 | | | — | | | $ | — | |
| | | | |
Swap Contracts
The Fund may enter into swap contract agreements with a counterparty to exchange a series of cash flows based on either specified reference rates, the price or volatility of asset or non-asset references, or the occurrence of a credit event, over a specified period. Swaps can be executed in a bi-lateral privately negotiated arrangement with a dealer in an OTC transaction (“OTC swaps”) or executed on a regulated market. Certain swaps, regardless of the venue of their execution, are required to be cleared through a clearinghouse (“centrally cleared swaps”). Swap contracts may include interest rate, equity, debt, index, total return, credit default, currency, and volatility swaps.
Swap contracts are reported on a schedule following the Statement of Investments. The values of centrally cleared swap and OTC swap contracts are aggregated by positive and negative values and disclosed separately on the Statement of Assets and Liabilities. The unrealized appreciation (depreciation) related to the change in the valuation of the notional amount of the swap is combined with the accrued interest due to (owed by) the Fund, if any, at termination or settlement. The net change in this amount during the period is included on the Statement of Operations. The Fund also records any periodic payments received from (paid to) the counterparty, including at termination, under such contracts as realized gain (loss) on the Statement of Operations.
Swap contract agreements are exposed to the market risk factor of the specific underlying reference rate or asset. Swap contracts are typically more attractively priced compared to similar investments in related cash securities because they isolate the risk to one market risk factor and eliminate the other market risk factors. Investments in cash securities (for instance bonds) have exposure to multiple risk factors (credit and interest rate risk). Because swaps have embedded leverage, they can expose the Fund to substantial risk in the isolated market risk factor.
Credit Default Swap Contracts. A credit default swap is a contract that enables an investor to buy or sell protection against a defined-issuer credit event, such as the issuer’s failure to make timely payments of interest or principal on a debt security, bankruptcy or restructuring. The Fund may enter into credit default swaps either by buying or selling protection on a corporate issuer, sovereign issuer, or a basket or index of issuers (the “reference asset”).
The buyer of protection pays a periodic fee to the seller of protection based on the notional amount of the swap contract. The seller of protection agrees to compensate the buyer of protection for future potential losses as a result of a credit event on the reference asset. The contract effectively transfers the credit event risk of the reference asset from the buyer of protection to the seller of protection.
The ongoing value of the contract will fluctuate throughout the term of the contract based primarily on the credit risk of the reference asset. If the credit quality of the reference asset improves relative to the credit quality at contract initiation, the buyer of protection may have an unrealized
31 OPPENHEIMER CONSERVATIVE BALANCED FUND/VA
NOTES TO FINANCIAL STATEMENTS Continued
6. Use of Derivatives (Continued)
loss greater than the anticipated periodic fee owed. This unrealized loss would be the result of current credit protection being cheaper than the cost of credit protection at contract initiation. If the buyer elects to terminate the contract prior to its maturity, and there has been no credit event, this unrealized loss will become realized. If the contract is held to maturity, and there has been no credit event, the realized loss will be equal to the periodic fee paid over the life of the contract.
If there is a credit event, the buyer of protection can exercise its rights under the contract and receive a payment from the seller of protection equal to the notional amount of the swap less the market value of specified debt securities issued by the reference asset. Upon exercise of the contract the difference between such value and the notional amount is recorded as realized gain (loss) and is included on the Statement of Operations.
The Fund has sold credit protection through credit default swaps to increase exposure to the credit risk of individual issuers and/or indexes of issuers that are either unavailable or considered to be less attractive in the bond market.
For the reporting period, the Fund had ending monthly average notional amounts of $158,462 on credit default swaps to sell protection.
Additional associated risks to the Fund include counterparty credit risk and liquidity risk.
Swaption Transactions
The Fund may enter into a swaption contract which grants the purchaser the right, but not the obligation, to enter into a swap transaction at preset terms detailed in the underlying agreement within a specified period of time. The purchaser pays a premium to the swaption writer who bears the risk of unfavorable changes in the preset terms on the underlying swap.
Purchased swaptions are reported as a component of investments in the Statement of Investments and the Statement of Assets and Liabilities. Written swaptions are reported on a schedule following the Statement of Investments and their value is reported as a separate asset or liability line item in the Statement of Assets and Liabilities. The net change in unrealized appreciation or depreciation on written swaptions is separately reported in the Statement of Operations. When a swaption is exercised, the cost of the swap is adjusted by the amount of premium paid or received. Upon the expiration or closing of an unexercised swaption contract, a gain or loss is reported in the Statement of Operations for the amount of the premium paid or received.
The Fund generally will incur a greater risk when it writes a swaption than when it purchases a swaption. When the Fund writes a swaption it will become obligated, upon exercise of the swaption, according to the terms of the underlying agreement. Swaption contracts written by the Fund do not give rise to counterparty credit risk prior to exercise as they obligate the Fund, not its counterparty, to perform. When the Fund purchases a swaption it only risks losing the amount of the premium it paid if the swaption expires unexercised. However, when the Fund exercises a purchased swaption there is a risk that the counterparty will fail to perform or otherwise default on its obligations under the swaption contract.
The Fund has purchased swaptions which gives it the option to buy credit protection through credit default swaps in order to decrease exposure to the credit risk of individual issuers and/or indexes of issuers. A purchased swaption of this type becomes more valuable as the likelihood of a credit event on the reference asset increases.
The Fund has written swaptions which give it the obligation, if exercised by the purchaser, to buy credit protection through credit default swaps in order to decrease exposure to the credit risk of individual issuers and/or, indexes of issuers. A written swaption of this type becomes more valuable as the likelihood of a credit event on the reference asset increases.
At period end, the Fund had no purchased or written swaptions outstanding.
During the reporting period, the Fund had an ending monthly average market value of $14,832 and $4,244 on purchased and written swaptions, respectively.
Written swaption activity for the reporting period was as follows:
| | | | | | | | |
| | | Notional Amount | | | Amount of
Premiums | |
| |
| Swaptions outstanding as of December 31, 2015 | | | — | | | $ | — | |
Swaptions written | | | 6,958,000 | | | | 37,155 | |
Swaptions closed or expired | | | (6,958,000) | | | | (37,155) | |
| | | | |
| Swaptions outstanding as of December 31, 2016 | | | — | | | $ | — | |
| | | | |
Counterparty Credit Risk. Derivative positions are subject to the risk that the counterparty will not fulfill its obligation to the Fund. The Fund intends to enter into derivative transactions with counterparties that the Manager believes to be creditworthy at the time of the transaction.
The Fund’s risk of loss from counterparty credit risk on OTC derivatives is generally limited to the aggregate unrealized gain netted against any collateral held by the Fund. For OTC options purchased, the Fund bears the risk of loss of the amount of the premiums paid plus the positive change in market values net of any collateral held by the Fund should the counterparty fail to perform under the contracts. Options written by the Fund do not typically give rise to counterparty credit risk, as options written generally obligate the Fund and not the counterparty to perform.
To reduce counterparty risk with respect to OTC transactions, the Fund has entered into master netting arrangements, established within the Fund’s International Swap and Derivatives Association, Inc. (“ISDA”) master agreements, which allow the Fund to make (or to have an entitlement to receive) a single net payment in the event of default (close-out netting) for outstanding payables and receivables with respect to certain OTC positions in swaps, options, swaptions, and forward currency exchange contracts for each individual counterparty. In addition, the Fund may require that certain counterparties post cash and/or securities in collateral accounts to cover their net payment obligations for those derivative contracts subject to ISDA master agreements. If the counterparty fails to perform under these contracts and agreements, the cash and/or securities will be made available to the Fund.
ISDA master agreements include credit related contingent features which allow counterparties to OTC derivatives to terminate derivative contracts
32 OPPENHEIMER CONSERVATIVE BALANCED FUND/VA
6. Use of Derivatives (Continued)
prior to maturity in the event that, for example, the Fund’s net assets decline by a stated percentage or the Fund fails to meet the terms of its ISDA master agreements, which would cause the Fund to accelerate payment of any net liability owed to the counterparty.
For financial reporting purposes, the Fund does not offset derivative assets and derivative liabilities that are subject to netting arrangements in the Statement of Assets and Liabilities. Bankruptcy or insolvency laws of a particular jurisdiction may impose restrictions on or prohibitions against the right of offset in bankruptcy, insolvency or other events.
The Fund’s risk of loss from counterparty credit risk on exchange-traded derivatives cleared through a clearinghouse and for centrally cleared swaps is generally considered lower than as compared to OTC derivatives. However, counterparty credit risk exists with respect to initial and variation margin deposited/paid by the Fund that is held in futures commission merchant, broker and/or clearinghouse accounts for such exchange-traded derivatives and for centrally cleared swaps.
With respect to centrally cleared swaps, such transactions will be submitted for clearing, and if cleared, will be held in accounts at futures commission merchants or brokers that are members of clearinghouses. While brokers, futures commission merchants and clearinghouses are required to segregate customer margin from their own assets, in the event that a broker, futures commission merchant or clearinghouse becomes insolvent or goes into bankruptcy and at that time there is a shortfall in the aggregate amount of margin held by the broker, futures commission merchant or clearinghouse for all its customers, U.S. bankruptcy laws will typically allocate that shortfall on a pro-rata basis across all the broker’s, futures commission merchant’s or clearinghouse’s customers, potentially resulting in losses to the Fund.
There is the risk that a broker, futures commission merchant or clearinghouse will decline to clear a transaction on the Fund’s behalf, and the Fund may be required to pay a termination fee to the executing broker with whom the Fund initially enters into the transaction. Clearinghouses may also be permitted to terminate centrally cleared swaps at any time. The Fund is also subject to the risk that the broker or futures commission merchant will improperly use the Fund’s assets deposited/paid as initial or variation margin to satisfy payment obligations of another customer. In the event of a default by another customer of the broker or futures commission merchant, the Fund might not receive its variation margin payments from the clearinghouse, due to the manner in which variation margin payments are aggregated for all customers of the broker/futures commission merchant.
Collateral and margin requirements differ by type of derivative. Margin requirements are established by the broker, futures commission merchant or clearinghouse for exchange-traded and cleared derivatives, including centrally cleared swaps. Brokers, futures commission merchants and clearinghouses can ask for margin in excess of the regulatory minimum, or increase the margin amount, in certain circumstances.
Collateral terms are contract specific for OTC derivatives. For derivatives traded under an ISDA master agreement, the collateral requirements are typically calculated by netting the mark to market amount for each transaction under such agreement and comparing that amount to the value of any collateral currently pledged by the Fund or the counterparty.
For financial reporting purposes, cash collateral that has been pledged to cover obligations of the Fund, if any, is reported separately on the Statement of Assets and Liabilities as cash pledged as collateral. Non-cash collateral pledged by the Fund, if any, is noted in the Statement of Investments. Generally, the amount of collateral due from or to a party must exceed a minimum transfer amount threshold (e.g. $250,000) before a transfer has to be made. To the extent amounts due to the Fund from its counterparties are not fully collateralized, contractually or otherwise, the Fund bears the risk of loss from counterparty nonperformance.
The following table presents the valuations of derivative instruments by risk exposure as reported within the Statement of Assets and Liabilities at period end:
| | | | | | | | | | | | |
| | | Asset Derivatives | | | Liability Derivatives | |
Derivatives Not Accounted for as Hedging Instruments | | Statement of Assets
and Liabilities Location | | Value | | | Statement of Assets
and Liabilities Location | | Value | |
| |
Credit contracts | | Centrally cleared swaps, at value | | $ | 127,718 | | | | | | | |
Interest rate contracts | | Variation margin receivable | | | 59,438 | * | | Variation margin payable | | $ | 9,055 | * |
| | | | | | | | | | | | |
Total | | | | $ | 187,156 | | | | | $ | 9,055 | |
| | | | | | | | | | | | |
* Includes only the current day’s variation margin. Prior variation margin movements have been reflected in cash on the Statement of Assets and Liabilities upon receipt or payment.
The effect of derivative instruments on the Statement of Operations is as follows:
| | | | | | | | | | | | | | | | | | | | |
Amount of Realized Gain or (Loss) Recognized on Derivatives | |
Derivatives Not Accounted for as Hedging Instruments | | Investment
from
unaffiliated
companies
(including
premiums
on options
exercised)* | | | Closing and
expiration
of swaption
contracts
written | | | Closing and
expiration
of futures
contracts | | | Swap contracts | | | Total | |
| |
Credit contracts | | $ | (110,842 | ) | | $ | 37,155 | | | | $ — | | | | $ (3,290) | | | $ | (76,977) | |
Interest rate contracts | | | 181,398 | | | | — | | | | (57,460) | | | | — | | | | 123,938 | |
| | | | |
Total | | $ | 70,556 | | | $ | 37,155 | | | | $ (57,460) | | | | $ (3,290) | | | $ | 46,961 | |
| | | | |
33 OPPENHEIMER CONSERVATIVE BALANCED FUND/VA
NOTES TO FINANCIAL STATEMENTS Continued
6. Use of Derivatives (Continued)
*Includes purchased options contracts, purchased swaption contracts, written options contracts exercised and written swaption contracts exercised, if any.
| | | | | | | | | | | | |
Amount of Change in Unrealized Gain or (Loss) Recognized on Derivatives | |
Derivatives Not Accounted for as Hedging Instruments | | Futures
contracts | | | Swap contracts | | | Total | |
| |
Credit contracts | | | $ — | | | | $ (843) | | | | $ (843) | |
Interest rate contracts | | | (62,412) | | | | — | | | | (62,412) | |
| | | | |
Total | | | $ (62,412) | | | | $ (843) | | | | $ (63,255) | |
| | | | |
7. Shares of Beneficial Interest
The Fund has authorized an unlimited number of $0.001 par value shares of beneficial interest of each class. Transactions in shares of beneficial interest were as follows:
| | | | | | | | | | | | | | | | |
| | | Year Ended December 31, 2016 | | Year Ended December 31, 2015 |
| | | Shares | | Amount | | Shares | | Amount | |
| |
Non-Service Shares | | | | | | | | | | | | | | | | |
Sold | | | 180,594 | | | $ | 2,654,702 | | | | 192,335 | | | $ | 2,822,887 | |
Dividends and/or distributions reinvested | | | 289,075 | | | | 4,214,715 | | | | 299,338 | | | | 4,370,338 | |
Redeemed | | | (1,468,409) | | | | (21,559,020) | | | | (1,759,489) | | | | (25,932,576) | |
| | | | |
Net decrease | | | (998,740) | | | $ | (14,689,603) | | | | (1,267,816) | | | $ | (18,739,351) | |
| | | | |
| | | | | | | | | | | | | | | | |
| |
Service Shares | | | | | | | | | | | | | | | | |
Sold | | | 707,970 | | | $ | 10,153,873 | | | | 228,285 | | | $ | 3,296,473 | |
Dividends and/or distributions reinvested | | | 80,196 | | | | 1,155,621 | | | | 82,918 | | | | 1,196,499 | |
Redeemed | | | (918,852) | | | | (13,350,668) | | | | (1,062,479) | | | | (15,384,640) | |
| | | | |
Net decrease | | | (130,686) | | | $ | (2,041,174) | | | | (751,276) | | | $ | (10,891,668) | |
| | | | |
8. Purchases and Sales of Securities
The aggregate cost of purchases and proceeds from sales of securities, other than short-term obligations and investments in IGMMF, for the reporting period were as follows:
| | | | | | | | | | | | |
| | | Purchases | | | | | | Sales | |
| |
Investment securities | | | $133,833,990 | | | | | | | | $152,263,256 | |
U.S. government and government agency obligations | | | 1,591,266 | | | | | | | | 1,960,893 | |
To Be Announced (TBA) mortgage-related securities | | | 737,550,642 | | | | | | | | 742,753,245 | |
9. Fees and Other Transactions with Affiliates
Management Fees. Under the investment advisory agreement, the Fund pays the Manager a management fee based on the daily net assets of the Fund at an annual rate as shown in the following table:
| | | | |
Fee Schedule | |
Up to $200 million | | | 0.75% | |
Next $200 million | | | 0.72 | |
Next $200 million | | | 0.69 | |
Next $200 million | | | 0.66 | |
Over $800 million | | | 0.60 | |
The Fund’s effective management fee for the reporting period was 0.75% of average annual net assets before any applicable waivers.
Sub-Adviser Fees. The Manager has retained the Sub-Adviser to provide the day-to-day portfolio management of the Fund. Under the Sub-Advisory Agreement, the Manager pays the Sub-Adviser an annual fee in monthly installments, equal to a percentage of the investment management fee collected by the Manager from the Fund, which shall be calculated after any investment management fee waivers. The fee paid to the Sub-Adviser is paid by the Manager, not by the Fund.
Transfer Agent Fees. OFI Global (the “Transfer Agent”) serves as the transfer and shareholder servicing agent for the Fund. The Fund pays the Transfer Agent a fee based on annual net assets. Fees incurred and average net assets for each class with respect to these services are detailed in the Statement of Operations and Financial Highlights, respectively.
Sub-Transfer Agent Fees. The Transfer Agent has retained Shareholder Services, Inc., a wholly-owned subsidiary of OFI (the “Sub-Transfer Agent”),
34 OPPENHEIMER CONSERVATIVE BALANCED FUND/VA
9. Fees and Other Transactions with Affiliates (Continued)
to provide the day-to-day transfer agent and shareholder servicing of the Fund. Under the Sub-Transfer Agency Agreement, the Transfer Agent pays the Sub-Transfer Agent an annual fee in monthly installments, equal to a percentage of the transfer agent fee collected by the Transfer Agent from the Fund, which shall be calculated after any applicable fee waivers. The fee paid to the Sub-Transfer Agent is paid by the Transfer Agent, not by the Fund.
Trustees’ Compensation. The Fund’s Board of Trustees (“Board”) has adopted a compensation deferral plan for Independent Trustees that enables Trustees to elect to defer receipt of all or a portion of the annual compensation they are entitled to receive from the Fund. For purposes of determining the amount owed to the Trustees under the plan, deferred amounts are treated as though equal dollar amounts had been invested in shares of the Fund or in other Oppenheimer funds selected by the Trustees. The Fund purchases shares of the funds selected for deferral by the Trustees in amounts equal to his or her deemed investment, resulting in a Fund asset equal to the deferred compensation liability. Such assets are included as a component of “Other” within the asset section of the Statement of Assets and Liabilities. Deferral of Trustees’ fees under the plan will not affect the net assets of the Fund and will not materially affect the Fund’s assets, liabilities or net investment income per share. Amounts will be deferred until distributed in accordance with the compensation deferral plan.
Distribution and Service Plan for Service Shares. The Fund has adopted a Distribution and Service Plan (the “Plan”) pursuant to Rule 12b-1 under the 1940 Act for Service shares to pay OppenheimerFunds Distributor, Inc. (the “Distributor”), for distribution related services, personal service and account maintenance for the Fund’s Service shares. Under the Plan, payments are made periodically at an annual rate of 0.25% of the daily net assets of Service shares of the Fund. The Distributor currently uses all of those fees to compensate sponsors of the insurance product that offers Fund shares, for providing personal service and maintenance of accounts of their variable contract owners that hold Service shares. These fees are paid out of the Fund’s assets on an on-going basis and increase operating expenses of the Service shares, which results in lower performance compared to the Fund’s shares that are not subject to a service fee. Fees incurred by the Fund under the Plan are detailed in the Statement of Operations.
Waivers and Reimbursements of Expenses. The Manager has contractually agreed to limit the Fund’s expenses after payments, waivers and/or reimbursements and reduction to custodian expenses, excluding any applicable dividend expense, taxes, interest and fees from borrowing, any subsidiary expenses, Acquired Fund Fees and Expenses, brokerage commissions, unusual and infrequent expenses and certain other Fund expenses; so that those expenses, as percentages of daily net assets, will not exceed the annual rate of 0.67% for Non-Service shares and 0.92% for Service shares. During the reporting period, the Manager waived fees and/or reimbursed the Fund $469,065 and $142,509 for Non-Service and Service shares, respectively.
The Manager will waive fees and/or reimburse Fund expenses in an amount equal to the indirect management fees incurred through the Fund’s investment in IGMMF. During the reporting period, the Manager waived fees and/or reimbursed the Fund $5,384 for IGMMF management fees.
Waivers and/or reimbursements may be modified or terminated as set forth according to the terms in the prospectus.
10. Borrowings and Other Financing
Joint Credit Facility. A number of mutual funds managed by the Manager participate in a $1.3 billion revolving credit facility (the “Facility”) intended to provide short-term financing, if necessary, subject to certain restrictions in connection with atypical redemption activity. Expenses and fees related to the Facility are paid by the participating funds and are disclosed separately or as other expenses on the Statement of Operations. The Fund did not utilize the Facility during the reporting period.
11. Pending Litigation
In 2009, several putative class action lawsuits were filed and later consolidated before the U.S. District Court for the District of Colorado in connection with the investment performance of Oppenheimer Rochester California Municipal Fund (the “California Fund”), a fund advised by OppenheimerFunds, Inc. (“OFI”) and distributed by OppenheimerFunds Distributor, Inc. (“OFDI”). The plaintiffs asserted claims against OFI, OFDI and certain present and former trustees and officers of the California Fund under the federal securities laws, alleging, among other things, that the disclosure documents of the California Fund contained misrepresentations and omissions and the investment policies of the California Fund were not followed. An amended complaint and a motion to dismiss were filed, and in 2011, the court issued an order which granted in part and denied in part the defendants’ motion to dismiss. In October 2015, following a successful appeal by defendants and a subsequent hearing, the court granted plaintiffs’ motion for class certification and appointed class representatives and class counsel.
OFI and OFDI believe the suit is without merit; that it is premature to render any opinion as to the likelihood of an outcome unfavorable to them in the suit; and that no estimate can yet be made as to the amount or range of any potential loss. Furthermore, OFI believes that the suit should not impair the ability of OFI or OFDI to perform their respective duties to the Fund and that the outcome of the suit should not have any material effect on the operations of any of the Oppenheimer funds.
35 OPPENHEIMER CONSERVATIVE BALANCED FUND/VA
REPORT OF INDEPENDENT REGISTERED PUBLIC ACCOUNTING FIRM
The Board of Trustees and Shareholders of Oppenheimer Variable Account Funds:
We have audited the accompanying statement of assets and liabilities of Oppenheimer Conservative Balanced Fund/VA (a separate series of Oppenheimer Variable Account Funds), including the statement of investments, as of December 31, 2016, and the related statement of operations for the year then ended, the statements of changes in net assets for each of the years in the two-year period then ended, and the financial highlights for each of the years in the five-year period then ended. These financial statements and financial highlights are the responsibility of the Fund’s management. Our responsibility is to express an opinion on these financial statements and financial highlights based on our audits.
We conducted our audits in accordance with the standards of the Public Company Accounting Oversight Board (United States). Those standards require that we plan and perform the audit to obtain reasonable assurance about whether the financial statements and financial highlights are free of material misstatement. An audit includes examining, on a test basis, evidence supporting the amounts and disclosures in the financial statements. Our procedures included confirmation of securities owned as of December 31, 2016, by correspondence with the custodian, transfer agent and brokers, or by other appropriate auditing procedures where replies from brokers were not received. An audit also includes assessing the accounting principles used and significant estimates made by management, as well as evaluating the overall financial statement presentation. We believe that our audits provide a reasonable basis for our opinion.
In our opinion, the financial statements and financial highlights referred to above present fairly, in all material respects, the financial position of Oppenheimer Conservative Balanced Fund/VA as of December 31, 2016, the results of its operations for the year then ended, the changes in its net assets for each of the years in the two-year period then ended, and the financial highlights for each of the years in the five-year period then ended, in conformity with U.S. generally accepted accounting principles.
KPMGLLP
Denver, Colorado
February 15, 2017
36 OPPENHEIMER CONSERVATIVE BALANCED FUND/VA
FEDERAL INCOME TAX INFORMATION
In early 2017, if applicable, shareholders of record received information regarding all dividends and distributions paid to them by the Fund during calendar year 2016.
Dividends, if any, paid by the Fund during the reporting period which are not designated as capital gain distributions should be multiplied by the maximum amount allowable but not less than 27.71% to arrive at the amount eligible for the corporate dividend-received deduction.
The foregoing information is presented to assist shareholders in reporting distributions received from the Fund to the Internal Revenue Service. Because of the complexity of the federal regulations which may affect your individual tax return and the many variations in state and local tax regulations, we recommend that you consult your tax advisor for specific guidance.
37 OPPENHEIMER CONSERVATIVE BALANCED FUND/VA
BOARD APPROVAL OF THE FUND’S INVESTMENT ADVISORY AND SUB-ADVISORY AGREEMENTS Unaudited
The Fund has entered into an investment advisory agreement with OFI Global Asset Management, Inc. (“OFI Global” or the “Adviser”), a wholly-owned subsidiary of OppenheimerFunds, Inc. (“OFI” or the “Sub-Adviser”) (“OFI Global” and “OFI” together the “Managers”) and OFI Global has entered into a sub-advisory agreement with OFI whereby OFI provides investment sub-advisory services to the Fund (collectively, the “Agreements”). Each year, the Board of Trustees (the “Board”), including a majority of the independent Trustees, is required to determine whether to approve the terms of the Agreements and the renewal thereof. The Investment Company Act of 1940, as amended, requires that the Board request and evaluate, and that the Managers provide, such information as may be reasonably necessary to evaluate the terms of the Agreements. The Board employs an independent consultant to prepare a report that provides information, including comparative information that the Board requests for that purpose. In addition to in-person meetings focused on this evaluation, the Board receives information throughout the year regarding Fund services, fees, expenses and performance.
The Managers and the independent consultant provided information to the Board on the following factors: (i) the nature, quality and extent of the Managers’ services, (ii) the comparative investment performance of the Fund and the Managers, (iii) the fees and expenses of the Fund, including comparative fee and expense information, (iv) the profitability of the Managers and their affiliates, including an analysis of the cost of providing services, (v) whether economies of scale are realized as the Fund grows and whether fee levels reflect these economies of scale for Fund investors and (vi) other benefits to the Managers from their relationship with the Fund. The Board was aware that there are alternatives to retaining the Managers.
Outlined below is a summary of the principal information considered by the Board as well as the Board’s conclusions.
Nature, Quality and Extent of Services. The Board considered information about the nature, quality and extent of the services provided to the Fund and information regarding the Managers’ key personnel who provide such services. The Managers’ duties include providing the Fund with the services of the portfolio managers and the Sub-Adviser’s investment team, who provide research, analysis and other advisory services in regard to the Fund’s investments; and securities trading services. OFI Global is responsible for oversight of third-party service providers; monitoring compliance with applicable Fund policies and procedures and adherence to the Fund’s investment restrictions; risk management; and oversight of the Sub-Adviser. OFI Global is also responsible for providing certain administrative services to the Fund. Those services include providing and supervising all administrative and clerical personnel who are necessary in order to provide effective corporate administration for the Fund; compiling and maintaining records with respect to the Fund’s operations; preparing and filing reports required by the U.S. Securities and Exchange Commission; preparing periodic reports regarding the operations of the Fund for its shareholders; preparing proxy materials for shareholder meetings; and preparing the registration statements required by federal and state securities laws for the sale of the Fund’s shares. OFI Global also provides the Fund with office space, facilities and equipment.
The Board also considered the quality of the services provided and the quality of the Managers’ resources that are available to the Fund. The Board took account of the fact that the Sub-Adviser has over fifty years of experience as an investment adviser and that its assets under management rank it among the top mutual fund managers in the United States. The Board evaluated the Managers’ advisory, administrative, accounting, legal, compliance and risk management services, and information the Board has received regarding the experience and professional qualifications of the Managers’ key personnel and the size and functions of its staff. In its evaluation of the quality of the portfolio management services provided, the Board considered the experience of Krishna Memani and Magnus Krantz, the portfolio managers for the Fund, and the Sub-Adviser’s investment team and analysts. The Board members also considered the totality of their experiences with the Managers as directors or trustees of the Fund and other funds advised by the Managers. The Board considered information regarding the quality of services provided by affiliates of the Managers, which the Board members have become knowledgeable about through their experiences with the Managers and in connection with the renewal of the Fund’s service agreements. The Board concluded, in light of the Managers’ experience, reputation, personnel, operations and resources that the Fund benefits from the services provided under the Agreements.
Investment Performance of the Managers and the Fund. Throughout the year, the Managers provided information on the investment performance of the Fund, the Adviser and the Sub-Adviser, including comparative performance information. The Board also reviewed information, prepared by the Managers and by the independent consultant, comparing the Fund’s historical performance to relevant market indices and to the performance of other conservative allocation funds underlying variable insurance products. The Board considered that the Fund outperformed its performance category during the one-, three- and five-year periods, but underperformed for the ten-year period.
Fees and Expenses of the Fund. The Board reviewed the fees paid to the Adviser and the other expenses borne by the Fund. The Board noted that the Adviser, not the Fund, pays the Sub-Adviser’s fee under the sub-advisory agreement. The independent consultant provided comparative data in regard to the fees and expenses of the Fund and other conservative allocation funds underlying variable insurance products. In reviewing the fees and expenses charged to the VA funds, the Board considered the Adviser’s assertion that, because there is much greater disparity in the fees and services that may be provided by a manager to a VA fund as opposed to a retail fund, when comparing the expenses of the various VA funds to those of retail funds, it is most appropriate to focus on total expenses (rather than on the management fees). Accordingly, while the Board reviewed and considered all expenses, it focused on total expenses. The Board considered that the Fund’s total expenses, net of waivers, were lower than its peer group median and category median. The Board also considered that the Fund’s contractual management fee was lower than its peer group median and higher than its category median. The Board noted that the Adviser has contractually agreed to limit the Fund’s total annual operating expenses so that those expenses, as percentages of daily net assets, will not exceed the annual rate of 0.67% for Non-Service Shares and 0.92% for Service Shares. This contractual expense limitation may not be amended or withdrawn until one year after the date of the Fund’s prospectus, unless approved by the Board.
Economies of Scale and Profits Realized by the Managers. The Board considered information regarding the Managers’ costs in serving as the Fund’s investment adviser and sub-adviser, including the costs associated with the personnel and systems necessary to manage the Fund, and information regarding the Managers’ profitability from their relationship with the Fund. The Board also considered that the Managers must be able to pay and retain experienced professional personnel at competitive rates to provide quality services to the Fund. The Board reviewed whether the Managers may realize economies of scale in managing and supporting the Fund. The Board noted that the Fund currently has management fee breakpoints, which are intended to share with Fund shareholders economies of scale that may exist as the Fund’s assets grow.
Other Benefits to the Managers. In addition to considering the profits realized by the Managers, the Board considered information that was
38 OPPENHEIMER CONSERVATIVE BALANCED FUND/VA
BOARD APPROVAL OF THE FUND’S INVESTMENT ADVISORY AND SUB-ADVISORY AGREEMENTS Unaudited / Continued
provided regarding the direct and indirect benefits the Managers receive as a result of their relationship with the Fund, including compensation paid to the Managers’ affiliates and research provided to the Adviser in connection with permissible brokerage arrangements (soft dollar arrangements).
Conclusions. These factors were also considered by the independent Trustees meeting separately from the full Board, assisted by experienced counsel to the Fund and to the independent Trustees. Fund counsel and the independent Trustees’ counsel are independent of the Managers within the meaning and intent of the Securities and Exchange Commission Rules.
Based on its review of the information it received and its evaluations described above, the Board, including a majority of the independent Trustees, decided to continue the Agreements through August 31, 2017. In arriving at its decision, the Board did not identify any factor or factors as being more important than others, but considered all of the above information, and considered the terms and conditions of the Agreements, including the management fees, in light of all the surrounding circumstances.
39 OPPENHEIMER CONSERVATIVE BALANCED FUND/VA
PORTFOLIO PROXY VOTING POLICIES AND GUIDELINES; UPDATES TO STATEMENTS OF INVESTMENTS Unaudited
The Fund has adopted Portfolio Proxy Voting Policies and Guidelines under which the Fund votes proxies relating to securities (“portfolio proxies”) held by the Fund. A description of the Fund’s Portfolio Proxy Voting Policies and Guidelines is available (i) without charge, upon request, by calling the Fund toll-free at 1.800.525.7048, (ii) on the Fund’s website at www.oppenheimerfunds.com, and (iii) on the SEC’s website at www.sec.gov. In addition, the Fund is required to file Form N-PX, with its complete proxy voting record for the 12 months ended June 30th, no later than August 31st of each year. The Fund’s voting record is available (i) without charge, upon request, by calling the Fund toll-free at 1.800.525.7048, and (ii) in the Form N-PX filing on the SEC’s website at www.sec.gov.
The Fund files its complete schedule of portfolio holdings with the SEC for the first quarter and the third quarter of each fiscal year on Form N-Q. The Fund’s Form N-Q filings are available on the SEC’s website at www.sec.gov. Those forms may be reviewed and copied at the SEC’s Public Reference Room in Washington, D.C. Information on the operation of the Public Reference Room may be obtained by calling 1-800-SEC-0330.
40 �� OPPENHEIMER CONSERVATIVE BALANCED FUND/VA
TRUSTEES AND OFFICERS Unaudited
| | |
| Name, Position(s) Held with the Fund, Length of Service, Age | | Principal Occupation(s) During the Past 5 Years; Other Trusteeships/Directorships Held; Number of Portfolios in the Fund Complex Currently Overseen |
| |
| INDEPENDENT TRUSTEES | | The address of each Trustee in the chart below is 6803 S. Tucson Way, Centennial, Colorado 80112-3924. Each Trustee serves for an indefinite term, or until his or her resignation, retirement, death or removal. |
| |
Robert J. Malone, Chairman of the Board of Trustees (since 2016), Trustee (since 2002) Year of Birth: 1944 | | Chairman - Colorado Market of MidFirst Bank (since January 2015); Chairman of the Board (2012-2016) and Director (August 2005-March 2016) of Jones International University (educational organization); Trustee of the Gallagher Family Foundation (non-profit organization) (2000-2015); Chairman, Chief Executive Officer and Director of Steele Street Bank Trust (commercial banking) (August 2003-January 2015); Board of Directors of Opera Colorado Foundation (non-profit organization) (2008- 2012); Director of Colorado UpLIFT (charitable organization) (1986-2010); Director of Jones Knowledge, Inc. (2006-2010); Former Chairman of U.S. Bank-Colorado (subsidiary of U.S. Bancorp and formerly Colorado National Bank) (July 1996-April 1999); Director of Commercial Assets, Inc. (real estate investment trust) (1993-2000); Director of U.S. Exploration, Inc. (oil and gas exploration) (1997-February 2004); Chairman of the Board (1991-1994) and Trustee (1985-1994) of Regis University; and Chairman of the Board (1990-1991) and Trustee (1984-1999) of Young Presidents Organization. Oversees 47 portfolios in the OppenheimerFunds complex. Mr. Malone has served on the Boards of certain Oppenheimer funds since 2002, during which time he has become familiar with the Fund’s (and other Oppenheimer funds’) financial, accounting, regulatory and investment matters and has contributed to the Boards’ deliberations. |
| |
Jon S. Fossel, Trustee (since 1990) Year of Birth: 1942 | | Chairman of the Board of Jack Creek Preserve Foundation (non-profit organization) (since March 2005); Director of Jack Creek Preserve Foundation (non-profit organization) (March 2005-December 2014); Chairman of the Board (2006-December 2011) and Director (June 2002-December 2011) of UNUMProvident (insurance company); Director of Northwestern Energy Corp. (public utility corporation) (November 2004-December 2009); Director of P.R. Pharmaceuticals (October 1999-October 2003); Director of Rocky Mountain Elk Foundation (non-profit organization) (February 1998-February 2003 and February 2005-February 2007); Chairman and Director (until October 1996) and President and Chief Executive Officer (until October 1995) of OppenheimerFunds, Inc.; President, Chief Executive Officer and Director of the following: Oppenheimer Acquisition Corp. (“OAC”) (parent holding company of OppenheimerFunds, Inc.), Shareholders Services, Inc. and Shareholder Financial Services, Inc. (until October 1995). Oversees 47 portfolios in the OppenheimerFunds complex. Mr. Fossel has served on the Boards of certain Oppenheimer funds since 1990, during which time he has become familiar with the Fund’s (and other Oppenheimer funds’) financial, accounting, regulatory and investment matters and has contributed to the Boards’ deliberations. |
| |
Richard F. Grabish, Trustee (since 2012) Year of Birth: 1948 | | Formerly Senior Vice President and Assistant Director of Sales and Marketing (March 1997-December 2007), Director (March 1987-December 2007) and Manager of Private Client Services (June 1985-June 2005) of A.G. Edwards & Sons, Inc. (broker/dealer and investment firm); Chairman and Chief Executive Officer of A.G. Edwards Trust Company, FSB (March 2001-December 2007); President and Vice Chairman of A.G. Edwards Trust Company, FSB (investment adviser) (April 1987-March 2001); President of A.G. Edwards Trust Company, FSB (investment adviser) (June 2005-December 2007). Oversees 47 portfolios in the OppenheimerFunds complex. Mr. Grabish has served on the Boards of certain Oppenheimer funds since 2001, during which time he has become familiar with the Fund’s (and other Oppenheimer funds’) financial, accounting, regulatory and investment matters and has contributed to the Boards’ deliberations. |
| |
Beverly L. Hamilton, Trustee (since 2002) Year of Birth: 1946 | | Trustee of Monterey Institute for International Studies (educational organization) (2000-2014); Board Member of Middlebury College (educational organization) (December 2005-June 2011); Chairman (2010-2016) of American Funds’ Emerging Markets Growth Fund, Inc. (mutual fund); Director of The California Endowment (philanthropic organization) (April 2002-April 2008); Director (February 2002-2005) and Chairman of Trustees (2006-2007) of the Community Hospital of Monterey Peninsula; Director (October 1991-2005) and Vice Chairman (2006-2009) of American Funds’ Emerging Markets Growth Fund, Inc. (mutual fund); President of ARCO Investment Management Company (February 1991-April 2000); Member of the investment committees of The Rockefeller Foundation (2001-2006) and The University of Michigan (since 2000); Advisor at Credit Suisse First Boston’s Sprout venture capital unit (venture capital fund) (1994-January 2005); Trustee of MassMutual Institutional Funds (investment company) (1996-June 2004); Trustee of MML Series Investment Fund (investment company) (April 1989-June 2004); Member of the investment committee of Hartford Hospital (2000-2003); and Advisor to Unilever (Holland) pension fund (2000-2003). Oversees 47 portfolios in the OppenheimerFunds complex. Ms. Hamilton has served on the Boards of certain Oppenheimer funds since 2002, during which time she has become familiar with the Fund’s (and other Oppenheimer funds’) financial, accounting, regulatory and investment matters and has contributed to the Boards’ deliberations. |
| |
Victoria J. Herget, Trustee (since 2012) Year of Birth:1951 | | Board Chair (2008-2015) and Director (2004-Present), United Educators (insurance company); Trustee (since 2000) and Chair (since 2010), Newberry Library (independent research library); Trustee, Mather LifeWays (senior living organization) (since 2001); Independent Director of the First American Funds (mutual fund family) (2003-2011); former Managing Director (1993-2001), Principal (1985-1993), Vice President (1978-1985) and Assistant Vice President (1973-1978) of Zurich Scudder Investments (investment adviser) (and its predecessor firms); Trustee (1992-2007), Chair of the Board of Trustees (1999-2007), Investment Committee Chair (1994-1999) and Investment Committee member (2007-2010) of Wellesley College; Trustee, BoardSource (non-profit organization) (2006-2009) and Chicago City Day School (K-8 School) (1994-2005). Oversees 47 portfolios in the OppenheimerFunds complex. Ms. Herget has served on the Boards of certain Oppenheimer funds since 2012, during which time she has become familiar with the Fund’s (and other Oppenheimer funds’) financial, accounting, regulatory and investment matters and has contributed to the Boards’ deliberations. |
41 OPPENHEIMER CONSERVATIVE BALANCED FUND/VA
TRUSTEES AND OFFICERS Unaudited / Continued
| | |
F. William Marshall, Jr., Trustee (since 2000) Year of Birth: 1942 | | Trustee Emeritus of Worcester Polytech Institute (WPI) (private university) (since 2009); Trustee of MassMutual Select Funds (formerly MassMutual Institutional Funds) (investment company) (1996-2015), MML Series Investment Fund (investment company) (1996-2015) and Mass Mutual Premier Funds (investment company) (January 2012-December 2015); President and Treasurer of the SIS Fund (private charitable fund) (January 1999-March 2011); Former Trustee of WPI (1985-2008); Former Chairman of the Board (2004-2006) and Former Chairman of the Investment Committee of WPI (1994-2008); Chairman of SIS Family Bank, F.S.B. (formerly SIS Bank) (commercial bank) (January 1999-July 1999); Executive Vice President of Peoples Heritage Financial Group, Inc. (commercial bank) (January 1999-July 1999); and Former President and Chief Executive Officer of SIS Bancorp. (1993-1999). Oversees 47 portfolios in the OppenheimerFunds complex. Mr. Marshall has served on the Boards of certain Oppenheimer funds since 2000, during which time he has become familiar with the Fund’s (and other Oppenheimer funds’) financial, accounting, regulatory and investment matters and has contributed to the Boards’ deliberations. |
| |
Karen L. Stuckey, Trustee (since 2012) Year of Birth: 1953 | | Member (since May 2015) of Desert Mountain Community Foundation Advisory Board (non-profit organization); Partner (1990-2012) of PricewaterhouseCoopers LLP (professional services firm) (held various positions 1975-1990); Trustee (1992- 2006), member of Executive, Nominating and Audit Committees and Chair of Finance Committee (1992-2006), and Emeritus Trustee (since 2006) of Lehigh University; and member, Women’s Investment Management Forum (professional organization) since inception. Oversees 47 portfolios in the OppenheimerFunds complex. Ms. Stuckey has served on the Boards of certain Oppenheimer funds since 2012, during which time she has become familiar with the Fund’s (and other Oppenheimer funds’) financial, accounting, regulatory and investment matters and has contributed to the Boards’ deliberations. |
| |
James D. Vaughn, Trustee (since 2012) Year of Birth:1945 | | Retired; former managing partner (1994-2001) of Denver office of Deloitte & Touche LLP, (held various positions 1969- 1993); Trustee and Chairman of the Audit Committee of Schroder Funds (2003-2012); Board member and Chairman of Audit Committee of AMG National Trust Bank (since 2005); Trustee and Investment Committee member, University of South Dakota Foundation (since 1996); Board member, Audit Committee Member and past Board Chair, Junior Achievement (since 1993); former Board member, Mile High United Way, Boys and Girls Clubs, Boy Scouts, Colorado Business Committee for the Arts, Economic Club of Colorado and Metro Denver Network. Oversees 47 portfolios in the OppenheimerFunds complex. Mr. Vaughn has served on the Boards of certain Oppenheimer funds since 2012, during which time he has become familiar with the Fund’s (and other Oppenheimer funds’) financial, accounting, regulatory and investment matters and has contributed to the Boards’ deliberations. |
|
| INTERESTED TRUSTEE AND OFFICER | | Mr. Steinmetz is an “Interested Trustee” because he is affiliated with the Manager and the Sub-Adviser by virtue of his positions as Chairman and director of the Sub-Adviser and officer and director of the Manager. Both as a Trustee and as an officer, Mr. Steinmetz serves for an indefinite term, or until his resignation, retirement, death or removal. Mr. Steinmetz’s address is 225 Liberty Street, New York, New York 10281-1008. |
| |
Arthur P. Steinmetz, Trustee (Since 2015), President and Principal Executive Officer (since 2014) Year of Birth: 1958 | | Chairman of OppenheimerFunds, Inc. (since January 2015); CEO and Chairman of OFI Global Asset Management, Inc. (since July 2014), President of OFI Global Asset Management, Inc. (since May 2013), a Director of OFI Global Asset Management, Inc. (since January 2013), Director of OppenheimerFunds, Inc. (since July 2014), President, Management Director and CEO of Oppenheimer Acquisition Corp. (OppenheimerFunds, Inc.‘s parent holding company) (since July 2014), and President and Director of OFI SteelPath, Inc. (since January 2013). Chief Investment Officer of the OppenheimerFunds advisory entities from (January 2013-December 2013); Executive Vice President of OFI Global Asset Management, Inc. (January 2013-May 2013); Chief Investment Officer of OppenheimerFunds, Inc. (October 2010-December 2012); Chief Investment Officer, Fixed- Income, of OppenheimerFunds, Inc. (April 2009-October 2010); Executive Vice President of OppenheimerFunds, Inc. (October 2009-December 2012); Director of Fixed Income of OppenheimerFunds, Inc. (January 2009-April 2009); and a Senior Vice President of OppenheimerFunds, Inc. (March 1993-September 2009). An officer of 103 portfolios in the OppenheimerFunds complex. |
|
| OTHER OFFICERS OF THE FUND | | The addresses of the Officers in the chart below are as follows: for Messrs. Memani, Krantz, Mss. Lo Bessette, Foxson and Picciotto, 225 Liberty Street, New York, New York 10281-1008, for Mr. Petersen, 6803 S. Tucson Way, Centennial, Colorado 80112-3924. Each Officer serves for an indefinite term or until his or her resignation, retirement, death or removal. |
| |
Krishna Memani, Vice President (since 2009) Year of Birth: 1960 | | President of the Sub-Adviser (since January 2013); Executive Vice President of the Manager (since January 2014) and Chief Investment Officer of the OppenheimerFunds advisory entities (since January 2014). Chief Investment Officer, Fixed Income of the Sub-Adviser (January 2013-December 2013); Head of the Investment Grade Fixed Income Team of the Sub-Adviser (March 2009-January 2014); Director of Fixed Income of the Sub-Adviser (October 2010-December 2012); Senior Vice President of the Sub-Adviser (March 2009-December 2012) and Senior Vice President of OFI Global Institutional, Inc. (April 2009-December 2012). Managing Director and Head of the U.S. and European Credit Analyst Team at Deutsche Bank Securities (June 2006-January 2009). Chief Credit Strategist at Credit Suisse Securities (August 2002-March 2006). Managing Director and Senior Portfolio Manager at Putnam Investments (September 1998-June 2002). A portfolio manager and an officer of other portfolios in the OppenheimerFunds complex. |
| |
Magnus Krantz, Vice President (since 2013) Year of Birth: 1967 | | Vice President of the Sub-Adviser (since May 2009) and a portfolio manager of the Sub-Adviser (since November 2012); sector manager for technology for the Sub-Adviser’s Main Street Investment Team (since May 2009). Prior to joining the Sub-Adviser, Mr. Krantz was a sector manager at RS Investment and Guardian Life Insurance Company. Mr. Krantz joined Guardian Life Insurance Company in December 2005 and transitioned to RS Investments in October 2006 in connection with Guardian Life Insurance Company’s acquisition of an interest in RS Investments. Portfolio manager and analyst at Citigroup Asset Management (1998-2005) and as a consultant at Price Waterhouse (1997-1998). He also served as product development engineer at Newbridge Networks (1993-1996) and as a software engineer at Mitel Corporation (1990-1993). A portfolio manager and officer of other portfolios in the OppenheimerFunds complex. |
42 OPPENHEIMER CONSERVATIVE BALANCED FUND/VA
| | |
| |
Cynthia Lo Bessette, Secretary and Chief Legal Officer (since 2016) Year of Birth: 1969 | | Executive Vice President, General Counsel and Secretary of the Manager (since February 2016); Chief Legal Officer of the Sub-Adviser and the Distributor (since February 2016); Vice President, General Counsel and Secretary of Oppenheimer Acquisition Corp. (since February 2016); General Counsel of OFI SteelPath, Inc., VTL Associates, LLC and Index Management Solutions, LLC (since February 2016); Chief Legal Officer of OFI Global Institutional, Inc., HarbourView Asset Management Corporation, OFI Global Trust Company, Oppenheimer Real Asset Management, Inc., OFI Private Investments Inc., Shareholder Services, Inc. and Trinity Investment Management Corporation (since February 2016); Senior Vice President and Deputy General Counsel (March 2015-February 2016) and Executive Vice President, Vice President, Corporate Counsel (February 2012-March 2015) and Deputy Chief Legal Officer (April 2013-March 2015) of Jennison Associates LLC; Assistant General Counsel (April 2008-September 2009) and Deputy General Counsel (October 2009-February 2012) of Lord Abbett & Co. LLC. An officer of 103 portfolios in the OppenheimerFunds complex. |
| |
Jennifer Foxson, Vice President and Chief Business Officer (since 2014) Year of Birth: 1969 | | Senior Vice President of OppenheimerFunds Distributor, Inc. (since June 2014); Vice President of OppenheimerFunds Distributor, Inc. (April 2006-June 2014); Vice President of the Sub-Adviser (January 1998-March 2006); Assistant Vice President of the Sub-Adviser (October 1991-December 1998). An officer of 103 portfolios in the OppenheimerFunds complex. |
| |
Mary Ann Picciotto, Chief Compliance Officer and Chief Anti-Money Laundering Officer (since 2014) Year of Birth: 1973 | | Senior Vice President and Chief Compliance Officer of the Manager (since March 2014); Chief Compliance Officer of the Sub- Adviser, OFI SteelPath, Inc., OFI Global Trust Company, OFI Global Institutional, Inc., Oppenheimer Real Asset Management, Inc., OFI Private Investments, Inc., Harborview Asset Management Corporation, Trinity Investment Management Corporation, and Shareholder Services, Inc. (since March 2014); Managing Director of Morgan Stanley Investment Management Inc. and certain of its various affiliated entities; Chief Compliance Officer of various Morgan Stanley Funds (May 2010-January 2014); Chief Compliance Officer of Morgan Stanley Investment Management Inc. (April 2007-January 2014). An officer of 103 portfolios in the OppenheimerFunds complex. |
| |
Brian S. Petersen, Treasurer and Principal Financial & Accounting Officer (since 2016) Year of Birth: 1970 | | Vice President of the Manager (since January 2013); Vice President of the Sub-Adviser (February 2007-December 2012); Assistant Vice President of the Sub-Adviser (August 2002-2007). An officer of 103 portfolios in the OppenheimerFunds complex. |
The Fund’s Statement of Additional Information contains additional information about the Fund’s Trustees and Officers and is available without charge, upon request, by calling 1.800.988.8287.
43 OPPENHEIMER CONSERVATIVE BALANCED FUND/VA
OPPENHEIMER CONSERVATIVE BALANCED FUND/VA
| | |
| A Series of Oppenheimer Variable Account Funds |
| |
| Manager | | OFI Global Asset Management, Inc. |
| |
| Sub-Adviser | | OppenheimerFunds, Inc. |
| |
| Distributor | | OppenheimerFunds Distributor, Inc. |
| |
| Transfer and Shareholder Servicing Agent | | OFI Global Asset Management, Inc. |
| |
| Sub-Transfer Agent | | Shareholder Services, Inc. |
| | DBA OppenheimerFunds Services |
| |
| Independent Registered Public Accounting Firm | | KPMG LLP |
| |
| Legal Counsel | | Ropes & Gray LLP |
| |
| | Before investing in any of the Oppenheimer funds, investors should carefully consider a fund’s investment objectives, risks, charges and expenses. Fund prospectuses and summary prospectuses contain this and other information about the funds, and may be obtained by asking your financial advisor, or calling us at 1.800.988.8287. Read prospectuses and summary prospectuses carefully before investing. |
| |
| | © 2017 OppenheimerFunds, Inc. All rights reserved. Oppenheimer funds are distributed by OppenheimerFunds Distributor, Inc. |

| | | | |
| | 
| | |
| | |
| | | December 31, 2016 | | |
| | | Oppenheimer | | |
| | Capital Appreciation Fund/VA | | Annual Report |
| | A Series of Oppenheimer Variable Account Funds | | |
| | | |
| | ANNUAL REPORT | | |
| | |
| | Listing of Top Holdings | | |
| | |
| | Fund Performance Discussion | | |
| | |
| | Financial Statements | | |
PORTFOLIO MANAGER: Paul Larson1
AVERAGE ANNUAL TOTAL RETURNS FOR THE PERIODS ENDED 12/31/16
| | | | | | | | | | | | | | |
| | | Inception
Date | | 1-Year | | | 5-Year | | | 10-Year | |
Non-Service Shares | | 4/3/85 | | | -2.20 | % | | | 11.59 | % | | | 5.34 | % |
Service Shares | | 9/18/01 | | | -2.43 | | | | 11.31 | | | | 5.07 | |
S&P 500 Index | | | | | 11.96 | | | | 14.66 | | | | 6.95 | |
Russell 1000 Growth Index | | | | | 7.08 | | | | 14.50 | | | | 8.33 | |
Performance data quoted represents past performance, which does not guarantee future results. The investment return and principal value of an investment in the Fund will fluctuate so that an investor’s shares, when redeemed, may be worth more or less than their original cost. Current performance may be lower or higher than the performance quoted. For performance data current to the most recent month end, call us at 1.800.988.8287. The Fund’s total returns should not be expected to be the same as the returns of other funds, whether or not both funds have the same portfolio managers and/or similar names. The Fund’s total returns include changes in share price and reinvested distributions but do not include the charges associated with the separate account products that offer this Fund. Such performance would have been lower if such charges were taken into account.
TOP HOLDINGS AND ALLOCATIONS
TOP TEN COMMON STOCK HOLDINGS
��
| | | | |
| |
Apple, Inc. | | | 6.9% | |
| |
Alphabet, Inc., Cl. C | | | 6.2 | |
| |
Microsoft Corp. | | | 5.9 | |
| |
Facebook, Inc., Cl. A | | | 4.5 | |
| |
Amazon.com, Inc. | | | 3.7 | |
| |
Mastercard, Inc., Cl. A | | | 3.1 | |
| |
Comcast Corp., Cl. A | | | 2.7 | |
| |
Lowe’s Cos., Inc. | | | 2.6 | |
| |
Priceline Group, Inc. (The) | | | 2.2 | |
| |
PayPal Holdings, Inc. | | | 2.0 | |
| |
Portfolio holdings and allocations are subject to change. Percentages are as of December 31, 2016, and are based on net assets. For more current Fund holdings, please visit oppenheimerfunds.com.
SECTOR ALLOCATION
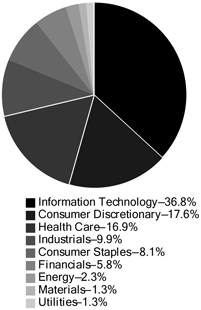
Portfolio holdings and allocations are subject to change. Percentages are as of December 31, 2016, and are based on the total market value of common stocks.
1. Paul Larson became a portfolio manager in October 2016.
2 OPPENHEIMER CAPITAL APPRECIATION FUND/VA
Fund Performance Discussion
Changes were made to the Fund’s portfolio management team during the reporting period. Effective October 5, 2016, the new Portfolio Manager of the Fund is Paul Larson. Mr. Larson joined OppenheimerFunds in 2013 and has 20 years of investment experience. The Fund’s focus on domestic large-cap growth has not changed, but Mr. Larson and team will implement the same investment process employed by the Main Street strategies. The Main Street team employs a process that seeks to identify competitively advantaged companies with a compelling risk/reward profile, while seeking an all-weather orientation for the portfolio as a whole. The deep and experienced investment team has a history of guiding portfolios through distinct market cycles using this disciplined approach.
For the one-year reporting period, the Fund’s Non-Service shares generated a total return of -2.20%. In comparison, the Fund underperformed the Russell 1000 Growth Index (the “Index”), which returned 7.08% for the same period. The Fund was positioned strongly toward growth-oriented companies during the reporting period, yet value stocks outperformed during the period, and particularly following the election. While still remaining a growth fund, the new portfolio management team is in the process of moving the Fund to a more all-weather orientation in the value versus growth spectrum. The Fund also saw significant turnover—and related costs—in the closing months of the year as the portfolio manager change precipitated meaningful transformation within the portfolio. With the portfolio positioning changes nearly complete, turnover should be far lower going forward. On a sector basis, the largest underperformers included health care, consumer discretionary, and industrials, where stock selection detracted from performance. The Fund outperformed in energy due to an overweight position and stock selection, as well as in the utilities sector due to stock selection.
MARKET OVERVIEW
Markets were turbulent during the reporting period. However, domestic equities generally experienced gains, particularly after the November U.S. Presidential election. A large trend for the first half of 2016 was the demand for so-called “bond proxy stocks” with above average dividend yields. This trend was magnified post the Brexit vote as treasury yields, already at historic lows, were under pressure and future interest rate hike expectations continued to be pushed further out. However, the market environment shifted over the fourth quarter of 2016, when the “risk-on” trade returned. This meant a sharp rebound in lower quality cyclicals, outperformance by smaller versus larger cap stocks, and a rotation away from more stable earnings and defensive-oriented higher dividend companies. This theme continued through year end.
The one-year reporting period saw the market driven by several important macroeconomic trends and events:
| ● | | The U.S. election, which saw Republicans take the White House and maintain control of Congress. |
| | ● | | Given above, significant policy changes are expected surrounding taxation, cross-border trade, regulatory burdens, and healthcare. |
| | ● | | With these changes, a broad shift from monetary stimuli to inflationary fiscal stimuli. |
| ● | | Uncertainty over the pace of Federal Reserve interest rate hikes. |
| ● | | The U.S. dollar materially strengthening versus other currencies. |
| ● | | Continued slow, but steady recovery in domestic consumer employment, wages and consumption. |
| ● | | Continued impact of Brexit, and increased uncertainty for global markets as a result. |
| ● | | Competitive currency devaluations, including negative interest rates in a number of jurisdictions, thrusting the world economy into uncharted territory. |
As investors, it is important to know what is and what is not within one’s circle of competence. As such, we strive to keep the portfolio in an all-weather orientation. Whether rates, commodity prices, currencies or even whole economies go up or down, our goal is to have a portfolio that can out-perform no matter the environment.
If our strategy includes not making oversized macro factor bets, a reasonable question is, “What types of risks are you willing to take?” First, we believe identifying companies with sustainable competitive advantages (or economic moats, if you prefer), is squarely in the middle of our circle of competence.
Second, we believe we have the skills to identify company management teams that are likely to successfully execute on their plans. Lastly, correctly valuing stocks and seeing what expectations the market is pricing in is also within our skillset. It is not by accident that we weight the portfolio more heavily towards companies that we believe have structural competitive advantages and/or management teams that are executing (e.g. gaining market share, expanding profit margins), with at least reasonable stock valuations. Companies with these qualities generally have more stable earnings.
3 OPPENHEIMER CAPITAL APPRECIATION FUND/VA
Allow us to use a metaphor. If managing the portfolio was like betting on horses, we’d readily admit that we cannot predict ahead of time the weather or track conditions. But we do believe we can find the strongest horses (advantaged business models), the best jockeys (executing management teams), and can see when the payoff odds are in our favor (positive expected returns). To offset our agnostic position on the conditions, we seek to have some horses in the stable that we believe will win no matter the weather. In short, it boils down to mostly stock selection.
TOP INDIVIDUAL CONTRIBUTORS
Top contributors to the Fund’s performance this period included NVIDIA, Electronic Arts and Microsoft. We exited our position in NVIDIA and Electronic Arts. NVIDIA designs and develops three-dimensional graphic processors to the mainstream personal computer market. The company reported revenue above consensus over the first quarter of its fiscal year and guided second quarter revenue ahead of consensus expectations driven by broad-based growth. Shares of video game developer Electronic Arts rallied after reporting strong fourth quarter and full-year 2016 financial results in May 2016. Microsoft develops and supports software products. Over the third quarter of 2016, the company reported profit and sales better than analysts’ estimates, as a result of their aggressive push into Internet-based software and services for businesses. Revenue from Azure, the company’s corporate cloud platform, doubled in the quarter ending September 30.
TOP INDIVIDUAL DETRACTORS
Detractors from performance this reporting period included Allergan, Valeant Pharmaceuticals and LinkedIn. Allergan, formerly known as Actavis, is a specialty pharmaceuticals manufacturer that markets branded drugs for patients suffering from diseases principally in the eye care, neuroscience, medical aesthetics/ dermatology, women’s health and gastroenterology categories. In November 2015, the company announced that it was merging with Pfizer to create a global pharmaceuticals company, and expected the deal to close in the second half of 2016. However, the deal was torpedoed by new Treasury Department rules meant to block American companies from moving their corporate addresses overseas to avoid U.S. taxes. This led Pfizer and Allergan to walk away from the record $160 billion deal. Over the first half of the reporting period, Valeant Pharmaceuticals said it was under investigation by the U.S. Securities and Exchange Commission in a previously undisclosed probe, in addition to its delayed financial results. The new portfolio management team believes Valeant’s management will divest non-core assets and utilize its free cash flow to pay down debt. LinkedIn, the largest professional networking website, reported better-than-expected earnings for the last quarter but warned that revenue would fall short of what analysts had projected for 2016. It also said it was discontinuing a new online advertising system that had not worked out. We exited our position (though we continue to own the business, via its new parent company Microsoft).
STRATEGY & OUTLOOK
While bottom-up company research and stock selection continue to be central to our process and strategy, we do have some observations about the current environment. First, the upcoming change resulting from the elections are likely to be profound. While the exact forms change will take is still speculation at this point, here are our base case expectations for what we believe will happen in the year ahead:
| ● | | Lower U.S. corporate tax rates (leading to fewer companies re-domiciling outside the U.S., and maybe some companies coming back) |
| ● | | Offsetting the lower rates, fewer specialized deductions |
| ● | | Lower regulatory burdens |
| ● | | Greater fiscal stimulus, most notably infrastructure spending |
| ● | | Rhetoric around protectionism in many forms, including higher import tariffs |
While some of these changes—most notably tax rates—would directly lead to earnings growth in the near term, these changes do present some material risks that need to be considered.
Supply chains today are highly globalized, and higher friction within global trade could lead to disruptions and higher costs for our companies. Moreover, other countries could easily create retaliatory protectionist policies of their own, reducing demand for U.S. exports and/or making life more difficult for overseas operations of our companies. Finally, deflation has been the bigger concern in recent years, but these policies are clearly swinging the pendulum toward higher inflation. In moderation, inflation is helpful, but we are mindful that sometimes the pendulum can swing too far.
At the moment, the U.S. economy continues its “slow and steady” growth. This is being driven by favorable employment, wage and inflation data while home prices and innovation also continue to help drive the economy higher.
U.S. corporate revenues, earnings, and free cash flow have resumed their moderate growth. The post-election strength in US equity markets and the return of the “risk on trade” indicates that the consensus expects earnings growth to accelerate further in the quarters ahead.
4 OPPENHEIMER CAPITAL APPRECIATION FUND/VA
We continue to be laser-focused on the rise in “accounting shenanigans” and the rising spread between GAAP earnings and pro-forma adjusted earnings. This, combined with ongoing financial engineering, e.g., tax inversions and other obfuscations, have caused us to place increasing emphasis on judging the attractiveness of an investment based on free cash flow, rather than earnings.
While interest rates have increased in recent months, they are still very low relative to historical standards. Current capital allocation is fueled by this environment of ongoing relatively low interest rates. We believe the risks inherent to this market include the misallocation of capital if interest rates were to rise materially. We intend to maintain our discipline around valuation. Additionally, while innovation is alive and well and continuing to help generate economic growth, fundamental disruptions across market segments have been elevated. We continue to be focused on potential disruption risk to our companies.
We expect heightened uncertainty to return in the equity markets. Traditionally, during periods of economic uncertainty and heightened market volatility, investors favor stocks of higher quality companies—with greater consistency and stability of revenue and earnings— leading to relatively better stock performance for those companies. We think focusing on companies with economic moats and skilled management teams positions us well, should this environment come to pass. During times of economic volatility such companies frequently widen their lead over weaker competitors. We seek to invest in companies, characterized by these qualities, at compelling valuations and believe this disciplined approach is essential to generating superior long-term performance.
Investors should consider the Fund’s investment objective, risks, charges and expenses carefully before investing. The Fund’s prospectus and summary prospectus contain this and other information about the Fund, and may be obtained by asking your financial advisor or calling us at 1.800.988.8287. Read prospectuses and summary prospectuses carefully before investing.
Total returns include changes in share price and reinvestment of dividends and capital gains distributions in a hypothetical investment for the periods shown, but do not include the charges associated with the separate account products that offer this Fund.
The Fund’s investment strategy and focus can change over time. The mention of specific fund holdings does not constitute a recommendation by OppenheimerFunds, Inc. or its affiliates.
Shares of Oppenheimer funds are not deposits or obligations of any bank, are not guaranteed by any bank, are not insured by the FDIC or any other agency, and involve investment risks, including the possible loss of the principal amount invested.
Comparing the Fund’s Performance to the Market. The graphs that follow show the performance of a hypothetical $10,000 investment in each share class of the Fund held until December 31, 2016. Performance is measured over a ten-fiscal-year period for both Classes. Performance information does not reflect charges that apply to separate accounts investing in the Fund. If these charges were taken into account, performance would be lower. The graphs assume that all dividends and capital gains distributions were reinvested in additional shares.
The Fund’s performance is compared to the performance of the S&P 500 Index and the Russell 1000 Growth Index. The S&P 500 Index is a broad-based measure of domestic stock performance. The Russell 1000 Growth Index measures the performance of the large-cap growth segment of the U.S. equity universe. It includes those Russell 1000 companies with higher price-to-book ratios and higher forecasted growth values. The Indices are unmanaged and cannot be purchased directly by investors. Index performance is shown for illustrative purposes only and does not predict or depict the performance of the Fund. While index comparisons may be useful to provide a benchmark for the Fund’s performance, it must be noted that the Fund’s investments are not limited to the investments comprising the Index. Index performance includes reinvestment of income, but does not reflect transaction costs, fees, expenses or taxes. Index performance is shown for illustrative purposes only as a benchmark for the Fund’s performance, and does not predict or depict performance of the Fund. The Fund’s performance reflects the effects of the Fund’s business and operating expenses.
5 OPPENHEIMER CAPITAL APPRECIATION FUND/VA
COMPARISON OF CHANGE IN VALUE OF $10,000 HYPOTHETICAL INVESTMENTS IN:

COMPARISON OF CHANGE IN VALUE OF $10,000 HYPOTHETICAL INVESTMENTS IN:
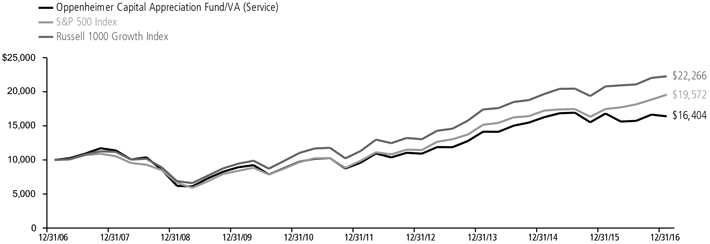
Performance data quoted represents past performance, which does not guarantee future results. The investment return and principal value of an investment in the Fund will fluctuate so that an investor’s shares, when redeemed, may be worth more or less than their original cost. Current performance may be lower or higher than the performance quoted. For performance data current to the most recent month end, call us at 1.800. 988.8287. The Fund’s total returns should not be expected to be the same as the returns of other funds, whether or not both funds have the same portfolio managers and/or similar names. The Fund’s total returns include changes in share price and reinvested distributions but do not include the charges associated with the separate account products that offer this Fund. Such performance would have been lower if such charges were taken into account.
6 OPPENHEIMER CAPITAL APPRECIATION FUND/VA
Fund Expenses
Fund Expenses. As a shareholder of the Fund, you incur two types of costs: (1) transaction costs and (2) ongoing costs, including management fees; distribution and service fees; and other Fund expenses. These examples are intended to help you understand your ongoing costs (in dollars) of investing in the Fund and to compare these costs with the ongoing costs of investing in other mutual funds.
The examples are based on an investment of $1,000.00 invested at the beginning of the period and held for the entire 6-month period ended December 31, 2016.
Actual Expenses. The first section of the table provides information about actual account values and actual expenses. You may use the information in this section for the class of shares you hold, together with the amount you invested, to estimate the expense that you paid over the period. Simply divide your account value by $1,000.00 (for example, an $8,600.00 account value divided by $1,000.00 = 8.60), then multiply the result by the number in the first section under the heading entitled “Expenses Paid During 6 Months Ended December 31, 2016” to estimate the expenses you paid on your account during this period.
Hypothetical Example for Comparison Purposes.
The second section of the table provides information about hypothetical account values and hypothetical expenses based on the Fund’s actual expense ratio for each class of shares, and an assumed rate of return of 5% per year for each class before expenses, which is not the actual return. The hypothetical account values and expenses may not be used to estimate the actual ending account balance or expenses you paid for the period. You may use this information to compare the ongoing costs of investing in the Fund and other funds. To do so, compare this 5% hypothetical example for the class of shares you hold with the 5% hypothetical examples that appear in the shareholder reports of the other funds.
Please note that the expenses shown in the table are meant to highlight your ongoing costs only and do not reflect any charges associated with the separate accounts that offer this Fund. Therefore, the “hypothetical” lines of the table are useful in comparing ongoing costs only, and will not help you determine the relative total costs of owning different funds. In addition, if these separate account charges were included your costs would have been higher.
| | | | | | | | | | | | |
| Actual | | Beginning Account Value
July 1, 2016 | | | Ending Account Value
December 31, 2016 | | | Expenses Paid During 6 Months Ended
December 31, 2016 | |
Non-Service shares | | $ | 1,000.00 | | | $ | 1,043.60 | | | $ | 4.12 | |
Service shares | | | 1,000.00 | | | | 1,042.40 | | | | 5.40 | |
|
| Hypothetical | |
| (5% return before expenses) | | | | | | | | | |
Non-Service shares | | | 1,000.00 | | | | 1,021.11 | | | | 4.07 | |
Service shares | | | 1,000.00 | | | | 1,019.86 | | | | 5.35 | |
Expenses are equal to the Fund’s annualized expense ratio for that class, multiplied by the average account value over the period, multiplied by 184/366 (to reflect the one-half year period). Those annualized expense ratios, excluding indirect expenses from affiliated funds, based on the 6-month period ended December 31, 2016 are as follows:
| | | | |
| Class | | Expense Ratios | |
Non-Service shares | | | 0.80% | |
Service shares | | | 1.05 | |
The expense ratios reflect voluntary and/or contractual waivers and/or reimbursements of expenses by the Fund’s Manager. Some of these undertakings may be modified or terminated at any time, as indicated in the Fund’s prospectus. The “Financial Highlights” tables in the Fund’s financial statements, included in this report, also show the gross expense ratios, without such waivers or reimbursements and reduction to custodian expenses, if applicable.
7 OPPENHEIMER CAPITAL APPRECIATION FUND/VA
STATEMENT OF INVESTMENTS December 31, 2016
| | | | | | | | | | | | |
| | | Shares | | | Value | | | | |
| | | | | |
Common Stocks—96.8% | | | | | |
| | | | | |
Consumer Discretionary—17.1% | | | | | | | | | |
| | | | | |
Hotels, Restaurants & Leisure—2.0% | | | | | |
| | | | | |
Cedar Fair LP1 | | | 133,437 | | | $ | 8,566,656 | | | | | |
| | | | | |
Starbucks Corp. | | | 134,360 | | | | 7,459,667 | | | | | |
| | | | | | | | | | | | |
| | | | | | | 16,026,323 | | | | | |
| | | | | |
Household Durables—2.4% | | | | | |
| | | | | |
Newell Brands, Inc. | | | 144,750 | | | | 6,463,088 | | | | | |
| | | | | |
Whirlpool Corp. | | | 66,960 | | | | 12,171,319 | | | | | |
| | | | | | | | | | | | |
| | | | | | | 18,634,407 | | | | | |
| | | | | |
Internet & Direct Marketing Retail—5.9% | | | | | |
| | | | | |
Amazon.com, Inc.2 | | | 39,624 | | | | 29,712,849 | | | | | |
| | | | | |
Priceline Group, Inc. (The)2 | | | 11,770 | | | | 17,255,526 | | | | | |
| | | | | | | | | | | | |
| | | | | | | 46,968,375 | | | | | |
| | | | | |
Media—2.7% | | | | | |
| | | | | |
Comcast Corp., Cl. A | | | 316,126 | | | | 21,828,500 | | | | | |
| | | | | |
Specialty Retail—4.1% | | | | | |
| | | | | |
AutoZone, Inc.2 | | | 14,820 | | | | 11,704,688 | | | | | |
| | | | | |
Lowe’s Cos., Inc. | | | 292,400 | | | | 20,795,488 | | | | | |
| | | | | | | | | | | | |
| | | | | | | 32,500,176 | | | | | |
| | | | | |
Consumer Staples—7.8% | | | | | | | | | |
| | | | | |
Beverages—3.8% | | | | | |
| | | | | |
Constellation Brands, Inc., Cl. A | | | 65,570 | | | | 10,052,536 | | | | | |
| | | | | |
Dr Pepper Snapple Group, Inc. | | | 109,540 | | | | 9,931,992 | | | | | |
| | | | | |
Molson Coors Brewing Co., Cl. B | | | 109,890 | | | | 10,693,396 | | | | | |
| | | | | | | | | | | | |
| | | | | | | 30,677,924 | | | | | |
| | | | | |
Food & Staples Retailing—1.0% | | | | | | | | | |
| | | | | |
Costco Wholesale Corp. | | | 49,560 | | | | 7,935,052 | | | | | |
| | | | | |
Food Products—1.7% | | | | | |
| | | | | |
Conagra Brands, Inc. | | | 105,930 | | | | 4,189,531 | | | | | |
| | | | | |
Kraft Heinz Co. (The) | | | 103,430 | | | | 9,031,508 | | | | | |
| | | | | | | | | | | | |
| | | | | | | 13,221,039 | | | | | |
| | | | | |
Household Products—1.3% | | | | | | | | | |
| | | | | |
Spectrum Brands Holdings, Inc. | | | 85,020 | | | | 10,400,497 | | | | | |
| | | | | |
Energy—2.2% | | | | | | | | | |
| | | | | |
Energy Equipment & Services—0.4% | | | | | |
| | | | | |
Halliburton Co. | | | 60,202 | | | | 3,256,326 | | | | | |
| | | | | |
Oil, Gas & Consumable Fuels—1.8% | | | | | |
| | | | | |
EOG Resources, Inc. | | | 30,421 | | | | 3,075,563 | | | | | |
| | | | | |
Magellan Midstream Partners LP1 | | | 107,015 | | | | 8,093,545 | | | | | |
| | | | | |
Pioneer Natural Resources Co. | | | 19,611 | | | | 3,531,353 | | | | | |
| | | | | | | | | | | | |
| | | | | | | 14,700,461 | | | | | |
| | | | | |
Financials—5.6% | | | | | | | | | |
| | | | | |
Capital Markets—4.0% | | | | | |
| | | | | |
BlackRock, Inc., Cl. A | | | 11,130 | | | | 4,235,410 | | | | | |
| | | | | |
Charles Schwab Corp. (The) | | | 244,360 | | | | 9,644,889 | | | | | |
| | | | | |
CME Group, Inc., Cl. A | | | 80,820 | | | | 9,322,587 | | | | | |
| | | | | |
Intercontinental Exchange, Inc. | | | 161,850 | | | | 9,131,577 | | | | | |
| | | | | | | | | | | | |
| | | | | | | 32,334,463 | | | | | |
| | | | | |
Real Estate Investment Trusts (REITs)—1.6% | | | | | | | | | |
| | | | | |
Crown Castle International Corp. | | | 98,190 | | | | 8,519,947 | | | | | |
| | | | | |
| Mid-America Apartment Communities, Inc. | | | 42,760 | | | | 4,187,059 | | | | | |
| | | | | | | | | | | | |
| | | | | | | 12,707,006 | | | | | |
| | | | | |
Health Care—16.4% | | | | | | | | | |
| | | | | |
Biotechnology—4.0% | | | | | |
| | | | | |
Amgen, Inc. | | | 48,720 | | | | 7,123,351 | | | | | |
| | | | | |
Biogen, Inc.2 | | | 45,470 | | | | 12,894,383 | | | | | |
| | | | | |
Celgene Corp.2 | | | 104,464 | | | | 12,091,708 | | | | | |
| | | | | | | | | | | | |
| | | | | | | 32,109,442 | | | | | |
| | | | | |
Health Care Equipment & Supplies—6.3% | | | | | | | | | |
| | | | | |
Baxter International, Inc. | | | 221,410 | | | | 9,817,319 | | | | | |
| | | | | |
CR Bard, Inc. | | | 36,760 | | | | 8,258,502 | | | | | |
| | | | | | | | |
| | | Shares | | | Value | |
| |
Health Care Equipment & Supplies (Continued) | |
| |
Danaher Corp. | | | 154,870 | | | $ | 12,055,081 | |
| |
Intuitive Surgical, Inc.2 | | | 10,510 | | | | 6,665,127 | |
| |
Medtronic plc | | | 121,500 | | | | 8,654,445 | |
| |
Stryker Corp. | | | 36,510 | | | | 4,374,263 | |
| | | | | | | | |
| | | | | | | 49,824,737 | |
| |
Health Care Providers & Services—2.6% | | | | | |
| |
Humana, Inc. | | | 50,250 | | | | 10,252,507 | |
| |
Laboratory Corp. of America Holdings2 | | | 83,020 | | | | 10,658,108 | |
| | | | | | | | |
| | | | | | | 20,910,615 | |
| |
Health Care Technology—0.6% | | | | | |
| |
Cerner Corp.2 | | | 104,960 | | | | 4,971,955 | |
| |
Pharmaceuticals—2.9% | | | | | | | | |
| |
Allergan plc2 | | | 76,100 | | | | 15,981,761 | |
| |
Merck & Co., Inc. | | | 94,350 | | | | 5,554,384 | |
| |
| Valeant Pharmaceuticals International, Inc.2 | | | 74,480 | | | | 1,081,450 | |
| | | | | | | | |
| | | | | | | 22,617,595 | |
| |
Industrials—9.5% | | | | | | | | |
| |
Building Products—0.4% | | | | | | | | |
| |
Allegion plc | | | 48,750 | | | | 3,120,000 | |
| |
Commercial Services & Supplies—1.6% | |
| |
KAR Auction Services, Inc. | | | 291,300 | | | | 12,415,206 | |
| |
Electrical Equipment—0.7% | | | | | | | | |
| |
Acuity Brands, Inc. | | | 17,880 | | | | 4,127,777 | |
| |
Rockwell Automation, Inc. | | | 14,160 | | | | 1,903,104 | |
| | | | | | | | |
| | | | | | | 6,030,881 | |
| |
Machinery—3.6% | | | | | | | | |
| |
Deere & Co. | | | 110,470 | | | | 11,382,829 | |
| |
Ingersoll-Rand plc | | | 41,080 | | | | 3,082,643 | |
| |
Stanley Black & Decker, Inc. | | | 35,030 | | | | 4,017,591 | |
| |
Wabtec Corp. | | | 125,350 | | | | 10,406,557 | |
| | | | | | | | |
| | | | | | | 28,889,620 | |
| |
Professional Services—1.0% | |
| |
Nielsen Holdings plc | | | 195,150 | | | | 8,186,542 | |
| |
Road & Rail—2.2% | | | | | | | | |
| |
Canadian National Railway Co. | | | 95,310 | | | | 6,423,894 | |
| |
Canadian Pacific Railway Ltd. | | | 70,120 | | | | 10,011,032 | |
| |
Kansas City Southern | | | 9,760 | | | | 828,136 | |
| | | | | | | | |
| | | | | | | 17,263,062 | |
| |
Information Technology—35.6% | |
| |
Internet Software & Services—10.6% | |
| |
Alphabet, Inc., Cl. C2 | | | 63,910 | | | | 49,327,016 | |
| |
| Facebook, Inc., Cl. A2 | | | 309,570 | | | | 35,616,029 | |
| | | | | | | | |
| | | | | | | 84,943,045 | |
| |
IT Services—6.2% | | | | | | | | |
| |
Mastercard, Inc., Cl. A | | | 236,300 | | | | 24,397,975 | |
| |
PayPal Holdings, Inc.2 | | | 407,220 | | | | 16,072,973 | |
| |
| Visa, Inc., Cl. A | | | 116,158 | | | | 9,062,647 | |
| | | | | | | | |
| | | | | | | 49,533,595 | |
| |
Semiconductors & Semiconductor Equipment—2.9% | |
| |
Broadcom Ltd. | | | 74,660 | | | | 13,197,648 | |
| |
Texas Instruments, Inc. | | | 132,950 | | | | 9,701,362 | |
| | | | | | | | |
| | | | | | | 22,899,010 | |
| |
Software—9.0% | | | | | | | | |
| |
Activision Blizzard, Inc. | | | 355,030 | | | | 12,820,133 | |
| |
Microsoft Corp. | | | 759,450 | | | | 47,192,223 | |
| |
| Oracle Corp. | | | 297,110 | | | | 11,423,880 | |
| | | | | | | | |
| | | | | | | 71,436,236 | |
| |
Technology Hardware, Storage & Peripherals—6.9% | |
| |
Apple, Inc. | | | 472,520 | | | | 54,727,266 | |
8 OPPENHEIMER CAPITAL APPRECIATION FUND/VA
| | | | | | | | | | | | |
| | | Shares | | | Value | | | | |
| | | | | |
Materials—1.3% | | | | | | | | | | | | |
| | | | | |
Chemicals—1.0% | | | | | | | | | | | | |
| | | | | |
Albemarle Corp. | | | 49,100 | | | $ | 4,226,528 | | | | | |
| | | | | |
Sherwin-Williams Co. (The) | | | 14,240 | | | | 3,826,858 | | | | | |
| | | | | | | | | | | | |
| | | | | | | 8,053,386 | | | | | |
| | | | | |
Construction Materials—0.3% | | | | | | | | | | | | |
| | | | | |
Vulcan Materials Co. | | | 15,650 | | | | 1,958,596 | | | | | |
| | | | | | | | |
| | | Shares | | | Value | |
| |
Utilities—1.3% | | | | | | | | |
| |
Gas Utilities—1.3% | | | | | | | | |
| |
AmeriGas Partners LP1 | | | 211,050 | | | $ | 10,113,516 | |
| | | | | | | | |
Total Common Stocks (Cost $675,097,605) | | | | | | | 771,194,854 | |
| |
Investment Company—3.9% | |
| |
| Oppenheimer Institutional Government Money Market Fund, Cl. E, 0.43%3,4 (Cost $31,306,028) | | | 31,306,028 | | | | 31,306,028 | |
| |
| Total Investments, at Value (Cost $706,403,633) | | | 100.7% | | | | 802,500,882 | |
| |
| Net Other Assets (Liabilities) | | | (0.7) | | | | (5,519,102) | |
| | | | |
Net Assets | | | 100.0% | | | $ | 796,981,780 | |
| | | | |
Footnotes to Statement of Investments
1. Security is a Master Limited Partnership.
2. Non-income producing security.
3. Rate shown is the 7-day yield at period end.
4. Is or was an affiliate, as defined in the Investment Company Act of 1940, as amended, at or during the reporting period, by virtue of the Fund owning at least 5% of the voting securities of the issuer or as a result of the Fund and the issuer having the same investment adviser. Transactions during the reporting period in which the issuer was an affiliate are as follows:
| | | | | | | | | | | | | | | | | | | | |
| | | Shares December 31, 2015 | | | | | | Gross Additions | | | Gross Reductions | | | Shares December 31, 2016 | |
| |
| Oppenheimer Institutional Government Money Market Fund, Cl. Ea | | | 8,225,463 | | | | | | | | 328,580,976 | | | | 305,500,411 | | | | 31,306,028 | |
| | | | | |
| | | | | | | | | | | | Value | | | Income | |
| |
| Oppenheimer Institutional Government Money Market Fund, Cl. Ea | | | | | | | | | | | | | | $ | 31,306,028 | | | $ | 70,441 | |
a. Prior to September 28, 2016, this fund was named Oppenheimer Institutional Money Market Fund.
See accompanying Notes to Financial Statements.
9 OPPENHEIMER CAPITAL APPRECIATION FUND/VA
STATEMENT OF ASSETS AND LIABILITIES December 31, 2016
| | | | |
| |
Assets | | | | |
Investments, at value—see accompanying statement of investments: | | | | |
Unaffiliated companies (cost $675,097,605) | | $ | 771,194,854 | |
Affiliated companies (cost $31,306,028) | | | 31,306,028 | |
| | | | |
| | | 802,500,882 | |
| |
Cash | | | 2,000,609 | |
| |
Receivables and other assets: | |
Dividends | | | 983,853 | |
Shares of beneficial interest sold | | | 310,134 | |
Other | | | 79,626 | |
| | | | |
Total assets | | | 805,875,104 | |
| |
Liabilities | | | | |
Payables and other liabilities: | | | | |
Investments purchased | | | 8,459,224 | |
Shares of beneficial interest redeemed | | | 238,493 | |
Trustees’ compensation | | | 73,315 | |
Distribution and service plan fees | | | 62,557 | |
Shareholder communications | | | 31,296 | |
Other | | | 28,439 | |
| | | | |
Total liabilities | | | 8,893,324 | |
| |
Net Assets | | $ | 796,981,780 | |
| | | | |
|
| |
Composition of Net Assets | | | | |
Par value of shares of beneficial interest | | $ | 16,561 | |
| |
Additional paid-in capital | | | 624,327,701 | |
| |
Accumulated net investment loss | | | (101,477) | |
| |
Accumulated net realized gain on investments | | | 76,664,950 | |
| |
Net unrealized appreciation on investments and translation of assets and liabilities denominated in foreign currencies | | | 96,074,045 | |
| | | | |
Net Assets | | ��$ | 796,981,780 | |
| | | | |
|
| |
Net Asset Value Per Share | | | | |
Non-Service Shares: | | | | |
| Net asset value, redemption price per share and offering price per share (based on net assets of $501,755,406 and 10,375,470 shares of beneficial interest outstanding) | | | $48.36 | |
| |
| |
Service Shares: | | | | |
| Net asset value, redemption price per share and offering price per share (based on net assets of $295,226,374 and 6,185,743 shares of beneficial interest outstanding) | | | $47.73 | |
See accompanying Notes to Financial Statements.
10 OPPENHEIMER CAPITAL APPRECIATION FUND/VA
STATEMENT OF OPERATIONS For the Year Ended December 31, 2016
| | | | |
| |
Investment Income | | | | |
| |
Dividends: | | | | |
Unaffiliated companies (net of foreign withholding taxes of $13,655) | | $ | 8,385,149 | |
Affiliated companies | | | 70,441 | |
| | | | |
Total investment income | | | 8,455,590 | |
| |
Expenses | | | | |
Management fees | | | 5,654,232 | |
| |
Distribution and service plan fees - Service shares | | | 719,950 | |
| |
Transfer and shareholder servicing agent fees: | | | | |
Non-Service shares | | | 515,055 | |
Service shares | | | 288,234 | |
| |
Shareholder communications: | | | | |
Non-Service shares | | | 45,447 | |
Service shares | | | 25,589 | |
| |
Trustees’ compensation | | | 35,177 | |
| |
Custodian fees and expenses | | | 16,845 | |
| |
Borrowing fees | | | 14,821 | |
| |
Other | | | 81,630 | |
| | | | |
Total expenses | | | 7,396,980 | |
Less reduction to custodian expenses | | | (1,385) | |
Less waivers and reimbursements of expenses | | | (233,965) | |
| | | | |
Net expenses | | | 7,161,630 | |
| |
Net Investment Income | | | 1,293,960 | |
| |
Realized and Unrealized Gain (Loss) | | | | |
Net realized gain on investment transactions in unaffiliated companies | | | 85,112,682 | |
| |
Net change in unrealized appreciation/depreciation on: | | | | |
Investment transactions | | | (108,412,929) | |
Translation of assets and liabilities denominated in foreign currencies | | | (3,770) | |
| | | | |
Net change in unrealized appreciation/depreciation | | | (108,416,699) | |
| |
Net Decrease in Net Assets Resulting from Operations | | $ | (22,010,057) | |
| | | | |
See accompanying Notes to Financial Statements.
11 OPPENHEIMER CAPITAL APPRECIATION FUND/VA
STATEMENTS OF CHANGES IN NET ASSETS
| | | | | | | | |
| | | Year Ended
December 31, 2016 | | | Year Ended
December 31, 2015 | |
| |
Operations | | | | | | | | |
Net investment income | | $ | 1,293,960 | | | $ | 2,548,712 | |
| |
Net realized gain | | | 85,112,682 | | | | 91,601,467 | |
| |
Net change in unrealized appreciation/depreciation | | | (108,416,699) | | | | (62,184,920) | |
| | | | |
Net increase (decrease) in net assets resulting from operations | | | (22,010,057) | | | | 31,965,259 | |
| |
Dividends and/or Distributions to Shareholders | | | | | | | | |
Dividends from net investment income: | | | | | | | | |
Non-Service shares | | | (2,123,971) | | | | (554,707) | |
Service shares | | | (318,481) | | | | — | |
| | | | |
| | | (2,442,452) | | | | (554,707) | |
| |
Distributions from net realized gain: | | | | | | | | |
Non-Service shares | | | (53,815,550) | | | | (106,184,924) | |
Service shares | | | (29,108,236) | | | | (59,885,291) | |
| | | | |
| | | (82,923,786) | | | | (166,070,215) | |
| |
Beneficial Interest Transactions | | | | | | | | |
Net increase in net assets resulting from beneficial interest transactions: | | | | | | | | |
Non-Service shares | | | 6,630,751 | | | | 32,611,326 | |
Service shares | | | 15,475,883 | | | | 30,119,410 | |
| | | | |
| | | 22,106,634 | | | | 62,730,736 | |
| |
Net Assets | | | | | | | | |
Total decrease | | | (85,269,661) | | | | (71,928,927) | |
| |
Beginning of period | | | 882,251,441 | | | | 954,180,368 | |
| | | | |
| End of period (including accumulated net investment income (loss) of $(101,477) and $ 1,047,015, respectively) | | $ | 796,981,780 | | | $ | 882,251,441 | |
| | | | |
See accompanying Notes to Financial Statements.
12 OPPENHEIMER CAPITAL APPRECIATION FUND/VA
FINANCIAL HIGHLIGHTS
| | | | | | | | | | | | | | | | | | | | |
| Non-Service Shares | | Year Ended
December 31,
2016 | | | Year Ended
December 31,
2015 | | | Year Ended
December 31,
2014 | | | Year Ended
December 31,
2013 | | | Year Ended
December 31,
2012 | |
| |
Per Share Operating Data | | | | | | | | | | | | | | | | | | | | |
Net asset value, beginning of period | | $ | 55.49 | | | $ | 64.87 | | | $ | 57.88 | | | $ | 45.06 | | | $ | 39.75 | |
| |
Income (loss) from investment operations: | | | | | | | | | | | | | | | | | | | | |
Net investment income1 | | | 0.12 | | | | 0.22 | | | | 0.09 | | | | 0.23 | | | | 0.42 | |
Net realized and unrealized gain (loss) | | | (1.57) | | | | 2.25 | | | | 8.64 | | | | 13.09 | | | | 5.18 | |
| | | | |
Total from investment operations | | | (1.45) | | | | 2.47 | | | | 8.73 | | | | 13.32 | | | | 5.60 | |
| |
Dividends and/or distributions to shareholders: | | | | | | | | | | | | | | | | | | | | |
Dividends from net investment income | | | (0.22) | | | | (0.06) | | | | (0.27) | | | | (0.50) | | | | (0.29) | |
Distributions from net realized gain | | | (5.46) | | | | (11.79) | | | | (1.47) | | | | 0.00 | | | | 0.00 | |
| | | | |
Total dividends and/or distributions to shareholders | | | (5.68) | | | | (11.85) | | | | (1.74) | | | | (0.50) | | | | (0.29) | |
| |
Net asset value, end of period | | $ | 48.36 | | | $ | 55.49 | | | $ | 64.87 | | | $ | 57.88 | | | $ | 45.06 | |
| | | | |
| | | | |
| |
Total Return, at Net Asset Value2 | | | (2.20)% | | | | 3.54% | | | | 15.41% | | | | 29.74% | | | | 14.12% | |
| |
| |
Ratios/Supplemental Data | | | | | | | | | | | | | | | | | | | | |
Net assets, end of period (in thousands) | | $ | 501,756 | | | $ | 564,514 | | | $ | 616,862 | | | $ | 626,907 | | | $ | 573,684 | |
| |
Average net assets (in thousands) | | $ | 514,525 | | | $ | 601,110 | | | $ | 614,272 | | | $ | 595,912 | | | $ | 600,121 | |
| |
Ratios to average net assets:3 | | | | | | | | | | | | | | | | | | | | |
Net investment income | | | 0.25% | | | | 0.36% | | | | 0.15% | | | | 0.44% | | | | 0.95% | |
Expenses excluding specific expenses listed below | | | 0.83% | | | | 0.81% | | | | 0.80% | | | | 0.81% | | | | 0.81% | |
Interest and fees from borrowings | | | 0.00%4 | | | | 0.00%4 | | | | 0.00% | | | | 0.00% | | | | 0.00% | |
| | | | |
Total expenses5 | | | 0.83% | | | | 0.81% | | | | 0.80% | | | | 0.81% | | | | 0.81% | |
| Expenses after payments, waivers and/or reimbursements and reduction to custodian expenses | | | 0.80% | | | | 0.80% | | | | 0.80%6 | | | | 0.80% | | | | 0.80% | |
| |
Portfolio turnover rate | | | 114% | | | | 60% | | | | 61% | | | | 77% | | | | 28% | |
1. Per share amounts calculated based on the average shares outstanding during the period.
2. Assumes an initial investment on the business day before the first day of the fiscal period, with all dividends and distributions reinvested in additional shares on the reinvestment date, and redemption at the net asset value calculated on the last business day of the fiscal period. Total returns are not annualized for periods less than one full year. Total return information does not reflect expenses that apply at the separate account level or to related insurance products. Inclusion of these charges would reduce the total return figures for all periods shown. Returns do not reflect the deduction of taxes that a shareholder would pay on fund distributions or the redemption of fund shares.
3. Annualized for periods less than one full year.
4. Less than 0.005%.
5. Total expenses including indirect expenses from affiliated fund fees and expenses were as follows:
| | |
Year Ended December 31, 2016 | | 0.83% |
Year Ended December 31, 2015 | | 0.81% |
Year Ended December 31, 2014 | | 0.80% |
Year Ended December 31, 2013 | | 0.81% |
Year Ended December 31, 2012 | | 0.81% |
6. Waiver was less than 0.005%.
See accompanying Notes to Financial Statements.
13 OPPENHEIMER CAPITAL APPRECIATION FUND/VA
FINANCIAL HIGHLIGHTS Continued
| | | | | | | | | | | | | | | | | | | | |
| Service Shares | | Year Ended
December 31,
2016 | | | Year Ended
December 31,
2015 | | | Year Ended
December 31,
2014 | | | Year Ended
December 31,
2013 | | | Year Ended
December 31,
2012 | |
| |
Per Share Operating Data | | | | | | | | | | | | | | | | | | | | |
Net asset value, beginning of period | | $ | 54.80 | | | $ | 64.30 | | | $ | 57.37 | | | $ | 44.66 | | | $ | 39.40 | |
| |
Income (loss) from investment operations: | | | | | | | | | | | | | | | | | | | | |
Net investment income (loss)1 | | | 0.002 | | | | 0.07 | | | | (0.06) | | | | 0.10 | | | | 0.31 | |
Net realized and unrealized gain (loss) | | | (1.55) | | | | 2.22 | | | | 8.57 | | | | 12.98 | | | | 5.12 | |
| | | | |
Total from investment operations | | | (1.55) | | | | 2.29 | | | | 8.51 | | | | 13.08 | | | | 5.43 | |
| |
Dividends and/or distributions to shareholders: | | | | | | | | | | | | | | | | | | | | |
Dividends from net investment income | | | (0.06) | | | | 0.00 | | | | (0.11) | | | | (0.37) | | | | (0.17) | |
Distributions from net realized gain | | | (5.46) | | | | (11.79) | | | | (1.47) | | | | 0.00 | | | | 0.00 | |
| | | | |
Total dividends and/or distributions to shareholders | | | (5.52) | | | | (11.79) | | | | (1.58) | | | | (0.37) | | | | (0.17) | |
| |
Net asset value, end of period | | $ | 47.73 | | | $ | 54.80 | | | $ | 64.30 | | | $ | 57.37 | | | $ | 44.66 | |
| | | | |
|
| |
Total Return, at Net Asset Value3 | | | (2.43)% | | | | 3.27% | | | | 15.13% | | | | 29.43% | | | | 13.81% | |
|
| |
| |
Ratios/Supplemental Data | | | | | | | | | | | | | | | | | | | | |
Net assets, end of period (in thousands) | | $ | 295,226 | | | $ | 317,737 | | | $ | 337,318 | | | $ | 364,214 | | | $ | 366,664 | |
| |
Average net assets (in thousands) | | $ | 287,933 | | | $ | 332,468 | | | $ | 343,254 | | | $ | 367,615 | | | $ | 382,196 | |
| |
Ratios to average net assets:4 | | | | | | | | | | | | | | | | | | | | |
Net investment income (loss) | | | 0.00%5 | | | | 0.12% | | | | (0.10)% | | | | 0.20% | | | | 0.71% | |
Expenses excluding specific expenses listed below | | | 1.08% | | | | 1.06% | | | | 1.05% | | | | 1.06% | | | | 1.06% | |
Interest and fees from borrowings | | | 0.00%5 | | | | 0.00%5 | | | | 0.00% | | | | 0.00% | | | | 0.00% | |
| | | | |
Total expenses6 | | | 1.08% | | | | 1.06% | | | | 1.05% | | | | 1.06% | | | | 1.06% | |
| Expenses after payments, waivers and/or reimbursements and reduction to custodian expenses | | | 1.05% | | | | 1.05% | | | | 1.05%7 | | | | 1.05% | | | | 1.05% | |
| |
Portfolio turnover rate | | | 114% | | | | 60% | | | | 61% | | | | 77% | | | | 28% | |
1. Per share amounts calculated based on the average shares outstanding during the period.
2. Less than $0.005 per share.
3. Assumes an initial investment on the business day before the first day of the fiscal period, with all dividends and distributions reinvested in additional shares on the reinvestment date, and redemption at the net asset value calculated on the last business day of the fiscal period. Total returns are not annualized for periods less than one full year. Total return information does not reflect expenses that apply at the separate account level or to related insurance products. Inclusion of these charges would reduce the total return figures for all periods shown. Returns do not reflect the deduction of taxes that a shareholder would pay on fund distributions or the redemption of fund shares.
4. Annualized for periods less than one full year.
5. Less than 0.005%.
6. Total expenses including indirect expenses from affiliated fund fees and expenses were as follows:
| | |
Year Ended December 31, 2016 | | 1.08% |
Year Ended December 31, 2015 | | 1.06% |
Year Ended December 31, 2014 | | 1.05% |
Year Ended December 31, 2013 | | 1.06% |
Year Ended December 31, 2012 | | 1.06% |
7. Waiver was less than 0.005%.
See accompanying Notes to Financial Statements.
14 OPPENHEIMER CAPITAL APPRECIATION FUND/VA
NOTES TO FINANCIAL STATEMENTS December 31, 2016
1. Organization
Oppenheimer Capital Appreciation Fund/VA (the “Fund”), a separate series of Oppenheimer Variable Account Funds, is a diversified open-end management investment company registered under the Investment Company Act of 1940 (“1940 Act”), as amended. The Fund’s investment objective is to seek capital appreciation. The Fund’s investment adviser is OFI Global Asset Management, Inc. (“OFI Global” or the “Manager”), a wholly-owned subsidiary of OppenheimerFunds, Inc. (“OFI” or the “Sub-Adviser”). The Manager has entered into a sub-advisory agreement with OFI. Shares of the Fund are sold only to separate accounts of life insurance companies.
The Fund offers two classes of shares. Both classes are sold at their offering price, which is the net asset value per share, to separate investment accounts of participating insurance companies as an underlying investment for variable life insurance policies, variable annuity contracts or other investment products. The class of shares designated as Service shares is subject to a distribution and service plan. Both classes of shares have identical rights and voting privileges with respect to the Fund in general and exclusive voting rights on matters that affect that class alone. Earnings, net assets and net asset value per share may differ due to each class having its own expenses, such as transfer and shareholder servicing agent fees and shareholder communications, directly attributable to that class.
The following is a summary of significant accounting policies followed in the Fund’s preparation of financial statements in accordance with accounting principles generally accepted in the United States (“U.S. GAAP”).
2. Significant Accounting Policies
Security Valuation. All investments in securities are recorded at their estimated fair value, as described in Note 3.
Foreign Currency Translation. The books and records of the Fund are maintained in U.S. dollars. Any foreign currency amounts are translated into U.S. dollars on the following basis:
(1) Market value of investment securities, other assets and liabilities — at the exchange rates prevailing at Market Close as described in Note 3.
(2) Purchases and sales of investment securities, income and expenses — at the rates of exchange prevailing on the respective dates of such transactions.
Although the net assets and the market values are presented at the foreign exchange rates at Market Close, the Fund does not isolate the portion of the results of operations resulting from changes in foreign exchange rates on investments from the fluctuations arising from changes in market prices of securities held. Such fluctuations are included with the net realized and unrealized gains or losses from investments shown in the Statement of Operations.
For securities, which are subject to foreign withholding tax upon disposition, realized gains or losses on such securities are recorded net of foreign withholding tax.
Reported net realized foreign exchange gains or losses arise from sales of foreign currencies, currency gains or losses realized between the trade and settlement dates on securities transactions, the difference between the amounts of dividends, interest, and foreign withholding tax reclaims recorded on Fund’s books, and the U.S. dollar equivalent of the amounts actually received or paid. Net unrealized foreign exchange gains and losses arise from changes in the value of assets and liabilities other than investments in securities, resulting from changes in the exchange rate.
Allocation of Income, Expenses, Gains and Losses. Income, expenses (other than those attributable to a specific class), gains and losses are allocated on a daily basis to each class of shares based upon the relative proportion of net assets represented by such class. Operating expenses directly attributable to a specific class are charged against the operations of that class.
Dividends and Distributions to Shareholders. Dividends and distributions to shareholders, which are determined in accordance with income tax regulations and may differ from U.S. GAAP, are recorded on the ex-dividend date. Income and capital gain distributions, if any, are declared and paid annually or at other times as deemed necessary by the Manager.
Investment Income. Dividend income is recorded on the ex-dividend date or upon ex-dividend notification in the case of certain foreign dividends where the ex-dividend date may have passed. Non-cash dividends included in dividend income, if any, are recorded at the fair market value of the securities received. Interest income is recognized on an accrual basis. Discount and premium, which are included in interest income on the Statement of Operations, are amortized or accreted daily.
Return of Capital Estimates. Distributions received from the Fund’s investments in Master Limited Partnerships (MLPs) and Real Estate Investments Trusts (REITs), generally are comprised of income and return of capital. The Fund records investment income and return of capital based on estimates. Such estimates are based on historical information available from each MLP, REIT and other industry sources. These estimates may subsequently be revised based on information received from MLPs and REITs after their tax reporting periods are concluded.
Custodian Fees. “Custodian fees and expenses” in the Statement of Operations may include interest expense incurred by the Fund on any cash overdrafts of its custodian account during the period. Such cash overdrafts may result from the effects of failed trades in portfolio securities and from cash outflows resulting from unanticipated shareholder redemption activity. The Fund pays interest to its custodian on such cash overdrafts, to the extent they are not offset by positive cash balances maintained by the Fund, at a rate equal to the Federal Funds Rate plus 0.50%. This rate will increase to 2.00% effective January 1, 2017. The “Reduction to custodian expenses” line item, if applicable, represents earnings on cash balances maintained by the Fund during the period. Such interest expense and other custodian fees may be paid with these earnings.
15 OPPENHEIMER CAPITAL APPRECIATION FUND/VA
NOTES TO FINANCIAL STATEMENTS Continued
2. Significant Accounting Policies (Continued)
Security Transactions. Security transactions are recorded on the trade date. Realized gains and losses on securities sold are determined on the basis of identified cost.
Indemnifications. The Fund’s organizational documents provide current and former Trustees and officers with a limited indemnification against liabilities arising in connection with the performance of their duties to the Fund. In the normal course of business, the Fund may also enter into contracts that provide general indemnifications. The Fund’s maximum exposure under these arrangements is unknown as this would be dependent on future claims that may be made against the Fund. The risk of material loss from such claims is considered remote.
Federal Taxes. The Fund intends to comply with provisions of the Internal Revenue Code applicable to regulated investment companies and to distribute substantially all of its investment company taxable income, including any net realized gain on investments not offset by capital loss carryforwards, if any, to shareholders. Therefore, no federal income or excise tax provision is required. The Fund files income tax returns in U.S. federal and applicable state jurisdictions. The statute of limitations on the Fund’s tax return filings generally remains open for the three preceding fiscal reporting period ends. The Fund has analyzed its tax positions for the fiscal year ended December 31, 2016, including open tax years, and does not believe there are any uncertain tax positions requiring recognition in the Fund’s financial statements.
The tax components of capital shown in the following table represent distribution requirements the Fund must satisfy under the income tax regulations, losses the Fund may be able to offset against income and gains realized in future years and unrealized appreciation or depreciation of securities and other investments for federal income tax purposes.
| | | | | | | | | | | | |
Undistributed Net Investment Income | | Undistributed
Long-Term
Gain | | | Accumulated
Loss
Carryforward1,2 | | | Net Unrealized
Appreciation
Based on cost of
Securities and
Other Investments
for Federal Income
Tax Purposes | |
| |
$1,290,709 | | | $76,705,372 | | | | $— | | | | $95,897,357 | |
1. During the reporting period, the Fund did not utilize any capital loss carryforward.
2. During the previous reporting period, the Fund did not utilize any capital loss carryforward.
Net investment income (loss) and net realized gain (loss) may differ for financial statement and tax purposes. The character of dividends and distributions made during the fiscal year from net investment income or net realized gains are determined in accordance with federal income tax requirements, which may differ from the character of net investment income or net realized gains presented in those financial statements in accordance with U.S. GAAP. Also, due to timing of dividends and distributions, the fiscal year in which amounts are distributed may differ from the fiscal year in which the income or net realized gain was recorded by the Fund.
Accordingly, the following amounts have been reclassified for the reporting period. Net assets of the Fund were unaffected by the reclassifications.
| | | | |
Increase to Paid-in Capital | | Reduction
to Accumulated Net
Realized Gain
on Investments3 | |
| |
$7,314,047 | | | $7,314,047 | |
3. $7,314,047, all of which was long-term capital gain, was distributed in connection with Fund share redemptions.
The tax character of distributions paid during the reporting periods:
| | | | | | | | |
| | | Year Ended
December 31, 2016 | | | Year Ended
December 31, 2015 | |
| |
Distributions paid from: | | | | | | | | |
Ordinary income | | $ | 2,442,452 | | | $ | 24,673,136 | |
Long-term capital gain | | | 82,923,786 | | | | 141,951,786 | |
| | | | |
Total | | $ | 85,366,238 | | | $ | 166,624,922 | |
| | | | |
The aggregate cost of securities and other investments and the composition of unrealized appreciation and depreciation of securities and other investments for federal income tax purposes at period end are noted in the following table. The primary difference between book and tax appreciation or depreciation of securities and other investments, if applicable, is attributable to the tax deferral of losses or tax realization of financial statement unrealized gain or loss.
| | | | |
Federal tax cost of securities | | | $ 706,580,321 | |
| | | | |
Gross unrealized appreciation | | | $ 107,689,169 | |
Gross unrealized depreciation | | | (11,791,812) | |
| | | | |
Net unrealized appreciation | | | $ 95,897,357 | |
| | | | |
Use of Estimates. The preparation of financial statements in conformity with U.S. GAAP requires management to make estimates and assumptions
16 OPPENHEIMER CAPITAL APPRECIATION FUND/VA
2. Significant Accounting Policies (Continued)
that affect the reported amounts of assets and liabilities and disclosure of contingent assets and liabilities at the date of the financial statements and the reported amounts of increases and decreases in net assets from operations during the reporting period. Actual results could differ from those estimates.
3. Securities Valuation
The Fund calculates the net asset value of its shares as of 4:00 P.M. Eastern time, on each day the New York Stock Exchange (the “Exchange”) is open for trading, except in the case of a scheduled early closing of the Exchange, in which case the Fund will calculate net asset value of the shares as of the scheduled early closing time of the Exchange.
The Fund’s Board has adopted procedures for the valuation of the Fund’s securities and has delegated the day-to-day responsibility for valuation determinations under those procedures to the Manager. The Manager has established a Valuation Committee which is responsible for determining a “fair valuation” for any security for which market quotations are not “readily available.” The Valuation Committee’s fair valuation determinations are subject to review, approval and ratification by the Fund’s Board at its next regularly scheduled meeting covering the calendar quarter in which the fair valuation was determined.
Valuation Methods and Inputs
Securities are valued using unadjusted quoted market prices, when available, as supplied primarily by third party pricing services or dealers.
The following methodologies are used to determine the market value or the fair value of the types of securities described below:
Equity securities traded on a securities exchange (including exchange-traded derivatives other than futures and futures options) are valued based on the official closing price on the principal exchange on which the security is traded, as identified by the Manager, prior to the time when the Fund’s assets are valued. If the official closing price is unavailable, the security is valued at the last sale price on the principal exchange on which it is traded. If the official closing price or last sales price for a foreign security is not available, the security is valued at the mean between the bid and asked price per the exchange or, if not available from the exchange, obtained from two dealers. If bid and asked prices are not available from either the exchange or two dealers, the security is valued by using one of the following methodologies (listed in order of priority): (1) a bid from the exchange, (2) the mean between the bid and asked price as provided by a single dealer, or (3) a bid from a single dealer.
Shares of a registered investment company that are not traded on an exchange are valued at that investment company’s net asset value per share.
Corporate and government debt securities (of U.S. or foreign issuers) and municipal debt securities, event-linked bonds, loans, mortgage-backed securities, collateralized mortgage obligations, and asset-backed securities are valued at the mean between the “bid” and “asked” prices utilizing evaluated prices obtained from third party pricing services or broker-dealers who may use matrix pricing methods to determine the evaluated prices.
Short-term money market type debt securities are valued at the mean between the “bid” and “asked” prices utilizing evaluated prices obtained from third party pricing services or broker-dealers.
A description of the standard inputs that may generally be considered by the third party pricing vendors in determining their evaluated prices is provided below.
| | |
| Security Type | | Standard inputs generally considered by third-party pricing vendors |
| Corporate debt, government debt, municipal, mortgage- backed and asset-backed securities | | Reported trade data, broker-dealer price quotations, benchmark yields, issuer spreads on comparable securities, the credit quality, yield, maturity, and other appropriate factors. |
| Loans | | Information obtained from market participants regarding reported trade data and broker-dealer price quotations. |
| Event-linked bonds | | Information obtained from market participants regarding reported trade data and broker-dealer price quotations. |
If a market value or price cannot be determined for a security using the methodologies described above, or if, in the “good faith” opinion of the Manager, the market value or price obtained does not constitute a “readily available market quotation,” or a significant event has occurred that would materially affect the value of the security, the security is fair valued either (i) by a standardized fair valuation methodology applicable to the security type or the significant event as previously approved by the Valuation Committee and the Fund’s Board or (ii) as determined in good faith by the Manager’s Valuation Committee. The Valuation Committee considers all relevant facts that are reasonably available, through either public information or information available to the Manager, when determining the fair value of a security. Fair value determinations by the Manager are subject to review, approval and ratification by the Fund’s Board at its next regularly scheduled meeting covering the calendar quarter in which the fair valuation was determined. Those fair valuation standardized methodologies include, but are not limited to, valuing securities at the last sale price or initially at cost and subsequently adjusting the value based on: changes in company specific fundamentals, changes in an appropriate securities index, or changes in the value of similar securities which may be further adjusted for any discounts related to security-specific resale restrictions. When possible, such methodologies use observable market inputs such as unadjusted quoted prices of similar securities, observable interest rates, currency rates and yield curves. The methodologies used for valuing securities are not necessarily an indication of the risks associated with investing in those securities nor can it be assured that the Fund can obtain the fair value assigned to a security if it were to sell the security.
To assess the continuing appropriateness of security valuations, the Manager, or its third party service provider who is subject to oversight by the Manager, regularly compares prior day prices, prices on comparable securities, and sale prices to the current day prices and challenges those prices exceeding certain tolerance levels with the third party pricing service or broker source. For those securities valued by fair valuations, whether through
17 OPPENHEIMER CAPITAL APPRECIATION FUND/VA
NOTES TO FINANCIAL STATEMENTS Continued
3. Securities Valuation (Continued)
a standardized fair valuation methodology or a fair valuation determination, the Valuation Committee reviews and affirms the reasonableness of the valuations based on such methodologies and fair valuation determinations on a regular basis after considering all relevant information that is reasonably available.
Classifications
Each investment asset or liability of the Fund is assigned a level at measurement date based on the significance and source of the inputs to its valuation. Various data inputs are used in determining the value of each of the Fund’s investments as of the reporting period end. These data inputs are categorized in the following hierarchy under applicable financial accounting standards:
1) Level 1-unadjusted quoted prices in active markets for identical assets or liabilities (including securities actively traded on a securities exchange)
2) Level 2-inputs other than unadjusted quoted prices that are observable for the asset or liability (such as unadjusted quoted prices for similar assets and market corroborated inputs such as interest rates, prepayment speeds, credit risks, etc.)
3) Level 3-significant unobservable inputs (including the Manager’s own judgments about assumptions that market participants would use in pricing the asset or liability).
The inputs used for valuing securities are not necessarily an indication of the risks associated with investing in those securities.
The Fund classifies each of its investments in investment companies which are publicly offered as Level 1. Investment companies that are not publicly offered are measured using net asset value as a practical expedient, and are not classified in the fair value hierarchy.
The table below categorizes amounts that are included in the Fund’s Statement of Assets and Liabilities at period end based on valuation input level:
| | | | | | | | | | | | | | | | |
| | | Level 1—
Unadjusted Quoted Prices | | | Level 2— Other Significant Observable Inputs | | | Level 3— Significant Unobservable Inputs | | | Value | |
| |
Assets Table | | | | | | | | | | | | | | | | |
Investments, at Value: | | | | | | | | | | | | | | | | |
Common Stocks | | | | | | | | | | | | | | | | |
Consumer Discretionary | | $ | 135,957,781 | | | $ | — | | | $ | — | | | $ | 135,957,781 | |
Consumer Staples | | | 62,234,512 | | | | — | | | | — | | | | 62,234,512 | |
Energy | | | 17,956,787 | | | | — | | | | — | | | | 17,956,787 | |
Financials | | | 45,041,469 | | | | — | | | | — | | | | 45,041,469 | |
Health Care | | | 130,434,344 | | | | — | | | | — | | | | 130,434,344 | |
Industrials | | | 75,905,311 | | | | — | | | | — | | | | 75,905,311 | |
Information Technology | | | 283,539,152 | | | | — | | | | — | | | | 283,539,152 | |
Materials | | | 10,011,982 | | | | — | | | | — | | | | 10,011,982 | |
Utilities | | | 10,113,516 | | | | — | | | | — | | | | 10,113,516 | |
Investment Company | | | 31,306,028 | | | | — | | | | — | | | | 31,306,028 | |
| | | | |
Total Assets | | $ | 802,500,882 | | | $ | — | | | $ | — | | | $ | 802,500,882 | |
| | | | |
Forward currency exchange contracts and futures contracts, if any, are reported at their unrealized appreciation/depreciation at measurement date, which represents the change in the contract’s value from trade date. All additional assets and liabilities included in the above table are reported at their market value at measurement date.
4. Investments and Risks
Investments in Affiliated Funds. The Fund is permitted to invest in other mutual funds advised by the Manager (“Affiliated Funds”). Affiliated Funds are open-end management investment companies registered under the 1940 Act, as amended. The Manager is the investment adviser of, and the Sub-Adviser provides investment and related advisory services to, the Affiliated Funds. When applicable, the Fund’s investments in Affiliated Funds are included in the Statement of Investments. Shares of Affiliated Funds are valued at their net asset value per share. As a shareholder, the Fund is subject to its proportional share of the Affiliated Funds’ expenses, including their management fee. The Manager will waive fees and/or reimburse Fund expenses in an amount equal to the indirect management fees incurred through the Fund’s investment in the Affiliated Funds.
Each of the Affiliated Funds in which the Fund invests has its own investment risks, and those risks can affect the value of the Fund’s investments and therefore the value of the Fund’s shares. To the extent that the Fund invests more of its assets in one Affiliated Fund than in another, the Fund will have greater exposure to the risks of that Affiliated Fund.
Investments in Money Market Instruments. The Fund is permitted to invest its free cash balances in money market instruments to provide liquidity or for defensive purposes. The Fund may invest in money market instruments by investing in Class E shares of Oppenheimer Institutional Government Money Market Fund (“IGMMF”), formerly known as Oppenheimer Institutional Money Market Fund, which is an Affiliated Fund. IGMMF is regulated as a money market fund under the 1940 Act, as amended. The Fund may also invest in money market instruments directly or in other affiliated or unaffiliated money market funds.
Master Limited Partnerships (“MLPs”). MLPs issue common units that represent an equity ownership interest in a partnership and provide limited
18 OPPENHEIMER CAPITAL APPRECIATION FUND/VA
4. Investments and Risks (Continued)
voting rights. MLP common units are registered with the Securities and Exchange Commission (“SEC”), and are freely tradable on securities exchanges such as the NYSE and the NASDAQ Stock Market (“NASDAQ”), or in the over-the-counter (“OTC”) market. An MLP consists of one or more general partners, who conduct the business, and one or more limited partners, who contribute capital. MLP common unit holders have a limited role in the partnership’s operations and management. The Fund, as a limited partner, normally would not be liable for the debts of the MLP beyond the amounts the Fund has contributed, but would not be shielded to the same extent that a shareholder of a corporation would be. In certain circumstances creditors of an MLP would have the right to seek return of capital distributed to a limited partner. This right of an MLP’s creditors would continue after the Fund sold its investment in the MLP.
Equity Security Risk. Stocks and other equity securities fluctuate in price. The value of the Fund’s portfolio may be affected by changes in the equity markets generally. Equity markets may experience significant short-term volatility and may fall sharply at times. Different markets may behave differently from each other and U.S. equity markets may move in the opposite direction from one or more foreign stock markets. Adverse events in any part of the equity or fixed-income markets may have unexpected negative effects on other market segments.
The prices of individual equity securities generally do not all move in the same direction at the same time and a variety of factors can affect the price of a particular company’s securities. These factors may include, but are not limited to, poor earnings reports, a loss of customers, litigation against the company, general unfavorable performance of the company’s sector or industry, or changes in government regulations affecting the company or its industry.
Shareholder Concentration. At period end, one shareholder owned 20% or more of the Fund’s total outstanding shares.
The shareholder is a related party of the Fund. Related parties may include, but are not limited to, the investment manager and its affiliates, affiliated broker dealers, fund of funds, and directors or employees. The related party owned 50% of the Fund’s total outstanding shares at period end.
5. Market Risk Factors
The Fund’s investments in securities and/or financial derivatives may expose the Fund to various market risk factors:
Commodity Risk. Commodity risk relates to the change in value of commodities or commodity indexes as they relate to increases or decreases in the commodities market. Commodities are physical assets that have tangible properties. Examples of these types of assets are crude oil, heating oil, metals, livestock, and agricultural products.
Credit Risk. Credit risk relates to the ability of the issuer of debt to meet interest and principal payments, or both, as they come due. In general, lower-grade, higher-yield debt securities are subject to credit risk to a greater extent than lower-yield, higher-quality securities.
Equity Risk. Equity risk relates to the change in value of equity securities as they relate to increases or decreases in the general market.
Foreign Exchange Rate Risk. Foreign exchange rate risk relates to the change in the U.S. dollar value of a security held that is denominated in a foreign currency. The U.S. dollar value of a foreign currency denominated security will decrease as the dollar appreciates against the currency, while the U.S. dollar value will increase as the dollar depreciates against the currency.
Interest Rate Risk. Interest rate risk refers to the fluctuations in value of fixed-income securities resulting from the inverse relationship between price and yield. For example, an increase in general interest rates will tend to reduce the market value of already issued fixed-income investments, and a decline in general interest rates will tend to increase their value. In addition, debt securities with longer maturities, which tend to have higher yields, are subject to potentially greater fluctuations in value from changes in interest rates than obligations with shorter maturities.
Volatility Risk. Volatility risk refers to the magnitude of the movement, but not the direction of the movement, in a financial instrument’s price over a defined time period. Large increases or decreases in a financial instrument’s price over a relative time period typically indicate greater volatility risk, while small increases or decreases in its price typically indicate lower volatility risk.
6. Shares of Beneficial Interest
The Fund has authorized an unlimited number of $0.001 par value shares of beneficial interest of each class. Transactions in shares of beneficial interest were as follows:
| | | | | | | | | | | | | | | | |
| | | Year Ended December 31, 2016 | | | Year Ended December 31, 2015 | |
| | | Shares | | | Amount | | | Shares | | | Amount | |
| |
Non-Service Shares | | | | | | | | | | | | | | | | |
Sold | | | 575,681 | | | $ | 28,663,769 | | | | 257,353 | | | $ | 15,042,314 | |
Dividends and/or distributions reinvested | | | 1,203,259 | | | | 55,939,521 | | | | 1,895,571 | | | | 106,739,631 | |
Redeemed | | | (1,577,136) | | | | (77,972,539) | | | | (1,488,512) | | | | (89,170,619) | |
| | | | |
Net increase | | | 201,804 | | | $ | 6,630,751 | | | | 664,412 | | | $ | 32,611,326 | |
| | | | |
|
| |
Service Shares | | | | | | | | | | | | | | | | |
Sold | | | 1,273,302 | | | $ | 61,113,815 | | | | 931,104 | | | $ | 54,653,065 | |
Dividends and/or distributions reinvested | | | 640,546 | | | | 29,426,717 | | | | 1,075,333 | | | | 59,885,291 | |
Redeemed | | | (1,525,798) | | | | (75,064,649) | | | | (1,455,061) | | | | (84,418,946) | |
| | | | |
Net increase | | | 388,050 | | | $ | 15,475,883 | | | | 551,376 | | | $ | 30,119,410 | |
| | | | |
17 OPPENHEIMER CAPITAL APPRECIATION FUND/VA
NOTES TO FINANCIAL STATEMENTS Continued
7. Purchases and Sales of Securities
The aggregate cost of purchases and proceeds from sales of securities, other than short-term obligations and investments in IGMMF, for the reporting period were as follows:
| | | | | | | | |
| | | Purchases | | | Sales | |
| |
Investment securities | | $ | 894,252,796 | | | | $979,284,795 | |
8. Fees and Other Transactions with Affiliates
Management Fees. Under the investment advisory agreement, the Fund pays the Manager a management fee based on the daily net assets of the Fund at an annual rate as shown in the following table:
| | |
| Fee Schedule |
|
Up to $200 million | | 0.75% |
Next $200 million | | 0.72 |
Next $200 million | | 0.69 |
Next $200 million | | 0.66 |
Next $200 million | | 0.60 |
Over $1 billion | | 0.58 |
The Fund’s effective management fee for the reporting period was 0.70% of average annual net assets before any applicable waivers.
Sub-Adviser Fees. The Manager has retained the Sub-Adviser to provide the day-to-day portfolio management of the Fund. Under the Sub-Advisory Agreement, the Manager pays the Sub-Adviser an annual fee in monthly installments, equal to a percentage of the investment management fee collected by the Manager from the Fund, which shall be calculated after any investment management fee waivers. The fee paid to the Sub-Adviser is paid by the Manager, not by the Fund.
Transfer Agent Fees. OFI Global (the “Transfer Agent”) serves as the transfer and shareholder servicing agent for the Fund. The Fund pays the Transfer Agent a fee based on annual net assets. Fees incurred and average net assets for each class with respect to these services are detailed in the Statement of Operations and Financial Highlights, respectively.
Sub-Transfer Agent Fees. The Transfer Agent has retained Shareholder Services, Inc., a wholly-owned subsidiary of OFI (the “Sub-Transfer Agent”), to provide the day-to-day transfer agent and shareholder servicing of the Fund. Under the Sub-Transfer Agency Agreement, the Transfer Agent pays the Sub-Transfer Agent an annual fee in monthly installments, equal to a percentage of the transfer agent fee collected by the Transfer Agent from the Fund, which shall be calculated after any applicable fee waivers. The fee paid to the Sub-Transfer Agent is paid by the Transfer Agent, not by the Fund.
Trustees’ Compensation. The Fund’s Board of Trustees (“Board”) has adopted a compensation deferral plan for Independent Trustees that enables Trustees to elect to defer receipt of all or a portion of the annual compensation they are entitled to receive from the Fund. For purposes of determining the amount owed to the Trustees under the plan, deferred amounts are treated as though equal dollar amounts had been invested in shares of the Fund or in other Oppenheimer funds selected by the Trustees. The Fund purchases shares of the funds selected for deferral by the Trustees in amounts equal to his or her deemed investment, resulting in a Fund asset equal to the deferred compensation liability. Such assets are included as a component of “Other” within the asset section of the Statement of Assets and Liabilities. Deferral of Trustees’ fees under the plan will not affect the net assets of the Fund and will not materially affect the Fund’s assets, liabilities or net investment income per share. Amounts will be deferred until distributed in accordance with the compensation deferral plan.
Distribution and Service Plan for Service Shares. The Fund has adopted a Distribution and Service Plan (the “Plan”) pursuant to Rule 12b-1 under the 1940 Act for Service shares to pay OppenheimerFunds Distributor, Inc. (the “Distributor”), for distribution related services, personal service and account maintenance for the Fund’s Service shares. Under the Plan, payments are made periodically at an annual rate of 0.25% of the daily net assets of Service shares of the Fund. The Distributor currently uses all of those fees to compensate sponsors of the insurance product that offers Fund shares, for providing personal service and maintenance of accounts of their variable contract owners that hold Service shares. These fees are paid out of the Fund’s assets on an on-going basis and increase operating expenses of the Service shares, which results in lower performance compared to the Fund’s shares that are not subject to a service fee. Fees incurred by the Fund under the Plan are detailed in the Statement of Operations.
Waivers and Reimbursements of Expenses. The Manager has contractually agreed to limit the Fund’s expenses after payments, waivers and/or reimbursements and reduction to custodian expenses, excluding any applicable dividend expense, taxes, interest and fees from borrowing, any subsidiary expenses, Acquired Fund Fees and Expenses, brokerage commissions, unusual and infrequent expenses and certain other Fund expenses; so that those expenses, as percentages of daily net assets, will not exceed the annual rate of 0.80% for Non-Service shares and 1.05% for Service shares. During the reporting period, the Manager waived fees and/or reimbursed the Fund $138,123 and $77,264 for Non-Service and Service shares, respectively.
The Manager will waive fees and/or reimburse Fund expenses in an amount equal to the indirect management fees incurred through the Fund’s investment in IGMMF. During the reporting period, the Manager waived fees and/or reimbursed the Fund $ 18,578 for IGMMF management fees.
Waivers and/or reimbursements may be modified or terminated as set forth according to the terms in the prospectus.
20 OPPENHEIMER CAPITAL APPRECIATION FUND/VA
9. Borrowings and Other Financing
Joint Credit Facility. A number of mutual funds managed by the Manager participate in a $1.3 billion revolving credit facility (the “Facility”) intended to provide short-term financing, if necessary, subject to certain restrictions in connection with atypical redemption activity. Expenses and fees related to the Facility are paid by the participating funds and are disclosed separately or as other expenses on the Statement of Operations. The Fund did not utilize the Facility during the reporting period.
10. Pending Litigation
In 2009, several putative class action lawsuits were filed and later consolidated before the U.S. District Court for the District of Colorado in connection with the investment performance of Oppenheimer Rochester California Municipal Fund (the “California Fund”), a fund advised by OppenheimerFunds, Inc. (“OFI”) and distributed by OppenheimerFunds Distributor, Inc. (“OFDI”). The plaintiffs asserted claims against OFI, OFDI and certain present and former trustees and officers of the California Fund under the federal securities laws, alleging, among other things, that the disclosure documents of the California Fund contained misrepresentations and omissions and the investment policies of the California Fund were not followed. An amended complaint and a motion to dismiss were filed, and in 2011, the court issued an order which granted in part and denied in part the defendants’ motion to dismiss. In October 2015, following a successful appeal by defendants and a subsequent hearing, the court granted plaintiffs’ motion for class certification and appointed class representatives and class counsel.
OFI and OFDI believe the suit is without merit; that it is premature to render any opinion as to the likelihood of an outcome unfavorable to them in the suit; and that no estimate can yet be made as to the amount or range of any potential loss. Furthermore, OFI believes that the suit should not impair the ability of OFI or OFDI to perform their respective duties to the Fund and that the outcome of the suit should not have any material effect on the operations of any of the Oppenheimer funds.
21 OPPENHEIMER CAPITAL APPRECIATION FUND/VA
REPORT OF INDEPENDENT REGISTERED PUBLIC ACCOUNTING FIRM
The Board of Trustees and Shareholders of Oppenheimer Variable Account Funds:
We have audited the accompanying statement of assets and liabilities of Oppenheimer Capital Appreciation Fund/VA (a separate series of Oppenheimer Variable Account Funds), including the statement of investments, as of December 31, 2016, and the related statement of operations for the year then ended, the statements of changes in net assets for each of the years in the two-year period then ended, and the financial highlights for each of the years in the five-year period then ended. These financial statements and financial highlights are the responsibility of the Fund’s management. Our responsibility is to express an opinion on these financial statements and financial highlights based on our audits.
We conducted our audits in accordance with the standards of the Public Company Accounting Oversight Board (United States). Those standards require that we plan and perform the audit to obtain reasonable assurance about whether the financial statements and financial highlights are free of material misstatement. An audit includes examining, on a test basis, evidence supporting the amounts and disclosures in the financial statements. Our procedures included confirmation of securities owned as of December 31, 2016, by correspondence with the custodian, transfer agent and brokers, or by other appropriate auditing procedures where replies from brokers were not received. An audit also includes assessing the accounting principles used and significant estimates made by management, as well as evaluating the overall financial statement presentation. We believe that our audits provide a reasonable basis for our opinion.
In our opinion, the financial statements and financial highlights referred to above present fairly, in all material respects, the financial position of Oppenheimer Capital Appreciation Fund/VA as of December 31, 2016, the results of its operations for the year then ended, the changes in its net assets for each of the years in the two-year period then ended, and the financial highlights for each of the years in the five-year period then ended, in conformity with U.S. generally accepted accounting principles.
KPMG LLP
Denver, Colorado
February 15, 2017
22 OPPENHEIMER CAPITAL APPRECIATION FUND/VA
FEDERAL INCOME TAX INFORMATION Unaudited
In early 2017, if applicable, shareholders of record received information regarding all dividends and distributions paid to them by the Fund during calendar year 2016.
Capital gain distributions of $5.46372 per share were paid to Non-Service and Service shareholders, respectively, on June 21, 2016. Whether received in stock or in cash, the capital gain distribution should be treated by shareholders as a gain from the sale of the capital assets held for more than one year (long-term capital gains).
Dividends, if any, paid by the Fund during the reporting period which are not designated as capital gain distributions should be multiplied by the maximum amount allowable but not less than 100% to arrive at the amount eligible for the corporate dividend-received deduction.
The foregoing information is presented to assist shareholders in reporting distributions received from the Fund to the Internal Revenue Service. Because of the complexity of the federal regulations which may affect your individual tax return and the many variations in state and local tax regulations, we recommend that you consult your tax advisor for specific guidance.
23 OPPENHEIMER CAPITAL APPRECIATION FUND/VA
BOARD APPROVAL OF THE FUND’S INVESTMENT ADVISORY AND SUB-ADVISORY AGREEMENTS Unaudited
The Fund has entered into an investment advisory agreement with OFI Global Asset Management, Inc. (“OFI Global” or the “Adviser”), a wholly-owned subsidiary of OppenheimerFunds, Inc. (“OFI” or the “Sub-Adviser”) (“OFI Global” and “OFI” together the “Managers”) and OFI Global has entered into a sub-advisory agreement with OFI whereby OFI provides investment sub-advisory services to the Fund (collectively, the “Agreements”). Each year, the Board of Trustees (the “Board”), including a majority of the independent Trustees, is required to determine whether to approve the terms of the Agreements and the renewal thereof. The Investment Company Act of 1940, as amended, requires that the Board request and evaluate, and that the Managers provide, such information as may be reasonably necessary to evaluate the terms of the Agreements. The Board employs an independent consultant to prepare a report that provides information, including comparative information that the Board requests for that purpose. In addition to in-person meetings focused on this evaluation, the Board receives information throughout the year regarding Fund services, fees, expenses and performance.
The Managers and the independent consultant provided information to the Board on the following factors:
(i) the nature, quality and extent of the Managers’ services, (ii) the comparative investment performance of the Fund and the Managers, (iii) the fees and expenses of the Fund, including comparative fee and expense information, (iv) the profitability of the Managers and their affiliates, including an analysis of the cost of providing services, (v) whether economies of scale are realized as the Fund grows and whether fee levels reflect these economies of scale for Fund investors and (vi) other benefits to the Managers from their relationship with the Fund. The Board was aware that there are alternatives to retaining the Managers.
Outlined below is a summary of the principal information considered by the Board as well as the Board’s conclusions.
Nature, Quality and Extent of Services. The Board considered information about the nature, quality and extent of the services provided to the Fund and information regarding the Managers’ key personnel who provide such services. The Managers’ duties include providing the Fund with the services of the portfolio manager and the Sub-Adviser’s investment team, who provide research, analysis and other advisory services in regard to the Fund’s investments; and securities trading services. OFI Global is responsible for oversight of third-party service providers; monitoring compliance with applicable Fund policies and procedures and adherence to the Fund’s investment restrictions; risk management; and oversight of the Sub-Adviser. OFI Global is also responsible for providing certain administrative services to the Fund. Those services include providing and supervising all administrative and clerical personnel who are necessary in order to provide effective corporate administration for the Fund; compiling and maintaining records with respect to the Fund’s operations; preparing and filing reports required by the U.S. Securities and Exchange Commission; preparing periodic reports regarding the operations of the Fund for its shareholders; preparing proxy materials for shareholder meetings; and preparing the registration statements required by federal and state securities laws for the sale of the Fund’s shares. OFI Global also provides the Fund with office space, facilities and equipment.
The Board also considered the quality of the services provided and the quality of the Managers’ resources that are available to the Fund. The Board took account of the fact that the Sub-Adviser has over fifty years of experience as an investment adviser and that its assets under management rank it among the top mutual fund managers in the United States. The Board evaluated the Managers’ advisory, administrative, accounting, legal, compliance and risk management services, and information the Board has received regarding the experience and professional qualifications of the Managers’ key personnel and the size and functions of its staff. In its evaluation of the quality of the portfolio management services provided, the Board considered the experience of Paul Larson, the portfolio manager for the Fund, and the Sub-Adviser’s investment team and analysts. The Board members also considered the totality of their experiences with the Managers as directors or trustees of the Fund and other funds advised by the Managers. The Board considered information regarding the quality of services provided by affiliates of the Managers, which the Board members have become knowledgeable about through their experiences with the Managers and in connection with the renewal of the Fund’s service agreements. The Board concluded, in light of the Managers’ experience, reputation, personnel, operations and resources that the Fund benefits from the services provided under the Agreements.
Investment Performance of the Managers and the Fund. Throughout the year, the Managers provided information on the investment performance of the Fund, the Adviser and the Sub-Adviser, including comparative performance information. The Board also reviewed information, prepared by the Managers and by the independent consultant, comparing the Fund’s historical performance to relevant market indices and to the performance of other large growth funds underlying variable insurance products. The Board noted that the Fund underperformed its category median during the one-, three-, five- and ten-year periods. The Board also noted that the Fund outperformed its category median in 2014, though it underperformed its category median in 2015. The Board considered that Michael Kotlarz took over sole portfolio management responsibilities on May 31, 2013 and has been fully accountable for the Fund’s performance since June 30, 2013. The Board further considered that the Fund’s recent underperformance has been relatively concentrated in a short time period from February to April 2016, during which time there was an unprecedented sharp sell-off in high growth momentum companies. The Board noted the Adviser’s assertion that the Fund has had top quartile results since the end of March 2016 and that it outperformed its category for the quarter ended June 30, 2016.
Fees and Expenses of the Fund. The Board reviewed the fees paid to the Adviser and the other expenses borne by the Fund. The Board noted that the Adviser, not the Fund, pays the Sub-Adviser’s fee under the sub-advisory agreement. The independent consultant provided comparative data in regard to the fees and expenses of the Fund and other large growth funds underlying variable insurance products. In reviewing the fees and expenses charged to the VA funds, the Board considered the Adviser’s assertion that, because there is much greater disparity in the fees and services that may be provided by a manager to a VA fund as opposed to a retail fund, when comparing the expenses of the various VA funds to those of retail funds, it is most appropriate to focus on total expenses (rather than on the management fees). Accordingly, while the Board reviewed and considered all expenses, it focused on total expenses. The Board considered that the Fund’s total expenses were higher than its peer group median and its category median and that its contractual management fee was lower than its peer group median and category median. The Adviser has contractually agreed to limit the Fund’s total annual operating expenses so that those expenses, as percentages of daily net assets, will not exceed the annual rate of 0.80% for Non-Service Shares and 1.05% for Service Shares. This waiver and/or reimbursement may not be amended or withdrawn until one year from the date of the Fund’s prospectus, unless approved by the Board.
Economies of Scale and Profits Realized by the Managers. The Board considered information regarding the Managers’ costs in serving as the Fund’s investment adviser and sub-adviser, including the costs associated with the personnel and systems necessary to manage the Fund, and information regarding the Managers’ profitability from their relationship with the Fund. The Board also considered that the Managers must be able to pay and retain experienced professional personnel at competitive rates to provide quality services to the Fund. The Board reviewed whether the
24 OPPENHEIMER CAPITAL APPRECIATION FUND/VA
BOARD APPROVAL OF THE FUND’S INVESTMENT ADVISORY AND SUB-ADVISORY AGREEMENTS Unaudited / Continued
Managers may realize economies of scale in managing and supporting the Fund. The Board noted that the Fund currently has management fee breakpoints, which are intended to share with Fund shareholders economies of scale that may exist as the Fund’s assets grow.
Other Benefits to the Managers. In addition to considering the profits realized by the Managers, the Board considered information that was provided regarding the direct and indirect benefits the Managers receive as a result of their relationship with the Fund, including compensation paid to the Managers’ affiliates and research provided to the Adviser in connection with permissible brokerage arrangements (soft dollar arrangements).
Conclusions. These factors were also considered by the independent Trustees meeting separately from the full Board, assisted by experienced counsel to the Fund and to the independent Trustees. Fund counsel and the independent Trustees’ counsel are independent of the Managers within the meaning and intent of the Securities and Exchange Commission Rules.
Based on its review of the information it received and its evaluations described above, the Board, including a majority of the independent Trustees, decided to continue the Agreements through August 31, 2017. In arriving at its decision, the Board did not identify any factor or factors as being more important than others, but considered all of the above information, and considered the terms and conditions of the Agreements, including the management fees, in light of all the surrounding circumstances.
25 OPPENHEIMER CAPITAL APPRECIATION FUND/VA
PORTFOLIO PROXY VOTING POLICIES AND GUIDELINES; UPDATES TO STATEMENTS OF INVESTMENTS Unaudited
The Fund has adopted Portfolio Proxy Voting Policies and Guidelines under which the Fund votes proxies relating to securities (“portfolio proxies”) held by the Fund. A description of the Fund’s Portfolio Proxy Voting Policies and Guidelines is available (i) without charge, upon request, by calling the Fund toll-free at 1.800. CALL OPP (225.5677), (ii) on the Fund’s website at www.oppenheimerfunds.com, and (iii) on the SEC’s website at www.sec.gov. In addition, the Fund is required to file Form N-PX, with its complete proxy voting record for the 12 months ended June 30th, no later than August 31st of each year. The Fund’s voting record is available (i) without charge, upon request, by calling the Fund toll-free at 1.800. CALL OPP (225.5677), and (ii) in the Form N-PX filing on the SEC’s website at www.sec.gov.
The Fund files its complete schedule of portfolio holdings with the SEC for the first quarter and the third quarter of each fiscal year on Form N-Q. The Fund’s Form N-Q filings are available on the SEC’s website at www.sec.gov. Those forms may be reviewed and copied at the SEC’s Public Reference Room in Washington, D.C. Information on the operation of the Public Reference Room may be obtained by calling 1-800-SEC-0330.
26 OPPENHEIMER CAPITAL APPRECIATION FUND/VA
TRUSTEES AND OFFICERS Unaudited
| | |
| Name, Position(s) Held with the Fund, Length of Service, Age | | Principal Occupation(s) During the Past 5 Years; Other Trusteeships/Directorships Held; Number of Portfolios in the Fund Complex Currently Overseen |
| |
| INDEPENDENT TRUSTEES | | The address of each Trustee in the chart below is 6803 S. Tucson Way, Centennial, Colorado 80112-3924. Each Trustee serves for an indefinite term, or until his or her resignation, retirement, death or removal. |
| |
Robert J. Malone, Chairman of the Board of Trustees (since 2016), Trustee (since 2002) Year of Birth: 1944 | | Chairman - Colorado Market of MidFirst Bank (since January 2015); Chairman of the Board (2012-2016) and Director (August 2005-March 2016) of Jones International University (educational organization); Trustee of the Gallagher Family Foundation (non-profit organization) (2000-2015); Chairman, Chief Executive Officer and Director of Steele Street Bank Trust (commercial banking) (August 2003-January 2015); Board of Directors of Opera Colorado Foundation (non-profit organization) (2008- 2012); Director of Colorado UpLIFT (charitable organization) (1986-2010); Director of Jones Knowledge, Inc. (2006-2010); Former Chairman of U.S. Bank-Colorado (subsidiary of U.S. Bancorp and formerly Colorado National Bank) (July 1996-April 1999); Director of Commercial Assets, Inc. (real estate investment trust) (1993-2000); Director of U.S. Exploration, Inc. (oil and gas exploration) (1997-February 2004); Chairman of the Board (1991-1994) and Trustee (1985-1994) of Regis University; and Chairman of the Board (1990-1991) and Trustee (1984-1999) of Young Presidents Organization. Oversees 47 portfolios in the OppenheimerFunds complex. Mr. Malone has served on the Boards of certain Oppenheimer funds since 2002, during which time he has become familiar with the Fund’s (and other Oppenheimer funds’) financial, accounting, regulatory and investment matters and has contributed to the Boards’ deliberations. |
| |
Jon S. Fossel, Trustee (since 1990) Year of Birth: 1942 | | Chairman of the Board of Jack Creek Preserve Foundation (non-profit organization) (since March 2005); Director of Jack Creek Preserve Foundation (non-profit organization) (March 2005-December 2014); Chairman of the Board (2006-December 2011) and Director (June 2002-December 2011) of UNUMProvident (insurance company); Director of Northwestern Energy Corp. (public utility corporation) (November 2004-December 2009); Director of P.R. Pharmaceuticals (October 1999-October 2003); Director of Rocky Mountain Elk Foundation (non-profit organization) (February 1998-February 2003 and February 2005-February 2007); Chairman and Director (until October 1996) and President and Chief Executive Officer (until October 1995) of OppenheimerFunds, Inc.; President, Chief Executive Officer and Director of the following: Oppenheimer Acquisition Corp. (“OAC”) (parent holding company of OppenheimerFunds, Inc.), Shareholders Services, Inc. and Shareholder Financial Services, Inc. (until October 1995). Oversees 47 portfolios in the OppenheimerFunds complex. Mr. Fossel has served on the Boards of certain Oppenheimer funds since 1990, during which time he has become familiar with the Fund’s (and other Oppenheimer funds’) financial, accounting, regulatory and investment matters and has contributed to the Boards’ deliberations. |
| |
Richard F. Grabish, Trustee (since 2012) Year of Birth: 1948 | | Formerly Senior Vice President and Assistant Director of Sales and Marketing (March 1997-December 2007), Director (March 1987-December 2007) and Manager of Private Client Services (June 1985-June 2005) of A.G. Edwards & Sons, Inc. (broker/dealer and investment firm); Chairman and Chief Executive Officer of A.G. Edwards Trust Company, FSB (March 2001-December 2007); President and Vice Chairman of A.G. Edwards Trust Company, FSB (investment adviser) (April 1987-March 2001); President of A.G. Edwards Trust Company, FSB (investment adviser) (June 2005-December 2007). Oversees 47 portfolios in the OppenheimerFunds complex. Mr. Grabish has served on the Boards of certain Oppenheimer funds since 2001, during which time he has become familiar with the Fund’s (and other Oppenheimer funds’) financial, accounting, regulatory and investment matters and has contributed to the Boards’ deliberations. |
| |
Beverly L. Hamilton, Trustee (since 2002) Year of Birth: 1946 | | Trustee of Monterey Institute for International Studies (educational organization) (2000-2014); Board Member of Middlebury College (educational organization) (December 2005-June 2011); Chairman (2010-2016) of American Funds’ Emerging Markets Growth Fund, Inc. (mutual fund); Director of The California Endowment (philanthropic organization) (April 2002-April 2008); Director (February 2002-2005) and Chairman of Trustees (2006-2007) of the Community Hospital of Monterey Peninsula; Director (October 1991-2005) and Vice Chairman (2006-2009) of American Funds’ Emerging Markets Growth Fund, Inc. (mutual fund); President of ARCO Investment Management Company (February 1991-April 2000); Member of the investment committees of The Rockefeller Foundation (2001-2006) and The University of Michigan (since 2000); Advisor at Credit Suisse First Boston’s Sprout venture capital unit (venture capital fund) (1994-January 2005); Trustee of MassMutual Institutional Funds (investment company) (1996-June 2004); Trustee of MML Series Investment Fund (investment company) (April 1989-June 2004); Member of the investment committee of Hartford Hospital (2000-2003); and Advisor to Unilever (Holland) pension fund (2000-2003). Oversees 47 portfolios in the OppenheimerFunds complex. Ms. Hamilton has served on the Boards of certain Oppenheimer funds since 2002, during which time she has become familiar with the Fund’s (and other Oppenheimer funds’) financial, accounting, regulatory and investment matters and has contributed to the Boards’ deliberations. |
| |
Victoria J. Herget, Trustee (since 2012) Year of Birth:1951 | | Board Chair (2008-2015) and Director (2004-Present), United Educators (insurance company); Trustee (since 2000) and Chair (since 2010), Newberry Library (independent research library); Trustee, Mather LifeWays (senior living organization) (since 2001); Independent Director of the First American Funds (mutual fund family) (2003-2011); former Managing Director (1993-2001), Principal (1985-1993), Vice President (1978-1985) and Assistant Vice President (1973-1978) of Zurich Scudder Investments (investment adviser) (and its predecessor firms); Trustee (1992-2007), Chair of the Board of Trustees (1999-2007), Investment Committee Chair (1994-1999) and Investment Committee member (2007-2010) of Wellesley College; Trustee, BoardSource (non-profit organization) (2006-2009) and Chicago City Day School (K-8 School) (1994-2005). Oversees 47 portfolios in the OppenheimerFunds complex. Ms. Herget has served on the Boards of certain Oppenheimer funds since 2012, during which time she has become familiar with the Fund’s (and other Oppenheimer funds’) financial, accounting, regulatory and investment matters and has contributed to the Boards’ deliberations. |
27 OPPENHEIMER CAPITAL APPRECIATION FUND/VA
TRUSTEES AND OFFICERS Unaudited / Continued
| | |
F. William Marshall, Jr., Trustee (since 2000) Year of Birth: 1942 | | Trustee Emeritus of Worcester Polytech Institute (WPI) (private university) (since 2009); Trustee of MassMutual Select Funds (formerly MassMutual Institutional Funds) (investment company) (1996-2015), MML Series Investment Fund (investment company) (1996-2015) and Mass Mutual Premier Funds (investment company) (January 2012-December 2015); President and Treasurer of the SIS Fund (private charitable fund) (January 1999-March 2011); Former Trustee of WPI (1985-2008); Former Chairman of the Board (2004-2006) and Former Chairman of the Investment Committee of WPI (1994-2008); Chairman of SIS Family Bank, F.S.B. (formerly SIS Bank) (commercial bank) (January 1999-July 1999); Executive Vice President of Peoples Heritage Financial Group, Inc. (commercial bank) (January 1999-July 1999); and Former President and Chief Executive Officer of SIS Bancorp. (1993-1999). Oversees 47 portfolios in the OppenheimerFunds complex. Mr. Marshall has served on the Boards of certain Oppenheimer funds since 2000, during which time he has become familiar with the Fund’s (and other Oppenheimer funds’) financial, accounting, regulatory and investment matters and has contributed to the Boards’ deliberations. |
| |
Karen L. Stuckey, Trustee (since 2012) Year of Birth: 1953 | | Member (since May 2015) of Desert Mountain Community Foundation Advisory Board (non-profit organization); Partner (1990-2012) of PricewaterhouseCoopers LLP (professional services firm) (held various positions 1975-1990); Trustee (1992- 2006), member of Executive, Nominating and Audit Committees and Chair of Finance Committee (1992-2006), and Emeritus Trustee (since 2006) of Lehigh University; and member, Women’s Investment Management Forum (professional organization) since inception. Oversees 47 portfolios in the OppenheimerFunds complex. Ms. Stuckey has served on the Boards of certain Oppenheimer funds since 2012, during which time she has become familiar with the Fund’s (and other Oppenheimer funds’) financial, accounting, regulatory and investment matters and has contributed to the Boards’ deliberations. |
| |
James D. Vaughn, Trustee (since 2012) Year of Birth: 1945 | | Retired; former managing partner (1994-2001) of Denver office of Deloitte & Touche LLP, (held various positions 1969- 1993); Trustee and Chairman of the Audit Committee of Schroder Funds (2003-2012); Board member and Chairman of Audit Committee of AMG National Trust Bank (since 2005); Trustee and Investment Committee member, University of South Dakota Foundation (since 1996); Board member, Audit Committee Member and past Board Chair, Junior Achievement (since 1993); former Board member, Mile High United Way, Boys and Girls Clubs, Boy Scouts, Colorado Business Committee for the Arts, Economic Club of Colorado and Metro Denver Network. Oversees 47 portfolios in the OppenheimerFunds complex. Mr. Vaughn has served on the Boards of certain Oppenheimer funds since 2012, during which time he has become familiar with the Fund’s (and other Oppenheimer funds’) financial, accounting, regulatory and investment matters and has contributed to the Boards’ deliberations. |
| | |
| INTERESTED TRUSTEE AND OFFICER | | Mr. Steinmetz is an “Interested Trustee” because he is affiliated with the Manager and the Sub-Adviser by virtue of his positions as Chairman and director of the Sub-Adviser and officer and director of the Manager. Both as a Trustee and as an officer, Mr. Steinmetz serves for an indefinite term, or until his resignation, retirement, death or removal. Mr. Steinmetz’s address is 225 Liberty Street, New York, New York 10281-1008. |
| |
Arthur P. Steinmetz, Trustee (Since 2015), President and Principal Executive Officer (since 2014) Year of Birth: 1958 | | Chairman of OppenheimerFunds, Inc. (since January 2015); CEO and Chairman of OFI Global Asset Management, Inc. (since July 2014), President of OFI Global Asset Management, Inc. (since May 2013), a Director of OFI Global Asset Management, Inc. (since January 2013), Director of OppenheimerFunds, Inc. (since July 2014), President, Management Director and CEO of Oppenheimer Acquisition Corp. (OppenheimerFunds, Inc.‘s parent holding company) (since July 2014), and President and Director of OFI SteelPath, Inc. (since January 2013). Chief Investment Officer of the OppenheimerFunds advisory entities from (January 2013-December 2013); Executive Vice President of OFI Global Asset Management, Inc. (January 2013-May 2013); Chief Investment Officer of OppenheimerFunds, Inc. (October 2010-December 2012); Chief Investment Officer, Fixed- Income, of OppenheimerFunds, Inc. (April 2009-October 2010); Executive Vice President of OppenheimerFunds, Inc. (October 2009-December 2012); Director of Fixed Income of OppenheimerFunds, Inc. (January 2009-April 2009); and a Senior Vice President of OppenheimerFunds, Inc. (March 1993-September 2009). An officer of 103 portfolios in the OppenheimerFunds complex. |
| | |
| OTHER OFFICERS OF THE FUND | | The addresses of the Officers in the chart below are as follows: for Mr. Larson, Mss. Lo Bessette, Foxson and Picciotto, 225 Liberty Street, New York, New York 10281-1008, for Mr. Petersen, 6803 S. Tucson Way, Centennial, Colorado 80112-3924. Each Officer serves for an indefinite term or until his or her resignation, retirement, death or removal. |
| |
Paul Larson, Vice President (since 2016) Year of Birth: 1971 | | Vice President of the Sub-Adviser (since January 2013). Prior to joining the Sub-Adviser, he was a portfolio manager and Chief Equity Strategist at Morningstar. He was previously an analyst at Morningstar covering the energy sector and oversaw the firm’s natural resources analysts. Prior to joining Morningstar in 2002, Mr. Larson was an analyst with The Motley Fool. A portfolio manager and officer of other portfolios in the OppenheimerFunds complex. |
| |
Cynthia Lo Bessette, Secretary and Chief Legal Officer (since 2016) Year of Birth: 1969 | | Executive Vice President, General Counsel and Secretary of the Manager (since February 2016); Chief Legal Officer of the Sub-Adviser and the Distributor (since February 2016); Vice President, General Counsel and Secretary of Oppenheimer Acquisition Corp. (since February 2016); General Counsel of OFI SteelPath, Inc., VTL Associates, LLC and Index Management Solutions, LLC (since February 2016); Chief Legal Officer of OFI Global Institutional, Inc., HarbourView Asset Management Corporation, OFI Global Trust Company, Oppenheimer Real Asset Management, Inc., OFI Private Investments Inc., Shareholder Services, Inc. and Trinity Investment Management Corporation (since February 2016); Senior Vice President and Deputy General Counsel (March 2015-February 2016) and Executive Vice President, Vice President, Corporate Counsel (February 2012-March 2015) and Deputy Chief Legal Officer (April 2013-March 2015) of Jennison Associates LLC; Assistant General Counsel (April 2008-September 2009) and Deputy General Counsel (October 2009-February 2012) of Lord Abbett & Co. LLC. An officer of 103 portfolios in the OppenheimerFunds complex. |
| |
Jennifer Foxson, Vice President and Chief Business Officer (since 2014) Year of Birth: 1969 | | Senior Vice President of OppenheimerFunds Distributor, Inc. (since June 2014); Vice President of OppenheimerFunds Distributor, Inc. (April 2006-June 2014); Vice President of the Sub-Adviser (January 1998-March 2006); Assistant Vice President of the Sub-Adviser (October 1991-December 1998). An officer of 103 portfolios in the OppenheimerFunds complex. |
28 OPPENHEIMER CAPITAL APPRECIATION FUND/VA
| | |
Mary Ann Picciotto, Chief Compliance Officer and Chief Anti-Money Laundering Officer (since 2014) Year of Birth: 1973 | | Senior Vice President and Chief Compliance Officer of the Manager (since March 2014); Chief Compliance Officer of the Sub-Adviser, OFI SteelPath, Inc., OFI Global Trust Company, OFI Global Institutional, Inc., Oppenheimer Real Asset Management, Inc., OFI Private Investments, Inc., Harborview Asset Management Corporation, Trinity Investment Management Corporation, and Shareholder Services, Inc. (since March 2014); Managing Director of Morgan Stanley Investment Management Inc. and certain of its various affiliated entities; Chief Compliance Officer of various Morgan Stanley Funds (May 2010-January 2014); Chief Compliance Officer of Morgan Stanley Investment Management Inc. (April 2007-January 2014). An officer of 103 portfolios in the OppenheimerFunds complex. |
| |
Brian S. Petersen, Treasurer and Principal Financial & Accounting Officer (since 2016) Year of Birth: 1970 | | Vice President of the Manager (since January 2013); Vice President of the Sub-Adviser (February 2007-December 2012); Assistant Vice President of the Sub-Adviser (August 2002-2007). An officer of 103 portfolios in the OppenheimerFunds complex. |
The Fund’s Statement of Additional Information contains additional information about the Fund’s Trustees and Officers and is available without charge, upon request, by calling 1.800.988.8287.
29 OPPENHEIMER CAPITAL APPRECIATION FUND/VA
THIS PAGE INTENTIONALLY LEFT BLANK.
30 OPPENHEIMER CAPITAL APPRECIATION FUND/VA
THIS PAGE INTENTIONALLY LEFT BLANK.
31 OPPENHEIMER CAPITAL APPRECIATION FUND/VA
OPPENHEIMER CAPITAL APPRECIATION FUND/VA
A Series of Oppenheimer Variable Account Funds
| | |
| Manager | | OFI Global Asset Management, Inc. |
| |
| Sub-Adviser | | OppenheimerFunds, Inc. |
| |
| Distributor | | OppenheimerFunds Distributor, Inc. |
| |
Transfer and Shareholder Servicing Agent | | OFI Global Asset Management, Inc. |
| |
| Sub-Transfer Agent | | Shareholder Services, Inc. DBA OppenheimerFunds Services |
| |
Independent Registered Public Accounting Firm | | KPMG LLP |
| |
| Legal Counsel | | Ropes & Gray LLP |
| |
| | Before investing in any of the Oppenheimer funds, investors should carefully consider a fund’s investment objectives, risks, charges and expenses. Fund prospectuses and summary prospectuses contain this and other information about the funds, and may be obtained by asking your financial advisor, or calling us at 1.800.988.8287. Read prospectuses and summary prospectuses carefully before investing. |
| |
| | © 2017 OppenheimerFunds, Inc. All rights reserved. Oppenheimer funds are distributed by OppenheimerFunds Distributor, Inc. |

| | | | |
| | 
| | |
| | |
| | | December 31, 2016 | | |
| | Oppenheimer | | |
| | Core Bond Fund/VA | | Annual Report |
| | A Series of Oppenheimer Variable Account Funds | | |
| | | |
| | ANNUAL REPORT | | |
| | |
| | Listing of Top Holdings | | |
| | |
| | Fund Performance Discussion | | |
| | |
| | Financial Statements | | |
PORTFOLIO MANAGERS: Krishna Memani and Peter A. Strzalkowski, CFA
AVERAGE ANNUAL TOTAL RETURNS FOR THE PERIODS ENDED 12/31/16
| | | | | | | | | | | | | | | | |
| | | Inception
Date | | | 1-Year | | | 5-Year | | | 10-Year | |
Non-Service Shares | | | 4/3/85 | | | | 3.27% | | | | 4.27% | | | | 0.36% | |
Service Shares | | | 5/1/02 | | | | 3.05 | | | | 4.02 | | | | 0.11 | |
Bloomberg Barclays Credit Index | | | | | | | 5.63 | | | | 3.85 | | | | 5.31 | |
Bloomberg Barclays U.S. Aggregate Bond Index | | | | | | | 2.65 | | | | 2.23 | | | | 4.34 | |
Citigroup Broad Investment Grade Bond Index | | | | | | | 2.66 | | | | 2.22 | | | | 4.43 | |
Performance data quoted represents past performance, which does not guarantee future results. The investment return and principal value of an investment in the Fund will fluctuate so that an investor’s shares, when redeemed, may be worth more or less than their original cost. Current performance may be lower or higher than the performance quoted. For performance data current to the most recent month end, call us at 1.800.988.8287. The Fund’s total returns should not be expected to be the same as the returns of other funds, whether or not both funds have the same portfolio managers and/or similar names. The Fund’s total returns include changes in share price and reinvested distributions but do not include the charges associated with the separate account products that offer this Fund. Such performance would have been lower if such charges were taken into account.
TOP HOLDINGS AND ALLOCATIONS
| | | | |
| PORTFOLIO ALLOCATION | | | | |
Non-Convertible Corporate Bonds and Notes | | | 37.2% | |
Mortgage-Backed Obligations | | | | |
Government Agency | | | 24.4 | |
Non-Agency | | | 10.2 | |
Short-Term Notes | | | 13.2 | |
Asset-Backed Securities | | | 11.8 | |
Investment Company | | | | |
Oppenheimer Institutional Government Money Market Fund | | | 1.6 | |
U.S. Government Obligations | | | 1.3 | |
Certificates of Deposit | | | 0.3 | |
Portfolio holdings and allocations are subject to change. Percentages are as of December 31, 2016, and are based on the total market value of investments. | |
CORPORATE BONDS & NOTES - TOP TEN INDUSTRIES | |
Commercial Banks | | | 4.6% | |
Oil, Gas & Consumable Fuels | | | 3.1 | |
Electric Utilities | | | 2.4 | |
Capital Markets | | | 2.2 | |
Automobiles | | | 2.1 | |
Diversified Telecommunication Services | | | 2.1 | |
Media | | | 1.9 | |
Food Products | | | 1.9 | |
Beverages | | | 1.7 | |
Chemicals | | | 1.4 | |
Portfolio holdings and allocations are subject to change. Percentages are as of December 31, 2016, and are based on net assets. | |
2 OPPENHEIMER CORE BOND FUND/VA
Fund Performance Discussion
MARKET OVERVIEW
It was a volatile reporting period for fixed-income markets. Central Bank policy was a major focus this reporting period, with statements and actions from the Federal Reserve (the “Fed”), Bank of Japan (BoJ), European Central Bank (“ECB”), and more, fueling movements in global capital markets. Throughout most of the year, the question of when the Fed would raise interest rates remained. It finally did in the closing month of the reporting period. Improved economic data and outlook led the Fed to hike its policy rates by 0.25% in December, meeting market expectations. The Fed’s policy making Federal Open Market Committee noted they will continue to be cautious and will hike rates gradually, but posted a modestly optimistic outlook. By year end, markets were pricing for slightly more than two hikes by the end of 2017.
Other major events that created volatility during the year were the United Kingdom’s (“UK”) vote to leave the European Union (commonly referred to as Brexit) and the U.S. Presidential election. After Brexit, U.S. markets became extremely volatile for two days. However, the event came and went with most financial assets rallying strong early in the third quarter.
Markets turned to general risk on mode after the surprise election of Donald Trump with equities climbing, credit spreads narrowing to the tightest levels since early 2015, and U.S. Treasury yields climbing to levels not experienced since 2014. The dollar rallied strongly against many currencies, particularly after Mr. Trump’s victory.
Even with the substantial sell off of U.S. Treasuries after the election, the Bloomberg Barclays U.S. Treasury Index still posted a positive return for the year at just over 1%. Spread sectors fared much better, with Industrials posting over 7% gains, while returns of structured products (mortgage backed securities and asset backed securities) were more muted. Distressed credit was the stand-out performer amongst global fixed income asset classes as higher oil prices reduced fears of significant defaults in the energy and mining sectors.
FUND REVIEW
Against this backdrop, the Fund’s Non-Service shares produced a return of 3.27% during the reporting period. In comparison, the Fund’s benchmarks, the Bloomberg Barclays U.S. Aggregate Bond Index (the “Index”), the Bloomberg Barclays Credit Index and the Citigroup Broad Investment Grade Bond Index, returned 2.65%, 5.63%, and 2.66%, respectively. The Fund’s outperformance versus the Index this reporting period stemmed from its underweight position in U.S. Treasuries, which sold off this reporting period, as mentioned earlier. In addition, the Fund’s exposure to high yield credit benefited performance. The top detractor from the Fund’s performance versus the Index was its overweight exposure to agency mortgage-backed securities (“MBS”). While the Fund had a larger allocation to agency MBS, its exposure to non-agency MBS produced slight outperformance this reporting period.
STRATEGY & OUTLOOK
The portfolio management team believes macroeconomic fundamentals will continue to remain solid, with continued gains in wages and employment. Inflation is likely to creep higher and potential fiscal stimulus could boost consumption later in the year. The team expects the Fed to hike interest rates two times in 2017 and continue to reinvest pay downs and maturities of mortgages and Treasury securities.
The team remains neutral duration as near term inflation risks appear to be fully priced into yields and the rise in risk premium is consistent with a relative sanguine economic outlook. Given the unattractive carry and rising risk later in the year for the Fed to discuss suspension of mortgage reinvestments, the team is slightly underweight agency MBS going into 2017. Should spreads widen or relative value between different areas of the market develop, the team intends to take positions tactically. However, unless carry improves significantly, this would unlikely be a longer-term position.
Demand for credit-related securities remains robust at period end. As corporate fundamentals remain stable the team remains cautiously engaged in corporate credit.
Within structured products, the team continues to avoid student loan and more esoteric asset-backed securities (“ABS”). The team remains engaged in auto and credit card ABS given the attractive fundamentals and carry of those segments. The team seeks opportunities to participate in commercial mortgage backed securities (“CMBS”) as they believe valuations are attractive and the implementation of risk retention rules make underwriting of the structures more appealing.
3 OPPENHEIMER CORE BOND FUND/VA
Investors should consider the Fund’s investment objective, risks, charges and expenses carefully before investing. The Fund’s prospectus and summary prospectus contain this and other information about the Fund, and may be obtained by asking your financial advisor or calling us at 1.800.988.8287. Read prospectuses and summary prospectuses carefully before investing.
Total returns include changes in share price and reinvestment of dividends and capital gains distributions in a hypothetical investment for the periods shown, but do not include the charges associated with the separate account products that offer this Fund.
The Fund’s investment strategy and focus can change over time. The mention of specific fund holdings does not constitute a recommendation by OppenheimerFunds, Inc. or its affiliates.
Shares of Oppenheimer funds are not deposits or obligations of any bank, are not guaranteed by any bank, are not insured by the FDIC or any other agency, and involve investment risks, including the possible loss of the principal amount invested.
Comparing the Fund’s Performance to the Market. The graphs that follow show the performance of a hypothetical $10,000 investment in each share class of the Fund held until December 31, 2016. Performance is measured over a ten-fiscal-year period for both Classes. Performance information does not reflect charges that apply to separate accounts investing in the Fund. If these charges were taken into account, performance would be lower. The graphs assume that all dividends and capital gains distributions were reinvested in additional shares.
The Fund’s performance is compared to the performance of the Bloomberg Barclays Credit Index, an index of non-convertible U.S. investment grade corporate bonds; the Bloomberg Barclays U.S. Aggregate Bond Index, an index of U.S. corporate and government bonds and the Citigroup Broad Investment Grade Bond Index, an index of institutionally traded U.S. Treasury Bonds, government-sponsored bonds, mortgage-backed securities and corporate securities. The indices are unmanaged and cannot be purchased directly by investors. While index comparisons may be useful to provide a benchmark for the Fund’s performance, it must be noted that the Fund’s investments are not limited to the investments comprising the indices. Index performance includes reinvestment of income, but does not reflect transaction costs, fees, expenses or taxes. Index performance is shown for illustrative purposes only as a benchmark for the Fund’s performance, and does not predict or depict performance of the Fund. The Fund’s performance reflects the effects of the Fund’s business and operating expenses.
4 OPPENHEIMER CORE BOND FUND/VA
COMPARISON OF CHANGE IN VALUE OF $10,000 HYPOTHETICAL INVESTMENTS IN:
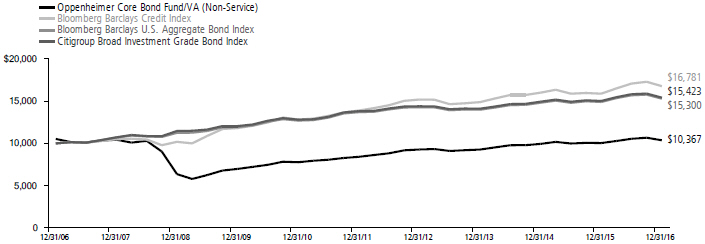
COMPARISON OF CHANGE IN VALUE OF $10,000 HYPOTHETICAL INVESTMENTS IN:
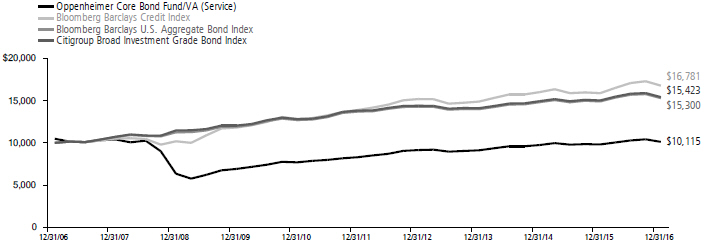
Performance data quoted represents past performance, which does not guarantee future results. The investment return and principal value of an investment in the Fund will fluctuate so that an investor’s shares, when redeemed, may be worth more or less than their original cost. Current performance may be lower or higher than the performance quoted. For performance data current to the most recent month end, call us at 1.800.988.8287. The Fund’s total returns should not be expected to be the same as the returns of other funds, whether or not both funds have the same portfolio managers and/or similar names. The Fund’s total returns include changes in share price and reinvested distributions but do not include the charges associated with the separate account products that offer this Fund. Such performance would have been lower if such charges were taken into account.
5 OPPENHEIMER CORE BOND FUND/VA
Fund Expenses
Fund Expenses. As a shareholder of the Fund, you incur two types of costs: (1) transaction costs and (2) ongoing costs, including management fees; distribution and service fees; and other Fund expenses. These examples are intended to help you understand your ongoing costs (in dollars) of investing in the Fund and to compare these costs with the ongoing costs of investing in other mutual funds.
The examples are based on an investment of $1,000.00 invested at the beginning of the period and held for the entire 6-month period ended December 31, 2016.
Actual Expenses. The first section of the table provides information about actual account values and actual expenses. You may use the information in this section for the class of shares you hold, together with the amount you invested, to estimate the expense that you paid over the period. Simply divide your account value by $1,000.00 (for example, an $8,600.00 account value divided by $1,000.00 = 8.60), then multiply the result by the number in the first section under the heading entitled “Expenses Paid During 6 Months Ended December 31, 2016” to estimate the expenses you paid on your account during this period.
Hypothetical Example for Comparison Purposes.
The second section of the table provides information about hypothetical account values and hypothetical expenses based on the Fund’s actual expense ratio for each class of shares, and an assumed rate of return of 5% per year for each class before expenses, which is not the actual return. The hypothetical account values and expenses may not be used to estimate the actual ending account balance or expenses you paid for the period. You may use this information to compare the ongoing costs of investing in the Fund and other funds. To do so, compare this 5% hypothetical example for the class of shares you hold with the 5% hypothetical examples that appear in the shareholder reports of the other funds.
Please note that the expenses shown in the table are meant to highlight your ongoing costs only and do not reflect any charges associated with the separate accounts that offer this Fund. Therefore, the “hypothetical” lines of the table are useful in comparing ongoing costs only, and will not help you determine the relative total costs of owning different funds. In addition, if these separate account charges were included your costs would have been higher.
| | | | | | | | | | | | | | | | |
| Actual | | Beginning Account Value July 1, 2016 | | | Ending Account Value
December 31, 2016 | | | | | | Expenses Paid During 6 Months Ended December 31, 2016 | |
Non-Service shares | | | $ 1,000.00 | | | | $ 983.30 | | | | | | | | $ 3.75 | |
Service shares | | | 1,000.00 | | | | 983.10 | | | | | | | | 5.00 | |
| | | | |
| Hypothetical | | | | | | | | | | | | |
| (5% return before expenses) | | | | | | | | | | | | |
Non-Service shares | | | 1,000.00 | | | | 1,021.37 | | | | | | | | 3.82 | |
Service shares | | | 1,000.00 | | | | 1,020.11 | | | | | | | | 5.09 | |
Expenses are equal to the Fund’s annualized expense ratio for that class, multiplied by the average account value over the period, multiplied by 184/366 (to reflect the one-half year period). Those annualized expense ratios, excluding indirect expenses from affiliated funds, based on the 6-month period ended December 31, 2016 are as follows:
| | | | |
| Class | | Expense Ratios | |
Non-Service shares | | | 0.75% | |
Service shares | | | 1.00 | |
The expense ratios reflect voluntary and/or contractual waivers and/or reimbursements of expenses by the Fund’s Manager. Some of these undertakings may be modified or terminated at any time, as indicated in the Fund’s prospectus. The “Financial Highlights” tables in the Fund’s financial statements, included in this report, also show the gross expense ratios, without such waivers or reimbursements and reduction to custodian expenses, if applicable.
6 OPPENHEIMER CORE BOND FUND/VA
STATEMENT OF INVESTMENTS December 31, 2016
| | | | | | | | |
| | | Principal Amount | | | Value | |
| |
Asset-Backed Securities—14.6% | | | | | |
| |
| Auto Loan—9.0% | |
| |
| American Credit Acceptance Receivables Trust: | |
| Series 2014-3,Cl. B, 2.43%, 6/10/201 | | $ | 81,775 | | | $ | 81,850 | |
| Series 2014-4,Cl. B, 2.60%, 10/10/171 | | | 72,084 | | | | 72,308 | |
| Series 2015-1,Cl. B, 2.85%, 2/12/211 | | | 385,000 | | | | 386,895 | |
| Series 2015-3,Cl. B, 3.56%, 10/12/211 | | | 325,000 | | | | 329,618 | |
| |
| AmeriCredit Automobile Receivables Trust: | |
| Series 2012-4,Cl. D, 2.68%, 10/9/18 | | | 100,000 | | | | 98,119 | |
| Series 2013-2,Cl. E, 3.41%, 10/8/201 | | | 345,000 | | | | 348,185 | |
| Series 2013-3,Cl. E, 3.74%, 12/8/201 | | | 160,000 | | | | 162,278 | |
| Series 2013-4,Cl. D, 3.31%, 10/8/19 | | | 50,000 | | | | 50,871 | |
| Series 2014-1,Cl. E, 3.58%, 8/9/21 | | | 310,000 | | | | 315,138 | |
| Series 2014-2,Cl. E, 3.37%, 11/8/21 | | | 385,000 | | | | 389,534 | |
| |
| Capital Auto Receivables Asset Trust: | |
| Series 2014-1,Cl. D, 3.39%, 7/22/19 | | | 115,000 | | | | 117,683 | |
| Series 2014-3,Cl. D, 3.14%, 2/20/20 | | | 295,000 | | | | 299,455 | |
| Series 2015-1,Cl. D, 3.16%, 8/20/20 | | | 165,000 | | | | 167,037 | |
| Series 2015-4,Cl. D, 3.62%, 5/20/21 | | | 260,000 | | | | 265,276 | |
| Series 2016-2,Cl. D, 3.16%, 11/20/23 | | | 60,000 | | | | 59,953 | |
| Series 2016-3,Cl. D, 2.65%, 1/20/24 | | | 100,000 | | | | 98,478 | |
| |
| CarFinance Capital Auto Trust, Series 2015-1A, Cl. A, 1.75%, 6/15/211 | | | 83,735 | | | | 83,802 | |
| |
| CarMax Auto Owner Trust: | | | | | | | | |
| Series 2013-2,Cl. D, 2.06%, 11/15/19 | | | 45,000 | | | | 44,991 | |
| Series 2015-2,Cl. D, 3.04%, 11/15/21 | | | 100,000 | | | | 100,155 | |
| Series 2015-3,Cl. D, 3.27%, 3/15/22 | | | 295,000 | | | | 297,378 | |
| Series 2016-1,Cl. D, 3.11%, 8/15/22 | | | 185,000 | | | | 183,689 | |
| Series 2016-3,Cl. D, 2.94%, 1/17/23 | | | 115,000 | | | | 112,829 | |
| Series 2016-4,Cl. D, 2.91%, 4/17/23 | | | 260,000 | | | | 254,359 | |
| |
| CPS Auto Receivables Trust: | |
| Series 2014-A,Cl. A, 1.21%, 8/15/181 | | | 14,699 | | | | 14,694 | |
| Series 2014-C,Cl. A, 1.31%, 2/15/191 | | | 50,197 | | | | 50,184 | |
| |
| Credit Acceptance Auto Loan Trust: | | | | | | | | |
| Series 2014-1A,Cl. B, 2.29%, 4/15/221 | | | 215,000 | | | | 215,584 | |
| Series 2014-2A,Cl. B, 2.67%, 9/15/221 | | | 160,000 | | | | 160,673 | |
| |
| Drive Auto Receivables Trust: | | | | | | | | |
| Series 2015-BA,Cl. C, 2.76%, 7/15/211 | | | 300,000 | | | | 301,960 | |
| Series 2015-DA,Cl. D, 4.59%, 1/17/231 | | | 50,000 | | | | 51,352 | |
| Series 2016-BA,Cl. C, 3.19%, 7/15/221 | | | 160,000 | | | | 161,256 | |
| Series 2016-CA,Cl. A1, 0.90%, 12/15/171 | | | 439,221 | | | | 439,225 | |
| Series 2016-CA,Cl. D, 4.18%, 3/15/241 | | | 160,000 | | | | 158,863 | |
| |
| DT Auto Owner Trust: | |
| Series 2013-2A,Cl. D, 4.18%, 6/15/201 | | | 303,618 | | | | 306,277 | |
| Series 2014-2A,Cl. D, 3.68%, 4/15/211 | | | 525,000 | | | | 530,152 | |
| Series 2014-3A,Cl. D, 4.47%, 11/15/211 | | | 375,000 | | | | 382,512 | |
| Series 2015-1A,Cl. C, 2.87%, 11/16/201 | | | 178,604 | | | | 179,209 | |
| Series 2016-1A,Cl. B, 2.79%, 5/15/201 | | | 265,000 | | | | 266,630 | |
| Series 2016-4A,Cl. B, 2.02%, 8/17/201 | | | 240,000 | | | | 239,151 | |
| |
| Exeter Automobile Receivables Trust: | |
| Series 2014-1A,Cl. B, 2.42%, 1/15/191 | | | 61,267 | | | | 61,321 | |
| Series 2014-1A,Cl. C, 3.57%, 7/15/191 | | | 230,000 | | | | 231,513 | |
| Series 2014-2A,Cl. C, 3.26%, 12/16/191 | | | 155,000 | | | | 155,895 | |
| |
| First Investors Auto Owner Trust: | |
| Series 2013-3A,Cl. B, 2.32%, 10/15/191 | | | 385,000 | | | | 385,715 | |
| Series 2013-3A,Cl. D, 3.67%, 5/15/201 | | | 125,000 | | | | 125,896 | |
| |
| Flagship Credit Auto Trust: | | | | | | | | |
| Series 2014-1,Cl. A, 1.21%, 4/15/191 | | | 11,957 | | | | 11,954 | |
| Series 2014-2,Cl. A, 1.43%, 12/16/191 | | | 64,354 | | | | 64,351 | |
| Series 2016-4,Cl. A1, 1.47%, 3/16/201 | | | 265,850 | | | | 265,638 | |
| |
| Ford Credit Floorplan Master Owner Trust A, Series 2016-3, Cl. A1, 1.55%, 7/15/21 | | | 365,000 | | | | 361,298 | |
| |
| GM Financial Automobile Leasing Trust, Series 2015-1, Cl. D, 3.01%, 3/20/20 | | | 240,000 | | | | 242,836 | |
| |
| Huntington Auto Trust, Series 2016-1, Cl. A1, 0.85%, 12/15/17 | | | 208,715 | | | | 208,720 | |
| |
| Navistar Financial Dealer Note Master Owner Trust II: | | | | | | | | |
| Series 2015-1,Cl. B, 2.456%, 6/25/201,2 | | | 70,000 | | | | 70,063 | |
| | | | | | | | |
| | | Principal Amount | | | Value | |
| |
Auto Loan (Continued) | | | | | |
| |
| Navistar Financial Dealer Note Master Owner Trust II: (Continued) | |
| Series 2015-1,Cl. D, 3.906%, 6/25/201,2 | | $ | 25,000 | | | $ | 25,035 | |
| Series 2016-1,Cl. D, 4.056%, 9/27/211,2 | | | 75,000 | | | | 75,493 | |
| |
| Santander Drive Auto Receivables Trust: | | | | | |
| Series 2013-4,Cl. E, 4.67%, 1/15/201 | | | 360,000 | | | | 366,440 | |
| Series 2013-A,Cl. E, 4.71%, 1/15/211 | | | 270,000 | | | | 276,919 | |
| Series 2014-2,Cl. D, 2.76%, 2/18/20 | | | 215,000 | | | | 217,631 | |
| Series 2014-4,Cl. C, 2.60%, 11/16/20 | | | 155,000 | | | | 156,275 | |
| Series 2016-2,Cl. D, 3.39%, 4/15/22 | | | 120,000 | | | | 120,954 | |
| |
| SNAAC Auto Receivables Trust, Series 2014-1A, Cl. D, 2.88%, 1/15/201 | | | 140,000 | | | | 139,396 | |
| |
| TCF Auto Receivables Owner Trust: | | | | | |
| Series 2014-1A,Cl. C, 3.12%, 4/15/211 | | | 100,000 | | | | 100,053 | |
| Series 2015-1A,Cl. D, 3.53%, 3/15/221 | | | 160,000 | | | | 160,318 | |
| |
| United Auto Credit Securitization Trust, Series 2015-1, Cl. D, 2.92%, 6/17/191 | | | 225,000 | | | | 225,666 | |
| |
| Westlake Automobile Receivables Trust: | | | | | |
| Series 2014-2A,Cl. D, 2.86%, 7/15/211 | | | 165,000 | | | | 165,798 | |
| Series 2015-1A,Cl. C, 2.29%, 11/16/201 | | | 215,000 | | | | 215,607 | |
| Series 2015-2A,Cl. C, 2.45%, 1/15/211 | | | 215,000 | | | | 216,476 | |
| | | | | | | | |
| | | | | | | 12,424,864 | |
|
| |
| |
| Credit Card—5.3% | |
| |
| American Express Credit Account Master Trust: | |
| Series 2014-2,Cl. A, 1.26%, 1/15/20 | | | 75,000 | | | | 75,052 | |
| Series 2014-3,Cl. A, 1.49%, 4/15/20 | | | 305,000 | | | | 305,714 | |
| Series 2014-5,Cl. A, 0.994%, 5/15/202 | | | 325,000 | | | | 325,371 | |
| Series 2015-1,Cl. A, 0.994%, 1/15/202 | | | 600,000 | | | | 600,579 | |
| |
| Cabela’s Credit Card Master Note Trust: | | | | | |
| Series 2013-2A,Cl. A2, 1.354%, 8/16/211,2 | | | 100,000 | | | | 100,458 | |
| Series 2016-1,Cl. A1, 1.78%, 6/15/22 | | | 320,000 | | | | 319,141 | |
| |
| Capital One Multi-Asset Execution Trust: | | | | | |
| Series 2007-A1,Cl. A1, 0.754%, 11/15/192 | | | 305,000 | | | | 305,002 | |
| Series 2014-A2,Cl. A2, 1.26%, 1/15/20 | | | 445,000 | | | | 445,256 | |
| Series 2014-A5,Cl. A5, 1.48%, 7/15/20 | | | 595,000 | | | | 596,276 | |
| |
| Chase Issuance Trust: | | | | | | | | |
| Series 2007-A3,Cl. A3, 5.23%, 4/15/19 | | | 95,000 | | | | 95,443 | |
| Series 2014-A1,Cl. A1, 1.15%, 1/15/19 | | | 555,000 | | | | 555,006 | |
| Series 2014-A6,Cl. A6, 1.26%, 7/15/19 | | | 430,000 | | | | 430,292 | |
| Series 2014-A7,Cl. A7, 1.38%, 11/15/19 | | | 605,000 | | | | 605,588 | |
| Series 2016-A6,Cl. A6, 1.10%, 1/15/20 | | | 580,000 | | | | 578,686 | |
| |
| Discover Card Execution Note Trust, Series 2014-A5, Cl. A, 1.39%, 4/15/20 | | | 535,000 | | | | 535,836 | |
| |
| Evergreen Credit Card Trust, Series 2016-3, Cl. A, 1.204%, 11/16/201,2 | | | 455,000 | | | | 455,385 | |
| |
| Synchrony Credit Card Master Note Trust, Series 2012-6, Cl. A, 1.36%, 8/17/20 | | | 165,000 | | | | 165,108 | |
| |
| World Financial Network Credit Card Master Trust: | |
| Series 2014-C,Cl. A, 1.60%, 8/16/21 | | | 310,000 | | | | 310,480 | |
| Series 2015-C,Cl. A, 1.26%, 3/15/21 | | | 225,000 | | | | 225,148 | |
| Series 2016-B,Cl. A, 1.44%, 6/15/22 | | | 205,000 | | | | 204,344 | |
| | | | | | | | |
| | | | | | | 7,234,165 | |
|
| |
| |
| Equipment—0.1% | |
| |
| FRS I LLC, Series 2013-1A, Cl. A1, 1.80%, 4/15/431 | | | 44,412 | | | | 43,509 | |
| |
| Trip Rail Master Funding LLC, Series 2014-1A, Cl. A1, 2.863%, 4/15/441 | | | 75,888 | | | | 74,098 | |
| | | | | | | | |
| | | | | | | 117,607 | |
|
| |
| |
| Loans: Other—0.2% | |
| |
| Element Rail Leasing I LLC, Series 2014-1A, Cl. A1, 2.299%, 4/19/441 | | | 275,174 | | | | 267,913 | |
| | | | | | | | |
| Total Asset-Backed Securities (Cost $20,009,872) | | | | | | | 20,044,549 | |
7 OPPENHEIMER CORE BOND FUND/VA
STATEMENT OF INVESTMENTS Continued
| | | | | | | | |
| | | Principal Amount | | | Value | |
| |
Mortgage-Backed Obligations—42.9% | | | | | |
| |
| Government Agency—30.2% | |
| |
| FHLMC/FNMA/FHLB/Sponsored—25.7% | |
| |
| Federal Home Loan Mortgage Corp. Gold Pool: | |
| 5.00%, 12/1/34 | | $ | 4,588 | | | $ | 5,018 | |
| 5.50%, 9/1/39 | | | 364,987 | | | | 405,501 | |
| 6.00%, 5/1/18-10/1/29 | | | 506,020 | | | | 574,517 | |
| 6.50%, 4/1/18-4/1/34 | | | 145,255 | | | | 164,005 | |
| 7.00%, 10/1/31-10/1/37 | | | 141,188 | | | | 157,786 | |
| 9.00%, 8/1/22-5/1/25 | | | 9,233 | | | | 10,034 | |
| |
| Federal Home Loan Mortgage Corp. Non Gold Pool, 10.50%, 10/1/20 | | | 763 | | | | 787 | |
| |
| Federal Home Loan Mortgage Corp., Interest-Only Stripped Mtg.-Backed Security: | |
| Series 205,Cl. IO, 51.644%, 9/1/293 | | | 6,486 | | | | 1,464 | |
| Series 206,Cl. IO, 0.00%, 12/1/293,4 | | | 103,800 | | | | 30,063 | |
| Series 243,Cl. 6, 0.00%, 12/15/323,4 | | | 70,896 | | | | 13,123 | |
| |
| Federal Home Loan Mortgage Corp., Mtg.-Linked Amortizing Global Debt Securities, Series 2012-1, Cl. A10, 2.06%, 1/15/22 | | | 368,584 | | | | 372,033 | |
| |
| Federal Home Loan Mortgage Corp., Principal-Only Stripped Mtg.-Backed Security, Series 176, Cl. PO, 4.108%, 6/1/265 | | | 34,672 | | | | 31,583 | |
| |
| Federal Home Loan Mortgage Corp., Real Estate Mtg. Investment Conduit Multiclass Pass-Through Certificates: | |
| Series 151,Cl. F, 9.00%, 5/15/21 | | | 2,489 | | | | 2,687 | |
| Series 1674,Cl. Z, 6.75%, 2/15/24 | | | 10,224 | | | | 11,163 | |
| Series 2034,Cl. Z, 6.50%, 2/15/28 | | | 1,851 | | | | 2,090 | |
| Series 2042,Cl. N, 6.50%, 3/15/28 | | | 4,373 | | | | 4,865 | |
| Series 2043,Cl. ZP, 6.50%, 4/15/28 | | | 222,333 | | | | 247,495 | |
| Series 2046,Cl. G, 6.50%, 4/15/28 | | | 10,689 | | | | 12,069 | |
| Series 2053,Cl. Z, 6.50%, 4/15/28 | | | 1,953 | | | | 2,208 | |
| Series 2066,Cl. Z, 6.50%, 6/15/28 | | | 202,708 | | | | 228,872 | |
| Series 2195,Cl. LH, 6.50%, 10/15/29 | | | 176,457 | | | | 199,262 | |
| Series 2220,Cl. PD, 8.00%, 3/15/30 | | | 1,135 | | | | 1,344 | |
| Series 2326,Cl. ZP, 6.50%, 6/15/31 | | | 51,804 | | | | 57,645 | |
| Series 2461,Cl. PZ, 6.50%, 6/15/32 | | | 192,490 | | | | 224,554 | |
| Series 2470,Cl. LF, 1.704%, 2/15/322 | | | 1,591 | | | | 1,631 | |
| Series 2564,Cl. MP, 5.00%, 2/15/18 | | | 28,872 | | | | 29,341 | |
| Series 2585,Cl. HJ, 4.50%, 3/15/18 | | | 14,882 | | | | 15,262 | |
| Series 2635,Cl. AG, 3.50%, 5/15/32 | | | 30,745 | | | | 31,677 | |
| Series 2707,Cl. QE, 4.50%, 11/15/18 | | | 8,870 | | | | 9,066 | |
| Series 2770,Cl. TW, 4.50%, 3/15/19 | | | 5,619 | | | | 5,791 | |
| Series 3010,Cl. WB, 4.50%, 7/15/20 | | | 15,000 | | | | 15,463 | |
| Series 3025,Cl. SJ, 22.169%, 8/15/352 | | | 16,980 | | | | 25,403 | |
| Series 3030,Cl. FL, 1.104%, 9/15/352 | | | 2,599 | | | | 2,588 | |
| Series 3645,Cl. EH, 3.00%, 12/15/20 | | | 48,769 | | | | 49,530 | |
| Series 3741,Cl. PA, 2.15%, 2/15/35 | | | 145,416 | | | | 146,359 | |
| Series 3815,Cl. BD, 3.00%, 10/15/20 | | | 2,491 | | | | 2,520 | |
| Series 3822,Cl. JA, 5.00%, 6/15/40 | | | 5,190 | | | | 5,432 | |
| Series 3840,Cl. CA, 2.00%, 9/15/18 | | | 1,879 | | | | 1,887 | |
| Series 3848,Cl. WL, 4.00%, 4/15/40 | | | 25,913 | | | | 26,870 | |
| Series 3857,Cl. GL, 3.00%, 5/15/40 | | | 5,450 | | | | 5,575 | |
| Series 4221,Cl. HJ, 1.50%, 7/15/23 | | | 96,443 | | | | 95,899 | |
| |
| Federal Home Loan Mortgage Corp., Real Estate Mtg. Investment Conduit Multiclass Pass-Through Certificates, Interest-Only Stripped Mtg.-Backed Security: | |
| Series 2074,Cl. S, 99.999%, 7/17/283 | | | 1,393 | | | | 208 | |
| Series 2079,Cl. S, 99.999%, 7/17/283 | | | 2,445 | | | | 411 | |
| Series 2130,Cl. SC, 99.999%, 3/15/293 | | | 85,533 | | | | 15,458 | |
| Series 2526,Cl. SE, 64.254%, 6/15/293 | | | 2,832 | | | | 575 | |
| Series 2796,Cl. SD, 99.999%, 7/15/263 | | | 152,194 | | | | 23,429 | |
| Series 2920,Cl. S, 5.996%, 1/15/353 | | | 583,922 | | | | 94,331 | |
| Series 2922,Cl. SE, 25.997%, 2/15/353 | | | 71,455 | | | | 11,049 | |
| Series 2981,Cl. AS, 10.855%, 5/15/353 | | | 94,470 | | | | 15,818 | |
| Series 3004,Cl. SB, 0.00%, 7/15/353,4 | | | 27,440 | | | | 3,527 | |
| Series 3397,Cl. GS, 0.00%, 12/15/373,4 | | | 13,034 | | | | 2,266 | |
| Series 3424,Cl. EI, 0.00%, 4/15/383,4 | | | 13,688 | | | | 1,541 | |
| Series 3450,Cl. BI, 23.402%, 5/15/383 | | | 370,782 | | | | 53,139 | |
| Series 3606,Cl. SN, 23.012%, 12/15/393 | | | 95,952 | | | | 15,167 | |
| | | | | | | | |
| | | Principal Amount | | | Value | |
| |
| FHLMC/FNMA/FHLB/Sponsored (Continued) | |
| |
| Federal National Mortgage Assn.: | |
| 2.50%, 1/1/326 | | $ | 2,355,000 | | | $ | 2,357,774 | |
| 3.00%, 1/1/326 | | | 5,115,000 | | | | 5,247,367 | |
| 3.50%, 1/1/476 | | | 6,945,000 | | | | 7,114,306 | |
| 4.00%, 1/15/476 | | | 8,115,000 | | | | 8,527,876 | |
| 4.50%, 1/1/476 | | | 2,720,000 | | | | 2,924,969 | |
| 5.00%, 1/1/476 | | | 1,830,000 | | | | 1,993,339 | |
| |
| Federal National Mortgage Assn. Pool: | |
| 5.00%, 3/1/21-7/1/22 | | | 6,896 | | | | 7,124 | |
| 5.50%, 2/1/35-5/1/36 | | | 147,903 | | | | 165,914 | |
| 6.50%, 5/1/17-1/1/34 | | | 25,657 | | | | 27,096 | |
| 7.00%, 11/1/17-7/1/35 | | | 46,366 | | | | 51,588 | |
| 7.50%, 1/1/33 | | | 4,171 | | | | 5,013 | |
| 8.50%, 7/1/32 | | | 10,036 | | | | 10,896 | |
| |
| Federal National Mortgage Assn., Interest-Only Stripped Mtg.-Backed Security: | |
| Series 221,Cl. 2, 99.999%, 5/25/233 | | | 2,051 | | | | 350 | |
| Series 222,Cl. 2, 99.999%, 6/25/233 | | | 227,932 | | | | 34,141 | |
| Series 252,Cl. 2, 99.999%, 11/25/233 | | | 214,758 | | | | 36,922 | |
| Series 294,Cl. 2, 99.999%, 2/25/283 | | | 26,572 | | | | 6,715 | |
| Series 301,Cl. 2, 6.128%, 4/25/293 | | | 2,180 | | | | 520 | |
| Series 303,Cl. IO, 35.026%, 11/25/293 | | | 46,378 | | | | 12,004 | |
| Series 320,Cl. 2, 34.649%, 4/25/323 | | | 180,738 | | | | 52,372 | |
| Series 321,Cl. 2, 0.00%, 4/25/323,4 | | | 456,651 | | | | 107,659 | |
| Series 324,Cl. 2, 0.00%, 7/25/323,4 | | | 4,775 | | | | 1,149 | |
| Series 331,Cl. 5, 0.00%, 2/25/333,4 | | | 6,782 | | | | 1,310 | |
| Series 331,Cl. 9, 27.723%, 2/25/333 | | | 151,099 | | | | 32,237 | |
| Series 334,Cl. 12, 0.00%, 3/25/333,4 | | | 11,135 | | | | 2,530 | |
| Series 334,Cl. 17, 20.596%, 2/25/333 | | | 96,379 | | | | 19,886 | |
| Series 339,Cl. 12, 0.00%, 6/25/333,4 | | | 154,729 | | | | 31,986 | |
| Series 339,Cl. 7, 0.00%, 11/25/333,4 | | | 324,925 | | | | 65,633 | |
| Series 343,Cl. 13, 0.00%, 9/25/333,4 | | | 159,769 | | | | 31,888 | |
| Series 343,Cl. 18, 0.00%, 5/25/343,4 | | | 39,700 | | | | 9,381 | |
| Series 345,Cl. 9, 0.00%, 1/25/343,4 | | | 115,693 | | | | 22,212 | |
| Series 351,Cl. 10, 0.00%, 4/25/343,4 | | | 51,322 | | | | 10,542 | |
| Series 351,Cl. 8, 0.00%, 4/25/343,4 | | | 87,557 | | | | 17,965 | |
| Series 356,Cl. 10, 0.00%, 6/25/353,4 | | | 62,881 | | | | 12,728 | |
| Series 356,Cl. 12, 0.00%, 2/25/353,4 | | | 30,498 | | | | 6,905 | |
| Series 362,Cl. 13, 0.00%, 8/25/353,4 | | | 122,556 | | | | 25,381 | |
| Series 364,Cl. 15, 0.00%, 9/25/353,4 | | | 6,389 | | | | 1,188 | |
| Series 364,Cl. 16, 0.00%, 9/25/353,4 | | | 133,692 | | | | 26,064 | |
| Series 365,Cl. 16, 0.00%, 3/25/363,4 | | | 179,626 | | | | 36,292 | |
| |
| Federal National Mortgage Assn., Real Estate Mtg. Investment Conduit Multiclass Pass-Through Certificates: | |
| Series 1993-87,Cl. Z, 6.50%, 6/25/23 | | | 159,421 | | | | 173,672 | |
| Series 1998-58,Cl. PC, 6.50%, 10/25/28 | | | 121,912 | | | | 134,645 | |
| Series 1998-61,Cl. PL, 6.00%, 11/25/28 | | | 63,548 | | | | 72,122 | |
| Series 1999-54,Cl. LH, 6.50%, 11/25/29 | | | 100,253 | | | | 115,244 | |
| Series 2001-51,Cl. OD, 6.50%, 10/25/31 | | | 7,427 | | | | 8,176 | |
| Series 2001-74,Cl. QE, 6.00%, 12/25/31 | | | 152,211 | | | | 173,179 | |
| Series 2002-12,Cl. PG, 6.00%, 3/25/17 | | | 24 | | | | 24 | |
| Series 2003-100,Cl. PA, 5.00%, 10/25/18 | | | 74,370 | | | | 76,045 | |
| Series 2003-28,Cl. KG, 5.50%, 4/25/23 | | | 479,713 | | | | 519,120 | |
| Series 2003-84,Cl. GE, 4.50%, 9/25/18 | | | 3,513 | | | | 3,605 | |
| Series 2004-101,Cl. BG, 5.00%, 1/25/20 | | | 2,425 | | | | 2,429 | |
| Series 2004-25,Cl. PC, 5.50%, 1/25/34 | | | 3,485 | | | | 3,595 | |
| Series 2005-73,Cl. DF, 1.006%, 8/25/352 | | | 6,633 | | | | 6,661 | |
| Series 2006-11,Cl. PS, 21.794%, 3/25/362 | | | 83,689 | | | | 124,565 | |
| Series 2006-46,Cl. SW, 21.427%, 6/25/362 | | | 60,902 | | | | 81,940 | |
| Series 2006-50,Cl. KS, 21.428%, 6/25/362 | | | 81,701 | | | | 119,541 | |
| Series 2008-75,Cl. DB, 4.50%, 9/25/23 | | | 25,157 | | | | 25,659 | |
| Series 2009-113,Cl. DB, 3.00%, 12/25/20 | | | 83,622 | | | | 84,680 | |
| Series 2009-36,Cl. FA, 1.696%, 6/25/372 | | | 69,251 | | | | 70,829 | |
8 OPPENHEIMER CORE BOND FUND/VA
| | | | | | | | |
| | | Principal Amount | | | Value | |
| |
| FHLMC/FNMA/FHLB/Sponsored (Continued) | |
| |
| Federal National Mortgage Assn., Real Estate Mtg. Investment Conduit Multiclass Pass-Through Certificates: (Continued) | |
| Series 2009-70,Cl. TL, 4.00%, 8/25/19 | | $ | 32,819 | | | $ | 33,246 | |
| Series 2010-43,Cl. KG, 3.00%, 1/25/21 | | | 26,551 | | | | 26,971 | |
| Series 2011-3,Cl. EL, 3.00%, 5/25/20 | | | 136,690 | | | | 138,392 | |
| Series 2011-38,Cl. AH, 2.75%, 5/25/20 | | | 2,181 | | | | 2,202 | |
| Series 2011-82,Cl. AD, 4.00%, 8/25/26 | | | 51,522 | | | | 52,600 | |
| |
| Federal National Mortgage Assn., Real Estate Mtg. Investment Conduit Multiclass Pass-Through Certificates, Interest-Only Stripped Mtg.-Backed Security: | |
| Series 2001-61,Cl. SH, 17.584%, 11/18/313 | | | 6,151 | | | | 1,455 | |
| Series 2001-63,Cl. SD, 52.614%, 12/18/313 | | | 2,075 | | | | 422 | |
| Series 2001-65,Cl. S, 29.387%, 11/25/313 | | | 154,334 | | | | 30,165 | |
| Series 2001-68,Cl. SC, 39.602%, 11/25/313 | | | 1,393 | | | | 295 | |
| Series 2001-81,Cl. S, 27.623%, 1/25/323 | | | 45,836 | | | | 12,969 | |
| Series 2002-28,Cl. SA, 27.098%, 4/25/323 | | | 1,330 | | | | 272 | |
| Series 2002-38,Cl. SO, 61.581%, 4/25/323 | | | 4,012 | | | | 732 | |
| Series 2002-39,Cl. SD, 49.534%, 3/18/323 | | | 2,653 | | | | 522 | |
| Series 2002-47,Cl. NS, 29.176%, 4/25/323 | | | 132,304 | | | | 32,187 | |
| Series 2002-48,Cl. S, 34.434%, 7/25/323 | | | 2,191 | | | | 466 | |
| Series 2002-51,Cl. S, 27.72%, 8/25/323 | | | 121,455 | | | | 23,241 | |
| Series 2002-52,Cl. SD, 71.891%, 9/25/323 | | | 186,728 | | | | 37,802 | |
| Series 2002-52,Cl. SL, 28.106%, 9/25/323 | | | 1,374 | | | | 285 | |
| Series 2002-53,Cl. SK, 70.502%, 4/25/323 | | | 9,244 | | | | 1,904 | |
| Series 2002-56,Cl. SN, 32.718%, 7/25/323 | | | 2,987 | | | | 624 | |
| Series 2002-60,Cl. SM, 20.925%, 8/25/323 | | | 19,812 | | | | 3,424 | |
| Series 2002-7,Cl. SK, 21.511%, 1/25/323 | | | 8,757 | | | | 1,755 | |
| Series 2002-77,Cl. BS, 21.321%, 12/18/323 | | | 12,513 | | | | 2,533 | |
| Series 2002-77,Cl. IS, 47.912%, 12/18/323 | | | 6,836 | | | | 1,330 | |
| Series 2002-77,Cl. SH, 33.094%, 12/18/323 | | | 61,390 | | | | 12,872 | |
| Series 2002-84,Cl. SA, 27.678%, 12/25/323 | | | 145,746 | | | | 29,481 | |
| Series 2002-9,Cl. MS, 25.517%, 3/25/323 | | | 2,298 | | | | 471 | |
| Series 2002-90,Cl. SN, 21.338%, 8/25/323 | | | 10,192 | | | | 1,762 | |
| Series 2002-90,Cl. SY, 25.223%, 9/25/323 | | | 7,294 | | | | 1,238 | |
| Series 2003-26,Cl. DI, 42.779%, 4/25/333 | | | 6,451 | | | | 1,512 | |
| Series 2003-33,Cl. SP, 33.145%, 5/25/333 | | | 151,789 | | | | 30,627 | |
| Series 2003-4,Cl. S, 21.312%, 2/25/333 | | | 92,787 | | | | 20,778 | |
| Series 2004-54,Cl. DS, 99.999%, 11/25/303 | | | 131,636 | | | | 23,572 | |
| Series 2005-12,Cl. SC, 43.072%, 3/25/353 | | | 33,603 | | | | 5,249 | |
| Series 2005-14,Cl. SE, 54.967%, 3/25/353 | | | 104,805 | | | | 16,264 | |
| Series 2005-40,Cl. SA, 99.999%, 5/25/353 | | | 302,731 | | | | 54,342 | |
| Series 2005-40,Cl. SB, 83.359%, 5/25/353 | | | 13,135 | | | | 1,968 | |
| | | | | | | | |
| | | Principal Amount | | | Value | |
| |
| FHLMC/FNMA/FHLB/Sponsored (Continued) | |
| |
| Federal National Mortgage Assn., Real Estate Mtg. Investment Conduit Multiclass Pass-Through Certificates, Interest-Only Stripped Mtg.-Backed Security: (Continued) | |
| Series 2005-52,Cl. JH, 49.433%, 5/25/353 | | $ | 80,746 | | | $ | 12,533 | |
| Series 2005-93,Cl. SI, 11.819%, 10/25/353 | | | 209,881 | | | | 37,420 | |
| Series 2008-55,Cl. SA, 0.00%, 7/25/383,4 | | | 15,917 | | | | 1,719 | |
| Series 2009-8,Cl. BS, 99.999%, 2/25/243 | | | 14,605 | | | | 428 | |
| Series 2011-96,Cl. SA, 14.482%, 10/25/413 | | | 60,579 | | | | 10,696 | |
| Series 2012-134,Cl. SA, 9.568%, 12/25/423 | | | 172,008 | | | | 35,883 | |
| Series 2012-40,Cl. PI, 3.764%, 4/25/413 | | | 139,640 | | | | 18,731 | |
| |
| Federal National Mortgage Assn., Real Estate Mtg. Investment Conduit Multiclass Pass-Through Certificates, Principal-Only Stripped Mtg.-Backed Security, Series 1993-184, Cl. M, 5.195%, 9/25/235 | | | 71,445 | | | | 66,364 | |
| | | | | | | | |
| | | | | | | 35,092,038 | |
|
| |
| GNMA/Guaranteed—4.5% | |
| |
| Government National Mortgage Assn. I Pool: | |
| 7.00%, 12/15/23-3/15/26 | | | 6,724 | | | | 7,206 | |
| 8.50%, 8/15/17-12/15/17 | | | 1,224 | | | | 1,227 | |
| |
| Government National Mortgage Assn. II Pool: | |
| 3.50%, 1/21/476 | | | 3,890,000 | | | | 4,041,236 | |
| 4.00%, 1/1/476 | | | 1,940,000 | | | | 2,059,268 | |
| |
| Government National Mortgage Assn., Interest-Only Stripped Mtg.-Backed Security: | |
| Series 2002-15,Cl. SM, 99.999%, 2/16/323 | | | 214,065 | | | | 30,223 | |
| Series 2007-17,Cl. AI, 65.36%, 4/16/373 | | | 73,069 | | | | 12,804 | |
| Series 2011-52,Cl. HS, 34.013%, 4/16/413 | | | 485,000 | | | | 79,495 | |
| | | | | | | | |
| | | | | | | 6,231,459 | |
|
| |
| Non-Agency—12.7% | |
| |
| Commercial—8.8% | |
| |
| Asset Securitization Corp., Interest-Only Stripped Mtg.-Backed Security, Series 1997-D4, Cl. PS1, 91.934%, 4/14/293 | | | 1,244,619 | | | | 6,009 | |
| |
| Banc of America Funding Trust, Series 2014-R7, Cl. 3A1, 3.003%, 3/26/362 | | | 213,985 | | | | 214,354 | |
| |
| BCAP LLC Trust, Series 2011-R11, Cl. 18A5, 2.69%, 9/26/351,2 | | | 98,535 | | | | 98,476 | |
| |
| Capital Lease Funding Securitization LP, Interest-Only Commercial Mtg. Pass-Through Certificates, Series 1997-CTL1, Cl. IO, 0.00%, 6/22/241,3,4 | | | 299,643 | | | | 8,866 | |
| |
| CD Commercial Mortgage Trust, Series 2016-CD2, Cl. AM, 3.668%, 11/10/492 | | | 150,000 | | | | 153,846 | |
| |
| Chase Mortgage Finance Trust, Series 2005- A2, Cl. 1A3, 2.966%, 1/25/362 | | | 124,900 | | | | 118,197 | |
| |
| Citigroup Global Markets Mortgage Securities VII, Inc., Interest-Only Stripped Mtg.-Backed Security, Series 1999-C1, Cl. X, 0.00%, 5/18/323,4 | | | 653,277 | | | | 698 | |
| |
| COMM Mortgage Trust: | | | | | | | | |
| Series 2013-CR6,Cl. AM, 3.147%, 3/10/461 | | | 245,000 | | | | 244,997 | |
| Series 2013-CR7,Cl. D, 4.354%, 3/10/461,2 | | | 390,000 | | | | 355,024 | |
| Series 2014-CR21,Cl. AM, 3.987%, 12/10/47 | | | 715,000 | | | | 740,393 | |
| Series 2014-LC15,Cl. AM, 4.198%, 4/10/47 | | | 85,000 | | | | 89,386 | |
| Series 2014-UBS6,Cl. AM, 4.048%, 12/10/47 | | | 475,000 | | | | 487,029 | |
9 OPPENHEIMER CORE BOND FUND/VA
STATEMENT OF INVESTMENTS Continued
| | | | | | | | |
| | | Principal Amount | | | Value | |
| |
| Commercial (Continued) | |
| |
| COMM Mortgage Trust: (Continued) | |
| Series 2015-CR23,Cl. AM, 3.801%, 5/10/48 | | $ | 280,000 | | | $ | 285,599 | |
| |
| COMM Mortgage Trust, Interest-Only Stripped Mtg.-Backed Security, Series 2012-CR5, Cl. XA, 0.00%, 12/10/453,4 | | | 2,484,924 | | | | 166,314 | |
| |
| CSMC, Series 2006-6, Cl. 1A4, 6%, 7/25/36 | | | 192,306 | | | | 144,262 | |
| |
| Deutsche Bank Commercial Mortgage Trust, Series 2016-C1, Cl. AM, 3.539%, 5/10/49 | | | 140,000 | | | | 141,334 | |
| |
| First Horizon Alternative Mortgage Securities Trust: | |
| Series 2004-FA2,Cl. 3A1, 6.00%, 1/25/35 | | | 124,810 | | | | 114,817 | |
| Series 2005-FA8,Cl. 1A6, 1.406%, 11/25/352 | | | 157,197 | | | | 105,754 | |
| |
| FREMF Mortgage Trust: | |
| Series 2013-K25,Cl. C, 3.743%, 11/25/451,2 | | | 90,000 | | | | 86,493 | |
| Series 2013-K26,Cl. C, 3.599%, 12/25/451,2 | | | 60,000 | | | | 56,944 | |
| Series 2013-K27,Cl. C, 3.616%, 1/25/461,2 | | | 95,000 | | | | 90,821 | |
| Series 2013-K28,Cl. C, 3.494%, 6/25/461,2 | | | 285,000 | | | | 270,168 | |
| Series 2013-K502,Cl. C, 3.077%, 3/25/451,2 | | | 175,000 | | | | 175,286 | |
| Series 2013-K712,Cl. C, 3.365%, 5/25/451,2 | | | 75,000 | | | | 75,076 | |
| Series 2013-K713,Cl. C, 3.165%, 4/25/461,2 | | | 115,000 | | | | 112,892 | |
| Series 2014-K715,Cl. C, 4.126%, 2/25/461,2 | | | 50,000 | | | | 49,354 | |
| |
| GSMSC Pass-Through Trust, Series 2009-3R, Cl. 1A2, 6%, 4/25/371,2 | | | 356,487 | | | | 337,192 | |
| |
| GSR Mortgage Loan Trust, Series 2005-AR4, Cl. 6A1, 3.209%, 7/25/352 | | | 94,065 | | | | 92,781 | |
| |
| JP Morgan Chase Commercial Mortgage Securities Trust: | |
| Series 2013-C10,Cl. AS, 3.372%, 12/15/47 | | | 315,000 | | | | 319,792 | |
| Series 2013-C16,Cl. AS, 4.517%, 12/15/46 | | | 300,000 | | | | 323,337 | |
| Series 2013-LC11,Cl. AS, 3.216%, 4/15/46 | | | 40,000 | | | | 40,175 | |
| Series 2014-C20,Cl. AS, 4.043%, 7/15/47 | | | 205,000 | | | | 214,166 | |
| |
| JP Morgan Mortgage Trust, Series 2007-A1, Cl. 5A1, 3.178%, 7/25/352 | | | 98,477 | | | | 98,714 | |
| |
| JP Morgan Resecuritization Trust, Series 2009-5, Cl. 1A2, 3.08%, 7/26/361,2 | | | 330,993 | | | | 299,895 | |
| |
| JPMBB Commercial Mortgage Securities Trust: | |
| Series 2014-C19,Cl. AS, 4.243%, 4/15/472 | | | 130,000 | | | | 137,719 | |
| Series 2014-C25,Cl. AS, 4.065%, 11/15/47 | | | 490,000 | | | | 512,804 | |
| Series 2014-C26,Cl. AS, 3.80%, 1/15/48 | | | 155,000 | | | | 159,382 | |
| |
| JPMDB Commercial Mortgage Securities Trust, Series 2016-C4, Cl. AS, 3.385%, 12/15/49 | | | 230,000 | | | | 229,075 | |
| |
| LB Commercial Conduit Mortgage Trust, Interest-Only Stripped Mtg.-Backed Security, Series 1998-C1, Cl. IO, 0.00%, 2/18/303,4 | | | 265,261 | | | | 8 | |
| |
| Lehman Structured Securities Corp., Series 2002-GE1, Cl. A, 0%, 7/26/241,2 | | | 44,930 | | | | 36,539 | |
| |
| Morgan Stanley Bank of America Merrill Lynch Trust: | |
| Series 2013-C9,Cl. AS, 3.456%, 5/15/46 | | | 225,000 | | | | 227,642 | |
| Series 2014-C19,Cl. AS, 3.832%, 12/15/47 | | | 595,000 | | | | 610,301 | |
| Series 2016-C30,Cl. AS, 3.175%, 9/15/49 | | | 375,000 | | | | 362,737 | |
| |
| Morgan Stanley Re-Remic Trust, Series 2012-R3, Cl. 1B, 2.615%, 11/26/361,2 | | | 450,542 | | | | 345,704 | |
| | | | | | | | |
| | | Principal Amount | | | Value | |
| |
| Commercial (Continued) | |
| |
| Morgan Stanley Resecuritization Trust, Series 2013-R9, Cl. 3A, 2.756%, 6/26/461,2 | | $ | 214,505 | | | $ | 214,331 | |
| |
| RBSSP Resecuritization Trust, Series 2010-1, Cl. 2A1, 2.625%, 7/26/451,2 | | | 22,832 | | | | 22,846 | |
| |
| Structured Agency Credit Risk Debt Nts.: | | | | | |
| Series 2013-DN1,Cl. M1, 4.156%, 7/25/232 | | | 211,012 | | | | 214,246 | |
| Series 2014-DN1,Cl. M1, 1.756%, 2/25/242 | | | 17,372 | | | | 17,379 | |
| Series 2014-HQ2,Cl. M1, 2.206%, 9/25/242 | | | 44,467 | | | | 44,632 | |
| Series 2015-DNA3,Cl. M1, 2.106%, 4/25/282 | | | 14,509 | | | | 14,516 | |
| Series 2015-HQA2,Cl. M2, 3.556%, 5/25/282 | | | 95,000 | | | | 97,551 | |
| Series 2016-DNA2,Cl. M1, 2.006%, 10/25/282 | | | 255,411 | | | | 255,748 | |
| Series 2016-DNA3,Cl. M1, 1.856%, 12/25/282 | | | 259,792 | | | | 260,410 | |
| Series 2016-DNA4,Cl. M1, 1.556%, 3/25/292 | | | 171,308 | | | | 171,276 | |
| Series 2016-HQA2,Cl. M1, 1.956%, 11/25/282 | | | 179,344 | | | | 179,559 | |
| Series 2016-HQA3,Cl. M1, 1.556%, 3/25/292 | | | 220,885 | | | | 221,149 | |
| Series 2016-HQA4,Cl. M1, 1.556%, 4/25/292 | | | 380,028 | | | | 379,572 | |
| |
| Wells Fargo Commercial Mortgage Trust: | |
| Series 2015-C29,Cl. AS, 4.013%, 6/15/482 | | | 240,000 | | | | 246,531 | |
| Series 2016-C37,Cl. AS, 4.018%, 12/15/49 | | | 355,000 | | | | 366,702 | |
| |
| WF-RBS Commercial Mortgage Trust: | |
| Series 2012-C7,Cl. E, 4.835%, 6/15/451,2 | | | 120,000 | | | | 113,046 | |
| Series 2013-C14,Cl. AS, 3.488%, 6/15/46 | | | 150,000 | | | | 152,947 | |
| Series 2014-C20,Cl. AS, 4.176%, 5/15/47 | | | 130,000 | | | | 137,072 | |
| Series 2014-LC14,Cl. AS, 4.351%, 3/15/472 | | | 145,000 | | | | 154,097 | |
| | | | | | | | |
| | | | | | | 12,003,962 | |
|
| |
| Residential—3.9% | |
| |
| Banc of America Funding Trust: | |
| Series 2007-1,Cl. 1A3, 6.00%, 1/25/37 | | | 122,268 | | | | 109,121 | |
| Series 2007-C,Cl. 1A4, 3.096%, 5/20/362 | | | 55,874 | | | | 50,540 | |
| |
| Banc of America Mortgage Trust, Series 2007-1, Cl. 1A24, 6%, 3/25/37 | | | 84,452 | | | | 77,016 | |
| |
| Bear Stearns ARM Trust: | |
| Series 2005-2,Cl. A1, 2.92%, 3/25/352 | | | 170,309 | | | | 171,555 | |
| Series 2005-9,Cl. A1, 2.83%, 10/25/352 | | | 170,106 | | | | 164,783 | |
| Series 2006-1,Cl. A1, 2.91%, 2/25/362 | | | 219,586 | | | | 218,359 | |
| |
| Carrington Mortgage Loan Trust, Series 2006-FRE1, Cl. A2, 0.866%, 7/25/362 | | | 5,310 | | | | 5,311 | |
| |
| CHL Mortgage Pass-Through Trust: | |
| Series 2005-17,Cl. 1A8, 5.50%, 9/25/35 | | | 18,137 | | | | 18,085 | |
| Series 2005-26,Cl. 1A8, 5.50%, 11/25/35 | | | 100,082 | | | | 93,165 | |
| Series 2005-J4,Cl. A7, 5.50%, 11/25/35 | | | 13,649 | | | | 13,449 | |
| |
| Citigroup Mortgage Loan Trust, Inc., Series 2006-AR1, Cl. 1A1, 2.87%, 10/25/352 | | | 459,531 | | | | 458,718 | |
| |
| Connecticut Avenue Securities: | |
| Series 2014-C01,Cl. M1, 2.356%, 1/25/242 | | | 25,108 | | | | 25,244 | |
| Series 2014-C02,Cl. 2M1, 1.706%, 5/25/242 | | | 103,767 | | | | 103,923 | |
| Series 2014-C03,Cl. 1M1, 1.956%, 7/25/242 | | | 330,226 | | | | 331,120 | |
10 OPPENHEIMER CORE BOND FUND/VA
| | | | | | | | |
| | | Principal Amount | | | Value | |
| |
| Residential (Continued) | |
| |
| Connecticut Avenue Securities: (Continued) | |
| Series 2014-C03,Cl. 2M1, 1.956%, 7/25/242 | | $ | 137,834 | | | $ | 137,986 | |
| Series 2014-C04,Cl. 2M1, 2.856%, 11/25/242 | | | 2,632 | | | | 2,634 | |
| Series 2015-C02,Cl. 1M1, 1.906%, 5/25/252 | | | 13,094 | | | | 13,096 | |
| Series 2015-C03,Cl. 1M1, 2.256%, 7/25/252 | | | 96,020 | | | | 96,205 | |
| Series 2015-C03,Cl. 2M1, 2.256%, 7/25/252 | | | 27,458 | | | | 27,515 | |
| Series 2016-C02,Cl. 1M1, 2.906%, 9/25/282 | | | 37,885 | | | | 38,287 | |
| Series 2016-C03,Cl. 1M1, 2.756%, 10/25/282 | | | 9,647 | | | | 9,780 | |
| Series 2016-C03,Cl. 2M1, 2.956%, 10/25/282 | | | 128,355 | | | | 129,710 | |
| Series 2016-C06,Cl. 1M1, 2.056%, 4/25/292 | | | 341,735 | | | | 342,536 | |
| Series 2016-C07,Cl. 2M1, 2.056%, 4/25/292 | | | 195,000 | | | | 195,243 | |
| |
| HomeBanc Mortgage Trust, Series 2005-3, Cl. A2, 1.066%, 7/25/352 | | | 42,097 | | | | 41,472 | |
| |
| MASTR Asset Backed Securities Trust, Series 2006-WMC3, Cl. A3, 0.856%, 8/25/362 | | | 49,883 | | | | 23,489 | |
| |
| RALI Trust: | | | | | | | | |
| Series 2006-QS13,Cl. 1A8, 6.00%, 9/25/36 | | | 879 | | | | 719 | |
| Series 2007-QS6,Cl. A28, 5.75%, 4/25/37 | | | 11,013 | | | | 9,250 | |
| |
| WaMu Mortgage Pass-Through Certificates Trust: | |
| Series 2003-AR10,Cl. A7, 2.825%, 10/25/332 | | | 108,058 | | | | 110,341 | |
| Series 2005-AR14,Cl. 1A4, 2.792%, | | | | | | | | |
| 12/25/352 | | | 216,311 | | | | 209,478 | |
| Series 2005-AR16,Cl. 1A1, 2.85%, 12/25/352 | | | 93,949 | | | | 88,499 | |
| |
| Wells Fargo Mortgage-Backed Securities Trust: | |
| Series 2005-AR10,Cl. 1A1, 3.022%, 6/25/352 | | | 401,117 | | | | 417,260 | |
| Series 2005-AR13,Cl. 1A5, 3.058%, 5/25/352 | | | 86,253 | | | | 86,503 | |
| Series 2005-AR15,Cl. 1A2, 2.983%, 9/25/352 | | | 116,773 | | | | 113,642 | |
| Series 2005-AR15,Cl. 1A6, 2.983%, 9/25/352 | | | 46,050 | | | | 43,799 | |
| Series 2005-AR4,Cl. 2A2, 3.067%, 4/25/352 | | | 276,079 | | | | 276,380 | |
| Series 2006-AR10,Cl. 1A1, 3.027%, 7/25/362 | | | 72,311 | | | | 69,627 | |
| Series 2006-AR10,Cl. 5A5, 3.08%, 7/25/362 | | | 212,220 | | | | 209,173 | |
| Series 2006-AR14,Cl. 1A2, 3.062%, 10/25/362 | | | 108,643 | | | | 101,750 | |
| Series 2006-AR2,Cl. 2A3, 3.003%, 3/25/362 | | | 94,086 | | | | 92,533 | |
| Series 2006-AR7,Cl. 2A4, 3.089%, 5/25/362 | | | 7,075 | | | | 6,752 | |
| Series 2006-AR8,Cl. 2A1, 3.083%, 4/25/362 | | | 237,122 | | | | 233,896 | |
| Series 2006-AR8,Cl. 2A4, 3.083%, 4/25/362 | | | 103,794 | | | | 102,382 | |
| Series 2007-16,Cl. 1A1, 6.00%, 12/28/37 | | | 92,092 | | | | 95,735 | |
| Series 2007-AR3,Cl. A4, 5.949%, 4/25/372 | | | 51,932 | | | | 48,242 | |
| | | | | | | | |
| | | Principal Amount | | | Value | |
| |
| Residential (Continued) | |
| |
| Wells Fargo Mortgage-Backed Securities Trust: (Continued) | |
| Series 2007-AR8,Cl. A1, 3.15%, 11/25/372 | | $ | 159,569 | | | $ | 143,142 | |
| | | | | | | | |
| | | | | | | 5,357,445 | |
| | | | | | | | |
| Total Mortgage-Backed Obligations (Cost $60,192,043) | | | | 58,684,904 | |
|
| |
U.S. Government Obligations—1.6% | | | | | |
| |
| Federal Home Loan Bank Nts., 1.375%, 11/15/19 | | | 97,000 | | | | 96,606 | |
| |
| Federal National Mortgage Assn. Nts.: | | | | | | | | |
| 1.00%, 10/24/19 | | | 157,000 | | | | 154,814 | |
| 1.875%, 9/24/26 | | | 503,000 | | | | 462,076 | |
| |
| United States Treasury Nts., 1.50%, 5/31/197 | | | 1,438,000 | | | | 1,444,368 | |
| | | | | | | | |
| Total U.S. Government Obligations (Cost $2,195,955) | | | | 2,157,864 | |
|
| |
Corporate Bonds and Notes—46.2% | | | | | |
| |
| Consumer Discretionary—8.1% | |
| |
| Auto Components—0.1% | |
| |
| BorgWarner, Inc., 4.375% Sr. Unsec. Nts., 3/15/45 | | | 109,000 | | | | 104,978 | |
|
| |
| Automobiles—2.1% | |
| |
| Daimler Finance North America LLC, 8.50% Sr. Unsec. Unsub. Nts., 1/18/31 | | | 172,000 | | | | 258,979 | |
| |
| Ford Motor Credit Co. LLC, 3.664% Sr. Unsec. Nts., 9/8/24 | | | 759,000 | | | | 740,930 | |
| |
| General Motors Co., 6.25% Sr. Unsec. Nts., 10/2/43 | | | 303,000 | | | | 335,533 | |
| |
| General Motors Financial Co., Inc., 3% Sr. Unsec. Nts., 9/25/17 | | | 344,000 | | | | 347,342 | |
| |
| Harley-Davidson, Inc., 4.625% Sr. Unsec. Nts., 7/28/45 | | | 93,000 | | | | 91,904 | |
| |
| Hyundai Capital America, 2.40% Sr. Unsec. Nts., 10/30/181 | | | 348,000 | | | | 349,477 | |
| |
| Nissan Motor Acceptance Corp.: | | | | | | | | |
| 1.55% Sr. Unsec. Nts., 9/13/191 | | | 86,000 | | | | 84,697 | |
| 2.00% Sr. Unsec. Nts., 3/8/191 | | | 251,000 | | | | 250,431 | |
| |
| ZF North America Capital, Inc., 4.75% Sr. Unsec. Nts., 4/29/251 | | | 338,000 | | | | 345,183 | |
| | | | | | | | |
| | | | | | | 2,804,476 | |
|
| |
| Diversified Consumer Services—0.2% | |
| |
| Service Corp. International, 5.375% Sr. Unsec. Nts., 5/15/24 | | | 311,000 | | | | 325,773 | |
|
| |
| Hotels, Restaurants & Leisure—0.5% | |
| |
| Marriott International, Inc.: | | | | | | | | |
| 3.25% Sr. Unsec. Nts., 9/15/22 | | | 148,000 | | | | 149,266 | |
| 6.375% Sr. Unsec. Nts., 6/15/17 | | | 314,000 | | | | 320,845 | |
| |
| McDonald’s Corp., 2.75% Sr. Unsec. Nts., 12/9/20 | | | 153,000 | | | | 155,402 | |
| | | | | | | | |
| | | | | | | 625,513 | |
|
| |
| Household Durables—1.2% | |
| |
| Lennar Corp., 4.75% Sr. Unsec. Nts., 5/30/25 | | | 344,000 | | | | 337,120 | |
| |
| Newell Brands, Inc.: | | | | | | | | |
| 5.00% Sr. Unsec. Nts., 11/15/23 | | | 346,000 | | | | 371,128 | |
| 5.50% Sr. Unsec. Nts., 4/1/46 | | | 81,000 | | | | 93,027 | |
| |
| PulteGroup, Inc., 5% Sr. Unsec. Nts., 1/15/27 | | | 359,000 | | | | 342,396 | |
| |
| Toll Brothers Finance Corp., 4.375% Sr. Unsec. Nts., 4/15/23 | | | 352,000 | | | | 352,440 | |
| |
| Whirlpool Corp.: | | | | | | | | |
| 1.35% Sr. Unsec. Nts., 3/1/17 | | | 104,000 | | | | 104,024 | |
| 1.65% Sr. Unsec. Nts., 11/1/17 | | | 85,000 | | | | 85,134 | |
| | | | | | | | |
| | | | | | | 1,685,269 | |
11 OPPENHEIMER CORE BOND FUND/VA
STATEMENT OF INVESTMENTS Continued
| | | | | | | | |
| | | Principal Amount | | | Value | |
| |
| Leisure Equipment & Products—0.3% | |
| |
| Mattel, Inc., 1.70% Sr. Unsec. Nts., 3/15/18 | | $ | 371,000 | | | $ | 370,228 | |
|
| |
| Media—1.9% | |
| |
| 21st Century Fox America, Inc., 4.75% Sr. Unsec. Nts., 11/15/461 | | | 142,000 | | | | 142,707 | |
| |
| Charter Communications Operating LLC/Charter Communications Operating Capital: | |
| 4.464% Sr. Sec. Nts., 7/23/22 | | | 154,000 | | | | 160,962 | |
| 6.484% Sr. Sec. Nts., 10/23/45 | | | 230,000 | | | | 266,365 | |
| |
| Comcast Cable Communications Holdings, Inc., 9.455% Sr. Unsec. Nts., 11/15/22 | | | 242,000 | | | | 327,448 | |
| |
| Comcast Corp., 2.35% Sr. Unsec. Nts., 1/15/27 | | | 159,000 | | | | 146,913 | |
| |
| Historic TW, Inc., 9.15% Debs., 2/1/23 | | | 96,000 | | | | 123,136 | |
| |
| Interpublic Group of Cos., Inc. (The), 4.20% Sr. Unsec. Nts., 4/15/24 | | | 113,000 | | | | 116,156 | |
| |
| Sky plc: | | | | | | | | |
| 3.75% Sr. Unsec. Nts., 9/16/241 | | | 162,000 | | | | 162,587 | |
| 6.10% Sr. Unsec. Nts., 2/15/181 | | | 116,000 | | | | 121,051 | |
| |
| Thomson Reuters Corp., 1.65% Sr. Unsec. Nts., 9/29/17 | | | 366,000 | | | | 366,461 | |
| |
| Time Warner Cable LLC, 4.50% Sr. Unsec. Unsub. Nts., 9/15/42 | | | 126,000 | | | | 114,322 | |
| |
| Time Warner, Inc., 2.95% Sr. Unsec. Nts., 7/15/26 | | | 168,000 | | | | 156,582 | |
| |
| Viacom, Inc.: | | | | | | | | |
| 2.25% Sr. Unsec. Nts., 2/4/22 | | | 70,000 | | | | 65,793 | |
| 3.45% Sr. Unsec. Nts., 10/4/26 | | | 84,000 | | | | 77,675 | |
| 4.375% Sr. Unsec. Nts., 3/15/43 | | | 107,000 | | | | 85,383 | |
| |
| Virgin Media Secured Finance plc, 5.25% Sr. Sec. Nts., 1/15/261 | | | 227,000 | | | | 225,014 | |
| | | | | | | | |
| | | | | | | 2,658,555 | |
|
| |
| Multiline Retail—0.3% | |
| |
| Dollar Tree, Inc., 5.75% Sr. Sec. Nts., 3/1/23 | | | 325,000 | | | | 345,741 | |
|
| |
| Specialty Retail—1.0% | |
| |
| AutoZone, Inc.: | | | | | | | | |
| 1.30% Sr. Unsec. Nts., 1/13/17 | | | 59,000 | | | | 59,002 | |
| 1.625% Sr. Unsec. Nts., 4/21/19 | | | 64,000 | | | | 63,436 | |
| |
| Best Buy Co., Inc., 5.50% Sr. Unsec. Nts., 3/15/21 | | | 212,000 | | | | 232,984 | |
| |
| L Brands, Inc., 5.625% Sr. Unsec. Nts., 2/15/22 | | | 120,000 | | | | 128,250 | |
| |
| Lowe’s Cos., Inc., 3.70% Sr. Unsec. Nts., 4/15/46 | | | 152,000 | | | | 141,947 | |
| |
| Ross Stores, Inc., 3.375% Sr. Unsec. Nts., 9/15/24 | | | 355,000 | | | | 357,634 | |
| |
| Sally Holdings LLC/Sally Capital, Inc., 5.625% Sr. Unsec. Nts., 12/1/25 | | | 330,000 | | | | 344,850 | |
| |
| Signet UK Finance plc, 4.70% Sr. Unsec. Nts., 6/15/24 | | | 101,000 | | | | 96,832 | |
| | | | | | | | |
| | | | | | | 1,424,935 | |
|
| |
| Textiles, Apparel & Luxury Goods—0.5% | |
| |
| Hanesbrands, Inc., 4.875% Sr. Unsec. Nts., 5/15/261 | | | 239,000 | | | | 234,817 | |
| |
| Levi Strauss & Co., 5% Sr. Unsec. Nts., 5/1/25 | | | 302,000 | | | | 303,510 | |
| |
| PVH Corp., 4.50% Sr. Unsec. Unsub. Nts., 12/15/22 | | | 154,000 | | | | 157,080 | |
| | | | | | | | |
| | | | | | | 695,407 | |
|
| |
| Consumer Staples—5.5% | |
| |
| Beverages—1.7% | |
| |
| Anheuser-Busch InBev Finance, Inc.: | |
| 1.90% Sr. Unsec. Nts., 2/1/19 | | | 408,000 | | | | 408,701 | |
| 3.65% Sr. Unsec. Nts., 2/1/26 | | | 85,000 | | | | 86,320 | |
| | | | | | | | |
| | | Principal Amount | | | Value | |
| |
| Beverages (Continued) | |
| |
| Anheuser-Busch InBev Finance, Inc.: (Continued) | |
| 4.90% Sr. Unsec. Nts., 2/1/46 | | $ | 82,000 | | | $ | 88,394 | |
| |
| Anheuser-Busch InBev Worldwide, Inc., 8.20% Sr. Unsec. Unsub. Nts., 1/15/39 | | | 230,000 | | | | 346,431 | |
| |
| Constellation Brands, Inc., 4.75% Sr. Unsec. Nts., 11/15/24 | | | 330,000 | | | | 351,945 | |
| |
| Molson Coors Brewing Co.: | | | | | | | | |
| 2.10% Sr. Unsec. Nts., 7/15/21 | | | 309,000 | | | | 300,985 | |
| 4.20% Sr. Unsec. Nts., 7/15/46 | | | 82,000 | | | | 76,608 | |
| |
| Pernod Ricard SA: | | | | | | | | |
| 2.95% Sr. Unsec. Nts., 1/15/171 | | | 357,000 | | | | 357,195 | |
| 4.25% Sr. Unsec. Nts., 7/15/221 | | | 252,000 | | | | 263,729 | |
| | | | | | | | |
| | | | | | | 2,280,308 | |
|
| |
| Food & Staples Retailing—1.3% | |
| |
| CVS Health Corp., 2.875% Sr. Unsec. Nts., 6/1/26 | | | 348,000 | | | | 331,884 | |
| |
Koninklijke Ahold Delhaize NV,
6.50% Sr. Unsec. Nts., 6/15/17 | | | 224,000 | | | | 228,881 | |
| |
| Kroger Co. (The): | | | | | | | | |
| 2.00% Sr. Unsec. Nts., 1/15/19 | | | 15,000 | | | | 15,038 | |
| 6.40% Sr. Unsec. Nts., 8/15/17 | | | 330,000 | | | | 339,845 | |
| 6.90% Sr. Unsec. Nts., 4/15/38 | | | 90,000 | | | | 115,257 | |
| |
| Walgreens Boots Alliance, Inc.: | | | | | | | | |
| 1.75% Sr. Unsec. Nts., 5/30/18 | | | 240,000 | | | | 240,286 | |
| 3.10% Sr. Unsec. Nts., 6/1/23 | | | 385,000 | | | | 382,583 | |
| |
| Wal-Mart Stores, Inc., 4.30% Sr. Unsec. Nts., 4/22/44 | | | 183,000 | | | | 193,196 | |
| | | | | | | | |
| | | | | | | 1,846,970 | |
|
| |
| Food Products—1.9% | |
| |
| Bunge Ltd. Finance Corp.: | | | | | | | | |
| 3.20% Sr. Unsec. Nts., 6/15/17 | | | 140,000 | | | | 141,066 | |
| 3.25% Sr. Unsec. Nts., 8/15/26 | | | 216,000 | | | | 207,533 | |
| 8.50% Sr. Unsec. Nts., 6/15/19 | | | 289,000 | | | | 331,333 | |
| |
| Ingredion, Inc., 1.80% Sr. Unsec. Nts., 9/25/17 | | | 374,000 | | | | 374,521 | |
| |
| JM Smucker Co. (The), 1.75% Sr. Unsec. Nts., 3/15/18 | | | 288,000 | | | | 288,423 | |
| |
| Kraft Heinz Foods Co.: | | | | | | | | |
| 2.80% Sr. Unsec. Nts., 7/2/20 | | | 321,000 | | | | 324,088 | |
| 4.375% Sr. Unsec. Nts., 6/1/46 | | | 195,000 | | | | 183,862 | |
| |
| Lamb Weston Holdings, Inc., 4.875% Sr. Unsec. Nts., 11/1/261 | | | 184,000 | | | | 182,505 | |
| |
| Mondelez International Holdings Netherlands BV, 1.625% Sr. Unsec. Nts., 10/28/191 | | | 353,000 | | | | 346,111 | |
| |
| TreeHouse Foods, Inc., 6% Sr. Unsec. Nts., 2/15/241 | | | 170,000 | | | | 178,925 | |
| | | | | | | | |
| | | | | | | 2,558,367 | |
|
| |
| Tobacco—0.6% | |
| |
| Altria Group, Inc., 3.875% Sr. Unsec. Nts., 9/16/46 | | | 216,000 | | | | 199,772 | |
| |
| Imperial Brands Finance plc, 2.05% Sr. Unsec. Nts., 7/20/181 | | | 357,000 | | | | 356,995 | |
| |
| Reynolds American, Inc., 5.85% Sr. Unsec. Nts., 8/15/45 | | | 279,000 | | | | 330,991 | |
| | | | | | | | |
| | | | | | | 887,758 | |
|
| |
| Energy—4.0% | |
| |
| Energy Equipment & Services—0.9% | |
| |
| Halliburton Co., 5% Sr. Unsec. Nts., 11/15/45 | | | 92,000 | | | | 99,972 | |
| |
| Helmerich & Payne International Drilling Co., 4.65% Sr. Unsec. Nts., 3/15/25 | | | 146,000 | | | | 150,925 | |
| |
| Schlumberger Holdings Corp.: | | | | | | | | |
| 1.90% Sr. Unsec. Nts., 12/21/171 | | | 334,000 | | | | 335,305 | |
| 4.00% Sr. Unsec. Nts., 12/21/251 | | | 194,000 | | | | 203,261 | |
12 OPPENHEIMER CORE BOND FUND/VA
| | | | | | | | |
| | | Principal Amount | | | Value | |
| |
| Energy Equipment & Services (Continued) | |
| |
| Sinopec Group Overseas Development 2014 Ltd., 1.75% Sr. Unsec. Nts., 4/10/171 | | $ | 369,000 | | | $ | 368,990 | |
| | | | | | | | |
| | | | | | | 1,158,453 | |
|
| |
| Oil, Gas & Consumable Fuels—3.1% | |
| |
| Anadarko Petroleum Corp.: | | | | | | | | |
| 4.50% Sr. Unsec. Nts., 7/15/44 | | | 64,000 | | | | 60,247 | |
| 6.20% Sr. Unsec. Nts., 3/15/40 | | | 64,000 | | | | 73,418 | |
| |
| Apache Corp., 4.75% Sr. Unsec. Nts., 4/15/43 | | | 107,000 | | | | 110,421 | |
| |
| Boardwalk Pipelines LP, 4.95% Sr. Unsec. Nts., 12/15/24 | | | 176,000 | | | | 180,789 | |
| |
| BP Capital Markets plc, 1.676% Sr. Unsec. Nts., 5/3/19 | | | 328,000 | | | | 325,709 | |
| |
| Buckeye Partners LP, 3.95% Sr. Unsec. Nts., 12/1/26 | | | 85,000 | | | | 82,969 | |
| |
| Chevron Corp., 1.561% Sr. Unsec. Nts., 5/16/19 | | | 352,000 | | | | 350,742 | |
| |
| CNOOC Nexen Finance 2014 ULC, 1.625% Sr. Unsec. Nts., 4/30/17 | | | 373,000 | | | | 372,780 | |
| |
| Columbia Pipeline Group, Inc., 4.50% Sr. Unsec. Nts., 6/1/25 | | | 168,000 | | | | 176,577 | |
| |
| ConocoPhillips Co.: | |
| 4.95% Sr. Unsec. Nts., 3/15/26 | | | 42,000 | | | | 46,391 | |
| 5.95% Sr. Unsec. Nts., 3/15/46 | | | 89,000 | | | | 110,344 | |
| |
| Devon Energy Corp., 4.75% Sr. Unsec. Nts., 5/15/42 | | | 106,000 | | | | 100,318 | |
| |
| EnLink Midstream Partners LP, 4.85% Sr. Unsec. Nts., 7/15/26 | | | 87,000 | | | | 87,804 | |
| |
| Enterprise Products Operating LLC: | |
| 4.85% Sr. Unsec. Nts., 8/15/42 | | | 105,000 | | | | 105,174 | |
| 4.90% Sr. Unsec. Nts., 5/15/46 | | | 37,000 | | | | 38,055 | |
| |
| EQT Midstream Partners LP, 4.125% Sr. Unsec. Nts., 12/1/26 | | | 202,000 | | | | 197,005 | |
| |
| Kinder Morgan, Inc., 5.55% Sr. Unsec. Nts., 6/1/45 | | | 276,000 | | | | 290,818 | |
| |
| Noble Energy, Inc., 5.05% Sr. Unsec. Nts., 11/15/44 | | | 92,000 | | | | 92,443 | |
| |
| ONEOK Partners LP, 4.90% Sr. Unsec. Nts., 3/15/25 | | | 156,000 | | | | 167,403 | |
| |
| Phillips 66 Partners LP, 3.605% Sr. Unsec. Nts., 2/15/25 | | | 303,000 | | | | 296,888 | |
| |
| Regency Energy Partners LP/Regency Energy Finance Corp., 5% Sr. Unsec. Nts., 10/1/22 | | | 235,000 | | | | 249,073 | |
| |
| Shell International Finance BV: | |
| 1.375% Sr. Unsec. Nts., 5/10/19 | | | 264,000 | | | | 261,367 | |
| 4.00% Sr. Unsec. Nts., 5/10/46 | | | 130,000 | | | | 124,368 | |
| |
| Tesoro Logistics LP, 5.25% Sr. Unsec. Nts., 1/15/25 | | | 59,000 | | | | 60,475 | |
| |
| TransCanada PipeLines Ltd., 1.625% Sr. Unsec. Nts., 11/9/17 | | | 324,000 | | | | 323,783 | |
| | | | | | | | |
| | | | | | | 4,285,361 | |
|
| |
| Financials—10.3% | |
| |
| Capital Markets—2.2% | |
| |
| Apollo Management Holdings LP, 4% Sr. Unsec. Nts., 5/30/241 | | | 258,000 | | | | 255,757 | |
| |
| Bank of New York Mellon Corp. (The), 3% Sub. Nts., 10/30/28 | | | 146,000 | | | | 138,777 | |
| |
| Brookfield Asset Management, Inc., 4% Sr. Unsec. Nts., 1/15/25 | | | 332,000 | | | | 325,802 | |
| |
| Credit Suisse AG (New York), 3.625% Sr. Unsec. Nts., 9/9/24 | | | 199,000 | | | | 200,286 | |
| |
| Credit Suisse Group Funding Guernsey Ltd., 4.55% Sr. Unsec. Nts., 4/17/26 | | | 130,000 | | | | 135,084 | |
| |
| Deutsche Bank AG (London), 6% Sr. Unsec. Nts., 9/1/17 | | | 173,000 | | | | 177,114 | |
| | | | | | | | |
| | | Principal Amount | | | Value | |
| |
| Capital Markets (Continued) | |
| |
| E*TRADE Financial Corp., 5.875% Jr. Sub. Perpetual Bonds2,8 | | $ | 358,000 | | | $ | 356,836 | |
| |
| Goldman Sachs Group, Inc. (The): | |
| 3.50% Sr. Unsec. Nts., 11/16/26 | | | 208,000 | | | | 204,156 | |
| 3.75% Sr. Unsec. Nts., 2/25/26 | | | 202,000 | | | | 202,696 | |
| |
| Morgan Stanley, 5% Sub. Nts., 11/24/25 | | | 315,000 | | | | 336,674 | |
| |
| Raymond James Financial, Inc., 3.625% Sr. Unsec. Nts., 9/15/26 | | | 202,000 | | | | 197,102 | |
| |
| S&P Global, Inc., 2.50% Sr. Unsec. Nts., 8/15/18 | | | 226,000 | | | | 227,937 | |
| |
| UBS Group Funding Jersey Ltd., 4.125% Sr. Unsec. Nts., 4/15/261 | | | 205,000 | | | | 209,767 | |
| | | | | | | | |
| | | | | | | 2,967,988 | |
|
| |
| Commercial Banks—4.6% | |
| |
| Bank of America Corp.: | | | | | | | | |
| 3.248% Sr. Unsec. Nts., 10/21/27 | | | 294,000 | | | | 280,852 | |
| 7.75% Jr. Sub. Nts., 5/14/38 | | | 236,000 | | | | 325,417 | |
| |
| BB&T Corp., 2.05% Sr. Unsec. Nts., 5/10/21 | | | 360,000 | | | | 353,228 | |
| |
| BPCE SA: | |
| 2.65% Sr. Unsec. Nts., 2/3/21 | | | 321,000 | | | | 320,973 | |
| 3.375% Sr. Unsec. Nts., 12/2/26 | | | 140,000 | | | | 137,246 | |
| |
| Citizens Bank NA (Providence RI), 2.55% Sr. Unsec. Nts., 5/13/21 | | | 281,000 | | | | 279,316 | |
| |
| Danske Bank AS, 2.80% Sr. Unsec. Nts., 3/10/211 | | | 202,000 | | | | 203,382 | |
| |
| Fifth Third Bank (Cincinnati OH), 3.85% Sub. Nts., 3/15/26 | | | 206,000 | | | | 207,409 | |
| |
| First Republic Bank, 4.375% Sub. Nts., 8/1/46 | | | 150,000 | | | | 136,593 | |
| |
| FirstMerit Bank NA (Akron OH), 4.27% Sub. Nts., 11/25/26 | | | 362,000 | | | | 367,624 | |
| |
| HSBC Holdings plc, 2.65% Sr. Unsec. Nts., 1/5/22 | | | 294,000 | | | | 287,595 | |
| |
| Huntington Bancshares, Inc., 3.15% Sr. Unsec. Nts., 3/14/21 | | | 218,000 | | | | 221,104 | |
| |
| ING Bank NV, 2.75% Sr. Unsec. Nts., 3/22/211 | | | 270,000 | | | | 271,089 | |
| |
| JPMorgan Chase & Co.: | |
| 2.295% Sr. Unsec. Nts., 8/15/21 | | | 79,000 | | | | 77,515 | |
| 2.70% Sr. Unsec. Nts., 5/18/23 | | | 152,000 | | | | 148,679 | |
| |
| KeyBank NA (Cleveland OH), 3.40% Sub. Nts., 5/20/26 | | | 302,000 | | | | 293,758 | |
| |
| Lloyds Banking Group plc, 6.657% Jr. Sub. Perpetual Bonds1,2,8 | | | 334,000 | | | | 360,720 | |
| |
| PNC Bank NA, 2.55% Sr. Unsec. Nts., 12/9/21 | | | 149,000 | | | | 149,082 | |
| |
| Regions Bank (Birmingham AL), 2.25% Sr. Unsec. Nts., 9/14/18 | | | 287,000 | | | | 288,005 | |
| |
| Royal Bank of Scotland Group plc, 7.64% Jr. Sub. Perpetual Bonds2,8 | | | 359,000 | | | | 334,767 | |
| |
| Skandinaviska Enskilda Banken AB, 2.625% Sr. Unsec. Nts., 3/15/21 | | | 202,000 | | | | 202,152 | |
| |
| Standard Chartered plc, 6.409% Jr. Sub. Perpetual Bonds1,2,8 | | | 400,000 | | | | 307,000 | |
| |
| SunTrust Bank (Atlanta GA), 3.30% Sub. Nts., 5/15/26 | | | 151,000 | | | | 145,823 | |
| |
| Swedbank AB, 2.65% Sr. Unsec. Nts., 3/10/211 | | | 216,000 | | | | 216,265 | |
| |
| US Bancorp, 3.10% Sub. Nts., 4/27/26 | | | 214,000 | | | | 208,287 | |
| |
| Wells Fargo & Co., 4.75% Sub. Nts., 12/7/46 | | | 208,000 | | | | 210,448 | |
| | | | | | | | |
| | | | | | | 6,334,329 | |
|
| |
| Consumer Finance—0.9% | | | | | | | | |
| |
| Ally Financial, Inc., 4.25% Sr. Unsec. Nts., 4/15/21 | | | 346,000 | | | | 350,109 | |
| |
| Capital One Financial Corp., 3.20% Sr. Unsec. Nts., 2/5/25 | | | 277,000 | | | | 268,606 | |
13 OPPENHEIMER CORE BOND FUND/VA
STATEMENT OF INVESTMENTS Continued
| | | | | | | | |
| | | Principal Amount | | | Value | |
| |
| Consumer Finance (Continued) | |
| |
| Discover Financial Services: | |
| 3.75% Sr. Unsec. Nts., 3/4/25 | | $ | 186,000 | | | $ | 181,930 | |
| 3.95% Sr. Unsec. Nts., 11/6/24 | | | 280,000 | | | | 277,622 | |
| |
| Synchrony Financial, 4.50% Sr. Unsec. Nts., 7/23/25 | | | 97,000 | | | | 99,681 | |
| | | | | | | | |
| | | | | | | 1,177,948 | |
|
| |
| Diversified Financial Services—0.4% | |
| |
| Berkshire Hathaway Energy Co., 2% Sr. Unsec. Nts., 11/15/18 | | | 102,000 | | | | 102,465 | |
| |
| Peachtree Corners Funding Trust, 3.976% Sr. Unsec. Nts., 2/15/251 | | | 189,000 | | | | 184,495 | |
| |
| Voya Financial, Inc., 5.65% Jr. Sub. Nts., 5/15/532 | | | 345,000 | | | | 340,256 | |
| | | | | | | | |
| | | | | | | 627,216 | |
|
| |
| Equity Real Estate Investment Trusts (REITs)—0.9% | |
| |
| American Tower Corp.: | |
| 5.05% Sr. Unsec. Unsub. Nts., 9/1/20 | | | 149,000 | | | | 159,913 | |
| 5.90% Sr. Unsec. Nts., 11/1/21 | | | 200,000 | | | | 223,981 | |
| |
| HCP, Inc., 5.625% Sr. Unsec. Nts., 5/1/17 | | | 107,000 | | | | 108,429 | |
| |
| Highwoods Realty LP, 5.85% Sr. Unsec. Nts., 3/15/17 | | | 149,000 | | | | 150,267 | |
| |
| Ventas Realty LP, 1.25% Sr. Unsec. Nts., 4/17/17 | | | 151,000 | | | | 150,939 | |
| |
| WEA Finance LLC/Westfield UK & Europe Finance plc, 1.75% Sr. Unsec. Nts., 9/15/171 | | | 318,000 | | | | 318,242 | |
| |
| Welltower, Inc., 2.25% Sr. Unsec. Nts., 3/15/18 | | | 75,000 | | | | 75,333 | |
| | | | | | | | |
| | | | | | | 1,187,104 | |
|
| |
| Insurance—1.3% | |
| |
| Arch Capital Finance LLC, 4.011% Sr. Unsec. Nts., 12/15/26 | | | 208,000 | | | | 210,938 | |
| |
| AXIS Specialty Finance plc, 5.15% Sr. Unsec. Nts., 4/1/45 | | | 220,000 | | | | 218,049 | |
| |
| Five Corners Funding Trust, 4.419% Unsec. Nts., 11/15/231 | | | 258,000 | | | | 272,856 | |
| |
| Manulife Financial Corp., 4.15% Sr. Unsec. Nts., 3/4/26 | | | 205,000 | | | | 213,969 | |
| |
| MetLife, Inc., 5.25% Jr. Sub. Perpetual Bonds2,8 | | | 258,000 | | | | 261,870 | |
| |
| Principal Financial Group, Inc., 4.30% Sr. Unsec. Nts., 11/15/46 | | | 150,000 | | | | 147,273 | |
| |
| TIAA Asset Management Finance Co. LLC, 4.125% Sr. Unsec. Nts., 11/1/241 | | | 326,000 | | | | 329,419 | |
| |
| XLIT Ltd., 6.50% Jr. Sub. Perpetual Bonds2,8 | | | 212,000 | | | | 165,890 | |
| | | | | | | | |
| | | | | | | 1,820,264 | |
|
| |
| Health Care—3.6% | |
| |
| Biotechnology—0.8% | |
| |
| AbbVie, Inc.: | | | | | | | | |
| 3.60% Sr. Unsec. Nts., 5/14/25 | | | 167,000 | | | | 165,491 | |
| 4.70% Sr. Unsec. Nts., 5/14/45 | | | 54,000 | | | | 53,084 | |
| |
| Biogen, Inc., 5.20% Sr. Unsec. Nts., 9/15/45 | | | 100,000 | | | | 107,587 | |
| |
| Celgene Corp.: | | | | | | | | |
| 3.875% Sr. Unsec. Nts., 8/15/25 | | | 162,000 | | | | 164,397 | |
| 5.00% Sr. Unsec. Nts., 8/15/45 | | | 39,000 | | | | 40,628 | |
| |
| Shire Acquisitions Investments Ireland DAC: | |
| 1.90% Sr. Unsec. Nts., 9/23/19 | | | 354,000 | | | | 349,578 | |
| 3.20% Sr. Unsec. Nts., 9/23/26 | | | 272,000 | | | | 254,346 | |
| | | | | | | | |
| | | | | | | 1,135,111 | |
|
| |
| Health Care Equipment & Supplies—0.8% | |
| |
| Abbott Laboratories: | | | | | | | | |
| 2.35% Sr. Unsec. Nts., 11/22/19 | | | 349,000 | | | | 349,481 | |
| 4.90% Sr. Unsec. Nts., 11/30/46 | | | 141,000 | | | | 144,999 | |
| | | | | | | | |
| | | Principal Amount | | | Value | |
| |
| Health Care Equipment & Supplies (Continued) | |
| |
| Baxter International, Inc., 2.60% Sr. Unsec. Nts., 8/15/26 | | $ | 169,000 | | | $ | 156,105 | |
| |
| Boston Scientific Corp., 3.85% Sr. Unsec. Nts., 5/15/25 | | | 260,000 | | | | 260,636 | |
| |
| Stryker Corp., 3.50% Sr. Unsec. Nts., 3/15/26 | | | 124,000 | | | | 125,235 | |
| | | | | | | | |
| | | | | | | 1,036,456 | |
|
| |
| Health Care Providers & Services—1.1% | |
| |
| Aetna, Inc., 3.20% Sr. Unsec. Nts., 6/15/26 | | | 264,000 | | | | 261,309 | |
| |
| Cardinal Health, Inc., 3.50% Sr. Unsec. Nts., 11/15/24 | | | 158,000 | | | | 159,822 | |
| |
| Express Scripts Holding Co., 4.50% Sr. Unsec. Nts., 2/25/26 | | | 239,000 | | | | 246,165 | |
| |
| Fresenius Medical Care US Finance II, Inc., 5.875% Sr. Unsec. Nts., 1/31/221 | | | 136,000 | | | | 149,600 | |
| |
| Laboratory Corp. of America Holdings, 3.60% Sr. Unsec. Nts., 2/1/25 | | | 454,000 | | | | 452,224 | |
| |
| McKesson Corp., 4.883% Sr. Unsec. Nts., 3/15/44 | | | 133,000 | | | | 135,551 | |
| |
| Quest Diagnostics, Inc., 3.45% Sr. Unsec. Nts., 6/1/26 | | | 145,000 | | | | 143,096 | |
| | | | | | | | |
| | | | | | | 1,547,767 | |
|
| |
| Life Sciences Tools & Services—0.4% | |
| |
| Thermo Fisher Scientific, Inc.: | | | | | | | | |
| 2.15% Sr. Unsec. Nts., 12/14/18 | | | 138,000 | | | | 138,670 | |
| 3.00% Sr. Unsec. Nts., 4/15/23 | | | 142,000 | | | | 139,613 | |
| 4.15% Sr. Unsec. Nts., 2/1/24 | | | 121,000 | | | | 126,051 | |
| 5.30% Sr. Unsec. Nts., 2/1/44 | | | 105,000 | | | | 117,700 | |
| | | | | | | | |
| | | | | | | 522,034 | |
|
| |
| Pharmaceuticals—0.5% | |
| |
| Actavis Funding SCS: | | | | | | | | |
| 3.80% Sr. Unsec. Nts., 3/15/25 | | | 220,000 | | | | 220,363 | |
| 4.75% Sr. Unsec. Nts., 3/15/45 | | | 94,000 | | | | 92,461 | |
| |
| Perrigo Finance Unlimited Co., 4.375% Sr. Unsec. Nts., 3/15/26 | | | 92,000 | | | | 92,141 | |
| |
| Teva Pharmaceutical Finance Netherlands III BV, 1.70% Sr. Unsec. Nts., 7/19/19 | | | 324,000 | | | | 318,395 | |
| | | | | | | | |
| | | | | | | 723,360 | |
|
| |
| Industrials—3.7% | |
| |
| Aerospace & Defense—0.6% | |
| |
| BAE Systems Holdings, Inc., 3.85% Sr. Unsec. Nts., 12/15/251 | | | 258,000 | | | | 263,259 | |
| |
| L-3 Communications Corp., 3.85% Sr. Unsec. Nts., 12/15/26 | | | 89,000 | | | | 88,516 | |
| |
| Lockheed Martin Corp., 3.55% Sr. Unsec. Nts., 1/15/26 | | | 168,000 | | | | 171,734 | |
| |
| Northrop Grumman Corp., 4.75% Sr. Unsec. Nts., 6/1/43 | | | 180,000 | | | | 196,493 | |
| |
| Textron, Inc., 3.875% Sr. Unsec. Nts., 3/1/25 | | | 111,000 | | | | 111,661 | |
| |
| United Technologies Corp., 1.778% Jr. Sub. Nts., 5/4/182 | | | 60,000 | | | | 60,024 | |
| | | | | | | | |
| | | | | | | 891,687 | |
|
| |
| Building Products—0.2% | |
| |
| Johnson Controls International plc, 1.40%, 11/2/17 | | | 66,000 | | | | 66,116 | |
| |
| Owens Corning, 3.40% Sr. Unsec. Nts., 8/15/26 | | | 243,000 | | | | 230,959 | |
| | | | | | | | |
| | | | | | | 297,075 | |
|
| |
| Commercial Services & Supplies—0.6% | |
| |
| Pitney Bowes, Inc., 4.625% Sr. Unsec. Nts., 3/15/24 | | | 277,000 | | | | 272,960 | |
| |
| Republic Services, Inc.: 2.90% Sr. Unsec. Nts., 7/1/26 | | | 175,000 | | | | 167,856 | |
14 OPPENHEIMER CORE BOND FUND/VA
| | | | | | | | |
| | | Principal Amount | | | Value | |
| |
| Commercial Services & Supplies (Continued) | |
| |
| Republic Services, Inc.: (Continued) | |
| 3.80% Sr. Unsec. Nts., 5/15/18 | | $ | 294,000 | | | $ | 302,231 | |
| |
| Waste Management, Inc., 4.10% Sr. Unsec. Nts., 3/1/45 | | | 85,000 | | | | 84,298 | |
| | | | | | | | |
| | | | | | | 827,345 | |
|
| |
| Electrical Equipment—0.3% | |
| |
| Sensata Technologies BV, 4.875% Sr. Unsec. Nts., 10/15/231 | | | 347,000 | | | | 356,109 | |
|
| |
| Industrial Conglomerates—0.1% | |
| |
| Roper Technologies, Inc.: | |
| 3.80% Sr. Unsec. Nts., 12/15/26 | | | 43,000 | | | | 43,355 | |
| 3.85% Sr. Unsec. Nts., 12/15/25 | | | 170,000 | | | | 172,173 | |
| | | | | | | | |
| | | | | | | 215,528 | |
|
| |
| Machinery—0.5% | |
| |
| Fortive Corp., 1.80% Sr. Unsec. Nts., 6/15/191 | | | 360,000 | | | | 357,880 | |
| |
| Ingersoll-Rand Global Holding Co. Ltd., 4.25% Sr. Unsec. Nts., 6/15/23 | | | 130,000 | | | | 137,545 | |
| |
| Wabtec Corp., 3.45% Sr. Unsec. Nts., 11/15/261 | | | 144,000 | | | | 138,499 | |
| | | | | | | | |
| | | | | | | 633,924 | |
|
| |
| Professional Services—0.3% | |
| |
| Experian Finance plc, 2.375% Sr. Unsec. Nts., 6/15/171 | | | 361,000 | | | | 362,383 | |
|
| |
| Road & Rail—0.7% | |
| |
| Canadian Pacific Railway Co., 4.80% Sr. Unsec. Nts., 9/15/35 | | | 68,000 | | | | 73,513 | |
| |
| CSX Corp., 3.80% Sr. Unsec. Nts., 11/1/46 | | | 84,000 | | | | 78,044 | |
| |
| ERAC USA Finance LLC, 6.375% Sr. Unsec. Nts., 10/15/171 | | | 279,000 | | | | 289,124 | |
| |
| Norfolk Southern Corp., 4.65% Sr. Unsec. Nts., 1/15/46 | | | 110,000 | | | | 117,197 | |
| |
| Penske Truck Leasing Co. LP/PTL Finance Corp.: | |
| 3.40% Sr. Unsec. Nts., 11/15/261 | | | 285,000 | | | | 272,832 | |
| 3.75% Sr. Unsec. Nts., 5/11/171 | | | 195,000 | | | | 196,529 | |
| | | | | | | | |
| | | | | | | 1,027,239 | |
|
| |
| Trading Companies & Distributors—0.4% | |
| |
| AerCap Ireland Capital Ltd./AerCap Global Aviation Trust, 3.95% Sr. Unsec. Nts., 2/1/22 | | | 354,000 | | | | 357,983 | |
| |
| Air Lease Corp., 3% Sr. Unsec. Nts., 9/15/23 | | | 148,000 | | | | 141,446 | |
| | | | | | | | |
| | | | | | | 499,429 | |
|
| |
| Information Technology—2.5% | |
| |
| Electronic Equipment, Instruments, & Components—0.2% | |
| |
| Flex Ltd., 4.75% Sr. Unsec. Nts., 6/15/25 | | | 280,000 | | | | 296,381 | |
|
| |
| IT Services—0.5% | |
| |
| Broadridge Financial Solutions, Inc., 3.40% Sr. Unsec. Nts., 6/27/26 | | | 174,000 | | | | 168,004 | |
| |
| Fidelity National Information Services, Inc., 1.45% Sr. Unsec. Nts., 6/5/17 | | | 297,000 | | | | 297,144 | |
| |
| Xerox Corp.: | | | | | | | | |
| 2.95% Sr. Unsec. Nts., 3/15/17 | | | 130,000 | | | | 130,396 | |
| 6.75% Sr. Unsec. Nts., 2/1/17 | | | 65,000 | | | | 65,236 | |
| | | | | | | | |
| | | | | | | 660,780 | |
|
| |
| Semiconductors & Semiconductor Equipment—0.1% | |
| |
| Intel Corp., 4.90% Sr. Unsec. Nts., 7/29/45 | | | 93,000 | | | | 104,080 | |
|
| |
| Software—1.3% | |
| |
| Activision Blizzard, Inc., 2.30% Sr. Unsec. Nts., 9/15/211 | | | 334,000 | | | | 325,985 | |
| |
| Autodesk, Inc.: | | | | | | | | |
| 1.95% Sr. Unsec. Nts., 12/15/17 | | | 279,000 | | | | 279,527 | |
| | | | | | | | |
| | | Principal Amount | | | Value | |
| |
| Software (Continued) | |
| |
| Autodesk, Inc.: (Continued) | |
| 4.375% Sr. Unsec. Nts., 6/15/25 | | $ | 110,000 | | | $ | 113,051 | |
| |
| Diamond 1 Finance Corp./Diamond 2 Finance Corp.: | |
| 3.48% Sr. Sec. Nts., 6/1/191 | | | 355,000 | | | | 362,503 | |
| 6.02% Sr. Sec. Nts., 6/15/261 | | | 218,000 | | | | 236,271 | |
| |
| Open Text Corp., 5.625% Sr. Unsec. Nts., 1/15/231 | | | 236,000 | | | | 247,210 | |
| |
| Oracle Corp., 2.40% Sr. Unsec. Nts., 9/15/23 | | | 211,000 | | | | 204,364 | |
| | | | | | | | |
| | | | | | | 1,768,911 | |
|
| |
| Technology Hardware, Storage & Peripherals—0.4% | |
| |
| Apple, Inc., 4.375% Sr. Unsec. Nts., 5/13/45 | | | 198,000 | | | | 203,496 | |
| |
| Hewlett Packard Enterprise Co.: | |
| 2.45% Sr. Unsec. Nts., 10/5/17 | | | 238,000 | | | | 239,355 | |
| 6.35% Sr. Unsec. Nts., 10/15/45 | | | 149,000 | | | | 150,754 | |
| | | | | | | | |
| | | | | | | 593,605 | |
|
| |
| Materials—3.2% | |
| |
| Chemicals—1.4% | |
| |
| Agrium, Inc.: | | | | | | | | |
| 3.375% Sr. Unsec. Nts., 3/15/25 | | | 151,000 | | | | 146,335 | |
| 4.125% Sr. Unsec. Nts., 3/15/35 | | | 75,000 | | | | 68,875 | |
| |
| CF Industries, Inc., 4.50% Sr. Sec. Nts., 12/1/261 | | | 162,000 | | | | 159,313 | |
| |
| Eastman Chemical Co., 4.65% Sr. Unsec. Nts., 10/15/44 | | | 92,000 | | | | 91,418 | |
| |
| Ecolab, Inc.: | | | | | | | | |
| 2.00% Sr. Unsec. Nts., 1/14/19 | | | 338,000 | | | | 338,353 | |
| 3.70% Sr. Unsec. Nts., 11/1/46 | | | 56,000 | | | | 51,030 | |
| |
| PolyOne Corp., 5.25% Sr. Unsec. Nts., 3/15/23 | | | 344,000 | | | | 350,880 | |
| |
| RPM International, Inc., 3.45% Sr. Unsec. Unsub. Nts., 11/15/22 | | | 285,000 | | | | 282,657 | |
| |
| Valspar Corp. (The): | | | | | | | | |
| 3.30% Sr. Unsec. Nts., 2/1/25 | | | 103,000 | | | | 98,918 | |
| 3.95% Sr. Unsec. Nts., 1/15/26 | | | 152,000 | | | | 152,032 | |
| |
| Yara International ASA, 3.80% Sr. Unsec. Nts., 6/6/261 | | | 215,000 | | | | 210,869 | |
| | | | | | | | |
| | | | | | | 1,950,680 | |
|
| |
| Construction Materials—0.4% | |
| |
| CRH America, Inc., 5.125% Sr. Unsec. Nts., 5/18/451 | | | 245,000 | | | | 255,617 | |
| |
| James Hardie International Finance Ltd., 5.875% Sr. Unsec. Nts., 2/15/231 | | | 161,000 | | | | 167,440 | |
| |
| LafargeHolcim Finance US LLC, 3.50% Sr. Unsec. Nts., 9/22/261 | | | 85,000 | | | | 82,660 | |
| | | | | | | | |
| | | | | | | 505,717 | |
|
| |
| Containers & Packaging—0.5% | |
| |
| Ball Corp., 5.25% Sr. Unsec. Nts., 7/1/25 | | | 15,000 | | | | 15,731 | |
| |
| International Paper Co.: | | | | | | | | |
| 3.00% Sr. Unsec. Nts., 2/15/27 | | | 166,000 | | | | 156,701 | |
| 4.80% Sr. Unsec. Nts., 6/15/44 | | | 153,000 | | | | 152,257 | |
| |
| Packaging Corp. of America: | | | | | | | | |
| 3.65% Sr. Unsec. Nts., 9/15/24 | | | 94,000 | | | | 94,427 | |
| 4.50% Sr. Unsec. Nts., 11/1/23 | | | 253,000 | | | | 268,088 | |
| | | | | | | | |
| | | | | | | 687,204 | |
|
| |
| Metals & Mining—0.7% | |
| |
| BHP Billiton Finance USA Ltd., 1.625% Sr. Unsec. Nts., 2/24/17 | | | 352,000 | | | | 352,272 | |
| |
| Glencore Finance Canada Ltd., 3.60% Sr. Unsec. Nts., 1/15/171 | | | 302,000 | | | | 302,139 | |
| |
| Goldcorp, Inc., 5.45% Sr. Unsec. Nts., 6/9/44 | | | 101,000 | | | | 99,245 | |
15 OPPENHEIMER CORE BOND FUND/VA
STATEMENT OF INVESTMENTS Continued
| | | | | | | | |
| | | Principal Amount | | | Value | |
| |
| Metals & Mining (Continued) | |
| |
| Rio Tinto Finance USA Ltd., 3.75% Sr. Unsec. Nts., 6/15/25 | | $ | 143,000 | | | $ | 147,332 | |
| | | | | | | | |
| | | | | | | 900,988 | |
|
| |
| Paper & Forest Products—0.2% | |
| |
| Georgia-Pacific LLC, 2.539% Sr. Unsec. Nts., 11/15/191 | | | 78,000 | | | | 78,699 | |
| |
| Louisiana-Pacific Corp., 4.875% Sr. Unsec. Nts., 9/15/24 | | | 186,000 | | | | 180,885 | |
| | | | | | | | |
| | | | | | | 259,584 | |
|
| |
| Telecommunication Services—2.1% | |
| |
| Diversified Telecommunication Services—2.1% | |
| |
| AT&T, Inc.: | | | | | | | | |
| 2.80% Sr. Unsec. Nts., 2/17/21 | | | 367,000 | | | | 364,136 | |
| 4.35% Sr. Unsec. Nts., 6/15/45 | | | 281,000 | | | | 250,867 | |
| |
| British Telecommunications plc, 9.375% Sr. Unsec. Nts., 12/15/30 | | | 247,000 | | | | 377,074 | |
| |
| Deutsche Telekom International Finance BV, 2.25% Sr. Unsec. Nts., 3/6/171 | | | 349,000 | | | | 349,510 | |
| |
| Telefonica Emisiones SAU: | | | | | | | | |
| 3.192% Sr. Unsec. Nts., 4/27/18 | | | 347,000 | | | | 352,053 | |
| 7.045% Sr. Unsec. Unsub. Nts., 6/20/36 | | | 95,000 | | | | 110,423 | |
| |
| Verizon Communications, Inc.: | | | | | | | | |
| 1.75% Sr. Unsec. Nts., 8/15/21 | | | 247,000 | | | | 236,985 | |
| 4.125% Sr. Unsec. Nts., 8/15/46 | | | 148,000 | | | | 134,219 | |
| 4.50% Sr. Unsec. Nts., 9/15/20 | | | 409,000 | | | | 437,730 | |
| 4.522% Sr. Unsec. Nts., 9/15/48 | | | 186,000 | | | | 178,727 | |
| | | | | | | | |
| | | | | | | 2,791,724 | |
|
| |
| Utilities—3.2% | |
| |
| Electric Utilities—2.4% | |
| |
| AEP Texas Central Co., 3.85% Sr. Unsec. Nts., 10/1/251 | | | 177,000 | | | | 181,815 | |
| |
| Cleco Corporate Holdings LLC, 3.743% Sr. Sec. Nts., 5/1/261 | | | 176,000 | | | | 173,423 | |
| |
| Duke Energy Corp., 3.75% Sr. Unsec. Nts., 9/1/46 | | | 165,000 | | | | 148,854 | |
| |
| Edison International, 2.95% Sr. Unsec. Nts., 3/15/23 | | | 208,000 | | | | 205,844 | |
| |
| Enel Finance International NV, 6.25% Sr. Unsec. Nts., 9/15/171 | | | 333,000 | | | | 343,257 | |
| |
| Exelon Corp., 4.45% Sr. Unsec. Nts., 4/15/46 | | | 85,000 | | | | 83,378 | |
| |
| Indiana Michigan Power Co., Series K, 4.55% Sr. Unsec. Nts., 3/15/46 | | | 70,000 | | | | 72,750 | |
| |
| ITC Holdings Corp., 5.30% Sr. Unsec. Nts., 7/1/43 | | | 90,000 | | | | 98,630 | |
| |
| NextEra Energy Capital Holdings, Inc., 1.586% Sr. Unsec. Nts., 6/1/17 | | | 369,000 | | | | 369,248 | |
| |
| Pennsylvania Electric Co., 5.20% Sr. Unsec. Nts., 4/1/20 | | | 73,000 | | | | 78,184 | |
| |
| PPL WEM Ltd./Western Power Distribution Ltd., 5.375% Sr. Unsec. Unsub. Nts., 5/1/211 | | | 444,000 | | | | 479,147 | |
| |
| Public Service Co. of New Mexico, 7.95% Sr. Unsec. Nts., 5/15/18 | | | 307,000 | | | | 331,483 | |
| |
| Southern Power Co., 1.95% Sr. Unsec. Nts., 12/15/19 | | | 311,000 | | | | 308,092 | |
| |
| Trans-Allegheny Interstate Line Co., 3.85% Sr. Unsec. Nts., 6/1/251 | | | 213,000 | | | | 215,877 | |
| |
| Xcel Energy, Inc., 3.30% Sr. Unsec. Nts., 6/1/25 | | | 167,000 | | | | 167,131 | |
| | | | | | | | |
| | | | | | | 3,257,113 | |
|
| |
| Multi-Utilities—0.8% | |
| |
| CenterPoint Energy, Inc., 5.95% Sr. Unsec. Nts., 2/1/17 | | | 327,000 | | | | 328,118 | |
| |
| CMS Energy Corp.: | | | | | | | | |
| 3.875% Sr. Unsec. Nts., 3/1/24 | | | 202,000 | | | | 210,171 | |
| 5.05% Sr. Unsec. Unsub. Nts., 3/15/22 | | | 99,000 | | | | 108,470 | |
| | | | | | | | |
| | | Principal Amount | | | Value | |
| |
| Multi-Utilities (Continued) | |
| |
| NiSource Finance Corp., 4.80% Sr. Unsec. Nts., 2/15/44 | | $ | 157,000 | | | $ | 165,606 | |
| |
| Public Service Enterprise Group, Inc., 1.60% Sr. Unsec. Nts., 11/15/19 | | | 328,000 | | | | 323,471 | |
| | | | | | | | |
| | | | | | | 1,135,836 | |
| | | | | | | | |
| Total Corporate Bonds and Notes (Cost $62,735,844) | | | | 63,160,991 | |
| |
Short-Term Notes12—16.4% | | | | | |
| Road & Rail—0.5% | |
| |
| Paccar Financial Corp., 0.651%, 1/12/179 | | | 630,000 | | | | 629,882 | |
| |
| Personal Products—0.5% | |
| |
| Estee Lauder Cos., Inc. (The), 0.651%, 1/19/179 | | | 630,000 | | | | 629,807 | |
| |
| Receivables Finance—0.5% | |
| |
| Thunder Bay Funding LLC, 0.852%, 1/25/179 | | | 630,000 | | | | 629,707 | |
| |
| Electric Utilities—1.5% | |
| |
| Arizona Public Service Co., 0.75%, 1/3/17 | | | 500,000 | | | | 499,959 | |
| |
| Duke Energy Corp., 0.831%, 1/3/179 | | | 250,000 | | | | 249,979 | |
| |
| Eversource Energy, 0.721%, 1/3/179 | | | 620,000 | | | | 619,950 | |
| |
| Sempra Energy Holdings, 1.071%, 1/23/179 | | | 600,000 | | | | 599,643 | |
| | | | | | | | |
| | | | | | | 1,969,531 | |
| |
| Telephone Utilities—1.1% | |
| |
| Bell Canada, 1.003%, 2/8/179 | | | 630,000 | | | | 629,385 | |
| |
| Deutsche Telekom AG, 0.951%, 1/13/17 | | | 270,000 | | | | 269,908 | |
| |
| TELUS Corp., 0.952%, 1/30/179 | | | 640,000 | | | | 639,478 | |
| | | | | | | | |
| | | | | | | 1,538,771 | |
| |
| Banks—2.3% | |
| |
| Bank of Tokyo-Mitsubishi UFJ Ltd., 0.952%, 3/27/171 | | | 610,000 | | | | 608,630 | |
| |
| DNB Bank ASA, 0.952%, 3/28/179 | | | 610,000 | | | | 608,638 | |
| |
| Mizuho Bank Ltd. (New York), 0.842%, 2/17/179 | | | 620,000 | | | | 619,362 | |
| |
| Sumitomo Mitsui Banking Corp., 0.862%, 2/17/179 | | | 620,000 | | | | 619,411 | |
| |
| Toronto Dominion Holding (U.S.A.), Inc., 0.691%, 2/2/179 | | | 640,000 | | | | 639,632 | |
| | | | | | | | |
| | | | | | | 3,095,673 | |
| |
| Leasing & Factoring—2.6% | |
| |
| American Honda Finance Corp., 0.661%, 1/27/17 | | | 630,000 | | | | 629,738 | |
| |
| Harley-Davidson Financial Services, Inc., 0.822%, 2/6/179 | | | 410,000 | | | | 409,579 | |
| |
| Hitachi Capital America Corp., 1.111%, 1/6/17 | | | 500,000 | | | | 499,925 | |
| |
| Hyundai Capital America, 0.931%, 1/5/179 | | | 620,000 | | | | 619,920 | |
| |
| Nissan Motor Acceptance Corp., 0.932%, 2/24/179 | | | 620,000 | | | | 619,005 | |
| |
| Toyota Motor Credit Corp., 0.741%, 2/7/179 | | | 640,000 | | | | 639,523 | |
| | | | | | | | |
| | | | | | | 3,417,690 | |
| |
| Household Products—0.9% | |
| |
| Church & Dwight Co., Inc., 0.751%, 1/10/179 | | | 640,000 | | | | 639,845 | |
| |
| Clorox Co. (The), 0.821%, 1/25/179 | | | 620,000 | | | | 619,593 | |
| | | | | | | | |
| | | | | | | 1,259,438 | |
| |
| Electronic Equipment & Instruments—1.0% | |
| |
| Amphenol Corp., 0.901%, 1/5/17 | | | 620,000 | | | | 619,920 | |
| |
| Tyco Electronics, 1%, 1/5/179 | | | 610,000 | | | | 609,922 | |
| | | | | | | | |
| | | | | | | 1,229,842 | |
| |
| Aerospace & Defense—0.4% | |
| |
| Rockwell Collins, Inc., 0.951%, 1/9/179 | | | 620,000 | | | | 619,864 | |
| |
| Multiline Retail—0.4% | |
| |
| Dollar General Corp., 1.011%, 1/17/179 | | | 620,000 | | | | 619,710 | |
16 OPPENHEIMER CORE BOND FUND/VA
| | | | | | | | |
| | | Principal Amount | | | Value | |
| |
| Computers & Peripherals—1.0% | |
| |
| Apple, Inc., 0.711%, 2/27/179 | | $ | 610,000 | | | $ | 609,408 | |
| |
| HP, Inc., 1.151%, 1/9/17 | | | 270,000 | | | | 269,965 | |
| |
| NetApp, Inc., 1.071%, 1/10/179 | | | 505,000 | | | | 504,878 | |
| | | | | | | | |
| | | | | | | 1,384,251 | |
| |
| Water Utilities—0.5% | | | | | | | | |
| |
| American Water Capital Corp., 0.861%, 1/5/179 | | | 620,000 | | | | 619,924 | |
| |
| Software—0.4% | | | | | | | | |
| |
| Microsoft Corp., 0.832%, 2/27/179 | | | 620,000 | | | | 619,331 | |
| |
| Commercial Services & Supplies—0.2% | |
| |
| Equifax, Inc., 0.972%, 2/6/179 | | | 270,000 | | | | 269,723 | |
| |
| Chemicals—0.2% | | | | | | | | |
| |
| Eastman Chemical Co., 1.081%, 1/10/179 | | | 280,000 | | | | 279,932 | |
| |
| Commercial Finance—0.4% | | | | | | | | |
| |
| Caterpillar Financial Services Corp., 0.951%, 1/6/17 | | | 610,000 | | | | 609,946 | |
| |
| Household Durables—0.8% | | | | | | | | |
| |
| Leggett & Platt, Inc., 1.001%, 1/17/179 | | | 610,000 | | | | 609,745 | |
| |
| Mohawk Industries, Inc., 1.001%, 1/18/179 | | | 610,000 | | | | 609,727 | |
| | | | | | | | |
| | | | | | | 1,219,472 | |
| | | | | | | | |
| | | Principal Amount | | | Value | |
| |
| Food Products—0.4% | | | | | | | | |
| |
| General Mills, Inc., 0.85%, 1/17/179 | | $ | 610,000 | | | $ | 609,745 | |
| |
| Multi-Utilities—0.6% | | | | | | | | |
| |
| DTE Energy Co., 0.90%, 1/3/17 | | | 610,000 | | | | 609,948 | |
| |
| Virginia Electric & Power Co., 0.951%, 2/6/179 | | | 270,000 | | | | 269,752 | |
| | | | | | | | |
| | | | | | | 879,700 | |
| |
| Media—0.2% | | | | | | | | |
| |
| CBS Corp., 1.001%, 1/30/179 | | | 270,000 | | | | 269,780 | |
| | | | | | | | |
| Total Short-Term Notes (Cost $22,401,513) | | | | | | | 22,401,719 | |
| |
Certificate of Deposit—0.4% | | | | | |
| |
| DBS Bank Ltd., 0.841%, 2/6/17 (Cost $619,479) | | | 620,000 | | | | 619,593 | |
| | | Shares | | | | |
| |
Investment Company—2.0% | | | | | |
| |
| Oppenheimer Institutional Government Money Market Fund, Cl. E, 0.43%10,11 (Cost $2,688,938) | | | 2,688,938 | | | | 2,688,938 | |
| |
| Total Investments, at Value (Cost $170,843,644) | | | 124.1 | % | | | 169,758,558 | |
| |
| Net Other Assets (Liabilities) | | | (24.1 | ) | | | (33,003,675) | |
| | | | |
| Net Assets | | | 100.0 | % | | $ | 136,754,883 | |
| | | | |
Footnotes to Statement of Investments
1. Represents securities sold under Rule 144A, which are exempt from registration under the Securities Act of 1933, as amended. These securities have been determined to be liquid under guidelines established by the Board of Trustees. These securities amount to $26,802,070 or 19.60% of the Fund’s net assets at period end.
2. Represents the current interest rate for a variable or increasing rate security.
3. Interest-Only Strips represent the right to receive the monthly interest payments on an underlying pool of mortgage loans. These securities typically decline in price as interest rates decline. Most other fixed income securities increase in price when interest rates decline. The principal amount of the underlying pool represents the notional amount on which current interest is calculated. The price of these securities is typically more sensitive to changes in prepayment rates than traditional mortgage-backed securities (for example, GNMA pass-throughs). Interest rates disclosed represent current yields based upon the current cost basis and estimated timing and amount of future cash flows. These securities amount to $1,661,875 or 1.22% of the Fund’s net assets at period end.
4. Interest rate is less than 0.0005%.
5. Principal-Only Strips represent the right to receive the monthly principal payments on an underlying pool of mortgage loans. The value of these securities generally increases as interest rates decline and prepayment rates rise. The price of these securities is typically more volatile than that of coupon-bearing bonds of the same maturity. Interest rates disclosed represent current yields based upon the current cost basis and estimated timing of future cash flows. These securities amount to $97,947 or 0.07% of the Fund’s net assets at period end.
6. All or a portion of the security position is when-issued or delayed delivery to be delivered and settled after period end. See Note 4 of the accompanying Notes.
7. All or a portion of the security position is held in accounts at a futures clearing merchant and pledged to cover margin requirements on open futures contracts and written options on futures, if applicable. The aggregate market value of such securities is $117,518. See Note 6 of the accompanying Notes.
8. This bond has no contractual maturity date, is not redeemable and contractually pays an indefinite stream of interest.
9. Security issued in an exempt transaction without registration under the Securities Act of 1933. Such securities amount to $17,783,780 or 13.00% of the Fund’s net assets, and have been determined to be liquid pursuant to guidelines adopted by the Board of Trustees.
10. Rate shown is the 7-day yield at period end.
11. Is or was an affiliate, as defined in the Investment Company Act of 1940, as amended, at or during the reporting period, by virtue of the Fund owning at least 5% of the voting securities of the issuer or as a result of the Fund and the issuer having the same investment adviser. Transactions during the reporting period in which the issuer was an affiliate are as follows:
| | | | | | | | | | | | | | | | |
| | | Shares
December 31, 2015 | | | Gross
Additions | | | Gross
Reductions | | | Shares
December 31, 2016 | |
| |
Oppenheimer Institutional Government Money Market Fund, Cl. Ea | | | 24,144,526 | | | | 209,288,532 | | | | 230,744,120 | | | | 2,688,938 | |
| | | | | | | | | Value | | | Income | |
| |
Oppenheimer Institutional Government Money Market Fund, Cl. Ea | | | | | | | | | | $ | 2,688,938 | | | $ | 56,224 | |
a. Prior to September 28, 2016, this fund was named Oppenheimer Institutional Money Market Fund.
| 12. | Current yield as of period end. |
| | | | | | | | | | | | | | | | | | | | | | | | |
Futures Contracts as of December 31, 2016 | |
| Description | | Exchange | | | Buy/Sell | | | Expiration Date | | | Number of Contracts | | | Value | | | Unrealized Appreciation
(Depreciation) | |
| |
United States Treasury Long Bonds | | | CBT | | | | Sell | | | | 3/22/17 | | | | 20 | | | $ | 3,013,125 | | | $ | 34,104 | |
United States Treasury Nts., 10 yr. | | | CBT | | | | Sell | | | | 3/22/17 | | | | 9 | | | | 1,118,531 | | | | 6,641 | |
United States Treasury Nts., 2 yr. | | | CBT | | | | Buy | | | | 3/31/17 | | | | 73 | | | | 15,818,187 | | | | 62 | |
United States Treasury Nts., 5 yr. | | | CBT | | | | Sell | | | | 3/31/17 | | | | 5 | | | | 588,320 | | | | 962 | |
United States Ultra Bonds | | | CBT | | | | Buy | | | | 3/22/17 | | | | 67 | | | | 10,736,750 | | | | (81,760) | |
| | | | | | | | | | | | | | | | | | | | | | | | |
| | | | | | | | | | | | | | | | | | | | | | $ | (39,991) | |
| | | | | | | | | | | | | | | | | | | | | | | | |
17 OPPENHEIMER CORE BOND FUND/VA
STATEMENT OF INVESTMENTS Continued
| | | | | | | | | | | | | | | | | | | | | | | | | | |
| Centrally Cleared Credit Default Swaps at December 31, 2016 | | | | | | | | | | | | |
| Reference Asset | | Buy/Sell
Protection | | | Fixed
Rate | | | Maturity Date | | | | | Notional Amount (000’s) | | | Premiums Received/(Paid) | | | Value | |
| |
| CDX.HY.27 | | | Sell | | | | 5.000% | | | | 12/20/21 | | | USD | | | 965 | | | $ | (59,342 | ) | | $ | 59,896 | |
| |
| CDX.HY.27 | | | Sell | | | | 5.000 | | | | 12/20/21 | | | USD | | | 955 | | | | (60,473 | ) | | | 59,143 | |
| | | | | | | | | | | | | | | | | | | | | | |
| Total of Cleared Credit Default Swaps | | | | | | | | | | | | | | | | | | | | $ | (119,815 | ) | | $ | 119,039 | |
| | | | | | | | | | | | | | | | | | | | | | |
The table that follows shows the undiscounted maximum potential payment by the Fund related to selling credit protection in credit default swaps:
| | | | | | | | | | | | |
| Type of Reference Asset on which the Fund Sold Protection | | Total Maximum
Potential Payments
for Selling Credit
Protection
(Undiscounted) | | | Amount Recoverable* | | | Reference Asset Rating
Range** | |
| |
Non-Investment Grade Corporate Debt Indexes | | | $1,920,000 | | | | $— | | | | BB- | |
* The Fund has no amounts recoverable from related purchased protection. In addition, the Fund has no recourse provisions under the credit derivatives and holds no collateral which can offset or reduce potential payments under a triggering event.
** The period end reference asset security ratings, as rated by any rating organization, are included in the equivalent Standard & Poor’s rating category. The reference asset rating represents the likelihood of a potential credit event on the reference asset which would result in a related payment of the Fund.
Glossary:
| | | | |
| Definitions | | | | |
| CDX.HY.27 | | Markit CDX High Yield Index | | |
| | |
| Exchange Abbreviations | | | | |
| CBT | | Chicago Board of Trade | | |
See accompanying Notes to Financial Statements.
18 OPPENHEIMER CORE BOND FUND/VA
STATEMENT OF ASSETS AND LIABILITIES December 31, 2016
| | | | |
| |
Assets | | | | |
| Investments, at value—see accompanying statement of investments: | | | | |
| Unaffiliated companies (cost $168,154,706) | | $ | 167,069,620 | |
| Affiliated companies (cost $2,688,938) | | | 2,688,938 | |
| | | | |
| | | 169,758,558 | |
| |
| Cash | | | 559,764 | |
| |
| Cash used for collateral on futures | | | 220,000 | |
| |
| Centrally cleared swaps, at value (premiums paid $119,815) | | | 119,039 | |
| |
| Receivables and other assets: | | | | |
| Investments sold on a when-issued or delayed delivery basis | | | 5,810,776 | |
| Interest, dividends and principal paydowns | | | 700,451 | |
| Shares of beneficial interest sold | | | 291,684 | |
| Variation margin receivable | | | 69,579 | |
| Other | | | 38,832 | |
| | | | |
| Total assets | | | 177,568,683 | |
| |
| Liabilities | | | | |
| Centrally cleared swap collateral due | | | 17,027 | |
| |
| Payables and other liabilities: | | | | |
| Investments purchased (including $40,161,628 purchased on a when-issued or delayed delivery basis) | | | 40,492,145 | |
| Shares of beneficial interest redeemed | | | 185,191 | |
| Trustees’ compensation | | | 30,943 | |
| Variation margin payable | | | 19,072 | |
| Distribution and service plan fees | | | 11,239 | |
| Shareholder communications | | | 9,424 | |
| Other | | | 48,759 | |
| | | | |
| Total liabilities | | | 40,813,800 | |
| |
| Net Assets | | $ | 136,754,883 | |
| | | | |
|
| |
| Composition of Net Assets | | | | |
| Par value of shares of beneficial interest | | $ | 17,915 | |
| |
| Additional paid-in capital | | | 213,569,427 | |
| |
| Accumulated net investment income | | | 3,115,545 | |
| |
| Accumulated net realized loss on investments | | | (78,822,151) | |
| |
| Net unrealized depreciation on investments | | | (1,125,853) | |
| | | | |
| Net Assets | | $ | 136,754,883 | |
| | | | |
|
| |
| Net Asset Value Per Share | | | | |
| |
| Non-Service Shares: | | | | |
| |
| Net asset value, redemption price per share and offering price per share (based on net assets of $83,405,076 and 10,869,638 shares of beneficial interest outstanding) | | | $7.67 | |
| |
| |
| Service Shares: | | | | |
| |
| Net asset value, redemption price per share and offering price per share (based on net assets of $53,349,807 and 7,045,841 shares of beneficial interest outstanding) | | | $7.57 | |
See accompanying Notes to Financial Statements.
19 OPPENHEIMER CORE BOND FUND/VA
STATEMENT OF OPERATIONS For the Year Ended December 31, 2016
| | | | |
| |
Investment Income | | | | |
| Interest - unaffiliated companies | | $ | 4,393,452 | |
| |
| Fee income on when-issued securities | | | 730,168 | |
| |
| Dividends - affiliated companies | | | 56,224 | |
| | | | |
| Total investment income | | | 5,179,844 | |
| |
Expenses | | | | |
| Management fees | | | 838,714 | |
| |
| Distribution and service plan fees - Service shares | | | 131,762 | |
| |
| Transfer and shareholder servicing agent fees: | | | | |
| Non-Service shares | | | 87,044 | |
| Service shares | | | 52,742 | |
| |
| Shareholder communications: | | | | |
| Non-Service shares | | | 21,414 | |
| Service shares | | | 12,959 | |
| |
| Legal, auditing and other professional fees | | | 85,957 | |
| |
| Custodian fees and expenses | | | 48,058 | |
| |
| Trustees’ compensation | | | 16,123 | |
| |
| Borrowing fees | | | 2,432 | |
| |
| Other | | | 8,305 | |
| | | | |
| Total expenses | | | 1,305,510 | |
| Less reduction to custodian expenses | | | (260) | |
| Less waivers and reimbursements of expenses | | | (122,573) | |
| | | | |
| Net expenses | | | 1,182,677 | |
| |
| Net Investment Income | | | 3,997,167 | |
| |
Realized and Unrealized Gain (Loss) | | | | |
| Net realized gain (loss) on: | | | | |
| Investment transactions in unaffiliated companies (including premiums on options exercised) | | | (2,469,083) | |
| Closing and expiration of futures contracts | | | (196,844) | |
| Swap contracts | | | (3,069) | |
| Swaption contracts | | | 34,800 | |
| | | | |
| Net realized loss | | | (2,634,196) | |
| |
| Net change in unrealized appreciation/depreciation on: | | | | |
| Investment transactions | | | 3,085,703 | |
| Futures contracts | | | (84,654) | |
| Swap contracts | | | (776) | |
| | | | |
| Net change in unrealized appreciation/depreciation | | | 3,000,273 | |
| |
| Net Increase in Net Assets Resulting from Operations | | $ | 4,363,244 | |
| | | | |
See accompanying Notes to Financial Statements.
20 OPPENHEIMER CORE BOND FUND/VA
STATEMENTS OF CHANGES IN NET ASSETS
| | | | | | | | |
| | | Year Ended
December 31, 2016 | | | Year Ended
December 31, 2015 | |
| |
Operations | | | | | | | | |
| Net investment income | | $ | 3,997,167 | | | $ | 4,848,365 | |
| |
| Net realized loss | | | (2,634,196) | | | | (345,781) | |
| |
| Net change in unrealized appreciation/depreciation | | | 3,000,273 | | | | (3,220,897) | |
| | | | |
| Net increase in net assets resulting from operations | | | 4,363,244 | | | | 1,281,687 | |
| |
Dividends and/or Distributions to Shareholders | | | | | | | | |
| Dividends from net investment income: | | | | | | | | |
| Non-Service shares | | | (3,248,135) | | | | (3,667,301) | |
| Service shares | | | (1,867,358) | | | | (2,079,404) | |
| | | | |
| | | (5,115,493) | | | | (5,746,705) | |
| |
Beneficial Interest Transactions | | | | | | | | |
| Net increase (decrease) in net assets resulting from beneficial interest transactions: | | | | | | | | |
| Non-Service shares | | | (1,355,182) | | | | (2,833,378) | |
| Service shares | | | 1,183,323 | | | | 1,545,644 | |
| | | | |
| | | (171,859) | | | | (1,287,734) | |
| |
Net Assets | | | | | | | | |
| Total decrease | | | (924,108) | | | | (5,752,752) | |
| |
| Beginning of period | | | 137,678,991 | | | | 143,431,743 | |
| | | | |
| End of period (including accumulated net investment income of $3,115,545 and $4,110,201, respectively) | | $ | 136,754,883 | | | $ | 137,678,991 | |
| | | | |
See accompanying Notes to Financial Statements.
21 OPPENHEIMER CORE BOND FUND/VA
FINANCIAL HIGHLIGHTS
| | | | | | | | | | | | | | | | | | | | |
| Non-Service Shares | | Year Ended
December 31,
2016 | | | Year Ended
December 31,
2015 | | | Year Ended
December 31,
2014 | | | Year Ended
December 31,
2013 | | | Year Ended
December 31,
2012 | |
| |
Per Share Operating Data | | | | | | | | | | | | | | | | | | | | |
| Net asset value, beginning of period | | | $7.71 | | | | $7.96 | | | | $7.83 | | | | $8.26 | | | | $7.88 | |
| |
| Income (loss) from investment operations: | | | | | | | | | | | | | | | | | | | | |
| Net investment income1 | | | 0.23 | | | | 0.27 | | | | 0.30 | | | | 0.36 | | | | 0.35 | |
| Net realized and unrealized gain (loss) | | | 0.02 | | | | (0.19) | | | | 0.26 | | | | (0.37) | | | | 0.44 | |
| | | | |
| Total from investment operations | | | 0.25 | | | | 0.08 | | | | 0.56 | | | | (0.01) | | | | 0.79 | |
| |
| Dividends and/or distributions to shareholders: | | | | | | | | | | | | | | | | | | | | |
| Dividends from net investment income | | | (0.29) | | | | (0.33) | | | | (0.43) | | | | (0.42) | | | | (0.41) | |
| |
| Net asset value, end of period | | | $7.67 | | | | $7.71 | | | | $7.96 | | | | $7.83 | | | | $8.26 | |
| | | | |
| | | | | | | | | | | | | | | | |
| |
Total Return, at Net Asset Value2 | | | 3.27% | | | | 0.96% | | | | 7.27% | | | | (0.10)% | | | | 10.29% | |
| | | | | | | | | | | | | | | | |
| |
Ratios/Supplemental Data | | | | | | | | | | | | | | | | | | | | |
| Net assets, end of period (in thousands) | | | $83,405 | | | | $85,160 | | | | $90,757 | | | | $96,785 | | | | $116,989 | |
| |
| Average net assets (in thousands) | | | $87,039 | | | | $89,919 | | | | $94,336 | | | | $105,012 | | | | $119,547 | |
| |
| Ratios to average net assets:3 | | | | | | | | | | | | | | | | | | | | |
| Net investment income | | | 2.96% | | | | 3.46% | | | | 3.72% | | | | 4.51% | | | | 4.34% | |
| Expenses excluding specific expenses listed below | | | 0.84% | | | | 0.82% | | | | 0.80% | | | | 0.80% | | | | 0.77% | |
| Interest and fees from borrowings | | | 0.00%4 | | | | 0.00%4 | | | | 0.00% | | | | 0.00% | | | | 0.00% | |
| | | | |
| Total expenses5 | | | 0.84% | | | | 0.82% | | | | 0.80% | | | | 0.80% | | | | 0.77% | |
| Expenses after payments, waivers and/or reimbursements and reduction to custodian expenses | | | 0.75% | | | | 0.75% | | | | 0.75% | | | | 0.75% | | | | 0.75% | |
| |
| Portfolio turnover rate6 | | | 79% | | | | 73% | | | | 127% | | | | 115% | | | | 140% | |
1. Per share amounts calculated based on the average shares outstanding during the period.
2. Assumes an initial investment on the business day before the first day of the fiscal period, with all dividends and distributions reinvested in additional shares on the reinvestment date, and redemption at the net asset value calculated on the last business day of the fiscal period. Total returns are not annualized for periods less than one full year. Total return information does not reflect expenses that apply at the separate account level or to related insurance products. Inclusion of these charges would reduce the total return figures for all periods shown. Returns do not reflect the deduction of taxes that a shareholder would pay on fund distributions or the redemption of fund shares.
3. Annualized for periods less than one full year.
4. Less than 0.005%.
5. Total expenses including indirect expenses from affiliated fund fees and expenses were as follows:
| | | | | | |
Year Ended December 31, 2016 | | | 0.85 | % | | |
Year Ended December 31, 2015 | | | 0.83 | % | | |
Year Ended December 31, 2014 | | | 0.81 | % | | |
Year Ended December 31, 2013 | | | 0.81 | % | | |
Year Ended December 31, 2012 | | | 0.79 | % | | |
6. The portfolio turnover rate excludes purchase and sale transactions of To Be Announced (TBA) mortgage-related securities as follows:
| | | | | | | | |
| | | Purchase Transactions | | | Sale Transactions | |
| |
Year Ended December 31, 2016 | | | $672,031,328 | | | | $673,808,454 | |
Year Ended December 31, 2015 | | | $697,962,198 | | | | $709,720,690 | |
Year Ended December 31, 2014 | | | $560,409,975 | | | | $543,669,748 | |
Year Ended December 31, 2013 | | | $776,927,298 | | | | $806,883,121 | |
Year Ended December 31, 2012 | | | $930,202,858 | | | | $942,406,652 | |
See accompanying Notes to Financial Statements.
22 OPPENHEIMER CORE BOND FUND/VA
| | | | | | | | | | | | | | | | | | | | |
| Service Shares | | Year Ended
December 31,
2016 | | | Year Ended
December 31,
2015 | | | Year Ended
December 31,
2014 | | | Year Ended
December 31,
2013 | | | Year Ended
December 31,
2012 | |
| |
Per Share Operating Data | | | | | | | | | | | | | | | | | | | | |
| Net asset value, beginning of period | | | $7.61 | | | | $7.86 | | | | $7.74 | | | | $8.17 | | | | $7.79 | |
| |
| Income (loss) from investment operations: | | | | | | | | | | | | | | | | | | | | |
| Net investment income1 | | | 0.21 | | | | 0.25 | | | | 0.27 | | | | 0.34 | | | | 0.33 | |
| Net realized and unrealized gain (loss) | | | 0.02 | | | | (0.19) | | | | 0.26 | | | | (0.37) | | | | 0.44 | |
| | | | |
| Total from investment operations | | | 0.23 | | | | 0.06 | | | | 0.53 | | | | (0.03) | | | | 0.77 | |
| |
| Dividends and/or distributions to shareholders: | | | | | | | | | | | | | | | | | | | | |
| Dividends from net investment income | | | (0.27) | | | | (0.31) | | | | (0.41) | | | | (0.40) | | | | (0.39) | |
| |
| Net asset value, end of period | | | $7.57 | | | | $7.61 | | | | $7.86 | | | | $7.74 | | | | $8.17 | |
| | | | |
| | | | | | | | | | | | | | | | |
| |
Total Return, at Net Asset Value2 | | | 3.05% | | | | 0.70% | | | | 6.93% | | | | (0.38)% | | | | 10.17% | |
| | | | | | | | | | | | | | | | |
| |
Ratios/Supplemental Data | | | | | | | | | | | | | | | | | | | | |
| Net assets, end of period (in thousands) | | | $53,350 | | | | $52,519 | | | | $52,675 | | | | $54,946 | | | | $64,694 | |
| |
| Average net assets (in thousands) | | | $52,738 | | | | $54,016 | | | | $55,215 | | | | $59,523 | | | | $67,116 | |
| |
| Ratios to average net assets:3 | | | | | | | | | | | | | | | | | | | | |
| Net investment income | | | 2.70% | | | | 3.21% | | | | 3.47% | | | | 4.26% | | | | 4.07% | |
| Expenses excluding specific expenses listed below | | | 1.09% | | | | 1.07% | | | | 1.04% | | | | 1.05% | | | | 1.02% | |
| Interest and fees from borrowings | | | 0.00%4 | | | | 0.00%4 | | | | 0.00% | | | | 0.00% | | | | 0.00% | |
| | | | |
| Total expenses5 | | | 1.09% | | | | 1.07% | | | | 1.04% | | | | 1.05% | | | | 1.02% | |
| Expenses after payments, waivers and/or reimbursements and reduction to custodian expenses | | | 1.00% | | | | 1.00% | | | | 1.00% | | | | 1.00% | | | | 1.00% | |
| |
| Portfolio turnover rate6 | | | 79% | | | | 73% | | | | 127% | | | | 115% | | | | 140% | |
1. Per share amounts calculated based on the average shares outstanding during the period.
2. Assumes an initial investment on the business day before the first day of the fiscal period, with all dividends and distributions reinvested in additional shares on the reinvestment date, and redemption at the net asset value calculated on the last business day of the fiscal period. Total returns are not annualized for periods less than one full year. Total return information does not reflect expenses that apply at the separate account level or to related insurance products. Inclusion of these charges would reduce the total return figures for all periods shown. Returns do not reflect the deduction of taxes that a shareholder would pay on fund distributions or the redemption of fund shares.
3. Annualized for periods less than one full year.
4. Less than 0.005%.
5. Total expenses including indirect expenses from affiliated fund fees and expenses were as follows:
| | | | |
Year Ended December 31, 2016 | | | 1.10 | % |
Year Ended December 31, 2015 | | | 1.08 | % |
Year Ended December 31, 2014 | | | 1.05 | % |
Year Ended December 31, 2013 | | | 1.06 | % |
Year Ended December 31, 2012 | | | 1.04 | % |
6. The portfolio turnover rate excludes purchase and sale transactions of To Be Announced (TBA) mortgage-related securities as follows:
| | | | | | | | |
| | | Purchase Transactions | | | Sale Transactions | |
| |
Year Ended December 31, 2016 | | | $672,031,328 | | | | $673,808,454 | |
Year Ended December 31, 2015 | | | $697,962,198 | | | | $709,720,690 | |
Year Ended December 31, 2014 | | | $560,409,975 | | | | $543,669,748 | |
Year Ended December 31, 2013 | | | $776,927,298 | | | | $806,883,121 | |
Year Ended December 31, 2012 | | | $930,202,858 | | | | $942,406,652 | |
See accompanying Notes to Financial Statements.
23 OPPENHEIMER CORE BOND FUND/VA
NOTES TO FINANCIAL STATEMENTS December 31, 2016
1. Organization
Oppenheimer Core Bond Fund/VA (the “Fund”), a separate series of Oppenheimer Variable Account Funds, is a diversified open-end management investment company registered under the Investment Company Act of 1940 (“1940 Act”), as amended. The Fund’s main investment objective is to seek total return. The Fund’s investment adviser is OFI Global Asset Management, Inc. (“OFI Global” or the “Manager”), a wholly-owned subsidiary of OppenheimerFunds, Inc. (“OFI” or the “Sub-Adviser”). The Manager has entered into a sub-advisory agreement with OFI. Shares of the Fund are sold only to separate accounts of life insurance companies.
The Fund offers two classes of shares. Both classes are sold at their offering price, which is the net asset value per share, to separate investment accounts of participating insurance companies as an underlying investment for variable life insurance policies, variable annuity contracts or other investment products. The class of shares designated as Service shares is subject to a distribution and service plan. Both classes of shares have identical rights and voting privileges with respect to the Fund in general and exclusive voting rights on matters that affect that class alone. Earnings, net assets and net asset value per share may differ due to each class having its own expenses, such as transfer and shareholder servicing agent fees and shareholder communications, directly attributable to that class.
The following is a summary of significant accounting policies followed in the Fund’s preparation of financial statements in accordance with accounting principles generally accepted in the United States (“U.S. GAAP”).
2. Significant Accounting Policies
Security Valuation. All investments in securities are recorded at their estimated fair value, as described in Note 3.
Allocation of Income, Expenses, Gains and Losses. Income, expenses (other than those attributable to a specific class), gains and losses are allocated on a daily basis to each class of shares based upon the relative proportion of net assets represented by such class. Operating expenses directly attributable to a specific class are charged against the operations of that class.
Dividends and Distributions to Shareholders. Dividends and distributions to shareholders, which are determined in accordance with income tax regulations and may differ from U.S. GAAP, are recorded on the ex-dividend date. Income and capital gain distributions, if any, are declared and paid annually or at other times as deemed necessary by the Manager.
Investment Income. Dividend income is recorded on the ex-dividend date or upon ex-dividend notification in the case of certain foreign dividends where the ex-dividend date may have passed. Non-cash dividends included in dividend income, if any, are recorded at the fair market value of the securities received. Interest income is recognized on an accrual basis. Discount and premium, which are included in interest income on the Statement of Operations, are amortized or accreted daily.
Custodian Fees. “Custodian fees and expenses” in the Statement of Operations may include interest expense incurred by the Fund on any cash overdrafts of its custodian account during the period. Such cash overdrafts may result from the effects of failed trades in portfolio securities and from cash outflows resulting from unanticipated shareholder redemption activity. The Fund pays interest to its custodian on such cash overdrafts, to the extent they are not offset by positive cash balances maintained by the Fund, at a rate equal to the Federal Funds Rate plus 0.50%. This rate will increase to 2.00% effective January 1, 2017. The “Reduction to custodian expenses” line item, if applicable, represents earnings on cash balances maintained by the Fund during the period. Such interest expense and other custodian fees may be paid with these earnings.
Security Transactions. Security transactions are recorded on the trade date. Realized gains and losses on securities sold are determined on the basis of identified cost.
Indemnifications. The Fund’s organizational documents provide current and former Trustees and officers with a limited indemnification against liabilities arising in connection with the performance of their duties to the Fund. In the normal course of business, the Fund may also enter into contracts that provide general indemnifications. The Fund’s maximum exposure under these arrangements is unknown as this would be dependent on future claims that may be made against the Fund. The risk of material loss from such claims is considered remote.
Federal Taxes. The Fund intends to comply with provisions of the Internal Revenue Code applicable to regulated investment companies and to distribute substantially all of its investment company taxable income, including any net realized gain on investments not offset by capital loss carryforwards, if any, to shareholders. Therefore, no federal income or excise tax provision is required. The Fund files income tax returns in U.S. federal and applicable state jurisdictions. The statute of limitations on the Fund’s tax return filings generally remains open for the three preceding fiscal reporting period ends. The Fund has analyzed its tax positions for the fiscal year ended December 31, 2016, including open tax years, and does not believe there are any uncertain tax positions requiring recognition in the Fund’s financial statements.
The tax components of capital shown in the following table represent distribution requirements the Fund must satisfy under the income tax regulations, losses the Fund may be able to offset against income and gains realized in future years and unrealized appreciation or depreciation of securities and other investments for federal income tax purposes.
24 OPPENHEIMER CORE BOND FUND/VA
2. Significant Accounting Policies (Continued)
| | | | | | | | | | | | |
Undistributed Net Investment Income | | Undistributed
Long-Term
Gain | | | Accumulated
Loss
Carryforward1,2,3,4,5 | | | Net Unrealized
Depreciation
Based on cost of
Securities and
Other Investments
for Federal Income
Tax Purposes | |
| |
$3,145,708 | | | $— | | | | $78,811,638 | | | | $1,135,589 | |
1. At period end, the Fund had $78,809,859 of net capital loss carryforward available to offset future realized capital gains, if any, and thereby reduce future taxable gain distributions. Details of the capital loss carryforwards are included in the table below. Capital loss carryovers with no expiration, if any, must be utilized prior to those with expiration dates.
| | | | |
| Expiring | | | |
| |
2017 | | $ | 75,069,850 | |
No expiration | | | 3,740,009 | |
| | | | |
Total | | $ | 78,809,859 | |
| | | | |
2. The Fund had $1,779 of straddle losses which were deferred.
3. During the reporting period, the Fund did not utilize any capital loss carryforward.
4. During the previous reporting period, the Fund did not utilize any capital loss carryforward.
5. During the reporting period, $5,303,131 of unused capital loss carryforward expired.
Net investment income (loss) and net realized gain (loss) may differ for financial statement and tax purposes. The character of dividends and distributions made during the fiscal year from net investment income or net realized gains are determined in accordance with federal income tax requirements, which may differ from the character of net investment income or net realized gains presented in those financial statements in accordance with U.S. GAAP. Also, due to timing of dividends and distributions, the fiscal year in which amounts are distributed may differ from the fiscal year in which the income or net realized gain was recorded by the Fund.
Accordingly, the following amounts have been reclassified for the reporting period. Net assets of the Fund were unaffected by the reclassifications.
| | | | | | | | |
| | | Increase | | | Reduction | |
| | | to Accumulated | | | to Accumulated Net | |
Reduction to Paid-in Capital | | Net Investment
Income | | | Realized Loss
on Investments | |
| |
$5,303,131 | | | $123,670 | | | | $5,179,461 | |
The tax character of distributions paid during the reporting periods:
| | | | | | | | |
| | | Year Ended
December 31, 2016 | | | Year Ended
December 31, 2015 | |
| |
Distributions paid from: | | | | | | | | |
Ordinary income | | $ | 5,115,493 | | | $ | 5,746,705 | |
The aggregate cost of securities and other investments and the composition of unrealized appreciation and depreciation of securities and other investments for federal income tax purposes at period end are noted in the following table. The primary difference between book and tax appreciation or depreciation of securities and other investments, if applicable, is attributable to the tax deferral of losses or tax realization of financial statement unrealized gain or loss.
| | | | |
Federal tax cost of securities | | $ | 170,894,146 | |
Federal tax cost of other investments | | | 21,954,001 | |
| | | | |
Total federal tax cost | | $ | 192,848,147 | |
| | | | |
Gross unrealized appreciation | | $ | 2,482,083 | |
Gross unrealized depreciation | | | (3,617,672) | |
| | | | |
Net unrealized depreciation | | $ | (1,135,589) | |
| | | | |
Use of Estimates. The preparation of financial statements in conformity with U.S. GAAP requires management to make estimates and assumptions that affect the reported amounts of assets and liabilities and disclosure of contingent assets and liabilities at the date of the financial statements and the reported amounts of increases and decreases in net assets from operations during the reporting period. Actual results could differ from those estimates.
3. Securities Valuation
The Fund calculates the net asset value of its shares as of 4:00 P.M. Eastern time, on each day the New York Stock Exchange (the “Exchange”) is open for trading, except in the case of a scheduled early closing of the Exchange, in which case the Fund will calculate net asset value of the shares as of the scheduled early closing time of the Exchange.
The Fund’s Board has adopted procedures for the valuation of the Fund’s securities and has delegated the day-to-day responsibility for valuation
25 OPPENHEIMER CORE BOND FUND/VA
NOTES TO FINANCIAL STATEMENTS Continued
3. Securities Valuation (Continued)
determinations under those procedures to the Manager. The Manager has established a Valuation Committee which is responsible for determining a “fair valuation” for any security for which market quotations are not “readily available.” The Valuation Committee’s fair valuation determinations are subject to review, approval and ratification by the Fund’s Board at its next regularly scheduled meeting covering the calendar quarter in which the fair valuation was determined.
Valuation Methods and Inputs
Securities are valued using unadjusted quoted market prices, when available, as supplied primarily by third party pricing services or dealers.
The following methodologies are used to determine the market value or the fair value of the types of securities described below:
Equity securities traded on a securities exchange (including exchange-traded derivatives other than futures and futures options) are valued based on the official closing price on the principal exchange on which the security is traded, as identified by the Manager, prior to the time when the Fund’s assets are valued. If the official closing price is unavailable, the security is valued at the last sale price on the principal exchange on which it is traded. If the official closing price or last sales price for a foreign security is not available, the security is valued at the mean between the bid and asked price per the exchange or, if not available from the exchange, obtained from two dealers. If bid and asked prices are not available from either the exchange or two dealers, the security is valued by using one of the following methodologies (listed in order of priority): (1) a bid from the exchange, (2) the mean between the bid and asked price as provided by a single dealer, or (3) a bid from a single dealer.
Shares of a registered investment company that are not traded on an exchange are valued at that investment company’s net asset value per share.
Corporate and government debt securities (of U.S. or foreign issuers) and municipal debt securities, event-linked bonds, loans, mortgage-backed securities, collateralized mortgage obligations, and asset-backed securities are valued at the mean between the “bid” and “asked” prices utilizing evaluated prices obtained from third party pricing services or broker-dealers who may use matrix pricing methods to determine the evaluated prices.
Short-term money market type debt securities are valued at the mean between the “bid” and “asked” prices utilizing evaluated prices obtained from third party pricing services or broker-dealers.
Structured securities, swaps, swaptions, and other over-the-counter derivatives are valued utilizing evaluated prices obtained from third party pricing services or broker-dealers.
Futures contracts and futures options traded on a commodities or futures exchange will be valued at the final settlement price or official closing price on the principal exchange as reported by such principal exchange at its trading session ending at, or most recently prior to, the time when the Fund’s assets are valued.
A description of the standard inputs that may generally be considered by the third party pricing vendors in determining their evaluated prices is provided below.
| | |
| Security Type | | Standard inputs generally considered by third-party pricing vendors |
| Corporate debt, government debt, municipal, mortgage- backed and asset-backed securities | | Reported trade data, broker-dealer price quotations, benchmark yields, issuer spreads on comparable securities, the credit quality, yield, maturity, and other appropriate factors. |
| Loans | | Information obtained from market participants regarding reported trade data and broker-dealer price quotations. |
| Event-linked bonds | | Information obtained from market participants regarding reported trade data and broker-dealer price quotations. |
| Structured securities | | Relevant market information such as the price of underlying financial instruments, stock market indices, foreign currencies, interest rate spreads, commodities, or the occurrence of other specific events. |
| Swaps | | Relevant market information, including underlying reference assets such as credit spreads, credit event probabilities, index values, individual security values, forward interest rates, variable interest rates, volatility measures, and forward currency rates. |
If a market value or price cannot be determined for a security using the methodologies described above, or if, in the “good faith” opinion of the Manager, the market value or price obtained does not constitute a “readily available market quotation,” or a significant event has occurred that would materially affect the value of the security, the security is fair valued either (i) by a standardized fair valuation methodology applicable to the security type or the significant event as previously approved by the Valuation Committee and the Fund’s Board or (ii) as determined in good faith by the Manager’s Valuation Committee. The Valuation Committee considers all relevant facts that are reasonably available, through either public information or information available to the Manager, when determining the fair value of a security. Fair value determinations by the Manager are subject to review, approval and ratification by the Fund’s Board at its next regularly scheduled meeting covering the calendar quarter in which the fair valuation was determined. Those fair valuation standardized methodologies include, but are not limited to, valuing securities at the last sale price or initially at cost and subsequently adjusting the value based on: changes in company specific fundamentals, changes in an appropriate securities index, or changes in the value of similar securities which may be further adjusted for any discounts related to security-specific resale restrictions. When possible, such methodologies use observable market inputs such as unadjusted quoted prices of similar securities, observable interest rates, currency rates and yield curves. The methodologies used for valuing securities are not necessarily an indication of the risks associated with investing in those securities nor can it be assured that the Fund can obtain the fair value assigned to a security if it were to sell the security.
To assess the continuing appropriateness of security valuations, the Manager, or its third party service provider who is subject to oversight by the
26 OPPENHEIMER CORE BOND FUND/VA
3. Securities Valuation (Continued)
Manager, regularly compares prior day prices, prices on comparable securities, and sale prices to the current day prices and challenges those prices exceeding certain tolerance levels with the third party pricing service or broker source. For those securities valued by fair valuations, whether through a standardized fair valuation methodology or a fair valuation determination, the Valuation Committee reviews and affirms the reasonableness of the valuations based on such methodologies and fair valuation determinations on a regular basis after considering all relevant information that is reasonably available.
Classifications
Each investment asset or liability of the Fund is assigned a level at measurement date based on the significance and source of the inputs to its valuation. Various data inputs are used in determining the value of each of the Fund’s investments as of the reporting period end. These data inputs are categorized in the following hierarchy under applicable financial accounting standards:
1) Level 1-unadjusted quoted prices in active markets for identical assets or liabilities (including securities actively traded on a securities exchange)
2) Level 2-inputs other than unadjusted quoted prices that are observable for the asset or liability (such as unadjusted quoted prices for similar assets and market corroborated inputs such as interest rates, prepayment speeds, credit risks, etc.)
3) Level 3-significant unobservable inputs (including the Manager’s own judgments about assumptions that market participants would use in pricing the asset or liability).
The inputs used for valuing securities are not necessarily an indication of the risks associated with investing in those securities.
The Fund classifies each of its investments in investment companies which are publicly offered as Level 1. Investment companies that are not publicly offered are measured using net asset value as a practical expedient, and are not classified in the fair value hierarchy.
The table below categorizes amounts that are included in the Fund’s Statement of Assets and Liabilities at period end based on valuation input level:
| | | | | | | | | | | | | | | | |
| | | Level 1— Unadjusted Quoted Prices | | | Level 2— Other Significant
Observable Inputs | | | Level 3— Significant
Unobservable Inputs | | | Value | |
| |
Assets Table | | | | | | | | | | | | | | | | |
Investments, at Value: | | | | | | | | | | | | | | | | |
Asset-Backed Securities | | $ | — | | | $ | 20,044,549 | | | $ | — | | | $ | 20,044,549 | |
Mortgage-Backed Obligations | | | — | | | | 58,425,145 | | | | 259,759 | | | | 58,684,904 | |
U.S. Government Obligations | | | — | | | | 2,157,864 | | | | — | | | | 2,157,864 | |
Corporate Bonds and Notes | | | — | | | | 63,160,991 | | | | — | | | | 63,160,991 | |
Short-Term Notes | | | — | | | | 22,401,719 | | | | — | | | | 22,401,719 | |
Certificate of Deposit | | | — | | | | 619,593 | | | | — | | | | 619,593 | |
Investment Company | | | 2,688,938 | | | | — | | | | — | | | | 2,688,938 | |
| | | | |
Total Investments, at Value | | | 2,688,938 | | | | 166,809,861 | | | | 259,759 | | | | 169,758,558 | |
Other Financial Instruments: | | | | | | | | | | | | | | | | |
Futures contracts | | | 41,769 | | | | — | | | | — | | | | 41,769 | |
Centrally cleared swaps, at value | | | — | | | | 119,039 | | | | — | | | | 119,039 | |
| | | | |
Total Assets | | $ | 2,730,707 | | | $ | 166,928,900 | | | $ | 259,759 | | | $ | 169,919,366 | |
| | | | |
| | | | |
Liabilities Table | | | | | | | | | | | | | | | | |
Other Financial Instruments: | | | | | | | | | | | | | | | | |
Futures contracts | | $ | (81,760) | | | $ | — | | | $ | — | | | $ | (81,760) | |
| | | | |
Total Liabilities | | $ | (81,760) | | | $ | — | | | $ | — | | | $ | (81,760) | |
| | | | |
Forward currency exchange contracts and futures contracts, if any, are reported at their unrealized appreciation/depreciation at measurement date, which represents the change in the contract’s value from trade date. All additional assets and liabilities included in the above table are reported at their market value at measurement date.
The table below shows the transfers between Level 2 and Level 3. The Fund’s policy is to recognize transfers in and transfers out as of the beginning of the reporting period.
| | | | | | | | |
| | | Transfers out of Level 2* | | | Transfers into Level 3* | |
| |
Assets Table | | | | | | | | |
Investments, at Value: | | | | | | | | |
Mortgage-Backed Obligations | | $ | (345,813) | | | $ | 345,813 | |
| | | | |
Total Assets | | $ | (345,813) | | | $ | 345,813 | |
| | | | |
| * | Transferred from Level 2 to Level 3 because of the lack of observable market data due to a decrease in market activity for this security. |
4. Investments and Risks
Investments in Affiliated Funds. The Fund is permitted to invest in other mutual funds advised by the Manager (“Affiliated Funds”). Affiliated Funds are open-end management investment companies registered under the 1940 Act, as amended. The Manager is the investment adviser of, and the Sub-Adviser provides investment and related advisory services to, the Affiliated Funds. When applicable, the Fund’s investments in Affiliated Funds are
27 OPPENHEIMER CORE BOND FUND/VA
NOTES TO FINANCIAL STATEMENTS Continued
4. Investments and Risks (Continued)
included in the Statement of Investments. Shares of Affiliated Funds are valued at their net asset value per share. As a shareholder, the Fund is subject to its proportional share of the Affiliated Funds’ expenses, including their management fee. The Manager will waive fees and/or reimburse Fund expenses in an amount equal to the indirect management fees incurred through the Fund’s investment in the Affiliated Funds.
Each of the Affiliated Funds in which the Fund invests has its own investment risks, and those risks can affect the value of the Fund’s investments and therefore the value of the Fund’s shares. To the extent that the Fund invests more of its assets in one Affiliated Fund than in another, the Fund will have greater exposure to the risks of that Affiliated Fund.
Investments in Money Market Instruments. The Fund is permitted to invest its free cash balances in money market instruments to provide liquidity or for defensive purposes. The Fund may invest in money market instruments by investing in Class E shares of Oppenheimer Institutional Government Money Market Fund (“IGMMF”), formerly known as Oppenheimer Institutional Money Market Fund, which is an Affiliated Fund. IGMMF is regulated as a money market fund under the 1940 Act, as amended. The Fund may also invest in money market instruments directly or in other affiliated or unaffiliated money market funds.
Securities on a When-Issued or Delayed Delivery Basis. The Fund may purchase securities on a “when-issued” basis, and may purchase or sell securities on a “delayed delivery” basis. “When-issued” or “delayed delivery” refers to securities whose terms and indenture are available and for which a market exists, but which are not available for immediate delivery. Delivery and payment for securities that have been purchased by the Fund on a when-issued basis normally takes place within six months and possibly as long as two years or more after the trade date. During this period, such securities do not earn interest, are subject to market fluctuation and may increase or decrease in value prior to their delivery. The purchase of securities on a when-issued basis may increase the volatility of the Fund’s net asset value to the extent the Fund executes such transactions while remaining substantially fully invested. When the Fund engages in when-issued or delayed delivery transactions, it relies on the buyer or seller, as the case may be, to complete the transaction. Their failure to do so may cause the Fund to lose the opportunity to obtain or dispose of the security at a price and yield it considers advantageous. The Fund may also sell securities that it purchased on a when-issued basis or forward commitment prior to settlement of the original purchase.
At period end, the Fund had purchased securities issued on a when-issued or delayed delivery basis and sold securities issued on a delayed delivery basis as follows:
| | |
| | | When-Issued or
Delayed Delivery
Basis Transactions |
|
Purchased securities | | $40,161,628 |
Sold securities | | 5,810,776 |
The Fund may enter into “forward roll” transactions with respect to mortgage-related securities. In this type of transaction, the Fund sells a mortgage-related security to a buyer and simultaneously agrees to repurchase a similar security (same type, coupon and maturity) at a later date at a set price. During the period between the sale and the repurchase, the Fund will not be entitled to receive interest and principal payments on the securities that have been sold. The Fund records the incremental difference between the forward purchase and sale of each forward roll as realized gain (loss) on investments or as fee income in the case of such transactions that have an associated fee in lieu of a difference in the forward purchase and sale price.
Forward roll transactions may be deemed to entail embedded leverage since the Fund purchases mortgage-related securities with extended settlement dates rather than paying for the securities under a normal settlement cycle. This embedded leverage increases the Fund’s market value of investments relative to its net assets which can incrementally increase the volatility of the Fund’s performance. Forward roll transactions can be replicated over multiple settlement periods.
Risks of entering into forward roll transactions include the potential inability of the counterparty to meet the terms of the agreement; the potential of the Fund to receive inferior securities at redelivery as compared to the securities sold to the counterparty; and counterparty credit risk.
At period end, the Fund pledged $281,240 of collateral to the counterparty for forward roll transactions.
Shareholder Concentration. At period end, three shareholders each owned 20% or more of the Fund’s total outstanding shares.
A shareholder is the related party of the Fund. Related parties may include, but are not limited to, the investment manager and its affiliates, affiliated broker dealers, fund of funds, and directors or employees. A related party owned 25% of the Fund’s total outstanding shares at period end.
5. Market Risk Factors
The Fund’s investments in securities and/or financial derivatives may expose the Fund to various market risk factors:
Commodity Risk. Commodity risk relates to the change in value of commodities or commodity indexes as they relate to increases or decreases in the commodities market. Commodities are physical assets that have tangible properties. Examples of these types of assets are crude oil, heating oil, metals, livestock, and agricultural products.
Credit Risk. Credit risk relates to the ability of the issuer of debt to meet interest and principal payments, or both, as they come due. In general, lower-grade, higher-yield debt securities are subject to credit risk to a greater extent than lower-yield, higher-quality securities.
Equity Risk. Equity risk relates to the change in value of equity securities as they relate to increases or decreases in the general market.
28 OPPENHEIMER CORE BOND FUND/VA
5. Market Risk Factors (Continued)
Foreign Exchange Rate Risk. Foreign exchange rate risk relates to the change in the U.S. dollar value of a security held that is denominated in a foreign currency. The U.S. dollar value of a foreign currency denominated security will decrease as the dollar appreciates against the currency, while the U.S. dollar value will increase as the dollar depreciates against the currency.
Interest Rate Risk. Interest rate risk refers to the fluctuations in value of fixed-income securities resulting from the inverse relationship between price and yield. For example, an increase in general interest rates will tend to reduce the market value of already issued fixed-income investments, and a decline in general interest rates will tend to increase their value. In addition, debt securities with longer maturities, which tend to have higher yields, are subject to potentially greater fluctuations in value from changes in interest rates than obligations with shorter maturities.
Volatility Risk. Volatility risk refers to the magnitude of the movement, but not the direction of the movement, in a financial instrument’s price over a defined time period. Large increases or decreases in a financial instrument’s price over a relative time period typically indicate greater volatility risk, while small increases or decreases in its price typically indicate lower volatility risk.
6. Use of Derivatives
The Fund’s investment objective not only permits the Fund to purchase investment securities, it also allows the Fund to enter into various types of derivatives contracts, including, but not limited to, futures contracts, forward currency exchange contracts, credit default swaps, interest rate swaps, total return swaps, variance swaps and purchased and written options. In doing so, the Fund will employ strategies in differing combinations to permit it to increase, decrease, or change the level or types of exposure to market risk factors. These instruments may allow the Fund to pursue its objectives more quickly and efficiently than if it were to make direct purchases or sales of securities capable of effecting a similar response to market factors. Such contracts may be entered into through a bilateral over-the-counter (“OTC”) transaction, or through a securities or futures exchange and cleared through a clearinghouse.
Derivatives may have little or no initial cash investment relative to their market value exposure and therefore can produce significant gains or losses in excess of their cost due to unanticipated changes in the market risk factors and the overall market. This use of embedded leverage allows the Fund to increase its market value exposure relative to its net assets and can substantially increase the volatility of the Fund’s performance. In instances where the Fund is using derivatives to decrease, or hedge, exposures to market risk factors for securities held by the Fund, there are also risks that those derivatives may not perform as expected resulting in losses for the combined or hedged positions. Some derivatives have the potential for unlimited loss, regardless of the size of the Fund’s initial investment.
Additional associated risks from investing in derivatives also exist and potentially could have significant effects on the valuation of the derivative and the Fund. Typically, the associated risks are not the risks that the Fund is attempting to increase or decrease exposure to, per its investment objectives, but are the additional risks from investing in derivatives. Examples of these associated risks are liquidity risk, which is the risk that the Fund will not be able to sell the derivative in the open market in a timely manner, and counterparty credit risk, which is the risk that the counterparty will not fulfill its obligation to the Fund.
The Fund’s actual exposures to these market risk factors and associated risks during the period are discussed in further detail, by derivative type, below.
Futures Contracts
A futures contract is a commitment to buy or sell a specific amount of a commodity, financial instrument or currency at a negotiated price on a stipulated future date. The Fund may buy and sell futures contracts and may also buy or write put or call options on these futures contracts. Futures contracts and options thereon are generally entered into on a regulated futures exchange and cleared through a clearinghouse associated with the exchange.
Upon entering into a futures contract, the Fund is required to deposit either cash or securities (initial margin) in an amount equal to a certain percentage of the contract value in an account registered in the futures commission merchant’s name. Subsequent payments (variation margin) are paid to or from the futures commission merchant each day equal to the daily changes in the contract value. Such payments are recorded as unrealized gains and losses. Should the Fund fail to make requested variation margin payments, the futures commission merchant can gain access to the initial margin to satisfy the Fund’s payment obligations.
Futures contracts are reported on a schedule following the Statement of Investments. Securities held by a futures commission merchant to cover initial margin requirements on open futures contracts are noted in the Statement of Investments. Cash held by a futures commission merchant to cover initial margin requirements on open futures contracts and the receivable and/or payable for the daily mark to market for the variation margin are noted in the Statement of Assets and Liabilities. The net change in unrealized appreciation and depreciation is reported in the Statement of Operations. Realized gains (losses) are reported in the Statement of Operations at the closing or expiration of futures contracts.
The Fund has purchased futures contracts on various bonds and notes to increase exposure to interest rate risk.
The Fund has sold futures contracts on various bonds and notes to decrease exposure to interest rate risk.
During the reporting period, the Fund had an ending monthly average market value of $18,294,393 and $13,531,441 on futures contracts purchased and sold, respectively.
Additional associated risks of entering into futures contracts (and related options) include the possibility that there may be an illiquid market where the Fund is unable to liquidate the contract or enter into an offsetting position and, if used for hedging purposes, the risk that the price of the contract will correlate imperfectly with the prices of the Fund’s securities.
29 OPPENHEIMER CORE BOND FUND/VA
NOTES TO FINANCIAL STATEMENTS Continued
6. Use of Derivatives (Continued)
Option Activity
The Fund may buy and sell put and call options, or write put and call options. When an option is written, the Fund receives a premium and becomes obligated to sell or purchase the underlying security, currency or other underlying financial instrument at a fixed price, upon exercise of the option.
Options can be traded through an exchange or through a privately negotiated arrangement with a dealer in an OTC transaction. Options traded through an exchange are generally cleared through a clearinghouse (such as The Options Clearing Corporation). The difference between the premium received or paid, and market value of the option, is recorded as unrealized appreciation or depreciation. The net change in unrealized appreciation or depreciation is reported in the Statement of Operations. When an option is exercised, the cost of the security purchased or the proceeds of the security sale are adjusted by the amount of premium received or paid. Upon the expiration or closing of the option transaction, a gain or loss is reported in the Statement of Operations.
The Fund has purchased call options on treasury and/or euro futures to increase exposure to interest rate risk. A purchased call option becomes more valuable as the price of the underlying financial instrument appreciates relative to the strike price.
The Fund has purchased put options on treasury and/or euro futures to decrease exposure to interest rate risk. A purchased put option becomes more valuable as the price of the underlying financial instrument depreciates relative to the strike price.
During the reporting period, the Fund had an ending monthly average market value of $36,586 and $4,357 on purchased call options and purchased put options, respectively.
At period end, the Fund had no purchased options outstanding.
Options written, if any, are reported in a schedule following the Statement of Investments and as a liability in the Statement of Assets and Liabilities. Securities held in collateral accounts to cover potential obligations with respect to outstanding written options are noted in the Statement of Investments.
The risk in writing a call option is that the market price of the security increases and if the option is exercised, the Fund must either purchase the security at a higher price for delivery or, if the Fund owns the underlying security, give up the opportunity for profit. The risk in writing a put option is that the Fund may incur a loss if the market price of the security decreases and the option is exercised. The risk in buying an option is that the Fund pays a premium whether or not the option is exercised. The Fund also has the additional risk that there may be an illiquid market where the Fund is unable to close the contract.
The Fund has written put options on treasury and/or euro futures to increase exposure to interest rate risk. A written put option becomes more valuable as the price of the underlying financial instrument appreciates relative to the strike price.
During the reporting period, the Fund had an ending monthly average market value of $3,504 on written put options. Additional associated risks to the Fund include counterparty credit risk and liquidity risk.
At period end, the Fund had no written options outstanding.
Written option activity for the reporting period was as follows:
| | | | | | | | |
| | | Number of
Contracts | | | Amount of
Premiums | |
| |
| Options outstanding as of December 31, 2015 | | | — | | | $ | — | |
| Options written | | | 3,880,856 | | | | 61,628 | |
| Options exercised | | | (3,880,856) | | | | (61,628) | |
| | | | |
| Options outstanding as of December 31, 2016 | | | — | | | $ | — | |
| | | | |
Swap Contracts
The Fund may enter into swap contract agreements with a counterparty to exchange a series of cash flows based on either specified reference rates, the price or volatility of asset or non-asset references, or the occurrence of a credit event, over a specified period. Swaps can be executed in a bi-lateral privately negotiated arrangement with a dealer in an OTC transaction (“OTC swaps”) or executed on a regulated market. Certain swaps, regardless of the venue of their execution, are required to be cleared through a clearinghouse (“centrally cleared swaps”). Swap contracts may include interest rate, equity, debt, index, total return, credit default, currency, and volatility swaps.
Swap contracts are reported on a schedule following the Statement of Investments. The values of centrally cleared swap and OTC swap contracts are aggregated by positive and negative values and disclosed separately on the Statement of Assets and Liabilities. The unrealized appreciation (depreciation) related to the change in the valuation of the notional amount of the swap is combined with the accrued interest due to (owed by) the Fund, if any, at termination or settlement. The net change in this amount during the period is included on the Statement of Operations. The Fund also records any periodic payments received from (paid to) the counterparty, including at termination, under such contracts as realized gain (loss) on the Statement of Operations.
Swap contract agreements are exposed to the market risk factor of the specific underlying reference rate or asset. Swap contracts are typically more attractively priced compared to similar investments in related cash securities because they isolate the risk to one market risk factor and eliminate the other market risk factors. Investments in cash securities (for instance bonds) have exposure to multiple risk factors (credit and interest rate risk). Because swaps have embedded leverage, they can expose the Fund to substantial risk in the isolated market risk factor.
Credit Default Swap Contracts. A credit default swap is a contract that enables an investor to buy or sell protection against a defined-issuer credit event, such as the issuer’s failure to make timely payments of interest or principal on a debt security, bankruptcy or restructuring. The Fund may enter
30 OPPENHEIMER CORE BOND FUND/VA
6. Use of Derivatives (Continued)
into credit default swaps either by buying or selling protection on a corporate issuer, sovereign issuer, or a basket or index of issuers (the “reference asset”).
The buyer of protection pays a periodic fee to the seller of protection based on the notional amount of the swap contract. The seller of protection agrees to compensate the buyer of protection for future potential losses as a result of a credit event on the reference asset. The contract effectively transfers the credit event risk of the reference asset from the buyer of protection to the seller of protection.
The ongoing value of the contract will fluctuate throughout the term of the contract based primarily on the credit risk of the reference asset. If the credit quality of the reference asset improves relative to the credit quality at contract initiation, the buyer of protection may have an unrealized loss greater than the anticipated periodic fee owed. This unrealized loss would be the result of current credit protection being cheaper than the cost of credit protection at contract initiation. If the buyer elects to terminate the contract prior to its maturity, and there has been no credit event, this unrealized loss will become realized. If the contract is held to maturity, and there has been no credit event, the realized loss will be equal to the periodic fee paid over the life of the contract.
If there is a credit event, the buyer of protection can exercise its rights under the contract and receive a payment from the seller of protection equal to the notional amount of the swap less the market value of specified debt securities issued by the reference asset. Upon exercise of the contract the difference between such value and the notional amount is recorded as realized gain (loss) and is included on the Statement of Operations.
The Fund has sold credit protection through credit default swaps to increase exposure to the credit risk of individual issuers and/or indexes of issuers that are either unavailable or considered to be less attractive in the bond market. For the reporting period, the Fund had ending monthly average notional amounts of $147,692 on credit default swaps to sell protection. Additional associated risks to the Fund include counterparty credit risk and liquidity risk.
Swaption Transactions
The Fund may enter into a swaption contract which grants the purchaser the right, but not the obligation, to enter into a swap transaction at preset terms detailed in the underlying agreement within a specified period of time. The purchaser pays a premium to the swaption writer who bears the risk of unfavorable changes in the preset terms on the underlying swap.
Purchased swaptions are reported as a component of investments in the Statement of Investments and the Statement of Assets and Liabilities. Written swaptions are reported on a schedule following the Statement of Investments and their value is reported as a separate asset or liability line item in the Statement of Assets and Liabilities. The net change in unrealized appreciation or depreciation on written swaptions is separately reported in the Statement of Operations. When a swaption is exercised, the cost of the swap is adjusted by the amount of premium paid or received. Upon the expiration or closing of an unexercised swaption contract, a gain or loss is reported in the Statement of Operations for the amount of the premium paid or received.
The Fund generally will incur a greater risk when it writes a swaption than when it purchases a swaption. When the Fund writes a swaption it will become obligated, upon exercise of the swaption, according to the terms of the underlying agreement. Swaption contracts written by the Fund do not give rise to counterparty credit risk prior to exercise as they obligate the Fund, not its counterparty, to perform. When the Fund purchases a swaption it only risks losing the amount of the premium it paid if the swaption expires unexercised. However, when the Fund exercises a purchased swaption there is a risk that the counterparty will fail to perform or otherwise default on its obligations under the swaption contract.
The Fund has purchased swaptions which gives it the option to buy credit protection through credit default swaps in order to decrease exposure to the credit risk of individual issuers and/or indexes of issuers. A purchased swaption of this type becomes more valuable as the likelihood of a credit event on the reference asset increases.
The Fund has written swaptions which give it the obligation, if exercised by the purchaser, to buy credit protection through credit default swaps in order to decrease exposure to the credit risk of individual issuers and/or, indexes of issuers. A written swaption of this type becomes more valuable as the likelihood of a credit event on the reference asset increases.
During the reporting period, the Fund had an ending monthly average market value of $13,892 and $3,975 on purchased and written swaptions, respectively.
At period end, the Fund had no purchased or written swaptions outstanding.
Written swaption activity for the reporting period was as follows:
| | | | | | | | |
| | | Notional Amount | | | Amount of
Premiums | |
| |
| Swaptions outstanding as of December 31, 2015 | | | — | | | $ | — | |
| Swaptions written | | | 6,517,000 | | | | 34,800 | |
| Swaptions closed or expired | | | (6,517,000) | | | | (34,800) | |
| | | | |
| Swaptions outstanding as of December 31, 2016 | | | — | | | $ | — | |
| | | | |
Counterparty Credit Risk. Derivative positions are subject to the risk that the counterparty will not fulfill its obligation to the Fund. The Fund intends to enter into derivative transactions with counterparties that the Manager believes to be creditworthy at the time of the transaction.
The Fund’s risk of loss from counterparty credit risk on OTC derivatives is generally limited to the aggregate unrealized gain netted against any collateral held by the Fund. For OTC options purchased, the Fund bears the risk of loss of the amount of the premiums paid plus the positive change in market values net of any collateral held by the Fund should the counterparty fail to perform under the contracts. Options written by the Fund do not
31 OPPENHEIMER CORE BOND FUND/VA
NOTES TO FINANCIAL STATEMENTS Continued
6. Use of Derivatives (Continued)
typically give rise to counterparty credit risk, as options written generally obligate the Fund and not the counterparty to perform.
To reduce counterparty risk with respect to OTC transactions, the Fund has entered into master netting arrangements, established within the Fund’s International Swap and Derivatives Association, Inc. (“ISDA”) master agreements, which allow the Fund to make (or to have an entitlement to receive) a single net payment in the event of default (close-out netting) for outstanding payables and receivables with respect to certain OTC positions in swaps, options, swaptions, and forward currency exchange contracts for each individual counterparty. In addition, the Fund may require that certain counterparties post cash and/or securities in collateral accounts to cover their net payment obligations for those derivative contracts subject to ISDA master agreements. If the counterparty fails to perform under these contracts and agreements, the cash and/or securities will be made available to the Fund.
ISDA master agreements include credit related contingent features which allow counterparties to OTC derivatives to terminate derivative contracts prior to maturity in the event that, for example, the Fund’s net assets decline by a stated percentage or the Fund fails to meet the terms of its ISDA master agreements, which would cause the Fund to accelerate payment of any net liability owed to the counterparty.
For financial reporting purposes, the Fund does not offset derivative assets and derivative liabilities that are subject to netting arrangements in the Statement of Assets and Liabilities. Bankruptcy or insolvency laws of a particular jurisdiction may impose restrictions on or prohibitions against the right of offset in bankruptcy, insolvency or other events.
The Fund’s risk of loss from counterparty credit risk on exchange-traded derivatives cleared through a clearinghouse and for centrally cleared swaps is generally considered lower than as compared to OTC derivatives. However, counterparty credit risk exists with respect to initial and variation margin deposited/paid by the Fund that is held in futures commission merchant, broker and/or clearinghouse accounts for such exchange-traded derivatives and for centrally cleared swaps.
With respect to centrally cleared swaps, such transactions will be submitted for clearing, and if cleared, will be held in accounts at futures commission merchants or brokers that are members of clearinghouses. While brokers, futures commission merchants and clearinghouses are required to segregate customer margin from their own assets, in the event that a broker, futures commission merchant or clearinghouse becomes insolvent or goes into bankruptcy and at that time there is a shortfall in the aggregate amount of margin held by the broker, futures commission merchant or clearinghouse for all its customers, U.S. bankruptcy laws will typically allocate that shortfall on a pro-rata basis across all the broker’s, futures commission merchant’s or clearinghouse’s customers, potentially resulting in losses to the Fund.
There is the risk that a broker, futures commission merchant or clearinghouse will decline to clear a transaction on the Fund’s behalf, and the Fund may be required to pay a termination fee to the executing broker with whom the Fund initially enters into the transaction. Clearinghouses may also be permitted to terminate centrally cleared swaps at any time. The Fund is also subject to the risk that the broker or futures commission merchant will improperly use the Fund’s assets deposited/paid as initial or variation margin to satisfy payment obligations of another customer. In the event of a default by another customer of the broker or futures commission merchant, the Fund might not receive its variation margin payments from the clearinghouse, due to the manner in which variation margin payments are aggregated for all customers of the broker/futures commission merchant.
Collateral and margin requirements differ by type of derivative. Margin requirements are established by the broker, futures commission merchant or clearinghouse for exchange-traded and cleared derivatives, including centrally cleared swaps. Brokers, futures commission merchants and clearinghouses can ask for margin in excess of the regulatory minimum, or increase the margin amount, in certain circumstances.
Collateral terms are contract specific for OTC derivatives. For derivatives traded under an ISDA master agreement, the collateral requirements are typically calculated by netting the mark to market amount for each transaction under such agreement and comparing that amount to the value of any collateral currently pledged by the Fund or the counterparty.
For financial reporting purposes, cash collateral that has been pledged to cover obligations of the Fund, if any, is reported separately on the Statement of Assets and Liabilities as cash pledged as collateral. Non-cash collateral pledged by the Fund, if any, is noted in the Statement of Investments. Generally, the amount of collateral due from or to a party must exceed a minimum transfer amount threshold (e.g. $250,000) before a transfer has to be made. To the extent amounts due to the Fund from its counterparties are not fully collateralized, contractually or otherwise, the Fund bears the risk of loss from counterparty nonperformance.
The following table presents the valuations of derivative instruments by risk exposure as reported within the Statement of Assets and Liabilities at period end:
| | | | | | | | | | | | | | | | |
| | | Asset Derivatives | | | Liability Derivatives | |
Derivatives Not Accounted for as Hedging Instruments | | Statement of Assets
and Liabilities Location | | | Value | | | Statement of Assets
and Liabilities Location | | | Value | |
| |
Credit contracts | | | Centrally cleared swaps, at value | | | $ | 119,039 | | | | | | | | | |
Interest rate contracts Variation margin receivable | | | | | | | 69,579* | | | | Variation margin payable | | | $ | 19,072* | |
| | | | | | | | | | | | | | | | |
Total | | | | | | $ | 188,618 | | | | | | | $ | 19,072 | |
| | | | | | | | | | | | | | | | |
*Includes only the current day’s variation margin. Prior variation margin movements have been reflected in cash on the Statement of Assets and Liabilities upon receipt or payment.
The effect of derivative instruments on the Statement of Operations is as follows:
32 OPPENHEIMER CORE BOND FUND/VA
6. Use of Derivatives (Continued)
| | | | | | | | | | | | | | | | | | | | |
Amount of Realized Gain or (Loss) Recognized on Derivatives | |
| | | Investment | | | | | | | | | | | | | |
| | | from | | | | | | | | | | | | | |
| | | unaffiliated | | | | | | | | | | | | | |
| | | companies | | | Closing and | | | | | | | | | | |
| Derivatives | | (including | | | expiration | | | Closing and | | | | | | | |
| Not Accounted | | premiums | | | of swaption | | | expiration | | | | | | | |
| for as Hedging | | on options | | | contracts | | | of futures | | | | | | | |
| Instruments | | exercised)* | | | written | | | contracts | | | Swap contracts | | | Total | |
| |
Credit contracts | | $ | (103,816) | | | $ | 34,800 | | | $ | — | | | $ | (3,069) | | | $ | (72,085) | |
Interest rate contracts | | | 107,945 | | | | — | | | | (196,844) | | | | — | | | | (88,899) | |
| | | | |
Total | | $ | 4,129 | | | $ | 34,800 | | | $ | (196,844) | | | $ | (3,069) | | | $ | (160,984) | |
| | | | |
*Includes purchased option contracts, purchased swaption contracts, written option contracts exercised and written swaption contracts exercised, if any.
| | | | | | | | | | | | |
Amount of Change in Unrealized Gain or (Loss) Recognized on Derivatives | |
| Derivatives | | | | | | | | | |
Not Accounted
for as Hedging | | Futures | | | | | | | |
| Instruments | | contracts | | | Swap contracts | | | Total | |
| |
Credit contracts | | $ | — | | | $ | (776 | ) | | $ | (776) | |
Interest rate contracts | | | (84,654 | ) | | | — | | | | (84,654) | |
| | | | |
Total | | $ | (84,654 | ) | | $ | (776 | ) | | $ | (85,430) | |
| | | | |
7. Shares of Beneficial Interest
The Fund has authorized an unlimited number of $0.001 par value shares of beneficial interest of each class. Transactions in shares of beneficial interest were as follows:
| | | | | | | | | | | | | | | | | | | | |
| | | Year Ended December 31, 2016 | | | | | | Year Ended December 31, 2015 | |
| | | Shares | | | Amount | | | | | | Shares | | | Amount | |
| |
Non-Service Shares | | | | | | | | | | | | | | | | | | | | |
Sold | | | 1,355,120 | | | $ | 10,666,396 | | | | | | | | 1,062,552 | | | $ | 8,456,159 | |
Dividends and/or distributions reinvested | | | 420,198 | | | | 3,248,135 | | | | | | | | 476,892 | | | | 3,667,301 | |
Redeemed | | | (1,952,587) | | | | (15,269,713) | | | | | | | | (1,900,400) | | | | (14,956,838) | |
| | | | |
Net decrease | | | (177,269) | | | $ | (1,355,182) | | | | | | | | (360,956) | | | $ | (2,833,378) | |
| | | | |
|
| |
Service Shares | | | | | | | | | | | | | | | | | | | | |
Sold | | | 3,050,438 | | | $ | 23,656,300 | | | | | | | | 2,849,289 | | | $ | 22,223,803 | |
Dividends and/or distributions reinvested | | | 244,739 | | | | 1,867,358 | | | | | | | | 273,246 | | | | 2,079,404 | |
Redeemed | | | (3,149,918) | | | | (24,340,335) | | | | | | | | (2,925,634) | | | | (22,757,563) | |
| | | | |
Net increase | | | 145,259 | | | $ | 1,183,323 | | | | | | | | 196,901 | | | $ | 1,545,644 | |
| | | | |
8. Purchases and Sales of Securities
The aggregate cost of purchases and proceeds from sales of securities, other than short-term obligations and investments in IGMMF, for the reporting period were as follows:
| | | | | | | | |
| | | Purchases | | | Sales | |
| |
Investment securities | | | $86,169,688 | | | | $88,981,950 | |
U.S. government and government agency obligations | | | 1,930,998 | | | | 2,276,341 | |
To Be Announced (TBA) mortgage-related securities | | | 672,031,328 | | | | 673,808,454 | |
9. Fees and Other Transactions with Affiliates
Management Fees. Under the investment advisory agreement, the Fund pays the Manager a management fee based on the daily net assets of the Fund at an annual rate as shown in the following table:
| | | | |
| Fee Schedule | | | | |
|
Up to $1 billion | | 0.60% | | |
Over $1 billion | | 0.50 | | |
The Fund’s effective management fee for the reporting period was 0.60% of average annual net assets before any applicable waivers.
Sub-Adviser Fees. The Manager has retained the Sub-Adviser to provide the day-to-day portfolio management of the Fund. Under the Sub-Advisory Agreement, the Manager pays the Sub-Adviser an annual fee in monthly installments, equal to a percentage of the investment management fee collected by the Manager from the Fund, which shall be calculated after any investment management fee waivers. The fee paid to the Sub-Adviser is paid
33 OPPENHEIMER CORE BOND FUND/VA
NOTES TO FINANCIAL STATEMENTS Continued
9. Fees and Other Transactions with Affiliates (Continued)
by the Manager, not by the Fund.
Transfer Agent Fees. OFI Global (the “Transfer Agent”) serves as the transfer and shareholder servicing agent for the Fund. The Fund pays the Transfer Agent a fee based on annual net assets. Fees incurred and average net assets for each class with respect to these services are detailed in the Statement of Operations and Financial Highlights, respectively.
Sub-Transfer Agent Fees. The Transfer Agent has retained Shareholder Services, Inc., a wholly-owned subsidiary of OFI (the “Sub-Transfer Agent”), to provide the day-to-day transfer agent and shareholder servicing of the Fund. Under the Sub-Transfer Agency Agreement, the Transfer Agent pays the Sub-Transfer Agent an annual fee in monthly installments, equal to a percentage of the transfer agent fee collected by the Transfer Agent from the Fund, which shall be calculated after any applicable fee waivers. The fee paid to the Sub-Transfer Agent is paid by the Transfer Agent, not by the Fund.
Trustees’ Compensation. The Fund’s Board of Trustees (“Board”) has adopted a compensation deferral plan for Independent Trustees that enables Trustees to elect to defer receipt of all or a portion of the annual compensation they are entitled to receive from the Fund. For purposes of determining the amount owed to the Trustees under the plan, deferred amounts are treated as though equal dollar amounts had been invested in shares of the Fund or in other Oppenheimer funds selected by the Trustees. The Fund purchases shares of the funds selected for deferral by the Trustees in amounts equal to his or her deemed investment, resulting in a Fund asset equal to the deferred compensation liability. Such assets are included as a component of “Other” within the asset section of the Statement of Assets and Liabilities. Deferral of Trustees’ fees under the plan will not affect the net assets of the Fund and will not materially affect the Fund’s assets, liabilities or net investment income per share. Amounts will be deferred until distributed in accordance with the compensation deferral plan.
Distribution and Service Plan for Service Shares. The Fund has adopted a Distribution and Service Plan (the “Plan”) pursuant to Rule 12b-1 under the 1940 Act for Service shares to pay OppenheimerFunds Distributor, Inc. (the “Distributor”), for distribution related services, personal service and account maintenance for the Fund’s Service shares. Under the Plan, payments are made periodically at an annual rate of 0.25% of the daily net assets of Service shares of the Fund. The Distributor currently uses all of those fees to compensate sponsors of the insurance product that offers Fund shares, for providing personal service and maintenance of accounts of their variable contract owners that hold Service shares. These fees are paid out of the Fund’s assets on an on-going basis and increase operating expenses of the Service shares, which results in lower performance compared to the Fund’s shares that are not subject to a service fee. Fees incurred by the Fund under the Plan are detailed in the Statement of Operations.
Waivers and Reimbursements of Expenses. The Manager has contractually agreed to limit the Fund’s expenses after payments, waivers and/or reimbursements and reduction to custodian expenses, excluding any applicable dividend expense, taxes, interest and fees from borrowing, any subsidiary expenses, Acquired Fund Fees and Expenses, brokerage commissions, unusual and infrequent expenses and certain other Fund expenses; so that those expenses, as percentages of daily net assets, will not exceed the annual rate of 0.75% for Non-Service shares and 1.00% for Service shares. During the reporting period, the Manager waived fees and/or reimbursed the Fund $68,094 and $41,180 for Non-Service and Service shares, respectively.
The Manager will waive fees and/or reimburse Fund expenses in an amount equal to the indirect management fees incurred through the Fund’s investment in IGMMF. During the reporting period, the Manager waived fees and/or reimbursed the Fund $13,299 for IGMMF management fees.
Waivers and/or reimbursements may be modified or terminated as set forth according to the terms in the prospectus.
10. Borrowings and Other Financing
Joint Credit Facility. A number of mutual funds managed by the Manager participate in a $1.3 billion revolving credit facility (the “Facility”) intended to provide short-term financing, if necessary, subject to certain restrictions in connection with atypical redemption activity. Expenses and fees related to the Facility are paid by the participating funds and are disclosed separately or as other expenses on the Statement of Operations. The Fund did not utilize the Facility during the reporting period.
11. Pending Litigation
In 2009, several putative class action lawsuits were filed and later consolidated before the U.S. District Court for the District of Colorado in connection with the investment performance of Oppenheimer Rochester California Municipal Fund (the “California Fund”), a fund advised by OppenheimerFunds, Inc. (“OFI”) and distributed by OppenheimerFunds Distributor, Inc. (“OFDI”). The plaintiffs asserted claims against OFI, OFDI and certain present and former trustees and officers of the California Fund under the federal securities laws, alleging, among other things, that the disclosure documents of the California Fund contained misrepresentations and omissions and the investment policies of the California Fund were not followed. An amended complaint and a motion to dismiss were filed, and in 2011, the court issued an order which granted in part and denied in part the defendants’ motion to dismiss. In October 2015, following a successful appeal by defendants and a subsequent hearing, the court granted plaintiffs’ motion for class certification and appointed class representatives and class counsel.
OFI and OFDI believe the suit is without merit; that it is premature to render any opinion as to the likelihood of an outcome unfavorable to them in the suit; and that no estimate can yet be made as to the amount or range of any potential loss. Furthermore, OFI believes that the suit should not impair the ability of OFI or OFDI to perform their respective duties to the Fund and that the outcome of the suit should not have any material effect on the operations of any of the Oppenheimer funds.
34 OPPENHEIMER CORE BOND FUND/VA
REPORT OF INDEPENDENT REGISTERED PUBLIC ACCOUNTING FIRM
The Board of Trustees and Shareholders of Oppenheimer Variable Account Funds:
We have audited the accompanying statement of assets and liabilities of Oppenheimer Core Bond Fund/VA (a separate series of Oppenheimer Variable Account Funds), including the statement of investments, as of December 31, 2016, and the related statement of operations for the year then ended, the statements of changes in net assets for each of the years in the two-year period then ended, and the financial highlights for each of the years in the five-year period then ended. These financial statements and financial highlights are the responsibility of the Fund’s management. Our responsibility is to express an opinion on these financial statements and financial highlights based on our audits.
We conducted our audits in accordance with the standards of the Public Company Accounting Oversight Board (United States). Those standards require that we plan and perform the audit to obtain reasonable assurance about whether the financial statements and financial highlights are free of material misstatement. An audit includes examining, on a test basis, evidence supporting the amounts and disclosures in the financial statements. Our procedures included confirmation of securities owned as of December 31, 2016, by correspondence with the custodian, transfer agent and brokers, or by other appropriate auditing procedures where replies from brokers were not received. An audit also includes assessing the accounting principles used and significant estimates made by management, as well as evaluating the overall financial statement presentation. We believe that our audits provide a reasonable basis for our opinion.
In our opinion, the financial statements and financial highlights referred to above present fairly, in all material respects, the financial position of Oppenheimer Core Bond Fund/VA as of December 31, 2016, the results of its operations for the year then ended, the changes in its net assets for each of the years in the two-year period then ended, and the financial highlights for each of the years in the five-year period then ended, in conformity with U.S. generally accepted accounting principles.
KPMG LLP
Denver, Colorado
February 15, 2017
35 OPPENHEIMER CORE BOND FUND/VA
FEDERAL INCOME TAX INFORMATION Unaudited
In early 2017, if applicable, shareholders of record received information regarding all dividends and distributions paid to them by the Fund during calendar year 2016.
The foregoing information is presented to assist shareholders in reporting distributions received from the Fund to the Internal Revenue Service. Because of the complexity of the federal regulations which may affect your individual tax return and the many variations in state and local tax regulations, we recommend that you consult your tax advisor for specific guidance.
36 OPPENHEIMER CORE BOND FUND/VA
BOARD APPROVAL OF THE FUND’S INVESTMENT ADVISORY AND SUB-ADVISORY AGREEMENTS Unaudited
The Fund has entered into an investment advisory agreement with OFI Global Asset Management, Inc. (“OFI Global” or the “Adviser”), a wholly-owned subsidiary of OppenheimerFunds, Inc. (“OFI” or the “Sub-Adviser”) (“OFI Global” and “OFI” together the “Managers”) and OFI Global has entered into a sub-advisory agreement with OFI whereby OFI provides investment sub-advisory services to the Fund (collectively, the “Agreements”). Each year, the Board of Trustees (the “Board”), including a majority of the independent Trustees, is required to determine whether to approve the terms of the Agreements and the renewal thereof. The Investment Company Act of 1940, as amended, requires that the Board request and evaluate, and that the Managers provide, such information as may be reasonably necessary to evaluate the terms of the Agreements. The Board employs an independent consultant to prepare a report that provides information, including comparative information that the Board requests for that purpose. In addition to in-person meetings focused on this evaluation, the Board receives information throughout the year regarding Fund services, fees, expenses and performance.
The Managers and the independent consultant provided information to the Board on the following factors: (i) the nature, quality and extent of the Managers’ services, (ii) the comparative investment performance of the Fund and the Managers, (iii) the fees and expenses of the Fund, including comparative fee and expense information, (iv) the profitability of the Managers and their affiliates, including an analysis of the cost of providing services, (v) whether economies of scale are realized as the Fund grows and whether fee levels reflect these economies of scale for Fund investors and (vi) other benefits to the Managers from their relationship with the Fund. The Board was aware that there are alternatives to retaining the Managers.
Outlined below is a summary of the principal information considered by the Board as well as the Board’s conclusions.
Nature, Quality and Extent of Services. The Board considered information about the nature, quality and extent of the services provided to the Fund and information regarding the Managers’ key personnel who provide such services. The Managers’ duties include providing the Fund with the services of the portfolio managers and the Sub-Adviser’s investment team, who provide research, analysis and other advisory services in regard to the Fund’s investments; and securities trading services. OFI Global is responsible for oversight of third-party service providers; monitoring compliance with applicable Fund policies and procedures and adherence to the Fund’s investment restrictions; risk management; and oversight of the Sub-Adviser. OFI Global is also responsible for providing certain administrative services to the Fund. Those services include providing and supervising all administrative and clerical personnel who are necessary in order to provide effective corporate administration for the Fund; compiling and maintaining records with respect to the Fund’s operations; preparing and filing reports required by the U.S. Securities and Exchange Commission; preparing periodic reports regarding the operations of the Fund for its shareholders; preparing proxy materials for shareholder meetings; and preparing the registration statements required by federal and state securities laws for the sale of the Fund’s shares. OFI Global also provides the Fund with office space, facilities and equipment.
The Board also considered the quality of the services provided and the quality of the Managers’ resources that are available to the Fund. The Board took account of the fact that the Sub-Adviser has over fifty years of experience as an investment adviser and that its assets under management rank it among the top mutual fund managers in the United States. The Board evaluated the Managers’ advisory, administrative, accounting, legal, compliance and risk management services, and information the Board has received regarding the experience and professional qualifications of the Managers’ key personnel and the size and functions of its staff. In its evaluation of the quality of the portfolio management services provided, the Board considered the experience of Krishna Memani and Peter Strzalkowski, the portfolio managers for the Fund, and the Sub-Adviser’s investment team and analysts. The Board members also considered the totality of their experiences with the Managers as directors or trustees of the Fund and other funds advised by the Managers. The Board considered information regarding the quality of services provided by affiliates of the Managers, which the Board members have become knowledgeable about through their experiences with the Managers and in connection with the renewal of the Fund’s service agreements. The Board concluded, in light of the Managers’ experience, reputation, personnel, operations and resources that the Fund benefits from the services provided under the Agreements.
Investment Performance of the Managers and the Fund. Throughout the year, the Managers provided information on the investment performance of the Fund, the Adviser and the Sub-Adviser, including comparative performance information. The Board also reviewed information, prepared by the Managers and by the independent consultant, comparing the Fund’s historical performance to relevant market indices and to the performance of other intermediate-term bond funds underlying variable insurance products. The Board considered that the Fund outperformed its performance category median during the one-, three- and five-year periods, although it underperformed for the ten-year period.
Fees and Expenses of the Fund. The Board reviewed the fees paid to the Adviser and the other expenses borne by the Fund. The Board noted that the Adviser, not the Fund, pays the Sub-Adviser’s fee under the sub-advisory agreement. The independent consultant provided comparative data in regard to the fees and expenses of the Fund and other intermediate-term bond funds underlying variable insurance products. In reviewing the fees and expenses charged to the VA funds, the Board considered the Adviser’s assertion that, because there is much greater disparity in the fees and services that may be provided by a manager to a VA fund as opposed to a retail fund, when comparing the expenses of the various VA funds to those of retail funds, it is most appropriate to focus on total expenses (rather than on the management fees). Accordingly, while the Board reviewed and considered all expenses, it focused on total expenses. The Board considered that the Fund’s total expenses were higher than its peer group median and category median. The Board also considered that the Fund’s contractual management fee was higher than its peer group median and its category median. The Board considered that the Adviser has contractually agreed to limit the Fund’s total annual operating expenses so that those expenses, as percentages of daily net assets, will not exceed that annual rate of 0.75% for Non-Service Shares and 1.00% for Service Shares. This contractual expense limitation may not be amended or withdrawn until one year after the date of the Fund’s prospectus, unless approved by the Board.
Economies of Scale and Profits Realized by the Managers. The Board considered information regarding the Managers’ costs in serving as the Fund’s investment adviser and sub-adviser, including the costs associated with the personnel and systems necessary to manage the Fund, and information regarding the Managers’ profitability from their relationship with the Fund. The Board also considered that the Managers must be able to pay and retain experienced professional personnel at competitive rates to provide quality services to the Fund. The Board reviewed whether the Managers may realize economies of scale in managing and supporting the Fund. The Board noted that the Fund currently has management fee breakpoints, which are intended to share with Fund shareholders economies of scale that may exist as the Fund’s assets grow.
Other Benefits to the Managers. In addition to considering the profits realized by the Managers, the Board considered information that was
37 OPPENHEIMER CORE BOND FUND/VA
BOARD APPROVAL OF THE FUND’S INVESTMENT ADVISORY AND SUB-ADVISORY AGREEMENTS
Unaudited / Continued
provided regarding the direct and indirect benefits the Managers receive as a result of their relationship with the Fund, including compensation paid to the Managers’ affiliates.
Conclusions. These factors were also considered by the independent Trustees meeting separately from the full Board, assisted by experienced counsel to the Fund and to the independent Trustees. Fund counsel and the independent Trustees’ counsel are independent of the Managers within the meaning and intent of the Securities and Exchange Commission Rules.
Based on its review of the information it received and its evaluations described above, the Board, including a majority of the independent Trustees, decided to continue the Agreements through August 31, 2017. In arriving at its decision, the Board did not identify any factor or factors as being more important than others, but considered all of the above information, and considered the terms and conditions of the Agreements, including the management fees, in light of all the surrounding circumstances.
38 OPPENHEIMER CORE BOND FUND/VA
PORTFOLIO PROXY VOTING POLICIES AND GUIDELINES; UPDATES TO STATEMENTS OF INVESTMENTS Unaudited
The Fund has adopted Portfolio Proxy Voting Policies and Guidelines under which the Fund votes proxies relating to securities (“portfolio proxies”) held by the Fund. A description of the Fund’s Portfolio Proxy Voting Policies and Guidelines is available (i) without charge, upon request, by calling the Fund toll-free at 1.800.CALL OPP (225.5677), (ii) on the Fund’s website at www.oppenheimerfunds.com, and (iii) on the SEC’s website at www.sec.gov. In addition, the Fund is required to file Form N-PX, with its complete proxy voting record for the 12 months ended June 30th, no later than August 31st of each year. The Fund’s voting record is available (i) without charge, upon request, by calling the Fund toll-free at 1.800.CALL OPP (225.5677), and (ii) in the Form N-PX filing on the SEC’s website at www.sec.gov.
The Fund files its complete schedule of portfolio holdings with the SEC for the first quarter and the third quarter of each fiscal year on Form N-Q. The Fund’s Form N-Q filings are available on the SEC’s website at www.sec.gov. Those forms may be reviewed and copied at the SEC’s Public Reference Room in Washington, D.C. Information on the operation of the Public Reference Room may be obtained by calling 1-800-SEC-0330.
39 OPPENHEIMER CORE BOND FUND/VA
TRUSTEES AND OFFICERS Unaudited
| | |
Name, Position(s) Held with the Fund, Length of
Service, Age | | Principal Occupation(s) During the Past 5 Years; Other Trusteeships/Directorships Held;
Number of Portfolios in the Fund Complex Currently Overseen |
| |
| INDEPENDENT TRUSTEES | | The address of each Trustee in the chart below is 6803 S. Tucson Way, Centennial, Colorado 80112-3924. Each Trustee serves for an indefinite term, or until his or her resignation, retirement, death or removal. |
| |
Robert J. Malone, Chairman of the Board of Trustees (since 2016), Trustee (since 2002) Year of Birth: 1944 | | Chairman - Colorado Market of MidFirst Bank (since January 2015); Chairman of the Board (2012-2016) and Director (August 2005-March 2016) of Jones International University (educational organization); Trustee of the Gallagher Family Foundation (non-profit organization) (2000-2015); Chairman, Chief Executive Officer and Director of Steele Street Bank Trust (commercial banking) (August 2003-January 2015); Board of Directors of Opera Colorado Foundation (non-profit organization) (2008- 2012); Director of Colorado UpLIFT (charitable organization) (1986-2010); Director of Jones Knowledge, Inc. (2006-2010); Former Chairman of U.S. Bank-Colorado (subsidiary of U.S. Bancorp and formerly Colorado National Bank) (July 1996-April 1999); Director of Commercial Assets, Inc. (real estate investment trust) (1993-2000); Director of U.S. Exploration, Inc. (oil and gas exploration) (1997-February 2004); Chairman of the Board (1991-1994) and Trustee (1985-1994) of Regis University; and Chairman of the Board (1990-1991) and Trustee (1984-1999) of Young Presidents Organization. Oversees 47 portfolios in the OppenheimerFunds complex. Mr. Malone has served on the Boards of certain Oppenheimer funds since 2002, during which time he has become familiar with the Fund’s (and other Oppenheimer funds’) financial, accounting, regulatory and investment matters and has contributed to the Boards’ deliberations. |
| |
Jon S. Fossel, Trustee (since 1990) Year of Birth: 1942 | | Chairman of the Board of Jack Creek Preserve Foundation (non-profit organization) (since March 2005); Director of Jack Creek Preserve Foundation (non-profit organization) (March 2005-December 2014); Chairman of the Board (2006-December 2011) and Director (June 2002-December 2011) of UNUMProvident (insurance company); Director of Northwestern Energy Corp. (public utility corporation) (November 2004-December 2009); Director of P.R. Pharmaceuticals (October 1999-October 2003); Director of Rocky Mountain Elk Foundation (non-profit organization) (February 1998-February 2003 and February 2005-February 2007); Chairman and Director (until October 1996) and President and Chief Executive Officer (until October 1995) of OppenheimerFunds, Inc.; President, Chief Executive Officer and Director of the following: Oppenheimer Acquisition Corp. (“OAC”) (parent holding company of OppenheimerFunds, Inc.), Shareholders Services, Inc. and Shareholder Financial Services, Inc. (until October 1995). Oversees 47 portfolios in the OppenheimerFunds complex. Mr. Fossel has served on the Boards of certain Oppenheimer funds since 1990, during which time he has become familiar with the Fund’s (and other Oppenheimer funds’) financial, accounting, regulatory and investment matters and has contributed to the Boards’ deliberations. |
| |
Richard F. Grabish, Trustee (since 2012) Year of Birth: 1948 | | Formerly Senior Vice President and Assistant Director of Sales and Marketing (March 1997-December 2007), Director (March 1987-December 2007) and Manager of Private Client Services (June 1985-June 2005) of A.G. Edwards & Sons, Inc. (broker/dealer and investment firm); Chairman and Chief Executive Officer of A.G. Edwards Trust Company, FSB (March 2001-December 2007); President and Vice Chairman of A.G. Edwards Trust Company, FSB (investment adviser) (April 1987-March 2001); President of A.G. Edwards Trust Company, FSB (investment adviser) (June 2005-December 2007). Oversees 47 portfolios in the OppenheimerFunds complex. Mr. Grabish has served on the Boards of certain Oppenheimer funds since 2001, during which time he has become familiar with the Fund’s (and other Oppenheimer funds’) financial, accounting, regulatory and investment matters and has contributed to the Boards’ deliberations. |
| |
Beverly L. Hamilton, Trustee (since 2002) Year of Birth: 1946 | | Trustee of Monterey Institute for International Studies (educational organization) (2000-2014); Board Member of Middlebury College (educational organization) (December 2005-June 2011); Chairman (2010-2016) of American Funds’ Emerging Markets Growth Fund, Inc. (mutual fund); Director of The California Endowment (philanthropic organization) (April 2002-April 2008); Director (February 2002-2005) and Chairman of Trustees (2006-2007) of the Community Hospital of Monterey Peninsula; Director (October 1991-2005) and Vice Chairman (2006-2009) of American Funds’ Emerging Markets Growth Fund, Inc. (mutual fund); President of ARCO Investment Management Company (February 1991-April 2000); Member of the investment committees of The Rockefeller Foundation (2001-2006) and The University of Michigan (since 2000); Advisor at Credit Suisse First Boston’s Sprout venture capital unit (venture capital fund) (1994-January 2005); Trustee of MassMutual Institutional Funds (investment company) (1996-June 2004); Trustee of MML Series Investment Fund (investment company) (April 1989-June 2004); Member of the investment committee of Hartford Hospital (2000-2003); and Advisor to Unilever (Holland) pension fund (2000-2003). Oversees 47 portfolios in the OppenheimerFunds complex. Ms. Hamilton has served on the Boards of certain Oppenheimer funds since 2002, during which time she has become familiar with the Fund’s (and other Oppenheimer funds’) financial, accounting, regulatory and investment matters and has contributed to the Boards’ deliberations. |
| |
Victoria J. Herget, Trustee (since 2012) Year of Birth:1951 | | Board Chair (2008-2015) and Director (2004-Present), United Educators (insurance company); Trustee (since 2000) and Chair (since 2010), Newberry Library (independent research library); Trustee, Mather LifeWays (senior living organization) (since 2001); Independent Director of the First American Funds (mutual fund family) (2003-2011); former Managing Director (1993-2001), Principal (1985-1993), Vice President (1978-1985) and Assistant Vice President (1973-1978) of Zurich Scudder Investments (investment adviser) (and its predecessor firms); Trustee (1992-2007), Chair of the Board of Trustees (1999-2007), Investment Committee Chair (1994-1999) and Investment Committee member (2007-2010) of Wellesley College; Trustee, BoardSource (non-profit organization) (2006-2009) and Chicago City Day School (K-8 School) (1994-2005). Oversees 47 portfolios in the OppenheimerFunds complex. Ms. Herget has served on the Boards of certain Oppenheimer funds since 2012, during which time she has become familiar with the Fund’s (and other Oppenheimer funds’) financial, accounting, regulatory and investment matters and has contributed to the Boards’ deliberations. |
40 OPPENHEIMER CORE BOND FUND/VA
| | |
| |
F. William Marshall, Jr., Trustee (since 2000) Year of Birth: 1942 | | Trustee Emeritus of Worcester Polytech Institute (WPI) (private university) (since 2009); Trustee of MassMutual Select Funds (formerly MassMutual Institutional Funds) (investment company) (1996-2015), MML Series Investment Fund (investment company) (1996-2015) and Mass Mutual Premier Funds (investment company) (January 2012-December 2015); President and Treasurer of the SIS Fund (private charitable fund) (January 1999-March 2011); Former Trustee of WPI (1985-2008); Former Chairman of the Board (2004-2006) and Former Chairman of the Investment Committee of WPI (1994-2008); Chairman of SIS Family Bank, F.S.B. (formerly SIS Bank) (commercial bank) (January 1999-July 1999); Executive Vice President of Peoples Heritage Financial Group, Inc. (commercial bank) (January 1999-July 1999); and Former President and Chief Executive Officer of SIS Bancorp. (1993-1999). Oversees 47 portfolios in the OppenheimerFunds complex. Mr. Marshall has served on the Boards of certain Oppenheimer funds since 2000, during which time he has become familiar with the Fund’s (and other Oppenheimer funds’) financial, accounting, regulatory and investment matters and has contributed to the Boards’ deliberations. |
| |
Karen L. Stuckey, Trustee (since 2012) Year of Birth: 1953 | | Member (since May 2015) of Desert Mountain Community Foundation Advisory Board (non-profit organization); Partner (1990-2012) of PricewaterhouseCoopers LLP (professional services firm) (held various positions 1975-1990); Trustee (1992- 2006), member of Executive, Nominating and Audit Committees and Chair of Finance Committee (1992-2006), and Emeritus Trustee (since 2006) of Lehigh University; and member, Women’s Investment Management Forum (professional organization) since inception. Oversees 47 portfolios in the OppenheimerFunds complex. Ms. Stuckey has served on the Boards of certain Oppenheimer funds since 2012, during which time she has become familiar with the Fund’s (and other Oppenheimer funds’) financial, accounting, regulatory and investment matters and has contributed to the Boards’ deliberations. |
| |
James D. Vaughn, Trustee (since 2012) Year of Birth:1945 | | Retired; former managing partner (1994-2001) of Denver office of Deloitte & Touche LLP, (held various positions 1969- 1993); Trustee and Chairman of the Audit Committee of Schroder Funds (2003-2012); Board member and Chairman of Audit Committee of AMG National Trust Bank (since 2005); Trustee and Investment Committee member, University of South Dakota Foundation (since 1996); Board member, Audit Committee Member and past Board Chair, Junior Achievement (since 1993); former Board member, Mile High United Way, Boys and Girls Clubs, Boy Scouts, Colorado Business Committee for the Arts, Economic Club of Colorado and Metro Denver Network. Oversees 47 portfolios in the OppenheimerFunds complex. Mr. Vaughn has served on the Boards of certain Oppenheimer funds since 2012, during which time he has become familiar with the Fund’s (and other Oppenheimer funds’) financial, accounting, regulatory and investment matters and has contributed to the Boards’ deliberations. |
| |
| INTERESTED TRUSTEE AND OFFICER | | Mr. Steinmetz is an “Interested Trustee” because he is affiliated with the Manager and the Sub-Adviser by virtue of his positions as Chairman and director of the Sub-Adviser and officer and director of the Manager. Both as a Trustee and as an officer, Mr. Steinmetz serves for an indefinite term, or until his resignation, retirement, death or removal. Mr. Steinmetz’s address is 225 Liberty Street, New York, New York 10281-1008. |
| |
Arthur P. Steinmetz, Trustee (Since 2015), President and Principal Executive Officer (since 2014) Year of Birth: 1958 | | Chairman of OppenheimerFunds, Inc. (since January 2015); CEO and Chairman of OFI Global Asset Management, Inc. (since July 2014), President of OFI Global Asset Management, Inc. (since May 2013), a Director of OFI Global Asset Management, Inc. (since January 2013), Director of OppenheimerFunds, Inc. (since July 2014), President, Management Director and CEO of Oppenheimer Acquisition Corp. (OppenheimerFunds, Inc.‘s parent holding company) (since July 2014), and President and Director of OFI SteelPath, Inc. (since January 2013). Chief Investment Officer of the OppenheimerFunds advisory entities from (January 2013-December 2013); Executive Vice President of OFI Global Asset Management, Inc. (January 2013-May 2013); Chief Investment Officer of OppenheimerFunds, Inc. (October 2010-December 2012); Chief Investment Officer, Fixed- Income, of OppenheimerFunds, Inc. (April 2009-October 2010); Executive Vice President of OppenheimerFunds, Inc. (October 2009-December 2012); Director of Fixed Income of OppenheimerFunds, Inc. (January 2009-April 2009); and a Senior Vice President of OppenheimerFunds, Inc. (March 1993-September 2009). An officer of 103 portfolios in the OppenheimerFunds complex. |
| |
| OTHER OFFICERS OF THE FUND | | The addresses of the Officers in the chart below are as follows: for Messrs. Memani, Strzalkowski, Mss. Lo Bessette, Foxson and Picciotto, 225 Liberty Street, New York, New York 10281-1008, for Mr. Petersen, 6803 S. Tucson Way, Centennial, Colorado 80112-3924. Each Officer serves for an indefinite term or until his or her resignation, retirement, death or removal. |
| |
Krishna Memani, Vice President (since 2009) Year of Birth: 1960 | | President of the Sub-Adviser (since January 2013); Executive Vice President of the Manager (since January 2014) and Chief Investment Officer of the OppenheimerFunds advisory entities (since January 2014). Chief Investment Officer, Fixed Income of the Sub-Adviser (January 2013-December 2013); Head of the Investment Grade Fixed Income Team of the Sub-Adviser (March 2009-January 2014); Director of Fixed Income of the Sub-Adviser (October 2010-December 2012); Senior Vice President of the Sub-Adviser (March 2009-December 2012) and Senior Vice President of OFI Global Institutional, Inc. (April 2009-December 2012). Managing Director and Head of the U.S. and European Credit Analyst Team at Deutsche Bank Securities (June 2006-January 2009). Chief Credit Strategist at Credit Suisse Securities (August 2002-March 2006). Managing Director and Senior Portfolio Manager at Putnam Investments (September 1998-June 2002). A portfolio manager and an officer of other portfolios in the OppenheimerFunds complex. |
| |
Peter A. Strzalkowski, Vice President (since 2009) Year of Birth: 1965 | | Senior Vice President of the Sub-Adviser (since January 2016); Vice President and Senior Portfolio Manager of the Sub-Adviser (August 2007-January 2016) and co-Team Leader for the Sub-Adviser’s Investment Grade Fixed Income Team (since January 2014). A member of the Sub-Adviser’s Investment Grade Fixed Income Team (April 2009-January 2014). Managing Partner and Chief Investment Officer of Vector Capital Management, LLC, a structured products money management firm he founded, (July 2006-August 2007). Senior Portfolio Manager at Highland Capital Management, L.P. (June 2005-July 2006) and a Senior Fixed Income Portfolio Manager at Microsoft Corp. (June 2003-June 2005). Vice President and Senior Fixed Income Portfolio Manager at First Citizens Bank Trust, Capital Management Group (April 2000-June 2003) and a Vice President and Fixed Income Portfolio Manager at Centura Banks (November 1998-April 2000). A portfolio manager and officer of other portfolios in the OppenheimerFunds complex. |
41 OPPENHEIMER CORE BOND FUND/VA
TRUSTEES AND OFFICERS Unaudited / Continued
| | |
Cynthia Lo Bessette, Secretary and Chief Legal Officer (since 2016) Year of Birth: 1969 | | Executive Vice President, General Counsel and Secretary of the Manager (since February 2016); Chief Legal Officer of the Sub-Adviser and the Distributor (since February 2016); Vice President, General Counsel and Secretary of Oppenheimer Acquisition Corp. (since February 2016); General Counsel of OFI SteelPath, Inc., VTL Associates, LLC and Index Management Solutions, LLC (since February 2016); Chief Legal Officer of OFI Global Institutional, Inc., HarbourView Asset Management Corporation, OFI Global Trust Company, Oppenheimer Real Asset Management, Inc., OFI Private Investments Inc., Shareholder Services, Inc. and Trinity Investment Management Corporation (since February 2016); Senior Vice President and Deputy General Counsel (March 2015-February 2016) and Executive Vice President, Vice President, Corporate Counsel (February 2012-March 2015) and Deputy Chief Legal Officer (April 2013-March 2015) of Jennison Associates LLC; Assistant General Counsel (April 2008-September 2009) and Deputy General Counsel (October 2009-February 2012) of Lord Abbett & Co. LLC. An officer of 103 portfolios in the OppenheimerFunds complex. |
| |
Jennifer Foxson, Vice President and Chief Business Officer (since 2014) Year of Birth: 1969 | | Senior Vice President of OppenheimerFunds Distributor, Inc. (since June 2014); Vice President of OppenheimerFunds Distributor, Inc. (April 2006-June 2014); Vice President of the Sub-Adviser (January 1998-March 2006); Assistant Vice President of the Sub-Adviser (October 1991-December 1998). An officer of 103 portfolios in the OppenheimerFunds complex. |
| |
Mary Ann Picciotto, Chief Compliance Officer and Chief Anti-Money Laundering Officer (since 2014) Year of Birth: 1973 | | Senior Vice President and Chief Compliance Officer of the Manager (since March 2014); Chief Compliance Officer of the Sub- Adviser, OFI SteelPath, Inc., OFI Global Trust Company, OFI Global Institutional, Inc., Oppenheimer Real Asset Management, Inc., OFI Private Investments, Inc., Harborview Asset Management Corporation, Trinity Investment Management Corporation, and Shareholder Services, Inc. (since March 2014); Managing Director of Morgan Stanley Investment Management Inc. and certain of its various affiliated entities; Chief Compliance Officer of various Morgan Stanley Funds (May 2010-January 2014); Chief Compliance Officer of Morgan Stanley Investment Management Inc. (April 2007-January 2014). An officer of 103 portfolios in the OppenheimerFunds complex. |
| |
Brian S. Petersen, Treasurer and Principal Financial & Accounting Officer (since 2016) Year of Birth: 1970 | | Vice President of the Manager (since January 2013); Vice President of the Sub-Adviser (February 2007-December 2012); Assistant Vice President of the Sub-Adviser (August 2002-2007). An officer of 103 portfolios in the OppenheimerFunds complex. |
The Fund’s Statement of Additional Information contains additional information about the Fund’s Trustees and Officers and is available without charge, upon request, by calling 1.800.988.8287.
42 OPPENHEIMER CORE BOND FUND/VA
THIS PAGE INTENTIONALLY LEFT BLANK.
43 OPPENHEIMER CORE BOND FUND/VA
OPPENHEIMER CORE BOND FUND/VA
A Series of Oppenheimer Variable Account Funds
| | |
| Manager | | OFI Global Asset Management, Inc. |
| |
| Sub-Adviser | | OppenheimerFunds, Inc. |
| |
| Distributor | | OppenheimerFunds Distributor, Inc. |
| |
Transfer and Shareholder Servicing Agent | | OFI Global Asset Management, Inc. |
| |
| Sub-Transfer Agent | | Shareholder Services, Inc. DBA OppenheimerFunds Services |
| |
Independent Registered Public Accounting Firm | | KPMG LLP |
| |
| Legal Counsel | | Ropes & Gray LLP |
| |
| | Before investing in any of the Oppenheimer funds, investors should carefully consider a fund’s investment objectives, risks, charges and expenses. Fund prospectuses and summary prospectuses contain this and other information about the funds, and may be obtained by asking your financial advisor, or calling us at 1.800.988.8287. Read prospectuses and summary prospectuses carefully before investing. |
| |
| | © 2017 OppenheimerFunds, Inc. All rights reserved. Oppenheimer funds are distributed by OppenheimerFunds Distributor, Inc. |

| | | | |
| | 
| | |
| | |
| | | December 31, 2016 | | |
| | Oppenheimer | | |
| | Global Fund/VA | | Annual Report |
| | A Series of Oppenheimer Variable Account Funds | | |
| | | |
| | ANNUAL REPORT | | |
| | |
| | Listing of Top Holdings | | |
| | |
| | Fund Performance Discussion | | |
| | |
| | Financial Statements | | |
PORTFOLIO MANAGER: Rajeev Bhaman, CFA
AVERAGE ANNUAL TOTAL RETURNS FOR THE PERIODS ENDED 12/31/16
| | | | | | | | | | | | | | | | |
| | | Inception Date | | | 1-Year | | | 5-Year | | | 10-Year | |
Non-Service Shares | | | 11/12/90 | | | | 0.08 | % | | | 10.44 | % | | | 4.50 | % |
Service Shares | | | 7/13/00 | | | | -0.16 | | | | 10.16 | | | | 4.24 | |
MSCI All Country World Index | | | | | | | 7.86 | | | | 9.36 | | | | 3.56 | |
Performance data quoted represents past performance, which does not guarantee future results. The investment return and principal value of an investment in the Fund will fluctuate so that an investor’s shares, when redeemed, may be worth more or less than their original cost. Current performance may be lower or higher than the performance quoted. For performance data current to the most recent month end, call us at 1.800.988.8287. The Fund’s total returns should not be expected to be the same as the returns of other funds, whether or not both funds have the same portfolio managers and/or similar names. The Fund’s total returns include changes in share price and reinvested distributions but do not include the charges associated with the separate account products that offer this Fund. Such performance would have been lower if such charges were taken into account.
TOP HOLDINGS AND ALLOCATIONS
TOP TEN COMMON STOCK HOLDINGS
| | | | |
S&P Global, Inc. | | | 3.1 | % |
Citigroup, Inc. | | | 3.0 | |
Aetna, Inc. | | | 2.9 | |
Airbus Group SE | | | 2.7 | |
Alphabet, Inc., Cl. C | | | 2.7 | |
Murata Manufacturing Co. Ltd. | | | 2.6 | |
Alphabet, Inc., Cl. A | | | 2.6 | |
LVMH Moet Hennessy Louis Vuitton SE | | | 2.5 | |
SAP SE | | | 2.4 | |
Colgate-Palmolive Co. | | | 2.4 | |
Portfolio holdings and allocations are subject to change. Percentages are as of December 31, 2016, and are based on net assets. For more current Fund holdings, please visit oppenheimerfunds.com.
REGIONAL ALLOCATION
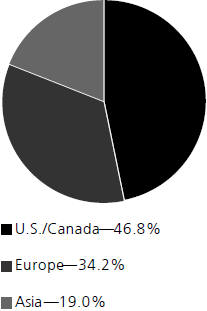
Portfolio holdings and allocations are subject to change. Percentages are as of December 31, 2016, and are based on the total market value of investments.
2 OPPENHEIMER GLOBAL FUND/VA
Fund Performance Discussion
During the one-year period ended December 31, 2016, the Fund’s Non-Service shares produced a return of 0.08%, underperforming the MSCI All Country World Index (the “Index”), which returned 7.86%.
Global equity markets were volatile in 2016, and our performance was disappointing. However, virtually all the Fund’s underperformance occurred during the first half of 2016. During that time, the market dislocation that resulted from expectations of the Federal Reserve (the “Fed”) raising rates in 2016 led to a severe underperformance of all things growth related, and outperformance was observed in anything with bond like characteristics. Perceived safety and stability were sought after, as were the major losers of the previous year. Energy and Materials rallied, as did utilities and bond proxies. Our orientation towards long-term growth companies was not the flavor of the market during this time. This was a period where cyclical factors ruled. The political season also impacted some of our companies, particularly in health care, where the posturing over price controls and eagerness of both presidential candidates to demonstrate populist rhetoric hurt the biotechnology sector. We did not help ourselves either by our choice of European financials, which were hit hard during the first half of 2016, as European policy makers seemed not to be able to get out of their own way and exacerbated the crisis in financials that existed for the better part of this decade.
The environment shifted over the third quarter of 2016. Post Brexit, things seemed to shift from the extremes of the first half of the year. Interest rates began to climb and the stock market had a better tone to it. Growth cyclicals, as opposed to mere commodity cyclicals, performed better during this time, especially among the consumer discretionary and information technology sectors. The performance of bond proxies in the consumer staples, telecommunication services, and utilities sectors, which surged in the first half of the year, was muted in the third quarter. Financials bounced back from the Brexit swoon late in the second quarter, despite the controversy created by the U.S. Department of Justice’s decision to fine Deutsche Bank $14 billion over residential mortgage backed securities sales. Higher interest rates support improved net interest margins for most financials and many European financials were nicely up in price over the third quarter of 2016.
During the fourth quarter, markets were largely driven by a turn in expectations. The catalyst was the outcome of the presidential election in the U.S. and a reassessment of electoral dynamics elsewhere. Financials was the best performing sector in the market with the recognition that the reality of the future doesn’t have to be the reality of the last two years. Central banks may not necessarily continue dampening interest rates all around the world and there can be a less draconian approach to regulation. If so, the environment for financial institutions shouldn’t be quite as bad as it has been. This change in expectations over the fourth quarter also benefitted the stock prices of luxury and media companies, some of which we held. It drove many cyclical companies and industries as well, especially in the energy and materials sectors. This was an adverse circumstance for us as we are perennially underweight energy, and the same is generally true for materials. We like certain companies for the technology they have or their access to a very scarce resource. However we don’t believe that we can predict either energy or materials prices consistently, and so will continue to invest relatively little in those sectors. Instead we find more enduring opportunities investing in technology and innovation, and this is reflected in our overweight positions in health care and information technology. These are two sectors that experienced a sell-off in the fourth quarter on the sentiment change as investors rotated into more cyclical areas.
FUND REVIEW
Against this backdrop, the top detractors from our relative performance during the reporting period were in the Financials, Information Technology and Health Care sectors. Over the first half of 2016, our pivot to cheap European financials was met with a hefty smack upside the head. In addition, our investments in the engines of 21st century drug discovery was trampled on by the stampede to the exit door with the murmurs of Fed rate rises and the increased eagerness of politicians to promise free products and services, even life-saving ones, upon which billions of dollars of risk capital have been ventured. Our structural bet against commodities, which helped in 2015, had the opposite impact for much of 2016. Quality and growth orientation seemed to attract opprobrium not salutes. We compounded this with several poor performing investments especially in SunEdison, which stumbled its way towards bankruptcy. We exited our position. We also had disappointing results in Phase III drug trials in two of our Pharma companies: Circassia Pharmaceuticals plc and Celldex Therapeutics. We exited our position in Celldex.
The Fund outperformed the Index in the consumer discretionary sector due to stock selection and the consumer staples sector as a result of an underweight position. Top contributing holdings to performance included LVMH Moet Hennessy Louis Vuitton SE, Keyence Corp. and Kering SA. LVMH Moet Hennessy Louis Vuitton is an iconic global luxury company with 70 brands across fashion and leather goods, watches and jewelry, wines and spirits, perfumes and cosmetics, and selective retailing. The company remains well positioned to benefit from the growing demand for luxury goods, particularly in the emerging markets, where customers are willing to pay premium prices, enabling LVMH to earn above-average margins and deliver returns on invested capital in the low double digits. Keyence develops, produces and sells factory automation solutions, such as image processing equipment, control and measuring equipment, as well as sensors. The company reported strong operating results at the close of April for their fiscal third quarter. Kering is a global consumer and luxury brands company, with
3 OPPENHEIMER GLOBAL FUND/VA
popular names such as Gucci, Bottega Veneta, Yves Saint Laurent and Puma. These brands tend to garner high margins and have timeless appeal even through fashion cycles.
POSITIONING AND OUTLOOK
We are long-term investors in companies that we believe can sustainably monetize their exposure to growth streams within the world economy to provide us, as shareholders, with a meaningfully positive return on our capital. We manage the risk in our portfolio through the diversity of the companies we hold and by limiting the size of individual stock positions. We hold companies in our portfolio for an average of eight to ten years – some we have held even longer – in an effort to reap those capital returns as they compound over time.
Within the market, investor expectations have turned toward the possibility of regulatory change. Regulations often have a myriad of compliance costs, and can stifle innovation as they often advantage established incumbents. So, some of this is clearly positive and some, at least to us, is not.
One area of focus is the information technology sector and the potential for trade policies and tax-related changes imposed by the new administration to negatively affect companies within it. The kinds of businesses that we own are mostly in the area of software and internet-related services. In our opinion, the taxes and tariffs that have been discussed are unlikely to affect them. The underlying demand for their technologies is unchanged and their valuations are reasonable.
Within health care, another area that may experience regulatory change, we are focused on drug innovation. Therefore we own highly innovative platform biotechnology and pharmaceutical companies that we believe are priced at a fraction of their option value.
Interest rates are a topic of speculation at period end. In our opinion, the Financials that we hold in our portfolio are very undervalued should interest rates rise meaningfully, and still undervalued if they rise only slightly. The overweight position that we have built is not typical for us when looking at the portfolio over a longer period of time. We have a natural bias against businesses with the opacity and financial leverage that financials – especially banks – have, and we would normally have a severe underweighting to them. Our overweight at period end is purely the result of valuation levels that are, in our opinion, compelling.
Speculation continues over the strength of the Eurozone and its currency. In our opinion, increased uncertainty for the Euro means continued weakening for the Euro. This is in line with the view we have held for years: that the unprofitable dynamics within many European economies lead to a weaker currency. However, we look at the world as one marketplace. The European domiciled companies that we own have done great things in the world and happen to have the Euro as their home currency. Many of them benefit from a weaker Euro, earning more in Euro terms on what they sell outside of Europe. What matters to them is not the level of the Euro but world trade conditions more generally.
As we look ahead, we are concerned about what could happen with world trade and with barriers to world trade, because that clearly affects the growth of the world economy. Volumes in world trade have been fairly mediocre over the past few years. But negative changes to the trade infrastructure would cause them to go down further and that would have a negative impact on the world economy, in which case growth rates will be lower. To the extent that we have had a change in any of our attitudes over the past six months, it is that we no longer take world trade growth for granted.
Investors should consider the Fund’s investment objective, risks, charges and expenses carefully before investing. The Fund’s prospectus and summary prospectus contain this and other information about the Fund, and may be obtained by asking your financial advisor or calling us at 1.800.988.8287. Read prospectuses and summary prospectuses carefully before investing.
Total returns include changes in share price and reinvestment of dividends and capital gains distributions in a hypothetical investment for the periods shown, but do not include the charges associated with the separate account products that offer this Fund.
The Fund’s investment strategy and focus can change over time. The mention of specific fund holdings does not constitute a recommendation by OppenheimerFunds, Inc. or its affiliates.
Shares of Oppenheimer funds are not deposits or obligations of any bank, are not guaranteed by any bank, are not insured by the FDIC or any other agency, and involve investment risks, including the possible loss of the principal amount invested.
4 OPPENHEIMER GLOBAL FUND/VA
Comparing the Fund’s Performance to the Market. The graphs that follow show the performance of a hypothetical $10,000 investment in each share class of the Fund held until December 31, 2016. In the case of Non-Service shares and Service shares, performance is measured over a ten-fiscal-year period. Performance information does not reflect charges that apply to separate accounts investing in the Fund. If these charges were taken into account, performance would be lower. The graphs assume that all dividends and capital gains distributions were reinvested in additional shares.
The Fund’s performance is compared to the performance of the MSCI All Country (AC) World Index, a free float-adjusted market capitalization weighted index that is designed to measure the equity market performance of developed and emerging markets. The Index is unmanaged and cannot be purchased directly by investors. While index comparisons may be useful to provide a benchmark for the Fund’s performance, it must be noted that the Fund’s investments are not limited to the investments comprising the Index. Index performance includes reinvestment of income, but does not reflect transaction costs, fees, expenses or taxes. Index performance is shown for illustrative purposes only as a benchmark for the Fund’s performance, and does not predict or depict performance of the Fund. The Fund’s performance reflects the effects of the Fund’s business and operating expenses.
5 OPPENHEIMER GLOBAL FUND/VA
COMPARISON OF CHANGE IN VALUE OF $10,000 HYPOTHETICAL INVESTMENTS IN:
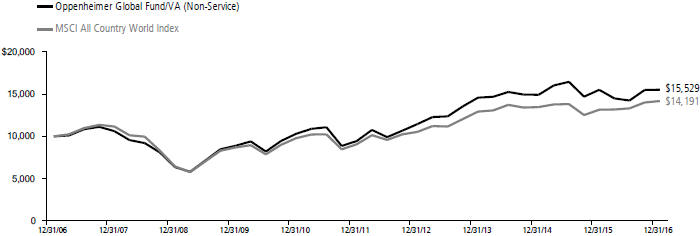
COMPARISON OF CHANGE IN VALUE OF $10,000 HYPOTHETICAL INVESTMENTS IN:
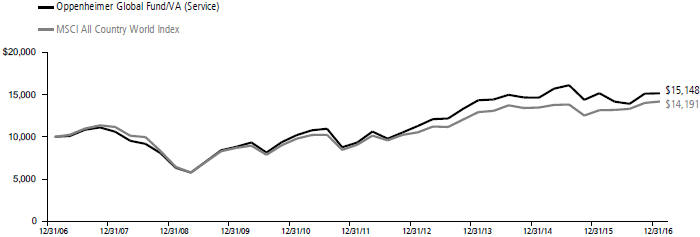
Performance data quoted represents past performance, which does not guarantee future results. The investment return and principal value of an investment in the Fund will fluctuate so that an investor’s shares, when redeemed, may be worth more or less than their original cost. Current performance may be lower or higher than the performance quoted. For performance data current to the most recent month end, call us at 1.800.988.8287. The Fund’s total returns should not be expected to be the same as the returns of other funds, whether or not both funds have the same portfolio managers and/or similar names. The Fund’s total returns include changes in share price and reinvested distributions but do not include the charges associated with the separate account products that offer this Fund. Such performance would have been lower if such charges were taken into account.
6 OPPENHEIMER GLOBAL FUND/VA
Fund Expenses
Fund Expenses. As a shareholder of the Fund, you incur two types of costs: (1) transaction costs and (2) ongoing costs, including management fees; distribution and service fees; and other Fund expenses. These examples are intended to help you understand your ongoing costs (in dollars) of investing in the Fund and to compare these costs with the ongoing costs of investing in other mutual funds.
The examples are based on an investment of $1,000.00 invested at the beginning of the period and held for the entire 6-month period ended December 31, 2016.
Actual Expenses. The first section of the table provides information about actual account values and actual expenses. You may use the information in this section for the class of shares you hold, together with the amount you invested, to estimate the expense that you paid over the period. Simply divide your account value by $1,000.00 (for example, an $8,600.00 account value divided by $1,000.00 = 8.60), then multiply the result by the number in the first section under the heading entitled “Expenses Paid During 6 Months Ended December 31, 2016” to estimate the expenses you paid on your account during this period.
Hypothetical Example for Comparison Purposes.
The second section of the table provides information about hypothetical account values and hypothetical expenses based on the Fund’s actual expense ratio for each class of shares, and an assumed rate of return of 5% per year for each class before expenses, which is not the actual return. The hypothetical account values and expenses may not be used to estimate the actual ending account balance or expenses you paid for the period. You may use this information to compare the ongoing costs of investing in the Fund and other funds. To do so, compare this 5% hypothetical example for the class of shares you hold with the 5% hypothetical examples that appear in the shareholder reports of the other funds.
Please note that the expenses shown in the table are meant to highlight your ongoing costs only and do not reflect any charges associated with the separate accounts that offer this Fund. Therefore, the “hypothetical” lines of the table are useful in comparing ongoing costs only, and will not help you determine the relative total costs of owning different funds. In addition, if these separate account charges were included your costs would have been higher.
| | | | | | | | | | | | |
| Actual | | Beginning Account Value July 1, 2016 | | | Ending Account Value December 31, 2016 | | | Expenses Paid During 6 Months Ended December 31, 2016 | |
Non-Service shares | | $ | 1,000.00 | | | $ | 1,090.00 | | | $ | 4.00 | |
Service shares | | | 1,000.00 | | | | 1,088.60 | | | | 5.32 | |
| | | |
Hypothetical | | | | | | | | | | | | |
(5% return before expenses) | | | | | | | | | | | | |
Non-Service shares | | | 1,000.00 | | | | 1,021.32 | | | | 3.87 | |
Service shares | | | 1,000.00 | | | | 1,020.06 | | | | 5.14 | |
Expenses are equal to the Fund’s annualized expense ratio for that class, multiplied by the average account value over the period, multiplied by 184/366 (to reflect the one-half year period). Those annualized expense ratios, excluding indirect expenses from affiliated funds, based on the 6-month period ended December 31, 2016 are as follows:
| | | | |
| Class | | Expense Ratios | |
Non-Service shares | | | 0.76% | |
Service shares | | | 1.01 | |
The expense ratios reflect voluntary and/or contractual waivers and/or reimbursements of expenses by the Fund’s Manager. Some of these undertakings may be modified or terminated at any time, as indicated in the Fund’s prospectus. The “Financial Highlights” tables in the Fund’s financial statements, included in this report, also show the gross expense ratios, without such waivers or reimbursements and reduction to custodian expenses, if applicable.
7 OPPENHEIMER GLOBAL FUND/VA
STATEMENT OF INVESTMENTS December 31, 2016
| | | | | | | | |
| | | Shares | | | Value | |
| Common Stocks—96.2% | |
| Consumer Discretionary—14.5% | |
| Automobiles—0.8% | |
| Suzuki Motor Corp. | | | 517,700 | | | $ | 18,172,763 | |
| | | | | | | | | |
| Hotels, Restaurants & Leisure—0.8% | |
| International Game Technology plc | | | 749,411 | | | | 19,124,969 | |
| | | | | | | | | |
| Internet & Direct Marketing Retail—1.3% | |
| JD.com, Inc., ADR1 | | | 1,148,186 | | | | 29,209,852 | |
| | | | | | | | | |
| Leisure Products—0.5% | |
| Nintendo Co. Ltd. | | | 53,300 | | | | 11,142,126 | |
| | | | | | | | | |
| Media—2.8% | |
| Walt Disney Co. (The) | | | 465,660 | | | | 48,531,085 | |
| Zee Entertainment Enterprises Ltd. | | | 2,508,388 | | | | 16,702,185 | |
| | | | | | | 65,233,270 | |
| | | | | | | | | |
| Specialty Retail—3.4% | |
| Industria de Diseno Textil SA | | | 1,435,668 | | | | 48,992,876 | |
| Tiffany & Co. | | | 398,250 | | | | 30,836,497 | |
| | | | | | | 79,829,373 | |
| | | | | | | | | |
| Textiles, Apparel & Luxury Goods—4.9% | |
| Brunello Cucinelli SpA | | | 426,730 | | | | 9,135,513 | |
| Kering | | | 175,060 | | | | 39,245,772 | |
| LVMH Moet Hennessy Louis Vuitton SE | | | 298,300 | | | | 56,879,028 | |
| Tod’s SpA | | | 117,609 | | | | 7,646,433 | |
| | | | | | | 112,906,746 | |
| | | | | | | | | |
| Consumer Staples—5.3% | |
| Food & Staples Retailing—0.4% | |
| Whole Foods Market, Inc. | | | 287,930 | | | | 8,856,727 | |
| | | | | | | | | |
| Food Products—2.5% | |
| Nestle SA | | | 275,307 | | | | 19,746,695 | |
| Unilever plc | | | 963,823 | | | | 38,986,764 | |
| | | | | | | 58,733,459 | |
| | | | | | | | | |
| Household Products—2.4% | |
| Colgate-Palmolive Co. | | | 842,290 | | | | 55,119,457 | |
| | | | | | | | | |
| Energy—1.0% | |
| Energy Equipment & Services—1.0% | |
| Technip SA | | | 318,940 | | | | 22,632,750 | |
| | | | | | | | | |
| Financials—21.7% | |
| Capital Markets—7.5% | |
| Credit Suisse Group AG1 | | | 639,562 | | | | 9,132,318 | |
| Goldman Sachs Group, Inc. (The) | | | 185,660 | | | | 44,456,287 | |
| S&P Global, Inc. | | | 660,970 | | | | 71,080,714 | |
| UBS Group AG | | | 3,104,518 | | | | 48,601,023 | |
| | | | | | | 173,270,342 | |
| | | | | | | | | |
| Commercial Banks—7.0% | |
| Banco Bilbao Vizcaya Argentaria SA | | | 1,967,915 | | | | 13,276,176 | |
| Citigroup, Inc. | | | 1,157,260 | | | | 68,775,962 | |
| ICICI Bank Ltd., Sponsored ADR | | | 3,980,800 | | | | 29,816,192 | |
| Societe Generale SA | | | 617,309 | | | | 30,304,091 | |
| Sumitomo Mitsui Financial Group, Inc. | | | 504,300 | | | | 19,118,042 | |
| | | | | | | 161,290,463 | |
| | | | | | | | | |
| Insurance—5.9% | |
| Allianz SE | | | 249,352 | | | | 41,218,650 | |
| Dai-ichi Life Holdings, Inc. | | | 2,031,100 | | | | 33,651,769 | |
| FNF Group | | | 580,970 | | | | 19,729,741 | |
| Prudential plc | | | 2,145,387 | | | | 42,792,215 | |
| | | | | | | 137,392,375 | |
| | | | | | | | | |
| Real Estate Management & Development—1.3% | |
| DLF Ltd. | | | 18,658,732 | | | | 30,631,885 | |
| | | | | | | | | |
| Health Care—14.7% | |
| Biotechnology—5.9% | |
| ACADIA Pharmaceuticals, Inc.1 | | | 604,070 | | | | 17,421,379 | |
| Biogen, Inc.1 | | | 92,120 | | | | 26,123,389 | |
| BioMarin Pharmaceutical, Inc.1 | | | 137,090 | | | | 11,356,535 | |
| | | | | | | | |
| | | Shares | | | Value | |
| Biotechnology (Continued) | |
| Bluebird Bio, Inc.1 | | | 131,850 | | | $ | 8,135,145 | |
| Circassia Pharmaceuticals plc1 | | | 4,471,614 | | | | 5,179,391 | |
| Gilead Sciences, Inc. | | | 334,460 | | | | 23,950,680 | |
| Ionis Pharmaceuticals, Inc.1 | | | 370,790 | | | | 17,734,886 | |
| MacroGenics, Inc.1 | | | 412,270 | | | | 8,426,799 | |
| Sage Therapeutics, Inc.1 | | | 241,260 | | | | 12,318,736 | |
| Vertex Pharmaceuticals, Inc.1 | | | 73,170 | | | | 5,390,434 | |
| | | | | | | 136,037,374 | |
| | | | | | | | | |
| Health Care Equipment & Supplies—1.3% | |
| Zimmer Biomet Holdings, Inc. | | | 286,340 | | | | 29,550,288 | |
| | | | | | | | | |
| Health Care Providers & Services—4.7% | |
| Aetna, Inc. | | | 546,160 | | | | 67,729,302 | |
| Anthem, Inc. | | | 283,915 | | | | 40,818,459 | |
| | | | | | | 108,547,761 | |
| | | | | | | | | |
| Pharmaceuticals—2.8% | |
| Bayer AG | | | 306,756 | | | | 32,002,603 | |
| Roche Holding AG | | | 89,725 | | | | 20,444,129 | |
| Shire plc | | | 245,800 | | | | 13,928,546 | |
| | | | | | | 66,375,278 | |
| | | | | | | | | |
| Industrials—12.7% | |
| Aerospace & Defense—2.7% | |
| Airbus Group SE | | | 936,930 | | | | 61,836,037 | |
| | | | | | | | | |
| Air Freight & Couriers—1.3% | |
| United Parcel Service, Inc., Cl. B | | | 261,740 | | | | 30,005,874 | |
| | | | | | | | | |
| Airlines—0.5% | |
| International Consolidated Airlines | | | | | | | | |
| Group SA | | | 2,152,390 | | | | 11,672,811 | |
| | | | | | | | | |
| Building Products—1.4% | |
| Assa Abloy AB, Cl. B | | | 1,761,077 | | | | 32,667,970 | |
| | | | | | | | | |
| Construction & Engineering—0.4% | |
| FLSmidth & Co. AS | | | 209,880 | | | | 8,699,998 | |
| | | | | | | | | |
| Electrical Equipment—3.2% | |
| Emerson Electric Co. | | | 309,810 | | | | 17,271,907 | |
| Nidec Corp. | | | 547,400 | | | | 47,076,426 | |
| Prysmian SpA | | | 415,636 | | | | 10,669,107 | |
| | | | | | | 75,017,440 | |
| | | | | | | | | |
| Industrial Conglomerates—2.4% | |
| 3M Co. | | | 216,320 | | | | 38,628,262 | |
| Siemens AG | | | 132,726 | | | | 16,314,926 | |
| | | | | | | 54,943,188 | |
| | | | | | | | | |
| Machinery—0.8% | |
| FANUC Corp. | | | 105,300 | | | | 17,806,299 | |
| | | | | | | | | |
| Information Technology—23.8% | |
| Electronic Equipment, Instruments, & Components—6.3% | |
| Keyence Corp. | | | 67,011 | | | | 45,914,511 | |
| Kyocera Corp. | | | 603,000 | | | | 29,908,226 | |
| Murata Manufacturing Co. Ltd. | | | 457,300 | | | | 60,897,333 | |
| TDK Corp. | | | 133,800 | | | | 9,174,694 | |
| | | | | | | 145,894,764 | |
| | | | | | | | | |
| Internet Software & Services—8.0% | |
| Alphabet, Inc., Cl. A1 | | | 76,480 | | | | 60,606,576 | |
| Alphabet, Inc., Cl. C1 | | | 79,332 | | | | 61,230,024 | |
| Facebook, Inc., Cl. A1 | | | 412,470 | | | | 47,454,674 | |
| Twitter, Inc.1 | | | 962,590 | | | | 15,690,217 | |
| | | | | | | 184,981,491 | |
| | | | | | | | | |
| IT Services—1.1% | |
| Earthport plc1 | | | 11,701,573 | | | | 3,061,683 | |
| PayPal Holdings, Inc.1 | | | 534,100 | | | | 21,080,927 | |
| | | | | | | 24,142,610 | |
| | | | | | | | | |
| Semiconductors & Semiconductor Equipment—2.0% | |
| Maxim Integrated Products, Inc. | | | 1,194,825 | | | | 46,084,400 | |
8 OPPENHEIMER GLOBAL FUND/VA
| | | | | | | | |
| | | Shares | | | Value | |
| Software—6.4% | |
| Adobe Systems, Inc.1 | | | 380,983 | | | $ | 39,222,200 | |
| Intuit, Inc. | | | 461,300 | | | | 52,869,593 | |
SAP SE | | | 636,197 | | | | 55,600,503 | |
| | | | | | | 147,692,296 | |
| | | | | | | | | |
Materials—1.0% | |
Chemicals—1.0% | |
Linde AG | | | 138,739 | | | | 22,749,601 | |
| | | | | | | | | |
Telecommunication Services—1.5% | |
Wireless Telecommunication Services—1.5% | |
KDDI Corp. | | | 1,370,100 | | | | 34,592,160 | |
Total Common Stocks (Cost $1,209,741,067) | | | | | | | 2,222,844,197 | |
| | | | | | | | |
| | | Shares | | | Value | |
Preferred Stocks—2.0% | |
| Bayerische Motoren Werke (BMW) AG, Preference | | | 567,551 | | | $ | 43,531,506 | |
| Zee Entertainment Enterprises Ltd., 6% Cum. Non-Cv. | | | 7,925,360 | | | | 1,143,204 | |
Total Preferred Stocks (Cost $17,963,907) | | | | | | | 44,674,710 | |
| | |
Investment Company—1.4% | | | | | | | | |
| Oppenheimer Institutional Government Money Market Fund, Cl. E, 0.43%2,3 (Cost $32,806,872) | | | 32,806,872 | | | | 32,806,872 | |
Total Investments, at Value (Cost $1,260,511,846) | | | 99.6% | | | | 2,300,325,779 | |
Net Other Assets (Liabilities) | | | 0.4 | | | | 9,891,552 | |
Net Assets | | | 100.0% | | | $ | 2,310,217,331 | |
| | | | | | | | |
Footnotes to Statement of Investments
1. Non-income producing security.
2. Rate shown is the 7-day yield at period end.
3. Is or was an affiliate, as defined in the Investment Company Act of 1940, as amended, at or during the reporting period, by virtue of the Fund owning at least 5% of the voting securities of the issuer or as a result of the Fund and the issuer having the same investment adviser. Transactions during the reporting period in which the issuer was an affiliate are as follows:
| | | | | | | | | | | | | | | | |
| | | Shares December 31, 2015 | | | Gross Additions | | | Gross Reductions | | | Shares December 31, 2016 | |
| Oppenheimer Institutional Government Money Market Fund, Cl. Ea | | | 20,379,539 | | | | 386,700,976 | | | | 374,273,643 | | | | 32,806,872 | |
| | | | |
| | | �� | | | | | | Value | | | Income | |
| Oppenheimer Institutional Government Money Market Fund, Cl. Ea | | | | | | | | | | $ | 32,806,872 | | | $ | 106,158 | |
a. Prior to September 28, 2016, this fund was named Oppenheimer Institutional Money Market Fund.
| | | | | | |
| Distribution of investments representing geographic holdings, as a percentage of total investments at value, is as follows: | | | |
| Geographic Holdings (Unaudited) | | Value | | Percent | |
United States | | $ 1,079,294,030 | | | 46.8 | % |
Japan | | 327,454,349 | | | 14.3 | |
Germany | | 211,417,788 | | | 9.2 | |
France | | 210,897,678 | | | 9.2 | |
United Kingdom | | 120,817,833 | | | 5.2 | |
Switzerland | | 97,924,165 | | | 4.3 | |
India | | 78,293,466 | | | 3.4 | |
Spain | | 62,269,052 | | | 2.7 | |
Sweden | | 32,667,969 | | | 1.4 | |
China | | 29,209,852 | | | 1.3 | |
Italy | | 27,451,053 | | | 1.2 | |
Ireland | | 13,928,546 | | | 0.6 | |
Denmark | | 8,699,998 | | | 0.4 | |
Total | | $ 2,300,325,779 | | | 100.0 | % |
| | | | | | |
See accompanying Notes to Financial Statements.
9 OPPENHEIMER GLOBAL FUND/VA
STATEMENT OF ASSETS AND LIABILITIES December 31, 2016
| | | | | | |
| | | |
Assets | | | | | | |
Investments, at value—see accompanying statement of investments: | | | | | | |
Unaffiliated companies (cost $1,227,704,974) | | | | $ | 2,267,518,907 | |
Affiliated companies (cost $32,806,872) | | | | | 32,806,872 | |
| | | | | | 2,300,325,779 | |
Cash | | | | | 1,999,971 | |
Receivables and other assets: | | | | | | |
Dividends | | | | | 5,849,448 | |
Investments sold | | | | | 3,165,794 | |
Shares of beneficial interest sold | | | | | 451,641 | |
Other | | | | | 114,315 | |
Total assets | | | | | 2,311,906,948 | |
| | | |
Liabilities | | | | | | |
Payables and other liabilities: | | | | | | |
Shares of beneficial interest redeemed | | | | | 1,169,070 | |
Distribution and service plan fees | | | | | 227,511 | |
Trustees’ compensation | | | | | 106,108 | |
Shareholder communications | | | | | 93,858 | |
Foreign capital gains tax | | | | | 14,173 | |
Other | | | | | 78,897 | |
Total liabilities | | | | | 1,689,617 | |
Net Assets | | | | $ | 2,310,217,331 | |
| | | | | | |
| | | | | | | |
| | |
Composition of Net Assets | | | | | | |
Par value of shares of beneficial interest | | | | $ | 66,297 | |
Additional paid-in capital | | | | | 1,285,731,623 | |
Accumulated net investment income | | | | | 17,542,546 | |
Accumulated net realized loss on investments and foreign currency transactions | | | | | (32,206,260 | ) |
Net unrealized appreciation on investments and translation of assets and liabilities denominated in foreign currencies | | | | | 1,039,083,125 | |
Net Assets | | | | $ | 2,310,217,331 | |
| | | | | | |
| | | | | | | |
| | |
Net Asset Value Per Share | | | | | | |
Non-Service Shares: | | | | | | |
| Net asset value, redemption price per share and offering price per share (based on net assets of $1,245,069,883 and 35,549,508 shares of beneficial interest outstanding) | | | | | $35.02 | |
Service Shares: | | | | | | |
Net asset value, redemption price per share and offering price per share (based on net assets of $1,065,147,448 and 30,747,177 shares of beneficial interest outstanding) | | | | | $34.64 | |
See accompanying Notes to Financial Statements.
10 OPPENHEIMER GLOBAL FUND/VA
STATEMENT OF OPERATIONS For the Year Ended December 31, 2016
| | | | | | |
| | | |
Investment Income | | | | | | |
Dividends: | | | | | | |
Unaffiliated companies (net of foreign withholding taxes of $3,680,533) | | | | $ | 34,344,915 | |
Affiliated companies | | | | | 106,158 | |
Total investment income | | | | | 34,451,073 | |
| | | | | | | |
Expenses | | | | | | |
Management fees | | | | | 14,572,942 | |
Distribution and service plan fees - Service shares | | | | | 2,541,824 | |
Transfer and shareholder servicing agent fees: | | | | | | |
Non-Service shares | | | | | 1,271,162 | |
Service shares | | | | | 1,017,661 | |
Shareholder communications: | | | | | | |
Non-Service shares | | | | | 101,590 | |
Service shares | | | | | 81,922 | |
Custodian fees and expenses | | | | | 134,285 | |
Trustees’ compensation | | | | | 72,455 | |
Borrowing fees | | | | | 42,388 | |
Other | | | | | 201,566 | |
Total expenses | | | | | 20,037,795 | |
Less reduction to custodian expenses | | | | | (927 | ) |
Less waivers and reimbursements of expenses | | | | | (24,019 | ) |
Net expenses | | | | | 20,012,849 | |
| | | | | | | |
Net Investment Income | | | | | 14,438,224 | |
| | | | | | | |
Realized and Unrealized Gain (Loss) | | | | | | |
Net realized gain (loss) on: | | | | | | |
Investment transactions in unaffiliated companies | | | | | 3,077,774 | |
Foreign currency transactions | | | | | (25,098 | ) |
Net realized gain | | | | | 3,052,676 | |
Net change in unrealized appreciation/depreciation on: | | | | | | |
Investment transactions (net of foreign capital gains tax of $3,510) | | | | | (27,642,196 | ) |
Translation of assets and liabilities denominated in foreign currencies | | | | | (216,203 | ) |
Net change in unrealized appreciation/depreciation | | | | | (27,858,399 | ) |
| | | | | | | |
Net Decrease in Net Assets Resulting from Operations | | | | $ | (10,367,499 | ) |
| | | | | | |
See accompanying Notes to Financial Statements.
11 OPPENHEIMER GLOBAL FUND/VA
STATEMENTS OF CHANGES IN NET ASSETS
| | | | | | | | |
| | | Year Ended December 31, 2016 | | | Year Ended December 31, 20151 | |
Operations | | | | | | | | |
Net investment income | | $ | 14,438,224 | | | $ | 22,366,099 | |
Net realized gain | | | 3,052,676 | | | | 168,860,356 | |
Net change in unrealized appreciation/depreciation | | | (27,858,399) | | | | (89,628,016) | |
Net increase (decrease) in net assets resulting from operations | | | (10,367,499) | | | | 101,598,439 | |
| | | | | | | | | |
Dividends and/or Distributions to Shareholders | | | | | | | | |
Dividends from net investment income: | | | | | | | | |
Non-Service shares | | | (13,598,845) | | | | (19,562,644) | |
Service shares | | | (7,587,430) | | | | (13,304,683) | |
| | | (21,186,275) | | | | (32,867,327) | |
| | | | | | | | | |
Distributions from net realized gain: | | | | | | | | |
Non-Service shares | | | (86,197,755) | | | | (97,527,552) | |
Service shares | | | (67,272,765) | | | | (81,961,759) | |
| | | (153,470,520) | | | | (179,489,311) | |
| | | | | | | | | |
Beneficial Interest Transactions | | | | | | | | |
Net increase (decrease) in net assets resulting from beneficial interest transactions: | | | | | | | | |
Non-Service shares | | | (55,451,479) | | | | (4,461,169) | |
Service shares | | | 62,981,601 | | | | (69,555,025) | |
| | | 7,530,122 | | | | (74,016,194) | |
| | | | | | | | | |
Net Assets | | | | | | | | |
Total decrease | | | (177,494,172) | | | | (184,774,393) | |
Beginning of period | | | 2,487,711,503 | | | | 2,672,485,896 | |
| End of period (including accumulated net investment income of $17,542,546 and $20,709,7871, respectively) | | $ | 2,310,217,331 | | | $ | 2,487,711,503 | |
| | | | | | | | |
1. Net investment income and net realized gain (loss) for the year ended December 31, 2015 includes an adjustment for a prior period reclassification. Please see Note 10 of the accompanying Notes to Financial Statements.
See accompanying Notes to Financial Statements.
12 OPPENHEIMER GLOBAL FUND/VA
FINANCIAL HIGHLIGHTS
| | | | | | | | | | | | | | | | | | | | |
| Non-Service Shares | | Year Ended December 31, 2016 | | | Year Ended December 31, 2015 | | | Year Ended December 31, 2014 | | | Year Ended December 31, 2013 | | | Year Ended December 31, 2012 | |
Per Share Operating Data | | | | | | | | | | | | | | | | | | | | |
Net asset value, beginning of period | | | $38.00 | | | | $39.50 | | | | $40.86 | | | | $32.55 | | | | $27.46 | |
Income (loss) from investment operations: | | | | | | | | | | | | | | | | | | | | |
Net investment income1 | | | 0.26 | | | | 0.372 | | | | 0.522 | | | | 0.442 | | | | 0.44 | |
Net realized and unrealized gain (loss) | | | (0.42) | | | | 1.382 | | | | 0.442 | | | | 8.372 | | | | 5.29 | |
Total from investment operations | | | (0.16) | | | | 1.75 | | | | 0.96 | | | | 8.81 | | | | 5.73 | |
Dividends and/or distributions to shareholders: | | | | | | | | | | | | | | | | | | | | |
Dividends from net investment income | | | (0.38) | | | | (0.54) | | | | (0.46) | | | | (0.50) | | | | (0.64) | |
Distributions from net realized gain | | | (2.44) | | | | (2.71) | | | | (1.86) | | | | 0.00 | | | | 0.00 | |
Total dividends and/or distributions to shareholders | | | (2.82) | | | | (3.25) | | | | (2.32) | | | | (0.50) | | | | (0.64) | |
Net asset value, end of period | | | $35.02 | | | | $38.00 | | | | $39.50 | | | | $40.86 | | | | $32.55 | |
| | | | | | | | | | | | | | | | | | | | |
| | | | | | | | | | | | | | | | | | | | | |
Total Return, at Net Asset Value3 | | | 0.08% | | | | 3.94% | | | | 2.29% | | | | 27.31% | | | | 21.27% | |
| | | | | | | | | | | | | | | | | | | | | |
Ratios/Supplemental Data | | | | | | | | | | | | | | | | | | | | |
Net assets, end of period (in thousands) | | | $1,245,070 | | | | $1,406,001 | | | | $1,468,107 | | | | $1,397,026 | | | | $1,252,127 | |
Average net assets (in thousands) | | | $1,270,049 | | | | $1,502,338 | | | | $1,532,383 | | | | $1,333,848 | | | | $1,206,244 | |
Ratios to average net assets:4 | | | | | | | | | | | | | | | | | | | | |
Net investment income | | | 0.75% | | | | 0.92%2 | | | | 1.30%2 | | | | 1.20%2 | | | | 1.48% | |
Expenses excluding specific expenses listed below | | | 0.77% | | | | 0.76% | | | | 0.76% | | | | 0.77% | | | | 0.76% | |
Interest and fees from borrowings | | | 0.00%5 | | | | 0.00%5 | | | | 0.00% | | | | 0.00% | | | | 0.00% | |
Total expenses6 | | | 0.77% | | | | 0.76% | | | | 0.76% | | | | 0.77% | | | | 0.76% | |
| Expenses after payments, waivers and/or reimbursements and reduction to custodian expenses | | | 0.77%7 | | | | 0.76%7 | | | | 0.76%7 | | | | 0.77%7 | | | | 0.76%7 | |
Portfolio turnover rate | | | 14% | | | | 14% | | | | 13% | | | | 11% | | | | 14% | |
1. Per share amounts calculated based on the average shares outstanding during the period.
2. Net investment income per share, net realized and unrealized gain (loss) per share and the net investment income ratio include an adjustment for a prior period reclassification for the years ended December 31, 2013, 2014 and 2015. Please see Note 10 of the accompanying Notes to Financial Statements.
3. Assumes an initial investment on the business day before the first day of the fiscal period, with all dividends and distributions reinvested in additional shares on the reinvestment date, and redemption at the net asset value calculated on the last business day of the fiscal period. Total returns are not annualized for periods less than one full year. Total return information does not reflect expenses that apply at the separate account level or to related insurance products. Inclusion of these charges would reduce the total return figures for all periods shown. Returns do not reflect the deduction of taxes that a shareholder would pay on fund distributions or the redemption of fund shares.
4. Annualized for periods less than one full year.
5. Less than 0.005%.
6. Total expenses including indirect expenses from affiliated fund fees and expenses were as follows:
| | | | |
Year Ended December 31, 2016 | | | 0.77 | % |
Year Ended December 31, 2015 | | | 0.76 | % |
Year Ended December 31, 2014 | | | 0.76 | % |
Year Ended December 31, 2013 | | | 0.77 | % |
Year Ended December 31, 2012 | | | 0.76 | % |
7. Waiver was less than 0.005%.
See accompanying Notes to Financial Statements.
13 OPPENHEIMER GLOBAL FUND/VA
FINANCIAL HIGHLIGHTS Continued
| | | | | | | | | | | | | | | | | | | | |
| Service Shares | | Year Ended December 31, 2016 | | | Year Ended December 31, 2015 | | | Year Ended December 31, 2014 | | | Year Ended December 31, 2013 | | | Year Ended December 31, 2012 | |
Per Share Operating Data | | | | | | | | | | | | | | | | | | | | |
Net asset value, beginning of period | | | $37.59 | | | | $39.10 | | | | $40.47 | | | | $32.25 | | | | $27.21 | |
Income (loss) from investment operations: | | | | | | | | | | | | | | | | | | | | |
Net investment income1 | | | 0.17 | | | | 0.282 | | | | 0.422 | | | | 0.342 | | | | 0.36 | |
Net realized and unrealized gain (loss) | | | (0.41) | | | | 1.362 | | | | 0.422 | | | | 8.302 | | | | 5.25 | |
Total from investment operations | | | (0.24) | | | | 1.64 | | | | 0.84 | | | | 8.64 | | | | 5.61 | |
Dividends and/or distributions to shareholders: | | | | | | | | | | | | | | | | | | | | |
Dividends from net investment income | | | (0.27) | | | | (0.44) | | | | (0.35) | | | | (0.42) | | | | (0.57) | |
Distributions from net realized gain | | | (2.44) | | | | (2.71) | | | | (1.86) | | | | 0.00 | | | | 0.00 | |
Total dividends and/or distributions to shareholders | | | (2.71) | | | | (3.15) | | | | (2.21) | | | | (0.42) | | | | (0.57) | |
Net asset value, end of period | | | $34.64 | | | | $37.59 | | | | $39.10 | | | | $40.47 | | | | $32.25 | |
| | | | | | | | | | | | | | | | | | | | |
| | | | | | | | | | | | | | | | | | | | | |
Total Return, at Net Asset Value3 | | | (0.16)% | | | | 3.67% | | | | 2.06% | | | | 26.99% | | | | 20.95% | |
| | | | | | | | | | | | | | | | | | | | | |
Ratios/Supplemental Data | | | | | | | | | | | | | | | | | | | | |
Net assets, end of period (in thousands) | | | $1,065,147 | | | | $1,081,711 | | | | $1,204,379 | | | | $1,216,285 | | | | $1,130,388 | |
Average net assets (in thousands) | | | $1,016,772 | | | | $1,219,501 | | | | $1,265,528 | | | | $1,174,119 | | | | $1,069,295 | |
Ratios to average net assets:4 | | | | | | | | | | | | | | | | | | | | |
Net investment income | | | 0.49% | | | | 0.70%2 | | | | 1.05%2 | | | | 0.95%2 | | | | 1.23% | |
Expenses excluding specific expenses listed below | | | 1.02% | | | | 1.01% | | | | 1.01% | | | | 1.02% | | | | 1.01% | |
Interest and fees from borrowings | | | 0.00%5 | | | | 0.00%5 | | | | 0.00% | | | | 0.00% | | | | 0.00% | |
Total expenses6 | | | 1.02% | | | | 1.01% | | | | 1.01% | | | | 1.02% | | | | 1.01% | |
| Expenses after payments, waivers and/or reimbursements and reduction to custodian expenses | | | 1.02%7 | | | | 1.01%7 | | | | 1.01%7 | | | | 1.02%7 | | | | 1.01%7 | |
Portfolio turnover rate | | | 14% | | | | 14% | | | | 13% | | | | 11% | | | | 14% | |
1. Per share amounts calculated based on the average shares outstanding during the period.
2. Net investment income per share, net realized and unrealized gain (loss) per share and the net investment income ratio include an adjustment for a prior period reclassification for the years ended December 31, 2013, 2014 and 2015. Please see Note 10 of the accompanying Notes to Financial Statements.
3. Assumes an initial investment on the business day before the first day of the fiscal period, with all dividends and distributions reinvested in additional shares on the reinvestment date, and redemption at the net asset value calculated on the last business day of the fiscal period. Total returns are not annualized for periods less than one full year. Total return information does not reflect expenses that apply at the separate account level or to related insurance products. Inclusion of these charges would reduce the total return figures for all periods shown. Returns do not reflect the deduction of taxes that a shareholder would pay on fund distributions or the redemption of fund shares.
4. Annualized for periods less than one full year.
5. Less than 0.005%.
6. Total expenses including indirect expenses from affiliated fund fees and expenses were as follows:
| | | | |
Year Ended December 31, 2016 | | | 1.02 | % |
Year Ended December 31, 2015 | | | 1.01 | % |
Year Ended December 31, 2014 | | | 1.01 | % |
Year Ended December 31, 2013 | | | 1.03 | % |
Year Ended December 31, 2012 | | | 1.01 | % |
7. Waiver was less than 0.005%.
See accompanying Notes to Financial Statements.
14 OPPENHEIMER GLOBAL FUND/VA
NOTES TO FINANCIAL STATEMENTS December 31, 2016
1. Organization
Oppenheimer Global Fund/VA (the “Fund”), a separate series of Oppenheimer Variable Account Funds, is a diversified open-end management investment company registered under the Investment Company Act of 1940 (“1940 Act”), as amended. The Fund’s main investment objective is to seek capital appreciation. The Fund’s investment adviser is OFI Global Asset Management, Inc. (“OFI Global” or the “Manager”), a wholly-owned subsidiary of OppenheimerFunds, Inc. (“OFI” or the “Sub-Adviser”). The Manager has entered into a sub-advisory agreement with OFI. Shares of the Fund are sold only to separate accounts of life insurance companies.
The Fund offers two classes of shares. Both classes are sold at their offering price, which is the net asset value per share, to separate investment accounts of participating insurance companies as an underlying investment for variable life insurance policies, variable annuity contracts or other investment products. The class of shares designated as Service shares is subject to a distribution and service plan. Both classes of shares have identical rights and voting privileges with respect to the Fund in general and exclusive voting rights on matters that affect that class alone. Earnings, net assets and net asset value per share may differ due to each class having its own expenses, such as transfer and shareholder servicing agent fees and shareholder communications, directly attributable to that class.
The following is a summary of significant accounting policies followed in the Fund’s preparation of financial statements in accordance with accounting principles generally accepted in the United States (“U.S. GAAP”).
2. Significant Accounting Policies
Security Valuation. All investments in securities are recorded at their estimated fair value, as described in Note 3.
Foreign Currency Translation. The books and records of the Fund are maintained in U.S. dollars. Any foreign currency amounts are translated into U.S. dollars on the following basis:
(1) Market value of investment securities, other assets and liabilities — at the exchange rates prevailing at Market Close as described in Note 3.
(2) Purchases and sales of investment securities, income and expenses — at the rates of exchange prevailing on the respective dates of such transactions.
Although the net assets and the market values are presented at the foreign exchange rates at Market Close, the Fund does not isolate the portion of the results of operations resulting from changes in foreign exchange rates on investments from the fluctuations arising from changes in market prices of securities held. Such fluctuations are included with the net realized and unrealized gains or losses from investments shown in the Statement of Operations.
For securities, which are subject to foreign withholding tax upon disposition, realized gains or losses on such securities are recorded net of foreign withholding tax.
Reported net realized foreign exchange gains or losses arise from sales of foreign currencies, currency gains or losses realized between the trade and settlement dates on securities transactions, the difference between the amounts of dividends, interest, and foreign withholding tax reclaims recorded on Fund’s books, and the U.S. dollar equivalent of the amounts actually received or paid. Net unrealized foreign exchange gains and losses arise from changes in the value of assets and liabilities other than investments in securities, resulting from changes in the exchange rate.
Allocation of Income, Expenses, Gains and Losses. Income, expenses (other than those attributable to a specific class), gains and losses are allocated on a daily basis to each class of shares based upon the relative proportion of net assets represented by such class. Operating expenses directly attributable to a specific class are charged against the operations of that class.
Dividends and Distributions to Shareholders. Dividends and distributions to shareholders, which are determined in accordance with income tax regulations and may differ from U.S. GAAP, are recorded on the ex-dividend date. Income and capital gain distributions, if any, are declared and paid annually or at other times as deemed necessary by the Manager.
Investment Income. Dividend income is recorded on the ex-dividend date or upon ex-dividend notification in the case of certain foreign dividends where the ex-dividend date may have passed. Non-cash dividends included in dividend income, if any, are recorded at the fair market value of the securities received. Interest income is recognized on an accrual basis. Discount and premium, which are included in interest income on the Statement of Operations, are amortized or accreted daily.
Custodian Fees. “Custodian fees and expenses” in the Statement of Operations may include interest expense incurred by the Fund on any cash overdrafts of its custodian account during the period. Such cash overdrafts may result from the effects of failed trades in portfolio securities and from cash outflows resulting from unanticipated shareholder redemption activity. The Fund pays interest to its custodian on such cash overdrafts, to the extent they are not offset by positive cash balances maintained by the Fund, at a rate equal to the Federal Funds Rate plus 0.50%. This rate will increase to 2.00% effective January 1, 2017. The “Reduction to custodian expenses” line item, if applicable, represents earnings on cash balances maintained by the Fund during the period. Such interest expense and other custodian fees may be paid with these earnings.
Security Transactions. Security transactions are recorded on the trade date. Realized gains and losses on securities sold are determined on the basis of identified cost.
Indemnifications. The Fund’s organizational documents provide current and former Trustees and officers with a limited indemnification against
15 OPPENHEIMER GLOBAL FUND/VA
NOTES TO FINANCIAL STATEMENTS Continued
2. Significant Accounting Policies (Continued)
liabilities arising in connection with the performance of their duties to the Fund. In the normal course of business, the Fund may also enter into contracts that provide general indemnifications. The Fund’s maximum exposure under these arrangements is unknown as this would be dependent on future claims that may be made against the Fund. The risk of material loss from such claims is considered remote.
Federal Taxes. The Fund intends to comply with provisions of the Internal Revenue Code applicable to regulated investment companies and to distribute substantially all of its investment company taxable income, including any net realized gain on investments not offset by capital loss carryforwards, if any, to shareholders. Therefore, no federal income or excise tax provision is required. The Fund files income tax returns in U.S. federal and applicable state jurisdictions. The statute of limitations on the Fund’s tax return filings generally remains open for the three preceding fiscal reporting period ends. The Fund has analyzed its tax positions for the fiscal year ended December 31, 2016, including open tax years, and does not believe there are any uncertain tax positions requiring recognition in the Fund’s financial statements.
The tax components of capital shown in the following table represent distribution requirements the Fund must satisfy under the income tax regulations, losses the Fund may be able to offset against income and gains realized in future years and unrealized appreciation or depreciation of securities and other investments for federal income tax purposes.
| | | | | | | | | | | | |
| Undistributed Net Investment Income | | Undistributed
Long-Term
Gain | | | Accumulated
Loss
Carryforward1,2,3 | | | Net Unrealized
Appreciation
Based on cost of Securities and Other Investments for Federal Income Tax Purposes | |
$21,458,166 | | | $— | | | | $17,365,953 | | | | $1,020,433,153 | |
1. At period end, the Fund had $17,365,953 of net capital loss carryforward available to offset future realized capital gains, if any, and thereby reduce future taxable gain distributions. Details of the capital loss carryforwards are included in the table below. Capital loss carryovers with no expiration, if any, must be utilized prior to those with expiration dates.
| | | | |
| Expiring | | | |
No expiration | | $ | 17,365,953 | |
2. During the reporting period, the Fund did not utilize any capital loss carryforward.
3. During the previous reporting period, the Fund did not utilize any capital loss carryforward.
Net investment income (loss) and net realized gain (loss) may differ for financial statement and tax purposes. The character of dividends and distributions made during the fiscal year from net investment income or net realized gains are determined in accordance with federal income tax requirements, which may differ from the character of net investment income or net realized gains presented in those financial statements in accordance with U.S. GAAP. Also, due to timing of dividends and distributions, the fiscal year in which amounts are distributed may differ from the fiscal year in which the income or net realized gain was recorded by the Fund.
Accordingly, the following amounts have been reclassified for the reporting period. Net assets of the Fund were unaffected by the reclassifications.
| | | | | | | | |
| Increase to Paid-in Capital | | Increase to Accumulated
Net Investment
Income | | | Increase to Accumulated Net
Realized Loss on Investments | |
$4,602,266 | | | $233,817 | | | | $4,836,083 | |
The tax character of distributions paid during the reporting periods:
| | | | | | | | |
| | | Year Ended
December 31, 2016 | | | Year Ended
December 31, 2015 | |
Distributions paid from: | | | | | | | | |
Ordinary income | | $ | 25,033,705 | | | $ | 32,867,327 | |
Long-term capital gain | | | 149,623,090 | | | | 179,489,311 | |
Total | | $ | 174,656,795 | | | $ | 212,356,638 | |
| | | | | | | | |
The aggregate cost of securities and other investments and the composition of unrealized appreciation and depreciation of securities and other investments for federal income tax purposes at period end are noted in the following table. The primary difference between book and tax appreciation or depreciation of securities and other investments, if applicable, is attributable to the tax deferral of losses or tax realization of financial statement unrealized gain or loss.
16 OPPENHEIMER GLOBAL FUND/VA
2. Significant Accounting Policies (Continued)
| | | | |
Federal tax cost of securities | | $ | 1,279,161,818 | |
Federal tax cost of other investments | | | 301,968 | |
Total federal tax cost | | $ | 1,279,463,786 | |
| | | | |
Gross unrealized appreciation | | $ | 1,141,363,995 | |
Gross unrealized depreciation | | | (120,930,842 | ) |
Net unrealized appreciation | | $ | 1,020,433,153 | |
| | | | |
Certain foreign countries impose a tax on capital gains which is accrued by the Fund based on unrealized appreciation, if any, on affected securities. The tax is paid when the gain is realized.
Use of Estimates. The preparation of financial statements in conformity with U.S. GAAP requires management to make estimates and assumptions that affect the reported amounts of assets and liabilities and disclosure of contingent assets and liabilities at the date of the financial statements and the reported amounts of increases and decreases in net assets from operations during the reporting period. Actual results could differ from those estimates.
3. Securities Valuation
The Fund calculates the net asset value of its shares as of 4:00 P.M. Eastern time, on each day the New York Stock Exchange (the “Exchange”) is open for trading, except in the case of a scheduled early closing of the Exchange, in which case the Fund will calculate net asset value of the shares as of the scheduled early closing time of the Exchange.
The Fund’s Board has adopted procedures for the valuation of the Fund’s securities and has delegated the day-to-day responsibility for valuation determinations under those procedures to the Manager. The Manager has established a Valuation Committee which is responsible for determining a “fair valuation” for any security for which market quotations are not “readily available.” The Valuation Committee’s fair valuation determinations are subject to review, approval and ratification by the Fund’s Board at its next regularly scheduled meeting covering the calendar quarter in which the fair valuation was determined.
Valuation Methods and Inputs
Securities are valued using unadjusted quoted market prices, when available, as supplied primarily by third party pricing services or dealers.
The following methodologies are used to determine the market value or the fair value of the types of securities described below:
Equity securities traded on a securities exchange (including exchange-traded derivatives other than futures and futures options) are valued based on the official closing price on the principal exchange on which the security is traded, as identified by the Manager, prior to the time when the Fund’s assets are valued. If the official closing price is unavailable, the security is valued at the last sale price on the principal exchange on which it is traded. If the official closing price or last sales price for a foreign security is not available, the security is valued at the mean between the bid and asked price per the exchange or, if not available from the exchange, obtained from two dealers. If bid and asked prices are not available from either the exchange or two dealers, the security is valued by using one of the following methodologies (listed in order of priority): (1) a bid from the exchange, (2) the mean between the bid and asked price as provided by a single dealer, or (3) a bid from a single dealer.
Shares of a registered investment company that are not traded on an exchange are valued at that investment company’s net asset value per share.
Corporate and government debt securities (of U.S. or foreign issuers) and municipal debt securities, event-linked bonds, loans, mortgage-backed securities, collateralized mortgage obligations, and asset-backed securities are valued at the mean between the “bid” and “asked” prices utilizing evaluated prices obtained from third party pricing services or broker-dealers who may use matrix pricing methods to determine the evaluated prices.
Short-term money market type debt securities are valued at the mean between the “bid” and “asked” prices utilizing evaluated prices obtained from third party pricing services or broker-dealers.
A description of the standard inputs that may generally be considered by the third party pricing vendors in determining their evaluated prices is provided below.
| | |
| Security Type | | Standard inputs generally considered by third-party pricing vendors |
| Corporate debt, government debt, municipal, mortgage- backed and asset-backed securities | | Reported trade data, broker-dealer price quotations, benchmark yields, issuer spreads on comparable securities, the credit quality, yield, maturity, and other appropriate factors. |
| Loans | | Information obtained from market participants regarding reported trade data and broker-dealer price quotations. |
| Event-linked bonds | | Information obtained from market participants regarding reported trade data and broker-dealer price quotations. |
If a market value or price cannot be determined for a security using the methodologies described above, or if, in the “good faith” opinion of the Manager, the market value or price obtained does not constitute a “readily available market quotation,” or a significant event has occurred that would materially affect the value of the security, the security is fair valued either (i) by a standardized fair valuation methodology applicable to the security type or the significant event as previously approved by the Valuation Committee and the Fund’s Board or (ii) as determined in good faith by the Manager’s Valuation Committee. The Valuation Committee considers all relevant facts that are reasonably available, through either public information
17 OPPENHEIMER GLOBAL FUND/VA
NOTES TO FINANCIAL STATEMENTS Continued
3. Securities Valuation (Continued)
or information available to the Manager, when determining the fair value of a security. Fair value determinations by the Manager are subject to review, approval and ratification by the Fund’s Board at its next regularly scheduled meeting covering the calendar quarter in which the fair valuation was determined. Those fair valuation standardized methodologies include, but are not limited to, valuing securities at the last sale price or initially at cost and subsequently adjusting the value based on: changes in company specific fundamentals, changes in an appropriate securities index, or changes in the value of similar securities which may be further adjusted for any discounts related to security-specific resale restrictions. When possible, such methodologies use observable market inputs such as unadjusted quoted prices of similar securities, observable interest rates, currency rates and yield curves. The methodologies used for valuing securities are not necessarily an indication of the risks associated with investing in those securities nor can it be assured that the Fund can obtain the fair value assigned to a security if it were to sell the security.
To assess the continuing appropriateness of security valuations, the Manager, or its third party service provider who is subject to oversight by the Manager, regularly compares prior day prices, prices on comparable securities, and sale prices to the current day prices and challenges those prices exceeding certain tolerance levels with the third party pricing service or broker source. For those securities valued by fair valuations, whether through a standardized fair valuation methodology or a fair valuation determination, the Valuation Committee reviews and affirms the reasonableness of the valuations based on such methodologies and fair valuation determinations on a regular basis after considering all relevant information that is reasonably available.
Classifications
Each investment asset or liability of the Fund is assigned a level at measurement date based on the significance and source of the inputs to its valuation. Various data inputs are used in determining the value of each of the Fund’s investments as of the reporting period end. These data inputs are categorized in the following hierarchy under applicable financial accounting standards:
1) Level 1-unadjusted quoted prices in active markets for identical assets or liabilities (including securities actively traded on a securities exchange)
2) Level 2-inputs other than unadjusted quoted prices that are observable for the asset or liability (such as unadjusted quoted prices for similar assets and market corroborated inputs such as interest rates, prepayment speeds, credit risks, etc.)
3) Level 3-significant unobservable inputs (including the Manager’s own judgments about assumptions that market participants would use in pricing the asset or liability).
The inputs used for valuing securities are not necessarily an indication of the risks associated with investing in those securities.
The Fund classifies each of its investments in investment companies which are publicly offered as Level 1. Investment companies that are not publicly offered are measured using net asset value as a practical expedient, and are not classified in the fair value hierarchy.
The table below categorizes amounts that are included in the Fund’s Statement of Assets and Liabilities at period end based on valuation input level:
| | | | | | | | | | | | | | | | |
| | | Level 1— Unadjusted Quoted Prices | | | Level 2— Other Significant Observable Inputs | | | Level 3— Significant Unobservable Inputs | | | Value | |
| |
Assets Table | | | | | | | | | | | | | | | | |
Investments, at Value: | | | | | | | | | | | | | | | | |
Common Stocks | | | | | | | | | | | | | | | | |
Consumer Discretionary | | $ | 127,702,403 | | | $ | 207,916,696 | | | $ | — | | | $ | 335,619,099 | |
Consumer Staples | | | 63,976,184 | | | | 58,733,459 | | | | — | | | | 122,709,643 | |
Energy | | | — | | | | 22,632,750 | | | | — | | | | 22,632,750 | |
Financials | | | 233,858,896 | | | | 268,726,169 | | | | — | | | | 502,585,065 | |
Health Care | | | 268,956,032 | | | | 71,554,669 | | | | — | | | | 340,510,701 | |
Industrials | | | 85,906,043 | | | | 206,743,574 | | | | — | | | | 292,649,617 | |
Information Technology | | | 344,238,611 | | | | 204,556,950 | | | | — | | | | 548,795,561 | |
Materials | | | — | | | | 22,749,601 | | | | — | | | | 22,749,601 | |
Telecommunication Services | | | — | | | | 34,592,160 | | | | — | | | | 34,592,160 | |
Preferred Stocks | | | 1,143,204 | | | | 43,531,506 | | | | — | | | | 44,674,710 | |
Investment Company | | | 32,806,872 | | | | — | | | | — | | | | 32,806,872 | |
| | | | |
Total Assets | | $ | 1,158,588,245 | | | $ | 1,141,737,534 | | | $ | — | | | $ | 2,300,325,779 | |
| | | | |
Forward currency exchange contracts and futures contracts, if any, are reported at their unrealized appreciation/depreciation at measurement date, which represents the change in the contract’s value from trade date. All additional assets and liabilities included in the above table are reported at their market value at measurement date.
4. Investments and Risks
Risks of Foreign Investing. The Fund may invest in foreign securities which are subject to special risks. Securities traded in foreign markets may be less liquid and more volatile than those traded in U.S. markets. Foreign issuers are usually not subject to the same accounting and disclosure requirements that U.S. companies are subject to, which may make it difficult for the Fund to evaluate a foreign company’s operations or financial condition. A change in the value of a foreign currency against the U.S. dollar will result in a change in the U.S. dollar value of investments denominated in that foreign currency and in the value of any income or distributions the Fund may receive on those investments. The value of foreign investments may be affected by exchange control regulations, foreign taxes, higher transaction and other costs, delays in the settlement of transactions, changes
18 OPPENHEIMER GLOBAL FUND/VA
4. Investments and Risks (Continued)
in economic or monetary policy in the United States or abroad, expropriation or nationalization of a company’s assets, or other political and economic factors. In addition, due to the inter-relationship of global economies and financial markets, changes in political and economic factors in one country or region could adversely affect conditions in another country or region. Investments in foreign securities may also expose the Fund to time-zone arbitrage risk. Foreign securities may trade on weekends or other days when the Fund does not price its shares. At times, the Fund may emphasize investments in a particular country or region and may be subject to greater risks from adverse events that occur in that country or region. Foreign securities and foreign currencies held in foreign banks and securities depositories may be subject to limited or no regulatory oversight.
Investments in Affiliated Funds. The Fund is permitted to invest in other mutual funds advised by the Manager (“Affiliated Funds”). Affiliated Funds are open-end management investment companies registered under the 1940 Act, as amended. The Manager is the investment adviser of, and the Sub-Adviser provides investment and related advisory services to, the Affiliated Funds. When applicable, the Fund’s investments in Affiliated Funds are included in the Statement of Investments. Shares of Affiliated Funds are valued at their net asset value per share. As a shareholder, the Fund is subject to its proportional share of the Affiliated Funds’ expenses, including their management fee. The Manager will waive fees and/or reimburse Fund expenses in an amount equal to the indirect management fees incurred through the Fund’s investment in the Affiliated Funds.
Each of the Affiliated Funds in which the Fund invests has its own investment risks, and those risks can affect the value of the Fund’s investments and therefore the value of the Fund’s shares. To the extent that the Fund invests more of its assets in one Affiliated Fund than in another, the Fund will have greater exposure to the risks of that Affiliated Fund.
Investments in Money Market Instruments. The Fund is permitted to invest its free cash balances in money market instruments to provide liquidity or for defensive purposes. The Fund may invest in money market instruments by investing in Class E shares of Oppenheimer Institutional Government Money Market Fund (“IGMMF”), formerly known as Oppenheimer Institutional Money Market Fund, which is an Affiliated Fund. IGMMF is regulated as a money market fund under the 1940 Act, as amended. The Fund may also invest in money market instruments directly or in other affiliated or unaffiliated money market funds.
Equity Security Risk. Stocks and other equity securities fluctuate in price. The value of the Fund’s portfolio may be affected by changes in the equity markets generally. Equity markets may experience significant short-term volatility and may fall sharply at times. Different markets may behave differently from each other and U.S. equity markets may move in the opposite direction from one or more foreign stock markets. Adverse events in any part of the equity or fixed-income markets may have unexpected negative effects on other market segments.
The prices of individual equity securities generally do not all move in the same direction at the same time and a variety of factors can affect the price of a particular company’s securities. These factors may include, but are not limited to, poor earnings reports, a loss of customers, litigation against the company, general unfavorable performance of the company’s sector or industry, or changes in government regulations affecting the company or its industry.
Shareholder Concentration. At period end, one shareholder owned 20% or more of the Fund’s total outstanding shares.
The shareholder is a related party of the Fund. Related parties may include, but are not limited to, the investment manager and its affiliates, affiliated broker dealers, fund of funds, and directors or employees. The related party owned 28% of the Fund’s total outstanding shares at period end.
5. Market Risk Factors
The Fund’s investments in securities and/or financial derivatives may expose the Fund to various market risk factors:
Commodity Risk. Commodity risk relates to the change in value of commodities or commodity indexes as they relate to increases or decreases in the commodities market. Commodities are physical assets that have tangible properties. Examples of these types of assets are crude oil, heating oil, metals, livestock, and agricultural products.
Credit Risk. Credit risk relates to the ability of the issuer of debt to meet interest and principal payments, or both, as they come due. In general, lower-grade, higher-yield debt securities are subject to credit risk to a greater extent than lower-yield, higher-quality securities.
Equity Risk. Equity risk relates to the change in value of equity securities as they relate to increases or decreases in the general market.
Foreign Exchange Rate Risk. Foreign exchange rate risk relates to the change in the U.S. dollar value of a security held that is denominated in a foreign currency. The U.S. dollar value of a foreign currency denominated security will decrease as the dollar appreciates against the currency, while the U.S. dollar value will increase as the dollar depreciates against the currency.
Interest Rate Risk. Interest rate risk refers to the fluctuations in value of fixed-income securities resulting from the inverse relationship between price and yield. For example, an increase in general interest rates will tend to reduce the market value of already issued fixed-income investments, and a decline in general interest rates will tend to increase their value. In addition, debt securities with longer maturities, which tend to have higher yields, are subject to potentially greater fluctuations in value from changes in interest rates than obligations with shorter maturities.
Volatility Risk. Volatility risk refers to the magnitude of the movement, but not the direction of the movement, in a financial instrument’s price over a defined time period. Large increases or decreases in a financial instrument’s price over a relative time period typically indicate greater volatility risk, while small increases or decreases in its price typically indicate lower volatility risk.
19 OPPENHEIMER GLOBAL FUND/VA
NOTES TO FINANCIAL STATEMENTS Continued
6. Shares of Beneficial Interest
The Fund has authorized an unlimited number of $0.001 par value shares of beneficial interest of each class. Transactions in shares of beneficial interest were as follows:
| | | | | | | | | | | | | | | | |
| | | Year Ended December 31, 2016 | | | Year Ended December 31, 2015 | |
| | | Shares | | | Amount | | | Shares | | | Amount | |
Non-Service Shares | | | | | | | | | | | | | | | | |
Sold | | | 2,580,191 | | | $ | 89,371,624 | | | | 3,090,155 | | | $ | 125,761,536 | |
Dividends and/or distributions reinvested | | | 3,043,507 | | | | 99,796,600 | | | | 2,891,830 | | | | 117,090,196 | |
Redeemed | | | (7,075,696 | ) | | | (244,619,703 | ) | | | (6,149,839 | ) | | | (247,312,901 | ) |
Net decrease | | | (1,451,998 | ) | | $ | (55,451,479 | ) | | | (167,854 | ) | | $ | (4,461,169 | ) |
| | | | | | | | | | | | | | | | |
| | | | | | | | | | | | | | | | | |
Service Shares | | | | | | | | | | | | | | | | |
Sold | | | 5,078,438 | | | $ | 172,658,993 | | | | 5,612,447 | | | $ | 223,502,452 | |
Dividends and/or distributions reinvested | | | 2,305,519 | | | | 74,860,195 | | | | 2,375,130 | | | | 95,266,442 | |
Redeemed | | | (5,412,550 | ) | | | (184,537,587 | ) | | | (10,010,458 | ) | | | (388,323,919 | ) |
Net increase (decrease) | | | 1,971,407 | | | $ | 62,981,601 | | | | (2,022,881 | ) | | $ | (69,555,025 | ) |
| | | | | | | | | | | | | | | | |
7. Purchases and Sales of Securities
The aggregate cost of purchases and proceeds from sales of securities, other than short-term obligations and investments in IGMMF, for the reporting period were as follows:
| | | | | | | | |
| | | Purchases | | | Sales | |
| |
Investment securities | | | $318,669,110 | | | | $486,188,793 | |
8. Fees and Other Transactions with Affiliates
Management Fees. Under the investment advisory agreement, the Fund pays the Manager a management fee based on the daily net assets of the Fund at an annual rate as shown in the following table:
| | | | |
| Fee Schedule | | | |
Up to $200 million | | | 0.75 | % |
Next $200 million | | | 0.72 | |
Next $200 million | | | 0.69 | |
Next $200 million | | | 0.66 | |
Next $4.2 billion | | | 0.60 | |
Over $5 billion | | | 0.58 | |
The Fund’s effective management fee for the reporting period was 0.64% of average annual net assets before any applicable waivers.
Sub-Adviser Fees. The Manager has retained the Sub-Adviser to provide the day-to-day portfolio management of the Fund. Under the Sub-Advisory Agreement, the Manager pays the Sub-Adviser an annual fee in monthly installments, equal to a percentage of the investment management fee collected by the Manager from the Fund, which shall be calculated after any investment management fee waivers. The fee paid to the Sub-Adviser is paid by the Manager, not by the Fund.
Transfer Agent Fees. OFI Global (the “Transfer Agent”) serves as the transfer and shareholder servicing agent for the Fund. The Fund pays the Transfer Agent a fee based on annual net assets. Fees incurred and average net assets for each class with respect to these services are detailed in the Statement of Operations and Financial Highlights, respectively.
Sub-Transfer Agent Fees. The Transfer Agent has retained Shareholder Services, Inc., a wholly-owned subsidiary of OFI (the “Sub-Transfer Agent”), to provide the day-to-day transfer agent and shareholder servicing of the Fund. Under the Sub-Transfer Agency Agreement, the Transfer Agent pays the Sub-Transfer Agent an annual fee in monthly installments, equal to a percentage of the transfer agent fee collected by the Transfer Agent from the Fund, which shall be calculated after any applicable fee waivers. The fee paid to the Sub-Transfer Agent is paid by the Transfer Agent, not by the Fund.
Trustees’ Compensation. The Fund’s Board of Trustees (“Board”) has adopted a compensation deferral plan for Independent Trustees that enables Trustees to elect to defer receipt of all or a portion of the annual compensation they are entitled to receive from the Fund. For purposes of determining the amount owed to the Trustees under the plan, deferred amounts are treated as though equal dollar amounts had been invested in shares of the Fund or in other Oppenheimer funds selected by the Trustees. The Fund purchases shares of the funds selected for deferral by the Trustees in amounts equal to his or her deemed investment, resulting in a Fund asset equal to the deferred compensation liability. Such assets are included as a component of “Other” within the asset section of the Statement of Assets and Liabilities. Deferral of Trustees’ fees under the plan will not affect the net assets of the Fund and will not materially affect the Fund’s assets, liabilities or net investment income per share. Amounts will be deferred until distributed in accordance with the compensation deferral plan.
Distribution and Service Plan for Service Shares. The Fund has adopted a Distribution and Service Plan (the “Plan”) pursuant to Rule 12b-1
20 OPPENHEIMER GLOBAL FUND/VA
8. Fees and Other Transactions with Affiliates (Continued)
under the 1940 Act for Service shares to pay OppenheimerFunds Distributor, Inc. (the “Distributor”), for distribution related services, personal service and account maintenance for the Fund’s Service shares. Under the Plan, payments are made periodically at an annual rate of 0.25% of the daily net assets of Service shares of the Fund. The Distributor currently uses all of those fees to compensate sponsors of the insurance product that offers Fund shares, for providing personal service and maintenance of accounts of their variable contract owners that hold Service shares. These fees are paid out of the Fund’s assets on an on-going basis and increase operating expenses of the Service shares, which results in lower performance compared to the Fund’s shares that are not subject to a service fee. Fees incurred by the Fund under the Plan are detailed in the Statement of Operations.
Waivers and Reimbursements of Expenses. The Manager has voluntarily agreed to limit the Fund’s expenses after payments, waivers and/or reimbursements and reduction to custodian expenses, excluding any applicable dividend expense, taxes, interest and fees from borrowing, any subsidiary expenses, Acquired Fund Fees and Expenses, brokerage commissions, unusual and infrequent expenses and certain other Fund expenses; so that those expenses, as percentages of daily net assets, will not exceed the annual rate of 1.00% for Non-Service shares and 1.25% for Service shares.
The Manager will waive fees and/or reimburse Fund expenses in an amount equal to the indirect management fees incurred through the Fund’s investment in IGMMF. During the reporting period, the Manager waived fees and/or reimbursed the Fund $24,019 for IGMMF management fees.
Waivers and/or reimbursements may be modified or terminated as set forth according to the terms in the prospectus.
9. Borrowings and Other Financing
Joint Credit Facility. A number of mutual funds managed by the Manager participate in a $1.3 billion revolving credit facility (the “Facility”) intended to provide short-term financing, if necessary, subject to certain restrictions in connection with atypical redemption activity. Expenses and fees related to the Facility are paid by the participating funds and are disclosed separately or as other expenses on the Statement of Operations. The Fund did not utilize the Facility during the reporting period.
10. Prior Period Reclassification
An adjustment to reflect a prior period reclassification between net investment income and net change in unrealized appreciation (depreciation) on investments and/or net realized gain (loss) on investments during the years ending December 31, 2013, 2014 and 2015 has been made to properly reflect income distributions received by the Fund from two of its investments.
The following adjustments are reflected in the respective fiscal years per the Statements of Changes in Net Assets and the Financial Highlights:
| | | | | | | | | | | | |
| | | 2013 | | | 2014 | | | 2015 | |
| |
Net investment income (loss) | | | $ 1,678,655 | | | | $ 1,668,338 | | | | $ 1,749,447 | |
Net realized gain (loss) | | | (163,217 | ) | | | (275,757 | ) | | | (222,558 | ) |
| Net change in unrealized appreciation/depreciation | | | (1,515,438 | ) | | | (1,392,581 | ) | | | (1,526,889 | ) |
The cumulative impact of these adjustments are also reflected in the respective component of net assets on the Statement of Assets and liabilities and had no impact on total net assets or net asset values per share of the Fund.
11. Pending Litigation
In 2009, several putative class action lawsuits were filed and later consolidated before the U.S. District Court for the District of Colorado in connection with the investment performance of Oppenheimer Rochester California Municipal Fund (the “California Fund”), a fund advised by OppenheimerFunds, Inc. (“OFI”) and distributed by OppenheimerFunds Distributor, Inc. (“OFDI”). The plaintiffs asserted claims against OFI, OFDI and certain present and former trustees and officers of the California Fund under the federal securities laws, alleging, among other things, that the disclosure documents of the California Fund contained misrepresentations and omissions and the investment policies of the California Fund were not followed. An amended complaint and a motion to dismiss were filed, and in 2011, the court issued an order which granted in part and denied in part the defendants’ motion to dismiss. In October 2015, following a successful appeal by defendants and a subsequent hearing, the court granted plaintiffs’ motion for class certification and appointed class representatives and class counsel.
OFI and OFDI believe the suit is without merit; that it is premature to render any opinion as to the likelihood of an outcome unfavorable to them in the suit; and that no estimate can yet be made as to the amount or range of any potential loss. Furthermore, OFI believes that the suit should not impair the ability of OFI or OFDI to perform their respective duties to the Fund and that the outcome of the suit should not have any material effect on the operations of any of the Oppenheimer funds.
21 OPPENHEIMER GLOBAL FUND/VA
REPORT OF INDEPENDENT REGISTERED PUBLIC ACCOUNTING FIRM
The Board of Trustees and Shareholders of Oppenheimer Variable Account Funds:
We have audited the accompanying statement of assets and liabilities of Oppenheimer Global Fund/VA (a separate series of Oppenheimer Variable Account Funds), including the statement of investments, as of December 31, 2016, and the related statement of operations for the year then ended, the statements of changes in net assets for each of the years in the two-year period then ended, and the financial highlights for each of the years in the five-year period then ended. These financial statements and financial highlights are the responsibility of the Fund’s management. Our responsibility is to express an opinion on these financial statements and financial highlights based on our audits.
We conducted our audits in accordance with the standards of the Public Company Accounting Oversight Board (United States). Those standards require that we plan and perform the audit to obtain reasonable assurance about whether the financial statements and financial highlights are free of material misstatement. An audit includes examining, on a test basis, evidence supporting the amounts and disclosures in the financial statements. Our procedures included confirmation of securities owned as of December 31, 2016, by correspondence with the custodian and transfer agent. An audit also includes assessing the accounting principles used and significant estimates made by management, as well as evaluating the overall financial statement presentation. We believe that our audits provide a reasonable basis for our opinion.
In our opinion, the financial statements and financial highlights referred to above present fairly, in all material respects, the financial position of Oppenheimer Global Fund/VA as of December 31, 2016, the results of its operations for the year then ended, the changes in its net assets for each of the years in the two-year period then ended, and the financial highlights for each of the years in the five-year period then ended, in conformity with U.S. generally accepted accounting principles.
KPMG LLP
Denver, Colorado
February 15, 2017
22 OPPENHEIMER GLOBAL FUND/VA
FEDERAL INCOME TAX INFORMATION Unaudited
In early 2017, if applicable, shareholders of record received information regarding all dividends and distributions paid to them by the Fund during calendar year 2016.
Capital gain distributions of $2.37418 per share were paid to Non-Service and Service shareholders, respectively, on June 21, 2016. Whether received in stock or in cash, the capital gain distribution should be treated by shareholders as a gain from the sale of the capital assets held for more than one year (long-term capital gains).
Dividends, if any, paid by the Fund during the reporting period which are not designated as capital gain distributions should be multiplied by the maximum amount allowable but not less than 47.35% to arrive at the amount eligible for the corporate dividend-received deduction.
The Fund has elected the application of Section 853 of the Internal Revenue Code to permit shareholders to take a federal income tax credit or deduction, at their option, on a per share basis. The maximum amount allowable but not less than $3,672,525 of foreign income taxes were paid by the Fund during the reporting period. A separate notice will be mailed to each shareholder, which will reflect the proportionate share of such foreign taxes which must be treated by shareholders as gross income for federal income tax purposes.
Gross income of the maximum amount allowable but not less than $22,998,327 was derived from sources within foreign countries or possessions of the United States.
The foregoing information is presented to assist shareholders in reporting distributions received from the Fund to the Internal Revenue Service. Because of the complexity of the federal regulations which may affect your individual tax return and the many variations in state and local tax regulations, we recommend that you consult your tax advisor for specific guidance.
23 OPPENHEIMER GLOBAL FUND/VA
BOARD APPROVAL OF THE FUND’S INVESTMENT ADVISORY AND SUB-ADVISORY AGREEMENTS Unaudited
The Fund has entered into an investment advisory agreement with OFI Global Asset Management, Inc. (“OFI Global” or the “Adviser”), a wholly-owned subsidiary of OppenheimerFunds, Inc. (“OFI” or the “Sub-Adviser”) (“OFI Global” and “OFI” together the “Managers”) and OFI Global has entered into a sub-advisory agreement with OFI whereby OFI provides investment sub-advisory services to the Fund (collectively, the “Agreements”). Each year, the Board of Trustees (the “Board”), including a majority of the independent Trustees, is required to determine whether to approve the terms of the Agreements and the renewal thereof. The Investment Company Act of 1940, as amended, requires that the Board request and evaluate, and that the Managers provide, such information as may be reasonably necessary to evaluate the terms of the Agreements. The Board employs an independent consultant to prepare a report that provides information, including comparative information that the Board requests for that purpose. In addition to in-person meetings focused on this evaluation, the Board receives information throughout the year regarding Fund services, fees, expenses and performance.
The Managers and the independent consultant provided information to the Board on the following factors: (i) the nature, quality and extent of the Managers’ services, (ii) the comparative investment performance of the Fund and the Managers, (iii) the fees and expenses of the Fund, including comparative fee and expense information, (iv) the profitability of the Managers and their affiliates, including an analysis of the cost of providing services, (v) whether economies of scale are realized as the Fund grows and whether fee levels reflect these economies of scale for Fund investors and (vi) other benefits to the Managers from their relationship with the Fund. The Board was aware that there are alternatives to retaining the Managers.
Outlined below is a summary of the principal information considered by the Board as well as the Board’s conclusions.
Nature, Quality and Extent of Services. The Board considered information about the nature, quality and extent of the services provided to the Fund and information regarding the Managers’ key personnel who provide such services. The Managers’ duties include providing the Fund with the services of the portfolio manager and the Sub-Adviser’s investment team, who provide research, analysis and other advisory services in regard to the Fund’s investments; and securities trading services. OFI Global is responsible for oversight of third-party service providers; monitoring compliance with applicable Fund policies and procedures and adherence to the Fund’s investment restrictions; risk management; and oversight of the Sub-Adviser. OFI Global is also responsible for providing certain administrative services to the Fund. Those services include providing and supervising all administrative and clerical personnel who are necessary in order to provide effective corporate administration for the Fund; compiling and maintaining records with respect to the Fund’s operations; preparing and filing reports required by the U.S. Securities and Exchange Commission; preparing periodic reports regarding the operations of the Fund for its shareholders; preparing proxy materials for shareholder meetings; and preparing the registration statements required by federal and state securities laws for the sale of the Fund’s shares. OFI Global also provides the Fund with office space, facilities and equipment.
The Board also considered the quality of the services provided and the quality of the Managers’ resources that are available to the Fund. The Board took account of the fact that the Sub-Adviser has over fifty years of experience as an investment adviser and that its assets under management rank it among the top mutual fund managers in the United States. The Board evaluated the Managers’ advisory, administrative, accounting, legal, compliance and risk management services, and information the Board has received regarding the experience and professional qualifications of the Managers’ key personnel and the size and functions of its staff. In its evaluation of the quality of the portfolio management services provided, the Board considered the experience of Rajeev Bhaman, the portfolio manager for the Fund, and the Sub-Adviser’s investment team and analysts. The Board members also considered the totality of their experiences with the Managers as directors or trustees of the Fund and other funds advised by the Managers. The Board considered information regarding the quality of services provided by affiliates of the Managers, which the Board members have become knowledgeable about through their experiences with the Managers and in connection with the renewal of the Fund’s service agreements. The Board concluded, in light of the Managers’ experience, reputation, personnel, operations and resources that the Fund benefits from the services provided under the Agreements.
Investment Performance of the Managers and the Fund. Throughout the year, the Managers provided information on the investment performance of the Fund, the Adviser and the Sub-Adviser, including comparative performance information. The Board also reviewed information, prepared by the Managers and by the independent consultant, comparing the Fund’s historical performance to relevant market indices and to the performance of other world stock funds underlying variable insurance products. The Board considered that the Fund outperformed its performance category median during the one-, three-, five- and ten-year periods.
Fees and Expenses of the Fund. The Board reviewed the fees paid to the Adviser and the other expenses borne by the Fund. The Board noted that the Adviser, not the Fund, pays the Sub-Adviser’s fee under the sub-advisory agreement. The independent consultant provided comparative data in regard to the fees and expenses of the Fund and other world stock funds underlying variable insurance products. In reviewing the fees and expenses charged to the VA funds, the Board considered the Adviser’s assertion that, because there is much greater disparity in the fees and services that may be provided by a manager to a VA fund as opposed to a retail fund, when comparing the expenses of the various VA funds to those of retail funds, it is most appropriate to focus on total expenses (rather than on the management fees). Accordingly, while the Board reviewed and considered all expenses, it focused on total expenses. The Board considered that the Fund’s total expenses and contractual management fee were lower than its peer group median and its category median. The Board further considered that the Adviser has voluntarily agreed to limit the Fund’s total annual operating expenses so that those expenses, as percentages of daily net assets, will not exceed the annual rate of 1.00% for Non-Service Shares and 1.25% for Service Shares. This voluntary expense limitation may be amended or withdrawn at any time without prior notice to shareholders.
Economies of Scale and Profits Realized by the Managers. The Board considered information regarding the Managers’ costs in serving as the Fund’s investment adviser and sub-adviser, including the costs associated with the personnel and systems necessary to manage the Fund, and information regarding the Managers’ profitability from their relationship with the Fund. The Board also considered that the Managers must be able to pay and retain experienced professional personnel at competitive rates to provide quality services to the Fund. The Board reviewed whether the Managers may realize economies of scale in managing and supporting the Fund. The Board noted that the Fund currently has management fee breakpoints, which are intended to share with Fund shareholders economies of scale that may exist as the Fund’s assets grow.
Other Benefits to the Managers. In addition to considering the profits realized by the Managers, the Board considered information that was provided regarding the direct and indirect benefits the Managers receive as a result of their relationship with the Fund, including compensation paid to the Managers’ affiliates and research provided to the Adviser in connection with permissible brokerage arrangements (soft dollar arrangements).
24 OPPENHEIMER GLOBAL FUND/VA
BOARD APPROVAL OF THE FUND’S INVESTMENT ADVISORY AND SUB-ADVISORY AGREEMENTS Unaudited / Continued
Conclusions. These factors were also considered by the independent Trustees meeting separately from the full Board, assisted by experienced counsel to the Fund and to the independent Trustees. Fund counsel and the independent Trustees’ counsel are independent of the Managers within the meaning and intent of the Securities and Exchange Commission Rules.
Based on its review of the information it received and its evaluations described above, the Board, including a majority of the independent Trustees, decided to continue the Agreements through August 31, 2017. In arriving at its decision, the Board did not identify any factor or factors as being more important than others, but considered all of the above information, and considered the terms and conditions of the Agreements, including the management fees, in light of all the surrounding circumstances.
25 OPPENHEIMER GLOBAL FUND/VA
PORTFOLIO PROXY VOTING POLICIES AND GUIDELINES; UPDATES TO STATEMENTS OF INVESTMENTS Unaudited
The Fund has adopted Portfolio Proxy Voting Policies and Guidelines under which the Fund votes proxies relating to securities (“portfolio proxies”) held by the Fund. A description of the Fund’s Portfolio Proxy Voting Policies and Guidelines is available (i) without charge, upon request, by calling the Fund toll-free at 1.800.CALL OPP (225.5677), (ii) on the Fund’s website at www.oppenheimerfunds.com, and (iii) on the SEC’s website at www.sec.gov. In addition, the Fund is required to file Form N-PX, with its complete proxy voting record for the 12 months ended June 30th, no later than August 31st of each year. The Fund’s voting record is available (i) without charge, upon request, by calling the Fund toll-free at 1.800.CALL OPP (225.5677), and (ii) in the Form N-PX filing on the SEC’s website at www.sec.gov.
The Fund files its complete schedule of portfolio holdings with the SEC for the first quarter and the third quarter of each fiscal year on Form N-Q. The Fund’s Form N-Q filings are available on the SEC’s website at www.sec.gov. Those forms may be reviewed and copied at the SEC’s Public Reference Room in Washington, D.C. Information on the operation of the Public Reference Room may be obtained by calling 1-800-SEC-0330.
26 OPPENHEIMER GLOBAL FUND/VA
TRUSTEES AND OFFICERS Unaudited
| | |
Name, Position(s) Held with the Fund, Length of
Service, Age | | Principal Occupation(s) During the Past 5 Years; Other Trusteeships/Directorships Held;
Number of Portfolios in the Fund Complex Currently Overseen |
| |
| INDEPENDENT TRUSTEES | | The address of each Trustee in the chart below is 6803 S. Tucson Way, Centennial, Colorado 80112-3924. Each Trustee serves for an indefinite term, or until his or her resignation, retirement, death or removal. |
| |
Robert J. Malone, Chairman of the Board of Trustees (since 2016), Trustee (since 2002) Year of Birth: 1944 | | Chairman - Colorado Market of MidFirst Bank (since January 2015); Chairman of the Board (2012-2016) and Director (August 2005-March 2016) of Jones International University (educational organization); Trustee of the Gallagher Family Foundation (non-profit organization) (2000-2015); Chairman, Chief Executive Officer and Director of Steele Street Bank Trust (commercial banking) (August 2003-January 2015); Board of Directors of Opera Colorado Foundation (non-profit organization) (2008- 2012); Director of Colorado UpLIFT (charitable organization) (1986-2010); Director of Jones Knowledge, Inc. (2006-2010); Former Chairman of U.S. Bank-Colorado (subsidiary of U.S. Bancorp and formerly Colorado National Bank) (July 1996-April 1999); Director of Commercial Assets, Inc. (real estate investment trust) (1993-2000); Director of U.S. Exploration, Inc. (oil and gas exploration) (1997-February 2004); Chairman of the Board (1991-1994) and Trustee (1985-1994) of Regis University; and Chairman of the Board (1990-1991) and Trustee (1984-1999) of Young Presidents Organization. Oversees 47 portfolios in the OppenheimerFunds complex. Mr. Malone has served on the Boards of certain Oppenheimer funds since 2002, during which time he has become familiar with the Fund’s (and other Oppenheimer funds’) financial, accounting, regulatory and investment matters and has contributed to the Boards’ deliberations. |
| |
Jon S. Fossel, Trustee (since 1990) Year of Birth: 1942 | | Chairman of the Board of Jack Creek Preserve Foundation (non-profit organization) (since March 2005); Director of Jack Creek Preserve Foundation (non-profit organization) (March 2005-December 2014); Chairman of the Board (2006-December 2011) and Director (June 2002-December 2011) of UNUMProvident (insurance company); Director of Northwestern Energy Corp. (public utility corporation) (November 2004-December 2009); Director of P.R. Pharmaceuticals (October 1999-October 2003); Director of Rocky Mountain Elk Foundation (non-profit organization) (February 1998-February 2003 and February 2005-February 2007); Chairman and Director (until October 1996) and President and Chief Executive Officer (until October 1995) of OppenheimerFunds, Inc.; President, Chief Executive Officer and Director of the following: Oppenheimer Acquisition Corp. (“OAC”) (parent holding company of OppenheimerFunds, Inc.), Shareholders Services, Inc. and Shareholder Financial Services, Inc. (until October 1995). Oversees 47 portfolios in the OppenheimerFunds complex. Mr. Fossel has served on the Boards of certain Oppenheimer funds since 1990, during which time he has become familiar with the Fund’s (and other Oppenheimer funds’) financial, accounting, regulatory and investment matters and has contributed to the Boards’ deliberations. |
| |
Richard F. Grabish, Trustee (since 2012) Year of Birth: 1948 | | Formerly Senior Vice President and Assistant Director of Sales and Marketing (March 1997-December 2007), Director (March 1987-December 2007) and Manager of Private Client Services (June 1985-June 2005) of A.G. Edwards & Sons, Inc. (broker/dealer and investment firm); Chairman and Chief Executive Officer of A.G. Edwards Trust Company, FSB (March 2001-December 2007); President and Vice Chairman of A.G. Edwards Trust Company, FSB (investment adviser) (April 1987-March 2001); President of A.G. Edwards Trust Company, FSB (investment adviser) (June 2005-December 2007). Oversees 47 portfolios in the OppenheimerFunds complex. Mr. Grabish has served on the Boards of certain Oppenheimer funds since 2001, during which time he has become familiar with the Fund’s (and other Oppenheimer funds’) financial, accounting, regulatory and investment matters and has contributed to the Boards’ deliberations. |
| |
Beverly L. Hamilton, Trustee (since 2002) Year of Birth: 1946 | | Trustee of Monterey Institute for International Studies (educational organization) (2000-2014); Board Member of Middlebury College (educational organization) (December 2005-June 2011); Chairman (2010-2016) of American Funds’ Emerging Markets Growth Fund, Inc. (mutual fund); Director of The California Endowment (philanthropic organization) (April 2002-April 2008); Director (February 2002-2005) and Chairman of Trustees (2006-2007) of the Community Hospital of Monterey Peninsula; Director (October 1991-2005) and Vice Chairman (2006-2009) of American Funds’ Emerging Markets Growth Fund, Inc. (mutual fund); President of ARCO Investment Management Company (February 1991-April 2000); Member of the investment committees of The Rockefeller Foundation (2001-2006) and The University of Michigan (since 2000); Advisor at Credit Suisse First Boston’s Sprout venture capital unit (venture capital fund) (1994-January 2005); Trustee of MassMutual Institutional Funds (investment company) (1996-June 2004); Trustee of MML Series Investment Fund (investment company) (April 1989-June 2004); Member of the investment committee of Hartford Hospital (2000-2003); and Advisor to Unilever (Holland) pension fund (2000-2003). Oversees 47 portfolios in the OppenheimerFunds complex. Ms. Hamilton has served on the Boards of certain Oppenheimer funds since 2002, during which time she has become familiar with the Fund’s (and other Oppenheimer funds’) financial, accounting, regulatory and investment matters and has contributed to the Boards’ deliberations. |
| |
Victoria J. Herget, Trustee (since 2012) Year of Birth:1951 | | Board Chair (2008-2015) and Director (2004-Present), United Educators (insurance company); Trustee (since 2000) and Chair (since 2010), Newberry Library (independent research library); Trustee, Mather LifeWays (senior living organization) (since 2001); Independent Director of the First American Funds (mutual fund family) (2003-2011); former Managing Director (1993-2001), Principal (1985-1993), Vice President (1978-1985) and Assistant Vice President (1973-1978) of Zurich Scudder Investments (investment adviser) (and its predecessor firms); Trustee (1992-2007), Chair of the Board of Trustees (1999-2007), Investment Committee Chair (1994-1999) and Investment Committee member (2007-2010) of Wellesley College; Trustee, BoardSource (non-profit organization) (2006-2009) and Chicago City Day School (K-8 School) (1994-2005). Oversees 47 portfolios in the OppenheimerFunds complex. Ms. Herget has served on the Boards of certain Oppenheimer funds since 2012, during which time she has become familiar with the Fund’s (and other Oppenheimer funds’) financial, accounting, regulatory and investment matters and has contributed to the Boards’ deliberations. |
27 OPPENHEIMER GLOBAL FUND/VA
TRUSTEES AND OFFICERS Unaudited / Continued
| | |
F. William Marshall, Jr., Trustee (since 2000) Year of Birth: 1942 | | Trustee Emeritus of Worcester Polytech Institute (WPI) (private university) (since 2009); Trustee of MassMutual Select Funds (formerly MassMutual Institutional Funds) (investment company) (1996-2015), MML Series Investment Fund (investment company) (1996-2015) and Mass Mutual Premier Funds (investment company) (January 2012-December 2015); President and Treasurer of the SIS Fund (private charitable fund) (January 1999-March 2011); Former Trustee of WPI (1985-2008); Former Chairman of the Board (2004-2006) and Former Chairman of the Investment Committee of WPI (1994-2008); Chairman of SIS Family Bank, F.S.B. (formerly SIS Bank) (commercial bank) (January 1999-July 1999); Executive Vice President of Peoples Heritage Financial Group, Inc. (commercial bank) (January 1999-July 1999); and Former President and Chief Executive Officer of SIS Bancorp. (1993-1999). Oversees 47 portfolios in the OppenheimerFunds complex. Mr. Marshall has served on the Boards of certain Oppenheimer funds since 2000, during which time he has become familiar with the Fund’s (and other Oppenheimer funds’) financial, accounting, regulatory and investment matters and has contributed to the Boards’ deliberations. |
| |
Karen L. Stuckey, Trustee (since 2012) Year of Birth: 1953 | | Member (since May 2015) of Desert Mountain Community Foundation Advisory Board (non-profit organization); Partner (1990-2012) of PricewaterhouseCoopers LLP (professional services firm) (held various positions 1975-1990); Trustee (1992- 2006), member of Executive, Nominating and Audit Committees and Chair of Finance Committee (1992-2006), and Emeritus Trustee (since 2006) of Lehigh University; and member, Women’s Investment Management Forum (professional organization) since inception. Oversees 47 portfolios in the OppenheimerFunds complex. Ms. Stuckey has served on the Boards of certain Oppenheimer funds since 2012, during which time she has become familiar with the Fund’s (and other Oppenheimer funds’) financial, accounting, regulatory and investment matters and has contributed to the Boards’ deliberations. |
| |
James D. Vaughn, Trustee (since 2012) Year of Birth:1945 | | Retired; former managing partner (1994-2001) of Denver office of Deloitte & Touche LLP, (held various positions 1969- 1993); Trustee and Chairman of the Audit Committee of Schroder Funds (2003-2012); Board member and Chairman of Audit Committee of AMG National Trust Bank (since 2005); Trustee and Investment Committee member, University of South Dakota Foundation (since 1996); Board member, Audit Committee Member and past Board Chair, Junior Achievement (since 1993); former Board member, Mile High United Way, Boys and Girls Clubs, Boy Scouts, Colorado Business Committee for the Arts, Economic Club of Colorado and Metro Denver Network. Oversees 47 portfolios in the OppenheimerFunds complex. Mr. Vaughn has served on the Boards of certain Oppenheimer funds since 2012, during which time he has become familiar with the Fund’s (and other Oppenheimer funds’) financial, accounting, regulatory and investment matters and has contributed to the Boards’ deliberations. |
| | | |
| INTERESTED TRUSTEE AND OFFICER | | Mr. Steinmetz is an “Interested Trustee” because he is affiliated with the Manager and the Sub-Adviser by virtue of his positions as Chairman and director of the Sub-Adviser and officer and director of the Manager. Both as a Trustee and as an officer, Mr. Steinmetz serves for an indefinite term, or until his resignation, retirement, death or removal. Mr. Steinmetz’s address is 225 Liberty Street, New York, New York 10281-1008. |
| |
Arthur P. Steinmetz, Trustee (Since 2015), President and Principal Executive Officer (since 2014) Year of Birth: 1958 | | Chairman of OppenheimerFunds, Inc. (since January 2015); CEO and Chairman of OFI Global Asset Management, Inc. (since July 2014), President of OFI Global Asset Management, Inc. (since May 2013), a Director of OFI Global Asset Management, Inc. (since January 2013), Director of OppenheimerFunds, Inc. (since July 2014), President, Management Director and CEO of Oppenheimer Acquisition Corp. (OppenheimerFunds, Inc.‘s parent holding company) (since July 2014), and President and Director of OFI SteelPath, Inc. (since January 2013). Chief Investment Officer of the OppenheimerFunds advisory entities from (January 2013-December 2013); Executive Vice President of OFI Global Asset Management, Inc. (January 2013-May 2013); Chief Investment Officer of OppenheimerFunds, Inc. (October 2010-December 2012); Chief Investment Officer, Fixed- Income, of OppenheimerFunds, Inc. (April 2009-October 2010); Executive Vice President of OppenheimerFunds, Inc. (October 2009-December 2012); Director of Fixed Income of OppenheimerFunds, Inc. (January 2009-April 2009); and a Senior Vice President of OppenheimerFunds, Inc. (March 1993-September 2009). An officer of 103 portfolios in the OppenheimerFunds complex. |
| | | |
| OTHER OFFICERS OF THE FUND | | The addresses of the Officers in the chart below are as follows: for Mr. Bhaman, Mss. Lo Bessette, Foxson and Picciotto, 225 Liberty Street, New York, New York 10281-1008, for Mr. Petersen, 6803 S. Tucson Way, Centennial, Colorado 80112-3924. Each Officer serves for an indefinite term or until his or her resignation, retirement, death or removal. |
| |
Rajeev Bhaman, Vice President (since 2004) Year of Birth: 1963 | | Director of Global Equities of the Sub-Adviser (since January 2013); Senior Vice President of the Sub-Adviser (since May 2006); Vice President of the Sub-Adviser (January 1997-May 2006). An officer of other portfolios in the OppenheimerFunds complex. |
| |
Cynthia Lo Bessette, Secretary and Chief Legal Officer (since 2016) Year of Birth: 1969 | | Executive Vice President, General Counsel and Secretary of the Manager (since February 2016); Chief Legal Officer of the Sub-Adviser and the Distributor (since February 2016); Vice President, General Counsel and Secretary of Oppenheimer Acquisition Corp. (since February 2016); General Counsel of OFI SteelPath, Inc., VTL Associates, LLC and Index Management Solutions, LLC (since February 2016); Chief Legal Officer of OFI Global Institutional, Inc., HarbourView Asset Management Corporation, OFI Global Trust Company, Oppenheimer Real Asset Management, Inc., OFI Private Investments Inc., Shareholder Services, Inc. and Trinity Investment Management Corporation (since February 2016); Senior Vice President and Deputy General Counsel (March 2015-February 2016) and Executive Vice President, Vice President, Corporate Counsel (February 2012-March 2015) and Deputy Chief Legal Officer (April 2013-March 2015) of Jennison Associates LLC; Assistant General Counsel (April 2008-September 2009) and Deputy General Counsel (October 2009-February 2012) of Lord Abbett & Co. LLC. An officer of 103 portfolios in the OppenheimerFunds complex. |
| |
Jennifer Foxson, Vice President and Chief Business Officer (since 2014) Year of Birth: 1969 | | Senior Vice President of OppenheimerFunds Distributor, Inc. (since June 2014); Vice President of OppenheimerFunds Distributor, Inc. (April 2006-June 2014); Vice President of the Sub-Adviser (January 1998-March 2006); Assistant Vice President of the Sub-Adviser (October 1991-December 1998). An officer of 103 portfolios in the OppenheimerFunds complex. |
28 OPPENHEIMER GLOBAL FUND/VA
| | |
| |
Mary Ann Picciotto, Chief Compliance Officer and Chief Anti-Money Laundering Officer (since 2014) Year of Birth: 1973 | | Senior Vice President and Chief Compliance Officer of the Manager (since March 2014); Chief Compliance Officer of the Sub- Adviser, OFI SteelPath, Inc., OFI Global Trust Company, OFI Global Institutional, Inc., Oppenheimer Real Asset Management, Inc., OFI Private Investments, Inc., Harborview Asset Management Corporation, Trinity Investment Management Corporation, and Shareholder Services, Inc. (since March 2014); Managing Director of Morgan Stanley Investment Management Inc. and certain of its various affiliated entities; Chief Compliance Officer of various Morgan Stanley Funds (May 2010-January 2014); Chief Compliance Officer of Morgan Stanley Investment Management Inc. (April 2007-January 2014). An officer of 103 portfolios in the OppenheimerFunds complex. |
| |
Brian S. Petersen, Treasurer and Principal Financial & Accounting Officer (since 2016) Year of Birth: 1970 | | Vice President of the Manager (since January 2013); Vice President of the Sub-Adviser (February 2007-December 2012); Assistant Vice President of the Sub-Adviser (August 2002-2007). An officer of 103 portfolios in the OppenheimerFunds complex. |
The Fund’s Statement of Additional Information contains additional information about the Fund’s Trustees and Officers and is available without charge, upon request, by calling 1.800.988.8287.
29 OPPENHEIMER GLOBAL FUND/VA
THIS PAGE INTENTIONALLY LEFT BLANK.
30 OPPENHEIMER GLOBAL FUND/VA
THIS PAGE INTENTIONALLY LEFT BLANK.
31 OPPENHEIMER GLOBAL FUND/VA
OPPENHEIMER GLOBAL FUND/VA
A Series of Oppenheimer Variable Account Funds
| | |
| Manager | | OFI Global Asset Management, Inc. |
| |
| Sub-Adviser | | OppenheimerFunds, Inc. |
| |
| Distributor | | OppenheimerFunds Distributor, Inc. |
| |
Transfer and
Shareholder
Servicing Agent | | OFI Global Asset Management, Inc. |
| |
| Sub-Transfer Agent | | Shareholder Services, Inc. |
| | DBA OppenheimerFunds Services |
| |
Independent
Registered
Public
Accounting
Firm | | KPMG LLP |
| |
| Legal Counsel | | Ropes & Gray LLP |
| |
| | Before investing in any of the Oppenheimer funds, investors should carefully consider a fund’s investment objectives, risks, charges and expenses. Fund prospectuses and summary prospectuses contain this and other information about the funds, and may be obtained by asking your financial advisor, or calling us at 1.800.988.8287. Read prospectuses and summary prospectuses carefully before investing. |
| |
| | © 2017 OppenheimerFunds, Inc. All rights reserved. Oppenheimer funds are distributed by OppenheimerFunds Distributor, Inc. |

| | | | |
| |  | | |
| | December 31, 2016 | | |
| | | Oppenheimer | | |
| | Main Street Fund®/VA | | Annual Report |
| | | A Series of Oppenheimer Variable Account Funds | | |
| | ANNUAL REPORT | | |
| | Listing of Top Holdings Fund Performance Discussion Financial Statements | | |
PORTFOLIO MANAGERS: Manind Govil, CFA, Benjamin Ram and Paul Larson
AVERAGE ANNUAL TOTAL RETURNS FOR THE PERIODS ENDED 12/31/16
| | | | | | | | | | | | | | | | |
| | | Inception
Date | | | 1-Year | | | 5-Year | | | 10-Year | |
Non-Service Shares | | | 7/5/95 | | | | 11.62% | | | | 14.48% | | | | 6.53 | % |
Service Shares | | | 7/13/00 | | | | 11.30 | | | | 14.19 | | | | 6.25 | |
S&P 500 Index | | | | | | | 11.96 | | | | 14.66 | | | | 6.95 | |
Performance data quoted represents past performance, which does not guarantee future results. The investment return and principal value of an investment in the Fund will fluctuate so that an investor’s shares, when redeemed, may be worth more or less than their original cost. Current performance may be lower or higher than the performance quoted. For performance data current to the most recent month end, call us at 1.800.988.8287. The Fund’s total returns should not be expected to be the same as the returns of other funds, whether or not both funds have the same portfolio managers and/or similar names. The Fund’s total returns include changes in share price and reinvested distributions but do not include the charges associated with the separate account products that offer this Fund. Such performance would have been lower if such charges were taken into account.
TOP HOLDINGS AND ALLOCATIONS
TOP TEN COMMON STOCK HOLDINGS
| | |
Apple, Inc. | | 5.6% |
Alphabet, Inc., Cl. C | | 4.6 |
General Electric Co. | | 3.5 |
Comcast Corp., Cl. A | | 3.4 |
Citigroup, Inc. | | 3.3 |
Chevron Corp. | | 2.8 |
Mondelez International, Inc., Cl. A | | 2.8 |
Berkshire Hathaway, Inc., Cl. B | | 2.8 |
PepsiCo, Inc. | | 2.6 |
CME Group, Inc., Cl. A | | 2.3 |
Portfolio holdings and allocations are subject to change. Percentages are as of December 31, 2016, and are based on net assets. For more current Fund holdings, please visit oppenheimerfunds.com.
SECTOR ALLOCATION
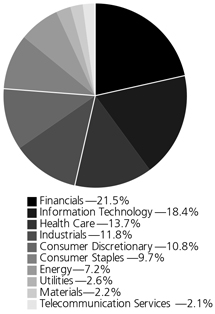
Portfolio holdings and allocations are subject to change. Percentages are as of December 31, 2016, and are based on the total market value of common stocks.
2 OPPENHEIMER MAIN STREET FUND/VA
Fund Performance Discussion
During the reporting period, the Fund’s Non-Service shares produced a return of 11.62%. In comparison, the S&P 500 Index (the “Index”) returned 11.96%. The Fund underperformed the Index in the information technology and energy sectors due mainly to stock selection, and in telecommunication services, as a result of an underweight and stock selection. The Fund outperformed the Index in financials, health care, consumer staples and utilities due to stock selection, while an overweight position in financials also helped.
While the absolute returns seen by the Index and the Fund were both moderately above long-term averages for 2016, roughly half of the return came in the final eight weeks of the year following the election. The Fund’s performance was consistent with our expectations. Namely, given our strategy and the types of higher-quality companies we invest in, we expect to underperform in “go-go” markets, mildly outperform when market returns are near long-term averages, and then materially outperform in bear markets. 2016 was roughly between the first two of these scenarios.
MARKET OVERVIEW
Markets were turbulent during the reporting period. However, despite the volatility, the Index and the Fund experienced gains, particularly after the November U.S. Presidential election. A large trend for the first half of 2016 was the demand for so-called “bond proxy stocks” with above average dividend yields. This trend was magnified post the Brexit vote as treasury yields, already at historic lows, were under further pressure and future interest rate hike expectations continued to be pushed further out. However, the market environment shifted over the fourth quarter of 2016, when the “risk-on” trade returned. This meant a sharp rebound in lower quality cyclicals, outperformance by smaller versus larger cap stocks, and a rotation away from defensive-oriented companies with more stable earnings and higher dividends. This theme continued through year end.
The one-year reporting period saw the market driven by several important macroeconomic trends and events:
| ● | | The U.S. election, which saw Republicans take the White House and maintain control of Congress. |
| | ● | | Given above, significant policy changes are expected surrounding taxation, cross-border trade, regulatory burdens, and healthcare. |
| | ● | | With these changes, a broad shift from monetary stimuli to inflationary fiscal stimuli. |
| ● | | Uncertainty over the pace of Federal Reserve interest rate hikes. |
| ● | | The U.S. dollar materially strengthening versus other currencies. |
| ● | | Continued slow, but steady recovery in domestic consumer employment, wages and consumption. |
| ● | | Continued impact of Brexit, and increased uncertainty for global markets as a result. |
| ● | | Competitive currency devaluations, including negative interest rates in a growing number of jurisdictions, thrusting the world economy into uncharted territory. |
As investors, it is important to know what is and what is not within one’s circle of competence. As such, we strive to keep the portfolio in an all-weather orientation. Whether rates, commodity prices, currencies or even whole economies go up or down, our goal is to have a portfolio that can out-perform no matter the environment.
If our strategy includes not making oversized macro factor bets, a reasonable question is, “What types of risks are you willing to take?” First, we believe identifying companies with sustainable competitive advantages (or economic moats, if you prefer), is squarely in the middle of our circle of competence.
Second, we believe we have the skills to identify company management teams that are likely to successfully execute on their plans. Lastly, correctly valuing stocks and seeing what expectations the market is pricing in is also within our skill set. It is not by accident that we weight the portfolio more heavily towards companies that we believe have structural competitive advantages and/or management teams that are executing (e.g. gaining market share, expanding profit margins), with at least reasonable stock valuations.
Allow us to use a metaphor. If managing the portfolio was like betting on horses, we’d readily admit that we cannot predict ahead of time the weather or track conditions. But we do believe we can find the strongest horses (advantaged business models), the best jockeys (executing management teams), and can see when the payoff odds are in our favor (positive expected returns). To offset our agnostic position on the conditions, we seek to have some horses in the stable that we believe will win no matter the weather. In short, it boils down to mostly stock selection. This approach has led to consistent positive alpha versus our peers over time.
3 OPPENHEIMER MAIN STREET FUND/VA
TOP INDIVIDUAL CONTRIBUTORS
Top contributors to performance this period included CME Group, Chevron and Comcast. Our overweight position in financials skews towards non-lender financials such as CME Group. The company performed well during the reporting period, and particularly after the U.S. Presidential election in November. Financials were the biggest winner after the election, as many believe the Trump administration will be more favorable to the sector, thanks to less regulation as well as implementing other policies favorable to both economic growth and interest rate increases, leading to net interest margin expansion. Chevron benefited from the sharp bounce off the oil price lows seen in the first quarter of 2016. Furthermore, Chevron’s attractive yield and more focused capital spending plans were rewarded by the market. Media and technology company Comcast reported strong earnings in October 2016. The summer Olympics helped drive growth at NBCUniversal.
TOP INDIVIDUAL DETRACTORS
The top detractors from performance included health care stocks Mylan, Express Scripts and Gilead Sciences. Shares of Mylan were impacted by questions over the pricing of EpiPen. Mylan’s CEO called out the supply chain, including pharmacy benefit managers (PBMs) such as Express Scripts, as to why the price of EpiPen has had significant price increases over the last few years. Express Scripts was also negatively impacted by concern regarding scrutiny over manufacturer rebates and transparency of the PBM business model. Gilead is a biopharmaceutical company primarily focused on development of drugs aimed at HIV/AIDS, liver disease, and serious cardiovascular and respiratory conditions. The stock was down with the biotech sector, and it also faced a new competitor within the Hepatitis C market — Merck’s Zepatier — which was approved at the end of January. We’ve since exited our position on pricing concerns in the Hepatitis C space.
STRATEGY & OUTLOOK
While bottom-up company research and stock selection continue to be central to our process and strategy, we do have some observations about the current environment. First, the upcoming change resulting from the elections are likely to be profound. While the exact forms of change that will take place are still speculation at this point, here are our base case expectations for what we believe will happen in the year ahead:
| ● | | Lower U.S. corporate tax rates (fewer companies re-domiciling outside the U.S., and maybe some companies coming back) |
| ● | | Offsetting the lower tax rates, fewer specialized deductions |
| ● | | Lower regulatory burdens |
| ● | | Greater fiscal stimulus, most notably infrastructure spending |
| ● | | Rhetoric around protectionism in many forms, including higher import tariffs |
While some of these changes—most notably tax rates—would directly lead to earnings growth in the near term, these changes do present some material risks that need to be considered. Supply chains today are highly globalized, and higher friction within global trade could lead to disruptions and higher costs for our companies. Moreover, other countries could easily create retaliatory protectionist policies of their own, reducing demand for U.S. exports and/or making life more difficult for overseas operations of our companies. Finally, deflation has been the bigger concern in recent years, but these policies are clearly swinging the pendulum toward higher inflation. In moderation, inflation is helpful, but we are mindful that sometimes the pendulum can swing too far.
At the moment, the U.S. economy continues its “slow and steady” growth. This is being driven by favorable employment, wage and inflation data while home prices and innovation also continue to help drive the economy higher.
U.S. corporate revenues, earnings, and free cash flow have resumed their moderate growth. The post-election strength in U.S. equity markets and the return of the “risk on trade” indicates that consensus expects earnings growth to accelerate further in the quarters ahead.
We continue to be laser-focused on the rise in “accounting shenanigans” and the rising spread between GAAP earnings and pro-forma adjusted earnings. This, combined with ongoing financial engineering, e.g., tax inversions and other obfuscations, have caused us to place increasing emphasis on judging the attractiveness of an investment based on free cash flow, rather than earnings.
While interest rates have increased in recent months, they are still very low relative to historical standards. Current capital allocation is fueled by this environment of ongoing relatively low interest rates. We believe the risks inherent to this market include the misallocation of capital if interest rates were to rise materially. We intend to maintain our discipline around valuation. Additionally, while innovation is alive and well and continuing to help generate economic growth, fundamental disruptions across market segments have been elevated. We continue to be focused on potential disruption risk to our companies.
4 OPPENHEIMER MAIN STREET FUND/VA
We expect heightened uncertainty to return in the equity markets. Traditionally, during periods of economic uncertainty and heightened market volatility, investors favor stocks of higher quality companies—with greater consistency and stability of revenue and earnings— leading to relatively better stock performance of those companies. We think focusing on companies with economic moats and skilled management teams positions us well, should this environment come to pass. During times of economic volatility such companies frequently widen their lead over weaker competitors. We seek to invest in companies, characterized by these qualities, at compelling valuations and believe this disciplined approach is essential to generating superior long-term performance.
Investors should consider the Fund’s investment objective, risks, charges and expenses carefully before investing. The Fund’s prospectus and summary prospectus contain this and other information about the Fund, and may be obtained by asking your financial advisor or calling us at 1.800.988.8287. Read prospectuses and summary prospectuses carefully before investing.
Total returns include changes in share price and reinvestment of dividends and capital gains distributions in a hypothetical investment for the periods shown, but do not include the charges associated with the separate account products that offer this Fund.
The Fund’s investment strategy and focus can change over time. The mention of specific fund holdings does not constitute a recommendation by OppenheimerFunds, Inc. or its affiliates.
Shares of Oppenheimer funds are not deposits or obligations of any bank, are not guaranteed by any bank, are not insured by the FDIC or any other agency, and involve investment risks, including the possible loss of the principal amount invested.
Comparing the Fund’s Performance to the Market. The graphs that follow show the performance of a hypothetical $10,000 investment in each share class of the Fund held until December 31, 2016. Performance is measured over a ten-fiscal-year period for both Classes. Performance information does not reflect charges that apply to separate accounts investing in the Fund. If these charges were taken into account, performance would be lower. The graphs assume that all dividends and capital gains distributions were reinvested in additional shares.
The S&P 500 Index is a broad-based measure of domestic stock performance. The Index is unmanaged and cannot be purchased directly by investors. While index comparisons may be useful to provide a benchmark for the Fund’s performance, it must be noted that the Fund’s investments are not limited to the investments comprising the Index. Index performance includes reinvestment of income, but does not reflect transaction costs, fees, expenses or taxes. Index performance is shown for illustrative purposes only as a benchmark for the Fund’s performance, and does not predict or depict performance of the Fund. The Fund’s performance reflects the effects of the Fund’s business and operating expenses.
5 OPPENHEIMER MAIN STREET FUND/VA
COMPARISON OF CHANGE IN VALUE OF $10,000 HYPOTHETICAL INVESTMENTS IN:
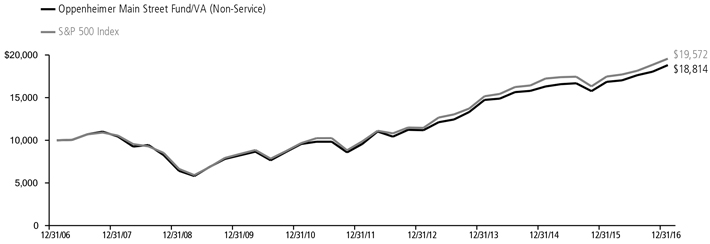
COMPARISON OF CHANGE IN VALUE OF $10,000 HYPOTHETICAL INVESTMENTS IN:
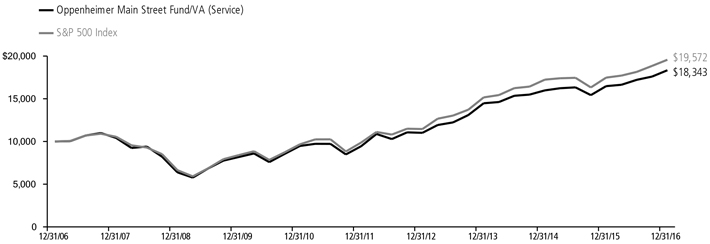
The performance data quoted represents past performance, which does not guarantee future results. The investment return and principal value of an investment in the Fund will fluctuate so that an investor’s shares, when redeemed, may be worth more or less than their original cost. Current performance may be lower or higher than the performance quoted. For performance data current to the most recent month end, call us at 1.800.988.8287. The Fund’s total returns should not be expected to be the same as the returns of other funds, whether or not both funds have the same portfolio managers and/or similar names. The Fund’s total returns include changes in share price and reinvested distributions but do not include the charges associated with the separate account products that offer this Fund. Such performance would have been lower if such charges were taken into account.
6 OPPENHEIMER MAIN STREET FUND/VA
Fund Expenses
Fund Expenses. As a shareholder of the Fund, you incur two types of costs: (1) transaction costs and (2) ongoing costs, including management fees; distribution and service fees; and other Fund expenses. These examples are intended to help you understand your ongoing costs (in dollars) of investing in the Fund and to compare these costs with the ongoing costs of investing in other mutual funds.
The examples are based on an investment of $1,000.00 invested at the beginning of the period and held for the entire 6-month period ended December 31, 2016.
Actual Expenses. The first section of the table provides information about actual account values and actual expenses. You may use the information in this section for the class of shares you hold, together with the amount you invested, to estimate the expense that you paid over the period. Simply divide your account value by $1,000.00 (for example, an $8,600.00 account value divided by $1,000.00 = 8.60), then multiply the result by the number in the first section under the heading entitled “Expenses Paid During 6 Months Ended December 31, 2016” to estimate the expenses you paid on your account during this period.
Hypothetical Example for Comparison Purposes.
The second section of the table provides information about hypothetical account values and hypothetical expenses based on the Fund’s actual expense ratio for each class of shares, and an assumed rate of return of 5% per year for each class before expenses, which is not the actual return. The hypothetical account values and expenses may not be used to estimate the actual ending account balance or expenses you paid for the period. You may use this information to compare the ongoing costs of investing in the Fund and other funds. To do so, compare this 5% hypothetical example for the class of shares you hold with the 5% hypothetical examples that appear in the shareholder reports of the other funds.
Please note that the expenses shown in the table are meant to highlight your ongoing costs only and do not reflect any charges associated with the separate accounts that offer this Fund. Therefore, the “hypothetical” lines of the table are useful in comparing ongoing costs only, and will not help you determine the relative total costs of owning different funds. In addition, if these separate account charges were included your costs would have been higher.
| | | | | | | | | | | | | | | | |
| Actual | | Beginning Account Value July 1, 2016 | | | Ending Account Value
December 31, 2016 | | | Expenses Paid During 6 Months Ended
December 31, 2016 | |
Non-Service shares | | $ | 1,000.00 | | | $ | 1,066.90 | | | $ | 4.11 | | | | | |
Service shares | | | 1,000.00 | | | | 1,065.20 | | | | 5.41 | | | | | |
| | | | |
| Hypothetical | | | | | | | | | | | | |
(5% return before expenses) | | | | | | | | | | | | |
Non-Service shares | | | 1,000.00 | | | | 1,021.17 | | | | 4.02 | | | | | |
Service shares | | | 1,000.00 | | | | 1,019.91 | | | | 5.29 | | | | | |
Expenses are equal to the Fund’s annualized expense ratio for that class, multiplied by the average account value over the period, multiplied by 184/366 (to reflect the one-half year period). Those annualized expense ratios, excluding indirect expenses from affiliated funds, based on the 6-month period ended December 31, 2016 are as follows:
| | | | | | | | |
| Class | | Expense Ratios | | | | |
Non-Service shares | | | 0.79% | | | | | |
Service shares | | | 1.04 | | | | | |
The expense ratios reflect voluntary and/or contractual waivers and/or reimbursements of expenses by the Fund’s Manager. Some of these undertakings may be modified or terminated at any time, as indicated in the Fund’s prospectus. The “Financial Highlights” tables in the Fund’s financial statements, included in this report, also show the gross expense ratios, without such waivers or reimbursements and reduction to custodian expenses, if applicable.
7 OPPENHEIMER MAIN STREET FUND/VA
STATEMENT OF INVESTMENTS December 31, 2016
| | | | | | | | |
| | | Shares | | | Value | |
| |
Common Stocks—99.1% | | | | | | | | |
| |
| Consumer Discretionary—10.7% | | | | | | | | |
| |
| Auto Components—0.7% | | | | | | | | |
| |
| Adient plc1 | | | 31,222 | | | $ | 1,829,609 | |
| |
| Delphi Automotive plc | | | 105,800 | | | | 7,125,630 | |
| | | | | | | | |
| | | | | | | 8,955,239 | |
| |
| Hotels, Restaurants & Leisure—1.9% | |
| |
| McDonald’s Corp. | | | 195,420 | | | | 23,786,523 | |
| |
| Household Durables—1.0% | | | | | | | | |
| |
| Whirlpool Corp. | | | 71,430 | | | | 12,983,831 | |
| |
| Internet & Catalog Retail—0.7% | | | | | | | | |
| |
| Amazon.com, Inc.1 | | | 10,890 | | | | 8,166,084 | |
| |
| Media—3.4% | | | | | | | | |
| |
| Comcast Corp., Cl. A | | | 620,205 | | | | 42,825,155 | |
| |
| Specialty Retail—3.0% | | | | | | | | |
| |
| AutoZone, Inc.1 | | | 17,830 | | | | 14,081,956 | |
| |
| Home Depot, Inc. (The) | | | 174,317 | | | | 23,372,423 | |
| | | | | | | | |
| | | | | | | 37,454,379 | |
| |
| Consumer Staples—9.6% | | | | | | | | |
| |
| Beverages—2.6% | | | | | | | | |
| |
| PepsiCo, Inc. | | | 309,310 | | | | 32,363,105 | |
| |
| Food Products—5.0% | | | | | | | | |
| |
| Kraft Heinz Co. (The) | | | 313,130 | | | | 27,342,512 | |
| |
| Mondelez International, Inc., Cl. A | | | 798,480 | | | | 35,396,618 | |
| | | | | | | | |
| | | | | | | 62,739,130 | |
| |
| Tobacco—2.0% | | | | | | | | |
| |
| Philip Morris International, Inc. | | | 277,489 | | | | 25,387,469 | |
| |
| Energy—7.2% | | | | | | | | |
| |
| Oil, Gas & Consumable Fuels—7.2% | |
| |
| Chevron Corp. | | | 301,747 | | | | 35,515,622 | |
| |
| HollyFrontier Corp. | | | 233,635 | | | | 7,653,882 | |
| |
| Magellan Midstream Partners LP2 | | | 213,290 | | | | 16,131,123 | |
| |
| Noble Energy, Inc. | | | 307,463 | | | | 11,702,042 | |
| |
| Suncor Energy, Inc. | | | 589,240 | | | | 19,262,256 | |
| | | | | | | | |
| | | | | | | 90,264,925 | |
| |
| Financials—21.3% | | | | | | | | |
| |
| Capital Markets—4.6% | | | | | | | | |
| |
| Bank of New York Mellon Corp. (The) | | | 422,000 | | | | 19,994,360 | |
| |
| CME Group, Inc., Cl. A | | | 255,410 | | | | 29,461,544 | |
| |
| S&P Global, Inc. | | | 80,311 | | | | 8,636,645 | |
| | | | | | | | |
| | | | | | | 58,092,549 | |
| |
| Commercial Banks—6.1% | | | | | | | | |
| |
| Citigroup, Inc. | | | 701,598 | | | | 41,695,969 | |
| |
| SunTrust Banks, Inc. | | | 330,610 | | | | 18,133,959 | |
| |
| US Bancorp | | | 323,560 | | | | 16,621,277 | |
| | | | | | | | |
| | | | | | | 76,451,205 | |
| |
| Consumer Finance—3.1% | | | | | | | | |
| |
| American Express Co. | | | 238,820 | | | | 17,691,785 | |
| |
| Discover Financial Services | | | 293,963 | | | | 21,191,793 | |
| | | | | | | | |
| | | | | | | 38,883,578 | |
| |
| Diversified Financial Services—2.8% | |
| |
| Berkshire Hathaway, Inc., Cl. B1 | | | 216,740 | | | | 35,324,285 | |
| |
| Insurance—3.3% | | | | | | | | |
| |
| Marsh & McLennan Cos., Inc. | | | 126,110 | | | | 8,523,775 | |
| |
| MetLife, Inc. | | | 323,610 | | | | 17,439,343 | |
| |
| Progressive Corp. (The) | | | 450,150 | | | | 15,980,325 | |
| | | | | | | | |
| | | | | | | 41,943,443 | |
| |
| Real Estate Investment Trusts (REITs)—1.4% | |
| |
| Mid-America Apartment Communities, Inc. | | | 97,690 | | | | 9,565,805 | |
| |
| Simon Property Group, Inc. | | | 42,420 | | | | 7,536,761 | |
| | | | | | | | |
| | | | | | | 17,102,566 | |
| | | | | | | | |
| | | Shares | | | Value | |
| |
| Health Care—13.6% | | | | | | | | |
| |
| Biotechnology—1.0% | | | | | | | | |
| |
| Celgene Corp.1 | | | 111,710 | | | $ | �� 12,930,433 | |
| |
| Health Care Equipment & Supplies—2.3% | |
| |
| Boston Scientific Corp.1 | | | 617,510 | | | | 13,356,742 | |
| |
| Stryker Corp. | | | 130,330 | | | | 15,614,837 | |
| | | | | | | | |
| | | | | | | 28,971,579 | |
| |
| Health Care Providers & Services—4.4% | |
| |
| Express Scripts Holding Co.1 | | | 319,107 | | | | 21,951,371 | |
| |
| Humana, Inc. | | | 46,850 | | | | 9,558,805 | |
| |
| UnitedHealth Group, Inc. | | | 151,700 | | | | 24,278,068 | |
| | | | | | | | |
| | | | | | | 55,788,244 | |
| |
| Health Care Technology—0.6% | |
| |
| Cerner Corp.1 | | | 148,490 | | | | 7,033,971 | |
| |
| Life Sciences Tools & Services—0.7% | |
| |
| Agilent Technologies, Inc. | | | 185,250 | | | | 8,439,990 | |
| |
| Pharmaceuticals—4.6% | | | | | | | | |
| |
| Johnson & Johnson | | | 190,770 | | | | 21,978,612 | |
| |
| Merck & Co., Inc. | | | 408,900 | | | | 24,071,943 | |
| |
| Mylan NV1 | | | 237,060 | | | | 9,043,839 | |
| |
| Valeant Pharmaceuticals International, Inc.1 | | | 223,520 | | | | 3,245,510 | |
| | | | | | | | |
| | | | | | | 58,339,904 | |
| |
| Industrials—11.7% | | | | | | | | |
| |
| Aerospace & Defense—1.9% | | | | | | | | |
| |
| Lockheed Martin Corp. | | | 49,450 | | | | 12,359,533 | |
| |
| United Technologies Corp. | | | 105,040 | | | | 11,514,485 | |
| | | | | | | | |
| | | | | | | 23,874,018 | |
| |
| Commercial Services & Supplies—2.0% | |
| |
| Johnson Controls International plc | | | 312,195 | | | | 12,859,312 | |
| |
| Republic Services, Inc., Cl. A | | | 77,360 | | | | 4,413,388 | |
| |
| Waste Connections, Inc. | | | 98,495 | | | | 7,740,722 | |
| | | | | | | | |
| | | | | | | 25,013,422 | |
| |
| Industrial Conglomerates—3.5% | | | | | | | | |
| |
| General Electric Co. | | | 1,400,220 | | | | 44,246,952 | |
| |
| Machinery—1.3% | | | | | | | | |
| |
| Deere & Co. | | | 161,860 | | | | 16,678,054 | |
| |
| Professional Services—1.0% | | | | | | | | |
| |
| Nielsen Holdings plc | | | 295,900 | | | | 12,413,005 | |
| |
| Road & Rail—2.0% | | | | | | | | |
| |
| Canadian National Railway Co. | | | 163,000 | | | | 10,986,200 | |
| |
| Canadian Pacific Railway Ltd. | | | 102,100 | | | | 14,576,817 | |
| | | | | | | | |
| | | | | | | 25,563,017 | |
| |
| Information Technology—18.2% | |
| |
| Communications Equipment—1.2% | |
| |
| Cisco Systems, Inc. | | | 493,450 | | | | 14,912,059 | |
| |
| Internet Software & Services—6.5% | |
| |
| Alphabet, Inc., Cl. C1 | | | 74,967 | | | | 57,861,030 | |
| |
| Facebook, Inc., Cl. A1 | | | 207,380 | | | | 23,859,069 | |
| | | | | | | | |
| | | | | | | 81,720,099 | |
| |
| IT Services—3.0% | | | | | | | | |
| |
| Amdocs Ltd. | | | 351,720 | | | | 20,487,690 | |
| |
| PayPal Holdings, Inc.1 | | | 317,390 | | | | 12,527,383 | |
| |
| Xerox Corp. | | | 623,927 | | | | 5,446,883 | |
| | | | | | | | |
| | | | | | | 38,461,956 | |
| |
| Semiconductors & Semiconductor Equipment—0.9% | |
| |
| Applied Materials, Inc. | | | 357,080 | | | | 11,522,972 | |
| |
| Technology Hardware, Storage & Peripherals—6.6% | |
| |
| Apple, Inc. | | | 608,066 | | | | 70,426,204 | |
| |
| Western Digital Corp. | | | 182,060 | | | | 12,370,977 | |
| | | | | | | | |
| | | | | | | 82,797,181 | |
8 OPPENHEIMER MAIN STREET FUND/VA
| | | | | | | | |
| | | Shares | | | Value | |
| |
| Materials—2.2% | | | | | | | | |
| |
| Chemicals—1.5% | | | | | | | | |
| |
| EI du Pont de Nemours & Co. | | | 118,210 | | | | $ 8,676,614 | |
| |
| PPG Industries, Inc. | | | 99,860 | | | | 9,462,734 | |
| | | | | | | | |
| | | | | | | 18,139,348 | |
| |
| Construction Materials—0.7% | | | | | | | | |
| |
| Vulcan Materials Co. | | | 72,830 | | | | 9,114,674 | |
| |
| Telecommunication Services—2.0% | | | | | | | | |
| |
| Diversified Telecommunication Services—2.0% | |
| |
| Verizon Communications, Inc. | | | 485,600 | | | | 25,921,328 | |
| |
| Utilities—2.6% | | | | | | | | |
| |
| Electric Utilities—2.1% | | | | | | | | |
| |
| PG&E Corp. | | | 424,570 | | | | 25,801,119 | |
| | | | | | | | |
| | | Shares | | | Value | |
| |
| Multi-Utilities—0.5% | | | | | | | | |
| |
| National Grid plc | | | 554,760 | | | $ | 6,488,105 | |
| | | | | | | | |
| Total Common Stocks (Cost $895,871,088) | | | | | | | 1,246,894,896 | |
|
| | |
| |
| |
Investment Company—0.9% | | | | | | | | |
| |
| Oppenheimer Institutional Government Money Market Fund, Cl. E, 0.43%3,4 (Cost $11,146,627) | | | 11,146,627 | | | | 11,146,627 | |
| |
Total Investments, at Value
(Cost $907,017,715) | | | 100.0% | | | | 1,258,041,523 | |
| | | | |
| Net Other Assets (Liabilities) | | | 0.0 | | | | (251,101) | |
| | | | |
| Net Assets | | | 100.0% | | | $ | 1,257,790,422 | |
| | | | |
Footnotes to Statement of Investments
1. Non-income producing security.
2. Security is a Master Limited Partnership.
3. Rate shown is the 7-day yield at period end.
4. Is or was an affiliate, as defined in the Investment Company Act of 1940, as amended, at or during the reporting period, by virtue of the Fund owning at least 5% of the voting securities of the issuer or as a result of the Fund and the issuer having the same investment adviser. Transactions during the reporting period in which the issuer was an affiliate are as follows:
| | | | | | | | | | | | | | | | |
| | | Shares
December 31, 2015 | | | Gross
Additions | | | Gross Reductions | | | Shares
December 31, 2016 | |
| |
| Oppenheimer Institutional Government Money Market Fund, Cl. Ea | | | 18,174,708 | | | | 262,220,352 | | | | 269,248,433 | | | | 11,146,627 | |
| | | | |
| | | | | | | | | Value | | | Income | |
| |
| Oppenheimer Institutional Government Money Market Fund, Cl. Ea | | | | | | | | | | $ | 11,146,627 | | | $ | 92,718 | |
a. Prior to September 28, 2016, this fund was named Oppenheimer Institutional Money Market Fund.
See accompanying Notes to Financial Statements.
9 OPPENHEIMER MAIN STREET FUND/VA
STATEMENT OF ASSETS AND LIABILITIES December 31, 2016
| | | | |
| |
Assets | | | | |
| Investments, at value—see accompanying statement of investments: | | | | |
| Unaffiliated companies (cost $895,871,088) | | | $ 1,246,894,896 | |
| Affiliated companies (cost $11,146,627) | | | 11,146,627 | |
| | | | |
| | | 1,258,041,523 | |
| |
| Cash | | | 750,904 | |
| |
| Receivables and other assets: | | | | |
| Dividends | | | 3,193,853 | |
| Shares of beneficial interest sold | | | 335,228 | |
| Other | | | 97,418 | |
| | | | |
Total assets | | | 1,262,418,926 | |
| |
Liabilities | | | | |
| Payables and other liabilities: | | | | |
| Investments purchased | | | 3,401,028 | |
| Shares of beneficial interest redeemed | | | 908,283 | |
| Distribution and service plan fees | | | 165,308 | |
| Trustees’ compensation | | | 91,668 | |
| Shareholder communications | | | 33,603 | |
| Other | | | 28,614 | |
| | | | |
| Total liabilities | | | 4,628,504 | |
| |
| Net Assets | | | $ 1,257,790,422 | |
| | | | |
|
| |
Composition of Net Assets | | | | |
| Par value of shares of beneficial interest | | | $ 44,550 | |
| |
| Additional paid-in capital | | | 871,876,424 | |
| |
| Accumulated net investment income | | | 12,234,256 | |
| |
| Accumulated net realized gain on investments and foreign currency transactions | | | 22,629,061 | |
| |
| Net unrealized appreciation on investments and translation of assets and liabilities denominated in foreign currencies | | | 351,006,131 | |
| | | | |
| Net Assets | | | $ 1,257,790,422 | |
| | | | |
|
| |
Net Asset Value Per Share | | | | |
| Non-Service Shares: | | | | |
| Net asset value, redemption price per share and offering price per share (based on net assets of $485,195,969 and 17,080,300 shares of beneficial interest outstanding) | | | $28.41 | |
| |
Service Shares: | | | | |
| Net asset value, redemption price per share and offering price per share (based on net assets of $772,594,453 and 27,470,151 shares of beneficial interest outstanding) | | | $28.12 | |
See accompanying Notes to Financial Statements.
10 OPPENHEIMER MAIN STREET FUND/VA
STATEMENT OF OPERATIONS For the Year Ended December 31, 2016
| | | | |
| |
Investment Income | | | | |
Dividends: | | | | |
| Unaffiliated companies (net of foreign withholding taxes of $135,097) | | $ | 24,041,072 | |
Affiliated companies | | | 92,718 | |
| |
Interest | | | 44 | |
| | | | |
Total investment income | | | 24,133,834 | |
| |
Expenses | | | | |
Management fees | | | 8,166,529 | |
| |
Distribution and service plan fees - Service shares | | | 1,813,561 | |
| |
Transfer and shareholder servicing agent fees: | | | | |
| Non-Service shares | | | 502,660 | |
Service shares | | | 726,052 | |
| |
| Shareholder communications: | | | | |
Non-Service shares | | | 55,998 | |
Service shares | | | 81,628 | |
| |
Trustees’ compensation | | | 47,929 | |
| |
Borrowing fees | | | 22,097 | |
| |
Custodian fees and expenses | | | 7,394 | |
| |
Other | | | 96,363 | |
| | | | |
Total expenses | | | 11,520,211 | |
Less reduction to custodian expenses | | | (409) | |
Less waivers and reimbursements of expenses | | | (22,543) | |
| | | | |
Net expenses | | | 11,497,259 | |
| |
Net Investment Income | | | 12,636,575 | |
| |
Realized and Unrealized Gain | | | | |
Net realized gain on: | | | | |
Investment transactions in unaffiliated companies | | | 29,425,614 | |
Foreign currency transactions | | | 12,591 | |
| | | | |
Net realized gain | | | 29,438,205 | |
| |
| Net change in unrealized appreciation/depreciation on: | | | | |
Investment transactions | | | 88,753,320 | |
Translation of assets and liabilities denominated in foreign currencies | | | (3,669) | |
| | | | |
Net change in unrealized appreciation/depreciation | | | 88,749,651 | |
| |
Net Increase in Net Assets Resulting from Operations | | $ | 130,824,431 | |
| | | | |
See accompanying Notes to Financial Statements.
11 OPPENHEIMER MAIN STREET FUND/VA
STATEMENTS OF CHANGES IN NET ASSETS
| | | | | | | | |
| | | Year Ended | | | Year Ended | |
| | | December 31, 2016 | | | December 31, 2015 | |
| |
Operations | | | | | | | | |
| Net investment income | | $ | 12,636,575 | | | $ | 11,743,405 | |
| |
| Net realized gain | | | 29,438,205 | | | | 162,442,794 | |
| |
| Net change in unrealized appreciation/depreciation | | | 88,749,651 | | | | (133,007,686) | |
| | | | |
Net increase in net assets resulting from operations | | | 130,824,431 | | | | 41,178,513 | |
| |
Dividends and/or Distributions to Shareholders | | | | | | | | |
| Dividends from net investment income: | | | | | | | | |
| Non-Service shares | | | (5,704,267) | | | | (5,010,080) | |
| Service shares | | | (6,065,396) | | | | (4,935,637) | |
| | | | |
| | | (11,769,663) | | | | (9,945,717) | |
| |
| Distributions from net realized gain: | | | | | | | | |
| Non-Service shares | | | (60,632,295) | | | | (81,805,950) | |
| Service shares | | | (84,601,632) | | | | (115,456,402) | |
| | | | |
| | | (145,233,927) | | | | (197,262,352) | |
| |
Beneficial Interest Transactions | | | | | | | | |
| Net increase (decrease) in net assets resulting from beneficial interest transactions: | | | | | | | | |
| Non-Service shares | | | (20,488,952) | | | | 27,294,558 | |
| Service shares | | | 70,674,306 | | | | 6,563,579 | |
| | | | |
| | | 50,185,354 | | | | 33,858,137 | |
| |
Net Assets | | | | | | | | |
| Total increase (decrease) | | | 24,006,195 | | | | (132,171,419) | |
| |
| Beginning of period | | | 1,233,784,227 | | | | 1,365,955,646 | |
| | | | |
| End of period (including accumulated net investment income of $12,234,256 and $11,585,433, respectively) | | $ | 1,257,790,422 | | | $ | 1,233,784,227 | |
| | | | |
See accompanying Notes to Financial Statements.
12 OPPENHEIMER MAIN STREET FUND/VA
FINANCIAL HIGHLIGHTS
| | | | | | | | | | | | | | | | | | |
| Non-Service Shares | | Year Ended
December 31,
2016 | | | Year Ended
December 31,
2015 | | | Year Ended
December 31,
2014 | | | Year Ended
December 31,
2013 | | | Year Ended
December 31,
2012 |
|
Per Share Operating Data |
| Net asset value, beginning of period | | | $29.24 | | | | $33.61 | | | | $31.24 | | | | $23.97 | | | $20.71 |
|
| Income (loss) from investment operations: | | | | | | | | | | | | | | | | | | |
| Net investment income1 | | | 0.33 | | | | 0.33 | | | | 0.28 | | | | 0.24 | | | 0.26 |
| Net realized and unrealized gain | | | 2.76 | | | | 0.80 | | | | 3.01 | | | | 7.33 | | | 3.22 |
| | | |
| Total from investment operations | | | 3.09 | | | | 1.13 | | | | 3.29 | | | | 7.57 | | | 3.48 |
|
| Dividends and/or distributions to shareholders: | | | | | | | | | | | | | | | | | | |
| Dividends from net investment income | | | (0.34) | | | | (0.32) | | | | (0.27) | | | | (0.30) | | | (0.22) |
| Distributions from net realized gain | | | (3.58) | | | | (5.18) | | | | (0.65) | | | | 0.00 | | | 0.00 |
| | | |
| Total dividends and/or distributions to shareholders | | | (3.92) | | | | (5.50) | | | | (0.92) | | | | (0.30) | | | (0.22) |
|
| Net asset value, end of period | | | $28.41 | | | | $29.24 | | | | $33.61 | | | | $31.24 | | | $23.97 |
| | | |
| | | | | | | | | | | | | | | | | | |
|
Total Return, at Net Asset Value2 | | | 11.62% | | | | 3.33% | | | | 10.70% | | | | 31.77% | | | 16.87% |
| | | | | | | | | | | | | | | | | | |
|
Ratios/Supplemental Data | | | | | | | | | | | | | | | | | | |
| Net assets, end of period (in thousands) | | | $485,196 | | | | $518,456 | | | | $559,933 | | | | $561,016 | | | $481,089 |
|
| Average net assets (in thousands) | | | $502,522 | | | | $541,020 | | | | $554,449 | | | | $517,750 | | | $466,231 |
|
| Ratios to average net assets:3 | | | | | | | | | | | | | | | | | | |
| Net investment income | | | 1.16% | | | | 1.05% | | | | 0.86% | | | | 0.87% | | | 1.12% |
| Expenses excluding specific expenses listed below | | | 0.79% | | | | 0.78% | | | | 0.77% | | | | 0.78% | | | 0.78% |
| Interest and fees from borrowings | | | 0.00%4 | | | | 0.00%4 | | | | 0.00% | | | | 0.00% | | | 0.00% |
| | | |
| Total expenses5 | | | 0.79% | | | | 0.78% | | | | 0.77% | | | | 0.78% | | | 0.78% |
| Expenses after payments, waivers and/or reimbursements and reduction to custodian expenses | | | 0.79%6 | | | | 0.78%6 | | | | 0.77%6 | | | | 0.78%6 | | | 0.78%6 |
|
| Portfolio turnover rate | | | 33% | | | | 44% | | | | 43% | | | | 49% | | | 37% |
1. Per share amounts calculated based on the average shares outstanding during the period.
2. Assumes an initial investment on the business day before the first day of the fiscal period, with all dividends and distributions reinvested in additional shares on the reinvestment date, and redemption at the net asset value calculated on the last business day of the fiscal period. Total returns are not annualized for periods less than one full year. Total return information does not reflect expenses that apply at the separate account level or to related insurance products. Inclusion of these charges would reduce the total return figures for all periods shown. Returns do not reflect the deduction of taxes that a shareholder would pay on fund distributions or the redemption of fund shares.
3. Annualized for periods less than one full year.
4. Less than 0.005%.
5. Total expenses including indirect expenses from affiliated fund fees and expenses were as follows:
| | | | |
| |
Year Ended December 31, 2016 | | | 0.79 | % |
Year Ended December 31, 2015 | | | 0.78 | % |
Year Ended December 31, 2014 | | | 0.77 | % |
Year Ended December 31, 2013 | | | 0.78 | % |
Year Ended December 31, 2012 | | | 0.78 | % |
6. Waiver was less than 0.005%.
See accompanying Notes to Financial Statements.
13 OPPENHEIMER MAIN STREET FUND/VA
FINANCIAL HIGHLIGHTS Continued
| | | | | | | | | | | | | | | | | | | | |
Service Shares | |
| Year Ended
December 31,
2016 |
| |
| Year Ended
December 31,
2015 |
| |
| Year Ended
December 31,
2014 |
| |
| Year Ended
December 31,
2013 |
| |
| Year Ended
December 31,
2012 |
|
| |
Per Share Operating Data | | | | | | | | | | | | | | | | | | | | |
Net asset value, beginning of period | | | $28.98 | | | | $33.33 | | | | $30.99 | | | | $23.78 | | | | $20.53 | |
| |
Income (loss) from investment operations: | | | | | | | | | | | | | | | | | | | | |
Net investment income1 | | | 0.26 | | | | 0.25 | | | | 0.19 | | | | 0.17 | | | | 0.20 | |
Net realized and unrealized gain | | | 2.72 | | | | 0.80 | | | | 2.99 | | | | 7.27 | | | | 3.20 | |
| | | | |
| Total from investment operations | | | 2.98 | | | | 1.05 | | | | 3.18 | | | | 7.44 | | | | 3.40 | |
| |
Dividends and/or distributions to shareholders: | | | | | | | | | | | | | | | | | | | | |
Dividends from net investment income | | | (0.26) | | | | (0.22) | | | | (0.19) | | | | (0.23) | | | | (0.15) | |
Distributions from net realized gain | | | (3.58) | | | | (5.18) | | | | (0.65) | | | | 0.00 | | | | 0.00 | |
| | | | |
Total dividends and/or distributions to shareholders | | | (3.84) | | | | (5.40) | | | | (0.84) | | | | (0.23) | | | | (0.15) | |
| |
Net asset value, end of period | | | $28.12 | | | | $28.98 | | | | $33.33 | | | | $30.99 | | | | $23.78 | |
| | | | |
|
| |
Total Return, at Net Asset Value2 | | | 11.30% | | | | 3.11% | | | | 10.40% | | | | 31.44% | | | | 16.61% | |
|
| |
Ratios/Supplemental Data | | | | | | | | | | | | | | | | | | | | |
Net assets, end of period (in thousands) | | | $772,594 | | | | $715,328 | | | | $806,023 | | | | $915,027 | | | | $869,372 | |
| |
Average net assets (in thousands) | | | $725,836 | | | | $757,218 | | | | $856,467 | | | | $895,073 | | | | $913,871 | |
| |
Ratios to average net assets:3 | | | | | | | | | | | | | | | | | | | | |
Net investment income | | | 0.94% | | | | 0.80% | | | | 0.61% | | | | 0.62% | | | | 0.85% | |
Expenses excluding specific expenses listed below | | | 1.04% | | | | 1.03% | | | | 1.02% | | | | 1.04% | | | | 1.03% | |
Interest and fees from borrowings | | | 0.00%4 | | | | 0.00%4 | | | | 0.00% | | | | 0.00% | | | | 0.00% | |
| | | | |
Total expenses5 | | | 1.04% | | | | 1.03% | | | | 1.02% | | | | 1.04% | | | | 1.03% | |
| Expenses after payments, waivers and/or reimbursements and reduction to custodian expenses | | | 1.04%6 | | | | 1.03%6 | | | | 1.02%6 | | | | 1.04%6 | | | | 1.03%6 | |
| |
Portfolio turnover rate | | | 33% | | | | 44% | | | | 43% | | | | 49% | | | | 37% | |
1. Per share amounts calculated based on the average shares outstanding during the period.
2. Assumes an initial investment on the business day before the first day of the fiscal period, with all dividends and distributions reinvested in additional shares on the reinvestment date, and redemption at the net asset value calculated on the last business day of the fiscal period. Total returns are not annualized for periods less than one full year. Total return information does not reflect expenses that apply at the separate account level or to related insurance products. Inclusion of these charges would reduce the total return figures for all periods shown. Returns do not reflect the deduction of taxes that a shareholder would pay on fund distributions or the redemption of fund shares.
3. Annualized for periods less than one full year.
4. Less than 0.005%.
5. Total expenses including indirect expenses from affiliated fund fees and expenses were as follows:
| | | | |
Year Ended December 31, 2016 | | | 1.04 | % |
Year Ended December 31, 2015 | | | 1.03 | % |
Year Ended December 31, 2014 | | | 1.02 | % |
Year Ended December 31, 2013 | | | 1.04 | % |
Year Ended December 31, 2012 | | | 1.03 | % |
6. Waiver was less than 0.005%.
See accompanying Notes to Financial Statements.
14 OPPENHEIMER MAIN STREET FUND/VA
NOTES TO FINANCIAL STATEMENTS December 31, 2016
1. Organization
Oppenheimer Main Street Fund/VA (the “Fund”), a separate series of Oppenheimer Variable Account Funds, is a diversified open-end management investment company registered under the Investment Company Act of 1940 (“1940 Act”), as amended. The Fund’s investment objective is to seek capital appreciation. The Fund’s investment adviser is OFI Global Asset Management, Inc. (“OFI Global” or the “Manager”), a wholly-owned subsidiary of OppenheimerFunds, Inc. (“OFI” or the “Sub-Adviser”). The Manager has entered into a sub-advisory agreement with OFI. Shares of the Fund are sold only to separate accounts of life insurance companies.
The Fund offers two classes of shares. Both classes are sold at their offering price, which is the net asset value per share, to separate investment accounts of participating insurance companies as an underlying investment for variable life insurance policies, variable annuity contracts or other investment products. The class of shares designated as Service shares is subject to a distribution and service plan. Both classes of shares have identical rights and voting privileges with respect to the Fund in general and exclusive voting rights on matters that affect that class alone. Earnings, net assets and net asset value per share may differ due to each class having its own expenses, such as transfer and shareholder servicing agent fees and shareholder communications, directly attributable to that class.
The following is a summary of significant accounting policies followed in the Fund’s preparation of financial statements in accordance with accounting principles generally accepted in the United States (“U.S. GAAP”).
2. Significant Accounting Policies
Security Valuation. All investments in securities are recorded at their estimated fair value, as described in Note 3.
Foreign Currency Translation. The books and records of the Fund are maintained in U.S. dollars. Any foreign currency amounts are translated into U.S. dollars on the following basis:
(1) Market value of investment securities, other assets and liabilities — at the exchange rates prevailing at Market Close as described in Note 3.
(2) Purchases and sales of investment securities, income and expenses — at the rates of exchange prevailing on the respective dates of such transactions.
Although the net assets and the market values are presented at the foreign exchange rates at Market Close, the Fund does not isolate the portion of the results of operations resulting from changes in foreign exchange rates on investments from the fluctuations arising from changes in market prices of securities held. Such fluctuations are included with the net realized and unrealized gains or losses from investments shown in the Statement of Operations.
For securities, which are subject to foreign withholding tax upon disposition, realized gains or losses on such securities are recorded net of foreign withholding tax.
Reported net realized foreign exchange gains or losses arise from sales of foreign currencies, currency gains or losses realized between the trade and settlement dates on securities transactions, the difference between the amounts of dividends, interest, and foreign withholding tax reclaims recorded on Fund’s books, and the U.S. dollar equivalent of the amounts actually received or paid. Net unrealized foreign exchange gains and losses arise from changes in the value of assets and liabilities other than investments in securities, resulting from changes in the exchange rate.
Allocation of Income, Expenses, Gains and Losses. Income, expenses (other than those attributable to a specific class), gains and losses are allocated on a daily basis to each class of shares based upon the relative proportion of net assets represented by such class. Operating expenses directly attributable to a specific class are charged against the operations of that class.
Dividends and Distributions to Shareholders. Dividends and distributions to shareholders, which are determined in accordance with income tax regulations and may differ from U.S. GAAP, are recorded on the ex-dividend date. Income and capital gain distributions, if any, are declared and paid annually or at other times as deemed necessary by the Manager.
Investment Income. Dividend income is recorded on the ex-dividend date or upon ex-dividend notification in the case of certain foreign dividends where the ex-dividend date may have passed. Non-cash dividends included in dividend income, if any, are recorded at the fair market value of the securities received. Interest income is recognized on an accrual basis. Discount and premium, which are included in interest income on the Statement of Operations, are amortized or accreted daily.
Return of Capital Estimates. Distributions received from the Fund’s investments in Master Limited Partnerships (MLPs) and Real Estate Investments Trusts (REITs), generally are comprised of income and return of capital. The Fund records investment income and return of capital based on estimates. Such estimates are based on historical information available from each MLP, REIT and other industry sources. These estimates may subsequently be revised based on information received from MLPs and REITs after their tax reporting periods are concluded.
Custodian Fees. “Custodian fees and expenses” in the Statement of Operations may include interest expense incurred by the Fund on any cash overdrafts of its custodian account during the period. Such cash overdrafts may result from the effects of failed trades in portfolio securities and from cash outflows resulting from unanticipated shareholder redemption activity. The Fund pays interest to its custodian on such cash overdrafts, to the extent they are not offset by positive cash balances maintained by the Fund, at a rate equal to the Federal Funds Rate plus 0.50%. This rate will increase to 2.00% effective January 1, 2017. The “Reduction to custodian expenses” line item, if applicable, represents earnings on cash balances maintained by the Fund during the period. Such interest expense and other custodian fees may be paid with these earnings.
15 OPPENHEIMER MAIN STREET FUND/VA
NOTES TO FINANCIAL STATEMENTS Continued
2. Significant Accounting Policies (Continued)
Security Transactions. Security transactions are recorded on the trade date. Realized gains and losses on securities sold are determined on the basis of identified cost.
Indemnifications. The Fund’s organizational documents provide current and former Trustees and officers with a limited indemnification against liabilities arising in connection with the performance of their duties to the Fund. In the normal course of business, the Fund may also enter into contracts that provide general indemnifications. The Fund’s maximum exposure under these arrangements is unknown as this would be dependent on future claims that may be made against the Fund. The risk of material loss from such claims is considered remote.
Federal Taxes. The Fund intends to comply with provisions of the Internal Revenue Code applicable to regulated investment companies and to distribute substantially all of its investment company taxable income, including any net realized gain on investments not offset by capital loss carryforwards, if any, to shareholders. Therefore, no federal income or excise tax provision is required. The Fund files income tax returns in U.S. federal and applicable state jurisdictions. The statute of limitations on the Fund’s tax return filings generally remains open for the three preceding fiscal reporting period ends. The Fund has analyzed its tax positions for the fiscal year ended December 31, 2016, including open tax years, and does not believe there are any uncertain tax positions requiring recognition in the Fund’s financial statements.
The tax components of capital shown in the following table represent distribution requirements the Fund must satisfy under the income tax regulations, losses the Fund may be able to offset against income and gains realized in future years and unrealized appreciation or depreciation of securities and other investments for federal income tax purposes.
| | | | | | | | | | | | |
Undistributed Net Investment Income | | Undistributed
Long-Term
Gain | | | Accumulated
Loss
Carryforward1,2 | | | Net Unrealized
Appreciation
Based on cost of
Securities and
Other Investments
for Federal Income
Tax Purposes | |
| |
$13,437,974 | | | $23,414,574 | | | | $— | | | | $349,108,561 | |
1. During the reporting period, the Fund utilized $2,513,988 of capital loss carryforward to offset capital gains realized in that fiscal year.
2. During the previous reporting period, the Fund utilized $2,513,988 of capital loss carryforward to offset capital gains realized in that fiscal year.
Net investment income (loss) and net realized gain (loss) may differ for financial statement and tax purposes. The character of dividends and distributions made during the fiscal year from net investment income or net realized gains are determined in accordance with federal income tax requirements, which may differ from the character of net investment income or net realized gains presented in those financial statements in accordance with U.S. GAAP. Also, due to timing of dividends and distributions, the fiscal year in which amounts are distributed may differ from the fiscal year in which the income or net realized gain was recorded by the Fund.
Accordingly, the following amounts have been reclassified for the reporting period. Net assets of the Fund were unaffected by the reclassifications.
| | | | | | | | |
Increase to Paid-in Capital | | Reduction to Accumulated
Net Investment
Income | | | Reduction to Accumulated Net
Realized Gain on Investments3 | |
| |
$2,777,522 | | | $218,089 | | | | $2,559,433 | |
3. $2,778,017, all of which was long-term capital gain, was distributed in connection with Fund share redemptions.
The tax character of distributions paid during the reporting periods:
| | | | | | | | |
| | | Year Ended
December 31, 2016 | | | Year Ended
December 31, 2015 | |
| |
Distributions paid from: | | | | | | | | |
Ordinary income | | $ | 16,035,719 | | | $ | 39,268,736 | |
Long-term capital gain | | | 140,967,871 | | | | 167,939,333 | |
| | | | |
Total | | $ | 157,003,590 | | | $ | 207,208,069 | |
| | | | |
The aggregate cost of securities and other investments and the composition of unrealized appreciation and depreciation of securities and other investments for federal income tax purposes at period end are noted in the following table. The primary difference between book and tax appreciation or depreciation of securities and other investments, if applicable, is attributable to the tax deferral of losses or tax realization of financial statement unrealized gain or loss.
| | | | |
Federal tax cost of securities | | $ | 908,915,285 | |
| | | | |
Gross unrealized appreciation | | $ | 359,226,894 | |
| |
Gross unrealized depreciation | | | (10,118,333) | |
| | | | |
Net unrealized appreciation | | $ | 349,108,561 | |
| | | | |
16 OPPENHEIMER MAIN STREET FUND/VA
2. Significant Accounting Policies (Continued)
Use of Estimates. The preparation of financial statements in conformity with U.S. GAAP requires management to make estimates and assumptions that affect the reported amounts of assets and liabilities and disclosure of contingent assets and liabilities at the date of the financial statements and the reported amounts of increases and decreases in net assets from operations during the reporting period. Actual results could differ from those estimates.
3. Securities Valuation
The Fund calculates the net asset value of its shares as of 4:00 P.M. Eastern time, on each day the New York Stock Exchange (the “Exchange”) is open for trading, except in the case of a scheduled early closing of the Exchange, in which case the Fund will calculate net asset value of the shares as of the scheduled early closing time of the Exchange.
The Fund’s Board has adopted procedures for the valuation of the Fund’s securities and has delegated the day-to-day responsibility for valuation determinations under those procedures to the Manager. The Manager has established a Valuation Committee which is responsible for determining a “fair valuation” for any security for which market quotations are not “readily available.” The Valuation Committee’s fair valuation determinations are subject to review, approval and ratification by the Fund’s Board at its next regularly scheduled meeting covering the calendar quarter in which the fair valuation was determined.
Valuation Methods and Inputs
Securities are valued using unadjusted quoted market prices, when available, as supplied primarily by third party pricing services or dealers.
The following methodologies are used to determine the market value or the fair value of the types of securities described below:
Equity securities traded on a securities exchange (including exchange-traded derivatives other than futures and futures options) are valued based on the official closing price on the principal exchange on which the security is traded, as identified by the Manager, prior to the time when the Fund’s assets are valued. If the official closing price is unavailable, the security is valued at the last sale price on the principal exchange on which it is traded. If the official closing price or last sales price for a foreign security is not available, the security is valued at the mean between the bid and asked price per the exchange or, if not available from the exchange, obtained from two dealers. If bid and asked prices are not available from either the exchange or two dealers, the security is valued by using one of the following methodologies (listed in order of priority): (1) a bid from the exchange, (2) the mean between the bid and asked price as provided by a single dealer, or (3) a bid from a single dealer.
Shares of a registered investment company that are not traded on an exchange are valued at that investment company’s net asset value per share.
Corporate and government debt securities (of U.S. or foreign issuers) and municipal debt securities, event-linked bonds, loans, mortgage-backed securities, collateralized mortgage obligations, and asset-backed securities are valued at the mean between the “bid” and “asked” prices utilizing evaluated prices obtained from third party pricing services or broker-dealers who may use matrix pricing methods to determine the evaluated prices.
Short-term money market type debt securities are valued at the mean between the “bid” and “asked” prices utilizing evaluated prices obtained from third party pricing services or broker-dealers.
A description of the standard inputs that may generally be considered by the third party pricing vendors in determining their evaluated prices is provided below.
| | |
| Security Type | | Standard inputs generally considered by third-party pricing vendors |
| Corporate debt, government debt, municipal, mortgage- backed and asset-backed securities | | Reported trade data, broker-dealer price quotations, benchmark yields, issuer spreads on comparable securities, the credit quality, yield, maturity, and other appropriate factors. |
| Loans | | Information obtained from market participants regarding reported trade data and broker-dealer price quotations. |
| Event-linked bonds | | Information obtained from market participants regarding reported trade data and broker-dealer price quotations. |
If a market value or price cannot be determined for a security using the methodologies described above, or if, in the “good faith” opinion of the Manager, the market value or price obtained does not constitute a “readily available market quotation,” or a significant event has occurred that would materially affect the value of the security, the security is fair valued either (i) by a standardized fair valuation methodology applicable to the security type or the significant event as previously approved by the Valuation Committee and the Fund’s Board or (ii) as determined in good faith by the Manager’s Valuation Committee. The Valuation Committee considers all relevant facts that are reasonably available, through either public information or information available to the Manager, when determining the fair value of a security. Fair value determinations by the Manager are subject to review, approval and ratification by the Fund’s Board at its next regularly scheduled meeting covering the calendar quarter in which the fair valuation was determined. Those fair valuation standardized methodologies include, but are not limited to, valuing securities at the last sale price or initially at cost and subsequently adjusting the value based on: changes in company specific fundamentals, changes in an appropriate securities index, or changes in the value of similar securities which may be further adjusted for any discounts related to security-specific resale restrictions. When possible, such methodologies use observable market inputs such as unadjusted quoted prices of similar securities, observable interest rates, currency rates and yield curves. The methodologies used for valuing securities are not necessarily an indication of the risks associated with investing in those securities nor can it be assured that the Fund can obtain the fair value assigned to a security if it were to sell the security.
To assess the continuing appropriateness of security valuations, the Manager, or its third party service provider who is subject to oversight by the
17 OPPENHEIMER MAIN STREET FUND/VA
NOTES TO FINANCIAL STATEMENTS Continued
3. Securities Valuation (Continued)
Manager, regularly compares prior day prices, prices on comparable securities, and sale prices to the current day prices and challenges those prices exceeding certain tolerance levels with the third party pricing service or broker source. For those securities valued by fair valuations, whether through a standardized fair valuation methodology or a fair valuation determination, the Valuation Committee reviews and affirms the reasonableness of the valuations based on such methodologies and fair valuation determinations on a regular basis after considering all relevant information that is reasonably available.
Classifications
Each investment asset or liability of the Fund is assigned a level at measurement date based on the significance and source of the inputs to its valuation. Various data inputs are used in determining the value of each of the Fund’s investments as of the reporting period end. These data inputs are categorized in the following hierarchy under applicable financial accounting standards:
1) Level 1-unadjusted quoted prices in active markets for identical assets or liabilities (including securities actively traded on a securities exchange)
2) Level 2-inputs other than unadjusted quoted prices that are observable for the asset or liability (such as unadjusted quoted prices for similar assets and market corroborated inputs such as interest rates, prepayment speeds, credit risks, etc.)
3) Level 3-significant unobservable inputs (including the Manager’s own judgments about assumptions that market participants would use in pricing the asset or liability).
The inputs used for valuing securities are not necessarily an indication of the risks associated with investing in those securities.
The Fund classifies each of its investments in investment companies which are publicly offered as Level 1. Investment companies that are not publicly offered are measured using net asset value as a practical expedient, and are not classified in the fair value hierarchy.
The table below categorizes amounts that are included in the Fund’s Statement of Assets and Liabilities at period end based on valuation input level:
| | | | | | | | | | | | | | | | |
| | | Level 1— Unadjusted Quoted Prices | | | Level 2— Other Significant
Observable Inputs | | | Level 3— Significant
Unobservable Inputs | | | Value | |
| |
Assets Table | | | | | | | | | | | | | | | | |
Investments, at Value: | | | | | | | | | | | | | | | | |
Common Stocks | | | | | | | | | | | | | | | | |
Consumer Discretionary | | $ | 134,171,211 | | | $ | — | | | $ | — | | | $ | 134,171,211 | |
Consumer Staples | | | 120,489,704 | | | | — | | | | — | | | | 120,489,704 | |
Energy | | | 90,264,925 | | | | — | | | | — | | | | 90,264,925 | |
Financials | | | 267,797,626 | | | | — | | | | — | | | | 267,797,626 | |
Health Care | | | 171,504,121 | | | | — | | | | — | | | | 171,504,121 | |
Industrials | | | 147,788,468 | | | | — | | | | — | | | | 147,788,468 | |
Information Technology | | | 229,414,267 | | | | — | | | | — | | | | 229,414,267 | |
Materials | | | 27,254,022 | | | | — | | | | — | | | | 27,254,022 | |
Telecommunication Services | | | 25,921,328 | | | | — | | | | — | | | | 25,921,328 | |
Utilities | | | 25,801,119 | | | | 6,488,105 | | | | — | | | | 32,289,224 | |
Investment Company | | | 11,146,627 | | | | — | | | | — | | | | 11,146,627 | |
| | | | |
Total Assets | | $ | 1,251,553,418 | | | $ | 6,488,105 | | | $ | — | | | $ | 1,258,041,523 | |
| | | | |
Forward currency exchange contracts and futures contracts, if any, are reported at their unrealized appreciation/depreciation at measurement date, which represents the change in the contract’s value from trade date. All additional assets and liabilities included in the above table are reported at their market value at measurement date.
4. Investments and Risks
Investments in Affiliated Funds. The Fund is permitted to invest in other mutual funds advised by the Manager (“Affiliated Funds”). Affiliated Funds are open-end management investment companies registered under the 1940 Act, as amended. The Manager is the investment adviser of, and the Sub-Adviser provides investment and related advisory services to, the Affiliated Funds. When applicable, the Fund’s investments in Affiliated Funds are included in the Statement of Investments. Shares of Affiliated Funds are valued at their net asset value per share. As a shareholder, the Fund is subject to its proportional share of the Affiliated Funds’ expenses, including their management fee. The Manager will waive fees and/or reimburse Fund expenses in an amount equal to the indirect management fees incurred through the Fund’s investment in the Affiliated Funds.
Each of the Affiliated Funds in which the Fund invests has its own investment risks, and those risks can affect the value of the Fund’s investments and therefore the value of the Fund’s shares. To the extent that the Fund invests more of its assets in one Affiliated Fund than in another, the Fund will have greater exposure to the risks of that Affiliated Fund.
Investments in Money Market Instruments. The Fund is permitted to invest its free cash balances in money market instruments to provide liquidity or for defensive purposes. The Fund may invest in money market instruments by investing in Class E shares of Oppenheimer Institutional Government Money Market Fund (“IGMMF”), formerly known as Oppenheimer Institutional Money Market Fund, which is an Affiliated Fund. IGMMF is regulated as a money market fund under the 1940 Act, as amended. The Fund may also invest in money market instruments directly or in other affiliated or
18 OPPENHEIMER MAIN STREET FUND/VA
4. Investments and Risks (Continued)
unaffiliated money market funds.
Master Limited Partnerships (“MLPs”). MLPs issue common units that represent an equity ownership interest in a partnership and provide limited voting rights. MLP common units are registered with the Securities and Exchange Commission (“SEC”), and are freely tradable on securities exchanges such as the NYSE and the NASDAQ Stock Market (“NASDAQ”), or in the over-the-counter (“OTC”) market. An MLP consists of one or more general partners, who conduct the business, and one or more limited partners, who contribute capital. MLP common unit holders have a limited role in the partnership’s operations and management. The Fund, as a limited partner, normally would not be liable for the debts of the MLP beyond the amounts the Fund has contributed, but would not be shielded to the same extent that a shareholder of a corporation would be. In certain circumstances creditors of an MLP would have the right to seek return of capital distributed to a limited partner. This right of an MLP’s creditors would continue after the Fund sold its investment in the MLP.
Equity Security Risk. Stocks and other equity securities fluctuate in price. The value of the Fund’s portfolio may be affected by changes in the equity markets generally. Equity markets may experience significant short-term volatility and may fall sharply at times. Different markets may behave differently from each other and U.S. equity markets may move in the opposite direction from one or more foreign stock markets. Adverse events in any part of the equity or fixed-income markets may have unexpected negative effects on other market segments.
The prices of individual equity securities generally do not all move in the same direction at the same time and a variety of factors can affect the price of a particular company’s securities. These factors may include, but are not limited to, poor earnings reports, a loss of customers, litigation against the company, general unfavorable performance of the company’s sector or industry, or changes in government regulations affecting the company or its industry.
Shareholder Concentration. At period end, one shareholder owned 20% or more of the Fund’s total outstanding shares.
5. Market Risk Factors
The Fund’s investments in securities and/or financial derivatives may expose the Fund to various market risk factors:
Commodity Risk. Commodity risk relates to the change in value of commodities or commodity indexes as they relate to increases or decreases in the commodities market. Commodities are physical assets that have tangible properties. Examples of these types of assets are crude oil, heating oil, metals, livestock, and agricultural products.
Credit Risk. Credit risk relates to the ability of the issuer of debt to meet interest and principal payments, or both, as they come due. In general, lower-grade, higher-yield debt securities are subject to credit risk to a greater extent than lower-yield, higher-quality securities.
Equity Risk. Equity risk relates to the change in value of equity securities as they relate to increases or decreases in the general market.
Foreign Exchange Rate Risk. Foreign exchange rate risk relates to the change in the U.S. dollar value of a security held that is denominated in a foreign currency. The U.S. dollar value of a foreign currency denominated security will decrease as the dollar appreciates against the currency, while the U.S. dollar value will increase as the dollar depreciates against the currency.
Interest Rate Risk. Interest rate risk refers to the fluctuations in value of fixed-income securities resulting from the inverse relationship between price and yield. For example, an increase in general interest rates will tend to reduce the market value of already issued fixed-income investments, and a decline in general interest rates will tend to increase their value. In addition, debt securities with longer maturities, which tend to have higher yields, are subject to potentially greater fluctuations in value from changes in interest rates than obligations with shorter maturities.
Volatility Risk. Volatility risk refers to the magnitude of the movement, but not the direction of the movement, in a financial instrument’s price over a defined time period. Large increases or decreases in a financial instrument’s price over a relative time period typically indicate greater volatility risk, while small increases or decreases in its price typically indicate lower volatility risk.
6. Shares of Beneficial Interest
The Fund has authorized an unlimited number of $0.001 par value shares of beneficial interest of each class. Transactions in shares of beneficial interest were as follows:
| | | | | | | | | | | | | | | | | | | | | | | | | | | | |
| | | Year Ended December 31, 2016 | | | | | | | | | Year Ended December 31, 2015 | | | | |
| | | Shares | | | Amount | | | | | | | | | Shares | | | Amount | | | | |
| |
Non-Service Shares | | | | | | | | | | | | | | | | | | | | | | | | | | | | |
Sold | | | 1,123,635 | | | $ | 31,497,254 | | | | | | | | | | | | 517,352 | | | $ | 15,973,699 | | | | | |
Dividends and/or distributions reinvested | | | 2,522,303 | | | | 66,336,562 | | | | | | | | | | | | 2,966,041 | | | | 86,816,030 | | | | | |
Redeemed | | | (4,296,043 | ) | | | (118,322,768 | ) | | | | | | | | | | | (2,414,970 | ) | | | (75,495,171 | ) | | | | |
| | | | |
Net increase (decrease) | | | (650,105 | ) | | $ | (20,488,952 | ) | | | | | | | | | | | 1,068,423 | | | $ | 27,294,558 | | | | | |
| | | | |
19 OPPENHEIMER MAIN STREET FUND/VA
NOTES TO FINANCIAL STATEMENTS Continued
6. Shares of Beneficial Interest (Continued)
| | | | | | | | | | | | | | | | | | | | | | | | |
| | | Year Ended December 31, 2016 | | | | | | | | | Year Ended December 31, 2015 | |
| | | Shares | | | Amount | | | | | | | | | Shares | | | Amount | |
| |
| Service Shares | | | | | | | | | | | | | | | | | | | | | | | | |
| Sold | | | 4,774,619 | | | $ | 132,212,797 | | | | | | | | | | | | 1,895,395 | | | $ | 56,747,875 | |
| Dividends and/or distributions reinvested | | | 3,477,830 | | | | 90,667,028 | | | | | | | | | | | | 4,144,304 | | | | 120,392,039 | |
| Redeemed | | | (5,466,756 | ) | | | (152,205,519) | | | | | | | | | | | | (5,534,911 | ) | | | (170,576,335) | |
| | | | |
| Net increase | | | 2,785,693 | | | $ | 70,674,306 | | | | | | | | | | | | 504,788 | | | $ | 6,563,579 | |
| | | | |
7. Purchases and Sales of Securities
The aggregate cost of purchases and proceeds from sales of securities, other than short-term obligations and investments in IGMMF, for the reporting period were as follows:
| | | | |
| | | Purchases | | Sales |
|
Investment securities | | $399,117,010 | | $474,199,381 |
8. Fees and Other Transactions with Affiliates
Management Fees. Under the investment advisory agreement, the Fund pays the Manager a management fee based on the daily net assets of the Fund at an annual rate as shown in the following table:
| | | | |
| Fee Schedule | | | |
| |
Up to $200 million | | | 0.75% | |
Next $200 million | | | 0.72 | |
Next $200 million | | | 0.69 | |
Next $200 million | | | 0.66 | |
Next $200 million | | | 0.60 | |
Next $4 billion | | | 0.58 | |
Over $5 billion | | | 0.56 | |
The Fund’s effective management fee for the reporting period was 0.66% of average annual net assets before any applicable waivers.
Sub-Adviser Fees. The Manager has retained the Sub-Adviser to provide the day-to-day portfolio management of the Fund. Under the Sub-Advisory Agreement, the Manager pays the Sub-Adviser an annual fee in monthly installments, equal to a percentage of the investment management fee collected by the Manager from the Fund, which shall be calculated after any investment management fee waivers. The fee paid to the Sub-Adviser is paid by the Manager, not by the Fund.
Transfer Agent Fees. OFI Global (the “Transfer Agent”) serves as the transfer and shareholder servicing agent for the Fund. The Fund pays the Transfer Agent a fee based on annual net assets. Fees incurred and average net assets for each class with respect to these services are detailed in the Statement of Operations and Financial Highlights, respectively.
Sub-Transfer Agent Fees. The Transfer Agent has retained Shareholder Services, Inc., a wholly-owned subsidiary of OFI (the “Sub-Transfer Agent”), to provide the day-to-day transfer agent and shareholder servicing of the Fund. Under the Sub-Transfer Agency Agreement, the Transfer Agent pays the Sub-Transfer Agent an annual fee in monthly installments, equal to a percentage of the transfer agent fee collected by the Transfer Agent from the Fund, which shall be calculated after any applicable fee waivers. The fee paid to the Sub-Transfer Agent is paid by the Transfer Agent, not by the Fund.
Trustees’ Compensation. The Fund’s Board of Trustees (“Board”) has adopted a compensation deferral plan for Independent Trustees that enables Trustees to elect to defer receipt of all or a portion of the annual compensation they are entitled to receive from the Fund. For purposes of determining the amount owed to the Trustees under the plan, deferred amounts are treated as though equal dollar amounts had been invested in shares of the Fund or in other Oppenheimer funds selected by the Trustees. The Fund purchases shares of the funds selected for deferral by the Trustees in amounts equal to his or her deemed investment, resulting in a Fund asset equal to the deferred compensation liability. Such assets are included as a component of “Other” within the asset section of the Statement of Assets and Liabilities. Deferral of Trustees’ fees under the plan will not affect the net assets of the Fund and will not materially affect the Fund’s assets, liabilities or net investment income per share. Amounts will be deferred until distributed in accordance with the compensation deferral plan.
Distribution and Service Plan for Service Shares. The Fund has adopted a Distribution and Service Plan (the “Plan”) pursuant to Rule 12b-1 under the 1940 Act for Service shares to pay OppenheimerFunds Distributor, Inc. (the “Distributor”), for distribution related services, personal service and account maintenance for the Fund’s Service shares. Under the Plan, payments are made periodically at an annual rate of 0.25% of the daily net assets of Service shares of the Fund. The Distributor currently uses all of those fees to compensate sponsors of the insurance product that offers Fund shares, for providing personal service and maintenance of accounts of their variable contract owners that hold Service shares. These fees are paid out of the Fund’s assets on an on-going basis and increase operating expenses of the Service shares, which results in lower performance compared to the Fund’s shares
20 OPPENHEIMER MAIN STREET FUND/VA
8. Fees and Other Transactions with Affiliates (Continued)
that are not subject to a service fee. Fees incurred by the Fund under the Plan are detailed in the Statement of Operations.
Waivers and Reimbursements of Expenses. The Manager has voluntarily agreed to limit the Fund’s expenses after payments, waivers and/or reimbursements and reduction to custodian expenses, excluding any applicable dividend expense, taxes, interest and fees from borrowing, any subsidiary expenses, Acquired Fund Fees and Expenses, brokerage commissions, unusual and infrequent expenses and certain other Fund expenses; so that those expenses, as percentages of daily net assets, will not exceed the annual rate of 0.80% for Non-Service shares and 1.05% for Service shares.
The Manager will waive fees and/or reimburse Fund expenses in an amount equal to the indirect management fees incurred through the Fund’s investment in IGMMF. During the reporting period, the Manager waived fees and/or reimbursed the Fund $22,543 for IGMMF management fees.
Waivers and/or reimbursements may be modified or terminated as set forth according to the terms in the prospectus.
9. Borrowings and Other Financing
Joint Credit Facility. A number of mutual funds managed by the Manager participate in a $1.3 billion revolving credit facility (the “Facility”) intended to provide short-term financing, if necessary, subject to certain restrictions in connection with atypical redemption activity. Expenses and fees related to the Facility are paid by the participating funds and are disclosed separately or as other expenses on the Statement of Operations. The Fund did not utilize the Facility during the reporting period.
10. Pending Litigation
In 2009, several putative class action lawsuits were filed and later consolidated before the U.S. District Court for the District of Colorado in connection with the investment performance of Oppenheimer Rochester California Municipal Fund (the “California Fund”), a fund advised by OppenheimerFunds, Inc. (“OFI”) and distributed by OppenheimerFunds Distributor, Inc. (“OFDI”). The plaintiffs asserted claims against OFI, OFDI and certain present and former trustees and officers of the California Fund under the federal securities laws, alleging, among other things, that the disclosure documents of the California Fund contained misrepresentations and omissions and the investment policies of the California Fund were not followed. An amended complaint and a motion to dismiss were filed, and in 2011, the court issued an order which granted in part and denied in part the defendants’ motion to dismiss. In October 2015, following a successful appeal by defendants and a subsequent hearing, the court granted plaintiffs’ motion for class certification and appointed class representatives and class counsel.
OFI and OFDI believe the suit is without merit; that it is premature to render any opinion as to the likelihood of an outcome unfavorable to them in the suit; and that no estimate can yet be made as to the amount or range of any potential loss. Furthermore, OFI believes that the suit should not impair the ability of OFI or OFDI to perform their respective duties to the Fund and that the outcome of the suit should not have any material effect on the operations of any of the Oppenheimer funds.
21 OPPENHEIMER MAIN STREET FUND/VA
REPORT OF INDEPENDENT REGISTERED PUBLIC ACCOUNTING FIRM
The Board of Trustees and Shareholders of Oppenheimer Variable Account Funds:
We have audited the accompanying statement of assets and liabilities of Oppenheimer Main Street Fund/VA (a separate series of Oppenheimer Variable Account Funds), including the statement of investments, as of December 31, 2016, and the related statement of operations for the year then ended, the statements of changes in net assets for each of the years in the two-year period then ended, and the financial highlights for each of the years in the five-year period then ended. These financial statements and financial highlights are the responsibility of the Fund’s management. Our responsibility is to express an opinion on these financial statements and financial highlights based on our audits.
We conducted our audits in accordance with the standards of the Public Company Accounting Oversight Board (United States). Those standards require that we plan and perform the audit to obtain reasonable assurance about whether the financial statements and financial highlights are free of material misstatement. An audit includes examining, on a test basis, evidence supporting the amounts and disclosures in the financial statements. Our procedures included confirmation of securities owned as of December 31, 2016, by correspondence with the custodian, transfer agent and brokers, or by other appropriate auditing procedures where replies from brokers were not received. An audit also includes assessing the accounting principles used and significant estimates made by management, as well as evaluating the overall financial statement presentation. We believe that our audits provide a reasonable basis for our opinion.
In our opinion, the financial statements and financial highlights referred to above present fairly, in all material respects, the financial position of Oppenheimer Main Street Fund/VA as of December 31, 2016, the results of its operations for the year then ended, the changes in its net assets for each of the years in the two-year period then ended, and the financial highlights for each of the years in the five-year period then ended, in conformity with U.S. generally accepted accounting principles.
KPMG LLP
Denver, Colorado
February 15, 2017
22 OPPENHEIMER MAIN STREET FUND/VA
FEDERAL INCOME TAX INFORMATION Unaudited
In early 2017, if applicable, shareholders of record received information regarding all dividends and distributions paid to them by the Fund during calendar year 2016.
Capital gain distributions of $3.47128 per share were paid to Non-Service and Service shareholders, respectively, on June 21, 2016. Whether received in stock or in cash, the capital gain distribution should be treated by shareholders as a gain from the sale of the capital assets held for more than one year (long-term capital gains).
Dividends, if any, paid by the Fund during the reporting period which are not designated as capital gain distributions should be multiplied by the maximum amount allowable but not less than 100% to arrive at the amount eligible for the corporate dividend-received deduction.
The foregoing information is presented to assist shareholders in reporting distributions received from the Fund to the Internal Revenue Service. Because of the complexity of the federal regulations which may affect your individual tax return and the many variations in state and local tax regulations, we recommend that you consult your tax advisor for specific guidance.
23 OPPENHEIMER MAIN STREET FUND/VA
BOARD APPROVAL OF THE FUND’S INVESTMENT ADVISORY AND SUB-ADVISORY AGREEMENTS Unaudited
The Fund has entered into an investment advisory agreement with OFI Global Asset Management, Inc. (“OFI Global” or the “Adviser”), a wholly-owned subsidiary of OppenheimerFunds, Inc. (“OFI” or the “Sub-Adviser”) (“OFI Global” and “OFI” together the “Managers”) and OFI Global has entered into a sub-advisory agreement with OFI whereby OFI provides investment sub-advisory services to the Fund (collectively, the “Agreements”). Each year, the Board of Trustees (the “Board”), including a majority of the independent Trustees, is required to determine whether to approve the terms of the Agreements and the renewal thereof. The Investment Company Act of 1940, as amended, requires that the Board request and evaluate, and that the Managers provide, such information as may be reasonably necessary to evaluate the terms of the Agreements. The Board employs an independent consultant to prepare a report that provides information, including comparative information that the Board requests for that purpose. In addition to in-person meetings focused on this evaluation, the Board receives information throughout the year regarding Fund services, fees, expenses and performance.
The Managers and the independent consultant provided information to the Board on the following factors: (i) the nature, quality and extent of the Managers’ services, (ii) the comparative investment performance of the Fund and the Managers, (iii) the fees and expenses of the Fund, including comparative fee and expense information, (iv) the profitability of the Managers and their affiliates, including an analysis of the cost of providing services, (v) whether economies of scale are realized as the Fund grows and whether fee levels reflect these economies of scale for Fund investors and (vi) other benefits to the Managers from their relationship with the Fund. The Board was aware that there are alternatives to retaining the Managers.
Outlined below is a summary of the principal information considered by the Board as well as the Board’s conclusions.
Nature, Quality and Extent of Services. The Board considered information about the nature, quality and extent of the services provided to the Fund and information regarding the Managers’ key personnel who provide such services. The Managers’ duties include providing the Fund with the services of the portfolio managers and the Sub-Adviser’s investment team, who provide research, analysis and other advisory services in regard to the Fund’s investments; and securities trading services. OFI Global is responsible for oversight of third-party service providers; monitoring compliance with applicable Fund policies and procedures and adherence to the Fund’s investment restrictions; risk management; and oversight of the Sub-Adviser. OFI Global is also responsible for providing certain administrative services to the Fund. Those services include providing and supervising all administrative and clerical personnel who are necessary in order to provide effective corporate administration for the Fund; compiling and maintaining records with respect to the Fund’s operations; preparing and filing reports required by the U.S. Securities and Exchange Commission; preparing periodic reports regarding the operations of the Fund for its shareholders; preparing proxy materials for shareholder meetings; and preparing the registration statements required by federal and state securities laws for the sale of the Fund’s shares. OFI Global also provides the Fund with office space, facilities and equipment.
The Board also considered the quality of the services provided and the quality of the Managers’ resources that are available to the Fund. The Board took account of the fact that the Sub-Adviser has over fifty years of experience as an investment adviser and that its assets under management rank it among the top mutual fund managers in the United States. The Board evaluated the Managers’ advisory, administrative, accounting, legal, compliance and risk management services, and information the Board has received regarding the experience and professional qualifications of the Managers’ key personnel and the size and functions of its staff. In its evaluation of the quality of the portfolio management services provided, the Board considered the experience of Manind Govil, Benjamin Ram and Paul Larson, the portfolio managers for the Fund, and the Sub-Adviser’s investment team and analysts. The Board members also considered the totality of their experiences with the Managers as directors or trustees of the Fund and other funds advised by the Managers. The Board considered information regarding the quality of services provided by affiliates of the Managers, which the Board members have become knowledgeable about through their experiences with the Managers and in connection with the renewal of the Fund’s service agreements. The Board concluded, in light of the Managers’ experience, reputation, personnel, operations and resources that the Fund benefits from the services provided under the Agreements.
Investment Performance of the Managers and the Fund. Throughout the year, the Managers provided information on the investment performance of the Fund, the Adviser and the Sub-Adviser, including comparative performance information. The Board also reviewed information, prepared by the Managers and by the independent consultant, comparing the Fund’s historical performance to relevant market indices and to the performance of other large blend funds underlying variable insurance products. The Board considered that the Fund outperformed its performance category median during the one-, three-, five- and ten-year periods.
Fees and Expenses of the Fund. The Board reviewed the fees paid to the Adviser and the other expenses borne by the Fund. The Board noted that the Adviser, not the Fund, pays the Sub-Adviser’s fee under the sub-advisory agreement. The independent consultant provided comparative data in regard to the fees and expenses of the Fund and other large blend funds underlying variable insurance products. In reviewing the fees and expenses charged to the VA funds, the Board considered the Adviser’s assertion that, because there is much greater disparity in the fees and services that may be provided by a manager to a VA fund as opposed to a retail fund, when comparing the expenses of the various VA funds to those of retail funds, it is most appropriate to focus on total expenses (rather than on the management fees). Accordingly, while the Board reviewed and considered all expenses, it focused on total expenses. The Board considered that the Fund’s total expenses were higher than its peer group median and category median. The Board also considered that the Fund’s contractual management fee was lower than its category median and higher than its peer group median. The Board noted that the Adviser has voluntarily agreed to limit the Fund’s total annual operating expenses so that those expenses, as percentages of daily net assets, will not exceed the annual rate of 0.80% for Non-Service Shares and 1.05% for Service Shares. This voluntary expense limitation may be amended or withdrawn at any time without prior notice to shareholders.
Economies of Scale and Profits Realized by the Managers. The Board considered information regarding the Managers’ costs in serving as the Fund’s investment adviser and sub-adviser, including the costs associated with the personnel and systems necessary to manage the Fund, and information regarding the Managers’ profitability from their relationship with the Fund. The Board also considered that the Managers must be able to pay and retain experienced professional personnel at competitive rates to provide quality services to the Fund. The Board reviewed whether the Managers may realize economies of scale in managing and supporting the Fund. The Board noted that the Fund currently has management fee breakpoints, which are intended to share with Fund shareholders economies of scale that may exist as the Fund’s assets grow.
Other Benefits to the Managers. In addition to considering the profits realized by the Managers, the Board considered information that was
24 OPPENHEIMER MAIN STREET FUND/VA
BOARD APPROVAL OF THE FUND’S INVESTMENT ADVISORY AND SUB-ADVISORY AGREEMENTS Unaudited / Continued
provided regarding the direct and indirect benefits the Managers receive as a result of their relationship with the Fund, including compensation paid to the Managers’ affiliates and research provided to the Adviser in connection with permissible brokerage arrangements (soft dollar arrangements).
Conclusions. These factors were also considered by the independent Trustees meeting separately from the full Board, assisted by experienced counsel to the Fund and to the independent Trustees. Fund counsel and the independent Trustees’ counsel are independent of the Managers within the meaning and intent of the Securities and Exchange Commission Rules.
Based on its review of the information it received and its evaluations described above, the Board, including a majority of the independent Trustees, decided to continue the Agreements through August 31, 2017. In arriving at its decision, the Board did not identify any factor or factors as being more important than others, but considered all of the above information, and considered the terms and conditions of the Agreements, including the management fees, in light of all the surrounding circumstances.
25 OPPENHEIMER MAIN STREET FUND/VA
PORTFOLIO PROXY VOTING POLICIES AND GUIDELINES; UPDATES TO STATEMENTS OF INVESTMENTS Unaudited
The Fund has adopted Portfolio Proxy Voting Policies and Guidelines under which the Fund votes proxies relating to securities (“portfolio proxies”) held by the Fund. A description of the Fund’s Portfolio Proxy Voting Policies and Guidelines is available (i) without charge, upon request, by calling the Fund toll-free at 1.800.CALL OPP (225.5677), (ii) on the Fund’s website at www.oppenheimerfunds.com, and (iii) on the SEC’s website at www.sec.gov. In addition, the Fund is required to file Form N-PX, with its complete proxy voting record for the 12 months ended June 30th, no later than August 31st of each year. The Fund’s voting record is available (i) without charge, upon request, by calling the Fund toll-free at 1.800.CALL OPP (225.5677), and (ii) in the Form N-PX filing on the SEC’s website at www.sec.gov.
The Fund files its complete schedule of portfolio holdings with the SEC for the first quarter and the third quarter of each fiscal year on Form N-Q. The Fund’s Form N-Q filings are available on the SEC’s website at www.sec.gov. Those forms may be reviewed and copied at the SEC’s Public Reference Room in Washington, D.C. Information on the operation of the Public Reference Room may be obtained by calling 1-800-SEC-0330.
26 OPPENHEIMER MAIN STREET FUND/VA
TRUSTEES AND OFFICERS Unaudited
| | |
| Name, Position(s) Held with the Fund, Length of Service, Age | | Principal Occupation(s) During the Past 5 Years; Other Trusteeships/Directorships Held; Number of Portfolios in the Fund Complex Currently Overseen |
| |
| INDEPENDENT TRUSTEES | | The address of each Trustee in the chart below is 6803 S. Tucson Way, Centennial, Colorado 80112-3924. Each Trustee serves for an indefinite term, or until his or her resignation, retirement, death or removal. |
| |
Robert J. Malone, Chairman of the Board of Trustees (since 2016), Trustee (since 2002) Year of Birth: 1944 | | Chairman - Colorado Market of MidFirst Bank (since January 2015); Chairman of the Board (2012-2016) and Director (August 2005-March 2016) of Jones International University (educational organization); Trustee of the Gallagher Family Foundation (non-profit organization) (2000-2015); Chairman, Chief Executive Officer and Director of Steele Street Bank Trust (commercial banking) (August 2003-January 2015); Board of Directors of Opera Colorado Foundation (non-profit organization) (2008- 2012); Director of Colorado UpLIFT (charitable organization) (1986-2010); Director of Jones Knowledge, Inc. (2006-2010); Former Chairman of U.S. Bank-Colorado (subsidiary of U.S. Bancorp and formerly Colorado National Bank) (July 1996-April 1999); Director of Commercial Assets, Inc. (real estate investment trust) (1993-2000); Director of U.S. Exploration, Inc. (oil and gas exploration) (1997-February 2004); Chairman of the Board (1991-1994) and Trustee (1985-1994) of Regis University; and Chairman of the Board (1990-1991) and Trustee (1984-1999) of Young Presidents Organization. Oversees 47 portfolios in the OppenheimerFunds complex. Mr. Malone has served on the Boards of certain Oppenheimer funds since 2002, during which time he has become familiar with the Fund’s (and other Oppenheimer funds’) financial, accounting, regulatory and investment matters and has contributed to the Boards’ deliberations. |
| |
Jon S. Fossel, Trustee (since 1990) Year of Birth: 1942 | | Chairman of the Board of Jack Creek Preserve Foundation (non-profit organization) (since March 2005); Director of Jack Creek Preserve Foundation (non-profit organization) (March 2005-December 2014); Chairman of the Board (2006-December 2011) and Director (June 2002-December 2011) of UNUMProvident (insurance company); Director of Northwestern Energy Corp. (public utility corporation) (November 2004-December 2009); Director of P.R. Pharmaceuticals (October 1999-October 2003); Director of Rocky Mountain Elk Foundation (non-profit organization) (February 1998-February 2003 and February 2005-February 2007); Chairman and Director (until October 1996) and President and Chief Executive Officer (until October 1995) of OppenheimerFunds, Inc.; President, Chief Executive Officer and Director of the following: Oppenheimer Acquisition Corp. (“OAC”) (parent holding company of OppenheimerFunds, Inc.), Shareholders Services, Inc. and Shareholder Financial Services, Inc. (until October 1995). Oversees 47 portfolios in the OppenheimerFunds complex. Mr. Fossel has served on the Boards of certain Oppenheimer funds since 1990, during which time he has become familiar with the Fund’s (and other Oppenheimer funds’) financial, accounting, regulatory and investment matters and has contributed to the Boards’ deliberations. |
| |
Richard F. Grabish, Trustee (since 2012) Year of Birth: 1948 | | Formerly Senior Vice President and Assistant Director of Sales and Marketing (March 1997-December 2007), Director (March 1987-December 2007) and Manager of Private Client Services (June 1985-June 2005) of A.G. Edwards & Sons, Inc. (broker/dealer and investment firm); Chairman and Chief Executive Officer of A.G. Edwards Trust Company, FSB (March 2001-December 2007); President and Vice Chairman of A.G. Edwards Trust Company, FSB (investment adviser) (April 1987-March 2001); President of A.G. Edwards Trust Company, FSB (investment adviser) (June 2005-December 2007). Oversees 47 portfolios in the OppenheimerFunds complex. Mr. Grabish has served on the Boards of certain Oppenheimer funds since 2001, during which time he has become familiar with the Fund’s (and other Oppenheimer funds’) financial, accounting, regulatory and investment matters and has contributed to the Boards’ deliberations. |
| |
Beverly L. Hamilton, Trustee (since 2002) Year of Birth: 1946 | | Trustee of Monterey Institute for International Studies (educational organization) (2000-2014); Board Member of Middlebury College (educational organization) (December 2005-June 2011); Chairman (2010-2016) of American Funds’ Emerging Markets Growth Fund, Inc. (mutual fund); Director of The California Endowment (philanthropic organization) (April 2002-April 2008); Director (February 2002-2005) and Chairman of Trustees (2006-2007) of the Community Hospital of Monterey Peninsula; Director (October 1991-2005) and Vice Chairman (2006-2009) of American Funds’ Emerging Markets Growth Fund, Inc. (mutual fund); President of ARCO Investment Management Company (February 1991-April 2000); Member of the investment committees of The Rockefeller Foundation (2001-2006) and The University of Michigan (since 2000); Advisor at Credit Suisse First Boston’s Sprout venture capital unit (venture capital fund) (1994-January 2005); Trustee of MassMutual Institutional Funds (investment company) (1996-June 2004); Trustee of MML Series Investment Fund (investment company) (April 1989-June 2004); Member of the investment committee of Hartford Hospital (2000-2003); and Advisor to Unilever (Holland) pension fund (2000-2003). Oversees 47 portfolios in the OppenheimerFunds complex. Ms. Hamilton has served on the Boards of certain Oppenheimer funds since 2002, during which time she has become familiar with the Fund’s (and other Oppenheimer funds’) financial, accounting, regulatory and investment matters and has contributed to the Boards’ deliberations. |
| |
Victoria J. Herget, Trustee (since 2012) Year of Birth:1951 | | Board Chair (2008-2015) and Director (2004-Present), United Educators (insurance company); Trustee (since 2000) and Chair (since 2010), Newberry Library (independent research library); Trustee, Mather LifeWays (senior living organization) (since 2001); Independent Director of the First American Funds (mutual fund family) (2003-2011); former Managing Director (1993-2001), Principal (1985-1993), Vice President (1978-1985) and Assistant Vice President (1973-1978) of Zurich Scudder Investments (investment adviser) (and its predecessor firms); Trustee (1992-2007), Chair of the Board of Trustees (1999-2007), Investment Committee Chair (1994-1999) and Investment Committee member (2007-2010) of Wellesley College; Trustee, BoardSource (non-profit organization) (2006-2009) and Chicago City Day School (K-8 School) (1994-2005). Oversees 47 portfolios in the OppenheimerFunds complex. Ms. Herget has served on the Boards of certain Oppenheimer funds since 2012, during which time she has become familiar with the Fund’s (and other Oppenheimer funds’) financial, accounting, regulatory and investment matters and has contributed to the Boards’ deliberations. |
27 OPPENHEIMER MAIN STREET FUND/VA
TRUSTEES AND OFFICERS Unaudited / Continued
| | |
F. William Marshall, Jr., Trustee (since 2000) Year of Birth: 1942 | | Trustee Emeritus of Worcester Polytech Institute (WPI) (private university) (since 2009); Trustee of MassMutual Select Funds (formerly MassMutual Institutional Funds) (investment company) (1996-2015), MML Series Investment Fund (investment company) (1996-2015) and Mass Mutual Premier Funds (investment company) (January 2012-December 2015); President and Treasurer of the SIS Fund (private charitable fund) (January 1999-March 2011); Former Trustee of WPI (1985-2008); Former Chairman of the Board (2004-2006) and Former Chairman of the Investment Committee of WPI (1994-2008); Chairman of SIS Family Bank, F.S.B. (formerly SIS Bank) (commercial bank) (January 1999-July 1999); Executive Vice President of Peoples Heritage Financial Group, Inc. (commercial bank) (January 1999-July 1999); and Former President and Chief Executive Officer of SIS Bancorp. (1993-1999). Oversees 47 portfolios in the OppenheimerFunds complex. Mr. Marshall has served on the Boards of certain Oppenheimer funds since 2000, during which time he has become familiar with the Fund’s (and other Oppenheimer funds’) financial, accounting, regulatory and investment matters and has contributed to the Boards’ deliberations. |
| |
Karen L. Stuckey, Trustee (since 2012) Year of Birth: 1953 | | Member (since May 2015) of Desert Mountain Community Foundation Advisory Board (non-profit organization); Partner (1990-2012) of PricewaterhouseCoopers LLP (professional services firm) (held various positions 1975-1990); Trustee (1992- 2006), member of Executive, Nominating and Audit Committees and Chair of Finance Committee (1992-2006), and Emeritus Trustee (since 2006) of Lehigh University; and member, Women’s Investment Management Forum (professional organization) since inception. Oversees 47 portfolios in the OppenheimerFunds complex. Ms. Stuckey has served on the Boards of certain Oppenheimer funds since 2012, during which time she has become familiar with the Fund’s (and other Oppenheimer funds’) financial, accounting, regulatory and investment matters and has contributed to the Boards’ deliberations. |
| |
James D. Vaughn, Trustee (since 2012) Year of Birth:1945 | | Retired; former managing partner (1994-2001) of Denver office of Deloitte & Touche LLP, (held various positions 1969- 1993); Trustee and Chairman of the Audit Committee of Schroder Funds (2003-2012); Board member and Chairman of Audit Committee of AMG National Trust Bank (since 2005); Trustee and Investment Committee member, University of South Dakota Foundation (since 1996); Board member, Audit Committee Member and past Board Chair, Junior Achievement (since 1993); former Board member, Mile High United Way, Boys and Girls Clubs, Boy Scouts, Colorado Business Committee for the Arts, Economic Club of Colorado and Metro Denver Network. Oversees 47 portfolios in the OppenheimerFunds complex. Mr. Vaughn has served on the Boards of certain Oppenheimer funds since 2012, during which time he has become familiar with the Fund’s (and other Oppenheimer funds’) financial, accounting, regulatory and investment matters and has contributed to the Boards’ deliberations. |
INTERESTED TRUSTEE AND OFFICER | | Mr. Steinmetz is an “Interested Trustee” because he is affiliated with the Manager and the Sub-Adviser by virtue of his positions as Chairman and director of the Sub-Adviser and officer and director of the Manager. Both as a Trustee and as an officer, Mr. Steinmetz serves for an indefinite term, or until his resignation, retirement, death or removal. Mr. Steinmetz’s address is 225 Liberty Street, New York, New York 10281-1008. |
| |
Arthur P. Steinmetz, Trustee (Since 2015), President and Principal Executive Officer (since 2014) Year of Birth: 1958 | | Chairman of OppenheimerFunds, Inc. (since January 2015); CEO and Chairman of OFI Global Asset Management, Inc. (since July 2014), President of OFI Global Asset Management, Inc. (since May 2013), a Director of OFI Global Asset Management, Inc. (since January 2013), Director of OppenheimerFunds, Inc. (since July 2014), President, Management Director and CEO of Oppenheimer Acquisition Corp. (OppenheimerFunds, Inc.’s parent holding company) (since July 2014), and President and Director of OFI SteelPath, Inc. (since January 2013). Chief Investment Officer of the OppenheimerFunds advisory entities from (January 2013-December 2013); Executive Vice President of OFI Global Asset Management, Inc. (January 2013-May 2013); Chief Investment Officer of OppenheimerFunds, Inc. (October 2010-December 2012); Chief Investment Officer, Fixed- Income, of OppenheimerFunds, Inc. (April 2009-October 2010); Executive Vice President of OppenheimerFunds, Inc. (October 2009-December 2012); Director of Fixed Income of OppenheimerFunds, Inc. (January 2009-April 2009); and a Senior Vice President of OppenheimerFunds, Inc. (March 1993-September 2009). An officer of 103 portfolios in the OppenheimerFunds complex. |
OTHER OFFICERS OF THE FUND | | The addresses of the Officers in the chart below are as follows: for Messrs. Govil, Ram, Larson, Mss. Lo Bessette, Foxson and Picciotto, 225 Liberty Street, New York, New York 10281-1008, for Mr. Petersen, 6803 S. Tucson Way, Centennial, Colorado 80112-3924. Each Officer serves for an indefinite term or until his or her resignation, retirement, death or removal. |
| |
Manind Govil, Vice President (since 2009) Year of Birth: 1969 | | Senior Vice President, the Main Street Team Leader and a portfolio manager of the Sub-Adviser (since May 2009). Portfolio manager with RS Investment Management Co. LLC (October 2006-March 2009). Head of equity investments at The Guardian Life Insurance Company of America (August 2005-October 2006) when Guardian Life Insurance acquired an interest in RS Investment Management Co. LLC. Lead portfolio manager - large cap blend/core equity, co-head of equities and head of equity research (2001-July 2005), and was lead portfolio manager - core equity (April 1996-July 2005), at Mercantile Capital Advisers, Inc. A portfolio manager and officer of other portfolios in the OppenheimerFunds complex. |
| |
Benjamin Ram, Vice President (since 2009) Year of Birth: 1972 | | Vice President of the Sub-Adviser (since May 2009); Senior Portfolio Manager of the Sub-Adviser (since January 2011) and Portfolio Manager of the Sub-Adviser (May 2009-December 2010). Sector manager for financial investments and a co portfolio manager for mid-cap portfolios with the RS Core Equity Team of RS Investment Management Co. LLC (October 2006-May 2009). Portfolio Manager of Mid Cap Strategies, Sector Manager Financials at The Guardian Life Insurance Company of America (January 2006-October 2006) when Guardian Life Insurance acquired an interest in RS Investment Management Co. LLC. Financial analyst (2003-2005), and co-portfolio manager (2005-2006) at Mercantile Capital Advisers, Inc.; bank analyst at Legg Mason Securities (2000-2003) and a senior financial analyst at the CitiFinancial division of Citigroup, Inc. (1997-2000). A portfolio manager and officer of other portfolios in the OppenheimerFunds complex. |
| |
Paul Larson, Vice President (since 2014) Year of Birth: 1971 | | Vice President of the Sub-Adviser (since January 2013). Prior to joining the Sub-Adviser, he was a portfolio manager and Chief Equity Strategist at Morningstar. He was previously an analyst at Morningstar covering the energy sector and oversaw the firm’s natural resources analysts. Prior to joining Morningstar in 2002, Mr. Larson was an analyst with The Motley Fool. A portfolio manager and officer of other portfolios in the OppenheimerFunds complex. |
28 OPPENHEIMER MAIN STREET FUND/VA
| | |
| |
Cynthia Lo Bessette, Secretary and Chief Legal Officer (since 2016) Year of Birth: 1969 | | Executive Vice President, General Counsel and Secretary of the Manager (since February 2016); Chief Legal Officer of the Sub-Adviser and the Distributor (since February 2016); Vice President, General Counsel and Secretary of Oppenheimer Acquisition Corp. (since February 2016); General Counsel of OFI SteelPath, Inc., VTL Associates, LLC and Index Management Solutions, LLC (since February 2016); Chief Legal Officer of OFI Global Institutional, Inc., HarbourView Asset Management Corporation, OFI Global Trust Company, Oppenheimer Real Asset Management, Inc., OFI Private Investments Inc., Shareholder Services, Inc. and Trinity Investment Management Corporation (since February 2016); Senior Vice President and Deputy General Counsel (March 2015-February 2016) and Executive Vice President, Vice President, Corporate Counsel (February 2012-March 2015) and Deputy Chief Legal Officer (April 2013-March 2015) of Jennison Associates LLC; Assistant General Counsel (April 2008-September 2009) and Deputy General Counsel (October 2009-February 2012) of Lord Abbett & Co. LLC. An officer of 103 portfolios in the OppenheimerFunds complex. |
| |
Jennifer Foxson, Vice President and Chief Business Officer (since 2014) Year of Birth: 1969 | | Senior Vice President of OppenheimerFunds Distributor, Inc. (since June 2014); Vice President of OppenheimerFunds Distributor, Inc. (April 2006-June 2014); Vice President of the Sub-Adviser (January 1998-March 2006); Assistant Vice President of the Sub-Adviser (October 1991-December 1998). An officer of 103 portfolios in the OppenheimerFunds complex. |
| |
Mary Ann Picciotto, Chief Compliance Officer and Chief Anti-Money Laundering Officer (since 2014) Year of Birth: 1973 | | Senior Vice President and Chief Compliance Officer of the Manager (since March 2014); Chief Compliance Officer of the Sub- Adviser, OFI SteelPath, Inc., OFI Global Trust Company, OFI Global Institutional, Inc., Oppenheimer Real Asset Management, Inc., OFI Private Investments, Inc., Harborview Asset Management Corporation, Trinity Investment Management Corporation, and Shareholder Services, Inc. (since March 2014); Managing Director of Morgan Stanley Investment Management Inc. and certain of its various affiliated entities; Chief Compliance Officer of various Morgan Stanley Funds (May 2010-January 2014); Chief Compliance Officer of Morgan Stanley Investment Management Inc. (April 2007-January 2014). An officer of 103 portfolios in the OppenheimerFunds complex. |
| |
Brian S. Petersen, Treasurer and Principal Financial & Accounting Officer (since 2016) Year of Birth: 1970 | | Vice President of the Manager (since January 2013); Vice President of the Sub-Adviser (February 2007-December 2012); Assistant Vice President of the Sub-Adviser (August 2002-2007). An officer of 103 portfolios in the OppenheimerFunds complex. |
The Fund’s Statement of Additional Information contains additional information about the Fund’s Trustees and Officers and is available without charge, upon request, by calling 1.800.988.8287.
29 OPPENHEIMER MAIN STREET FUND/VA
THIS PAGE INTENTIONALLY LEFT BLANK.
30 OPPENHEIMER MAIN STREET FUND/VA
THIS PAGE INTENTIONALLY LEFT BLANK.
31 OPPENHEIMER MAIN STREET FUND/VA
OPPENHEIMER MAIN STREET FUND/VA
A Series of Oppenheimer Variable Account Funds
| | |
| Manager | | OFI Global Asset Management, Inc. |
| |
| Sub-Adviser | | OppenheimerFunds, Inc. |
| |
| Distributor | | OppenheimerFunds Distributor, Inc. |
| |
| Transfer and | | OFI Global Asset Management, Inc. |
Shareholder | | |
Servicing Agent | | |
| |
| Sub-Transfer Agent | | Shareholder Services, Inc. |
| | DBA OppenheimerFunds Services |
| |
| Independent | | KPMG LLP |
Registered | | |
Public | | |
Accounting | | |
Firm | | |
| |
| Legal Counsel | | Ropes & Gray LLP |
| |
| | Before investing in any of the Oppenheimer funds, investors should carefully consider a fund’s investment objectives, risks, charges and expenses. Fund prospectuses and summary prospectuses contain this and other information about the funds, and may be obtained by asking your financial advisor, or calling us at 1.800.988.8287. Read prospectuses and summary prospectuses carefully before investing. |
| |
| | © 2017 OppenheimerFunds, Inc. All rights reserved. Oppenheimer funds are distributed by OppenheimerFunds Distributor, Inc. |


December 31, 2016
| | | | | | |
| | | | | | |
| | Oppenheimer | | Annual Report | | |
| | Main Street Small Cap Fund/VA | | |
| | A Series of Oppenheimer Variable Account Funds | | |
| | | | | | |
ANNUAL REPORT
Listing of Top Holdings
Fund Performance Discussion
Financial Statements
PORTFOLIO MANAGERS: Matthew P. Ziehl, CFA, Raymond Anello, CFA, Raman Vardharaj, CFA, Joy Budzinski, Kristin Ketner, Magnus Krantz and Adam Weiner.
AVERAGE ANNUAL TOTAL RETURNS FOR THE PERIODS ENDED 12/31/16
| | | | | | | | | | | | | | | | | | | | |
| | | Inception
Date | | | | | | 1-Year | | 5-Year | | 10-Year |
Non-Service Shares | | | 5/1/98 | | | | | | | | 18.05% | | | | 15.65% | | | | 7.72% | |
Service Shares | | | 7/16/01 | | | | | | | | 17.67 | | | | 15.34 | | | | 7.45 | |
Russell 2000 Index | | | | | | | | | | | 21.31 | | | | 14.46 | | | | 7.07 | |
The performance data quoted represents past performance, which does not guarantee future results. The investment return and principal value of an investment in the Fund will fluctuate so that an investor’s shares, when redeemed, may be worth more or less than their original cost. Current performance may be lower or higher than the performance quoted. For performance data current to the most recent month end, call us at 1.800.988.8287. The Fund’s total returns should not be expected to be the same as the returns of other funds, whether or not both funds have the same portfolio managers and/or similar names. The Fund’s total returns include changes in share price and reinvested distributions but do not include the charges associated with the separate account products that offer this Fund. Such performance would have been lower if such charges were taken into account.
TOP HOLDINGS AND ALLOCATIONS
TOP TEN COMMON STOCK HOLDINGS
| | | | |
Korn/Ferry International | | | 2.2% | |
On Assignment, Inc. | | | 2.2 | |
Prestige Brands Holdings, Inc. | | | 2.1 | |
MB Financial, Inc. | | | 2.1 | |
CACI International, Inc., Cl. A | | | 1.9 | |
Webster Financial Corp. | | | 1.7 | |
Sonic Corp. | | | 1.7 | |
Portland General Electric Co. | | | 1.7 | |
Group 1 Automotive, Inc. | | | 1.6 | |
BankUnited, Inc. | | | 1.6 | |
Portfolio holdings and allocations are subject to change. Percentages are as of December 31, 2016, and are based on net assets. For more current Fund holdings, please visit oppenheimerfunds.com.
SECTOR ALLOCATION
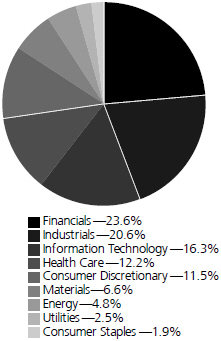
Portfolio holdings and allocations are subject to change. Percentages are as of December 31, 2016, and are based on the total market value of common stocks.
2 OPPENHEIMER MAIN STREET SMALL CAP FUND/VA
Fund Performance Discussion
During the reporting period, the Fund’s Non-Service shares produced a return of 18.05%. In comparison, the Fund underperformed the Russell 2000 Index (the “Index”), which returned 21.31%. The Fund underperformed the Index in the information technology, materials and industrials sectors, due to weaker relative stock selection. The Fund outperformed the Index in the health care, energy and utilities sectors, where stock selection benefited.
MARKET OVERVIEW
Markets were turbulent during the reporting period. However, despite the volatility, the Index and the Fund experienced gains, particularly after the November U.S. Presidential election. A large trend for the first half of 2016 was the demand for so-called “bond proxy stocks” with above average dividend yields. This trend was magnified post the Brexit vote as treasury yields, already at historic lows, were under further pressure and future interest rate hike expectations continued to be pushed further out. However, the market environment shifted over the third quarter of 2016, when the “risk-on” trade returned. This meant a sharp rebound in lower quality cyclicals, outperformance by smaller versus larger cap stocks, and a rotation away from more stable earnings and defensive-oriented higher dividend companies. This theme continued through year end.
The one-year reporting period saw the market driven by several important macroeconomic trends and events:
| • | | The U.S. election, which saw Republicans take the White House and maintain control of Congress. |
| | • | | Given above, significant policy changes are expected surrounding taxation, cross-border trade, regulatory burdens, and healthcare. |
| | • | | With these changes, a broad shift from monetary stimuli to inflationary fiscal stimuli. |
| • | | Uncertainty over the pace of Federal Reserve interest rate hikes. |
| • | | The U.S. dollar materially strengthening versus other currencies. |
| • | | Continued slow but steady recovery in domestic consumer employment, wages and consumption. |
| • | | Continued impact of Brexit and increased uncertainty for global markets as a result. |
| • | | Competitive currency devaluations, including negative interest rates in a growing number of jurisdictions, thrusting the world economy into uncharted territory. |
As investors, it is important to know what is and what is not within one’s circle of competence. As such, we strive to keep the portfolio in an all-weather orientation. Whether rates, commodity prices, currencies or even whole economies go up or down, our goal is to have a portfolio that can out-perform no matter the environment.
Second, we believe we have the skills to identify company management teams that are likely to successfully execute on their plans. Lastly, correctly valuing stocks and seeing what expectations the market is pricing in is also within our skillset. It is not by accident that we weight the portfolio more heavily towards companies that we believe have management teams that are executing (e.g. gaining market share, expanding profit margins), with at least reasonable stock valuations.
TOP INDIVIDUAL CONTRIBUTORS
Fund holdings that were contributors to performance this period included WellCare Health Plans, Inc., Burlington Stores, Inc. and MKS Instruments, Inc. WellCare is a managed care company for government-sponsored healthcare coverage, with a focus on Medicare and Medicaid programs. Investors reacted favorably over the first quarter of the year when the company updated its longer term growth goals of doubling its revenue within five years and attaining an after tax margin of at least 2%. WellCare also has a strong cash position and this, combined with a new credit facility, has increased deployable cash for potential acquisitions and accelerating growth. Burlington owns and operates branded apparel retail stores throughout the U.S. and Puerto Rico. During the fourth quarter of 2015 both weather and secular issues negatively impacted apparel retailers and department stores—pushing earnings down by 10%-15% for many. In contrast, Burlington executed extremely well and grew earnings despite being in the early stages of a transition to an off-price retail model. Management’s success in a challenging environment led to rising investor confidence and boosted the stock higher. MKS Instruments is a global provider of instruments, subsystems and process control solutions that measure, control, power, monitor and analyze critical parameters of advanced manufacturing processes to improve process performance and productivity. During the reporting period, the company benefited from completing its acquisition of Newport Corporation, a worldwide leader in photonics solutions. MKS Instruments also reported several quarters of strong earnings.
3 OPPENHEIMER MAIN STREET SMALL CAP FUND/VA
TOP INDIVIDUAL DETRACTORS
Top detractors from performance included MDC Partners, Inc., Imperva, Inc. and Diplomat Pharmacy, Inc. We exited our position in these three stocks. Advertising agency, MDC Holdings, had a difficult year, and failed to meet revenue goals over its third quarter of 2016. Imperva develops protection software and services for databases and business applications. Over the first half of the period, positive quarterly results were overshadowed by a conservative outlook relative to lofty expectations, especially on bottom line earnings per share (EPS). Its shares fell again late in the period after reports indicated a hold put on the company’s potential sale. Shares of Diplomat Pharmacy fell after the company reported weak third quarter earnings.
STRATEGY & OUTLOOK
While bottom-up company research and stock selection continue to be central to our process and strategy, we do have some observations about the current environment. First, the U.S. economy continues its “slow and steady” growth. This is being driven by favorable employment and inflation data, while home prices and innovation also continue to help drive the economy higher. However, the potential for protectionist trade policies by the incoming Trump administration could cause global contagion by slowing global trade.
U.S. corporate revenues, earnings, and free cash flow have resumed their moderate growth. The post-election strength in U.S. equity markets and the return of the “risk on trade” indicates that consensus expects earnings growth to accelerate further in the quarters ahead.
We believe the risks inherent to this market include the misallocation of capital, fueled by an environment of ongoing relatively low interest rates and possibly leading to “bubble-like” valuations for some companies. We intend to maintain our discipline around valuation. Additionally, while innovation is alive and well, and continuing to help generate economic growth, fundamental disruptions across market segments have been elevated. We continue to be focused on potential disruption risk to our companies.
We expect heightened uncertainty to return in the equity markets. Traditionally, during periods of economic uncertainty and heightened market volatility, investors favor stocks of higher quality companies—with greater consistency and stability of revenue and earnings—leading to relatively better stock performance of those companies. We think focusing on companies with economic moats and skilled management teams positions us well, should this environment come to pass. During times of economic volatility such companies frequently widen their lead over weaker competitors. We seek to invest in companies, characterized by these qualities, at compelling valuations and believe this disciplined approach is essential to generating superior long-term performance.
Investors should consider the Fund’s investment objective, risks, charges and expenses carefully before investing. The Fund’s prospectus and summary prospectus contain this and other information about the Fund, and may be obtained by asking your financial advisor or calling us at 1.800.988.8287. Read prospectuses and summary prospectuses carefully before investing.
Total returns include changes in share price and reinvestment of dividends and capital gains distributions in a hypothetical investment for the periods shown, but do not include the charges associated with the separate account products that offer this Fund.
The Fund’s investment strategy and focus can change over time. The mention of specific fund holdings does not constitute a recommendation by OppenheimerFunds, Inc. or its affiliates.
Shares of Oppenheimer funds are not deposits or obligations of any bank, are not guaranteed by any bank, are not insured by the FDIC or any other agency, and involve investment risks, including the possible loss of the principal amount invested
Comparing the Fund’s Performance to the Market. The graphs that follow show the performance of a hypothetical $10,000 investment in each share class of the Fund held until December 31, 2016. Performance is measured over a ten-fiscal-year period for both Classes. Performance information does not reflect charges that apply to separate accounts investing in the Fund. If these charges were taken into account, performance would be lower. The graphs assume that all dividends and capital gains distributions were reinvested in additional shares.
The Fund’s performance is compared to the performance of the Russell 2000 Index. The Russell 2000 Index measures the performance of the small-cap segment of the U.S. equity universe. The Russell 2000 Index is a subset of the Russell 3000 Index representing approximately 10% of the total market capitalization of that index. It includes approximately 2000 of the smallest securities based on a combination of their market cap and current index membership. The index is unmanaged and cannot be purchased directly by investors. While index comparisons may be useful to provide a benchmark for the Fund’s performance, it must be noted that the Fund’s investments are not limited to the investments comprising the Index. Index performance includes reinvestment of income, but does not
4 OPPENHEIMER MAIN STREET SMALL CAP FUND/VA
reflect transaction costs, fees, expenses or taxes. Index performance is shown for illustrative purposes only as a benchmark for the Fund’s performance, and does not predict or depict performance of the Fund. The Fund’s performance reflects the effects of the Fund’s business and operating expenses.
COMPARISON OF CHANGE IN VALUE OF $10,000 HYPOTHETICAL INVESTMENTS IN:
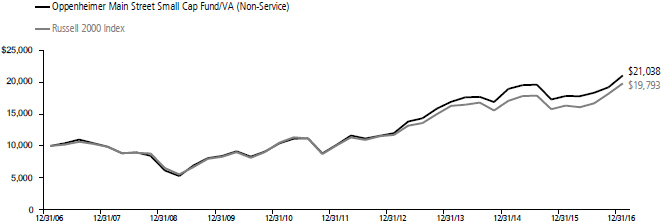
COMPARISON OF CHANGE IN VALUE OF $10,000 HYPOTHETICAL INVESTMENTS IN:
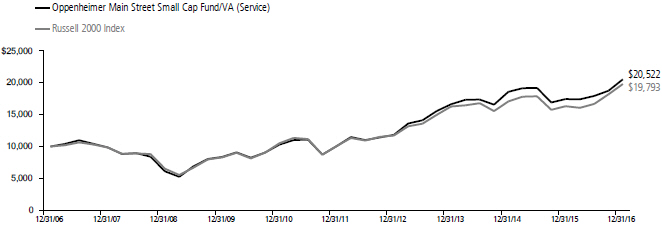
The performance data quoted represents past performance, which does not guarantee future results. The investment return and principal value of an investment in the Fund will fluctuate so that an investor’s shares, when redeemed, may be worth more or less than their original cost. Current performance may be lower or higher than the performance quoted. For performance data current to the most recent month end, call us at 1.800.988.8287. The Fund’s total returns should not be expected to be the same as the returns of other funds, whether or not both funds have the same portfolio managers and/or similar names. The Fund’s total returns include changes in share price and reinvested distributions but do not include the charges associated with the separate account products that offer this Fund. Such performance would have been lower if such charges were taken into account.
5 OPPENHEIMER MAIN STREET SMALL CAP FUND/VA
Fund Expenses
Fund Expenses. As a shareholder of the Fund, you incur two types of costs: (1) transaction costs and (2) ongoing costs, including management fees; distribution and service fees; and other Fund expenses. These examples are intended to help you understand your ongoing costs (in dollars) of investing in the Fund and to compare these costs with the ongoing costs of investing in other mutual funds.
The examples are based on an investment of $1,000.00 invested at the beginning of the period and held for the entire 6-month period ended December 31, 2016.
Actual Expenses. The first section of the table provides information about actual account values and actual expenses. You may use the information in this section for the class of shares you hold, together with the amount you invested, to estimate the expense that you paid over the period. Simply divide your account value by $1,000.00 (for example, an $8,600.00 account value divided by $1,000.00 = 8.60), then multiply the result by the number in the first section under the heading entitled “Expenses Paid During 6 Months Ended December 31, 2016” to estimate the expenses you paid on your account during this period.
Hypothetical Example for Comparison Purposes.
The second section of the table provides information about hypothetical account values and hypothetical expenses based on the Fund’s actual expense ratio for each class of shares, and an assumed rate of return of 5% per year for each class before expenses, which is not the actual return. The hypothetical account values and expenses may not be used to estimate the actual ending account balance or expenses you paid for the period. You may use this information to compare the ongoing costs of investing in the Fund and other funds. To do so, compare this 5% hypothetical example for the class of shares you hold with the 5% hypothetical examples that appear in the shareholder reports of the other funds.
Please note that the expenses shown in the table are meant to highlight your ongoing costs only and do not reflect any charges associated with the separate accounts that offer this Fund. Therefore, the “hypothetical” lines of the table are useful in comparing ongoing costs only, and will not help you determine the relative total costs of owning different funds. In addition, if these separate account charges were included your costs would have been higher.
| | | | | | | | | | | | |
| Actual | | Beginning Account Value July 1, 2016 | | | Ending Account Value December 31, 2016 | | | Expenses Paid During 6 Months Ended December 31, 2016 | |
Non-Service shares | | $ | 1,000.00 | | | $ | 1,147.20 | | | $ | 4.33 | |
Service shares | | | 1,000.00 | | | | 1,145.10 | | | | 5.68 | |
| | | |
Hypothetical | | | | | | | | | | | | |
(5% return before expenses) | | | | | | | | | | | | |
Non-Service shares | | | 1,000.00 | | | | 1,021.11 | | | | 4.07 | |
Service shares | | | 1,000.00 | | | | 1,019.86 | | | | 5.35 | |
Expenses are equal to the Fund’s annualized expense ratio for that class, multiplied by the average account value over the period, multiplied by 184/366 (to reflect the one-half year period). Those annualized expense ratios, excluding indirect expenses from affiliated funds, based on the 6-month period ended December 31, 2016 are as follows:
| | | | |
| Class | | Expense Ratios | |
Non-Service shares | | | 0.80% | |
Service shares | | | 1.05 | |
The expense ratios reflect voluntary and/or contractual waivers and/or reimbursements of expenses by the Fund’s Manager. Some of these undertakings may be modified or terminated at any time, as indicated in the Fund’s prospectus. The “Financial Highlights” tables in the Fund’s financial statements, included in this report, also show the gross expense ratios, without such waivers or reimbursements and reduction to custodian expenses, if applicable.
6 OPPENHEIMER MAIN STREET SMALL CAP FUND/VA
STATEMENT OF INVESTMENTS December 31, 2016
| | | | | | | | |
| | | Shares | | | Value | |
| Common Stocks—98.1% | |
Consumer Discretionary—11.3% | |
Auto Components—1.2% | | | | | | | | |
Visteon Corp. | | | 158,250 | | | $ | 12,713,805 | |
| | | | | | | | | |
Diversified Consumer Services—0.5% | |
Houghton Mifflin Harcourt Co.1 | | | 506,420 | | | | 5,494,657 | |
| | | | | | | | | |
Hotels, Restaurants & Leisure—4.3% | |
International Speedway Corp., Cl. A | | | 52,728 | | | | 1,940,391 | |
Popeyes Louisiana Kitchen, Inc.1 | | | 236,890 | | | | 14,327,107 | |
Sonic Corp. | | | 676,740 | | | | 17,940,377 | |
| Texas Roadhouse, Inc., Cl. A | | | 250,230 | | | | 12,071,095 | |
| | | | | | | 46,278,970 | |
| | | | | | | | | |
Media—0.7% | | | | | | | | |
Madison Square Garden Co. (The), Cl. A1 | | | 45,450 | | | | 7,795,130 | |
| | | | | | | | | |
Specialty Retail—4.6% | | | | | | | | |
Burlington Stores, Inc.1 | | | 120,830 | | | | 10,240,342 | |
DSW, Inc., Cl. A | | | 351,470 | | | | 7,960,796 | |
Group 1 Automotive, Inc. | | | 221,800 | | | | 17,287,092 | |
| Sally Beauty Holdings, Inc.1 | | | 519,720 | | | | 13,731,002 | |
| | | | | | | 49,219,232 | |
| | | | | | | | | |
Consumer Staples—1.8% | | | | | | | | |
Beverages—0.8% | | | | | | | | |
Boston Beer Co., Inc. (The), Cl. A1 | | | 47,620 | | | | 8,088,257 | |
| | | | | | | | | |
Food Products—1.0% | | | | | | | | |
Pinnacle Foods, Inc. | | | 205,350 | | | | 10,975,958 | |
| | | | | | | | | |
Energy—4.7% | | | | | | | | |
Energy Equipment & Services—0.6% | |
RigNet, Inc.1 | | | 286,580 | | | | 6,634,327 | |
| | | | | | | | | |
Oil, Gas & Consumable Fuels—4.1% | |
Cone Midstream Partners LP2 | | | 357,943 | | | | 8,429,558 | |
HollyFrontier Corp. | | | 411,615 | | | | 13,484,507 | |
Matador Resources Co.1 | | | 202,032 | | | | 5,204,344 | |
Noble Midstream Partners LP1,2 | | | 185,706 | | | | 6,685,416 | |
| Renewable Energy Group, Inc.1 | | | 1,076,323 | | | | 10,440,333 | |
| | | | | | | 44,244,158 | |
| | | | | | | | | |
Financials—23.2% | | | | | | | | |
Capital Markets—1.0% | | | | | | | | |
Stifel Financial Corp.1 | | | 210,100 | | | | 10,494,495 | |
| | | | | | | | | |
Commercial Banks—10.1% | | | | | | | | |
BankUnited, Inc. | | | 455,595 | | | | 17,171,376 | |
Berkshire Hills Bancorp, Inc. | | | 217,310 | | | | 8,007,873 | |
Chemical Financial Corp. | | | 194,376 | | | | 10,529,348 | |
Customers Bancorp, Inc.1 | | | 217,140 | | | | 7,777,955 | |
FCB Financial Holdings, Inc., Cl. A1 | | | 162,620 | | | | 7,756,974 | |
IBERIABANK Corp. | | | 199,750 | | | | 16,729,062 | |
MB Financial, Inc. | | | 464,990 | | | | 21,961,478 | |
| Webster Financial Corp. | | | 336,460 | | | | 18,263,049 | |
| | | | | | | 108,197,115 | |
| | | | | | | | | |
Insurance—1.3% | | | | | | | | |
James River Group Holdings Ltd. | | | 325,230 | | | | 13,513,307 | |
| | | | | | | | | |
Real Estate Investment Trusts (REITs)—7.6% | |
Brandywine Realty Trust | | | 962,010 | | | | 15,882,785 | |
CYS Investments, Inc. | | | 1,788,150 | | | | 13,822,400 | |
DiamondRock Hospitality Co. | | | 1,069,410 | | | | 12,330,297 | |
DuPont Fabros Technology, Inc. | | | 282,830 | | | | 12,424,722 | |
Four Corners Property Trust, Inc. | | | 667,520 | | | | 13,697,510 | |
| National Storage Affiliates Trust | | | 577,426 | | | | 12,743,792 | |
| | | | | | | 80,901,506 | |
| | | | | | | | | |
Real Estate Management & Development—0.8% | |
Realogy Holdings Corp. | | | 320,880 | | | | 8,256,242 | |
| | | | | | | | | |
Thrifts & Mortgage Finance—2.4% | |
Beneficial Bancorp, Inc. | | | 410,630 | | | | 7,555,592 | |
| | | | | | | | |
| | | Shares | | | Value | |
Thrifts & Mortgage Finance (Continued) | |
Oritani Financial Corp. | | | 688,900 | | | $ | 12,916,875 | |
WSFS Financial Corp. | | | 113,710 | | | | 5,270,458 | |
| | | | | | | 25,742,925 | |
| | | | | | | | | |
Health Care—12.0% | | | | | | | | |
Biotechnology—2.0% | | | | | | | | |
ACADIA Pharmaceuticals, Inc.1 | | | 159,240 | | | | 4,592,481 | |
Axovant Sciences Ltd.1 | | | 155,730 | | | | 1,934,167 | |
Clovis Oncology, Inc.1 | | | 77,040 | | | | 3,422,117 | |
Exelixis, Inc.1 | | | 99,340 | | | | 1,481,159 | |
Sage Therapeutics, Inc.1 | | | 83,680 | | | | 4,272,701 | |
| Ultragenyx Pharmaceutical, Inc.1 | | | 80,860 | | | | 5,685,267 | |
| | | | | | | 21,387,892 | |
| | | | | | | | | |
Health Care Equipment & Supplies—2.8% | |
NuVasive, Inc.1 | | | 148,250 | | | | 9,986,120 | |
NxStage Medical, Inc.1 | | | 438,980 | | | | 11,505,666 | |
| Spectranetics Corp. (The)1 | | | 330,390 | | | | 8,094,555 | |
| | | | | | | 29,586,341 | |
| | | | | | | | | |
Health Care Providers & Services—3.4% | |
Addus HomeCare Corp.1 | | | 110,400 | | | | 3,869,520 | |
Amedisys, Inc.1 | | | 216,720 | | | | 9,238,773 | |
HealthSouth Corp. | | | 305,900 | | | | 12,615,316 | |
| WellCare Health Plans, Inc.1 | | | 78,321 | | | | 10,736,243 | |
| | | | | | | 36,459,852 | |
| | | | | | | | | |
Life Sciences Tools & Services—0.7% | |
VWR Corp.1 | | | 287,860 | | | | 7,205,136 | |
| | | | | | | | | |
Pharmaceuticals—3.1% | | | | | | | | |
Akorn, Inc.1 | | | 146,810 | | | | 3,204,862 | |
Intersect ENT, Inc.1 | | | 298,050 | | | | 3,606,405 | |
Prestige Brands Holdings, Inc.1 | | | 423,986 | | | | 22,089,671 | |
| TherapeuticsMD, Inc.1 | | | 752,150 | | | | 4,339,905 | |
| | | | | | | 33,240,843 | |
| | | | | | | | | |
Industrials—20.1% | | | | | | | | |
Aerospace & Defense—1.3% | | | | | | | | |
Hexcel Corp. | | | 127,070 | | | | 6,536,481 | |
| Wesco Aircraft Holdings, Inc.1 | | | 520,830 | | | | 7,786,408 | |
| | | | | | | 14,322,889 | |
| | | | | | | | | |
Airlines—1.4% | | | | | | | | |
Spirit Airlines, Inc.1 | | | 251,150 | | | | 14,531,539 | |
| | | | | | | | | |
Building Products—1.2% | | | | | | | | |
Masonite International Corp.1 | | | 197,600 | | | | 13,002,080 | |
| | | | | | | | | |
Commercial Services & Supplies—4.9% | |
ABM Industries, Inc. | | | 385,520 | | | | 15,744,637 | |
ACCO Brands Corp.1 | | | 1,171,907 | | | | 15,293,386 | |
Advanced Disposal Services, Inc.1 | | | 312,270 | | | | 6,938,640 | |
| Matthews International Corp., Cl. A | | | 187,440 | | | | 14,404,764 | |
| | | | | | | 52,381,427 | |
| | | | | | | | | |
Construction & Engineering—1.9% | |
Dycom Industries, Inc.1 | | | 127,400 | | | | 10,228,946 | |
| KBR, Inc. | | | 602,120 | | | | 10,049,383 | |
| | | | | | | 20,278,329 | |
| | | | | | | | | |
Electrical Equipment—1.3% | | | | | | | | |
Generac Holdings, Inc.1 | | | 348,580 | | | | 14,201,149 | |
| | | | | | | | | |
Machinery—1.9% | | | | | | | | |
Greenbrier Cos., Inc. (The) | | | 172,680 | | | | 7,174,854 | |
Manitowoc Co., Inc. (The)1 | | | 910,770 | | | | 5,446,405 | |
| Rexnord Corp.1 | | | 413,810 | | | | 8,106,538 | |
| | | | | | | 20,727,797 | |
| | | | | | | | | |
Professional Services—4.5% | | | | | | | | |
Korn/Ferry International | | | 813,461 | | | | 23,940,157 | |
| On Assignment, Inc.1 | | | 538,930 | | | | 23,799,149 | |
| | | | | | | 47,739,306 | |
7 OPPENHEIMER MAIN STREET SMALL CAP FUND/VA
STATEMENT OF INVESTMENTS Continued
| | | | | | | | |
| | | Shares | | | Value | |
Road & Rail—1.2% | |
Genesee & Wyoming, Inc., Cl. A1 | | | 188,090 | | | $ | 13,055,327 | |
| | | | | | | | | |
Trading Companies & Distributors—0.5% | |
SiteOne Landscape Supply, Inc.1 | | | 162,700 | | | | 5,650,571 | |
| | | | | | | | | |
Information Technology—16.1% | |
Electronic Equipment, Instruments, & Components—1.7% | |
SYNNEX Corp. | | | 90,000 | | | | 10,891,800 | |
| Vishay Intertechnology, Inc. | | | 424,710 | | | | 6,880,302 | |
| | | | | | | 17,772,102 | |
| | | | | | | | | |
Internet Software & Services—2.1% | | | | | | | | |
j2 Global, Inc. | | | 197,913 | | | | 16,189,283 | |
Yelp, Inc., Cl. A1 | | | 174,990 | | | | 6,672,369 | |
| | | | | | | 22,861,652 | |
| | | | | | | | | |
IT Services—4.2% | | | | | | | | |
Black Knight Financial Services, Inc., Cl. A1 | | | 345,872 | | | | 13,073,962 | |
Booz Allen Hamilton Holding Corp., Cl. A | | | 320,720 | | | | 11,568,370 | |
| CACI International, Inc., Cl. A1 | | | 159,030 | | | | 19,767,429 | |
| | | | | | | 44,409,761 | |
| | | | | | | | | |
Semiconductors & Semiconductor Equipment—3.7% | |
Brooks Automation, Inc. | | | 514,110 | | | | 8,775,858 | |
Cypress Semiconductor Corp. | | | 540,941 | | | | 6,188,365 | |
MaxLinear, Inc., Cl. A1 | | | 490,600 | | | | 10,695,080 | |
| MKS Instruments, Inc. | | | 225,050 | | | | 13,367,970 | |
| | | | | | | 39,027,273 | |
| | | | | | | | | |
Software—4.4% | | | | | | | | |
Guidewire Software, Inc.1 | | | 172,400 | | | | 8,504,492 | |
Paylocity Holding Corp.1 | | | 327,320 | | | | 9,822,873 | |
Pegasystems, Inc. | | | 305,200 | | | | 10,987,200 | |
| | | | | | | | |
| | | Shares | | | Value | |
Software (Continued) | | | | | | | | |
Proofpoint, Inc.1 | | | 132,080 | | | $ | 9,331,452 | |
| Zynga, Inc., Cl. A1 | | | 3,240,230 | | | | 8,327,391 | |
| | | | | | | 46,973,408 | |
| | | | | | | | | |
Materials—6.4% | | | | | | | | |
Chemicals—0.8% | | | | | | | | |
Ingevity Corp.1 | | | 145,270 | | | | 7,969,512 | |
| | | | | | | | | |
Construction Materials—1.1% | |
Summit Materials, Inc., Cl. A1 | | | 474,454 | | | | 11,287,261 | |
| | | | | | | | | |
Metals & Mining—2.0% | | | | | | | | |
Century Aluminum Co.1 | | | 607,180 | | | | 5,197,461 | |
| Kaiser Aluminum Corp. | | | 210,480 | | | | 16,352,191 | |
| | | | | | | 21,549,652 | |
| | | | | | | | | |
Paper & Forest Products—2.5% | |
Boise Cascade Co.1 | | | 444,750 | | | | 10,006,875 | |
| PH Glatfelter Co. | | | 698,500 | | | | 16,687,165 | |
| | | | | | | 26,694,040 | |
| | | | | | | | | |
Utilities—2.5% | | | | | | | | |
Electric Utilities—1.7% | | | | | | | | |
Portland General Electric Co. | | | 408,170 | | | | 17,686,006 | |
| | | | | | | | | |
Gas Utilities—0.8% | | | | | | | | |
| Suburban Propane Partners LP2 | | | 278,235 | | | | 8,363,744 | |
Total Common Stocks (Cost $817,823,149) | | | | 1,046,914,973 | |
| | | | | | | | |
| | | | | | | | | |
| | |
Investment Company—2.8% | | | | | | | | |
| Oppenheimer Institutional Government Money Market Fund, Cl. E, 0.43%3,4 (Cost $30,101,780) | | | 30,101,780 | | | | 30,101,780 | |
| Total Investments, at Value (Cost $847,924,929) | | | 100.9 | % | | | 1,077,016,753 | |
| Net Other Assets (Liabilities) | | | (0.9 | ) | | | (9,552,101 | ) |
Net Assets | | | 100.0 | % | | $ | 1,067,464,652 | |
| | | | | | | | |
Footnotes to Statement of Investments
1. Non-income producing security.
2. Security is a Master Limited Partnership.
3. Rate shown is the 7-day yield at period end.
4. Is or was an affiliate, as defined in the Investment Company Act of 1940, as amended, at or during the reporting period, by virtue of the Fund owning at least 5% of the voting securities of the issuer or as a result of the Fund and the issuer having the same investment adviser. Transactions during the reporting period in which the issuer was an affiliate are as follows:
| | | | | | | | | | | | | | | | |
| | | Shares December 31, 2015 | | | Gross Additions | | | Gross Reductions | | | Shares December 31, 2016 | |
| Oppenheimer Institutional Government Money Market Fund, Cl. Ea | | | 14,384,001 | | | | 330,528,421 | | | | 314,810,642 | | | | 30,101,780 | |
| | | | |
| | | | | | | | | Value | | | Income | |
| Oppenheimer Institutional Government Money Market Fund, Cl. Ea | | | | | | | | | | $ | 30,101,780 | | | $ | 78,925 | |
a. Prior to September 28, 2016, this fund was named Oppenheimer Institutional Money Market Fund.
See accompanying Notes to Financial Statements.
8 OPPENHEIMER MAIN STREET SMALL CAP FUND/VA
STATEMENT OF ASSETS AND LIABILITIES December 31, 2016
| | | | |
| | |
Assets | | | | |
Investments, at value—see accompanying statement of investments: | | | | |
Unaffiliated companies (cost $817,823,149) | | $ | 1,046,914,973 | |
Affiliated companies (cost $30,101,780) | | | 30,101,780 | |
| | | | 1,077,016,753 | |
Cash | | | 978,993 | |
Receivables and other assets: | | | | |
Dividends | | | 1,078,371 | |
Shares of beneficial interest sold | | | 434,278 | |
Investments sold | | | 40,192 | |
Other | | | 50,985 | |
Total assets | | | 1,079,599,572 | |
| | |
Liabilities | | | | |
Payables and other liabilities: | | | | |
Investments purchased | | | 10,540,607 | |
Shares of beneficial interest redeemed | | | 1,289,385 | |
Distribution and service plan fees | | | 195,531 | |
Trustees’ compensation | | | 46,347 | |
Shareholder communications | | | 37,194 | |
Other | | | 25,856 | |
Total liabilities | | | 12,134,920 | |
Net Assets | | $ | 1,067,464,652 | |
| | | | |
| | | | | |
| |
Composition of Net Assets | | | | |
Par value of shares of beneficial interest | | $ | 44,857 | |
Additional paid-in capital | | | 776,525,265 | |
Accumulated net investment income | | | 5,127,532 | |
Accumulated net realized gain on investments and foreign currency transactions | | | 56,675,174 | |
Net unrealized appreciation on investments and translation of assets and liabilities denominated in foreign currencies | | | 229,091,824 | |
Net Assets | | $ | 1,067,464,652 | |
| | | | |
| | | | | |
| |
Net Asset Value Per Share | | | | |
Non-Service Shares: | | | | |
Net asset value, redemption price per share and offering price per share (based on net assets of $145,427,852 and 6,040,539 shares of beneficial interest outstanding) | | | $24.08 | |
Service Shares: | | | | |
Net asset value, redemption price per share and offering price per share (based on net assets of $922,036,800 and 38,816,908 shares of beneficial interest outstanding) | | | $23.75 | |
See accompanying Notes to Financial Statements.
9 OPPENHEIMER MAIN STREET SMALL CAP FUND/VA
STATEMENT OF OPERATIONS For the Year Ended December 31, 2016
| | | | |
| | |
Investment Income | | | | |
Dividends: | | | | |
Unaffiliated companies (net of foreign withholding taxes of $17,147) | | $ | 15,093,669 | |
Affiliated companies | | | 78,925 | |
Interest | | | 96 | |
Total investment income | | | 15,172,690 | |
| | | | | |
Expenses | | | | |
Management fees | | | 6,726,921 | |
Distribution and service plan fees: | | | | |
Service shares | | | 2,125,027 | |
Transfer and shareholder servicing agent fees: | | | | |
Non-Service shares | | | 130,851 | |
Service shares | | | 850,630 | |
Shareholder communications: | | | | |
Non-Service shares | | | 13,751 | |
Service shares | | | 89,853 | |
Trustees’ compensation | | | 40,081 | |
Borrowing fees | | | 17,535 | |
Custodian fees and expenses | | | 5,004 | |
Other | | | 86,991 | |
Total expenses | | | 10,086,644 | |
Less reduction to custodian expenses | | | (474 | ) |
Less waivers and reimbursements of expenses | | | (90,251 | ) |
Net expenses | | | 9,995,919 | |
| | | | | |
Net Invest’ment Income | | | 5,176,771 | |
| | | | | |
| |
Realized and Unrealized Gain (Loss) | | | | |
Net realized gain on: | | | | |
Investment transactions in unaffiliated companies | | | 64,005,144 | |
Foreign currency transactions | | | 3,148 | |
Net realized gain | | | 64,008,292 | |
Net change in unrealized appreciation/depreciation on: | | | | |
Investment transactions | | | 97,917,025 | |
Translation of assets and liabilities denominated in foreign currencies | | | (6 | ) |
Net change in unrealized appreciation/depreciation | | | 97,917,019 | |
| | | | | |
Net Increase in Net Assets Resulting from Operations | | $ | 167,102,082 | |
| | | | |
See accompanying Notes to Financial Statements.
10 OPPENHEIMER MAIN STREET SMALL CAP FUND/VA
STATEMENTS OF CHANGES IN NET ASSETS
| | | | | | | | |
| | | Year Ended
December 31, 2016 | | | Year Ended
December 31, 2015 | |
Operations | | | | | | | | |
Net investment income | | $ | 5,176,771 | | | $ | 2,875,881 | |
Net realized gain | | | 64,008,292 | | | | 41,953,892 | |
Net change in unrealized appreciation/depreciation | | | 97,917,019 | | | | (107,664,132) | |
Net increase (decrease) in net assets resulting from operations | | | 167,102,082 | | | | (62,834,359) | |
| | | | | | | | | |
Dividends and/or Distributions to Shareholders | | | | | | | | |
Dividends from net investment income: | | | | | | | | |
Non-Service shares | | | (682,044) | | | | (1,186,413) | |
Service shares | | | (2,155,681) | | | | (5,919,665) | |
| | | (2,837,725) | | | | (7,106,078) | |
| | | | | | | | | |
Distributions from net realized gain: | | | | | | | | |
Non-Service shares | | | (5,056,400) | | | | (19,582,501) | |
Service shares | | | (33,184,812) | | | | (137,100,829) | |
| | | (38,241,212) | | | | (156,683,330) | |
| | | | | | | | | |
Beneficial Interest Transactions | | | | | | | | |
Net increase (decrease) in net assets resulting from beneficial interest transactions: | | | | | | | | |
Non-Service shares | | | (467,642) | | | | 21,318,007 | |
Service shares | | | (43,913,591) | | | | 86,089,174 | |
| | | (44,381,233) | | | | 107,407,181 | |
| | | | | | | | | |
Net Assets | | | | | | | | |
Total increase (decrease) | | | 81,641,912 | | | | (119,216,586) | |
Beginning of period | | | 985,822,740 | | | | 1,105,039,326 | |
| End of period (including accumulated net investment income of $5,127,532 and $2,764,432, respectively) | | $ | 1,067,464,652 | | | $ | 985,822,740 | |
| | | | | | | | |
See accompanying Notes to Financial Statements.
11 OPPENHEIMER MAIN STREET SMALL CAP FUND/VA
FINANCIAL HIGHLIGHTS
| | | | | | | | | | | | | | | | | | | | |
| Non-Service Shares | | Year Ended
December 31,
2016 | | | Year Ended
December 31,
2015 | | | Year Ended
December 31,
2014 | | | Year Ended
December 31,
2013 | | | Year Ended
December 31,
2012 | |
Per Share Operating Data | | | | | | | | | | | | | | | | | | | | |
Net asset value, beginning of period | | | $21.32 | | | | $26.56 | | | | $27.80 | | | | $20.14 | | | | $17.17 | |
Income (loss) from investment operations: | | | | | | | | | | | | | | | | | | | | |
Net investment income1 | | | 0.16 | | | | 0.12 | | | | 0.26 | | | | 0.16 | | | | 0.21 | |
Net realized and unrealized gain (loss) | | | 3.55 | | | | (1.28) | | | | 2.74 | | | | 8.01 | | | | 2.87 | |
Total from investment operations | | | 3.71 | | | | (1.16) | | | | 3.00 | | | | 8.17 | | | | 3.08 | |
Dividends and/or distributions to shareholders: | | | | | | | | | | | | | | | | | | | | |
Dividends from net investment income | | | (0.11) | | | | (0.23) | | | | (0.25) | | | | (0.22) | | | | (0.11) | |
Distributions from net realized gain | | | (0.84) | | | | (3.85) | | | | (3.99) | | | | (0.29) | | | | 0.00 | |
Total dividends and/or distributions to shareholders | | | (0.95) | | | | (4.08) | | | | (4.24) | | | | (0.51) | | | | (0.11) | |
Net asset value, end of period | | | $24.08 | | | | $21.32 | | | | $26.56 | | | | $27.80 | | | | $20.14 | |
| | | | | | | | | | | | | | | | | | | | |
| | | | | | | | | | | | | | | | | | | | | |
Total Return, at Net Asset Value2 | | | 18.05% | | | | (5.90)% | | | | 11.93% | | | | 41.01% | | | | 17.99% | |
| | | | | | | | | | | | | | | | | | | | | |
Ratios/Supplemental Data | | | | | | | | | | | | | | | | | | | | |
Net assets, end of period (in thousands) | | | $145,428 | | | | $129,104 | | | | $136,402 | | | | $134,692 | | | | $87,267 | |
Average net assets (in thousands) | | | $130,889 | | | | $134,932 | | | | $133,864 | | | | $113,522 | | | | $83,790 | |
Ratios to average net assets:3 | | | | | | | | | | | | | | | | | | | | |
Net investment income | | | 0.74% | | | | 0.49% | | | | 0.99% | | | | 0.67% | | | | 1.09% | |
Expenses excluding specific expenses listed below | | | 0.81% | | | | 0.80% | | | | 0.80% | | | | 0.81% | | | | 0.83% | |
Interest and fees from borrowings | | | 0.00%4 | | | | 0.00%4 | | | | 0.00% | | | | 0.00% | | | | 0.00% | |
Total expenses5 | | | 0.81% | | | | 0.80% | | | | 0.80% | | | | 0.81% | | | | 0.83% | |
| Expenses after payments, waivers and/or reimbursements and reduction to custodian expenses | | | 0.80% | | | | 0.80%6 | | | | 0.79% | | | | 0.80% | | | | 0.80% | |
Portfolio turnover rate | | | 65% | | | | 43% | | | | 65% | | | | 60% | | | | 92% | |
1. Per share amounts calculated based on the average shares outstanding during the period.
2. Assumes an initial investment on the business day before the first day of the fiscal period, with all dividends and distributions reinvested in additional shares on the reinvestment date, and redemption at the net asset value calculated on the last business day of the fiscal period. Total returns are not annualized for periods less than one full year. Total return information does not reflect expenses that apply at the separate account level or to related insurance products. Inclusion of these charges would reduce the total return figures for all periods shown. Returns do not reflect the deduction of taxes that a shareholder would pay on fund distributions or the redemption of fund shares.
3. Annualized for periods less than one full year.
4. Less than 0.005%.
5. Total expenses including indirect expenses from affiliated fund fees and expenses were as follows:
| | | | |
Year Ended December 31, 2016 | | | 0.81 | % |
Year Ended December 31, 2015 | | | 0.80 | % |
Year Ended December 31, 2014 | | | 0.80 | % |
Year Ended December 31, 2013 | | | 0.81 | % |
Year Ended December 31, 2012 | | | 0.83 | % |
6. Waiver was less than 0.005%.
See accompanying Notes to Financial Statements.
12 OPPENHEIMER MAIN STREET SMALL CAP FUND/VA
| | | | | | | | | | | | | | | | | | | | |
| Service Shares | | Year Ended
December 31,
2016 | | | Year Ended
December 31,
2015 | | | Year Ended
December 31,
2014 | | | Year Ended
December 31,
2013 | | | Year Ended
December 31,
2012 | |
Per Share Operating Data | | | | | | | | | | | | | | | | | | | | |
Net asset value, beginning of period | | | $21.05 | | | | $26.26 | | | | $27.53 | | | | $19.96 | | | | $17.02 | |
Income (loss) from investment operations: | | | | | | | | | | | | | | | | | | | | |
Net investment income1 | | | 0.10 | | | | 0.06 | | | | 0.19 | | | | 0.10 | | | | 0.15 | |
Net realized and unrealized gain (loss) | | | 3.49 | | | | (1.25) | | | | 2.71 | | | | 7.93 | | | | 2.85 | |
Total from investment operations | | | 3.59 | | | | (1.19) | | | | 2.90 | | | | 8.03 | | | | 3.00 | |
Dividends and/or distributions to shareholders: | | | | | | | | | | | | | | | | | | | | |
Dividends from net investment income | | | (0.05) | | | | (0.17) | | | | (0.18) | | | | (0.17) | | | | (0.06) | |
Distributions from net realized gain | | | (0.84) | | | | (3.85) | | | | (3.99) | | | | (0.29) | | | | 0.00 | |
Total dividends and/or distributions to shareholders | | | (0.89) | | | | (4.02) | | | | (4.17) | | | | (0.46) | | | | (0.06) | |
Net asset value, end of period | | | $23.75 | | | | $21.05 | | | | $26.26 | | | | $27.53 | | | | $19.96 | |
| | | | | | | | | | | | | | | | | | | | |
| | | | | | | | | | | | | | | | | | | | | |
Total Return, at Net Asset Value2 | | | 17.67% | | | | (6.09)% | | | | 11.66% | | | | 40.62% | | | | 17.67% | |
| | | | | | | | | | | | | | | | | | | | | |
Ratios/Supplemental Data | | | | | | | | | | | | | | | | | | | | |
Net assets, end of period (in thousands) | | | $922,037 | | | | $856,719 | | | | $968,637 | | | | $990,168 | | | | $849,920 | |
Average net assets (in thousands) | | | $850,883 | | | | $927,514 | | | | $957,874 | | | | $935,083 | | | | $836,487 | |
Ratios to average net assets:3 | | | | | | | | | | | | | | | | | | | | |
Net investment income | | | 0.49% | | | | 0.24% | | | | 0.75% | | | | 0.43% | | | | 0.82% | |
Expenses excluding specific expenses listed below | | | 1.06% | | | | 1.05% | | | | 1.05% | | | | 1.06% | | | | 1.08% | |
Interest and fees from borrowings | | | 0.00%4 | | | | 0.00%4 | | | | 0.00% | | | | 0.00% | | | | 0.00% | |
Total expenses5 | | | 1.06% | | | | 1.05% | | | | 1.05% | | | | 1.06% | | | | 1.08% | |
| Expenses after payments, waivers and/or reimbursements and reduction to custodian expenses | | | 1.05% | | | | 1.05%6 | | | | 1.04% | | | | 1.05% | | | | 1.05% | |
Portfolio turnover rate | | | 65% | | | | 43% | | | | 65% | | | | 60% | | | | 92% | |
1. Per share amounts calculated based on the average shares outstanding during the period.
2. Assumes an initial investment on the business day before the first day of the fiscal period, with all dividends and distributions reinvested in additional shares on the reinvestment date, and redemption at the net asset value calculated on the last business day of the fiscal period. Total returns are not annualized for periods less than one full year. Total return information does not reflect expenses that apply at the separate account level or to related insurance products. Inclusion of these charges would reduce the total return figures for all periods shown. Returns do not reflect the deduction of taxes that a shareholder would pay on fund distributions or the redemption of fund shares.
3. Annualized for periods less than one full year.
4. Less than 0.005%.
5. Total expenses including indirect expenses from affiliated fund fees and expenses were as follows:
| | | | |
Year Ended December 31, 2016 | | | 1.06 | % |
Year Ended December 31, 2015 | | | 1.05 | % |
Year Ended December 31, 2014 | | | 1.05 | % |
Year Ended December 31, 2013 | | | 1.06 | % |
Year Ended December 31, 2012 | | | 1.08 | % |
6. Waiver was less than 0.005%.
See accompanying Notes to Financial Statements.
13 OPPENHEIMER MAIN STREET SMALL CAP FUND/VA
NOTES TO FINANCIAL STATEMENTS December 31, 2016
1. Organization
Oppenheimer Main Street Small Cap Fund/VA (the “Fund”), a separate series of Oppenheimer Variable Account Funds, is a diversified open-end management investment company registered under the Investment Company Act of 1940 (“1940 Act”), as amended. The Fund’s investment objective is to seek capital appreciation. The Fund’s investment adviser is OFI Global Asset Management, Inc. (“OFI Global” or the “Manager”), a wholly-owned subsidiary of OppenheimerFunds, Inc. (“OFI” or the “Sub-Adviser”). The Manager has entered into a sub-advisory agreement with OFI. Shares of the Fund are sold only to separate accounts of life insurance companies.
The Fund offers two classes of shares. Both classes are sold at their offering price, which is the net asset value per share, to separate investment accounts of participating insurance companies as an underlying investment for variable life insurance policies, variable annuity contracts or other investment products. The class of shares designated as Service shares is subject to a distribution and service plan. Both classes of shares have identical rights and voting privileges with respect to the Fund in general and exclusive voting rights on matters that affect that class alone. Earnings, net assets and net asset value per share may differ due to each class having its own expenses, such as transfer and shareholder servicing agent fees and shareholder communications, directly attributable to that class.
The following is a summary of significant accounting policies followed in the Fund’s preparation of financial statements in accordance with accounting principles generally accepted in the United States (“U.S. GAAP”).
2. Significant Accounting Policies
Security Valuation. All investments in securities are recorded at their estimated fair value, as described in Note 3.
Foreign Currency Translation. The books and records of the Fund are maintained in U.S. dollars. Any foreign currency amounts are translated into U.S. dollars on the following basis:
(1) Market value of investment securities, other assets and liabilities — at the exchange rates prevailing at Market Close as described in Note 3.
(2) Purchases and sales of investment securities, income and expenses — at the rates of exchange prevailing on the respective dates of such transactions.
Although the net assets and the market values are presented at the foreign exchange rates at Market Close, the Fund does not isolate the portion of the results of operations resulting from changes in foreign exchange rates on investments from the fluctuations arising from changes in market prices of securities held. Such fluctuations are included with the net realized and unrealized gains or losses from investments shown in the Statement of Operations.
For securities, which are subject to foreign withholding tax upon disposition, realized gains or losses on such securities are recorded net of foreign withholding tax.
Reported net realized foreign exchange gains or losses arise from sales of foreign currencies, currency gains or losses realized between the trade and settlement dates on securities transactions, the difference between the amounts of dividends, interest, and foreign withholding tax reclaims recorded on Fund’s books, and the U.S. dollar equivalent of the amounts actually received or paid. Net unrealized foreign exchange gains and losses arise from changes in the value of assets and liabilities other than investments in securities, resulting from changes in the exchange rate.
Allocation of Income, Expenses, Gains and Losses. Income, expenses (other than those attributable to a specific class), gains and losses are allocated on a daily basis to each class of shares based upon the relative proportion of net assets represented by such class. Operating expenses directly attributable to a specific class are charged against the operations of that class.
Dividends and Distributions to Shareholders. Dividends and distributions to shareholders, which are determined in accordance with income tax regulations and may differ from U.S. GAAP, are recorded on the ex-dividend date. Income and capital gain distributions, if any, are declared and paid annually or at other times as deemed necessary by the Manager.
Investment Income. Dividend income is recorded on the ex-dividend date or upon ex-dividend notification in the case of certain foreign dividends where the ex-dividend date may have passed. Non-cash dividends included in dividend income, if any, are recorded at the fair market value of the securities received. Interest income is recognized on an accrual basis. Discount and premium, which are included in interest income on the Statement of Operations, are amortized or accreted daily.
Return of Capital Estimates. Distributions received from the Fund’s investments in Master Limited Partnerships (MLPs) and Real Estate Investments Trusts (REITs), generally are comprised of income and return of capital. The Fund records investment income and return of capital based on estimates. Such estimates are based on historical information available from each MLP, REIT and other industry sources. These estimates may subsequently be revised based on information received from MLPs and REITs after their tax reporting periods are concluded.
Custodian Fees. “Custodian fees and expenses” in the Statement of Operations may include interest expense incurred by the Fund on any cash overdrafts of its custodian account during the period. Such cash overdrafts may result from the effects of failed trades in portfolio securities and from cash outflows resulting from unanticipated shareholder redemption activity. The Fund pays interest to its custodian on such cash overdrafts, to the extent they are not offset by positive cash balances maintained by the Fund, at a rate equal to the Federal Funds Rate plus 0.50%. This rate will increase to 2.00% effective January 1, 2017. The “Reduction to custodian expenses” line item, if applicable, represents earnings on cash balances maintained by the Fund during the period. Such interest expense and other custodian fees may be paid with these earnings.
14 OPPENHEIMER MAIN STREET SMALL CAP FUND/VA
2. Significant Accounting Policies (Continued)
Security Transactions. Security transactions are recorded on the trade date. Realized gains and losses on securities sold are determined on the basis of identified cost.
Indemnifications. The Fund’s organizational documents provide current and former Trustees and officers with a limited indemnification against liabilities arising in connection with the performance of their duties to the Fund. In the normal course of business, the Fund may also enter into contracts that provide general indemnifications. The Fund’s maximum exposure under these arrangements is unknown as this would be dependent on future claims that may be made against the Fund. The risk of material loss from such claims is considered remote.
Federal Taxes. The Fund intends to comply with provisions of the Internal Revenue Code applicable to regulated investment companies and to distribute substantially all of its investment company taxable income, including any net realized gain on investments not offset by capital loss carryforwards, if any, to shareholders. Therefore, no federal income or excise tax provision is required. The Fund files income tax returns in U.S. federal and applicable state jurisdictions. The statute of limitations on the Fund’s tax return filings generally remains open for the three preceding fiscal reporting period ends. The Fund has analyzed its tax positions for the fiscal year ended December 31, 2016, including open tax years, and does not believe there are any uncertain tax positions requiring recognition in the Fund’s financial statements.
The tax components of capital shown in the following table represent distribution requirements the Fund must satisfy under the income tax regulations, losses the Fund may be able to offset against income and gains realized in future years and unrealized appreciation or depreciation of securities and other investments for federal income tax purposes.
| | | | | | | | | | | | |
Undistributed Net Investment Income | | Undistributed
Long-Term
Gain | | | Accumulated
Loss
Carryforward1,2 | | | Net Unrealized
Appreciation
Based on cost of
Securities and
Other Investments
for Federal Income
Tax Purposes | |
$5,169,716 | | | $58,941,215 | | | | $— | | | | $226,829,945 | |
1. During the reporting period, the Fund did not utilize any capital loss carryforward.
2. During the previous reporting period, the Fund did not utilize any capital loss carryforward.
Net investment income (loss) and net realized gain (loss) may differ for financial statement and tax purposes. The character of dividends and distributions made during the fiscal year from net investment income or net realized gains are determined in accordance with federal income tax requirements, which may differ from the character of net investment income or net realized gains presented in those financial statements in accordance with U.S. GAAP. Also, due to timing of dividends and distributions, the fiscal year in which amounts are distributed may differ from the fiscal year in which the income or net realized gain was recorded by the Fund.
Accordingly, the following amounts have been reclassified for the reporting period. Net assets of the Fund were unaffected by the reclassifications.
| | | | | | | | |
Increase to Paid-in Capital | | Increase to Accumulated
Net Investment
Income | | | Reduction to Accumulated Net
Realized Gain on Investments1 | |
$5,808,947 | | | $24,054 | | | | $5,833,001 | |
1. $5,808,478, all of which was long-term capital gain, was distributed in connection with Fund share redemptions.
The tax character of distributions paid during the reporting periods:
| | | | | | | | |
| | | Year Ended
December 31, 2016 | | | Year Ended
December 31, 2015 | |
Distributions paid from: | | | | | | | | |
Ordinary income | | $ | 2,837,725 | | | $ | 11,136,711 | |
Long-term capital gain | | | 38,241,212 | | | | 152,652,697 | |
| | | | | | | | |
Total | | $ | 41,078,937 | | | $ | 163,789,408 | |
| | | | | | | | |
The aggregate cost of securities and other investments and the composition of unrealized appreciation and depreciation of securities and other investments for federal income tax purposes at period end are noted in the following table. The primary difference between book and tax appreciation or depreciation of securities and other investments, if applicable, is attributable to the tax deferral of losses or tax realization of financial statement unrealized gain or loss.
| | | | |
Federal tax cost of securities | | | $ 850,186,808 | |
| | | | |
Gross unrealized appreciation | | | $ 242,104,432 | |
Gross unrealized depreciation | | | (15,274,487) | |
| | | | |
Net unrealized appreciation | | | $ 226,829,945 | |
| | | | |
15 OPPENHEIMER MAIN STREET SMALL CAP FUND/VA
NOTES TO FINANCIAL STATEMENTS Continued
2. Significant Accounting Policies (Continued)
Use of Estimates. The preparation of financial statements in conformity with U.S. GAAP requires management to make estimates and assumptions that affect the reported amounts of assets and liabilities and disclosure of contingent assets and liabilities at the date of the financial statements and the reported amounts of increases and decreases in net assets from operations during the reporting period. Actual results could differ from those estimates.
3. Securities Valuation
The Fund calculates the net asset value of its shares as of 4:00 P.M. Eastern time, on each day the New York Stock Exchange (the “Exchange”) is open for trading, except in the case of a scheduled early closing of the Exchange, in which case the Fund will calculate net asset value of the shares as of the scheduled early closing time of the Exchange.
The Fund’s Board has adopted procedures for the valuation of the Fund’s securities and has delegated the day-to-day responsibility for valuation determinations under those procedures to the Manager. The Manager has established a Valuation Committee which is responsible for determining a “fair valuation” for any security for which market quotations are not “readily available.” The Valuation Committee’s fair valuation determinations are subject to review, approval and ratification by the Fund’s Board at its next regularly scheduled meeting covering the calendar quarter in which the fair valuation was determined.
Valuation Methods and Inputs
Securities are valued using unadjusted quoted market prices, when available, as supplied primarily by third party pricing services or dealers.
The following methodologies are used to determine the market value or the fair value of the types of securities described below:
Equity securities traded on a securities exchange (including exchange-traded derivatives other than futures and futures options) are valued based on the official closing price on the principal exchange on which the security is traded, as identified by the Manager, prior to the time when the Fund’s assets are valued. If the official closing price is unavailable, the security is valued at the last sale price on the principal exchange on which it is traded. If the official closing price or last sales price for a foreign security is not available, the security is valued at the mean between the bid and asked price per the exchange or, if not available from the exchange, obtained from two dealers. If bid and asked prices are not available from either the exchange or two dealers, the security is valued by using one of the following methodologies (listed in order of priority): (1) a bid from the exchange, (2) the mean between the bid and asked price as provided by a single dealer, or (3) a bid from a single dealer.
Shares of a registered investment company that are not traded on an exchange are valued at that investment company’s net asset value per share.
Corporate and government debt securities (of U.S. or foreign issuers) and municipal debt securities, event-linked bonds, loans, mortgage-backed securities, collateralized mortgage obligations, and asset-backed securities are valued at the mean between the “bid” and “asked” prices utilizing evaluated prices obtained from third party pricing services or broker-dealers who may use matrix pricing methods to determine the evaluated prices.
Short-term money market type debt securities are valued at the mean between the “bid” and “asked” prices utilizing evaluated prices obtained from third party pricing services or broker-dealers.
A description of the standard inputs that may generally be considered by the third party pricing vendors in determining their evaluated prices is provided below.
| | |
| Security Type | | Standard inputs generally considered by third-party pricing vendors |
| Corporate debt, government debt, municipal, mortgage- backed and asset-backed securities | | Reported trade data, broker-dealer price quotations, benchmark yields, issuer spreads on comparable securities, the credit quality, yield, maturity, and other appropriate factors. |
| Loans | | Information obtained from market participants regarding reported trade data and broker-dealer price quotations. |
| Event-linked bonds | | Information obtained from market participants regarding reported trade data and broker-dealer price quotations. |
If a market value or price cannot be determined for a security using the methodologies described above, or if, in the “good faith” opinion of the Manager, the market value or price obtained does not constitute a “readily available market quotation,” or a significant event has occurred that would materially affect the value of the security, the security is fair valued either (i) by a standardized fair valuation methodology applicable to the security type or the significant event as previously approved by the Valuation Committee and the Fund’s Board or (ii) as determined in good faith by the Manager’s Valuation Committee. The Valuation Committee considers all relevant facts that are reasonably available, through either public information or information available to the Manager, when determining the fair value of a security. Fair value determinations by the Manager are subject to review, approval and ratification by the Fund’s Board at its next regularly scheduled meeting covering the calendar quarter in which the fair valuation was determined. Those fair valuation standardized methodologies include, but are not limited to, valuing securities at the last sale price or initially at cost and subsequently adjusting the value based on: changes in company specific fundamentals, changes in an appropriate securities index, or changes in the value of similar securities which may be further adjusted for any discounts related to security-specific resale restrictions. When possible, such methodologies use observable market inputs such as unadjusted quoted prices of similar securities, observable interest rates, currency rates and yield curves. The methodologies used for valuing securities are not necessarily an indication of the risks associated with investing in those securities nor can it be assured that the Fund can obtain the fair value assigned to a security if it were to sell the security.
To assess the continuing appropriateness of security valuations, the Manager, or its third party service provider who is subject to oversight by the
16 OPPENHEIMER MAIN STREET SMALL CAP FUND/VA
3. Securities Valuation (Continued)
Manager, regularly compares prior day prices, prices on comparable securities, and sale prices to the current day prices and challenges those prices exceeding certain tolerance levels with the third party pricing service or broker source. For those securities valued by fair valuations, whether through a standardized fair valuation methodology or a fair valuation determination, the Valuation Committee reviews and affirms the reasonableness of the valuations based on such methodologies and fair valuation determinations on a regular basis after considering all relevant information that is reasonably available.
Classifications
Each investment asset or liability of the Fund is assigned a level at measurement date based on the significance and source of the inputs to its valuation. Various data inputs are used in determining the value of each of the Fund’s investments as of the reporting period end. These data inputs are categorized in the following hierarchy under applicable financial accounting standards:
1) Level 1-unadjusted quoted prices in active markets for identical assets or liabilities (including securities actively traded on a securities exchange)
2) Level 2-inputs other than unadjusted quoted prices that are observable for the asset or liability (such as unadjusted quoted prices for similar assets and market corroborated inputs such as interest rates, prepayment speeds, credit risks, etc.)
3) Level 3-significant unobservable inputs (including the Manager’s own judgments about assumptions that market participants would use in pricing the asset or liability).
The inputs used for valuing securities are not necessarily an indication of the risks associated with investing in those securities.
The Fund classifies each of its investments in investment companies which are publicly offered as Level 1. Investment companies that are not publicly offered are measured using net asset value as a practical expedient, and are not classified in the fair value hierarchy.
The table below categorizes amounts that are included in the Fund’s Statement of Assets and Liabilities at period end based on valuation input level:
| | | | | | | | | | | | | | | | |
| | | Level 1— Unadjusted Quoted Prices | | | Level 2—
Other Significant
Observable Inputs | | | Level 3—
Significant
Unobservable
Inputs | | | Value | |
Assets Table | | | | | | | | | | | | | | | | |
Investments, at Value: | | | | | | | | | | | | | | | | |
Common Stocks | | | | | | | | | | | | | | | | |
Consumer Discretionary | | $ | 121,501,794 | | | $ | — | | | $ | — | | | $ | 121,501,794 | |
Consumer Staples | | | 19,064,215 | | | | — | | | | — | | | | 19,064,215 | |
Energy | | | 50,878,485 | | | | — | | | | — | | | | 50,878,485 | |
Financials | | | 247,105,590 | | | | — | | | | — | | | | 247,105,590 | |
Health Care | | | 127,880,064 | | | | — | | | | — | | | | 127,880,064 | |
Industrials | | | 215,890,414 | | | | — | | | | — | | | | 215,890,414 | |
Information Technology | | | 171,044,196 | | | | — | | | | — | | | | 171,044,196 | |
Materials | | | 67,500,465 | | | | — | | | | — | | | | 67,500,465 | |
Utilities | | | 26,049,750 | | | | — | | | | — | | | | 26,049,750 | |
Investment Company | | | 30,101,780 | | | | — | | | | — | | | | 30,101,780 | |
| | | | | | | | | | | | | | | | |
Total Assets | | $ | 1,077,016,753 | | | $ | — | | | $ | — | | | $ | 1,077,016,753 | |
| | | | | | | | | | | | | | | | |
Forward currency exchange contracts and futures contracts, if any, are reported at their unrealized appreciation/depreciation at measurement date, which represents the change in the contract’s value from trade date. All additional assets and liabilities included in the above table are reported at their market value at measurement date.
4. Investments and Risks
Investments in Affiliated Funds. The Fund is permitted to invest in other mutual funds advised by the Manager (“Affiliated Funds”). Affiliated Funds are open-end management investment companies registered under the 1940 Act, as amended. The Manager is the investment adviser of, and the Sub-Adviser provides investment and related advisory services to, the Affiliated Funds. When applicable, the Fund’s investments in Affiliated Funds are included in the Statement of Investments. Shares of Affiliated Funds are valued at their net asset value per share. As a shareholder, the Fund is subject to its proportional share of the Affiliated Funds’ expenses, including their management fee. The Manager will waive fees and/or reimburse Fund expenses in an amount equal to the indirect management fees incurred through the Fund’s investment in the Affiliated Funds.
Each of the Affiliated Funds in which the Fund invests has its own investment risks, and those risks can affect the value of the Fund’s investments and therefore the value of the Fund’s shares. To the extent that the Fund invests more of its assets in one Affiliated Fund than in another, the Fund will have greater exposure to the risks of that Affiliated Fund.
Investments in Money Market Instruments. The Fund is permitted to invest its free cash balances in money market instruments to provide liquidity or for defensive purposes. The Fund may invest in money market instruments by investing in Class E shares of Oppenheimer Institutional Government Money Market Fund (“IGMMF”), formerly known as Oppenheimer Institutional Money Market Fund, which is an Affiliated Fund. IGMMF is regulated as a money market fund under the 1940 Act, as amended. The Fund may also invest in money market instruments directly or in other affiliated or unaffiliated money market funds.
17 OPPENHEIMER MAIN STREET SMALL CAP FUND/VA
NOTES TO FINANCIAL STATEMENTS Continued
4. Investments and Risks (Continued)
Master Limited Partnerships (“MLPs”). MLPs issue common units that represent an equity ownership interest in a partnership and provide limited voting rights. MLP common units are registered with the Securities and Exchange Commission (“SEC”), and are freely tradable on securities exchanges such as the NYSE and the NASDAQ Stock Market (“NASDAQ”), or in the over-the-counter (“OTC”) market. An MLP consists of one or more general partners, who conduct the business, and one or more limited partners, who contribute capital. MLP common unit holders have a limited role in the partnership’s operations and management. The Fund, as a limited partner, normally would not be liable for the debts of the MLP beyond the amounts the Fund has contributed, but would not be shielded to the same extent that a shareholder of a corporation would be. In certain circumstances creditors of an MLP would have the right to seek return of capital distributed to a limited partner. This right of an MLP’s creditors would continue after the Fund sold its investment in the MLP.
Equity Security Risk. Stocks and other equity securities fluctuate in price. The value of the Fund’s portfolio may be affected by changes in the equity markets generally. Equity markets may experience significant short-term volatility and may fall sharply at times. Different markets may behave differently from each other and U.S. equity markets may move in the opposite direction from one or more foreign stock markets. Adverse events in any part of the equity or fixed-income markets may have unexpected negative effects on other market segments.
The prices of individual equity securities generally do not all move in the same direction at the same time and a variety of factors can affect the price of a particular company’s securities. These factors may include, but are not limited to, poor earnings reports, a loss of customers, litigation against the company, general unfavorable performance of the company’s sector or industry, or changes in government regulations affecting the company or its industry.
Shareholder Concentration. At period end, one shareholder owned 20% or more of the Fund’s total outstanding shares.
5. Market Risk Factors
The Fund’s investments in securities and/or financial derivatives may expose the Fund to various market risk factors:
Commodity Risk. Commodity risk relates to the change in value of commodities or commodity indexes as they relate to increases or decreases in the commodities market. Commodities are physical assets that have tangible properties. Examples of these types of assets are crude oil, heating oil, metals, livestock, and agricultural products.
Credit Risk. Credit risk relates to the ability of the issuer of debt to meet interest and principal payments, or both, as they come due. In general, lower-grade, higher-yield debt securities are subject to credit risk to a greater extent than lower-yield, higher-quality securities.
Equity Risk. Equity risk relates to the change in value of equity securities as they relate to increases or decreases in the general market.
Foreign Exchange Rate Risk. Foreign exchange rate risk relates to the change in the U.S. dollar value of a security held that is denominated in a foreign currency. The U.S. dollar value of a foreign currency denominated security will decrease as the dollar appreciates against the currency, while the U.S. dollar value will increase as the dollar depreciates against the currency.
Interest Rate Risk. Interest rate risk refers to the fluctuations in value of fixed-income securities resulting from the inverse relationship between price and yield. For example, an increase in general interest rates will tend to reduce the market value of already issued fixed-income investments, and a decline in general interest rates will tend to increase their value. In addition, debt securities with longer maturities, which tend to have higher yields, are subject to potentially greater fluctuations in value from changes in interest rates than obligations with shorter maturities.
Volatility Risk. Volatility risk refers to the magnitude of the movement, but not the direction of the movement, in a financial instrument’s price over a defined time period. Large increases or decreases in a financial instrument’s price over a relative time period typically indicate greater volatility risk, while small increases or decreases in its price typically indicate lower volatility risk.
6. Shares of Beneficial Interest
The Fund has authorized an unlimited number of $0.001 par value shares of beneficial interest of each class. Transactions in shares of beneficial interest were as follows:
| | | | | | | | | | | | | | | | |
| | | Year Ended December 31, 2016 | | | Year Ended December 31, 2015 | |
| | | Shares | | | Amount | | | Shares | | | Amount | |
Non-Service Shares | | | | | | | | | | | | | | | | |
Sold | | | 1,207,275 | | | $ | 26,014,115 | | | | 1,409,497 | | | $ | 33,342,939 | |
Dividends and/or distributions reinvested | | | 272,999 | | | | 5,738,444 | | | | 876,695 | | | | 20,768,914 | |
Redeemed | | | (1,493,942) | | | | (32,220,201) | | | | (1,368,306 | ) | | | (32,793,846) | |
| | | | |
Net increase (decrease) | | | (13,668) | | | $ | (467,642) | | | | 917,886 | | | $ | 21,318,007 | |
| | | | |
| | | | | | | | | | | | | | | | | |
Service Shares | | | | | | | | | | | | | | | | |
Sold | | | 3,595,856 | | | $ | 73,971,132 | | | | 3,720,118 | | | $ | 87,937,386 | |
Dividends and/or distributions reinvested | | | 1,701,517 | | | | 35,340,493 | | | | 6,109,352 | | | | 143,020,494 | |
Redeemed | | | (7,186,807) | | | | (153,225,216) | | | | (6,013,134 | ) | | | (144,868,706) | |
| | | | |
Net increase (decrease) | | | (1,889,434) | | | $ | (43,913,591) | | | | 3,816,336 | | | $ | 86,089,174 | |
| | | | |
18 OPPENHEIMER MAIN STREET SMALL CAP FUND/VA
7. Purchases and Sales of Securities
The aggregate cost of purchases and proceeds from sales of securities, other than short-term obligations and investments in IGMMF, for the reporting period were as follows:
| | | | | | | | | | | | |
| | | Purchases | | | | | | Sales | |
Investment securities | | $ | 625,494,811 | | | | | | | $ | 705,014,873 | |
8. Fees and Other Transactions with Affiliates
Management Fees. Under the investment advisory agreement, the Fund pays the Manager a management fee based on the daily net assets of the Fund at an annual rate as shown in the following table:
| | | | |
| Fee Schedule | | | |
Up to $200 million | | | 0.75% | |
Next $200 million | | | 0.72 | |
Next $200 million | | | 0.69 | |
Next $200 million | | | 0.66 | |
Next $200 million | | | 0.60 | |
Next $4 billion | | | 0.58 | |
Over $5 billion | | | 0.56 | |
The Fund’s effective management fee for the reporting period was 0.69% of average annual net assets before any applicable waivers.
Sub-Adviser Fees. The Manager has retained the Sub-Adviser to provide the day-to-day portfolio management of the Fund. Under the Sub-Advisory Agreement, the Manager pays the Sub-Adviser an annual fee in monthly installments, equal to a percentage of the investment management fee collected by the Manager from the Fund, which shall be calculated after any investment management fee waivers. The fee paid to the Sub-Adviser is paid by the Manager, not by the Fund.
Transfer Agent Fees. OFI Global (the “Transfer Agent”) serves as the transfer and shareholder servicing agent for the Fund. The Fund pays the Transfer Agent a fee based on annual net assets. Fees incurred and average net assets for each class with respect to these services are detailed in the Statement of Operations and Financial Highlights, respectively.
Sub-Transfer Agent Fees. The Transfer Agent has retained Shareholder Services, Inc., a wholly-owned subsidiary of OFI (the “Sub-Transfer Agent”), to provide the day-to-day transfer agent and shareholder servicing of the Fund. Under the Sub-Transfer Agency Agreement, the Transfer Agent pays the Sub-Transfer Agent an annual fee in monthly installments, equal to a percentage of the transfer agent fee collected by the Transfer Agent from the Fund, which shall be calculated after any applicable fee waivers. The fee paid to the Sub-Transfer Agent is paid by the Transfer Agent, not by the Fund.
Trustees’ Compensation. The Fund’s Board of Trustees (“Board”) has adopted a compensation deferral plan for Independent Trustees that enables Trustees to elect to defer receipt of all or a portion of the annual compensation they are entitled to receive from the Fund. For purposes of determining the amount owed to the Trustees under the plan, deferred amounts are treated as though equal dollar amounts had been invested in shares of the Fund or in other Oppenheimer funds selected by the Trustees. The Fund purchases shares of the funds selected for deferral by the Trustees in amounts equal to his or her deemed investment, resulting in a Fund asset equal to the deferred compensation liability. Such assets are included as a component of “Other” within the asset section of the Statement of Assets and Liabilities. Deferral of Trustees’ fees under the plan will not affect the net assets of the Fund and will not materially affect the Fund’s assets, liabilities or net investment income per share. Amounts will be deferred until distributed in accordance with the compensation deferral plan.
Distribution and Service Plan for Service Shares. The Fund has adopted a Distribution and Service Plan (the “Plan”) pursuant to Rule 12b-1 under the 1940 Act for Service shares to pay OppenheimerFunds Distributor, Inc. (the “Distributor”), for distribution related services, personal service and account maintenance for the Fund’s Service shares. Under the Plan, payments are made periodically at an annual rate of 0.25% of the daily net assets of Service shares of the Fund. The Distributor currently uses all of those fees to compensate sponsors of the insurance product that offers Fund shares, for providing personal service and maintenance of accounts of their variable contract owners that hold Service shares. These fees are paid out of the Fund’s assets on an on-going basis and increase operating expenses of the Service shares, which results in lower performance compared to the Fund’s shares that are not subject to a service fee. Fees incurred by the Fund under the Plan are detailed in the Statement of Operations.
Waivers and Reimbursements of Expenses. The Manager has voluntarily agreed to limit the Fund’s expenses after payments, waivers and/or reimbursements and reduction to custodian expenses, excluding any applicable dividend expense, taxes, interest and fees from borrowing, any subsidiary expenses, Acquired Fund Fees and Expenses, brokerage commissions, unusual and infrequent expenses and certain other Fund expenses; so that those expenses, as percentages of daily net assets, will not exceed the annual rate of 0.80% for Non-Service shares and 1.05% for Service shares. During the reporting period, the Manager waived fees and/or reimbursed the Fund $9,453 and $61,665 for Non-Service and Service shares, respectively.
The Manager will waive fees and/or reimburse Fund expenses in an amount equal to the indirect management fees incurred through the Fund’s investment in IGMMF. During the reporting period, the Manager waived fees and/or reimbursed the Fund $19,133 for IGMMF management fees.
Waivers and/or reimbursements may be modified or terminated as set forth according to the terms in the prospectus.
19 OPPENHEIMER MAIN STREET SMALL CAP FUND/VA
NOTES TO FINANCIAL STATEMENTS Continued
9. Borrowings and Other Financing
Joint Credit Facility. A number of mutual funds managed by the Manager participate in a $1.3 billion revolving credit facility (the “Facility”) intended to provide short-term financing, if necessary, subject to certain restrictions in connection with atypical redemption activity. Expenses and fees related to the Facility are paid by the participating funds and are disclosed separately or as other expenses on the Statement of Operations. The Fund did not utilize the Facility during the reporting period.
10. Pending Litigation
In 2009, several putative class action lawsuits were filed and later consolidated before the U.S. District Court for the District of Colorado in connection with the investment performance of Oppenheimer Rochester California Municipal Fund (the “California Fund”), a fund advised by OppenheimerFunds, Inc. (“OFI”) and distributed by OppenheimerFunds Distributor, Inc. (“OFDI”). The plaintiffs asserted claims against OFI, OFDI and certain present and former trustees and officers of the California Fund under the federal securities laws, alleging, among other things, that the disclosure documents of the California Fund contained misrepresentations and omissions and the investment policies of the California Fund were not followed. An amended complaint and a motion to dismiss were filed, and in 2011, the court issued an order which granted in part and denied in part the defendants’ motion to dismiss. In October 2015, following a successful appeal by defendants and a subsequent hearing, the court granted plaintiffs’ motion for class certification and appointed class representatives and class counsel.
OFI and OFDI believe the suit is without merit; that it is premature to render any opinion as to the likelihood of an outcome unfavorable to them in the suit; and that no estimate can yet be made as to the amount or range of any potential loss. Furthermore, OFI believes that the suit should not impair the ability of OFI or OFDI to perform their respective duties to the Fund and that the outcome of the suit should not have any material effect on the operations of any of the Oppenheimer funds.
20 OPPENHEIMER MAIN STREET SMALL CAP FUND/VA
REPORT OF INDEPENDENT REGISTERED PUBLIC ACCOUNTING FIRM
The Board of Trustees and Shareholders of Oppenheimer Variable Account Funds:
We have audited the accompanying statement of assets and liabilities of Oppenheimer Main Street Small Cap Fund/VA (a separate series of Oppenheimer Variable Account Funds), including the statement of investments, as of December 31, 2016, and the related statement of operations for the year then ended, the statements of changes in net assets for each of the years in the two-year period then ended, and the financial highlights for each of the years in the five-year period then ended. These financial statements and financial highlights are the responsibility of the Fund’s management. Our responsibility is to express an opinion on these financial statements and financial highlights based on our audits.
We conducted our audits in accordance with the standards of the Public Company Accounting Oversight Board (United States). Those standards require that we plan and perform the audit to obtain reasonable assurance about whether the financial statements and financial highlights are free of material misstatement. An audit includes examining, on a test basis, evidence supporting the amounts and disclosures in the financial statements. Our procedures included confirmation of securities owned as of December 31, 2016, by correspondence with the custodian, transfer agent and brokers, or by other appropriate auditing procedures where replies from brokers were not received. An audit also includes assessing the accounting principles used and significant estimates made by management, as well as evaluating the overall financial statement presentation. We believe that our audits provide a reasonable basis for our opinion.
In our opinion, the financial statements and financial highlights referred to above present fairly, in all material respects, the financial position of Oppenheimer Main Street Small Cap Fund/VA as of December 31, 2016, the results of its operations for the year then ended, the changes in its net assets for each of the years in the two-year period then ended, and the financial highlights for each of the years in the five-year period then ended, in conformity with U.S. generally accepted accounting principles.
KPMGLLP
Denver, Colorado
February 15, 2017
21 OPPENHEIMER MAIN STREET SMALL CAP FUND/VA
FEDERAL INCOME TAX INFORMATION Unaudited
In early 2017, if applicable, shareholders of record received information regarding all dividends and distributions paid to them by the Fund during calendar year 2016.
Capital gain distributions of $0.83744 per share were paid to Non-Service and Service shareholders, respectively, on June 21, 2016. Whether received in stock or in cash, the capital gain distribution should be treated by shareholders as a gain from the sale of the capital assets held for more than one year (long-term capital gains).
Dividends, if any, paid by the Fund during the reporting period which are not designated as capital gain distributions should be multiplied by the maximum amount allowable but not less than 100% to arrive at the amount eligible for the corporate dividend-received deduction.
The foregoing information is presented to assist shareholders in reporting distributions received from the Fund to the Internal Revenue Service. Because of the complexity of the federal regulations which may affect your individual tax return and the many variations in state and local tax regulations, we recommend that you consult your tax advisor for specific guidance.
22 OPPENHEIMER MAIN STREET SMALL CAP FUND/VA
BOARD APPROVAL OF THE FUND’S INVESTMENT ADVISORY AND SUB-ADVISORY AGREEMENTS Unaudited
The Fund has entered into an investment advisory agreement with OFI Global Asset Management, Inc. (“OFI Global” or the “Adviser”), a wholly-owned subsidiary of OppenheimerFunds, Inc. (“OFI” or the “Sub-Adviser”) (“OFI Global” and “OFI” together the “Managers”) and OFI Global has entered into a sub-advisory agreement with OFI whereby OFI provides investment sub-advisory services to the Fund (collectively, the “Agreements”). Each year, the Board of Trustees (the “Board”), including a majority of the independent Trustees, is required to determine whether to approve the terms of the Agreements and the renewal thereof. The Investment Company Act of 1940, as amended, requires that the Board request and evaluate, and that the Managers provide, such information as may be reasonably necessary to evaluate the terms of the Agreements. The Board employs an independent consultant to prepare a report that provides information, including comparative information that the Board requests for that purpose. In addition to in-person meetings focused on this evaluation, the Board receives information throughout the year regarding Fund services, fees, expenses and performance.
The Managers and the independent consultant provided information to the Board on the following factors: (i) the nature, quality and extent of the Managers’ services, (ii) the comparative investment performance of the Fund and the Managers, (iii) the fees and expenses of the Fund, including comparative fee and expense information, (iv) the profitability of the Managers and their affiliates, including an analysis of the cost of providing services, (v) whether economies of scale are realized as the Fund grows and whether fee levels reflect these economies of scale for Fund investors and (vi) other benefits to the Managers from their relationship with the Fund. The Board was aware that there are alternatives to retaining the Managers.
Outlined below is a summary of the principal information considered by the Board as well as the Board’s conclusions.
Nature, Quality and Extent of Services. The Board considered information about the nature, quality and extent of the services provided to the Fund and information regarding the Managers’ key personnel who provide such services. The Managers’ duties include providing the Fund with the services of the portfolio managers and the Sub-Adviser’s investment team, who provide research, analysis and other advisory services in regard to the Fund’s investments; and securities trading services. OFI Global is responsible for oversight of third-party service providers; monitoring compliance with applicable Fund policies and procedures and adherence to the Fund’s investment restrictions; risk management; and oversight of the Sub-Adviser. OFI Global is also responsible for providing certain administrative services to the Fund. Those services include providing and supervising all administrative and clerical personnel who are necessary in order to provide effective corporate administration for the Fund; compiling and maintaining records with respect to the Fund’s operations; preparing and filing reports required by the U.S. Securities and Exchange Commission; preparing periodic reports regarding the operations of the Fund for its shareholders; preparing proxy materials for shareholder meetings; and preparing the registration statements required by federal and state securities laws for the sale of the Fund’s shares. OFI Global also provides the Fund with office space, facilities and equipment.
The Board also considered the quality of the services provided and the quality of the Managers’ resources that are available to the Fund. The Board took account of the fact that the Sub-Adviser has over fifty years of experience as an investment adviser and that its assets under management rank it among the top mutual fund managers in the United States. The Board evaluated the Managers’ advisory, administrative, accounting, legal, compliance and risk management services, and information the Board has received regarding the experience and professional qualifications of the Managers’ key personnel and the size and functions of its staff. In its evaluation of the quality of the portfolio management services provided, the Board considered the experience of Matthew Ziehl, Raymond Anello, Raman Vardharaj, Joy Budzinski, Kristin Ketner, Magnus Krantz and Adam Weiner, the portfolio managers for the Fund, and the Sub-Adviser’s investment team and analysts. The Board members also considered the totality of their experiences with the Managers as directors or trustees of the Fund and other funds advised by the Managers. The Board considered information regarding the quality of services provided by affiliates of the Managers, which the Board members have become knowledgeable about through their experiences with the Managers and in connection with the renewal of the Fund’s service agreements. The Board concluded, in light of the Managers’ experience, reputation, personnel, operations and resources that the Fund benefits from the services provided under the Agreements.
Investment Performance of the Managers and the Fund. Throughout the year, the Managers provided information on the investment performance of the Fund, the Adviser and the Sub-Adviser, including comparative performance information. The Board also reviewed information, prepared by the Managers and by the independent consultant, comparing the Fund’s historical performance to relevant market indices and to the performance of other small blend funds underlying variable insurance products. The Board noted that the Fund outperformed its performance category median for each of the three-, five- and ten-year periods, although it underperformed its performance category median for the one-year period.
Fees and Expenses of the Fund. The Board reviewed the fees paid to the Adviser and the other expenses borne by the Fund. The Board noted that the Adviser, not the Fund, pays the Sub-Adviser’s fee under the sub-advisory agreement. The independent consultant provided comparative data in regard to the fees and expenses of the Fund and other small blend funds underlying variable insurance products. In reviewing the fees and expenses charged to the VA funds, the Board considered the Adviser’s assertion that, because there is much greater disparity in the fees and services that may be provided by a manager to a VA fund as opposed to a retail fund, when comparing the expenses of the various VA funds to those of retail funds, it is most appropriate to focus on total expenses (rather than on the management fees). Accordingly, while the Board reviewed and considered all expenses, it focused on total expenses. The Board considered that the Fund’s contractual management fee and total expenses were lower than their respective peer group medians and category medians. The Board also considered that the Adviser has voluntarily agreed to limit the Fund’s total annual operating expenses so that those expenses, as percentages of daily net assets, will not exceed the annual rate of 0.80% for Non-Service Shares and 1.05% for Service Shares. This voluntary expense limitation may be amended or withdrawn at any time without prior notice to shareholders.
Economies of Scale and Profits Realized by the Managers. The Board considered information regarding the Managers’ costs in serving as the Fund’s investment adviser and sub-adviser, including the costs associated with the personnel and systems necessary to manage the Fund, and information regarding the Managers’ profitability from their relationship with the Fund. The Board also considered that the Managers must be able to pay and retain experienced professional personnel at competitive rates to provide quality services to the Fund. The Board reviewed whether the Managers may realize economies of scale in managing and supporting the Fund. The Board noted that the Fund currently has management fee breakpoints, which are intended to share with Fund shareholders economies of scale that may exist as the Fund’s assets grow.
Other Benefits to the Managers. In addition to considering the profits realized by the Managers, the Board considered information that was provided regarding the direct and indirect benefits the Managers receive as a result of their relationship with the Fund, including compensation paid to
23 OPPENHEIMER MAIN STREET SMALL CAP FUND/VA
BOARD APPROVAL OF THE FUND’S INVESTMENT ADVISORY AND SUB-ADVISORY AGREEMENTS Unaudited / Continued
the Managers’ affiliates and research provided to the Adviser in connection with permissible brokerage arrangements (soft dollar arrangements).
Conclusions. These factors were also considered by the independent Trustees meeting separately from the full Board, assisted by experienced counsel to the Fund and to the independent Trustees. Fund counsel and the independent Trustees’ counsel are independent of the Managers within the meaning and intent of the Securities and Exchange Commission Rules.
Based on its review of the information it received and its evaluations described above, the Board, including a majority of the independent Trustees, decided to continue the Agreements through August 31, 2017. In arriving at its decision, the Board did not identify any factor or factors as being more important than others, but considered all of the above information, and considered the terms and conditions of the Agreements, including the management fees, in light of all the surrounding circumstances.
24 OPPENHEIMER MAIN STREET SMALL CAP FUND/VA
PORTFOLIO PROXY VOTING POLICIES AND GUIDELINES; UPDATES TO STATEMENTS OF INVESTMENTS Unaudited
The Fund has adopted Portfolio Proxy Voting Policies and Guidelines under which the Fund votes proxies relating to securities (“portfolio proxies”) held by the Fund. A description of the Fund’s Portfolio Proxy Voting Policies and Guidelines is available (i) without charge, upon request, by calling the Fund toll-free at 1.800.CALL OPP (225.5677), (ii) on the Fund’s website at www.oppenheimerfunds.com, and (iii) on the SEC’s website at www.sec.gov. In addition, the Fund is required to file Form N-PX, with its complete proxy voting record for the 12 months ended June 30th, no later than August 31st of each year. The Fund’s voting record is available (i) without charge, upon request, by calling the Fund toll-free at 1.800.CALL OPP (225.5677), and (ii) in the Form N-PX filing on the SEC’s website at www.sec.gov.
The Fund files its complete schedule of portfolio holdings with the SEC for the first quarter and the third quarter of each fiscal year on Form N-Q. The Fund’s Form N-Q filings are available on the SEC’s website at www.sec.gov. Those forms may be reviewed and copied at the SEC’s Public Reference Room in Washington, D.C. Information on the operation of the Public Reference Room may be obtained by calling 1-800-SEC-0330.
25 OPPENHEIMER MAIN STREET SMALL CAP FUND/VA
TRUSTEES AND OFFICERS Unaudited
| | |
Name, Position(s) Held with the Fund, Length of
Service, Age | | Principal Occupation(s) During the Past 5 Years; Other Trusteeships/Directorships Held;
Number of Portfolios in the Fund Complex Currently Overseen |
| |
| INDEPENDENT TRUSTEES | | The address of each Trustee in the chart below is 6803 S. Tucson Way, Centennial, Colorado 80112-3924. Each Trustee serves for an indefinite term, or until his or her resignation, retirement, death or removal. |
| |
Robert J. Malone, Chairman of the Board of Trustees (since 2016), Trustee (since 2002) Year of Birth: 1944 | | Chairman - Colorado Market of MidFirst Bank (since January 2015); Chairman of the Board (2012-2016) and Director (August 2005-March 2016) of Jones International University (educational organization); Trustee of the Gallagher Family Foundation (non-profit organization) (2000-2015); Chairman, Chief Executive Officer and Director of Steele Street Bank Trust (commercial banking) (August 2003-January 2015); Board of Directors of Opera Colorado Foundation (non-profit organization) (2008- 2012); Director of Colorado UpLIFT (charitable organization) (1986-2010); Director of Jones Knowledge, Inc. (2006-2010); Former Chairman of U.S. Bank-Colorado (subsidiary of U.S. Bancorp and formerly Colorado National Bank) (July 1996-April 1999); Director of Commercial Assets, Inc. (real estate investment trust) (1993-2000); Director of U.S. Exploration, Inc. (oil and gas exploration) (1997-February 2004); Chairman of the Board (1991-1994) and Trustee (1985-1994) of Regis University; and Chairman of the Board (1990-1991) and Trustee (1984-1999) of Young Presidents Organization. Oversees 47 portfolios in the OppenheimerFunds complex. Mr. Malone has served on the Boards of certain Oppenheimer funds since 2002, during which time he has become familiar with the Fund’s (and other Oppenheimer funds’) financial, accounting, regulatory and investment matters and has contributed to the Boards’ deliberations. |
| |
Jon S. Fossel, Trustee (since 1990) Year of Birth: 1942 | | Chairman of the Board of Jack Creek Preserve Foundation (non-profit organization) (since March 2005); Director of Jack Creek Preserve Foundation (non-profit organization) (March 2005-December 2014); Chairman of the Board (2006-December 2011) and Director (June 2002-December 2011) of UNUMProvident (insurance company); Director of Northwestern Energy Corp. (public utility corporation) (November 2004-December 2009); Director of P.R. Pharmaceuticals (October 1999-October 2003); Director of Rocky Mountain Elk Foundation (non-profit organization) (February 1998-February 2003 and February 2005-February 2007); Chairman and Director (until October 1996) and President and Chief Executive Officer (until October 1995) of OppenheimerFunds, Inc.; President, Chief Executive Officer and Director of the following: Oppenheimer Acquisition Corp. (“OAC”) (parent holding company of OppenheimerFunds, Inc.), Shareholders Services, Inc. and Shareholder Financial Services, Inc. (until October 1995). Oversees 47 portfolios in the OppenheimerFunds complex. Mr. Fossel has served on the Boards of certain Oppenheimer funds since 1990, during which time he has become familiar with the Fund’s (and other Oppenheimer funds’) financial, accounting, regulatory and investment matters and has contributed to the Boards’ deliberations. |
| |
Richard F. Grabish, Trustee (since 2012) Year of Birth: 1948 | | Formerly Senior Vice President and Assistant Director of Sales and Marketing (March 1997-December 2007), Director (March 1987-December 2007) and Manager of Private Client Services (June 1985-June 2005) of A.G. Edwards & Sons, Inc. (broker/dealer and investment firm); Chairman and Chief Executive Officer of A.G. Edwards Trust Company, FSB (March 2001-December 2007); President and Vice Chairman of A.G. Edwards Trust Company, FSB (investment adviser) (April 1987-March 2001); President of A.G. Edwards Trust Company, FSB (investment adviser) (June 2005-December 2007). Oversees 47 portfolios in the OppenheimerFunds complex. Mr. Grabish has served on the Boards of certain Oppenheimer funds since 2001, during which time he has become familiar with the Fund’s (and other Oppenheimer funds’) financial, accounting, regulatory and investment matters and has contributed to the Boards’ deliberations. |
| |
Beverly L. Hamilton, Trustee (since 2002) Year of Birth: 1946 | | Trustee of Monterey Institute for International Studies (educational organization) (2000-2014); Board Member of Middlebury College (educational organization) (December 2005-June 2011); Chairman (2010-2016) of American Funds’ Emerging Markets Growth Fund, Inc. (mutual fund); Director of The California Endowment (philanthropic organization) (April 2002-April 2008); Director (February 2002-2005) and Chairman of Trustees (2006-2007) of the Community Hospital of Monterey Peninsula; Director (October 1991-2005) and Vice Chairman (2006-2009) of American Funds’ Emerging Markets Growth Fund, Inc. (mutual fund); President of ARCO Investment Management Company (February 1991-April 2000); Member of the investment committees of The Rockefeller Foundation (2001-2006) and The University of Michigan (since 2000); Advisor at Credit Suisse First Boston’s Sprout venture capital unit (venture capital fund) (1994-January 2005); Trustee of MassMutual Institutional Funds (investment company) (1996-June 2004); Trustee of MML Series Investment Fund (investment company) (April 1989-June 2004); Member of the investment committee of Hartford Hospital (2000-2003); and Advisor to Unilever (Holland) pension fund (2000-2003). Oversees 47 portfolios in the OppenheimerFunds complex. Ms. Hamilton has served on the Boards of certain Oppenheimer funds since 2002, during which time she has become familiar with the Fund’s (and other Oppenheimer funds’) financial, accounting, regulatory and investment matters and has contributed to the Boards’ deliberations. |
| |
Victoria J. Herget, Trustee (since 2012) Year of Birth:1951 | | Board Chair (2008-2015) and Director (2004-Present), United Educators (insurance company); Trustee (since 2000) and Chair (since 2010), Newberry Library (independent research library); Trustee, Mather LifeWays (senior living organization) (since 2001); Independent Director of the First American Funds (mutual fund family) (2003-2011); former Managing Director (1993-2001), Principal (1985-1993), Vice President (1978-1985) and Assistant Vice President (1973-1978) of Zurich Scudder Investments (investment adviser) (and its predecessor firms); Trustee (1992-2007), Chair of the Board of Trustees (1999-2007), Investment Committee Chair (1994-1999) and Investment Committee member (2007-2010) of Wellesley College; Trustee, BoardSource (non-profit organization) (2006-2009) and Chicago City Day School (K-8 School) (1994-2005). Oversees 47 portfolios in the OppenheimerFunds complex. Ms. Herget has served on the Boards of certain Oppenheimer funds since 2012, during which time she has become familiar with the Fund’s (and other Oppenheimer funds’) financial, accounting, regulatory and investment matters and has contributed to the Boards’ deliberations. |
26 OPPENHEIMER MAIN STREET SMALL CAP FUND/VA
| | |
F. William Marshall, Jr., Trustee (since 2000) Year of Birth: 1942 | | Trustee Emeritus of Worcester Polytech Institute (WPI) (private university) (since 2009); Trustee of MassMutual Select Funds (formerly MassMutual Institutional Funds) (investment company) (1996-2015), MML Series Investment Fund (investment company) (1996-2015) and Mass Mutual Premier Funds (investment company) (January 2012-December 2015); President and Treasurer of the SIS Fund (private charitable fund) (January 1999-March 2011); Former Trustee of WPI (1985-2008); Former Chairman of the Board (2004-2006) and Former Chairman of the Investment Committee of WPI (1994-2008); Chairman of SIS Family Bank, F.S.B. (formerly SIS Bank) (commercial bank) (January 1999-July 1999); Executive Vice President of Peoples Heritage Financial Group, Inc. (commercial bank) (January 1999-July 1999); and Former President and Chief Executive Officer of SIS Bancorp. (1993-1999). Oversees 47 portfolios in the OppenheimerFunds complex. Mr. Marshall has served on the Boards of certain Oppenheimer funds since 2000, during which time he has become familiar with the Fund’s (and other Oppenheimer funds’) financial, accounting, regulatory and investment matters and has contributed to the Boards’ deliberations. |
| |
Karen L. Stuckey, Trustee (since 2012) Year of Birth: 1953 | | Member (since May 2015) of Desert Mountain Community Foundation Advisory Board (non-profit organization); Partner (1990-2012) of PricewaterhouseCoopers LLP (professional services firm) (held various positions 1975-1990); Trustee (1992- 2006), member of Executive, Nominating and Audit Committees and Chair of Finance Committee (1992-2006), and Emeritus Trustee (since 2006) of Lehigh University; and member, Women’s Investment Management Forum (professional organization) since inception. Oversees 47 portfolios in the OppenheimerFunds complex. Ms. Stuckey has served on the Boards of certain Oppenheimer funds since 2012, during which time she has become familiar with the Fund’s (and other Oppenheimer funds’) financial, accounting, regulatory and investment matters and has contributed to the Boards’ deliberations. |
| |
James D. Vaughn, Trustee (since 2012) Year of Birth:1945 | | Retired; former managing partner (1994-2001) of Denver office of Deloitte & Touche LLP, (held various positions 1969- 1993); Trustee and Chairman of the Audit Committee of Schroder Funds (2003-2012); Board member and Chairman of Audit Committee of AMG National Trust Bank (since 2005); Trustee and Investment Committee member, University of South Dakota Foundation (since 1996); Board member, Audit Committee Member and past Board Chair, Junior Achievement (since 1993); former Board member, Mile High United Way, Boys and Girls Clubs, Boy Scouts, Colorado Business Committee for the Arts, Economic Club of Colorado and Metro Denver Network. Oversees 47 portfolios in the OppenheimerFunds complex. Mr. Vaughn has served on the Boards of certain Oppenheimer funds since 2012, during which time he has become familiar with the Fund’s (and other Oppenheimer funds’) financial, accounting, regulatory and investment matters and has contributed to the Boards’ deliberations. |
| | | |
| INTERESTED TRUSTEE AND OFFICER | | Mr. Steinmetz is an “Interested Trustee” because he is affiliated with the Manager and the Sub-Adviser by virtue of his positions as Chairman and director of the Sub-Adviser and officer and director of the Manager. Both as a Trustee and as an officer, Mr. Steinmetz serves for an indefinite term, or until his resignation, retirement, death or removal. Mr. Steinmetz’s address is 225 Liberty Street, New York, New York 10281-1008. |
| |
Arthur P. Steinmetz, Trustee (Since 2015), President and Principal Executive Officer (since 2014) Year of Birth: 1958 | | Chairman of OppenheimerFunds, Inc. (since January 2015); CEO and Chairman of OFI Global Asset Management, Inc. (since July 2014), President of OFI Global Asset Management, Inc. (since May 2013), a Director of OFI Global Asset Management, Inc. (since January 2013), Director of OppenheimerFunds, Inc. (since July 2014), President, Management Director and CEO of Oppenheimer Acquisition Corp. (OppenheimerFunds, Inc.‘s parent holding company) (since July 2014), and President and Director of OFI SteelPath, Inc. (since January 2013). Chief Investment Officer of the OppenheimerFunds advisory entities from (January 2013-December 2013); Executive Vice President of OFI Global Asset Management, Inc. (January 2013-May 2013); Chief Investment Officer of OppenheimerFunds, Inc. (October 2010-December 2012); Chief Investment Officer, Fixed- Income, of OppenheimerFunds, Inc. (April 2009-October 2010); Executive Vice President of OppenheimerFunds, Inc. (October 2009-December 2012); Director of Fixed Income of OppenheimerFunds, Inc. (January 2009-April 2009); and a Senior Vice President of OppenheimerFunds, Inc. (March 1993-September 2009). An officer of 103 portfolios in the OppenheimerFunds complex. |
| | | |
| OTHER OFFICERS OF THE FUND | | The addresses of the Officers in the chart below are as follows: for Messrs. Ziehl, Vardharaj, Anello, Krantz, Weiner, Mss. Lo Bessette, Budzinski, Ketner, Foxson and Picciotto, 225 Liberty Street, New York, New York 10281-1008, for Mr. Petersen, 6803 S. Tucson Way, Centennial, Colorado 80112-3924. Each Officer serves for an indefinite term or until his or her resignation, retirement, death or removal. |
| |
Matthew P. Ziehl, Vice President (since 2009) Year of Birth: 1967 | | Vice President and Senior Portfolio Manager of the Sub-Adviser (since May 2009). Portfolio manager with RS Investment Management Co. LLC (October 2006-May 2009); Managing Director at The Guardian Life Insurance Company (December 2001-October 2006) when Guardian Life Insurance acquired an interest in RS Investment Management Co. LLC. Team leader and co portfolio manager with Salomon Brothers Asset Management, Inc. for small growth portfolios (January 2001-December 2001). A portfolio manager and officer of other portfolios in the OppenheimerFunds complex. |
| |
Raman Vardharaj, Vice President (since 2009) Year of Birth: 1971 | | Vice President and portfolio manager of the Sub-Adviser (since May 2009). Sector manager and a senior quantitative analyst creating stock selection models, monitoring portfolio risks and analyzing portfolio performance across the RS Core Equity Team of RS Investment Management Co. LLC (October 2006-May 2009). Quantitative analyst at The Guardian Life Insurance Company of America (1998-October 2006) when Guardian Life Insurance acquired an interest in RS Investment Management Co. LLC. A portfolio manager and officer of other portfolios in the OppenheimerFunds complex. |
| |
Raymond Anello, Vice President (since 2011) Year of Birth: 1964 | | Vice President of the Sub-Adviser (since May 2009) and a portfolio manager of the Sub-Adviser (since April 2011). Sector manager for energy and utilities for the Sub-Adviser’s Main Street Investment Team (since May 2009). Portfolio Manager of the RS All Cap Dividend product (from its inception in July 2007-April 2009) and served as a sector manager for energy and utilities for various other RS Investments products. Guardian Life Insurance Company (October 1999) and transitioned to RS Investments (October 2006) in connection with Guardian Life Insurance Company’s acquisition of an interest in RS Investments. Mr. Anello served as an equity portfolio manager/analyst and high yield analyst at Orion Capital (1995-1998) and an assistant portfolio manager at the Garrison Bradford portfolio management firm (1988-1995). A portfolio manager and officer of other portfolios in the OppenheimerFunds complex. |
27 OPPENHEIMER MAIN STREET SMALL CAP FUND/VA
TRUSTEES AND OFFICERS Unaudited / Continued
| | |
Joy Budzinski, Vice President (since 2012) Year of Birth: 1968 | | Vice President of the Sub-Adviser (since May 2009) and a portfolio manager of the Sub-Adviser (since November 2012). Sector manager for healthcare for the Sub-Adviser’s Main Street Investment Team (since May 2009). Healthcare sector manager at RS Investment and Guardian Life Insurance Company. Guardian Life Insurance Company (August 2006) and transitioned to RS Investments (October 2006) in connection with Guardian Life Insurance Company’s acquisition of an interest in RS Investments. Senior equity analyst at Bank of New York BNY Asset Management (2001 -2006); portfolio manager and analyst at Alliance of America (1999-2001); portfolio manager and analyst at JP Morgan Chase (1993-1997); analyst at Prudential Investments (1997-1998). A portfolio manager and officer of other portfolios in the OppenheimerFunds complex. |
| |
Kristin Ketner, Vice President (since 2012) Year of Birth: 1965 | | Vice President of the Sub-Adviser (since June 2009) and a portfolio manager of the Sub-Adviser (since November 2012). Sector manager for consumer discretionary and consumer staples for the Sub-Adviser’s Main Street Investment Team (since May 2009). Sector manager at RS Investment and Guardian Life Insurance Company. Guardian Life Insurance Company in February 2006 and transitioned to RS Investments in October 2006 in connection with Guardian Life Insurance Company’s acquisition of an interest in RS Investments. Portfolio Manager at Solstice Equity Management (2002-2005); retail analyst at Goldman Sachs (1999-2001); Director of Strategy and Integration at Staples (1997-1999); investment banker at Merrill Lynch (1987-1992 and 1995-1997) and Montgomery Securities (1994-1995). A portfolio manager and officer of other portfolios in the OppenheimerFunds complex. |
| |
Magnus Krantz, Vice President (since 2012) Year of Birth: 1967 | | Vice President of the Sub-Adviser (since May 2009) and a portfolio manager of the Sub-Adviser (since November 2012); sector manager for technology for the Sub-Adviser’s Main Street Investment Team (since May 2009). Prior to joining the Sub-Adviser, Mr. Krantz was a sector manager at RS Investment and Guardian Life Insurance Company. Mr. Krantz joined Guardian Life Insurance Company in December 2005 and transitioned to RS Investments in October 2006 in connection with Guardian Life Insurance Company’s acquisition of an interest in RS Investments. Portfolio manager and analyst at Citigroup Asset Management (1998-2005) and as a consultant at Price Waterhouse (1997-1998). He also served as product development engineer at Newbridge Networks (1993-1996) and as a software engineer at Mitel Corporation (1990-1993). A portfolio manager and officer of other portfolios in the OppenheimerFunds complex. |
| |
Adam Weiner, Vice President (since 2012) Year of Birth: 1969 | | Vice President of the Sub-Adviser (since May 2009) and a portfolio manager of the Sub-Adviser (since November 2012). Sector manager for industrials and materials for the Sub-Adviser’s Main Street Investment Team (since May 2009). Sector manager at RS Investment for industrials and materials (January 2007-April 2009). Director and senior equity analyst at Credit Suisse Asset Management (CSAM) (September 2004-December 2006). Equity analyst at Credit Suisse First Boston 2004-2006 (buy-side) and 1999-2004 (sell-side) and Morgan Stanley (1996-1999); internal auditor at Dun and Bradstreet (1992-1996). Budget analyst, Information Resources Division of the Executive Office of the President (1990-1992). A portfolio manager and officer of other portfolios in the OppenheimerFunds complex. |
| |
Cynthia Lo Bessette, Secretary and Chief Legal Officer (since 2016) Year of Birth: 1969 | | Executive Vice President, General Counsel and Secretary of the Manager (since February 2016); Chief Legal Officer of the Sub-Adviser and the Distributor (since February 2016); Vice President, General Counsel and Secretary of Oppenheimer Acquisition Corp. (since February 2016); General Counsel of OFI SteelPath, Inc., VTL Associates, LLC and Index Management Solutions, LLC (since February 2016); Chief Legal Officer of OFI Global Institutional, Inc., HarbourView Asset Management Corporation, OFI Global Trust Company, Oppenheimer Real Asset Management, Inc., OFI Private Investments Inc., Shareholder Services, Inc. and Trinity Investment Management Corporation (since February 2016); Senior Vice President and Deputy General Counsel (March 2015-February 2016) and Executive Vice President, Vice President, Corporate Counsel (February 2012-March 2015) and Deputy Chief Legal Officer (April 2013-March 2015) of Jennison Associates LLC; Assistant General Counsel (April 2008-September 2009) and Deputy General Counsel (October 2009-February 2012) of Lord Abbett & Co. LLC. An officer of 103 portfolios in the OppenheimerFunds complex. |
| |
Jennifer Foxson, Vice President and Chief Business Officer (since 2014) Year of Birth: 1969 | | Senior Vice President of OppenheimerFunds Distributor, Inc. (since June 2014); Vice President of OppenheimerFunds Distributor, Inc. (April 2006-June 2014); Vice President of the Sub-Adviser (January 1998-March 2006); Assistant Vice President of the Sub-Adviser (October 1991-December 1998). An officer of 103 portfolios in the OppenheimerFunds complex. |
| |
Mary Ann Picciotto, Chief Compliance Officer and Chief Anti-Money Laundering Officer (since 2014) Year of Birth: 1973 | | Senior Vice President and Chief Compliance Officer of the Manager (since March 2014); Chief Compliance Officer of the Sub- Adviser, OFI SteelPath, Inc., OFI Global Trust Company, OFI Global Institutional, Inc., Oppenheimer Real Asset Management, Inc., OFI Private Investments, Inc., Harborview Asset Management Corporation, Trinity Investment Management Corporation, and Shareholder Services, Inc. (since March 2014); Managing Director of Morgan Stanley Investment Management Inc. and certain of its various affiliated entities; Chief Compliance Officer of various Morgan Stanley Funds (May 2010-January 2014); Chief Compliance Officer of Morgan Stanley Investment Management Inc. (April 2007-January 2014). An officer of 103 portfolios in the OppenheimerFunds complex. |
| |
Brian S. Petersen, Treasurer and Principal Financial & Accounting Officer (since 2016) Year of Birth: 1970 | | Vice President of the Manager (since January 2013); Vice President of the Sub-Adviser (February 2007-December 2012); Assistant Vice President of the Sub-Adviser (August 2002-2007). An officer of 103 portfolios in the OppenheimerFunds complex. |
The Fund’s Statement of Additional Information contains additional information about the Fund’s Trustees and Officers and is available without charge, upon request, by calling 1.800.988.8287.
28 OPPENHEIMER MAIN STREET SMALL CAP FUND/VA
THIS PAGE INTENTIONALLY LEFT BLANK.
29 OPPENHEIMER MAIN STREET SMALL CAP FUND/VA
THIS PAGE INTENTIONALLY LEFT BLANK.
30 OPPENHEIMER MAIN STREET SMALL CAP FUND/VA
THIS PAGE INTENTIONALLY LEFT BLANK.
31 OPPENHEIMER MAIN STREET SMALL CAP FUND/VA
OPPENHEIMER MAIN STREET SMALL CAP FUND/VA
A Series of Oppenheimer Variable Account Funds
| | |
| Manager | | OFI Global Asset Management, Inc. |
| |
| Sub-Adviser | | OppenheimerFunds, Inc. |
| |
| Distributor | | OppenheimerFunds Distributor, Inc. |
| |
Transfer and Shareholder Servicing Agent | | OFI Global Asset Management, Inc. |
| |
| Sub-Transfer Agent | | Shareholder Services, Inc. |
| | DBA OppenheimerFunds Services |
| |
Independent Registered Public Accounting Firm | | KPMG LLP |
| |
| Legal Counsel | | Ropes & Gray LLP |
| |
| | Before investing in any of the Oppenheimer funds, investors should carefully consider a fund’s investment objectives, risks, charges and expenses. Fund prospectuses and summary prospectuses contain this and other information about the funds, and may be obtained by asking your financial advisor, or calling us at 1.800.988.8287. Read prospectuses and summary prospectuses carefully before investing. |
| |
| | © 2017 OppenheimerFunds, Inc. All rights reserved. Oppenheimer funds are distributed by OppenheimerFunds Distributor, Inc. |


December 31, 2016

ANNUAL REPORT
Listing of Top Holdings
Fund Performance Discussion
Financial Statements
*Prior to April 29, 2016, the Fund was named Oppenheimer Money Fund/VA
PORTFOLIO MANAGERS: Christopher Proctor, CFA and Adam S. Wilde, CFA
Current Yield
For the 7-Day Period Ended 12/31/16
With Compounding 0.01%
Without Compounding 0.01%
For the 12-Month Period Ended 12/31/16
With Compounding 0.01%
Without Compounding 0.01%
The performance data quoted represents past performance, which does not guarantee future results. Yields include dividends in a hypothetical investment for the periods shown. Current performance may be lower or higher than the performance quoted. For performance data current to the most recent month end, call us at 1.800.988.8287. The yields take into account voluntary fee waivers and/or expense reimbursements, without which yields would have been lower. Some of these undertakings may be modified at any time, as indicated in the prospectus. There is no guarantee that the Fund will maintain a positive yield. The Fund’s performance should not be expected to be the same as the returns of other funds, whether or not both funds have the same portfolio managers and/or similar names. The Fund’s performance does not include the charges associated with the separate account products that offer this Fund. Such performance would have been lower if such charges were taken into account.
| | | | |
| PORTFOLIO ALLOCATION | | | |
U.S. Government Agencies | | | 76.7% | |
Repurchase Agreements | | | 22.7 | |
U.S. Government Obligations | | | 0.6 | |
Portfolio holdings and allocations are subject to change. Percentages
are as of December 31, 2016, and are based on the total market value
of investments.
2 OPPENHEIMER GOVERNMENT MONEY FUND/VA
Fund Update
On April 29, 2016, the Fund converted from Oppenheimer Money Fund/VA to Oppenheimer Government Money Fund/VA.1 As such, the Fund now operates as a government money market fund, which requires that it invest 99.5% or more of its total assets in cash, government securities and/or repurchase agreements that are collateralized solely by government securities or cash. As a government money market fund, the Fund invests primarily in government agency securities, such as Federal Home Loan Bank System obligations, and short-term repurchase agreements collateralized by agency and treasury securities. Under the new rules adopted by the Securities and Exchange Commission (“SEC”), the Fund posts current and historical Fund metrics on the oppenheimerfunds.com website. Among these are the market based NAV, Daily Liquid Assets, Weekly Liquid Assets and Fund Net Inflows or Outflows.
FUND PERFORMANCE DISCUSSION
Throughout the reporting period, the Fund continued to offer very strong liquidity and a stable $1.00 net asset value (NAV), while providing competitive income. Throughout the year, short-term government market rates began to rise in anticipation of a Federal Reserve (the “Fed”) hike. The Fund benefited from these upticks as it was able to reinvest at higher rates. The Fund benefited further in December when the Fed followed through and increased the Federal Funds rate.
You could lose money by investing in the Fund. Although the Fund seeks to preserve the value of your investment at $1.00 per share, it cannot guarantee it will do so. An investment in the Fund is not insured or guaranteed by the Federal Deposit Insurance Corporation or any other government agency. The Fund’s sponsor has no legal obligation to provide financial support to the Fund, and you should not expect that the sponsor will provide financial support to the Fund at any time.
Investors should consider the Fund’s investment objective, risks, charges and expenses carefully before investing. The Fund’s prospectus and summary prospectus contain this and other information about the Fund, and may be obtained by asking your financial advisor or calling us at 1.800.988.8287. Read prospectuses and summary prospectuses carefully before investing.
Shares of Oppenheimer funds are not deposits or obligations of any bank, are not guaranteed by any bank, are not insured by the FDIC or any other agency, and involve investment risks, including the possible loss of the principal amount invested.
1. In connection with new rules governing money market funds implemented in October 2016, effective April 29, 2016, Oppenheimer Money Fund/VA changed its name to Oppenheimer Government Money Fund/VA, and made changes to its investment strategies that enable it to operate as a government money market fund.
3 OPPENHEIMER GOVERNMENT MONEY FUND/VA
Fund Expenses
Fund Expenses. As a shareholder of the Fund, you incur two types of costs: (1) transaction costs and (2) ongoing costs, including management fees; and other Fund expenses. These examples are intended to help you understand your ongoing costs (in dollars) of investing in the Fund and to compare these costs with the ongoing costs of investing in other mutual funds.
The examples are based on an investment of $1,000.00 invested at the beginning of the period and held for the entire 6-month period ended December 31, 2016.
Actual Expenses. The first section of the table provides information about actual account values and actual expenses. You may use the information in this section, together with the amount you invested, to estimate the expense that you paid over the period. Simply divide your account value by $1,000.00 (for example, an $8,600.00 account value divided by $1,000.00 = 8.60), then multiply the result by the number in the first section under the heading entitled “Expenses Paid During 6 Months Ended December 31, 2016” to estimate the expenses you paid on your account during this period.
Hypothetical Example for Comparison Purposes.
The second section of the table provides information about hypothetical account values and hypothetical expenses based on the Fund’s actual expense ratio, and an assumed rate of return of 5% per year before expenses, which is not the actual return. The hypothetical account values and expenses may not be used to estimate the actual ending account balance or expenses you paid for the period. You may use this information to compare the ongoing costs of investing in the Fund and other funds. To do so, compare this 5% hypothetical example with the 5% hypothetical examples that appear in the shareholder reports of the other funds.
Please note that the expenses shown in the table are meant to highlight your ongoing costs only and do not reflect any charges associated with the separate accounts that offer this Fund. Therefore, the “hypothetical” lines of the table are useful in comparing ongoing costs only, and will not help you determine the relative total costs of owning different funds. In addition, if these separate account charges were included your costs would have been higher.
| | | | | | | | | | | | | | | | | | | | | | | | |
| Actual | | Beginning
Account
Value
July 1, 2016 | | | | | | Ending
Account
Value
December 31, 2016 | | | | | | Expenses
Paid During
6 Months Ended
December 31, 2016 | | | | |
| | | $ | 1,000.00 | | | | | | | $ | 1,000.10 | | | | | | | | $ 1.61 | | | | | |
| | | | | | |
Hypothetical | | | | | | | | | | | | | | | | | | | | | | | | |
(5% return before expenses) | | | | | | | | | | | | | | | | | | | | | | | | |
| | | | 1,000.00 | | | | | | | | 1,023.53 | | | | | | | | 1.63 | | | | | |
Expenses are equal to the Fund’s annualized expense ratio, multiplied by the average account value over the period, multiplied by 184/366 (to reflect the one-half year period). This annualized expense ratio, excluding indirect expenses from affiliated funds, based on the 6-month period ended December 31,
2016 is as follows:
The expense ratio reflects voluntary and/or contractual waivers and/or reimbursements of expenses by the Fund’s Manager. Some of these undertakings may be modified or terminated at any time, as indicated in the Fund’s prospectus. The “Financial Highlights” table in the Fund’s financial statements, included in this report, also shows the gross expense ratio, without such waivers or reimbursements and reduction to custodian expenses, if applicable.
4 OPPENHEIMER GOVERNMENT MONEY FUND/VA
STATEMENT OF INVESTMENTS December 31, 2016
| | | | | | | | | | | | | | | | |
| | | Maturity Date* | | | Final Legal Maturity
Date** | | | Principal
Amount | | | Value | |
U.S. Government Agencies—76.6% | | | | | | | | | | | | | | | | |
Fannie Mae, 0.41% | | | 1/17/17 | | | | 1/17/17 | | | $ | 4,000,000 | | | $ | 3,999,271 | |
Federal Farm Credit Bank: | | | | | | | | | | | | | | | | |
0.74%1 | | | 1/3/17 | | | | 3/22/17 | | | | 1,000,000 | | | | 999,757 | |
0.766%1 | | | 1/27/17 | | | | 11/27/17 | | | | 2,000,000 | | | | 2,000,844 | |
Federal Home Loan Bank: | | | | | | | | | | | | | | | | |
0.295% | | | 1/3/17 | | | | 1/3/17 | | | | 3,000,000 | | | | 2,999,951 | |
0.34% | | | 1/10/17 | | | | 1/10/17 | | | | 5,000,000 | | | | 4,999,575 | |
0.36% | | | 1/5/17 | | | | 1/5/17 | | | | 20,000,000 | | | | 19,999,200 | |
0.364% | | | 1/27/17 | | | | 1/27/17 | | | | 5,000,000 | | | | 4,998,686 | |
0.37% | | | 2/3/17 | | | | 2/3/17 | | | | 5,000,000 | | | | 4,998,304 | |
0.391% | | | 2/24/17 | | | | 2/24/17 | | | | 3,000,000 | | | | 2,998,245 | |
0.393% | | | 1/12/17 | | | | 1/12/17 | | | | 25,800,000 | | | | 25,796,900 | |
0.407% | | | 1/11/17 | | | | 1/11/17 | | | | 36,200,000 | | | | 36,195,905 | |
0.41% | | | 1/6/17 | | | | 1/6/17 | | | | 12,100,000 | | | | 12,099,311 | |
0.439% | | | 2/8/17 | | | | 2/8/17 | | | | 13,000,000 | | | | 12,993,983 | |
0.444% | | | 1/20/17 | | | | 1/20/17 | | | | 14,630,000 | | | | 14,626,577 | |
0.451% | | | 1/4/17 | | | | 1/4/17 | | | | 25,000,000 | | | | 24,999,060 | |
0.452% | | | 1/13/17 | | | | 1/13/17 | | | | 34,900,000 | | | | 34,894,747 | |
0.457% | | | 1/25/17 | | | | 1/25/17 | | | | 30,000,000 | | | | 29,990,867 | |
0.461%1 | | | 1/27/17 | | | | 7/27/17 | | | | 2,000,000 | | | | 1,999,655 | |
0.464% | | | 1/18/17 | | | | 1/18/17 | | | | 37,800,000 | | | | 37,791,714 | |
0.468% | | | 3/1/17 | | | | 3/1/17 | | | | 10,000,000 | | | | 9,992,338 | |
0.476% | | | 1/24/17 | | | | 1/24/17 | | | | 25,050,000 | | | | 25,042,381 | |
0.501% | | | 2/9/17 | | | | 2/9/17 | | | | 3,000,000 | | | | 2,998,375 | |
0.51% | | | 2/10/17 | | | | 2/10/17 | | | | 9,603,000 | | | | 9,597,558 | |
0.52% | | | 2/15/17 | | | | 2/15/17 | | | | 20,000,000 | | | | 19,987,000 | |
0.541% | | | 3/28/17 | | | | 3/28/17 | | | | 10,000,000 | | | | 9,987,100 | |
0.551% | | | 2/22/17 | | | | 2/22/17 | | | | 4,299,000 | | | | 4,295,585 | |
0.622% | | | 6/2/17 | | | | 6/2/17 | | | | 3,000,000 | | | | 2,992,147 | |
0.636%1 | | | 1/24/17 | | | | 4/24/17 | | | | 3,000,000 | | | | 3,000,000 | |
0.675%1 | | | 1/5/17 | | | | 9/5/17 | | | | 1,135,000 | | | | 1,135,712 | |
0.722%1 | | | 1/7/17 | | | | 12/7/17 | | | | 3,000,000 | | | | 3,003,285 | |
0.847%1 | | | 2/9/17 | | | | 8/9/17 | | | | 6,000,000 | | | | 6,009,962 | |
0.905%1 | | | 2/25/17 | | | | 8/25/17 | | | | 2,000,000 | | | | 2,004,168 | |
Freddie Mac: | | | | | | | | | | | | | | | | |
0.501% | | | 5/16/17 | | | | 5/16/17 | | | | 5,000,000 | | | | 4,990,625 | |
0.75% | | | 7/14/17 | | | | 7/14/17 | | | | 1,000,000 | | | | 1,000,100 | |
Tennessee Valley Authority: | | | | | | | | | | | | | | | | |
0.498% | | | 1/10/17 | | | | 1/10/17 | | | | 10,000,000 | | | | 9,998,755 | |
0.50% | | | 1/3/17 | | | | 1/3/17 | | | | 20,000,000 | | | | 19,999,444 | |
Total U.S. Government Agencies (Cost $415,417,087) | | | | | | | | | | | | | | | 415,417,087 | |
U.S. Government Obligations—0.6% | | | | | | | | | |
United States Treasury Bills, 0.489% | | | 4/6/17 | | | | 4/6/17 | | | | 2,000,000 | | | | 1,997,427 | |
United States Treasury Nts., 0.625% | | | 8/31/17 | | | | 8/31/17 | | | | 1,000,000 | | | | 999,093 | |
Total U.S. Government Obligations (Cost $2,996,520) | | | | | | | | 2,996,520 | |
Repurchase Agreements—22.7% | | | | | | | | | |
Repurchase Agreements2 (Cost $123,000,000) | | | | | | | | | | | 123,000,000 | | | | 123,000,000 | |
Total Investments, at Value (Cost $541,413,607) | | | | 99.9% | | | | 541,413,607 | |
Net Other Assets (Liabilities) | | | | | | | | | | | 0.1 | | | | 556,318 | |
Net Assets | | | | | | | | | | | 100.0% | | | $ | 541,969,925 | |
| | | | | | | | | | | | | | | | |
Footnotes to Statement of Investments
Short-term notes and direct bank obligations are generally traded on a discount basis; the interest rate shown is the discount rate received by the Fund at the time of purchase. Other securities normally bear interest at the rates shown.
*. The Maturity Date represents the date used to calculate the Fund’s weighted average maturity as determined under Rule 2a-7.
**. If different from the Maturity Date, the Final Legal Maturity Date includes any maturity date extensions which may be affected at the option of the issuer or unconditional payments of principal by the issuer which may be affected at the option of the Fund, and represents the date used to calculate the Fund’s weighted average life as determined under Rule 2a-7.
1. Represents the current interest rate for a variable or increasing rate security.
2. Repurchase agreements:
5 OPPENHEIMER GOVERNMENT MONEY FUND/VA
STATEMENT OF INVESTMENTS Continued
Footnotes to Statement of Investments (Continued)
| | | | | | | | | | | | | | | | | | | | | | | | | | | | | | |
| Counterparty | | Lending
Rate | | | Settlement
Date | | | Maturity
Date | | | Principal
Amount | | | Collateralized By | | Collateral
Received, at
Valuea | | | Repurchase
Agreements, at
Value | | | Repurchase
Agreement
Proceeds to be
Receiveda | |
| Credit Agricole Corp. & Investment Bank | | | 0.52% | | | | 12/30/16 | | | | 1/3/17 | | | | $5,000,000 | | | U.S. Treasury Bonds, 1.375%, 2/15/44 | | | $(5,100,351 | ) | | | $5,000,000 | | | | $5,000,344 | |
| Deutsche Bank Securities, Inc. | | | 0.46 | | | | 12/30/16 | | | | 1/3/17 | | | | 12,000,000 | | | U.S. Agency Mortgages, 1.75%, 6/20/19 | | | (12,241,029 | ) | | | 12,000,000 | | | | 12,001,009 | |
| Deutsche Bank Securities, Inc. | | | 0.54 | | | | 12/20/16 | | | | 1/10/17 | | | | 5,000,000 | | | U.S. Agency Mortgages, 1%, 3/8/17 | | | (5,101,431 | ) | | | 5,000,000 | | | | 5,001,403 | |
| Deutsche Bank Securities, Inc. | | | 0.54 | | | | 12/23/16 | | | | 1/13/17 | | | | 2,000,000 | | | U.S. Agency Mortgages, 1%, 3/8/17 | | | (2,041,175 | ) | | | 2,000,000 | | | | 2,001,152 | |
| Deutsche Bank Securities, Inc. | | | 0.55 | | | | 12/19/16 | | | | 1/5/17 | | | | 2,000,000 | | | U.S. Agency Mortgages, 1%, 3/8/17 | | | (2,041,175 | ) | | | 2,000,000 | | | | 2,001,152 | |
| Deutsche Bank Securities, Inc. | | | 0.57 | | | | 12/27/16 | | | | 1/17/17 | | | | 1,000,000 | | | U.S. Agency Mortgages, 1%, 3/8/17 | | | (1,021,089 | ) | | | 1,000,000 | | | | 1,001,068 | |
| RBC Dominion Securities, Inc. | | | 0.50 | | | | 12/30/16 | | | | 1/3/17 | | | | 12,000,000 | | | U.S. Agency Mortgages, 3.50%, 4/20/46-6/20/46 | | | (12,240,680 | ) | | | 12,000,000 | | | | 12,000,667 | |
| RBC Dominion Securities, Inc. | | | 0.52 | | | | 12/23/16 | | | | 1/3/17 | | | | 2,000,000 | | | U.S. Agency Mortgages, 3%, 7/20/46 | | | (2,040,325 | ) | | | 2,000,000 | | | | 2,000,319 | |
| RBC Dominion Securities, Inc. | | | 0.53 | | | | 12/19/16 | | | | 1/4/17 | | | | 2,000,000 | | | U.S. Agency Mortgages, 4%, 6/20/44 | | | (2,040,451 | ) | | | 2,000,000 | | | | 2,000,442 | |
| RBC Dominion Securities, Inc. | | | 0.54 | | | | 12/28/16 | | | | 1/4/17 | | | | 10,000,000 | | | U.S. Agency Mortgages, 3.50%-4%, 1/20/44-4/20/46 | | | (10,200,918 | ) | | | 10,000,000 | | | | 10,000,900 | |
| South Street Securities, Inc. | | | 0.50 | | | | 12/30/16 | | | | 1/3/17 | | | | 50,000,000 | | | U.S. Agency Mortgages, 0.827%-3.975%, 11/1/17-1/25/45 | | | (51,747,934 | ) | | | 50,000,000 | | | | 50,002,778 | |
| TD Securities (USA) LLC | | | 0.59 | | | | 12/27/16 | | | | 1/3/17 | | | | 20,000,000 | | | U.S. Treasury Bonds, 3%, 11/15/45 | | | (20,402,430 | ) | | | 20,000,000 | | | | 20,002,383 | |
| | | | | | | | | | | | | | | | | | | | | $(126,218,988 | ) | | | $123,000,000 | | | | $123,013,617 | |
| | | | | | | | | | | | | | | | | | | | | | | | | | | | | | |
a. Includes accrued interest.
The following issuer is or was an affiliate, as defined in the Investment Company Act of 1940, at or during the reporting period by virtue of the Fund owning at least 5% of the voting securities of the issuer or as a result of the Fund and the issuer having the same investment adviser. There were no affiliate securities held by the Fund at period end. Transactions during the period in which the issuer was an affiliate are as follows:
| | | | | | | | | | | | | | | | | | |
| | | Shares
December 31, 2015 | | | Gross
Additions | | | Gross
Reductions | | | | | Shares
December 31, 2016 | |
Oppenheimer Institutional Government Money Market Fund, Cl. Ea | | | 131,359,385 | | | | 126,653,654 | | | | 258,013,039 | | | | | | — | |
| | | | | |
| | | | | | | | | | | | | | Income | |
Oppenheimer Institutional Government Money Market Fund, Cl. Ea | | | | | | | | | | | | | | $ | | | 190,049 | |
a. Prior to September 28, 2016, this fund was named Oppenheimer Institutional Money Market Fund.
See accompanying Notes to Financial Statements.
6 OPPENHEIMER GOVERNMENT MONEY FUND/VA
STATEMENT OF ASSETS AND LIABILITIES December 31, 2016
| | | | |
| Assets | | | |
Investments, at value (cost $541,413,607)—see accompanying statement of investments | | $ | 541,413,607 | |
Cash | | | 620,530 | |
Receivables and other assets: | | | | |
Shares of beneficial interest sold | | | 76,640 | |
Interest | | | 26,263 | |
Other | | | 40,736 | |
Total assets | | | 542,177,776 | |
Liabilities | | | | |
Payables and other liabilities: | | | | |
Shares of beneficial interest redeemed | | | 128,794 | |
Trustees’ compensation | | | 35,363 | |
Legal, auditing and other professional fees | | | 24,034 | |
Shareholder communications | | | 14,289 | |
Dividends | | | 2,035 | |
Other | | | 3,336 | |
Total liabilities | | | 207,851 | |
Net Assets | | $ | 541,969,925 | |
| | | | |
| |
| | | | |
Composition of Net Assets | | | | |
Par value of shares of beneficial interest | | $ | 541,943 | |
Additional paid-in capital | | | 541,408,064 | |
Accumulated net investment income | | | 20,133 | |
Accumulated net realized loss on investments | | | (215 | ) |
Net Assets – applicable to 541,943,307 shares of beneficial interest outstanding | | $ | 541,969,925 | |
| | | | |
| |
| | | | |
Net Asset Value, Redemption Price Per Share and Offering Price Per Share | | | $1.00 | |
See accompanying Notes to Financial Statements.
7 OPPENHEIMER GOVERNMENT MONEY FUND/VA
STATEMENT OF OPERATIONS For the Year Ended December 31, 2016
| | | | |
| | |
Investment Income | | | | |
| |
Interest | | $ | 5,035,253 | |
| |
Dividends from affiliated companies | | | 190,049 | |
| |
Total investment income | | | 5,225,302 | |
| | |
Expenses | | | | |
| |
Management fees | | | 6,131,106 | |
| |
Transfer and shareholder servicing agent fees | | | 1,477,875 | |
| |
Shareholder communications | | | 66,269 | |
| |
Trustees’ compensation | | | 85,299 | |
| |
Custodian fees and expenses | | | 12,909 | |
| |
Other | | | 339,355 | |
| |
Total expenses | | | 8,112,813 | |
| |
Less reduction to custodian expenses | | | (7,838 | ) |
| |
Less waivers and reimbursements of expenses | | | (3,027,668) | |
| |
Net expenses | | | 5,077,307 | |
| |
Net Investment Income | | | 147,995 | |
| |
Realized Loss | | | (215 | ) |
| |
Net Increase in Net Assets Resulting from Operations | | $ | 147,780 | |
| | | | |
See accompanying Notes to Financial Statements.
8 OPPENHEIMER GOVERNMENT MONEY FUND/VA
STATEMENTS OF CHANGES IN NET ASSETS
| | | | | | | | |
| | | Year Ended
December 31, 2016 | | | Year Ended
December 31, 2015 | |
Operations | | | | | | | | |
| | |
Net investment income | | $ | 147,995 | | | $ | 114,454 | |
| | |
Net realized gain (loss) | | | (215) | | | | 22,016 | |
| | |
Net increase in net assets resulting from operations | | | 147,780 | | | | 136,470 | |
Dividends and/or Distributions to Shareholders | | | | | | | | |
| | |
Dividends from net investment income | | | (153,515) | | | | (119,146) | |
Beneficial Interest Transactions | | | | | | | | |
| | |
Net increase (decrease) in net assets resulting from beneficial interest transactions | | | (2,106,660,389) | | | | 2,133,322,061 | |
Net Assets | | | | | | | | |
| | |
Total increase (decrease) | | | (2,106,666,124) | | | | 2,133,339,385 | |
| | |
Beginning of period | | | 2,648,636,049 | | | | 515,296,664 | |
| | |
End of period (including accumulated net investment income of $20,133 and $25,655, respectively) | | $ | 541,969,925 | | | $ | 2,648,636,049 | |
| | | | | | | | |
See accompanying Notes to Financial Statements.
9 OPPENHEIMER GOVERNMENT MONEY FUND/VA
FINANCIAL HIGHLIGHTS
| | | | | | | | | | | | | | | | | | | | |
| | | Year Ended
December 31,
2016 | | | Year Ended
December 31,
2015 | | | Year Ended
December 31,
2014 | | | Year Ended
December 31,
2013 | | | Year Ended
December 31,
2012 | |
Per Share Operating Data | | | | | | | | | | | | | | | | | | | | |
Net asset value, beginning of period | | $ | 1.00 | | | $ | 1.00 | | | $ | 1.00 | | | $ | 1.00 | | | $ | 1.00 | |
Income (loss) from investment operations: | | | | | | | | | | | | | | | | | | | | |
Net investment income1 | | | 0.00 | 2 | | | 0.00 | 2 | | | 0.00 | 2 | | | 0.00 | 2 | | | 0.00 | 2 |
Net realized gain (loss) | | | (0.00 | )2 | | | 0.00 | 2 | | | 0.00 | 2 | | | 0.00 | 2 | | | 0.00 | 2 |
| | | | | | | | | | | | | | | | | | | | |
Total from investment operations | | | 0.00 | 2 | | | 0.00 | 2 | | | 0.00 | 2 | | | 0.00 | 2 | | | 0.00 | 2 |
Dividends and/or distributions to shareholders: | | | | | | | | | | | | | | | | | | | | |
Dividends from net investment income | | | (0.00 | )2 | | | (0.00 | )2 | | | (0.00 | )2 | | | (0.00 | )2 | | | (0.00 | )2 |
Net asset value, end of period | | $ | 1.00 | | | $ | 1.00 | | | $ | 1.00 | | | $ | 1.00 | | | $ | 1.00 | |
| | | | |
| | | | |
| | | | | |
Total Return, at Net Asset Value3 | | | 0.01% | | | | 0.01% | | | | 0.01% | | | | 0.01% | | | | 0.01% | |
| | | | | | | | | | | | | | | | | | | | | |
Ratios/Supplemental Data | | | | | | | | | | | | | | | | | | | | |
Net assets, end of period (in thousands) | | $ | 541,970 | | | $ | 2,648,636 | | | $ | 515,297 | | | $ | 177,026 | | | $ | 174,428 | |
Average net assets (in thousands) | | $ | 1,470,447 | | | $ | 1,144,581 | | | $ | 329,045 | | | $ | 178,263 | | | $ | 164,276 | |
Ratios to average net assets:4 | | | | | | | | | | | | | | | | | | | | |
Net investment income | | | 0.01% | | | | 0.01% | | | | 0.01% | | | | 0.01% | | | | 0.01% | |
Total expenses5 | | | 0.55% | | | | 0.53% | | | | 0.57% | | | | 0.61% | | | | 0.62% | |
Expenses after payments, waivers and/or reimbursements and reduction to custodian expenses | | | 0.35% | | | | 0.19% | | | | 0.15% | | | | 0.22% | | | | 0.30% | |
1. Per share amounts calculated based on the average shares outstanding during the period.
2. Less than $0.005 per share.
3. Assumes an initial investment on the business day before the first day of the fiscal period, with all dividends and distributions reinvested in additional shares on the reinvestment date, and redemption at the net asset value calculated on the last business day of the fiscal period. Total returns are not annualized for periods less than one full year. Total return information does not reflect expenses that apply at the separate account level or to related insurance products. Inclusion of these charges would reduce the total return figures for all periods shown. Returns do not reflect the deduction of taxes that a shareholder would pay on fund distributions or the redemption of fund shares.
4. Annualized for periods less than one full year.
5. Total expenses including indirect expenses from affiliated fund fees and expenses were as follows:
| | | | | | |
| | | | |
| | Year Ended December 31, 2016 | | | 0.55% | |
| | Year Ended December 31, 2015 | | | 0.53% | |
| | Year Ended December 31, 2014 | | | 0.57% | |
See accompanying Notes to Financial Statements.
10 OPPENHEIMER GOVERNMENT MONEY FUND/VA
NOTES TO FINANCIAL STATEMENTS December 31, 2016
1. Organization
Oppenheimer Government Money Fund/VA, formerly Oppenheimer Money Fund/VA (the “Fund”), a separate series of Oppenheimer Variable Account Funds, is a diversified open-end management investment company registered under the Investment Company Act of 1940 (“1940 Act”), as amended. The Fund’s investment objective is to seek income consistent with stability of principal. The Fund’s investment adviser is OFI Global Asset Management, Inc. (“OFI Global” or the “Manager”), a wholly-owned subsidiary of OppenheimerFunds, Inc. (“OFI” or the “Sub-Adviser”). The Manager has entered into a sub-advisory agreement with OFI. Shares of the Fund are sold only to separate accounts of life insurance companies.
The following is a summary of significant accounting policies followed in the Fund’s preparation of financial statements in accordance with accounting principles generally accepted in the United States (“U.S. GAAP”).
2. Significant Accounting Policies
Security Valuation. All investments in securities are recorded at their estimated fair value, as described in Note 3.
Dividends and Distributions to Shareholders. Dividends and distributions to shareholders, which are determined in accordance with income tax regulations and may differ from U.S. GAAP, are recorded on the ex-dividend date. Income distributions, if any, are declared daily and paid monthly. Capital gain distributions, if any, are declared and paid annually but may be paid at other times to maintain the net asset value per share at $1.00.
Investment Income. Interest income is recognized on an accrual basis. Discount and premium, which are included in interest income on the Statement of Operations, are amortized or accreted daily.
Custodian Fees. “Custodian fees and expenses” in the Statement of Operations may include interest expense incurred by the Fund on any cash overdrafts of its custodian account during the period. Such cash overdrafts may result from the effects of failed trades in portfolio securities and from cash outflows resulting from unanticipated shareholder redemption activity. The Fund pays interest to its custodian on such cash overdrafts, to the extent they are not offset by positive cash balances maintained by the Fund, at a rate equal to the Federal Funds Rate plus 0.50%. This rate will increase to 2.00% effective January 1, 2017. The “Reduction to custodian expenses” line item, if applicable, represents earnings on cash balances maintained by the Fund during the period. Such interest expense and other custodian fees may be paid with these earnings.
Security Transactions. Security transactions are recorded on the trade date. Realized gains and losses on securities sold are determined on the basis of identified cost.
Indemnifications. The Fund’s organizational documents provide current and former Trustees and officers with a limited indemnification against liabilities arising in connection with the performance of their duties to the Fund. In the normal course of business, the Fund may also enter into contracts that provide general indemnifications. The Fund’s maximum exposure under these arrangements is unknown as this would be dependent on future claims that may be made against the Fund. The risk of material loss from such claims is considered remote.
Federal Taxes. The Fund intends to comply with provisions of the Internal Revenue Code applicable to regulated investment companies and to distribute substantially all of its investment company taxable income to shareholders. Therefore, no federal income or excise tax provision is required. The Fund files income tax returns in U.S. federal and applicable state jurisdictions. The statute of limitations on the Fund’s tax return filings generally remains open for the three preceding fiscal reporting period ends. The Fund has analyzed its tax positions for the fiscal year ended December 31, 2016, including open tax years, and does not believe there are any uncertain tax positions requiring recognition in the Fund’s financial statements.
The tax components of capital shown in the following table represent distribution requirements the Fund must satisfy under the income tax regulations, losses the Fund may be able to offset against income and gains realized in future years for federal income tax purposes.
| | | | | | | | |
| | Undistributed Net Investment Income | | Undistributed Long-Term Gain | | Accumulated Loss Carryforward1,2,3 | | |
| | $60,163 | | $— | | $215 | | |
1. At period end, the Fund had $215 of net capital loss carryforward available to offset future realized capital gains, if any, and thereby reduce future taxable gain distributions. Details of the capital loss carryforwards are included in the table below. Capital loss carryovers with no expiration, if any, must be utilized prior to those with expiration dates.
| | | | | | | | | | | | | | | | |
| | | | | | Expiring | | | | | | | | | | |
| | | | | | No expiration | | $ | | 215 | | | | | | |
2. During the reporting period, the Fund did not utilize any capital loss carryforwards.
3. During the previous reporting period, the Fund did not utilize any capital loss carryforwards.
Net investment income (loss) and net realized gain (loss) may differ for financial statement and tax purposes. The character of dividends and distributions made during the fiscal year from net investment income or net realized gains are determined in accordance with federal income tax requirements, which may differ from the character of net investment income or net realized gains presented in those financial statements in accordance with U.S. GAAP. Also, due to timing of dividends and distributions, the fiscal year in which amounts are distributed may differ from the fiscal year in which the income or net realized gain was recorded by the Fund.
11 OPPENHEIMER GOVERNMENT MONEY FUND/VA
NOTES TO FINANCIAL STATEMENTS Continued
2. Significant Accounting Policies (Continued)
Accordingly, the following amounts have been reclassified for the reporting period. Net assets of the Fund were unaffected by the reclassifications.
| | |
Increase to Paid-in Capital | | Reduction to Accumulated Net Investment Income |
$2 | | $2 |
The tax character of distributions paid during the reporting periods:
| | | | | | | | |
| | | Year Ended
December 31, 2016 | | | Year Ended
December 31, 2015 | |
Distributions paid from: | | | | | | | | |
Ordinary income | | $ | 153,515 | | | $ | 119,146 | |
Use of Estimates. The preparation of financial statements in conformity with U.S. GAAP requires management to make estimates and assumptions that affect the reported amounts of assets and liabilities and disclosure of contingent assets and liabilities at the date of the financial statements and the reported amounts of increases and decreases in net assets from operations during the reporting period. Actual results could differ from those estimates.
Money Market Fund Reform. In accordance with the Reform Rules, adopted by the Securities and Exchange Commission (SEC) in July 2014, the Fund’s name changed from Oppenheimer Money Fund/VA to Oppenheimer Government Money Fund/VA effective April 29, 2016. Additionally the Board of Trustees approved the adoption of a new non-fundamental investment policy requiring each Fund to invest 99.5% or more of its total assets in cash, government securities, and/or repurchase agreements that are collateralized fully by cash and/or government securities.
3. Securities Valuation
The Fund calculates the net asset value of its shares as of 4:00 P.M. Eastern time, on each day the New York Stock Exchange (the “Exchange”) is open for trading, except in the case of a scheduled early closing of the Exchange, in which case the Fund will calculate net asset value of the shares as of the scheduled early closing time of the Exchange.
The Fund’s Board has adopted procedures for the valuation of the Fund’s securities and has delegated the day-to-day responsibility for valuation determinations under those procedures to the Manager. The Manager has established a Valuation Committee which is responsible for determining a “fair valuation” for any security for which market quotations are not “readily available.” The Valuation Committee’s fair valuation determinations are subject to review, approval and ratification by the Fund’s Board at its next regularly scheduled meeting covering the calendar quarter in which the fair valuation was determined.
Valuation Methods and Inputs
Securities are valued at cost adjusted by the amortization of discount or premium to maturity (amortized cost), which approximates market value. If amortized cost is determined not to approximate market value, the fair value of the portfolio securities will be determined under procedures approved by the Fund’s Board of Trustees.
If a market value or price cannot be determined for a security using the methodologies described above, or if, in the “good faith” opinion of the Manager, the market value or price obtained does not constitute a “readily available market quotation,” or a significant event has occurred that would materially affect the value of the security, the security is fair valued either (i) by a standardized fair valuation methodology applicable to the security type or the significant event as previously approved by the Valuation Committee and the Fund’s Board or (ii) as determined in good faith by the Manager’s Valuation Committee. The Valuation Committee considers all relevant facts that are reasonably available, through either public information or information available to the Manager, when determining the fair value of a security. Fair value determinations by the Manager are subject to review, approval and ratification by the Fund’s Board at its next regularly scheduled meeting covering the calendar quarter in which the fair valuation was determined. Those fair valuation standardized methodologies include, but are not limited to, valuing securities at the last sale price or initially at cost and subsequently adjusting the value based on: changes in company specific fundamentals, changes in an appropriate securities index, or changes in the value of similar securities which may be further adjusted for any discounts related to security-specific resale restrictions. When possible, such methodologies use observable market inputs such as unadjusted quoted prices of similar securities, observable interest rates, currency rates and yield curves. The methodologies used for valuing securities are not necessarily an indication of the risks associated with investing in those securities nor can it be assured that the Fund can obtain the fair value assigned to a security if it were to sell the security.
To assess the continuing appropriateness of security valuations, the Manager, or its third party service provider who is subject to oversight by the Manager, regularly compares prior day prices, prices on comparable securities, and sale prices to the current day prices and challenges those prices exceeding certain tolerance levels with the third party pricing service or broker source. For those securities valued by fair valuations, whether through a standardized fair valuation methodology or a fair valuation determination, the Valuation Committee reviews and affirms the reasonableness of the valuations based on such methodologies and fair valuation determinations on a regular basis after considering all relevant information that is reasonably available.
12 OPPENHEIMER GOVERNMENT MONEY FUND/VA
3. Securities Valuation (Continued)
Classifications
Each investment asset or liability of the Fund is assigned a level at measurement date based on the significance and source of the inputs to its valuation. Various data inputs are used in determining the value of each of the Fund’s investments as of the reporting period end. These data inputs are categorized in the following hierarchy under applicable financial accounting standards:
1) Level 1-unadjusted quoted prices in active markets for identical assets or liabilities (including securities actively traded on a securities exchange)
2) Level 2-inputs other than unadjusted quoted prices that are observable for the asset or liability (such as unadjusted quoted prices for similar and market corroborated inputs such as interest rates, prepayment speeds, credit risks, etc.)
3) Level 3-significant unobservable inputs (including the Manager’s own judgments about assumptions that market participants would use in pricing asset or liability).
The inputs used for valuing securities are not necessarily an indication of the risks associated with investing in those securities.
The table below categorizes amounts that are included in the Fund’s Statement of Assets and Liabilities at period end based on valuation input level:
| | | | | | | | | | | | | | | | |
| | | Level 1—
Unadjusted
Quoted
Prices | | | Level 2—
Other Significant
Observable
Inputs | | | Level 3—
Significant
Unobservable
Inputs | | | Value | |
Assets Table | | | | | | | | | | | | | | | | |
Investments, at Value: | | | | | | | | | | | | | | | | |
U.S. Government Agencies | | $ | — | | | $ | 415,417,087 | | | $ | — | | | $ | 415,417,087 | |
U.S. Government Obligations | | | — | | | | 2,996,520 | | | | — | | | | 2,996,520 | |
Repurchase Agreement | | | — | | | | 123,000,000 | | | | — | | | | 123,000,000 | |
| | | | |
Total Assets | | $ | — | | | $ | 541,413,607 | | | $ | — | | | $ | 541,413,607 | |
| | | | |
4. Investments and Risks
Investments in Affiliated Funds. The Fund is permitted to invest in other mutual funds advised by the Manager (“Affiliated Funds”). Affiliated Funds are open-end management investment companies registered under the 1940 Act, as amended. The Manager is the investment adviser of, and the Sub-Adviser provides investment and related advisory services to, the Affiliated Funds. When applicable, the Fund’s investments in Affiliated Funds are included in the Statement of Investments. Shares of Affiliated Funds are valued at their net asset value per share. As a shareholder, the Fund is subject to its proportional share of the Affiliated Funds’ expenses, including their management fee. The Manager will waive fees and/or reimburse Fund expenses in an amount equal to the indirect management fees incurred through the Fund’s investment in the Affiliated Funds.
Each of the Affiliated Funds in which the Fund invests has its own investment risks, and those risks can affect the value of the Fund’s investments and therefore the value of the Fund’s shares. To the extent that the Fund invests more of its assets in one Affiliated Fund than in another, the Fund will have greater exposure to the risks of that Affiliated Fund.
Investments in Money Market Instruments. The Fund is permitted to invest its free cash balances in money market instruments to provide liquidity or for defensive purposes. The Fund may invest in money market instruments by investing in Class E shares of Oppenheimer Institutional Government Money Market Fund (“IGMMF”), formerly known as Oppenheimer Institutional Money Market Fund, which is an Affiliated Fund. IGMMF is regulated as a money market fund under the 1940 Act, as amended. The
Fund may also invest in money market instruments directly or in other affiliated or unaffiliated money market funds. At period end, the Fund had no holdings in IGMMF.
Shareholder Concentration. At period end, one shareholder owned 20% or more of the Fund’s total outstanding shares.
5. Market Risk Factors
The Fund’s investments in securities and/or financial derivatives may expose the Fund to various market risk factors:
Commodity Risk. Commodity risk relates to the change in value of commodities or commodity indexes as they relate to increases or decreases in the commodities market. Commodities are physical assets that have tangible properties. Examples of these types of assets are crude oil, heating oil, metals, livestock, and agricultural products.
Credit Risk. Credit risk relates to the ability of the issuer of debt to meet interest and principal payments, or both, as they come due. In general, lower-grade, higher-yield debt securities are subject to credit risk to a greater extent than lower-yield, higher-quality securities.
Equity Risk. Equity risk relates to the change in value of equity securities as they relate to increases or decreases in the general market.
Foreign Exchange Rate Risk. Foreign exchange rate risk relates to the change in the U.S. dollar value of a security held that is denominated in a foreign currency. The U.S. dollar value of a foreign currency denominated security will decrease as the dollar appreciates against the currency, while the U.S. dollar value will increase as the dollar depreciates against the currency.
Interest Rate Risk. Interest rate risk refers to the fluctuations in value of fixed-income securities resulting from the inverse relationship between price and yield. For example, an increase in general interest rates will tend to reduce the market value of already issued fixed-income investments, and a decline in general interest rates will tend to increase their value. In addition, debt securities with longer maturities, which tend to have higher yields,
13 OPPENHEIMER GOVERNMENT MONEY FUND/VA
NOTES TO FINANCIAL STATEMENTS Continued
5. Market Risk Factors (Continued)
are subject to potentially greater fluctuations in value from changes in interest rates than obligations with shorter maturities.
Volatility Risk. Volatility risk refers to the magnitude of the movement, but not the direction of the movement, in a financial instrument’s price over a defined time period. Large increases or decreases in a financial instrument’s price over a relative time period typically indicate greater volatility risk, while small increases or decreases in its price typically indicate lower volatility risk.
6. Shares of Beneficial Interest
The Fund has authorized an unlimited number of $0.001 par value shares of beneficial interest. Transactions in shares of beneficial interest were as follows:
| | | | | | | | | | | | | | | | |
| | | Year Ended December 31, 2016 | | | Year Ended December 31, 2015 | |
| | | Shares | | | Amount | | | Shares | | | Amount | |
Sold | | | 1,180,358,383 | | | $ | 1,180,358,383 | | | | 3,416,245,044 | | | $ | 3,416,245,044 | |
Dividends and/or distributions reinvested | | | 159,576 | | | | 159,576 | | | | 112,387 | | | | 112,387 | |
Redeemed | | | (3,287,178,348 | ) | | | (3,287,178,348 | ) | | | (1,283,035,370 | ) | | | (1,283,035,370) | |
Net increase (decrease) | | | (2,106,660,389 | ) | | $ | (2,106,660,389 | ) | | | 2,133,322,061 | | | $ | 2,133,322,061 | |
| | | | | | | | | | | | | | | | |
7. Fees and Other Transactions with Affiliates
Management Fees. Under the investment advisory agreement, the Fund pays the Manager a management fee based on the daily net assets of the Fund at an annual rate as shown in the following table:
| | | | |
| Fee Schedule | | | |
Up to $500 million | | | 0.450% | |
Next $500 million | | | 0.425 | |
Next $500 million | | | 0.400 | |
Over $1.5 billion | | | 0.375 | |
The Fund’s effective management fee for the reporting period was 0.42% of average annual net assets before any applicable waivers.
Sub-Adviser Fees. The Manager has retained the Sub-Adviser to provide the day-to-day portfolio management of the Fund. Under the Sub-Advisory Agreement, the Manager pays the Sub-Adviser an annual fee in monthly installments, equal to a percentage of the investment management fee collected by the Manager from the Fund, which shall be calculated after any investment management fee waivers. The fee paid to the Sub-Adviser is paid by the Manager, not by the Fund.
Transfer Agent Fees. OFI Global (the “Transfer Agent”) serves as the transfer and shareholder servicing agent for the Fund. The Fund pays the Transfer Agent a fee based on annual net assets. Fees incurred and average net assets with respect to these services are detailed in the Statement of Operations and Financial Highlights, respectively.
Sub-Transfer Agent Fees. The Transfer Agent has retained Shareholder Services, Inc., a wholly-owned subsidiary of OFI (the “Sub-Transfer Agent”), to provide the day-to-day transfer agent and shareholder servicing of the Fund. Under the Sub-Transfer Agency Agreement, the Transfer Agent pays the Sub-Transfer Agent an annual fee in monthly installments, equal to a percentage of the transfer agent fee collected by the Transfer Agent from the Fund, which shall be calculated after any applicable fee waivers. The fee paid to the Sub-Transfer Agent is paid by the Transfer Agent, not by the Fund.
Trustees’ Compensation. The Fund’s Board of Trustees (“Board”) has adopted a compensation deferral plan for Independent Trustees that enables Trustees to elect to defer receipt of all or a portion of the annual compensation they are entitled to receive from the Fund. For purposes of determining the amount owed to the Trustees under the plan, deferred amounts are treated as though equal dollar amounts had been invested in shares of the Fund or in other Oppenheimer funds selected by the Trustees. The Fund purchases shares of the funds selected for deferral by the Trustees in amounts equal to his or her deemed investment, resulting in a Fund asset equal to the deferred compensation liability. Such assets are included as a component of “Other” within the asset section of the Statement of Assets and Liabilities. Deferral of Trustees’ fees under the plan will not affect the net assets of the Fund and will not materially affect the Fund’s assets, liabilities or net investment income per share. Amounts will be deferred until distributed in accordance with the compensation deferral plan.
Waivers and Reimbursements of Expenses. The Manager has voluntarily undertaken to waive fees and/or reimburse expenses to the extent necessary to assist the Fund in attempting to maintain a positive yield. There is no guarantee that the Fund will maintain a positive yield. During the reporting period, the Manager waived fees and/or reimbursed the Fund $2,220,152.
The Manager has contractually agreed to limit the Fund’s expenses after payments, waivers and/or reimbursements and reduction to custodian expenses, excluding expenses incurred directly or indirectly by the Fund as a result of investments in other investment companies, wholly-owned subsidiaries and pooled investment vehicles; so that those expenses, as percentages of daily net assets, will not exceed the annual rate of 0.50%. As a result of this limitation, the Manager waived $762,661 for the reporting period.
The Manager is permitted to recapture previously waived and/or reimbursed fees in any given fiscal year if the recapture would not: 1) cause the Fund
14 OPPENHEIMER GOVERNMENT MONEY FUND/VA
7. Fees and Other Transactions with Affiliates (Continued)
to generate a negative daily yield, and 2) exceed amounts previously waived and/or reimbursed under this arrangement during the current and prior three fiscal years. The reimbursement to the Manager of such previous waivers and reimbursements would not include any portion of distribution and/or service fees. At period end, the following waived and/or reimbursed amounts are eligible for recapture:
| | | | |
| Expiration Date | | | |
| |
December 31, 2017 | | $ | 1,378,598 | |
December 31, 2018 | | | 3,773,037 | |
December 31, 2019 | | | 2,982,813 | |
The Manager has not recaptured any previously waived and/or reimbursed amounts during the reporting period.
The Manager will waive fees and/or reimburse Fund expenses in an amount equal to the indirect management fees incurred through the Fund’s investment in IGMMF. During the reporting period, the Manager waived fees and/or reimbursed the Fund $44,855 for IGMMF management fees.
Waivers and/or reimbursements may be modified or terminated as set forth according to the terms in the prospectus.
8. Repurchase Agreements
In a repurchase transaction, a Fund buys a security and simultaneously sells it back to an approved institution for delivery on an agreed-upon future date. The resale price exceeds the purchase price by an amount that reflects an agreed-upon interest rate effective for the period during which the repurchase agreement is in effect. Approved institutions include U.S. commercial banks, U.S. branches of foreign banks or broker-dealers that have been designated as primary dealers in government securities. They must meet credit requirements set by the investment adviser from time to time. Repurchase agreements must be fully collateralized. However, if the seller fails to pay the repurchase price on the delivery date, a Fund may incur costs in disposing of the collateral and may experience losses if there is any delay in its ability to do so. If the default on the part of the seller is due to its bankruptcy, a Fund’s ability to liquidate the collateral may be delayed or limited.
The following is a summary by counterparty of the market value of Borrowings and Other Financing Transactions and collateral (received) as of period end:
| | | | | | | | | | | | |
| Counterparty | | Repurchase Agreement
Proceeds to be
Received 1 | | | Collateral (Received) / Pledged1 | | | Net Exposure2 | |
| |
Repurchase Agreements | | | | | | | | | | | | |
Credit Agricole Corp. & Investment Bank | | $ | 5,000,344 | | | | $ (5,100,351) | | | $ | (100,007) | |
Deutsche Bank Securities, Inc. | | | 12,001,009 | | | | (12,241,029) | | | | (240,020) | |
Deutsche Bank Securities, Inc. | | | 5,001,403 | | | | (5,101,431) | | | | (100,028) | |
Deutsche Bank Securities, Inc. | | | 2,001,152 | | | | (2,041,175) | | | | (40,023) | |
Deutsche Bank Securities, Inc. | | | 2,001,152 | | | | (2,041,175) | | | | (40,023) | |
Deutsche Bank Securities, Inc. | | | 1,001,068 | | | | (1,021,089) | | | | (20,021) | |
RBC Dominion Securities, Inc. | | | 12,000,667 | | | | 12,240,680) | | | | (240,013) | |
RBC Dominion Securities, Inc. | | | 2,000,319 | | | | (2,040,325) | | | | (40,006) | |
RBC Dominion Securities, Inc. | | | 2,000,442 | | | | (2,040,451) | | | | (40,009) | |
RBC Dominion Securities, Inc. | | | 10,000,900 | | | | (10,200,918) | | | | (200,018) | |
South Street Securities, Inc. | | | 50,002,778 | | | | (51,747,934) | | | | (1,745,156) | |
TD Securities (USA) LLC | | | 20,002,383 | | | | (20,402,430) | | | | (400,047) | |
| | | | | | | | | | | | |
| | $ | 123,013,617 | | | | | | | | | |
| | | | | | | | | | | | |
| 1. | Includes accrued interest. |
| 2. | Net exposure represents the net receivable/payable that would be due from the counterparty in the event of default. |
9. Pending Litigation
In 2009, several putative class action lawsuits were filed and later consolidated before the U.S. District Court for the District of Colorado in connection with the investment performance of Oppenheimer Rochester California Municipal Fund (the “California Fund”), a fund advised by OppenheimerFunds, Inc. (“OFI”) and distributed by OppenheimerFunds Distributor, Inc. (“OFDI”). The plaintiffs asserted claims against OFI, OFDI and certain present and former trustees and officers of the California Fund under the federal securities laws, alleging, among other things, that the disclosure documents of the California Fund contained misrepresentations and omissions and the investment policies of the California Fund were not followed. An amended complaint and a motion to dismiss were filed, and in 2011, the court issued an order which granted in part and denied in part the defendants’ motion to dismiss. In October 2015, following a successful appeal by defendants and a subsequent hearing, the court granted plaintiffs’ motion for class certification and appointed class representatives and class counsel.
OFI and OFDI believe the suit is without merit; that it is premature to render any opinion as to the likelihood of an outcome unfavorable to them in the suit; and that no estimate can yet be made as to the amount or range of any potential loss. Furthermore, OFI believes that the suit should not impair the ability of OFI or OFDI to perform their respective duties to the Fund and that the outcome of the suit should not have any material effect on the operations of any of the Oppenheimer funds.
15 OPPENHEIMER GOVERNMENT MONEY FUND/VA
REPORT OF INDEPENDENT REGISTERED PUBLIC ACCOUNTING FIRM
The Board of Trustees and Shareholders of Oppenheimer Variable Account Funds:
We have audited the accompanying statement of assets and liabilities of Oppenheimer Government Money Fund/VA, formerly Oppenheimer Money Fund/VA, (a separate series of Oppenheimer Variable Account Funds), including the statement of investments, as of December 31, 2016, and the related statement of operations for the year then ended, the statements of changes in net assets for each of the years in the two-year period then ended, and the financial highlights for each of the years in the five-year period then ended. These financial statements and financial highlights are the responsibility of the Fund’s management. Our responsibility is to express an opinion on these financial statements and financial highlights based on our audits.
We conducted our audits in accordance with the standards of the Public Company Accounting Oversight Board (United States). Those standards require that we plan and perform the audit to obtain reasonable assurance about whether the financial statements and financial highlights are free of material misstatement. An audit includes examining, on a test basis, evidence supporting the amounts and disclosures in the financial statements. Our procedures included confirmation of securities owned as of December 31, 2016, by correspondence with the custodian and brokers. An audit also includes assessing the accounting principles used and significant estimates made by management, as well as evaluating the overall financial statement presentation. We believe that our audits provide a reasonable basis for our opinion.
In our opinion, the financial statements and financial highlights referred to above present fairly, in all material respects, the financial position of Oppenheimer Government Money Fund/VA as of December 31, 2016, the results of its operations for the year then ended, the changes in its net assets for each of the years in the two-year period then ended, and the financial highlights for each of the years in the five-year period then ended, in conformity with U.S. generally accepted accounting principles.
KPMG LLP
Denver, Colorado
February 15, 2017
16 OPPENHEIMER GOVERNMENT MONEY FUND/VA
FEDERAL INCOME TAX INFORMATION Unaudited
In early 2017, if applicable, shareholders of record received information regarding all dividends and distributions paid to them by the Fund during calendar year 2016.
The foregoing information is presented to assist shareholders in reporting distributions received from the Fund to the Internal Revenue Service. Because of the complexity of the federal regulations which may affect your individual tax return and the many variations in state and local tax regulations, we recommend that you consult your tax advisor for specific guidance.
17 OPPENHEIMER GOVERNMENT MONEY FUND/VA
BOARD APPROVAL OF THE FUND’S INVESTMENT ADVISORY AND SUB-ADVISORY AGREEMENTS Unaudited
The Fund has entered into an investment advisory agreement with OFI Global Asset Management, Inc. (“OFI Global” or the “Adviser”), a wholly-owned subsidiary of OppenheimerFunds, Inc. (“OFI” or the “Sub-Adviser”) (“OFI Global” and “OFI” together the “Managers”) and OFI Global has entered into a sub-advisory agreement with OFI whereby OFI provides investment sub-advisory services to the Fund (collectively, the “Agreements”). Each year, the Board of Trustees (the “Board”), including a majority of the independent Trustees, is required to determine whether to approve the terms of the Agreements and the renewal thereof. The Investment Company Act of 1940, as amended, requires that the Board request and evaluate, and that the Managers provide, such information as may be reasonably necessary to evaluate the terms of the Agreements. The Board employs an independent consultant to prepare a report that provides information, including comparative information that the Board requests for that purpose. In addition to in-person meetings focused on this evaluation, the Board receives information throughout the year regarding Fund services, fees, expenses and performance.
The Managers and the independent consultant provided information to the Board on the following factors: (i) the nature, quality and extent of the Managers’ services, (ii) the comparative investment performance of the Fund and the Managers, (iii) the fees and expenses of the Fund, including comparative fee and expense information, (iv) the profitability of the Managers and their affiliates, including an analysis of the cost of providing services, (v) whether economies of scale are realized as the Fund grows and whether fee levels reflect these economies of scale for Fund investors and (vi) other benefits to the Managers from their relationship with the Fund. The Board was aware that there are alternatives to retaining the Managers.
Outlined below is a summary of the principal information considered by the Board as well as the Board’s conclusions.
Nature, Quality and Extent of Services. The Board considered information about the nature, quality and extent of the services provided to the Fund and information regarding the Managers’ key personnel who provide such services. The Managers’ duties include providing the Fund with the services of the portfolio managers and the Sub-Adviser’s investment team, who provide research, analysis and other advisory services in regard to the Fund’s investments; and securities trading services. OFI Global is responsible for oversight of third-party service providers; monitoring compliance with applicable Fund policies and procedures and adherence to the Fund’s investment restrictions; risk management; and oversight of the Sub-Adviser. OFI Global is also responsible for providing certain administrative services to the Fund. Those services include providing and supervising all administrative and clerical personnel who are necessary in order to provide effective corporate administration for the Fund; compiling and maintaining records with respect to the Fund’s operations; preparing and filing reports required by the U.S. Securities and Exchange Commission; preparing periodic reports regarding the operations of the Fund for its shareholders; preparing proxy materials for shareholder meetings; and preparing the registration statements required by federal and state securities laws for the sale of the Fund’s shares. OFI Global also provides the Fund with office space, facilities and equipment.
The Board also considered the quality of the services provided and the quality of the Managers’ resources that are available to the Fund. The Board took account of the fact that the Sub-Adviser has over fifty years of experience as an investment adviser and that its assets under management rank it among the top mutual fund managers in the United States. The Board evaluated the Managers’ advisory, administrative, accounting, legal, compliance and risk management services, and information the Board has received regarding the experience and professional qualifications of the Managers’ key personnel and the size and functions of its staff. In its evaluation of the quality of the portfolio management services provided, the Board considered the experience of Christopher Proctor and Adam Wilde, the portfolio managers for the Fund, and the Sub-Adviser’s investment team and analysts. The Board members also considered the totality of their experiences with the Managers as directors or trustees of the Fund and other funds advised by the Managers. The Board considered information regarding the quality of services provided by affiliates of the Managers, which the Board members have become knowledgeable about through their experiences with the Managers and in connection with the renewal of the Fund’s service agreements. The Board concluded, in light of the Managers’ experience, reputation, personnel, operations and resources that the Fund benefits from the services provided under the Agreements.
Investment Performance of the Managers and the Fund. Throughout the year, the Managers provided information on the investment performance of the Fund, the Adviser and the Sub-Adviser, including comparative performance information. The Board also reviewed information, prepared by the Managers and by the independent consultant, comparing the Fund’s historical performance to relevant market indices and to the performance of other money market tax-free funds underlying variable insurance products. The Board considered that the Fund outperformed its performance category median during the three- and ten-year periods and performed in line with its performance category median during the one- and five-year periods.
Fees and Expenses of the Fund. The Board reviewed the fees paid to the Adviser and the other expenses borne by the Fund. The Board noted that the Adviser, not the Fund, pays the Sub-Adviser’s fee under the sub-advisory agreement. The independent consultant provided comparative data in regard to the fees and expenses of the Fund and other money market tax-free funds underlying variable insurance products. In reviewing the fees and expenses charged to the VA funds, the Board considered the Adviser’s assertion that, because there is much greater disparity in the fees and services that may be provided by a manager to a VA fund as opposed to a retail fund, when comparing the expenses of the various VA funds to those of retail funds, it is most appropriate to focus on total expenses (rather than on the management fees). Accordingly, while the Board reviewed and considered all expenses, it focused on total expenses. The Board considered that the Fund’s total expenses, net of waivers, were equal to its peer group median and lower than its category median. The Board also considered that the Fund’s contractual management fee was lower than both its peer group median and its category median. The Board noted that the Adviser has contractually agreed to limit the Fund’s total annual operating expenses so that those expenses, as a percentage of daily net assets, will not exceed the annual rate of 0.50%. This contractual expense limitation may not be amended or withdrawn until one year after the date of the Fund’s prospectus, unless approved by the Board. The Board also considered that the Adviser voluntarily agreed to waive fees to assist the Fund in attempting to maintain a positive yield, although there is no guarantee that the Fund will maintain a positive yield. This voluntary fee waiver may be amended or withdrawn at any time without prior notice to shareholders.
Economies of Scale and Profits Realized by the Managers. The Board considered information regarding the Managers’ costs in serving as the Fund’s investment adviser and sub-adviser, including the costs associated with the personnel and systems necessary to manage the Fund, and information regarding the Managers’ profitability from their relationship with the Fund. The Board also considered that the Managers must be able to pay and retain experienced professional personnel at competitive rates to provide quality services to the Fund. The Board reviewed whether the Managers may realize economies of scale in managing and supporting the Fund. The Board noted that the Fund currently has management fee
18 OPPENHEIMER GOVERNMENT MONEY FUND/VA
BOARD APPROVAL OF THE FUND’S INVESTMENT ADVISORY AND SUB-ADVISORY AGREEMENTS Unaudited / Continued
breakpoints, which are intended to share with Fund shareholders economies of scale that may exist as the Fund’s assets grow.
Other Benefits to the Managers. In addition to considering the profits realized by the Managers, the Board considered information that was provided regarding the direct and indirect benefits the Managers receive as a result of their relationship with the Fund, including compensation paid to the Managers’ affiliates.
Conclusions. These factors were also considered by the independent Trustees meeting separately from the full Board, assisted by experienced counsel to the Fund and to the independent Trustees. Fund counsel and the independent Trustees’ counsel are independent of the Managers within the meaning and intent of the Securities and Exchange Commission Rules.
Based on its review of the information it received and its evaluations described above, the Board, including a majority of the independent Trustees, decided to continue the Agreements through August 31, 2017. In arriving at its decision, the Board did not identify any factor or factors as being more important than others, but considered all of the above information, and considered the terms and conditions of the Agreements, including the management fees, in light of all the surrounding circumstances.
.
19 OPPENHEIMER GOVERNMENT MONEY FUND/VA
PORTFOLIO PROXY VOTING POLICIES AND GUIDELINES; UPDATES TO STATEMENTS OF INVESTMENTS Unaudited
The Fund has adopted Portfolio Proxy Voting Policies and Guidelines under which the Fund votes proxies relating to securities (“portfolio proxies”) held by the Fund. A description of the Fund’s Portfolio Proxy Voting Policies and Guidelines is available (i) without charge, upon request, by calling the Fund toll-free at 1.800.CALL OPP (225.5677), (ii) on the Fund’s website at www.oppenheimerfunds.com, and (iii) on the SEC’s website at www.sec.gov. In addition, the Fund is required to file Form N-PX, with its complete proxy voting record for the 12 months ended June 30th, no later than August 31st of each year. The Fund’s voting record is available (i) without charge, upon request, by calling the Fund toll-free at 1.800.CALL OPP (225.5677), and (ii) in the Form N-PX filing on the SEC’s website at www.sec.gov.
The Fund files its complete schedule of portfolio holdings with the SEC for the first quarter and the third quarter of each fiscal year on Form N-Q. The Fund’s Form N-Q filings are available on the SEC’s website at www.sec.gov. Those forms may be reviewed and copied at the SEC’s Public Reference Room in Washington, D.C. Information on the operation of the Public Reference Room may be obtained by calling 1-800-SEC-0330.
20 OPPENHEIMER GOVERNMENT MONEY FUND/VA
DISTRIBUTION SOURCES Unaudited
For any distribution that took place over the last six months of the Fund’s reporting period, the table below details, on a per-share basis, the percentage of the Fund’s total distribution payment amount that was derived from the following sources: net income, net profit from the sale of securities, and other capital sources. This information is based upon income and capital gains using generally accepted accounting principles as of the date of each distribution. Because the Fund is actively managed, the relative amount of the Fund’s total distributions derived from various sources over the calendar year may change. Please note that this information should not be used for tax reporting purposes as the tax character of distributable income may differ from the amounts used for this notification. You will receive IRS tax forms in the first quarter of each calendar year detailing the actual amount of the taxable and non-taxable portion of distributions paid to you during the tax year.
For the most current information, please go to oppenheimerfunds.com. Select your Fund, then the ‘Detailed’ tab; where ‘Dividends’ are shown, the Fund’s latest pay date will be followed by the sources of any distribution, updated daily.
| | | | | | | | | | | | | | | | |
| Fund Name | | Pay Date | | | Net Income | | | Net Profit from Sale | | | Other
Capital
Sources | |
Oppenheimer Government Money Fund/VA | | | 7/15/16 | | | | 95.9% | | | | 0.0% | | | | 4.1% | |
Oppenheimer Government Money Fund/VA | | | 8/19/16 | | | | 95.9% | | | | 0.0% | | | | 4.1% | |
Oppenheimer Government Money Fund/VA | | | 9/16/16 | | | | 95.9% | | | | 0.0% | | | | 4.1% | |
Oppenheimer Government Money Fund/VA | | | 10/21/16 | | | | 95.9% | | | | 0.0% | | | | 4.1% | |
Oppenheimer Government Money Fund/VA | | | 11/18/16 | | | | 95.9% | | | | 0.0% | | | | 4.1% | |
Oppenheimer Government Money Fund/VA | | | 12/16/16 | �� | | | 97.2% | | | | 0.0% | | | | 2.8% | |
21 OPPENHEIMER GOVERNMENT MONEY FUND/VA
TRUSTEES AND OFFICERS Unaudited
| | |
| Name, Position(s) Held with the Fund, Length of Service, Age | | Principal Occupation(s) During the Past 5 Years; Other Trusteeships/Directorships Held; Number of Portfolios in the Fund Complex Currently Overseen |
| |
| INDEPENDENT TRUSTEES | | The address of each Trustee in the chart below is 6803 S. Tucson Way, Centennial, Colorado 80112-3924. Each Trustee serves for an indefinite term, or until his or her resignation, retirement, death or removal. |
| |
Robert J. Malone, Chairman of the Board of Trustees (since 2016), Trustee (since 2002) Year of Birth: 1944 | | Chairman - Colorado Market of MidFirst Bank (since January 2015); Chairman of the Board (2012-2016) and Director (August 2005-March 2016) of Jones International University (educational organization); Trustee of the Gallagher Family Foundation (non-profit organization) (2000-2015); Chairman, Chief Executive Officer and Director of Steele Street Bank Trust (commercial banking) (August 2003-January 2015); Board of Directors of Opera Colorado Foundation (non-profit organization) (2008-2012); Director of Colorado UpLIFT (charitable organization) (1986-2010); Director of Jones Knowledge, Inc. (2006-2010); Former Chairman of U.S. Bank-Colorado (subsidiary of U.S. Bancorp and formerly Colorado National Bank) (July 1996-April 1999); Director of Commercial Assets, Inc. (real estate investment trust) (1993-2000); Director of U.S. Exploration, Inc. (oil and gas exploration) (1997-February 2004); Chairman of the Board (1991-1994) and Trustee (1985-1994) of Regis University; and Chairman of the Board (1990-1991) and Trustee (1984-1999) of Young Presidents Organization. Oversees 47 portfolios in the OppenheimerFunds complex. Mr. Malone has served on the Boards of certain Oppenheimer funds since 2002, during which time he has become familiar with the Fund’s (and other Oppenheimer funds’) financial, accounting, regulatory and investment matters and has contributed to the Boards’ deliberations. |
| |
Jon S. Fossel, Trustee (since 1990) Year of Birth: 1942 | | Chairman of the Board of Jack Creek Preserve Foundation (non-profit organization) (since March 2005); Director of Jack Creek Preserve Foundation (non-profit organization) (March 2005-December 2014); Chairman of the Board (2006-December 2011) and Director (June 2002-December 2011) of UNUMProvident (insurance company); Director of Northwestern Energy Corp. (public utility corporation) (November 2004-December 2009); Director of P.R. Pharmaceuticals (October 1999-October 2003); Director of Rocky Mountain Elk Foundation (non-profit organization) (February 1998-February 2003 and February 2005-February 2007); Chairman and Director (until October 1996) and President and Chief Executive Officer (until October 1995) of OppenheimerFunds, Inc.; President, Chief Executive Officer and Director of the following: Oppenheimer Acquisition Corp. (“OAC”) (parent holding company of OppenheimerFunds, Inc.), Shareholders Services, Inc. and Shareholder Financial Services, Inc. (until October 1995). Oversees 47 portfolios in the OppenheimerFunds complex. Mr. Fossel has served on the Boards of certain Oppenheimer funds since 1990, during which time he has become familiar with the Fund’s (and other Oppenheimer funds’) financial, accounting, regulatory and investment matters and has contributed to the Boards’ deliberations. |
| |
Richard F. Grabish, Trustee (since 2012) Year of Birth: 1948 | | Formerly Senior Vice President and Assistant Director of Sales and Marketing (March 1997-December 2007), Director (March 1987-December 2007) and Manager of Private Client Services (June 1985-June 2005) of A.G. Edwards & Sons, Inc. (broker/dealer and investment firm); Chairman and Chief Executive Officer of A.G. Edwards Trust Company, FSB (March 2001-December 2007); President and Vice Chairman of A.G. Edwards Trust Company, FSB (investment adviser) (April 1987-March 2001); President of A.G. Edwards Trust Company, FSB (investment adviser) (June 2005-December 2007). Oversees 47 portfolios in the OppenheimerFunds complex. Mr. Grabish has served on the Boards of certain Oppenheimer funds since 2001, during which time he has become familiar with the Fund’s (and other Oppenheimer funds’) financial, accounting, regulatory and investment matters and has contributed to the Boards’ deliberations. |
| |
Beverly L. Hamilton, Trustee (since 2002) Year of Birth: 1946 | | Trustee of Monterey Institute for International Studies (educational organization) (2000-2014); Board Member of Middlebury College (educational organization) (December 2005-June 2011); Chairman (2010-2016) of American Funds’ Emerging Markets Growth Fund, Inc. (mutual fund); Director of The California Endowment (philanthropic organization) (April 2002-April 2008); Director (February 2002-2005) and Chairman of Trustees (2006-2007) of the Community Hospital of Monterey Peninsula; Director (October 1991-2005) and Vice Chairman (2006-2009) of American Funds’ Emerging Markets Growth Fund, Inc. (mutual fund); President of ARCO Investment Management Company (February 1991-April 2000); Member of the investment committees of The Rockefeller Foundation (2001-2006) and The University of Michigan (since 2000); Advisor at Credit Suisse First Boston’s Sprout venture capital unit (venture capital fund) (1994-January 2005); Trustee of MassMutual Institutional Funds (investment company) (1996-June 2004); Trustee of MML Series Investment Fund (investment company) (April 1989-June 2004); Member of the investment committee of Hartford Hospital (2000-2003); and Advisor to Unilever (Holland) pension fund (2000-2003). Oversees 47 portfolios in the OppenheimerFunds complex. Ms. Hamilton has served on the Boards of certain Oppenheimer funds since 2002, during which time she has become familiar with the Fund’s (and other Oppenheimer funds’) financial, accounting, regulatory and investment matters and has contributed to the Boards’ deliberations. |
| |
Victoria J. Herget, Trustee (since 2012) Year of Birth: 1951 | | Board Chair (2008-2015) and Director (2004-Present), United Educators (insurance company); Trustee (since 2000) and Chair (since 2010), Newberry Library (independent research library); Trustee, Mather LifeWays (senior living organization) (since 2001); Independent Director of the First American Funds (mutual fund family) (2003-2011); former Managing Director (1993-2001), Principal (1985-1993), Vice President (1978-1985) and Assistant Vice President (1973-1978) of Zurich Scudder Investments (investment adviser) (and its predecessor firms); Trustee (1992-2007), Chair of the Board of Trustees (1999-2007), Investment Committee Chair (1994-1999) and Investment Committee member (2007-2010) of Wellesley College; Trustee, BoardSource (non-profit organization) (2006-2009) and Chicago City Day School (K-8 School) (1994-2005). Oversees 47 portfolios in the OppenheimerFunds complex. Ms. Herget has served on the Boards of certain Oppenheimer funds since 2012, during which time she has become familiar with the Fund’s (and other Oppenheimer funds’) financial, accounting, regulatory and investment matters and has contributed to the Boards’ deliberations. |
22 OPPENHEIMER GOVERNMENT MONEY FUND/VA
| | |
F. William Marshall, Jr., Trustee (since 2000) Year of Birth: 1942 | | Trustee Emeritus of Worcester Polytech Institute (WPI) (private university) (since 2009); Trustee of MassMutual Select Funds (formerly MassMutual Institutional Funds) (investment company) (1996-2015), MML Series Investment Fund (investment company) (1996-2015) and Mass Mutual Premier Funds (investment company) (January 2012-December 2015); President and Treasurer of the SIS Fund (private charitable fund) (January 1999-March 2011); Former Trustee of WPI (1985-2008); Former Chairman of the Board (2004-2006) and Former Chairman of the Investment Committee of WPI (1994-2008); Chairman of SIS Family Bank, F.S.B. (formerly SIS Bank) (commercial bank) (January 1999-July 1999); Executive Vice President of Peoples Heritage Financial Group, Inc. (commercial bank) (January 1999-July 1999); and Former President and Chief Executive Officer of SIS Bancorp. (1993-1999). Oversees 47 portfolios in the OppenheimerFunds complex. Mr. Marshall has served on the Boards of certain Oppenheimer funds since 2000, during which time he has become familiar with the Fund’s (and other Oppenheimer funds’) financial, accounting, regulatory and investment matters and has contributed to the Boards’ deliberations. |
| |
Karen L. Stuckey, Trustee (since 2012) Year of Birth: 1953 | | Member (since May 2015) of Desert Mountain Community Foundation Advisory Board (non-profit organization); Partner (1990-2012) of PricewaterhouseCoopers LLP (professional services firm) (held various positions 1975-1990); Trustee (1992-2006), member of Executive, Nominating and Audit Committees and Chair of Finance Committee (1992-2006), and Emeritus Trustee (since 2006) of Lehigh University; and member, Women’s Investment Management Forum (professional organization) since inception. Oversees 47 portfolios in the OppenheimerFunds complex. Ms. Stuckey has served on the Boards of certain Oppenheimer funds since 2012, during which time she has become familiar with the Fund’s (and other Oppenheimer funds’) financial, accounting, regulatory and investment matters and has contributed to the Boards’ deliberations. |
| |
James D. Vaughn, Trustee (since 2012) Year of Birth: 1945 | | Retired; former managing partner (1994-2001) of Denver office of Deloitte & Touche LLP, (held various positions 1969-1993); Trustee and Chairman of the Audit Committee of Schroder Funds (2003-2012); Board member and Chairman of Audit Committee of AMG National Trust Bank (since 2005); Trustee and Investment Committee member, University of South Dakota Foundation (since 1996); Board member, Audit Committee Member and past Board Chair, Junior Achievement (since 1993); former Board member, Mile High United Way, Boys and Girls Clubs, Boy Scouts, Colorado Business Committee for the Arts, Economic Club of Colorado and Metro Denver Network. Oversees 47 portfolios in the OppenheimerFunds complex. Mr. Vaughn has served on the Boards of certain Oppenheimer funds since 2012, during which time he has become familiar with the Fund’s (and other Oppenheimer funds’) financial, accounting, regulatory and investment matters and has contributed to the Boards’ deliberations. |
| |
| INTERESTED TRUSTEE AND OFFICER | | Mr. Steinmetz is an “Interested Trustee” because he is affiliated with the Manager and the Sub-Adviser by virtue of his positions as Chairman and director of the Sub-Adviser and officer and director of the Manager. Both as a Trustee and as an officer, Mr. Steinmetz serves for an indefinite term, or until his resignation, retirement, death or removal. Mr. Steinmetz’s address is 225 Liberty Street, New York, New York 10281-1008. |
| |
Arthur P. Steinmetz, Trustee (Since 2015), President and Principal Executive Officer (since 2014) Year of Birth: 1958 | | Chairman of OppenheimerFunds, Inc. (since January 2015); CEO and Chairman of OFI Global Asset Management, Inc. (since July 2014), President of OFI Global Asset Management, Inc. (since May 2013), a Director of OFI Global Asset Management, Inc. (since January 2013), Director of OppenheimerFunds, Inc. (since July 2014), President, Management Director and CEO of Oppenheimer Acquisition Corp. (OppenheimerFunds, Inc.’s parent holding company) (since July 2014), and President and Director of OFI SteelPath, Inc. (since January 2013). Chief Investment Officer of the OppenheimerFunds advisory entities from (January 2013-December 2013); Executive Vice President of OFI Global Asset Management, Inc. (January 2013-May 2013); Chief Investment Officer of OppenheimerFunds, Inc. (October 2010-December 2012); Chief Investment Officer, Fixed-Income, of OppenheimerFunds, Inc. (April 2009-October 2010); Executive Vice President of OppenheimerFunds, Inc. (October 2009-December 2012); Director of Fixed Income of OppenheimerFunds, Inc. (January 2009-April 2009); and a Senior Vice President of OppenheimerFunds, Inc. (March 1993-September 2009). An officer of 103 portfolios in the OppenheimerFunds complex. |
| |
| OTHER OFFICERS OF THE FUND | | The addresses of the Officers in the chart below are as follows: for Mss. Lo Bessette, Foxson and Picciotto, 225 Liberty Street, New York, New York 10281-1008, for Messrs. Proctor, Wilde and Petersen, 6803 S. Tucson Way, Centennial, Colorado 80112-3924. Each Officer serves for an indefinite term or until his or her resignation, retirement, death or removal. |
| |
Christopher Proctor, Vice President (since 2010) Year of Birth: 1968 | | Head of the Cash Strategies Team (since July 2013); Senior Vice President of the Sub-Adviser (since July 2013) and Senior Portfolio Manager of the Sub-Adviser (since January 2010). Vice President of the Sub-Adviser (August 2008-July 2013). Vice President at Calamos Asset Management (January 2007-March 2008) and Scudder-Kemper Investments (1999-2002). Managing Director and Co-Founder of Elmhurst Capital Management (June 2004-January 2007); Senior Manager of Research for Etrade Global Asset Management (2002-2004). A portfolio manager and officer of other portfolios in the OppenheimerFunds complex. |
| |
Adam S. Wilde, Vice President (since 2013) Year of Birth: 1978 | | Vice President of the Sub-Adviser (since May 2011) and a Portfolio Manager of the Sub-Adviser (since July 2013). He served as the head of credit research for the cash strategies team of the Sub-Adviser (from 2011 to 2013), and as an Assistant Vice President and senior research analyst of the Sub-Adviser (from 2008 to 2011). Mr. Wilde served as an intermediate research analyst of the Sub-Adviser (from 2007 to 2008) and served in other analyst roles of the Sub-Adviser (since 2002). Mr. Wilde joined the Sub-Adviser in 2001. A portfolio manager and officer of other portfolios in the OppenheimerFunds complex. |
| |
Cynthia Lo Bessette, Secretary and Chief Legal Officer (since 2016) Year of Birth: 1969 | | Executive Vice President, General Counsel and Secretary of the Manager (since February 2016); Chief Legal Officer of the Sub-Adviser and the Distributor (since February 2016); Vice President, General Counsel and Secretary of Oppenheimer Acquisition Corp. (since February 2016); General Counsel of OFI SteelPath, Inc., VTL Associates, LLC and Index Management Solutions, LLC (since February 2016); Chief Legal Officer of OFI Global Institutional, Inc., HarbourView Asset Management Corporation, OFI Global Trust Company, Oppenheimer Real Asset Management, Inc., OFI Private Investments Inc., Shareholder Services, Inc. and Trinity Investment Management Corporation (since February 2016); Senior Vice President and Deputy General Counsel (March 2015-February 2016) and Executive Vice President, Vice President, Corporate Counsel (February 2012-March 2015) and Deputy Chief Legal Officer (April 2013-March 2015) of Jennison Associates LLC; Assistant General Counsel (April 2008-September 2009) and Deputy General Counsel (October 2009-February 2012) of Lord Abbett & Co. LLC. An officer of 103 portfolios in the OppenheimerFunds complex. |
23 OPPENHEIMER GOVERNMENT MONEY FUND/VA
TRUSTEES AND OFFICERS Unaudited / Continued
| | |
Jennifer Foxson, Vice President and Chief Business Officer (since 2014) Year of Birth: 1969 | | Senior Vice President of OppenheimerFunds Distributor, Inc. (since June 2014); Vice President of OppenheimerFunds Distributor, Inc. (April 2006-June 2014); Vice President of the Sub-Adviser (January 1998-March 2006); Assistant Vice President of the Sub-Adviser (October 1991-December 1998). An officer of 103 portfolios in the OppenheimerFunds complex. |
| |
Mary Ann Picciotto, Chief Compliance Officer and Chief Anti-Money Laundering Officer (since 2014) Year of Birth: 1973 | | Senior Vice President and Chief Compliance Officer of the Manager (since March 2014); Chief Compliance Officer of the Sub-Adviser, OFI SteelPath, Inc., OFI Global Trust Company, OFI Global Institutional, Inc., Oppenheimer Real Asset Management, Inc., OFI Private Investments, Inc., Harborview Asset Management Corporation, Trinity Investment Management Corporation, and Shareholder Services, Inc. (since March 2014); Managing Director of Morgan Stanley Investment Management Inc. and certain of its various affiliated entities; Chief Compliance Officer of various Morgan Stanley Funds (May 2010-January 2014); Chief Compliance Officer of Morgan Stanley Investment Management Inc. (April 2007-January 2014). An officer of 103 portfolios in the OppenheimerFunds complex. |
| |
Brian S. Petersen, Treasurer and Principal Financial & Accounting Officer (since 2016) Year of Birth: 1970 | | Vice President of the Manager (since January 2013); Vice President of the Sub-Adviser (February 2007-December 2012); Assistant Vice President of the Sub-Adviser (August 2002-2007). An officer of 103 portfolios in the OppenheimerFunds complex. |
The Fund’s Statement of Additional Information contains additional information about the Fund’s Trustees and Officers and is available without charge, upon request, by calling 1.800.988.8287.
24 OPPENHEIMER GOVERNMENT MONEY FUND/VA
THIS PAGE INTENTIONALLY LEFT BLANK.
25 OPPENHEIMER GOVERNMENT MONEY FUND/VA
THIS PAGE INTENTIONALLY LEFT BLANK.
26 OPPENHEIMER GOVERNMENT MONEY FUND/VA
THIS PAGE INTENTIONALLY LEFT BLANK.
27 OPPENHEIMER GOVERNMENT MONEY FUND/VA
OPPENHEIMER GOVERNMENT MONEY FUND/VA
A Series of Oppenheimer Variable Account Funds
| | |
| |
| Manager | | OFI Global Asset Management, Inc. |
| |
| Sub-Adviser | | OppenheimerFunds, Inc. |
| |
| Distributor | | OppenheimerFunds Distributor, Inc. |
| |
| Transfer and | | OFI Global Asset Management, Inc. |
| Shareholder | | |
| Servicing Agent | | |
| Sub-Transfer Agent | | Shareholder Services, Inc. |
| | DBA OppenheimerFunds Services |
| |
| Independent | | KPMG LLP |
| Registered | | |
| Public | | |
| Accounting | | |
| Firm | | |
| |
| Legal Counsel | | Ropes & Gray LLP |
| |
| | Before investing in any of the Oppenheimer funds, investors should carefully consider a fund’s investment objectives, risks, charges and expenses. Fund prospectuses and summary prospectuses contain this and other information about the funds, and may be obtained by asking your financial advisor, or calling us at 1.800.988.8287. Read prospectuses and summary prospectuses carefully before investing. |
| |
| | © 2017 OppenheimerFunds, Inc. All rights reserved. Oppenheimer funds are distributed by OppenheimerFunds Distributor, Inc. |

| | |
| | 
|
| | December 31, 2016 |

|
| | ANNUAL REPORT Listing of Top Holdings Fund Performance Discussion Financial Statements |
PORTFOLIO MANAGERS: Michael A. Mata, Krishna Memani and Hemant Baijal1
AVERAGE ANNUAL TOTAL RETURNS FOR THE PERIODS ENDED 12/31/162
| | | | | | | | | | | | | | |
| | | Inception Date | | 1-Year | | | 5-Year | | | 10-Year | |
Non-Service Shares | | 5/3/93 | | | 6.53 | % | | | 3.96 | % | | | 4.64 | % |
Service Shares | | 3/19/01 | | | 6.27 | | | | 3.67 | | | | 4.37 | |
Bloomberg Barclays U.S. Aggregate Bond Index | | | | | 2.65 | | | | 2.23 | | | | 4.34 | |
Citigroup World Government Bond Index | | | | | 1.60 | | | | -0.99 | | | | 2.99 | |
Citigroup Non-U.S. World Government Bond Index | | | | | 1.81 | | | | -1.94 | | | | 2.54 | |
J.P. Morgan Domestic High Yield Index | | | | | 18.91 | | | | 7.59 | | | | 7.74 | |
Reference Index | | | | | 7.07 | | | | 2.19 | | | | 4.75 | |
Performance data quoted represents past performance, which does not guarantee future results. The investment return and principal value of an investment in the Fund will fluctuate so that an investor’s shares, when redeemed, may be worth more or less than their original cost. Current performance and expense ratios may be lower or higher than the data quoted. For performance data current to the most recent month end, call us at 1.800.988.8287. The Fund’s total returns should not be expected to be the same as the returns of other funds, whether or not both funds have the same portfolio managers and/or similar names. The Fund’s total returns include changes in share price and reinvested distributions but do not include the charges associated with the separate account products that offer this Fund. Such performance would have been lower if such charges were taken into account.
1. As referenced in the Prospectus supplement dated January 3, 2017, effective April 28, 2017, the Portfolio Managers will be: Michael Mata, Krishna Memani, Ruta Ziverte, and Chris Kelly, CFA.
2. As referenced in the Prospectus supplement dated January 3, 2017, effective April 28, 2017, all references to the “Reference Index,” the “Citigroup Non-U.S. World Government Bond Index,” the “JP Morgan Domestic High Yield Index,” and the “Citigroup World Government Bond Index” are deleted from the Prospectus entirely.
2 OPPENHEIMER GLOBAL STRATEGIC INCOME FUND/VA
TOP HOLDINGS AND ALLOCATIONS
| | |
PORTFOLIO ALLOCATION | | |
|
| Non-Convertible Corporate Bonds and Notes | | 45.0% |
|
Investment Companies | | |
Oppenheimer Institutional Government Money Market Fund | | 2.2 |
Oppenheimer Master Event-Linked Bond Fund, LLC | | 2.3 |
Oppenheimer Master Loan Fund, LLC | | 11.9 |
Oppenheimer Ultra-Short Duration Fund | | 1.2 |
|
Mortgage-Backed Obligations | | |
Government Agency | | 6.4 |
Non-Agency | | 9.3 |
|
Short-Term Notes | | 6.9 |
|
Foreign Government Obligations | | 6.8 |
|
Asset-Backed Securities | | 5.3 |
|
U.S. Government Obligations | | 1.8 |
|
Structured Securities | | 0.5 |
|
Common Stocks | | 0.2 |
|
Over-the-Counter Options Purchased | | 0.1 |
|
Corporate Loans | | 0.1 |
|
| Over-the-Counter Interest Rate Swaptions Purchased | | —* |
|
Rights, Warrants and Certificates | | —* |
| * | Represents a value of less than 0.05%. |
Portfolio holdings and allocations are subject to change. Percentages are as of December 31, 2016, and are based on total market value of investments. For more current Fund holdings, please visit oppenheimerfunds.com.
| | | | | |
| CREDIT RATING BREAKDOWN | | NRSRO ONLY TOTAL |
AAA | | | | 20.5% | |
AA | | | | 0.9 | |
A | | | | 3.7 | |
BBB | | | | 16.0 | |
BB | | | | 19.6 | |
B | | | | 16.7 | |
CCC | | | | 3.6 | |
CC | | | | 0.0 | |
C | | | | 0.1 | |
D | | | | 0.3 | |
Unrated | | | | 18.6 | |
Total | | | | 100.0% | |
The percentages above are based on the market value of the Fund’s securities as of December 31, 2016, and are subject to change. Except for securities labeled “Unrated,” and except for certain securities issued or guaranteed by a foreign sovereign, all securities have been rated by at least one Nationally Recognized Statistical Rating Organization (“NRSRO”), such as Standard & Poor’s (“S&P”). For securities rated only by an NRSRO other than S&P, OppenheimerFunds, Inc. (the “Sub-Adviser”) converts that rating to the equivalent S&P rating. If two or more NRSROs have assigned a rating to a security, the highest S&P equivalent rating is used. Unrated securities issued or guaranteed by a foreign sovereign are assigned a credit rating equal to the highest NRSRO rating assigned to that foreign sovereign. For securities not rated by an NRSRO, the Sub-Adviser uses its own credit analysis to assign ratings in categories similar to those of S&P. The use of similar categories is not an indication that the Sub-Adviser’s credit analysis process is consistent or comparable with any NRSRO’s process were that NRSRO to rate the same security. Fund assets invested in Oppenheimer Institutional Government Money Market Fund are assigned that Fund’s S&P rating, which is currently AAA. For the purposes of this table, “investment-grade” securities are securities rated within the NRSROs’ four highest rating categories (AAA, AA, A and BBB). Unrated securities do not necessarily indicate low credit quality, and may or may not be the equivalent of investment-grade. Please consult the Fund’s prospectus and Statement of Additional Information for further information.
3 OPPENHEIMER GLOBAL STRATEGIC INCOME FUND/VA
Fund Performance Discussion
The Fund’s Non-Service shares produced a return of 6.53% during the reporting period, versus the 2.65% return provided by the Bloomberg Barclays U.S. Aggregate Bond Index.
MARKET OVERVIEW
Markets were volatile this reporting period. One of the most significant events during the period was the United Kingdom’s (“UK”) vote to leave the European Union (“EU”), a move commonly referred to as “Brexit.” Although the UK still has not initiated the formal process to leave the EU, the vote initially raised the level of uncertainty in global markets. Within days of the result, there were sharp moves across all markets. Perhaps the most significant movers were government bonds, where yields fell sharply, despite already being well below historical levels.
Markets staged an impressive rebound in July, as investor fears receded, particularly over the immediate implications of June’s Brexit vote. We saw central bank action remain supportive with the Bank of England and the European Central Bank (“ECB”) making forceful statements outlining intentions to backstop market sentiment. Central bank activity was not just apparent after the Brexit vote, but played a large role throughout the period.
In June, the ECB started to purchase European corporate bonds, marking another ‘Rubicon crossed’ in the central bank’s unconventional monetary policy moves. The purchasing program started more aggressively than had been expected, buying at the upper end of the 5-10 billion euro per month range.
Two key policy meetings in the third quarter were closely watched, one with the U.S. Federal Reserve (“Fed”) and the other from the Bank of Japan (“BoJ”). Throughout most of the year, the question of when the Fed would raise interest rates remained. It finally did in the closing month of the reporting period. Improved economic data and outlook led the Fed to hike its policy rates by 0.25% in December, meeting market expectations. The Fed’s policy making Federal Open Market Committee noted that they will continue to be cautious and will hike rates gradually, but posted a modestly optimistic outlook. By year end, markets were pricing for slightly more than two hikes by the end of 2017.
The BoJ’s meeting was perhaps even more eagerly anticipated, with a growing view that the unprecedented monetary policy experiment from the last few years has failed to generate the promised inflation. Expectations varied widely, from a further rate cut (to more deeply negative), to expansion of the quantitative easing program, to no change to policy. In the end, the BoJ opted for what amounted to a fine-tuning of policy: It left its rates unchanged, but announced a new policy of ‘yield curve control’, where it would keep the 10-year Japanese Government Bond yield anchored around 0%, and target a modestly positively sloping yield curve.
Markets turned to general “risk on” mode after the surprise election of Donald Trump with equities climbing, credit spreads narrowing to the tightest levels since early 2015, and U.S. Treasury yields climbing to levels not experienced since 2014. The dollar rallied strongly against many currencies, particularly after Mr. Trump’s victory.
FUND REVIEW
For the one-year reporting period, the Fund’s allocation to High Yield was the strongest contributor to total return, followed by Leveraged Loans. These areas benefited performance as credit spreads tightened sharply during the second half of the period. Alternatively, the Fund’s allocation to and selection within local currency Emerging Market bonds was the largest detractor to the Fund’s return. Emerging market currencies experienced declines due to widened fears regarding the potential for protectionist U.S. policies after the U.S. election.
STRATEGY & OUTLOOK
Global growth and market trends are likely to continue for the early part of 2017. By year end, some global yield depressing activities, like the tapering of the ECB’s bond buying program could lead to higher yields in core European government bond markets with knock on effects to U.S. yields.
More immediately, increases in minimum wages in several U.S. jurisdictions in January is likely to manifest in wage pressures in coming months leading to an uptick in inflation during the first quarter. Such realized data should push 10-year U.S. Treasury yields toward 3%. Therefore we remain underweight duration generally.
Markets are fully pricing June and December Fed rate hikes, but higher inflation could lead to markets pricing additional hikes. We believe that such an environment should mean higher rates in short maturity bonds.
4 OPPENHEIMER GLOBAL STRATEGIC INCOME FUND/VA
We remain long credit sectors and continue to increase our allocation to floating rate loans, which are currently about 12% of the portfolio. We believe that defaults are likely to fall back below historic norms of 2% to 3%, thanks largely to the recovery and stabilization of energy prices. Floating rate loans should also benefit as the Fed continues to slowly move front end rates higher.
In High Yield bonds, we are underweight the retail sector on potential adverse tax policies from the incoming administration and continued transition to online retailers. We’re positive the energy sector, but remain cautious in regard to metals and mining as we believe the price of metals has likely peaked. We think the healthcare sector offers value but there are risks within the sector so we are selectively adding to a focused overweight.
Within the Fund, we allocate to foreign exchange when we believe doing so offers additional return to shareholders. At the moment such opportunities are limited given overall dollar strength. Our small currency exposure is focused on high carry emerging market currencies like the Brazilian real and Russian ruble against being modestly short low or negative carry currencies such as the euro and Korean won.
Investors should consider the Fund’s investment objective, risks, charges and expenses carefully before investing. The Fund’s prospectus and summary prospectus contain this and other information about the Fund, and may be obtained by asking your financial advisor or calling us at 1.800.988.8287. Read prospectuses and summary prospectuses carefully before investing.
Total returns include changes in share price and reinvestment of dividends and capital gains distributions in a hypothetical investment for the periods shown, but do not include the charges associated with the separate account products that offer this Fund.
The Fund’s investment strategy and focus can change over time. The mention of specific fund holdings does not constitute a recommendation by OppenheimerFunds, Inc. or its affiliates.
Shares of Oppenheimer funds are not deposits or obligations of any bank, are not guaranteed by any bank, are not insured by the FDIC or any other agency, and involve investment risks, including the possible loss of the principal amount invested.
Comparing the Fund’s Performance to the Market. The graphs that follow show the performance of a hypothetical $10,000 investment in each share class of the Fund held until December 31, 2016. Performance is measured over a ten-fiscal-year period for both Classes. Performance information does not reflect charges that apply to separate accounts investing in the Fund. If these charges were taken into account, performance would be lower. The graphs assume that all dividends and capital gains distributions were reinvested in additional shares.
The Fund’s performance is compared to the performance of the Bloomberg Barclays U.S. Aggregate Bond Index, the Citigroup World Government Bond Index, the Citigroup Non-U.S. World Government Bond Index, the J.P. Morgan Domestic High Yield Index and the Fund’s Reference Index. The Bloomberg Barclays U.S. Aggregate Bond Index is an index of U.S. Government and corporate bonds. The Citigroup World Government Bond Index is an index of debt securities of major foreign government bond markets. The Citigroup Non-U.S. World Government Bond Index is an index of fixed rate government bonds with a maturity of one year or longer and amounts outstanding of at least U.S. $25 million. The J.P. Morgan Domestic High Yield Index is an unmanaged index of high yield fixed income securities issued by U.S. companies. The Fund’s Reference Index is a customized weighted index currently comprised of the following underlying broad-based security indices: 40% Citigroup Non-U.S. World Government Bond Index, 30% J.P. Morgan Domestic High Yield Index, and 30% Barclays U.S. Aggregate Bond Index. As referenced in the Prospectus supplement dated January 3, 2017, effective April 28, 2017, all references to the “Reference Index,” the “Citigroup Non-U.S. World Government Bond Index,” the “JP Morgan Domestic High Yield Index,” and the “Citigroup World Government Bond Index” are deleted from the Prospectus entirely. The indices are unmanaged and cannot be purchased directly by investors. While index comparisons may be useful to provide a benchmark for the Fund’s performance, it must be noted that the Fund’s investments are not limited to the investments comprising the indices. Index performance includes reinvestment of income, but does not reflect transaction costs, fees, expenses or taxes. Index performance is shown for illustrative purposes only as a benchmark for the Fund’s performance, and does not predict or depict performance of the Fund. The Fund’s performance reflects the effects of the Fund’s business and operating expenses.
5 OPPENHEIMER GLOBAL STRATEGIC INCOME FUND/VA
COMPARISON OF CHANGE IN VALUE OF $10,000 HYPOTHETICAL INVESTMENTS IN:
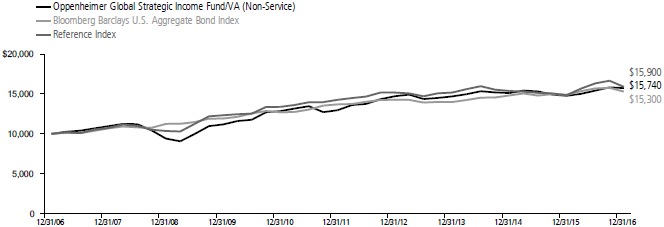
COMPARISON OF CHANGE IN VALUE OF $10,000 HYPOTHETICAL INVESTMENTS IN:
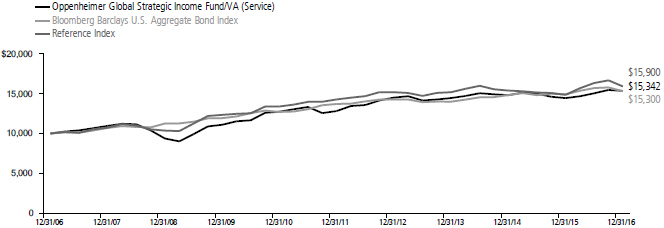
Performance data quoted represents past performance, which does not guarantee future results. The investment return and principal value of an investment in the Fund will fluctuate so that an investor’s shares, when redeemed, may be worth more or less than their original cost. Current performance may be lower or higher than the performance quoted. For performance data current to the most recent month end, call us at 1.800.988.8287. The Fund’s total returns should not be expected to be the same as the returns of other funds, whether or not both funds have the same portfolio managers and/or similar names. The Fund’s total returns include changes in share price and reinvested distributions but do not include the charges associated with the separate account products that offer this Fund. Such performance would have been lower if such charges were taken into account.
6 OPPENHEIMER GLOBAL STRATEGIC INCOME FUND/VA
Fund Expenses
Fund Expenses. As a shareholder of the Fund, you incur two types of costs: (1) transaction costs and (2) ongoing costs, including management fees; distribution and service fees; and other Fund expenses. These examples are intended to help you understand your ongoing costs (in dollars) of investing in the Fund and to compare these costs with the ongoing costs of investing in other mutual funds.
The examples are based on an investment of $1,000.00 invested at the beginning of the period and held for the entire 6-month period ended December 31, 2016.
Actual Expenses. The first section of the table provides information about actual account values and actual expenses. You may use the information in this section for the class of shares you hold, together with the amount you invested, to estimate the expense that you paid over the period. Simply divide your account value by $1,000.00 (for example, an $8,600.00 account value divided by $1,000.00 = 8.60), then multiply the result by the number in the first section under the heading entitled “Expenses Paid During 6 Months Ended December 31, 2016” to estimate the expenses you paid on your account during this period.
Hypothetical Example for Comparison Purposes.
The second section of the table provides information about hypothetical account values and hypothetical expenses based on the Fund’s actual expense ratio for each class of shares, and an assumed rate of return of 5% per year for each class before expenses, which is not the actual return. The hypothetical account values and expenses may not be used to estimate the actual ending account balance or expenses you paid for the period. You may use this information to compare the ongoing costs of investing in the Fund and other funds. To do so, compare this 5% hypothetical example for the class of shares you hold with the 5% hypothetical examples that appear in the shareholder reports of the other funds.
Please note that the expenses shown in the table are meant to highlight your ongoing costs only and do not reflect any charges associated with the separate accounts that offer this Fund. Therefore, the “hypothetical” lines of the table are useful in comparing ongoing costs only, and will not help you determine the relative total costs of owning different funds. In addition, if these separate account charges were included your costs would have been higher.
| | | | | | | | | | | | | | |
| Actual | | Beginning
Account Value
July 1, 2016 | | | Ending Account Value
December 31, 2016 | | | Expenses Paid During 6 Months Ended
December 31, 2016 | | | |
Non-Service shares | | $ | 1,000.00 | | | $ | 1,020.70 | | | $ | 3.77 | | | |
Service shares | | | 1,000.00 | | | | 1,020.10 | | | | 5.04 | | | |
| | | | |
| Hypothetical | | | | | | | | | | | |
(5% return before expenses) | | | | | | | | | | | | | | |
Non-Service shares | | | 1,000.00 | | | | 1,021.42 | | | | 3.77 | | | |
Service shares | | | 1,000.00 | | | | 1,020.16 | | | | 5.04 | | | |
Expenses are equal to the Fund’s annualized expense ratio for that class, multiplied by the average account value over the period, multiplied by 184/366 (to reflect the one-half year period). Those annualized expense ratios, excluding indirect expenses from affiliated funds, based on the 6-month period ended December 31, 2016 are as follows:
| | | | |
| Class | | Expense Ratios | |
Non-Service shares | | | 0.74% | |
Service shares | | | 0.99 | |
The expense ratios reflect voluntary and/or contractual waivers and/or reimbursements of expenses by the Fund’s Manager. Some of these undertakings may be modified or terminated at any time, as indicated in the Fund’s prospectus. The “Financial Highlights” tables in the Fund’s financial statements, included in this report, also show the gross expense ratios, without such waivers or reimbursements and reduction to custodian expenses, if applicable.
7 OPPENHEIMER GLOBAL STRATEGIC INCOME FUND/VA
CONSOLIDATED STATEMENT OF INVESTMENTS December 31, 2016
| | | | | | | | | | |
| | | | | Principal Amount | | | Value | |
| Asset-Backed Securities—5.4% | |
| American Credit Acceptance Receivables Trust: | |
| Series 2013-1, Cl. D, 4.94%, 6/15/201 | | | | $ | 1,520,000 | | | $ | 1,527,398 | |
| Series 2013-2, Cl. D, 5.92%, 8/17/201 | | | | | 1,375,000 | | | | 1,394,795 | |
| Series 2014-2, Cl. D, 4.96%, 5/10/211 | | | | | 720,000 | | | | 729,945 | |
| Series 2014-3, Cl. B, 2.43%, 6/10/201 | | | | | 120,365 | | | | 120,476 | |
| Series 2014-4, Cl. B, 2.60%, 10/10/171 | | | | | 101,911 | | | | 102,229 | |
| Series 2015-1, Cl. B, 2.85%, 2/12/211 | | | | | 665,000 | | | | 668,273 | |
| Series 2015-3, Cl. B, 3.56%, 10/12/211 | | | | | 525,000 | | | | 532,460 | |
| American Express Credit Account Master Trust: | |
| Series 2014-2, Cl. A, 1.26%, 1/15/20 | | | | | 130,000 | | | | 130,090 | |
| Series 2014-3, Cl. A, 1.49%, 4/15/20 | | | | | 865,000 | | | | 867,024 | |
| Series 2014-5, Cl. A, 0.994%, 5/15/202 | | | | | 1,080,000 | | | | 1,081,234 | |
| Series 2015-1, Cl. A, 0.994%, 1/15/202 | | | | | 1,710,000 | | | | 1,711,651 | |
| AmeriCredit Automobile Receivables Trust: | |
| Series 2012-4, Cl. D, 2.68%, 10/9/18 | | | | | 315,000 | | | | 315,175 | |
| Series 2013-2, Cl. E, 3.41%, 10/8/201 | | | | | 1,290,000 | | | | 1,301,910 | |
| Series 2013-3, Cl. D, 3.00%, 7/8/19 | | | | | 440,000 | | | | 444,945 | |
| Series 2013-3, Cl. E, 3.74%, 12/8/201 | | | | | 455,000 | | | | 461,479 | |
| Series 2013-4, Cl. D, 3.31%, 10/8/19 | | | | | 520,000 | | | | 529,062 | |
| Series 2014-1, Cl. C, 2.15%, 3/9/20 | | | | | 655,000 | | | | 658,801 | |
| Series 2014-1, Cl. E, 3.58%, 8/9/21 | | | | | 550,000 | | | | 559,116 | |
| Series 2014-2, Cl. E, 3.37%, 11/8/21 | | | | | 485,000 | | | | 490,712 | |
| Series 2014-3, Cl. D, 3.13%, 10/8/20 | | | | | 1,395,000 | | | | 1,417,285 | |
| Series 2014-4, Cl. D, 3.07%, 11/9/20 | | | | | 305,000 | | | | 309,252 | |
| Cabela’s Credit Card Master Note Trust: | |
| Series 2013-2A, Cl. A2, 1.354%, 8/16/211,2 | | | | | 280,000 | | | | 281,283 | |
| Series 2016-1, Cl. A1, 1.78%, 6/15/22 | | | | | 870,000 | | | | 867,664 | |
| Capital Auto Receivables Asset Trust: | |
| Series 2013-1, Cl. D, 2.19%, 9/20/21 | | | | | 275,000 | | | | 276,017 | |
| Series 2014-1, Cl. D, 3.39%, 7/22/19 | | | | | 185,000 | | | | 189,317 | |
| Series 2014-3, Cl. D, 3.14%, 2/20/20 | | | | | 265,000 | | | | 269,002 | |
| Series 2015-4, Cl. D, 3.62%, 5/20/21 | | | | | 470,000 | | | | 479,537 | |
| Series 2016-2, Cl. D, 3.16%, 11/20/23 | | | | | 165,000 | | | | 164,871 | |
| Series 2016-3, Cl. D, 2.65%, 1/20/24 | | | | | 275,000 | | | | 270,814 | |
| Capital One Multi-Asset Execution Trust: | |
| Series 2007-A1, Cl. A1, 0.754%, 11/15/192 | | | | | 875,000 | | | | 875,004 | |
| Series 2014-A2, Cl. A2, 1.26%, 1/15/20 | | | | | 965,000 | | | | 965,556 | |
| Series 2014-A5, Cl. A5, 1.48%, 7/15/20 | | | | | 1,070,000 | | | | 1,072,295 | |
| CarFinance Capital Auto Trust: | | | | | | | | | | |
| Series 2013-2A, Cl. B, 3.15%, 8/15/191 | | | | | 40,626 | | | | 40,786 | |
| Series 2015-1A, Cl. A, 1.75%, 6/15/211 | | | | | 144,793 | | | | 144,908 | |
| CarMax Auto Owner Trust: | | | | | | | | | | |
| Series 2013-2, Cl. D, 2.06%, 11/15/19 | | | | | 10,000 | | | | 9,998 | |
| Series 2014-2, Cl. D, 2.58%, 11/16/20 | | | | | 450,000 | | | | 450,543 | |
| Series 2015-2, Cl. D, 3.04%, 11/15/21 | | | | | 175,000 | | | | 175,270 | |
| Series 2015-3, Cl. D, 3.27%, 3/15/22 | | | | | 610,000 | | | | 614,917 | |
| Series 2016-1, Cl. D, 3.11%, 8/15/22 | | | | | 465,000 | | | | 461,704 | |
| Series 2016-3, Cl. D, 2.94%, 1/17/23 | | | | | 315,000 | | | | 309,054 | |
| Series 2016-4, Cl. D, 2.91%, 4/17/23 | | | | | 710,000 | | | | 694,595 | |
| Chase Issuance Trust: | | | | | | | | | | |
| Series 2007-A3, Cl. A3, 5.23%, 4/15/19 | | | | | 165,000 | | | | 165,769 | |
| Series 2014-A1, Cl. A1, 1.15%, 1/15/19 | | | | | 1,515,000 | | | | 1,515,017 | |
| Series 2014-A6, Cl. A6, 1.26%, 7/15/19 | | | | | 1,165,000 | | | | 1,165,791 | |
| Series 2014-A7, Cl. A7, 1.38%, 11/15/19 | | | | | 1,710,000 | | | | 1,711,663 | |
| Series 2016-A6, Cl. A6, 1.10%, 1/15/20 | | | | | 1,685,000 | | | | 1,681,181 | |
| CPS Auto Receivables Trust, Series 2014- C, Cl. A, 1.31%, 2/15/191 | | | | | 79,343 | | | | 79,323 | |
| CPS Auto Trust, Series 2012-C, Cl. A, 1.82%, 12/16/191 | | | | | 23,827 | | | | 23,832 | |
| Credit Acceptance Auto Loan Trust, Series 2014-1A, Cl. B, 2.29%, 4/15/221 | | | | | 765,000 | | | | 767,079 | |
| Discover Card Execution Note Trust, Series 2014-A5, Cl. A, 1.39%, 4/15/20 | | | | | 1,470,000 | | | | 1,472,298 | |
| Drive Auto Receivables Trust: | | | | | | | | | | |
| Series 2015-BA, Cl. C, 2.76%, 7/15/211 | | | | | 515,000 | | | | 518,364 | |
| | | | | | | | | | |
| | | | | Principal Amount | | | Value | |
| Asset-Backed Securities (Continued) | |
| Drive Auto Receivables Trust: (Continued) | |
| Series 2015-BA, Cl. D, 3.84%, 7/15/211 | | | | $ | 985,000 | | | $ | 992,180 | |
| Series 2015-CA, Cl. D, 4.20%, 9/15/211 | | | | | 1,715,000 | | | | 1,738,022 | |
| Series 2015-DA, Cl. C, 3.38%, 11/15/211 | | | | | 1,445,000 | | | | 1,468,960 | |
| Series 2015-DA, Cl. D, 4.59%, 1/17/231 | | | | | 135,000 | | | | 138,649 | |
| Series 2016-BA, Cl. C, 3.19%, 7/15/221 | | | | | 440,000 | | | | 443,453 | |
| Series 2016-CA, Cl. D, 4.18%, 3/15/241 | | | | | 430,000 | | | | 426,944 | |
| DT Auto Owner Trust: | | | | | | | | | | |
| Series 2013-2A, Cl. D, 4.18%, 6/15/201 | | | | | 422,561 | | | | 426,261 | |
| Series 2014-1A, Cl. D, 3.98%, 1/15/211 | | | | | 1,046,225 | | | | 1,055,233 | |
| Series 2014-2A, Cl. D, 3.68%, 4/15/211 | | | | | 2,505,000 | | | | 2,529,585 | |
| Series 2014-3A, Cl. D, 4.47%, 11/15/211 | | | | | 2,875,000 | | | | 2,932,590 | |
| Series 2015-1A, Cl. C, 2.87%, 11/16/201 | | | | | 302,635 | | | | 303,659 | |
| Series 2015-1A, Cl. D, 4.26%, 2/15/221 | | | | | 3,020,000 | | | | 3,063,303 | |
| Series 2015-2A, Cl. D, 4.25%, 2/15/221 | | | | | 625,000 | | | | 632,340 | |
| Series 2015-3A, Cl. D, 4.53%, 10/17/221 | | | | | 2,530,000 | | | | 2,576,754 | |
| Series 2016-1A, Cl. B, 2.79%, 5/15/201 | | | | | 625,000 | | | | 628,844 | |
| Series 2016-4A, Cl. B, 2.02%, 8/17/201 | | | | | 655,000 | | | | 652,683 | |
| Element Rail Leasing I LLC, Series 2014- 1A, Cl. A1, 2.299%, 4/19/441 | | | | | 250,983 | | | | 244,360 | |
| Evergreen Credit Card Trust, Series 2016-3, Cl. A, 1.204%, 11/16/201,2 | | | | | 1,210,000 | | | | 1,211,023 | |
| Exeter Automobile Receivables Trust: | | | | | |
| Series 2013-2A, Cl. C, 4.35%, 1/15/191 | | | | | 352,566 | | | | 355,212 | |
| Series 2014-1A, Cl. B, 2.42%, 1/15/191 | | | | | 98,560 | | | | 98,646 | |
| Series 2014-1A, Cl. C, 3.57%, 7/15/191 | | | | | 860,000 | | | | 865,656 | |
| Series 2014-2A, Cl. C, 3.26%, 12/16/191 | | | | | 180,000 | | | | 181,039 | |
| First Investors Auto Owner Trust, Series 2013-3A, Cl. D, 3.67%, 5/15/201 | | | | | 1,085,000 | | | | 1,092,777 | |
| Flagship Credit Auto Trust: | | | | | | | | | | |
| Series 2014-2, Cl. A, 1.43%, 12/16/191 | | | | | 93,066 | | | | 93,062 | |
| Series 2016-4, Cl. A1, 1.47%, 3/16/201 | | | | | 769,566 | | | | 768,953 | |
| Ford Credit Floorplan Master Owner Trust A, Series 2016-3, Cl. A1, 1.55%, 7/15/21 | | | | | 1,000,000 | | | | 989,857 | |
| GM Financial Automobile Leasing Trust, Series 2015-1, Cl. D, 3.01%, 3/20/20 | | | | | 415,000 | | | | 419,905 | |
| ICE EM CLO: | | | | | | | | | | |
| Series 2007-1A, Cl. B, 2.904%, 8/15/221,2 | | | | | 7,870,000 | | | | 7,705,572 | |
| Series 2007-1A, Cl. C, 4.204%, 8/15/221,2 | | | | | 5,270,000 | | | | 5,092,596 | |
| Series 2007-1A, Cl. D, 6.204%, 8/15/221,2 | | | | | 4,730,018 | | | | 4,353,343 | |
| Navistar Financial Dealer Note Master Owner Trust II: | |
| Series 2015-1, Cl. B, 2.456%, 6/25/201,2 | | | | | 185,000 | | | | 185,166 | |
| Series 2015-1, Cl. D, 3.906%, 6/25/201,2 | | | | | 70,000 | | | | 70,099 | |
| Series 2016-1, Cl. D, 4.056%, 9/27/211,2 | | | | | 205,000 | | | | 206,347 | |
| Santander Drive Auto Receivables Trust: | |
| Series 2013-1, Cl. D, 2.27%, 1/15/19 | | | | | 920,000 | | | | 923,743 | |
| Series 2013-4, Cl. D, 3.92%, 1/15/20 | | | | | 740,000 | | | | 755,831 | |
| Series 2013-4, Cl. E, 4.67%, 1/15/201 | | | | | 520,000 | | | | 529,302 | |
| Series 2013-5, Cl. D, 2.73%, 10/15/19 | | | | | 1,200,000 | | | | 1,213,926 | |
| Series 2013-A, Cl. E, 4.71%, 1/15/211 | | | | | 405,000 | | | | 415,379 | |
| Series 2014-2, Cl. D, 2.76%, 2/18/20 | | | | | 1,120,000 | | | | 1,133,707 | |
| Series 2014-4, Cl. C, 2.60%, 11/16/20 | | | | | 1,795,000 | | | | 1,809,769 | |
| Series 2015-1, Cl. D, 3.24%, 4/15/21 | | | | | 1,190,000 | | | | 1,204,574 | |
| Series 2015-5, Cl. D, 3.65%, 12/15/21 | | | | | 915,000 | | | | 938,019 | |
| Series 2016-2, Cl. D, 3.39%, 4/15/22 | | | | | 300,000 | | | | 302,386 | |
| SNAAC Auto Receivables Trust, Series 2014-1A, Cl. D, 2.88%, 1/15/201 | | | | | 905,000 | | | | 901,095 | |
| Synchrony Credit Card Master Note Trust, Series 2012-6, Cl. A, 1.36%, 8/17/20 | | | | | 470,000 | | | | 470,309 | |
| TCF Auto Receivables Owner Trust, Series 2015-1A, Cl. D, 3.53%, 3/15/221 | | | | | 285,000 | | | | 285,566 | |
| Trip Rail Master Funding LLC, Series 2014-1A, Cl. A1, 2.863%, 4/15/441 | | | | | 117,626 | | | | 114,852 | |
8 OPPENHEIMER GLOBAL STRATEGIC INCOME FUND/VA
| | | | | | | | | | |
| | | | | Principal Amount | | | Value | |
| Asset-Backed Securities (Continued) | |
| United Auto Credit Securitization Trust, Series 2015-1, Cl. D, 2.92%, 6/17/191 | | | | $ | 385,000 | | | $ | 386,140 | |
Westlake Automobile Receivables Trust: | | | | | |
| Series 2014-2A, Cl. D, 2.86%, 7/15/211 | | | | | 245,000 | | | | 246,184 | |
| Series 2015-1A, Cl. C, 2.29%, 11/16/201 | | | | | 485,000 | | | | 486,370 | |
| Series 2015-2A, Cl. C, 2.45%, 1/15/211 | | | | | 365,000 | | | | 367,506 | |
World Financial Network Credit Card Master Trust: | |
| Series 2014-C, Cl. A, 1.60%, 8/16/21 | | | | | 875,000 | | | | 876,355 | |
| Series 2015-C, Cl. A, 1.26%, 3/15/21 | | | | | 635,000 | | | | 635,418 | |
| Series 2016-B, Cl. A, 1.44%, 6/15/22 | | | | | 560,000 | | | | 558,209 | |
| Total Asset-Backed Securities (Cost $91,537,731) | | | | 91,564,477 | |
| | | |
| | | | | | | | | | |
| Mortgage-Backed Obligations—16.2% | |
| Government Agency—6.6% | |
| FHLMC/FNMA/FHLB/Sponsored—5.6% | |
Federal Home Loan Mortgage Corp. Gold Pool: | |
| 5.00%, 9/1/33 | | | | | 312,098 | | | | 343,064 | |
| 5.50%, 9/1/39 | | | | | 397,303 | | | | 441,405 | |
| 6.00%, 5/1/18-11/1/21 | | | | | 66,403 | | | | 74,658 | |
| 6.50%, 3/1/18-8/1/32 | | | | | 325,573 | | | | 358,456 | |
| 7.00%, 10/1/31-10/1/37 | | | | | 71,407 | | | | 80,594 | |
| 7.50%, 1/1/32 | | | | | 280,705 | | | | 339,319 | |
| Federal Home Loan Mortgage Corp., Interest-Only Stripped Mtg.-Backed Security: | |
| Series 192,Cl. IO, 77.047%, 2/1/283 | | | | | 6,696 | | | | 1,607 | |
| Series 205,Cl. IO, 37.955%, 9/1/293 | | | | | 40,072 | | | | 9,043 | |
| Series 243,Cl. 6, 0.852%, 12/15/323 | | | | | 86,088 | | | | 15,935 | |
| Federal Home Loan Mortgage Corp., Real Estate Mtg. Investment Conduit Multiclass Pass-Through Certificates: | |
| Series 1360,Cl. PZ, 7.50%, 9/15/22 | | | | | 279,995 | | | | 305,720 | |
| Series 151,Cl. F, 9.00%, 5/15/21 | | | | | 3,733 | | | | 4,031 | |
| Series 1674,Cl. Z, 6.75%, 2/15/24 | | | | | 138,020 | | | | 150,697 | |
| Series 1897,Cl. K, 7.00%, 9/15/26 | | | | | 525,641 | | | | 582,318 | |
| Series 2043,Cl. ZP, 6.50%, 4/15/28 | | | | | 197,629 | | | | 219,995 | |
| Series 2106,Cl. FG, 1.154%, 12/15/282 | | | | | 350,882 | | | | 351,849 | |
| Series 2122,Cl. F, 1.154%, 2/15/292 | | | | | 9,440 | | | | 9,467 | |
| Series 2148,Cl. ZA, 6.00%, 4/15/29 | | | | | 194,427 | | | | 217,473 | |
| Series 2195,Cl. LH, 6.50%, 10/15/29 | | | | | 141,071 | | | | 159,304 | |
| Series 2326,Cl. ZP, 6.50%, 6/15/31 | | | | | 19,925 | | | | 22,171 | |
| Series 2344,Cl. FP, 1.654%, 8/15/312 | | | | | 86,913 | | | | 89,445 | |
| Series 2368,Cl. PR, 6.50%, 10/15/31 | | | | | 65,371 | | | | 71,819 | |
| Series 2412,Cl. GF, 1.654%, 2/15/322 | | | | | 124,834 | | | | 128,444 | |
| Series 2449,Cl. FL, 1.254%, 1/15/322 | | | | | 97,080 | | | | 98,555 | |
| Series 2451,Cl. FD, 1.704%, 3/15/322 | | | | | 49,596 | | | | 51,139 | |
| Series 2453,Cl. BD, 6.00%, 5/15/17 | | | | | 1,445 | | | | 1,464 | |
| Series 2461,Cl. PZ, 6.50%, 6/15/32 | | | | | 231,868 | | | | 270,491 | |
| Series 2464,Cl. FI, 1.704%, 2/15/322 | | | | | 44,023 | | | | 45,131 | |
| Series 2470,Cl. AF, 1.704%, 3/15/322 | | | | | 85,095 | | | | 87,742 | |
| Series 2470,Cl. LF, 1.704%, 2/15/322 | | | | | 45,051 | | | | 46,185 | |
| Series 2477,Cl. FZ, 1.254%, 6/15/312 | | | | | 187,532 | | | | 188,755 | |
| Series 2517,Cl. GF, 1.704%, 2/15/322 | | | | | 39,169 | | | | 40,156 | |
| Series 2635,Cl. AG, 3.50%, 5/15/32 | | | | | 59,510 | | | | 61,315 | |
| Series 2668,Cl. AZ, 4.00%, 9/15/18 | | | | | 12,907 | | | | 13,077 | |
| Series 2676,Cl. KY, 5.00%, 9/15/23 | | | | | 688,885 | | | | 734,357 | |
| Series 2707,Cl. QE, 4.50%, 11/15/18 | | | | | 57,657 | | | | 58,926 | |
| Series 2770,Cl. TW, 4.50%, 3/15/19 | | | | | 8,429 | | | | 8,687 | |
| Series 3025,Cl. SJ, 22.169%, 8/15/352 | | | | | 113,501 | | | | 169,797 | |
| Series 3741,Cl. PA, 2.15%, 2/15/35 | | | | | 358,692 | | | | 361,018 | |
| Series 3815,Cl. BD, 3.00%, 10/15/20 | | | | | 7,785 | | | | 7,874 | |
| Series 3840,Cl. CA, 2.00%, 9/15/18 | | | | | 5,951 | | | | 5,975 | |
| Series 3848,Cl. WL, 4.00%, 4/15/40 | | | | | 190,358 | | | | 197,394 | |
| Series 3857,Cl. GL, 3.00%, 5/15/40 | | | | | 8,174 | | | | 8,363 | |
| Series 3917,Cl. BA, 4.00%, 6/15/38 | | | | | 106,226 | | | | 109,281 | |
| Series 4221,Cl. HJ, 1.50%, 7/15/23 | | | | | 248,957 | | | | 247,553 | |
| Federal Home Loan Mortgage Corp., Real Estate Mtg. Investment Conduit Multiclass Pass-Through Certificates, Interest-Only Stripped Mtg.-Backed Security: | |
| Series 2074,Cl. S, 99.999%, 7/17/283 | | | | | 10,677 | | | | 1,596 | |
| Series 2079,Cl. S, 99.999%, 7/17/283 | | | | | 18,380 | | | | 3,087 | |
| Series 2136,Cl. SG, 34.496%, 3/15/293 | | | | | 492,378 | | | | 92,207 | |
| | | | | | | | | | |
| | | | | Principal Amount | | | Value | |
FHLMC/FNMA/FHLB/Sponsored (Continued) | | | | | |
| Federal Home Loan Mortgage Corp., Real Estate Mtg. Investment Conduit Multiclass Pass-Through Certificates, Interest-Only Stripped Mtg.-Backed Security: (Continued) | |
| Series 2399,Cl. SG, 99.999%, 12/15/263 | | | | $ | 279,011 | | | $ | 49,341 | |
| Series 2437,Cl. SB, 45.488%, 4/15/323 | | | | | 867,353 | | | | 187,934 | |
| Series 2526,Cl. SE, 49.17%, 6/15/293 | | | | | 17,395 | | | | 3,534 | |
| Series 2682,Cl. TQ, 99.999%, 10/15/333 | | | | | 180,974 | | | | 39,714 | |
| Series 2795,Cl. SH, 99.999%, 3/15/243 | | | | | 367,371 | | | | 36,819 | |
| Series 2920,Cl. S, 55.393%, 1/15/353 | | | | | 190,295 | | | | 30,742 | |
| Series 2922,Cl. SE, 25.763%, 2/15/353 | | | | | 33,100 | | | | 5,118 | |
| Series 2981,Cl. AS, 11.50%, 5/15/353 | | | | | 313,788 | | | | 52,539 | |
| Series 2981,Cl. BS, 99.999%, 5/15/353 | | | | | 379,110 | | | | 68,292 | |
| Series 3397,Cl. GS, 0.00%, 12/15/373,4 | | | | | 121,168 | | | | 21,067 | |
| Series 3424,Cl. EI, 0.00%, 4/15/383,4 | | | | | 52,992 | | | | 5,966 | |
| Series 3450,Cl. BI, 24.976%, 5/15/383 | | | | | 220,605 | | | | 31,616 | |
| Series 3606,Cl. SN, 23.604%, 12/15/393 | | | | | 65,374 | | | | 10,334 | |
| Series 3659,Cl. IE, 44.406%, 3/15/193 | | | | | 147,413 | | | | 5,097 | |
| Series 3685,Cl. EI, 4.763%, 3/15/193 | | | | | 70,008 | | | | 1,683 | |
Federal National Mortgage Assn.: | |
| 2.50%, 1/1/325 | | | 6,400,000 | | | | 6,407,540 | |
| 3.00%, 1/1/325 | | | 13,965,000 | | | | 14,326,388 | |
| 3.50%, 1/1/475 | | | 18,770,000 | | | | 19,227,577 | |
| 4.00%, 1/15/475 | | | 22,380,000 | | | | 23,518,653 | |
| 4.50%, 1/1/475 | | | 7,270,000 | | | | 7,817,840 | |
| 5.00%, 1/1/475 | | | 4,380,000 | | | | 4,770,942 | |
Federal National Mortgage Assn. Pool: | |
| 5.00%, 2/1/18-7/1/33 | | | 626,330 | | | | 665,969 | |
| 5.50%, 4/1/21-5/1/36 | | | 215,919 | | | | 239,244 | |
| 6.00%, 3/1/17-1/1/19 | | | 3,819 | | | | 3,841 | |
| 6.50%, 4/1/17-1/1/34 | | | 579,646 | | | | 662,935 | |
| 7.00%, 11/1/17-6/1/34 | | | 728,839 | | | | 850,134 | |
| 7.50%, 2/1/27-3/1/33 | | | 925,633 | | | | 1,106,250 | |
| 8.50%, 7/1/32 | | | 1,470 | | | | 1,596 | |
| Federal National Mortgage Assn., Interest-Only Stripped Mtg.-Backed Security: | |
| Series 214,Cl. 2, 99.999%, 3/25/233 | | | | | 103,171 | | | | 15,820 | |
| Series 221,Cl. 2, 36.784%, 5/25/233 | | | | | 12,287 | | | | 2,098 | |
| Series 254,Cl. 2, 99.999%, 1/25/243 | | | | | 210,182 | | | | 45,384 | |
| Series 301,Cl. 2, 5.692%, 4/25/293 | | | | | 39,939 | | | | 9,519 | |
| Series 313,Cl. 2, 99.999%, 6/25/313 | | | | | 419,769 | | | | 113,737 | |
| Series 319,Cl. 2, 0.123%, 2/25/323 | | | | | 193,214 | | | | 46,828 | |
| Series 321,Cl. 2, 6.065%, 4/25/323 | | | | | 55,553 | | | | 13,097 | |
| Series 324,Cl. 2, 0.00%, 7/25/323,4 | | | | | 58,299 | | | | 14,024 | |
| Series 328,Cl. 2, 0.00%, 12/25/323,4 | | | | | 115,406 | | | | 26,625 | |
| Series 331,Cl. 5, 0.00%, 2/25/333,4 | | | | | 221,834 | | | | 42,847 | |
| Series 332,Cl. 2, 0.00%, 3/25/333,4 | | | | | 926,724 | | | | 220,859 | |
| Series 334,Cl. 12, 0.00%, 3/25/333,4 | | | | | 178,871 | | | | 40,638 | |
| Series 339,Cl. 15, 0.298%, 10/25/333 | | | | | 533,453 | | | | 116,489 | |
| Series 345,Cl. 9, 0.00%, 1/25/343,4 | | | | | 161,983 | | | | 31,099 | |
| Series 351,Cl. 10, 0.00%, 4/25/343,4 | | | | | 100,761 | | | | 20,696 | |
| Series 351,Cl. 8, 0.00%, 4/25/343,4 | | | | | 178,424 | | | | 36,609 | |
| Series 356,Cl. 10, 0.00%, 6/25/353,4 | | | | | 128,608 | | | | 26,032 | |
| Series 356,Cl. 12, 0.00%, 2/25/353,4 | | | | | 62,521 | | | | 14,155 | |
| Series 362,Cl. 13, 0.00%, 8/25/353,4 | | | | | 84,704 | | | | 17,542 | |
| Federal National Mortgage Assn., Real Estate Mtg. Investment Conduit Multiclass Pass-Through Certificates: | |
| Series 1999-54,Cl. LH, 6.50%, 11/25/29 | | | | | 120,712 | | | | 138,763 | |
| Series 2001-80,Cl. ZB, 6.00%, 1/25/32 | | | | | 108,083 | | | | 121,713 | |
| Series 2002-12,Cl. PG, 6.00%, 3/25/17 | | | | | 643 | | | | 649 | |
| Series 2002-29,Cl. F, 1.756%, 4/25/322 | | | | | 49,157 | | | | 50,431 | |
| Series 2002-64,Cl. FJ, 1.756%, 4/25/322 | | | | | 15,137 | | | | 15,529 | |
| Series 2002-68,Cl. FH, 1.236%, | | | | | | | | | | |
| 10/18/322 | | | 34,662 | | | | 34,831 | |
| Series 2002-84,Cl. FB, 1.756%, | | | | | | | | | | |
| 12/25/322 | | | 217,287 | | | | 222,662 | |
| Series 2002-9,Cl. PC, 6.00%, 3/25/17 | | | | | 776 | | | | 785 | |
| Series 2002-9,Cl. PR, 6.00%, 3/25/17 | | | | | 950 | | | | 960 | |
| Series 2002-90,Cl. FH, 1.256%, | | | | | | | | | | |
| 9/25/322 | | | 121,572 | | | | 122,089 | |
9 OPPENHEIMER GLOBAL STRATEGIC INCOME FUND/VA
| | | | | | | | | | |
| | | | | Principal Amount | | | Value | |
FHLMC/FNMA/FHLB/Sponsored (Continued) | |
| Federal National Mortgage Assn., Real Estate Mtg. Investment Conduit Multiclass Pass-Through Certificates: (Continued) | |
| Series 2003-100,Cl. PA, 5.00%, 10/25/18 | | | | $ | 82,681 | | | $ | 84,543 | |
| Series 2003-11,Cl. FA, 1.756%, 9/25/322 | | | | | 217,292 | | | | 222,667 | |
| Series 2003-112,Cl. AN, 4.00%, 11/25/18 | | | | | 28,756 | | | | 29,213 | |
| Series 2003-116,Cl. FA, 1.156%, 11/25/332 | | | | | 22,555 | | | | 22,580 | |
| Series 2003-84,Cl. GE, 4.50%, 9/25/18 | | | | | 11,709 | | | | 12,017 | |
| Series 2004-101,Cl. BG, 5.00%, 1/25/20 | | | | | 2,241 | | | | 2,245 | |
| Series 2004-25,Cl. PC, 5.50%, 1/25/34 | | | | | 33,103 | | | | 34,151 | |
| Series 2005-109,Cl. AH, 5.50%, | | | | | | | | | | |
| 12/25/25 | | | | | 924,289 | | | | 992,185 | |
| Series 2005-31,Cl. PB, 5.50%, 4/25/35 | | | | | 560,000 | | | | 633,014 | |
| Series 2005-71,Cl. DB, 4.50%, 8/25/25 | | | | | 131,611 | | | | 138,369 | |
| Series 2006-11,Cl. PS, 21.794%, 3/25/362 | | | | | 96,944 | | | | 144,295 | |
| Series 2006-46,Cl. SW, 21.427%, 6/25/362 | | | | | 160,542 | | | | 215,998 | |
| Series 2008-75,Cl. DB, 4.50%, 9/25/23 | | | | | 41,929 | | | | 42,765 | |
| Series 2009-113,Cl. DB, 3.00%, 12/25/20 | | | | | 125,138 | | | | 126,722 | |
| Series 2009-36,Cl. FA, 1.696%, 6/25/372 | | | | | 47,330 | | | | 48,408 | |
| Series 2009-70,Cl. TL, 4.00%, 8/25/19 | | | | | 134,067 | | | | 135,808 | |
| Series 2010-43,Cl. KG, 3.00%, 1/25/21 | | | | | 69,344 | | | | 70,441 | |
| Series 2011-122,Cl. EC, 1.50%, 1/25/20 | | | | | 78,898 | | | | 78,949 | |
| Series 2011-15,Cl. DA, 4.00%, 3/25/41 | | | | | 94,755 | | | | 97,683 | |
| Series 2011-3,Cl. EL, 3.00%, 5/25/20 | | | | | 204,555 | | | | 207,101 | |
| Series 2011-3,Cl. KA, 5.00%, 4/25/40 | | | | | 204,592 | | | | 220,244 | |
| Series 2011-38,Cl. AH, 2.75%, 5/25/20 | | | | | 6,233 | | | | 6,290 | |
| Series 2011-6,Cl. BA, 2.75%, 6/25/20 | | | | | 89,303 | | | | 90,246 | |
| Series 2011-69,Cl. EA, 3.00%, 11/25/29 | | | | | 37,959 | | | | 38,143 | |
| Series 2011-82,Cl. AD, 4.00%, 8/25/26 | | | | | 138,194 | | | | 141,085 | |
| Series 2012-20,Cl. FD, 1.156%, 3/25/422 | | | | | 274,893 | | | | 273,769 | |
| Federal National Mortgage Assn., Real Estate Mtg. Investment Conduit Multiclass Pass-Through Certificates, Interest-Only Stripped Mtg.-Backed Security: | |
| Series 2001-61,Cl. SH, 31.485%, 11/18/313 | | | | | 56,515 | | | | 13,365 | |
| Series 2001-63,Cl. SD, 56.448%, 12/18/313 | | | | | 14,903 | | | | 3,029 | |
| Series 2001-68,Cl. SC, 33.875%, 11/25/313 | | | | | 9,986 | | | | 2,113 | |
Series 2001-81,Cl. S, 36.41%, 1/25/323 | | | | | 12,470 | | | | 3,528 | |
| Series 2002-28,Cl. SA, 23.282%, 4/25/323 | | | | | 8,447 | | | | 1,725 | |
| Series 2002-38,Cl. SO, 47.275%, 4/25/323 | | | | | 56,482 | | | | 10,310 | |
Series 2002-48,Cl. S, 33.067%, 7/25/323 | | | | | 13,228 | | | | 2,812 | |
| Series 2002-52,Cl. SL, 23.07%, 9/25/323 | | | | | 8,488 | | | | 1,758 | |
| Series 2002-56,Cl. SN, 34.662%, 7/25/323 | | | | | 18,177 | | | | 3,801 | |
| Series 2002-77,Cl. IS, 44.431%, 12/18/323 | | | | | 96,228 | | | | 18,724 | |
| Series 2002-77,Cl. SH, 40.208%, | |
| 12/18/323 | | | | | 17,629 | | | | 3,696 | |
| Series 2002-9,Cl. MS, 23.644%, 3/25/323 | | | | | 16,149 | | | | 3,313 | |
| Series 2003-13,Cl. IO, 30.262%, 3/25/333 | | | | | 170,968 | | | | 27,797 | |
| Series 2003-26,Cl. DI, 26.659%, 4/25/333 | | | | | 130,827 | | | | 30,672 | |
| Series 2003-33,Cl. SP, 34.385%, 5/25/333 | | | | | 98,913 | | | | 19,958 | |
| Series 2003-38,Cl. SA, 99.999%, 3/25/233 | | | | | 14,561 | | | | 134 | |
| | | | | | | | | | |
| | | | | Principal Amount | | | Value | |
FHLMC/FNMA/FHLB/Sponsored (Continued) | | | | | |
| Federal National Mortgage Assn., Real Estate Mtg. Investment Conduit Multiclass Pass-Through Certificates, Interest-Only Stripped Mtg.-Backed Security: (Continued) | |
| Series 2003-4,Cl. S, 18.658%, 2/25/333 | | | | $ | 27,732 | | | $ | 6,210 | |
| Series 2004-56,Cl. SE, 7.457%, 10/25/333 | | | | | 462,983 | | | | 102,653 | |
| Series 2005-12,Cl. SC, 39.352%, 3/25/353 | | | | | 15,568 | | | | 2,432 | |
| Series 2005-14,Cl. SE, 63.254%, 3/25/353 | | | | | 567,314 | | | | 88,039 | |
| Series 2005-40,Cl. SA, 63.18%, 5/25/353 | | | | | 493,048 | | | | 88,505 | |
| Series 2005-40,Cl. SB, 99.999%, 5/25/353 | | | | | 750,444 | | | | 112,458 | |
| Series 2005-52,Cl. JH, 45.499%, 5/25/353 | | | | | 300,087 | | | | 46,578 | |
| Series 2005-63,Cl. SA, 41.298%, 10/25/313 | | | | | 26,409 | | | | 4,936 | |
| Series 2006-90,Cl. SX, 36.244%, 9/25/363 | | | | | 531,601 | | | | 82,342 | |
Series 2007-88,Cl. XI, 4.694%, 6/25/373 | | | | | 602,714 | | | | 103,855 | |
| Series 2008-55,Cl. SA, 0.00%, 7/25/383,4 | | | | | 48,679 | | | | 5,259 | |
| Series 2009-8,Cl. BS, 99.999%, 2/25/243 | | | | | 14,449 | | | | 424 | |
| Series 2010-95,Cl. DI, 66.153%, 11/25/203 | | | | | 219,543 | | | | 8,847 | |
| Series 2011-96,Cl. SA, 14.272%, 10/25/413 | | | | | 155,331 | | | | 27,427 | |
| Series 2012-134,Cl. SA, 9.234%, 12/25/423 | | | | | 612,348 | | | | 127,743 | |
| Series 2012-40,Cl. PI, 2.326%, 4/25/413 | | | | | 1,117,118 | | | | 149,845 | |
| Federal National Mortgage Assn., Stripped Mtg.-Backed Security, Series 302, Cl. 2, 6%, 5/1/29 | | | | | 3 | | | | — | |
| | | | | | | | | 93,811,373 | |
| | | | | | | | | | | |
| GNMA/Guaranteed—1.0% | | | | | | | | | | |
| Government National Mortgage Assn. I Pool: | |
| 7.00%, 4/15/28-7/15/28 | | | | | 59,305 | | | | 65,927 | |
| 7.50%, 2/15/27 | | | | | 4,495 | | | | 4,625 | |
| 8.00%, 5/15/26 | | | | | 9,273 | | | | 9,374 | |
| Government National Mortgage Assn. II Pool: | |
| 2.00%, 11/20/252 | | | | | 2,674 | | | | 2,757 | |
| 3.50%, 1/21/475 | | | | | 10,660,000 | | | | 11,074,441 | |
| 4.00%, 1/1/475 | | | | | 4,910,000 | | | | 5,211,858 | |
| Government National Mortgage Assn., Interest-Only Stripped Mtg.-Backed Security: | |
| Series 2007-17,Cl. AI, 52.528%, 4/16/373 | | | | | 260,703 | | | | 45,684 | |
| Series 2011-52,Cl. HS, 30.375%, 4/16/413 | | | | | 441,449 | | | | 72,357 | |
| | | | | | | | | 16,487,023 | |
| | | | | | | | | | | |
| Non-Agency—9.6% | | | | | | | | | | |
| Commercial—6.5% | | | | | | | | | | |
| Banc of America Funding Trust, Series 2014- R7, Cl. 3A1, 3.003%, 3/26/362 | | | | | 87,972 | | | | 88,123 | |
| BCAP LLC Trust: | | | | | | | | | | |
| Series 2011-R11,Cl. 18A5, 2.69%, 9/26/351,2 | | | | | 107,575 | | | | 107,510 | |
| Series 2012-RR2,Cl. 6A3, 3.242%, 9/26/351,2 | | | | | 126,758 | | | | 126,655 | |
| Series 2012-RR6,Cl. RR6, 2.054%, 11/26/361 | | | | | 201,301 | | | | 190,693 | |
| CD Commercial Mortgage Trust, Series 2016- CD2, Cl. AM, 3.668%, 11/10/492 | | | | | 365,000 | | | | 374,358 | |
| Chase Mortgage Finance Trust, Series 2005- A2, Cl. 1A3, 2.966%, 1/25/362 | | | | | 17,318 | | | | 16,389 | |
| COMM Mortgage Trust: | | | | | | | | | | |
| Series 2013-CR6,Cl. AM, 3.147%, 3/10/461 | | | | | 960,000 | | | | 959,988 | |
10 OPPENHEIMER GLOBAL STRATEGIC INCOME FUND/VA
| | | | | | | | | | |
| | | | | Principal Amount | | | Value | |
Commercial (Continued) | | | | | |
COMM Mortgage Trust: (Continued) | |
| Series 2013-CR7,Cl. D, 4.354%, 3/10/461,2 | | | | $ | 3,270,000 | | | $ | 2,976,741 | |
| Series 2014-CR21,Cl. AM, 3.987%, 12/10/47 | | | | | 25,000 | | | | 25,888 | |
| Series 2014-LC15,Cl. AM, 4.198%, 4/10/47 | | | | | 230,000 | | | | 241,869 | |
| Series 2014-UBS3,Cl. D, 4.813%, 6/10/471,2 | | | | | 8,895,000 | | | | 7,186,653 | |
| Series 2014-UBS6,Cl. AM, 4.048%, 12/10/47 | | | | | 1,600,000 | | | | 1,640,520 | |
| Series 2015-CR23,Cl. AM, 3.801%, 5/10/48 | | | | | 1,100,000 | | | | 1,121,995 | |
| COMM Mortgage Trust, Interest-Only Stripped Mtg.-Backed Security, Series 2012-CR5, Cl. XA, 0.00%, 12/10/453,4 | | | | | 3,132,404 | | | | 209,649 | |
| Deutsche Alt-B Securities, Inc. Mortgage Loan Trust, Series 2006-AB2, Cl. A1, 5.752%, 6/25/362 | | | | | 64,614 | | | | 54,021 | |
| Deutsche Bank Commercial Mortgage Trust, Series 2016-C1, Cl. AM, 3.539%, 5/10/49 | | | | | 600,000 | | | | 605,717 | |
| Deutsche Mortgage Securities, Inc., Series 2013-RS1, Cl. 1A2, 0.959%, 7/22/361,2 | | | | | 5,060,144 | | | | 4,510,200 | |
FREMF Mortgage Trust: | | | | | | | | | | |
| Series 2012-K20,Cl. C, 3.869%, 5/25/451,2 | | | | | 4,165,000 | | | | 4,122,876 | |
| Series 2013-K25,Cl. C, 3.743%, 11/25/451,2 | | | | | 135,000 | | | | 129,740 | |
| Series 2013-K26,Cl. C, 3.599%, 12/25/451,2 | | | | | 95,000 | | | | 90,161 | |
| Series 2013-K27,Cl. C, 3.616%, 1/25/461,2 | | | | | 1,460,000 | | | | 1,395,775 | |
| Series 2013-K28,Cl. C, 3.494%, 6/25/461,2 | | | | | 2,330,000 | | | | 2,208,743 | |
| Series 2013-K29,Cl. C, 3.481%, 5/25/461,2 | | | | | 2,300,000 | | | | 2,200,225 | |
| Series 2013-K502,Cl. C, 3.077%, 3/25/451,2 | | | | | 220,000 | | | | 220,360 | |
| Series 2013-K712,Cl. C, 3.365%, 5/25/451,2 | | | | | 265,000 | | | | 265,268 | |
| Series 2013-K713,Cl. C, 3.165%, 4/25/461,2 | | | | | 535,000 | | | | 525,191 | |
| Series 2014-K41,Cl. B, 3.961%, 11/25/471,2 | | | | | 2,365,000 | | | | 2,348,817 | |
| Series 2015-K44,Cl. B, 3.684%, 1/25/481,2 | | | | | 3,990,000 | | | | 3,849,584 | |
| Series 2015-K45,Cl. B, 3.591%, 4/25/481,2 | | | | | 4,646,000 | | | | 4,503,674 | |
| Series 2015-K721,Cl. B, 3.565%, 11/25/471,2 | | | | | 1,380,000 | | | | 1,346,890 | |
| GSR Mortgage Loan Trust, Series 2005-AR4, Cl. 6A1, 3.209%, 7/25/352 | | | | | 19,742 | | | | 19,473 | |
JP Morgan Chase Commercial Mortgage Securities Trust: | |
| Series 2013-C10,Cl. AS, 3.372%, 12/15/47 | | | | | 855,000 | | | | 868,006 | |
| Series 2013-C16,Cl. AS, 4.517%, 12/15/46 | | | | | 820,000 | | | | 883,788 | |
| Series 2013-LC11,Cl. AS, 3.216%, 4/15/46 | | | | | 110,000 | | | | 110,480 | |
| Series 2014-C20,Cl. AS, 4.043%, 7/15/47 | | | | | 560,000 | | | | 585,040 | |
| JP Morgan Mortgage Trust, Series 2007-A1, Cl. 5A1, 3.178%, 7/25/352 | | | | | 80,266 | | | | 80,458 | |
| JP Morgan Resecuritization Trust, Series 2009-5, Cl. 1A2, 3.08%, 7/26/361,2 | | | | | 4,190,075 | | | | 3,796,395 | |
JPMBB Commercial Mortgage Securities Trust: | |
| Series 2014-C19,Cl. AS, 4.243%, 4/15/472 | | | | | 350,000 | | | | 370,783 | |
| | | | | | | | | | |
| | | | | Principal Amount | | | Value | |
Commercial (Continued) | | | | | |
| JPMBB Commercial Mortgage Securities Trust: (Continued) | |
| Series 2014-C21,Cl. D, 4.66%, 8/15/471,2 | | | | $ | 3,703,000 | | | $ | 2,996,757 | |
| Series 2014-C25,Cl. AS, 4.065%, 11/15/47 | | | | | 2,245,000 | | | | 2,349,481 | |
| Series 2014-C26,Cl. AS, 3.80%, 1/15/48 | | | | | 1,250,000 | | | | 1,285,338 | |
| JPMDB Commercial Mortgage Securities Trust, Series 2016-C4, Cl. AS, 3.385%, 12/15/49 | | | | | 610,000 | | | | 607,548 | |
| Morgan Stanley Bank of America Merrill Lynch Trust: | |
| Series 2013-C9,Cl. AS, 3.456%, 5/15/46 | | | | | 570,000 | | | | 576,692 | |
| Series 2014-C14,Cl. B, 4.64%, 2/15/472 | | | | | 240,000 | | | | 256,866 | |
| Series 2014-C14,Cl. D, 4.83%, | | | | | | | | | | |
| 2/15/471,2 | | | | | 5,060,000 | | | | 4,461,540 | |
| Series 2016-C30,Cl. AS, 3.175%, 9/15/49 | | | | | 1,020,000 | | | | 986,644 | |
| Morgan Stanley Re-Remic Trust, Series 2012- R3, Cl. 1A, 2.615%, 11/26/361,2 | | | | | 19,366 | | | | 19,053 | |
| Morgan Stanley Resecuritization Trust, Series 2013-R9, Cl. 3A, 2.756%, 6/26/461,2 | | | | | 189,134 | | | | 188,980 | |
| Structured Adjustable Rate Mortgage Loan Trust, Series 2004-10, Cl. 2A, 3.032%, 8/25/342 | | | | | 3,507,935 | | | | 3,513,189 | |
| Structured Agency Credit Risk Debt Nts.: | |
| Series 2013-DN1,Cl. M1, 4.156%, 7/25/232 | | | | | 580,284 | | | | 589,178 | |
| Series 2014-DN1,Cl. M1, 1.756%, 2/25/242 | | | | | 44,395 | | | | 44,413 | |
| Series 2014-DN4,Cl. M3, 5.306%, 10/25/242 | | | | | 4,980,000 | | | | 5,333,608 | |
| Series 2014-HQ2,Cl. M1, 2.206%, 9/25/242 | | | | | 126,454 | | | | 126,924 | |
| Series 2014-HQ2,Cl. M3, 4.506%, 9/25/242 | | | | | 5,430,000 | | | | 5,676,077 | |
Series 2015-DNA3,Cl. M1, 2.106%, 4/25/282 | | | | | 41,999 | | | | 42,020 | |
| Series 2015-DNA3,Cl. M3, 5.456%, 4/25/282 | | | | | 3,815,000 | | | | 4,130,951 | |
| Series 2015-HQA2,Cl. M2, 3.556%, 5/25/282 | | | | | 600,000 | | | | 616,111 | |
| Series 2016-DNA2,Cl. M1, 2.006%, 10/25/282 | | | | | 716,568 | | | | 717,516 | |
| Series 2016-DNA2,Cl. M3, 5.406%, 10/25/282 | | | | | 3,674,000 | | | | 3,921,301 | |
| Series 2016-DNA3,Cl. M1, 1.856%, 12/25/282 | | | | | 723,088 | | | | 724,808 | |
| Series 2016-DNA3,Cl. M3, 5.756%, 12/25/282 | | | | | 2,630,000 | | | | 2,845,687 | |
| Series 2016-DNA4,Cl. M1, 1.556%, 3/25/292 | | | | | 460,083 | | | | 459,998 | |
| Series 2016-DNA4,Cl. M3, 4.556%, 3/25/292 | | | | | 4,645,000 | | | | 4,660,547 | |
| Series 2016-HQA2,Cl. M1, 1.956%, 11/25/282 | | | | | 495,332 | | | | 495,924 | |
| Series 2016-HQA3,Cl. M1, 1.556%, 3/25/292 | | | | | 598,844 | | | | 599,561 | |
| Series 2016-HQA3,Cl. M3, 4.606%, 3/25/292 | | | | | 4,620,000 | | | | 4,627,233 | |
| Series 2016-HQA4,Cl. M1, 1.556%, 4/25/292 | | | | | 1,026,569 | | | | 1,025,338 | |
| UBS-Barclays Commercial Mortgage Trust, Series 2012-C2, Cl. E, 4.885%, 5/10/631,2 | | | | | 930,000 | | | | 890,330 | |
| Washington Mutual Mortgage Pass-Through Certificates Trust, Series 2007-OA3, Cl. 5A, 1.848%, 4/25/472 | | | | | 421,655 | | | | 347,458 | |
| Wells Fargo Commercial Mortgage Trust: | |
| Series 2015-C29,Cl. AS, 4.013%, 6/15/482 | | | | | 780,000 | | | | 801,227 | |
| Series 2016-C37,Cl. AS, 4.018%, 12/15/49 | | | | | 910,000 | | | | 939,996 | |
11 OPPENHEIMER GLOBAL STRATEGIC INCOME FUND/VA
| | | | | | | | | | |
| | | | | Principal Amount | | | Value | |
Commercial (Continued) | | | | | | | | | | |
| WF-RBS Commercial Mortgage Trust: | |
| Series 2012-C7,Cl. E, 4.835%, 6/15/451,2 | | | | $ | 180,000 | | | $ | 169,568 | |
| Series 2013-C14,Cl. AS, 3.488%, 6/15/46 | | | | | 640,000 | | | | 652,575 | |
| Series 2014-C20,Cl. AS, 4.176%, 5/15/47 | | | | | 490,000 | | | | 516,657 | |
| Series 2014-LC14,Cl. AS, 4.351%, 3/15/472 | | | | | 395,000 | | | | 419,781 | |
| WF-RBS Commercial Mortgage Trust, Interest-Only Commercial Mtg. Pass-Through Certificates, Series 2011-C3, Cl. XA, 0.00%, 3/15/441,3,4 | | | | | 3,918,298 | | | | 168,197 | |
| | | | | | | | | 109,143,768 | |
| | | | | | | | | | | |
Residential—3.1% | | | | | | | | | | |
| Bear Stearns ARM Trust: | |
| Series 2005-2,Cl. A1, 2.92%, 3/25/352 | | | | | 124,353 | | | | 125,262 | |
| Series 2006-1,Cl. A1, 2.91%, 2/25/362 | | | | | 68,511 | | | | 68,128 | |
| CHL Mortgage Pass-Through Trust: | |
| Series 2005-17,Cl. 1A8, 5.50%, 9/25/35 | | | | | 847,917 | | | | 845,460 | |
| Series 2005-J4,Cl. A7, 5.50%, 11/25/35 | | | | | 719,983 | | | | 709,446 | |
| Citigroup Mortgage Loan Trust, Inc.: | |
| Series 2005-2,Cl. 1A3, 3.074%, 5/25/352 | | | | | 1,034,956 | | | | 1,023,651 | |
| Series 2005-3,Cl. 2A4, 3.225%, 8/25/352 | | | | | 1,887,482 | | | | 1,574,740 | |
| Series 2006-AR1,Cl. 1A1, 2.87%, 10/25/352 | | | | | 8,803 | | | | 8,788 | |
| Series 2009-8,Cl. 7A2, 3.003%, 3/25/361,2 | | | | | 10,353,846 | | | | 9,753,427 | |
| Series 2012-8,Cl. 1A1, 3.108%, 10/25/351,2 | | | | | 296,620 | | | | 296,293 | |
| Series 2014-8,Cl. 1A2, 1.029%, 7/20/361,2 | | | | | 3,400,000 | | | | 2,875,158 | |
| Connecticut Avenue Securities: | |
| Series 2014-C01,Cl. M1, 2.356%, 1/25/242 | | | | | 69,046 | | | | 69,422 | |
| Series 2014-C02,Cl. 2M1, 1.706%, 5/25/242 | | | | | 282,152 | | | | 282,578 | |
| Series 2014-C03,Cl. 1M1, 1.956%, 7/25/242 | | | | | 835,432 | | | | 837,694 | |
| Series 2014-C03,Cl. 2M1, 1.956%, 7/25/242 | | | | | 358,788 | | | | 359,185 | |
| Series 2014-C03,Cl. 2M2, 3.656%, 7/25/242 | | | | | 4,495,000 | | | | 4,517,669 | |
| Series 2014-C04,Cl. 2M1, 2.856%, 11/25/242 | | | | | 7,136 | | | | 7,140 | |
| Series 2015-C01,Cl. 1M2, 5.056%, 2/25/252 | | | | | 2,474,726 | | | | 2,605,018 | |
| Series 2015-C02,Cl. 1M1, 1.906%, 5/25/252 | | | | | 36,260 | | | | 36,266 | |
| Series 2015-C03,Cl. 1M1, 2.256%, 7/25/252 | | | | | 249,653 | | | | 250,134 | |
| Series 2015-C03,Cl. 1M2, 5.756%, 7/25/252 | | | | | 4,490,000 | | | | 4,845,172 | |
| Series 2015-C03,Cl. 2M1, 2.256%, 7/25/252 | | | | | 73,222 | | | | 73,375 | |
| Series 2016-C02,Cl. 1M1, 2.906%, 9/25/282 | | | | | 544,591 | | | | 550,374 | |
| Series 2016-C03,Cl. 1M1, 2.756%, 10/25/282 | | | | | 14,470 | | | | 14,670 | |
| Series 2016-C03,Cl. 2M1, 2.956%, 10/25/282 | | | | | 831,931 | | | | 840,716 | |
| Series 2016-C06,Cl. 1M1, 2.056%, 4/25/292 | | | | | 906,341 | | | | 908,464 | |
| Series 2016-C06,Cl. 1M2, 5.006%, 4/25/292 | | | | | 4,295,000 | | | | 4,441,480 | |
| Series 2016-C07,Cl. 2M1, 2.056%, 4/25/292 | | | | | 520,000 | | | | 517,332 | |
| | | | | | | | | | |
| | | | | Principal Amount | | | Value | |
Residential (Continued) | | | | | | | | | | |
| CWHEQ Revolving Home Equity Loan Trust: | |
| Series 2005-G,Cl. 2A, 0.934%, 12/15/352 | | | | $ | 46,906 | | | $ | 41,797 | |
| Series 2006-H,Cl. 2A1A, 0.854%, 11/15/362 | | | | | 28,211 | | | | 20,974 | |
| Home Equity Mortgage Trust, Series 2005-1, Cl. M6, 5.863%, 6/25/352 | | | | | 287,331 | | | | 290,109 | |
| HomeBanc Mortgage Trust, Series 2005-3, Cl. A2, 1.066%, 7/25/352 | | | | | 8,905 | | | | 8,773 | |
| MASTR Asset Backed Securities Trust, Series 2006-WMC3, Cl. A3, 0.856%, 8/25/362 | | | | | 933,527 | | | | 439,583 | |
| RALI Trust: | | | | | | | | | | |
| Series 2005-QA4,Cl. A32, 3.51%, 4/25/352 | | | | | 6,139 | | | | 196 | |
| Series 2006-QS13,Cl. 1A8, 6.00%, 9/25/36 | | | | | 17,578 | | | | 14,376 | |
| Residential Asset Securitization Trust, Series 2005-A6CB, Cl. A7, 6%, 6/25/35 | | | | | 2,303,911 | | | | 2,147,521 | |
| WaMu Mortgage Pass-Through Certificates Trust: | |
| Series 2003-AR10,Cl. A7, 2.825%, 10/25/332 | | | | | 88,932 | | | | 90,812 | |
| Series 2005-AR16,Cl. 1A1, 2.85%, 12/25/352 | | | | | 12,196 | | | | 11,488 | |
| Wells Fargo Mortgage-Backed Securities Trust: | |
| Series 2005-AR1,Cl. 1A1, 2.807%, 2/25/352 | | | | | 1,414,090 | | | | 1,436,429 | |
| Series 2005-AR10,Cl. 1A1, 3.022%, 6/25/352 | | | | | 644,477 | | | | 670,415 | |
| Series 2005-AR13,Cl. 1A5, 3.058%, 5/25/352 | | | | | 137,538 | | | | 137,937 | |
| Series 2005-AR15,Cl. 1A2, 2.983%, 9/25/352 | | | | | 225,761 | | | | 219,708 | |
| Series 2005-AR15,Cl. 1A6, 2.983%, 9/25/352 | | | | | 2,779,905 | | | | 2,644,008 | |
| Series 2005-AR4,Cl. 2A2, 3.067%, 4/25/352 | | | | | 13,299 | | | | 13,314 | |
| Series 2006-AR10,Cl. 1A1, 3.027%, 7/25/362 | | | | | 233,701 | | | | 225,026 | |
| | | |
| Series 2006-AR10,Cl. 5A5, 3.08%, 7/25/362 | | | | | 474,375 | | | | 467,563 | |
| Series 2006-AR14,Cl. 1A2, 3.062%, 10/25/362 | | | | | 988,603 | | | | 925,876 | |
| Series 2006-AR2,Cl. 2A3, 3.003%, 3/25/362 | | | | | 2,231,891 | | | | 2,195,046 | |
| Series 2006-AR7,Cl. 2A4, 3.089%, 5/25/362 | | | | | 1,203,826 | | | | 1,148,761 | |
| Series 2006-AR8,Cl. 2A1, 3.083%, 4/25/362 | | | | | 936,048 | | | | 923,314 | |
| Series 2007-AR3,Cl. A4, 5.949%, 4/25/372 | | | | | 693,407 | | | | 644,140 | |
| | | | | | | | | 53,154,208 | |
| Total Mortgage-Backed Obligations (Cost $270,391,670) | | | | 272,596,372 | |
| | | |
| | | | | | | | | | |
| U.S. Government Obligations—1.8% | |
| Federal Home Loan Bank Nts.: | |
| 1.25%, 1/16/19 | | | | | 5,275,000 | | | | 5,271,666 | |
| 1.375%, 11/15/19 | | | | | 2,698,000 | | | | 2,687,033 | |
| Federal National Mortgage Assn. Nts.: | |
| 1.00%, 10/24/19 | | | | | 5,325,000 | | | | 5,250,865 | |
| 1.875%, 9/24/26 | | | | | 1,371,000 | | �� | | 1,259,457 | |
| United States Treasury Nts.: | |
| 1.625%, 4/30/196,7 | | | | | 6,347,000 | | | | 6,395,834 | |
| 1.75%, 10/31/206,7,17 | | | | | 9,509,000 | | | | 9,522,294 | |
| 2.50%, 8/15/236 | | | | | 735,000 | | | | 747,275 | |
| Total U.S. Government Obligations (Cost $31,397,311) | | | | 31,134,424 | |
12 OPPENHEIMER GLOBAL STRATEGIC INCOME FUND/VA
| | | | | | | | | | |
| | | | | Principal Amount | | | Value | |
Foreign Government Obligations—7.0% | |
Argentina—0.3% | | | | | | | | | | |
| Argentine Republic Sr. Unsec. Bonds: | |
| 7.50%, 4/22/261 | | | | $ | 3,550,000 | | | $ | 3,736,375 | |
| 7.875%, 6/15/271 | | | | | 595,000 | | | | 588,276 | |
| Argentine Republic Sr. Unsec. Nts., 9.125%, 3/16/241 | | | | | 1,130,000 | | | | 1,232,265 | |
| | | | | | | | | 5,556,916 | |
| | | | | | | | | | | |
| Brazil—0.6% | | | | | | | | | | |
| Federative Republic of Brazil Nota Do Tesouro Nacional Unsec. Nts., 6%, 5/15/21 | | BRL | | | 8,000,000 | | | | 7,338,303 | |
| Federative Republic of Brazil Sr. Unsec. Bonds, 5%, 1/27/45 | | | | | 3,265,000 | | | | 2,664,893 | |
| | | | | | | | | 10,003,196 | |
| | | | | | | | | | | |
| Colombia—0.3% | | | | | | | | | | |
| Republic of Colombia Sr. Unsec. Bonds: | |
| 4.00%, 2/26/24 | | | | | 385,000 | | | | 389,813 | |
| 6.125%, 1/18/41 | | | | | 2,725,000 | | | | 2,956,625 | |
| Series B, 10.00%, 7/24/24 | | COP | | | 5,146,000,000 | | | | 2,027,810 | |
| | | | | | | | | 5,374,248 | |
| | | | | | | | | | | |
| Costa Rica—0.0% | | | | | | | | | | |
| Republic of Costa Rica Sr. Unsec. Bonds, 7.158%, 3/12/451 | | | | | 815,000 | | | | 758,610 | |
| | | | | | | | | | | |
| Croatia—0.1% | | | | | | | | | | |
| Republic of Croatia Sr. Unsec. Bonds, 6.75%, 11/5/191 | | | | | 985,000 | | | | 1,071,188 | |
| Republic of Croatia Sr. Unsec. Nts., 3.875%, 5/30/22 | | EUR | | | 1,145,000 | | | | 1,298,004 | |
| | | | | | | | | 2,369,192 | |
| | | | | | | | | | | |
| Dominican Republic—0.2% | | | | | |
| Dominican Republic Sr. Unsec. Bonds: | |
| 6.60%, 1/28/241 | | | | | 1,015,000 | | | | 1,063,212 | |
| 6.85%, 1/27/451 | | | | | 1,315,000 | | | | 1,248,882 | |
| 7.45%, 4/30/441 | | | | | 540,000 | | | | 548,100 | |
| | | | | | | | | 2,860,194 | |
| | | | | | | | | | | |
| Gabon—0.0% | | | | | | | | | | |
| Gabonese Republic Unsec. Bonds, 6.375%, 12/12/241 | | | | | 110,000 | | | | 102,955 | |
| | | | | | | | | | | |
| Ghana—0.0% | | | | | | | | | | |
| Republic of Ghana Sr. Unsec. International Nts., 9.25%, 9/15/221 | | | | | 345,000 | | | | 370,018 | |
| | | | | | | | | | | |
| Honduras—0.1% | | | | | | | | | | |
| Republic of Honduras Sr. Unsec. International Nts., 8.75%, 12/16/201 | | | | | 1,155,000 | | | | 1,291,752 | |
| | | | | | | | | | | |
| Hungary—0.3% | | | | | | | | | | |
| Hungary Sr. Unsec. Bonds, 5.75%, 11/22/23 | | | | | 2,245,000 | | | | 2,493,578 | |
| Hungary Unsec. Nts., Series 20/B, 3.50%, 6/24/20 | | HUF | | | 535,000,000 | | | | 1,966,420 | |
| | | | | | | | | 4,459,998 | |
| | | | | | | | | | | |
| Indonesia—1.6% | | | | | | | | | | |
| Perusahaan Penerbit SBSN Indonesia III Sr. Unsec. Nts., 4%, 11/21/181 | | | | | 860,000 | | | | 892,250 | |
| Perusahaan Penerbit SBSN Indonesia III Unsec. Bonds: | |
| 4.35%, 9/10/241 | | | | | 575,000 | | | | 579,341 | |
| 4.55%, 3/29/261 | | | | | 965,000 | | | | 972,238 | |
| Perusahaan Penerbit SBSN Indonesia III Unsec. Nts., 6.125%, 3/15/191 | | | | | 1,920,000 | | | | 2,076,096 | |
| Republic of Indonesia Sr. Unsec. Bonds: | |
| 3.375%, 7/30/251 | | EUR | | | 290,000 | | | | 313,242 | |
| 3.75%, 6/14/281 | | EUR | | | 485,000 | | | | 520,036 | |
| 4.125%, 1/15/251 | | | | | 340,000 | | | | 337,735 | |
| 5.875%, 3/13/201 | | | | | 360,000 | | | | 393,722 | |
| 6.75%, 1/15/441 | | | | | 1,885,000 | | | | 2,286,235 | |
| | | | | | | | | | |
| | | | | Principal Amount | | | Value | |
Indonesia (Continued) | |
| Republic of Indonesia Sr. Unsec. Nts., 3.70%, 1/8/221 | | | | $ | 720,000 | | | $ | 723,418 | |
| Republic of Indonesia Treasury Bonds: | |
| Series FR53, 8.25%, 7/15/21 | | IDR | | | 112,775,000,000 | | | | 8,596,372 | |
| Series FR56, 8.375%, 9/15/26 | | IDR | | | 95,810,000,000 | | | | 7,329,115 | |
| Series FR73, 8.75%, 5/15/31 | | IDR | | | 16,051,000,000 | | | | 1,242,918 | |
| | | | | | | | | 26,262,718 | |
| | | | | | | | | | | |
| Iraq—0.0% | | | | | | | | | | |
| Republic of Iraq Unsec. Bonds, 5.80%, 1/15/281 | | | | | 540,000 | | | | 450,039 | |
| | | | | | | | | | | |
| Ivory Coast—0.3% | | | | | | | | | | |
| Republic of Cote d’Ivoire Sr. Unsec. Bonds, 5.75%, 12/31/322 | | | | | 6,108,300 | | | | 5,673,688 | |
| | | | | | | | | | | |
| Jamaica—0.2% | | | | | | | | | | |
| Commonwealth of Jamaica Sr. Unsec. Bonds: | |
| 7.625%, 7/9/25 | | | | | 1,915,000 | | | | 2,194,188 | |
| 8.00%, 3/15/39 | | | | | 385,000 | | | | 429,487 | |
| | | | | | | | | 2,623,675 | |
| | | | | | | | | | | |
| Kazakhstan—0.1% | | | | | | | | | | |
| Republic of Kazakhstan Sr. Unsec. Bonds, 4.875%, 10/14/441 | | | | | 2,110,000 | | | | 2,019,895 | |
| | | | | | | | | | | |
| Kenya—0.1% | | | | | | | | | | |
| Republic of Kenya Sr. Unsec. Bonds, 6.875%, 6/24/241 | | | | | 1,260,000 | | | | 1,195,667 | |
| | | | | | | | | | | |
| Mexico—0.1% | | | | | | | | | | |
| United Mexican States Sr. Unsec. Bonds, Series M, 5.75%, 3/5/26 | | MXN | | | 54,445,000 | | | | 2,334,343 | |
| | | | | | | | | | | |
| Namibia—0.1% | | | | | | | | | | |
| Republic of Namibia Sr. Unsec. Bonds, 5.25%, 10/29/251 | | | | | 1,155,000 | | | | 1,135,180 | |
| | | | | | | | | | | |
| Paraguay—0.0% | | | | | | | | | | |
| Republic of Paraguay Sr. Unsec. Bonds, 6.10%, 8/11/441 | | | | | 575,000 | | | | 586,500 | |
| | | | | | | | | | | |
| Peru—0.2% | | | | | | | | | | |
| Republic of Peru Sr. Unsec. Bonds: | |
| 2.75%, 1/30/26 | | EUR | | | 1,290,000 | | | | 1,469,947 | |
| 3.75%, 3/1/30 | | EUR | | | 470,000 | | | | 559,632 | |
| 4.125%, 8/25/27 | | | | | 840,000 | | | | 876,750 | |
| 5.625%, 11/18/50 | | | | | 600,000 | | | | 681,000 | |
| | | | | | | | | 3,587,329 | |
| | | | | | | | | | | |
| Romania—0.2% | | | | | | | | | | |
| Romania Sr. Unsec. Bonds: | | | | | | | | | | |
| 2.75%, 10/29/251 | | EUR | | | 980,000 | | | | 1,078,800 | |
| 3.875%, 10/29/351 | | EUR | | | 305,000 | | | | 338,761 | |
| 4.875%, 1/22/241 | | | | | 1,120,000 | | | | 1,188,701 | |
| | | | | | | | | 2,606,262 | |
| | | | | | | | | | | |
| Russia—0.4% | | | | | | | | | | |
| Russian Federation Unsec. Nts., 7.50%, 8/18/21 | | RUB | | | 463,280,000 | | | | 7,394,959 | |
| | | | | | | | | | | |
| Senegal—0.0% | | | | | | | | | | |
| Republic of Senegal Unsec. Bonds, 6.25%, 7/30/241 | | | | | 540,000 | | | | 540,629 | |
| | | | | | | | | | | |
| Serbia—0.2% | | | | | | | | | | |
| Republic of Serbia Sr. Unsec. Nts., 5.25%, 11/21/171 | | | | | 1,005,000 | | | | 1,030,940 | |
| Republic of Serbia Unsec. Nts., 5.875%, 12/3/181 | | | | | 2,115,000 | | | | 2,216,262 | |
| | | | | | | | | 3,247,202 | |
| | | | | | | | | | | |
| South Africa—0.4% | | | | | | | | | | |
| Republic of South Africa Unsec. Bonds: Series 2037, 8.50%, 1/31/37 | | ZAR | | | 24,200,000 | | | | 1,586,068 | |
13 OPPENHEIMER GLOBAL STRATEGIC INCOME FUND/VA
| | | | | | | | | | |
| | | | | Principal Amount | | | Value | |
South Africa (Continued) | | | | | | | | | | |
Republic of South Africa Unsec. Bonds: (Continued) | |
| Series R186, 10.50%, 12/21/26 | | ZAR | | | 65,975,000 | | | $ | 5,298,440 | |
| | | | | | | | | | 6,884,508 | |
Sri Lanka—0.2% | | | | | | | | | | |
Democratic Socialist Republic of Sri Lanka Sr. Unsec. Bonds: | |
| 5.875%, 7/25/221 | | | | | 1,105,000 | | | | 1,089,553 | |
| 6.25%, 10/4/201 | | | | | 495,000 | | | | 509,235 | |
| 6.85%, 11/3/251 | | | | | 455,000 | | | | 449,100 | |
| Democratic Socialist Republic of Sri Lanka Sr. Unsec. Nts., 6%, 1/14/191 | | | | | 1,515,000 | | | | 1,561,370 | |
| | | | | | | | | | 3,609,258 | |
Turkey—0.2% | | | | | | | | | | |
Republic of Turkey Unsec. Nts., 8.80%, 11/14/18 | | TRY | | | 10,570,000 | | | | 2,924,290 | |
Ukraine—0.5% | | | | | | | | | | |
Ukraine Sr. Unsec. Nts., 7.75%, 9/1/19 | | | | | 8,450,000 | | | | 8,522,163 | |
Uruguay—0.2% | | | | | | | | | | |
Oriental Republic of Uruguay
Sr. Unsec. Bonds, 5.10%, 6/18/50 | | | | 2,810,000 | | | 2,536,025 | |
Vietnam—0.1% | | | | | | | | | | |
| Socialist Republic of Vietnam Sr. Unsec. Bonds, 4.80%, 11/19/241 | | | | | 1,065,000 | | | | 1,052,865 | |
Total Foreign Government Obligations (Cost $120,019,033) | | | | 118,334,274 | |
| | | |
| | | | | | | | | | |
| Corporate Loans—0.1% | | | | | | | | | | |
| Affinion Group, Inc., Sr. Sec. Credit Facilities 1st Lien Term Loan, Tranche B, 6.75%, 4/30/182 | | | | | 781,283 | | | | 777,946 | |
| Caesars Entertainment Resort Properties LLC, Sr. Sec. Credit Facilities 1st Lien Term Loan, Tranche B, 7.00%, 10/11/202 | | | | | 941,010 | | | | 952,302 | |
| Pharmaceutical Product Development LLC, Sr. Sec. Credit Facilities 1st Lien Term Loan, Tranche D, 4.25%, 8/18/222 | | | | | 762,261 | | | | 770,836 | |
| Total Corporate Loans (Cost $2,483,172) | | | | 2,501,084 | |
| | | |
| | | | | | | | | | |
| Corporate Bonds and Notes—46.5% | |
Consumer Discretionary—8.9% | |
Auto Components—0.5% | |
| BorgWarner, Inc., 4.375% Sr. Unsec. Nts., 3/15/45 | | | | | 192,000 | | | | 184,916 | |
| Dana Financing Luxembourg Sarl, 6.50% Sr. Unsec. Nts., 6/1/261 | | | | | 1,245,000 | | | | 1,304,137 | |
| Gates Global LLC/Gates Global Co., 6% Sr. Unsec. Nts., 7/15/221 | | | | | 1,075,000 | | | | 1,056,725 | |
Goodyear Tire & Rubber Co. (The): 5.00% Sr. Unsec. Nts., 5/31/26 | | | | | 665,000 | | | | 663,630 | |
| 5.125% Sr. Unsec. Nts., 11/15/23 | | | | | 1,815,000 | | | | 1,878,525 | |
| Grinding Media, Inc./MC Grinding Media Canada, Inc., 7.375% Sr. Sec. Nts., 12/15/231 | | | | | 505,000 | | | | 531,816 | |
| MPG Holdco I, Inc., 7.375% Sr. Unsec. Nts., 10/15/22 | | | | | 2,490,000 | | | | 2,614,500 | |
| Tenneco, Inc., 5% Sr. Unsec. Nts., 7/15/26 | | | | | 495,000 | | | | 486,956 | |
| | | | | | | | | | 8,721,205 | |
Automobiles—0.6% | | | | | | | | | | |
Daimler Finance North America LLC: | |
| 1.50% Sr. Unsec. Nts., 7/5/191 | | | | | 861,000 | | | | 847,058 | |
| 8.50% Sr. Unsec. Unsub. Nts., 1/18/31 | | | | | 485,000 | | | | 730,260 | |
| Ford Motor Credit Co. LLC, 3.664% Sr. Unsec. Nts., 9/8/24 | | | | | 2,067,000 | | | | 2,017,789 | |
General Motors Co.: | |
| 5.00% Sr. Unsec. Nts., 4/1/35 | | | | | 1,705,000 | | | | 1,665,052 | |
| 6.25% Sr. Unsec. Nts., 10/2/43 | | | | | 820,000 | | | | 908,044 | |
| | | | | | | | | | |
| | | | | Principal Amount | | | Value | |
Automobiles (Continued) | | | | | | | | | | |
| General Motors Financial Co., Inc., 3% Sr. Unsec. Nts., 9/25/17 | | | | $ | 616,000 | | | $ | 621,985 | |
| Harley-Davidson, Inc., 4.625% Sr. Unsec. Nts., 7/28/45 | | | | | 258,000 | | | | 254,959 | |
| Hyundai Capital America, 2.40% Sr. Unsec. Nts., 10/30/181 | | | | | 624,000 | | | | 626,648 | |
| Nissan Motor Acceptance Corp.: | | | | | | | | | | |
| 1.55% Sr. Unsec. Nts., 9/13/191 | | | | | 234,000 | | | | 230,455 | |
| 2.00% Sr. Unsec. Nts., 3/8/191 | | | | | 645,000 | | | | 643,538 | |
| Volkswagen Group of America Finance LLC, 1.60% Sr. Unsec. Nts., 11/20/171 | | | | | 976,000 | | | | 973,143 | |
| ZF North America Capital, Inc., 4.75% Sr. Unsec. Nts., 4/29/251 | | | | | 926,000 | | | | 945,678 | |
| | | | | | | | | | 10,464,609 | |
Distributors—0.1% | | | | | | | | | | |
LKQ Corp., 4.75% Sr. Unsec. Nts., 5/15/23 | | | | | 2,172,000 | | | | 2,172,000 | |
Diversified Consumer Services—0.1% | |
Service Corp. International, 5.375% Sr. Unsec. Nts., 5/15/24 | | | | | 813,000 | | | | 851,617 | |
Hotels, Restaurants & Leisure—2.0% | |
| 1011778 B.C. ULC/New Red Finance, Inc., 6% Sec. Nts., 4/1/221 | | | | | 2,285,000 | | | | 2,393,538 | |
| Aramark Services, Inc., 4.75% Sr. Unsec. Nts., 6/1/261 | | | | | 745,000 | | | | 739,412 | |
| Boyd Gaming Corp.: | | | | | | | | | | |
| 6.375% Sr. Unsec. Nts., 4/1/261 | | | | | 235,000 | | | | 254,270 | |
| 6.875% Sr. Unsec. Nts., 5/15/23 | | | | | 1,400,000 | | | | 1,510,250 | |
| Caesars Entertainment Resort Properties LLC, 11% Sec. Nts., 10/1/21 | | | | | 835,000 | | | | 916,412 | |
| Caesars Growth Properties Holdings LLC/Caesars Growth Properties Finance, Inc., 9.375% Sec. Nts., 5/1/22 | | | | | 830,000 | | | | 898,475 | |
| CEC Entertainment, Inc., 8% Sr. Unsec. Nts., 2/15/22 | | | | | 230,000 | | | | 235,750 | |
| Churchill Downs, Inc., 5.375% Sr. Unsec. Nts., 12/15/21 | | | | | 1,770,000 | | | | 1,845,225 | |
| Greektown Holdings LLC/Greektown Mothership Corp., 8.875% Sec. Nts., 3/15/191 | | | | | 2,005,000 | | | | 2,117,781 | |
| Hilton Domestic Operating Co., Inc., 4.25% Sr. Unsec. Nts., 9/1/241 | | | | | 500,000 | | | | 487,500 | |
| Hilton Grand Vacations Borrower LLC/Hilton Grand Vacations Borrower, Inc., 6.125% Sr. Unsec. Nts., 12/1/241 | | | | | 1,260,000 | | | | 1,315,125 | |
| Hilton Worldwide Finance LLC/Hilton Worldwide Finance Corp., 5.625% Sr. Unsec. Nts., 10/15/21 | | | | | 140,000 | | | | 144,629 | |
| International Game Technology plc, 6.25% Sr. Sec. Nts., 2/15/221 | | | | | 2,100,000 | | | | 2,262,750 | |
| Isle of Capri Casinos, Inc., 5.875% Sr. Unsec. Nts., 3/15/21 | | | | | 970,000 | | | | 1,004,556 | |
KFC Holding Co./Pizza Hut Holdings LLC/ Taco Bell of America LLC: | |
| 5.00% Sr. Unsec. Nts., 6/1/241 | | | | | 1,245,000 | | | | 1,274,569 | |
| 5.25% Sr. Unsec. Nts., 6/1/261 | | | | | 995,000 | | | | 1,012,413 | |
| Landry’s, Inc., 6.75% Sr. Unsec. Nts., 10/15/241 | | | | | 2,510,000 | | | | 2,553,925 | |
| Marriott International, Inc.: | | | | | | | | | | |
| 3.25% Sr. Unsec. Nts., 9/15/22 | | | | | 388,000 | | | | 391,319 | |
| 6.375% Sr. Unsec. Nts., 6/15/17 | | | | | 561,000 | | | | 573,230 | |
| McDonald’s Corp., 2.75% Sr. Unsec. Nts., 12/9/20 | | | | | 387,000 | | | | 393,077 | |
| MCE Finance Ltd., 5% Sr. Unsec. Nts., 2/15/211 | | | | | 1,080,000 | | | | 1,078,519 | |
| MGM Growth Properties Operating Partnership LP/MGP Escrow Co.-Issuer, Inc., 5.625% Sr. Unsec. Nts., 5/1/241 | | | | | 1,230,000 | | | | 1,291,500 | |
14 OPPENHEIMER GLOBAL STRATEGIC INCOME FUND/VA
| | | | | | | | | | |
| | | | | Principal Amount | | | Value | |
Hotels, Restaurants & Leisure (Continued) | |
| MGM Resorts International: | |
| 6.00% Sr. Unsec. Nts., 3/15/23 | | | | $ | 1,250,000 | | | $ | 1,353,125 | |
| 6.625% Sr. Unsec. Nts., 12/15/21 | | | | | 1,155,000 | | | | 1,293,600 | |
| Mohegan Tribal Gaming Authority, 7.875% Sr. Unsec. Nts., 10/15/241 | | | | | 780,000 | | | | 798,525 | |
| PF Chang’s China Bistro, Inc., 10.25% Sr. Unsec. Nts., 6/30/201 | | | | | 550,000 | | | | 540,375 | |
| Premier Cruises Ltd., 11% Sr. Unsec. Nts., 3/15/081,8 | | | | | 250,000 | | | | — | |
| Scientific Games International, Inc., 10% Sr. Unsec. Nts., 12/1/22 | | | | | 785,000 | | | | 785,000 | |
| Six Flags Entertainment Corp., 4.875% Sr. Unsec. Nts., 7/31/241 | | | | | 500,000 | | | | 495,000 | |
| Sugarhouse HSP Gaming Prop Mezz LP/ Sugarhouse HSP Gaming Finance Corp., 6.375% Sr. Sec. Nts., 6/1/211 | | | | | 560,000 | | | | 561,400 | |
| Viking Cruises Ltd., 8.50% Sr. Unsec. Nts., 10/15/221 | | | | | 2,235,000 | | | | 2,327,194 | |
| | | | | | | | | 32,848,444 | |
| | | | | | | | | | | |
Household Durables—1.0% | | | | | | | | | | |
| Ardagh Packaging Finance plc/Ardagh Holdings USA, Inc., 7.25% Sr. Unsec. Nts., 5/15/241 | | | | | 1,235,000 | | | | 1,306,012 | |
| Beazer Homes USA, Inc.: | |
| 7.25% Sr. Unsec. Nts., 2/1/23 | | | | | 870,000 | | | | 887,400 | |
| 8.75% Sr. Unsec. Nts., 3/15/221 | | | | | 785,000 | | | | 849,762 | |
| KB Home: | | | | | | | | | | |
| 7.00% Sr. Unsec. Nts., 12/15/21 | | | | | 1,100,000 | | | | 1,166,000 | |
| 7.625% Sr. Unsec. Nts., 5/15/23 | | | | | 1,075,000 | | | | 1,131,437 | |
| Lennar Corp.: | | | | | | | | | | |
| 4.75% Sr. Unsec. Nts., 11/15/22 | | | | | 400,000 | | | | 412,000 | |
| 4.75% Sr. Unsec. Nts., 5/30/25 | | | | | 2,498,000 | | | | 2,448,040 | |
| Meritage Homes Corp., 7.15% Sr. Unsec. Nts., 4/15/20 | | | | | 770,000 | | | | 839,300 | |
| Newell Brands, Inc.: | | | | | | | | | | |
| 2.15% Sr. Unsec. Nts., 10/15/18 | | | | | 386,000 | | | | 388,013 | |
| 5.00% Sr. Unsec. Nts., 11/15/23 | | | | | 628,000 | | | | 673,607 | |
| 5.50% Sr. Unsec. Nts., 4/1/46 | | | | | 289,000 | | | | 331,911 | |
| PulteGroup, Inc.: | | | | | | | | | | |
| 4.25% Sr. Unsec. Nts., 3/1/21 | | | | | 495,000 | | | | 508,613 | |
| 5.00% Sr. Unsec. Nts., 1/15/27 | | | | | 970,000 | | | | 925,138 | |
| 5.50% Sr. Unsec. Nts., 3/1/26 | | | | | 740,000 | | | | 737,225 | |
| 6.00% Sr. Unsec. Nts., 2/15/35 | | | | | 80,000 | | | | 77,200 | |
| Standard Industries, Inc., 5.50% Sr. Unsec. Nts., 2/15/231 | | | | | 245,000 | | | | 254,825 | |
| Taylor Morrison Communities, Inc./ Monarch Communities, Inc., 5.875% Sr. Unsec. Nts., 4/15/231 | | | | | 1,060,000 | | | | 1,081,200 | |
| Toll Brothers Finance Corp., 4.375% Sr. Unsec. Nts., 4/15/23 | | | | | 1,929,000 | | | | 1,931,411 | |
| Whirlpool Corp., 1.65% Sr. Unsec. Nts., 11/1/17 | | | | | 280,000 | | | | 280,442 | |
| | | | | | | | | 16,229,536 | |
| | | | | | | | | | | |
Leisure Equipment & Products—0.1% | | | | | |
| Mattel, Inc., 1.70% Sr. Unsec. Nts., 3/15/18 | | | | | 647,000 | | | | 645,653 | |
| Proven Honour Capital Ltd., 4.125% Sr. Unsec. Nts., 5/6/26 | | | | | 900,000 | | | | 895,722 | |
| | | | | | | | | 1,541,375 | |
| | | | | | | | | | | |
Media—3.2% | | | | | |
| 21st Century Fox America, Inc., 4.75% Sr. Unsec. Nts., 11/15/461 | | | | | 377,000 | | | | 378,877 | |
| Altice Financing SA, 6.50% Sec. Nts., 1/15/221 | | | | | 2,435,000 | | | | 2,544,575 | |
| Altice Finco SA, 8.125% Sec. Nts., 1/15/241 | | | | | 1,260,000 | | | | 1,310,400 | |
| AMC Entertainment Holdings, Inc.: 5.75% Sr. Sub. Nts., 6/15/25 | | | | | 745,000 | | | | 765,487 | |
| | | | | | | | | | |
| | | | | Principal Amount | | | Value | |
Media (Continued) | |
| AMC Entertainment Holdings, Inc.: (Continued) | | | | | | | | | | |
| 5.875% Sr. Sub. Nts., 11/15/261 | | | | $ | 760,000 | | | $ | 779,000 | |
| Belo Corp., 7.75% Sr. Unsec. Nts., 6/1/27 | | | | | 1,202,000 | | | | 1,292,150 | |
| CCO Holdings LLC/CCO Holdings Capital Corp., 5.75% Sr. Unsec. Nts., 2/15/261 | | | | | 1,135,000 | | | | 1,177,562 | |
| Cequel Communications Holdings I LLC/ Cequel Capital Corp., 6.375% Sr. Unsec. Nts., 9/15/201 | | | | | 2,475,000 | | | | 2,555,437 | |
| Charter Communications Operating LLC/ Charter Communications Operating Capital: | | | | | | | | | | |
| 4.464% Sr. Sec. Nts., 7/23/22 | | | | | 417,000 | | | | 435,853 | |
| 6.484% Sr. Sec. Nts., 10/23/45 | | | | | 612,000 | | | | 708,761 | |
| Cinemark USA, Inc., 4.875% Sr. Unsec. Nts., 6/1/23 | | | | | 495,000 | | | | 503,662 | |
| Clear Channel Worldwide Holdings, Inc.: 6.50% Sr. Unsec. Nts., Series B, 11/15/22 | | | | | 2,455,000 | | | | 2,522,512 | |
| 7.625% Sr. Sub. Nts., Series B, 3/15/20 | | | | | 1,695,000 | | | | 1,700,288 | |
| Comcast Corp., 2.35% Sr. Unsec. Nts., 1/15/27 | | | | | 858,000 | | | | 792,774 | |
| CSC Holdings LLC: | | | | | | | | | | |
| 5.25% Sr. Unsec. Nts., 6/1/24 | | | | | 1,200,000 | | | | 1,176,000 | |
| 5.50% Sr. Unsec. Nts., 4/15/271 | | | | | 750,000 | | | | 761,250 | |
| 10.875% Sr. Unsec. Nts., 10/15/251 | | | | | 860,000 | | | | 1,025,550 | |
| DISH DBS Corp.: | | | | | | | | | | |
| 5.875% Sr. Unsec. Nts., 11/15/24 | | | | | 2,950,000 | | | | 3,046,613 | |
| 6.75% Sr. Unsec. Nts., 6/1/21 | | | | | 925,000 | | | | 1,005,938 | |
| 7.75% Sr. Unsec. Nts., 7/1/26 | | | | | 250,000 | | | | 282,500 | |
| Gray Television, Inc.: | | | | | | | | | | |
| 5.125% Sr. Unsec. Nts., 10/15/241 | | | | | 760,000 | | | | 737,200 | |
| 5.875% Sr. Unsec. Nts., 7/15/261 | | | | | 2,380,000 | | | | 2,368,100 | |
| iHeartCommunications, Inc., 9% Sr. Sec. Nts., 12/15/19 | | | | | 875,000 | | | | 718,594 | |
| Interpublic Group of Cos., Inc. (The), 4.20% Sr. Unsec. Nts., 4/15/24 | | | | | 283,000 | | | | 290,904 | |
| LIN Television Corp., 6.375% Sr. Unsec. Nts., 1/15/21 | | | | | 1,200,000 | | | | 1,243,500 | |
| Lions Gate Entertainment Corp., 5.875% Sr. Unsec. Nts., 11/1/241 | | | | | 2,000,000 | | | | 2,040,000 | |
| MDC Partners, Inc., 6.50% Sr. Unsec. Nts., 5/1/241 | | | | | 490,000 | | | | 443,450 | |
| Mediacom LLC/Mediacom Capital Corp., 7.25% Sr. Unsec. Nts., 2/15/22 | | | | | 1,465,000 | | | | 1,514,444 | |
| Nexstar Broadcasting, Inc., 6.125% Sr. Unsec. Nts., 2/15/221 | | | | | 755,000 | | | | 785,200 | |
| Nexstar Escrow Corp., 5.625% Sr. Unsec. Nts., 8/1/241 | | | | | 1,245,000 | | | | 1,238,775 | |
| SFR Group SA, 6% Sr. Sec. Nts., 5/15/221 | | | | | 2,540,000 | | | | 2,616,200 | |
| Sinclair Television Group, Inc.: | | | | | | | | | | |
| 5.625% Sr. Unsec. Nts., 8/1/241 | | | | | 1,845,000 | | | | 1,891,125 | |
| 6.125% Sr. Unsec. Nts., 10/1/22 | | | | | 740,000 | | | | 775,150 | |
| Sirius XM Radio, Inc.: | | | | | | | | | | |
| 5.375% Sr. Unsec. Nts., 7/15/261 | | | | | 995,000 | | | | 975,100 | |
| 6.00% Sr. Unsec. Nts., 7/15/241 | | | | | 245,000 | | | | 256,638 | |
| Sky plc: | | | | | | | | | | |
| 3.75% Sr. Unsec. Nts., 9/16/241 | | | | | 433,000 | | | | 434,569 | |
| 6.10% Sr. Unsec. Nts., 2/15/181 | | | | | 317,000 | | | | 330,802 | |
| TEGNA, Inc., 5.50% Sr. Unsec. Nts., 9/15/241 | | | | | 1,680,000 | | | | 1,703,100 | |
| Thomson Reuters Corp., 1.65% Sr. Unsec. Nts., 9/29/17 | | | | | 628,000 | | | | 628,791 | |
| Time Warner Cable LLC, 4.50% Sr. Unsec. Unsub. Nts., 9/15/42 | | | | | 438,000 | | | | 397,405 | |
| Time Warner, Inc.: | | | | | | | | | | |
| 2.95% Sr. Unsec. Nts., 7/15/26 | | | | | 462,000 | | | | 430,600 | |
| 3.875% Sr. Unsec. Nts., 1/15/26 | | | | | 200,000 | | | | 200,317 | |
15 OPPENHEIMER GLOBAL STRATEGIC INCOME FUND/VA
| | | | | | | | | | |
| | | | | Principal Amount | | | Value | |
Media (Continued) | |
| Tribune Media Co., 5.875% Sr. Unsec. Nts., 7/15/22 | | | | $ | 965,000 | | | $ | 983,094 | |
| Univision Communications, Inc.: | | | | | | | | | | |
| 5.125% Sr. Sec. Nts., 5/15/231 | | | | | 245,000 | | | | 242,244 | |
| 5.125% Sr. Sec. Nts., 2/15/251 | | | | | 2,045,000 | | | | 1,963,200 | |
| Viacom, Inc.: | | | | | | | | | | |
| 2.25% Sr. Unsec. Nts., 2/4/22 | | | | | 191,000 | | | | 179,522 | |
| 3.45% Sr. Unsec. Nts., 10/4/26 | | | | | 231,000 | | | | 213,607 | |
| 4.375% Sr. Unsec. Nts., 3/15/43 | | | | | 292,000 | | | | 233,008 | |
| Virgin Media Secured Finance plc: | |
| 5.25% Sr. Sec. Nts., 1/15/261 | | | | | 577,000 | | | | 571,951 | |
| 5.50% Sr. Sec. Nts., 8/15/261 | | | | | 705,000 | | | | 705,000 | |
| Ziggo Secured Finance BV, 5.50% Sr. Sec. Nts., 1/15/271 | | | | | 2,515,000 | | | | 2,457,910 | |
| | | | | | | | | | 54,334,689 | |
| Multiline Retail—0.1% | | | | | | | | | | |
Dollar Tree, Inc., 5.75% Sr. Sec. Nts., 3/1/23 | | | | | 2,149,000 | | | | 2,286,149 | |
| Specialty Retail—0.6% | | | | | | | | | | |
| AutoZone, Inc.: | | | | | | | | | | |
| 1.30% Sr. Unsec. Nts., 1/13/17 | | | | | 161,000 | | | | 161,006 | |
| 1.625% Sr. Unsec. Nts., 4/21/19 | | | | | 174,000 | | | | 172,466 | |
| Best Buy Co., Inc., 5.50% Sr. Unsec. Nts., 3/15/21 | | | | | 574,000 | | | | 630,815 | |
| CST Brands, Inc., 5% Sr. Unsec. Nts., 5/1/23 | | | | | 1,255,000 | | | | 1,302,062 | |
| GameStop Corp.: | | | | | | | | | | |
| 5.50% Sr. Unsec. Nts., 10/1/191 | | | | | 1,030,000 | | | | 1,058,325 | |
| 6.75% Sr. Unsec. Nts., 3/15/211 | | | | | 1,425,000 | | | | 1,439,250 | |
| Guitar Center, Inc., 6.50% Sr. Sec. Nts., 4/15/191 | | | | | 615,000 | | | | 561,187 | |
| L Brands, Inc.: | | | | | | | | | | |
| 5.625% Sr. Unsec. Nts., 2/15/22 | | | | | 324,000 | | | | 346,275 | |
| 6.625% Sr. Unsec. Nts., 4/1/21 | | | | | 1,085,000 | | | | 1,223,338 | |
| 6.875% Sr. Unsec. Nts., 11/1/35 | | | | | 1,595,000 | | | | 1,634,875 | |
| Lowe’s Cos., Inc., 3.70% Sr. Unsec. Nts., 4/15/46 | | | | | 414,000 | | | | 386,620 | |
| Ross Stores, Inc., 3.375% Sr. Unsec. Nts., 9/15/24 | | | | | 555,000 | | | | 559,118 | |
| Sally Holdings LLC/Sally Capital, Inc., 5.625% Sr. Unsec. Nts., 12/1/25 | | | | | 890,000 | | | | 930,050 | |
| Signet UK Finance plc, 4.70% Sr. Unsec. Nts., 6/15/24 | | | | | 480,000 | | | | 460,192 | |
| | | | | | | | | | 10,865,579 | |
| Textiles, Apparel & Luxury Goods—0.6% | |
| Hanesbrands, Inc.: | | | | | | | | | | |
| 4.625% Sr. Unsec. Nts., 5/15/241 | | | | | 425,000 | | | | 414,375 | |
| 4.875% Sr. Unsec. Nts., 5/15/261 | | | | | 1,143,000 | | | | 1,122,998 | |
| Levi Strauss & Co., 5% Sr. Unsec. Nts., 5/1/25 | | | | | 3,031,000 | | | | 3,046,155 | |
| PVH Corp., 4.50% Sr. Unsec. Unsub. Nts., 12/15/22 | | | | | 1,002,000 | | | | 1,022,040 | |
| Springs Industries, Inc., 6.25% Sr. Sec. Nts., 6/1/21 | | | | | 3,060,000 | | | | 3,182,400 | |
| William Carter Co. (The), 5.25% Sr. Unsec. Nts., 8/15/21 | | | | | 825,000 | | | | 859,031 | |
| | | | | | | | | | 9,646,999 | |
Consumer Staples—2.7% | | | | | | | | | | |
Beverages—0.4% | | | | | | | | | | |
| Anheuser-Busch InBev Finance, Inc.: | |
| 1.90% Sr. Unsec. Nts., 2/1/19 | | | | | 970,000 | | | | 971,667 | |
| 3.65% Sr. Unsec. Nts., 2/1/26 | | | | | 508,000 | | | | 515,890 | |
| 4.90% Sr. Unsec. Nts., 2/1/46 | | | | | 343,000 | | | | 369,747 | |
| Anheuser-Busch InBev Worldwide, Inc., 8.20% Sr. Unsec. Unsub. Nts., 1/15/39 | | | | | 390,000 | | | | 587,427 | |
| Beam Suntory, Inc., 1.875% Sr. Unsec. Nts., 5/15/17 | | | | | 305,000 | | | | 305,456 | |
| | | | | | | | | | |
| | | | | Principal Amount | | | Value | |
Beverages (Continued) | | | | | | | | | | |
| Constellation Brands, Inc., 4.75% Sr. Unsec. Nts., 11/15/24 | | | | $ | 915,000 | | | $ | 975,847 | |
| Molson Coors Brewing Co.: | | | | | | | | | | |
| 1.45% Sr. Unsec. Nts., 7/15/19 | | | | | 348,000 | | | | 342,928 | |
| 2.10% Sr. Unsec. Nts., 7/15/21 | | | | | 833,000 | | | | 811,394 | |
| 4.20% Sr. Unsec. Nts., 7/15/46 | | | | | 241,000 | | | | 225,153 | |
| Pernod Ricard SA: | | | | | | | | | | |
| 2.95% Sr. Unsec. Nts., 1/15/171 | | | | | 708,000 | | | | 708,386 | |
4.25% Sr. Unsec. Nts., 7/15/221 | | | | | 704,000 | | | | 736,766 | |
| | | | | | | | | | 6,550,661 | |
Food & Staples Retailing—0.8% | |
| Albertsons Cos. LLC/Safeway, Inc./ New Albertson’s, Inc./Albertson’s LLC, 6.625% Sr. Unsec. Nts., 6/15/241 | | | | | 745,000 | | | | 778,525 | |
| CVS Health Corp., 2.875% Sr. Unsec. Nts., 6/1/26 | | | | | 932,000 | | | | 888,838 | |
| Ingles Markets, Inc., 5.75% Sr. Unsec. Nts., 6/15/23 | | | | | 1,485,000 | | | | 1,533,263 | |
| Koninklijke Ahold Delhaize NV, 6.50% Sr. Unsec. Nts., 6/15/17 | | | | | 565,000 | | | | 577,310 | |
| Kroger Co. (The): | | | | | | | | | | |
| 2.00% Sr. Unsec. Nts., 1/15/19 | | | | | 40,000 | | | | 40,102 | |
| 6.40% Sr. Unsec. Nts., 8/15/17 | | | | | 559,000 | | | | 575,676 | |
| 6.80% Sr. Unsec. Nts., 12/15/18 | | | | | 287,000 | | | | 314,259 | |
| 6.90% Sr. Unsec. Nts., 4/15/38 | | | | | 248,000 | | | | 317,598 | |
| New Albertsons, Inc., 7.45% Sr. Unsec. Nts., 8/1/29 | | | | | 740,000 | | | | 703,000 | |
| Omnicare, Inc., 4.75% Sr. Unsec. Nts., 12/1/22 | | | | | 1,765,000 | | | | 1,876,899 | |
| Performance Food Group, Inc., 5.50% Sr. Unsec. Nts., 6/1/241 | | | | | 495,000 | | | | 499,950 | |
| Rite Aid Corp., 6.125% Sr. Unsec. Nts., 4/1/231 | | | | | 2,100,000 | | | | 2,265,375 | |
| Simmons Foods, Inc., 7.875% Sec. Nts., 10/1/211 | | | | | 10,000 | | | | 10,325 | |
| SUPERVALU, Inc., 6.75% Sr. Unsec. Nts., 6/1/21 | | | | | 740,000 | | | | 751,100 | |
| US Foods, Inc., 5.875% Sr. Unsec. Nts., 6/15/241 | | | | | 125,000 | | | | 129,688 | |
| Walgreens Boots Alliance, Inc.: | | | | | | | | | | |
| 1.75% Sr. Unsec. Nts., 5/30/18 | | | | | 667,000 | | | | 667,796 | |
| 3.10% Sr. Unsec. Nts., 6/1/23 | | | | | 1,020,000 | | | | 1,013,596 | |
| Wal-Mart Stores, Inc., 4.30% Sr. Unsec. Nts., 4/22/44 | | | | | 498,000 | | | | 525,746 | |
| | | | | | | | | | 13,469,046 | |
Food Products—0.9% | | | | | | | | | | |
| Bunge Ltd. Finance Corp.: | | | | | | | | | | |
| 3.20% Sr. Unsec. Nts., 6/15/17 | | | | | 615,000 | | | | 619,680 | |
| 3.25% Sr. Unsec. Nts., 8/15/26 | | | | | 590,000 | | | | 566,873 | |
| 8.50% Sr. Unsec. Nts., 6/15/19 | | | | | 400,000 | | | | 458,593 | |
| Dean Foods Co., 6.50% Sr. Unsec. Nts., 3/15/231 | | | | | 2,065,000 | | | | 2,178,575 | |
| ESAL GmbH, 6.25% Sr. Unsec. Nts., 2/5/231 | | | | | 530,000 | | | | 534,240 | |
| Ingredion, Inc., 1.80% Sr. Unsec. Nts., 9/25/17 | | | | | 635,000 | | | | 635,885 | |
| JBS USA LLC/JBS USA Finance, Inc., 5.75% Sr. Unsec. Nts., 6/15/251 | | | | | 1,315,000 | | | | 1,338,012 | |
| JM Smucker Co. (The), 1.75% Sr. Unsec. Nts., 3/15/18 | | | | | 498,000 | | | | 498,732 | |
| Kraft Heinz Foods Co.: | | | | | | | | | | |
| 2.80% Sr. Unsec. Nts., 7/2/20 | | | | | 867,000 | | | | 875,341 | |
| 4.375% Sr. Unsec. Nts., 6/1/46 | | | | | 526,000 | | | | 495,955 | |
| Lamb Weston Holdings, Inc., 4.875% Sr. Unsec. Nts., 11/1/261 | | | | | 498,000 | | | | 493,954 | |
| Land O’ Lakes, Inc., 6% Sr. Unsec. Nts., 11/15/221 | | | | | 745,000 | | | | 815,775 | |
16 OPPENHEIMER GLOBAL STRATEGIC INCOME FUND/VA
| | | | | | | | | | |
| | | | | Principal Amount | | | Value | |
Food Products (Continued) | |
| Minerva Luxembourg SA, 6.50% Sr. Unsec. Nts., 9/20/261 | | | | $ | 585,000 | | | $ | 565,987 | |
| Mondelez International Holdings Netherlands BV, 1.625% Sr. Unsec. Nts., 10/28/191 | | | | | 966,000 | | | | 947,148 | |
| Pilgrim’s Pride Corp., 5.75% Sr. Unsec. Nts., 3/15/251 | | | | | 910,000 | | | | 914,550 | |
| Post Holdings, Inc., 6.75% Sr. Unsec. Nts., 12/1/211 | | | | | 940,000 | | | | 1,005,800 | |
| TreeHouse Foods, Inc., 6% Sr. Unsec. Nts., 2/15/241 | | | | | 1,445,000 | | | | 1,520,862 | |
| WhiteWave Foods Co. (The), 5.375% Sr. Unsec. Nts., 10/1/22 | | | | | 670,000 | | | | 736,163 | |
| | | | | | | | | | 15,202,125 | |
Household Products—0.0% | | | | | | | | | | |
Spectrum Brands, Inc., 6.125% Sr. Unsec. Nts., 12/15/24 | | | | | 360,000 | | | | 381,600 | |
| Personal Products—0.4% | | | | | | | | | | |
| Avon International Operations, Inc., 7.875% Sr. Sec. Nts., 8/15/221 | | | | | 3,035,000 | | | | 3,213,306 | |
| Edgewell Personal Care Co., 4.70% Sr. Unsec. Nts., 5/24/22 | | | | | 85,000 | | | | 87,975 | |
| Revlon Consumer Products Corp.: | |
| 5.75% Sr. Unsec. Nts., 2/15/21 | | | | | 2,205,000 | | | | 2,227,050 | |
| 6.25% Sr. Unsec. Nts., 8/1/24 | | | | | 500,000 | | | | 513,750 | |
| | | | | | | | | | 6,042,081 | |
| Tobacco—0.2% | | | | | | | | | | |
| Altria Group, Inc., 3.875% Sr. Unsec. Nts., 9/16/46 | | | | | 588,000 | | | | 543,825 | |
| Imperial Brands Finance plc, 2.05% Sr. Unsec. Nts., 7/20/181 | | | | | 947,000 | | | | 946,987 | |
| Reynolds American, Inc., 5.85% Sr. Unsec. Nts., 8/15/45 | | | | | 738,000 | | | | 875,523 | |
| Vector Group Ltd., 7.75% Sr. Sec. Nts., 2/15/21 | | | | | 1,170,000 | | | | 1,222,650 | |
| | | | | | | | | | 3,588,985 | |
Energy—8.8% | | | | | | | | | | |
Energy Equipment & Services—1.1% | |
| Endeavor Energy Resources LP/EER Finance, Inc., 7% Sr. Unsec. Nts., 8/15/211 | | | | | 550,000 | | | | 574,750 | |
| Ensco plc, 5.20% Sr. Unsec. Nts., 3/15/25 | | | | | 685,000 | | | | 595,039 | |
| Halliburton Co., 5% Sr. Unsec. Nts., 11/15/45 | | | | | 257,000 | | | | 279,270 | |
| Helmerich & Payne International Drilling Co., 4.65% Sr. Unsec. Nts., 3/15/25 | | | | | 247,000 | | | | 255,332 | |
| McDermott International, Inc., 8% Sec. Nts., 5/1/211 | | | | | 1,585,000 | | | | 1,608,775 | |
| Noble Holding International Ltd., 7.75% Sr. Unsec. Nts., 1/15/24 | | | | | 760,000 | | | | 716,756 | |
| Pertamina Persero PT: | | | | | | | | | | |
| 5.625% Sr. Unsec. Nts., 5/20/431 | | | | | 962,000 | | | | 889,926 | |
| 6.45% Sr. Unsec. Nts., 5/30/441 | | | | | 2,860,000 | | | | 2,906,549 | |
| Precision Drilling Corp., 6.625%, 11/15/20 | | | | | 466,370 | | | | 475,697 | |
| Rowan Cos., Inc.: | | | | | | | | | | |
| 4.875% Sr. Unsec. Unsub. Nts., 6/1/22 | | | | | 1,012,000 | | | | 961,400 | |
| 7.375% Sr. Unsec. Nts., 6/15/25 | | | | | 1,775,000 | | | | 1,814,937 | |
| Schlumberger Holdings Corp.: | | | | | | | | | | |
| 1.90% Sr. Unsec. Nts., 12/21/171 | | | | | 789,000 | | | | 792,082 | |
| 4.00% Sr. Unsec. Nts., 12/21/251 | | | | | 528,000 | | | | 553,206 | |
| Sinopec Group Overseas Development 2014 Ltd., 1.75% Sr. Unsec. Nts., 4/10/171 | | | | | 637,000 | | | | 636,982 | |
| Transocean, Inc., 9% Sr. Unsec. Nts., 7/15/231 | | | | | 2,155,000 | | | | 2,219,650 | |
| | | | | | | | | | |
| | | | | Principal Amount | | | Value | |
Energy Equipment & Services (Continued) | |
| Unit Corp., 6.625% Sr. Sub. Nts., 5/15/21 | | | | $ | 1,970,000 | | | $ | 1,920,750 | |
| Weatherford International Ltd., 9.875% Sr. Unsec. Nts., 2/15/241 | | | | | 507,000 | | | | 541,537 | |
| | | | | | | | | | 17,742,638 | |
| Oil, Gas & Consumable Fuels—7.7% | |
| Alta Mesa Holdings LP/Alta Mesa Finance Services Corp., 7.875% Sr. Unsec. Nts., 12/15/241 | | | | | 1,010,000 | | | | 1,050,400 | |
| Anadarko Petroleum Corp.: 4.50% Sr. Unsec. Nts., 7/15/44 | | | | | 168,000 | | | | 158,149 | |
| 6.20% Sr. Unsec. Nts., 3/15/40 | | | | | 175,000 | | | | 200,753 | |
| Apache Corp., 4.75% Sr. Unsec. Nts., 4/15/43 | | | | | 317,000 | | | | 327,134 | |
| Baytex Energy Corp., 5.625% Sr. Unsec. Nts., 6/1/241 | | | | | 1,635,000 | | | | 1,451,062 | |
| Bharat Petroleum Corp. Ltd., 4% Sr. Unsec. Nts., 5/8/25 | | | | | 1,960,000 | | | | 1,925,990 | |
| Bill Barrett Corp.: | | | | | | | | | | |
| 7.00% Sr. Unsec. Nts., 10/15/22 | | | | | 1,370,000 | | | | 1,315,200 | |
| 7.625% Sr. Unsec. Nts., 10/1/19 | | | | | 2,863,000 | | | | 2,834,370 | |
| Blue Racer Midstream LLC/Blue Racer Finance Corp., 6.125% Sr. Unsec. Nts., 11/15/221 | | | | | 570,000 | | | | 572,850 | |
| Boardwalk Pipelines LP, 4.95% Sr. Unsec. Nts., 12/15/24 | | | | | 480,000 | | | | 493,060 | |
| BP Capital Markets plc, 1.676% Sr. Unsec. Nts., 5/3/19 | | | | | 967,000 | | | | 960,245 | |
| Buckeye Partners LP, 3.95% Sr. Unsec. Nts., 12/1/26 | | | | | 230,000 | | | | 224,505 | |
| California Resources Corp., 8% Sec. Nts., 12/15/221 | | | | | 2,658,000 | | | | 2,378,910 | |
| Calumet Specialty Products Partners LP/Calumet Finance Corp., 6.50% Sr. Unsec. Nts., 4/15/21 | | | | | 1,415,000 | | | | 1,206,287 | |
| Carrizo Oil & Gas, Inc., 6.25% Sr. Unsec. Nts., 4/15/23 | | | | | 2,525,000 | | | | 2,600,750 | |
| Cheniere Corpus Christi Holdings LLC: | |
| 5.875% Sr. Sec. Nts., 3/31/251 | | | | | 2,530,000 | | | | 2,590,872 | |
| 7.00% Sr. Sec. Nts., 6/30/241 | | | | | 2,065,000 | | | | 2,245,687 | |
| Chesapeake Energy Corp.: | | | | | | | | | | |
| 4.875% Sr. Unsec. Nts., 4/15/22 | | | | | 630,000 | | | | 578,025 | |
| 6.125% Sr. Unsec. Nts., 2/15/21 | | | | | 1,135,000 | | | | 1,112,300 | |
| 8.00% Sec. Nts., 12/15/221 | | | | | 2,245,000 | | | | 2,434,141 | |
| 8.00% Sr. Unsec. Nts., 1/15/251 | | | | | 760,000 | | | | 778,050 | |
| Chevron Corp., 1.561% Sr. Unsec. Nts., 5/16/19 | | | | | 972,000 | | | | 968,526 | |
| CITGO Petroleum Corp., 6.25% Sr. Sec. Nts., 8/15/221 | | | | | 70,000 | | | | 73,150 | |
| Cloud Peak Energy Resources LLC/Cloud Peak Energy Finance Corp., 12% Sec. Nts., 11/1/21 | | | | | 1,440,000 | | | | 1,504,800 | |
| CNOOC Finance 2011 Ltd., 4.25% Sr. Unsec. Nts., 1/26/211 | | | | | 650,000 | | | | 677,851 | |
| CNOOC Nexen Finance 2014 ULC, 1.625% Sr. Unsec. Nts., 4/30/17 | | | | | 546,000 | | | | 545,678 | |
| Columbia Pipeline Group, Inc., 4.50% Sr. Unsec. Nts., 6/1/25 | | | | | 458,000 | | | | 481,382 | |
| Compania General de Combustibles SA, 9.50% Sr. Unsec. Nts., 11/7/211 | | | | | 445,000 | | | | 449,895 | |
| Concho Resources, Inc., 5.50% Sr. Unsec. Unsub. Nts., 4/1/23 | | | | | 740,000 | | | | 770,562 | |
| ConocoPhillips Co.: | | | | | | | | | | |
| 4.95% Sr. Unsec. Nts., 3/15/26 | | | | | 108,000 | | | | 119,291 | |
| 5.95% Sr. Unsec. Nts., 3/15/46 | | | | | 230,000 | | | | 285,160 | |
| CONSOL Energy, Inc.: | | | | | | | | | | |
| 5.875% Sr. Unsec. Nts., 4/15/22 | | | | | 2,730,000 | | | | 2,689,050 | |
| 8.00% Sr. Unsec. Nts., 4/1/23 | | | | | 1,320,000 | | | | 1,361,250 | |
17 OPPENHEIMER GLOBAL STRATEGIC INCOME FUND/VA
| | | | | | | | | | |
| | | | | Principal Amount | | | Value | |
Oil, Gas & Consumable Fuels (Continued) | |
| Continental Resources, Inc., 5% Sr. Unsec. Nts., 9/15/22 | | | | $ | 520,000 | | | $ | 526,833 | |
| Denbury Resources, Inc.: | | | | | | | | | | |
| 5.50% Sr. Sub. Nts., 5/1/22 | | | | | 987,000 | | | | 866,092 | |
| 6.375% Sr. Sub. Nts., 8/15/21 | | | | | 2,755,000 | | | | 2,493,275 | |
| 9.00% Sec. Nts., 5/15/211 | | | | | 1,140,000 | | | | 1,239,750 | |
| Devon Energy Corp., 4.75% Sr. Unsec. Nts., 5/15/42 | | | | | 1,367,000 | | | | 1,293,729 | |
| Energy Transfer Equity LP, 7.50% Sr. Sec. Nts., 10/15/20 | | | | | 1,975,000 | | | | 2,212,000 | |
| EnLink Midstream Partners LP, 4.85% Sr. Unsec. Nts., 7/15/26 | | | | | 233,000 | | | | 235,152 | |
| Enterprise Products Operating LLC: | | | | | | | | | | |
| 4.85% Sr. Unsec. Nts., 8/15/42 | | | | | 174,000 | | | | 174,288 | |
| 4.90% Sr. Unsec. Nts., 5/15/46 | | | | | 171,000 | | | | 175,876 | |
EP Energy LLC/Everest Acquisition Finance, Inc.: | |
| 7.75% Sr. Unsec. Nts., 9/1/22 | | | | | 860,000 | | | | 700,900 | |
| 8.00% Sr. Sec. Nts., 11/29/241 | | | | | 1,260,000 | | | | 1,360,422 | |
| 9.375% Sr. Unsec. Nts., 5/1/20 | | | | | 635,000 | | | | 588,562 | |
| EQT Midstream Partners LP, 4.125% Sr. Unsec. Nts., 12/1/26 | | | | | 537,000 | | | | 523,722 | |
| Gazprom OAO Via Gaz Capital SA, 4.95% Sr. Unsec. Nts., 7/19/221 | | | | | 3,580,000 | | | | 3,697,428 | |
Genesis Energy LP/Genesis Energy Finance Corp.: | |
| 5.75% Sr. Unsec. Nts., 2/15/21 | | | | | 515,000 | | | | 522,725 | |
| 6.00% Sr. Unsec. Nts., 5/15/23 | | | | | 885,000 | | | | 904,913 | |
| Gulfport Energy Corp., 6% Sr. Unsec. Nts., 10/15/241 | | | | | 1,765,000 | | | | 1,804,712 | |
| Halcon Resources Corp.: | | | | | | | | | | |
| 8.625% Sec. Nts., 2/1/201 | | | | | 1,745,000 | | | | 1,823,525 | |
| 12.00% Sec. Nts., 2/15/221 | | | | | 274,000 | | | | 300,030 | |
| Hess Corp., 5.60% Sr. Unsec. Nts., 2/15/41 | | | | | 525,000 | | | | 535,156 | |
| Indian Oil Corp. Ltd., 5.75% Sr. Unsec. Nts., 8/1/23 | | | | | 1,215,000 | | | | 1,333,322 | |
| Jones Energy Holdings LLC/Jones Energy Finance Corp., 6.75% Sr. Unsec. Nts., 4/1/22 | | | | | 1,888,000 | | | | 1,807,760 | |
| KazMunayGas National Co. JSC: | | | | | | | | | | |
| 4.40% Sr. Unsec. Nts., 4/30/231 | | | | | 280,000 | | | | 275,949 | |
| 6.375% Sr. Unsec. Nts., 4/9/211 | | | | | 2,300,000 | | | | 2,502,239 | |
| 7.00% Sr. Unsec. Nts., 5/5/201 | | | | | 1,880,000 | | | | 2,070,406 | |
| Kinder Morgan, Inc., 5.55% Sr. Unsec. Nts., 6/1/45 | | | | | 754,000 | | | | 794,482 | |
| Laredo Petroleum, Inc., 5.625% Sr. Unsec. Nts., 1/15/22 | | | | | 1,590,000 | | | | 1,609,875 | |
| LBC Tank Terminals Holding Netherlands BV, 6.875% Sr. Unsec. Nts., 5/15/231 | | | | | 1,530,000 | | | | 1,572,075 | |
| MEG Energy Corp.: | | | | | | | | | | |
| 6.50% Sr. Unsec. Nts., 3/15/211 | | | | | 1,345,000 | | | | 1,250,850 | |
| 7.00% Sr. Unsec. Nts., 3/31/241 | | | | | 1,355,000 | | | | 1,233,050 | |
| Murphy Oil Corp.: | | | | | | | | | | |
| 4.70% Sr. Unsec. Nts., 12/1/22 | | | | | 785,000 | | | | 761,207 | |
| 6.875% Sr. Unsec. Nts., 8/15/24 | | | | | 720,000 | | | | 768,600 | |
| Murray Energy Corp., 11.25% Sec. Nts., 4/15/211 | | | | | 3,250,000 | | | | 2,526,875 | |
| Newfield Exploration Co., 5.625% Sr. Unsec. Nts., 7/1/24 | | | | | 515,000 | | | | 539,462 | |
| NGL Energy Partners LP/NGL Energy | |
| Finance Corp.: | | | | | | | | | | |
| 6.875% Sr. Unsec. Nts., 10/15/21 | | | | | 1,365,000 | | | | 1,402,537 | |
| 7.50% Sr. Unsec. Nts., 11/1/231 | | | | | 885,000 | | | | 918,187 | |
| Noble Energy, Inc., 5.05% Sr. Unsec. Nts., 11/15/44 | | | | | 240,000 | | | | 241,155 | |
| Novatek OAO via Novatek Finance DAC, 4.422% Sr. Unsec. Nts., 12/13/221 | | | | | 915,000 | | | | 908,888 | |
| | | | | | | | | | |
| | | | | Principal Amount | | | Value | |
Oil, Gas & Consumable Fuels (Continued) | | | | | |
| Oasis Petroleum, Inc.: | | | | | | | | | | |
| 6.875% Sr. Unsec. Nts., 3/15/22 | | | | $ | 1,110,000 | | | $ | 1,143,300 | |
| 6.875% Sr. Unsec. Nts., 1/15/23 | | | | | 1,545,000 | | | | 1,591,350 | |
| ONEOK Partners LP, 4.90% Sr. Unsec. Nts., 3/15/25 | | | | | 421,000 | | | | 451,774 | |
| ONEOK, Inc., 7.50% Sr. Unsec. Nts., 9/1/23 | | | | | 1,360,000 | | | | 1,567,400 | |
| PBF Holding Co. LLC/PBF Finance Corp., 7% Sr. Sec. Nts., 11/15/231 | | | | | 2,090,000 | | | | 2,090,000 | |
| Peabody Energy Corp.: | | | | | | | | | | |
| 6.00% Sr. Unsec. Nts., 11/15/18 | | | | | 1,110,000 | | | | 682,650 | |
| 10.00% Sec. Nts., 3/15/221 | | | | | 2,075,000 | | | | 1,851,937 | |
| Petrobras Global Finance BV: | | | | | | | | | | |
| 4.375% Sr. Unsec. Nts., 5/20/23 | | | | | 2,405,000 | | | | 2,107,261 | |
| 5.75% Sr. Unsec. Nts., 1/20/20 | | | | | 135,000 | | | | 137,025 | |
| 8.375% Sr. Unsec. Nts., 5/23/21 | | | | | 4,830,000 | | | | 5,216,400 | |
| 8.75% Sr. Unsec. Nts., 5/23/26 | | | | | 2,680,000 | | | | 2,897,750 | |
| Petroleos Mexicanos: | | | | | | | | | | |
| 3.75% Sr. Unsec. Nts., 4/16/26 | | EUR | | | 1,005,000 | | | | 1,029,386 | |
| 4.625% Sr. Unsec. Nts., 9/21/231 | | | | | 2,480,000 | | | | 2,418,744 | |
| 5.375% Sr. Unsec. Nts., 3/13/221 | | | | | 510,000 | | | | 522,867 | |
| 5.50% Sr. Unsec. Nts., 6/27/44 | | | | | 1,720,000 | | | | 1,439,984 | |
| 6.375% Sr. Unsec. Nts., 2/4/211 | | | | | 820,000 | | | | 875,350 | |
| 6.50% Sr. Unsec. Nts., 3/13/271 | | | | | 1,030,000 | | | | 1,063,732 | |
| 6.875% Sr. Unsec. Nts., 8/4/261 | | | | | 1,100,000 | | | | 1,163,250 | |
| Phillips 66 Partners LP, 3.605% Sr. Unsec. Nts., 2/15/25 | | | | | 817,000 | | | | 800,521 | |
| Rain CII Carbon LLC/CII Carbon Corp., 8% Sec. Nts., 12/1/181 | | | | | 1,395,000 | | | | 1,395,000 | |
| Range Resources Corp.: | | | | | | | | | | |
| 5.00% Sr. Unsec. Nts., 8/15/221 | | | | | 830,000 | | | | 828,962 | |
| 5.00% Sr. Unsec. Nts., 3/15/231 | | | | | 325,000 | | | | 322,563 | |
| Regency Energy Partners LP/Regency Energy Finance Corp., 5% Sr. Unsec. Nts., 10/1/22 | | | | | 645,000 | | | | 683,625 | |
| Rose Rock Midstream LP/Rose Rock Finance Corp., 5.625% Sr. Unsec. Nts., 11/15/23 | | | | | 545,000 | | | | 534,100 | |
| RSP Permian, Inc., 5.25% Sr. Unsec. Nts., 1/15/251 | | | | | 760,000 | | | | 765,700 | |
| Sabine Pass Liquefaction LLC, 5.75% Sr. Sec. Nts., 5/15/24 | | | | | 575,000 | | | | 619,563 | |
| Sanchez Energy Corp.: | | | | | | | | | | |
| 6.125% Sr. Unsec. Nts., 1/15/23 | | | | | 1,225,000 | | | | 1,169,875 | |
| 7.75% Sr. Unsec. Nts., 6/15/21 | | | | | 405,000 | | | | 414,113 | |
| SemGroup Corp., 7.50% Sr. Unsec. Nts., 6/15/21 | | | | | 505,000 | | | | 522,675 | |
| Shell International Finance BV: | | | | | | | | | | |
| 1.375% Sr. Unsec. Nts., 5/10/19 | | | | | 728,000 | | | | 720,740 | |
| 4.00% Sr. Unsec. Nts., 5/10/46 | | | | | 355,000 | | | | 339,620 | |
| SM Energy Co., 6.50% Sr. Unsec. Nts., 1/1/23 | | | | | 1,765,000 | | | | 1,802,506 | |
| Southwestern Energy Co., 5.80% Sr. Unsec. Nts., 1/23/20 | | | | | 780,000 | | | | 807,300 | |
| Summit Midstream Holdings LLC/Summit Midstream Finance Corp., 5.50% Sr. Unsec. Nts., 8/15/22 | | | | | 1,420,000 | | | | 1,391,600 | |
| Sunoco LP/Sunoco Finance Corp., 6.375% Sr. Unsec. Nts., 4/1/23 | | | | | 755,000 | | | | 768,212 | |
| Tallgrass Energy Partners LP/Tallgrass Energy Finance Corp., 5.50% Sr. Unsec. Nts., 9/15/241 | | | | | 500,000 | | | | 498,750 | |
| Tesoro Logistics LP, 5.25% Sr. Unsec. | | | | | | | | | | |
| Nts., 1/15/25 | | | | | 162,000 | | | | 166,050 | |
| TransCanada PipeLines Ltd., 1.625% Sr. Unsec. Nts., 11/9/17 | | | | | 968,000 | | | | 967,352 | |
| Ultrapar International SA, 5.25% Sr. Unsec. Nts., 10/6/261 | | | | | 445,000 | | | | 438,281 | |
18 OPPENHEIMER GLOBAL STRATEGIC INCOME FUND/VA
| | | | | | | | | | |
| | | | | Principal Amount | | | Value | |
Oil, Gas & Consumable Fuels (Continued) | |
| Whiting Petroleum Corp., 5.75% Sr. Unsec. Nts., 3/15/21 | | | | $ | 1,640,000 | | | $ | 1,641,378 | |
| WPX Energy, Inc.: | | | | | | | | | | |
| 5.25% Sr. Unsec. Nts., 9/15/24 | | | | | 585,000 | | | | 570,375 | |
| 6.00% Sr. Unsec. Nts., 1/15/22 | | | | | 305,000 | | | | 314,150 | |
| 8.25% Sr. Unsec. Nts., 8/1/23 | | | | | 1,140,000 | | | | 1,279,650 | |
| | | | | | | | | | 129,874,165 | |
Financials—6.2% | | | | | | | | | | |
Capital Markets—1.3% | | | | | | | | | | |
| Affinion Group, Inc., 7.875% Sr. Unsec. Nts., 12/15/18 | | | | | 2,095,000 | | | | 1,833,125 | |
| Apollo Management Holdings LP, 4% Sr. Unsec. Nts., 5/30/241 | | | | | 765,000 | | | | 758,348 | |
| Bank of New York Mellon Corp. (The), 3% Sub. Nts., 10/30/28 | | | | | 401,000 | | | | 381,162 | |
| Brookfield Asset Management, Inc., 4% Sr. Unsec. Nts., 1/15/25 | | | | | 873,000 | | | | 856,701 | |
| Brookfield Residential Properties, Inc., 6.50% Sr. Unsec. Nts., 12/15/201 | | | | | 2,025,000 | | | | 2,080,687 | |
| Credit Suisse AG (New York), 3.625% Sr. Unsec. Nts., 9/9/24 | | | | | 512,000 | | | | 515,309 | |
| Credit Suisse Group Funding Guernsey Ltd., 4.55% Sr. Unsec. Nts., 4/17/26 | | | | | 360,000 | | | | 374,077 | |
| Deutsche Bank AG (London), 6% Sr. Unsec. Nts., 9/1/17 | | | | | 474,000 | | | | 485,272 | |
| Drawbridge Special Opportunities Fund LP/Drawbridge Special Opportunities Finance Corp., 5% Sr. Unsec. Nts., 8/1/211 | | | | | 3,145,000 | | | | 3,042,787 | |
| E*TRADE Financial Corp., 5.875% Jr. Sub. Perpetual Bonds2,9 | | | | | 978,000 | | | | 974,821 | |
| Enviva Partners LP/Enviva Partners Finance Corp., 8.50% Sr. Unsec. Nts., 11/1/211 | | | | | 1,235,000 | | | | 1,290,575 | |
| Equate Petrochemical BV, 4.25% Sr. Unsec. Nts., 11/3/261 | | | | | 1,010,000 | | | | 967,115 | |
| Goldman Sachs Group, Inc. (The): | |
| 3.50% Sr. Unsec. Nts., 11/16/26 | | | | | 556,000 | | | | 545,726 | |
| 3.75% Sr. Unsec. Nts., 2/25/26 | | | | | 548,000 | | | | 549,888 | |
| KCG Holdings, Inc., 6.875% Sr. Sec. Nts., 3/15/201 | | | | | 1,275,000 | | | | 1,281,375 | |
| Morgan Stanley, 5% Sub. Nts., 11/24/25 | | | | | 859,000 | | | | 918,104 | |
| MPH Acquisition Holdings LLC, 7.125% Sr. Unsec. Nts., 6/1/241 | | | | | 495,000 | | | | 522,275 | |
| Prime Security Services Borrower LLC/Prime Finance, Inc., 9.25% Sec. Nts., 5/15/231 | | | | | 495,000 | | | | 540,169 | |
| Raymond James Financial, Inc., 3.625% Sr. Unsec. Nts., 9/15/26 | | | | | 543,000 | | | | 529,835 | |
| Rivers Pittsburgh Borrower LP/Rivers Pittsburgh Finance Corp., 6.125% Sr. Sec. Nts., 8/15/211 | | | | | 375,000 | | | | 384,375 | |
| S&P Global, Inc., 2.50% Sr. Unsec. Nts., 8/15/18 | | | | | 941,000 | | | | 949,066 | |
| Springleaf Finance Corp., 8.25% Sr. Unsec. Nts., 12/15/20 | | | | | 490,000 | | | | 534,100 | |
| UBS Group Funding Jersey Ltd., 4.125% Sr. Unsec. Nts., 4/15/261 | | | | | 584,000 | | | | 597,580 | |
| | | | | | | | | | 20,912,472 | |
| Commercial Banks—1.8% | | | | | | | | | | |
| Astana Finance JSC, 9.16% Sr. Unsec. Nts., 3/14/128 | | | | | 315,159 | | | | — | |
| Australia & New Zealand Banking Group Ltd., 6.75% Jr. Sub. Perpetual Bonds1,2,9 | | | | | 105,000 | | | | 111,044 | |
| Banco ABC Brasil SA, 7.875% Sub. Nts., 4/8/201 | | | | | 150,000 | | | | 158,859 | |
| Banco Hipotecario SA, 9.75% Sr. Unsec. Nts., 11/30/201 | | | | | 170,000 | | | | 181,475 | |
| | | | | | | | | | |
| | | | | Principal Amount | | | Value | |
Commercial Banks (Continued) | |
| Banco Macro SA, 6.75% Sub. Nts., 11/4/261,2 | | | | $ | 265,000 | | | $ | 251,750 | |
| Bank of America Corp.: | | | | | | | | | | |
| 3.248% Sr. Unsec. Nts., 10/21/27 | | | | | 803,000 | | | | 767,088 | |
| 7.75% Jr. Sub. Nts., 5/14/38 | | | | | 645,000 | | | | 889,381 | |
| Bank of China Ltd., 5% Sub. Nts., 11/13/241 | | | | | 575,000 | | | | 597,328 | |
| BankAmerica Capital III, 1.45% Jr. Sub. Nts., 1/15/272 | | | | | 420,000 | | | | 380,625 | |
| BB&T Corp., 2.05% Sr. Unsec. Nts., 5/10/21 | | | | | 993,000 | | | | 974,321 | |
| BPCE SA: | | | | | | | | | | |
| 2.65% Sr. Unsec. Nts., 2/3/21 | | | | | 759,000 | | | | 758,935 | |
| 3.375% Sr. Unsec. Nts., 12/2/26 | | | | | 373,000 | | | | 365,663 | |
| CIT Group, Inc.: | | | | | | | | | | |
| 4.25% Sr. Unsec. Nts., 8/15/17 | | | | | 575,000 | | | | 582,906 | |
| 5.00% Sr. Unsec. Nts., 8/15/22 | | | | | 2,440,000 | | | | 2,549,800 | |
| Citigroup, Inc., 6.675% Sub. Nts., 9/13/43 | | | | | 296,000 | | | | 375,841 | |
| Citizens Bank NA (Providence RI), 2.55% Sr. Unsec. Nts., 5/13/21 | | | | | 776,000 | | | | 771,350 | |
| Constellis Holdings LLC/Constellis Finance Corp., 9.75% Sec. Nts., 5/15/201 | | | | | 1,420,000 | | | | 1,462,600 | |
| Danske Bank AS, 2.80% Sr. Unsec. Nts., 3/10/211 | | | | | 525,000 | | | | 528,591 | |
| Fifth Third Bank (Cincinnati OH), 3.85% Sub. Nts., 3/15/26 | | | | | 491,000 | | | | 494,358 | |
| First Republic Bank, 4.375% Sub. Nts., 8/1/46 | | | | | 405,000 | | | | 368,801 | |
| Global Bank Corp., 4.50% Sr. Unsec. Nts., 10/20/211 | | | | | 605,000 | | | | 590,601 | |
| Grupo Aval Ltd., 4.75% Sr. Unsec. Nts., 9/26/221 | | | | | 825,000 | | | | 815,925 | |
| HSBC Holdings plc, 2.65% Sr. Unsec. Nts., 1/5/22 | | | | | 801,000 | | | | 783,550 | |
| Huntington Bancshares, Inc.: | | | | | | | | | | |
| 3.15% Sr. Unsec. Nts., 3/14/21 | | | | | 528,000 | | | | 535,518 | |
| 4.35% Sub. Nts., 2/4/23 | | | | | 660,000 | | | | 671,374 | |
| ICICI Bank Ltd., 6.375% Jr. Sub. Nts., 4/30/221,2 | | | | | 930,000 | | | | 936,941 | |
| ING Bank NV, 2.75% Sr. Unsec. Nts., 3/22/211 | | | | | 705,000 | | | | 707,843 | |
| JPMorgan Chase & Co.: | | | | | | | | | | |
| 2.295% Sr. Unsec. Nts., 8/15/21 | | | | | 213,000 | | | | 208,996 | |
| 2.70% Sr. Unsec. Nts., 5/18/23 | | | | | 411,000 | | | | 402,019 | |
| Kenan Advantage Group, Inc. (The), 7.875% Sr. Unsec. Nts., 7/31/231 | | | | | 1,660,000 | | | | 1,684,900 | |
| KeyBank NA (Cleveland OH), 3.40% Sub. Nts., 5/20/26 | | | | | 833,000 | | | | 810,265 | |
| Krung Thai Bank PCL (Cayman Islands), 5.20% Sub. Nts., 12/26/242 | | | | | 440,000 | | | | 456,676 | |
| Lloyds Banking Group plc, 6.413% Jr. Sub. Perpetual Bonds1,2,9 | | | | | 566,000 | | | | 609,865 | |
| PNC Bank NA, 2.55% Sr. Unsec. Nts., 12/9/21 | | | | | 399,000 | | | | 399,220 | |
| Regions Bank (Birmingham AL), 2.25% Sr. Unsec. Nts., 9/14/18 | | | | | 477,000 | | | | 478,671 | |
| Royal Bank of Scotland Group plc, 7.64% Jr. Sub. Perpetual Bonds2,9 | | | | | 942,000 | | | | 878,415 | |
| Sberbank of Russia Via SB Capital SA, 5.50% Sub. Nts., 2/26/241,2 | | | | | 1,480,000 | | | | 1,507,750 | |
| Skandinaviska Enskilda Banken AB, 2.625% Sr. Unsec. Nts., 3/15/21 | | | | | 526,000 | | | | 526,397 | |
| Standard Chartered plc, 6.409% Jr. Sub. Perpetual Bonds1,2,9 | | | | | 1,100,000 | | | | 844,250 | |
| SunTrust Bank (Atlanta GA), 3.30% Sub. Nts., 5/15/26 | | | | | 417,000 | | | | 402,702 | |
| Swedbank AB, 2.65% Sr. Unsec. Nts., 3/10/211 | | | | | 557,000 | | | | 557,683 | |
19 OPPENHEIMER GLOBAL STRATEGIC INCOME FUND/VA
| | | | | | | | | | |
| | | | | Principal Amount | | | Value | |
Commercial Banks (Continued) | |
| TC Ziraat Bankasi AS, 4.75% Sr. Unsec. Nts., 4/29/211 | | | | $ | 250,000 | | | $ | 239,775 | |
| Turkiye Halk Bankasi AS, 5% Sr. Unsec. Nts., 7/13/211 | | | | | 515,000 | | | | 483,006 | |
| Turkiye Is Bankasi, 5.375% Sr. Unsec. Nts., 10/6/211 | | | | | 300,000 | | | | 288,042 | |
| Turkiye Vakiflar Bankasi TAO, 6.875% Sub. Nts., 2/3/251,2 | | | | | 625,000 | | | | 603,750 | |
| US Bancorp, 3.10% Sub. Nts., 4/27/26 | | | 586,000 | | | | 570,357 | |
| Wells Fargo & Co.: | | | | | | | | | | |
| 4.75% Sub. Nts., 12/7/46 | | | | | 558,000 | | | | 564,568 | |
| 5.90% Jr. Sub. Perpetual Bonds, Series S2,9 | | | | | 685,000 | | | | 689,281 | |
| | | | | | | | | | 30,819,056 | |
Consumer Finance—0.6% | | | | | | | | | | |
| Ahern Rentals, Inc., 7.375% Sec. Nts., 5/15/231 | | | | | 2,090,000 | | | | 1,766,050 | |
| Ally Financial, Inc.: | | | | | | | | | | |
| 4.25% Sr. Unsec. Nts., 4/15/21 | | | | | 1,704,000 | | | | 1,724,235 | |
| 4.625% Sr. Unsec. Nts., 5/19/22 | | | | | 1,000,000 | | | | 1,013,750 | |
| 5.75% Sub. Nts., 11/20/25 | | | | | 1,175,000 | | | | 1,176,469 | |
| Capital One Financial Corp., 3.20% Sr. Unsec. Nts., 2/5/25 | | | | | 656,000 | | | | 636,120 | |
| Discover Financial Services, 3.75% Sr. Unsec. Nts., 3/4/25 | | | | | 606,000 | | | | 592,740 | |
| Navient Corp.: | | | | | | | | | | |
| 6.625% Sr. Unsec. Nts., 7/26/21 | | | | | 505,000 | | | | 535,300 | |
| 7.25% Sr. Unsec. Nts., 1/25/22 | | | | | 2,300,000 | | | | 2,443,750 | |
| Synchrony Financial, 4.50% Sr. Unsec. Nts., 7/23/25 | | | | | 172,000 | | | | 176,755 | |
| TMX Finance LLC/TitleMax Finance Corp., 8.50% Sr. Sec. Nts., 9/15/181 | | | | | 685,000 | | | | 601,087 | |
| | | | | | | | | | 10,666,256 | |
Diversified Financial Services—0.1% | |
| Berkshire Hathaway Energy Co., 2% Sr. Unsec. Nts., 11/15/18 | | | | | 267,000 | | | | 268,216 | |
| JPMorgan Hipotecaria su Casita, 6.47% Sec. Nts., 8/26/3510,11 | | MXN | | | 5,808,600 | | | | 28,301 | |
| Peachtree Corners Funding Trust, 3.976% Sr. Unsec. Nts., 2/15/251 | | | | | 445,000 | | | | 434,393 | |
| Suntory Holdings Ltd., 1.65% Sr. Unsec. Nts., 9/29/171 | | | | | 327,000 | | | | 327,175 | |
| Voya Financial, Inc., 5.65% Jr. Sub. Nts., 5/15/532 | | | | | 810,000 | | | | 798,862 | |
| | | | | | | | | | 1,856,947 | |
Insurance—0.5% | |
| Arch Capital Finance LLC, 4.011% Sr. Unsec. Nts., 12/15/26 | | | | | 558,000 | | | | 565,883 | |
| AXIS Specialty Finance plc, 5.15% Sr. Unsec. Nts., 4/1/45 | | | | | 600,000 | | | | 594,679 | |
| CNO Financial Group, Inc., 4.50% Sr. Unsec. Nts., 5/30/20 | | | | | 2,195,000 | | | | 2,260,850 | |
| Five Corners Funding Trust, 4.419% Unsec. Nts., 11/15/231 | | | | | 744,000 | | | | 786,840 | |
| Manulife Financial Corp., 4.15% Sr. Unsec. Nts., 3/4/26 | | | | | 525,000 | | | | 547,970 | |
| MetLife, Inc., 5.25% Jr. Sub. Perpetual Bonds2,9 | | | | | 446,000 | | | | 452,690 | |
| NFP Corp., 9% Sr. Unsec. Nts., 7/15/211 | | | 1,525,000 | | | | 1,614,594 | |
| Principal Financial Group, Inc., 4.30% Sr. Unsec. Nts., 11/15/46 | | | | | 399,000 | | | | 391,747 | |
| Prudential Financial, Inc., 5.375% Jr. Sub. Nts., 5/15/452 | | | | | 617,000 | | | | 632,425 | |
| TIAA Asset Management Finance Co. LLC, 4.125% Sr. Unsec. Nts., 11/1/241 | | | | | 914,000 | | | | 923,584 | |
| | | | | | | | | | |
| | | | | Principal Amount | | | Value | |
Insurance (Continued) | | | | | | | | | | |
| XLIT Ltd., 6.50% Jr. Sub. Perpetual Bonds2,9 | | | | $ | 360,000 | | | $ | 281,700 | |
| | | | | | | | | | 9,052,962 | |
Real Estate Investment Trusts (REITs)—1.3% | |
| American Tower Corp.: | | | | | | | | | | |
| 2.80% Sr. Unsec. Nts., 6/1/20 | | | | | 616,000 | | | | 616,469 | |
| 5.90% Sr. Unsec. Nts., 11/1/21 | | | | | 279,000 | | | | 312,453 | |
| Banco Invex SA/Hipotecaria Creditoy Casa SA de CV, 6.45% Sec. Nts., 3/13/348,11 | | MXN | | | 4,830,531 | | | | — | |
| Boston Properties LP, 3.70% Sr. Unsec. Nts., 11/15/18 | | | | | 593,000 | | | | 610,947 | |
| Communications Sales & Leasing, Inc./CSL Capital LLC: | | | | | | | | | | |
| 7.125% Sr. Unsec. Nts., 12/15/241 | | | | | 760,000 | | | | 769,500 | |
| 8.25% Sr. Unsec. Nts., 10/15/23 | | | | | 1,195,000 | | | | 1,272,675 | |
| CTR Partnership LP/CareTrust Capital Corp., 5.875% Sr. Unsec. Nts., 6/1/21 | | | | | 760,000 | | | | 777,100 | |
| DuPont Fabros Technology LP, 5.875% Sr. Unsec. Nts., 9/15/21 | | | | | 1,535,000 | | | | 1,606,953 | |
| Equinix, Inc.: | | | | | | | | | | |
| 5.375% Sr. Unsec. Nts., 1/1/22 | | | | | 2,200,000 | | | | 2,321,000 | |
| 5.875% Sr. Unsec. Nts., 1/15/26 | | | | | 1,135,000 | | | | 1,197,425 | |
| FelCor Lodging LP, 6% Sr. Unsec. Nts., 6/1/25 | | | | | 1,035,000 | | | | 1,081,575 | |
| GLP Capital LP/GLP Financing II, Inc., 5.375% Sr. Unsec. Nts., 11/1/23 | | | | | 810,000 | | | | 870,750 | |
| HCP, Inc., 5.625% Sr. Unsec. Nts., 5/1/17 | | | | | 332,000 | | | | 336,436 | |
| Highwoods Realty LP, 5.85% Sr. Unsec. Nts., 3/15/17 | | | | | 407,000 | | | | 410,461 | |
| Iron Mountain US Holdings, Inc., 5.375% Sr. Unsec. Nts., 6/1/261 | | | | | 995,000 | | | | 967,638 | |
| iStar, Inc.: | | | | | | | | | | |
| 4.875% Sr. Unsec. Nts., 7/1/18 | | | | | 2,145,000 | | | | 2,150,362 | |
| 5.00% Sr. Unsec. Nts., 7/1/19 | | | | | 905,000 | | | | 911,787 | |
| Lamar Media Corp., 5.75% Sr. Unsec. Nts., 2/1/26 | | | | | 620,000 | | | | 654,875 | |
| MPT Operating Partnership LP/MPT Finance Corp., 6.375% Sr. Unsec. Nts., 3/1/24 | | | | | 740,000 | | | | 777,925 | |
| Outfront Media Capital LLC/Outfront Media Capital Corp., 5.875% Sr. Unsec. Nts., 3/15/25 | | | | | 2,040,000 | | | | 2,144,550 | |
| Starwood Property Trust, Inc., 5% Sr. Unsec. Nts., 12/15/211 | | | | | 760,000 | | | | 772,084 | |
| Trust F/1401, 5.25% Sr. Unsec. Nts., 1/30/261 | | | | | 1,145,000 | | | | 1,102,063 | |
| WEA Finance LLC/Westfield UK & Europe Finance plc, 1.75% Sr. Unsec. Nts., 9/15/171 | | | | | 434,000 | | | | 434,330 | |
| Welltower, Inc., 2.25% Sr. Unsec. Nts., 3/15/18 | | | | | 130,000 | | | | 130,577 | |
| | | | | | | | | | 22,229,935 | |
Real Estate Management & Development—0.3% | |
| Mattamy Group Corp.: | | | | | | | | | | |
| 6.50% Sr. Unsec. Nts., 11/15/201 | | | | | 1,010,000 | | | | 1,030,200 | |
| 6.875% Sr. Unsec. Nts., 12/15/231 | | | | | 505,000 | | | | 513,837 | |
| O1 Properties Finance plc, 8.25% Sr. Unsec. Nts., 9/27/211 | | | | | 200,000 | | | | 194,636 | |
| Realogy Group LLC/Realogy Co.-Issuer Corp.: | | | | | | | | | | |
| 4.875% Sr. Unsec. Nts., 6/1/231 | | | | | 1,240,000 | | | | 1,202,800 | |
| 5.25% Sr. Unsec. Nts., 12/1/211 | | | | | 985,000 | | | | 1,014,550 | |
| Shea Homes LP/Shea Homes Funding | | | | | | | | | | |
| Corp., 6.125% Sr. Unsec. Nts., 4/1/251 | | | | | 1,065,000 | | | | 1,035,713 | |
| | | | | | | | | 4,991,736 | |
20 OPPENHEIMER GLOBAL STRATEGIC INCOME FUND/VA
| | | | | | | | | | |
| | | | | Principal Amount | | | Value | |
Thrifts & Mortgage Finance—0.3% | |
| Jefferies Finance LLC/JFIN Co.-Issuer Corp., 7.375% Sr. Unsec. Nts., 4/1/201 | | | | $ | 1,015,000 | | | $ | 1,020,075 | |
| Quicken Loans, Inc., 5.75% Sr. Unsec. Nts., 5/1/251 | | | | | 2,135,000 | | | | 2,086,962 | |
| Radian Group, Inc., 5.25% Sr. Unsec. Nts., 6/15/20 | | | | | 1,235,000 | | | | 1,293,663 | |
| | | | | | | | | | 4,400,700 | |
Health Care—3.7% | | | | | | | | | | |
Biotechnology—0.3% | | | | | | | | | | |
| AbbVie, Inc.: | | | | | | | | | | |
| 3.60% Sr. Unsec. Nts., 5/14/25 | | | | | 440,000 | | | | 436,025 | |
| 4.70% Sr. Unsec. Nts., 5/14/45 | | | | | 150,000 | | | | 147,456 | |
| Biogen, Inc., 5.20% Sr. Unsec. Nts., 9/15/45 | | | | | 236,000 | | | | 253,906 | |
| Celgene Corp.: | | | | | | | | | | |
| 2.125% Sr. Unsec. Nts., 8/15/18 | | | | | 946,000 | | | | 950,009 | |
| 3.875% Sr. Unsec. Nts., 8/15/25 | | | | | 428,000 | | | | 434,332 | |
| 5.00% Sr. Unsec. Nts., 8/15/45 | | | | | 104,000 | | | | 108,340 | |
| Gilead Sciences, Inc., 4.75% Sr. Unsec. Nts., 3/1/46 | | | | | 390,000 | | | | 403,687 | |
| Shire Acquisitions Investments Ireland DAC: | | | | | | | | | | |
| 1.90% Sr. Unsec. Nts., 9/23/19 | | | | | 964,000 | | | | 951,958 | |
| 3.20% Sr. Unsec. Nts., 9/23/26 | | | | | 744,000 | | | | 695,711 | |
| | | | | | | | | | 4,381,424 | |
Health Care Equipment & Supplies—0.4% | |
| Abbott Laboratories: | | | | | | | | | | |
| 2.35% Sr. Unsec. Nts., 11/22/19 | | | | | 927,000 | | | | 928,278 | |
| 4.90% Sr. Unsec. Nts., 11/30/46 | | | | | 381,000 | | | | 391,806 | |
| Baxter International, Inc., 2.60% Sr. Unsec. Nts., 8/15/26 | | | | | 458,000 | | | | 423,053 | |
| Boston Scientific Corp., 3.85% Sr. Unsec. Nts., 5/15/25 | | | | | 743,000 | | | | 744,818 | |
| DJO Finco, Inc./DJO Finance LLC/ DJO Finance Corp., 8.125% Sec. Nts., 6/15/211 | | | | | 580,000 | | | | 506,050 | |
| Hill-Rom Holdings, Inc., 5.75% Sr. Unsec. Nts., 9/1/231 | | | | | 680,000 | | | | 705,500 | |
| Hologic, Inc., 5.25% Sr. Unsec. Nts., 7/15/221 | | | | | 1,460,000 | | | | 1,542,125 | |
| Jaguar Holding Co. II/Pharmaceutical Product Development LLC, 6.375% Sr. Unsec. Nts., 8/1/231 | | | | | 510,000 | | | | 546,975 | |
| Stryker Corp., 3.50% Sr. Unsec. Nts., 3/15/26 | | | | | 318,000 | | | | 321,167 | |
| | | | | | | | | | 6,109,772 | |
Health Care Providers & Services—2.1% | |
| Acadia Healthcare Co., Inc.: | | | | | | | | | | |
| 5.625% Sr. Unsec. Nts., 2/15/23 | | | | | 930,000 | | | | 934,650 | |
| 6.50% Sr. Unsec. Nts., 3/1/24 | | | | | 250,000 | | | | 256,250 | |
| Aetna, Inc., 3.20% Sr. Unsec. Nts., 6/15/26 | | | | | 707,000 | | | | 699,794 | |
| Cardinal Health, Inc., 3.50% Sr. Unsec. Nts., 11/15/24 | | | | | 430,000 | | | | 434,960 | |
| Centene Corp.: | | | | | | | | | | |
| 4.75% Sr. Unsec. Nts., 5/15/22 | | | | | 1,920,000 | | | | 1,948,800 | |
| 5.625% Sr. Unsec. Nts., 2/15/21 | | | | | 245,000 | | | | 258,205 | |
| 6.125% Sr. Unsec. Nts., 2/15/24 | | | | | 245,000 | | | | 258,781 | |
| CHS/Community Health Systems, Inc., 6.875% Sr. Unsec. Nts., 2/1/22 | | | | | 3,585,000 | | | | 2,509,500 | |
| DaVita, Inc., 5.125% Sr. Unsec. Nts., 7/15/24 | | | | | 1,995,000 | | | | 1,993,753 | |
| Envision Healthcare Corp.: | | | | | | | | | | |
| 5.125% Sr. Unsec. Nts., 7/1/221 | | | | | 590,000 | | | | 590,737 | |
| 5.625% Sr. Unsec. Nts., 7/15/22 | | | | | 945,000 | | | | 977,839 | |
| Express Scripts Holding Co., 4.50% Sr. Unsec. Nts., 2/25/26 | | | | | 634,000 | | | | 653,007 | |
| | | | | | | | | | |
| | | | | Principal Amount | | | Value | |
Health Care Providers & Services (Continued) | |
| FGI Operating Co. LLC/FGI Finance, Inc., 7.875% Sec. Nts., 5/1/20 | | | | $ | 1,008,000 | | | $ | 861,840 | |
| Fresenius Medical Care US Finance II, Inc.: | | | | | | | | | | |
| 4.75% Sr. Unsec. Nts., 10/15/241 | | | | | 785,000 | | | | 796,775 | |
| 5.875% Sr. Unsec. Nts., 1/31/221 | | | | | 775,000 | | | | 852,500 | |
| HCA, Inc.: | | | | | | | | | | |
| 5.375% Sr. Unsec. Nts., 2/1/25 | | | | | 700,000 | | | | 702,625 | |
| 7.50% Sr. Unsec. Nts., 2/15/22 | | | | | 2,695,000 | | | | 3,065,563 | |
| 5.875% Sr. Unsec. Nts., Series 1, 5/1/23 | | | | | 3,480,000 | | | | 3,706,200 | |
| HealthSouth Corp., 5.75% Sr. Unsec. Nts., 11/1/24 | | | | | 1,550,000 | | | | 1,577,125 | |
| IASIS Healthcare LLC/IASIS Capital Corp., 8.375% Sr. Unsec. Nts., 5/15/19 | | | | | 2,545,000 | | | | 2,226,875 | |
| Kindred Healthcare, Inc., 6.375% Sr. Unsec. Nts., 4/15/22 | | | | | 540,000 | | | | 483,975 | |
| Laboratory Corp. of America Holdings, 3.60% Sr. Unsec. Nts., 2/1/25 | | | | | 1,188,000 | | | | 1,183,351 | |
| LifePoint Health, Inc., 5.50% Sr. Unsec. Nts., 12/1/21 | | | | | 1,435,000 | | | | 1,493,297 | |
| McKesson Corp., 4.883% Sr. Unsec. Nts., 3/15/44 | | | | | 362,000 | | | | 368,942 | |
| OCP SA, 4.50% Sr. Unsec. Nts., 10/22/251 | | | | | 940,000 | | | | 901,285 | |
| Quest Diagnostics, Inc., 3.45% Sr. Unsec. Nts., 6/1/26 | | | | | 400,000 | | | | 394,748 | |
| Select Medical Corp., 6.375% Sr. Unsec. Nts., 6/1/21 | | | | | 900,000 | | | | 904,500 | |
| Tenet Healthcare Corp.: | | | | | | | | | | |
| 6.75% Sr. Unsec. Nts., 6/15/23 | | | | | 2,370,000 | | | | 2,091,525 | |
| 7.50% Sec. Nts., 1/1/221 | | | | | 505,000 | | | | 527,725 | |
| 8.125% Sr. Unsec. Nts., 4/1/22 | | | | | 1,445,000 | | | | 1,370,583 | |
| Universal Hospital Services, Inc., 7.625% Sec. Nts., 8/15/20 | | | | | 725,000 | | | | 721,375 | |
| | | | | | | | | | 35,747,085 | |
Life Sciences Tools & Services—0.1% | |
| Quintiles IMS, Inc., 4.875% Sr. Unsec. Nts., 5/15/231 | | | | | 1,197,000 | | | | 1,220,940 | |
| Thermo Fisher Scientific, Inc.: | |
| 2.15% Sr. Unsec. Nts., 12/14/18 | | | | | 247,000 | | | | 248,200 | |
| 3.00% Sr. Unsec. Nts., 4/15/23 | | | | | 599,000 | | | | 588,930 | |
| 4.15% Sr. Unsec. Nts., 2/1/24 | | | | | 136,000 | | | | 141,677 | |
| 5.30% Sr. Unsec. Nts., 2/1/44 | | | | | 281,000 | | | | 314,986 | |
| | | | | | | | | | 2,514,733 | |
Pharmaceuticals—0.8% | |
| Actavis Funding SCS: | | | | | | | | | | |
| 2.35% Sr. Unsec. Nts., 3/12/18 | | | | | 798,000 | | | | 802,744 | |
| 3.80% Sr. Unsec. Nts., 3/15/25 | | | | | 583,000 | | | | 583,962 | |
| 4.75% Sr. Unsec. Nts., 3/15/45 | | | | | 252,000 | | | | 247,875 | |
| Concordia International Corp., 7% Sr. Unsec. Nts., 4/15/231 | | | | | 585,000 | | | | 187,200 | |
| Endo Finance LLC/Endo Finco, Inc., 5.375% Sr. Unsec. Nts., 1/15/231 | | | | | 1,555,000 | | | | 1,329,525 | |
Endo Ltd./Endo Finance LLC/Endo Finco, Inc.: | |
| 6.00% Sr. Unsec. Nts., 7/15/231 | | | | | 1,205,000 | | | | 1,063,413 | |
| 6.50% Sr. Unsec. Nts., 2/1/251 | | | | | 210,000 | | | | 175,875 | |
Mallinckrodt International Finance SA/ Mallinckrodt CB LLC: | |
| 4.875% Sr. Unsec. Nts., 4/15/201 | | | | | 220,000 | | | | 221,925 | |
| 5.50% Sr. Unsec. Nts., 4/15/251 | | | | | 1,160,000 | | | | 1,044,000 | |
| 5.75% Sr. Unsec. Nts., 8/1/221 | | | | | 930,000 | | | | 899,775 | |
| Perrigo Finance Unlimited Co., 4.375% Sr. Unsec. Nts., 3/15/26 | | | | | 239,000 | | | | 239,365 | |
| Prestige Brands, Inc., 6.375% Sr. Unsec. Nts., 3/1/241 | | | | | 370,000 | | | | 390,350 | |
21 OPPENHEIMER GLOBAL STRATEGIC INCOME FUND/VA
| | | | | | | | | | |
| | | | | Principal Amount | | | Value | |
Pharmaceuticals (Continued) | |
| Teva Pharmaceutical Finance Netherlands III BV, 1.70% Sr. Unsec. Nts., 7/19/19 | | | | $ | 880,000 | | | $ | 864,778 | |
| Valeant Pharmaceuticals International, Inc.: | | | | | | | | | | |
| 5.375% Sr. Unsec. Nts., 3/15/201 | | | | | 700,000 | | | | 595,000 | |
| 5.50% Sr. Unsec. Nts., 3/1/231 | | | | | 2,330,000 | | | | 1,759,150 | |
| 5.875% Sr. Unsec. Nts., 5/15/231 | | | | | 555,000 | | | | 421,800 | |
| 6.75% Sr. Unsec. Nts., 8/15/211 | | | | | 485,000 | | | | 404,975 | |
| 7.25% Sr. Unsec. Nts., 7/15/221 | | | | | 1,150,000 | | | | 945,875 | |
| 7.50% Sr. Unsec. Nts., 7/15/211 | | | | | 785,000 | | | | 668,231 | |
| | | | | | | | | | 12,845,818 | |
Industrials—4.9% | |
Aerospace & Defense—0.6% | |
| BAE Systems Holdings, Inc., 3.85% Sr. Unsec. Nts., 12/15/251 | | | | | 674,000 | | | | 687,737 | |
| Bombardier, Inc., 8.75% Sr. Unsec. Nts., 12/1/211 | | | | | 2,525,000 | | | | 2,685,969 | |
| CBC Ammo LLC/CBC FinCo, Inc., 7.25% Sr. Unsec. Nts., 11/15/211 | | | | | 515,000 | | | | 508,563 | |
| L-3 Communications Corp., 3.85% Sr. Unsec. Nts., 12/15/26 | | | | | 239,000 | | | | 237,700 | |
| LMI Aerospace, Inc., 7.375% Sec. Nts., 7/15/19 | | | | | 1,555,000 | | | | 1,558,888 | |
| Lockheed Martin Corp., 3.55% Sr. Unsec. Nts., 1/15/26 | | | | | 428,000 | | | | 437,514 | |
| Northrop Grumman Corp., 4.75% Sr. Unsec. Nts., 6/1/43 | | | | | 505,000 | | | | 551,271 | |
| Textron, Inc., 4.30% Sr. Unsec. Nts., 3/1/24 | | | | | 293,000 | | | | 304,041 | |
| TransDigm, Inc., 6.375% Sr. Sub. Nts., 6/15/261 | | | | | 1,245,000 | | | | 1,284,840 | |
| Triumph Group, Inc., 5.25% Sr. Unsec. Nts., 6/1/22 | | | | | 1,975,000 | | | | 1,851,563 | |
| United Technologies Corp., 1.778% Jr. Sub. Nts., 5/4/182 | | | | | 170,000 | | | | 170,068 | |
| | | | | | | | | | 10,278,154 | |
Air Freight & Couriers—0.2% | |
| CEVA Group plc, 7% Sr. Sec. Nts., 3/1/211 | | | | | 1,475,000 | | | | 1,194,750 | |
| SPL Logistics Escrow LLC/SPL Logistics Finance Corp., 8.875% Sr. Sec. Nts., 8/1/201 | | | | | 2,560,000 | | | | 2,233,600 | |
| XPO Logistics, Inc., 6.125% Sr. Unsec. Nts., 9/1/231 | | | | | 370,000 | | | | 388,037 | |
| | | | | | | | | | 3,816,387 | |
Airlines—0.1% | |
| American Airlines Group, Inc.: | | | | | | | | | | |
| 4.625% Sr. Unsec. Nts., 3/1/201 | | | | | 830,000 | | | | 843,487 | |
| 5.50% Sr. Unsec. Nts., 10/1/191 | | | | | 930,000 | | | | 964,875 | |
| | | | | | | | | | 1,808,362 | |
Building Products—0.2% | |
| Masco Corp., 4.45% Sr. Unsec. Nts., 4/1/25 | | | | | 1,045,000 | | | | 1,065,900 | |
| Owens Corning, 3.40% Sr. Unsec. Nts., 8/15/26 | | | | | 656,000 | | | | 623,495 | |
| Standard Industries, Inc., 5.375% Sr. Unsec. Nts., 11/15/241 | | | | | 1,365,000 | | | | 1,409,362 | |
| USG Corp., 5.50% Sr. Unsec. Nts., 3/1/251 | | | | | 500,000 | | | | 515,625 | |
| | | | | | | | | | 3,614,382 | |
Commercial Services & Supplies—0.9% | |
| ACCO Brands Corp.: | | | | | | | | | | |
| 5.25% Sr. Unsec. Nts., 12/15/241 | | | | | 490,000 | | | | 494,596 | |
| 6.75% Sr. Unsec. Nts., 4/30/20 | | | | | 495,000 | | | | 520,987 | |
| ADT Corp. (The), 5.25% Sr. Sec. Nts., 3/15/20 | | | | | 2,210,000 | | | | 2,353,650 | |
| | | | | | | | | | |
| | | | | Principal Amount | | | Value | |
Commercial Services & Supplies (Continued) | |
| Advanced Disposal Services, Inc., 5.625% Sr. Unsec. Nts., 11/15/241 | | | | $ | 125,000 | | | $ | 124,688 | |
| APX Group, Inc., 8.75% Sr. Unsec. Nts., 12/1/20 | | | | | 1,180,000 | | | | 1,194,750 | |
| ARD Finance SA, 7.125% Sr. Sec. Nts., 9/15/231,12 | | | | | 765,000 | | | | 758,306 | |
| Cenveo Corp., 6% Sr. Sec. Nts., 8/1/191 | | | | | 400,000 | | | | 359,000 | |
| Clean Harbors, Inc., 5.125% Sr. Unsec. Nts., 6/1/21 | | | | | 1,230,000 | | | | 1,260,996 | |
| Covanta Holding Corp., 5.875% Sr. Unsec. Nts., 3/1/24 | | | | | 1,565,000 | | | | 1,510,225 | |
| Monitronics International, Inc., 9.125% Sr. Unsec. Nts., 4/1/20 | | | | | 1,400,000 | | | | 1,326,500 | |
| Pitney Bowes, Inc., 4.625% Sr. Unsec. Nts., 3/15/24 | | | | | 727,000 | | | | 716,396 | |
| Republic Services, Inc.: | | | | | | | | | | |
| 2.90% Sr. Unsec. Nts., 7/1/26 | | | | | 472,000 | | | | 452,733 | |
| 3.80% Sr. Unsec. Nts., 5/15/18 | | | | | 786,000 | | | | 808,006 | |
| RR Donnelley & Sons Co., 7.875% Sr. Unsec. Nts., 3/15/21 | | | | | 1,200,000 | | | | 1,242,000 | |
| Waste Management, Inc., 4.10% Sr. Unsec. Nts., 3/1/45 | | | | | 217,000 | | | | 215,207 | |
| West Corp., 5.375% Sr. Unsec. Nts., 7/15/221 | | | | | 1,375,000 | | | | 1,333,750 | |
| | | | | | | | | | 14,671,790 | |
Construction & Engineering—0.2% | |
| Fideicomiso PA Pacifico Tres, 8.25% Sr. Sec. Nts., 1/15/351 | | | | | 385,000 | | | | 409,062 | |
| Globe Luxembourg SCA, 9.625% Sr. Sec. Nts., 5/1/181 | | | | | 1,395,000 | | | | 1,384,538 | |
| IHS Netherlands Holdco BV, 9.50% Sr. Unsec. Nts., 10/27/211 | | | | | 505,000 | | | | 518,192 | |
| Sinopec Group Overseas Development 2016 Ltd., 2% Sr. Unsec. Nts., 9/29/211 | | | | | 1,200,000 | | | | 1,145,910 | |
| | | | | | | | | | 3,457,702 | |
Electrical Equipment—0.3% | |
| EnerSys, 5% Sr. Unsec. Nts., 4/30/231 | | | | | 2,090,000 | | | | 2,108,287 | |
| Sensata Technologies BV: 4.875% Sr. Unsec. Nts., 10/15/231 | | | | | 934,000 | | | | 958,518 | |
| 5.625% Sr. Unsec. Nts., 11/1/241 | | | | | 1,190,000 | | | | 1,245,038 | |
| | | | | | | | | | 4,311,843 | |
Industrial Conglomerates—0.1% | |
| Citgo Holding, Inc., 10.75% Sr. Sec. Nts., 2/15/201 | | | | | 570,000 | | | | 614,175 | |
| Icahn Enterprises LP/Icahn Enterprises Finance Corp., 5.875% Sr. Unsec. Nts., 2/1/22 | | | | | 1,370,000 | | | | 1,366,575 | |
| Roper Technologies, Inc.: | | | | | | | | | | |
| 3.80% Sr. Unsec. Nts., 12/15/26 | | | | | 185,000 | | | | 186,527 | |
| 3.85% Sr. Unsec. Nts., 12/15/25 | | | | | 305,000 | | | | 308,899 | |
| | | | | | | | | | 2,476,176 | |
Machinery—0.8% | |
| Allison Transmission, Inc., 5% Sr. Unsec. Nts., 10/1/241 | | | | | 500,000 | | | | 506,250 | |
| Amsted Industries, Inc., 5% Sr. Unsec. Nts., 3/15/221 | | | | | 1,785,000 | | | | 1,793,925 | |
| EnPro Industries, Inc., 5.875% Sr. Unsec. Nts., 9/15/22 | | | | | 1,020,000 | | | | 1,053,150 | |
| Fortive Corp., 1.80% Sr. Unsec. Nts., 6/15/191 | | | | | 985,000 | | | | 979,200 | |
| Ingersoll-Rand Global Holding Co. Ltd., 4.25% Sr. Unsec. Nts., 6/15/23 | | | | | 764,000 | | | | 808,343 | |
| Meritor, Inc., 6.25% Sr. Unsec. Nts., 2/15/24 | | | | | 1,640,000 | | | | 1,615,400 | |
| Navistar International Corp., 8.25% Sr. Unsec. Nts., 11/1/21 | | | | | 1,285,000 | | | | 1,304,275 | |
22 OPPENHEIMER GLOBAL STRATEGIC INCOME FUND/VA
| | | | | | | | | | |
| | | | | Principal Amount | | | Value | |
Machinery (Continued) | | | | | | | | | | |
| Stanley Black & Decker, Inc., 2.451% Sub. Nts., 11/17/18 | | | | $ | 946,000 | | | $ | 954,350 | |
| Terex Corp.: | | | | | | | | | | |
| 6.00% Sr. Unsec. Nts., 5/15/21 | | | | | 1,500,000 | | | | 1,539,375 | |
| 6.50% Sr. Unsec. Nts., 4/1/20 | | | | | 730,000 | | | | 748,250 | |
| Wabtec Corp., 3.45% Sr. Unsec. Nts., 11/15/261 | | | | | 384,000 | | | | 369,330 | |
| Xerium Technologies, Inc., 9.50% Sr. Sec. Nts., 8/15/211 | | | | | 1,025,000 | | | | 1,025,000 | |
| | | | | | | | | | 12,696,848 | |
Professional Services—0.4% | |
| Equifax, Inc., 6.30% Sr. Unsec. Nts., 7/1/17 | | | | | 796,000 | | | | 814,085 | |
| FTI Consulting, Inc., 6% Sr. Unsec. Nts., 11/15/22 | | | | | 2,740,000 | | | | 2,859,875 | |
| Nielsen Finance LLC/Nielsen Finance Co., 5% Sr. Unsec. Nts., 4/15/221 | | | | | 2,415,000 | | | | 2,466,319 | |
| | | | | | | | | | 6,140,279 | |
Road & Rail—0.3% | |
| Avis Budget Car Rental LLC/Avis Budget Finance, Inc., 5.25% Sr. Unsec. Nts., 3/15/251 | | | | | 2,100,000 | | | | 1,966,125 | |
| Canadian Pacific Railway Co., 4.80% Sr. Unsec. Nts., 9/15/35 | | | | | 111,000 | | | | 120,000 | |
| CSX Corp., 3.80% Sr. Unsec. Nts., 11/1/46 | | | | | 231,000 | | | | 214,621 | |
| ERAC USA Finance LLC, 6.375% Sr. Unsec. Nts., 10/15/171 | | | | | 794,000 | | | | 822,813 | |
| GFL Environmental, Inc., 9.875% Sr. Unsec. Nts., 2/1/211 | | | | | 490,000 | | | | 541,450 | |
| Hertz Corp. (The), 5.50% Sr. Unsec. Nts., 10/15/241 | | | | | 625,000 | | | | 549,219 | |
| Norfolk Southern Corp., 4.65% Sr. Unsec. Nts., 1/15/46 | | | | | 197,000 | | | | 209,889 | |
Penske Truck Leasing Co. LP/PTL
Finance Corp.: | |
| 3.40% Sr. Unsec. Nts., 11/15/261 | | | | | 772,000 | | | | 739,039 | |
| 3.75% Sr. Unsec. Nts., 5/11/171 | | | | | 354,000 | | | | 356,775 | |
| | | | | | | | | | 5,519,931 | |
Trading Companies & Distributors—0.7% | |
| AerCap Ireland Capital Ltd./AerCap Global Aviation Trust, 3.95% Sr. Unsec. Nts., 2/1/22 | | | | | 976,000 | | | | 986,980 | |
| Air Lease Corp., 3% Sr. Unsec. Nts., 9/15/23 | | | | | 403,000 | | | | 385,154 | |
| Aircastle Ltd., 5% Sr. Unsec. Nts., 4/1/23 | | | | | 245,000 | | | | 250,512 | |
| American Builders & Contractors Supply Co., Inc., 5.75% Sr. Unsec. Nts., 12/15/231 | | | | | 340,000 | | | | 351,050 | |
| Eldorado International Finance GmbH, 8.625% Sr. Unsec. Nts., 6/16/211 | | | | | 260,000 | | | | 224,900 | |
| Fly Leasing Ltd.: | | | | | | | | | | |
| 6.375% Sr. Unsec. Nts., 10/15/21 | | | | | 1,290,000 | | | | 1,348,050 | |
| 6.75% Sr. Unsec. Nts., 12/15/20 | | | | | 875,000 | | | | 917,656 | |
| HD Supply, Inc.: | | | | | | | | | | |
| 5.25% Sr. Sec. Nts., 12/15/211 | | | | | 1,190,000 | | | | 1,259,913 | |
| 5.75% Sr. Unsec. Nts., 4/15/241 | | | | | 490,000 | | | | 518,518 | |
| Herc Rentals, Inc.: | | | | | | | | | | |
| 7.50% Sec. Nts., 6/1/221 | | | | | 745,000 | | | | 788,769 | |
| 7.75% Sec. Nts., 6/1/241 | | | | | 500,000 | | | | 528,125 | |
| Standard Industries, Inc., 6% Sr. Unsec. Nts., 10/15/251 | | | | | 1,265,000 | | | | 1,337,737 | |
| United Rentals North America, Inc.: | | | | | | | | | | |
| 4.625% Sr. Sec. Nts., 7/15/23 | | | | | 1,245,000 | | | | 1,274,569 | |
| 5.875% Sr. Unsec. Nts., 9/15/26 | | | | | 1,235,000 | | | | 1,276,681 | |
| | | | | | | | | 11,448,614 | |
| | | | | | | | | | |
| | | | | Principal Amount | | | Value | |
Transportation Infrastructure—0.1% | |
| Aeropuerto Internacional de Tocumen SA, 5.625% Sr. Sec. Nts., 5/18/3610 | | | | $ | 1,075,000 | | | $ | 1,119,344 | |
| DP World Ltd., 6.85% Sr. Unsec. Nts., 7/2/371 | | | | | 835,000 | | | | 894,265 | |
| | | | | | | | | | 2,013,609 | |
Information Technology—2.4% | |
Communications Equipment—0.4% | |
| Avaya, Inc., 7% Sr. Sec. Nts., 4/1/191 | | | | | 1,610,000 | | | | 1,416,800 | |
| CommScope Technologies Finance LLC, 6% Sr. Unsec. Nts., 6/15/251 | | | | | 975,000 | | | | 1,038,375 | |
| Infor US, Inc., 6.50% Sr. Unsec. Nts., 5/15/22 | | | | | 1,760,000 | | | | 1,839,200 | |
| Plantronics, Inc., 5.50% Sr. Unsec. Nts., 5/31/231 | | | | | 730,000 | | | | 739,125 | |
| Riverbed Technology, Inc., 8.875% Sr. Unsec. Nts., 3/1/231 | | | | | 535,000 | | | | 569,775 | |
| ViaSat, Inc., 6.875% Sr. Unsec. Nts., 6/15/20 | | | | | 476,000 | | | | 490,578 | |
| | | | | | | | | | 6,093,853 | |
Electronic Equipment, Instruments, & Components—0.3% | |
| Belden, Inc., 5.50% Sr. Sub. Nts., 9/1/221 | | | | | 2,065,000 | | | | 2,137,275 | |
| CDW LLC/CDW Finance Corp., 5% Sr. Unsec. Nts., 9/1/23 | | | | | 700,000 | | | | 702,625 | |
| Flex Ltd., 4.75% Sr. Unsec. Nts., 6/15/25 | | | | | 752,000 | | | | 795,996 | |
| Zebra Technologies Corp., 7.25% Sr. Unsec. Nts., 10/15/22 | | | | | 1,390,000 | | | | 1,518,575 | |
| | | | | | | | | | 5,154,471 | |
Internet Software & Services—0.1% | |
| Inception Merger Sub, Inc./Rackspace Hosting, Inc., 8.625% Sr. Unsec. Nts., 11/15/241 | | | | | 1,395,000 | | | | 1,480,025 | |
IT Services—0.6% | |
| Broadridge Financial Solutions, Inc., 3.40% Sr. Unsec. Nts., 6/27/26 | | | | | 474,000 | | | | 457,665 | |
| Fidelity National Information Services, Inc., 2.85% Sr. Unsec. Nts., 10/15/18 | | | | | 626,000 | | | | 637,043 | |
| First Data Corp.: | | | | | | | | | | |
| 5.00% Sr. Sec. Nts., 1/15/241 | | | | | 1,350,000 | | | | 1,362,245 | |
| 5.75% Sec. Nts., 1/15/241 | | | | | 910,000 | | | | 942,423 | |
| 7.00% Sr. Unsec. Nts., 12/1/231 | | | | | 3,055,000 | | | | 3,261,213 | |
| Harland Clarke Holdings Corp., 6.875% Sr. Sec. Nts., 3/1/201 | | | | | 1,880,000 | | | | 1,823,600 | |
| Sabre GLBL, Inc., 5.25% Sr. Sec. Nts., 11/15/231 | | | | | 1,585,000 | | | | 1,635,514 | |
| Total System Services, Inc., 2.375% Sr. Unsec. Nts., 6/1/18 | | | | | 506,000 | | | | 508,192 | |
| Xerox Corp.: | | | | | | | | | | |
| 2.95% Sr. Unsec. Nts., 3/15/17 | | | | | 222,000 | | | | 222,677 | |
| 6.75% Sr. Unsec. Nts., 2/1/17 | | | | | 111,000 | | | | 111,402 | |
| | | | | | | | | | 10,961,974 | |
Semiconductors & Semiconductor Equipment—0.2% | |
| Intel Corp., 4.90% Sr. Unsec. Nts., 7/29/45 | | | | | 156,000 | | | | 174,587 | |
| Micron Technology, Inc., 5.25% Sr. Unsec. Nts., 8/1/231 | | | | | 575,000 | | | | 580,031 | |
| NXP BV/NXP Funding LLC, 4.625% Sr. Unsec. Nts., 6/1/231 | | | | | 2,540,000 | | | | 2,673,350 | |
| Versum Materials, Inc., 5.50% Sr. Unsec. Nts., 9/30/241 | | | | | 250,000 | | | | 256,250 | |
| | | | | | | | | | 3,684,218 | |
Software—0.6% | |
| Activision Blizzard, Inc., 2.30% Sr. Unsec. Nts., 9/15/211 | | | | | 911,000 | | | | 889,139 | |
| Autodesk, Inc.: | | | | | | | | | | |
| 1.95% Sr. Unsec. Nts., 12/15/17 | | | | | 659,000 | | | | 660,244 | |
| 4.375% Sr. Unsec. Nts., 6/15/25 | | | | | 185,000 | | | | 190,130 | |
23 OPPENHEIMER GLOBAL STRATEGIC INCOME FUND/VA
| | | | | | | | | | |
| | | | | Principal Amount | | | Value | |
Software (Continued) | | | | | | | | | | |
| BMC Software Finance, Inc., 8.125% Sr. Unsec. Nts., 7/15/211 | | | | $ | 1,225,000 | | | $ | 1,150,734 | |
| Diamond 1 Finance Corp./Diamond 2 Finance Corp.: | | | | | | | | | | |
| 3.48% Sr. Sec. Nts., 6/1/191 | | | | | 971,000 | | | | 991,522 | |
| 5.875% Sr. Unsec. Nts., 6/15/211 | | | | | 710,000 | | | | 755,426 | |
| 6.02% Sr. Sec. Nts., 6/15/261 | | | | | 577,000 | | | | 625,361 | |
| 7.125% Sr. Unsec. Nts., 6/15/241 | | | | | 745,000 | | | | 827,208 | |
| Infor Software Parent LLC/Infor Software Parent, Inc., 7.125% Sr. Unsec. Nts., 5/1/211,12 | | | | | 1,505,000 | | | | 1,550,150 | |
| Informatica LLC, 7.125% Sr. Unsec. Nts., 7/15/231 | | | | | 595,000 | | | | 569,712 | |
| Open Text Corp., 5.625% Sr. Unsec. Nts., 1/15/231 | | | | | 401,000 | | | | 420,047 | |
| Oracle Corp., 2.40% Sr. Unsec. Nts., 9/15/23 | | | | | 575,000 | | | | 556,917 | |
| Veritas US, Inc./Veritas Bermuda Ltd., 7.50% Sr. Sec. Nts., 2/1/231 | | | | | 755,000 | | | | 707,813 | |
| | | | | | | | | | 9,894,403 | |
Technology Hardware, Storage & Peripherals—0.2% | |
| Apple, Inc., 4.375% Sr. Unsec. Nts., 5/13/45 | | | | | 452,000 | | | | 464,545 | |
| Hewlett Packard Enterprise Co.: | | | | | | | | | | |
| 2.45% Sr. Unsec. Nts., 10/5/17 | | | | | 693,000 | | | | 696,946 | |
| 6.35% Sr. Unsec. Nts., 10/15/45 | | | | | 406,000 | | | | 410,780 | |
| NCR Corp., 6.375% Sr. Unsec. Nts., 12/15/23 | | | | | 520,000 | | | | 560,300 | |
| Western Digital Corp., 10.50% Sr. Unsec. Nts., 4/1/241 | | | | | 875,000 | | | | 1,036,875 | |
| | | | | | | | | | 3,169,446 | |
Materials—4.5% | |
Chemicals—1.3% | | | | | | | | | | |
| Agrium, Inc.: | | | | | | | | | | |
| 3.375% Sr. Unsec. Nts., 3/15/25 | | | | | 258,000 | | | | 250,029 | |
| 4.125% Sr. Unsec. Nts., 3/15/35 | | | | | 129,000 | | | | 118,464 | |
| Blue Cube Spinco, Inc., 9.75% Sr. Unsec. Nts., 10/15/23 | | | | | 645,000 | | | | 770,775 | |
| CF Industries, Inc., 4.50% Sr. Sec. Nts., 12/1/261 | | | | | 434,000 | | | | 426,803 | |
| Chemours Co. (The), 6.625% Sr. Unsec. Nts., 5/15/23 | | | | | 780,000 | | | | 776,100 | |
| Eastman Chemical Co., 4.65% Sr. Unsec. Nts., 10/15/44 | | | | | 187,000 | | | | 185,818 | |
| Ecolab, Inc.: | | | | | | | | | | |
| 2.00% Sr. Unsec. Nts., 1/14/19 | | | | | 803,000 | | | | 803,839 | |
| 3.70% Sr. Unsec. Nts., 11/1/46 | | | | | 154,000 | | | | 140,333 | |
| Hexion, Inc.: | | | | | | | | | | |
| 6.625% Sr. Sec. Nts., 4/15/20 | | | | | 2,540,000 | | | | 2,260,600 | |
| 8.875% Sec. Nts., 2/1/18 | | | | | 1,155,000 | | | | 1,155,000 | |
| Huntsman International LLC, 5.125% Sr. Unsec. Nts., 11/15/22 | | | | | 1,010,000 | | | | 1,035,250 | |
| Kallpa Generacion SA, 4.875% Sr. Unsec. Nts., 5/24/261 | | | | | 370,000 | | | | 374,625 | |
| LyondellBasell Industries NV, 5% Sr. Unsec. Nts., 4/15/19 | | | | | 895,000 | | | | 945,336 | |
| NOVA Chemicals Corp.: | | | | | | | | | | |
| 5.00% Sr. Unsec. Nts., 5/1/251 | | | | | 250,000 | | | | 245,547 | |
| 5.25% Sr. Unsec. Nts., 8/1/231 | | | | | 495,000 | | | | 501,806 | |
| ONGC Videsh Ltd.: | | | | | | | | | | |
| 2.75% Sr. Unsec. Nts., 7/15/21 | | EUR | | | 1,035,000 | | | | 1,157,760 | |
| 4.625% Sr. Unsec. Nts., 7/15/24 | | | | | 1,365,000 | | | | 1,404,210 | |
| Platform Specialty Products Corp., 6.50% Sr. Unsec. Nts., 2/1/221 | | | | | 1,435,000 | | | | 1,452,938 | |
| PolyOne Corp., 5.25% Sr. Unsec. Nts., 3/15/23 | | | | | 923,000 | | | | 941,460 | |
| PQ Corp., 6.75% Sr. Sec. Nts., 11/15/221 | | | 1,960,000 | | | | 2,102,100 | |
| | | | | | | | | | |
| | | | | Principal Amount | | | Value | |
Chemicals (Continued) | | | | | | | | | | |
| RPM International, Inc., 3.45% Sr. Unsec. Unsub. Nts., 11/15/22 | | | | $ | 692,000 | | | $ | 686,310 | |
| Techniplas LLC, 10% Sr. Sec. Nts., 5/1/201 | | | | | 1,395,000 | | | | 1,217,138 | |
| Tronox Finance LLC: | | | | | | | | | | |
| 6.375% Sr. Unsec. Nts., 8/15/20 | | | | | 1,965,000 | | | | 1,847,100 | |
| 7.50% Sr. Unsec. Nts., 3/15/221 | | | | | 670,000 | | | | 628,125 | |
| UPL Corp. Ltd., 3.25% Sr. Unsec. Nts., 10/13/211 | | | | | 500,000 | | | | 486,912 | |
| Valspar Corp. (The), 3.95% Sr. Unsec. Nts., 1/15/26 | | | | | 418,000 | | | | 418,088 | |
| Yara International ASA, 3.80% Sr. Unsec. Nts., 6/6/261 | | | | | 585,000 | | | | 573,759 | |
| | | | | | | | | | 22,906,225 | |
Construction Materials—0.3% | |
| Cemex SAB de CV, 5.70% Sr. Sec. Nts., 1/11/251 | | | | | 745,000 | | | | 752,450 | |
| CRH America, Inc., 5.125% Sr. Unsec. Nts., 5/18/451 | | | | | 678,000 | | | | 707,380 | |
| Globo Comunicacao e Participacoes SA, 4.843% Sr. Unsec. Nts., 6/8/251,2 | | | | | 1,750,000 | | | | 1,684,375 | |
| James Hardie International Finance Ltd., 5.875% Sr. Unsec. Nts., 2/15/231 | | | | | 431,000 | | | | 448,240 | |
| LafargeHolcim Finance US LLC, 3.50% Sr. Unsec. Nts., 9/22/261 | | | | | 231,000 | | | | 224,641 | |
| St Marys Cement, Inc., 5.75% Sr. Unsec. Nts., 1/28/271 | | | | | 450,000 | | | | 433,687 | |
| US Concrete, Inc., 6.375% Sr. Unsec. Nts., 6/1/24 | | | | | 745,000 | | | | 789,700 | |
| | | | | | | | | | 5,040,473 | |
Containers & Packaging—0.9% | |
| Ball Corp.: | | | | | | | | | | |
| 5.00% Sr. Unsec. Nts., 3/15/22 | | | | | 1,225,000 | | | | 1,287,781 | |
| 5.25% Sr. Unsec. Nts., 7/1/25 | | | | | 40,000 | | | | 41,950 | |
| Berry Plastics Corp., 5.125% Sec. Nts., 7/15/23 | | | | | 2,200,000 | | | | 2,249,500 | |
| Coveris Holdings SA, 7.875% Sr. Unsec. Nts., 11/1/191 | | | | | 1,880,000 | | | | 1,875,300 | |
| Crown Americas LLC/Crown Americas Capital Corp. IV, 4.50% Sr. Unsec. Nts., 1/15/23 | | | | | 1,000,000 | | | | 1,025,000 | |
| Graphic Packaging International, Inc., 4.125% Sr. Unsec. Nts., 8/15/24 | | | | | 765,000 | | | | 732,487 | |
| International Paper Co.: | | | | | | | | | | |
| 3.00% Sr. Unsec. Nts., 2/15/27 | | | | | 448,000 | | | | 422,905 | |
| 4.80% Sr. Unsec. Nts., 6/15/44 | | | | | 378,000 | | | | 376,165 | |
| Klabin Finance SA, 5.25% Sr. Unsec. Nts., 7/16/241 | | | | | 1,295,000 | | | | 1,233,487 | |
| Owens-Brockway Glass Container, Inc., 5% Sr. Unsec. Nts., 1/15/221 | | | | | 1,245,000 | | | | 1,277,681 | |
| Packaging Corp. of America, 4.50% Sr. Unsec. Nts., 11/1/23 | | | | | 690,000 | | | | 731,148 | |
Reynolds Group Issuer, Inc./Reynolds
Group Issuer LLC/Reynolds Group
Issuer Luxembourg SA: | |
| 5.125% Sr. Sec. Nts., 7/15/231 | | | | | 745,000 | | | | 758,037 | |
| 7.00% Sr. Unsec. Nts., 7/15/241 | | | | | 1,415,000 | | | | 1,506,091 | |
| Sealed Air Corp.: | | | | | | | | | | |
| 4.875% Sr. Unsec. Nts., 12/1/221 | | | | | 1,150,000 | | | | 1,185,938 | |
| 5.125% Sr. Unsec. Nts., 12/1/241 | | | | | 645,000 | | | | 665,963 | |
| | | | | | | | | | 15,369,433 | |
Metals & Mining—1.8% | |
| ABJA Investment Co. Pte Ltd., 5.95% Sr. Unsec. Nts., 7/31/24 | | | | | 2,490,000 | | | | 2,443,661 | |
| Alcoa Nederland Holding BV: | |
| 6.75% Sr. Unsec. Nts., 9/30/241 | | | | | 245,000 | | | | 266,437 | |
| 7.00% Sr. Unsec. Nts., 9/30/261 | | | | | 240,000 | | | | 263,400 | |
24 OPPENHEIMER GLOBAL STRATEGIC INCOME FUND/VA
| | | | | | | | | | |
| | | | | Principal Amount | | | Value | |
Metals & Mining (Continued) | |
| Aleris International, Inc., 7.875% Sr. Unsec. Nts., 11/1/20 | | | | $ | 1,402,000 | | | $ | 1,412,515 | |
| BHP Billiton Finance USA Ltd., 1.625% Sr. Unsec. Nts., 2/24/17 | | | | | 965,000 | | | | 965,746 | |
| Cliffs Natural Resources, Inc.: | | | | | | | | | | |
| 5.90% Sr. Unsec. Nts., 3/15/20 | | | | | 530,000 | | | | 514,100 | |
| 8.00% Sec. Nts., 9/30/201 | | | | | 735,000 | | | | 768,075 | |
| Constellium NV: | | | | | | | | | | |
| 5.75% Sr. Unsec. Nts., 5/15/241 | | | | | 1,250,000 | | | | 1,175,000 | |
| 8.00% Sr. Unsec. Nts., 1/15/231 | | | | | 470,000 | | | | 491,150 | |
| Evraz Group SA, 6.75% Sr. Unsec. Nts., 1/31/2213 | | | | | 380,000 | | | | 397,575 | |
| First Quantum Minerals Ltd.: | | | | | | | | | | |
| 7.00% Sr. Unsec. Nts., 2/15/211 | | | | | 690,000 | | | | 689,724 | |
| 7.25% Sr. Unsec. Nts., 5/15/221 | | | | | 2,050,000 | | | | 2,029,500 | |
| Freeport-McMoRan, Inc.: | | | | | | | | | | |
| 2.15% Sr. Unsec. Nts., 3/1/17 | | | | | 450,000 | | | | 447,750 | |
| 2.30% Sr. Unsec. Nts., 11/14/17 | | | | | 3,040,000 | | | | 3,032,400 | |
| 5.40% Sr. Unsec. Nts., 11/14/34 | | | | | 915,000 | | | | 773,175 | |
| 6.125% Sr. Unsec. Nts., 6/15/191 | | | | | 500,000 | | | | 513,750 | |
| Glencore Finance Canada Ltd., 3.60% Sr. Unsec. Nts., 1/15/171 | | | | | 962,000 | | | | 962,444 | |
| Goldcorp, Inc., 5.45% Sr. Unsec. Nts., 6/9/44 | | | | | 261,000 | | | | 256,464 | |
| HudBay Minerals, Inc.: | | | | | | | | | | |
| 7.25% Sr. Unsec. Nts., 1/15/231 | | | | | 380,000 | | | | 394,250 | |
| 7.625% Sr. Unsec. Nts., 1/15/251 | | | | | 505,000 | | | | 526,149 | |
| Metalloinvest Finance DAC, 5.625% Unsec. Nts., 4/17/201 | | | | | 335,000 | | | | 352,667 | |
| Novelis Corp.: | | | | | | | | | | |
| 5.875% Sr. Unsec. Nts., 9/30/261 | | | | | 1,250,000 | | | | 1,265,625 | |
| 6.25% Sr. Unsec. Nts., 8/15/241 | | | | | 500,000 | | | | 531,250 | |
| Polyus Gold International Ltd., 4.699% Sr. Unsec. Nts., 3/28/221 | | | | | 445,000 | | | | 439,438 | |
| Rio Tinto Finance USA Ltd., 3.75% Sr. Unsec. Nts., 6/15/25 | | | | | 390,000 | | | | 401,815 | |
| Southern Copper Corp., 5.875% Sr. Unsec. Nts., 4/23/45 | | | | | 1,315,000 | | | | 1,294,941 | |
| SunCoke Energy Partners LP/SunCoke Energy Partners Finance Corp.: | | | | | | | | | | |
| 7.375% Sr. Unsec. Nts., 2/1/201 | | | | | 475,000 | | | | 475,000 | |
| 7.375% Sr. Unsec. Nts., 2/1/20 | | | | | 280,000 | | | | 280,000 | |
| 7.375% Sr. Unsec. Nts., 2/1/201 | | | | | 505,000 | | | | 505,000 | |
| Teck Resources Ltd.: | | | | | | | | | | |
| 5.20% Sr. Unsec. Nts., 3/1/42 | | | | | 1,225,000 | | | | 1,084,125 | |
| 6.125% Sr. Unsec. Nts., 10/1/35 | | | | | 550,000 | | | | 537,625 | |
| 8.00% Sr. Unsec. Nts., 6/1/211 | | | | | 250,000 | | | | 275,625 | |
| 8.50% Sr. Unsec. Nts., 6/1/241 | | | | | 250,000 | | | | 288,750 | |
| United States Steel Corp., 8.375% Sr. Sec. Nts., 7/1/211 | | | | | 495,000 | | | | 548,475 | |
| Vale Overseas Ltd., 6.25% Sr. Unsec. Nts., 8/10/26 | | | | | 1,805,000 | | | | 1,881,713 | |
| Wise Metals Group LLC/Wise Alloys Finance Corp., 8.75% Sr. Sec. Nts., 12/15/181 | | | | | 560,000 | | | | 585,200 | |
| Zekelman Industries, Inc., 9.875% Sr. Sec. Nts., 6/15/231 | | | | | 805,000 | | | | 903,613 | |
| | | | | | | | | | 29,974,127 | |
Paper & Forest Products—0.2% | |
| Georgia-Pacific LLC, 2.539% Sr. Unsec. Nts., 11/15/191 | | | | | 212,000 | | | | 213,899 | |
| Louisiana-Pacific Corp., 4.875% Sr. Unsec. Nts., 9/15/24 | | | | | 968,000 | | | | 941,380 | |
| Mercer International, Inc., 7.75% Sr. Unsec. Nts., 12/1/22 | | | | | 500,000 | | | | 527,500 | |
| Suzano Austria GmbH, 5.75% Sr. Unsec. Nts., 7/14/261 | | | | | 1,030,000 | | | | 995,238 | |
| | | | | | | | | | |
| | | | | Principal Amount | | | Value | |
Paper & Forest Products (Continued) | |
| Tembec Industries, Inc., 9% Sr. Sec. Nts., 12/15/191 | | | | $ | 750,000 | | | $ | 705,000 | |
| | | | | | | | | | 3,383,017 | |
Telecommunication Services—2.3% | |
Diversified Telecommunication Services—1.8% | |
| AT&T, Inc.: | | | | | | | | | | |
| 2.80% Sr. Unsec. Nts., 2/17/21 | | | | | 994,000 | | | | 986,242 | |
| 4.35% Sr. Unsec. Nts., 6/15/45 | | | | | 763,000 | | | | 681,181 | |
| British Telecommunications plc, 9.375% Sr. Unsec. Nts., 12/15/30 | | | | | 719,000 | | | | 1,097,638 | |
| CenturyLink, Inc.: | | | | | | | | | | |
| 6.45% Sr. Unsec. Nts., Series S, 6/15/21 | | | | | 1,940,000 | | | | 2,051,550 | |
| 7.50% Sr. Unsec. Nts., Series Y, 4/1/24 | | | | | 1,235,000 | | | | 1,299,837 | |
| Deutsche Telekom International Finance BV, 2.25% Sr. Unsec. Nts., 3/6/171 | | | | | 958,000 | | | | 959,401 | |
| FairPoint Communications, Inc., 8.75% Sr. Sec. Nts., 8/15/191 | | | | | 3,600,000 | | | | 3,762,000 | |
| Frontier Communications Corp.: | | | | | | | | | | |
| 7.125% Sr. Unsec. Nts., 1/15/23 | | | | | 2,190,000 | | | | 1,992,900 | |
| 10.50% Sr. Unsec. Nts., 9/15/22 | | | | | 1,595,000 | | | | 1,682,805 | |
| 11.00% Sr. Unsec. Nts., 9/15/25 | | | | | 1,650,000 | | | | 1,709,813 | |
| Level 3 Financing, Inc.: | | | | | | | | | | |
| 5.25% Sr. Unsec. Nts., 3/15/261 | | | | | 1,195,000 | | | | 1,186,037 | |
| 5.625% Sr. Unsec. Nts., 2/1/23 | | | | | 1,930,000 | | | | 1,983,075 | |
| Telecom Italia Capital SA, 7.721% Sr. Unsec. Unsub. Nts., 6/4/38 | | | | | 2,141,000 | | | | 2,221,287 | |
| Telefonica Emisiones SAU: | | | | | | | | | | |
| 3.192% Sr. Unsec. Nts., 4/27/18 | | | | | 577,000 | | | | 585,403 | |
| 7.045% Sr. Unsec. Unsub. Nts., 6/20/36 | | | | | 228,000 | | | | 265,014 | |
| T-Mobile USA, Inc., 6% Sr. Unsec. Nts., 4/15/24 | | | | | 985,000 | | | | 1,040,406 | |
| Verizon Communications, Inc.: | | | | | | | | | | |
| 1.75% Sr. Unsec. Nts., 8/15/21 | | | | | 665,000 | | | | 638,036 | |
| 4.125% Sr. Unsec. Nts., 8/15/46 | | | | | 394,000 | | | | 357,312 | |
| 4.50% Sr. Unsec. Nts., 9/15/20 | | | | | 1,071,000 | | | | 1,146,232 | |
| 4.522% Sr. Unsec. Nts., 9/15/48 | | | | | 494,000 | | | | 474,684 | |
| Windstream Services LLC: | | | | | | | | | | |
| 6.375% Sr. Unsec. Nts., 8/1/23 | | | | | 1,155,000 | | | | 1,036,613 | |
| 7.75% Sr. Unsec. Nts., 10/1/21 | | | | | 1,285,000 | | | | 1,327,405 | |
| Zayo Group LLC/Zayo Capital, Inc., 6% Sr. Unsec. Nts., 4/1/23 | | | | | 1,345,000 | | | | 1,405,525 | |
| | | | | | | | | | 29,890,396 | |
Wireless Telecommunication Services—0.5% | |
| Digicel Ltd., 6.75% Sr. Unsec. Nts., 3/1/231 | | | | | 1,440,000 | | | | 1,305,547 | |
| Sprint Communications, Inc.: | | | | | | | | | | |
| 6.00% Sr. Unsec. Nts., 11/15/22 | | | | | 1,975,000 | | | | 1,994,750 | |
| 7.00% Sr. Unsec. Nts., 3/1/201 | | | | | 1,315,000 | | | | 1,430,062 | |
| Sprint Corp.: | | | | | | | | | | |
| 7.125% Sr. Unsec. Nts., 6/15/24 | | | | | 2,505,000 | | | | 2,586,413 | |
| 7.875% Sr. Unsec. Nts., 9/15/23 | | | | | 1,915,000 | | | | 2,049,050 | |
| | | | | | | | | | 9,365,822 | |
Utilities—2.1% | |
Electric Utilities—0.6% | | | | | | | | | | |
| AEP Texas Central Co., 3.85% Sr. Unsec. Nts., 10/1/251 | | | | | 291,000 | | | | 298,916 | |
| Cleco Corporate Holdings LLC, 3.743% Sr. Sec. Nts., 5/1/261 | | | | | 482,000 | | | | 474,944 | |
| Duke Energy Corp., 3.75% Sr. Unsec. Nts., 9/1/46 | | | | | 451,000 | | | | 406,868 | |
| Edison International, 2.95% Sr. Unsec. Nts., 3/15/23 | | | | | 539,000 | | | | 533,412 | |
| Emera US Finance LP, 2.15% Sr. Unsec. Nts., 6/15/191 | | | | | 434,000 | | | | 433,356 | |
| Enel Americas SA, 4% Sr. Unsec. Nts., 10/25/26 | | | | | 400,000 | | | | 382,504 | |
25 OPPENHEIMER GLOBAL STRATEGIC INCOME FUND/VA
| | | | | | | | | | |
| | | | | Principal Amount | | | Value | |
Electric Utilities (Continued) | |
| Enel Finance International NV, 6.25% Sr. Unsec. Nts., 9/15/171 | | | | $ | 728,000 | | | $ | 750,424 | |
| Entergy Texas, Inc., 7.125% Sec. Nts., 2/1/19 | | | | | 263,000 | | | | 289,470 | |
| Exelon Corp., 4.45% Sr. Unsec. Nts., 4/15/46 | | | | | 243,000 | | | | 238,363 | |
| Indiana Michigan Power Co., Series K, 4.55% Sr. Unsec. Nts., 3/15/46 | | | | | 202,000 | | | | 209,936 | |
| ITC Holdings Corp., 5.30% Sr. Unsec. Nts., 7/1/43 | | | | | 241,000 | | | | 264,109 | |
| NextEra Energy Capital Holdings, Inc., 1.586% Sr. Unsec. Nts., 6/1/17 | | | | | 793,000 | | | | 793,533 | |
| PPL WEM Ltd./Western Power Distribution Ltd., 5.375% Sr. Unsec. Unsub. Nts., 5/1/211 | | | | | 1,280,000 | | | | 1,381,325 | |
| Public Service Co. of New Mexico, 7.95% Sr. Unsec. Nts., 5/15/18 | | | | | 523,000 | | | | 564,709 | |
| Southern Power Co., 1.95% Sr. Unsec. Nts., 12/15/19 | | | | | 829,000 | | | | 821,250 | |
| TECO Finance, Inc., 6.572% Sr. Unsec. Nts., 11/1/17 | | | | | 650,000 | | | | 674,850 | |
| Trans-Allegheny Interstate Line Co., 3.85% Sr. Unsec. Nts., 6/1/251 | | | | | 568,000 | | | | 575,671 | |
| Xcel Energy, Inc., 3.30% Sr. Unsec. Nts., 6/1/25 | | | | | 431,000 | | | | 431,337 | |
| | | | | | | | | | 9,524,977 | |
Gas Utilities—0.1% | |
| Ferrellgas LP/Ferrellgas Finance Corp.: | | | | | | | | | | |
| 6.50% Sr. Unsec. Nts., 5/1/21 | | | | | 660,000 | | | | 656,700 | |
| 6.75% Sr. Unsec. Nts., 6/15/23 | | | | | 930,000 | | | | 918,375 | |
| | | | | | | | | | 1,575,075 | |
Independent Power and Renewable Electricity Producers—1.2% | |
| AES Andres BV/Dominican Power Partners/Empresa Generadora de Electricidad It, 7.95% Sr. Unsec. Nts., 5/11/261 | | | | | 790,000 | | | | 818,021 | |
| AES Corp., 6% Sr. Unsec. Nts., 5/15/26 | | | | | 2,120,000 | | | | 2,162,400 | |
| Calpine Corp.: | | | | | | | | | | |
| 5.25% Sr. Sec. Nts., 6/1/261 | | | | | 740,000 | | | | 732,600 | |
| 5.375% Sr. Unsec. Nts., 1/15/23 | | | | | 460,000 | | | | 451,950 | |
| 5.75% Sr. Unsec. Nts., 1/15/25 | | | | | 560,000 | | | | 543,200 | |
| Dynegy, Inc.: | | | | | | | | | | |
| 5.875% Sr. Unsec. Nts., 6/1/23 | | | | | 420,000 | | | | 366,450 | |
| 6.75% Sr. Unsec. Nts., 11/1/19 | | | | | 1,150,000 | | | | 1,175,875 | |
| 7.375% Sr. Unsec. Nts., 11/1/22 | | | | | 1,580,000 | | | | 1,516,800 | |
| 8.00% Sr. Unsec. Nts., 1/15/251 | | | | | 760,000 | | | | 712,500 | |
| Energy Future Intermediate Holding Co. LLC/EFIH Finance, Inc., 12.25% Sec. Nts., 3/1/221,8 | | | | | 1,487,674 | | | | 2,030,675 | |
| GenOn Energy, Inc., 9.50% Sr. Unsec. Nts., 10/15/18 | | | | | 935,000 | | | | 665,603 | |
| Listrindo Capital BV, 4.95% Sr. Unsec. Nts., 9/14/261 | | | | | 2,015,000 | | | | 1,965,776 | |
| Miran Mid-Atlantic Trust, 10.06% Sec. Pass-Through Certificates, Series C, 12/30/28 | | | | | 662,520 | | | | 570,374 | |
| NRG Energy, Inc.: | | | | | | | | | | |
| 6.625% Sr. Unsec. Nts., 3/15/23 | | | | | 785,000 | | | | 790,888 | |
| 7.25% Sr. Unsec. Nts., 5/15/261 | | | | | 2,485,000 | | | | 2,485,000 | |
| Talen Energy Supply LLC: | | | | | | | | | | |
| 4.625% Sr. Unsec. Nts., 7/15/191 | | | | | 585,000 | | | | 557,213 | |
| 6.50% Sr. Unsec. Nts., 6/1/25 | | | | | 1,930,000 | | | | 1,500,575 | |
| Trinidad Generation UnLtd, 5.25% Sr. Unsec. Nts., 11/4/271 | | | | | 505,000 | | | | 492,925 | |
| | | | | | | | | 19,538,825 | |
| | | | | | | | | | |
| | | | | Principal Amount | | | Value | |
Multi-Utilities—0.2% | |
| CenterPoint Energy, Inc., 5.95% Sr. Unsec. Nts., 2/1/17 | | | | $ | 200,000 | | | $ | 200,684 | |
| CMS Energy Corp.: | | | | | | | | | | |
| 3.875% Sr. Unsec. Nts., 3/1/24 | | | | | 740,000 | | | | 769,933 | |
| 5.05% Sr. Unsec. Unsub. Nts., 3/15/22 | | | | | 83,000 | | | | 90,939 | |
| InterGen NV, 7% Sr. Sec. Nts., 6/30/231 | | | | | 1,055,000 | | | | 944,225 | |
| NiSource Finance Corp.: | | | | | | | | | | |
| 4.80% Sr. Unsec. Nts., 2/15/44 | | | | | 418,000 | | | | 440,914 | |
| 6.80% Sr. Unsec. Nts., 1/15/19 | | | | | 843,000 | | | | 920,302 | |
| Public Service Enterprise Group, Inc., 1.60% Sr. Unsec. Nts., 11/15/19 | | | | | 871,000 | | | | 858,974 | |
| | | | | | | | | 4,225,971 | |
Total Corporate Bonds and Notes
(Cost $781,200,831) | | | | 782,829,207 | |
| | | |
| | | | | | Shares | | | | | |
Common Stocks—0.2% | | | | | | | | | | |
| Arco Capital Corp. Ltd.1,14,15 | | | | | 690,638 | | | | — | |
| JP Morgan International, GDR1,14 | | | | | 446,838 | | | | — | |
| NuStar Energy LP18 | | | | | 13,102 | | | | 652,480 | |
| Premier Holdings Ltd.14 | | | | | 18,514 | | | | — | |
| Quicksilver Resources, Inc.14 | | | | | 4,151,000 | | | | 149,021 | |
| Sabine Oil14 | | | | | 824 | | | | 40,376 | |
| Teck Resources Ltd., Cl. B | | | | | 30,971 | | | | 620,349 | |
| Valeant Pharmaceuticals International, Inc.14 | | | 108,823 | | | | 1,580,110 | |
| Wallace Theater Holdings, Inc.1,14 | | | | | 1,525 | | | | 15 | |
| Total Common Stocks (Cost $8,260,778) | | | | 3,042,351 | |
| | | |
| | | | | | Units | | | | | |
Rights, Warrants and Certificates—0.0% | |
| MediaNews Group, Inc. Wts., Strike Price $0.001, Exp. 3/19/1714 | | | | | 22,685 | | | | — | |
| Sabine Oil Tranche 1 Wts., Strike Price $4.49, Exp. 8/11/2614 | | | | | 2,611 | | | | 19,582 | |
| Sabine Oil Tranche 2 Wts., Strike Price $2.72, | | | | | | | | | | |
| Exp. 8/11/2614 | | | | | 465 | | | | 3,023 | |
Total Rights, Warrants and Certificates
(Cost $6,682,364) | | | | 22,605 | |
| | | |
| | | | | | Principal Amount | | | | | |
Structured Securities—0.5% | |
| Deutsche Bank AG, Coriolanus Ltd. Sec. Credit Linked Bonds: | |
| 3.098%, 4/30/251,16 | | | | $ | 1,268,396 | | | | 660,558 | |
| 3.003%, 4/30/251,16 | | | | | 1,153,058 | | | | 600,491 | |
| 3.054%, 4/30/251,16 | | | | | 1,469,174 | | | | 765,119 | |
| 3.131%, 4/30/251,16 | | | | | 1,133,786 | | | | 590,455 | |
| 3.179%, 4/30/251,16 | | | | | 1,411,656 | | | | 735,164 | |
| 3.231%, 4/30/251,16 | | | | | 1,611,190 | | | | 839,079 | |
| 3.265%, 4/30/251,16 | | | | | 1,287,153 | | | | 670,326 | |
| 3.346%, 4/30/251,16 | | | | | 1,209,869 | | | | 630,078 | |
| 72.268%, 12/31/1710,11 | | BRL | | | 5,140,000 | | | | 2,665,255 | |
| LB Peru Trust II Certificates, Series 1998- A, 3.796%, 2/28/168,16 | | | | | 2,994 | | | | — | |
| Morgan Stanley, Russian Federation Total Return Linked Bonds, Series 007, Cl. VR, 5%, 8/22/34 | | RUB | | | 32,561,994 | | | | 234,207 | |
Total Structured Securities (Cost $12,048,069) | | | | 8,390,732 | |
Short-Term Note—7.1% | |
| United States Treasury Bills, 0.485%, 3/16/176,16,17 (Cost $119,879,133) | | | | | 120,000,000 | | | | 119,881,200 | |
| | | |
| | | | | | Shares | | | | | |
Investment Companies—18.2% | |
| Oppenheimer Institutional Government Money Market Fund, Cl. E, 0.43%19,20 | | | | | 38,454,698 | | | | 38,454,698 | |
| Oppenheimer Master Event-Linked Bond Fund, LLC20 | | | | | 2,520,983 | | | | 40,463,664 | |
| Oppenheimer Master Loan Fund, LLC20 | | | | | 12,870,585 | | | | 207,632,814 | |
| Oppenheimer Ultra-Short Duration Fund, Cl. Y20 | | | | | 4,042,818 | | | | 20,254,519 | |
| Total Investment Companies (Cost $301,279,863) | | | | 306,805,695 | |
26 OPPENHEIMER GLOBAL STRATEGIC INCOME FUND/VA
| | | | | | | | | | | | | | | | | | | | | | | | | | | | | | | | |
| | | Counterparty | | | | | | Exercise Price | | | | | | Expiration Date | | | | | | Contracts | | | Value | |
| |
| Over-the-Counter Options Purchased—0.1% | | | | | | | | | | | | | | | | | | | | | |
| |
| AUD Currency Call14 | | | BAC | | | | NZD | | | | 1.085 | | | | | | | | 1/23/17 | | | | AUD | | | | 19,385,902 | | | $ | 831 | |
| |
| BRL Currency Call14 | | | HSBC | | | | BRL | | | | 3.160 | | | | | | | | 1/27/17 | | | | BRL | | | | 39,500,000 | | | | 56,129 | |
| |
| EUR Currency Put14 | | | BNP | | | | EUR | | | | 1.010 | | | | | | | | 2/10/17 | | | | EUR | | | | 18,159,835 | | | | 46,398 | |
| |
| EUR Currency Put14 | | | BAC | | | | PLN | | | | 4.400 | | | | | | | | 3/6/17 | | | | EUR | | | | 6,470,000 | | | | 59,216 | |
| |
| KRW Currency Put14 | | | BAC | | | | KRW | | | | 1200.000 | | | | | | | | 6/15/17 | | | | KRW | | | | 40,470,490,000 | | | | 1,133,174 | |
| |
| MXN Currency Put14 | | | CITNA-B | | | | MXN | | | | 21.100 | | | | | | | | 3/1/17 | | | | MXN | | | | 548,540,044 | | | | 411,405 | |
| |
| TWD Currency Put14 | | | HSBC | | | | TWD | | | | 32.750 | | | | | | | | 3/23/17 | | | | TWD | | | | 409,400,000 | | | | 137,149 | |
| | | | | | | | | | | | | | | | | | | | | | | | | | | | | | | | |
Total Over-the-Counter Options Purchased (Cost $2,108,649) | | | | | | | | | | | | | | | | 1,844,302 | |
| | | | | | | | | | | | | | | | | | | | | | | | | | | | | | | | |
| | | | | | | |
| | | Counterparty | | | Pay / Receive
Floating Rate | | | Floating Rate | | | Fixed Rate | | | Expiration
Date | | | Notional Amount (000’s) | | | | |
| |
| Over-the-Counter Interest Rate Swaption Purchased—0.1% | | | | | | | | | | | | | | | | | | | | | |
| |
| Interest Rate Swap maturing 3/2/27 Call14 (Cost $716,030) | | | BAC | | | | Pay | | |
| Three-Month USD
BBA LIBOR |
| | | 2.250% | | | | 2/28/17 | | | | USD | | | | 52,000 | | | | 918,199 | |
| | | | | | | | | | | | | | | | | | | | | | | | | | | | | | | | |
| |
| Total Investments, at Value (Cost $1,748,004,634) | | | | 103.2% | | | | 1,739,864,922 | |
| |
| Net Other Assets (Liabilities) | | | | | | | | | | | | | | | | (3.2) | | | | (54,534,831) | |
| | | | | | | | | | | | | | | | | | | | | | | | | | | | |
| Net Assets | | | | | | | | | | | | | | | | | | | | | | | | | | | 100.0% | | | $ | 1,685,330,091 | |
| | | | | | | | | | | | | | | | | | | | | | | | | | | | |
Consolidated Footnotes to Statement of Investments
1. Represents securities sold under Rule 144A, which are exempt from registration under the Securities Act of 1933, as amended. These securities have been determined to be liquid under guidelines established by the Board of Trustees. These securities amount to $508,053,612 or 30.15% of the Fund’s net assets at period end.
2. Represents the current interest rate for a variable or increasing rate security.
3. Interest-Only Strips represent the right to receive the monthly interest payments on an underlying pool of mortgage loans. These securities typically decline in price as interest rates decline. Most other fixed income securities increase in price when interest rates decline. The principal amount of the underlying pool represents the notional amount on which current interest is calculated. The price of these securities is typically more sensitive to changes in prepayment rates than traditional mortgage-backed securities (for example, GNMA pass-throughs). Interest rates disclosed represent current yields based upon the current cost basis and estimated timing and amount of future cash flows. These securities amount to $3,127,544 or 0.19% of the Fund’s net assets at period end.
4. Interest rate is less than 0.0005%.
5. All or a portion of the security position is when-issued or delayed delivery to be delivered and settled after period end. See Note 4 of the accompanying Consolidated Notes.
6. All or a portion of the security position is held in accounts at a futures clearing merchant and pledged to cover margin requirements on open futures contracts and written options on futures, if applicable. The aggregate market value of such securities is $2,412,903. See Note 6 of the accompanying Consolidated Notes.
7. All or a portion of the security position is held in segregated accounts and pledged to cover margin requirements under certain derivative contracts. The aggregate market value of such securities is $5,297,123. See Note 6 of the accompanying Consolidated Notes.
8. This security is not accruing income because the issuer has missed an interest payment on it and/or is not anticipated to make future interest and or principal payments. The rate shown is the contractual interest rate. See Note 4 of the accompanying Consolidated Notes.
9. This bond has no contractual maturity date, is not redeemable and contractually pays an indefinite stream of interest.
10. Restricted security. The aggregate value of restricted securities at period end was $3,812,900, which represents 0.23% of the Fund’s net assets. See Note 4 of the accompanying Consolidated Notes. Information concerning restricted securities is as follows:
| | | | | | | | | | | | | | | | | | |
| Security | | Acquisition
Dates | | | Cost | | | Value | | | | | | Unrealized
Appreciation/
(Depreciation) |
|
| Aeropuerto Internacional de Tocumen SA, 5.625% Sr. Sec. Nts., 5/18/36 | | | 5/13/16 – 9/8/16 | | | $ | 1,090,940 | | | $ | 1,119,344 | | | | | | | $ 28,404 |
| Deutsche Bank AG, Coriolanus Ltd. Sec. Credit Linked Bonds, 72.268%, 12/31/17 | | | 9/19/07 | | | | 2,567,888 | | | | 2,665,255 | | | | | | | 97,367 |
| JPMorgan Hipotecaria su Casita, 6.47% Sec. Nts., 8/26/35 | | | 3/21/07 | | | | 528,890 | | | | 28,301 | | | | | | | (500,589) |
| | | | | | | |
| | | | | | $ | 4,187,718 | | | $ | 3,812,900 | | | | | | | $ (374,818) |
| | | | | | | |
11. Denotes an inflation-indexed security: coupon or principal are indexed to a consumer price index.
12. Interest or dividend is paid-in-kind, when applicable.
13. All or a portion of this security is owned by the subsidiary. See Note 2 of the accompanying Consolidated Notes.
14. Non-income producing security.
15. Security received as the result of issuer reorganization.
16. Zero coupon bond reflects effective yield on the original acquisition date.
17. All or a portion of the security position has been pledged for collateral in association with forward roll transactions. See Note 4 of the accompanying Notes.
18. Security is a Master Limited Partnership.
19. Rate shown is the 7-day yield at period end.
20. Is or was an affiliate, as defined in the Investment Company Act of 1940, as amended, at or during the reporting period, by virtue of the Fund owning at least 5% of the voting securities of the issuer or as a result of the Fund and the issuer having the same investment adviser. Transactions during the reporting period in which the issuer was an affiliate are as follows:
| | | | | | | | | | | | | | | | |
| | | Shares
December 31, 2015 | | | Gross
Additions | | | Gross
Reductions | | | Shares
December 31, 2016 | |
| |
| Oppenheimer Institutional Government Money Market Fund, Cl. Ea | | | 92,728,261 | | | | 863,318,194 | | | | 917,591,757 | | | | 38,454,698 | |
| Oppenheimer Master Event-Linked Bond Fund, LLC | | | 3,158,849 | | | | — | | | | 637,866 | | | | 2,520,983 | |
| Oppenheimer Master Loan Fund, LLC | | | 6,443,877 | | | | 6,426,708 | | | | — | | | | 12,870,585 | |
| Oppenheimer Ultra-Short Duration Fund, Cl. Y | | | — | | | | 8,034,834 | | | | 3,992,016 | | | | 4,042,818 | |
| | | | |
| | | | | | Value | | | Income | | | Realized Loss | |
| |
| Oppenheimer Institutional Government Money Market Fund, Cl. Ea | | | | | | $ | 38,454,698 | | | $ | 562,242 | | | $ | — | |
| Oppenheimer Master Event-Linked Bond Fund, LLC | | | | | | | 40,463,664 | | | | 2,573,129b | | | | 326,597b | |
27 OPPENHEIMER GLOBAL STRATEGIC INCOME FUND/VA
CONSOLIDATED STATEMENT OF INVESTMENTS Continued
Consolidated Footnotes to Statement of Investments (Continued)
| | | | | | | | | | | | | | | | |
| | | | |
| | | | | | Value | | | Income | | | Realized Loss | |
| Oppenheimer Master Loan Fund, LLC | | | | | | $ | 207,632,814 | | | $ | 9,941,018c | | | | $ 4,258,987c | |
| Oppenheimer Ultra-Short Duration Fund, Cl. Y | | | | | | | 20,254,519 | | | | 254,325 | | | | — | |
| | | | | | | | |
| Total | | | | | | $ | 306,805,695 | | | $ | 13,330,714 | | | | $ 4,585,584 | |
| | | | | | | | |
a. Prior to September 28, 2016, this fund was named Oppenheimer Institutional Money Market Fund.
b. Represents the amount allocated to the Fund from Oppenheimer Master Event-Linked Bond Fund, LLC.
c. Represents the amount allocated to the Fund from Oppenheimer Master Loan Fund, LLC.
| | | | | | | | |
| Distribution of investments representing geographic holdings, as a percentage of total investments at value, is as follows: | |
| Geographic Holdings (Unaudited) | | Value | | | Percent | |
| |
| United States | | $ | 1,414,439,437 | | | | 81.3% | |
| Brazil | | | 32,571,797 | | | | 1.9 | |
| Indonesia | | | 32,024,969 | | | | 1.8 | |
| Canada | | | 27,185,751 | | | | 1.6 | |
| Supranational | | | 17,151,511 | | | | 1.0 | |
| Russia | | | 15,127,548 | | | | 0.9 | |
| Netherlands | | | 13,277,683 | | | | 0.8 | |
| Mexico | | | 13,141,875 | | | | 0.8 | |
| United Kingdom | | | 12,548,867 | | | | 0.7 | |
| Peru | | | 10,748,164 | | | | 0.6 | |
| India | | | 9,688,795 | | | | 0.6 | |
| Ukraine | | | 8,522,163 | | | | 0.5 | |
| Luxembourg | | | 7,265,144 | | | | 0.4 | |
| South Africa | | | 6,884,508 | | | | 0.4 | |
| Kazakhstan | | | 6,868,489 | | | | 0.4 | |
| Colombia | | | 6,599,235 | | | | 0.4 | |
| Germany | | | 6,590,086 | | | | 0.4 | |
| Argentina | | | 6,440,036 | | | | 0.4 | |
| Ireland | | | 6,208,468 | | | | 0.4 | |
| Ivory Coast | | | 5,673,688 | | | | 0.3 | |
| China | | | 5,577,990 | | | | 0.3 | |
| France | | | 5,185,950 | | | | 0.3 | |
| Turkey | | | 4,538,862 | | | | 0.3 | |
| Hungary | | | 4,459,998 | | | | 0.3 | |
| Belgium | | | 4,016,806 | | | | 0.2 | |
| Jamaica | | | 3,929,222 | | | | 0.2 | |
| Dominican Republic | | | 3,678,216 | | | | 0.2 | |
| Sri Lanka | | | 3,609,258 | | | | 0.2 | |
| Serbia | | | 3,247,202 | | | | 0.2 | |
| Italy | | | 2,971,711 | | | | 0.2 | |
| Romania | | | 2,606,262 | | | | 0.2 | |
| Uruguay | | | 2,536,025 | | | | 0.1 | |
| Croatia | | | 2,369,192 | | | | 0.1 | |
| Switzerland | | | 2,299,973 | | | | 0.1 | |
| New Zealand | | | 2,264,128 | | | | 0.1 | |
| Jersey, Channel Islands | | | 2,262,750 | | | | 0.1 | |
| Israel | | | 2,175,178 | | | | 0.1 | |
| Australia | | | 1,960,190 | | | | 0.1 | |
| South Korea | | | 1,759,822 | | | | 0.1 | |
| Panama | | | 1,709,945 | | | | 0.1 | |
| Honduras | | | 1,291,752 | | | | 0.1 | |
| Japan | | | 1,201,168 | | | | 0.1 | |
| Kenya | | | 1,195,667 | | | | 0.1 | |
| Namibia | | | 1,135,180 | | | | 0.1 | |
| Sweden | | | 1,084,080 | | | | 0.1 | |
| Vietnam | | | 1,052,865 | | | | 0.1 | |
| Kuwait | | | 967,115 | | | | 0.1 | |
| Morocco | | | 901,285 | | | | 0.1 | |
| United Arab Emirates | | | 894,265 | | | | 0.1 | |
| Spain | | | 850,417 | | | | 0.0 | |
| Singapore | | | 795,996 | | | | 0.0 | |
| Costa Rica | | | 758,610 | | | | 0.0 | |
| Paraguay | | | 586,500 | | | | 0.0 | |
| Norway | | | 573,759 | | | | 0.0 | |
| Senegal | | | 540,629 | | | | 0.0 | |
| Denmark | | | 528,591 | | | | 0.0 | |
28 OPPENHEIMER GLOBAL STRATEGIC INCOME FUND/VA
| | | | | | | | | | | | | | | | |
| Geographic Holdings (Unaudited) (Continued) | | Value | | | | | | Percent | | | | |
| |
Nigeria | | $ | 518,192 | | | | | | | | 0.0 | % | | | | |
Trinidad | | | 492,925 | | | | | | | | 0.0 | | | | | |
Thailand | | | 456,676 | | | | | | | | 0.0 | | | | | |
Iraq | | | 450,039 | | | | | | | | 0.0 | | | | | |
Chile | | | 382,504 | | | | | | | | 0.0 | | | | | |
Guernsey | | | 374,077 | | | | | | | | 0.0 | | | | | |
Ghana | | | 370,018 | | | | | | | | 0.0 | | | | | |
Taiwan | | | 137,149 | | | | | | | | 0.0 | | | | | |
Eurozone | | | 105,614 | | | | | | | | 0.0 | | | | | |
Gabon | | | 102,955 | | | | | | | | 0.0 | | | | | |
| | | | |
Total | | $ | 1,739,864,922 | | | | | | | | 100.0 | % | | | | |
| | | | |
|
| Forward Currency Exchange Contracts as of December 31, 2016 |
| | | | | | | | | | | | | | | | | | | | | | | | | | | | |
| Counterparty | | Settlement Month(s) | | | Currency Purchased (000’s) | | | Currency Sold (000’s) | | | Unrealized
Appreciation | | | Unrealized
Depreciation | |
| |
BAC | | | 03/2017 | | | EUR | | | | | 1,055 | | | USD | | | | | 1,129 | | | $ | — | | | $ | 14,364 | |
BAC | | | 03/2017 | | | JPY | | | | | 989,000 | | | USD | | | | | 9,625 | | | | — | | | | 1,132,418 | |
BAC | | | 03/2017 | | | MYR | | | | | 12,195 | | | USD | | | | | 2,885 | | | | — | | | | 176,366 | |
BAC | | | 03/2017 | | | RUB | | | | | 560,200 | | | USD | | | | | 8,430 | | | | 544,181 | | | | — | |
BAC | | | 03/2017 | | | TRY | | | | | 8,400 | | | USD | | | | | 2,370 | | | | — | | | | 24,770 | |
BAC | | | 03/2017 | | | USD | | | | | 8,655 | | | JPY | | | | | 905,000 | | | | 884,215 | | | | — | |
BAC | | | 03/2017 | | | USD | | | | | 3,800 | | | PEN | | | | | 12,920 | | | | — | | | | 13,710 | |
BNP | | | 03/2017 | | | USD | | | | | 9,074 | | | KRW | | | | | 10,579,000 | | | | 313,565 | | | | — | |
BNP | | | 03/2017 | | | USD | | | | | 9,904 | | | MXN | | | | | 213,800 | | | | — | | | | 312,189 | |
BNP | | | 03/2017 | | | USD | | | | | 1,505 | | | RUB | | | | | 94,900 | | | | — | | | | 14,870 | |
BOA | | | 03/2017 | | | EUR | | | | | 6,880 | | | USD | | | | | 7,334 | | | | — | | | | 65,409 | |
BOA | | | 01/2017 | | | INR | | | | | 547,000 | | | USD | | | | | 7,988 | | | | 53,430 | | | | — | |
BOA | | | 02/2017 | | | MYR | | | | | 21,055 | | | USD | | | | | 4,760 | | | | — | | | | 76,709 | |
BOA | | | 03/2017 | | | PEN | | | | | 12,930 | | | USD | | | | | 3,773 | | | | 43,683 | | | | — | |
BOA | | | 03/2017 | | | USD | | | | | 17,663 | | | EUR | | | | | 16,005 | | | | 755,094 | | | | — | |
BOA | | | 02/2017 | | | USD | | | | | 8,431 | | | IDR | | | | | 113,250,000 | | | | 82,410 | | | | — | |
BOA | | | 03/2017 | | | USD | | | | | 7,907 | | | KRW | | | | | 9,050,000 | | | | 412,718 | | | | — | |
BOA | | | 02/2017 | | | USD | | | | | 2,252 | | | PHP | | | | | 113,000 | | | | — | | | | 14,035 | |
BOA | | | 03/2017 | | | ZAR | | | | | 115,090 | | | USD | | | | | 8,367 | | | | — | | | | 98,031 | |
CITNA-B | | | 03/2017 | | | CAD | | | | | 5,750 | | | USD | | | | | 4,260 | | | | 26,487 | | | | — | |
CITNA-B | | | 01/2017 | | | COP | | | | | 18,720,000 | | | USD | | | | | 6,142 | | | | 87,129 | | | | — | |
CITNA-B | | | 03/2017 | | | EUR | | | | | 870 | | | USD | | | | | 921 | | | | — | | | | 1,992 | |
CITNA-B | | | 03/2017 | | | GBP | | | | | 4,925 | | | USD | | | | | 6,200 | | | | — | | | | 120,111 | |
CITNA-B | | | 03/2017 | | | MXN | | | | | 55,900 | | | USD | | | | | 2,880 | | | | — | | | | 208,487 | |
CITNA-B | | | 03/2017 | | | SGD | | | | | 6,460 | | | USD | | | | | 4,527 | | | | — | | | | 67,906 | |
CITNA-B | | | 02/2017 | | | USD | | | | | 3,879 | | | BRL | | | | | 13,686 | | | | — | | | | 288,550 | |
CITNA-B | | | 01/2017 | | | USD | | | | | 3,970 | | | COP | | | | | 12,732,000 | | | | — | | | | 266,359 | |
CITNA-B | | | 03/2017 | | | USD | | | | | 4,427 | | | GBP | | | | | 3,560 | | | | 31,953 | | | | — | |
CITNA-B | | | 01/2017 | | | USD | | | | | 3,747 | | | INR | | | | | 258,000 | | | | — | | | | 45,338 | |
CITNA-B | | | 03/2017 | | | USD | | | | | 19,860 | | | MXN | | | | | 399,500 | | | | 902,639 | | | | 122,857 | |
CITNA-B | | | 03/2017 | | | USD | | | | | 2,488 | | | RUB | | | | | 162,000 | | | | — | | | | 107,519 | |
CITNA-B | | | 03/2017 | | | USD | | | | | 4,542 | | | SGD | | | | | 6,460 | | | | 83,001 | | | | — | |
DEU | | | 03/2017 | | | EUR | | | | | 27,410 | | | USD | | | | | 29,440 | | | | — | | | | 483,803 | |
DEU | | | 03/2017 | | | USD | | | | | 117 | | | JPY | | | | | 12,200 | | | | 12,040 | | | | — | |
DEU | | | 01/2017 | | | USD | | | | | 91 | | | TRY | | | | | 300 | | | | 6,083 | | | | — | |
DEU | | | 03/2017 | | | USD | | | | | 1,757 | | | ZAR | | | | | 25,945 | | | | — | | | | 107,272 | |
GSCO-OT | | | 03/2017 | | | MXN | | | | | 268,100 | | | USD | | | | | 12,761 | | | | 69,070 | | | | 19,745 | |
GSCO-OT | | | 03/2017 | | | USD | | | | | 2,485 | | | BRL | | | | | 8,740 | | | | — | | | | 147,355 | |
GSCO-OT | | | 03/2017 | | | USD | | | | | 8,067 | | | KRW | | | | | 9,455,000 | | | | 236,858 | | | | — | |
GSCO-OT | | | 03/2017 | | | USD | | | | | 2,632 | | | ZAR | | | | | 37,160 | | | | — | | | | 37,513 | |
GSCO-OT | | | 03/2017 | | | ZAR | | | | | 36,320 | | | USD | | | | | 2,586 | | | | 23,359 | | | | — | |
HSBC | | | 03/2017 | | | EUR | | | | | 4,720 | | | USD | | | | | 5,359 | | | | — | | | | 372,529 | |
HSBC | | | 03/2017 | | | HUF | | | | | 1,227,000 | | | USD | | | | | 4,448 | | | | — | | | | 263,838 | |
HSBC | | | 03/2017 | | | PLN | | | | | 16,790 | | | USD | | | | | 4,131 | | | | — | | | | 123,718 | |
HSBC | | | 03/2017 | | | USD | | | | | 1,757 | | | ZAR | | | | | 25,945 | | | | — | | | | 106,697 | |
HSBC | | | 03/2017 | | | ZAR | | | | | 51,890 | | | USD | | | | | 3,567 | | | | 161,088 | | | | — | |
JPM | | | 03/2017 | | | BRL | | | | | 53,370 | | | USD | | | | | 16,098 | | | | — | | | | 21,541 | |
JPM | | | 03/2017 | | | CAD | | | | | 9,760 | | | USD | | | | | 7,359 | | | | — | | | | 83,544 | |
JPM | | | 03/2017 | | | CLP | | | | | 1,944,000 | | | USD | | | | | 2,892 | | | | — | | | | 4,580 | |
JPM | | | 01/2017 | | | COP | | | | | 5,671,000 | | | USD | | | | | 1,773 | | | | 113,564 | | | | — | |
JPM | | | 03/2017 | | | EUR | | | | | 1,435 | | | USD | | | | | 1,551 | | | | — | | | | 34,894 | |
JPM | | | 03/2017 | | | GBP | | | | | 1,120 | | | USD | | | | | 1,394 | | | | — | | | | 11,063 | |
JPM | | | 03/2017 | | | KRW | | | | | 9,455,000 | | | USD | | | | | 8,101 | | | | — | | | | 271,285 | |
JPM | | | 02/2017 - 03/2017 | | | MXN | | | | | 474,800 | | | USD | | | | | 22,689 | | | | 173,899 | | | | 126,206 | |
29 OPPENHEIMER GLOBAL STRATEGIC INCOME FUND/VA
|
| Forward Currency Exchange Contracts (Continued) |
| | | | | | | | | | | | | | | | | | | | | | | | | | | | | | | | |
| Counterparty | | Settlement Month(s) | | | Currency Purchased (000’s) | | | Currency Sold (000’s) | | | Unrealized
Appreciation | | | Unrealized
Depreciation | |
| |
JPM | | | 03/2017 | | | PEN | | | | | 12,920 | | | | USD | | | | | | | | 3,778 | | | $ | 35,491 | | | $ | — | |
JPM | | | 01/2017 - 03/2017 | | | RUB | | | | | 1,073,200 | | | | USD | | | | | | | | 16,840 | | | | 609,936 | | | | 97,775 | |
JPM | | | 01/2017 | | | THB | | | | | 90,200 | | | | USD | | | | | | | | 2,550 | | | | — | | | | 31,307 | |
JPM | | | 03/2017 | | | USD | | | | | 11,598 | | | | CAD | | | | | | | | 15,450 | | | | 81,416 | | | | — | |
JPM | | | 03/2017 | | | USD | | | | | 2,947 | | | | CLP | | | | | | | | 1,944,000 | | | | 59,170 | | | | — | |
JPM | | | 03/2017 | | | USD | | | | | 17,311 | | | | EUR | | | | | | | | 15,600 | | | | 830,830 | | | | — | |
JPM | | | 03/2017 | | | USD | | | | | 2,849 | | | | HUF | | | | | | | | 843,000 | | | | — | | | | 25,473 | |
JPM | | | 02/2017 - 03/2017 | | | USD | | | | | 5,807 | | | | IDR | | | | | | | | 78,514,500 | | | | 41,454 | | | | 4,987 | |
JPM | | | 01/2017 | | | USD | | | | | 4,201 | | | | INR | | | | | | | | 289,000 | | | | — | | | | 47,735 | |
JPM | | | 02/2017 - 03/2017 | | | USD | | | | | 2,574 | | | | MXN | | | | | | | | 53,400 | | | | 22,959 | | | | 266 | |
JPM | | | 03/2017 | | | USD | | | | | 2,618 | | | | MYR | | | | | | | | 11,650 | | | | 30,135 | | | | — | |
JPM | | | 01/2017 | | | USD | | | | | 13,110 | | | | RUB | | | | | | | | 850,700 | | | | 88,441 | | | | 776,393 | |
JPM | | | 03/2017 | | | USD | | | | | 2,501 | | | | TRY | | | | | | | | 8,790 | | | | 46,837 | | | | — | |
JPM | | | 03/2017 | | | USD | | | | | 14,619 | | | | ZAR | | | | | | | | 214,180 | | | | — | | | | 768,294 | |
JPM | | | 03/2017 | | | ZAR | | | | | 69,450 | | | | USD | | | | | | | | 5,034 | | | | — | | | | 44,846 | |
TDB | | | 02/2017 | | | BRL | | | | | 48,860 | | | | USD | | | | | | | | 13,773 | | | | 1,104,347 | | | | — | |
TDB | | | 03/2017 | | | EUR | | | | | 945 | | | | USD | | | | | | | | 1,008 | | | | — | | | | 9,551 | |
TDB | | | 02/2017 - 03/2017 | | | USD | | | | | 25,866 | | | | BRL | | | | | | | | 90,480 | | | | — | | | | 1,585,521 | |
TDB | | | 03/2017 | | | USD | | | | | 5,889 | | | | CAD | | | | | | | | 7,800 | | | | 74,412 | | | | — | |
TDB | | | 03/2017 | | | USD | | | | | 27,772 | | | | EUR | | | | | | | | 25,055 | | | | 1,303,202 | | | | — | |
TDB | | | 03/2017 | | | USD | | | | | 2,847 | | | | GBP | | | | | | | | 2,290 | | | | 19,365 | | | | — | |
TDB | | | 03/2017 | | | USD | | | | | 2,990 | | | | MXN | | | | | | | | 55,900 | | | | 319,098 | | | | — | |
| | | | | | | | | | | | | | | | | | | | | | | | | | | | |
| Total Unrealized Appreciation and Depreciation | | | | | | | | | | | | | | | $ | 9,683,559 | | | $ | 8,779,721 | |
| | | | | | | | | | | | | | | | | | | | | | | | | | | | |
|
| Futures Contracts as of December 31, 2016 |
| | | | | | | | | | | | | | | | | | | | | | | | |
| Description | | Exchange | | | Buy/Sell | | | Expiration Date | | | Number of Contracts | | | Value | | | Unrealized Appreciation
(Depreciation) | |
| |
| Euro-BUND | | | EUX | | | | Sell | | | | 3/08/17 | | | | 110 | | | $ | 19,007,174 | | | $ | (24,654) | |
| United States Treasury Long Bonds | | | CBT | | | | Buy | | | | 3/22/17 | | | | 102 | | | | 15,366,937 | | | | (50,957) | |
| United States Treasury Nts., 2 yr. | | | CBT | | | | Buy | | | | 3/31/17 | | | | 337 | | | | 73,023,687 | | | | (23,944) | |
| United States Treasury Nts., 5 yr. | | | CBT | | | | Sell | | | | 3/31/17 | | | | 19 | | | | 2,235,617 | | | | 4,221 | |
| United States Treasury Nts., 10 yr. | | | CBT | | | | Buy | | | | 3/22/17 | | | | 155 | | | | 19,263,594 | | | | (79,961) | |
| United States Treasury Nts., 10 yr. | | | CBT | | | | Sell | | | | 3/22/17 | | | | 56 | | | | 6,959,750 | | | | (2,772) | |
| United States Ultra Bonds | | | CBT | | | | Buy | | | | 3/22/17 | | | | 197 | | | | 31,569,250 | | | | (255,646) | |
| | | | | | | | | | | | | | | | | | | | | | | | |
| | | | | | | | | | | | | | | | | | | | | | $ | (433,713) | |
| | | | | | | | | | | | | | | | | | | | | | | | |
|
| Over-the-Counter Options Written at December 31, 2016 |
| | | | | | | | | | | | | | | | | | | | | | | | | | | | | | | | |
| Description | | Counterparty | | | | | | Exercise Price | | | Expiration Date | | | | | | Number of Contracts | | | Premiums Received | | | Value | |
| |
| BRL Currency Call | | | HSBC | | | | BRL | | | | 3.050 | | | | 1/27/17 | | | | BRL | | | | (38,125,000 | ) | | $ | 127,625 | | | $ | (10,484) | |
| |
| BRL Currency Put | | | HSBC | | | | BRL | | | | 3.400 | | | | 1/27/17 | | | | BRL | | | | (42,500,000 | ) | | | 170,000 | | | | (83,640) | |
| |
| EUR Currency Put | | | BAC | | | | PLN | | | | 4.300 | | | | 3/6/17 | | | | EUR | | | | (6,470,000 | ) | | | 11,320 | | | | (14,346) | |
| |
| EUR Currency Put | | | BNP | | | | EUR | | | | 0.980 | | | | 2/10/17 | | | | EUR | | | | (18,159,835 | ) | | | 44,491 | | | | (7,428) | |
| |
| KRW Currency Call | | | BAC | | | | KRW | | | | 1130.000 | | | | 6/15/17 | | | | KRW | | | | (38,109,710,000 | ) | | | 492,731 | | | | (266,768) | |
| |
| KRW Currency Put | | | BAC | | | | KRW | | | | 1250.000 | | | | 6/15/17 | | | | KRW | | | | (42,156,760,000 | ) | | | 491,042 | | | | (674,508) | |
| |
| MXN Currency Put | | | CITNA-B | | | | MXN | | | | 21.700 | | | | 3/1/17 | | | | MXN | | | | (564,138,339 | ) | | | 248,403 | | | | (220,014) | |
| |
| MXN Currency Call | | | CITNA-B | | | | MXN | | | | 20.000 | | | | 3/1/17 | | | | MXN | | | | (519,943,169 | ) | | | 177,170 | | | | (193,939) | |
| |
| TWD Currency Call | | | HSBC | | | | TWD | | | | 31.600 | | | | 3/23/17 | | | | TWD | | | | (395,000,000 | ) | | | 74,062 | | | | (71,100) | |
| |
| TWD Currency Put | | | HSBC | | | | TWD | | | | 33.400 | | | | 3/23/17 | | | | TWD | | | | (417,500,000 | ) | | | 72,813 | | | | (75,567) | |
| |
| ZAR Currency Put | | | CITNA-B | | | | ZAR | | | | 15.000 | | | | 1/5/17 | | | | ZAR | | | | (187,500,000 | ) | | | 205,811 | | | | (188) | |
| |
| ZAR Currency Call | | | CITNA-B | | | | ZAR | | | | 13.150 | | | | 1/5/17 | | | | ZAR | | | | (164,375,000 | ) | | | 142,009 | | | | (4,109) | |
| | | | | | | | | | | | | | | | | | | | | | | | | | | | |
| Total Over-the-Counter Options Written | | | | | | | | | | | $ | 2,257,477 | | | $ | (1,622,091) | |
| | | | | | | | | | | | | | | | | | | | | | | | | | | | |
|
| Centrally Cleared Credit Default Swaps at December 31, 2016 |
| | | | | | | | | | | | | | | | | | | | | | | | | | | | |
| Reference Asset | | Buy/Sell
Protection | | | Fixed Rate | | | Maturity Date | | | | | | Notional Amount
(000’s) | | | Premiums Received/(Paid) | | | Value | |
| |
| Argentine Republic | | | Buy | | | | 5.000% | | | | 12/20/21 | | | | USD | | | | 1,000 | | | $ | 26,470 | | | $ | (36,987) | |
| |
| CDX.EM.26 | | | Buy | | | | 1.000 | | | | 12/20/21 | | | | USD | | | | 1,000 | | | | (67,611) | | | | 61,958 | |
| |
| CDX.EM.26 | | | Buy | | | | 1.000 | | | | 12/20/21 | | | | USD | | | | 1,000 | | | | (70,556) | | | | 61,958 | |
| |
| CDX.EM.26 | | | Buy | | | | 1.000 | | | | 12/20/21 | | | | USD | | | | 1,000 | | | | (76,856) | | | | 61,958 | |
| |
| CDX.EM.26 | | | Buy | | | | 1.000 | | | | 12/20/21 | | | | USD | | | | 1,000 | | | | (76,256) | | | | 61,958 | |
| |
| CDX.EM.26 | | | Buy | | | | 1.000 | | | | 12/20/21 | | | | USD | | | | 1,000 | | | | (76,356) | | | | 61,958 | |
| |
| CDX.EM.26 | | | Buy | | | | 1.000 | | | | 12/20/21 | | | | USD | | | | 1,000 | | | | (75,411) | | | | 61,958 | |
| |
| CDX.HY.27 | | | Buy | | | | 5.000 | | | | 12/20/21 | | | | USD | | | | 18,900 | | | | 1,134,000 | | | | (1,176,881) | |
| |
| CDX.HY.27 | | | Sell | | | | 5.000 | | | | 12/20/21 | | | | USD | | | | 2,620 | | | | (161,115) | | | | 162,619 | |
| |
| CDX.HY.27 | | | Buy | | | | 5.000 | | | | 12/20/21 | | | | USD | | | | 18,900 | | | | 1,135,890 | | | | (1,176,881) | |
| |
| CDX.HY.27 | | | Sell | | | | 5.000 | | | | 12/20/21 | | | | USD | | | | 2,610 | | | | (165,271) | | | | 161,636 | |
| |
| Federative Republic of Brazil | | | Sell | | | | 1.000 | | | | 3/20/17 | | | | USD | | | | 5,000 | | | | (4,759) | | | | 5,436 | |
30 OPPENHEIMER GLOBAL STRATEGIC INCOME FUND/VA
|
| Centrally Cleared Credit Default Swaps (Continued) |
| | | | | | | | | | | | | | | | | | | | | | | | | | | | |
| Reference Asset | | Buy/Sell
Protection | | | Fixed Rate | | | Maturity Date | | | | | | Notional Amount
(000’s) | | | Premiums Received/(Paid) | | | Value | |
| |
| Malaysia | | | Buy | | | | 1.000% | | | | 12/20/21 | | | | USD | | | | 2,250 | | | $ | (41,734) | | | $ | 36,560 | |
| |
| People’s Republic of China | | | Buy | | | | 1.000 | | | | 12/20/21 | | | | USD | | | | 4,400 | | | | (39,302) | | | | 33,543 | |
| |
| Republic of Colombia | | | Buy | | | | 1.000 | | | | 12/20/21 | | | | USD | | | | 1,000 | | | | (32,341) | | | | 28,103 | |
| |
| Republic of Colombia | | | Buy | | | | 1.000 | | | | 12/20/21 | | | | USD | | | | 2,000 | | | | (61,273) | | | | 56,205 | |
| |
| Republic of Indonesia | | | Buy | | | | 1.000 | | | | 12/20/21 | | | | USD | | | | 1,000 | | | | (29,484) | | | | 24,886 | |
| |
| Republic of Indonesia | | | Buy | | | | 1.000 | | | | 12/20/21 | | | | USD | | | | 2,250 | | | | (68,644) | | | | 55,993 | |
| |
| Republic of Indonesia | | | Buy | | | | 1.000 | | | | 12/20/21 | | | | USD | | | | 2,000 | | | | (74,646) | | | | 49,772 | |
| |
| Republic of Indonesia | | | Buy | | | | 1.000 | | | | 12/20/21 | | | | USD | | | | 800 | | | | (24,407) | | | | 19,909 | |
| |
| Republic of Indonesia | | | Buy | | | | 1.000 | | | | 12/20/21 | | | | USD | | | | 1,300 | | | | (39,069) | | | | 32,352 | |
| |
| Republic of Indonesia | | | Buy | | | | 1.000 | | | | 12/20/21 | | | | USD | | | | 2,250 | | | | (69,667) | | | | 55,993 | |
| |
| Republic of Korea | | | Buy | | | | 1.000 | | | | 12/20/21 | | | | USD | | | | 2,250 | | | | 51,583 | | | | (60,033) | |
| |
| Republic of Korea | | | Buy | | | | 1.000 | | | | 12/20/21 | | | | USD | | | | 800 | | | | 20,144 | | | | (21,345) | |
| |
| Republic of Korea | | | Buy | | | | 1.000 | | | | 12/20/21 | | | | USD | | | | 1,300 | | | | 33,060 | | | | (34,686) | |
| |
| Republic of Korea | | | Buy | | | | 1.000 | | | | 12/20/21 | | | | USD | | | | 2,250 | | | | 51,583 | | | | (60,033) | |
| |
| Republic of Turkey | | | Buy | | | | 1.000 | | | | 12/20/21 | | | | USD | | | | 1,350 | | | | (110,390) | | | | 99,629 | |
| |
| Republic of Turkey | | | Buy | | | | 1.000 | | | | 12/20/21 | | | | USD | | | | 912 | | | | (71,041) | | | | 67,305 | |
| |
| Republic of Turkey | | | Buy | | | | 1.000 | | | | 12/20/21 | | | | USD | | | | 1,000 | | | | (79,561) | | | | 73,799 | |
| |
| Republic of Turkey | | | Buy | | | | 1.000 | | | | 12/20/21 | | | | USD | | | | 1,000 | | | | (87,539) | | | | 73,799 | |
| |
| Republic of Turkey | | | Buy | | | | 1.000 | | | | 12/20/21 | | | | USD | | | | 1,007 | | | | (81,432) | | | | 74,316 | |
| |
| Republic of Turkey | | | Buy | | | | 1.000 | | | | 12/20/21 | | | | USD | | | | 1,000 | | | | (79,247) | | | | 73,799 | |
| |
| Republic of Turkey | | | Buy | | | | 1.000 | | | | 12/20/21 | | | | USD | | | | 1,350 | | | | (108,131) | | | | 99,629 | |
| |
| United Mexican States | | | Buy | | | | 1.000 | | | | 12/20/21 | | | | USD | | | | 1,000 | | | | (27,280) | | | | 24,590 | |
| |
| United Mexican States | | | Buy | | | | 1.000 | | | | 12/20/21 | | | | USD | | | | 2,000 | | | | (83,627) | | | | 49,180 | |
| | | | | | | | | | | | | | | | | | | | | | | | |
| Total Cleared Credit Default Swaps | | | | | | | $ | 469,724 | | | $ | (836,045) | |
| | | | | | | | | | | | | | | | | | | | | | | | |
|
| Over-the-Counter Credit Default Swaps at December 31, 2016 |
| | | | | | | | | | | | | | | | | | | | | | | | | | | | | | | | |
| Reference Asset | | Counterparty | | | Buy/Sell Protection | | | Fixed
Rate | | | Maturity
Date | | | | | | Notional Amount
(000’s) | | | Premiums Received/(Paid) | | | Value | |
| |
| CMBX.NA.BBB-.9 | | | FIB | | | | Sell | | | | 3.000 | % | | | 9/17/58 | | | | USD | | | | 2,325 | | | $ | 358,796 | | | $ | (303,916) | |
| |
| CMBX.NA.BBB-.9 | | | FIB | | | | Sell | | | | 3.000 | | | | 9/17/58 | | | | USD | | | | 2,585 | | | | 396,164 | | | | (337,903) | |
| |
| CMBX.NA.BBB-.9 | | | FIB | | | | Sell | | | | 3.000 | | | | 9/17/58 | | | | USD | | | | 3,615 | | | | 548,772 | | | | (472,541) | |
| |
| CMBX.NA.BBB-.9 | | | MSCO | | | | Sell | | | | 3.000 | | | | 9/17/58 | | | | USD | | | | 2,585 | | | | 397,539 | | | | (337,903) | |
| |
| CMBX.NA.BBB-.9 | | | MSCO | | | | Sell | | | | 3.000 | | | | 9/17/58 | | | | USD | | | | 3,875 | | | | 590,697 | | | | (506,527) | |
| |
| CMBX.NA.BBB-.9 | | | MSCO | | | | Sell | | | | 3.000 | | | | 9/17/58 | | | | USD | | | | 2,580 | | | | 375,718 | | | | (337,249) | |
| |
| CMBX.NA.BBB-.9 | | | MSCO | | | | Sell | | | | 3.000 | | | | 9/17/58 | | | | USD | | | | 3,880 | | | | 592,189 | | | | (507,181) | |
| |
| Federative Republic of Brazil | | | BNP | | | | Sell | | | | 1.000 | | | | 12/20/18 | | | | USD | | | | 1,190 | | | | 94,152 | | | | (3,439) | |
| |
| Hellenic Republic | | | BAC | | | | Sell | | | | 1.000 | | | | 3/20/20 | | | | USD | | | | 475 | | | | 168,651 | | | | (106,887) | |
| |
| Hellenic Republic | | | BAC | | | | Sell | | | | 1.000 | | | | 3/20/20 | | | | USD | | | | 475 | | | | 180,526 | | | | (106,887) | |
| |
| Malaysia | | | GSCOI | | | | Buy | | | | 1.000 | | | | 6/20/21 | | | | USD | | | | 1,785 | | | | (47,059) | | | | 15,744 | |
| |
| Malaysia | | | MOS-A | | | | Buy | | | | 1.000 | | | | 12/20/20 | | | | USD | | | | 765 | | | | (48,374) | | | | 1,942 | |
| |
| Republic of Indonesia | | | BNP | | | | Buy | | | | 1.000 | | | | 6/20/21 | | | | USD | | | | 5,100 | | | | (203,573) | | | | 84,740 | |
| |
| Republic of Peru | | | BNP | | | | Buy | | | | 1.000 | | | | 12/20/20 | | | | USD | | | | 964 | | | | (27,540) | | | | (7,710) | |
| |
| Republic of Turkey | | | CITNA-B | | | | Buy | | | | 1.000 | | | | 6/20/21 | | | | USD | | | | 1,625 | | | | (107,092) | | | | 95,317 | |
| |
| Republic of Turkey | | | HSBC | | | | Buy | | | | 1.000 | | | | 6/20/21 | | | | USD | | | | 1,270 | | | | (94,540) | | | | 75,846 | |
| |
| Russian Federation | | | BNP | | | | Buy | | | | 1.000 | | | | 12/20/20 | | | | USD | | | | 765 | | | | (81,669) | | | | 11,131 | |
| |
| State Bank of India | | | BNP | | | | Sell | | | | 1.000 | | | | 9/20/19 | | | | USD | | | | 1,740 | | | | 71,791 | | | | 11,206 | |
| | | | | | | | | | | | | | | | | �� | | | | | | | | | | | |
| Total Over-the-Counter Credit Default Swaps | | | | | | | | | | | $ | 3,165,148 | | | $ | (2,732,217) | |
| | | | | | | | | | | | | | | | | | | | | | | | | | | | |
The table that follows shows the undiscounted maximum potential payment by the Fund related to selling credit protection in credit default swaps:
| | | | | | | | | | | | |
Type of Reference Asset on which the Fund Sold Protection | | Total Maximum Potential Payments
for Selling Credit Protection
(Undiscounted) | | | Amount Recoverable* | | | Reference Asset Rating
Range** | |
| |
| Non-Investment Grade Corporate Debt | | | | | | | | | | | | |
| Indexes | | $ | 26,675,000 | | | $ | 38,995,738 | | | | BB+ to BB- | |
| Investment Grade Single Name Corporate | | | | | | | | | | | | |
| Debt | | | 1,740,000 | | | | — | | | | BBB- | |
| Non-Investment Grade Sovereign Debt | | | 7,140,000 | | | | — | | | | BB to B- | |
| | | | | | | | | | | | |
| Total USD | | $ | 35,555,000 | | | $ | 38,995,738 | | | | | |
| | | | | | | | | | | | |
*The Fund has no amounts recoverable from related purchased protection. In addition, the Fund has no recourse provisions under the credit derivatives and holds no collateral which can offset or reduce potential payments under a triggering event.
**The period end reference asset security ratings, as rated by any rating organization, are included in the equivalent Standard & Poor’s rating category. The reference asset rating represents the likelihood of a potential credit event on the reference asset which would result in a related payment by the Fund.
31 OPPENHEIMER GLOBAL STRATEGIC INCOME FUND/VA
|
|
| Centrally Cleared Interest Rate Swaps at December 31, 2016 |
| | | | | | | | | | | | | | | | | | | | | | | | | | | | |
| Counterparty | | Pay/Receive
Floating Rate | | Floating Rate | | Fixed Rate | | | Maturity Date | | | Notional Amount (000’s) | | | Premiums Received / (Paid) | | | Value | |
| | | | Three-Month USD | | | | | | | | | | | | | | | | | | | | | | | | |
| BAC | | Receive | | BBA LIBOR | | | 2.461% | | | | 3/20/47 | | | | USD | | | | 2,825 | | | $ | — | | | $ | 80,641 | |
| |
| | | | Three-Month USD | | | | | | | | | | | | | | | | | | | | | | | | |
| BAC | | Receive | | BBA LIBOR | | | 2.289 | | | | 12/5/26 | | | | USD | | | | 17,800 | | | | — | | | | 47,907 | |
| |
| | | | Three-Month USD | | | | | | | | | | | | | | | | | | | | | | | | |
| BAC | | Receive | | BBA LIBOR | | | 1.796 | | | | 12/1/21 | | | | USD | | | | 26,400 | | | | — | | | | 184,751 | |
| |
| | | | Three-Month USD | | | | | | | | | | | | | | | | | | | | | | | | |
| BAC | | Pay | | BBA LIBOR | | | 2.191 | | | | 3/17/27 | | | | USD | | | | 6,837 | | | | — | | | | (111,090) | |
| |
| | | | Six-Month PLN WIBOR | | | | | | | | | | | | | | | | | | | | | | | | |
| BAC | | Pay | | WIBO | | | 1.745 | | | | 9/12/18 | | | | PLN | | | | 25,200 | | | | — | | | | (26,079) | |
| |
| | | | Six-Month PLN WIBOR | | | | | | | | | | | | | | | | | | | | | | | | |
| BAC | | Pay | | WIBO | | | 1.745 | | | | 9/15/18 | | | | PLN | | | | 25,195 | | | | — | | | | (19,937) | |
| |
| CITNA-B | | Pay | | BZDI | | | 11.710 | | | | 1/4/21 | | | | BRL | | | | 35,000 | | | | — | | | | 76,128 | |
| |
| | | | Three-Month ZAR | | | | | | | | | | | | | | | | | | | | | | | | |
| DEU | | Receive | | JIBAR SAFEX | | | 8.310 | | | | 6/29/26 | | | | ZAR | | | | 56,100 | | | | — | | | | 1,863 | |
| |
| GSCOI | | Pay | | MXN TIIE BANXICO | | | 6.820 | | | | 11/14/18 | | | | MXN | | | | 271,085 | | | | 2,516 | | | | (79,054) | |
| |
| GSCOI | | Receive | | MXN TIIE BANXICO | | | 7.400 | | | | 11/4/26 | | | | MXN | | | | 65,835 | | | | (663) | | | | 110,190 | |
| |
| | | | Three-Month USD | | | | | | | | | | | | | | | | | | | | | | | | |
| JPM | | Receive | | BBA LIBOR | | | 2.338 | | | | 12/15/26 | | | | USD | | | | 6,900 | | | | — | | | | (8,662) | |
| |
| | | | Three-Month USD | | | | | | | | | | | | | | | | | | | | | | | | |
| UBS | | Receive | | BBA LIBOR | | | 2.499 | | | | 12/20/26 | | | | USD | | | | 8,584 | | | | — | | | | (132,593) | |
| | | | | | | | | | | | | | | | | | | | | | | | |
| Total Centrally Cleared Interest Rate Swaps | | | | | | | | | | | | | | | | | | $ | 1,853 | | | $ | 124,065 | |
| | | | | | | | | | | | | | | | | | | | | | | | |
|
|
| Over-the-Counter Interest Rate Swaps at December 31, 2016 |
| | | | | | | | | | | | | | | | | | | | | | | | | | | | |
| Counterparty | |
| PAy/Receive
Floating Rate |
| | | Floating Rate | | | | Fixed Rate | | | | Maturity Date | | | | Notional Amount (000’s) | | | | Value | |
| |
| | | | | | | Three-Month KRW CD | | | | | | | | | | | | | | | | | | | | | |
| DEU | | | Pay | | | | KSDA | | | | 1.480% | | | | 4/20/18 | | | | KRW | | | | 102,630,000 | | | | $ (2,142) | |
| |
| | | | | | | Three-Month MYR | | | | | | | | | | | | | | | | | | | | | |
| SCB | | | Pay | | | | KLIBOR BNM | | | | 3.310 | | | | 8/19/21 | | | | MYR | | | | 45,000 | | | | (213,788) | |
| | | | | | | | | | | | | | | | | | | | | | | | | | | | |
| Total Over-the-Counter Interest Rate Swaps | | | | | | | | | | | | | | | | | | | | $ (215,930) | |
| | | | | | | | | | | | | | | | | | | | | | | | | | | | |
|
|
| Over-the-Counter Interest Rate Swaptions Written at December 31, 2016 |
| | | | | | | | | | | | | | | | | | | | | | | | | | | | | | | | | | | | | | | | |
| Description | | Counterparty | | | Pay/Receive
Floating Rate | | | Floating Rate | | | Fixed Rate | | | Expiration
Date | | | | | | | | | Notional Amount
(000’s) | | | Premiums Received | | | Value | |
| |
| Interest Rate Swap maturing 3/16/19 Call | | | BAC | | | | Pay | | |
| Three-Month
USD BBA
LIBOR |
| | | 1.821 | % | | | 3/14/17 | | | | USD | | | | | | | | 78,000 | | | $ | 105,300 | | | $ | (88,038 | ) |
| |
| Interest Rate Swap maturing 3/2/27 Call | | | BAC | | | | Pay | | |
| Three-Month
USD BBA
LIBOR |
| | | 2.500 | | | | 2/28/17 | | | | USD | | | | | | | | 104,000 | | | | 677,030 | | | | (760,094 | ) |
| | | | | | | | | | | | | | | | | | | | | | | | | | | | | | | | | | | | |
| Total Over-the-Counter Interest Rate Swaptions Written | | | | | | | | | | | | | | | | | | | | | | | $ | 782,330 | | | $ | (848,132) | |
| | | | | | | | | | | | | | | | | | | | | | | | | | | | | | | | | | | | |
| | |
| Glossary: | | |
| Counterparty Abbreviations | | |
| BAC | | Barclays Bank plc |
| BNP | | BNP Paribas |
| BOA | | Bank of America NA |
| CITNA-B | | Citibank NA |
| DEU | | Deutsche Bank AG |
| FIB | | Credit Suisse International |
| GSCOI | | Goldman Sachs International |
| GSCO-OT | | Goldman Sachs Bank USA |
| HSBC | | HSBC Bank USA NA |
| JPM | | JPMorgan Chase Bank NA |
| MOS-A | | Morgan Stanley |
| MSCO | | Morgan Stanley Capital Services, Inc. |
| SCB | | Standard Chartered Bank |
| TDB | | Toronto Dominion Bank |
| UBS | | UBS AG |
|
| Currency abbreviations indicate amounts reporting in currencies |
| AUD | | Australian Dollar |
| BRL | | Brazilian Real |
| CAD | | Canadian Dollar |
| CLP | | Chilean Peso |
| COP | | Colombian Peso |
| EUR | | Euro |
| GBP | | British Pound Sterling |
32 OPPENHEIMER GLOBAL STRATEGIC INCOME FUND/VA
| | |
| Currency abbreviations indicate amounts reporting in currencies (Continued) |
| HUF | | Hungarian Forint |
| IDR | | Indonesian Rupiah |
| INR | | Indian Rupee |
| JPY | | Japanese Yen |
| KRW | | South Korean Won |
| MXN | | Mexican Nuevo Peso |
| MYR | | Malaysian Ringgit |
| PEN | | Peruvian New Sol |
| PHP | | Philippine Peso |
| PLN | | Polish Zloty |
| RUB | | Russian Ruble |
| SGD | | Singapore Dollar |
| THB | | Thailand Baht |
| TRY | | New Turkish Lira |
| TWD | | New Taiwan Dollar |
| ZAR | | South African Rand |
|
| Definitions |
| BANXICO | | Banco de Mexico |
| BBA LIBOR | | British Bankers’ Association London - Interbank Offered Rate |
| BNM | | Bank Negra Malaysia |
| BUND | | German Federal Obligation |
| BZDI | | Brazil Interbank Deposit Rate |
| CD | | Certificate of Deposit |
| CDX.EM.26 | | Markit CDX Emerging Markets Index |
| CDX.HY.27 | | Markit CDX High Yield Index |
| CMBX.NA.BBB-.9 | | Markit CMBX North American Index |
| JIBAR SAFEX | | South Africa Johannesburg Interbank Agreed Rate/Futures Exchange |
| KLIBOR | | Kuala Lumpur Interbank Offered Rate |
| KSDA | | Korean Securities Dealers Assn. |
| TIIE | | Interbank Equilibrium Interest Rate |
| WIBOR WIBO | | Poland Warsaw Interbank Offer Bid Rate |
|
| Exchange Abbreviations |
| CBT | | Chicago Board of Trade |
| EUX | | European Stock Exchange |
See accompanying Notes to Consolidated Financial Statements.
33 OPPENHEIMER GLOBAL STRATEGIC INCOME FUND/VA
CONSOLIDATED STATEMENT OF ASSETS AND LIABILITIES December 31, 2016
| | | | |
| Assets | | | |
| Investments, at value—see accompanying Consolidated statement of investments: | | | | |
| Unaffiliated companies (cost $1,446,724,771) | | $ | 1,433,059,227 | |
| Affiliated companies (cost $301,279,863) | | | 306,805,695 | |
| | | | 1,739,864,922 | |
| Cash | | | 16,024,275 | |
| Cash—foreign currencies (cost $2,195,513) | | | 2,204,676 | |
| Cash used for collateral on centrally cleared swaps | | | 8,464,394 | |
| Unrealized appreciation on forward currency exchange contracts | | | 9,683,559 | |
| Swaps, at value (net payments paid $510,516) | | | 295,926 | |
| Centrally cleared swaps, at value (net premiums paid $1,983,669) | | | 2,232,281 | |
| Receivables and other assets: | | | | |
| Investments sold (including $14,663,625 sold on a when-issued or delayed delivery basis) | | | 18,387,165 | |
| Interest, dividends and principal paydowns | | | 14,259,300 | |
| Shares of beneficial interest sold | | | 597,966 | |
| Variation margin receivable | | | 374,618 | |
| Other | | | 189,135 | |
| Total assets | | | 1,812,578,217 | |
| Liabilities | | | |
| Unrealized depreciation on forward currency exchange contracts | | | 8,779,721 | |
| Options written, at value (premiums received $2,257,477) | | | 1,622,091 | |
| Swaps, at value (premiums received $3,675,664) | | | 3,244,073 | |
| Centrally cleared swaps, at value (premiums received $2,455,246) | | | 2,944,261 | |
| Swaptions written, at value (premiums received $782,330) | | | 848,132 | |
| Payables and other liabilities: | | | | |
| Investments purchased (including $107,226,767 purchased on a when-issued or delayed delivery basis) | | | 108,538,631 | |
| Shares of beneficial interest redeemed | | | 720,521 | |
| Distribution and service plan fees | | | 271,413 | |
| Trustees’ compensation | | | 101,660 | |
| Shareholder communications | | | 96,017 | |
| Variation margin payable | | | 3,117 | |
| Other | | | 78,489 | |
| Total liabilities | | | 127,248,126 | |
Net Assets | | $ | 1,685,330,091 | |
| | | | |
| | | | |
| Composition of Net Assets | | | |
| Par value of shares of beneficial interest | | $ | 334,282 | |
| Additional paid-in capital | | | 1,823,105,792 | |
| Accumulated net investment income | | | 44,340,175 | |
| Accumulated net realized loss on investments and foreign currency transactions | | | (175,308,515 | ) |
| Net unrealized depreciation on investments and translation of assets and liabilities denominated in foreign currencies | | | (7,141,643 | ) |
Net Assets | | $ | 1,685,330,091 | |
| | | | |
| | | | |
| Net Asset Value Per Share | | | |
| Non-Service Shares: | | | | |
| Net asset value, redemption price per share and offering price per share (based on net assets of $401,308,356 and 81,212,948 shares of beneficial interest outstanding) | | | $4.94 | |
| Service Shares: | | | | |
| Net asset value, redemption price per share and offering price per share (based on net assets of $1,284,021,735 and 253,069,229 shares of beneficial interest outstanding) | | | $5.07 | |
See accompanying Notes to Consolidated Financial Statements.
34 OPPENHEIMER GLOBAL STRATEGIC INCOME FUND/VA
CONSOLIDATED STATEMENT OF OPERATIONS For the Year Ended December 31, 2016
| | | | |
Allocation of Income and Expenses from Master Funds1 | | | | |
| Net investment income allocated from Oppenheimer Master Event-Linked Bond Fund, LLC: | | | | |
| Interest | | $ | 2,570,128 | |
| Dividends | | | 3,001 | |
| Net expenses | | | (197,765 | ) |
| Net investment income allocated from Oppenheimer Master Event-Linked Bond Fund, LLC | | | 2,375,364 | |
| Net investment income allocated from Oppenheimer Master Loan Fund, LLC | | | | |
| Interest | | | 9,679,578 | |
| Dividends | | | 261,440 | |
| Net expenses | | | (558,257 | ) |
| Net investment income allocated from Oppenheimer Master Loan Fund, LLC | | | 9,382,761 | |
| Total allocation of net investment income from master funds | | | 11,758,125 | |
Investment Income | | | | |
| Interest - unaffiliated companies (net of foreign withholding taxes of $400,957) | | | 67,590,200 | |
| Fee income on when-issued securities | | | 1,896,514 | |
| Dividends: | | | | |
| Unaffiliated companies (net of foreign withholding taxes of $169) | | | 1,351 | |
| Affiliated companies | | | 816,567 | |
Total investment income | | | 70,304,632 | |
Expenses | | | | |
| Management fees | | | 10,656,474 | |
| Distribution and service plan fees - Service shares | | | 3,329,305 | |
| Transfer and shareholder servicing agent fees: | | | | |
| Non-Service shares | | | 416,152 | |
| Service shares | | | 1,332,662 | |
| Shareholder communications: | | | | |
| Non-Service shares | | | 50,879 | |
| Service shares | | | 162,843 | |
| Custodian fees and expenses | | | 113,182 | |
| Trustees’ compensation | | | 69,512 | |
| Borrowing fees | | | 31,293 | |
| Other | | | 261,361 | |
| Total expenses | | | 16,423,663 | |
| Less reduction to custodian expenses | | | (6,049 | ) |
| Less waivers and reimbursements of expenses | | | (914,121 | ) |
Net expenses | | | 15,503,493 | |
| Net Investment Income | | | 66,559,264 | |
35 OPPENHEIMER GLOBAL STRATEGIC INCOME FUND/VA
CONSOLIDATED STATEMENT OF OPERATIONS Continued
| | | | |
Realized and Unrealized Gain (Loss) | | | | |
| Net realized gain (loss) on: | | | | |
| Investment transactions in unaffiliated companies (including premiums on options and swaptions exercised) | | $ | (80,022,358 | ) |
| Closing and expiration of option contracts written | | | 1,575,415 | |
| Closing and expiration of futures contracts | | | (8,521,990 | ) |
| Foreign currency transactions | | | 5,728,348 | |
| Swap contracts | | | (2,594,755 | ) |
| Swaption contracts | | | 1,138,332 | |
| Net realized loss allocated from: | | | | |
| Oppenheimer Master Event-Linked Bond Fund, LLC | | | (326,597 | ) |
| Oppenheimer Master Loan Fund, LLC | | | (4,258,987 | ) |
| Net realized loss | | | (87,282,592 | ) |
| Net change in unrealized appreciation/depreciation on: | | | | |
| Investment transactions | | | 114,058,602 | |
| Translation of assets and liabilities denominated in foreign currencies | | | (2,615,984 | ) |
| Futures contracts | | | (846,477 | ) |
| Option contracts written | | | 596,466 | |
| Swap contracts | | | 2,024,039 | |
| Swaption contracts | | | 1,399,283 | |
| Net change in unrealized appreciation/depreciation allocated from: | | | | |
| Oppenheimer Master Event-Linked Bond Fund, LLC | | | 837,960 | |
| Oppenheimer Master Loan Fund, LLC | | | 14,675,812 | |
Net change in unrealized appreciation/depreciation | | | 130,129,701 | |
| Net Increase in Net Assets Resulting from Operations | | $ | 109,406,373 | |
| | | | |
1. The Fund invests in certain affiliated mutual funds that expect to be treated as partnerships for tax purposes. See Note 4 of the accompanying Consolidated Notes.
See accompanying Notes to Consolidated Financial Statements.
36 OPPENHEIMER GLOBAL STRATEGIC INCOME FUND/VA
CONSOLIDATED STATEMENTS OF CHANGES IN NET ASSETS
| | | | | | | | |
| | | Year Ended
December 31, 2016 | | | Year Ended
December 31, 2015 | |
Operations | | | | | | | | |
| Net investment income | | $ | 66,559,264 | | | $ | 86,850,429 | |
| Net realized loss | | | (87,282,592 | ) | | | (53,432,958 | ) |
| Net change in unrealized appreciation/depreciation | | | 130,129,701 | | | | (75,538,414 | ) |
| Net increase (decrease) in net assets resulting from operations | | | 109,406,373 | | | | (42,120,943 | ) |
Dividends and/or Distributions to Shareholders | | | | | | | | |
Dividends from net investment income: | | | | | | | | |
| Non-Service shares | | | (20,719,866 | ) | | | (29,479,205 | ) |
| Service shares | | | (61,256,620 | ) | | | (81,704,570 | ) |
| | | (81,976,486 | ) | | | (111,183,775 | ) |
Beneficial Interest Transactions | | | | | | | | |
Net decrease in net assets resulting from beneficial interest transactions: | | | | | | | | |
| Non-Service shares | | | (34,595,904 | ) | | | (120,101,219 | ) |
| Service shares | | | (112,356,578 | ) | | | (59,939,490 | ) |
| | | (146,952,482 | ) | | | (180,040,709 | ) |
Net Assets | | | | | | | | |
| Total decrease | | | (119,522,595 | ) | | | (333,345,427 | ) |
| Beginning of period | | | 1,804,852,686 | | | | 2,138,198,113 | |
| End of period (including accumulated net investment income of $44,340,175 and $ 90,272,009, respectively) | | $ | 1,685,330,091 | | | $ | 1,804,852,686 | |
| | | | | | | | |
See accompanying Notes to Consolidated Financial Statements.
37 OPPENHEIMER GLOBAL STRATEGIC INCOME FUND/VA
CONSOLIDATED FINANCIAL HIGHLIGHTS
| | | | | | | | | | | | | | | | | | | | |
| Non-Service Shares | | Year Ended
December 31,
2016 | | | Year Ended
December 31,
2015 | | | Year Ended
December 31,
2014 | | | Year Ended
December 31,
2013 | | | Year Ended
December 31,
2012 | |
Per Share Operating Data | | | | | | | | | | | | | | | | | | | | |
| Net asset value, beginning of period | | | $4.88 | | | | $5.30 | | | | $5.38 | | | | $5.67 | | | | $5.38 | |
Income (loss) from investment operations: | | | | | | | | | | | | | | | | | | | | |
| Net investment income1 | | | 0.20 | | | | 0.23 | | | | 0.26 | | | | 0.28 | | | | 0.33 | |
| Net realized and unrealized gain (loss) | | | 0.11 | | | | (0.34) | | | | (0.11) | | | | (0.29) | | | | 0.36 | |
| Total from investment operations | | | 0.31 | | | | (0.11) | | | | 0.15 | | | | (0.01) | | | | 0.69 | |
Dividends and/or distributions to shareholders: | | | | | | | | | | | | | | | | | | | | |
| Dividends from net investment income | | | (0.25) | | | | (0.31) | | | | (0.23) | | | | (0.28) | | | | (0.34) | |
| Distributions from net realized gain | | | 0.00 | | | | 0.00 | | | | 0.00 | | | | 0.00 | | | | (0.06) | |
| Total dividends and/or distributions to shareholders | | | (0.25) | | | | (0.31) | | | | (0.23) | | | | (0.28) | | | | (0.40) | |
| Net asset value, end of period | | | $4.94 | | | | $4.88 | | | | $5.30 | | | | $5.38 | | | | $5.67 | |
| | | | | | | | | | | | | | | | | | | | |
| | | | | | | | | | | | | | | | | | | | |
Total Return, at Net Asset Value2 | | | 6.53% | | | | (2.26)% | | | | 2.84% | | | | (0.13)% | | | | 13.53% | |
| | | | | | | | | | | | | | | | | | | | |
Ratios/Supplemental Data | | | | | | | | | | | | | | | | | | | | |
| Net assets, end of period (in thousands) | | | $401,308 | | | | $429,710 | | | | $586,951 | | | | $738,741 | | | | $741,996 | |
| Average net assets (in thousands) | | | $416,054 | | | | $510,765 | | | | $707,673 | | | | $734,707 | | | | $690,351 | |
Ratios to average net assets:3,4 | | | | | | | | | | | | | | | | | | | | |
| Net investment income | | | 4.00% | | | | 4.51% | | | | 4.73% | | | | 5.12% | | | | 6.01% | |
| Expenses excluding specific expenses listed below | | | 0.79% | | | | 0.76% | | | | 0.74% | | | | 0.74% | | | | 0.77% | |
| Interest and fees from borrowings | | | 0.00%5 | | | | 0.00%5 | | | | 0.00% | | | | 0.00% | | | | 0.00% | |
| Total expenses6 | | | 0.79% | | | | 0.76% | | | | 0.74% | | | | 0.74% | | | | 0.77% | |
| Expenses after payments, waivers and/or reimbursements and reduction to custodian expenses | | | 0.74% | | | | 0.73% | | | | 0.71% | | | | 0.72% | | | | 0.71% | |
| Portfolio turnover rate7 | | | 80% | | | | 79% | | | | 93% | | | | 107% | | | | 78% | |
1. Per share amounts calculated based on the average shares outstanding during the period.
2. Assumes an initial investment on the business day before the first day of the fiscal period, with all dividends and distributions reinvested in additional shares on the reinvestment date, and redemption at the net asset value calculated on the last business day of the fiscal period. Total returns are not annualized for periods less than one full year. Total return information does not reflect expenses that apply at the separate account level or to related insurance products. Inclusion of these charges would reduce the total return figures for all periods shown. Returns do not reflect the deduction of taxes that a shareholder would pay on fund distributions or the redemption of fund shares.
3. Annualized for periods less than one full year.
4. Includes the Fund’s share of the allocated expenses and/or net investment income from the master funds.
5. Less than 0.005%.
6. Total expenses including indirect expenses from affiliated fund fees and expenses were as follows:
| | | | | | |
Year Ended December 31, 2016 | | | 0.80 | % | | |
Year Ended December 31, 2015 | | | 0.77 | % | | |
Year Ended December 31, 2014 | | | 0.75 | % | | |
Year Ended December 31, 2013 | | | 0.74 | % | | |
Year Ended December 31, 2012 | | | 0.77 | % | | |
7. The portfolio turnover rate excludes purchase and sale transactions of To Be Announced (TBA) mortgage-related securities as follows:
| | | | | | | | |
| | | Purchase Transactions | | | Sale Transactions | |
| |
Year Ended December 31, 2016 | | | $1,798,210,272 | | | | $1,766,445,159 | |
Year Ended December 31, 2015 | | | $1,225,140,927 | | | | $1,266,426,777 | |
Year Ended December 31, 2014 | | | $1,348,552,640 | | | | $1,337,346,996 | |
Year Ended December 31, 2013 | | | $4,294,357,677 | | | | $4,679,296,373 | |
Year Ended December 31, 2012 | | | $3,862,820,437 | | | | $3,466,796,233 | |
See accompanying Notes to Consolidated Financial Statements.
38 OPPENHEIMER GLOBAL STRATEGIC INCOME FUND/VA
| | | | | | | | | | | | | | | | | | | | |
| Service Shares | | Year Ended
December 31,
2016 | | | Year Ended
December 31,
2015 | | | Year Ended
December 31,
2014 | | | Year Ended
December 31,
2013 | | | Year Ended
December 31,
2012 | |
Per Share Operating Data | | | | | | | | | | | | | | | | | | | | |
| Net asset value, beginning of period | | | $5.00 | | | | $5.42 | | | | $5.50 | | | | $5.79 | | | | $5.49 | |
Income (loss) from investment operations: | | | | | | | | | | | | | | | | | | | | |
| Net investment income1 | | | 0.19 | | | | 0.23 | | | | 0.25 | | | | 0.27 | | | | 0.33 | |
| Net realized and unrealized gain (loss) | | | 0.12 | | | | (0.35) | | | | (0.11) | | | | (0.29) | | | | 0.36 | |
| Total from investment operations | | | 0.31 | | | | (0.12) | | | | 0.14 | | | | (0.02) | | | | 0.69 | |
Dividends and/or distributions to shareholders: | | | | | | | | | | | | | | | | | | | | |
| Dividends from net investment income | | | (0.24) | | | | (0.30) | | | | (0.22) | | | | (0.27) | | | | (0.33) | |
| Distributions from net realized gain | | | 0.00 | | | | 0.00 | | | | 0.00 | | | | 0.00 | | | | (0.06) | |
| Total dividends and/or distributions to shareholders | | | (0.24) | | | | (0.30) | | | | (0.22) | | | | (0.27) | | | | (0.39) | |
| Net asset value, end of period | | | $5.07 | | | | $5.00 | | | | $5.42 | | | | $5.50 | | | | $5.79 | |
| | | | | | | | | | | | | | | | | | | | |
| | | | | | | | | | | | | | | | | | | | |
Total Return, at Net Asset Value2 | | | 6.27% | | | | (2.49)% | | | | 2.49% | | | | (0.37)% | | | | 13.15% | |
| | | | | | | | | | | | | | | | | | | | |
Ratios/Supplemental Data | | | | | | | | | | | | | | | | | | | | |
| Net assets, end of period (in thousands) | | | $1,284,022 | | | | $1,375,143 | | | | $1,551,247 | | | | $1,716,026 | | | | $1,840,721 | |
| Average net assets (in thousands) | | | $1,332,343 | | | | $1,496,350 | | | | $1,646,615 | | | | $1,794,640 | | | | $1,715,995 | |
Ratios to average net assets:3,4 | | | | | | | | | | | | | | | | | | | | |
| Net investment income | | | 3.75% | | | | 4.26% | | | | 4.48% | | | | 4.88% | | | | 5.76% | |
| Expenses excluding specific expenses listed below | | | 1.04% | | | | 1.01% | | | | 0.99% | | | | 0.99% | | | | 1.02% | |
| Interest and fees from borrowings | | | 0.00%5 | | | | 0.00%5 | | | | 0.00% | | | | 0.00% | | | | 0.00% | |
| Total expenses6 | | | 1.04% | | | | 1.01% | | | | 0.99% | | | | 0.99% | | | | 1.02% | |
| Expenses after payments, waivers and/or reimbursements and reduction to custodian expenses | | | 0.99% | | | | 0.98% | | | | 0.96% | | | | 0.97% | | | | 0.96% | |
| Portfolio turnover rate7 | | | 80% | | | | 79% | | | | 93% | | | | 107% | | | | 78% | |
1. Per share amounts calculated based on the average shares outstanding during the period.
2. Assumes an initial investment on the business day before the first day of the fiscal period, with all dividends and distributions reinvested in additional shares on the reinvestment date, and redemption at the net asset value calculated on the last business day of the fiscal period. Total returns are not annualized for periods less than one full year. Total return information does not reflect expenses that apply at the separate account level or to related insurance products. Inclusion of these charges would reduce the total return figures for all periods shown. Returns do not reflect the deduction of taxes that a shareholder would pay on fund distributions or the redemption of fund shares.
3. Annualized for periods less than one full year.
4. Includes the Fund’s share of the allocated expenses and/or net investment income from the master funds.
5. Less than 0.005%.
6. Total expenses including indirect expenses from affiliated fund fees and expenses were as follows:
| | | | | | |
Year Ended December 31, 2016 | | | 1.05 | % | | |
Year Ended December 31, 2015 | | | 1.02 | % | | |
Year Ended December 31, 2014 | | | 1.00 | % | | |
Year Ended December 31, 2013 | | | 0.99 | % | | |
Year Ended December 31, 2012 | | | 1.02 | % | | |
7. The portfolio turnover rate excludes purchase and sale transactions of To Be Announced (TBA) mortgage-related securities as follows:
| | | | | | | | |
| | | Purchase Transactions | | | Sale Transactions | |
| |
Year Ended December 31, 2016 | | | $1,798,210,272 | | | | $1,766,445,159 | |
Year Ended December 31, 2015 | | | $1,225,140,927 | | | | $1,266,426,777 | |
Year Ended December 31, 2014 | | | $1,348,552,640 | | | | $1,337,346,996 | |
Year Ended December 31, 2013 | | | $4,294,357,677 | | | | $4,679,296,373 | |
Year Ended December 31, 2012 | | | $3,862,820,437 | | | | $3,466,796,233 | |
See accompanying Notes to Consolidated Financial Statements.
39 OPPENHEIMER GLOBAL STRATEGIC INCOME FUND/VA
NOTES TO CONSOLIDATED FINANCIAL STATEMENTS December 31, 2016
1. Organization
Oppenheimer Global Strategic Income Fund/VA (the “Fund”), a separate series of Oppenheimer Variable Account Funds, is a diversified open-end management investment company registered under the Investment Company Act of 1940 (“1940 Act”), as amended. The Fund’s main investment objective is to seek total return. The Fund’s investment adviser is OFI Global Asset Management, Inc. (“OFI Global” or the “Manager”), a wholly-owned subsidiary of OppenheimerFunds, Inc. (“OFI” or the “Sub-Adviser”). The Manager has entered into a sub-advisory agreement with OFI. Shares of the Fund are sold only to separate accounts of life insurance companies.
The Fund offers two classes of shares. Both classes are sold at their offering price, which is the net asset value per share, to separate investment accounts of participating insurance companies as an underlying investment for variable life insurance policies, variable annuity contracts or other investment products. The class of shares designated as Service shares is subject to a distribution and service plan. Both classes of shares have identical rights and voting privileges with respect to the Fund in general and exclusive voting rights on matters that affect that class alone. Earnings, net assets and net asset value per share may differ due to each class having its own expenses, such as transfer and shareholder servicing agent fees and shareholder communications, directly attributable to that class.
The following is a summary of significant accounting policies followed in the Fund’s preparation of financial statements in accordance with accounting principles generally accepted in the United States (“U.S. GAAP”).
2. Significant Accounting Policies
Security Valuation. All investments in securities are recorded at their estimated fair value, as described in Note 3.
Basis for Consolidation. The Fund has established a Cayman Islands exempted company, Oppenheimer Global Strategic Income Fund (Cayman) Ltd., which is wholly-owned and controlled by the Fund (the “Subsidiary”). The Fund and Subsidiary are both managed by the Manager. The Fund may invest up to 25% of its total assets in the Subsidiary. The Subsidiary invests primarily in commodity-linked derivatives (including commodity futures, financial futures, options and swap contracts) and exchange traded funds related to gold or other special minerals (“Gold ETFs”). The Subsidiary is subject to the same investment restrictions and guidelines, and follows the same compliance policies and procedures, as the Fund.
The financial statements have been consolidated and include accounts of the Fund and the Subsidiary. Accordingly, all inter-company transactions and balances have been eliminated. At period end, the Fund owned 51,485 shares with net assets of $4,466,412 in the Subsidiary.
Other financial information at period end:
| | | | |
Total market value of investments | | $ | 397,575 | |
Net assets | | $ | 4,466,412 | |
Net income (loss) | | $ | 140,883 | |
Net realized gain (loss) | | $ | 40,180 | |
Net change in unrealized appreciation/depreciation | | $ | 205,494 | |
Foreign Currency Translation. The books and records of the Fund are maintained in U.S. dollars. Any foreign currency amounts are translated into U.S. dollars on the following basis:
(1) Market value of investment securities, other assets and liabilities — at the exchange rates prevailing at Market Close as described in Note 3.
(2) Purchases and sales of investment securities, income and expenses — at the rates of exchange prevailing on the respective dates of such transactions.
Although the net assets and the market values are presented at the foreign exchange rates at Market Close, the Fund does not isolate the portion of the results of operations resulting from changes in foreign exchange rates on investments from the fluctuations arising from changes in market prices of securities held. Such fluctuations are included with the net realized and unrealized gains or losses from investments shown in the Consolidated Statement of Operations.
For securities, which are subject to foreign withholding tax upon disposition, realized gains or losses on such securities are recorded net of foreign withholding tax.
Reported net realized foreign exchange gains or losses arise from sales of foreign currencies, currency gains or losses realized between the trade and settlement dates on securities transactions, the difference between the amounts of dividends, interest, and foreign withholding tax reclaims recorded on Fund’s books, and the U.S. dollar equivalent of the amounts actually received or paid. Net unrealized foreign exchange gains and losses arise from changes in the value of assets and liabilities other than investments in securities, resulting from changes in the exchange rate.
Allocation of Income, Expenses, Gains and Losses. Income, expenses (other than those attributable to a specific class), gains and losses are allocated on a daily basis to each class of shares based upon the relative proportion of net assets represented by such class. Operating expenses directly attributable to a specific class are charged against the operations of that class.
Dividends and Distributions to Shareholders. Dividends and distributions to shareholders, which are determined in accordance with income tax regulations and may differ from U.S. GAAP, are recorded on the ex-dividend date. Income and capital gain distributions, if any, are declared and paid annually or at other times as deemed necessary by the Manager.
Investment Income. Dividend income is recorded on the ex-dividend date or upon ex-dividend notification in the case of certain foreign dividends where the ex-dividend date may have passed. Non-cash dividends included in dividend income, if any, are recorded at the fair market value of the
40 OPPENHEIMER GLOBAL STRATEGIC INCOME FUND/VA
2. Significant Accounting Policies (Continued)
securities received. Interest income is recognized on an accrual basis. Discount and premium, which are included in interest income on the Consolidated Statement of Operations, are amortized or accreted daily.
Return of Capital Estimates. Distributions received from the Fund’s investments in Master Limited Partnerships (MLPs), generally are comprised of income and return of capital. The Fund records investment income and return of capital based on estimates. Such estimates are based on historical information available from each MLP and other industry sources. These estimates may subsequently be revised based on information received from MLPs after their tax reporting periods are concluded.
Custodian Fees. “Custodian fees and expenses” in the Consolidated Statement of Operations may include interest expense incurred by the Fund on any cash overdrafts of its custodian account during the period. Such cash overdrafts may result from the effects of failed trades in portfolio securities and from cash outflows resulting from unanticipated shareholder redemption activity. The Fund pays interest to its custodian on such cash overdrafts, to the extent they are not offset by positive cash balances maintained by the Fund, at a rate equal to the Federal Funds Rate plus 0.50%. This rate will increase to 2.00% effective January 1, 2017. The “Reduction to custodian expenses” line item, if applicable, represents earnings on cash balances maintained by the Fund during the period. Such interest expense and other custodian fees may be paid with these earnings.
Security Transactions. Security transactions are recorded on the trade date. Realized gains and losses on securities sold are determined on the basis of identified cost.
Indemnifications. The Fund’s organizational documents provide current and former Trustees and officers with a limited indemnification against liabilities arising in connection with the performance of their duties to the Fund. In the normal course of business, the Fund may also enter into contracts that provide general indemnifications. The Fund’s maximum exposure under these arrangements is unknown as this would be dependent on future claims that may be made against the Fund. The risk of material loss from such claims is considered remote.
Federal Taxes. The Fund intends to comply with provisions of the Internal Revenue Code applicable to regulated investment companies and to distribute substantially all of its investment company taxable income, including any net realized gain on investments not offset by capital loss carryforwards, if any, to shareholders. Therefore, no federal income or excise tax provision is required. The Fund files income tax returns in U.S. federal and applicable state jurisdictions. The statute of limitations on the Fund’s tax return filings generally remains open for the three preceding fiscal reporting period ends. The Fund has analyzed its tax positions for the fiscal year ended December 31, 2016, including open tax years, and does not believe there are any uncertain tax positions requiring recognition in the Fund’s financial statements.
Subchapter M requires, among other things, that at least 90% of the Fund’s gross income be derived from securities or derived with respect to its business of investing in securities (typically referred to as “qualifying income”). Income from commodity-linked derivatives may not be treated as “qualifying income” for purposes of the 90% gross income requirement. The Internal Revenue Service (IRS) has previously issued a number of private letter rulings which conclude that income derived from commodity index-linked notes and investments in a wholly-owned subsidiary will be “qualifying income.” As a result, the Fund will gain exposure to commodities through commodity-linked notes and its wholly-owned subsidiary.
The IRS has suspended the granting of private letter rulings pending further review. As a result, there can be no assurance that the IRS will not change its position with respect to commodity-linked notes and wholly-owned subsidiaries. In addition, future legislation and guidance from the Treasury and the IRS may adversely affect the Fund’s ability to gain exposure to commodities through commodity-linked notes and its wholly-owned subsidiary.
The Fund is required to include in income for federal income tax purposes all of the subsidiary’s net income and gains whether or not such income is distributed by the subsidiary. Net income and gains from the subsidiary are generally treated as ordinary income by the Fund, regardless of the character of the subsidiary’s underlying income. Net losses from the subsidiary do not pass through to the Fund for federal income tax purposes.
The tax components of capital shown in the following table represent distribution requirements the Fund must satisfy under the income tax regulations, losses the Fund may be able to offset against income and gains realized in future years and unrealized appreciation or depreciation of securities and other investments for federal income tax purposes.
| | | | | | | | | | | | |
Undistributed Net Investment Income | | Undistributed
Long-Term
Gain | | | Accumulated
Loss
Carryforward1,2,3,4,5 | | | Net Unrealized
Depreciation
Based on cost of
Securities and
Other Investments
for Federal Income
Tax Purposes | |
| |
$33,682,851 | | | $— | | | | $164,705,502 | | | | $6,374,083 | |
1. At period end, the Fund had $164,682,432 of net capital loss carryforward available to offset future realized capital gains, if any, and thereby reduce future taxable gain distributions. Details of the capital loss carryforwards are included in the table below. Capital loss carryovers with no expiration, if any, must be utilized prior to those with expiration dates.
| | | | |
| Expiring | | | |
| |
| No expiration | | $ | 164,682,432 | |
2. The Fund had $23,070 of straddle losses which were deferred.
41 OPPENHEIMER GLOBAL STRATEGIC INCOME FUND/VA
NOTES TO CONSOLIDATED FINANCIAL STATEMENTS Continued
2. Significant Accounting Policies (Continued)
3. During the reporting period, the Fund did not utilize any capital loss carryforward.
4. During the previous reporting period, the Fund did not utilize any capital loss carryforward.
5. During the reporting period, $3,339,490 of unused capital loss carryforward expired.
Net investment income (loss) and net realized gain (loss) may differ for financial statement and tax purposes. The character of dividends and distributions made during the fiscal year from net investment income or net realized gains are determined in accordance with federal income tax requirements, which may differ from the character of net investment income or net realized gains presented in those financial statements in accordance with U.S. GAAP. Also, due to timing of dividends and distributions, the fiscal year in which amounts are distributed may differ from the fiscal year in which the income or net realized gain was recorded by the Fund.
Accordingly, the following amounts have been reclassified for the reporting period. Net assets of the Fund were unaffected by the reclassifications.
| | | | | | | | |
Reduction to Paid-in Capital | | Reduction
to Accumulated
Net Investment
Income | | | Reduction
to Accumulated Net
Realized Loss on Investments | |
| |
| $3,338,490 | | | $30,514,612 | | | | $33,853,102 | |
The tax character of distributions paid during the reporting periods:
| | | | | | | | |
| | | Year Ended
December 31, 2016 | | | Year Ended
December 31, 2015 | |
| |
| Distributions paid from: | | | | | | | | |
| Ordinary income | | $ | 81,976,486 | | | $ | 111,183,775 | |
The aggregate cost of securities and other investments and the composition of unrealized appreciation and depreciation of securities and other investments for federal income tax purposes at period end are noted in the following table. The primary difference between book and tax appreciation or depreciation of securities and other investments, if applicable, is attributable to the tax deferral of losses or tax realization of financial statement unrealized gain or loss.
| | | | |
Federal tax cost of securities | | $ | 1,745,976,661 | |
| Federal tax cost of other investments | | | 108,234,034 | |
| | | | |
| Total federal tax cost | | $ | 1,854,210,695 | |
| | | | |
| Gross unrealized appreciation | | $ | 38,022,334 | |
| Gross unrealized depreciation | | | (44,396,417 | ) |
| | | | |
| Net unrealized depreciation | | $ | (6,374,083 | ) |
| | | | |
Use of Estimates. The preparation of financial statements in conformity with U.S. GAAP requires management to make estimates and assumptions that affect the reported amounts of assets and liabilities and disclosure of contingent assets and liabilities at the date of the financial statements and the reported amounts of increases and decreases in net assets from operations during the reporting period. Actual results could differ from those estimates.
3. Securities Valuation
The Fund calculates the net asset value of its shares as of 4:00 P.M. Eastern time, on each day the New York Stock Exchange (the “Exchange”) is open for trading, except in the case of a scheduled early closing of the Exchange, in which case the Fund will calculate net asset value of the shares as of the scheduled early closing time of the Exchange.
The Fund’s Board has adopted procedures for the valuation of the Fund’s securities and has delegated the day-to-day responsibility for valuation determinations under those procedures to the Manager. The Manager has established a Valuation Committee which is responsible for determining a “fair valuation” for any security for which market quotations are not “readily available.” The Valuation Committee’s fair valuation determinations are subject to review, approval and ratification by the Fund’s Board at its next regularly scheduled meeting covering the calendar quarter in which the fair valuation was determined.
Valuation Methods and Inputs
Securities are valued using unadjusted quoted market prices, when available, as supplied primarily by third party pricing services or dealers.
The following methodologies are used to determine the market value or the fair value of the types of securities described below:
Equity securities traded on a securities exchange (including exchange-traded derivatives other than futures and futures options) are valued based on the official closing price on the principal exchange on which the security is traded, as identified by the Manager, prior to the time when the Fund’s assets are valued. If the official closing price is unavailable, the security is valued at the last sale price on the principal exchange on which it is traded. If the official closing price or last sales price for a foreign security is not available, the security is valued at the mean between the bid and asked price per the exchange or, if not available from the exchange, obtained from two dealers. If bid and asked prices are not available from either the exchange or two dealers, the security is valued by using one of the following methodologies (listed in order of priority): (1) a bid from the exchange, (2) the mean between the bid and asked price as provided by a single dealer, or (3) a bid from a single dealer.
42 OPPENHEIMER GLOBAL STRATEGIC INCOME FUND/VA
3. Securities Valuation (Continued)
Shares of a registered investment company that are not traded on an exchange are valued at that investment company’s net asset value per share.
Corporate and government debt securities (of U.S. or foreign issuers) and municipal debt securities, event-linked bonds, loans, mortgage-backed securities, collateralized mortgage obligations, and asset-backed securities are valued at the mean between the “bid” and “asked” prices utilizing evaluated prices obtained from third party pricing services or broker-dealers who may use matrix pricing methods to determine the evaluated prices.
Short-term money market type debt securities are valued at the mean between the “bid” and “asked” prices utilizing evaluated prices obtained from third party pricing services or broker-dealers.
Structured securities, swaps, swaptions, and other over-the-counter derivatives are valued utilizing evaluated prices obtained from third party pricing services or broker-dealers.
Forward foreign currency exchange contracts are valued utilizing current and forward currency rates obtained from third party pricing services. When the settlement date of a contract is an interim date for which a quotation is not available, interpolated values are derived using the nearest dated forward currency rate.
Futures contracts and futures options traded on a commodities or futures exchange will be valued at the final settlement price or official closing price on the principal exchange as reported by such principal exchange at its trading session ending at, or most recently prior to, the time when the Fund’s assets are valued.
A description of the standard inputs that may generally be considered by the third party pricing vendors in determining their evaluated prices is provided below.
| | |
| Security Type | | Standard inputs generally considered by third-party pricing vendors |
|
| Corporate debt, government debt, municipal, mortgage-backed and asset-backed securities | | Reported trade data, broker-dealer price quotations, benchmark yields, issuer spreads on comparable securities, the credit quality, yield, maturity, and other appropriate factors. |
|
| Loans | | Information obtained from market participants regarding reported trade data and broker-dealer price quotations. |
|
| Event-linked bonds | | Information obtained from market participants regarding reported trade data and broker-dealer price quotations. |
|
| Structured securities | | Relevant market information such as the price of underlying financial instruments, stock market indices, foreign currencies, interest rate spreads, commodities, or the occurrence of other specific events. |
|
| Swaps | | Relevant market information, including underlying reference assets such as credit spreads, credit event probabilities, index values, individual security values, forward interest rates, variable interest rates, volatility measures, and forward currency rates. |
If a market value or price cannot be determined for a security using the methodologies described above, or if, in the “good faith” opinion of the Manager, the market value or price obtained does not constitute a “readily available market quotation,” or a significant event has occurred that would materially affect the value of the security, the security is fair valued either (i) by a standardized fair valuation methodology applicable to the security type or the significant event as previously approved by the Valuation Committee and the Fund’s Board or (ii) as determined in good faith by the Manager’s Valuation Committee. The Valuation Committee considers all relevant facts that are reasonably available, through either public information or information available to the Manager, when determining the fair value of a security. Fair value determinations by the Manager are subject to review, approval and ratification by the Fund’s Board at its next regularly scheduled meeting covering the calendar quarter in which the fair valuation was determined. Those fair valuation standardized methodologies include, but are not limited to, valuing securities at the last sale price or initially at cost and subsequently adjusting the value based on: changes in company specific fundamentals, changes in an appropriate securities index, or changes in the value of similar securities which may be further adjusted for any discounts related to security-specific resale restrictions. When possible, such methodologies use observable market inputs such as unadjusted quoted prices of similar securities, observable interest rates, currency rates and yield curves. The methodologies used for valuing securities are not necessarily an indication of the risks associated with investing in those securities nor can it be assured that the Fund can obtain the fair value assigned to a security if it were to sell the security.
To assess the continuing appropriateness of security valuations, the Manager, or its third party service provider who is subject to oversight by the Manager, regularly compares prior day prices, prices on comparable securities, and sale prices to the current day prices and challenges those prices exceeding certain tolerance levels with the third party pricing service or broker source. For those securities valued by fair valuations, whether through a standardized fair valuation methodology or a fair valuation determination, the Valuation Committee reviews and affirms the reasonableness of the valuations based on such methodologies and fair valuation determinations on a regular basis after considering all relevant information that is reasonably available.
Classifications
Each investment asset or liability of the Fund is assigned a level at measurement date based on the significance and source of the inputs to its valuation. Various data inputs are used in determining the value of each of the Fund’s investments as of the reporting period end. These data inputs are categorized in the following hierarchy under applicable financial accounting standards:
1) Level 1-unadjusted quoted prices in active markets for identical assets or liabilities (including securities actively traded on a securities exchange)
2) Level 2-inputs other than unadjusted quoted prices that are observable for the asset or liability (such as unadjusted quoted prices for similar assets
43 OPPENHEIMER GLOBAL STRATEGIC INCOME FUND/VA
NOTES TO CONSOLIDATED FINANCIAL STATEMENTS Continued
3. Securities Valuation (Continued)
and market corroborated inputs such as interest rates, prepayment speeds, credit risks, etc.)
3) Level 3-significant unobservable inputs (including the Manager’s own judgments about assumptions that market participants would use in pricing the asset or liability).
The inputs used for valuing securities are not necessarily an indication of the risks associated with investing in those securities.
The Fund classifies each of its investments in investment companies which are publicly offered as Level 1. Investment companies that are not publicly offered are measured using net asset value as a practical expedient, and are not classified in the fair value hierarchy.
The table below categorizes amounts that are included in the Fund’s Consolidated Statement of Assets and Liabilities at period end based on valuation input level:
| | | | | | | | | | | | | | | | |
| | | Level 1—
Unadjusted
Quoted Prices | | | Level 2— Other Significant
Observable Inputs | | | Level 3—
Significant
Unobservable
Inputs | | | Value | |
| |
Assets Table | | | | | | | | | | | | | | | | |
Investments, at Value: | | | | | | | | | | | | | | | | |
| Asset-Backed Securities | | $ | — | | | $ | 74,412,966 | | | $ | 17,151,511 | | | $ | 91,564,477 | |
| Mortgage-Backed Obligations | | | — | | | | 272,508,249 | | | | 88,123 | | | | 272,596,372 | |
| U.S. Government Obligations | | | — | | | | 31,134,424 | | | | — | | | | 31,134,424 | |
| Foreign Government Obligations | | | — | | | | 118,334,274 | | | | — | | | | 118,334,274 | |
| Corporate Loans | | | — | | | | 2,501,084 | | | | — | | | | 2,501,084 | |
| Corporate Bonds and Notes | | | — | | | | 782,800,906 | | | | 28,301 | | | | 782,829,207 | |
| Common Stocks | | | 2,852,939 | | | | 40,376 | | | | 149,036 | | | | 3,042,351 | |
| Rights, Warrants and Certificates | | | — | | | | 22,605 | | | | — | | | | 22,605 | |
| Structured Securities | | | — | | | | 5,491,270 | | | | 2,899,462 | | | | 8,390,732 | |
| Short-Term Note | | | — | | | | 119,881,200 | | | | — | | | | 119,881,200 | |
| Investment Companies | | | 58,709,217 | | | | — | | | | — | | | | 58,709,217 | |
| Over-the-Counter Options Purchased | | | — | | | | 1,844,302 | | | | — | | | | 1,844,302 | |
| Over-the-Counter Interest Rate Swaption Purchased | | | — | | | | 918,199 | | | | — | | | | 918,199 | |
| | | | |
| Total Investments, at Value | | | 61,562,156 | | | | 1,409,889,855 | | | | 20,316,433 | | | | 1,491,768,444 | |
Other Financial Instruments: | | | | | | | | | | | | | | | | |
| Swaps, at value | | | — | | | | 295,926 | | | | — | | | | 295,926 | |
| Centrally cleared swaps, at value | | | — | | | | 2,232,281 | | | | — | | | | 2,232,281 | |
| Futures contracts | | | 4,221 | | | | — | | | | — | | | | 4,221 | |
| Forward currency exchange contracts | | | — | | | | 9,683,559 | | | | — | | | | 9,683,559 | |
| | | | |
| Total Assets excluding investment companies valued using practical expedient | | $ | 61,566,377 | | | $ | 1,422,101,621 | | | $ | 20,316,433 | | | | 1,503,984,431 | |
| | | | |
| Investment companies valued using practical expedient | | | | | | | | | | | | | | | 248,096,478 | |
| | | | | | | | | | | | | | | | |
| Total Assets | | | | | | | | | | | | | | $ | 1,752,080,909 | |
| | | | | | | | | | | | | | | | |
| | | | |
Liabilities Table | | | | | | | | | | | | | | | | |
Other Financial Instruments: | | | | | | | | | | | | | | | | |
| Swaps, at value | | $ | — | | | $ | (3,244,073 | ) | | $ | — | | | $ | (3,244,073 | ) |
| Centrally cleared swaps, at value | | | — | | | | (2,944,261 | ) | | | — | | | | (2,944,261 | ) |
| Options written, at value | | | — | | | | (1,622,091 | ) | | | — | | | | (1,622,091 | ) |
| Futures contracts | | | (437,934 | ) | | | — | | | | — | | | | (437,934 | ) |
| Forward currency exchange contracts | | | — | | | | (8,779,721 | ) | | | — | | | | (8,779,721 | ) |
| Swaptions written, at value | | | — | | | | (848,132 | ) | | | — | | | | (848,132 | ) |
| | | | |
| Total Liabilities | | $ | (437,934 | ) | | $ | (17,438,278 | ) | | $ | — | | | $ | (17,876,212 | ) |
| | | | |
Forward currency exchange contracts and futures contracts, if any, are reported at their unrealized appreciation/depreciation at measurement date, which represents the change in the contract’s value from trade date. All additional assets and liabilities included in the above table are reported at their market value at measurement date.
The table below shows the transfers between Level 2 and Level 3. The Fund’s policy is to recognize transfers in and transfers out as of the beginning of the reporting period.
| | | | | | | | |
| | | Transfers out of
Level 2* | | | Transfers into
Level 3* | |
| |
Assets Table Investments, at Value: | | | | | | | | |
Mortgage-Backed Obligations | | $ | (142,168 | ) | | $ | 142,168 | |
| | | | |
| Total Assets | | $ | (142,168 | ) | | $ | 142,168 | |
| | | | |
* Transferred from Level 2 to Level 3 because of the lack of observable market data due to a decrease in market activity for these securities.
44 OPPENHEIMER GLOBAL STRATEGIC INCOME FUND/VA
3. Securities Valuation (Continued)
The following is a reconciliation of assets in which significant unobservable inputs (level 3) were used in determining fair value:
| | | | | | | | | | | | | | | | |
| | | Value as of December 31, 2015 | | | Realized gain (loss) | | | Change in unrealized
appreciation/ depreciation | | | Accretion/ (amortization) of premium/ discounta | |
| |
Assets Table Investments, at Value: | | | | | | | | | | | | | | | | |
| Asset-Backed Securities | | $ | 16,991,566 | | | $ | — | | | $ | 70,591 | | | $ | 89,354 | |
| Mortgage-Backed Obligations | | | 16,686 | | | | (49,009) | | | | (3,530) | | | | (171) | |
| Corporate Loans | | | 7,452 | | | | (1,440,560) | | | | 1,433,108 | | | | — | |
| Corporate Bonds and Notes | | | 29,997 | | | | 1 | | | | (1,657) | | | | (39) | |
| Common Stocks | | | 1,255,935 | | | | (2,111,954) | | | | (1,084,555) | | | | — | |
| Structured Securities | | | 4,439,555 | | | | (5,199,346) | | | | 4,763,316 | | | | 49,425 | |
| | | | |
| Total Assets | | $ | 22,741,191 | | | $ | (8,800,868) | | | $ | 5,177,273 | | | $ | 138,569 | |
| | | | |
a. Included in net investment income.
| | | | | | | | | | | | | | | | | | | | |
| | | Purchases | | Sales | | | Transfers into Level 3 | | | Transfers out of Level 3 | | | Value as of
December 31, 2016 | |
| |
Assets Table Investments, at Value: | | | | | | | | | | | | | | | | | | | | |
| Asset-Backed Securities | | $ | — | | | $ | — | | | $ | — | | | $ | — | | | $ | 17,151,511 | |
| Mortgage-Backed Obligations | | | — | | | | (18,021 | ) | | | 142,168 | | | | — | | | | 88,123 | |
| Corporate Loans | | | — | | | | — | | | | — | | | | — | | | | — | |
| Corporate Bonds and Notes | | | — | | | | (1 | ) | | | — | | | | — | | | | 28,301 | |
| Common Stocks | | | 3,295,200 | | | | (1,205,590 | ) | | | — | | | | — | | | | 149,036 | |
| Structured Securities | | | — | | | | (1,153,488 | ) | | | — | | | | — | | | | 2,899,462 | |
| �� | | | |
| Total Assets | | $ | 3,295,200 | | | $ | (2,377,100 | ) | | $ | 142,168 | | | $ | — | | | $ | 20,316,433 | |
| | | | |
The total change in unrealized appreciation/depreciation included in the Consolidated Statement of Operations attributable to Level 3 investments still held at period end:
| | | | |
| | | Change in
unrealized
appreciation/
depreciation | |
| |
Assets Table Investments, at Value | | | | |
| Asset-Backed Securities | | $ | 70,591 | |
| Mortgage-Backed Obligations | | | (52,869 | ) |
| Corporate Bonds and Notes | | | (1,656 | ) |
| Common Stocks | | | (3,146,179 | ) |
| Structured Securities | | | (252,872 | ) |
| Total | | $ | (3,382,985 | ) |
The following table summarizes the valuation techniques and significant unobservable inputs used in determining fair value measurements for those investments classified as Level 3 at period end:
| | | | | | | | | | | | | | |
| | | Value as of December 31, 2016 | | | Valuation Technique | | Unobservable Input | | Range of
Unobservable Inputs | | Unobservable
Input Used | | |
|
| Assets Table | | | | | | | | | | | | | | |
| Investments, at Value: | | | | | | | | | | | | | | |
| Asset-Backed Securities | | $ | 17,151,511 | | | Broker quotes | | N/A | | N/A | | N/A | | (a) |
| Mortgage-Backed Obligations | | | 88,123 | | | Pricing service | | N/A | | N/A | | N/A | | (a) |
| Corporate Bonds and Notes | | | 28,301 | | | Broker quotes | | N/A | | N/A | | N/A | | (a) |
| | | | | | Estimated recovery | | | | | | | | |
| Common Stocks | | | 15 | | | proceeds | | Nominal Value | | N/A | | $0.01/share | | (b) |
| | | | | | Estimated recovery | | | | | | | | |
| Common Stocks | | | 149,021 | | | proceeds | | N/A | | N/A | | $0.0359/share | | (c) |
| Structured Securities | | | 2,899,462 | | | Broker quotes | | N/A | | N/A | | N/A | | (a) |
| | | | | | | | | | | | | | |
| Total | | $ | 20,316,433 | | | | | | | | | | | |
| | | | | | | | | | | | | | |
(a) Securities classified as Level 3 whose unadjusted values were provided by a pricing service or broker-dealer for which such inputs are unobservable. The Manager periodically reviews pricing vendor and broker methodologies and inputs to confirm they are determined using unobservable inputs and have been appropriately classified. Such securities’ fair valuations could change significantly based on changes in unobservable inputs used by the pricing service or broker.
(b) The Fund fair values certain common stocks held at a nominal value to reflect the low probability of receipt of future payments to be received as a result of a merger. The Manager monitors such investments for additional market information or the occurrence of a significant event which would warrant a re-evaluation of the security’s fair valuation. A significant increase (decrease) in the future distribution amount, or a significant increase (decrease) to the probability of payment rate, will result in a significant increase (decrease) to the fair value of the investment.
45 OPPENHEIMER GLOBAL STRATEGIC INCOME FUND/VA
NOTES TO CONSOLIDATED FINANCIAL STATEMENTS Continued
4. Investments and Risks
Risks of Foreign Investing. The Fund may invest in foreign securities which are subject to special risks. Securities traded in foreign markets may be less liquid and more volatile than those traded in U.S. markets. Foreign issuers are usually not subject to the same accounting and disclosure requirements that U.S. companies are subject to, which may make it difficult for the Fund to evaluate a foreign company’s operations or financial condition. A change in the value of a foreign currency against the U.S. dollar will result in a change in the U.S. dollar value of investments denominated in that foreign currency and in the value of any income or distributions the Fund may receive on those investments. The value of foreign investments may be affected by exchange control regulations, foreign taxes, higher transaction and other costs, delays in the settlement of transactions, changes in economic or monetary policy in the United States or abroad, expropriation or nationalization of a company’s assets, or other political and economic factors. In addition, due to the inter-relationship of global economies and financial markets, changes in political and economic factors in one country or region could adversely affect conditions in another country or region. Investments in foreign securities may also expose the Fund to time-zone arbitrage risk. Foreign securities may trade on weekends or other days when the Fund does not price its shares. At times, the Fund may emphasize investments in a particular country or region and may be subject to greater risks from adverse events that occur in that country or region. Foreign securities and foreign currencies held in foreign banks and securities depositories may be subject to limited or no regulatory oversight.
Investments in Affiliated Funds. The Fund is permitted to invest in other mutual funds advised by the Manager (“Affiliated Funds”). Affiliated Funds are open-end management investment companies registered under the 1940 Act, as amended. The Manager is the investment adviser of, and the Sub-Adviser provides investment and related advisory services to, the Affiliated Funds. When applicable, the Fund’s investments in Affiliated Funds are included in the Consolidated Statement of Investments. Shares of Affiliated Funds are valued at their net asset value per share. As a shareholder, the Fund is subject to its proportional share of the Affiliated Funds’ expenses, including their management fee. The Manager will waive fees and/or reimburse Fund expenses in an amount equal to the indirect management fees incurred through the Fund’s investment in the Affiliated Funds.
Each of the Affiliated Funds in which the Fund invests has its own investment risks, and those risks can affect the value of the Fund’s investments and therefore the value of the Fund’s shares. To the extent that the Fund invests more of its assets in one Affiliated Fund than in another, the Fund will have greater exposure to the risks of that Affiliated Fund.
Investments in Money Market Instruments. The Fund is permitted to invest its free cash balances in money market instruments to provide liquidity or for defensive purposes. The Fund may invest in money market instruments by investing in Class E shares of Oppenheimer Institutional Government Money Market Fund (“IGMMF”), formerly known as Oppenheimer Institutional Money Market Fund, which is an Affiliated Fund. IGMMF is regulated as a money market fund under the 1940 Act, as amended. The Fund may also invest in money market instruments directly or in other affiliated or unaffiliated money market funds.
Investment in Oppenheimer Master Funds. The Fund is permitted to invest in entities sponsored and/or advised by the Manager or an affiliate. Certain of these entities in which the Fund invests are mutual funds registered under the 1940 Act, as amended, that expect to be treated as partnerships for tax purposes, specifically Oppenheimer Master Loan Fund, LLC (“Master Loan”) and Oppenheimer Master Event-Linked Bond Fund, LLC (“Master Event-Linked Bond”) (the “Master Funds”). Each Master Fund has its own investment risks, and those risks can affect the value of the Fund’s investments and therefore the value of the Fund’s shares. To the extent that the Fund invests more of its assets in one Master Fund than in another, the Fund will have greater exposure to the risks of that Master Fund.
The investment objective of Master Loan is to seek income. The investment objective of Master Event-Linked Bond is to seek total return. The Fund’s investments in the Master Funds are included in the Consolidated Statement of Investments. The Fund recognizes income and gain/(loss) on its investments in each Master Fund according to its allocated pro-rata share, based on its relative proportion of total outstanding Master Fund shares held, of the total net income earned and the net gain/(loss) realized on investments sold by the Master Funds. As a shareholder, the Fund is subject to its proportional share of the Master Funds’ expenses, including their management fee. The Manager will waive fees and/or reimburse Fund expenses in an amount equal to the indirect management fees incurred through the Fund’s investment in the Master Funds. The Fund owns 13.7% of Master Loan and 14.6% of Master Event-Linked Bond at period end.
Master Limited Partnerships (“MLPs”). MLPs issue common units that represent an equity ownership interest in a partnership and provide limited voting rights. MLP common units are registered with the Securities and Exchange Commission (“SEC”), and are freely tradable on securities exchanges such as the NYSE and the NASDAQ Stock Market (“NASDAQ”), or in the over-the-counter (“OTC”) market. An MLP consists of one or more general partners, who conduct the business, and one or more limited partners, who contribute capital. MLP common unit holders have a limited role in the partnership’s operations and management. The Fund, as a limited partner, normally would not be liable for the debts of the MLP beyond the amounts the Fund has contributed, but would not be shielded to the same extent that a shareholder of a corporation would be. In certain circumstances creditors of an MLP would have the right to seek return of capital distributed to a limited partner. This right of an MLP’s creditors would continue after the Fund sold its investment in the MLP.
Structured Securities. The Fund invests in structured securities whose market values, interest rates and/or redemption prices are linked to the performance of underlying foreign currencies, interest rate spreads, stock market indices, prices of individual securities, commodities or other financial instruments or the occurrence of other specific events. The structured securities are often leveraged, increasing the volatility of each note’s market value relative to the change in the underlying linked financial element or event. Fluctuations in value of these securities are recorded as unrealized gains and losses in the accompanying Consolidated Statement of Operations. The Fund records a realized gain or loss when a structured security is sold or matures.
46 OPPENHEIMER GLOBAL STRATEGIC INCOME FUND/VA
4. Investments and Risks (Continued)
Loans. The Fund invests in loans made to U.S. and foreign borrowers that are corporations, partnerships or other business entities. The Fund will do so directly as an original lender or by assignment or indirectly through participation agreements or certain derivative instruments. While many of these loans will be collateralized, the Fund can also invest in uncollateralized loans. Loans are often issued in connection with recapitalizations, acquisitions, leveraged buyouts, and refinancing of borrowers. The loans often pay interest at rates that float above (or are adjusted periodically based on) a benchmark that reflects current interest rates although the Fund can also invest in loans with fixed interest rates.
Securities on a When-Issued or Delayed Delivery Basis. The Fund may purchase securities on a “when-issued” basis, and may purchase or sell securities on a “delayed delivery” basis. “When-issued” or “delayed delivery” refers to securities whose terms and indenture are available and for which a market exists, but which are not available for immediate delivery. Delivery and payment for securities that have been purchased by the Fund on a when-issued basis normally takes place within six months and possibly as long as two years or more after the trade date. During this period, such securities do not earn interest, are subject to market fluctuation and may increase or decrease in value prior to their delivery. The purchase of securities on a when-issued basis may increase the volatility of the Fund’s net asset value to the extent the Fund executes such transactions while remaining substantially fully invested. When the Fund engages in when-issued or delayed delivery transactions, it relies on the buyer or seller, as the case may be, to complete the transaction. Their failure to do so may cause the Fund to lose the opportunity to obtain or dispose of the security at a price and yield it considers advantageous. The Fund may also sell securities that it purchased on a when-issued basis or forward commitment prior to settlement of the original purchase.
At period end, the Fund had purchased securities issued on a when-issued or delayed delivery basis and sold securities issued on a delayed delivery basis as follows:
| | | | |
| | | When-Issued or
Delayed Delivery
Basis Transactions | |
| |
| Purchased securities | | | $107,226,767 | |
| Sold securities | | | 14,663,625 | |
The Fund may enter into “forward roll” transactions with respect to mortgage-related securities. In this type of transaction, the Fund sells a mortgage-related security to a buyer and simultaneously agrees to repurchase a similar security (same type, coupon and maturity) at a later date at a set price. During the period between the sale and the repurchase, the Fund will not be entitled to receive interest and principal payments on the securities that have been sold. The Fund records the incremental difference between the forward purchase and sale of each forward roll as realized gain (loss) on investments or as fee income in the case of such transactions that have an associated fee in lieu of a difference in the forward purchase and sale price.
Forward roll transactions may be deemed to entail embedded leverage since the Fund purchases mortgage-related securities with extended settlement dates rather than paying for the securities under a normal settlement cycle. This embedded leverage increases the Fund’s market value of investments relative to its net assets which can incrementally increase the volatility of the Fund’s performance. Forward roll transactions can be replicated over multiple settlement periods.
Risks of entering into forward roll transactions include the potential inability of the counterparty to meet the terms of the agreement; the potential of the Fund to receive inferior securities at redelivery as compared to the securities sold to the counterparty; and counterparty credit risk.
At period end, the Fund pledged $1,399,324 of collateral to the counterparty for forward roll transactions.
Restricted Securities. At period end, investments in securities included issues that are restricted. A restricted security may have a contractual restriction on its resale and is valued under methods approved by the Board of Trustees as reflecting fair value. Securities that are restricted are marked with an applicable footnote on the Consolidated Statement of Investments. Restricted securities are reported on a schedule following the Consolidated Statement of Investments.
Equity Security Risk. Stocks and other equity securities fluctuate in price. The value of the Fund’s portfolio may be affected by changes in the equity markets generally. Equity markets may experience significant short-term volatility and may fall sharply at times. Different markets may behave differently from each other and U.S. equity markets may move in the opposite direction from one or more foreign stock markets. Adverse events in any part of the equity or fixed-income markets may have unexpected negative effects on other market segments.
The prices of individual equity securities generally do not all move in the same direction at the same time and a variety of factors can affect the price of a particular company’s securities. These factors may include, but are not limited to, poor earnings reports, a loss of customers, litigation against the company, general unfavorable performance of the company���s sector or industry, or changes in government regulations affecting the company or its industry.
Credit Risk. The Fund invests in high-yield, non-investment-grade bonds, which may be subject to a greater degree of credit risk. Credit risk relates to the ability of the issuer to meet interest or principal payments or both as they become due. The Fund may acquire securities that have missed an interest payment, and is not obligated to dispose of securities whose issuers or underlying obligors subsequently miss an interest payment.
Information concerning securities not accruing interest at period end is as follows:
47 OPPENHEIMER GLOBAL STRATEGIC INCOME FUND/VA
NOTES TO CONSOLIDATED FINANCIAL STATEMENTS Continued
4. Investments and Risks (Continued)
| | | | |
Cost | | $ | 3,687,721 | |
Market Value | | $ | 2,030,675 | |
Market Value as % of Net Assets | | | 0.12% | |
Sovereign Debt Risk. The Fund invests in sovereign debt securities, which are subject to certain special risks. These risks include, but are not limited to, the risk that a governmental entity may delay or refuse, or otherwise be unable, to pay interest or repay the principal on its sovereign debt. There may also be no legal process for collecting sovereign debt that a government does not pay or bankruptcy proceedings through which all or part of such sovereign debt may be collected. In addition, a restructuring or default of sovereign debt may also cause additional impacts to the financial markets, such as downgrades to credit ratings, reduced liquidity and increased volatility, among others.
Shareholder Concentration. At period end, three shareholders each owned 20% or more of the Fund’s total outstanding shares.
A shareholder is a related party of the Fund. Related parties may include, but are not limited to, the investment manager and its affiliates, affiliated broker dealers, fund of funds, and directors or employees. A related party owned 21% of the Fund’s total outstanding shares at period end.
5. Market Risk Factors
The Fund’s investments in securities and/or financial derivatives may expose the Fund to various market risk factors:
Commodity Risk. Commodity risk relates to the change in value of commodities or commodity indexes as they relate to increases or decreases in the commodities market. Commodities are physical assets that have tangible properties. Examples of these types of assets are crude oil, heating oil, metals, livestock, and agricultural products.
Credit Risk. Credit risk relates to the ability of the issuer of debt to meet interest and principal payments, or both, as they come due. In general, lower-grade, higher-yield debt securities are subject to credit risk to a greater extent than lower-yield, higher-quality securities.
Equity Risk. Equity risk relates to the change in value of equity securities as they relate to increases or decreases in the general market.
Foreign Exchange Rate Risk. Foreign exchange rate risk relates to the change in the U.S. dollar value of a security held that is denominated in a foreign currency. The U.S. dollar value of a foreign currency denominated security will decrease as the dollar appreciates against the currency, while the U.S. dollar value will increase as the dollar depreciates against the currency.
Interest Rate Risk. Interest rate risk refers to the fluctuations in value of fixed-income securities resulting from the inverse relationship between price and yield. For example, an increase in general interest rates will tend to reduce the market value of already issued fixed-income investments, and a decline in general interest rates will tend to increase their value. In addition, debt securities with longer maturities, which tend to have higher yields, are subject to potentially greater fluctuations in value from changes in interest rates than obligations with shorter maturities.
Volatility Risk. Volatility risk refers to the magnitude of the movement, but not the direction of the movement, in a financial instrument’s price over a defined time period. Large increases or decreases in a financial instrument’s price over a relative time period typically indicate greater volatility risk, while small increases or decreases in its price typically indicate lower volatility risk.
6. Use of Derivatives
The Fund’s investment objective not only permits the Fund to purchase investment securities, it also allows the Fund to enter into various types of derivatives contracts, including, but not limited to, futures contracts, forward currency exchange contracts, credit default swaps, interest rate swaps, total return swaps, variance swaps and purchased and written options. In doing so, the Fund will employ strategies in differing combinations to permit it to increase, decrease, or change the level or types of exposure to market risk factors. These instruments may allow the Fund to pursue its objectives more quickly and efficiently than if it were to make direct purchases or sales of securities capable of effecting a similar response to market factors. Such contracts may be entered into through a bilateral over-the-counter (“OTC”) transaction, or through a securities or futures exchange and cleared through a clearinghouse.
Derivatives may have little or no initial cash investment relative to their market value exposure and therefore can produce significant gains or losses in excess of their cost due to unanticipated changes in the market risk factors and the overall market. This use of embedded leverage allows the Fund to increase its market value exposure relative to its net assets and can substantially increase the volatility of the Fund’s performance. In instances where the Fund is using derivatives to decrease, or hedge, exposures to market risk factors for securities held by the Fund, there are also risks that those derivatives may not perform as expected resulting in losses for the combined or hedged positions. Some derivatives have the potential for unlimited loss, regardless of the size of the Fund’s initial investment.
Additional associated risks from investing in derivatives also exist and potentially could have significant effects on the valuation of the derivative and the Fund. Typically, the associated risks are not the risks that the Fund is attempting to increase or decrease exposure to, per its investment objectives, but are the additional risks from investing in derivatives. Examples of these associated risks are liquidity risk, which is the risk that the Fund will not be able to sell the derivative in the open market in a timely manner, and counterparty credit risk, which is the risk that the counterparty will not fulfill its obligation to the Fund.
The Fund’s actual exposures to these market risk factors and associated risks during the period are discussed in further detail, by derivative type, below.
Forward Currency Exchange Contracts
The Fund may enter into forward currency exchange contracts (“forward contracts”) for the purchase or sale of a foreign currency at a negotiated rate at
48 OPPENHEIMER GLOBAL STRATEGIC INCOME FUND/VA
6. Use of Derivatives (Continued)
a future date. Such contracts are traded in the OTC inter-bank currency dealer market.
Forward contracts are reported on a schedule following the Consolidated Statement of Investments. The unrealized appreciation (depreciation) is reported in the Consolidated Statement of Assets and Liabilities as a receivable (or payable) and in the Consolidated Statement of Operations within the change in unrealized appreciation (depreciation). At contract close, the difference between the original cost of the contract and the value at the close date is recorded as a realized gain (loss) in the Consolidated Statement of Operations.
The Fund has entered into forward contracts with the obligation to purchase specified foreign currencies in the future at a currently negotiated forward rate in order to take a positive investment perspective on the related currency. These forward contracts seek to increase exposure to foreign exchange rate risk.
The Fund has entered into forward contracts with the obligation to purchase specified foreign currencies in the future at a currently negotiated forward rate in order to decrease exposure to foreign exchange rate risk associated with foreign currency denominated securities held by the Fund.
The Fund has entered into forward contracts with the obligation to sell specified foreign currencies in the future at a currently negotiated forward rate in order to take a negative investment perspective on the related currency. These forward contracts seek to increase exposure to foreign exchange rate risk.
The Fund has entered into forward contracts with the obligation to sell specified foreign currencies in the future at a currently negotiated forward rate in order to decrease exposure to foreign exchange rate risk associated with foreign currency denominated securities held by the Fund.
During the reporting period, the Fund had daily average contract amounts on forward contracts to buy and sell of $374,832,613 and $474,612,739, respectively.
Additional associated risk to the Fund includes counterparty credit risk. Counterparty credit risk arises from the possibility that the counterparty to a forward contract will default and fail to perform its obligations to the Fund.
Futures Contracts
A futures contract is a commitment to buy or sell a specific amount of a commodity, financial instrument or currency at a negotiated price on a stipulated future date. The Fund may buy and sell futures contracts and may also buy or write put or call options on these futures contracts. Futures contracts and options thereon are generally entered into on a regulated futures exchange and cleared through a clearinghouse associated with the exchange.
Upon entering into a futures contract, the Fund is required to deposit either cash or securities (initial margin) in an amount equal to a certain percentage of the contract value in an account registered in the futures commission merchant’s name. Subsequent payments (variation margin) are paid to or from the futures commission merchant each day equal to the daily changes in the contract value. Such payments are recorded as unrealized gains and losses. Should the Fund fail to make requested variation margin payments, the futures commission merchant can gain access to the initial margin to satisfy the Fund’s payment obligations.
Futures contracts are reported on a schedule following the Consolidated Statement of Investments. Securities held by a futures commission merchant to cover initial margin requirements on open futures contracts are noted in the Consolidated Statement of Investments. Cash held by a futures commission merchant to cover initial margin requirements on open futures contracts and the receivable and/or payable for the daily mark to market for the variation margin are noted in the Consolidated Statement of Assets and Liabilities. The net change in unrealized appreciation and depreciation is reported in the Consolidated Statement of Operations. Realized gains (losses) are reported in the Consolidated Statement of Operations at the closing or expiration of futures contracts.
The Fund has purchased futures contracts on various bonds and notes to increase exposure to interest rate risk.
The Fund has sold futures contracts on various bonds and notes to decrease exposure to interest rate risk.
The Fund has sold futures contracts on various equity indexes to decrease exposure to equity risk.
During the reporting period, the Fund had an ending monthly average market value of $148,090,086 and $67,672,958 on futures contracts purchased and sold, respectively.
Additional associated risks of entering into futures contracts (and related options) include the possibility that there may be an illiquid market where the Fund is unable to liquidate the contract or enter into an offsetting position and, if used for hedging purposes, the risk that the price of the contract will correlate imperfectly with the prices of the Fund’s securities.
Option Activity
The Fund may buy and sell put and call options, or write put and call options. When an option is written, the Fund receives a premium and becomes obligated to sell or purchase the underlying security, currency or other underlying financial instrument at a fixed price, upon exercise of the option.
Options can be traded through an exchange or through a privately negotiated arrangement with a dealer in an OTC transaction. Options traded through an exchange are generally cleared through a clearinghouse (such as The Options Clearing Corporation). The difference between the premium received or paid, and market value of the option, is recorded as unrealized appreciation or depreciation. The net change in unrealized appreciation or depreciation is reported in the Consolidated Statement of Operations. When an option is exercised, the cost of the security purchased or the proceeds of the security sale are adjusted by the amount of premium received or paid. Upon the expiration or closing of the option transaction, a gain or loss is reported in the Consolidated Statement of Operations.
The Fund has purchased call options on currencies to increase exposure to foreign exchange rate risk. A purchased call option becomes more valuable as the price of the underlying financial instrument appreciates relative to the strike price.
The Fund has purchased put options on currencies to decrease exposure to foreign exchange rate risk. A purchased put option becomes more valuable as the price of the underlying financial instrument depreciates relative to the strike price.
49 OPPENHEIMER GLOBAL STRATEGIC INCOME FUND/VA
NOTES TO CONSOLIDATED FINANCIAL STATEMENTS Continued
6. Use of Derivatives (Continued)
The Fund has purchased call options on treasury and/or euro futures to increase exposure to interest rate risk. A purchased call option becomes more valuable as the price of the underlying financial instrument appreciates relative to the strike price.
The Fund has purchased put options on treasury and/or euro futures to decrease exposure to interest rate risk. A purchased put option becomes more valuable as the price of the underlying financial instrument depreciates relative to the strike price.
The Fund has purchased call options on individual equity securities and/or equity indexes to increase exposure to equity risk. A purchased call option becomes more valuable as the price of the underlying financial instrument appreciates relative to the strike price.
During the reporting period, the Fund had an ending monthly average market value of $607,006 and $802,524 on purchased call options and purchased put options, respectively.
Options written, if any, are reported in a schedule following the Consolidated Statement of Investments and as a liability in the Consolidated Statement of Assets and Liabilities. Securities held in collateral accounts to cover potential obligations with respect to outstanding written options are noted in the Consolidated Statement of Investments.
The risk in writing a call option is that the market price of the security increases and if the option is exercised, the Fund must either purchase the security at a higher price for delivery or, if the Fund owns the underlying security, give up the opportunity for profit. The risk in writing a put option is that the Fund may incur a loss if the market price of the security decreases and the option is exercised. The risk in buying an option is that the Fund pays a premium whether or not the option is exercised. The Fund also has the additional risk that there may be an illiquid market where the Fund is unable to close the contract.
The Fund has written put options on currencies to increase exposure to foreign exchange rate risk. A written put option becomes more valuable as the price of the underlying financial instrument appreciates relative to the strike price.
The Fund has written call options on currencies to decrease exposure to foreign exchange rate risk. A written call option becomes more valuable as the price of the underlying financial instrument depreciates relative to the strike price.
The Fund has written put options on treasury and/or euro futures to increase exposure to interest rate risk. A written put option becomes more valuable as the price of the underlying financial instrument appreciates relative to the strike price.
The Fund has written call options on individual equity securities and/or equity indexes to decrease exposure to equity risk. A written call option becomes more valuable as the price of the underlying financial instrument depreciates relative to the strike price.
During the reporting period, the Fund had an ending monthly average market value of $537,015 and $509,461 on written call options and written put options, respectively.
Additional associated risks to the Fund include counterparty credit risk and liquidity risk.
Written option activity for the reporting period was as follows:
| | | | | | | | |
| | | Number of
Contracts | | Amount of
Premiums | |
| |
Options outstanding as of | | | | | | | | |
December 31, 2015 | | | 64,770,515,000 | | | $ | 2,061,032 | |
Options written | | | 530,436,238,368 | | | | 8,759,977 | |
Options closed or expired | | | (100,762,038,642 | ) | | | (1,575,414 | ) |
Options exercised | | | (411,824,533,383 | ) | | | (6,988,118 | ) |
| | | | |
Options outstanding as of | | | | | | | | |
December 31, 2016 | | | 82,620,181,343 | | | $ | 2,257,477 | |
| | | | |
Swap Contracts
The Fund may enter into swap contract agreements with a counterparty to exchange a series of cash flows based on either specified reference rates, the price or volatility of asset or non-asset references, or the occurrence of a credit event, over a specified period. Swaps can be executed in a bi-lateral privately negotiated arrangement with a dealer in an OTC transaction (“OTC swaps”) or executed on a regulated market. Certain swaps, regardless of the venue of their execution, are required to be cleared through a clearinghouse (“centrally cleared swaps”). Swap contracts may include interest rate, equity, debt, index, total return, credit default, currency, and volatility swaps.
Swap contracts are reported on a schedule following the Consolidated Statement of Investments. The values of centrally cleared swap and OTC swap contracts are aggregated by positive and negative values and disclosed separately on the Consolidated Statement of Assets and Liabilities. The unrealized appreciation (depreciation) related to the change in the valuation of the notional amount of the swap is combined with the accrued interest due to (owed by) the Fund, if any, at termination or settlement. The net change in this amount during the period is included on the Consolidated Statement of Operations. The Fund also records any periodic payments received from (paid to) the counterparty, including at termination, under such contracts as realized gain (loss) on the Consolidated Statement of Operations.
Swap contract agreements are exposed to the market risk factor of the specific underlying reference rate or asset. Swap contracts are typically more attractively priced compared to similar investments in related cash securities because they isolate the risk to one market risk factor and eliminate the other market risk factors. Investments in cash securities (for instance bonds) have exposure to multiple risk factors (credit and interest rate risk). Because swaps have embedded leverage, they can expose the Fund to substantial risk in the isolated market risk factor.
Credit Default Swap Contracts. A credit default swap is a contract that enables an investor to buy or sell protection against a defined-issuer credit event, such as the issuer’s failure to make timely payments of interest or principal on a debt security, bankruptcy or restructuring. The Fund may enter into credit default swaps either by buying or selling protection on a corporate issuer, sovereign issuer, or a basket or index of issuers (the “reference
50 OPPENHEIMER GLOBAL STRATEGIC INCOME FUND/VA
6. Use of Derivatives (Continued)
asset”).
The buyer of protection pays a periodic fee to the seller of protection based on the notional amount of the swap contract. The seller of protection agrees to compensate the buyer of protection for future potential losses as a result of a credit event on the reference asset. The contract effectively transfers the credit event risk of the reference asset from the buyer of protection to the seller of protection.
The ongoing value of the contract will fluctuate throughout the term of the contract based primarily on the credit risk of the reference asset. If the credit quality of the reference asset improves relative to the credit quality at contract initiation, the buyer of protection may have an unrealized loss greater than the anticipated periodic fee owed. This unrealized loss would be the result of current credit protection being cheaper than the cost of credit protection at contract initiation. If the buyer elects to terminate the contract prior to its maturity, and there has been no credit event, this unrealized loss will become realized. If the contract is held to maturity, and there has been no credit event, the realized loss will be equal to the periodic fee paid over the life of the contract.
If there is a credit event, the buyer of protection can exercise its rights under the contract and receive a payment from the seller of protection equal to the notional amount of the swap less the market value of specified debt securities issued by the reference asset. Upon exercise of the contract the difference between such value and the notional amount is recorded as realized gain (loss) and is included on the Consolidated Statement of Operations.
The Fund has sold credit protection through credit default swaps to increase exposure to the credit risk of individual issuers and/or indexes of issuers that are either unavailable or considered to be less attractive in the bond market.
The Fund has purchased credit protection through credit default swaps to decrease exposure to the credit risk of individual issuers and/or indexes of issuers.
The Fund has engaged in spread curve trades by simultaneously purchasing and selling protection through credit default swaps referenced to the same reference asset but with different maturities. Spread curve trades attempt to gain exposure to credit risk on a forward basis by realizing gains on the expected differences in spreads.
For the reporting period, the Fund had ending monthly average notional amounts of $34,974,074 and $20,124,193 on credit default swaps to buy protection and credit default swaps to sell protection, respectively.
Additional associated risks to the Fund include counterparty credit risk and liquidity risk.
Currency Swap Contracts. A currency swap contract is an agreement between counterparties to exchange different currencies at contract inception that are equivalent to a notional value. The exchange at contract inception is made at the current spot rate. The contract also includes an agreement to reverse the exchange of the same notional values of those currencies at contract termination. The re-exchange at contract termination may take place at the same exchange rate, a specified rate or the then current spot rate. Certain currency swap contracts provide for exchanging the currencies only at contract termination and can provide for only a net payment in the settlement currency, typically USD. A currency swap contract may also include the exchange of periodic payments, between the counterparties, that are based on interest rates available in the respective currencies at contract inception. Other currency swap contracts may not provide for exchanging the different currencies at all, and only for exchanging interest cash flows based on the notional value in the contract.
The Fund has entered into currency swap contracts with the obligation to pay an interest rate on the dollar notional amount and receive an interest rate on the various foreign currency notional amounts. These currency swap contracts increase exposure to, or decrease exposure away from, foreign exchange and interest rate risk.
For the reporting period, the Fund had ending monthly average notional amounts of $2,068,237 on currency swaps which receive a fixed rate.
Additional associated risks to the Fund include counterparty credit risk and liquidity risk.
Interest Rate Swap Contracts. An interest rate swap is an agreement between counterparties to exchange periodic payments based on interest rates. One cash flow stream will typically be a floating rate payment based upon a specified floating interest rate while the other is typically a fixed interest rate.
The Fund has entered into interest rate swaps in which it pays a floating interest rate and receives a fixed interest rate in order to increase exposure to interest rate risk. Typically, if relative interest rates rise, payments made by the Fund under a swap agreement will be greater than the payments received by the Fund.
The Fund has entered into interest rate swaps in which it pays a fixed interest rate and receives a floating interest rate in order to decrease exposure to interest rate risk. Typically, if relative interest rates rise, payments received by the Fund under the swap agreement will be greater than the payments made by the Fund.
For the reporting period, the Fund had ending monthly average notional amounts of $24,240,789 and $109,502,477 on interest rate swaps which pay a fixed rate and interest rate swaps which receive a fixed rate, respectively.
Additional associated risks to the Fund include counterparty credit risk and liquidity risk.
Total Return Swap Contracts. A total return swap is an agreement between counterparties to exchange periodic payments based on the value of asset or non-asset references. One cash flow is typically based on a non-asset reference (such as an interest rate) and the other on the total return of a reference asset (such as a security or a basket of securities or securities index). The total return of the reference asset typically includes appreciation or depreciation on the reference asset, plus any interest or dividend payments.
Total return swap contracts are exposed to the market risk factor of the specific underlying financial instrument or index. Total return swaps are less standard in structure than other types of swaps and can isolate and/or include multiple types of market risk factors including equity risk, credit risk, and interest rate risk.
The Fund has entered into total return swaps to increase exposure to the credit risk of various indexes or basket of securities. These credit risk
51 OPPENHEIMER GLOBAL STRATEGIC INCOME FUND/VA
NOTES TO CONSOLIDATED FINANCIAL STATEMENTS Continued
6. Use of Derivatives (Continued)
related total return swaps require the Fund to pay to, or receive payments from, the counterparty based on the movement of credit spreads of the related indexes or securities.
For the reporting period, the Fund had ending monthly average notional amounts of $1,294,976 on total return swaps which are long the reference asset.
Additional associated risks to the Fund include counterparty credit risk and liquidity risk.
Swaption Transactions
The Fund may enter into a swaption contract which grants the purchaser the right, but not the obligation, to enter into a swap transaction at preset terms detailed in the underlying agreement within a specified period of time. The purchaser pays a premium to the swaption writer who bears the risk of unfavorable changes in the preset terms on the underlying swap.
Purchased swaptions are reported as a component of investments in the Consolidated Statement of Investments and the Consolidated Statement of Assets and Liabilities. Written swaptions are reported on a schedule following the Consolidated Statement of Investments and their value is reported as a separate asset or liability line item in the Consolidated Statement of Assets and Liabilities. The net change in unrealized appreciation or depreciation on written swaptions is separately reported in the Consolidated Statement of Operations. When a swaption is exercised, the cost of the swap is adjusted by the amount of premium paid or received. Upon the expiration or closing of an unexercised swaption contract, a gain or loss is reported in the Consolidated Statement of Operations for the amount of the premium paid or received.
The Fund generally will incur a greater risk when it writes a swaption than when it purchases a swaption. When the Fund writes a swaption it will become obligated, upon exercise of the swaption, according to the terms of the underlying agreement. Swaption contracts written by the Fund do not give rise to counterparty credit risk prior to exercise as they obligate the Fund, not its counterparty, to perform. When the Fund purchases a swaption it only risks losing the amount of the premium it paid if the swaption expires unexercised. However, when the Fund exercises a purchased swaption there is a risk that the counterparty will fail to perform or otherwise default on its obligations under the swaption contract.
The Fund has purchased swaptions which gives it the option to enter into an interest rate swap in which it pays a floating interest rate and receives a fixed interest rate in order to increase exposure to interest rate risk. A purchased swaption of this type becomes more valuable as the reference interest rate decreases relative to the preset interest rate.
The Fund has purchased swaptions which gives it the option to enter into an interest rate swap in which it pays a fixed interest rate and receives a floating interest rate in order to decrease exposure to interest rate risk. A purchased swaption of this type becomes more valuable as the reference interest rate increases relative to the preset interest rate.
The Fund has purchased swaptions which gives it the option to sell credit protection through credit default swaps in order to increase exposure to the credit risk of individual issuers and/ or indexes of issuers. A purchased swaption of this type becomes more valuable as the likelihood of a credit event on the reference asset decreases.
The Fund has written swaptions which gives it the obligation, if exercised by the purchaser, to enter into an interest rate swap in which it pays a floating interest rate and receives a fixed interest rate in order to increase exposure to interest rate risk. A written swaption of this type becomes more valuable as the reference interest rate decreases relative to the preset interest rate.
The Fund has written swaptions which gives it the obligation, if exercised by the purchaser, to enter into an interest rate swap in which it pays a fixed interest rate and receives a floating interest rate in order to decrease exposure to interest rate risk. A written swaption of this type becomes more valuable as the reference interest rate increases relative to the preset interest rate.
The Fund has written swaptions which give it the obligation, if exercised by the purchaser, to sell credit protection through credit default swaps in order to increase exposure to the credit risk of individual issuers and/or indexes of issuers. A written swaption of this type becomes more valuable as the likelihood of a credit event on the reference asset decreases.
During the reporting period, the Fund had an ending monthly average market value of $1,773,812 and $1,229,063 on purchased and written swaptions, respectively.
Written swaption activity for the reporting period was as follows:
| | | | | | | | |
| | | Number of
Contracts | | Amount of
Premiums | |
| |
Swaptions outstanding as of | | | | | | | | |
December 31, 2015 | | | 362,297,441 | | | $ | 1,043,474 | |
Swaptions written | | | 1,820,854,000 | | | | 6,713,225 | |
Swaptions closed or expired | | | (380,061,441 | ) | | | (1,138,332 | ) |
Swaptions exercised | | | (1,621,090,000 | ) | | | (5,836,037 | ) |
| | | | |
Swaptions outstanding as of | | | | | | | | |
December 31, 2016 | | | 182,000,000 | | | $ | 782,330 | |
| | | | |
Counterparty Credit Risk. Derivative positions are subject to the risk that the counterparty will not fulfill its obligation to the Fund. The Fund intends to enter into derivative transactions with counterparties that the Manager believes to be creditworthy at the time of the transaction.
The Fund’s risk of loss from counterparty credit risk on OTC derivatives is generally limited to the aggregate unrealized gain netted against any collateral held by the Fund. For OTC options purchased, the Fund bears the risk of loss of the amount of the premiums paid plus the positive change in market values net of any collateral held by the Fund should the counterparty fail to perform under the contracts. Options written by the Fund do not typically give rise to counterparty credit risk, as options written generally obligate the Fund and not the counterparty to perform.
To reduce counterparty risk with respect to OTC transactions, the Fund has entered into master netting arrangements, established within the Fund’s
52 OPPENHEIMER GLOBAL STRATEGIC INCOME FUND/VA
6. Use of Derivatives (Continued)
International Swap and Derivatives Association, Inc. (“ISDA”) master agreements, which allow the Fund to make (or to have an entitlement to receive) a single net payment in the event of default (close-out netting) for outstanding payables and receivables with respect to certain OTC positions in swaps, options, swaptions, and forward currency exchange contracts for each individual counterparty. In addition, the Fund may require that certain counterparties post cash and/or securities in collateral accounts to cover their net payment obligations for those derivative contracts subject to ISDA master agreements. If the counterparty fails to perform under these contracts and agreements, the cash and/or securities will be made available to the Fund.
At period end, the Fund has required certain counterparties to post collateral of $4,069,474.
ISDA master agreements include credit related contingent features which allow counterparties to OTC derivatives to terminate derivative contracts prior to maturity in the event that, for example, the Fund’s net assets decline by a stated percentage or the Fund fails to meet the terms of its ISDA master agreements, which would cause the Fund to accelerate payment of any net liability owed to the counterparty.
For financial reporting purposes, the Fund does not offset derivative assets and derivative liabilities that are subject to netting arrangements in the Consolidated Statement of Assets and Liabilities. Bankruptcy or insolvency laws of a particular jurisdiction may impose restrictions on or prohibitions against the right of offset in bankruptcy, insolvency or other events.
The Fund’s risk of loss from counterparty credit risk on exchange-traded derivatives cleared through a clearinghouse and for centrally cleared swaps is generally considered lower than as compared to OTC derivatives. However, counterparty credit risk exists with respect to initial and variation margin deposited/paid by the Fund that is held in futures commission merchant, broker and/or clearinghouse accounts for such exchange-traded derivatives and for centrally cleared swaps.
With respect to centrally cleared swaps, such transactions will be submitted for clearing, and if cleared, will be held in accounts at futures commission merchants or brokers that are members of clearinghouses. While brokers, futures commission merchants and clearinghouses are required to segregate customer margin from their own assets, in the event that a broker, futures commission merchant or clearinghouse becomes insolvent or goes into bankruptcy and at that time there is a shortfall in the aggregate amount of margin held by the broker, futures commission merchant or clearinghouse for all its customers, U.S. bankruptcy laws will typically allocate that shortfall on a pro-rata basis across all the broker’s, futures commission merchant’s or clearinghouse’s customers, potentially resulting in losses to the Fund.
There is the risk that a broker, futures commission merchant or clearinghouse will decline to clear a transaction on the Fund’s behalf, and the Fund may be required to pay a termination fee to the executing broker with whom the Fund initially enters into the transaction. Clearinghouses may also be permitted to terminate centrally cleared swaps at any time. The Fund is also subject to the risk that the broker or futures commission merchant will improperly use the Fund’s assets deposited/paid as initial or variation margin to satisfy payment obligations of another customer. In the event of a default by another customer of the broker or futures commission merchant, the Fund might not receive its variation margin payments from the clearinghouse, due to the manner in which variation margin payments are aggregated for all customers of the broker/futures commission merchant.
Collateral and margin requirements differ by type of derivative. Margin requirements are established by the broker, futures commission merchant or clearinghouse for exchange-traded and cleared derivatives, including centrally cleared swaps. Brokers, futures commission merchants and clearinghouses can ask for margin in excess of the regulatory minimum, or increase the margin amount, in certain circumstances.
Collateral terms are contract specific for OTC derivatives. For derivatives traded under an ISDA master agreement, the collateral requirements are typically calculated by netting the mark to market amount for each transaction under such agreement and comparing that amount to the value of any collateral currently pledged by the Fund or the counterparty.
For financial reporting purposes, cash collateral that has been pledged to cover obligations of the Fund, if any, is reported separately on the Consolidated Statement of Assets and Liabilities as cash pledged as collateral. Non-cash collateral pledged by the Fund, if any, is noted in the Consolidated Statement of Investments. Generally, the amount of collateral due from or to a party must exceed a minimum transfer amount threshold (e.g. $250,000) before a transfer has to be made. To the extent amounts due to the Fund from its counterparties are not fully collateralized, contractually or otherwise, the Fund bears the risk of loss from counterparty nonperformance.
The following table presents by counterparty the Fund’s OTC derivative assets net of the related collateral pledged by the Fund at period end:
| | | | | | | | | | | | | | | | | | | | |
| | | | | Gross Amounts Not Offset in the Consolidated Statement of Assets &
Liabilities | | |
| Counterparty | | Gross Amounts Not Offset
in the Consolidated
Statement of Assets &
Liabilities* | | Financial
Instruments
Available for Offset | | Financial
Instruments
Collateral
Received** | | Cash Collateral
Received** | | Net Amount |
| |
| Bank of America NA | | $ | 1,347,335 | | | $ | (254,184) | | | $ | (1,093,151) | | | $ | – | | | $ | – | |
| Barclays Bank plc | | | 3,539,816 | | | | (3,379,156) | | | | – | | | | – | | | | 160,660 | |
| BNP Paribas | | | 467,040 | | | | (345,636) | | | | – | | | | – | | | | 121,404 | |
| Citibank NA | | | 1,637,931 | | | | (1,637,931) | | | | – | | | | – | | | | – | |
| Deutsche Bank AG | | | 18,123 | | | | (18,123) | | | | – | | | | – | | | | – | |
| Goldman Sachs Bank USA | | | 329,287 | | | | (204,613) | | | | (124,674) | | | | – | | | | – | |
| Goldman Sachs International | | | 15,744 | | | | – | | | | (15,744) | | | | – | | | | – | |
| HSBC Bank USA NA | | | 430,212 | | | | (430,212) | | | | – | | | | – | | | | – | |
| JPMorgan Chase Bank NA | | | 2,134,132 | | | | (2,134,132) | | | | – | | | | – | | | | – | |
| Morgan Stanley | | | 1,942 | | | | – | | | | – | | | | – | | | | 1,942 | |
53 OPPENHEIMER GLOBAL STRATEGIC INCOME FUND/VA
NOTES TO CONSOLIDATED FINANCIAL STATEMENTS Continued
6. Use of Derivatives (Continued)
| | | | | | | | | | | | | | | | | | | | |
| | | | | | Gross Amounts Not Offset in the Consolidated Statement of Assets &
Liabilities | | | | |
| Counterparty | | Gross Amounts Not Offset
in the Consolidated
Statement of Assets & Liabilities* | | | Financial Instruments
Available for Offset | | | Financial Instruments
Collateral Received** | | | Cash Collateral Received** | | | Net Amount | |
| |
Toronto Dominion Bank | | $ | 2,820,424 | | | $ | (1,595,072) | | | $ | (1,225,352) | | | $ | – | | | $ | – | |
| | | | |
| | $ | 12,741,986 | | | $ | (9,999,059) | | | $ | (2,458,921) | | | $ | – | | | $ | 284,006 | |
| | | | |
*OTC derivatives are reported gross on the Consolidated Statement of Assets and Liabilities. Exchange traded options and margin related to centrally cleared swaps and futures are excluded from these reported amounts.
**Reported collateral posted for the benefit of the Fund within this table is limited to the net outstanding amount due from an individual counterparty. The collateral posted for the benefit of the Fund may exceed these amounts.
The following table presents by counterparty the Fund’s OTC derivative liabilities net of the related collateral pledged by the Fund at period end:
| | | | | | | | | | | | | | | | | | | | |
| | | | | | Gross Amounts Not Offset in the Consolidated Statement of Assets &
Liabilities | | | | |
| Counterparty | | Gross Amounts Not Offset
in the Consolidated
Statement of Assets &
Liabilities* | | | Financial Instruments
Available for Offset | | | Financial Instruments
Collateral Pledged** | | | Cash Collateral Pledged** | | | Net Amount | |
| |
| Bank of America NA | | $ | (254,184) | | | $ | 254,184 | | | $ | – | | | $ | – | | | $ | – | |
| Barclays Bank plc | | | (3,379,156) | | | | 3,379,156 | | | | – | | | | – | | | | – | |
| BNP Paribas | | | (345,636) | | | | 345,636 | | | | – | | | | – | | | | – | |
| Citibank NA | | | (1,647,369) | | | | 1,637,931 | | | | – | | | | – | | | | (9,438) | |
| Credit Suisse International | | | (1,114,360) | | | | – | | | | 1,114,360 | | | | – | | | | – | |
| Deutsche Bank AG | | | (593,217) | | | | 18,123 | | | | 575,094 | | | | – | | | | – | |
| Goldman Sachs Bank USA | | | (204,613) | | | | 204,613 | | | | – | | | | – | | | | – | |
| HSBC Bank USA NA | | | (1,107,573) | | | | 430,212 | | | | 677,361 | | | | – | | | | – | |
| JPMorgan Chase Bank NA | | | (2,350,189) | | | | 2,134,132 | | | | 115,885 | | | | – | | | | (100,172) | |
| Morgan Stanley Capital Services, Inc. | | | (1,688,860) | | | | – | | | | 1,688,860 | | | | – | | | | – | |
| Standard Chartered Bank | | | (213,788) | | | | – | | | | 213,788 | | | | – | | | | – | |
| Toronto Dominion Bank | | | (1,595,072) | | | | 1,595,072 | | | | – | | | | – | | | | – | |
| | | | |
| | $ | (14,494,017) | | | $ | 9,999,059 | | | $ | 4,385,348 | | | $ | – | | | | $ (109,610) | |
| | | | |
*OTC derivatives are reported gross on the Consolidated Statement of Assets and Liabilities. Exchange traded options and margin related to centrally cleared swaps and futures are excluded from these reported amounts.
**Reported collateral pledged within this table is limited to the net outstanding amount due from the Fund. The securities pledged as collateral by the Fund as reported on the Consolidated Statements of Investments may exceed these amounts.
The following table presents the valuations of derivative instruments by risk exposure as reported within the Consolidated Statement of Assets and Liabilities at period end:
| | | | | | | | | | | | |
| | | Asset Derivatives | | | Liability Derivatives | |
Derivatives Not Accounted for as Hedging Instruments | | Consolidated Statement of Assets
and Liabilities Location | | Value | | | Consolidated Statement of Assets
and Liabilities Location | | Value | |
| |
Credit contracts | | Swaps, at value | | $ | 295,926 | | | Swaps, at value | | $ | 3,028,143 | |
Interest rate contracts | | | | | | | | Swaps, at value | | | 215,930 | |
Credit contracts | | Centrally cleared swaps, at value | | | 1,730,801 | | | Centrally cleared swaps, at value | | | 2,566,846 | |
Interest rate contracts | | Centrally cleared swaps, at value | | | 501,480 | | | Centrally cleared swaps, at value | | | 377,415 | |
Interest rate contracts | | Variation margin receivable | | | 374,618* | | | Variation margin payable | | | 3,117* | |
| | Unrealized appreciation on | | | | | | Unrealized depreciation on | | | | |
Forward currency | | forward currency exchange | | | | | | forward currency exchange | | | | |
exchange contracts | | contracts | | | 9,683,559 | | | contracts | | | 8,779,721 | |
Forward currency exchange contracts | | | | | | | | Options written, at value | | | 1,622,091 | |
Interest rate contracts | | | | | | | | Swaptions written, at value | | | 848,132 | |
Forward currency exchange contracts | | Investments, at value | | | 1,844,302** | | | | | | | |
Interest rate contracts | | Investments, at value | | | 918,199** | | | | | | | |
| | | | | | | | | | | | |
Total | | | | $ | 15,348,885 | | | | | $ | 17,441,395 | |
| | | | | | | | | | | | |
*Includes only the current day’s variation margin. Prior variation margin movements have been reflected in cash on the Consolidated Statement of Assets and Liabilities upon receipt or payment.
**Amounts relate to purchased option contracts and purchased swaption contracts, if any.
54 OPPENHEIMER GLOBAL STRATEGIC INCOME FUND/VA
6. Use of Derivatives (Continued)
The effect of derivative instruments on the Consolidated Statement of Operations is as follows:
| | | | | | | | | | | | | | | | | | | | | | | | | | | | |
| | | Amount of Realized Gain or (Loss) Recognized on Derivatives | | | | |
| |
Derivatives Not Accounted for as Hedging Instruments | | Investment from unaffiliated
companies
(including
premiums on
options and
swaptions
exercised)* | | | Closing and
expiration of swaption
contracts
written | | | Closing and
expiration of option
contracts
written | | | Closing and
expiration of futures
contracts | | | Foreign
currency
transactions | | | Swap contracts | | | Total | |
| |
| Credit contracts | | $ | (282,982) | | | $ | 94,857 | | | $ | — | | | $ | — | | | $ | — | | | $ | 386,038 | | | $ | 197,913 | |
| Equity contracts | | | (40,956) | | | | — | | | | — | | | | (138,766) | | | | — | | | | — | | | | (179,722) | |
| Forward currency exchange contracts | | | (2,338,231) | | | | — | | | | 1,575,415 | | | | — | | | | 6,422,510 | | | | (1,825,710) | | | | 3,833,984 | |
| Interest rate contracts | | | (3,270,391) | | | | 1,043,475 | | | | — | | | | (8,383,224) | | | | — | | | | (1,155,083) | | | | (11,765,223) | |
| | | | |
Total | | $ | (5,932,560) | | | $ | 1,138,332 | | | $ | 1,575,415 | | | $ | (8,521,990) | | | $ | 6,422,510 | | | $ | (2,594,755) | | | $ | (7,913,048) | |
| | | | |
*Includes purchased options contracts, purchased swaption contracts, written options contracts exercised and written swaption contracts exercised, if any.
| | | | | | | | | | | | | | | | | | | | | | | | | | | | |
| | | Amount of Change in Unrealized Gain or (Loss) Recognized on Derivatives | | | | |
| |
Derivatives Not Accounted for as Hedging Instruments | | Investments* | | | Option
contracts
written | | | Swaption
contracts
written | | | Futures
contracts | | | Translation
of assets and
liabilities
denominated in
foreign
currencies | | | Swap contracts | | | Total | |
| |
| Credit contracts | | $ | — | | | $ | — | | | $ | — | | | $ | — | | | $ | — | | | $ | 75,665 | | | $ | 75,665 | |
| Forward currency exchange contracts | | | 422,464 | | | | 596,466 | | | | — | | | | — | | | | (2,702,205) | | | | 1,512,906 | | | | (170,369) | |
| Interest rate contracts | | | 203,979 | | | | — | | | | 1,399,283 | | | | (846,477) | | | | — | | | | 435,468 | | | | 1,192,253 | |
| | | | |
Total | | $ | 626,443 | | | $ | 596,466 | | | $ | 1,399,283 | | | $ | (846,477) | | | $ | (2,702,205) | | | $ | 2,024,039 | | | $ | 1,097,549 | |
| | | | |
*Includes purchased option contracts and purchased swaption contracts, if any.
7. Shares of Beneficial Interest
The Fund has authorized an unlimited number of $0.001 par value shares of beneficial interest of each class. Transactions in shares of beneficial interest were as follows:
| | | | | | | | | | | | | | | | |
| | | Year Ended December 31, 2016 | | | Year Ended December 31, 2015 | |
| | | Shares | | | Amount | | | Shares | | | Amount | |
| |
Non-Service Shares | | | | | | | | | | | | | | | | |
| Sold | | | 2,809,997 | | | $ | 13,876,130 | | | | 4,671,962 | | | $ | 23,990,179 | |
| Dividends and/or distributions reinvested | | | 4,307,664 | | | | 20,719,866 | | | | 5,825,930 | | | | 29,479,205 | |
| Redeemed | | | (14,033,568) | | | | (69,191,900) | | | | (33,212,336) | | | | (173,570,603) | |
| | | | |
Net decrease | | | (6,915,907) | | | $ | (34,595,904) | | | | (22,714,444) | | | $ | (120,101,219) | |
| | | | |
| | | | | | | | | | | | | | | | |
| |
Service Shares | | | | | | | | | | | | | | | | |
| Sold | | | 9,843,598 | | | $ | 49,602,452 | | | | 13,496,560 | | | $ | 71,281,913 | |
| Dividends and/or distributions reinvested | | | 12,375,075 | | | | 61,256,620 | | | | 15,712,417 | | | | 81,704,570 | |
| Redeemed | | | (44,290,987) | | | | (223,215,650) | | | | (40,362,328) | | | | (212,925,973) | |
| | | | |
Net decrease | | | (22,072,314) | | | $ | (112,356,578) | | | | (11,153,351) | | | $ | (59,939,490) | |
| | | | |
8. Purchases and Sales of Securities
The aggregate cost of purchases and proceeds from sales of securities, other than short-term obligations and investments in IGMMF, for the reporting period were as follows:
| | | | | | | | |
| | | Purchases | | | Sales | |
| |
| Investment securities | | $ | 1,151,810,108 | | | $ | 1,358,293,133 | |
| U.S. government and government agency obligations | | | 73,000,441 | | | | 78,828,988 | |
| To Be Announced (TBA) mortgage-related securities | | | 1,798,210,272 | | | | 1,766,445,159 | |
9. Fees and Other Transactions with Affiliates
Management Fees. Under the investment advisory agreement, the Fund pays the Manager a management fee based on the daily net assets of the
55 OPPENHEIMER GLOBAL STRATEGIC INCOME FUND/VA
NOTES TO CONSOLIDATED FINANCIAL STATEMENTS Continued
9. Fees and Other Transactions with Affiliates (Continued)
Fund at an annual rate as shown in the following table:
| | | | |
| Fee Schedule | | | |
| |
Up to $200 million | | | 0.75% | |
Next $200 million | | | 0.72 | |
Next $200 million | | | 0.69 | |
Next $200 million | | | 0.66 | |
Next $200 million | | | 0.60 | |
Next $4 billion | | | 0.50 | |
Over $5 billion | | | 0.48 | |
The Manager also provides investment management related services to the Subsidiary. The Subsidiary pays the Manager a monthly management fee at an annual rate according to the above schedule. The Subsidiary also pays certain other expenses including custody and directors’ fees.
The Fund’s effective management fee for the reporting period was 0.61% of average annual net assets before any Subsidiary management fees or any applicable waivers.
Sub-Adviser Fees. The Manager has retained the Sub-Adviser to provide the day-to-day portfolio management of the Fund and the Subsidiary. Under the Sub-Advisory Agreement, the Manager pays the Sub-Adviser an annual fee in monthly installments, equal to a percentage of the investment management fee collected by the Manager from the Fund and the Subsidiary, which shall be calculated after any investment management fee waivers. The fee paid to the Sub-Adviser is paid by the Manager, not by the Fund.
Transfer Agent Fees. OFI Global (the “Transfer Agent”) serves as the transfer and shareholder servicing agent for the Fund. The Fund pays the Transfer Agent a fee based on annual net assets. Fees incurred and average net assets for each class with respect to these services are detailed in the Consolidated Statement of Operations and Consolidated Financial Highlights, respectively.
Sub-Transfer Agent Fees. The Transfer Agent has retained Shareholder Services, Inc., a wholly-owned subsidiary of OFI (the “Sub-Transfer Agent”), to provide the day-to-day transfer agent and shareholder servicing of the Fund. Under the Sub-Transfer Agency Agreement, the Transfer Agent pays the Sub-Transfer Agent an annual fee in monthly installments, equal to a percentage of the transfer agent fee collected by the Transfer Agent from the Fund, which shall be calculated after any applicable fee waivers. The fee paid to the Sub-Transfer Agent is paid by the Transfer Agent, not by the Fund.
Trustees’ Compensation. The Fund’s Board of Trustees (“Board”) has adopted a compensation deferral plan for Independent Trustees that enables Trustees to elect to defer receipt of all or a portion of the annual compensation they are entitled to receive from the Fund. For purposes of determining the amount owed to the Trustees under the plan, deferred amounts are treated as though equal dollar amounts had been invested in shares of the Fund or in other Oppenheimer funds selected by the Trustees. The Fund purchases shares of the funds selected for deferral by the Trustees in amounts equal to his or her deemed investment, resulting in a Fund asset equal to the deferred compensation liability. Such assets are included as a component of “Other” within the asset section of the Consolidated Statement of Assets and Liabilities. Deferral of Trustees’ fees under the plan will not affect the net assets of the Fund and will not materially affect the Fund’s assets, liabilities or net investment income per share. Amounts will be deferred until distributed in accordance with the compensation deferral plan.
Distribution and Service Plan for Service Shares. The Fund has adopted a Distribution and Service Plan (the “Plan”) pursuant to Rule 12b-1 under the 1940 Act for Service shares to pay OppenheimerFunds Distributor, Inc. (the “Distributor”), for distribution related services, personal service and account maintenance for the Fund’s Service shares. Under the Plan, payments are made periodically at an annual rate of 0.25% of the daily net assets of Service shares of the Fund. The Distributor currently uses all of those fees to compensate sponsors of the insurance product that offers Fund shares, for providing personal service and maintenance of accounts of their variable contract owners that hold Service shares. These fees are paid out of the Fund’s assets on an on-going basis and increase operating expenses of the Service shares, which results in lower performance compared to the Fund’s shares that are not subject to a service fee. Fees incurred by the Fund under the Plan are detailed in the Consolidated Statement of Operations.
Waivers and Reimbursements of Expenses. The Manager has voluntarily agreed to limit the Fund’s expenses after payments, waivers and/or reimbursements and reduction to custodian expenses, excluding any applicable dividend expense, taxes, interest and fees from borrowing, any subsidiary expenses, Acquired Fund Fees and Expenses, brokerage commissions, unusual and infrequent expenses and certain other Fund expenses; so that those expenses, as percentages of daily net assets, will not exceed the annual rate of 0.75% for Non-Service shares and 1.00% for Service shares.
The Manager has contractually agreed to waive the management fee it receives from the Fund in an amount equal to the management fee it receives from the Subsidiary. During the reporting period, the Manager waived $73,025.
The Manager will waive fees and/or reimburse Fund expenses in an amount equal to the indirect management fees incurred through the Fund’s investments in Affiliated Funds. During the reporting period, the Manager waived fees and/or reimbursed the Fund $841,096 for these management fees.
Waivers and/or reimbursements may be modified or terminated as set forth according to the terms in the prospectus.
10. Borrowings and Other Financing
Joint Credit Facility. A number of mutual funds managed by the Manager participate in a $1.3 billion revolving credit facility (the “Facility”) intended
56 OPPENHEIMER GLOBAL STRATEGIC INCOME FUND/VA
10. Borrowings and Other Financing (Continued)
to provide short-term financing, if necessary, subject to certain restrictions in connection with atypical redemption activity. Expenses and fees related to the Facility are paid by the participating funds and are disclosed separately or as other expenses on the Consolidated Statement of Operations. The Fund did not utilize the Facility during the reporting period.
11. Pending Litigation
In 2009, several putative class action lawsuits were filed and later consolidated before the U.S. District Court for the District of Colorado in connection with the investment performance of Oppenheimer Rochester California Municipal Fund (the “California Fund”), a fund advised by OppenheimerFunds, Inc. (“OFI”) and distributed by OppenheimerFunds Distributor, Inc. (“OFDI”). The plaintiffs asserted claims against OFI, OFDI and certain present and former trustees and officers of the California Fund under the federal securities laws, alleging, among other things, that the disclosure documents of the California Fund contained misrepresentations and omissions and the investment policies of the California Fund were not followed. An amended complaint and a motion to dismiss were filed, and in 2011, the court issued an order which granted in part and denied in part the defendants’ motion to dismiss. In October 2015, following a successful appeal by defendants and a subsequent hearing, the court granted plaintiffs’ motion for class certification and appointed class representatives and class counsel.
OFI and OFDI believe the suit is without merit; that it is premature to render any opinion as to the likelihood of an outcome unfavorable to them in the suit; and that no estimate can yet be made as to the amount or range of any potential loss. Furthermore, OFI believes that the suit should not impair the ability of OFI or OFDI to perform their respective duties to the Fund and that the outcome of the suit should not have any material effect on the operations of any of the Oppenheimer funds.
57 OPPENHEIMER GLOBAL STRATEGIC INCOME FUND/VA
REPORT OF INDEPENDENT REGISTERED PUBLIC ACCOUNTING FIRM
The Board of Trustees and Shareholders of Oppenheimer Variable Account Funds:
We have audited the accompanying consolidated statement of assets and liabilities of Oppenheimer Global Strategic Income Fund/VA (a separate series of Oppenheimer Variable Account Funds) and subsidiary, including the consolidated statement of investments, as of December 31, 2016, and the related consolidated statement of operations for the year then ended, the consolidated statements of changes in net assets for each of the years in the two-year period then ended, and the consolidated financial highlights for each of the years in the five-year period then ended. These consolidated financial statements and consolidated financial highlights are the responsibility of the Fund’s management. Our responsibility is to express an opinion on these consolidated financial statements and consolidated financial highlights based on our audits.
We conducted our audits in accordance with the standards of the Public Company Accounting Oversight Board (United States). Those standards require that we plan and perform the audit to obtain reasonable assurance about whether the financial statements and financial highlights are free of material misstatement. An audit includes examining, on a test basis, evidence supporting the amounts and disclosures in the financial statements. Our procedures included confirmation of securities owned as of December 31, 2016, by correspondence with the custodian, transfer agent and brokers, or by other appropriate auditing procedures where replies from brokers were not received. An audit also includes assessing the accounting principles used and significant estimates made by management, as well as evaluating the overall financial statement presentation. We believe that our audits provide a reasonable basis for our opinion.
In our opinion, the consolidated financial statements and consolidated financial highlights referred to above present fairly, in all material respects, the financial position of Oppenheimer Global Strategic Income Fund/VA and subsidiary as of December 31, 2016, the results of their operations for the year then ended, the changes in their net assets for each of the years in the two-year period then ended, and the consolidated financial highlights for each of the years in the five-year period then ended, in conformity with U.S. generally accepted accounting principles.
KPMG LLP
Denver, Colorado
February 24, 2017
58 OPPENHEIMER GLOBAL STRATEGIC INCOME FUND/VA
FEDERAL INCOME TAX INFORMATION Unaudited
In early 2017, if applicable, shareholders of record received information regarding all dividends and distributions paid to them by the Fund during calendar year 2016.
None of the dividends paid by the Fund during the reporting period are eligible for the corporate dividend-received deduction.
The foregoing information is presented to assist shareholders in reporting distributions received from the Fund to the Internal Revenue Service. Because of the complexity of the federal regulations which may affect your individual tax return and the many variations in state and local tax regulations, we recommend that you consult your tax advisor for specific guidance.
59 OPPENHEIMER GLOBAL STRATEGIC INCOME FUND/VA
BOARD APPROVAL OF THE FUND’S INVESTMENT ADVISORY AND SUB-ADVISORY AGREEMENTS Unaudited
The Fund has entered into an investment advisory agreement with OFI Global Asset Management, Inc. (“OFI Global” or the “Adviser”), a wholly-owned subsidiary of OppenheimerFunds, Inc. (“OFI” or the “Sub-Adviser”) (“OFI Global” and “OFI” together the “Managers”) and OFI Global has entered into a sub-advisory agreement with OFI whereby OFI provides investment sub-advisory services to the Fund (collectively, the “Agreements”). Each year, the Board of Trustees (the “Board”), including a majority of the independent Trustees, is required to determine whether to approve the terms of the Agreements and the renewal thereof. The Investment Company Act of 1940, as amended, requires that the Board request and evaluate, and that the Managers provide, such information as may be reasonably necessary to evaluate the terms of the Agreements. The Board employs an independent consultant to prepare a report that provides information, including comparative information that the Board requests for that purpose. In addition to in-person meetings focused on this evaluation, the Board receives information throughout the year regarding Fund services, fees, expenses and performance.
The Managers and the independent consultant provided information to the Board on the following factors: (i) the nature, quality and extent of the Managers’ services, (ii) the comparative investment performance of the Fund and the Managers, (iii) the fees and expenses of the Fund, including comparative fee and expense information, (iv) the profitability of the Managers and their affiliates, including an analysis of the cost of providing services, (v) whether economies of scale are realized as the Fund grows and whether fee levels reflect these economies of scale for Fund investors and (vi) other benefits to the Managers from their relationship with the Fund. The Board was aware that there are alternatives to retaining the Managers.
Outlined below is a summary of the principal information considered by the Board as well as the Board’s conclusions.
Nature, Quality and Extent of Services. The Board considered information about the nature, quality and extent of the services provided to the Fund and information regarding the Managers’ key personnel who provide such services. The Managers’ duties include providing the Fund with the services of the portfolio managers and the Sub-Adviser’s investment team, who provide research, analysis and other advisory services in regard to the Fund’s investments; and securities trading services. OFI Global is responsible for oversight of third-party service providers; monitoring compliance with applicable Fund policies and procedures and adherence to the Fund’s investment restrictions; risk management; and oversight of the Sub-Adviser. OFI Global is also responsible for providing certain administrative services to the Fund. Those services include providing and supervising all administrative and clerical personnel who are necessary in order to provide effective corporate administration for the Fund; compiling and maintaining records with respect to the Fund’s operations; preparing and filing reports required by the U.S. Securities and Exchange Commission; preparing periodic reports regarding the operations of the Fund for its shareholders; preparing proxy materials for shareholder meetings; and preparing the registration statements required by federal and state securities laws for the sale of the Fund’s shares. OFI Global also provides the Fund with office space, facilities and equipment.
The Board also considered the quality of the services provided and the quality of the Managers’ resources that are available to the Fund. The Board took account of the fact that the Sub-Adviser has over fifty years of experience as an investment adviser and that its assets under management rank it among the top mutual fund managers in the United States. The Board evaluated the Managers’ advisory, administrative, accounting, legal, compliance and risk management services, and information the Board has received regarding the experience and professional qualifications of the Managers’ key personnel and the size and functions of its staff. In its evaluation of the quality of the portfolio management services provided, the Board considered the experience of Michael Mata, Krishna Memani and Hemant Baijal, the portfolio managers for the Fund, and the Sub-Adviser’s investment team and analysts. The Board members also considered the totality of their experiences with the Managers as directors or trustees of the Fund and other funds advised by the Managers. The Board considered information regarding the quality of services provided by affiliates of the Managers, which the Board members have become knowledgeable about through their experiences with the Managers and in connection with the renewal of the Fund’s service agreements. The Board concluded, in light of the Managers’ experience, reputation, personnel, operations and resources that the Fund benefits from the services provided under the Agreements.
Investment Performance of the Managers and the Fund. Throughout the year, the Managers provided information on the investment performance of the Fund, the Adviser and the Sub-Adviser, including comparative performance information. The Board also reviewed information, prepared by the Managers and by the independent consultant, comparing the Fund’s historical performance to relevant market indices and to the performance of other multisector bond funds underlying variable insurance products. The Board considered that the Fund underperformed its category median during the one-, three-, five- and ten-year periods. The Board took into account the Adviser’s assertion that the Fund underperformed its performance category for the one- and three-year periods due to several asset allocation decisions relative to peer funds, including the Fund’s position in emerging market local debt, as well as security selection in high yield bonds. The Board took into account recent changes to the Fund, including that Hemant Baijal was appointed as a new portfolio manager for the Fund effective as of March 31, 2015. The Board further considered that the Adviser recently has added more resources to the Fund’s portfolio manager team. The Board concluded it was appropriate to permit the Fund’s performance to reflect these changes and additional investments on the part of the Adviser.
Fees and Expenses of the Fund. The Board reviewed the fees paid to the Adviser and the other expenses borne by the Fund. The Board noted that the Adviser, not the Fund, pays the Sub-Adviser’s fee under the sub-advisory agreement. The independent consultant provided comparative data in regard to the fees and expenses of the Fund and other multisector bond funds underlying variable insurance products. In reviewing the fees and expenses charged to the VA funds, the Board considered the Adviser’s assertion that, because there is much greater disparity in the fees and services that may be provided by a manager to a VA fund as opposed to a retail fund, when comparing the expenses of the various VA funds to those of retail funds, it is most appropriate to focus on total expenses (rather than on the management fees). Accordingly, while the Board reviewed and considered all expenses, it focused on total expenses. The Board considered that the Fund’s total expenses, net of waivers, were equal to its category median and one basis point higher than its peer group median. The Board also considered that the Fund’s contractual management fee was lower than its peer group median and category median. The Board noted that the Adviser has voluntarily agreed to limit the Fund’s total annual operating expenses so that those expenses, as percentages of daily net assets, will not exceed the annual rate of 0.75% for Non-Service Shares and 1.00% for Service Shares. This voluntary expense limitation may be amended or withdrawn at any time without prior notice to shareholders.
Economies of Scale and Profits Realized by the Managers. The Board considered information regarding the Managers’ costs in serving as the Fund’s investment adviser and sub-adviser, including the costs associated with the personnel and systems necessary to manage the Fund, and
60 OPPENHEIMER GLOBAL STRATEGIC INCOME FUND/VA
BOARD APPROVAL OF THE FUND’S INVESTMENT ADVISORY AND SUB-ADVISORY AGREEMENTS Unaudited / Continued
information regarding the Managers’ profitability from their relationship with the Fund. The Board also considered that the Managers must be able to pay and retain experienced professional personnel at competitive rates to provide quality services to the Fund. The Board reviewed whether the Managers may realize economies of scale in managing and supporting the Fund. The Board noted that the Fund currently has management fee breakpoints, which are intended to share with Fund shareholders economies of scale that may exist as the Fund’s assets grow.
Other Benefits to the Managers. In addition to considering the profits realized by the Managers, the Board considered information that was provided regarding the direct and indirect benefits the Managers receive as a result of their relationship with the Fund, including compensation paid to the Managers’ affiliates.
Conclusions. These factors were also considered by the independent Trustees meeting separately from the full Board, assisted by experienced counsel to the Fund and to the independent Trustees. Fund counsel and the independent Trustees’ counsel are independent of the Managers within the meaning and intent of the Securities and Exchange Commission Rules.
Based on its review of the information it received and its evaluations described above, the Board, including a majority of the independent Trustees, decided to continue the Agreements through August 31, 2017. In arriving at its decision, the Board did not identify any factor or factors as being more important than others, but considered all of the above information, and considered the terms and conditions of the Agreements, including the management fees, in light of all the surrounding circumstances.
61 OPPENHEIMER GLOBAL STRATEGIC INCOME FUND/VA
PORTFOLIO PROXY VOTING POLICIES AND GUIDELINES; UPDATES TO STATEMENTS OF INVESTMENTS Unaudited
The Fund has adopted Portfolio Proxy Voting Policies and Guidelines under which the Fund votes proxies relating to securities (“portfolio proxies”) held by the Fund. A description of the Fund’s Portfolio Proxy Voting Policies and Guidelines is available (i) without charge, upon request, by calling the Fund toll-free at 1.800.CALL OPP (225.5677), (ii) on the Fund’s website at www.oppenheimerfunds.com, and (iii) on the SEC’s website at www.sec.gov. In addition, the Fund is required to file Form N-PX, with its complete proxy voting record for the 12 months ended June 30th, no later than August 31st of each year. The Fund’s voting record is available (i) without charge, upon request, by calling the Fund toll-free at 1.800.CALL OPP (225.5677), and (ii) in the Form N-PX filing on the SEC’s website at www.sec.gov.
The Fund files its complete schedule of portfolio holdings with the SEC for the first quarter and the third quarter of each fiscal year on Form N-Q. The Fund’s Form N-Q filings are available on the SEC’s website at www.sec.gov. Those forms may be reviewed and copied at the SEC’s Public Reference Room in Washington, D.C. Information on the operation of the Public Reference Room may be obtained by calling 1-800-SEC-0330.
62 OPPENHEIMER GLOBAL STRATEGIC INCOME FUND/VA
TRUSTEES AND OFFICERS Unaudited
| | |
| Name, Position(s) Held with the Fund, Length of Service, Age | | Principal Occupation(s) During the Past 5 Years; Other Trusteeships/Directorships Held; Number of Portfolios in the Fund Complex Currently Overseen |
| |
| INDEPENDENT TRUSTEES | | The address of each Trustee in the chart below is 6803 S. Tucson Way, Centennial, Colorado 80112-3924. Each Trustee serves for an indefinite term, or until his or her resignation, retirement, death or removal. |
| |
Robert J. Malone, Chairman of the Board of Trustees (since 2016), Trustee (since 2002) Year of Birth: 1944 | | Chairman - Colorado Market of MidFirst Bank (since January 2015); Chairman of the Board (2012-2016) and Director (August 2005-March 2016) of Jones International University (educational organization); Trustee of the Gallagher Family Foundation (non-profit organization) (2000-2015); Chairman, Chief Executive Officer and Director of Steele Street Bank Trust (commercial banking) (August 2003-January 2015); Board of Directors of Opera Colorado Foundation (non-profit organization) (2008-2012); Director of Colorado UpLIFT (charitable organization) (1986-2010); Director of Jones Knowledge, Inc. (2006-2010); Former Chairman of U.S. Bank-Colorado (subsidiary of U.S. Bancorp and formerly Colorado National Bank) (July 1996-April 1999); Director of Commercial Assets, Inc. (real estate investment trust) (1993-2000); Director of U.S. Exploration, Inc. (oil and gas exploration) (1997-February 2004); Chairman of the Board (1991-1994) and Trustee (1985-1994) of Regis University; and Chairman of the Board (1990-1991) and Trustee (1984-1999) of Young Presidents Organization. Oversees 47 portfolios in the OppenheimerFunds complex. Mr. Malone has served on the Boards of certain Oppenheimer funds since 2002, during which time he has become familiar with the Fund’s (and other Oppenheimer funds’) financial, accounting, regulatory and investment matters and has contributed to the Boards’ deliberations. |
| |
Jon S. Fossel, Trustee (since 1990) Year of Birth: 1942 | | Chairman of the Board of Jack Creek Preserve Foundation (non-profit organization) (since March 2005); Director of Jack Creek Preserve Foundation (non-profit organization) (March 2005-December 2014); Chairman of the Board (2006-December 2011) and Director (June 2002-December 2011) of UNUMProvident (insurance company); Director of Northwestern Energy Corp. (public utility corporation) (November 2004-December 2009); Director of P.R. Pharmaceuticals (October 1999-October 2003); Director of Rocky Mountain Elk Foundation (non-profit organization) (February 1998-February 2003 and February 2005-February 2007); Chairman and Director (until October 1996) and President and Chief Executive Officer (until October 1995) of OppenheimerFunds, Inc.; President, Chief Executive Officer and Director of the following: Oppenheimer Acquisition Corp. (“OAC”) (parent holding company of OppenheimerFunds, Inc.), Shareholders Services, Inc. and Shareholder Financial Services, Inc. (until October 1995). Oversees 47 portfolios in the OppenheimerFunds complex. Mr. Fossel has served on the Boards of certain Oppenheimer funds since 1990, during which time he has become familiar with the Fund’s (and other Oppenheimer funds’) financial, accounting, regulatory and investment matters and has contributed to the Boards’ deliberations. |
| |
Richard F. Grabish, Trustee (since 2012) Year of Birth: 1948 | | Formerly Senior Vice President and Assistant Director of Sales and Marketing (March 1997-December 2007), Director (March 1987-December 2007) and Manager of Private Client Services (June 1985-June 2005) of A.G. Edwards & Sons, Inc. (broker/dealer and investment firm); Chairman and Chief Executive Officer of A.G. Edwards Trust Company, FSB (March 2001-December 2007); President and Vice Chairman of A.G. Edwards Trust Company, FSB (investment adviser) (April 1987-March 2001); President of A.G. Edwards Trust Company, FSB (investment adviser) (June 2005-December 2007). Oversees 47 portfolios in the OppenheimerFunds complex. Mr. Grabish has served on the Boards of certain Oppenheimer funds since 2001, during which time he has become familiar with the Fund’s (and other Oppenheimer funds’) financial, accounting, regulatory and investment matters and has contributed to the Boards’ deliberations. |
| |
Beverly L. Hamilton, Trustee (since 2002) Year of Birth: 1946 | | Trustee of Monterey Institute for International Studies (educational organization) (2000-2014); Board Member of Middlebury College (educational organization) (December 2005-June 2011); Chairman (2010-2016) of American Funds’ Emerging Markets Growth Fund, Inc. (mutual fund); Director of The California Endowment (philanthropic organization) (April 2002-April 2008); Director (February 2002-2005) and Chairman of Trustees (2006-2007) of the Community Hospital of Monterey Peninsula; Director (October 1991-2005) and Vice Chairman (2006-2009) of American Funds’ Emerging Markets Growth Fund, Inc. (mutual fund); President of ARCO Investment Management Company (February 1991-April 2000); Member of the investment committees of The Rockefeller Foundation (2001-2006) and The University of Michigan (since 2000); Advisor at Credit Suisse First Boston’s Sprout venture capital unit (venture capital fund) (1994-January 2005); Trustee of MassMutual Institutional Funds (investment company) (1996-June 2004); Trustee of MML Series Investment Fund (investment company) (April 1989-June 2004); Member of the investment committee of Hartford Hospital (2000-2003); and Advisor to Unilever (Holland) pension fund (2000-2003). Oversees 47 portfolios in the OppenheimerFunds complex. Ms. Hamilton has served on the Boards of certain Oppenheimer funds since 2002, during which time she has become familiar with the Fund’s (and other Oppenheimer funds’) financial, accounting, regulatory and investment matters and has contributed to the Boards’ deliberations. |
| |
Victoria J. Herget, Trustee (since 2012) Year of Birth:1951 | | Board Chair (2008-2015) and Director (2004-Present), United Educators (insurance company); Trustee (since 2000) and Chair (since 2010), Newberry Library (independent research library); Trustee, Mather LifeWays (senior living organization) (since 2001); Independent Director of the First American Funds (mutual fund family) (2003-2011); former Managing Director (1993-2001), Principal (1985-1993), Vice President (1978-1985) and Assistant Vice President (1973-1978) of Zurich Scudder Investments (investment adviser) (and its predecessor firms); Trustee (1992-2007), Chair of the Board of Trustees (1999-2007), Investment Committee Chair (1994-1999) and Investment Committee member (2007-2010) of Wellesley College; Trustee, BoardSource (non-profit organization) (2006-2009) and Chicago City Day School (K-8 School) (1994-2005). Oversees 47 portfolios in the OppenheimerFunds complex. Ms. Herget has served on the Boards of certain Oppenheimer funds since 2012, during which time she has become familiar with the Fund’s (and other Oppenheimer funds’) financial, accounting, regulatory and investment matters and has contributed to the Boards’ deliberations. |
63 OPPENHEIMER GLOBAL STRATEGIC INCOME FUND/VA
TRUSTEES AND OFFICERS Unaudited / Continued
| | |
F. William Marshall, Jr., Trustee (since 2000) Year of Birth: 1942 | | Trustee Emeritus of Worcester Polytech Institute (WPI) (private university) (since 2009); Trustee of MassMutual Select Funds (formerly MassMutual Institutional Funds) (investment company) (1996-2015), MML Series Investment Fund (investment company) (1996-2015) and Mass Mutual Premier Funds (investment company) (January 2012-December 2015); President and Treasurer of the SIS Fund (private charitable fund) (January 1999-March 2011); Former Trustee of WPI (1985-2008); Former Chairman of the Board (2004-2006) and Former Chairman of the Investment Committee of WPI (1994-2008); Chairman of SIS Family Bank, F.S.B. (formerly SIS Bank) (commercial bank) (January 1999-July 1999); Executive Vice President of Peoples Heritage Financial Group, Inc. (commercial bank) (January 1999-July 1999); and Former President and Chief Executive Officer of SIS Bancorp. (1993-1999). Oversees 47 portfolios in the OppenheimerFunds complex. Mr. Marshall has served on the Boards of certain Oppenheimer funds since 2000, during which time he has become familiar with the Fund’s (and other Oppenheimer funds’) financial, accounting, regulatory and investment matters and has contributed to the Boards’ deliberations. |
| |
Karen L. Stuckey, Trustee (since 2012) Year of Birth: 1953 | | Member (since May 2015) of Desert Mountain Community Foundation Advisory Board (non-profit organization); Partner (1990-2012) of PricewaterhouseCoopers LLP (professional services firm) (held various positions 1975-1990); Trustee (1992-2006), member of Executive, Nominating and Audit Committees and Chair of Finance Committee (1992-2006), and Emeritus Trustee (since 2006) of Lehigh University; and member, Women’s Investment Management Forum (professional organization) since inception. Oversees 47 portfolios in the OppenheimerFunds complex. Ms. Stuckey has served on the Boards of certain Oppenheimer funds since 2012, during which time she has become familiar with the Fund’s (and other Oppenheimer funds’) financial, accounting, regulatory and investment matters and has contributed to the Boards’ deliberations. |
| |
James D. Vaughn, Trustee (since 2012) Year of Birth:1945 | | Retired; former managing partner (1994-2001) of Denver office of Deloitte & Touche LLP, (held various positions 1969-1993); Trustee and Chairman of the Audit Committee of Schroder Funds (2003-2012); Board member and Chairman of Audit Committee of AMG National Trust Bank (since 2005); Trustee and Investment Committee member, University of South Dakota Foundation (since 1996); Board member, Audit Committee Member and past Board Chair, Junior Achievement (since 1993); former Board member, Mile High United Way, Boys and Girls Clubs, Boy Scouts, Colorado Business Committee for the Arts, Economic Club of Colorado and Metro Denver Network. Oversees 47 portfolios in the OppenheimerFunds complex. Mr. Vaughn has served on the Boards of certain Oppenheimer funds since 2012, during which time he has become familiar with the Fund’s (and other Oppenheimer funds’) financial, accounting, regulatory and investment matters and has contributed to the Boards’ deliberations. |
| INTERESTED TRUSTEE AND OFFICER | | Mr. Steinmetz is an “Interested Trustee” because he is affiliated with the Manager and the Sub-Adviser by virtue of his positions as Chairman and director of the Sub-Adviser and officer and director of the Manager. Both as a Trustee and as an officer, Mr. Steinmetz serves for an indefinite term, or until his resignation, retirement, death or removal. Mr. Steinmetz’s address is 225 Liberty Street, New York, New York 10281-1008. |
| |
Arthur P. Steinmetz, Trustee (Since 2015), President and Principal Executive Officer (since 2014) Year of Birth: 1958 | | Chairman of OppenheimerFunds, Inc. (since January 2015); CEO and Chairman of OFI Global Asset Management, Inc. (since July 2014), President of OFI Global Asset Management, Inc. (since May 2013), a Director of OFI Global Asset Management, Inc. (since January 2013), Director of OppenheimerFunds, Inc. (since July 2014), President, Management Director and CEO of Oppenheimer Acquisition Corp. (OppenheimerFunds, Inc.‘s parent holding company) (since July 2014), and President and Director of OFI SteelPath, Inc. (since January 2013). Chief Investment Officer of the OppenheimerFunds advisory entities from (January 2013-December 2013); Executive Vice President of OFI Global Asset Management, Inc. (January 2013-May 2013); Chief Investment Officer of OppenheimerFunds, Inc. (October 2010-December 2012); Chief Investment Officer, Fixed-Income, of OppenheimerFunds, Inc. (April 2009-October 2010); Executive Vice President of OppenheimerFunds, Inc. (October 2009-December 2012); Director of Fixed Income of OppenheimerFunds, Inc. (January 2009-April 2009); and a Senior Vice President of OppenheimerFunds, Inc. (March 1993-September 2009). An officer of 103 portfolios in the OppenheimerFunds complex. |
| OTHER OFFICERS OF THE FUND | | The addresses of the Officers in the chart below are as follows: for Messrs. Baijal, Mata, Memani, Mss. Lo Bessette, Foxson and Picciotto, 225 Liberty Street, New York, New York 10281-1008, for Mr. Petersen 6803 S. Tucson Way, Centennial, Colorado 80112-3924. Each Officer serves for an indefinite term or until his or her resignation, retirement, death or removal. |
| |
Hemant Baijal, Vice President (Since 2015) Year of Birth: 1962 | | Vice President and Senior Portfolio Manager of the Sub-Adviser (since July 2011) and Co-Head of the Global Debt Team (since January 2015). Co-founder, Partner and Portfolio Manager of Six Seasons Global Asset Management (January 2009-December 2010). Partner and Portfolio Manager of Aravali Partners, LLC (September 2006-December 2008); Partner and Portfolio Manager at Havell Capital Management, LLC (November 1996-August 2006). A portfolio manager and an officer of other portfolios in the OppenheimerFunds complex. |
| |
Michael Mata, Vice President (since 2014) Year of Birth: 1963 | | Senior Vice President of the Sub-Adviser and the Head of Multi-Sector Fixed Income (since July 2014). Portfolio manager with ING Investment Management and Head of Multi-Sector Fixed-Income (August 2004-December 2013), managing the Global Bond and Core Plus strategies and the macro and quantitative research teams, along with the emerging markets sovereign team. Senior Vice President and Senior Risk Manager at Putnam Investments (March 2000-August 2004) and a Vice President and Risk Manager for Fixed Income Trading at Lehman Brothers (September 1994-March 2000). A portfolio manager and an officer of other portfolios in the OppenheimerFunds complex. |
| |
Krishna Memani, Vice President (since 2009) Year of Birth: 1960 | | President of the Sub-Adviser (since January 2013); Executive Vice President of the Manager (since January 2014) and Chief Investment Officer of the OppenheimerFunds advisory entities (since January 2014). Chief Investment Officer, Fixed Income of the Sub-Adviser (January 2013-December 2013); Head of the Investment Grade Fixed Income Team of the Sub-Adviser (March 2009-January 2014); Director of Fixed Income of the Sub-Adviser (October 2010-December 2012); Senior Vice President of the Sub-Adviser (March 2009-December 2012) and Senior Vice President of OFI Global Institutional, Inc. (April 2009-December 2012). Managing Director and Head of the U.S. and European Credit Analyst Team at Deutsche Bank Securities (June 2006-January 2009). Chief Credit Strategist at Credit Suisse Securities (August 2002-March 2006). Managing Director and Senior Portfolio Manager at Putnam Investments (September 1998-June 2002). A portfolio manager and an officer of other portfolios in the OppenheimerFunds complex. |
64 OPPENHEIMER GLOBAL STRATEGIC INCOME FUND/VA
| | |
Cynthia Lo Bessette, Secretary and Chief Legal Officer (since 2016) Year of Birth: 1969 | | Executive Vice President, General Counsel and Secretary of the Manager (since February 2016); Chief Legal Officer of the Sub-Adviser and the Distributor (since February 2016); Vice President, General Counsel and Secretary of Oppenheimer Acquisition Corp. (since February 2016); General Counsel of OFI SteelPath, Inc., VTL Associates, LLC and Index Management Solutions, LLC (since February 2016); Chief Legal Officer of OFI Global Institutional, Inc., HarbourView Asset Management Corporation, OFI Global Trust Company, Oppenheimer Real Asset Management, Inc., OFI Private Investments Inc., Shareholder Services, Inc. and Trinity Investment Management Corporation (since February 2016); Senior Vice President and Deputy General Counsel (March 2015-February 2016) and Executive Vice President, Vice President, Corporate Counsel (February 2012-March 2015) and Deputy Chief Legal Officer (April 2013-March 2015) of Jennison Associates LLC; Assistant General Counsel (April 2008-September 2009) and Deputy General Counsel (October 2009-February 2012) of Lord Abbett & Co. LLC. An officer of 103 portfolios in the OppenheimerFunds complex. |
| |
Jennifer Foxson, Vice President and Chief Business Officer (since 2014) Year of Birth: 1969 | | Senior Vice President of OppenheimerFunds Distributor, Inc. (since June 2014); Vice President of OppenheimerFunds Distributor, Inc. (April 2006-June 2014); Vice President of the Sub-Adviser (January 1998-March 2006); Assistant Vice President of the Sub-Adviser (October 1991-December 1998). An officer of 103 portfolios in the OppenheimerFunds complex. |
| |
Mary Ann Picciotto, Chief Compliance Officer and Chief Anti-Money Laundering Officer (since 2014) Year of Birth: 1973 | | Senior Vice President and Chief Compliance Officer of the Manager (since March 2014); Chief Compliance Officer of the Sub-Adviser, OFI SteelPath, Inc., OFI Global Trust Company, OFI Global Institutional, Inc., Oppenheimer Real Asset Management, Inc., OFI Private Investments, Inc., Harborview Asset Management Corporation, Trinity Investment Management Corporation, and Shareholder Services, Inc. (since March 2014); Managing Director of Morgan Stanley Investment Management Inc. and certain of its various affiliated entities; Chief Compliance Officer of various Morgan Stanley Funds (May 2010-January 2014); Chief Compliance Officer of Morgan Stanley Investment Management Inc. (April 2007-January 2014). An officer of 103 portfolios in the OppenheimerFunds complex. |
| |
Brian S. Petersen, Treasurer and Principal Financial & Accounting Officer (since 2016) Year of Birth: 1970 | | Vice President of the Manager (since January 2013); Vice President of the Sub-Adviser (February 2007-December 2012); Assistant Vice President of the Sub-Adviser (August 2002-2007). An officer of 103 portfolios in the OppenheimerFunds complex. |
The Fund’s Statement of Additional Information contains additional information about the Fund’s Trustees and Officers and is available without charge, upon request, by calling 1.800.988.8287.
65 OPPENHEIMER GLOBAL STRATEGIC INCOME FUND/VA
THIS PAGE INTENTIONALLY LEFT BLANK.
66 OPPENHEIMER GLOBAL STRATEGIC INCOME FUND/VA
THIS PAGE INTENTIONALLY LEFT BLANK.
67 OPPENHEIMER GLOBAL STRATEGIC INCOME FUND/VA
OPPENHEIMER GLOBAL STRATEGIC INCOME FUND/VA
A Series of Oppenheimer Variable Account Funds
| | | | |
| Manager | | | | OFI Global Asset Management, Inc. |
| | |
| Sub-Adviser | | | | OppenheimerFunds, Inc. |
| | |
| Distributor | | | | OppenheimerFunds Distributor, Inc. |
| | |
| Transfer and Shareholder Servicing Agent | | | | OFI Global Asset Management, Inc. |
| | |
| Sub-Transfer Agent | | | | Shareholder Services, Inc. |
| | | | DBA OppenheimerFunds Services |
| | |
| Independent Registered Public Accounting Firm | | | | KPMG LLP |
| | |
| Legal Counsel | | | | Ropes & Gray LLP |
| | |
| | | | Before investing in any of the Oppenheimer funds, investors should carefully consider a fund’s investment objectives, risks, charges and expenses. Fund prospectuses and summary prospectuses contain this and other information about the funds, and may be obtained by asking your financial advisor, or calling us at 1.800.988.8287. Read prospectuses and summary prospectuses carefully before investing. |
| | |
| | | | © 2017 OppenheimerFunds, Inc. All rights reserved. Oppenheimer funds are distributed by OppenheimerFunds Distributor, Inc. |

| | | | |
| |  | | |
| | December 31, 2016 | | |
| | | Oppenheimer | | |
| | Equity Income Fund/VA | | Annual Report |
| | | A Series of Oppenheimer Variable Account Funds | | |
| | ANNUAL REPORT | | |
| | Listing of Top Holdings Fund Performance Discussion Financial Statements | | |
PORTFOLIO MANAGER: Michael S. Levine, CFA
AVERAGE ANNUAL TOTAL RETURNS FOR THE PERIODS ENDED 12/31/16
| | | | | | | | | | | | | | | | |
| | | Inception
Date | | | 1-Year | | | 5-Year | | | 10-Year | |
Non-Service Shares | | | 1/2/03 | | | | 15.31% | | | | 11.63% | | | | 6.70% | |
Service Shares | | | 9/18/06 | | | | 15.13 | | | | 10.84 | | | | 4.15 | |
Russell 1000 Value Index | | | | | | | 17.34 | | | | 14.80 | | | | 5.72 | |
Performance data quoted represents past performance, which does not guarantee future results. The investment return and principal value of an investment in the Fund will fluctuate so that an investor’s shares, when redeemed, may be worth more or less than their original cost. Current performance may be lower or higher than the performance quoted. For performance data current to the most recent month end, call us at 1.800.988.8287. The Fund’s total returns should not be expected to be the same as the returns of other funds, whether or not both funds have the same portfolio managers and/or similar names. The Fund’s total returns include changes in share price and reinvested distributions but do not include the charges associated with the separate account products that offer this Fund. Such performance would have been lower if such charges were taken into account.
TOP HOLDINGS AND ALLOCATIONS
TOP TEN COMMON STOCK HOLDINGS
| | | | |
| |
Citigroup, Inc. | | | 5.5% | |
| |
Assured Guaranty Ltd. | | | 3.1 | |
| |
JPMorgan Chase & Co. | | | 2.9 | |
| |
Wells Fargo & Co. | | | 2.8 | |
| |
AT&T, Inc. | | | 2.7 | |
| |
Apple, Inc. | | | 2.7 | |
| |
Chevron Corp. | | | 2.7 | |
| |
Royal Dutch Shell plc, Cl. A, Sponsored ADR | | | 2.4 | |
| |
Pfizer, Inc. | | | 2.4 | |
| |
Morgan Stanley | | | 2.0 | |
| |
Portfolio holdings and allocations are subject to change. Percentages are as of December 31, 2016, and are based on net assets. For more current Fund holdings, please visit oppenheimerfunds.com.
SECTOR ALLOCATION
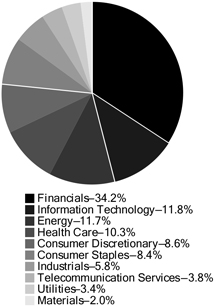
Portfolio holdings and allocations are subject to change. Percentages are as of December 31, 2016, and are based on the total market value of common stocks.
2 OPPENHEIMER EQUITY INCOME FUND/VA
Fund Performance Discussion
The Fund’s Non-Service shares returned 15.31% during the reporting period. In comparison, the Fund underperformed the Russell 1000 Value Index (the “Index”), which returned 17.34%. On a sector basis, the most significant detractors from performance versus the Index included stock selection and overweight positions in health care and consumer discretionary. The largest outperforming sectors for the Fund versus the Index were financials and consumer staples, due primarily to stock selection.
MARKET OVERVIEW
Not surprisingly, markets were volatile during the reporting period. Nevertheless, the Index and the Fund experienced gains, particularly after the November U.S. Presidential election. Similar to the surprise Brexit vote in June, expectations of a negative market reaction proved to be overly pessimistic, and the U.S. equity market reacted in a positive manner, with the Russell 1000 Value index gaining almost 8% between the election and mid-December, when the Federal Reserve increased the Federal Funds Rate by another quarter percent, only the second such move since the financial crisis.
Investor optimism improved in the hope that an incoming Trump administration would pursue a pro-growth economic agenda, specifically around corporate tax reform and deregulation. The primary beneficiary of the equity market’s year end optimism was the financials sector, led by bank stocks, which gained over 30% during the fourth quarter. Rising interest rates coupled with the prospect of lower corporate tax rates and a reduced regulatory burden could all benefit bank profitability, which drove valuation multiples higher for the group.
TOP INDIVIDUAL CONTRIBUTORS
Top contributors to the Fund’s performance this period included Assured Guaranty Ltd., Chevron Corp. and Navistar International Corp.
Assured Guaranty (AGO) is a leading Municipal Bond Insurer. AGO performed well during the reporting period as optimism surrounding a favorable solution to Puerto Rico’s debt problems increased following the results of the U.S. Presidential election as well the election of a new Governor in Puerto Rico. Both of these results should be favorable to creditors. Additionally, AGO continued to consolidate the Structure Finance market with an acquisition of MBIA, Inc’s U.K. structured finance subsidiary, which should be accretive.
Chevron benefited from the sharp bounce off the oil price lows seen in the first quarter of 2016. Furthermore, Chevron’s attractive yield and more focused capital spending plans were rewarded by the market.
Navistar International performed well due to steadily improving results in a challenging macro environment as well as an equity investment by Volkswagen. These two events/developments highlighted the earnings power of the company during the next up cycle and significantly de-risked the balance sheet. Following the recent strength in the name, we exited our position.
TOP INDIVIDUAL DETRACTORS
Detractors from performance this reporting period included Teva Pharmaceutical Industries Ltd., Allergan plc and Frontier Communications Corp.
Teva is a leading Generic Drug manufacturer. Teva has been a very disappointing investment during the second half of 2016. An expensive acquisition of Allergan’s generic business was poorly timed as the pricing environment has deteriorated for the generic industry. Furthermore, a delay in new product introductions has impacted recent results. Lastly, competition for its largest product appears likely (although not unexpected) over the next 12 months or so. While we are disappointed with the company’s execution, we maintained a position since at 7x-8x earnings per share (EPS), in our view, the stock is too cheap and our patience can be rewarded.
Allergan is a leading specialty Pharmaceuticals company. A failed merger with Pfizer in early 2016 set the tone for a dismal 2016 for the stock. Following the deal break up the stock continued to perform poorly due to overall industry pricing concerns, concerns about the prices Allergan was paying for acquisitions, and falling forward earnings guidance. We believe all of these issues are in the rearview mirror and we expect much better performance in 2017. A high percentage of cash pay business, solid balance sheet and above average earnings growth should hopefully lead to better stock performance.
Frontier is a high yielding local telephone company. Frontier acquired a large number of customers from Verizon in the spring of 2016. While this acquisition should ultimately generate significant synergies and cash flow, the integration has been challenging. Concerns about Frontier’s ability to continue to pay the
3 OPPENHEIMER EQUITY INCOME FUND/VA
dividend resulted in very poor performance during the second half of 2016. While we are concerned about the initial integration challenges, the current payout ratio is below 60%. We believe this gives Frontier time to stabilize the acquired properties. Once this happens, the stock should be revalued higher, in our view.
Investors should consider the Fund’s investment objective, risks, charges and expenses carefully before investing. The Fund’s prospectus and summary prospectus contain this and other information about the Fund, and may be obtained by asking your financial advisor or calling us at 1.800.988.8287. Read prospectuses and summary prospectuses carefully before investing.
Total returns include changes in share price and reinvestment of dividends and capital gains distributions in a hypothetical investment for the periods shown, but do not include the charges associated with the separate account products that offer this Fund.
The Fund’s investment strategy and focus can change over time. The mention of specific fund holdings does not constitute a recommendation by OppenheimerFunds, Inc. or its affiliates.
Shares of Oppenheimer funds are not deposits or obligations of any bank, are not guaranteed by any bank, are not insured by the FDIC or any other agency, and involve investment risks, including the possible loss of the principal amount invested.
Comparing the Fund’s Performance to the Market. The graphs that follow show the performance of a hypothetical $10,000 investment in each share class of the Fund held until December 31, 2016. Performance is measured over a ten-fiscal-year period for both Classes. Performance information does not reflect charges that apply to separate accounts investing in the Fund. If these charges were taken into account, performance would be lower. The graphs assume that all dividends and capital gains distributions were reinvested in additional shares.
The Fund’s performance is compared to the performance of the Russell 1000 Value Index. The Russell 1000 Value Index measures the performance of the large-cap value segment of the U.S. equity universe. It includes those Russell 1000 companies with lower price-to-book ratios and lower expected growth values. The index is unmanaged and cannot be purchased directly by investors. While index comparisons may be useful to provide a benchmark for the Fund’s performance, it must be noted that the Fund’s investments are not limited to the investments comprising the indices. Index performance includes reinvestment of income, but does not reflect transaction costs, fees, expenses or taxes. Index performance is shown for illustrative purposes only as a benchmark for the Fund’s performance, and does not predict or depict performance of the Fund. The Fund’s performance reflects the effects of the Fund’s business and operating expenses.
4 OPPENHEIMER EQUITY INCOME FUND/VA
COMPARISON OF CHANGE IN VALUE OF $10,000 HYPOTHETICAL INVESTMENTS IN:
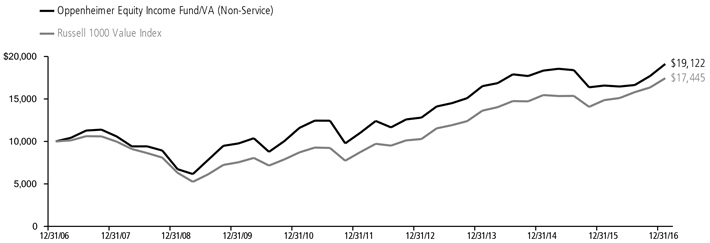
COMPARISON OF CHANGE IN VALUE OF $10,000 HYPOTHETICAL INVESTMENTS IN:
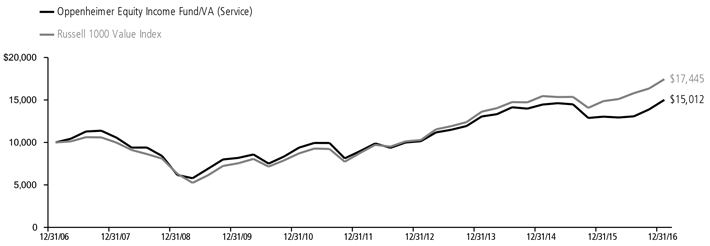
Performance data quoted represents past performance, which does not guarantee future results. The investment return and principal value of an investment in the Fund will fluctuate so that an investor’s shares, when redeemed, may be worth more or less than their original cost. Current performance may be lower or higher than the performance quoted. For performance data current to the most recent month end, call us at 1.800.988.8287. The Fund’s total returns should not be expected to be the same as the returns of other funds, whether or not both funds have the same portfolio managers and/or similar names. The Fund’s total returns include changes in share price and reinvested distributions but do not include the charges associated with the separate account products that offer this Fund. Such performance would have been lower if such charges were taken into account.
5 OPPENHEIMER EQUITY INCOME FUND/VA
Fund Expenses
Fund Expenses. As a shareholder of the Fund, you incur two types of costs: (1) transaction costs and (2) ongoing costs, including management fees; distribution and service fees; and other Fund expenses. These examples are intended to help you understand your ongoing costs (in dollars) of investing in the Fund and to compare these costs with the ongoing costs of investing in other mutual funds.
The examples are based on an investment of $1,000.00 invested at the beginning of the period and held for the entire 6-month period ended December 31, 2016.
Actual Expenses. The first section of the table provides information about actual account values and actual expenses. You may use the information in this section for the class of shares you hold, together with the amount you invested, to estimate the expense that you paid over the period. Simply divide your account value by $1,000.00 (for example, an $8,600.00 account value divided by $1,000.00 = 8.60), then multiply the result by the number in the first section under the heading entitled “Expenses Paid During 6 Months Ended December 31, 2016” to estimate the expenses you paid on your account during this period.
Hypothetical Example for Comparison Purposes.
The second section of the table provides information about hypothetical account values and hypothetical expenses based on the Fund’s actual expense ratio for each class of shares, and an assumed rate of return of 5% per year for each class before expenses, which is not the actual return. The hypothetical account values and expenses may not be used to estimate the actual ending account balance or expenses you paid for the period. You may use this information to compare the ongoing costs of investing in the Fund and other funds. To do so, compare this 5% hypothetical example for the class of shares you hold with the 5% hypothetical examples that appear in the shareholder reports of the other funds.
Please note that the expenses shown in the table are meant to highlight your ongoing costs only and do not reflect any charges associated with the separate accounts that offer this Fund. Therefore, the “hypothetical” lines of the table are useful in comparing ongoing costs only, and will not help you determine the relative total costs of owning different funds. In addition, if these separate account charges were included your costs would have been higher.
| | | | | | | | | | | | |
| Actual | | Beginning Account Value July 1, 2016 | | | Ending Account Value
December 31, 2016 | | | Expenses Paid During 6 Months Ended
December 31, 2016 | |
Non-Service shares | | $ | 1,000.00 | | | $ | 1,149.00 | | | $ | 4.33 | |
Service shares | | | 1,000.00 | | | | 1,148.10 | | | | 5.68 | |
| | | |
Hypothetical (5% return before expenses) | | | | | | | | | |
Non-Service shares | | | 1,000.00 | | | | 1,021.11 | | | | 4.07 | |
Service shares | | | 1,000.00 | | | | 1,019.86 | | | | 5.35 | |
Expenses are equal to the Fund’s annualized expense ratio for that class, multiplied by the average account value over the period, multiplied by 184/366 (to reflect the one-half year period). Those annualized expense ratios, excluding indirect expenses from affiliated funds, based on the 6-month period ended December 31, 2016 are as follows:
| | | | |
| Class | | Expense Ratios | |
Non-Service shares | | | 0.80% | |
Service shares | | | 1.05 | |
The expense ratios reflect voluntary and/or contractual waivers and/or reimbursements of expenses by the Fund’s Manager. Some of these undertakings may be modified or terminated at any time, as indicated in the Fund’s prospectus. The “Financial Highlights” tables in the Fund’s financial statements, included in this report, also show the gross expense ratios, without such waivers or reimbursements and reduction to custodian expenses, if applicable.
6 OPPENHEIMER EQUITY INCOME FUND/VA
STATEMENT OF INVESTMENTS December 31, 2016
| | | | | | | | |
| | | Shares | | | Value | |
| |
Common Stocks—90.6% | | | | | | | | |
| |
| Consumer Discretionary—7.8% | | | | | | | | |
| |
| Automobiles—1.8% | | | | | | | | |
| |
| Ford Motor Co. | | | 8,560 | | | $ | 103,833 | |
| |
| General Motors Co. | | | 1,250 | | | | 43,550 | |
| | | | | | | | |
| | | | | | | 147,383 | |
| |
| Hotels, Restaurants & Leisure—1.0% | |
| |
Extended Stay America, Inc. | | | 5,175 | | | | 83,576 | |
| |
| Household Durables—1.9% | | | | | | | | |
| |
| CalAtlantic Group, Inc. | | | 3,360 | | | | 114,274 | |
| |
| PulteGroup, Inc. | | | 1,925 | | | | 35,381 | |
| | | | | | | | |
| | | | | | | 149,655 | |
| |
| Media—1.1% | | | | | | | | |
| |
| Comcast Corp., Cl. A | | | 495 | | | | 34,180 | |
| |
| Time Warner, Inc. | | | 570 | | | | 55,022 | |
| | | | | | | | |
| | | | | | | 89,202 | |
| |
| Multiline Retail—1.2% | | | | | | | | |
| |
| Kohl’s Corp. | | | 750 | | | | 37,035 | |
| |
| Macy’s, Inc. | | | 1,735 | | | | 62,130 | |
| | | | | | | | |
| | | | | | | 99,165 | |
| |
| Specialty Retail—0.8% | | | | | | | | |
| |
| Signet Jewelers Ltd. | | | 320 | | | | 30,163 | |
| |
| Staples, Inc. | | | 3,675 | | | | 33,259 | |
| | | | | | | | |
| | | | | | | 63,422 | |
| |
| Consumer Staples—7.6% | | | | | | | | |
| |
| Beverages—1.1% | | | | | | | | |
| |
| Coca-Cola Co. (The) | | | 1,210 | | | | 50,167 | |
| |
| Molson Coors Brewing Co., Cl. B | | | 425 | | | | 41,357 | |
| | | | | | | | |
| | | | | | | 91,524 | |
| |
| Food & Staples Retailing—2.3% | | | | | | | | |
| |
| CVS Health Corp. | | | 195 | | | | 15,387 | |
| |
| Walgreens Boots Alliance, Inc. | | | 1,330 | | | | 110,071 | |
| |
| Wal-Mart Stores, Inc. | | | 890 | | | | 61,517 | |
| | | | | | | | |
| | | | | | | 186,975 | |
| |
| Food Products—2.4% | | | | | | | | |
| |
| Kraft Heinz Co. (The) | | | 1,250 | | | | 109,150 | |
| |
| Post Holdings, Inc.1 | | | 1,000 | | | | 80,390 | |
| | | | | | | | |
| | | | | | | 189,540 | |
| |
| Household Products—0.7% | | | | | | | | |
| |
Procter & Gamble Co. (The) | | | 640 | | | | 53,811 | |
| |
| Tobacco—1.1% | | | | | | | | |
| |
| Philip Morris International, Inc. | | | 915 | | | | 83,713 | |
| |
| Reynolds American, Inc. | | | 115 | | | | 6,445 | |
| | | | | | | | |
| | | | | | | 90,158 | |
| |
| Energy—10.6% | | | | | | | | |
| |
| Oil, Gas & Consumable Fuels—10.6% | |
| |
| BP plc, Sponsored ADR | | | 3,255 | | | | 121,672 | |
| |
| Chevron Corp.2 | | | 1,825 | | | | 214,803 | |
| |
| Exxon Mobil Corp. | | | 1,500 | | | | 135,390 | |
| |
| Kinder Morgan, Inc. | | | 2,875 | | | | 59,541 | |
| |
| Marathon Oil Corp. | | | 5,675 | | | | 98,234 | |
| |
| Royal Dutch Shell plc, Cl. A, Sponsored ADR | | | 3,600 | | | | 195,768 | |
| |
| Williams Cos., Inc. (The) | | | 1,050 | | | | 32,697 | |
| | | | | | | | |
| | | | | | | 858,105 | |
| |
| Financials—31.0% | | | | | | | | |
| |
| Capital Markets—5.5% | | | | | | | | |
| |
| Goldman Sachs Group, Inc. (The) | | | 550 | | | | 131,698 | |
| |
| KKR & Co. LP3 | | | 7,950 | | | | 122,350 | |
| |
| Morgan Stanley | | | 3,775 | | | | 159,494 | |
| |
| NorthStar Asset Management Group, Inc. | | | 1,800 | | | | 26,856 | |
| | | | | | | | |
| | | | | | | 440,398 | |
| | | | | | | | |
| | | Shares | | | Value | |
| |
| Commercial Banks—12.0% | | | | | | | | |
| |
| Bank of America Corp. | | | 3,000 | | | $ | 66,300 | |
| |
| Citigroup, Inc.2 | | | 7,500 | | | | 445,725 | |
| |
| JPMorgan Chase & Co.2 | | | 2,750 | | | | 237,297 | |
| |
| Wells Fargo & Co. | | | 4,050 | | | | 223,196 | |
| | | | | | | | |
| | | | | | | 972,518 | |
| |
| Insurance—5.7% | | | | | | | | |
| |
| American International Group, Inc. | | | 1,955 | | | | 127,681 | |
| |
| Assured Guaranty Ltd. | | | 6,650 | | | | 251,171 | |
| |
| MetLife, Inc. | | | 1,460 | | | | 78,679 | |
| | | | | | | | |
| | | | | | | 457,531 | |
| |
| Real Estate Investment Trusts (REITs)—5.0% | |
| |
| Blackstone Mortgage Trust, Inc., Cl. A | | | 1,900 | | | | 57,133 | |
| |
| Colony Capital, Inc., Cl. A | | | 5,525 | | | | 111,881 | |
| |
| Communications Sales & Leasing, Inc. | | | 2,850 | | | | 72,419 | |
| |
| NorthStar Realty Finance Corp. | | | 2,825 | | | | 42,799 | |
| |
| Starwood Property Trust, Inc. | | | 3,100 | | | | 68,045 | |
| |
| Two Harbors Investment Corp. | | | 5,625 | | | | 49,050 | |
| | | | | | | | |
| | | | | | | 401,327 | |
| |
| Real Estate Management & Development—0.6% | |
| |
Realogy Holdings Corp. | | | 1,925 | | | | 49,530 | |
| |
| Thrifts & Mortgage Finance—2.2% | |
| |
| MGIC Investment Corp.1 | | | 8,775 | | | | 89,417 | |
| |
| Radian Group, Inc. | | | 5,150 | | | | 92,597 | |
| | | | | | | | |
| | | | | | | 182,014 | |
| |
| Health Care—9.3% | | | | | | | | |
| |
| Biotechnology—2.1% | | | | | | | | |
| |
| AbbVie, Inc. | | | 1,355 | | | | 84,850 | |
| |
| Gilead Sciences, Inc. | | | 1,150 | | | | 82,352 | |
| | | | | | | | |
| | | | | | | 167,202 | |
| |
| Health Care Equipment & Supplies—2.1% | |
| |
| Abbott Laboratories | | | 2,650 | | | | 101,786 | |
| |
| Medtronic plc | | | 1,000 | | | | 71,230 | |
| | | | | | | | |
| | | | | | | 173,016 | |
| |
| Pharmaceuticals—5.1% | | | | | | | | |
| |
| Johnson & Johnson | | | 600 | | | | 69,126 | |
| |
| Merck & Co., Inc. | | | 2,590 | | | | 152,473 | |
| |
| Pfizer, Inc. | | | 5,845 | | | | 189,846 | |
| | | | | | | | |
| | | | | | | 411,445 | |
| |
| Industrials—5.3% | | | | | | | | |
| |
| Aerospace & Defense—1.2% | | | | | | | | |
| |
| General Dynamics Corp. | | | 250 | | | | 43,165 | |
| |
| United Technologies Corp. | | | 455 | | | | 49,877 | |
| | | | | | | | |
| | | | | | | 93,042 | |
| |
| Airlines—1.1% | | | | | | | | |
| |
United Continental Holdings, Inc.1 | | | 1,250 | | | | 91,100 | |
| |
| Commercial Services & Supplies—0.2% | |
| �� |
| RR Donnelley & Sons Co. | | | 1,000 | | | | 16,320 | |
| |
| Electrical Equipment—0.9% | | | | | | | | |
| |
| Eaton Corp. plc | | | 685 | | | | 45,956 | |
| |
| General Cable Corp. | | | 1,200 | | | | 22,860 | |
| | | | | | | | |
| | | | | | | 68,816 | |
| |
| Industrial Conglomerates—1.8% | | | | | | | | |
| |
| General Electric Co. | | | 4,550 | | | | 143,780 | |
| |
| Honeywell International, Inc. | | | 40 | | | | 4,634 | |
| | | | | | | | |
| | | | | | | 148,414 | |
| |
| Road & Rail—0.1% | | | | | | | | |
| |
CSX Corp. | | | 275 | | | | 9,881 | |
| |
| Information Technology—10.7% | | | | | | | | |
| |
| Communications Equipment—1.5% | | | | | | | | |
| |
| Cisco Systems, Inc. | | | 4,075 | | | | 123,146 | |
7 OPPENHEIMER EQUITY INCOME FUND/VA
STATEMENT OF INVESTMENTS Continued
| | | | | | | | |
| | | Shares | | | Value | |
| |
| Internet Software & Services—0.5% | | | | | | | | |
| |
Alphabet, Inc., Cl. C1 | | | 50 | | | $ | 38,591 | |
| |
| IT Services—0.7% | | | | | | | | |
| |
International Business Machines Corp. | | | 320 | | | | 53,117 | |
| |
| Semiconductors & Semiconductor Equipment—2.5% | |
| |
| Intel Corp. | | | 1,880 | | | | 68,188 | |
| |
| Micron Technology, Inc.1 | | | 3,075 | | | | 67,404 | |
| |
| QUALCOMM, Inc. | | | 1,000 | | | | 65,200 | |
| | | | | | | | |
| | | | | | | 200,792 | |
| |
| Software—2.6% | | | | | | | | |
| |
| Microsoft Corp. | | | 1,900 | | | | 118,066 | |
| |
| Oracle Corp. | | | 2,300 | | | | 88,435 | |
| | | | | | | | |
| | | | | | | 206,501 | |
| |
| Technology Hardware, Storage & Peripherals—2.9% | |
| |
| Apple, Inc. | | | 1,875 | | | | 217,162 | |
| |
| HP, Inc. | | | 1,350 | | | | 20,034 | |
| | | | | | | | |
| | | | | | | 237,196 | |
| |
| Materials—1.8% | | | | | | | | |
| |
| Chemicals—0.9% | | | | | | | | |
| |
| Dow Chemical Co. (The) | | | 655 | | | | 37,479 | |
| |
| LyondellBasell Industries NV, Cl. A | | | 425 | | | | 36,457 | |
| | | | | | | | |
| | | | | | | 73,936 | |
| |
| Containers & Packaging—0.5% | | | | | | | | |
| |
International Paper Co. | | | 750 | | | | 39,795 | |
| |
| Paper & Forest Products—0.4% | | | | | | | | |
| |
Domtar Corp. | | | 770 | | | | 30,053 | |
| |
| Telecommunication Services—3.4% | | | | | | | | |
| |
| Diversified Telecommunication Services—3.4% | |
| |
| AT&T, Inc. | | | 5,200 | | | | 221,156 | |
| |
| CenturyLink, Inc. | | | 470 | | | | 11,176 | |
| |
| Frontier Communications Corp. | | | 5,500 | | | | 18,590 | |
| |
| Level 3 Communications, Inc.1 | | | 460 | | | | 25,926 | |
| | | | | | | | |
| | | | | | | 276,848 | |
| |
| Utilities—3.1% | | | | | | | | |
| |
| Electric Utilities—2.4% | | | | | | | | |
| |
| American Electric Power Co., Inc. | | | 1,475 | | | | 92,866 | |
| |
| Exelon Corp. | | | 580 | | | | 20,584 | |
| |
| PPL Corp. | | | 2,350 | | | | 80,018 | |
| | | | | | | | |
| | | | | | | 193,468 | |
| | | | | | | | |
| | | Shares | | | Value | |
| |
| Independent Power and Renewable Electricity Producers—0.7% | |
| |
| NRG Energy, Inc. | | | 4,400 | | | $ | 53,944 | |
| | | | | | | | |
Total Common Stocks
(Cost $6,079,761) | | | | | | | 7,312,457 | |
| |
Preferred Stocks—7.7% | |
| |
| Allergan plc, 5.50% Cv., Series A | | | 209 | | | | 159,354 | |
| |
| Dominion Resources, Inc., 6.375% Cv. | | | 495 | | | | 24,780 | |
| |
| Exelon Corp., 6.50% Cv. | | | 1,435 | | | | 69,468 | |
| |
| Frontier Communications Corp., 11.125% Cv., Series A, Non-Vtg. | | | 1,910 | | | | 135,763 | |
| |
| iStar, Inc., 4.50% Cv., Non-Vtg. | | | 2,345 | | | | 122,526 | |
| |
| Teva Pharmaceutical Industries Ltd., 7% Cv., Non-Vtg. | | | 173 | | | | 111,585 | |
| | | | | | | | |
Total Preferred Stocks
(Cost $768,254) | | | | | | | 623,476 | |
| | |
| | | Principal Amount | | | | |
| |
Non-Convertible Corporate Bond and Note—0.0% | |
| |
Frontier Communications Corp., 11% Sr. Unsec. Nts., 9/15/25 (Cost $995) | | $ | 1,000 | | | | 1,036 | |
| |
Convertible Corporate Bonds and Notes—0.6% | |
| |
| MGIC Investment Corp., 9% Cv. Jr. Sub. Nts., 4/1/634 | | | 30,000 | | | | 37,688 | |
| |
| Micron Technology, Inc., 3% Cv. Sr. Unsec. Nts., 11/15/43 | | | 10,000 | | | | 9,981 | |
| | | | | | | | |
| Total Convertible Corporate Bonds and Notes (Cost $42,781) | | | | | | | 47,669 | |
| | |
| | | Shares | | | | |
| |
Structured Securities—1.2% | | | | | | | | |
| |
| Barclays Bank plc, Alcoa, Inc. Equity Linked Nts., 10/4/17 | | | 450 | | | | 12,599 | |
| |
| Barclays Bank plc, Alphabet, Inc., Cl. C Yield Enhanced Equity Debt Securities, 3/20/17 | | | 24 | | | | 18,574 | |
| |
| Citigroup Global Markets Holdings, Inc., Alphabet, Inc. Equity Linked Nts., 3/2/174 | | | 26 | | | | 20,007 | |
| |
| Credit Suisse AG (London Branch), Alphabet, Inc. Equity Linked Nts., 2/23/174 | | | 26 | | | | 20,037 | |
| |
| Credit Suisse AG (London Branch), Alphabet, Inc. Equity Linked Nts., 3/3/174 | | | 33 | | | | 25,436 | |
| | | | | | | | |
Total Structured Securities
(Cost $100,615) | | | | | | | 96,653 | |
| | | | | | | | | | | | | | | | | | | | | | | | |
| | | | | | Exercise Price | | | Expiration Date | | | | | | Contracts | | | | |
| |
Exchange-Traded Options Purchased—0.0% | |
| |
| Abbott Laboratories Put1 | | | USD | | | | 36.000 | | | | 1/20/17 | | | | USD | | | | 5 | | | | 110 | |
| |
| General Motors Co. Put1 | | | USD | | | | 32.000 | | | | 1/20/17 | | | | USD | | | | 10 | | | | 180 | |
| |
| NRG Energy, Inc. Put1 | | | USD | | | | 10.000 | | | | 1/20/17 | | | | USD | | | | 10 | | | | 50 | |
| | | | | | | | | | | | | | | | | | | | | | | | |
Total Exchange-Traded Options Purchased (Cost $521) | | | | | | | | | | | | | | | | | | | | | | | 340 | |
| |
| Total Investments, at Value (Cost $6,992,927) | | | | | | | | | | | | | | | | | | | 100.1% | | | | 8,081,631 | |
| |
| Net Other Assets (Liabilities) | | | | | | | | | | | | | | | | | | | (0.1) | | | | (10,946) | |
| | | | | | | | | | | | | | | | | | | | |
| Net Assets | | | | | | | | | | | | | | | | | | | 100.0% | | | $ | 8,070,685 | |
| | | | | | | | | | | | | | | | | | | | |
Footnotes to Statement of Investments
1. Non-income producing security.
2. All or a portion of the security position is held in segregated accounts and pledged to cover margin requirements with respect to outstanding written options. The aggregate market value of such securities is $486,276. See Note 6 of the accompanying Notes.
3. Security is a Master Limited Partnership.
4. Represents securities sold under Rule 144A, which are exempt from registration under the Securities Act of 1933, as amended. These securities have been determined to be liquid under guidelines established by the Board of Trustees. These securities amount to $103,168 or 1.28% of the Fund’s net assets at period end.
8 OPPENHEIMER EQUITY INCOME FUND/VA
The following issuer is or was an affiliate, as defined in the Investment Company Act of 1940, at or during the reporting period by virtue of the Fund owning at least 5% of the voting securities of the issuer or as a result of the Fund and the issuer having the same investment adviser. There were no affiliate securities held by the Fund at period end. Transactions during the period in which the issuer was an affiliate are as follows:
| | | | | | | | | | | | | | | | |
| | | Shares
December 31, 2015 | | | Gross
Additions | | | Gross
Reductions | | | Shares
December 31, 2016 | |
| |
| Oppenheimer Institutional Government Money Market Fund, Cl. Ea | | | 60,375 | | | | 1,654,426 | | | | 1,714,801 | | | | — | |
| | | | |
| | | | | | | | | | | | Income | |
| |
| Oppenheimer Institutional Government Money Market Fund, Cl. Ea | | | | | | | | | | | | | | $ | 206 | |
a. Prior to September 28, 2016, this fund was named Oppenheimer Institutional Money Market Fund.
| | | | | | | | | | | | | | | | | | | | | | | | | | | | |
| |
Exchange-Traded Options Written at December 31, 2016 | |
| Description | | | | | Exercise Price | | | Expiration Date | | | Number of Contracts | | | Premiums Received | | | Value | |
| |
| Abbott Laboratories Put | | | USD | | | | 38.000 | | | | 1/20/17 | | | | USD | | | | (10) | | | $ | 820 | | | $ | (690) | |
| |
| Assured Guaranty Ltd. Call | | | USD | | | | 39.000 | | | | 1/20/17 | | | | USD | | | | (1) | | | | 58 | | | | (29) | |
| |
| Assured Guaranty Ltd. Call | | | USD | | | | 38.000 | | | | 1/20/17 | | | | USD | | | | (3) | | | | 250 | | | | (195) | |
| |
| Citigroup, Inc. Call | | | USD | | | | 60.000 | | | | 1/20/17 | | | | USD | | | | (2) | | | | 382 | | | | (262) | |
| |
| Ford Motor Co. Call | | | USD | | | | 12.750 | | | | 1/20/17 | | | | USD | | | | (10) | | | | 350 | | | | (70) | |
| |
| Ford Motor Co. Call | | | USD | | | | 13.000 | | | | 1/20/17 | | | | USD | | | | (20) | | | | 879 | | | | (80) | |
| |
| General Motors Co. Put | | | USD | | | | 35.000 | | | | 1/20/17 | | | | USD | | | | (10) | | | | 579 | | | | (970) | |
| |
| International Paper Co. Call | | | USD | | | | 55.000 | | | | 1/20/17 | | | | USD | | | | (2) | | | | 163 | | | | (68) | |
| |
| Kroger Co. (The) Put | | | USD | | | | 35.000 | | | | 1/20/17 | | | | USD | | | | (5) | | | | 372 | | | | (500) | |
| |
| Marathon Oil Corp. Call | | | USD | | | | 17.000 | | | | 1/20/17 | | | | USD | | | | (5) | | | | 790 | | | | (420) | |
| |
| Micron Technology, Inc. Put | | | USD | | | | 20.000 | | | | 1/20/17 | | | | USD | | | | (1) | | | | 83 | | | | (19) | |
| |
| Microsoft Corp. Call | | | USD | | | | 64.000 | | | | 1/20/17 | | | | USD | | | | (1) | | | | 69 | | | | (30) | |
| |
| Morgan Stanley Call | | | USD | | | | 42.000 | | | | 1/20/17 | | | | USD | | | | (5) | | | | 1,050 | | | | (645) | |
| |
| NRG Energy, Inc. Put | | | USD | | | | 12.000 | | | | 1/20/17 | | | | USD | | | | (10) | | | | 724 | | | | (350) | |
| |
| Signet Jewelers Ltd. Call | | | USD | | | | 95.000 | | | | 1/20/17 | | | | USD | | | | (3) | | | | 1,540 | | | | (990) | |
| |
| Walgreens Boots Alliance, Inc. Call | | | USD | | | | 85.000 | | | | 1/20/17 | | | | USD | | | | (1) | | | | 352 | | | | (130) | |
| | | | | | | | | | | | | | | | | | | | | | | | |
| Total of Exchange-Traded Options Written | | | | | | | | | | | | | | | | | | | | | | $ | 8,461 | | | $ | (5,448) | |
| | | | | | | | | | | | | | | | | | | | | | | | |
See accompanying Notes to Financial Statements.
9 OPPENHEIMER EQUITY INCOME FUND/VA
STATEMENT OF ASSETS AND LIABILITIES December 31, 2016
| | | | |
| |
Assets | | | | |
| Investments, at value unaffiliated companies (cost $6,992,927)—see accompanying statement of investments | | $ | 8,081,631 | |
| |
| Cash | | | 26,264 | |
| |
| Receivables and other assets: | | | | |
| Investments sold | | | 24,349 | |
| Interest and dividends | | | 15,042 | |
| Shares of beneficial interest sold | | | 201 | |
| Other | | | 15,326 | |
| | | | |
| Total assets | | | 8,162,813 | |
| |
Liabilities | | | | |
| Options written, at value (premiums received $8,461) | | | 5,448 | |
| |
| Payables and other liabilities: | | | | |
| Investments purchased | | | 30,417 | |
| Legal, auditing and other professional fees | | | 27,697 | |
| Trustees’ compensation | | | 11,853 | |
| Shareholder communications | | | 8,866 | |
| Shares of beneficial interest redeemed | | | 5,464 | |
| Distribution and service plan fees | | | 1,660 | |
| Other | | | 723 | |
| | | | |
| Total liabilities | | | 92,128 | |
| |
| Net Assets | | $ | 8,070,685 | |
| | | | |
| | | | |
| |
Composition of Net Assets | | | | |
| Par value of shares of beneficial interest | | $ | 634 | |
| |
| Additional paid-in capital | | | 7,211,641 | |
| |
| Accumulated net investment income | | | 94,746 | |
| |
| Accumulated net realized loss on investments | | | (328,053) | |
| |
| Net unrealized appreciation on investments | | | 1,091,717 | |
| | | | |
| Net Assets | | $ | 8,070,685 | |
| | | | |
| | | | |
| |
Net Asset Value Per Share | | | | |
| Non-Service Shares: | | | | |
| Net asset value, redemption price per share and offering price per share (based on net assets of $412,395 and 39,301 shares of beneficial interest outstanding) | | | $10.49 | |
| |
| Service Shares: | | | | |
| Net asset value, redemption price per share and offering price per share (based on net assets of $7,658,290 and 595,173 shares of beneficial interest outstanding) | | | $12.87 | |
See accompanying Notes to Financial Statements.
10 OPPENHEIMER EQUITY INCOME FUND/VA
STATEMENT OF OPERATIONS For the Year Ended December 31, 2016
| | | | |
| |
Investment Income | | | | |
| Dividends: | | | | |
| Unaffiliated companies (net of foreign withholding taxes of $3,496) | | $ | 272,149 | |
| Affiliated companies | | | 206 | |
| |
| Interest | | | 14,024 | |
| | | | |
| Total investment income | | | 286,379 | |
| |
Expenses | | | | |
| Management fees | | | 59,448 | |
| |
| Distribution and service plan fees - Service shares | | | 18,936 | |
| |
| Transfer and shareholder servicing agent fees: | | | | |
| Non-Service shares | | | 346 | |
| Service shares | | | 7,580 | |
| |
| Shareholder communications: | | | | |
| Non-Service shares | | | 1,958 | |
| Service shares | | | 38,869 | |
| |
| Legal, auditing and other professional fees | | | 66,853 | |
| |
| Trustees’ compensation | | | 9,060 | |
| |
| Custodian fees and expenses | | | 2,109 | |
| |
| Borrowing fees | | | 151 | |
| |
| Other | | | 5,853 | |
| | | | |
| Total expenses | | | 211,163 | |
| Less reduction to custodian expenses | | | (1) | |
| Less waivers and reimbursements of expenses | | | (128,541) | |
| | | | |
| Net expenses | | | 82,621 | |
| |
| Net Investment Income | | | 203,758 | |
| |
Realized and Unrealized Gain (Loss) | | | | |
| Net realized gain (loss) on: | | | | |
| Investment transactions in unaffiliated companies (including premiums on options exercised) | | | 5,277 | |
| Closing and expiration of option contracts written | | | 40,242 | |
| Short positions | | | (149) | |
| | | | |
| Net realized gain | | | 45,370 | |
| |
| Net change in unrealized appreciation/depreciation on: | | | | |
| Investment transactions | | | 844,001 | |
| Option contracts written | | | (1,849) | |
| | | | |
| Net change in unrealized appreciation/depreciation | | | 842,152 | |
| |
| Net Increase in Net Assets Resulting from Operations | | $ | 1,091,280 | |
| | | | |
See accompanying Notes to Financial Statements.
11 OPPENHEIMER EQUITY INCOME FUND/VA
STATEMENTS OF CHANGES IN NET ASSETS
| | | | | | | | |
| | | Year Ended
December 31, 2016 | | | Year Ended
December 31, 2015 | |
| |
Operations | | | | | | | | |
| Net investment income | | $ | 203,758 | | | $ | 257,353 | |
| |
| Net realized gain (loss) | | | 45,370 | | | | (151,710) | |
| |
| Net change in unrealized appreciation/depreciation | | | 842,152 | | | | (1,094,652) | |
| | | | |
Net increase (decrease) in net assets resulting from operations | | | 1,091,280 | | | | (989,009) | |
| |
Dividends and/or Distributions to Shareholders | | | | | | | | |
| Dividends from net investment income: | | | | | | | | |
| Non-Service shares | | | (21,464) | | | | (10,233) | |
| Service shares | | | (396,306) | | | | (287,911) | |
| | | | |
| | | (417,770) | | | | (298,144) | |
| |
| Distributions from net realized gain: | | | | | | | | |
| Non-Service shares | | | — | | | | (25,987) | |
| Service shares | | | — | | | | (746,892) | |
| | | | |
| | | — | | | | (772,879) | |
| |
Beneficial Interest Transactions | | | | | | | | |
| Net increase (decrease) in net assets resulting from beneficial interest transactions: | | | | | | | | |
| Non-Service shares | | | 54,821 | | | | 91,789 | |
| Service shares | | | (1,177,501) | | | | (1,019,497) | |
| | | | |
| | | (1,122,680) | | | | (927,708) | |
| |
Net Assets | | | | | | | | |
| Total decrease | | | (449,170) | | | | (2,987,740) | |
| |
| Beginning of period | | | 8,519,855 | | | | 11,507,595 | |
| | | | |
| End of period (including accumulated net investment income of $94,746 and $226,680, respectively) | | $ | 8,070,685 | | | $ | 8,519,855 | |
| | | | |
See accompanying Notes to Financial Statements.
12 OPPENHEIMER EQUITY INCOME FUND/VA
FINANCIAL HIGHLIGHTS
| | | | | | | | | | | | | | | | | | | | |
| Non-Service Shares | | Year Ended
December 31,
2016 | | | Year Ended
December 31,
2015 | | | Year Ended
December 31,
2014 | | | Year Ended
December 31,
2013 | | | Year Ended
December 31,
2012 | |
| |
Per Share Operating Data | | | | | | | | | | | | | | | | | | | | |
| Net asset value, beginning of period | | | $9.72 | | | | $12.09 | | | | $11.64 | | | | $9.15 | | | | $8.00 | |
| |
| Income (loss) from investment operations: | | | | | | | | | | | | | | | | | | | | |
| Net investment income1 | | | 0.26 | | | | 0.29 | | | | 0.25 | | | | 0.21 | | | | 0.16 | |
| Net realized and unrealized gain (loss) | | | 1.13 | | | | (1.28) | | | | 1.01 | | | | 2.42 | | | | 1.11 | |
| | | | |
| Total from investment operations | | | 1.39 | | | | (0.99) | | | | 1.26 | | | | 2.63 | | | | 1.27 | |
| |
| Dividends and/or distributions to shareholders: | | | | | | | | | | | | | | | | | | | | |
| Dividends from net investment income | | | (0.62) | | | | (0.39) | | | | (0.22) | | | | (0.14) | | | | (0.12) | |
| Distributions from net realized gain | | | 0.00 | | | | (0.99) | | | | (0.59) | | | | 0.00 | | | | 0.00 | |
| | | | |
| Total dividends and/or distributions to shareholders | | | (0.62) | | | | (1.38) | | | | (0.81) | | | | (0.14) | | | | (0.12) | |
| |
| Net asset value, end of period | | | $10.49 | | | | $9.72 | | | | $12.09 | | | | $11.64 | | | | $9.15 | |
| | | | |
| | | | | | | | | | | | | | | | | | | | |
| |
Total Return, at Net Asset Value2 | | | 15.31% | | | | (9.58)% | | | | 11.08% | | | | 28.93% | | | | 16.08% | |
| | | | | | | | | | | | | | | | | | | | |
| |
Ratios/Supplemental Data | | | | | | | | | | | | | | | | | | | | |
| Net assets, end of period (in thousands) | | | $413 | | | | $325 | | | | $302 | | | | $227 | | | | $154 | |
| |
| Average net assets (in thousands) | | | $346 | | | | $318 | | | | $266 | | | | $195 | | | | $132 | |
| |
| Ratios to average net assets:3 | | | | | | | | | | | | | | | | | | | | |
| Net investment income | | | 2.75% | | | | 2.64% | | | | 2.08% | | | | 2.00% | | | | 1.82% | |
| Expenses excluding specific expenses listed below | | | 2.48% | | | | 1.52% | | | | 1.42% | | | | 1.64% | | | | 1.75% | |
| Interest and fees from borrowings | | | 0.00%4 | | | | 0.00%4 | | | | 0.00% | | | | 0.00% | | | | 0.00% | |
| | | | |
| Total expenses5 | | | 2.48% | | | | 1.52% | | | | 1.42% | | | | 1.64% | | | | 1.75% | |
| Expenses after payments, waivers and/or reimbursements and reduction to custodian expenses | | | 0.80% | | | | 0.80% | | | | 0.80% | | | | 0.80% | | | | 0.80% | |
| |
| Portfolio turnover rate | | | 49% | | | | 44% | | | | 40% | | | | 159% | | | | 87% | |
1. Per share amounts calculated based on the average shares outstanding during the period.
2. Assumes an initial investment on the business day before the first day of the fiscal period, with all dividends and distributions reinvested in additional shares on the reinvestment date, and redemption at the net asset value calculated on the last business day of the fiscal period. Total returns are not annualized for periods less than one full year. Total return information does not reflect expenses that apply at the separate account level or to related insurance products. Inclusion of these charges would reduce the total return figures for all periods shown. Returns do not reflect the deduction of taxes that a shareholder would pay on fund distributions or the redemption of fund shares.
3. Annualized for periods less than one full year.
4. Less than 0.005%.
5. Total expenses including indirect expenses from affiliated fund fees and expenses were as follows:
| | | | |
Year Ended December 31, 2016 | | | 2.48 | % |
Year Ended December 31, 2015 | | | 1.52 | % |
Year Ended December 31, 2014 | | | 1.42 | % |
Year Ended December 31, 2013 | | | 1.64 | % |
Year Ended December 31, 2012 | | | 1.75 | % |
See accompanying Notes to Financial Statements.
13 OPPENHEIMER EQUITY INCOME FUND/VA
FINANCIAL HIGHLIGHTS Continued
| | | | | | | | | | | | | | | | | | | | |
| Service Shares | | Year Ended
December 31,
2016 | | | Year Ended
December 31,
2015 | | | Year Ended
December 31,
2014 | | | Year Ended
December 31,
2013 | | | Year Ended
December 31,
2012 | |
| |
Per Share Operating Data | | | | | | | | | | | | | | | | | | | | |
| Net asset value, beginning of period | | | $11.81 | | | | $14.43 | | | | $13.78 | | | | $10.83 | | | | $9.69 | |
| |
| Income (loss) from investment operations: | | | | | | | | | | | | | | | | | | | | |
| Net investment income1 | | | 0.30 | | | | 0.33 | | | | 0.26 | | | | 0.22 | | | | 0.13 | |
| Net realized and unrealized gain (loss) | | | 1.39 | | | | (1.58) | | | | 1.19 | | | | 2.87 | | | | 1.13 | |
| | | | |
| Total from investment operations | | | 1.69 | | | | (1.25) | | | | 1.45 | | | | 3.09 | | | | 1.26 | |
| |
| Dividends and/or distributions to shareholders: | | | | | | | | | | | | | | | | | | | | |
| Dividends from net investment income | | | (0.63) | | | | (0.38) | | | | (0.21) | | | | (0.14) | | | | (0.12) | |
| Distributions from net realized gain | | | 0.00 | | | | (0.99) | | | | (0.59) | | | | 0.00 | | | | 0.00 | |
| | | | |
| Total dividends and/or distributions to shareholders | | | (0.63) | | | | (1.37) | | | | (0.80) | | | | (0.14) | | | | (0.12) | |
| |
| Net asset value, end of period | | | $12.87 | | | | $11.81 | | | | $14.43 | | | | $13.78 | | | | $10.83 | |
| | | | |
| | | | | | | | | | | | | | | | | | | | |
| |
Total Return, at Net Asset Value2 | | | 15.13% | | | | (9.82)% | | | | 10.73% | | | | 28.70% | | | | 13.09% | |
| | | | | | | | | | | | | | | | | | | | |
| |
Ratios/Supplemental Data | | | | | | | | | | | | | | | | | | | | |
| Net assets, end of period (in thousands) | | | $7,658 | | | | $8,195 | | | | $11,206 | | | | $10,862 | | | | $6,897 | |
| |
| Average net assets (in thousands) | | | $7,576 | | | | $10,265 | | | | $11,020 | | | | $8,549 | | | | $7,095 | |
| |
| Ratios to average net assets:3 | | | | | | | | | | | | | | | | | | | | |
| Net investment income | | | 2.56% | | | | 2.43% | | | | 1.82% | | | | 1.78% | | | | 1.26% | |
| Expenses excluding specific expenses listed below | | | 2.67% | | | | 1.76% | | | | 1.67% | | | | 1.89% | | | | 1.93% | |
| Interest and fees from borrowings | | | 0.00%4 | | | | 0.00%4 | | | | 0.00% | | | | 0.00% | | | | 0.00% | |
| | | | |
| Total expenses5 | | | 2.67% | | | | 1.76% | | | | 1.67% | | | | 1.89% | | | | 1.93% | |
| Expenses after payments, waivers and/or reimbursements and reduction to custodian expenses | | | 1.05% | | | | 1.05% | | | | 1.05% | | | | 1.05% | | | | 1.04% | |
| |
| Portfolio turnover rate | | | 49% | | | | 44% | | | | 40% | | | | 159% | | | | 87% | |
1. Per share amounts calculated based on the average shares outstanding during the period.
2. Assumes an initial investment on the business day before the first day of the fiscal period, with all dividends and distributions reinvested in additional shares on the reinvestment date, and redemption at the net asset value calculated on the last business day of the fiscal period. Total returns are not annualized for periods less than one full year. Total return information does not reflect expenses that apply at the separate account level or to related insurance products. Inclusion of these charges would reduce the total return figures for all periods shown. Returns do not reflect the deduction of taxes that a shareholder would pay on fund distributions or the redemption of fund shares.
3. Annualized for periods less than one full year.
4. Less than 0.005%.
5. Total expenses including indirect expenses from affiliated fund fees and expenses were as follows:
| | | | |
Year Ended December 31, 2016 | | | 2.67 | % |
Year Ended December 31, 2015 | | | 1.76 | % |
Year Ended December 31, 2014 | | | 1.67 | % |
Year Ended December 31, 2013 | | | 1.89 | % |
Year Ended December 31, 2012 | | | 1.93 | % |
See accompanying Notes to Financial Statements.
14 OPPENHEIMER EQUITY INCOME FUND/VA
NOTES TO FINANCIAL STATEMENTS December 31, 2016
1. Organization
Oppenheimer Equity Income Fund/VA (the “Fund”), a separate series of Oppenheimer Variable Account Funds, is a diversified open-end management investment company registered under the Investment Company Act of 1940 (“1940 Act”), as amended. The Fund’s investment objective is to seek total return. The Fund’s investment adviser is OFI Global Asset Management, Inc. (“OFI Global” or the “Manager”), a wholly-owned subsidiary of OppenheimerFunds, Inc. (“OFI” or the “Sub-Adviser”). The Manager has entered into a sub-advisory agreement with OFI. Shares of the Fund are sold only to separate accounts of life insurance companies.
The Fund offers two classes of shares. Both classes are sold at their offering price, which is the net asset value per share, to separate investment accounts of participating insurance companies as an underlying investment for variable life insurance policies, variable annuity contracts or other investment products. The class of shares designated as Service shares is subject to a distribution and service plan. Both classes of shares have identical rights and voting privileges with respect to the Fund in general and exclusive voting rights on matters that affect that class alone. Earnings, net assets and net asset value per share may differ due to each class having its own expenses, such as transfer and shareholder servicing agent fees and shareholder communications, directly attributable to that class.
The following is a summary of significant accounting policies followed in the Fund’s preparation of financial statements in accordance with accounting principles generally accepted in the United States (“U.S. GAAP”).
2. Significant Accounting Policies
Security Valuation. All investments in securities are recorded at their estimated fair value, as described in Note 3.
Allocation of Income, Expenses, Gains and Losses. Income, expenses (other than those attributable to a specific class), gains and losses are allocated on a daily basis to each class of shares based upon the relative proportion of net assets represented by such class. Operating expenses directly attributable to a specific class are charged against the operations of that class.
Dividends and Distributions to Shareholders. Dividends and distributions to shareholders, which are determined in accordance with income tax regulations and may differ from U.S. GAAP, are recorded on the ex-dividend date. Income and capital gain distributions, if any, are declared and paid annually or at other times as deemed necessary by the Manager.
Investment Income. Dividend income is recorded on the ex-dividend date or upon ex-dividend notification in the case of certain foreign dividends where the ex-dividend date may have passed. Non-cash dividends included in dividend income, if any, are recorded at the fair market value of the securities received. Interest income is recognized on an accrual basis. Discount and premium, which are included in interest income on the Statement of Operations, are amortized or accreted daily.
Return of Capital Estimates. Distributions received from the Fund’s investments in Master Limited Partnerships (MLPs) and Real Estate Investments Trusts (REITs), generally are comprised of income and return of capital. The Fund records investment income and return of capital based on estimates. Such estimates are based on historical information available from each MLP, REIT and other industry sources. These estimates may subsequently be revised based on information received from MLPs and REITs after their tax reporting periods are concluded.
Custodian Fees. “Custodian fees and expenses” in the Statement of Operations may include interest expense incurred by the Fund on any cash overdrafts of its custodian account during the period. Such cash overdrafts may result from the effects of failed trades in portfolio securities and from cash outflows resulting from unanticipated shareholder redemption activity. The Fund pays interest to its custodian on such cash overdrafts, to the extent they are not offset by positive cash balances maintained by the Fund, at a rate equal to the Federal Funds Rate plus 0.50%. This rate will increase to 2.00% effective January 1, 2017. The “Reduction to custodian expenses” line item, if applicable, represents earnings on cash balances maintained by the Fund during the period. Such interest expense and other custodian fees may be paid with these earnings.
Security Transactions. Security transactions are recorded on the trade date. Realized gains and losses on securities sold are determined on the basis of identified cost.
Indemnifications. The Fund’s organizational documents provide current and former Trustees and officers with a limited indemnification against liabilities arising in connection with the performance of their duties to the Fund. In the normal course of business, the Fund may also enter into contracts that provide general indemnifications. The Fund’s maximum exposure under these arrangements is unknown as this would be dependent on future claims that may be made against the Fund. The risk of material loss from such claims is considered remote.
Federal Taxes. The Fund intends to comply with provisions of the Internal Revenue Code applicable to regulated investment companies and to distribute substantially all of its investment company taxable income, including any net realized gain on investments not offset by capital loss carryforwards, if any, to shareholders. Therefore, no federal income or excise tax provision is required. The Fund files income tax returns in U.S. federal and applicable state jurisdictions. The statute of limitations on the Fund’s tax return filings generally remains open for the three preceding fiscal reporting period ends. The Fund has analyzed its tax positions for the fiscal year ended December 31, 2016, including open tax years, and does not believe there are any uncertain tax positions requiring recognition in the Fund’s financial statements.
15 OPPENHEIMER EQUITY INCOME FUND/VA
NOTES TO FINANCIAL STATEMENTS Continued
2. Significant Accounting Policies (Continued)
The tax components of capital shown in the following table represent distribution requirements the Fund must satisfy under the income tax regulations, losses the Fund may be able to offset against income and gains realized in future years and unrealized appreciation or depreciation of securities and other investments for federal income tax purposes.
| | | | | | | | | | | | |
Undistributed Net Investment Income | | Undistributed Long-Term Gain | | | Accumulated Loss
Carryforward1,2,3 | | | Net Unrealized
Appreciation
Based on cost of
Securities and
Other Investments
for Federal Income
Tax Purposes | |
| |
| $110,075 | | | $— | | | | $206,795 | | | | $966,981 | |
1. At period end, the Fund had $206,795 of net capital loss carryforward available to offset future realized capital gains, if any, and thereby reduce future taxable gain distributions. Details of the capital loss carryforwards are included in the table below. Capital loss carryovers with no expiration, if any, must be utilized prior to those with expiration dates.
| | | | |
| Expiring | | | |
| |
| No expiration | | $ | 206,795 | |
2. During the reporting period, the Fund did not utilize any capital loss carryforward.
3. During the previous reporting period, the Fund did not utilize any capital loss carryforward.
Net investment income (loss) and net realized gain (loss) may differ for financial statement and tax purposes. The character of dividends and distributions made during the fiscal year from net investment income or net realized gains are determined in accordance with federal income tax requirements, which may differ from the character of net investment income or net realized gains presented in those financial statements in accordance with U.S. GAAP. Also, due to timing of dividends and distributions, the fiscal year in which amounts are distributed may differ from the fiscal year in which the income or net realized gain was recorded by the Fund.
Accordingly, the following amounts have been reclassified for the reporting period. Net assets of the Fund were unaffected by the reclassifications.
| | |
Increase to Accumulated Net Investment Income | | Increase to Accumulated Net
Realized Loss on Investments |
|
$82,078 | | $82,078 |
The tax character of distributions paid during the reporting periods:
| | | | | | | | |
| | | Year Ended
December 31, 2016 | | | Year Ended
December 31, 2015 | |
| |
Distributions paid from: | | | | | | | | |
Ordinary income | | $ | 417,770 | | | $ | 636,899 | |
Long-term capital gain | | | — | | | | 434,124 | |
| | | | |
Total | | $ | 417,770 | | | $ | 1,071,023 | |
| | | | |
The aggregate cost of securities and other investments and the composition of unrealized appreciation and depreciation of securities and other investments for federal income tax purposes at period end are noted in the following table. The primary difference between book and tax appreciation or depreciation of securities and other investments, if applicable, is attributable to the tax deferral of losses or tax realization of financial statement unrealized gain or loss.
| | |
| Federal tax cost of securities | | $ 7,117,663 |
| Federal tax cost of other investments | | (8,461) |
| | |
| Total federal tax cost | | $ 7,109,202 |
| | |
| Gross unrealized appreciation | | $ 1,264,912 |
| Gross unrealized depreciation | | (297,931) |
| | |
| Net unrealized appreciation | | $ 966,981 |
| | |
Use of Estimates. The preparation of financial statements in conformity with U.S. GAAP requires management to make estimates and assumptions that affect the reported amounts of assets and liabilities and disclosure of contingent assets and liabilities at the date of the financial statements and the reported amounts of increases and decreases in net assets from operations during the reporting period. Actual results could differ from those estimates.
3. Securities Valuation
The Fund calculates the net asset value of its shares as of 4:00 P.M. Eastern time, on each day the New York Stock Exchange (the “Exchange”) is open for trading, except in the case of a scheduled early closing of the Exchange, in which case the Fund will calculate net asset value of the shares as of the scheduled early closing time of the Exchange.
The Fund’s Board has adopted procedures for the valuation of the Fund’s securities and has delegated the day-to-day responsibility for valuation
16 OPPENHEIMER EQUITY INCOME FUND/VA
3. Securities Valuation (Continued)
determinations under those procedures to the Manager. The Manager has established a Valuation Committee which is responsible for determining a “fair valuation” for any security for which market quotations are not “readily available.” The Valuation Committee’s fair valuation determinations are subject to review, approval and ratification by the Fund’s Board at its next regularly scheduled meeting covering the calendar quarter in which the fair valuation was determined.
Valuation Methods and Inputs
Securities are valued using unadjusted quoted market prices, when available, as supplied primarily by third party pricing services or dealers.
The following methodologies are used to determine the market value or the fair value of the types of securities described below:
Equity securities traded on a securities exchange (including exchange-traded derivatives other than futures and futures options) are valued based on the official closing price on the principal exchange on which the security is traded, as identified by the Manager, prior to the time when the Fund’s assets are valued. If the official closing price is unavailable, the security is valued at the last sale price on the principal exchange on which it is traded. If the official closing price or last sales price for a foreign security is not available, the security is valued at the mean between the bid and asked price per the exchange or, if not available from the exchange, obtained from two dealers. If bid and asked prices are not available from either the exchange or two dealers, the security is valued by using one of the following methodologies (listed in order of priority): (1) a bid from the exchange, (2) the mean between the bid and asked price as provided by a single dealer, or (3) a bid from a single dealer.
Shares of a registered investment company that are not traded on an exchange are valued at that investment company’s net asset value per share.
Corporate and government debt securities (of U.S. or foreign issuers) and municipal debt securities, event-linked bonds, loans, mortgage-backed securities, collateralized mortgage obligations, and asset-backed securities are valued at the mean between the “bid” and “asked” prices utilizing evaluated prices obtained from third party pricing services or broker-dealers who may use matrix pricing methods to determine the evaluated prices.
Short-term money market type debt securities are valued at the mean between the “bid” and “asked” prices utilizing evaluated prices obtained from third party pricing services or broker-dealers.
Structured securities, swaps, swaptions, and other over-the-counter derivatives are valued utilizing evaluated prices obtained from third party pricing services or broker-dealers.
A description of the standard inputs that may generally be considered by the third party pricing vendors in determining their evaluated prices is provided below.
| | |
| Security Type | | Standard inputs generally considered by third-party pricing vendors |
|
| Corporate debt, government debt, municipal, mortgage- backed and asset-backed securities | | Reported trade data, broker-dealer price quotations, benchmark yields, issuer spreads on comparable securities, the credit quality, yield, maturity, and other appropriate factors. |
|
| Loans | | Information obtained from market participants regarding reported trade data and broker-dealer price quotations. |
|
| Event-linked bonds | | Information obtained from market participants regarding reported trade data and broker-dealer price quotations. |
|
| Structured securities | | Relevant market information such as the price of underlying financial instruments, stock market indices, foreign currencies, interest rate spreads, commodities, or the occurrence of other specific events. |
|
| Swaps | | Relevant market information, including underlying reference assets such as credit spreads, credit event probabilities, index values, individual security values, forward interest rates, variable interest rates, volatility measures, and forward currency rates. |
If a market value or price cannot be determined for a security using the methodologies described above, or if, in the “good faith” opinion of the Manager, the market value or price obtained does not constitute a “readily available market quotation,” or a significant event has occurred that would materially affect the value of the security, the security is fair valued either (i) by a standardized fair valuation methodology applicable to the security type or the significant event as previously approved by the Valuation Committee and the Fund’s Board or (ii) as determined in good faith by the Manager’s Valuation Committee. The Valuation Committee considers all relevant facts that are reasonably available, through either public information or information available to the Manager, when determining the fair value of a security. Fair value determinations by the Manager are subject to review, approval and ratification by the Fund’s Board at its next regularly scheduled meeting covering the calendar quarter in which the fair valuation was determined. Those fair valuation standardized methodologies include, but are not limited to, valuing securities at the last sale price or initially at cost and subsequently adjusting the value based on: changes in company specific fundamentals, changes in an appropriate securities index, or changes in the value of similar securities which may be further adjusted for any discounts related to security-specific resale restrictions. When possible, such methodologies use observable market inputs such as unadjusted quoted prices of similar securities, observable interest rates, currency rates and yield curves. The methodologies used for valuing securities are not necessarily an indication of the risks associated with investing in those securities nor can it be assured that the Fund can obtain the fair value assigned to a security if it were to sell the security.
To assess the continuing appropriateness of security valuations, the Manager, or its third party service provider who is subject to oversight by the Manager, regularly compares prior day prices, prices on comparable securities, and sale prices to the current day prices and challenges those prices exceeding certain tolerance levels with the third party pricing service or broker source. For those securities valued by fair valuations, whether through a standardized fair valuation methodology or a fair valuation determination, the Valuation Committee reviews and affirms the reasonableness of the
17 OPPENHEIMER EQUITY INCOME FUND/VA
NOTES TO FINANCIAL STATEMENTS Continued
3. Securities Valuation (Continued)
valuations based on such methodologies and fair valuation determinations on a regular basis after considering all relevant information that is reasonably available.
Classifications
Each investment asset or liability of the Fund is assigned a level at measurement date based on the significance and source of the inputs to its valuation. Various data inputs are used in determining the value of each of the Fund’s investments as of the reporting period end. These data inputs are categorized in the following hierarchy under applicable financial accounting standards:
1) Level 1-unadjusted quoted prices in active markets for identical assets or liabilities (including securities actively traded on a securities exchange)
2) Level 2-inputs other than unadjusted quoted prices that are observable for the asset or liability (such as unadjusted quoted prices for similar assets and market corroborated inputs such as interest rates, prepayment speeds, credit risks, etc.)
3) Level 3-significant unobservable inputs (including the Manager’s own judgments about assumptions that market participants would use in pricing the asset or liability).
The inputs used for valuing securities are not necessarily an indication of the risks associated with investing in those securities.
The table below categorizes amounts that are included in the Fund’s Statement of Assets and Liabilities at period end based on valuation input level:
| | | | | | | | | | | | | | |
| | | Level 1— Unadjusted
Quoted Prices | | | Level 2— Other Significant
Observable Inputs | | | Level 3—
Significant
Unobservable
Inputs | | | Value |
|
| Assets Table | | | | | | | | | | | | | | |
| Investments, at Value: | | | | | | | | | | | | | | |
| Common Stocks | | | | | | | | | | | | | | |
Consumer Discretionary | | $ | 632,403 | | | $ | — | | | $ | — | | | $ 632,403 |
Consumer Staples | | | 612,008 | | | | — | | | | — | | | 612,008 |
Energy | | | 858,105 | | | | — | | | | — | | | 858,105 |
Financials | | | 2,503,318 | | | | — | | | | — | | | 2,503,318 |
Health Care | | | 751,663 | | | | — | | | | — | | | 751,663 |
Industrials | | | 427,573 | | | | — | | | | — | | | 427,573 |
Information Technology | | | 859,343 | | | | — | | | | — | | | 859,343 |
Materials | | | 143,784 | | | | — | | | | — | | | 143,784 |
Telecommunication Services | | | 276,848 | | | | — | | | | — | | | 276,848 |
Utilities | | | 247,412 | | | | — | | | | — | | | 247,412 |
| Preferred Stocks | | | 500,950 | | | | 122,526 | | | | — | | | 623,476 |
| Non-Convertible Corporate Bond and Note | | | — | | | | 1,036 | | | | — | | | 1,036 |
| Convertible Corporate Bonds and Notes | | | — | | | | 47,669 | | | | — | | | 47,669 |
| Structured Securities | | | — | | | | 96,653 | | | | — | | | 96,653 |
| Exchange-Traded Options Purchased | | | 340 | | | | — | | | | — | | | 340 |
| | | |
| Total Assets | | $ | 7,813,747 | | | $ | 267,884 | | | $ | — | | | $ 8,081,631 |
| | | |
| | | | |
| Liabilities Table | | | | | | | | | | | | | | |
| Other Financial Instruments: | | | | | | | | | | | | | | |
| Options written, at value | | $ | (5,448) | | | $ | — | | | $ | — | | | $ (5,448) |
| | | |
| Total Liabilities | | $ | (5,448) | | | $ | — | | | $ | — | | | $ (5,448) |
| | | |
Forward currency exchange contracts and futures contracts, if any, are reported at their unrealized appreciation/depreciation at measurement date, which represents the change in the contract’s value from trade date. All additional assets and liabilities included in the above table are reported at their market value at measurement date.
4. Investments and Risks
Investments in Affiliated Funds. The Fund is permitted to invest in other mutual funds advised by the Manager (“Affiliated Funds”). Affiliated Funds are open-end management investment companies registered under the 1940 Act, as amended. The Manager is the investment adviser of, and the Sub-Adviser provides investment and related advisory services to, the Affiliated Funds. When applicable, the Fund’s investments in Affiliated Funds are included in the Statement of Investments. Shares of Affiliated Funds are valued at their net asset value per share. As a shareholder, the Fund is subject to its proportional share of the Affiliated Funds’ expenses, including their management fee. The Manager will waive fees and/or reimburse Fund expenses in an amount equal to the indirect management fees incurred through the Fund’s investment in the Affiliated Funds.
Each of the Affiliated Funds in which the Fund invests has its own investment risks, and those risks can affect the value of the Fund’s investments and therefore the value of the Fund’s shares. To the extent that the Fund invests more of its assets in one Affiliated Fund than in another, the Fund will have greater exposure to the risks of that Affiliated Fund.
Investments in Money Market Instruments. The Fund is permitted to invest its free cash balances in money market instruments to provide liquidity or for defensive purposes. The Fund may invest in money market instruments by investing in Class E shares of Oppenheimer Institutional Government
18 OPPENHEIMER EQUITY INCOME FUND/VA
4. Investments and Risks (Continued)
Money Market Fund (“IGMMF”), formerly known as Oppenheimer Institutional Money Market Fund, which is an Affiliated Fund. IGMMF is regulated as a money market fund under the 1940 Act, as amended. The Fund may also invest in money market instruments directly or in other affiliated or unaffiliated money market funds. At period end, the Fund had no holdings in IGMMF.
Master Limited Partnerships (“MLPs”). MLPs issue common units that represent an equity ownership interest in a partnership and provide limited voting rights. MLP common units are registered with the Securities and Exchange Commission (“SEC”), and are freely tradable on securities exchanges such as the NYSE and the NASDAQ Stock Market (“NASDAQ”), or in the over-the-counter (“OTC”) market. An MLP consists of one or more general partners, who conduct the business, and one or more limited partners, who contribute capital. MLP common unit holders have a limited role in the partnership’s operations and management. The Fund, as a limited partner, normally would not be liable for the debts of the MLP beyond the amounts the Fund has contributed, but would not be shielded to the same extent that a shareholder of a corporation would be. In certain circumstances creditors of an MLP would have the right to seek return of capital distributed to a limited partner. This right of an MLP’s creditors would continue after the Fund sold its investment in the MLP.
Structured Securities. The Fund invests in structured securities whose market values, interest rates and/or redemption prices are linked to the performance of underlying foreign currencies, interest rate spreads, stock market indices, prices of individual securities, commodities or other financial instruments or the occurrence of other specific events. The structured securities are often leveraged, increasing the volatility of each note’s market value relative to the change in the underlying linked financial element or event. Fluctuations in value of these securities are recorded as unrealized gains and losses in the accompanying Statement of Operations. The Fund records a realized gain or loss when a structured security is sold or matures.
Equity Security Risk. Stocks and other equity securities fluctuate in price. The value of the Fund’s portfolio may be affected by changes in the equity markets generally. Equity markets may experience significant short-term volatility and may fall sharply at times. Different markets may behave differently from each other and U.S. equity markets may move in the opposite direction from one or more foreign stock markets. Adverse events in any part of the equity or fixed-income markets may have unexpected negative effects on other market segments.
The prices of individual equity securities generally do not all move in the same direction at the same time and a variety of factors can affect the price of a particular company’s securities. These factors may include, but are not limited to, poor earnings reports, a loss of customers, litigation against the company, general unfavorable performance of the company’s sector or industry, or changes in government regulations affecting the company or its industry.
Shareholder Concentration. At period end, two shareholders each owned 20% or more of the Fund’s total outstanding shares.
5. Market Risk Factors
The Fund’s investments in securities and/or financial derivatives may expose the Fund to various market risk factors:
Commodity Risk. Commodity risk relates to the change in value of commodities or commodity indexes as they relate to increases or decreases in the commodities market. Commodities are physical assets that have tangible properties. Examples of these types of assets are crude oil, heating oil, metals, livestock, and agricultural products.
Credit Risk. Credit risk relates to the ability of the issuer of debt to meet interest and principal payments, or both, as they come due. In general, lower-grade, higher-yield debt securities are subject to credit risk to a greater extent than lower-yield, higher-quality securities.
Equity Risk. Equity risk relates to the change in value of equity securities as they relate to increases or decreases in the general market.
Foreign Exchange Rate Risk. Foreign exchange rate risk relates to the change in the U.S. dollar value of a security held that is denominated in a foreign currency. The U.S. dollar value of a foreign currency denominated security will decrease as the dollar appreciates against the currency, while the U.S. dollar value will increase as the dollar depreciates against the currency.
Interest Rate Risk. Interest rate risk refers to the fluctuations in value of fixed-income securities resulting from the inverse relationship between price and yield. For example, an increase in general interest rates will tend to reduce the market value of already issued fixed-income investments, and a decline in general interest rates will tend to increase their value. In addition, debt securities with longer maturities, which tend to have higher yields, are subject to potentially greater fluctuations in value from changes in interest rates than obligations with shorter maturities.
Volatility Risk. Volatility risk refers to the magnitude of the movement, but not the direction of the movement, in a financial instrument’s price over a defined time period. Large increases or decreases in a financial instrument’s price over a relative time period typically indicate greater volatility risk, while small increases or decreases in its price typically indicate lower volatility risk.
6. Use of Derivatives
The Fund’s investment objective not only permits the Fund to purchase investment securities, it also allows the Fund to enter into various types of derivatives contracts, including, but not limited to, futures contracts, forward currency exchange contracts, credit default swaps, interest rate swaps, total return swaps, variance swaps and purchased and written options. In doing so, the Fund will employ strategies in differing combinations to permit it to increase, decrease, or change the level or types of exposure to market risk factors. These instruments may allow the Fund to pursue its objectives more quickly and efficiently than if it were to make direct purchases or sales of securities capable of effecting a similar response to market factors. Such contracts may be entered into through a bilateral over-the-counter (“OTC”) transaction, or through a securities or futures exchange and cleared through
19 OPPENHEIMER EQUITY INCOME FUND/VA
NOTES TO FINANCIAL STATEMENTS Continued
6. Use of Derivatives (Continued)
a clearinghouse.
Derivatives may have little or no initial cash investment relative to their market value exposure and therefore can produce significant gains or losses in excess of their cost due to unanticipated changes in the market risk factors and the overall market. This use of embedded leverage allows the Fund to increase its market value exposure relative to its net assets and can substantially increase the volatility of the Fund’s performance. In instances where the Fund is using derivatives to decrease, or hedge, exposures to market risk factors for securities held by the Fund, there are also risks that those derivatives may not perform as expected resulting in losses for the combined or hedged positions. Some derivatives have the potential for unlimited loss, regardless of the size of the Fund’s initial investment.
Additional associated risks from investing in derivatives also exist and potentially could have significant effects on the valuation of the derivative and the Fund. Typically, the associated risks are not the risks that the Fund is attempting to increase or decrease exposure to, per its investment objectives, but are the additional risks from investing in derivatives. Examples of these associated risks are liquidity risk, which is the risk that the Fund will not be able to sell the derivative in the open market in a timely manner, and counterparty credit risk, which is the risk that the counterparty will not fulfill its obligation to the Fund.
The Fund’s actual exposures to these market risk factors and associated risks during the period are discussed in further detail, by derivative type, below.
Option Activity
The Fund may buy and sell put and call options, or write put and call options. When an option is written, the Fund receives a premium and becomes obligated to sell or purchase the underlying security, currency or other underlying financial instrument at a fixed price, upon exercise of the option.
Options can be traded through an exchange or through a privately negotiated arrangement with a dealer in an OTC transaction. Options traded through an exchange are generally cleared through a clearinghouse (such as The Options Clearing Corporation). The difference between the premium received or paid, and market value of the option, is recorded as unrealized appreciation or depreciation. The net change in unrealized appreciation or depreciation is reported in the Statement of Operations. When an option is exercised, the cost of the security purchased or the proceeds of the security sale are adjusted by the amount of premium received or paid. Upon the expiration or closing of the option transaction, a gain or loss is reported in the Statement of Operations.
The Fund has purchased put options on individual equity securities and/or equity indexes to decrease exposure to equity risk. A purchased put option becomes more valuable as the price of the underlying financial instrument depreciates relative to the strike price.
During the reporting period, the Fund had an ending monthly average market value of $111 on purchased put options.
Options written, if any, are reported in a schedule following the Statement of Investments and as a liability in the Statement of Assets and Liabilities. Securities held in collateral accounts to cover potential obligations with respect to outstanding written options are noted in the Statement of Investments.
The risk in writing a call option is that the market price of the security increases and if the option is exercised, the Fund must either purchase the security at a higher price for delivery or, if the Fund owns the underlying security, give up the opportunity for profit. The risk in writing a put option is that the Fund may incur a loss if the market price of the security decreases and the option is exercised. The risk in buying an option is that the Fund pays a premium whether or not the option is exercised. The Fund also has the additional risk that there may be an illiquid market where the Fund is unable to close the contract.
The Fund has written put options on individual equity securities and/or equity indexes to increase exposure to equity risk. A written put option becomes more valuable as the price of the underlying financial instrument appreciates relative to the strike price.
The Fund has written call options on individual equity securities and/or equity indexes to decrease exposure to equity risk. A written call option becomes more valuable as the price of the underlying financial instrument depreciates relative to the strike price.
During the reporting period, the Fund had an ending monthly average market value of $6,279 and $867 on written call options and written put options, respectively.
Additional associated risks to the Fund include counterparty credit risk and liquidity risk.
Written option activity for the reporting period was as follows:
| | | | | | | | |
| | | Number of | | | Amount of | |
| | | Contracts | | | Premiums | |
| |
| Options outstanding as of December 31, 2015 | | | 49 | | | $ | 9,487 | |
| Options written | | | 1,095 | | | | 94,722 | |
| Options closed or expired | | | (548) | | | | (40,242) | |
| Options exercised | | | (507) | | | | (55,506) | |
| | | | |
| Options outstanding as of December 31, 2016 | | | 89 | | | $ | 8,461 | |
| | | | |
Counterparty Credit Risk. Derivative positions are subject to the risk that the counterparty will not fulfill its obligation to the Fund. The Fund intends to enter into derivative transactions with counterparties that the Manager believes to be creditworthy at the time of the transaction.
For financial reporting purposes, the Fund does not offset derivative assets and derivative liabilities that are subject to netting arrangements in the Statement of Assets and Liabilities. Bankruptcy or insolvency laws of a particular jurisdiction may impose restrictions on or prohibitions against the right of offset in bankruptcy, insolvency or other events.
20 OPPENHEIMER EQUITY INCOME FUND/VA
6. Use of Derivatives (Continued)
The Fund’s risk of loss from counterparty credit risk on exchange-traded derivatives cleared through a clearinghouse and for centrally cleared swaps is generally considered lower than as compared to OTC derivatives. However, counterparty credit risk exists with respect to initial and variation margin deposited/paid by the Fund that is held in futures commission merchant, broker and/or clearinghouse accounts for such exchange-traded derivatives and for centrally cleared swaps.
With respect to centrally cleared swaps, such transactions will be submitted for clearing, and if cleared, will be held in accounts at futures commission merchants or brokers that are members of clearinghouses. While brokers, futures commission merchants and clearinghouses are required to segregate customer margin from their own assets, in the event that a broker, futures commission merchant or clearinghouse becomes insolvent or goes into bankruptcy and at that time there is a shortfall in the aggregate amount of margin held by the broker, futures commission merchant or clearinghouse for all its customers, U.S. bankruptcy laws will typically allocate that shortfall on a pro-rata basis across all the broker’s, futures commission merchant’s or clearinghouse’s customers, potentially resulting in losses to the Fund.
There is the risk that a broker, futures commission merchant or clearinghouse will decline to clear a transaction on the Fund’s behalf, and the Fund may be required to pay a termination fee to the executing broker with whom the Fund initially enters into the transaction. Clearinghouses may also be permitted to terminate centrally cleared swaps at any time. The Fund is also subject to the risk that the broker or futures commission merchant will improperly use the Fund’s assets deposited/paid as initial or variation margin to satisfy payment obligations of another customer. In the event of a default by another customer of the broker or futures commission merchant, the Fund might not receive its variation margin payments from the clearinghouse, due to the manner in which variation margin payments are aggregated for all customers of the broker/futures commission merchant.
Collateral and margin requirements differ by type of derivative. Margin requirements are established by the broker, futures commission merchant or clearinghouse for exchange-traded and cleared derivatives, including centrally cleared swaps. Brokers, futures commission merchants and clearinghouses can ask for margin in excess of the regulatory minimum, or increase the margin amount, in certain circumstances.
For financial reporting purposes, cash collateral that has been pledged to cover obligations of the Fund, if any, is reported separately on the Statement of Assets and Liabilities as cash pledged as collateral. Non-cash collateral pledged by the Fund, if any, is noted in the Statement of Investments. Generally, the amount of collateral due from or to a party must exceed a minimum transfer amount threshold (e.g. $250,000) before a transfer has to be made. To the extent amounts due to the Fund from its counterparties are not fully collateralized, contractually or otherwise, the Fund bears the risk of loss from counterparty nonperformance.
The following table presents the valuations of derivative instruments by risk exposure as reported within the Statement of Assets and Liabilities at period end:
| | | | | | | | | | | | | | |
| | | Asset Derivatives | | | Liability Derivatives | | | | | |
| | | | | | | |
Derivatives Not Accounted for as Hedging Instruments | | Statement of Assets
and Liabilities Location | | Value | | | Statement of Assets
and Liabilities Location | | Value | | |
| | |
| Equity contracts | | Investments, at value | | $ | 340* | | | Options written, at value | | $ | 5,448 | | |
*Amounts relate to purchased option contracts and purchased swaption contracts, if any.
The effect of derivative instruments on the Statement of Operations is as follows:
| | | | | | | | | | | | |
Amount of Realized Gain or (Loss) Recognized on Derivatives | |
Derivatives Not Accounted for as Hedging Instruments | | Investment
from
unaffiliated companies (including
premiums on options
exercised)* | | | Closing and
expiration of option
contracts written | | | Total | |
| |
| Equity contracts | | $ | 6,335 | | | $ | 40,242 | | | $ | 46,577 | |
*Includes purchased option contracts and purchased swaption contracts, if any.
| | | | | | | | | | | | |
Amount of Change in Unrealized Gain or (Loss) Recognized on Derivatives | |
Derivatives Not Accounted for as Hedging Instruments | | Investments* | | | Option contracts written | | | Total | |
| |
| Equity contracts | | $ | 1,072 | | | $ | (1,849) | | | $ | (777) | |
*Includes purchased option contracts and purchased swaption contracts, if any.
7. Shares of Beneficial Interest
The Fund has authorized an unlimited number of $0.001 par value shares of beneficial interest of each class. Transactions in shares of beneficial interest
21 OPPENHEIMER EQUITY INCOME FUND/VA
NOTES TO FINANCIAL STATEMENTS Continued
7. Shares of Beneficial Interest (Continued)
were as follows:
| | | | | | | | | | | | | | | | |
| | | Year Ended December 31, 2016 | | | Year Ended December 31, 2015 | |
| | | Shares | | | Amount | | | Shares | | | Amount | |
| |
| Non-Service Shares | | | | | | | | | | | | | | | | |
| Sold | | | 7,879 | | | $ | 75,176 | | | | 6,593 | | | $ | 71,817 | |
| Dividends and/or distributions reinvested | | | 2,351 | | | | 21,464 | | | | 3,275 | | | | 36,220 | |
| Redeemed | | | (4,349 | ) | | | (41,819 | ) | | | (1,387 | ) | | | (16,248) | |
| | | | |
| Net increase | | | 5,881 | | | $ | 54,821 | | | | 8,481 | | | $ | 91,789 | |
| | | | |
|
| |
| Service Shares | | | | | | | | | | | | | | | | |
| Sold | | | 17,226 | | | $ | 196,973 | | | | 73,064 | | | $ | 1,015,107 | |
| Dividends and/or distributions reinvested | | | 35,353 | | | | 396,306 | | | | 76,880 | | | | 1,034,803 | |
| Redeemed | | | (151,342 | ) | | | (1,770,780 | ) | | | (232,573 | ) | | | (3,069,407) | |
| | | | |
| Net decrease | | | (98,763 | ) | | $ | (1,177,501 | ) | | | (82,629 | ) | | $ | (1,019,497) | |
| | | | |
8. Purchases and Sales of Securities
The aggregate cost of purchases and proceeds from sales of securities, other than short-term obligations and investments in IGMMF, for the reporting period were as follows:
| | | | | | | | |
| | | Purchases | | | Sales | |
| |
| Investment securities | | $ | 3,862,606 | | | $ | 5,081,436 | |
9. Fees and Other Transactions with Affiliates
Management Fees. Under the investment advisory agreement, the Fund pays the Manager a management fee based on the daily net assets of the Fund at an annual rate as shown in the following table:
| | |
| Fee Schedule | | |
|
| Up to $200 million | | 0.75% |
| Next $200 million | | 0.72 |
| Next $200 million | | 0.69 |
| Next $200 million | | 0.66 |
| Over $800 million | | 0.60 |
The Fund’s effective management fee for the reporting period was 0.75% of average annual net assets before any applicable waivers.
Sub-Adviser Fees. The Manager has retained the Sub-Adviser to provide the day-to-day portfolio management of the Fund. Under the Sub-Advisory Agreement, the Manager pays the Sub-Adviser an annual fee in monthly installments, equal to a percentage of the investment management fee collected by the Manager from the Fund, which shall be calculated after any investment management fee waivers. The fee paid to the Sub-Adviser is paid by the Manager, not by the Fund.
Transfer Agent Fees. OFI Global (the “Transfer Agent”) serves as the transfer and shareholder servicing agent for the Fund. The Fund pays the Transfer Agent a fee based on annual net assets. Fees incurred and average net assets for each class with respect to these services are detailed in the Statement of Operations and Financial Highlights, respectively.
Sub-Transfer Agent Fees. The Transfer Agent has retained Shareholder Services, Inc., a wholly-owned subsidiary of OFI (the “Sub-Transfer Agent”), to provide the day-to-day transfer agent and shareholder servicing of the Fund. Under the Sub-Transfer Agency Agreement, the Transfer Agent pays the Sub-Transfer Agent an annual fee in monthly installments, equal to a percentage of the transfer agent fee collected by the Transfer Agent from the Fund, which shall be calculated after any applicable fee waivers. The fee paid to the Sub-Transfer Agent is paid by the Transfer Agent, not by the Fund.
Trustees’ Compensation. The Fund’s Board of Trustees (“Board”) has adopted a compensation deferral plan for Independent Trustees that enables Trustees to elect to defer receipt of all or a portion of the annual compensation they are entitled to receive from the Fund. For purposes of determining the amount owed to the Trustees under the plan, deferred amounts are treated as though equal dollar amounts had been invested in shares of the Fund or in other Oppenheimer funds selected by the Trustees. The Fund purchases shares of the funds selected for deferral by the Trustees in amounts equal to his or her deemed investment, resulting in a Fund asset equal to the deferred compensation liability. Such assets are included as a component of “Other” within the asset section of the Statement of Assets and Liabilities. Deferral of Trustees’ fees under the plan will not affect the net assets of the Fund and will not materially affect the Fund’s assets, liabilities or net investment income per share. Amounts will be deferred until distributed in accordance with the compensation deferral plan.
Distribution and Service Plan for Service Shares. The Fund has adopted a Distribution and Service Plan (the “Plan”) pursuant to Rule 12b-1 under the 1940 Act for Service shares to pay OppenheimerFunds Distributor, Inc. (the “Distributor”), for distribution related services, personal service and
22 OPPENHEIMER EQUITY INCOME FUND/VA
9. Fees and Other Transactions with Affiliates (Continued)
account maintenance for the Fund’s Service shares. Under the Plan, payments are made periodically at an annual rate of 0.25% of the daily net assets of Service shares of the Fund. The Distributor currently uses all of those fees to compensate sponsors of the insurance product that offers Fund shares, for providing personal service and maintenance of accounts of their variable contract owners that hold Service shares. These fees are paid out of the Fund’s assets on an on-going basis and increase operating expenses of the Service shares, which results in lower performance compared to the Fund’s shares that are not subject to a service fee. Fees incurred by the Fund under the Plan are detailed in the Statement of Operations.
Waivers and Reimbursements of Expenses. The Manager has contractually agreed to limit the Fund’s expenses after payments, waivers and/or reimbursements and reduction to custodian expenses, excluding any applicable dividend expense, taxes, interest and fees from borrowing, any subsidiary expenses, Acquired Fund Fees and Expenses, brokerage commissions, unusual and infrequent expenses and certain other Fund expenses; so that those expenses, as percentages of daily net assets, will not exceed the annual rate of 0.80% for Non-Service shares and 1.05% for Service shares. During the reporting period, the Manager waived fees and/or reimbursed the Fund $5,819 and $122,672 for Non-Service and Service shares, respectively.
The Manager will waive fees and/or reimburse Fund expenses in an amount equal to the indirect management fees incurred through the Fund’s investment in IGMMF. During the reporting period, the Manager waived fees and/or reimbursed the Fund $50 for IGMMF management fees.
Waivers and/or reimbursements may be modified or terminated as set forth according to the terms in the prospectus.
10. Borrowings and Other Financing
Securities Sold Short. The Fund sells securities that it does not own, and it will therefore be obligated to purchase such securities at a future date. Upon entering into a short position, the Fund is required to segregate cash or securities at its custodian which are pledged for the benefit of the lending broker and/or to deposit and pledge cash directly at the lending broker, with a value equal to a certain percentage, exceeding 100%, of the value of the securities that it sold short. Cash that has been segregated and pledged for this purpose will be disclosed on the Statement of Assets and Liabilities; securities that have been segregated and pledged for this purpose are disclosed as such in the Statement of Investments. The value of the open short position is recorded as a liability, and the Fund records an unrealized gain or loss to the extent of the difference between the proceeds received and the change in value of the open short position. The Fund records a realized gain or loss when the short position is closed out. By entering into short sales, the Fund bears the market risk of increases in value of the security sold short in excess of the proceeds received. Until the security is replaced, the Fund is required to pay the lender any dividend or interest earned. Dividend expense on short sales is treated as an expense in the Statement of Operations.
At period end, the Fund had no outstanding securities sold short.
Joint Credit Facility. A number of mutual funds managed by the Manager participate in a $1.3 billion revolving credit facility (the “Facility”) intended to provide short-term financing, if necessary, subject to certain restrictions in connection with atypical redemption activity. Expenses and fees related to the Facility are paid by the participating funds and are disclosed separately or as other expenses on the Statement of Operations. The Fund did not utilize the Facility during the reporting period.
11. Pending Agreement and Plan of Reorganization
The Board of Trustees of the Fund has determined that it is in the best interests of the Fund that the Fund reorganize with and into Oppenheimer Main Street Fund/VA (“Main Street Fund/VA”) and that the interests of the Fund’s existing shareholders would not be diluted as a result of the reorganization. The Board unanimously approved an Agreement and Plan of Reorganization (the “Agreement”) to be entered into between the Fund and Main Street Fund/VA, pursuant to which Main Street Fund/VA will acquire substantially all of the assets and assume certain liabilities of the Fund in exchange for newly-issued shares of Main Street Fund/VA (the “Reorganization”). If the Reorganization takes place, shareholders of the Fund will receive corresponding shares of Main Street Fund/VA, in each case equal in value to the value of the net assets of the shares of the Fund held immediately prior to the Reorganization. The shares of Main Street Fund/VA to be received by shareholders of the Fund will be issued at net asset value and without a sales charge. The Reorganization is expected to be a tax-free reorganization for U.S. federal income tax purposes. Following the Reorganization, the Fund will liquidate and dissolve and terminate its registration as an investment company under the Investment Company Act of 1940.
The Reorganization is conditioned upon, among other things, approval by the Fund’s shareholders. If approved by the shareholders and certain conditions required by the Agreement are satisfied, the Reorganization of the Fund is expected to take place on or about April 28, 2017.
12. Pending Litigation
In 2009, several putative class action lawsuits were filed and later consolidated before the U.S. District Court for the District of Colorado in connection with the investment performance of Oppenheimer Rochester California Municipal Fund (the “California Fund”), a fund advised by OppenheimerFunds, Inc. (“OFI”) and distributed by OppenheimerFunds Distributor, Inc. (“OFDI”). The plaintiffs asserted claims against OFI, OFDI and certain present and former trustees and officers of the California Fund under the federal securities laws, alleging, among other things, that the disclosure documents of the California Fund contained misrepresentations and omissions and the investment policies of the California Fund were not followed. An amended complaint and a motion to dismiss were filed, and in 2011, the court issued an order which granted in part and denied in part the defendants’ motion to dismiss. In October 2015, following a successful appeal by defendants and a subsequent hearing, the court granted plaintiffs’ motion for class certification and appointed class representatives and class counsel.
OFI and OFDI believe the suit is without merit; that it is premature to render any opinion as to the likelihood of an outcome unfavorable to them in
23 OPPENHEIMER EQUITY INCOME FUND/VA
NOTES TO FINANCIAL STATEMENTS Continued
12. Pending Litigation (Continued)
the suit; and that no estimate can yet be made as to the amount or range of any potential loss. Furthermore, OFI believes that the suit should not impair the ability of OFI or OFDI to perform their respective duties to the Fund and that the outcome of the suit should not have any material effect on the operations of any of the Oppenheimer funds.
24 OPPENHEIMER EQUITY INCOME FUND/VA
REPORT OF INDEPENDENT REGISTERED PUBLIC ACCOUNTING FIRM
The Board of Trustees and Shareholders of Oppenheimer Variable Account Funds:
We have audited the accompanying statement of assets and liabilities of Oppenheimer Equity Income Fund/VA (a separate series of Oppenheimer Variable Account Funds), including the statement of investments, as of December 31, 2016, and the related statement of operations for the year then ended, the statements of changes in net assets for each of the years in the two-year period then ended, and the financial highlights for each of the years in the five-year period then ended. These financial statements and financial highlights are the responsibility of the Fund’s management. Our responsibility is to express an opinion on these financial statements and financial highlights based on our audits.
We conducted our audits in accordance with the standards of the Public Company Accounting Oversight Board (United States). Those standards require that we plan and perform the audit to obtain reasonable assurance about whether the financial statements and financial highlights are free of material misstatement. An audit includes examining, on a test basis, evidence supporting the amounts and disclosures in the financial statements. Our procedures included confirmation of securities owned as of December 31, 2016, by correspondence with the custodian and brokers, or by other appropriate auditing procedures where replies from brokers were not received. An audit also includes assessing the accounting principles used and significant estimates made by management, as well as evaluating the overall financial statement presentation. We believe that our audits provide a reasonable basis for our opinion.
In our opinion, the financial statements and financial highlights referred to above present fairly, in all material respects, the financial position of Oppenheimer Equity Income Fund/VA as of December 31, 2016, the results of its operations for the year then ended, the changes in its net assets for each of the years in the two-year period then ended, and the financial highlights for each of the years in the five-year period then ended, in conformity with U.S. generally accepted accounting principles.
As discussed in Note 11 to the financial statements, Pending Agreement and Plan of Reorganization, at a meeting held February 10, 2017, the Board voted to approve the merger of Oppenheimer Equity Income Fund/VA into Oppenheimer Main Street Fund/VA effective on or about April 28, 2017, subject to approval by the acquired Fund’s shareholders.
KPMG LLP
Denver, Colorado
February 15, 2017
25 OPPENHEIMER EQUITY INCOME FUND/VA
FEDERAL INCOME TAX INFORMATION Unaudited
In early 2017, if applicable, shareholders of record received information regarding all dividends and distributions paid to them by the Fund during calendar year 2016.
Dividends, if any, paid by the Fund during the reporting period which are not designated as capital gain distributions should be multiplied by the maximum amount allowable but not less than 100% to arrive at the amount eligible for the corporate dividend-received deduction.
The foregoing information is presented to assist shareholders in reporting distributions received from the Fund to the Internal Revenue Service. Because of the complexity of the federal regulations which may affect your individual tax return and the many variations in state and local tax regulations, we recommend that you consult your tax advisor for specific guidance.
26 OPPENHEIMER EQUITY INCOME FUND/VA
BOARD APPROVAL OF THE FUND’S INVESTMENT ADVISORY AND SUB-ADVISORY AGREEMENTS Unaudited
The Fund has entered into an investment advisory agreement with OFI Global Asset Management, Inc. (“OFI Global” or the “Adviser”), a wholly-owned subsidiary of OppenheimerFunds, Inc. (“OFI” or the “Sub-Adviser”) (“OFI Global” and “OFI” together the “Managers”) and OFI Global has entered into a sub-advisory agreement with OFI whereby OFI provides investment sub-advisory services to the Fund (collectively, the “Agreements”). Each year, the Board of Trustees (the “Board”), including a majority of the independent Trustees, is required to determine whether to approve the terms of the Agreements and the renewal thereof. The Investment Company Act of 1940, as amended, requires that the Board request and evaluate, and that the Managers provide, such information as may be reasonably necessary to evaluate the terms of the Agreements. The Board employs an independent consultant to prepare a report that provides information, including comparative information that the Board requests for that purpose. In addition to in-person meetings focused on this evaluation, the Board receives information throughout the year regarding Fund services, fees, expenses and performance.
The Managers and the independent consultant provided information to the Board on the following factors: (i) the nature, quality and extent of the Managers’ services, (ii) the comparative investment performance of the Fund and the Managers, (iii) the fees and expenses of the Fund, including comparative fee and expense information, (iv) the profitability of the Managers and their affiliates, including an analysis of the cost of providing services, (v) whether economies of scale are realized as the Fund grows and whether fee levels reflect these economies of scale for Fund investors and (vi) other benefits to the Managers from their relationship with the Fund. The Board was aware that there are alternatives to retaining the Managers.
Outlined below is a summary of the principal information considered by the Board as well as the Board’s conclusions.
Nature, Quality and Extent of Services. The Board considered information about the nature, quality and extent of the services provided to the Fund and information regarding the Managers’ key personnel who provide such services. The Managers’ duties include providing the Fund with the services of the portfolio manager and the Sub-Adviser’s investment team, who provide research, analysis and other advisory services in regard to the Fund’s investments; and securities trading services. OFI Global is responsible for oversight of third-party service providers; monitoring compliance with applicable Fund policies and procedures and adherence to the Fund’s investment restrictions; risk management; and oversight of the Sub-Adviser. OFI Global is also responsible for providing certain administrative services to the Fund. Those services include providing and supervising all administrative and clerical personnel who are necessary in order to provide effective corporate administration for the Fund; compiling and maintaining records with respect to the Fund’s operations; preparing and filing reports required by the U.S. Securities and Exchange Commission; preparing periodic reports regarding the operations of the Fund for its shareholders; preparing proxy materials for shareholder meetings; and preparing the registration statements required by federal and state securities laws for the sale of the Fund’s shares. OFI Global also provides the Fund with office space, facilities and equipment.
The Board also considered the quality of the services provided and the quality of the Managers’ resources that are available to the Fund. The Board took account of the fact that the Sub-Adviser has over fifty years of experience as an investment adviser and that its assets under management rank it among the top mutual fund managers in the United States. The Board evaluated the Managers’ advisory, administrative, accounting, legal, compliance and risk management services, and information the Board has received regarding the experience and professional qualifications of the Managers’ key personnel and the size and functions of its staff. In its evaluation of the quality of the portfolio management services provided, the Board considered the experience of Michael Levine, the portfolio manager for the Fund, and the Sub-Adviser’s investment team and analysts. The Board members also considered the totality of their experiences with the Managers as directors or trustees of the Fund and other funds advised by the Managers. The Board considered information regarding the quality of services provided by affiliates of the Managers, which the Board members have become knowledgeable about through their experiences with the Managers and in connection with the renewal of the Fund’s service agreements. The Board concluded, in light of the Managers’ experience, reputation, personnel, operations and resources that the Fund benefits from the services provided under the Agreements.
Investment Performance of the Managers and the Fund. Throughout the year, the Managers provided information on the investment performance of the Fund, the Adviser and the Sub-Adviser, including comparative performance information. The Board also reviewed information, prepared by the Managers and by the independent consultant, comparing the Fund’s historical performance to relevant market indices and to the performance of other large value funds underlying variable insurance products. The Board considered that the Fund outperformed its performance category median during the ten-year period but underperformed its performance category median during the one-, three- and five-year periods. The Board noted that on April 30, 2013 the Fund changed its name from Oppenheimer Value Fund/VA to Oppenheimer Equity Income Fund/VA, and changed its investment strategy and, that on that same date, Michael Levine took over as sole portfolio manager of the Fund. Accordingly, the Board noted that performance prior to April 30, 2013 is reflective of a different investment strategy and different portfolio managers. The Board also considered the Adviser’s assertion that the vast majority of the Fund’s 3-year underperformance was concentrated in the second half of 2015 and that excluding that period, Mr. Levine’s performance record since becoming sole portfolio manager of the Fund has been better, with monthly performance in the top half of the Morningstar category 58% of the time. The Board also considered that the Adviser is implementing certain changes to the Fund’s investment process, which, it noted, deserve time to be evaluated.
Fees and Expenses of the Fund. The Board reviewed the fees paid to the Adviser and the other expenses borne by the Fund. The Board noted that the Adviser, not the Fund, pays the Sub-Adviser’s fee under the sub-advisory agreement. The independent consultant provided comparative data in regard to the fees and expenses of the Fund and other large value funds underlying variable insurance products. In reviewing the fees and expenses charged to the VA funds, the Board considered the Adviser’s assertion that, because there is much greater disparity in the fees and services that may be provided by a manager to a VA fund as opposed to a retail fund, when comparing the expenses of the various VA funds to those of retail funds, it is most appropriate to focus on total expenses (rather than on the management fees). Accordingly, while the Board reviewed and considered all expenses, it focused on total expenses. The Board considered that the Fund’s total expenses, net of waivers, were higher than both its peer group median and its category median. The Board also considered that the Fund’s contractual management fee was higher than both its peer group median and its category median. The Board further noted that the Adviser has contractually agreed to limit the Fund’s total annual operating expenses so that those expenses, as percentages of daily net assets, will not exceed the annual rate of 0.80% for Non-Service Shares and 1.05% for Service Shares. This contractual expense limitation may not be amended or withdrawn until one year after the date of the Fund’s prospectus, unless approved by the Board.
Economies of Scale and Profits Realized by the Managers. The Board considered information regarding the Managers’ costs in serving as the Fund’s investment adviser and sub-adviser, including the costs associated with the personnel and systems necessary to manage the Fund, and
27 OPPENHEIMER EQUITY INCOME FUND/VA
BOARD APPROVAL OF THE FUND’S INVESTMENT ADVISORY AND SUB-ADVISORY AGREEMENTS Unaudited / Continued
information regarding the Managers’ profitability from their relationship with the Fund. The Board also considered that the Managers must be able to pay and retain experienced professional personnel at competitive rates to provide quality services to the Fund. The Board reviewed whether the Managers may realize economies of scale in managing and supporting the Fund. The Board noted that the Fund currently has management fee breakpoints, which are intended to share with Fund shareholders economies of scale that may exist as the Fund’s assets grow.
Other Benefits to the Managers. In addition to considering the profits realized by the Managers, the Board considered information that was provided regarding the direct and indirect benefits the Managers receive as a result of their relationship with the Fund, including compensation paid to the Managers’ affiliates and research provided to the Adviser in connection with permissible brokerage arrangements (soft dollar arrangements).
Conclusions. These factors were also considered by the independent Trustees meeting separately from the full Board, assisted by experienced counsel to the Fund and to the independent Trustees. Fund counsel and the independent Trustees’ counsel are independent of the Managers within the meaning and intent of the Securities and Exchange Commission Rules.
Based on its review of the information it received and its evaluations described above, the Board, including a majority of the independent Trustees, decided to continue the Agreements through August 31, 2017. In arriving at its decision, the Board did not identify any factor or factors as being more important than others, but considered all of the above information, and considered the terms and conditions of the Agreements, including the management fees, in light of all the surrounding circumstances.
28 OPPENHEIMER EQUITY INCOME FUND/VA
PORTFOLIO PROXY VOTING POLICIES AND GUIDELINES; UPDATES TO STATEMENTS OF INVESTMENTS Unaudited
The Fund has adopted Portfolio Proxy Voting Policies and Guidelines under which the Fund votes proxies relating to securities (“portfolio proxies”) held by the Fund. A description of the Fund’s Portfolio Proxy Voting Policies and Guidelines is available (i) without charge, upon request, by calling the Fund toll-free at 1.800.CALL OPP (225.5677), (ii) on the Fund’s website at www.oppenheimerfunds.com, and (iii) on the SEC’s website at www.sec.gov. In addition, the Fund is required to file Form N-PX, with its complete proxy voting record for the 12 months ended June 30th, no later than August 31st of each year. The Fund’s voting record is available (i) without charge, upon request, by calling the Fund toll-free at 1.800.CALL OPP (225.5677), and (ii) in the Form N-PX filing on the SEC’s website at www.sec.gov.
The Fund files its complete schedule of portfolio holdings with the SEC for the first quarter and the third quarter of each fiscal year on Form N-Q. The Fund’s Form N-Q filings are available on the SEC’s website at www.sec.gov. Those forms may be reviewed and copied at the SEC’s Public Reference Room in Washington, D.C. Information on the operation of the Public Reference Room may be obtained by calling 1-800-SEC-0330.
29 OPPENHEIMER EQUITY INCOME FUND/VA
TRUSTEES AND OFFICERS Unaudited
| | |
| Name, Position(s) Held with the Fund, Length of Service, Age | | Principal Occupation(s) During the Past 5 Years; Other Trusteeships/Directorships Held; Number of Portfolios in the Fund Complex Currently Overseen |
| |
| INDEPENDENT TRUSTEES | | The address of each Trustee in the chart below is 6803 S. Tucson Way, Centennial, Colorado 80112-3924. Each Trustee serves for an indefinite term, or until his or her resignation, retirement, death or removal. |
| |
Robert J. Malone, Chairman of the Board of Trustees (since 2016), Trustee (since 2002) Year of Birth: 1944 | | Chairman - Colorado Market of MidFirst Bank (since January 2015); Chairman of the Board (2012-2016) and Director (August 2005-March 2016) of Jones International University (educational organization); Trustee of the Gallagher Family Foundation (non-profit organization) (2000-2015); Chairman, Chief Executive Officer and Director of Steele Street Bank Trust (commercial banking) (August 2003-January 2015); Board of Directors of Opera Colorado Foundation (non-profit organization) (2008- 2012); Director of Colorado UpLIFT (charitable organization) (1986-2010); Director of Jones Knowledge, Inc. (2006-2010); Former Chairman of U.S. Bank-Colorado (subsidiary of U.S. Bancorp and formerly Colorado National Bank) (July 1996-April 1999); Director of Commercial Assets, Inc. (real estate investment trust) (1993-2000); Director of U.S. Exploration, Inc. (oil and gas exploration) (1997-February 2004); Chairman of the Board (1991-1994) and Trustee (1985-1994) of Regis University; and Chairman of the Board (1990-1991) and Trustee (1984-1999) of Young Presidents Organization. Oversees 47 portfolios in the OppenheimerFunds complex. Mr. Malone has served on the Boards of certain Oppenheimer funds since 2002, during which time he has become familiar with the Fund’s (and other Oppenheimer funds’) financial, accounting, regulatory and investment matters and has contributed to the Boards’ deliberations. |
| |
Jon S. Fossel, Trustee (since 1990) Year of Birth: 1942 | | Chairman of the Board of Jack Creek Preserve Foundation (non-profit organization) (since March 2005); Director of Jack Creek Preserve Foundation (non-profit organization) (March 2005-December 2014); Chairman of the Board (2006-December 2011) and Director (June 2002-December 2011) of UNUMProvident (insurance company); Director of Northwestern Energy Corp. (public utility corporation) (November 2004-December 2009); Director of P.R. Pharmaceuticals (October 1999-October 2003); Director of Rocky Mountain Elk Foundation (non-profit organization) (February 1998-February 2003 and February 2005-February 2007); Chairman and Director (until October 1996) and President and Chief Executive Officer (until October 1995) of OppenheimerFunds, Inc.; President, Chief Executive Officer and Director of the following: Oppenheimer Acquisition Corp. (“OAC”) (parent holding company of OppenheimerFunds, Inc.), Shareholders Services, Inc. and Shareholder Financial Services, Inc. (until October 1995). Oversees 47 portfolios in the OppenheimerFunds complex. Mr. Fossel has served on the Boards of certain Oppenheimer funds since 1990, during which time he has become familiar with the Fund’s (and other Oppenheimer funds’) financial, accounting, regulatory and investment matters and has contributed to the Boards’ deliberations. |
| |
Richard F. Grabish, Trustee (since 2012) Year of Birth: 1948 | | Formerly Senior Vice President and Assistant Director of Sales and Marketing (March 1997-December 2007), Director (March 1987-December 2007) and Manager of Private Client Services (June 1985-June 2005) of A.G. Edwards & Sons, Inc. (broker/dealer and investment firm); Chairman and Chief Executive Officer of A.G. Edwards Trust Company, FSB (March 2001-December 2007); President and Vice Chairman of A.G. Edwards Trust Company, FSB (investment adviser) (April 1987-March 2001); President of A.G. Edwards Trust Company, FSB (investment adviser) (June 2005-December 2007). Oversees 47 portfolios in the OppenheimerFunds complex. Mr. Grabish has served on the Boards of certain Oppenheimer funds since 2001, during which time he has become familiar with the Fund’s (and other Oppenheimer funds’) financial, accounting, regulatory and investment matters and has contributed to the Boards’ deliberations. |
| |
Beverly L. Hamilton, Trustee (since 2002) Year of Birth: 1946 | | Trustee of Monterey Institute for International Studies (educational organization) (2000-2014); Board Member of Middlebury College (educational organization) (December 2005-June 2011); Chairman (2010-2016) of American Funds’ Emerging Markets Growth Fund, Inc. (mutual fund); Director of The California Endowment (philanthropic organization) (April 2002-April 2008); Director (February 2002-2005) and Chairman of Trustees (2006-2007) of the Community Hospital of Monterey Peninsula; Director (October 1991-2005) and Vice Chairman (2006-2009) of American Funds’ Emerging Markets Growth Fund, Inc. (mutual fund); President of ARCO Investment Management Company (February 1991-April 2000); Member of the investment committees of The Rockefeller Foundation (2001-2006) and The University of Michigan (since 2000); Advisor at Credit Suisse First Boston’s Sprout venture capital unit (venture capital fund) (1994-January 2005); Trustee of MassMutual Institutional Funds (investment company) (1996-June 2004); Trustee of MML Series Investment Fund (investment company) (April 1989-June 2004); Member of the investment committee of Hartford Hospital (2000-2003); and Advisor to Unilever (Holland) pension fund (2000-2003). Oversees 47 portfolios in the OppenheimerFunds complex. Ms. Hamilton has served on the Boards of certain Oppenheimer funds since 2002, during which time she has become familiar with the Fund’s (and other Oppenheimer funds’) financial, accounting, regulatory and investment matters and has contributed to the Boards’ deliberations. |
| |
Victoria J. Herget, Trustee (since 2012) Year of Birth:1951 | | Board Chair (2008-2015) and Director (2004-Present), United Educators (insurance company); Trustee (since 2000) and Chair (since 2010), Newberry Library (independent research library); Trustee, Mather LifeWays (senior living organization) (since 2001); Independent Director of the First American Funds (mutual fund family) (2003-2011); former Managing Director (1993-2001), Principal (1985-1993), Vice President (1978-1985) and Assistant Vice President (1973-1978) of Zurich Scudder Investments (investment adviser) (and its predecessor firms); Trustee (1992-2007), Chair of the Board of Trustees (1999-2007), Investment Committee Chair (1994-1999) and Investment Committee member (2007-2010) of Wellesley College; Trustee, BoardSource (non-profit organization) (2006-2009) and Chicago City Day School (K-8 School) (1994-2005). Oversees 47 portfolios in the OppenheimerFunds complex. Ms. Herget has served on the Boards of certain Oppenheimer funds since 2012, during which time she has become familiar with the Fund’s (and other Oppenheimer funds’) financial, accounting, regulatory and investment matters and has contributed to the Boards’ deliberations. |
30 OPPENHEIMER EQUITY INCOME FUND/VA
| | |
| |
F. William Marshall, Jr., Trustee (since 2000) Year of Birth: 1942 | | Trustee Emeritus of Worcester Polytech Institute (WPI) (private university) (since 2009); Trustee of MassMutual Select Funds (formerly MassMutual Institutional Funds) (investment company) (1996-2015), MML Series Investment Fund (investment company) (1996-2015) and Mass Mutual Premier Funds (investment company) (January 2012-December 2015); President and Treasurer of the SIS Fund (private charitable fund) (January 1999-March 2011); Former Trustee of WPI (1985-2008); Former Chairman of the Board (2004-2006) and Former Chairman of the Investment Committee of WPI (1994-2008); Chairman of SIS Family Bank, F.S.B. (formerly SIS Bank) (commercial bank) (January 1999-July 1999); Executive Vice President of Peoples Heritage Financial Group, Inc. (commercial bank) (January 1999-July 1999); and Former President and Chief Executive Officer of SIS Bancorp. (1993-1999). Oversees 47 portfolios in the OppenheimerFunds complex. Mr. Marshall has served on the Boards of certain Oppenheimer funds since 2000, during which time he has become familiar with the Fund’s (and other Oppenheimer funds’) financial, accounting, regulatory and investment matters and has contributed to the Boards’ deliberations. |
| |
Karen L. Stuckey, Trustee (since 2012) Year of Birth: 1953 | | Member (since May 2015) of Desert Mountain Community Foundation Advisory Board (non-profit organization); Partner (1990-2012) of PricewaterhouseCoopers LLP (professional services firm) (held various positions 1975-1990); Trustee (1992- 2006), member of Executive, Nominating and Audit Committees and Chair of Finance Committee (1992-2006), and Emeritus Trustee (since 2006) of Lehigh University; and member, Women’s Investment Management Forum (professional organization) since inception. Oversees 47 portfolios in the OppenheimerFunds complex. Ms. Stuckey has served on the Boards of certain Oppenheimer funds since 2012, during which time she has become familiar with the Fund’s (and other Oppenheimer funds’) financial, accounting, regulatory and investment matters and has contributed to the Boards’ deliberations. |
| |
James D. Vaughn, Trustee (since 2012) Year of Birth:1945 | | Retired; former managing partner (1994-2001) of Denver office of Deloitte & Touche LLP, (held various positions 1969- 1993); Trustee and Chairman of the Audit Committee of Schroder Funds (2003-2012); Board member and Chairman of Audit Committee of AMG National Trust Bank (since 2005); Trustee and Investment Committee member, University of South Dakota Foundation (since 1996); Board member, Audit Committee Member and past Board Chair, Junior Achievement (since 1993); former Board member, Mile High United Way, Boys and Girls Clubs, Boy Scouts, Colorado Business Committee for the Arts, Economic Club of Colorado and Metro Denver Network. Oversees 47 portfolios in the OppenheimerFunds complex. Mr. Vaughn has served on the Boards of certain Oppenheimer funds since 2012, during which time he has become familiar with the Fund’s (and other Oppenheimer funds’) financial, accounting, regulatory and investment matters and has contributed to the Boards’ deliberations. |
| INTERESTED TRUSTEE AND OFFICER | | Mr. Steinmetz is an “Interested Trustee” because he is affiliated with the Manager and the Sub-Adviser by virtue of his positions as Chairman and director of the Sub-Adviser and officer and director of the Manager. Both as a Trustee and as an officer, Mr. Steinmetz serves for an indefinite term, or until his resignation, retirement, death or removal. Mr. Steinmetz’s address is 225 Liberty Street, New York, New York 10281-1008. |
| |
Arthur P. Steinmetz, Trustee (Since 2015), President and Principal Executive Officer (since 2014) Year of Birth: 1958 | | Chairman of OppenheimerFunds, Inc. (since January 2015); CEO and Chairman of OFI Global Asset Management, Inc. (since July 2014), President of OFI Global Asset Management, Inc. (since May 2013), a Director of OFI Global Asset Management, Inc. (since January 2013), Director of OppenheimerFunds, Inc. (since July 2014), President, Management Director and CEO of Oppenheimer Acquisition Corp. (OppenheimerFunds, Inc.‘s parent holding company) (since July 2014), and President and Director of OFI SteelPath, Inc. (since January 2013). Chief Investment Officer of the OppenheimerFunds advisory entities from (January 2013-December 2013); Executive Vice President of OFI Global Asset Management, Inc. (January 2013-May 2013); Chief Investment Officer of OppenheimerFunds, Inc. (October 2010-December 2012); Chief Investment Officer, Fixed- Income, of OppenheimerFunds, Inc. (April 2009-October 2010); Executive Vice President of OppenheimerFunds, Inc. (October 2009-December 2012); Director of Fixed Income of OppenheimerFunds, Inc. (January 2009-April 2009); and a Senior Vice President of OppenheimerFunds, Inc. (March 1993-September 2009). An officer of 103 portfolios in the OppenheimerFunds complex. |
| OTHER OFFICERS OF THE FUND | | The addresses of the Officers in the chart below are as follows: for Messrs. Levine, Mss. Lo Bessette, Foxson and Picciotto, 225 Liberty Street, New York, New York 10281-1008, for Mr. Petersen, 6803 S. Tucson Way, Centennial, Colorado 80112-3924. Each Officer serves for an indefinite term or until his or her resignation, retirement, death or removal. |
| |
Michael S. Levine, Vice President (since 2013) Year of Birth: 1965 | | Vice President of the Sub-Adviser (since June 1998) and Senior Portfolio Manager of the Sub-Adviser (since September 2000). A portfolio manager and an officer of other portfolios in the OppenheimerFunds complex. |
| |
Cynthia Lo Bessette, Secretary and Chief Legal Officer (since 2016) Year of Birth: 1969 | | Executive Vice President, General Counsel and Secretary of the Manager (since February 2016); Chief Legal Officer of the Sub-Adviser and the Distributor (since February 2016); Vice President, General Counsel and Secretary of Oppenheimer Acquisition Corp. (since February 2016); General Counsel of OFI SteelPath, Inc., VTL Associates, LLC and Index Management Solutions, LLC (since February 2016); Chief Legal Officer of OFI Global Institutional, Inc., HarbourView Asset Management Corporation, OFI Global Trust Company, Oppenheimer Real Asset Management, Inc., OFI Private Investments Inc., Shareholder Services, Inc. and Trinity Investment Management Corporation (since February 2016); Senior Vice President and Deputy General Counsel (March 2015-February 2016) and Executive Vice President, Vice President, Corporate Counsel (February 2012-March 2015) and Deputy Chief Legal Officer (April 2013-March 2015) of Jennison Associates LLC; Assistant General Counsel (April 2008-September 2009) and Deputy General Counsel (October 2009-February 2012) of Lord Abbett & Co. LLC. An officer of 103 portfolios in the OppenheimerFunds complex. |
| |
Jennifer Foxson, Vice President and Chief Business Officer (since 2014) Year of Birth: 1969 | | Senior Vice President of OppenheimerFunds Distributor, Inc. (since June 2014); Vice President of OppenheimerFunds Distributor, Inc. (April 2006-June 2014); Vice President of the Sub-Adviser (January 1998-March 2006); Assistant Vice President of the Sub-Adviser (October 1991-December 1998). An officer of 103 portfolios in the OppenheimerFunds complex. |
31 OPPENHEIMER EQUITY INCOME FUND/VA
TRUSTEES AND OFFICERS Unaudited / Continued
| | |
| |
Mary Ann Picciotto, Chief Compliance Officer and Chief Anti-Money Laundering Officer (since 2014) Year of Birth: 1973 | | Senior Vice President and Chief Compliance Officer of the Manager (since March 2014); Chief Compliance Officer of the Sub- Adviser, OFI SteelPath, Inc., OFI Global Trust Company, OFI Global Institutional, Inc., Oppenheimer Real Asset Management, Inc., OFI Private Investments, Inc., Harborview Asset Management Corporation, Trinity Investment Management Corporation, and Shareholder Services, Inc. (since March 2014); Managing Director of Morgan Stanley Investment Management Inc. and certain of its various affiliated entities; Chief Compliance Officer of various Morgan Stanley Funds (May 2010-January 2014); Chief Compliance Officer of Morgan Stanley Investment Management Inc. (April 2007-January 2014). An officer of 103 portfolios in the OppenheimerFunds complex. |
| |
Brian S. Petersen, Treasurer and Principal Financial & Accounting Officer (since 2016) Year of Birth: 1970 | | Vice President of the Manager (since January 2013); Vice President of the Sub-Adviser (February 2007-December 2012); Assistant Vice President of the Sub-Adviser (August 2002-2007). An officer of 103 portfolios in the OppenheimerFunds complex. |
The Fund’s Statement of Additional Information contains additional information about the Fund’s Trustees and Officers and is available without charge, upon request, by calling 1.800.988.8287.
32 OPPENHEIMER EQUITY INCOME FUND/VA
THIS PAGE INTENTIONALLY LEFT BLANK.
33 OPPENHEIMER EQUITY INCOME FUND/VA
THIS PAGE INTENTIONALLY LEFT BLANK.
34 OPPENHEIMER EQUITY INCOME FUND/VA
THIS PAGE INTENTIONALLY LEFT BLANK.
35 OPPENHEIMER EQUITY INCOME FUND/VA
OPPENHEIMER EQUITY INCOME FUND/VA
A Series of Oppenheimer Variable Account Funds
| | |
| Manager | | OFI Global Asset Management, Inc. |
| |
| Sub-Adviser | | OppenheimerFunds, Inc. |
| |
| Distributor | | OppenheimerFunds Distributor, Inc. |
| |
Transfer and Shareholder Servicing Agent | | OFI Global Asset Management, Inc. |
| |
| Sub-Transfer Agent | | Shareholder Services, Inc. DBA OppenheimerFunds Services |
| |
Independent Registered Public Accounting Firm | | KPMG LLP |
| |
| Legal Counsel | | Ropes & Gray LLP |
| |
| | Before investing in any of the Oppenheimer funds, investors should carefully consider a fund’s investment objectives, risks, charges and expenses. Fund prospectuses and summary prospectuses contain this and other information about the funds, and may be obtained by asking your financial advisor, or calling us at 1.800.988.8287. Read prospectuses and summary prospectuses carefully before investing. © 2017 OppenheimerFunds, Inc. All rights reserved. Oppenheimer funds are distributed by OppenheimerFunds Distributor, Inc. |


| | | | | | |
| December 31, 2016 | | | | |
| | | Oppenheimer Global Multi-Alternatives Fund/VA A Series of Oppenheimer Variable Account Funds | | | Annual Report | |
| | |
| | ANNUAL REPORT Listing of Top Holdings Fund Performance Discussion Financial Statements | | | | |
PORTFOLIO MANAGERS: Mark Hamilton; Benjamin Rockmuller, CFA; Dokyoung Lee, CFA; and Alessio de Longis, CFA
AVERAGE ANNUAL TOTAL RETURNS FOR THE PERIODS ENDED 12/31/16
| | | | | | | | | | | | |
| | | Inception
Date | | | 1-Year | | | Since
Inception | |
Non-Service Shares | | | 11/14/13 | | | | 3.71 | % | | | 1.70 | % |
Service Shares | | | 11/14/13 | | | | 3.49 | | | | 1.51 | |
Bank of America Merrill Lynch 3-Month U.S. Treasury Bill Index | | | | | | | 0.33 | | | | 0.14 | |
Performance data quoted represents past performance, which does not guarantee future results. The investment return and principal value of an investment in the Fund will fluctuate so that an investor’s shares, when redeemed, may be worth more or less than their original cost. Current performance may be lower or higher than the performance quoted. For performance data current to the most recent month end, call us at 1.800.988.8287. The Fund’s total returns should not be expected to be the same as the returns of other funds, whether or not both funds have the same portfolio managers and/or similar names. The Fund’s total returns include changes in share price and reinvested distributions but do not include the charges associated with the separate account products that offer this Fund. Such performance would have been lower if such charges were taken into account.
TOP HOLDINGS AND ALLOCATIONS
TOP TEN COMMON STOCK HOLDINGS
| | |
| Alphabet, Inc., Cl. A | | 0.8% |
| Honeywell International, Inc. | | 0.8 |
| M&T Bank Corp. | | 0.7 |
| Chubb Ltd. | | 0.7 |
| UnitedHealth Group, Inc. | | 0.6 |
| Republic Services, Inc., Cl. A | | 0.6 |
| Apple, Inc. | | 0.6 |
| Xilinx, Inc. | | 0.6 |
| General Electric Co. | | 0.6 |
| Lockheed Martin Corp. | | 0.5 |
Portfolio holdings and allocations are subject to change. Percentages are as of December 31, 2016, and are based on net assets. For more current Fund holdings, please visit oppenheimerfunds.com.
| | | | |
| PORTFOLIO ALLOCATION | | | | |
| Common Stocks | | | 31.0% | |
| Short-Term Notes | | | 18.6 | |
Investment Companies | | | | |
Highland/iBoxx Senior Loan Exchange Traded Fund | | | 0.5 | |
iShares US Preferred Stock Exchange Traded Fund | | | —* | |
Oppenheimer Institutional Government Money Market Fund | | | 14.7 | |
SPDR Gold Trust Exchange Traded Fund | | | 1.0 | |
Event-Linked Bonds | | | | |
Multiple Event | | | 6.8 | |
Windstorm | | | 3.7 | |
Earthquake | | | 3.2 | |
Other | | | 0.6 | |
Longevity | | | 0.1 | |
| Non-Convertible Corporate Bonds and Notes | | | 8.8 | |
| Asset-Backed Securities | | | 4.1 | |
| Corporate Loans | | | 3.3 | |
| Foreign Government Obligations | | | 2.0 | |
| Over-the-Counter Options Purchased | | | 0.5 | |
Mortgage-Backed Obligations
Non-Agency | | | 0.5 | |
| Preferred Stocks | | | 0.3 | |
| Convertible Corporate Bonds and Notes | | | 0.2 | |
| Over-the-Counter Interest Rate Swaptions Purchased | | | 0.1 | |
| Exchange-Traded Options Purchased | | | —* | |
| Rights, Warrants and Certificates | | | —* | |
| *Represents a value of less than 0.05%. | | | | |
Portfolio holdings and allocations are subject to change. Percentages are as of December 31, 2016, and are based on the total market value of investments.
2 OPPENHEIMER GLOBAL MULTI-ALTERNATIVES FUND/VA
| | |
Fund Performance Discussion |
The Fund’s Non-Service shares returned 3.71% during the reporting period. On a relative basis, the Fund outperformed the Bank of America Merrill Lynch 3-Month U.S. Treasury Bill Index (the “Index”), which returned 0.33% during the same period. In what was a volatile reporting period for global capital markets, most alternative asset classes in which the Fund invests outperformed the performance of short-term U.S. Government securities, resulting in the Fund’s relative outperformance versus the Index.
FUND REVIEW
The Fund’s strongest performing exposure was to income alternatives, particularly master limited partnerships (“MLPs”) and loans. Our MLP strategy seeks to invest in U.S. midstream MLPs that the investment team believes have attractive risk and reward characteristics. After experiencing declines over the first half of the reporting period, MLPs rallied strongly over the second half. The supply-demand picture for both crude oil and natural gas improved during the reporting period. Credit assets like bank loans also did very well as spreads declined throughout the period. Also performing positively for the Fund among income alternatives was our exposure to event-linked bonds, which transfer a specified set of catastrophe risks such as hurricanes, earthquakes and windstorms from a sponsor to investors. Event-linked bonds performed well during the reporting period in the absence of catastrophe related events.
Our exposure to Alpha alternatives contributed positively to performance overall. Our positive results were driven by the Fundamental Alpha and Global Multi Strategies. The Currency Alpha Strategy, which is a total return strategy focusing on fundamental and systematic dislocations across currency markets, detracted from performance during the reporting period. The strategy can be long and/or short currencies against the U.S. dollar. It has a go-anywhere mandate across currencies and seeks opportunities regardless of dollar bull or bear market cycles. During the reporting period, the Currency Alpha Strategy had a bias to higher yielding emerging currencies versus the lower yielding developed currencies. This positioning hurt after the U.S. election as we saw a reversal of the carry trade and many emerging currencies selling off.
Detractors from performance this reporting period included the Fund’s exposure to Global Real Estate through real estate investment trusts (REITs). After healthy year-to-date returns through the third quarter of 2016, global-listed securities declined sharply in the fourth quarter, as REITs were negatively impacted by rising interest rates around the world. Although we reduced our position, we continue to see value in real estate assets based on attractive spreads versus the government bond yields and continued strong demand. Moreover, attractive valuations in Europe in conjunction with additional quantitative easing measures should provide additional support. The Fund’s risk management overlay was also a detractor from performance. In particular, we reduced our equity market exposure through shorting European futures, and this was a drag as equity markets moved higher. Given appropriate market conditions, the Fund periodically utilizes risk management overlays in an attempt to control and manage volatility, hedge unwanted risks, and maximize risk-adjusted returns.
STRATEGY & OUTLOOK
The Fund comprises a flexible blend of alternative strategies and assets and is designed to be a turnkey alternative solution that improves the risk/reward tradeoff of a traditional balanced portfolio. We classify alternatives into three categories: Alpha alternatives, income alternatives and real alpha alternatives. Alpha alternatives, such as Global Multi Strategies, Fundamental Alpha Strategies, and the Currency Alpha Strategy, rely less on the direction of major markets and economic factors to generate returns. Income alternatives (e.g. MLPs, loans, and event-linked bonds) provide exposure to relatively stable income producing assets with less interest rate sensitivity than traditional fixed income allocations. Real asset alternatives, like Global Real Estate and Commodities, could help guard against inflation over the long-term. We combine these strategies and assets to provide a core, alternative exposure that can potentially offset some of the risk from equity drawdowns, rising interest rates and inflationary shocks.
As we look ahead, most developed markets reached the peak of the cycle over the past couple of years and have spent the last few quarters in a “slowdown” regime, an environment in which growth is above trend and decelerating, though experiencing frequent short-lived re-accelerations (i.e. renewed “expansions”). In our opinion, the first half of 2017 will be characterized by another one of these mini-expansions that are generally accompanied by outperformance of equities and credit over government bonds.
However, we recognize that 2017 may bring some unique challenges. For example, enacting fiscal stimulus when the economy is near full employment would be highly unusual. Such a move would likely push the Fed to hike rates more aggressively, in turn generating volatility and a more challenging investment environment overall. In such an environment, further diversifying in alternatives can improve the risk/reward profile for investors. Thus we believe that diversifying risk, controlling volatility and managing the downside will be a winning strategy going forward. Because the Fund comprises a number of different alternative
3 OPPENHEIMER GLOBAL MULTI-ALTERNATIVES FUND/VA
assets and strategies, with diversifying properties as well as the potential to generate attractive total returns, we believe it can play a particularly valuable role in investors’ portfolios.
Investors should consider the Fund’s investment objective, risks, charges and expenses carefully before investing. The Fund’s prospectus and summary prospectus contain this and other information about the Fund, and may be obtained by asking your financial advisor or calling us at 1.800.988.8287. Read prospectuses and summary prospectuses carefully before investing.
Total returns include changes in share price and reinvestment of dividends and capital gains distributions in a hypothetical investment for the periods shown, but do not include the charges associated with the separate account products that offer this Fund.
The Fund’s investment strategy and focus can change over time. The mention of specific fund holdings does not constitute a recommendation by OppenheimerFunds, Inc. or its affiliates.
Shares of Oppenheimer funds are not deposits or obligations of any bank, are not guaranteed by any bank, are not insured by the FDIC or any other agency, and involve investment risks, including the possible loss of the principal amount invested.
Comparing the Fund’s Performance to the Market. The graphs that follow show the performance of a hypothetical $10,000 investment in each share class of the Fund held until December 31, 2016. Performance is measured from the inception of both Classes on November 14, 2013. Performance information does not reflect charges that apply to separate accounts investing in the Fund. If these charges were taken into account, performance would be lower. The graphs assume that all dividends and capital gains distributions were reinvested in additional shares.
The Fund’s performance is compared to the performance of the Bank of America Merrill Lynch 3-Month U.S. Treasury Bill Index. The Bank of America Merrill Lynch 3-Month U.S. Treasury Bill Index is an index of short-term U.S. Government securities with a remaining term to final maturity of less than three months. The index is unmanaged, includes the reinvestment of dividends and cannot be purchased directly by investors. While index comparisons may be useful to provide a benchmark for the Fund’s performance, it must be noted that the Fund’s investments are not limited to the investments comprising the indices. Index performance includes reinvestment of income, but does not reflect transaction costs, fees, expenses or taxes. Index performance is shown for illustrative purposes only as a benchmark for the Fund’s performance, and does not predict or depict performance of the Fund. The Fund’s performance reflects the effects of the Fund’s business and operating expenses.
4 OPPENHEIMER GLOBAL MULTI-ALTERNATIVES FUND/VA
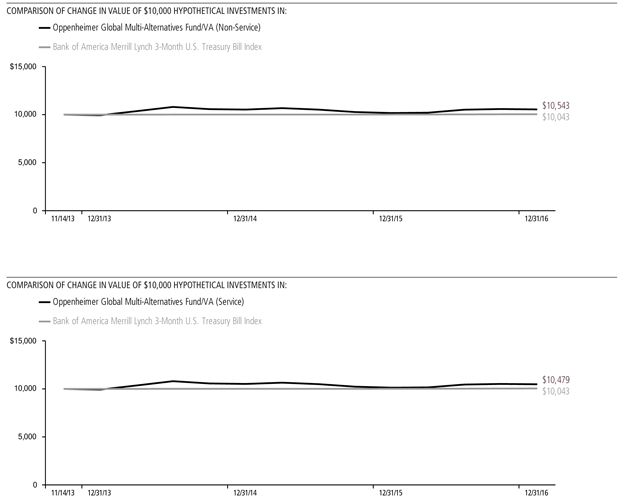
Performance data quoted represents past performance, which does not guarantee future results. The investment return and principal value of an investment in the Fund will fluctuate so that an investor’s shares, when redeemed, may be worth more or less than their original cost. Current performance may be lower or higher than the performance quoted. For performance data current to the most recent month end, call us at 1.800.988.8287. The Fund’s total returns should not be expected to be the same as the returns of other funds, whether or not both funds have the same portfolio managers and/or similar names. The Fund’s total returns include changes in share price and reinvested distributions but do not include the charges associated with the separate account products that offer this Fund. Such performance would have been lower if such charges were taken into account.
5 OPPENHEIMER GLOBAL MULTI-ALTERNATIVES FUND/VA
Fund Expenses. As a shareholder of the Fund, you incur two types of costs: (1) transaction costs and (2) ongoing costs, including management fees; distribution and service fees; and other Fund expenses. These examples are intended to help you understand your ongoing costs (in dollars) of investing in the Fund and to compare these costs with the ongoing costs of investing in other mutual funds.
The examples are based on an investment of $1,000.00 invested at the beginning of the period and held for the entire 6-month period ended December 31, 2016.
Actual Expenses. The first section of the table provides information about actual account values and actual expenses. You may use the information in this section for the class of shares you hold, together with the amount you invested, to estimate the expense that you paid over the period. Simply divide your account value by $1,000.00 (for example, an $8,600.00 account value divided by $1,000.00 = 8.60), then multiply the result by the number in the first section under the heading entitled “Expenses Paid During 6 Months Ended December 31, 2016” to estimate the expenses you paid on your account during this period.
Hypothetical Example for Comparison Purposes.
The second section of the table provides information about hypothetical account values and hypothetical expenses based on the Fund’s actual expense ratio for each class of shares, and an assumed rate of return of 5% per year for each class before expenses, which is not the actual return. The hypothetical account values and expenses may not be used to estimate the actual ending account balance or expenses you paid for the period. You may use this information to compare the ongoing costs of investing in the Fund and other funds. To do so, compare this 5% hypothetical example for the class of shares you hold with the 5% hypothetical examples that appear in the shareholder reports of the other funds.
Please note that the expenses shown in the table are meant to highlight your ongoing costs only and do not reflect any charges associated with the separate accounts that offer this Fund. Therefore, the “hypothetical” lines of the table are useful in comparing ongoing costs only, and will not help you determine the relative total costs of owning different funds. In addition, if these separate account charges were included your costs would have been higher.
| | | | | | | | | | | | | | | | | | | | | | | | | | | | | | |
| Actual | | Beginning
Account Value July 1, 2016 | | | | Ending Account Value
December 31, 2016 | | | | Expenses Paid During 6 Months Ended
December 31, 2016 | | |
Non-Service shares | | | $ | 1,000.00 | | | | | | | | | | $ 1,002.40 | | | | | | | | | | $ 7.48 | | | | | | |
Service shares | | | | 1,000.00 | | | | | | | | | | 1,002.70 | | | | | | | | | | 8.70 | | | | | | |
| | | | | | |
Hypothetical | | | | | | | | | | | | | | | | | | | | | | | | | | | | | | |
(5% return before expenses) | | | | | | | | | | | | | | | | | | | | | | | | | | | | | | |
Non-Service shares | | | | 1,000.00 | | | | | | | | | | 1,017.70 | | | | | | | | | | 7.53 | | | | | | |
Service shares | | | | 1,000.00 | | | | | | | | | | 1,016.49 | | | | | | | | | | 8.76 | | | | | | |
Expenses are equal to the Fund’s annualized expense ratio for that class, multiplied by the average account value over the period, multiplied by 184/366 (to reflect the one-half year period). Those annualized expense ratios, excluding indirect expenses from affiliated funds, based on the 6-month period ended December 31, 2016 are as follows:
| | | | | | | | |
| Class | | Expense Ratios | | | | |
Non-Service shares | | | 1.48% | | | | | |
Service shares | | | 1.72 | | | | | |
The expense ratios reflect voluntary and/or contractual waivers and/or reimbursements of expenses by the Fund’s Manager. Some of these undertakings may be modified or terminated at any time, as indicated in the Fund’s prospectus. The “Financial Highlights” tables in the Fund’s financial statements, included in this report, also show the gross expense ratios, without such waivers or reimbursements and reduction to custodian expenses, if applicable.
6 OPPENHEIMER GLOBAL MULTI-ALTERNATIVES FUND/VA
| | |
CONSOLIDATED STATEMENT OF INVESTMENTS December 31, 2016 |
| | | | | | | | |
| | | Shares | | | Value | |
| |
Common Stocks—30.1% | | | | | | | | |
| |
Consumer Discretionary—1.3% | | | | | | | | |
| |
Diversified Consumer Services—0.1% | | | | | |
| |
| Houghton Mifflin Harcourt Co.1 | | | 8,508 | | | $ | 92,312 | |
| |
| LifeLock, Inc.1 | | | 18,039 | | | | 431,493 | |
| | | | | | | | |
| | | | | | | 523,805 | |
|
| |
Hotels, Restaurants & Leisure—0.3% | | | | | |
| |
Brinker International, Inc. | | | 17,815 | | | | 882,377 | |
| |
Hilton Worldwide Holdings, Inc. | | | 6,610 | | | | 179,792 | |
| | | | | | | | |
| | | | | | | 1,062,169 | |
|
| |
Household Durables—0.2% | | | | | | | | |
| |
Harman International Industries, Inc. | | | 3,820 | | | | 424,631 | |
| |
| Sekisui House SI Residential Investment Corp. | | | 155 | | | | 172,551 | |
| | | | | | | | |
| | | | | | | 597,182 | |
|
| |
Internet & Catalog Retail—0.1% | | | | | | | | |
| |
Blue Nile, Inc. | | | 10,669 | | | | 433,481 | |
|
| |
Media—0.4% | | | | | | | | |
| |
DISH Network Corp., Cl. A1 | | | 17,463 | | | | 1,011,631 | |
| |
Live Nation Entertainment, Inc.1 | | | 13,800 | | | | 367,080 | |
| | | | | | | | |
| | | | | | | 1,378,711 | |
|
| |
Multiline Retail—0.0% | | | | | | | | |
| |
Fred’s, Inc., Cl. A | | | 4,968 | | | | 92,206 | |
|
| |
Specialty Retail—0.2% | | | | | | | | |
| |
Ascena Retail Group, Inc.1 | | | 33,040 | | | | 204,518 | |
| |
Cabela’s, Inc.1 | | | 6,119 | | | | 358,267 | |
| |
CST Brands, Inc. | | | 8,511 | | | | 409,805 | |
| | | | | | | | |
| | | | | | | 972,590 | |
|
| |
Consumer Staples—1.2% | | | | | | | | |
| |
Beverages—0.2% | | | | | | | | |
| |
Coca-Cola Co. (The) | | | 25,800 | | | | 1,069,668 | |
|
| |
Food Products—0.1% | | | | | | | | |
| |
WhiteWave Foods Co. (The), Cl. A1 | | | 7,314 | | | | 406,658 | |
|
| |
Tobacco—0.9% | | | | | | | | |
| |
Altria Group, Inc. | | | 32,102 | | | | 2,170,737 | |
| |
Philip Morris International, Inc. | | | 15,420 | | | | 1,410,776 | |
| | | | | | | | |
| | | | | | | 3,581,513 | |
|
| |
Energy—7.3% | | | | | | | | |
| |
Energy Equipment & Services—0.3% | | | | | |
| |
Halliburton Co. | | | 11,041 | | | | 597,208 | |
| |
Schlumberger Ltd. | | | 6,359 | | | | 533,838 | |
| |
Vantage Drilling International1 | | | 447 | | | | 46,264 | |
| | | | | | | | |
| | | | | | | 1,177,310 | |
|
| |
Oil, Gas & Consumable Fuels—7.0% | | | | | |
| |
Arch Coal, Inc., Cl. A1 | | | 139 | | | | 10,849 | |
| |
Buckeye Partners LP2 | | | 14,390 | | | | 952,042 | |
| |
Canadian Natural Resources Ltd. | | | 14,945 | | | | 476,294 | |
| |
Chevron Corp. | | | 11,886 | | | | 1,398,982 | |
| |
ConocoPhillips | | | 22,344 | | | | 1,120,328 | |
| |
Energy Transfer Equity LP2 | | | 87,985 | | | | 1,698,990 | |
| |
Energy Transfer Partners LP2 | | | 44,716 | | | | 1,601,280 | |
| |
Enterprise Products Partners LP2 | | | 60,120 | | | | 1,625,645 | |
| |
EOG Resources, Inc. | | | 8,076 | | | | 816,484 | |
| |
EQT Midstream Partners LP2 | | | 8,395 | | | | 643,729 | |
| |
Genesis Energy LP2 | | | 21,345 | | | | 768,847 | |
| |
Halcon Resources Corp.1 | | | 7,505 | | | | 70,097 | |
| |
Magellan Midstream Partners LP2 | | | 21,715 | | | | 1,642,305 | |
| |
MPLX LP2 | | | 37,187 | | | | 1,287,414 | |
| |
Newfield Exploration Co.1 | | | 13,541 | | | | 548,410 | |
| |
Noble Energy, Inc.3 | | | 23,368 | | | | 889,386 | |
| |
NuStar Energy LP2 | | | 3,420 | | | | 170,316 | |
| |
NuStar GP Holdings LLC2 | | | 14,255 | | | | 411,969 | |
| |
Occidental Petroleum Corp. | | | 16,887 | | | | 1,202,861 | |
| |
Pacific Ethanol, Inc.1 | | | 7,742 | | | | 73,549 | |
| | | | | | | | |
| | | Shares | | | Value | |
| |
Oil, Gas & Consumable Fuels (Continued) | | | | | |
| |
Plains All American Pipeline LP2 | | | 20,030 | | | $ | 646,769 | |
| |
Rice Midstream Partners LP1,2,4,5 | | | 29,925 | | | | 735,557 | |
| |
Rice Midstream Partners LP2,5 | | | 800 | | | | 19,664 | |
| |
SandRidge Energy, Inc.1 | | | 1,128 | | | | 26,564 | |
| |
Sunoco Logistics Partners LP2 | | | 58,775 | | | | 1,411,776 | |
| |
Tallgrass Energy GP LP, Cl. A | | | 45,777 | | | | 1,226,824 | |
| |
Tallgrass Energy Partners LP2 | | | 4,600 | | | | 218,270 | |
| |
Targa Resources Corp.3 | | | 22,912 | | | | 1,284,676 | |
| |
TC PipeLines LP2 | | | 30,395 | | | | 1,788,442 | |
| |
Tesoro Logistics LP2 | | | 9,445 | | | | 479,900 | |
| |
TransMontaigne Partners LP2 | | | 6,045 | | | | 267,612 | |
| |
Valero Energy Corp. | | | 6,541 | | | | 446,881 | |
| |
Western Gas Partners LP2 | | | 7,235 | | | | 425,129 | |
| |
Westmoreland Coal Co.1 | | | 6,660 | | | | 117,682 | |
| |
Williams Cos., Inc. (The) | | | 29,970 | | | | 933,266 | |
| |
Williams Partners LP2 | | | 24,917 | | | | 947,594 | |
| | | | | | | | |
| | | | | | | 28,386,383 | |
|
| |
Financials—5.8% | | | | | | | | |
| |
Capital Markets—0.2% | | | | | | | | |
| |
Goldman Sachs Group, Inc. (The) | | | 4,212 | | | | 1,008,563 | |
|
| |
Commercial Banks—0.9% | | | | | | | | |
| |
Atlantic Capital Bancshares, Inc.1 | | | 246 | | | | 4,674 | |
| |
JPMorgan Chase & Co. | | | 4,660 | | | | 402,111 | |
| |
M&T Bank Corp.3 | | | 17,515 | | | | 2,739,872 | |
| |
Wells Fargo & Co. | | | 7,790 | | | | 429,307 | |
| | | | | | | | |
| | | | | | | 3,575,964 | |
|
| |
Insurance—1.3% | | | | | | | | |
| |
Allstate Corp. (The) | | | 27,460 | | | | 2,035,335 | |
| |
Chubb Ltd. | | | 20,725 | | | | 2,738,187 | |
| |
Endurance Specialty Holdings Ltd. | | | 4,264 | | | | 393,994 | |
| |
Enstar Group Ltd.1 | | | 175 | | | | 34,597 | |
| | | | | | | | |
| | | | | | | 5,202,113 | |
|
| |
Real Estate Investment Trusts (REITs)—2.8% | |
| |
Acadia Realty Trust | | | 5,200 | | | | 169,936 | |
| |
Agree Realty Corp. | | | 1,330 | | | | 61,246 | |
| |
American Assets Trust, Inc. | | | 13,015 | | | | 560,686 | |
| |
American Campus Communities, Inc. | | | 5,280 | | | | 262,786 | |
| |
American Homes 4 Rent, Cl. A | | | 4,880 | | | | 102,382 | |
| |
Ascendas Real Estate Investment Trust | | | 69,000 | | | | 107,814 | |
| |
AvalonBay Communities, Inc. | | | 1,050 | | | | 186,007 | |
| |
Blackstone Mortgage Trust, Inc., Cl. A | | | 41,355 | | | | 1,243,545 | |
| |
Boston Properties, Inc. | | | 2,200 | | | | 276,716 | |
| |
Champion REIT | | | 92,000 | | | | 49,749 | |
| |
Charter Hall Retail REIT | | | 34,200 | | | | 104,334 | |
| |
Colony Starwood Homes | | | 4,110 | | | | 118,409 | |
| |
CyrusOne, Inc. | | | 3,810 | | | | 170,421 | |
| |
Derwent London plc | | | 930 | | | | 31,733 | |
| |
Dexus Property Group | | | 31,300 | | | | 217,871 | |
| |
Duke Realty Corp. | | | 7,440 | | | | 197,606 | |
| |
Equity One, Inc. | | | 5,680 | | | | 174,319 | |
| |
Eurocommercial Properties NV | | | 1,802 | | | | 69,376 | |
| |
Extra Space Storage, Inc. | | | 3,650 | | | | 281,926 | |
| |
First Industrial Realty Trust, Inc. | | | 4,550 | | | | 127,627 | |
| |
Fortune Real Estate Investment Trust | | | 113,000 | | | | 129,688 | |
| |
GEO Group, Inc. (The) | | | 2,570 | | | | 92,340 | |
| |
GLP J-Reit | | | 146 | | | | 168,173 | |
| |
Goodman Group | | | 29,200 | | | | 150,647 | |
| |
Great Portland Estates plc | | | 6,060 | | | | 49,837 | |
| |
Hammerson plc | | | 10,180 | | | | 71,725 | |
| |
Highwoods Properties, Inc. | | | 2,120 | | | | 108,141 | |
| |
Hudson Pacific Properties, Inc. | | | 5,430 | | | | 188,855 | |
| |
Invincible Investment Corp. | | | 85 | | | | 38,145 | |
| |
Japan Retail Fund Investment Corp. | | | 79 | | | | 160,003 | |
| |
Kilroy Realty Corp. | | | 2,730 | | | | 199,891 | |
| |
Klepierre | | | 3,540 | | | | 139,041 | |
| |
Land Securities Group plc | | | 12,850 | | | | 169,749 | |
7 OPPENHEIMER GLOBAL MULTI-ALTERNATIVES FUND/VA
| | |
CONSOLIDATED STATEMENT OF INVESTMENTS Continued |
| | | | | | | | |
| | | Shares | | | Value | |
| |
Real Estate Investment Trusts (REITs) (Continued) | |
| |
Macerich Co. (The) | | | 12,615 | | | $ | 893,647 | |
| |
Mapletree Commercial Trust | | | 46,000 | | | | 44,248 | |
| |
Mapletree Industrial Trust | | | 56,000 | | | | 63,554 | |
| |
Mid-America Apartment Communities, | | | | | | | | |
Inc. | | | 3,112 | | | | 304,727 | |
| |
Milestone Apartments Real Estate | | | | | | | | |
Investment Trust | | | 8,966 | | | | 126,879 | |
| |
Orix JREIT, Inc. | | | 32 | | | | 50,501 | |
| |
Paramount Group, Inc. | | | 7,730 | | | | 123,603 | |
| |
Physicians Realty Trust | | | 10,530 | | | | 199,649 | |
| |
Prologis, Inc. | | | 6,210 | | | | 327,826 | |
| |
Ramco-Gershenson Properties Trust | | | 4,620 | | | | 76,600 | |
| |
Regency Centers Corp. | | | 1,970 | | | | 135,832 | |
| |
Simon Property Group, Inc. | | | 2,100 | | | | 373,107 | |
| |
Spirit Realty Capital, Inc. | | | 14,560 | | | | 158,122 | |
| |
Starwood Property Trust, Inc. | | | 27,830 | | | | 610,869 | |
| |
Stockland | | | 56,200 | | | | 185,576 | |
| |
STORE Capital Corp. | | | 3,310 | | | | 81,790 | |
| |
Tanger Factory Outlet Centers, Inc. | | | 2,100 | | | | 75,138 | |
| |
Taubman Centers, Inc. | | | 1,260 | | | | 93,152 | |
| |
Unibail-Rodamco SE | | | 1,448 | | | | 345,172 | |
| |
Vastned Retail NV | | | 1,217 | | | | 47,245 | |
| |
Ventas, Inc. | | | 4,440 | | | | 277,589 | |
| |
Vicinity Centres | | | 44,600 | | | | 96,475 | |
| |
Welltower, Inc. | | | 3,960 | | | | 265,043 | |
| |
Wereldhave NV | | | 1,662 | | | | 74,733 | |
| |
Westfield Corp. | | | 15,607 | | | | 105,924 | |
| | | | | | | | |
| | | | | | | 11,317,725 | |
|
| |
Real Estate Management & Development—0.4% | |
| |
Cheung Kong Property Holdings Ltd. | | | 18,000 | | | | 109,155 | |
| |
China Resources Land Ltd. | | | 52,000 | | | | 117,242 | |
| |
Frasers Logistics & Industrial Trust1 | | | 128,000 | | | | 81,654 | |
| |
Henderson Land Development Co. Ltd. | | | 25,100 | | | | 132,501 | |
| |
Hongkong Land Holdings Ltd. | | | 5,000 | | | | 31,554 | |
| |
Hulic Co. Ltd. | | | 10,600 | | | | 94,023 | |
| |
Mitsubishi Estate Co. Ltd. | | | 10,100 | | | | 200,208 | |
| |
Mitsui Fudosan Co. Ltd. | | | 10,000 | | | | 230,754 | |
| |
Sun Hung Kai Properties Ltd. | | | 6,000 | | | | 75,121 | |
| |
Unite Group plc (The) | | | 15,050 | | | | 112,509 | |
| |
Vonovia SE | | | 8,656 | | | | 281,959 | |
| |
Wharf Holdings Ltd. (The) | | | 15,000 | | | | 98,573 | |
| | | | | | | | |
| | | | | | | 1,565,253 | |
|
| |
Thrifts & Mortgage Finance—0.2% | |
| |
Astoria Financial Corp. | | | 10,576 | | | | 197,243 | |
| |
Essent Group Ltd.1 | | | 1,227 | | | | 39,718 | |
| |
EverBank Financial Corp. | | | 21,078 | | | | 409,967 | |
| | | | | | | | |
| | | | | | | 646,928 | |
|
| |
Health Care—3.4% | |
| |
Biotechnology—0.3% | |
| |
Chelsea Therapeutics, Inc.1,6,7 | | | 10,531 | | | | — | |
| |
Dyax Corp.1,7 | | | 10,770 | | | | 108 | |
| |
Immunomedics, Inc.1 | | | 31,189 | | | | 114,464 | |
| |
Shire plc, ADR | | | 5,840 | | | | 995,019 | |
| | | | | | | | |
| | | | | | | 1,109,591 | |
|
| |
Health Care Equipment & Supplies—0.4% | |
| |
Medtronic plc | | | 15,942 | | | | 1,135,548 | |
| |
Vascular Solutions, Inc.1 | | | 7,727 | | | | 433,485 | |
| | | | | | | | |
| | | | | | | 1,569,033 | |
|
| |
Health Care Providers & Services—1.6% | |
| |
Capital Senior Living Corp.1 | | | 9,039 | | | | 145,076 | |
| |
Cigna Corp. | | | 7,410 | | | | 988,420 | |
| |
Express Scripts Holding Co.1 | | | 12,140 | | | | 835,111 | |
| |
HCA Holdings, Inc.1 | | | 12,205 | | | | 903,414 | |
| |
Team Health Holdings, Inc.1 | | | 14,878 | | | | 646,449 | |
| |
UnitedHealth Group, Inc.3 | | | 16,215 | | | | 2,595,049 | |
| | | | | | | | |
| | | Shares | | | Value | |
| |
Health Care Providers & Services (Continued) | |
| |
Universal Health Services, Inc., Cl. B | | | 3,225 | | | $ | 343,075 | |
| | | | | | | | |
| | | | | | | 6,456,594 | |
|
| |
Pharmaceuticals—1.1% | |
| |
Allergan plc1,3 | | | 6,680 | | | | 1,402,867 | |
| |
Ambit Biosciences Corp.1,7 | | | 10,347 | | | | 6,208 | |
| |
Bristol-Myers Squibb Co. | | | 6,630 | | | | 387,457 | |
| |
Durata Therapeutics1,7 | | | 6,530 | | | | — | |
| |
Merck & Co., Inc. | | | 16,755 | | | | 986,367 | |
| |
Novartis AG, Sponsored ADR | | | 13,050 | | | | 950,562 | |
| |
Roche Holding AG | | | 4,211 | | | | 959,490 | |
| |
Teva Pharmaceutical Industries Ltd.1 | | | 10 | | | | — | |
| | | | | | | | |
| | | | | | | 4,692,951 | |
|
| |
Industrials—4.3% | |
| |
Aerospace & Defense—1.4% | |
| |
Arconic, Inc. | | | 6,794 | | | | 125,961 | |
| |
L-3 Communications Holdings, Inc. | | | 7,420 | | | | 1,128,656 | |
| |
Lockheed Martin Corp. | | | 8,715 | | | | 2,178,227 | |
| |
Northrop Grumman Corp. | | | 5,320 | | | | 1,237,326 | |
| |
Raytheon Co. | | | 6,130 | | | | 870,460 | |
| | | | | | | | |
| | | | | | | 5,540,630 | |
|
| |
Airlines—0.2% | |
| |
United Continental Holdings, Inc.1 | | | 10,260 | | | | 747,749 | |
|
| |
Building Products—0.0% | |
| |
Griffon Corp. | | | 333 | | | | 8,725 | |
|
| |
Commercial Services & Supplies—1.1% | |
| |
G&K Services, Inc., Cl. A | | | 4,181 | | | | 403,257 | |
| |
Johnson Controls International plc3 | | | 36,340 | | | | 1,496,845 | |
| |
Republic Services, Inc., Cl. A3 | | | 41,520 | | | | 2,368,716 | |
| | | | | | | | |
| | | | | | | 4,268,818 | |
|
| |
Construction & Engineering—0.0% | |
| |
Great Lakes Dredge & Dock Corp.1 | | | 18,935 | | | | 79,527 | |
|
| |
Industrial Conglomerates—1.3% | |
| |
General Electric Co.3 | | | 71,100 | | | | 2,246,760 | |
| |
Honeywell International, Inc.3 | | | 26,420 | | | | 3,060,757 | |
| | | | | | | | |
| | | | | | | 5,307,517 | |
|
| |
Machinery—0.2% | |
| |
CLARCOR, Inc. | | | 5,207 | | | | 429,421 | |
| |
Joy Global, Inc. | | | 14,601 | | | | 408,828 | |
| | | | | | | | |
| | | | | | | 838,249 | |
|
| |
Road & Rail—0.1% | |
| |
Union Pacific Corp. | | | 4,030 | | | | 417,830 | |
|
| |
Information Technology—3.2% | |
| |
Communications Equipment—0.5% | |
| |
Aerohive Networks, Inc.1 | | | 41,242 | | | | 235,079 | |
| |
Brocade Communications Systems, Inc. | | | 34,432 | | | | 430,056 | |
| |
Cisco Systems, Inc. | | | 44,380 | | | | 1,341,164 | |
| | | | | | | | |
| | | | | | | 2,006,299 | |
|
| |
Electronic Equipment, Instruments, & Components—0.1% | |
| |
InvenSense, Inc., Cl. A1 | | | 33,498 | | | | 428,439 | |
|
| |
Internet Software & Services—0.8% | |
| |
Alphabet, Inc., Cl. A1,3 | | | 4,246 | | | | 3,364,743 | |
| |
Benefitfocus, Inc.1 | | | 373 | | | | 11,078 | |
| |
| Endurance International Group Holdings, Inc.1 | | | 1,305 | | | | 12,136 | |
| |
Limelight Networks, Inc.1 | | | 1,344 | | | | 3,387 | |
| | | | | | | | |
| | | | | | | 3,391,344 | |
|
| |
IT Services—0.1% | |
| |
MoneyGram International, Inc.1 | | | 360 | | | | 4,252 | |
| |
NeuStar, Inc., Cl. A1 | | | 12,933 | | | | 431,962 | |
| | | | | | | | |
| | | | | | | 436,214 | |
|
| |
Semiconductors & Semiconductor Equipment—1.0% | |
| |
Exar Corp.1 | | | 12,379 | | | | 133,446 | |
8 OPPENHEIMER GLOBAL MULTI-ALTERNATIVES FUND/VA
| | | | | | | | |
| | | Shares | | | Value | |
| |
Semiconductors & Semiconductor Equipment (Continued) | |
| |
Hanergy Thin Film Power Group Ltd.1 | | | 161,121 | | | $ | 2 | |
| |
Intersil Corp., Cl. A | | | 18,072 | | | | 403,006 | |
| |
Lattice Semiconductor Corp.1 | | | 53,020 | | | | 390,227 | |
| |
QUALCOMM, Inc.3 | | | 10,880 | | | | 709,376 | |
| |
Xilinx, Inc.3 | | | 37,385 | | | | 2,256,932 | |
| | | | | | | | |
| | | | | | | 3,892,989 | |
|
| |
Software—0.1% | |
| |
Mentor Graphics Corp. | | | 11,510 | | | | 424,604 | |
|
| |
Technology Hardware, Storage & Peripherals—0.6% | |
| |
Apple, Inc. | | | 20,000 | | | | 2,316,400 | |
| |
Diebold Nixdorf, Inc. | | | 4,335 | | | | 109,025 | |
| | | | | | | | |
| | | | | | | 2,425,425 | |
|
| |
Materials—1.7% | |
| |
Chemicals—0.8% | |
| |
Celanese Corp., Cl. A3 | | | 17,230 | | | | 1,356,690 | |
| |
Chemtura Corp.1 | | | 12,027 | | | | 399,297 | |
| |
Methanex Corp. | | | 25,342 | | | | 1,109,980 | |
| |
Westlake Chemical Partners LP2 | | | 17,512 | | | | 380,010 | |
| | | | | | | | |
| | | | | | | 3,245,977 | |
|
| |
Construction Materials—0.1% | |
| |
Headwaters, Inc.1 | | | 17,852 | | | | 419,879 | |
|
| |
Containers & Packaging—0.7% | |
| |
Packaging Corp. of America | | | 13,320 | | | | 1,129,802 | |
| |
Sonoco Products Co.3 | | | 31,420 | | | | 1,655,834 | |
| | | | | | | | |
| | | | | | | 2,785,636 | |
|
| |
Metals & Mining—0.1% | |
| |
Stillwater Mining Co.1 | | | 23,974 | | | | 386,221 | |
|
| |
Telecommunication Services—1.0% | |
| |
Diversified Telecommunication Services—1.0% | |
| |
AT&T, Inc.3 | | | 28,570 | | | | 1,215,082 | |
| |
BCE, Inc. | | | 27,865 | | | | 1,204,882 | |
| |
Inteliquent, Inc. | | | 18,977 | | | | 434,953 | |
| |
Verizon Communications, Inc. | | | 21,950 | | | | 1,171,691 | |
| | | | | | | | |
| | | | | | | 4,026,608 | |
|
| |
Wireless Telecommunication Services—0.0% | |
| |
NII Holdings, Inc.1 | | | 605 | | | | 1,301 | |
|
| |
Utilities—0.9% | |
| |
Electric Utilities—0.7% | |
| |
Edison International | | | 25,985 | | | | 1,870,660 | |
| |
PG&E Corp. | | | 16,490 | | | | 1,002,098 | |
| | | | | | | | |
| | | | | | | 2,872,758 | |
|
| |
Independent Power and Renewable Electricity Producers—0.0% | |
| |
NRG Energy, Inc. | | | 171 | | | | 2,099 | |
|
| |
Multi-Utilities—0.2% | |
CMS Energy Corp. | | | 15,510 | | | | 645,526 | |
| | | | | | | | |
Total Common Stocks (Cost $109,430,002) | | | | 121,426,755 | |
|
| |
Preferred Stocks—0.3% | | | | | | | | |
| |
Kinesis 2017 Sidecar, Preferred1 | | | 49,261 | | | | 482,758 | |
| |
| M&T Bank Corp., 6.375% Cum., Series A, Non-Vtg. | | | 340 | | | | 343,400 | |
| |
| M&T Bank Corp., 6.375% Cum., Series C, Non-Vtg. | | | 475 | | | | 479,750 | |
| | | | | | | | |
Total Preferred Stocks (Cost $1,345,454) | | | | | | | 1,305,908 | |
| | |
| | | Units | | | | |
| |
Rights, Warrants and Certificates—0.0% | | | | | |
| |
| Halcon Resources Corp. Wts., Strike Price $14.04, Exp. 9/9/201 | | | 2,038 | | | | 4,891 | |
| |
| Kaisa Group Holdings Ltd. Rts., Strike Price 1SGD, Exp. 12/31/491 | | | 231 | | | | 2 | |
| |
SandRidge Energy, Inc., Wts., Strike Price $41.34, Exp. 10/3/221 | | | 977 | | | | 3,419 | |
| | | | | | | | |
| | | Units | | | Value | |
| |
Rights, Warrants and Certificates (Continued) | |
| |
| SandRidge Energy, Inc., Wts., Strike Price $42.03, Exp. 10/3/221 | | | 411 | | | $ | 1,665 | |
| | | | | | | | |
| Total Rights, Warrants and Certificates (Cost $70,284) | | | | | | | 9,977 | |
| | | Principal
Amount | | | | |
| |
Asset-Backed Securities—4.0% | |
| |
| Airspeed Ltd., Series 2007-1A, Cl. G1, 0.974%, 6/15/328,9 | | $ | 4,041,730 | | | | 3,191,669 | |
| |
| Bear Stearns Structured Products Trust, Series 2007-EMX1, Cl. A2, 2.056%, 3/25/378,9 | | | 1,600,000 | | | | 1,534,597 | |
| |
| Blade Engine Securitization Ltd., Series 2006-1AW, Cl. A1, 1.004%, 9/15/414,9 | | | 1,112,285 | | | | 730,088 | |
| |
| GSAMP Trust, Series 2005-HE4, Cl. M3, 1.276%, 7/25/459 | | | 1,400,000 | | | | 1,200,333 | |
| |
| JP Morgan Mortgage Acquisition Corp., Series 2005-OPT2, Cl. M2, 1.206%, 12/25/359 | | | 1,836,000 | | | | 1,763,270 | |
| |
| Morgan Stanley ABS Capital I, Inc. Trust, Series 2006-NC1, Cl. M1, 1.136%, 12/25/359 | | | 1,780,000 | | | | 1,612,020 | |
| |
| New Century Home Equity Loan Trust, Series 2005-1, Cl. M2, 1.476%, 3/25/359 | | | 517,001 | | | | 443,196 | |
| |
| Raspro Trust, Series 2005-1A, Cl. G, 1.397%, 3/23/248,9 | | | 1,990,983 | | | | 1,923,696 | |
| |
| SG Mortgage Securities Trust, Series 2005-OPT1, Cl. M2, 1.206%, 10/25/359 | | | 4,250,000 | | | | 3,666,393 | |
| | | | | | | | |
| Total Asset-Backed Securities (Cost $16,269,070) | | | | | | | 16,065,262 | |
|
| |
Mortgage-Backed Obligation—0.5% | | | | | |
| |
| RAMP Trust, Series 2005-RS6, Cl. M4, 1.731%, 6/25/359 (Cost $2,060,390) | | | 2,300,000 | | | | 2,064,231 | |
|
| |
| Foreign Government Obligations—1.9% | |
| Federative Republic of Brazil Nota Do Tesouro Nacional Unsec. Nts., 11.779%, 7/1/1712 | | BRL | 10,400,000 | | | | 3,014,770 | |
| |
| Kingdom of Spain Sr. Unsec. Bonds, 3.80%, 1/31/178 | | EUR | 4,350,000 | | | | 4,593,758 | |
| | | | | | | | |
| Total Foreign Government Obligations (Cost $7,795,338) | | | | | | | 7,608,528 | |
|
| |
Non-Convertible Corporate Bonds and Notes—8.6% | |
| |
| 1011778 B.C. ULC/New Red Finance, Inc., 6% Sec. Nts., 4/1/228 | | | 350,000 | | | | 366,625 | |
| |
| Alcatel-Lucent USA, Inc., 6.45% Sr. Unsec. Nts., 3/15/29 | | | 350,000 | | | | 366,625 | |
| |
| Arconic, Inc., 5.40% Sr. Unsec. Nts., 4/15/21 | | | 300,000 | | | | 319,125 | |
| |
| Ardagh Packaging Finance plc/Ardagh Holdings USA, Inc., 7.25% Sr. Unsec. Nts., 5/15/248 | | | 350,000 | | | | 370,125 | |
| |
| Bancolombia SA, 5.125% Unsec. Sub. Nts., 9/11/22 | | | 350,000 | | | | 357,437 | |
| |
| Bank of America Corp., 8% Jr. Sub. Perpetual Bonds, Series K9,10 | | | 1,666,000 | | | | 1,713,897 | |
| |
| BMC Software Finance, Inc., 8.125% Sr. Unsec. Nts., 7/15/218 | | | 350,000 | | | | 328,781 | |
| |
| CCO Holdings LLC/CCO Holdings Capital Corp., 5.125% Sr. Unsec. Nts., 5/1/238 | | | 200,000 | | | | 206,500 | |
| |
| Cemex Finance LLC, 6% Sr. Sec. Nts., 4/1/248 | | | 350,000 | | | | 360,500 | |
9 OPPENHEIMER GLOBAL MULTI-ALTERNATIVES FUND/VA
| | |
CONSOLIDATED STATEMENT OF INVESTMENTS Continued |
| | | | | | | | |
| | | Principal
Amount | | | Value | |
| |
Non-Convertible Corporate Bonds and Notes (Continued) | |
| |
| Cenovus Energy, Inc., 6.75% Sr. Unsec. Nts., 11/15/39 | | $ | 300,000 | | | $ | 335,004 | |
| |
| Centene Corp., 5.625% Sr. Unsec. Nts., 2/15/21 | | | 300,000 | | | | 316,170 | |
| |
| Cequel Communications Holdings I LLC/Cequel Capital Corp., 6.375% Sr. Unsec. Nts., 9/15/208 | | | 250,000 | | | | 258,125 | |
| |
| Charter Communications Operating LLC/Charter Communications Operating Capital, 4.908% Sr. Sec. Nts., 7/23/25 | | | 300,000 | | | | 316,324 | |
| |
| CHC Helicopter SA, 9.25% Sr. Sec. Nts., 10/15/206 | | | 90,000 | | | | 43,200 | |
| |
| China Evergrande Group, 8.75% Sr. Unsec. Nts., 10/30/188 | | | 200,000 | | | | 204,000 | |
| |
| Citigroup, Inc., 5.875% Jr. Sub. Perpetual Bonds9,10 | | | 1,783,000 | | | | 1,803,059 | |
| |
| Columbus Cable Barbados Ltd., 7.375% Sr. Unsec. Nts., 3/30/218 | | | 200,000 | | | | 213,578 | |
| |
| CommScope Technologies Finance LLC, 6% Sr. Unsec. Nts., 6/15/258 | | | 300,000 | | | | 319,500 | |
| |
| Concho Resources, Inc., 5.50% Sr. Unsec. Unsub. Nts., 4/1/23 | | | 300,000 | | | | 312,390 | |
| |
| CONSOL Energy, Inc., 5.875% Sr. Unsec. Nts., 4/15/22 | | | 300,000 | | | | 295,500 | |
| |
| Continental Resources, Inc., 5% Sr. Unsec. Nts., 9/15/22 | | | 350,000 | | | | 354,599 | |
| |
| Crown Castle International Corp., 5.25% Sr. Unsec. Nts., 1/15/23 | | | 350,000 | | | | 378,000 | |
| |
| CSC Holdings LLC, 10.875% Sr. Unsec. Nts., 10/15/258 | | | 350,000 | | | | 417,375 | |
| |
| DaVita, Inc.: | | | | | | | | |
| 5.125% Sr. Unsec. Nts., 7/15/24 | | | 550,000 | | | | 549,656 | |
| 5.75% Sr. Unsec. Nts., 8/15/22 | | | 200,000 | | | | 209,750 | |
| |
| Digicel Group Ltd., 8.25% Sr. Unsec. Nts., 9/30/208 | | | 200,000 | | | | 172,594 | |
| |
| DISH DBS Corp., 5.875% Sr. Unsec. Nts., 7/15/22 | | | 350,000 | | | | 369,250 | |
| |
| Dollar Tree, Inc., 5.75% Sr. Sec. Nts., 3/1/23 | | | 250,000 | | | | 265,955 | |
| |
| Energy Future Intermediate Holding Co. LLC/EFIH Finance, Inc., 12.25% Sec. Nts., 3/1/226,8 | | | 1,027,487 | | | | 1,402,520 | |
| |
| EP Energy LLC/Everest Acquisition Finance, Inc., 9.375% Sr. Unsec. Nts., 5/1/20 | | | 300,000 | | | | 278,061 | |
| |
| FirstEnergy Corp., 7.375% Sr. Unsec. Nts., 11/15/31 | | | 350,000 | | | | 451,411 | |
| |
| FMG Resources August 2006 Pty Ltd., 9.75% Sr. Sec. Nts., 3/1/228 | | | 350,000 | | | | 407,774 | |
| |
| Gazprom OAO Via Gaz Capital SA, 9.25% Sr. Unsec. Nts., 4/23/198 | | | 300,000 | | | | 340,416 | |
| |
| Goldman Sachs Capital II, 4% Jr. Sub. Perpetual Bonds9,10 | | | 8,000 | | | | 6,549 | |
| |
| Goldman Sachs Group, Inc. (The), 5.70% Jr. Sub. Perpetual Bonds, Series L9,10 | | | 168,000 | | | | 172,376 | |
| |
| HCA, Inc., 6.50% Sr. Sec. Nts., 2/15/20 | | | 250,000 | | | | 274,125 | |
| |
| Hexion, Inc., 8.875% Sec. Nts., 2/1/18 | | | 300,000 | | | | 300,000 | |
| |
| Hilton Worldwide Finance LLC/Hilton Worldwide Finance Corp., 5.625% Sr. Unsec. Nts., 10/15/21 | | | 250,000 | | | | 258,267 | |
| |
| HUB International Ltd., 7.875% Sr. Unsec. Nts., 10/1/218 | | | 250,000 | | | | 264,728 | |
| |
| Icahn Enterprises LP/Icahn Enterprises Finance Corp., 6% Sr. Unsec. Nts., 8/1/20 | | | 350,000 | | | | 359,188 | |
| |
| iHeartCommunications, Inc., 9% Sr. Sec. Nts., 12/15/19 | | | 300,000 | | | | 246,375 | |
| | | | | | | | |
| | | Principal
Amount | | | Value | |
| |
Non-Convertible Corporate Bonds and Notes (Continued) | |
| |
| Intelsat Jackson Holdings SA, 7.25% Sr. Unsec. Nts., 10/15/20 | | $ | 300,000 | | | $ | 234,000 | |
| |
| Itau Unibanco Holding SA (Cayman Islands), 5.125% Sub. Nts., 5/13/238 | | | 300,000 | | | | 297,750 | |
| |
| JPMorgan Chase & Co., 7.90% Jr. Sub. Perpetual Bonds, Series 19,10 | | | 1,653,000 | | | | 1,713,748 | |
| |
| Laureate Education, Inc., 10% Sr. Unsec. Nts., 9/1/198 | | | 400,000 | | | | 410,500 | |
| |
| Lukoil International Finance BV: 4.563% Sr. Unsec. Unsub. Nts., 4/24/238 | | | 250,000 | | | | 252,898 | |
| 6.125% Sr. Unsec. Nts., 11/9/208 | | | 2,729,000 | | | | 2,965,593 | |
| |
| MGM Resorts International, 7.75% Sr. Unsec. Nts., 3/15/22 | | | 250,000 | | | | 288,125 | |
| |
| MMC Energy, Inc., 8.875% Sr. Unsec. Nts., 10/15/206,7 | | | 100,000 | | | | — | |
| |
| Momentive Performance Materials, Inc., 3.88% Sr. Sec. Nts., 10/24/21 | | | 200,000 | | | | 189,000 | |
| |
| NGPL PipeCo LLC, 7.119% Sr. Sec. Nts., 12/15/178 | | | 350,000 | | | | 366,625 | |
| |
| Nielsen Finance LLC/Nielsen Finance Co., 5% Sr. Unsec. Nts., 4/15/228 | | | 350,000 | | | | 357,438 | |
| |
| OAS Financial Ltd., 8% Sr. Unsec. Nts., 7/2/214,6 | | | 200,000 | | | | 9,400 | |
| |
| Offshore Group Investment Ltd., 7.50% 1st Lien Nts., 11/1/196,7 | | | 250,000 | | | | — | |
| |
| Ortho-Clinical Diagnostics, Inc./Ortho-Clinical Diagnostics SA, 6.625% Sr. Unsec. Nts., 5/15/228 | | | 400,000 | | | | 356,000 | |
| |
| Post Holdings, Inc., 5% Sr. Unsec. Nts., 8/15/268 | | | 350,000 | | | | 336,000 | |
| |
| Reynolds Group Issuer, Inc./Reynolds Group Issuer LLC/Reynolds Group Issuer Luxembourg SA, 5.75% Sr. Sec. Nts., 10/15/20 | | | 350,000 | | | | 361,375 | |
| |
| Rio Oil Finance Trust, 9.25% Sr. Sec. Nts., 7/6/248 | | | 321,521 | | | | 303,837 | |
| |
| Sabine Pass Liquefaction LLC, 5.625% Sr. Sec. Nts., 2/1/21 | | | 300,000 | | | | 322,500 | |
| |
| Samson Investment Co., 9.75% Sr. Unsec. Nts., 2/15/206 | | | 300,000 | | | | 16,125 | |
| |
| Sandridge Energy, Inc., 7.50% Sr. Unsec. Nts., 3/15/216,7 | | | 500,000 | | | | 50 | |
| |
| Scientific Games International, Inc., 10% Sr. Unsec. Nts., 12/1/22 | | | 300,000 | | | | 300,000 | |
| |
| Sirius XM Radio, Inc., 6% Sr. Unsec. Nts., 7/15/248 | | | 350,000 | | | | 366,625 | |
| |
| SoftBank Group Corp., 4.50% Sr. Unsec. Nts., 4/15/208 | | | 200,000 | | | | 205,500 | |
| |
| Solera LLC/Solera Finance, Inc., 10.50% Sr. Unsec. Nts., 3/1/248 | | | 350,000 | | | | 395,500 | |
| |
| Springleaf Finance Corp., 6.90% Sr. Unsec. Nts., 12/15/17 | | | 400,000 | | | | 418,120 | |
| |
| Sprint Corp., 7.875% Sr. Unsec. Nts., 9/15/23 | | | 300,000 | | | | 321,000 | |
| |
| Talen Energy Supply LLC, 4.625% Sr. Unsec. Nts., 7/15/198 | | | 250,000 | | | | 238,125 | |
| |
| T-Mobile USA, Inc., 6.625% Sr. Unsec. Nts., 4/1/23 | | | 350,000 | | | | 371,875 | |
| |
| TransDigm, Inc., 6.50% Sr. Sub. Nts., 7/15/24 | | | 350,000 | | | | 367,938 | |
| |
| United Rentals North America, Inc., 7.625% Sr. Unsec. Nts., 4/15/22 | | | 142,000 | | | | 150,165 | |
| |
| Univision Communications, Inc., 5.125% Sr. Sec. Nts., 2/15/258 | | | 300,000 | | | | 288,000 | |
| |
| Vantage Drilling International, 10% Sec. Nts., 12/31/20 | | | 7,000 | | | | 6,370 | |
| |
| VTR Finance BV, 6.875% Sr. Sec. Nts., 1/15/248 | | | 400,000 | | | | 414,000 | |
10 OPPENHEIMER GLOBAL MULTI-ALTERNATIVES FUND/VA
| | | | | | | | |
| | | Principal
Amount | | | Value | |
| |
Non-Convertible Corporate Bonds and Notes (Continued) | |
| |
| Wachovia Capital Trust III, 5.57% Jr. Sub. Perpetual Bonds9,10 | | $ | 1,842,000 | | | $ | 1,809,857 | |
| |
| Wells Fargo & Co., 7.98% Jr. Sub. Perpetual Bonds, Series K9,10 | | | 1,597,000 | | | | 1,670,861 | |
| |
| Western Digital Corp., 10.50% Sr. Unsec. Nts., 4/1/248 | | | 300,000 | | | | 355,500 | |
| |
| Williams Partners LP/ACMP Finance Corp., 4.875% Sr. Unsec. Nts., 5/15/23 | | | 350,000 | | | | 356,607 | |
| |
| Wind Acquisition Finance SA, 7.375% Sec. Nts., 4/23/218 | | | 400,000 | | | | 417,000 | |
| |
| Wynn Las Vegas LLC/Wynn Las Vegas Capital Corp., 5.50% Sr. Unsec. Nts., 3/1/258 | | | 250,000 | | | | 248,625 | |
| |
| Wynn Macau Ltd., 5.25% Sr. Unsec. Nts., 10/15/218 | | | 200,000 | | | | 202,500 | |
| |
| Zayo Group LLC/Zayo Capital, Inc., 6% Sr. Unsec. Nts., 4/1/23 | | | 300,000 | | | | 313,500 | |
| |
| ZF North America Capital, Inc., 4.75% Sr. Unsec. Nts., 4/29/258 | | | 300,000 | | | | 306,375 | |
| | | | | | | | |
| Total Non-Convertible Corporate Bonds and Notes (Cost $34,011,226) | | | | | | | 34,590,441 | |
| |
Convertible Corporate Bond and Note—0.1% | |
| |
Clearwire Communications LLC/Clearwire Finance, Inc., 8.25% Cv. Sr. Unsec. Nts., 12/1/404 (Cost $618,854) | | | 600,000 | | | | 628,500 | |
| |
| Corporate Loans—3.2% | | | | | | | | |
| |
| Ardagh Holdings USA, Inc., Sr. Sec. Credit Facilities 1st Lien Term Loan, Delayed Draw, 4.00%, 12/17/219,11 | | | 1,499,756 | | | | 1,518,736 | |
| |
| Delos Finance Sarl, Sr. Sec. Credit Facilities 1st Lien Term Loan, 3.748%, 2/26/219 | | | 5,330,000 | | | | 5,377,304 | |
| |
| Dynegy, Inc., Sr. Sec. Credit Facilities 1st Lien Term Loan, 4.00%, 4/23/209 | | | 472,661 | | | | 475,074 | |
| |
| Neiman Marcus Group Ltd. LLC, Sr. Sec. Credit Facilities 1st Lien Term Loan, 4.25%, 10/25/209 | | | 771,036 | | | | 674,656 | |
| |
| Pinnacle Foods Finance LLC, Sr. Sec. Credit Facilities 1st Lien Term Loan, 3.284%, 1/13/239,11 | | | 705,453 | | | | 715,741 | |
| |
| TransDigm, Inc., Sr. Sec. Credit Facilities 1st Lien Term Loan, 3.77%, 5/14/229 | | | 3,971,168 | | | | 4,003,743 | |
| | | | | | | | |
Total Corporate Loans (Cost $12,670,598) | | | | | | | 12,765,254 | |
| |
Event-Linked Bonds—13.9% | | | | | |
| |
Earthquake—3.1% | | | | | | | | |
| |
| Acorn Re Ltd. Catastrophe Linked Nts., 4.183%, 7/17/184,9 | | | 750,000 | | | | 769,987 | |
| |
| Azzurro Re I Ltd. Catastrophe Linked Nts., 2.15%, 1/16/198,9 | | EUR | 800,000 | | | | 844,688 | |
| |
| Bosphorus Ltd. Catastrophe Linked Nts., 4.341%, 8/17/184,9 | | | 500,000 | | | | 508,675 | |
| |
| Golden State Re II Ltd. Catastrophe Linked Nts., 2.713%, 1/8/198,9 | | | 1,000,000 | | | | 1,000,550 | |
| |
| Kilimanjaro Re Ltd. Catastrophe Linked Nts., 4.242%, 11/25/198,9 | | | 250,000 | | | | 253,912 | |
| |
| Kizuna Re II Ltd. Catastrophe Linked Nts.: | | | | | | | | |
| 2.742%, 4/6/188,9 | | | 950,000 | | | | 954,322 | |
| 2.992%, 4/6/188,9 | | | 750,000 | | | | 751,612 | |
| |
| Merna Re Ltd. Catastrophe Linked Nts.: | | | | | | | | |
| 2.492%, 4/9/188,9 | | | 500,000 | | | | 500,775 | |
| 2.742%, 4/8/198,9 | | | 500,000 | | | | 502,825 | |
| |
| Merna Re V Ltd. Catastrophe Linked | | | | | | | | |
| Nts., 2.492%, 4/7/178,9 | | | 750,000 | | | | 751,312 | |
| | | | | | | | |
| | | Principal
Amount | | | Value | |
| |
Earthquake (Continued) | | | | | | | | |
| |
| Nakama Re Ltd. Catastrophe Linked Nts.: | | | | | | | | |
2.622%, 1/16/198,9 | | $ | 750,000 | | | $ | 750,937 | |
2.747%, 4/13/188,9 | | | 250,000 | | | | 250,712 | |
2.997%, 4/13/188,9 | | | 500,000 | | | | 502,425 | |
3.372%, 1/16/204,9 | | | 500,000 | | | | 508,475 | |
3.372%, 1/14/218,9 | | | 250,000 | | | | 251,013 | |
3.518%, 10/13/218,9 | | | 650,000 | | | | 652,503 | |
3.747%, 1/14/218,9 | | | 250,000 | | | | 256,763 | |
4.568%, 10/13/218,9 | | | 250,000 | | | | 250,588 | |
| |
| Tramline Re II Ltd. Catastrophe Linked Nts., 3.742%, 7/7/178,9 | | | 250,000 | | | | 250,738 | |
| |
| Ursa Re Ltd. Catastrophe Linked Nts.: | | | | | | | | |
3.50%, 12/7/178,9 | | | 750,000 | | | | 754,688 | |
4.00%, 12/10/228,9 | | | 500,000 | | | | 502,175 | |
5.00%, 12/7/17-9/21/188,9 | | | 750,000 | | | | 764,763 | |
| | | | | | | | |
| | | | | | | 12,534,438 | |
|
| |
Longevity—0.0% | | | | | | | | |
| |
Vita Capital VI Ltd. Catastrophe Linked Nts., 3.647%, 1/8/218,9 | | | 250,000 | | | | 254,538 | |
| |
| Multiple Event—6.6% | | | | | | | | |
| |
| Atlas IX Capital DAC Catastrophe Linked Nts.: | | | | | | | | |
4.188%, 1/17/198,9 | | | 750,000 | | | | 763,612 | |
8.358%, 1/8/208,9 | | | 250,000 | | | | 265,812 | |
8.443%, 1/7/198,9 | | | 250,000 | | | | 256,837 | |
| |
| Blue Halo Re Ltd. Catastrophe Linked Nts.: | | | | | | | | |
| 8.742%, 7/26/198,9 | | | 250,000 | | | | 260,137 | |
| 14.492%, 6/21/198,9 | | | 500,000 | | | | 520,025 | |
| |
| Bonanza Re Ltd. Catastrophe Linked Nts.: | | | | | | | | |
| 4.703%, 12/31/198,9 | | | 250,000 | | | | 248,337 | |
| 5.953%, 12/31/198,9 | | | 250,000 | | | | 248,137 | |
| |
| Caelus Re 2013 Ltd. Catastrophe Linked Nts., 7.347%, 4/7/208,9 | | | 500,000 | | | | 507,675 | |
| |
| Caelus Re IV Ltd. Catastrophe Linked Nts., 5.997%, 3/6/208,9 | | | 750,000 | | | | 785,212 | |
| |
| Citrus Re Ltd. Catastrophe Linked Nts.: | | | | | | | | |
| 4.797%, 4/24/178,9 | | | 750,000 | | | | 757,162 | |
| 5.507%, 4/18/178,9 | | | 250,000 | | | | 252,812 | |
| |
| Cranberry Re Ltd. Catastrophe Linked Nts., 4.357%, 7/6/188,9 | | | 500,000 | | | | 513,475 | |
| |
| East Lane Re VI Ltd. Catastrophe Linked Nts.: | | | | | | | | |
| 3.147%, 3/14/188,9 | | | 750,000 | | | | 757,162 | |
| 3.887%, 3/13/208,9 | | | 500,000 | | | | 511,175 | |
| |
| Eden Re II Ltd. Catastrophe Linked Nts., 0%, 3/22/2112 | | | 500,000 | | | | 500,000 | |
| |
| Espada Re Ltd. Catastrophe Linked Nts., 1.50%, 6/6/20 | | | 250,000 | | | | 252,375 | |
| |
| Galilei Re Ltd. Catastrophe Linked Nts.: | | | | | | | | |
| 5.503%, 1/8/218,9,11 | | | 750,000 | | | | 750,000 | |
| 6.241%, 1/8/218,9,11 | | | 250,000 | | | | 250,000 | |
| 14.228%, 1/8/208,9 | | | 250,000 | | | | 250,569 | |
| |
| Galileo Re Ltd. Catastrophe Linked Nts.: | | | | | | | | |
| 14.013%, 1/8/18-1/8/198,9 | | | 750,000 | | | | 779,138 | |
| |
| Kilimanjaro Re Ltd. Catastrophe Linked Nts.: | | | | | | | | |
| 4.992%, 4/30/188,9 | | | 500,000 | | | | 510,925 | |
| 5.242%, 4/30/188,9 | | | 500,000 | | | | 512,775 | |
| 7.242%, 12/6/198,9 | | | 250,000 | | | | 259,162 | |
| 9.742%, 12/6/198,9 | | | 500,000 | | | | 522,175 | |
| |
| Laetere Re Ltd. Catastrophe Linked Nts., 9.952%, 6/6/178,12 | | | 250,000 | | | | 246,687 | |
| |
| Loma Reinsurance Ltd. Catastrophe Linked Nts.: | | | | | | | | |
| 12.232%, 1/8/188,9 | | | 200,000 | | | | 205,470 | |
| 18.232%, 1/8/188,9 | | | 500,000 | | | | 522,175 | |
| |
| Long Point Re III Ltd. Catastrophe Linked Nts., 3.75%, 5/23/188,9 | | | 250,000 | | | | 255,262 | |
| |
| PennUnion Re Ltd. Catastrophe Linked Nts., 4.997%, 12/7/188,9 | | | 500,000 | | | | 509,025 | |
11 OPPENHEIMER GLOBAL MULTI-ALTERNATIVES FUND/VA
| | |
CONSOLIDATED STATEMENT OF INVESTMENTS Continued |
| | | | | | | | |
| | | Principal
Amount | | | Value | |
| |
Multiple Event (Continued) | | | | | | | | |
| |
| Residential Reinsurance 2013 Ltd. Catastrophe Linked Nts.: | | | | | | | | |
| 5.742%, 12/6/178,9 | | $ | 500,000 | | | $ | 505,725 | |
| 8.492%, 6/6/178,9 | | | 250,000 | | | | 255,287 | |
| 20.492%, 12/6/178,9 | | | 500,000 | | | | 517,825 | |
| |
| Residential Reinsurance 2014 Ltd. Catastrophe Linked Nts.: | | | | | | | | |
| 4.102%, 6/6/188,9 | | | 750,000 | | | | 763,988 | |
| 15.572%, 6/6/188,9 | | | 500,000 | | | | 523,475 | |
| |
| Residential Reinsurance 2015 Ltd. Catastrophe Linked Nts.: | | | | | | | | |
| 7.742%, 12/6/198,9 | | | 250,000 | | | | 258,688 | |
| 11.462%, 6/6/198,9 | | | 250,000 | | | | 256,088 | |
| |
| Residential Reinsurance 2016 Ltd. Catastrophe Linked Nts.: | | | | | | | | |
| 1.981%, 12/6/208,12 | | | 250,000 | | | | 231,763 | |
| 3.742%, 6/6/208,9 | | | 750,000 | | | | 762,563 | |
| 3.992%, 12/6/238,9 | | | 500,000 | | | | 496,275 | |
| 11.992%, 6/6/208,9 | | | 250,000 | | | | 253,788 | |
| |
| Riverfront Re Ltd. Catastrophe Linked | | | | | | | | |
| Nts., 4.492%, 1/6/178,9 | | | 1,125,000 | | | | 1,128,206 | |
| |
| Sanders Re Ltd. Catastrophe Linked Nts.: | | | | | | | | |
| 3.593%, 5/25/188,9 | | | 250,000 | | | | 252,638 | |
| 3.813%, 5/25/188,9 | | | 750,000 | | | | 759,488 | |
| 4.013%, 5/5/178,9 | | | 500,000 | | | | 501,175 | |
| 4.283%, 6/7/178,9 | | | 500,000 | | | | 504,675 | |
| 4.383%, 5/28/198,9 | | | 250,000 | | | | 254,538 | |
| 4.513%, 5/5/178,9 | | | 500,000 | | | | 501,725 | |
| |
| Tradewynd Re Ltd. Catastrophe Linked Nts.: | | | | | | | | |
| 5.31%, 1/8/218,9 | | | 500,000 | | | | 507,625 | |
| 6.702%, 1/9/178,9 | | | 1,375,000 | | | | 1,379,194 | |
| 7.382%, 1/9/178,9 | | | 1,125,000 | | | | 1,128,544 | |
| 7.45%, 1/8/188,9 | | | 500,000 | | | | 512,475 | |
| 10.142%, 7/9/188,9 | | | 250,000 | | | | 270,088 | |
| |
| Tramline Re II Ltd. Catastrophe Linked | | | | | | | | |
| Nts., 10.242%, 1/4/198,9 | | | 400,000 | | | | 416,500 | |
| |
| VenTerra Re Ltd. Catastrophe Linked | | | | | | | | |
| Nts., 4.242%, 1/9/178,9 | | | 750,000 | | | | 752,138 | |
| | | | | | | | |
| | | | | | | 26,667,782 | |
|
| |
| Other—0.6% | | | | | | | | |
| |
| Benu Capital Ltd. Catastrophe Linked Nts.: | | | | | | | | |
| 2.55%, 1/8/208,9 | | EUR | 250,000 | | | | 265,084 | |
| 3.35%, 1/8/208,9 | | EUR | 500,000 | | | | 533,272 | |
| |
| Horse Capital I DAC Catastrophe | | | | | | | | |
| Linked Nts., 12%, 6/15/208,9 | | EUR | 500,000 | | | | 525,904 | |
| |
| Vitality Re IV Ltd. Catastrophe Linked | | | | | | | | |
| Nts., 4.242%, 1/9/178,9 | | | 250,000 | | | | 250,762 | |
| |
| Vitality Re V Ltd. Catastrophe Linked | | | | | | | | |
| Nts., 2.992%, 1/7/198,9 | | | 250,000 | | | | 252,312 | |
| |
| Vitality Re VI Ltd. Catastrophe Linked | | | | | | | | |
| Nts., 2.592%, 1/8/188,9 | | | 250,000 | | | | 250,413 | |
| |
| Vitality Re VII Ltd. Catastrophe Linked | | | | | | | | |
| Nts., 3.142%, 1/7/204,9 | | | 250,000 | | | | 254,138 | |
| | | | | | | | |
| | | | | | | 2,331,885 | |
|
| |
| Windstorm—3.6% | | | | | | | | |
| |
| Akibare Re Ltd. Catastrophe Linked | | | | | | | | |
| Nts., 3.818%, 4/7/208,9 | | | 750,000 | | | | 765,337 | |
| |
| Alamo Re Ltd. Catastrophe Linked Nts.: | | | | | | | | |
| 5.112%, 6/7/198,9 | | | 750,000 | | | | 787,537 | |
| 6.272%, 6/7/188,9 | | | 500,000 | | | | 517,025 | |
| |
| Aozora Re Ltd. Catastrophe Linked Nts.: | | | | | | | | |
| 2.497%, 4/7/178,9 | | JPY | 91,000,000 | | | | 780,089 | |
| 3.518%, 4/7/208,9 | | | 250,000 | | | | 253,012 | |
| |
| Calypso Capital II Ltd. Catastrophe Linked Nts.: | | | | | | | | |
| 2.88%, 1/9/178,9 | | EUR | 500,000 | | | | 526,272 | |
| 4.10%, 1/8/188,9 | | EUR | 500,000 | | | | 534,825 | |
| |
| Citrus Re Ltd. Catastrophe Linked Nts.: | | | | | | | | |
| 5.637%, 4/9/188,9 | | | 250,000 | | | | 255,637 | |
| 7.457%, 4/9/188,9 | | | 250,000 | | | | 257,587 | |
| 7.50%, 2/25/198,9 | | | 500,000 | | | | 522,225 | |
| 9.527%, 4/9/188,9 | | | 250,000 | | | | 257,162 | |
| | | | | | | | |
| | | Principal Amount | | | Value | |
| |
Windstorm (Continued) | | | | | | | | |
| |
| Citrus Re Ltd. Catastrophe Linked Nts.: (Continued) | | | | | | | | |
| 10.997%, 2/25/218,9 | | $ | 500,000 | | | $ | 524,425 | |
| |
| Everglades Re II Ltd. Catastrophe Linked Nts., 5.727%, 5/3/188,9 | | | 750,000 | | | | 768,263 | |
| |
| Everglades Re Ltd. Catastrophe Linked Nts., 7.607%, 4/28/178,9 | | | 500,000 | | | | 509,375 | |
| |
| First Coast Re 2016 Ltd. Catastrophe Linked Nts., 4.497%, 6/7/198,9 | | | 250,000 | | | | 254,513 | |
| |
| Gator Re Ltd. Catastrophe Linked Nts., 6.783%, 1/9/178,9 | | | 1,000,000 | | | | 843,750 | |
| |
| Green Fields II Capital Ltd. Catastrophe Linked Nts., 2.75%, 1/9/178,9 | | EUR | 750,000 | | | | 789,409 | |
| |
| Lion I Re Ltd. Catastrophe Linked Nts., 2.31%, 4/28/178,9 | | EUR | 750,000 | | | | 790,435 | |
| |
| Manatee Re Ltd. Catastrophe Linked Nts.: | | | | | | | | |
| 5.492%, 12/22/178,9 | | | 750,000 | | | | 757,388 | |
| 16.25%, 3/10/198 | | | 500,000 | | | | 488,300 | |
| |
| Pelican III Re Ltd. Catastrophe Linked Nts., 6.677%, 4/16/188,9 | | | 750,000 | | | | 769,763 | |
| |
| Pelican Re Ltd. Catastrophe Linked Nts., 6.497%, 5/15/178,9 | | | 500,000 | | | | 508,375 | |
| |
| Queen City Re Ltd. Catastrophe Linked Nts., 3.997%, 1/6/178,9 | | | 665,000 | | | | 666,895 | |
| |
| Queen Street IX Re DAC Catastrophe Linked Nts., 5.997%, 6/8/178,9 | | | 250,000 | | | | 251,863 | |
| |
| Queen Street X Re Ltd. Catastrophe Linked Nts., 6.247%, 6/8/188,9 | | | 250,000 | | | | 252,338 | |
| |
| Queen Street XI Re DAC Catastrophe Linked Nts., 6.647%, 6/7/198,9 | | | 250,000 | | | | 256,488 | |
| |
| Queen Street XII Re Designated Activity Co. Catastrophe Linked Nts., 6.41%, 4/8/208,9 | | | 500,000 | | | | 508,525 | |
| | | | | | | | |
| | | | | | | 14,396,813 | |
| | | | | | | | |
Total Event-Linked Bonds (Cost $56,212,349) | | | | | | | 56,185,456 | |
| |
Short-Term Notes—18.1% | | | | | | | | |
| |
France—1.0% | | | | | | | | |
French Republic Treasury Bills, 0%, 2/15/1712 | | EUR | 4,000,000 | | | | 4,214,650 | |
| |
| Italy—2.3% | | | | | | | | |
| Republic of Italy Treasury Bills: | | | | | | | | |
| 0%, 1/13/1712 | | EUR | 6,950,000 | | | | 7,316,759 | |
| 0%, 3/14/1712 | | EUR | 1,680,000 | | | | 1,770,181 | |
| | | | | | | | |
| | | | | | | 9,086,940 | |
| |
| Japan—4.3% | | | | | | | | |
| Japan Treasury Bills, 0%, 2/20/1712 | | JPY | 2,000,000,000 | | | | 17,118,871 | |
| |
| Mexico—0.4% | | | | | | | | |
United Mexican States Treasury Bills, 5.521%, 3/30/1712 | | MXN | 37,400,000 | | | | 1,777,694 | |
| |
| Portugal—0.6% | | | | | | | | |
| Portuguese Republic Treasury Bills, 0%, 1/20/1712 | | EUR | 2,245,000 | | | | 2,363,535 | |
| |
| Sweden—3.4% | | | | | | | | |
| Kingdom of Sweden Treasury Bills, 0%, 1/18/1712 | | SEK | 123,800,000 | | | | 13,593,554 | |
| |
| United States—6.1% | | | | | | | | |
| United States Treasury Bills, 0.488%, 3/9/1712,13,14 | | USD | 24,735,000 | | | | 24,713,950 | |
| | | | | | | | |
Total Short-Term Notes
(Cost $75,176,343) | | | | | | | 72,869,194 | |
| | | Shares | | | | | |
| |
| Investment Companies—15.8% | | | | | |
| |
| Highland/iBoxx Senior Loan Exchange Traded Fund | | | 111,516 | | | | 2,090,925 | |
| |
| Oppenheimer Institutional Government Money Market Fund, Cl. E, 0.43%15,16,17 | | | 57,727,699 | | | | 57,727,699 | |
| |
| SPDR Gold Trust Exchange Traded Fund1,17 | | | 34,231 | | | | 3,752,060 | |
12 OPPENHEIMER GLOBAL MULTI-ALTERNATIVES FUND/VA
| | | | | | | | |
| | | Shares | | | Value | |
Investment Companies (Continued) | |
| Total Investment Companies (Cost $63,799,739) | | | | | | $ | 63,570,684 | |
| | | | | | | | | | | | | | | | | | | | | | | | | | | | |
| | | | | | | | | Exercise Price | | | Expiration Date | | | | | | Contracts | | | Value | |
Exchange-Traded Option Purchased—0.0% | | | | | |
| S&P 500 Index Put1 (Cost $43,791) | | | | USD | | | | 2,100.000 | | | | 1/20/17 | | | | USD | | | | 13 | | | $ | 3,640 | |
| | | | | | | |
| | | Counterparty | | | | | | | | | | | | | | | | | | Value | |
Over-the-Counter Options Purchased—0.5% | | | | | |
CNH Currency Put1 | | | CITNA-B | | | | CNH | | | | 7.300 | | | | 11/29/17 | | | | CNH | | | | 53,100,000 | | | | 233,056 | |
CNH Currency Put1 | | | CITNA-B | | | | CNH | | | | 7.300 | | | | 11/29/17 | | | | CNH | | | | 10,585,000 | | | | 46,458 | |
EUR Currency Put1 | | | CITNA-B | | | | EUR | | | | 1.030 | | | | 5/12/17 | | | | EUR | | | | 18,464,000 | | | | 305,838 | |
JPY Currency Put1,18 | | | GSCO-OT | | | | JPY | | | | 117.000 | | | | 1/19/17 | | | | JPY | | | | 923,400 | | | | 433,730 | |
JPY Currency Put1 | | | BOA | | | | JPY | | | | 118.500 | | | | 6/19/17 | | | | JPY | | | | 3,283,000,000 | | | | 686,147 | |
NZD Currency Put1 | | | BOA | | | | CAD | | | | 0.935 | | | | 4/26/17 | | | | NZD | | | | 18,465,000 | | | | 326,763 | |
Total Over-the-Counter Options Purchased (Cost $1,617,185) | | | | | | | | 2,031,992 | |
| | | | | | | | | | | | | | | | | | | | | | | | | | | | | | |
| | | | Counterparty | | |
| Pay / Receive
Floating Rate |
| | Floating Rate | | | Fixed Rate | | |
| Expiration
Date |
| | | Notional Amount (000’s) | | | | | |
Over-the-Counter Interest Rate Swaptions Purchased—0.1% | | | | | | | | | | | | | | | | | | | | |
Interest Rate Swap maturing | | | | | | | | | | Six-Month JPY BBA | | | | | | | | | | | | | | | | | | | | |
11/2/27 Call1 | | | GSCOI | | | | Pay | | | LIBOR | | | 1.070% | | | | 11/20/17 | | | | JPY | | | | 560,000 | | | | 5,883 | |
Interest Rate Swap maturing | | | | | | | | | | Six-Month JPY BBA | | | | | | | | | | | | | | | | | | | | |
11/22/27 Call1 | | | GSCOI | | | | Pay | | | LIBOR | | | 1.070 | | | | 11/20/17 | | | | JPY | | | | 424,000 | | | | 4,454 | |
Interest Rate Swap maturing | | | | | | | | | | Six-Month JPY BBA | | | | | | | | | | | | | | | | | | | | |
7/25/28 Call1 | | | GSCOI | | | | Pay | | | LIBOR | | | 1.050 | | | | 7/23/18 | | | | JPY | | | | 630,000 | | | | 16,185 | |
Interest Rate Swap maturing | | | | | | | | | | Three-Month USD | | | | | | | | | | | | | | | | | | | | |
9/6/28 Call1 | | | GSCOI | | | | Pay | | | BBA LIBOR | | | 1.610 | | | | 9/4/18 | | | | USD | | | | 3,700 | | | | 333,726 | |
Total Over-the-Counter Interest Rate Swaptions Purchased (Cost $495,436) | | | | | | | | 360,248 | |
Total Investments, at Value (Cost $381,616,059) | | | | 97.1% | | | | 391,486,070 | |
Net Other Assets (Liabilities) | | | | | | | | | | | | 2.9 | | | | 11,507,100 | |
Net Assets | | | | | | | | | | | | 100.0% | | | $ | 402,993,170 | |
| | | | | | | | | | | | | | | | | |
Footnotes to Consolidated Statement of Investments
1. Non-income producing security.
2. Security is a Master Limited Partnership.
3. All or portion of the security position is held in segregated accounts and pledged to cover margin requirements with respect to securities sold short. The aggregate market value of such securities is $9,890,389. See Note 10 of accompanying Consolidated Notes.
4. Restricted security. The aggregate value of restricted securities at period end was $4,144,820, which represents 1.03% of the Fund’s net assets. See Note 4 of the accompanying Consolidated Notes. Information concerning restricted securities is as follows:
| | | | | | | | | | | | | | | | |
| Security | | Acquisition
Dates | | | Cost | | | Value | | | Unrealized
Appreciation/
(Depreciation) | |
Acorn Re Ltd. Catastrophe Linked Nts., 4.183%, 7/17/18 | | | 7/2/15 | | | $ | 750,000 | | | $ | 769,987 | | | $ | 19,987 | |
Blade Engine Securitization Ltd., Series 2006-1AW, Cl. A1, 1.004%, 9/15/41 | | | 7/25/14-8/28/14 | | | | 920,999 | | | | 730,088 | | | | (190,911) | |
Bosphorus Ltd. Catastrophe Linked Nts., 4.341%, 8/17/18 | | | 8/11/15 | | | | 500,000 | | | | 508,675 | | | | 8,675 | |
Clearwire Communications LLC/Clearwire Finance, Inc., 8.25% Cv. Sr. Unsec. Nts., 12/1/40 | | | 8/14/15 | | | | 618,854 | | | | 628,500 | | | | 9,646 | |
Nakama Re Ltd. Catastrophe Linked Nts., 3.372%, 1/16/20 | | | 12/12/14-10/9/15 | | | | 500,727 | | | | 508,475 | | | | 7,748 | |
OAS Financial Ltd., 8% Sr. Unsec. Nts., 7/2/21 | | | 9/3/14 | | | | 204,171 | | | | 9,400 | | | | (194,771) | |
Rice Midstream Partners LP | | | 10/7/16 | | | | 643,387 | | | | 735,557 | | | | 92,170 | |
Vitality Re VII Ltd. Catastrophe Linked Nts., 3.142%, 1/7/20 | | | 1/22/16 | | | | 250,000 | | | | 254,138 | | | | 4,138 | |
| | | | | | $ | 4,388,138 | | | $ | 4,144,820 | | | | $ (243,318) | |
| | | | | | | | | | | | | | | | |
5. The Fund holds securities which have been issued by the same entity and that trade on separate exchanges.
6. This security is not accruing income because the issuer has missed an interest payment on it and/or is not anticipated to make future interest and or principal payments. The rate shown is the contractual interest rate. See Note 4 of the accompanying Consolidated Notes.
7. Security received as the result of issuer reorganization.
8. Represents securities sold under Rule 144A, which are exempt from registration under the Securities Act of 1933, as amended. These securities have been determined to be liquid under guidelines established by the Board of Trustees. These securities amount to $79,353,058 or 19.69% of the Fund’s net assets at period end.
9. Represents the current interest rate for a variable or increasing rate security.
10. This bond has no contractual maturity date, is not redeemable and contractually pays an indefinite stream of interest.
11. All or a portion of the security position is when-issued or delayed delivery to be delivered and settled after period end. See Note 4 of the accompanying Consolidated Notes.
12. Zero coupon bond reflects effective yield on the original acquisition date.
13 OPPENHEIMER GLOBAL MULTI-ALTERNATIVES FUND/VA
| | |
CONSOLIDATED STATEMENT OF INVESTMENTS Continued |
Footnotes to Consolidated Statement of Investments (Continued)
13. All or a portion of the security position is held in accounts at a futures clearing merchant and pledged to cover margin requirements on open futures contracts and written options on futures, if applicable. The aggregate market value of such securities is $6,083,818. See Note 6 of the accompanying Consolidated Notes.
14. All or a portion of the security position is held in segregated accounts and pledged to cover margin requirements under certain derivative contracts. The aggregate market value of such securities is $1,666,581. See Note 6 of the accompanying Consolidated Notes.
15. Is or was an affiliate, as defined in the Investment Company Act of 1940, as amended, at or during the reporting period, by virtue of the Fund owning at least 5% of the voting securities of the issuer or as a result of the Fund and the issuer having the same investment adviser. Transactions during the reporting period in which the issuer was an affiliate are as follows:
| | | | | | | | | | | | | | | | |
| | | Shares
December 31, 2015 | | | Gross
Additions | | | Gross
Reductions | | | Shares
December 31, 2016 | |
Oppenheimer Institutional Government Money Market Fund, Cl. E a | | | 23,203,584 | | | | 358,220,893 | | | | 323,696,778 | | | | 57,727,699 | |
| | | | |
| | | | | | | | | Value | | | Income | |
Oppenheimer Institutional Government Money Market Fund, Cl. E a | | | | | | | | | | $ | 57,727,699 | | | $ | 130,187 | |
a. Prior to September 28, 2016, this fund was named Oppenheimer Institutional Money Market Fund.
16. Rate shown is the 7-day yield at period end.
17. All or a portion of this security is owned by the subsidiary. See Note 2 of the accompanying Consolidated Notes.
18. One-Touch Binary option becomes eligible for exercise if at any time spot rate is greater than or equal to 117 JPY per 1 USD.
Distribution of investments representing geographic holdings, as a percentage of total investments at value, is as follows:
| | | | | | | | | | |
| Geographic Holdings (Unaudited) | | Value | | | Percent | | | |
|
United States | | $ | 282,197,179 | | | | 72.1 | % | | |
Japan | | | 26,010,492 | | | | 6.6 | | | |
Sweden | | | 13,593,554 | | | | 3.5 | | | |
Supranational | | | 10,283,464 | | | | 2.6 | | | |
Italy | | | 9,503,940 | | | | 2.4 | | | |
France | | | 6,653,253 | | | | 1.7 | | | |
Bermuda | | | 5,073,948 | | | | 1.3 | | | |
Spain | | | 4,593,758 | | | | 1.2 | | | |
Ireland | | | 3,944,610 | | | | 1.0 | | | |
Cayman Islands | | | 3,828,450 | | | | 1.0 | | | |
Brazil | | | 3,625,757 | | | | 0.9 | | | |
Russia | | | 3,558,907 | | | | 0.9 | | | |
Canada | | | 3,492,786 | | | | 0.9 | | | |
Eurozone | | | 2,467,233 | | | | 0.6 | | | |
Portugal | | | 2,363,535 | | | | 0.6 | | | |
Mexico | | | 2,138,194 | | | | 0.5 | | | |
Switzerland | | | 1,910,052 | | | | 0.5 | | | |
Australia | | | 1,268,602 | | | | 0.3 | | | |
Hong Kong | | | 626,341 | | | | 0.2 | | | |
Germany | | | 588,334 | | | | 0.2 | | | |
Turkey | | | 508,675 | | | | 0.1 | | | |
United Kingdom | | | 435,553 | | | | 0.1 | | | |
Chile | | | 414,000 | | | | 0.1 | | | |
Colombia | | | 357,437 | | | | 0.1 | | | |
New Zealand | | | 326,763 | | | | 0.1 | | | |
China | | | 321,244 | | | | 0.1 | | | |
Singapore | | | 297,269 | | | | 0.1 | | | |
China Offshore | | | 279,513 | | | | 0.1 | | | |
Barbados | | | 213,578 | | | | 0.1 | | | |
Macau | | | 202,500 | | | | 0.1 | | | |
Netherlands | | | 191,355 | | | | 0.0 | | | |
Jamaica | | | 172,594 | | | | 0.0 | | | |
Luxembourg | | | 43,200 | | | | 0.0 | | | |
| | | |
Total | | $ | 391,486,070 | | | | 100.0 | % | | |
| | | |
| | | | | | | | |
| | | Shares Sold Short | | | Value | |
Securities Sold Short—(9.9)% | | | | | | | | |
Common Stock Securities Sold Short—(9.3)% | | | | | | | | |
AGCO Corp. | | | (26,510) | | | | $ (1,533,869) | |
Air Lease Corp., Cl. A | | | (52,605) | | | | (1,805,930 | ) |
Aircastle Ltd. | | | (24,325) | | | | (507,176 | ) |
Aker Solutions ASA1 | | | (325,366) | | | | (1,556,984 | ) |
athenahealth, Inc.1 | | | (4,430) | | | | (465,903 | ) |
Boeing Co. (The) | | | (13,220) | | | | (2,058,090 | ) |
Caterpillar, Inc. | | | (8,505) | | | | (788,754) | |
CBL & Associates Properties, Inc. | | | (45,690) | | | | (525,435 | ) |
Charter Communications, Inc., Cl. A1 | | | (5,956) | | | | (1,714,851 | ) |
Cheniere Energy, Inc.1 | | | (13,430) | | | | (556,405 | ) |
Cie Financiere Richemont SA | | | (11,321) | | | | (749,584 | ) |
14 OPPENHEIMER GLOBAL MULTI-ALTERNATIVES FUND/VA
| | | | | | | | |
Securities Sold Short—(9.9)% (Continued) | | | | | | | | |
Common Stock Securities Sold Short (Continued) | | | | | | | | |
CNH Industrial NV | | | (144,010) | | | $ | (1,251,447) | |
Colgate-Palmolive Co. | | | (16,210) | | | | (1,060,782) | |
Comcast Corp., Cl. A | | | (11,240) | | | | (776,122) | |
Deere & Co. | | | (20,200) | | | | (2,081,408) | |
Fastenal Co. | | | (21,700) | | | | (1,019,466) | |
Franklin Resources, Inc. | | | (17,010) | | | | (673,256) | |
Intel Corp. | | | (39,945) | | | | (1,448,805) | |
International Business Machines Corp. | | | (11,240) | | | | (1,865,727) | |
Kennametal, Inc. | | | (16,433) | | | | (513,695) | |
Pennsylvania Real Estate Investment Trust | | | (86,442) | | | | (1,638,940) | |
Procter & Gamble Co. (The) | | | (16,445) | | | | (1,382,696) | |
Rio Tinto plc, Sponsored ADR | | | (9,650) | | | | (371,139) | |
RLJ Lodging Trust | | | (59,040) | | | | (1,445,890) | |
SAP SE, Sponsored ADR | | | (22,250) | | | | (1,923,067) | |
Southern Copper Corp. | | | (52,550) | | | | (1,678,447) | |
Subsea 7 SA1 | | | (165,771) | | | | (2,095,425) | |
Tiffany & Co. | | | (7,520) | | | | (582,274) | |
W.W. Grainger, Inc. | | | (4,245) | | | | (985,901) | |
Walt Disney Co. (The) | | | (4,460) | | | | (464,821) | |
Weingarten Realty Investors | | | (59,980 | ) | | | (2,146,684 | ) |
| | | | | | | | |
Common Stock Securities Sold Short (Proceeds $35,120,091) | | | | | | | (37,668,973) | |
Investment Company Securities Sold Short—(0.6)% | | | | | | | | |
iShares US Preferred Stock Exchange Traded Fund (Proceeds $2,442,608) | | | (61,965 | ) | | | (2,305,719 | ) |
| | | | | | | | |
Total Securities Sold Short (Proceeds $37,562,699) | | | | | | $ | (39,974,692 | ) |
| | | | | | | | |
| | | | | | | | | | | | | | | | | | |
Forward Currency Exchange Contracts as of December 31, 2016 | |
| Counterparty | | Settlement Month(s) | | Currency Purchased (000’s) | | | | Currency Sold (000’s) | | Unrealized
Appreciation | | | Unrealized
Depreciation | |
BAC | | 02/2017 | | IDR | | 40,478,000 | | USD | | 3,007 | | $ | — | | | $ | 33,121 | |
BAC | | 01/2017 | | JPY | | 538,000 | | USD | | 4,630 | | | — | | | | 20,913 | |
BAC | | 03/2017 | | USD | | 3,020 | | CAD | | 4,065 | | | — | | | | 9,471 | |
BAC | | 02/2017 | | USD | | 3,645 | | IDR | | 49,540,000 | | | 5,602 | | | | — | |
BOA | | 01/2017 | | BRL | | 19,710 | | USD | | 5,839 | | | 217,184 | | | | — | |
BOA | | 03/2017 | | COP | | 3,037,000 | | USD | | 1,003 | | | — | | | | 2,802 | |
BOA | | 01/2017 - 03/2017 | | IDR | | 52,275,049 | | USD | | 3,879 | | | — | | | | 36,699 | |
BOA | | 03/2017 | | TWD | | 64,000 | | USD | | 2,013 | | | — | | | | 37,948 | |
BOA | | 01/2017 - 01/2017 | | USD | | 9,169 | | BRL | | 30,110 | | | — | | | | 80,979 | |
BOA | | 11/2017 | | USD | | 184 | | CNH | | 1,300 | | | 5,837 | | | | — | |
BOA | | 01/2017 | | USD | | 2,523 | | EUR | | 2,245 | | | 157,574 | | | | — | |
BOA | | 03/2017 | | USD | | 7,513 | | KRW | | 8,920,000 | | | 125,770 | | | | 29 | |
BOA | | 03/2017 | | USD | | 2,379 | | THB | | 85,000 | | | 5,808 | | | | — | |
BOA | | 03/2017 | | USD | | 1,978 | | TWD | | 64,000 | | | 2,360 | | | | — | |
BOA | | 02/2017 | | ZAR | | 18,330 | | USD | | 1,325 | | | — | | | | 3,160 | |
CITNA-B | | 01/2017 - 03/2017 | | BRL | | 13,780 | | USD | | 4,167 | | | 47,275 | | | | — | |
CITNA-B | | 01/2017 | | CAD | | 4,050 | | USD | | 2,986 | | | 31,067 | | | | — | |
CITNA-B | | 03/2017 | | EUR | | 1,585 | | USD | | 1,677 | | | — | | | | 2,806 | |
CITNA-B | | 07/2017 | | USD | | 3,022 | | BRL | | 10,400 | | | — | | | | 23,174 | |
CITNA-B | | 03/2017 | | USD | | 1,001 | | CLP | | 682,000 | | | — | | | | 13,017 | |
CITNA-B | | 01/2017 - 03/2017 | | USD | | 22,529 | | EUR | | 20,777 | | | 614,665 | | | | — | |
CITNA-B | | 03/2017 | | USD | | 769 | | TRY | | 2,760 | | | — | | | | 2,951 | |
DEU | | 01/2017 | | CAD | | 4,950 | | USD | | 3,678 | | | 8,936 | | | | — | |
DEU | | 03/2017 | | IDR | | 42,163,200 | | USD | | 3,048 | | | 49,120 | | | | — | |
DEU | | 01/2017 | | JPY | | 544,000 | | USD | | 4,630 | | | 30,575 | | | | — | |
DEU | | 01/2017 | | NZD | | 9,230 | | USD | | 6,712 | | | — | | | | 303,290 | |
DEU | | 01/2017 | | USD | | 6,735 | | CAD | | 8,995 | | | 34,069 | | | | — | |
DEU | | 03/2017 | | USD | | 1,809 | | CHF | | 1,835 | | | — | | | | 503 | |
DEU | | 01/2017 | | USD | | 3,542 | | NZD | | 5,030 | | | 49,239 | | | | — | |
DEU | | 02/2017 | | ZAR | | 38,460 | | USD | | 2,737 | | | 37,008 | | | | — | |
GSCO-OT | | 01/2017 | | BRL | | 17,730 | | USD | | 5,386 | | | 61,681 | | | | — | |
GSCO-OT | | 03/2017 | | COP | | 2,962,000 | | USD | | 976 | | | — | | | | 1,033 | |
GSCO-OT | | 03/2017 | | GBP | | 680 | | USD | | 857 | | | — | | | | 17,655 | |
GSCO-OT | | 01/2017 | | JPY | | 544,000 | | USD | | 4,629 | | | 31,417 | | | | — | |
GSCO-OT | | 03/2017 | | KRW | | 2,027,000 | | USD | | 1,704 | | | — | | | | 25,763 | |
GSCO-OT | | 03/2017 | | NOK | | 35,630 | | USD | | 4,148 | | | — | | | | 20,316 | |
GSCO-OT | | 03/2017 | | SEK | | 18,360 | | USD | | 1,988 | | | 34,973 | | | | — | |
GSCO-OT | | 03/2017 | | USD | | 6,723 | | AUD | | 8,980 | | | 252,973 | | | | — | |
GSCO-OT | | 01/2017 | | USD | | 5,319 | | BRL | | 17,730 | | | 18,745 | | | | 147,381 | |
15 OPPENHEIMER GLOBAL MULTI-ALTERNATIVES FUND/VA
| | |
CONSOLIDATED STATEMENT OF INVESTMENTS Continued |
| | | | | | | | | | | | | | | | | | |
Forward Currency Exchange Contracts (Continued) | |
| Counterparty | | Settlement Month(s) | | Currency Purchased (000’s) | | | | Currency Sold (000’s) | | Unrealized
Appreciation | | | Unrealized
Depreciation | |
GSCO-OT | | 03/2017 | | USD | | 4,792 | | CAD | | 6,300 | | $ | 96,012 | | | $ | — | |
GSCO-OT | | 04/2017 | | USD | | 1,505 | | CNH | | 10,000 | | | 102,967 | | | | — | |
GSCO-OT | | 03/2017 | | USD | | 531 | | EUR | | 500 | | | 2,856 | | | | — | |
GSCO-OT | | 03/2017 | | USD | | 1,115 | | GBP | | 885 | | | 22,978 | | | | — | |
HSBC | | 01/2017 | | BRL | | 9,700 | | USD | | 3,009 | | | — | | | | 28,286 | |
HSBC | | 03/2017 | | CZK | | 50,900 | | USD | | 1,995 | | | — | | | | 3,734 | |
HSBC | | 02/2017 | | IDR | | 15,789,000 | | USD | | 1,173 | | | — | | | | 13,268 | |
HSBC | | 03/2017 | | MXN | | 17,600 | | USD | | 851 | | | — | | | | 9,264 | |
HSBC | | 03/2017 | | NZD | | 1,210 | | USD | | 860 | | | — | | | | 21,410 | |
HSBC | | 03/2017 | | PLN | | 4,170 | | USD | | 988 | | | 7,529 | | | | — | |
HSBC | | 03/2017 | | TWD | | 65,000 | | USD | | 2,024 | | | — | | | | 18,162 | |
HSBC | | 01/2017 | | USD | | 2,976 | | BRL | | 9,700 | | | — | | | | 4,024 | |
HSBC | | 03/2017 | | USD | | 831 | | HUF | | 247,000 | | | — | | | | 10,793 | |
HSBC | | 02/2017 | | USD | | 18,547 | | JPY | | 2,000,000 | | | 1,392,289 | | | | — | |
HSBC | | 03/2017 | | USD | | 993 | | MXN | | 20,500 | | | 12,673 | | | | — | |
HSBC | | 03/2017 | | USD | | 3,979 | | NZD | | 5,532 | | | 143,584 | | | | — | |
HSBC | | 03/2017 | | USD | | 866 | | SEK | | 7,910 | | | — | | | | 5,195 | |
HSBC | | 03/2017 | | USD | | 1,010 | | SGD | | 1,460 | | | 2,582 | | | | — | |
HSBC | | 03/2017 | | ZAR | | 41,570 | | USD | | 2,943 | | | 47,598 | | | | — | |
JPM | | 01/2017 | | BRL | | 14,540 | | USD | | 4,386 | | | 81,133 | | | | — | |
JPM | | 03/2017 | | CAD | | 2,290 | | USD | | 1,713 | | | — | | | | 6,246 | |
JPM | | 04/2017 | | CNH | | 10,000 | | USD | | 1,430 | | | — | | | | 28,000 | |
JPM | | 02/2017 | | IDR | | 84,263,000 | | USD | | 6,180 | | | 17,121 | | | | 6,151 | |
JPM | | 03/2017 | | NOK | | 9,000 | | USD | | 1,035 | | | 7,370 | | | | — | |
JPM | | 03/2017 | | RUB | | 186,400 | | USD | | 2,974 | | | 24,101 | | | | 6,857 | |
JPM | | 01/2017 | | USD | | 4,240 | | BRL | | 14,540 | | | — | | | | 227,340 | |
JPM | | 03/2017 | | USD | | 1,723 | | CAD | | 2,330 | | | — | | | | 13,194 | |
JPM | | 11/2017 | | USD | | 1,268 | | CNH | | 9,000 | | | 37,212 | | | | — | |
JPM | | 01/2017 - 02/2017 | | USD | | 3,618 | | IDR | | 49,616,049 | | | — | | | | 33,596 | |
JPM | | 03/2017 | | USD | | 3,292 | | JPY | | 382,900 | | | 5,589 | | | | — | |
JPM | | 03/2017 | | USD | | 2,116 | | KRW | | 2,528,000 | | | 21,969 | | | | — | |
JPM | | 03/2017 | | USD | | 1,795 | | MXN | | 37,400 | | | 11,270 | | | | — | |
JPM | | 03/2017 | | USD | | 843 | | NOK | | 7,220 | | | 6,402 | | | | — | |
JPM | | 01/2017 - 03/2017 | | USD | | 4,667 | | NZD | | 6,650 | | | 54,369 | | | | 2,604 | |
JPM | | 01/2017 | | USD | | 14,128 | | SEK | | 123,800 | | | 525,007 | | | | — | |
MSCO | | 02/2017 - 03/2017 | | USD | | 6,056 | | EUR | | 5,680 | | | 79,020 | | | | 17,384 | |
TDB | | 01/2017 - 03/2017 | | BRL | | 19,160 | | USD | | 5,808 | | | 32,080 | | | | — | |
TDB | | 03/2017 | | COP | | 3,132,000 | | USD | | 1,043 | | | — | | | | 11,616 | |
TDB | | 03/2017 | | JPY | | 237,000 | | USD | | 2,024 | | | 10,361 | | | | — | |
TDB | | 01/2017 | | USD | | 2,914 | | BRL | | 9,580 | | | — | | | | 29,589 | |
TDB | | 03/2017 | | USD | | 186 | | CHF | | 190 | | | — | | | | 1,142 | |
| | | | | | | | | | | | | | |
Total Unrealized Appreciation and Depreciation | | $ | 4,565,950 | | | $ | 1,280,866 | |
| | | | | | | | | | | | | | |
| | | | | | | | | | | | | | | | |
Futures Contracts as of December 31, 2016 | |
| Description | | Exchange | | Buy/Sell | | Expiration Date | | Number of Contracts | | Value | | | Unrealized
Appreciation
(Depreciation) | |
| |
Aluminum* | | LME | | Buy | | 1/18/17 | | 10 | | $ | 423,500 | | | $ | (5,532) | |
CAC 40 10 Index | | PAR | | Sell | | 1/20/17 | | 220 | | | 11,261,881 | | | | (265,445) | |
CBOE Volatility Index | | CBE | | Sell | | 1/18/17 | | 66 | | | 998,250 | | | | 75,051 | |
Copper* | | CMX | | Buy | | 3/29/17 | | 7 | | | 438,462 | | | | (21,629) | |
Corn* | | CBT | | Sell | | 3/14/17 | | 25 | | | 440,000 | | | | 5,128 | |
Cotton No. 2* | | NYB | | Sell | | 3/09/17 | | 12 | | | 423,900 | | | | 4,465 | |
Euro-BONO | | EUX | | Sell | | 3/08/17 | | 14 | | | 2,069,384 | | | | (37,008) | |
Euro-BTP | | EUX | | Sell | | 3/08/17 | | 32 | | | 4,557,890 | | | | (90,369) | |
Euro-BUND | | EUX | | Buy | | 3/08/17 | | 44 | | | 7,602,870 | | | | 106,065 | |
Euro-OAT | | EUX | | Sell | | 3/08/17 | | 12 | | | 1,917,760 | | | | (21,739) | |
FTSE 100 Index | | ICE | | Sell | | 3/17/17 | | 74 | | | 6,429,431 | | | | (215,774) | |
Gold (100 oz.)* | | CMX | | Sell | | 2/24/17 | | 5 | | | 575,850 | | | | (11,612) | |
Live Cattle* | | CME | | Buy | | 2/28/17 | | 10 | | | 464,200 | | | | 13,571 | |
Natural Gas* | | NYM | | Sell | | 2/24/17 | | 15 | | | 552,600 | | | | (43,090) | |
Nickel* | | LME | | Buy | | 1/18/17 | | 6 | | | 359,100 | | | | (42,535) | |
Russell 2000 Mini Index | | NYF | | Sell | | 3/17/17 | | 314 | �� | | 21,303,330 | | | | 464,230 | |
S&P 500 E-Mini Index | | CME | | Buy | | 3/17/17 | | 216 | | | 24,150,960 | | | | (151,659) | |
S&P 500 E-Mini Index | | CME | | Sell | | 3/17/17 | | 26 | | | 2,907,060 | | | | 32,023 | |
S&P/TSX 60 Index | | MON | | Sell | | 3/16/17 | | 5 | | | 668,007 | | | | 192 | |
SPI 200 Index | | SFE | | Sell | | 3/16/17 | | 15 | | | 1,523,854 | | | | (33,312) | |
STOXX Europe 600 Index | | EUX | | Sell | | 3/17/17 | | 879 | | | 16,590,258 | | | | (264,977) | |
16 OPPENHEIMER GLOBAL MULTI-ALTERNATIVES FUND/VA
| | | | | | | | | | | | | | | | | | | | | | | | |
Futures Contracts (Continued) | | | | | | | | | | | | | | | | | |
| Description | | Exchange | | | Buy/Sell | | | Expiration Date | | | Number of Contracts | | | Value | | | Unrealized Appreciation
(Depreciation) | |
Sugar #11 World* | | | NYB | | | | Sell | | | | 2/28/17 | | | | 19 | | | $ | 415,173 | | | $ | 35,494 | |
United States Treasury Long Bonds | | | CBT | | | | Sell | | | | 3/22/17 | | | | 56 | | | | 8,436,750 | | | | 92,654 | |
United States Treasury Nts., 10 yr. | | | CBT | | | | Sell | | | | 3/22/17 | | | | 94 | | | | 11,682,438 | | | | 65,220 | |
United States Treasury Nts., 5 yr. | | | CBT | | | | Sell | | | | 3/31/17 | | | | 102 | | | | 12,001,734 | | | | 17,372 | |
Wheat* | | | CBT | | | | Sell | | | | 3/14/17 | | | | 21 | | | | 428,400 | | | | 22,177 | |
WTI Crude Oil* | | | NYM | | | | Buy | | | | 1/20/17 | | | | 12 | | | | 644,640 | | | | 26,372 | |
Zinc* | | | LME | | | | Buy | | | | 1/18/17 | | | | 6 | | | | 384,525 | | | | (27,994 | ) |
| | | | | | | | | | | | | | | | | | | | | | | | |
| | | | | | | | | | | | | | | | | | | | | | $ | (272,661 | ) |
| | | | | | | | | | | | | | | | | | | | | | | | |
*All or a portion of this security is owned by the subsidiary. See Note 2 of the accompanying Consolidated Notes.
| | | | | | | | | | | | | | | | | | | | | | | | | | | | | | | | |
Over-the-Counter Options Written at December 31, 2016 | |
Description | | | Counterparty | | | | | | | | Exercise Price | | | | Expiration Date | | | | | | | | Number of Contracts | | | | Premiums Received | | | | Value | |
CNH Currency Put | | | CITNA-B | | | | CNH | | | | 8.000 | | | | 11/29/17 | | | | CNH | | | | (58,200,000 | ) | | $ | 60,528 | | | $ | (82,353 | ) |
CNH Currency Put | | | CITNA-B | | | | CNH | | | | 8.000 | | | | 11/29/17 | | | | CNH | | | | (11,600,000 | ) | | | 10,323 | | | | (16,414 | ) |
EUR Currency Put | | | JPM | | | | EUR | | | | 1.055 | | | | 1/6/17 | | | | EUR | | | | (1,370,000 | ) | | | 8,566 | | | | (9,923 | ) |
EUR Currency Call | | | JPM | | | | EUR | | | | 1.055 | | | | 1/6/17 | | | | EUR | | | | (1,370,000 | ) | | | 8,913 | | | | (8,046 | ) |
IDR Currency Call | | | DEU | | | | IDR | | | | 14000.000 | | | | 2/28/17 | | | | IDR | | | | (129,291,000,000 | ) | | | 265,606 | | | | (387,873 | ) |
IDR Currency Put | | | DEU | | | | IDR | | | | 14000.000 | | | | 2/28/17 | | | | IDR | | | | (129,291,000,000 | ) | | | 155,983 | | | | (129,291 | ) |
IDR Currency Call | | | NOM | | | | IDR | | | | 13830.000 | | | | 2/21/17 | | | | IDR | | | | (127,700,000,000 | ) | | | 230,850 | | | | (255,400 | ) |
IDR Currency Put | | | NOM | | | | IDR | | | | 13830.000 | | | | 2/21/17 | | | | IDR | | | | (127,700,000,000 | ) | | | 230,850 | | | | (127,700 | ) |
JPY Currency Put | | | BOA | | | | JPY | | | | 125.000 | | | | 6/19/17 | | | | JPY | | | | (3,463,000,000 | ) | | | 300,865 | | | | (270,114 | ) |
NZD Currency Put | | | BOA | | | | CAD | | | | 0.890 | | | | 4/26/17 | | | | NZD | | | | (18,465,000 | ) | | | 84,298 | | | | (94,259 | ) |
ZAR Currency Call | | | GSCO-OT | | | | ZAR | | | | 14.500 | | | | 1/21/17 | | | | ZAR | | | | (133,900,000 | ) | | | 356,082 | | | | (526,897 | ) |
ZAR Currency Put | | | GSCO-OT | | | | ZAR | | | | 14.500 | | | | 2/21/17 | | | | ZAR | | | | (133,900,000 | ) | | | 363,008 | | | | (123,322 | ) |
| | | | | | | | | | | | | | | | | | | | | | | | | | | | |
Total of Over-the-Counter Options Written | | | $ | 2,075,872 | | | $ | (2,031,592 | ) |
| | | | | | | | | | | | | | | | | | | | | | | | | | | | |
| | | | | | | | | | | | | | | | | | | | | | | | | | | | | | | | |
Centrally Cleared Credit Default Swaps at December 31, 2016 | | | | | |
Reference Asset | | |
| Buy/Sell
Protection |
| | | Fixed Rate | | | | Maturity Date | | | | | | |
| Notional Amount
(000’s) |
| |
| Premiums
Received/(Paid) |
| | | Value | |
21st Century Fox America, Inc. | | | | Buy | | | | 1.000% | | | | 12/20/21 | | | | USD | | | | 1,100 | | | $ | 28,034 | | | $ | (22,515 | ) |
Altria Group, Inc. | | | | Sell | | | | 1.000 | | | | 12/20/21 | | | | USD | | | | 1,100 | | | | (38,911 | ) | | | 35,590 | |
Avnet, Inc. | | | | Buy | | | | 1.000 | | | | 12/20/21 | | | | USD | | | | 1,100 | | | | (122 | ) | | | (5,042 | ) |
Barrick Gold Corp. | | | | Buy | | | | 1.000 | | | | 12/20/21 | | | | USD | | | | 1,100 | | | | (33,146 | ) | | | 35,338 | |
Best Buy Co., Inc. | | | | Sell | | | | 5.000 | | | | 12/20/21 | | | | USD | | | | 1,100 | | | | (169,728 | ) | | | 170,097 | |
Caterpillar, Inc. | | | | Sell | | | | 1.000 | | | | 12/20/21 | | | | USD | | | | 1,100 | | | | (20,785 | ) | | | 19,769 | |
CDX.HY.24 | | | | Buy | | | | 5.000 | | | | 6/20/20 | | | | USD | | | | 215 | | | | 13,140 | | | | (16,977 | ) |
CDX.HY.24 | | | | Buy | | | | 5.000 | | | | 6/20/20 | | | | USD | | | | 1,862 | | | | 144,017 | | | | (147,286 | ) |
CDX.HY.25 | | | | Buy | | | | 5.000 | | | | 12/20/20 | | | | USD | | | | 8,793 | | | | 217,607 | | | | (608,625 | ) |
CDX.HY.25 | | | | Buy | | | | 5.000 | | | | 12/20/20 | | | | USD | | | | 12,628 | | | | (25,958 | ) | | | (874,084 | ) |
CDX.IG.25 | | | | Sell | | | | 1.000 | | | | 12/20/20 | | | | USD | | | | 5,655 | | | | (44,408 | ) | | | 93,660 | |
Hartford Financial Services Group, Inc. (The) | | | | Buy | | | | 1.000 | | | | 12/20/21 | | | | USD | | | | 1,100 | | | | 10,751 | | | | (15,145 | ) |
Hess Corp. | | | | Sell | | | | 1.000 | | | | 12/20/21 | | | | USD | | | | 1,100 | | | | (58,177 | ) | | | 38,457 | |
Home Depot, Inc. (The) | | | | Sell | | | | 1.000 | | | | 12/20/21 | | | | USD | | | | 1,100 | | | | (41,919 | ) | | | 38,563 | |
Honeywell International, Inc. | | | | Sell | | | | 1.000 | | | | 12/20/21 | | | | USD | | | | 1,100 | | | | (40,324 | ) | | | 39,626 | |
iTraxx.Main 26 | | | | Buy | | | | 1.000 | | | | 12/20/21 | | | | EUR | | | | 150 | | | | 1,718 | | | | (2,067 | ) |
iTraxx.Main.24 | | | | Buy | | | | 1.000 | | | | 12/20/20 | | | | EUR | | | | 5,160 | | | | 69,067 | | | | (83,018 | ) |
Johnson & Johnson | | | | Sell | | | | 1.000 | | | | 12/20/21 | | | | USD | | | | 1,100 | | | | (46,743 | ) | | | 39,848 | |
Kinder Morgan, Inc. | | | | Buy | | | | 1.000 | | | | 12/20/21 | | | | USD | | | | 1,100 | | | | 31,647 | | | | (18,367 | ) |
Kroger Co. (The) | | | | Buy | | | | 1.000 | | | | 12/20/21 | | | | USD | | | | 1,100 | | | | 19,133 | | | | (20,306 | ) |
Lincoln National Corp. | | | | Sell | | | | 1.000 | | | | 12/20/21 | | | | USD | | | | 1,100 | | | | 19,733 | | | | (3,208 | ) |
Lockheed Martin Corp. | | | | Buy | | | | 1.000 | | | | 12/20/21 | | | | USD | | | | 1,100 | | | | 38,264 | | | | (36,535 | ) |
Lowe’s Cos., Inc. | | | | Buy | | | | 1.000 | | | | 12/20/21 | | | | USD | | | | 1,100 | | | | 41,170 | | | | (39,276 | ) |
Mckesson Corp. | | | | Buy | | | | 1.000 | | | | 12/20/21 | | | | USD | | | | 1,100 | | | | 38,836 | | | | (25,019 | ) |
Motorola Solutions, Inc. | | | | Sell | | | | 1.000 | | | | 12/20/21 | | | | USD | | | | 1,100 | | | | 2,809 | | | | (1,394 | ) |
Neiman Marcus Group LLC (The) | | | | Buy | | | | 5.000 | | | | 12/20/20 | | | | USD | | | | 715 | | | | 41,431 | | | | (30,155 | ) |
Northrop Grumman Systems Corp. | | | | Buy | | | | 1.000 | | | | 12/20/21 | | | | USD | | | | 1,100 | | | | 44,051 | | | | (42,802 | ) |
Sherwin-Williams Co. (The) | | | | Sell | | | | 1.000 | | | | 12/20/21 | | | | USD | | | | 1,100 | | | | (10,287 | ) | | | 10,042 | |
Total of Cleared Credit Default Swaps | | | | | | | | | | | | | | | $ | 230,900 | | | $ | (1,470,831 | ) |
| | | | | | | | | | | | | | | | | | | | | | | | | |
| | | | | | | | | | | | | | | | | | | | | | | | | | | | | |
Over-the-Counter Credit Default Swaps at December 31, 2016 | | | | | |
Reference Asset | | | Counterparty | | |
| Buy/Sell
Protection |
| | | Fixed Rate | | | | Maturity Date | | | | | | |
| Notional Amount
(000’s) |
| |
| Premiums
Received/(Paid) |
| | | Value | |
CDX.NA.HY.21 | | | CITNA-B | | | | Buy | | | | 5.000% | | | | 12/20/18 | | | | USD | | | | 1,125 | | | $ | (34,531 | ) | | $ | (99,609 | ) |
CDX.NA.HY.21 | | | CITNA-B | | | | Sell | | | | 5.000 | | | | 12/20/18 | | | | USD | | | | 288 | | | | 160,725 | | | | (52,386 | ) |
CDX.NA.HY.21 | | | GSG | | | | Sell | | | | 5.000 | | | | 12/20/18 | | | | USD | | | | 84 | | | | 46,161 | | | | (15,366 | ) |
CDX.NA.HY.25 | | | GSG | | | | Buy | | | | 5.000 | | | | 12/20/20 | | | | USD | | | | 1,125 | | | | (194,688 | ) | | | (39,668 | ) |
CDX.NA.HY.25 | | | GSG | | | | Sell | | | | 5.000 | | | | 12/20/20 | | | | USD | | | | 353 | | | | 234,113 | | | | (153,382 | ) |
17 OPPENHEIMER GLOBAL MULTI-ALTERNATIVES FUND/VA
| | |
CONSOLIDATED STATEMENT OF INVESTMENTS Continued |
| | | | | | | | | | | | | | | | | | | | | | | | | | | | | | | | | | | | | | | | |
| Over-the-Counter Credit Default Swaps (Continued) | | | | | | | | | | | | | | | | | | | | | | | | | | | | | |
Reference Asset | | | Counterparty | | |
| Buy/Sell
Protection |
| | | Fixed Rate | | | | Maturity Date | | | | | | | | | | | | | | |
| Notional Amount
(000’s) |
| | | Premiums Received/(Paid) | | | | Value | |
Malaysia | | | BNP | | | | Buy | | | | 1.000% | | | | 6/20/21 | | | | USD | | | | | | | | | | | | 775 | | | $ | (22,856) | | | $ | 6,836 | |
Malaysia | | | BNP | | | | Buy | | | | 1.000 | | | | 12/20/20 | | | | USD | | | | | | | | | | | | 1,700 | | | | (110,693) | | | | 4,315 | |
Malaysia | | | MOS-A | | | | Buy | | | | 1.000 | | | | 12/20/20 | | | | USD | | | | | | | | | | | | 1,700 | | | | (85,394) | | | | 4,315 | |
Total of Over-the-Counter Credit Default Swaps | | | | | | | | | | | | | | | | | | | | | | | $ | (7,163) | | | $ | (344,945) | |
| | | | | | | | | | | | | | | | | | | | | | | | | | | | | | | | | | | | |
The table that follows shows the undiscounted maximum potential payment by the Fund related to selling credit protection in credit default swaps:
| | | | | | | | | | | | |
Type of Reference Asset on which the Fund Sold Protection | | Total Maximum Potential Payments for Selling Credit
Protection
(Undiscounted) | | | Amount Recoverable* | | | Reference Asset Rating
Range** | |
Investment Grade Corporate Debt Indexes | | | $6,027,399 | | | | $1,125,000 | | | | BBB+ to BBB- | |
Non-Investment Grade Corporate Debt Indexes | | | 352,750 | | | | 22,546,620 | | | | B | |
Investment Grade Single Name Corporate Debt | | | 11,000,000 | | | | — | | | | AAA to BBB- | |
| | | | | | | | | | | | |
Total | | | $17,380,149 | | | | $23,671,620 | | | | | |
| | | | | | | | | | | | |
* Amounts recoverable includes potential payments from related purchased protection for instances where the Fund is the seller of protection. In addition, the Fund has no recourse provisions under the credit derivatives and holds no collateral which can offset or reduce potential payments under a triggering event.
** The period end reference asset security ratings, as rated by any rating organization, are included in the equivalent Standard & Poor’s rating category. The reference asset rating represents the likelihood of a potential credit event on the reference asset which would result in a related payment by the Fund.
| | | | | | | | | | | | | | | | | | | | | | | | | | | | | | | | |
| Centrally Cleared Interest Rate Swaps at December 31, 2016 | | | | | | | | | | | | | | | | | | | | | |
| | | Pay/Receive | | | | | | | | | | | | | | | | | | | | Premiums | | | | | |
Counterparty | | | Floating Rate | | | | Floating Rate | | | | Fixed Rate | | | | Maturity Date | | | | Notional Amount (000’s) | | | | Received / (Paid) | | | | Value | |
| |
| | | | | | | Six-Month JPY BBA | | | | | | | | | | | | | | | | | | | | | | | | | |
BAC | | | Receive | | | | LIBOR | | | | 0.468% | | | | 11/12/25 | | | | JPY | | | | 23,000 | | | $ | — | | | | $ (5,046) | |
| | | | | | | | Three-Month SEK | | | | | | | | | | | | | | | | | | | | | | | | | |
BAC | | | Pay | | | | STIBOR SIDE | | | | 1.418 | | | | 11/12/25 | | | | SEK | | | | 1,840 | | | | — | | | | 8,788 | |
| | | | | | | | Three-Month SEK | | | | | | | | | | | | | | | | | | | | | | | | | |
BAC | | | Pay | | | | STIBOR SIDE | | | | 0.628 | | | | 7/8/26 | | | | SEK | | | | 2,340 | | | | — | | | | (8,596) | |
| | | | | | | | Three-Month SEK | | | | | | | | | | | | | | | | | | | | | | | | | |
BAC | | | Pay | | | | STIBOR SIDE | | | | 1.501 | | | | 12/9/25 | | | | SEK | | | | 5,120 | | | | — | | | | 27,534 | |
| | | | | | | | Three-Month SEK | | | | | | | | | | | | | | | | | | | | | | | | | |
BAC | | | Pay | | | | STIBOR SIDE | | | | 1.365 | | | | 8/10/25 | | | | SEK | | | | 4,580 | | | | — | | | | 22,468 | |
| | | | | | | | Three-Month SEK | | | | | | | | | | | | | | | | | | | | | | | | | |
BAC | | | Pay | | | | STIBOR SIDE | | | | 1.630 | | | | 7/3/25 | | | | SEK | | | | 41,685 | | | | 12,089 | | | | 323,835 | |
| | | | | | | | Three-Month NZD | | | | | | | | | | | | | | | | | | | | | | | | | |
BOA | | | Pay | | | | BBR FRA | | | | 3.353 | | | | 12/8/26 | | | | NZD | | | | 9,145 | | | | — | | | | (66,612) | |
| | | | | | | | Six-Month JPY BBA | | | | | | | | | | | | | | | | | | | | | | | | | |
BOA | | | Receive | | | | LIBOR | | | | 0.208 | | | | 12/8/26 | | | | JPY | | | | 49,000 | | | | — | | | | 459 | |
| | | | | | | | Six-Month NOK | | | | | | | | | | | | | | | | | | | | | | | | | |
GSCOI | | | Receive | | | | NIBOR NIBR | | | | 1.393 | | | | 9/5/26 | | | | NOK | | | | 53,985 | | | | — | | | | 301,399 | |
| | | | | | | | Six-Month JPY BBA | | | | | | | | | | | | | | | | | | | | | | | | | |
JPM | | | Receive | | | | LIBOR | | | | 0.595 | | | | 8/11/25 | | | | JPY | | | | 29,000 | | | | — | | | | (9,516) | |
| | | | | | | | Three-Month SEK | | | | | | | | | | | | | | | | | | | | | | | | | |
JPM | | | Pay | | | | STIBOR SIDE | | | | 1.070 | | | | 6/7/26 | | | | SEK | | | | 3,550 | | | | — | | | | 4,188 | |
| | | | | | | | Six-Month JPY BBA | | | | | | | | | | | | | | | | | | | | | | | | | |
JPM | | | Receive | | | | LIBOR | | | | 0.593 | | | | 7/10/25 | | | | JPY | | | | 563,000 | | | | — | | | | (186,522) | |
| | | | | | | | Six-Month JPY BBA | | | | | | | | | | | | | | | | | | | | | | | | | |
JPM | | | Receive | | | | LIBOR | | | | 0.566 | | | | 8/6/25 | | | | JPY | | | | 13,000 | | | | — | | | | (3,975) | |
| | | | | | | | Six-Month JPY BBA | | | | | | | | | | | | | | | | | | | | | | | | | |
JPM | | | Receive | | | | LIBOR | | | | 0.100 | | | | 6/6/26 | | | | JPY | | | | 35,000 | | | | — | | | | 2,846 | |
| | | | | | | | Six-Month JPY BBA | | | | | | | | | | | | | | | | | | | | | | | | | |
JPM | | | Receive | | | | LIBOR | | | | 0.461 | | | | 12/9/25 | | | | JPY | | | | 28,000 | | | | — | | | | (5,940) | |
| | | | | | | | | | | | | | | | | | | | | | | | | | | | |
Total of Centrally Cleared Interest Rate Swaps | | | | | | | | | | | | | | | $ | 12,089 | | | | $ 405,310 | |
| | | | | | | | | | | | | | | | | | | | | | | | | | | | |
| | | | | | | | | | | | | | | | | | | | | | | | | | | | | | |
Over-the-Counter Total Return Swaps at December 31, 2016 | | | | | | | | | | | | | | | | | | | | |
Reference Asset | | | Counterparty | | |
| Pay/Receive Total
Return* |
| | Floating Rate | | | Maturity Date | | | | | | | | | | |
| Notional
Amount
(000’s) |
| | | Value | |
| | | | | | | | | | One-Month AUD BBR BBSW | | | | | | | | | | | | | | | | | | | | |
CGAUOPAU Custom Basket | | | CITNA-B | | | | Receive | | | plus 50 basis points | | | 3/9/17 | | | | AUD | | | | | | | | 2,881 | | | $ | 90,065 | |
| | | | | | | | | | One-Month CAD BA CDOR | | | | | | | | | | | | | | | | | | | | |
CGCNOCAD Custom Basketa | | | CITNA-B | | | | Receive | | | plus 80 basis points | | | 3/7/17 | | | | CAD | | | | | | | | 5,571 | | | | 13,832 | |
GSEHOPCN Custom Basket | | | GSG | | | | Pay | | | One-Month HKD HIBOR HKAB minus 25 basis points | | | 6/22/17 | | |
|
HKD |
| | | | | | | 14,465 | | | | (442,721 | ) |
GSOPRUSS Custom Basketb | | | GSCOI | | | | Receive | | | One-Month USD BBA LIBOR plus 35 basis points | | | 12/7/17 | | | | USD | | | | | | | | 20,512 | | | | 738,352 | |
GSOPSPS3 Custom Basketc | | | GSCOI | | | | Receive | | | One-Month USD BBA LIBOR plus 35 basis points | | | 10/7/17 | | | | USD | | | | | | | | 11,097 | | | | 154,958 | |
JPCMOLNG Custom Basket | | | JPM | | | | Receive | | | One-Month USD BBA LIBOR plus 30 basis points | | | 6/7/17 | | | | USD | | | | | | | | 3,221 | | | | 42,469 | |
18 OPPENHEIMER GLOBAL MULTI-ALTERNATIVES FUND/VA
| | | | | | | | | | | | | | | | | | | | | | | | | | |
Over-the-Counter Total Return Swaps (Continued) | | | | | | | | | | | | | | | | |
| | | | | | | |
Reference Asset | | | Counterparty | | |
| Pay/Receive Total
Return* |
| | Floating Rate | | | Maturity Date | | | | | | |
| Notional
Amount
(000’s) |
| | | Value | |
| | | | | | | | | | | One-Month USD BBA LIBOR | | | | | | | | | | | | | | | | |
JPCMOSHR Custom Basket | | | JPM | | | | Pay | | | minus 85 basis points | | | 6/7/17 | | | | USD | | | | 3,225 | | | $ | 1,090 | |
| | | | | | | | | | | One-Month EUR EURIBOR | | | | | | | | | | | | | | | | |
JPEBCACO Custom Basketd | | | JPM | | | | Receive | | | plus 10 basis points | | | 4/6/17 | | | | EUR | | | | 9,717 | | | | 650,228 | |
| | | | | | | | | | | One-Month GBP BBA LIBOR | | | | | | | | | | | | | | | | |
JPEBUKXO Custom Baskete | | | JPM | | | | Receive | | | plus 20 basis points | | | 4/6/17 | | | | GBP | | | | 4,755 | | | | 332,729 | |
| | | | | | | | | | | One-Month USD BBA LIBOR | | | | | | | | | | | | | | | | |
OEX Index | | | GSG | | | | Pay | | | minus 35 basis points | | | 7/10/17 | | | | USD | | | | 307 | | | | (8,172 | ) |
| | | | | | | | | | | One-Month USD BBA LIBOR | | | | | | | | | | | | | | | | |
OEX Index | | | GSG | | | | Pay | | | minus 35 basis points | | | 4/13/17 | | | | USD | | | | 11,002 | | | | (62,079 | ) |
PowerShares Senior Loan | | | | | | | | | | One-Month USD BBA LIBOR | | | | | | | | | | | | | | | | |
Portfolio | | | CITNA-B | | | | Receive | | | minus 15 basis points | | | 11/1/17 | | | | USD | | | | 65,082 | | | | 53,527 | |
| | | | | | | | | | | | | | | | | | | | | | | | | | |
Total of Over-the-Counter Total Return Swaps | | | | | | | | | | | | | | | | | $ | 1,564,278 | |
| | | | | | | | | | | | | | | | | | | |
* Fund will pay or receive the total return of the reference asset depending on whether the return is positive or negative. For contracts where the Fund has elected to receive the total return of the reference asset if positive, it will be responsible for paying the floating rate and the total return of the reference asset if negative. If the Fund has elected to pay the total return of the reference asset if positive, it will receive the floating rate and the total return of the reference asset if negative.
| | | | | | | | |
Custom baskets of securities: The following are the components and weights of the underlying basket of securities | |
| Description | | Shares | | | % of Basket | |
CGCNOCADa: | | | | | | | | |
Alimentation Couche-Tard, Inc., Cl. B | | | 0.08059 | | | | 1.27% | |
Boyd Group Income Fund | | | 0.05766 | | | | 0.91 | |
Canadian Apartment Properties Real Estate Investment Trust | | | 0.16359 | | | | 2.58 | |
Celestica, Inc. | | | 0.3065 | | | | 4.84 | |
Cott Corp. | | | 0.32717 | | | | 5.17 | |
Dollarama, Inc. | | | 0.05 | | | | 0.79 | |
Empire Co. Ltd., Cl. A | | | 0.2739 | | | | 4.33 | |
Enbridge Income Fund Holding | | | 0.1463 | | | | 2.31 | |
FirstService Corp. | | | 0.08565 | | | | 1.35 | |
Intertape Polymer Group, Inc. | | | 0.20242 | | | | 3.20 | |
Jean Coutu Group, Inc., Cl. A | | | 0.24123 | | | | 3.81 | |
Just Energy Group, Inc. | | | 0.67972 | | | | 10.73 | |
Metro, Inc. | | | 0.12212 | | | | 1.93 | |
North West Co., Inc. (The) | | | 0.19943 | | | | 3.15 | |
Parkland Fuel Corp. | | | 0.1792 | | | | 2.83 | |
Premium Brands Holdings Corp. | | | 0.07077 | | | | 1.12 | |
Saputo, Inc. | | | 0.10997 | | | | 1.74 | |
Stella-Jones, Inc. | | | 0.1107 | | | | 1.75 | |
Uni-Select, Inc. | | | 0.16483 | | | | 2.60 | |
Western Forest Products, Inc. | | | 2.76017 | | | | 43.59 | |
| | | | |
| | | 6.33192 | | | | 100.00% | |
| | | | |
GSOPRUSSb: | | | | | | | | |
Achillion Pharmaceuticals | | | 0.012169 | | | | 0.23% | |
Advanced Micro Devices | | | 0.044101 | | | | 0.85 | |
American Eagle Outfitters | | | 0.010928 | | | | 0.21 | |
Amkor Technology, Inc. | | | 0.01094 | | | | 0.21 | |
Arena Pharmaceuticals, Inc. | | | 0.0146 | | | | 0.28 | |
Avon Products, Inc. | | | 0.0313 | | | | 0.60 | |
BGC Partners, Inc., Cl. A | | | 0.0144 | | | | 0.28 | |
BioScrip, Inc. | | | 0.0163 | | | | 0.31 | |
Cobalt International Energy | | | 0.0168 | | | | 0.32 | |
Coeur Mining, Inc. | | | 0.0114 | | | | 0.22 | |
Cousins Properties, Inc. | | | 0.0121 | | | | 0.23 | |
Denbury Resources, Inc. | | | 0.0148 | | | | 0.29 | |
Diamondrock Hospitality Co. | | | 0.0102 | | | | 0.20 | |
Eclipse Resources Corp. | | | 0.0142 | | | | 0.27 | |
Erin Energy Corp. | | | 0.0134 | | | | 0.26 | |
Exco Resources, Inc. | | | 0.0174 | | | | 0.34 | |
Exelixis, Inc. | | | 0.0105 | | | | 0.20 | |
First Bancorp (Puerto Rico) | | | 0.0111 | | | | 0.21 | |
FNB Corp. | | | 0.0106 | | | | 0.20 | |
FNFV Group | | | 0.0187 | | | | 0.36 | |
Genworth Financial, Inc., Cl. A | | | 0.0283 | | | | 0.55 | |
Gramercy Property Trust | | | 0.0261 | | | | 0.50 | |
Hecla Mining Co. | | | 0.0228 | | | | 0.44 | |
19 OPPENHEIMER GLOBAL MULTI-ALTERNATIVES FUND/VA
| | |
CONSOLIDATED STATEMENT OF INVESTMENTS Continued |
| | | | | | | | |
Custom baskets of securities: The following are the components and weights of the underlying basket of securities (Continued) | |
| Description | | Shares | | | % of Basket | |
| GSOPRUSSb: (Continued) | | | | | | |
HRG Group, Inc. | | | 0.0114 | | | | 0.22% | |
Investors Bancorp, Inc. | | | 0.0165 | | | | 0.32 | |
Janus Capital Group, Inc. | | | 0.0102 | | | | 0.20 | |
LendingClub Corp. | | | 0.0201 | | | | 0.39 | |
Lexington Realty Trust | | | 0.0137 | | | | 0.26 | |
McDermott International, Inc. | | | 0.0106 | | | | 0.20 | |
Medical Properties Trust, Inc. | | | 0.0213 | | | | 0.41 | |
MGIC Investment Corp. | | | 0.0182 | | | | 0.35 | |
New Residential Investment | | | 0.0133 | | | | 0.26 | |
NRG Yield, Inc., Cl. A | | | 0.0108 | | | | 0.21 | |
NRG Yield, Inc., Cl. C | | | 0.0108 | | | | 0.21 | |
Office Depot, Inc. | | | 0.0289 | | | | 0.56 | |
Other Securities Outside Top 50 | | | 4.426549 | | | | 85.29 | |
PDL Biopharma, Inc. | | | 0.0143 | | | | 0.28 | |
Pure Storage, Inc., Cl. A | | | 0.0102 | | | | 0.20 | |
Radian Group, Inc. | | | 0.0117 | | | | 0.23 | |
Sunstone Hotel Investors, Inc. | | | 0.011 | | | | 0.21 | |
SUPERVALU, Inc. | | | 0.0144 | | | | 0.28 | |
TherapeuticsMD, Inc. | | | 0.0111 | | | | 0.21 | |
Travelport Worldwide Ltd. | | | 0.0106 | | | | 0.20 | |
Umpqua Holdings Corp. | | | 0.0111 | | | | 0.21 | |
Valhi, Inc. | | | 0.0126 | | | | 0.24 | |
Valley National Bancorp | | | 0.013 | | | | 0.25 | |
Viavi Solutions, Inc. | | | 0.0123 | | | | 0.24 | |
Vonage Holdings Corp. | | | 0.0133 | | | | 0.26 | |
Washington Prime Group, Inc. | | | 0.0114 | | | | 0.22 | |
WMIH Corp. | | | 0.015 | | | | 0.29 | |
Xenith Bankshares, Inc. | | | 0.0127 | | | | 0.24 | |
| | | | |
| | | 5.190187 | | | | 100.00% | |
| | | | |
| | |
GSOPSPS3c: | | | | | | | | |
Abbott Laboratories | | | 0.032604 | | | | 1.26% | |
Abbvie, Inc. | | | 0.029029 | | | | 1.12 | |
Allstate Corp. | | | 0.03227 | | | | 1.25 | |
Altria Group, Inc. | | | 0.029949 | | | | 1.16 | |
American International Group | | | 0.023183 | | | | 0.90 | |
At&T, Inc. | | | 0.045781 | | | | 1.77 | |
Bank of America Corp. | | | 0.077955 | | | | 3.02 | |
Bank of New York Mellon Corp. | | | 0.030192 | | | | 1.17 | |
Bristol-Myers Squibb Co. | | | 0.041474 | | | | 1.61 | |
Cisco Systems, Inc. | | | 0.047391 | | | | 1.83 | |
Coca-Cola Co. (The) | | | 0.039132 | | | | 1.51 | |
Colgate-Palmolive Co. | | | 0.024208 | | | | 0.94 | |
Comcast Corp., Cl. A | | | 0.030526 | | | | 1.18 | |
ConocoPhillips | | | 0.028749 | | | | 1.11 | |
CVS Health Corp. | | | 0.038045 | | | | 1.47 | |
Danaher Corp. | | | 0.02358 | | | | 0.91 | |
Dow Chemical Co. (The) | | | 0.043402 | | | | 1.68 | |
Du Pont (E.I.) De Nemours | | | 0.027348 | | | | 1.06 | |
Duke Energy Corp. | | | 0.032224 | | | | 1.25 | |
Eli Lilly & Co. | | | 0.025905 | | | | 1.00 | |
Exelon Corp. | | | 0.048959 | | | | 1.89 | |
Ford Motor Co. | | | 0.104011 | | | | 4.03 | |
General Electric Co. | | | 0.051347 | | | | 1.99 | |
General Motors Co. | | | 0.037627 | | | | 1.46 | |
Gilead Sciences, Inc. | | | 0.024358 | | | | 0.94 | |
Halliburton Co. | | | 0.023095 | | | | 0.89 | |
Intel Corp. | | | 0.036163 | | | | 1.40 | |
Kinder Morgan, Inc. | | | 0.054031 | | | | 2.09 | |
Lowe’s Cos., Inc. | | | 0.025508 | | | | 0.99 | |
Merck & Co., Inc. | | | 0.022936 | | | | 0.89 | |
MetLife, Inc. | | | 0.026094 | | | | 1.01 | |
Microsoft Corp. | | | 0.025316 | | | | 0.98 | |
Mondelez International, Inc., Cl. A | | | 0.026474 | | | | 1.02 | |
Monsanto Co. | | | 0.022815 | | | | 0.88 | |
Morgan Stanley | | | 0.028958 | | | | 1.12 | |
Nike, Inc., Cl. B | | | 0.034854 | | | | 1.35 | |
Oracle Corp. | | | 0.040997 | | | | 1.59 | |
20 OPPENHEIMER GLOBAL MULTI-ALTERNATIVES FUND/VA
| | | | | | | | |
Custom baskets of securities: The following are the components and weights of the underlying basket of securities (Continued) | |
| Description | | Shares | | | % of Basket | |
| GSOPSPS3c: (Continued) | | | | | | |
Other Securities Outside Top 50 | | | 0.734247 | | | | 28.42% | |
PayPal Holdings, Inc. | | | 0.039881 | | | | 1.54 | |
Pfizer, Inc. | | | 0.04977 | | | | 1.93 | |
QUALCOMM, Inc. | | | 0.022895 | | | | 0.89 | |
Southern Co. (The) | | | 0.055487 | | | | 2.15 | |
Starbucks Corp. | | | 0.038271 | | | | 1.48 | |
Target Corp. | | | 0.037338 | | | | 1.45 | |
Twenty-First Century Fox, Cl. A | | | 0.049344 | | | | 1.91 | |
Twenty-First Century Fox, Cl. B | | | 0.048127 | | | | 1.86 | |
US Bancorp | | | 0.039454 | | | | 1.53 | |
Verizon Communications, Inc. | | | 0.040909 | | | | 1.58 | |
Wal-Mart Stores, Inc. | | | 0.029656 | | | | 1.15 | |
Walt Disney Co. (The) | | | 0.02412 | | | | 0.93 | |
Wells Fargo & Co. | | | 0.037811 | | | | 1.46 | |
| | | | |
| | | 2.5838 | | | | 100.00% | |
| | | | |
| | |
JPEBCACOd: | | | | | | | | |
Accor SA | | | 15,065 | | | | 1.89% | |
Air Liquide SA | | | 8,783 | | | | 1.10 | |
Airbus Group SE | | | 12,202 | | | | 1.53 | |
Arcelormittal | | | 62,758 | | | | 7.88 | |
Axa SA | | | 20,035 | | | | 2.51 | |
BNP Paribas | | | 8,719 | | | | 1.09 | |
Bouygues SA | | | 25,795 | | | | 3.24 | |
Capgemini | | | 6,987 | | | | 0.88 | |
Carrefour SA | | | 26,467 | | | | 3.32 | |
Compagnie De Saint Gobain | | | 12,935 | | | | 1.62 | |
Credit Agricole SA | | | 52,326 | | | | 6.57 | |
Danone | | | 12,493 | | | | 1.57 | |
ENGIE | | | 47,899 | | | | 6.01 | |
Essilor International | | | 8,081 | | | | 1.01 | |
Kering | | | 3,623 | | | | 0.45 | |
Klepierre | | | 19,935 | | | | 2.50 | |
Lafargeholcim Ltd. | | | 8,999 | | | | 1.13 | |
Legrand SA | | | 13,344 | | | | 1.67 | |
L’Oreal | | | 5,380 | | | | 0.68 | |
LVMH Moet Hennessy Louis Vuitton SE | | | 4,241 | | | | 0.53 | |
Michelin | | | 7,462 | | | | 0.94 | |
Nokia OYJ | | | 118,207 | | | | 14.84 | |
Orange SA | | | 54,511 | | | | 6.84 | |
Pernod Ricard SA | | | 10,833 | | | | 1.36 | |
Peugeot SA | | | 25,987 | | | | 3.26 | |
Publicis Groupe | | | 10,902 | | | | 1.37 | |
Renault SA | | | 5,533 | | | | 0.69 | |
Safran SA | | | 10,419 | | | | 1.31 | |
Sanofi | | | 15,652 | | | | 1.96 | |
Schneider Electric SE | | | 8,646 | | | | 1.09 | |
Societe Generale SA | | | 11,833 | | | | 1.49 | |
Sodexo | | | 9,315 | | | | 1.17 | |
Solvay SA | | | 6,425 | | | | 0.81 | |
Technip SA | | | 13,400 | | | | 1.68 | |
Total SA | | | 13,095 | | | | 1.64 | |
Unibail-Rodamco SE | | | 3,271 | | | | 0.41 | |
Valeo SA | | | 9,998 | | | | 1.25 | |
Veolia Environnement | | | 37,560 | | | | 4.71 | |
Vinci SA | | | 10,505 | | | | 1.32 | |
Vivendi | | | 37,264 | | | | 4.68 | |
| | | | |
| | | 796,885 | | | | 100.00% | |
| | | | |
| | |
JPEBUKXOe: | | | | | | | | |
3I Group plc | | | 22,495 | | | | 0.77% | |
Antofagasta plc | | | 27,876 | | | | 0.95 | |
Aviva plc | | | 27,962 | | | | 0.95 | |
BAE Systems plc | | | 43,091 | | | | 1.47 | |
Barclays plc | | | 68,428 | | | | 2.34 | |
BP plc | | | 53,201 | | | | 1.82 | |
British Land Co. plc | | | 20,860 | | | | 0.71 | |
BT Group plc | | | 48,753 | | | | 1.66 | |
21 OPPENHEIMER GLOBAL MULTI-ALTERNATIVES FUND/VA
| | |
CONSOLIDATED STATEMENT OF INVESTMENTS Continued |
| | | | | | | | |
Custom baskets of securities: The following are the components and weights of the underlying basket of securities (Continued) | |
| Description | | Shares | | | % of Basket | |
JPEBUKXOe: (Continued) | | | | | | | | |
Capita plc | | | 22,550 | | | | 0.77% | |
Centrica plc | | | 77,685 | | | | 2.65 | |
Compass Group plc | | | 19,131 | | | | 0.65 | |
Direct Line Insurance Group | | | 65,562 | | | | 2.24 | |
Dixons Carphone plc | | | 39,137 | | | | 1.34 | |
GKN plc | | | 77,086 | | | | 2.63 | |
GlaxoSmithKline plc | | | 19,078 | | | | 0.65 | |
Glencore plc | | | 53,266 | | | | 1.82 | |
Hammerson plc | | | 25,093 | | | | 0.86 | |
HSBC Holdings plc | | | 52,772 | | | | 1.80 | |
Informa plc | | | 37,999 | | | | 1.30 | |
International Consolidated Airlines Group SA | | | 29,945 | | | | 1.02 | |
Intu Properties plc | | | 51,474 | | | | 1.76 | |
ITV plc | | | 65,322 | | | | 2.23 | |
J Sainsbury plc | | | 74,643 | | | | 2.55 | |
Kingfisher plc | | | 49,206 | | | | 1.68 | |
Legal & General Group plc | | | 49,512 | | | | 1.69 | |
Lloyds Banking Group plc | | | 222,234 | | | | 7.58 | |
Marks & Spencer Group plc | | | 38,952 | | | | 1.33 | |
Mediclinic International plc | | | 26,135 | | | | 0.89 | |
Merlin Entertainment | | | 49,525 | | | | 1.69 | |
National Grid plc | | | 28,322 | | | | 0.97 | |
Old Mutual plc | | | 70,089 | | | | 2.39 | |
Other Securities Outside Top 50 | | | 492,351 | | | | 16.80 | |
Pearson plc | | | 33,896 | | | | 1.16 | |
Polymetal International plc | | | 28,602 | | | | 0.98 | |
RELX plc | | | 21,420 | | | | 0.73 | |
Rolls-Royce Holdings plc | | | 30,629 | | | | 1.04 | |
Royal Bank of Scotland Group | | | 71,382 | | | | 2.44 | |
Royal Mail plc | | | 40,498 | | | | 1.38 | |
RSA Insurance Group plc | | | 37,712 | | | | 1.29 | |
SABMiller plc | | | 47,426 | | | | 1.62 | |
Sage Group plc (The) | | | 28,183 | | | | 0.96 | |
Sky plc | | | 20,675 | | | | 0.70 | |
Smith & Nephew plc | | | 21,827 | | | | 0.74 | |
Standard Chartered plc | | | 22,084 | | | | 0.75 | |
Standard Life plc | | | 32,537 | | | | 1.11 | |
Taylor Wimpey plc | | | 55,051 | | | | 1.88 | |
Tesco plc | | | 76,666 | | | | 2.62 | |
United Utilities Group plc | | | 27,662 | | | | 0.94 | |
Vodafone Group plc | | | 122,311 | | | | 4.17 | |
Wm Morrison Supermarkets | | | 87,340 | | | | 2.98 | |
Worldpay Group plc | | | 74,695 | | | | 2.55 | |
| | | | |
| | | 2,930,331 | | | | 100.00% | |
| | | | |
| | | | | | | | | | | | | | | | | | | | | | | | | | | | |
Over-the-Counter Volatility Swaps at December 31, 2016 | | | | | | | | | | | | | | | | | |
Reference Asset | | | Counterparty | | | | Pay/Receive Volatility* | | | | Strike Price | | | | Maturity Date | | | | | | | | Notional Amount | | | | Value | |
CAD/JPY spot exchange rate | | | CITNA-B | | | | Pay | | | $ | 13.050 | | | | 2/6/17 | | | | CAD | | | | (6,400 | ) | | $ | (2,669 | ) |
EUR/CAD spot exchange rate | | | CITNA-B | | | | Receive | | | | 8.550 | | | | 1/12/17 | | | | EUR | | | | 4,500 | | | | (1,847 | ) |
EUR/CAD spot exchange rate | | | DEU | | | | Receive | | | | 8.250 | | | | 1/13/17 | | | | EUR | | | | 4,500 | | | | (568 | ) |
EUR/NZD spot exchange rate | | | CITNA-B | | | | Pay | | | | 10.300 | | | | 1/6/17 | | | | EUR | | | | (4,500 | ) | | | 5,400 | |
EUR/SEK spot exchange rate | | | DEU | | | | Pay | | | | 6.000 | | | | 1/9/17 | | | | EUR | | | | (4,400 | ) | | | (9,680 | ) |
GBP/AUD spot exchange rate | | | JPM | | | | Pay | | | | 10.100 | | | | 2/3/17 | | | | GBP | | | | (3,900 | ) | | | (5,191 | ) |
GBP/CAD spot exchange rate | | | JPM | | | | Pay | | | | 7.900 | | | | 1/30/17 | | | | GBP | | | | (3,900 | ) | | | (8,219 | ) |
GBP/CAD spot exchange rate | | | DEU | | | | Pay | | | | 8.800 | | | | 1/30/17 | | | | GBP | | | | (3,900 | ) | | | (3,220 | ) |
GBP/CAD spot exchange rate | | | HSBC | | | | Pay | | | | 9.350 | | | | 1/31/17 | | | | GBP | | | | (3,900 | ) | | | (1,923 | ) |
GBP/CAD spot exchange rate | | | CITNA-B | | | | Pay | | | | 8.450 | | | | 1/30/17 | | | | GBP | | | | (3,900 | ) | | | (4,422 | ) |
NZD/CHF spot exchange rate | | | HSBC | | | | Pay | | | | 9.300 | | | | 1/9/17 | | | | NZD | | | | (6,700 | ) | | | 1,443 | |
NZD/CHF spot exchange rate | | | DEU | | | | Pay | | | | 10.000 | | | | 1/9/17 | | | | NZD | | | | (6,600 | ) | | | 3,851 | |
NZD/USD spot exchange rate | | | CITNA-B | | | | Receive | | | | 11.650 | | | | 1/26/17 | | | | USD | | | | 4,800 | | | | (6,864 | ) |
NZD/USD spot exchange rate | | | JPM | | | | Receive | | | | 12.050 | | | | 1/20/17 | | | | USD | | | | 4,800 | | | | (11,232 | ) |
NZD/USD spot exchange rate | | | CITNA-B | | | | Pay | | | | 9.150 | | | | 1/17/17 | | | | USD | | | | (4,800 | ) | | | (8,256 | ) |
NZD/USD spot exchange rate | | | HSBC | | | | Receive | | | | 11.150 | | | | 1/19/17 | | | | USD | | | | 4,800 | | | | (5,232 | ) |
USD/JPY spot exchange rate | | | JPM | | | | Pay | | | | 11.860 | | | | 1/17/17 | | | | USD | | | | (4,800 | ) | | | 2,640 | |
USD/JPY spot exchange rate | | | DEU | | | | Pay | | | | 11.400 | | | | 1/17/17 | | | | USD | | | | (4,800 | ) | | | 4,224 | |
USD/JPY spot exchange rate | | | DEU | | | | Receive | | | | 11.650 | | | | 1/27/17 | | | | USD | | | | 4,800 | | | | (528 | ) |
USD/JPY spot exchange rate | | | JPM | | | | Receive | | | | 11.600 | | | | 1/23/17 | | | | USD | | | | 4,800 | | | | (3,264 | ) |
22 OPPENHEIMER GLOBAL MULTI-ALTERNATIVES FUND/VA
| | | | | | | | | | | | | | | | | | | | | | | | | | | | |
Over-the-Counter Volatility Swaps (Continued) | | | | | | | | | | | | | | | | | |
Reference Asset | | | Counterparty | | | | Pay/Receive Volatility* | | | | Strike Price | | | | Maturity Date | | | | | | | | Notional Amount | | | | Value | |
USD/SEK spot exchange rate | | | GSCO-OT | | | | Pay | | | | $ 10.750 | | | | 1/5/17 | | | | USD | | | | (4,800 | ) | | $ | 1,824 | |
| | | | | | | | | | | | | | | | | | | | | | | | | | | | |
Total of Over-the-Counter Volatility Swaps | | | | | | | | | | | | | | | | | | | | | | | $ | (53,733 | ) |
| | | | | | | | | | | | | | | | | | | | | | | | | | | | |
* Fund will pay or receive the volatility of the reference asset depending on whether the realized volatility of the reference asset exceeds or is less than the strike price. For contracts where the Fund has elected to receive the volatility of the reference asset, it will receive a net payment of the difference between the realized volatility and the strike price multiplied by the notional amount if the realized volatility exceeds the strike price; the Fund will make a net payment of the absolute value of the difference of the realized volatility and the strike price multiplied by the notional amount if the realized volatility is less than the strike price. For contracts where the Fund has elected to pay the volatility of the reference asset, it will make a net payment of the difference between the realized volatility and the strike price multiplied by the notional amount if the realized volatility exceeds the strike price; the Fund will receive a net payment of the absolute value of the difference of the realized and the strike price multiplied by the notional amount if the realized volatility is less than the strike price.
| | |
| Glossary: | | |
| Counterparty Abbreviations | | |
| BAC | | Barclays Bank plc |
| BNP | | BNP Paribas |
| BOA | | Bank of America NA |
| CITNA-B | | Citibank NA |
| DEU | | Deutsche Bank AG |
| GSCOI | | Goldman Sachs International |
| GSCO-OT | | Goldman Sachs Bank USA |
| GSG | | Goldman Sachs Group, Inc. (The) |
| HSBC | | HSBC Bank USA NA |
| JPM | | JPMorgan Chase Bank NA |
| MOS-A | | Morgan Stanley |
| MSCO | | Morgan Stanley Capital Services, Inc. |
| NOM | | Nomura Global Financial Products, Inc. |
| TDB | | Toronto Dominion Bank |
|
| Currency abbreviations indicate amounts reporting in currencies |
| AUD | | Australian Dollar |
| BRL | | Brazilian Real |
| CAD | | Canadian Dollar |
| CHF | | Swiss Franc |
| CLP | | Chilean Peso |
| CNH | | Offshore Chinese Renminbi |
| COP | | Colombian Peso |
| CZK | | Czech Koruna |
| EUR | | Euro |
| GBP | | British Pound Sterling |
| HKD | | Hong Kong Dollar |
| HUF | | Hungarian Forint |
| IDR | | Indonesian Rupiah |
| JPY | | Japanese Yen |
| KRW | | South Korean Won |
| MXN | | Mexican Nuevo Peso |
| NOK | | Norwegian Krone |
| NZD | | New Zealand Dollar |
| PLN | | Polish Zloty |
| RUB | | Russian Ruble |
| SEK | | Swedish Krona |
| SGD | | Singapore Dollar |
| THB | | Thailand Baht |
| TRY | | New Turkish Lira |
| TWD | | New Taiwan Dollar |
| ZAR | | South African Rand |
| |
Definitions | | |
| BA CDOR | | Canada Bankers Acceptances Deposit Offering Rate |
| BBA LIBOR | | British Bankers’ Association London - Interbank Offered Rate |
| BBR | | Bank Bill Rate |
| BBR FRA | | Bank Bill Forward Rate Agreement |
| BBSW | | Bank Bill Swap Reference Rate (Australian Financial Market) |
| BONO | | Spanish Government Bonds |
| BTP | | Italian Treasury Bonds |
| BUND | | German Federal Obligation |
| CDX.HY.24 | | Merkit CDX High Yield Index |
| CDX.HY.25 | | Markit CDX High Yield Index |
| CDX.IG.25 | | Markit CDX Investment Grade Index |
| CDX.NA.HY.21 | | Markit CDX North American High Yield |
| CDX.NA.HY.25 | | Markit CDX North American High Yield |
23 OPPENHEIMER GLOBAL MULTI-ALTERNATIVES FUND/VA
| | |
CONSOLIDATED STATEMENT OF INVESTMENTS Continued |
| | |
| Definitions (Continued) | | |
| CGAUOPAU | | Custom Basket of Securities |
| EURIBOR | | Euro Interbank Offered Rate |
| FTSE 100 | | United Kingdom 100 most highly capitalized companies on the London Stock Exchange |
| GSEHOPCN | | Custom Basket of Securities |
| HIBOR | | Hong Kong Interbank Offered Rate |
| HKAB | | Hong Kong Association of Banks |
| iTraxx.Main.24 | | Credit Default Swap Trading Index for a Specific Basket of Securities |
| iTraxx.Main.26 | | Credit Default Swap Trading Index for a Specific Basket of Securities |
| JPCMOLNG | | Custom Basket of Securities |
| JPCMOSHR | | Custom Basket of Securities |
| MLHKOPCB | | Custom Basket of Securities |
| NIBOR NIBR | | Norwegian Interbank Offered Rate |
| OAT | | French Gorvernment Bonds |
| OEX | | S&P 100 Index |
| S&P | | Standard & Poor’s |
| STIBOR SIDE | | Stockholm Interbank Offered Rate |
| TSX 60 | | 60 largest companies on the Toronto Stock Exchange |
| |
| Exchange Abbreviations | | |
| CBE | | Chicago Board Options Exchange |
| CBT | | Chicago Board of Trade |
| CME | | Chicago Mercantile Exchanges |
| CMX | | Commodity Exchange, Inc. |
| EUX | | European Stock Exchange |
| ICE | | IntercontinentalExchange |
| LME | | London Metal Exchange |
| MON | | Montreal Exchange |
| NYB | | New York Board of Trade |
| NYF | | New York Futures Exchange |
| NYM | | New York Mercantile Exchange |
| PAR | | Paris Stock Exchange |
| SFE | | Sydney Futures Exchange |
See accompanying Notes to Consolidated Financial Statements.
24 OPPENHEIMER GLOBAL MULTI-ALTERNATIVES FUND/VA
| | |
CONSOLIDATED STATEMENT OF ASSETS AND LIABILITIES December 31, 2016 |
| | | | |
Assets | | | | |
Investments, at value—see accompanying consolidated statement of investments: | | | | |
Unaffiliated companies (cost $323,888,360) | | $ | 333,758,371 | |
Affiliated companies (cost $57,727,699) | | | 57,727,699 | |
| | | | 391,486,070 | |
Cash | | | 2,622,941 | |
Cash used for collateral on futures | | | 768,112 | |
Cash used for collateral on centrally cleared swaps | | | 3,677,063 | |
Deposits with broker for securities sold short | | | 40,075,810 | |
Deposits with broker for foreign securities sold short (cost $3,963,252) | | | 3,912,230 | |
Unrealized appreciation on forward currency exchange contracts | | | 4,565,950 | |
Swaps, at value (premiums paid $218,943) | | | 2,112,098 | |
Centrally cleared swaps, at value (net premiums paid $492,339) | | | 1,212,507 | |
Receivables and other assets: | | | | |
Interest and dividends | | | 1,454,243 | |
Investments sold | | | 442,608 | |
Variation margin receivable | | | 153,069 | |
Shares of beneficial interest sold | | | 101,939 | |
Other | | | 18,640 | |
Total assets | | | 452,603,280 | |
Liabilities | | | | |
Securities sold short, at value (proceeds $37,562,699) - see accompanying Consolidated statement of investments | | | 39,974,692 | |
Unrealized depreciation on forward currency exchange contracts | | | 1,280,866 | |
Options written, at value (net premiums received $2,075,872) | | | 2,031,592 | |
Swaps, at value (net premiums received $211,780) | | | 946,498 | |
Centrally cleared swaps, at value (net premiums received $735,328) | | | 2,278,028 | |
Payables and other liabilities: | | | | |
Investments purchased (including $1,934,751 purchased on a when-issued or delayed delivery basis) | | | 2,569,425 | |
Variation margin payable | | | 372,673 | |
Dividends on short sales | | | 64,743 | |
Trustees’ compensation | | | 5,491 | |
Shareholder communications | | | 3,599 | |
Distribution and service plan fees | | | 515 | |
Shares of beneficial interest redeemed | | | 101 | |
Other | | | 81,887 | |
Total liabilities | | | 49,610,110 | |
Net Assets | | $ | 402,993,170 | |
| | | | |
| | | | | |
Composition of Net Assets | | | | |
Par value of shares of beneficial interest | | $ | 40,773 | |
Additional paid-in capital | | | 413,697,088 | |
Accumulated net investment loss | | | (1,020,555) | |
Accumulated net realized loss on investments and foreign currency transactions | | | (20,391,824) | |
| Net unrealized appreciation on investments and translation of assets and liabilities denominated in foreign currencies | | | 10,667,688 | |
Net Assets | | $ | 402,993,170 | |
| | | | |
| | | | |
Net Asset Value Per Share | | | | |
Non-Service Shares: | | | | |
| Net asset value, redemption price per share and offering price per share (based on net assets of $400,449,043 and 40,515,373 shares of beneficial interest outstanding) | | | $9.88 | |
Service Shares: | | | | |
| Net asset value, redemption price per share and offering price per share (based on net assets of $2,544,127 and 257,806 shares of beneficial interest outstanding) | | | $9.87 | |
See accompanying Notes to Consolidated Financial Statements.
25 OPPENHEIMER GLOBAL MULTI-ALTERNATIVES FUND/VA
| | |
CONSOLIDATED STATEMENT OF OPERATIONS For the Year Ended December 31, 2016 |
| | | | |
Investment Income | | | | |
Interest (net of foreign withholding taxes of $23,500) | | $ | 7,555,090 | |
Dividends: | | | | |
Unaffiliated companies (net of foreign withholding taxes of $56,439) | | | 2,784,508 | |
Affiliated companies | | | 130,187 | |
Total investment income | | | 10,469,785 | |
Expenses | | | | |
Management fees | | | 4,223,739 | |
Distribution and service plan fees - Service shares | | | 5,123 | |
Transfer and shareholder servicing agent fees: | | | | |
Non-Service shares | | | 408,842 | |
Service shares | | | 2,054 | |
Shareholder communications: | | | | |
Non-Service shares | | | 17,935 | |
Service shares | | | 93 | |
Dividends on short sales | | | 895,600 | |
Custodian fees and expenses | | | 131,257 | |
Financing expense from short sales | | | 98,514 | |
Trustees’ compensation | | | 33,000 | |
Borrowing fees | | | 7,177 | |
Other | | | 231,537 | |
Total expenses | | | 6,054,871 | |
Less reduction to custodian expenses | | | (1,136) | |
Less waivers and reimbursements of expenses | | | (153,229) | |
Net expenses | | | 5,900,506 | |
Net Investment Income | | | 4,569,279 | |
Realized and Unrealized Gain (Loss) | | | | |
Net realized gain (loss) on: | | | | |
Investments transactions in unaffiliated companies (including premiums on options exercised) | | | (13,586,074) | |
Closing and expiration of option contracts written | | | 6,379,729 | |
Closing and expiration of futures contracts | | | (7,913,621) | |
Foreign currency transactions | | | (4,762,171) | |
Short positions | | | 2,049,395 | |
Swap contracts | | | 2,606,362 | |
Net realized loss | | | (15,226,380) | |
Net change in unrealized appreciation/depreciation on: | | | | |
Investment transactions | | | 29,540,154 | |
Translation of assets and liabilities denominated in foreign currencies | | | (983,348) | |
Futures contracts | | | 1,294,797 | |
Option contracts written | | | (185,743) | |
Short positions | | | (7,855,565) | |
Swap contracts | | | 4,003,448 | |
Net change in unrealized appreciation/depreciation | | | 25,813,743 | |
Net Increase in Net Assets Resulting from Operations | | $ | 15,156,642 | |
| | | | |
| | | | |
See accompanying Notes to Consolidated Financial Statements.
26 OPPENHEIMER GLOBAL MULTI-ALTERNATIVES FUND/VA
| | |
CONSOLIDATED STATEMENTS OF CHANGES IN NET ASSETS |
| | | | | | | | |
| | | Year Ended | | | Year Ended | |
| | | December 31, 2016 | | | December 31, 20151 | |
Operations | | | | | | | | |
Net investment income | | $ | 4,569,279 | | | $ | 4,065,328 | |
Net realized loss | | | (15,226,380) | | | | (4,481,159) | |
Net change in unrealized appreciation/depreciation | | | 25,813,743 | | | | (15,637,443) | |
Net increase (decrease) in net assets resulting from operations | | | 15,156,642 | | | | (16,053,274) | |
Dividends and/or Distributions to Shareholders | | | | | | | | |
Dividends from net investment income: | | | | | | | | |
Non-Service shares | | | (5,549,952) | | | | (1,416,586) | |
Service shares | | | (29,481) | | | | (1,965) | |
| | | | (5,579,433) | | | | (1,418,551) | |
Beneficial Interest Transactions | | | | | | | | |
Net increase (decrease) in net assets resulting from beneficial interest transactions: | | | | | | | | |
Non-Service shares | | | (15,372,890) | | | | 161,111,575 | |
Service shares | | | 657,532 | | | | 587,007 | |
| | | (14,715,358) | | | | 161,698,582 | |
Net Assets | | | | | | | | |
Total increase (decrease) | | | (5,138,149) | | | | 144,226,757 | |
Beginning of period | | | 408,131,319 | | | | 263,904,562 | |
| | |
End of period (including accumulated net investment loss of $1,020,555 and $5,176,1701, respectively) | | $ | 402,993,170 | | | $ | 408,131,319 | |
| | | | | | | | |
1. Net investment income and net realized gain (loss) for the year ended December 31, 2015 includes an adjustment for a prior period reclassification. Please see Note 11 of the accompanying Notes to Financial Statements.
See accompanying Notes to Consolidated Financial Statements.
27 OPPENHEIMER GLOBAL MULTI-ALTERNATIVES FUND/VA
| | |
CONSOLIDATED FINANCIAL HIGHLIGHTS |
| | | | | | | | | | | | | | | | |
| | | Year Ended | | | Year Ended | | | Year Ended | | | Period Ended | |
Non-Service Shares | | December 31, | | | December 31, | | | December 31, | | | December 31, | |
| | 2016 | | | 20151 | | | 20141 | | | 20132 | |
Per Share Operating Data | | | | | | | | | | | | | | | | |
Net asset value, beginning of period | | | $9.66 | | | | $10.04 | | | | $9.92 | | | | $10.00 | |
Income (loss) from investment operations: | | | | | | | | | | | | | | | | |
Net investment income (loss)3 | | | 0.11 | | | | 0.11 | | | | 0.08 | | | | (0.02) | |
Net realized and unrealized gain (loss) | | | 0.25 | | | | (0.46) | | | | 0.52 | | | | (0.05) | |
Total from investment operations | | | 0.36 | | | | (0.35) | | | | 0.60 | | | | (0.07) | |
Dividends and/or distributions to shareholders: | | | | | | | | | | | | | | | | |
Dividends from net investment income | | | (0.14) | | | | (0.03) | | | | (0.25) | | | | (0.01) | |
Distributions from net realized gain | | | 0.00 | | | | 0.00 | | | | (0.21) | | | | 0.00 | |
Tax return of capital distribution | | | 0.00 | | | | 0.00 | | | | (0.02) | | | | 0.00 | |
Total dividends and/or distributions to shareholders | | | (0.14) | | | | (0.03) | | | | (0.48) | | | | (0.01) | |
Net asset value, end of period | | | $9.88 | | | | $9.66 | | | | $10.04 | | | | $9.92 | |
| | | | | | | | | | | | | | | | | |
| | | | | | | | | | | | | | | | |
Total Return, at Net Asset Value4 | | | 3.71% | | | | (3.45)% | | | | 6.02% | | | | (0.69)% | |
| | | | | | | | | | | | | | | | |
Ratios/Supplemental Data | | | | | | | | | | | | | | | | |
Net assets, end of period (in thousands) | | | $400,449 | | | | $406,286 | | | | $262,573 | | | | $9,917 | |
Average net assets (in thousands) | | | $408,810 | | | | $363,975 | | | | $161,988 | | | | $9,827 | |
Ratios to average net assets:5 | | | | | | | | | | | | | | | | |
Net investment income (loss) | | | 1.11% | | | | 1.11% | | | | 0.77%6 | | | | (1.85)%6 | |
Expenses excluding specific expenses listed below | | | 1.23% | | | | 1.24% | | | | 1.33% | | | | 7.16% | |
Dividends and/or interest expense on securities sold short | | | 0.22% | | | | 0.17% | | | | 0.08% | | | | 0.00% | |
Borrowing expenses on securities sold short | | | 0.02% | | | | 0.05% | | | | 0.02% | | | | 0.00% | |
Interest and fees from borrowings | | | 0.00%7 | | | | 0.00%7 | | | | 0.00% | | | | 0.00% | |
Total expenses8 | | | 1.47% | | | | 1.46% | | | | 1.43%6 | | | | 7.16%6 | |
| Expenses after payments, waivers and/or reimbursements and reduction to custodian expenses | | | 1.43% | | | | 1.41% | | | | 1.31%6 | | | | 3.33%6 | |
Portfolio turnover rate | | | 93% | | | | 67% | | | | 147% | | | | 11% | |
1. Net investment income per share, net realized and unrealized gain (loss) per share and the net investment income ratio include an adjustment for a prior period reclassification for the years ended December 31, 2014 and 2015. Please see Note 11 of the accompanying Notes to Financial Statements.
2. For the period from November 14, 2013 (inception of offering) to December 31, 2013.
3. Per share amounts calculated based on the average shares outstanding during the period.
4. Assumes an initial investment on the business day before the first day of the fiscal period, with all dividends and distributions reinvested in additional shares on the reinvestment date, and redemption at the net asset value calculated on the last business day of the fiscal period. Total returns are not annualized for periods less than one full year. Total return information does not reflect expenses that apply at the separate account level or to related insurance products. Inclusion of these charges would reduce the total return figures for all periods shown. Returns do not reflect the deduction of taxes that a shareholder would pay on fund distributions or the redemption of fund shares.
5. Annualized for periods less than one full year.
6. Includes the Fund’s shares of the allocated expenses and/or net investment income from the master funds.
7. Less than 0.005%.
8. Total expenses including indirect expenses from affiliated fund fees and expenses were as follows:
| | | | |
Year Ended December 31, 2016 | | | 1.48 | % |
Year Ended December 31, 2015 | | | 1.47 | % |
Year Ended December 31, 2014 | | | 1.45 | % |
Period Ended December 31, 2013 | | | 7.18 | % |
See accompanying Notes to Consolidated Financial Statements.
28 OPPENHEIMER GLOBAL MULTI-ALTERNATIVES FUND/VA
| | | | | | | | | | | | | | | | |
| | | Year Ended | | | Year Ended | | | Year Ended | | | Period Ended | |
Service Shares | | December 31, | | | December 31, | | | December 31, | | | December 31, | |
| | 2016 | | | 20151 | | | 20141 | | | 20132 | |
Per Share Operating Data | | | | | | | | | | | | | | | | |
Net asset value, beginning of period | | | $9.65 | | | | $10.03 | | | | $9.92 | | | | $10.00 | |
Income (loss) from investment operations: | | | | | | | | | | | | | | | | |
Net investment income (loss)3 | | | 0.08 | | | | 0.08 | | | | 0.08 | | | | (0.03) | |
Net realized and unrealized gain (loss) | | | 0.26 | | | | (0.45) | | | | 0.50 | | | | (0.04) | |
Total from investment operations | | | 0.34 | | | | (0.37) | | | | 0.58 | | | | (0.07) | |
Dividends and/or distributions to shareholders: | | | | | | | | | | | | | | | | |
Dividends from net investment income | | | (0.12) | | | | (0.01) | | | | (0.25) | | | | (0.01) | |
Distributions from net realized gain | | | 0.00 | | | | 0.00 | | | | (0.21) | | | | 0.00 | |
Tax return of capital distribution | | | 0.00 | | | | 0.00 | | | | (0.01) | | | | 0.00 | |
Total dividends and/or distributions to shareholders | | | (0.12) | | | | (0.01) | | | | (0.47) | | | | (0.01) | |
Net asset value, end of period | | | $9.87 | | | | $9.65 | | | | $10.03 | | | | $9.92 | |
| | | | | | | | | | | | | | | | | |
| | | | | | | | | | | | | | | | |
Total Return, at Net Asset Value4 | | | 3.49% | | | | (3.68)% | | | | 5.90% | | | | (0.72)% | |
| | | | | | | | | | | | | | | | |
Ratios/Supplemental Data | | | | | | | | | | | | | | | | |
Net assets, end of period (in thousands) | | | $2,544 | | | | $1,845 | | | | $1,332 | | | | $10 | |
Average net assets (in thousands) | | | $2,054 | | | | $1,695 | | | | $335 | | | | $10 | |
Ratios to average net assets:5 | | | | | | | | | | | | | | | | |
Net investment income (loss) | | | 0.85% | | | | 0.85% | | | | 0.78%6 | | | | (2.12)%6 | |
Expenses excluding specific expenses listed below | | | 1.48% | | | | 1.48% | | | | 1.68% | | | | 7.43% | |
Dividends and/or interest expense on securities sold short | | | 0.22% | | | | 0.17% | | | | 0.08% | | | | 0.00% | |
Borrowing expenses on securities sold short | | | 0.02% | | | | 0.05% | | | | 0.02% | | | | 0.00% | |
Interest and fees from borrowings | | | 0.00%7 | | | | 0.00%7 | | | | 0.00% | | | | 0.00% | |
Total expenses8 | | | 1.72% | | | | 1.70% | | | | 1.78%6 | | | | 7.43%6 | |
| Expenses after payments, waivers and/or reimbursements and reduction to custodian expenses | | | 1.68% | | | | 1.65% | | | | 1.67%6 | | | | 3.50%6 | |
Portfolio turnover rate | | | 93% | | | | 67% | | | | 147% | | | | 11% | |
1. Net investment income per share, net realized and unrealized gain (loss) per share and the net investment income ratio include an adjustment for a prior period reclassification for the years ended December 31, 2014 and 2015. Please see Note 11 of the accompanying Notes to Financial Statements.
2. For the period from November 14, 2013 (inception of offering) to December 31, 2013.
3. Per share amounts calculated based on the average shares outstanding during the period.
4. Assumes an initial investment on the business day before the first day of the fiscal period, with all dividends and distributions reinvested in additional shares on the reinvestment date, and redemption at the net asset value calculated on the last business day of the fiscal period. Total returns are not annualized for periods less than one full year. Total return information does not reflect expenses that apply at the separate account level or to related insurance products. Inclusion of these charges would reduce the total return figures for all periods shown. Returns do not reflect the deduction of taxes that a shareholder would pay on fund distributions or the redemption of fund shares.
5. Annualized for periods less than one full year.
6. Includes the Fund’s shares of the allocated expenses and/or net investment income from the master funds.
7. Less than 0.005%.
8. Total expenses including indirect expenses from affiliated fund fees and expenses were as follows:
| | | | |
Year Ended December 31, 2016 | | | 1.73 | % |
Year Ended December 31, 2015 | | | 1.71 | % |
Year Ended December 31, 2014 | | | 1.80 | % |
Period Ended December 31, 2013 | | | 7.45 | % |
See accompanying Notes to Consolidated Financial Statements.
29 OPPENHEIMER GLOBAL MULTI-ALTERNATIVES FUND/VA
| | |
NOTES TO CONSOLIDATED FINANCIAL STATEMENTS December 31, 2016 |
1. Organization
Oppenheimer Global Multi-Alternatives Fund/VA (the “Fund”) is a separate series of Oppenheimer Variable Account Funds, a diversified open-end management investment company registered under the Investment Company Act of 1940 (“1940 Act”), as amended. The Fund’s investment objective is to seek total return. The Fund’s investment adviser is OFI Global Asset Management, Inc. (“OFI Global” or the “Manager”), a wholly-owned subsidiary of OppenheimerFunds, Inc. (“OFI” or the “Sub-Adviser”). The Manager has entered into a sub-advisory agreement with OFI. The Sub-Adviser has entered into a sub-sub-advisory agreement with Barings Real Estate Advisers LLC, formerly Cornerstone Real Estate Advisers LLC, and OFI SteelPath, Inc. (collectively, the “Sub-Sub-Advisers”). Effective January 1, 2017, Barings Real Estate Advisers LLC is known as Barings LLC. Shares of the Fund are sold only to separate accounts of life insurance companies.
The Fund offers two classes of shares. Both classes are sold at their offering price, which is the net asset value per share, to separate investment accounts of participating insurance companies as an underlying investment for variable life insurance policies, variable annuity contracts or other investment products. The class of shares designated as Service shares is subject to a distribution and service plan. Both classes of shares have identical rights and voting privileges with respect to the Fund in general and exclusive voting rights on matters that affect that class alone. Earnings, net assets and net asset value per share may differ due to each class having its own expenses, such as transfer and shareholder servicing agent fees and shareholder communications, directly attributable to that class.
The following is a summary of significant accounting policies followed in the Fund’s preparation of financial statements in accordance with accounting principles generally accepted in the United States (“U.S. GAAP”).
2. Significant Accounting Policies
Security Valuation. All investments in securities are recorded at their estimated fair value, as described in Note 3.
Basis for Consolidation. The Fund has established a Cayman Islands exempted company, Oppenheimer Global Multi-Alternatives Fund/VA (Cayman) Ltd., which is wholly-owned and controlled by the Fund (the “Subsidiary”). The Fund and Subsidiary are both managed by the Manager. The Fund may invest up to 25% of its total assets in the Subsidiary. The Subsidiary invests primarily in commodity-linked derivatives (including commodity futures, financial futures, options and swap contracts) and certain fixed-income securities and other investments that may serve as margin or collateral for its derivatives positions. Investments in the Subsidiary are expected to provide the Fund with exposure to commodities markets within the limitations of the federal tax requirements that apply to the Fund. The Subsidiary is subject to the same investment restrictions and guidelines, and follows the same compliance policies and procedures, as the Fund.
The financial statements have been consolidated and include accounts of the Fund and the Subsidiary. Accordingly, all inter-company transactions and balances have been eliminated. At period end, the Fund owned 21,023 shares with net assets of $11,445,792 in the Subsidiary.
Other financial information at period end:
| | | | |
Total market value of investments | | $ | 10,758,662 | |
Net assets | | $ | 11,445,792 | |
Net income (loss) | | $ | (137,501 | ) |
Net realized gain (loss) | | $ | 612,819 | |
Net change in unrealized appreciation/depreciation | | $ | 336,328 | |
Foreign Currency Translation. The books and records of the Fund are maintained in U.S. dollars. Any foreign currency amounts are translated into U.S. dollars on the following basis:
(1) Market value of investment securities, other assets and liabilities — at the exchange rates prevailing at Market Close as described in Note 3.
(2) Purchases and sales of investment securities, income and expenses — at the rates of exchange prevailing on the respective dates of such transactions.
Although the net assets and the market values are presented at the foreign exchange rates at Market Close, the Fund does not isolate the portion of the results of operations resulting from changes in foreign exchange rates on investments from the fluctuations arising from changes in market prices of securities held. Such fluctuations are included with the net realized and unrealized gains or losses from investments shown in the Consolidated Statement of Operations.
For securities, which are subject to foreign withholding tax upon disposition, realized gains or losses on such securities are recorded net of foreign withholding tax.
Reported net realized foreign exchange gains or losses arise from sales of foreign currencies, currency gains or losses realized between the trade and settlement dates on securities transactions, the difference between the amounts of dividends, interest, and foreign withholding tax reclaims recorded on Fund’s books, and the U.S. dollar equivalent of the amounts actually received or paid. Net unrealized foreign exchange gains and losses arise from changes in the value of assets and liabilities other than investments in securities, resulting from changes in the exchange rate.
Allocation of Income, Expenses, Gains and Losses. Income, expenses (other than those attributable to a specific class), gains and losses are allocated on a daily basis to each class of shares based upon the relative proportion of net assets represented by such class. Operating expenses directly attributable to a specific class are charged against the operations of that class.
Dividends and Distributions to Shareholders. Dividends and distributions to shareholders, which are determined in accordance with income tax regulations and may differ from U.S. GAAP, are recorded on the ex-dividend date. Income and capital gain distributions, if any, are declared and paid
30 OPPENHEIMER GLOBAL MULTI-ALTERNATIVES FUND/VA
2. Significant Accounting Policies (Continued)
annually or at other times as deemed necessary by the Manager.
Investment Income. Dividend income is recorded on the ex-dividend date or upon ex-dividend notification in the case of certain foreign dividends where the ex-dividend date may have passed. Non-cash dividends included in dividend income, if any, are recorded at the fair market value of the securities received. Interest income is recognized on an accrual basis. Discount and premium, which are included in interest income on the Consolidated Statement of Operations, are amortized or accreted daily.
Return of Capital Estimates. Distributions received from the Fund’s investments in Master Limited Partnerships (MLPs) and Real Estate Investments Trusts (REITs), generally are comprised of income and return of capital. The Fund records investment income and return of capital based on estimates. Such estimates are based on historical information available from each MLP, REIT and other industry sources. These estimates may subsequently be revised based on information received from MLPs and REITs after their tax reporting periods are concluded.
Custodian Fees. “Custodian fees and expenses” in the Consolidated Statement of Operations may include interest expense incurred by the Fund on any cash overdrafts of its custodian account during the period. Such cash overdrafts may result from the effects of failed trades in portfolio securities and from cash outflows resulting from unanticipated shareholder redemption activity. The Fund pays interest to its custodian on such cash overdrafts, to the extent they are not offset by positive cash balances maintained by the Fund, at a rate equal to the Federal Funds Rate plus 0.50%. This rate will increase to 2.00% effective January 1, 2017. The “Reduction to custodian expenses” line item, if applicable, represents earnings on cash balances maintained by the Fund during the period. Such interest expense and other custodian fees may be paid with these earnings.
Security Transactions. Security transactions are recorded on the trade date. Realized gains and losses on securities sold are determined on the basis of identified cost.
Indemnifications. The Fund’s organizational documents provide current and former Trustees and officers with a limited indemnification against liabilities arising in connection with the performance of their duties to the Fund. In the normal course of business, the Fund may also enter into contracts that provide general indemnifications. The Fund’s maximum exposure under these arrangements is unknown as this would be dependent on future claims that may be made against the Fund. The risk of material loss from such claims is considered remote.
Federal Taxes. The Fund intends to comply with provisions of the Internal Revenue Code applicable to regulated investment companies and to distribute substantially all of its investment company taxable income, including any net realized gain on investments not offset by capital loss carryforwards, if any, to shareholders. Therefore, no federal income or excise tax provision is required. The Fund files income tax returns in U.S. federal and applicable state jurisdictions. The statute of limitations on the Fund’s tax return filings generally remains open for the three preceding fiscal reporting period ends. The Fund has analyzed its tax positions for the fiscal year ended December 31, 2016, including open tax years, and does not believe there are any uncertain tax positions requiring recognition in the Fund’s financial statements.
Subchapter M requires, among other things, that at least 90% of the Fund’s gross income be derived from securities or derived with respect to its business of investing in securities (typically referred to as “qualifying income”). Income from commodity-linked derivatives may not be treated as “qualifying income” for purposes of the 90% gross income requirement. The Internal Revenue Service (IRS) has previously issued a number of private letter rulings which conclude that income derived from commodity index-linked notes and investments in a wholly-owned subsidiary will be “qualifying income.” As a result, the Fund will gain exposure to commodities through commodity-linked notes and its wholly-owned subsidiary.
The IRS has suspended the granting of private letter rulings pending further review. As a result, there can be no assurance that the IRS will not change its position with respect to commodity-linked notes and wholly-owned subsidiaries. In addition, future legislation and guidance from the Treasury and the IRS may adversely affect the Fund’s ability to gain exposure to commodities through commodity-linked notes and its wholly-owned subsidiary.
The Fund is required to include in income for federal income tax purposes all of the subsidiary’s net income and gains whether or not such income is distributed by the subsidiary. Net income and gains from the subsidiary are generally treated as ordinary income by the Fund, regardless of the character of the subsidiary’s underlying income. Net losses from the subsidiary do not pass through to the Fund for federal income tax purposes.
The tax components of capital shown in the following table represent distribution requirements the Fund must satisfy under the income tax regulations, losses the Fund may be able to offset against income and gains realized in future years and unrealized appreciation or depreciation of securities and other investments for federal income tax purposes.
| | | | | | | | | | | | |
Undistributed Net Investment Income | | Undistributed
Long-Term
Gain | | | Accumulated
Loss
Carryforward1,2,3,4 | | | Net Unrealized
Appreciation
Based on cost of
Securities and
Other Investments
for Federal Income
Tax Purposes | |
$3,552,520 | | | $— | | | | $14,646,720 | | | | $3,050,070 | |
1. At period end, the Fund had $14,645,163 of net capital loss carryforward available to offset future realized capital gains, if any, and thereby reduce future taxable gain distributions. Details
31 OPPENHEIMER GLOBAL MULTI-ALTERNATIVES FUND/VA
| | |
NOTES TO CONSOLIDATED FINANCIAL STATEMENTS Continued |
2. Significant Accounting Policies (Continued)
of the capital loss carryforwards are included in the table below. Capital loss carryovers with no expiration, if any, must be utilized prior to those with expiration dates.
| | | | |
| Expiring | | | |
No expiration | | $ | 14,645,163 | |
2. The Fund had $1,557 of straddle losses which were deferred.
3. During the reporting period, the Fund did not utilize any capital loss carryforward.
4. During the previous reporting period, the Fund did not utilize any capital loss carryforward.
Net investment income (loss) and net realized gain (loss) may differ for financial statement and tax purposes. The character of dividends and distributions made during the fiscal year from net investment income or net realized gains are determined in accordance with federal income tax requirements, which may differ from the character of net investment income or net realized gains presented in those financial statements in accordance with U.S. GAAP. Also, due to timing of dividends and distributions, the fiscal year in which amounts are distributed may differ from the fiscal year in which the income or net realized gain was recorded by the Fund.
Accordingly, the following amounts have been reclassified for the reporting period. Net assets of the Fund were unaffected by the reclassifications.
| | | | | | | | |
Reduction to Paid-in Capital | | Reduction to Accumulated
Net Investment
Loss | | | Increase
to Accumulated Net Realized Loss on
Investments | |
$4,826,314 | | | $5,162,070 | | | | $335,756 | |
The tax character of distributions paid during the reporting periods:
| | | | | | | | |
| | | Year Ended December 31, 2016 | | | Year Ended
December 31, 2015 | |
Distributions paid from: | | | | | | | | |
Ordinary income | | $ | 5,579,433 | | | $ | 1,418,551 | |
The aggregate cost of securities and other investments and the composition of unrealized appreciation and depreciation of securities and other investments for federal income tax purposes at period end are noted in the following table. The primary difference between book and tax appreciation or depreciation of securities and other investments, if applicable, is attributable to the tax deferral of losses or tax realization of financial statement unrealized gain or loss.
| | | | |
Federal tax cost of securities | | $ | 385,874,340 | |
Federal tax cost of other investments | | | (106,958,092) | |
| | | | |
Total federal tax cost | | $ | 278,916,248 | |
| | | | |
Gross unrealized appreciation | | $ | 19,473,301 | |
Gross unrealized depreciation | | | (16,423,231) | |
| | | | |
Net unrealized appreciation | | $ | 3,050,070 | |
| | | | |
Use of Estimates. The preparation of financial statements in conformity with U.S. GAAP requires management to make estimates and assumptions that affect the reported amounts of assets and liabilities and disclosure of contingent assets and liabilities at the date of the financial statements and the reported amounts of increases and decreases in net assets from operations during the reporting period. Actual results could differ from those estimates.
3. Securities Valuation
The Fund calculates the net asset value of its shares as of 4:00 P.M. Eastern time, on each day the New York Stock Exchange (the “Exchange”) is open for trading, except in the case of a scheduled early closing of the Exchange, in which case the Fund will calculate net asset value of the shares as of the scheduled early closing time of the Exchange.
The Fund’s Board has adopted procedures for the valuation of the Fund’s securities and has delegated the day-to-day responsibility for valuation determinations under those procedures to the Manager. The Manager has established a Valuation Committee which is responsible for determining a “fair valuation” for any security for which market quotations are not “readily available.” The Valuation Committee’s fair valuation determinations are subject to review, approval and ratification by the Fund’s Board at its next regularly scheduled meeting covering the calendar quarter in which the fair valuation was determined.
Valuation Methods and Inputs
Securities are valued using unadjusted quoted market prices, when available, as supplied primarily by third party pricing services or dealers.
The following methodologies are used to determine the market value or the fair value of the types of securities described below:
Equity securities traded on a securities exchange (including exchange-traded derivatives other than futures and futures options) are valued based on the official closing price on the principal exchange on which the security is traded, as identified by the Manager, prior to the time when the Fund’s assets are valued. If the official closing price is unavailable, the security is valued at the last sale price on the principal exchange on which it is traded. If the official closing price or last sales price for a foreign security is not available, the security is valued at the mean between the bid and asked price per the
32 OPPENHEIMER GLOBAL MULTI-ALTERNATIVES FUND/VA
3. Securities Valuation (Continued)
exchange or, if not available from the exchange, obtained from two dealers. If bid and asked prices are not available from either the exchange or two dealers, the security is valued by using one of the following methodologies (listed in order of priority): (1) a bid from the exchange, (2) the mean between the bid and asked price as provided by a single dealer, or (3) a bid from a single dealer.
Shares of a registered investment company that are not traded on an exchange are valued at that investment company’s net asset value per share.
Corporate and government debt securities (of U.S. or foreign issuers) and municipal debt securities, event-linked bonds, loans, mortgage-backed securities, collateralized mortgage obligations, and asset-backed securities are valued at the mean between the “bid” and “asked” prices utilizing evaluated prices obtained from third party pricing services or broker-dealers who may use matrix pricing methods to determine the evaluated prices.
Short-term money market type debt securities are valued at the mean between the “bid” and “asked” prices utilizing evaluated prices obtained from third party pricing services or broker-dealers.
Structured securities, swaps, swaptions, and other over-the-counter derivatives are valued utilizing evaluated prices obtained from third party pricing services or broker-dealers.
Forward foreign currency exchange contracts are valued utilizing current and forward currency rates obtained from third party pricing services. When the settlement date of a contract is an interim date for which a quotation is not available, interpolated values are derived using the nearest dated forward currency rate.
Futures contracts and futures options traded on a commodities or futures exchange will be valued at the final settlement price or official closing price on the principal exchange as reported by such principal exchange at its trading session ending at, or most recently prior to, the time when the Fund’s assets are valued.
A description of the standard inputs that may generally be considered by the third party pricing vendors in determining their evaluated prices is provided below.
| | |
Security Type | | Standard inputs generally considered by third-party pricing vendors |
| Corporate debt, government debt, municipal, mortgage- backed and asset-backed securities | | Reported trade data, broker-dealer price quotations, benchmark yields, issuer spreads on comparable securities, the credit quality, yield, maturity, and other appropriate factors. |
Loans | | Information obtained from market participants regarding reported trade data and broker-dealer price quotations. |
Event-linked bonds | | Information obtained from market participants regarding reported trade data and broker-dealer price quotations. |
Structured securities | | Relevant market information such as the price of underlying financial instruments, stock market indices, foreign currencies, interest rate spreads, commodities, or the occurrence of other specific events. |
Swaps | | Relevant market information, including underlying reference assets such as credit spreads, credit event probabilities, index values, individual security values, forward interest rates, variable interest rates, volatility measures, and forward currency rates. |
If a market value or price cannot be determined for a security using the methodologies described above, or if, in the “good faith” opinion of the Manager, the market value or price obtained does not constitute a “readily available market quotation,” or a significant event has occurred that would materially affect the value of the security, the security is fair valued either (i) by a standardized fair valuation methodology applicable to the security type or the significant event as previously approved by the Valuation Committee and the Fund’s Board or (ii) as determined in good faith by the Manager’s Valuation Committee. The Valuation Committee considers all relevant facts that are reasonably available, through either public information or information available to the Manager, when determining the fair value of a security. Fair value determinations by the Manager are subject to review, approval and ratification by the Fund’s Board at its next regularly scheduled meeting covering the calendar quarter in which the fair valuation was determined. Those fair valuation standardized methodologies include, but are not limited to, valuing securities at the last sale price or initially at cost and subsequently adjusting the value based on: changes in company specific fundamentals, changes in an appropriate securities index, or changes in the value of similar securities which may be further adjusted for any discounts related to security-specific resale restrictions. When possible, such methodologies use observable market inputs such as unadjusted quoted prices of similar securities, observable interest rates, currency rates and yield curves. The methodologies used for valuing securities are not necessarily an indication of the risks associated with investing in those securities nor can it be assured that the Fund can obtain the fair value assigned to a security if it were to sell the security.
To assess the continuing appropriateness of security valuations, the Manager, or its third party service provider who is subject to oversight by the Manager, regularly compares prior day prices, prices on comparable securities, and sale prices to the current day prices and challenges those prices exceeding certain tolerance levels with the third party pricing service or broker source. For those securities valued by fair valuations, whether through a standardized fair valuation methodology or a fair valuation determination, the Valuation Committee reviews and affirms the reasonableness of the valuations based on such methodologies and fair valuation determinations on a regular basis after considering all relevant information that is reasonably available.
Classifications
Each investment asset or liability of the Fund is assigned a level at measurement date based on the significance and source of the inputs to its valuation.
Various data inputs are used in determining the value of each of the Fund’s investments as of the reporting period end. These data inputs are
33 OPPENHEIMER GLOBAL MULTI-ALTERNATIVES FUND/VA
| | |
NOTES TO CONSOLIDATED FINANCIAL STATEMENTS Continued |
3. Securities Valuation (Continued)
categorized in the following hierarchy under applicable financial accounting standards:
1) Level 1-unadjusted quoted prices in active markets for identical assets or liabilities (including securities actively traded on a securities exchange)
2) Level 2-inputs other than unadjusted quoted prices that are observable for the asset or liability (such as unadjusted quoted prices for similar assets and market corroborated inputs such as interest rates, prepayment speeds, credit risks, etc.)
3) Level 3-significant unobservable inputs (including the Manager’s own judgments about assumptions that market participants would use in pricing the asset or liability).
The inputs used for valuing securities are not necessarily an indication of the risks associated with investing in those securities.
The Fund classifies each of its investments in investment companies which are publicly offered as Level 1. Investment companies that are not publicly offered are measured using net asset value as a practical expedient, and are not classified in the fair value hierarchy.
The table below categorizes amounts that are included in the Fund’s Consolidated Statement of Assets and Liabilities at period end based on valuation input level:
| | | | | | | | | | | | | | | | |
| | | Level 1—
Unadjusted
Quoted Prices | | | Level 2— Other Significant
Observable Inputs | | | Level 3—
Significant
Unobservable
Inputs | | | Value | |
Assets Table | | | | | | | | | | | | | | | | |
Investments, at Value: | | | | | | | | | | | | | | | | |
Common Stocks | | | | | | | | | | | | | | | | |
Consumer Discretionary | | $ | 4,887,593 | | | $ | 172,551 | | | $ | — | | | $ | 5,060,144 | |
Consumer Staples | | | 5,057,839 | | | | — | | | | — | | | | 5,057,839 | |
Energy | | | 29,517,429 | | | | 46,264 | | | | — | | | | 29,563,693 | |
Financials | | | 19,079,980 | | | | 4,236,566 | | | | — | | | | 23,316,546 | |
Health Care | | | 12,862,363 | | | | 959,490 | | | | 6,316 | | | | 13,828,169 | |
Industrials | | | 17,209,045 | | | | — | | | | — | | | | 17,209,045 | |
Information Technology | | | 13,005,312 | | | | — | | | | 2 | | | | 13,005,314 | |
Materials | | | 6,837,713 | | | | — | | | | — | | | | 6,837,713 | |
Telecommunication Services | | | 4,027,909 | | | | — | | | | — | | | | 4,027,909 | |
Utilities | | | 3,520,383 | | | | — | | | | — | | | | 3,520,383 | |
Preferred Stocks | | | 482,758 | | | | 823,150 | | | | — | | | | 1,305,908 | |
Rights, Warrants and Certificates | | | 8,312 | | | | 1,665 | | | | — | | | | 9,977 | |
Asset-Backed Securities | | | — | | | | 14,141,566 | | | | 1,923,696 | | | | 16,065,262 | |
Mortgage-Backed Obligation | | | — | | | | 2,064,231 | | | | — | | | | 2,064,231 | |
Foreign Government Obligations | | | — | | | | 7,608,528 | | | | — | | | | 7,608,528 | |
Non-Convertible Corporate Bonds and Notes | | | — | | | | 34,590,391 | | | | 50 | | | | 34,590,441 | |
Convertible Corporate Bond and Note | | | — | | | | 628,500 | | | | — | | | | 628,500 | |
Corporate Loans | | | — | | | | 12,765,254 | | | | — | | | | 12,765,254 | |
Event-Linked Bonds | | | — | | | | 56,185,456 | | | | — | | | | 56,185,456 | |
Short-Term Notes | | | — | | | | 72,869,194 | | | | — | | | | 72,869,194 | |
Investment Companies | | | 63,570,684 | | | | — | | | | — | | | | 63,570,684 | |
Exchange-Traded Option Purchased | | | 3,640 | | | | — | | | | — | | | | 3,640 | |
Over-the-Counter Options Purchased | | | — | | | | 2,031,992 | | | | — | | | | 2,031,992 | |
Over-the-Counter Interest Rate Swaptions Purchased | | | — | | | | 360,248 | | | | — | | | | 360,248 | |
| | | | |
Total Investments, at Value | | | 180,070,960 | | | | 209,485,046 | | | | 1,930,064 | | | | 391,486,070 | |
Other Financial Instruments: | | | | | | | | | | | | | | | | |
Swaps, at value | | | — | | | | 2,112,098 | | | | — | | | | 2,112,098 | |
Centrally cleared swaps, at value | | | — | | | | 1,212,507 | | | | — | | | | 1,212,507 | |
Futures contracts | | | 960,014 | | | | — | | | | — | | | | 960,014 | |
Forward currency exchange contracts | | | — | | | | 4,565,950 | | | | — | | | | 4,565,950 | |
| | | | |
Total Assets | | $ | 181,030,974 | | | $ | 217,375,601 | | | $ | 1,930,064 | | | $ | 400,336,639 | |
| | | | |
| | | | |
Liabilities Table | | | | | | | | | | | | | | | | |
Other Financial Instruments: | | | | | | | | | | | | | | | | |
Investment Company Securities Sold Short | | $ | (2,305,719 | ) | | $ | — | | | $ | — | | | $ | (2,305,719) | |
Common Stock Securities Sold Short | | | (33,266,980 | ) | | | (4,401,993 | ) | | | — | | | | (37,668,973) | |
Swaps, at value | | | — | | | | (946,498 | ) | | | — | | | | (946,498) | |
Centrally cleared swaps, at value | | | — | | | | (2,278,028 | ) | | | — | | | | (2,278,028) | |
Options written, at value | | | — | | | | (2,031,592 | ) | | | — | | | | (2,031,592) | |
Futures contracts | | | (1,232,675 | ) | | | — | | | | — | | | | (1,232,675) | |
Forward currency exchange contracts | | | — | | | | (1,280,866 | ) | | | — | | | | (1,280,866) | |
| | | | |
Total Liabilities | | $ | (36,805,374 | ) | | $ | (10,938,977 | ) | | $ | — | | | $ | (47,744,351) | |
| | | | |
Forward currency exchange contracts and futures contracts, if any, are reported at their unrealized appreciation/depreciation at measurement date, which represents the change in the contract’s value from trade date. All additional assets and liabilities included in the above table are reported at their market value at measurement date.
34 OPPENHEIMER GLOBAL MULTI-ALTERNATIVES FUND/VA
3. Securities Valuation (Continued)
The table below shows the transfers between Level 2 and Level 3. The Fund’s policy is to recognize transfers in and transfers out as of the beginning of the reporting period.
| | | | | | | | | | | | | | | | |
| | | Transfers into Level 2** | | | Transfers out of Level 2* | | | Transfers into Level 3* | | | Transfers out of Level 3** | |
| |
Assets Table | | | | | | | | | | | | | | | | |
Investments, at Value: | | | | | | | | | | | | | | | | |
Asset-Backed Securities | | $ | 1,394,054 | | | $ | (2,557,750 | ) | | $ | 2,557,750 | | | $ | (1,394,054) | |
| | | | |
Total Assets | | $ | 1,394,054 | | | $ | (2,557,750 | ) | | $ | 2,557,750 | | | $ | (1,394,054) | |
| | | | |
* Transferred from Level 2 to Level 3 because of the lack of observable market data due to a decrease in market activity for these securities.
** Transferred from Level 3 to Level 2 due to the availability of market data for this security.
4. Investments and Risks
Risks of Foreign Investing. The Fund may invest in foreign securities which are subject to special risks. Securities traded in foreign markets may be less liquid and more volatile than those traded in U.S. markets. Foreign issuers are usually not subject to the same accounting and disclosure requirements that U.S. companies are subject to, which may make it difficult for the Fund to evaluate a foreign company’s operations or financial condition. A change in the value of a foreign currency against the U.S. dollar will result in a change in the U.S. dollar value of investments denominated in that foreign currency and in the value of any income or distributions the Fund may receive on those investments. The value of foreign investments may be affected by exchange control regulations, foreign taxes, higher transaction and other costs, delays in the settlement of transactions, changes in economic or monetary policy in the United States or abroad, expropriation or nationalization of a company’s assets, or other political and economic factors. In addition, due to the inter-relationship of global economies and financial markets, changes in political and economic factors in one country or region could adversely affect conditions in another country or region. Investments in foreign securities may also expose the Fund to time-zone arbitrage risk. Foreign securities may trade on weekends or other days when the Fund does not price its shares. At times, the Fund may emphasize investments in a particular country or region and may be subject to greater risks from adverse events that occur in that country or region. Foreign securities and foreign currencies held in foreign banks and securities depositories may be subject to limited or no regulatory oversight.
Investments in Affiliated Funds. The Fund is permitted to invest in other mutual funds advised by the Manager (“Affiliated Funds”). Affiliated Funds are open-end management investment companies registered under the 1940 Act, as amended. The Manager is the investment adviser of, and the Sub-Adviser provides investment and related advisory services to, the Affiliated Funds. When applicable, the Fund’s investments in Affiliated Funds are included in the Consolidated Statement of Investments. Shares of Affiliated Funds are valued at their net asset value per share. As a shareholder, the Fund is subject to its proportional share of the Affiliated Funds’ expenses, including their management fee. The Manager will waive fees and/or reimburse Fund expenses in an amount equal to the indirect management fees incurred through the Fund’s investment in the Affiliated Funds.
Each of the Affiliated Funds in which the Fund invests has its own investment risks, and those risks can affect the value of the Fund’s investments and therefore the value of the Fund’s shares. To the extent that the Fund invests more of its assets in one Affiliated Fund than in another, the Fund will have greater exposure to the risks of that Affiliated Fund.
Investments in Money Market Instruments. The Fund is permitted to invest its free cash balances in money market instruments to provide liquidity or for defensive purposes. The Fund may invest in money market instruments by investing in Class E shares of Oppenheimer Institutional Government Money Market Fund (“IGMMF”), formerly known as Oppenheimer Institutional Money Market Fund, which is an Affiliated Fund. IGMMF is regulated as a money market fund under the 1940 Act, as amended. The Fund may also invest in money market instruments directly or in other affiliated or unaffiliated money market funds.
Master Limited Partnerships (“MLPs”). MLPs issue common units that represent an equity ownership interest in a partnership and provide limited voting rights. MLP common units are registered with the Securities and Exchange Commission (“SEC”), and are freely tradable on securities exchanges such as the NYSE and the NASDAQ Stock Market (“NASDAQ”), or in the over-the-counter (“OTC”) market. An MLP consists of one or more general partners, who conduct the business, and one or more limited partners, who contribute capital. MLP common unit holders have a limited role in the partnership’s operations and management. The Fund, as a limited partner, normally would not be liable for the debts of the MLP beyond the amounts the Fund has contributed, but would not be shielded to the same extent that a shareholder of a corporation would be. In certain circumstances creditors of an MLP would have the right to seek return of capital distributed to a limited partner. This right of an MLP’s creditors would continue after the Fund sold its investment in the MLP.
Event-Linked Bonds. The Fund may invest in “event-linked” bonds. Event-linked bonds, which are sometimes referred to as “catastrophe” bonds, are fixed income securities for which the return of principal and payment of interest is contingent on the non-occurrence of a specific trigger event, such as a hurricane, earthquake, or other occurrence that leads to physical or economic loss. If the trigger event occurs prior to maturity, the Fund may lose all or a portion of its principal in addition to interest otherwise due from the security. Event-linked bonds may expose the Fund to certain other risks, including issuer default, adverse regulatory or jurisdictional interpretations, liquidity risk and adverse tax consequences. The Fund records the net change in market value of event-linked bonds on the Consolidated Statement of Operations as a change in unrealized appreciation or depreciation on investments. The Fund records a realized gain or loss on the Consolidated Statement of Operations upon the sale or maturity of such securities.
35 OPPENHEIMER GLOBAL MULTI-ALTERNATIVES FUND/VA
| | |
NOTES TO CONSOLIDATED FINANCIAL STATEMENTS Continued |
4. Investments and Risks (Continued)
Loans. The Fund invests in loans made to U.S. and foreign borrowers that are corporations, partnerships or other business entities. The Fund will do so directly as an original lender or by assignment or indirectly through participation agreements or certain derivative instruments. While many of these loans will be collateralized, the Fund can also invest in uncollateralized loans. Loans are often issued in connection with recapitalizations, acquisitions, leveraged buyouts, and refinancing of borrowers. The loans often pay interest at rates that float above (or are adjusted periodically based on) a benchmark that reflects current interest rates although the Fund can also invest in loans with fixed interest rates.
Securities on a When-Issued or Delayed Delivery Basis. The Fund may purchase securities on a “when-issued” basis, and may purchase or sell securities on a “delayed delivery” basis. “When-issued” or “delayed delivery” refers to securities whose terms and indenture are available and for which a market exists, but which are not available for immediate delivery. Delivery and payment for securities that have been purchased by the Fund on a when-issued basis normally takes place within six months and possibly as long as two years or more after the trade date. During this period, such securities do not earn interest, are subject to market fluctuation and may increase or decrease in value prior to their delivery. The purchase of securities on a when-issued basis may increase the volatility of the Fund’s net asset value to the extent the Fund executes such transactions while remaining substantially fully invested. When the Fund engages in when-issued or delayed delivery transactions, it relies on the buyer or seller, as the case may be, to complete the transaction. Their failure to do so may cause the Fund to lose the opportunity to obtain or dispose of the security at a price and yield it considers advantageous. The Fund may also sell securities that it purchased on a when-issued basis or forward commitment prior to settlement of the original purchase.
At period end, the Fund had purchased securities issued on a when-issued or delayed delivery basis as follows:
| | | | |
| | | When-Issued or | |
| | | Delayed Delivery | |
| | | Basis Transactions | |
Purchased securities | | | $1,934,751 | |
Restricted Securities. At period end, investments in securities included issues that are restricted. A restricted security may have a contractual restriction on its resale and is valued under methods approved by the Board of Trustees as reflecting fair value. Securities that are restricted are marked with an applicable footnote on the Consolidated Statement of Investments. Restricted securities are reported on a schedule following the Consolidated Statement of Investments.
Equity Security Risk. Stocks and other equity securities fluctuate in price. The value of the Fund’s portfolio may be affected by changes in the equity markets generally. Equity markets may experience significant short-term volatility and may fall sharply at times. Different markets may behave differently from each other and U.S. equity markets may move in the opposite direction from one or more foreign stock markets. Adverse events in any part of the equity or fixed-income markets may have unexpected negative effects on other market segments.
The prices of individual equity securities generally do not all move in the same direction at the same time and a variety of factors can affect the price of a particular company’s securities. These factors may include, but are not limited to, poor earnings reports, a loss of customers, litigation against the company, general unfavorable performance of the company’s sector or industry, or changes in government regulations affecting the company or its industry.
Credit Risk. The Fund invests in high-yield, non-investment-grade bonds, which may be subject to a greater degree of credit risk. Credit risk relates to the ability of the issuer to meet interest or principal payments or both as they become due. The Fund may acquire securities that have missed an interest payment, and is not obligated to dispose of securities whose issuers or underlying obligors subsequently miss an interest payment. Information concerning securities not accruing interest at period end is as follows:
| | | | |
Cost | | | $1,764,185 | |
Market Value | | | $1,471,295 | |
Market Value as % of Net Assets | | | 0.37% | |
Sovereign Debt Risk. The Fund invests in sovereign debt securities, which are subject to certain special risks. These risks include, but are not limited to, the risk that a governmental entity may delay or refuse, or otherwise be unable, to pay interest or repay the principal on its sovereign debt. There may also be no legal process for collecting sovereign debt that a government does not pay or bankruptcy proceedings through which all or part of such sovereign debt may be collected. In addition, a restructuring or default of sovereign debt may also cause additional impacts to the financial markets, such as downgrades to credit ratings, reduced liquidity and increased volatility, among others.
Shareholder Concentration. At period end, one shareholder owned 20% or more of the Fund’s total outstanding shares. The shareholder is a related party of the Fund. Related parties may include, but are not limited to, the investment manager and its affiliates, affiliated broker dealers, fund of funds, and directors or employees. The related party owned 96% of the Fund’s total outstanding shares at period end.
5. Market Risk Factors
The Fund’s investments in securities and/or financial derivatives may expose the Fund to various market risk factors:
Commodity Risk. Commodity risk relates to the change in value of commodities or commodity indexes as they relate to increases or decreases in
36 OPPENHEIMER GLOBAL MULTI-ALTERNATIVES FUND/VA
5. Market Risk Factors (Continued)
the commodities market. Commodities are physical assets that have tangible properties. Examples of these types of assets are crude oil, heating oil, metals, livestock, and agricultural products.
Credit Risk. Credit risk relates to the ability of the issuer of debt to meet interest and principal payments, or both, as they come due. In general, lower-grade, higher-yield debt securities are subject to credit risk to a greater extent than lower-yield, higher-quality securities.
Equity Risk. Equity risk relates to the change in value of equity securities as they relate to increases or decreases in the general market.
Foreign Exchange Rate Risk. Foreign exchange rate risk relates to the change in the U.S. dollar value of a security held that is denominated in a foreign currency. The U.S. dollar value of a foreign currency denominated security will decrease as the dollar appreciates against the currency, while the U.S. dollar value will increase as the dollar depreciates against the currency.
Interest Rate Risk. Interest rate risk refers to the fluctuations in value of fixed-income securities resulting from the inverse relationship between price and yield. For example, an increase in general interest rates will tend to reduce the market value of already issued fixed-income investments, and a decline in general interest rates will tend to increase their value. In addition, debt securities with longer maturities, which tend to have higher yields, are subject to potentially greater fluctuations in value from changes in interest rates than obligations with shorter maturities.
Volatility Risk. Volatility risk refers to the magnitude of the movement, but not the direction of the movement, in a financial instrument’s price over a defined time period. Large increases or decreases in a financial instrument’s price over a relative time period typically indicate greater volatility risk, while small increases or decreases in its price typically indicate lower volatility risk.
6. Use of Derivatives
The Fund’s investment objective not only permits the Fund to purchase investment securities, it also allows the Fund to enter into various types of derivatives contracts, including, but not limited to, futures contracts, forward currency exchange contracts, credit default swaps, interest rate swaps, total return swaps, variance swaps and purchased and written options. In doing so, the Fund will employ strategies in differing combinations to permit it to increase, decrease, or change the level or types of exposure to market risk factors. These instruments may allow the Fund to pursue its objectives more quickly and efficiently than if it were to make direct purchases or sales of securities capable of effecting a similar response to market factors. Such contracts may be entered into through a bilateral over-the-counter (“OTC”) transaction, or through a securities or futures exchange and cleared through a clearinghouse.
Derivatives may have little or no initial cash investment relative to their market value exposure and therefore can produce significant gains or losses in excess of their cost due to unanticipated changes in the market risk factors and the overall market. This use of embedded leverage allows the Fund to increase its market value exposure relative to its net assets and can substantially increase the volatility of the Fund’s performance. In instances where the Fund is using derivatives to decrease, or hedge, exposures to market risk factors for securities held by the Fund, there are also risks that those derivatives may not perform as expected resulting in losses for the combined or hedged positions. Some derivatives have the potential for unlimited loss, regardless of the size of the Fund’s initial investment.
Additional associated risks from investing in derivatives also exist and potentially could have significant effects on the valuation of the derivative and the Fund. Typically, the associated risks are not the risks that the Fund is attempting to increase or decrease exposure to, per its investment objectives, but are the additional risks from investing in derivatives. Examples of these associated risks are liquidity risk, which is the risk that the Fund will not be able to sell the derivative in the open market in a timely manner, and counterparty credit risk, which is the risk that the counterparty will not fulfill its obligation to the Fund.
The Fund’s actual exposures to these market risk factors and associated risks during the period are discussed in further detail, by derivative type, below.
Forward Currency Exchange Contracts
The Fund may enter into forward currency exchange contracts (“forward contracts”) for the purchase or sale of a foreign currency at a negotiated rate at a future date. Such contracts are traded in the OTC inter-bank currency dealer market.
Forward contracts are reported on a schedule following the Consolidated Statement of Investments. The unrealized appreciation (depreciation) is reported in the Consolidated Statement of Assets and Liabilities as a receivable (or payable) and in the Consolidated Statement of Operations within the change in unrealized appreciation (depreciation). At contract close, the difference between the original cost of the contract and the value at the close date is recorded as a realized gain (loss) in the Consolidated Statement of Operations.
The Fund has entered into forward contracts with the obligation to purchase specified foreign currencies in the future at a currently negotiated forward rate in order to take a positive investment perspective on the related currency. These forward contracts seek to increase exposure to foreign exchange rate risk.
The Fund has entered into forward contracts with the obligation to purchase specified foreign currencies in the future at a currently negotiated forward rate in order to decrease exposure to foreign exchange rate risk associated with foreign currency denominated securities held by the Fund.
The Fund has entered into forward contracts with the obligation to sell specified foreign currencies in the future at a currently negotiated forward rate in order to take a negative investment perspective on the related currency. These forward contracts seek to increase exposure to foreign exchange rate risk.
The Fund has entered into forward contracts with the obligation to sell specified foreign currencies in the future at a currently negotiated forward rate in order to decrease exposure to foreign exchange rate risk associated with foreign currency denominated securities held by the Fund.
During the reporting period, the Fund had daily average contract amounts on forward contracts to buy and sell of $115,314,500 and $180,011,486,
37 OPPENHEIMER GLOBAL MULTI-ALTERNATIVES FUND/VA
| | |
NOTES TO CONSOLIDATED FINANCIAL STATEMENTS Continued |
6. Use of Derivatives (Continued)
respectively.
Additional associated risk to the Fund includes counterparty credit risk. Counterparty credit risk arises from the possibility that the counterparty to a forward contract will default and fail to perform its obligations to the Fund.
Futures Contracts
A futures contract is a commitment to buy or sell a specific amount of a commodity, financial instrument or currency at a negotiated price on a stipulated future date. The Fund may buy and sell futures contracts and may also buy or write put or call options on these futures contracts. Futures contracts and options thereon are generally entered into on a regulated futures exchange and cleared through a clearinghouse associated with the exchange.
Upon entering into a futures contract, the Fund is required to deposit either cash or securities (initial margin) in an amount equal to a certain percentage of the contract value in an account registered in the futures commission merchant’s name. Subsequent payments (variation margin) are paid to or from the futures commission merchant each day equal to the daily changes in the contract value. Such payments are recorded as unrealized gains and losses. Should the Fund fail to make requested variation margin payments, the futures commission merchant can gain access to the initial margin to satisfy the Fund’s payment obligations.
Futures contracts are reported on a schedule following the Consolidated Statement of Investments. Securities held by a futures commission merchant to cover initial margin requirements on open futures contracts are noted in the Consolidated Statement of Investments. Cash held by a futures commission merchant to cover initial margin requirements on open futures contracts and the receivable and/or payable for the daily mark to market for the variation margin are noted in the Consolidated Statement of Assets and Liabilities. The net change in unrealized appreciation and depreciation is reported in the Consolidated Statement of Operations. Realized gains (losses) are reported in the Consolidated Statement of Operations at the closing or expiration of futures contracts.
The Fund has purchased futures contracts on various bonds and notes to increase exposure to interest rate risk. The Fund has sold futures contracts on various bonds and notes to decrease exposure to interest rate risk.
The Fund has purchased futures contracts on various equity indexes to increase exposure to equity risk.
The Fund has sold futures contracts on various equity indexes to decrease exposure to equity risk.
The Fund has purchased futures contracts, which have values that are linked to the price movement of the related volatility indexes, in order to increase exposure to volatility risk.
The Fund has sold futures contracts, which have values that are linked to the price movement of the related volatility indexes, in order to decrease exposure to volatility risk.
The Fund has purchased futures contracts, which have values that are linked to the price movement of the related commodities, in order to increase exposure to commodity risk.
The Fund has sold futures contracts, which have values that are linked to the price movement of the related commodities, in order to decrease exposure to commodity risk.
During the reporting period, the Fund had an ending monthly average market value of $40,429,651 and $103,611,269 on futures contracts purchased and sold, respectively.
Additional associated risks of entering into futures contracts (and related options) include the possibility that there may be an illiquid market where the Fund is unable to liquidate the contract or enter into an offsetting position and, if used for hedging purposes, the risk that the price of the contract will correlate imperfectly with the prices of the Fund’s securities.
Option Activity
The Fund may buy and sell put and call options, or write put and call options. When an option is written, the Fund receives a premium and becomes obligated to sell or purchase the underlying security, currency or other underlying financial instrument at a fixed price, upon exercise of the option.
Options can be traded through an exchange or through a privately negotiated arrangement with a dealer in an OTC transaction. Options traded through an exchange are generally cleared through a clearinghouse (such as The Options Clearing Corporation). The difference between the premium received or paid, and market value of the option, is recorded as unrealized appreciation or depreciation. The net change in unrealized appreciation or depreciation is reported in the Consolidated Statement of Operations. When an option is exercised, the cost of the security purchased or the proceeds of the security sale are adjusted by the amount of premium received or paid. Upon the expiration or closing of the option transaction, a gain or loss is reported in the Consolidated Statement of Operations.
The Fund has purchased call options on currencies to increase exposure to foreign exchange rate risk. A purchased call option becomes more valuable as the price of the underlying financial instrument appreciates relative to the strike price.
The Fund has purchased put options on currencies to decrease exposure to foreign exchange rate risk. A purchased put option becomes more valuable as the price of the underlying financial instrument depreciates relative to the strike price.
The Fund has purchased put options on treasury and/or euro futures to decrease exposure to interest rate risk. A purchased put option becomes more valuable as the price of the underlying financial instrument depreciates relative to the strike price.
The Fund has purchased call options on individual equity securities and/or equity indexes to increase exposure to equity risk. A purchased call option becomes more valuable as the price of the underlying financial instrument appreciates relative to the strike price.
The Fund has purchased put options on individual equity securities and/or equity indexes to decrease exposure to equity risk. A purchased put option becomes more valuable as the price of the underlying financial instrument depreciates relative to the strike price.
During the reporting period, the Fund had an ending monthly average market value of $354,090 and $863,558 on purchased call options and
38 OPPENHEIMER GLOBAL MULTI-ALTERNATIVES FUND/VA
6. Use of Derivatives (Continued)
purchased put options, respectively.
Options written, if any, are reported in a schedule following the Consolidated Statement of Investments and as a liability in the Consolidated Statement of Assets and Liabilities. Securities held in collateral accounts to cover potential obligations with respect to outstanding written options are noted in the Consolidated Statement of Investments.
The risk in writing a call option is that the market price of the security increases and if the option is exercised, the Fund must either purchase the security at a higher price for delivery or, if the Fund owns the underlying security, give up the opportunity for profit. The risk in writing a put option is that the Fund may incur a loss if the market price of the security decreases and the option is exercised. The risk in buying an option is that the Fund pays a premium whether or not the option is exercised. The Fund also has the additional risk that there may be an illiquid market where the Fund is unable to close the contract.
The Fund has written put options on currencies to increase exposure to foreign exchange rate risk. A written put option becomes more valuable as the price of the underlying financial instrument appreciates relative to the strike price.
The Fund has written call options on currencies to decrease exposure to foreign exchange rate risk. A written call option becomes more valuable as the price of the underlying financial instrument depreciates relative to the strike price.
The Fund has written call options on treasury and/or euro futures to decrease exposure to interest rate risk. A written call option becomes more valuable as the price of the underlying financial instrument depreciates relative to the strike price.
During the reporting period, the Fund had an ending monthly average market value of $934,318 and $648,185 on written call options and written put options, respectively.
Additional associated risks to the Fund include counterparty credit risk and liquidity risk.
Written option activity for the reporting period was as follows:
| | | | | | | | | | | | |
| | | Number of
Contracts | | Amount of Premiums |
Options outstanding as of | | | | | | | | | | | | |
December 31, 2015 | | | 5,400,003,810 | | | | | $ | 609,381 | | | |
Options written | | | 2,379,799,459,880 | | | | | | 17,553,603 | | | |
Options closed or expired | | | (337,503,960,000) | | | | | | (6,379,729) | | | |
Options exercised | | | (1,529,891,698,690) | | | | | | (9,707,383) | | | |
| | | | | | |
Options outstanding as of | | | | | | | | | | | | |
December 31, 2016 | | | 517,803,805,000 | | | | | $ | 2,075,872 | | | |
| | | | | | |
Swap Contracts
The Fund may enter into swap contract agreements with a counterparty to exchange a series of cash flows based on either specified reference rates, the price or volatility of asset or non-asset references, or the occurrence of a credit event, over a specified period. Swaps can be executed in a bi-lateral privately negotiated arrangement with a dealer in an OTC transaction (“OTC swaps”) or executed on a regulated market. Certain swaps, regardless of the venue of their execution, are required to be cleared through a clearinghouse (“centrally cleared swaps”). Swap contracts may include interest rate, equity, debt, index, total return, credit default, currency, and volatility swaps.
Swap contracts are reported on a schedule following the Consolidated Statement of Investments. The values of centrally cleared swap and OTC swap contracts are aggregated by positive and negative values and disclosed separately on the Consolidated Statement of Assets and Liabilities. The unrealized appreciation (depreciation) related to the change in the valuation of the notional amount of the swap is combined with the accrued interest due to (owed by) the Fund, if any, at termination or settlement. The net change in this amount during the period is included on the Consolidated Statement of Operations. The Fund also records any periodic payments received from (paid to) the counterparty, including at termination, under such contracts as realized gain (loss) on the Consolidated Statement of Operations.
Swap contract agreements are exposed to the market risk factor of the specific underlying reference rate or asset. Swap contracts are typically more attractively priced compared to similar investments in related cash securities because they isolate the risk to one market risk factor and eliminate the other market risk factors. Investments in cash securities (for instance bonds) have exposure to multiple risk factors (credit and interest rate risk). Because swaps have embedded leverage, they can expose the Fund to substantial risk in the isolated market risk factor.
Credit Default Swap Contracts. A credit default swap is a contract that enables an investor to buy or sell protection against a defined-issuer credit event, such as the issuer’s failure to make timely payments of interest or principal on a debt security, bankruptcy or restructuring. The Fund may enter into credit default swaps either by buying or selling protection on a corporate issuer, sovereign issuer, or a basket or index of issuers (the “reference asset”).
The buyer of protection pays a periodic fee to the seller of protection based on the notional amount of the swap contract. The seller of protection agrees to compensate the buyer of protection for future potential losses as a result of a credit event on the reference asset. The contract effectively transfers the credit event risk of the reference asset from the buyer of protection to the seller of protection.
The ongoing value of the contract will fluctuate throughout the term of the contract based primarily on the credit risk of the reference asset. If the credit quality of the reference asset improves relative to the credit quality at contract initiation, the buyer of protection may have an unrealized loss greater than the anticipated periodic fee owed. This unrealized loss would be the result of current credit protection being cheaper than the cost of credit protection at contract initiation. If the buyer elects to terminate the contract prior to its maturity, and there has been no credit event, this unrealized loss will become realized. If the contract is held to maturity, and there has been no credit event, the realized loss will be equal to the
39 OPPENHEIMER GLOBAL MULTI-ALTERNATIVES FUND/VA
| | |
NOTES TO CONSOLIDATED FINANCIAL STATEMENTS Continued |
6. Use of Derivatives (Continued)
periodic fee paid over the life of the contract.
If there is a credit event, the buyer of protection can exercise its rights under the contract and receive a payment from the seller of protection equal to the notional amount of the swap less the market value of specified debt securities issued by the reference asset. Upon exercise of the contract the difference between such value and the notional amount is recorded as realized gain (loss) and is included on the Consolidated Statement of Operations.
The Fund has sold credit protection through credit default swaps to increase exposure to the credit risk of individual issuers and/or indexes of issuers that are either unavailable or considered to be less attractive in the bond market.
The Fund has purchased credit protection through credit default swaps to decrease exposure to the credit risk of individual issuers and/or indexes of issuers.
The Fund has engaged in spread curve trades by simultaneously purchasing and selling protection through credit default swaps referenced to the same reference asset but with different maturities. Spread curve trades attempt to gain exposure to credit risk on a forward basis by realizing gains on the expected differences in spreads.
For the reporting period, the Fund had ending monthly average notional amounts of $64,377,846 and $19,897,953 on credit default swaps to buy protection and credit default swaps to sell protection, respectively.
Additional associated risks to the Fund include counterparty credit risk and liquidity risk.
Interest Rate Swap Contracts. An interest rate swap is an agreement between counterparties to exchange periodic payments based on interest rates. One cash flow stream will typically be a floating rate payment based upon a specified floating interest rate while the other is typically a fixed interest rate.
The Fund has entered into interest rate swaps in which it pays a floating interest rate and receives a fixed interest rate in order to increase exposure to interest rate risk. Typically, if relative interest rates rise, payments made by the Fund under a swap agreement will be greater than the payments received by the Fund.
The Fund has entered into interest rate swaps in which it pays a fixed interest rate and receives a floating interest rate in order to decrease exposure to interest rate risk. Typically, if relative interest rates rise, payments received by the Fund under the swap agreement will be greater than the payments made by the Fund.
For the reporting period, the Fund had ending monthly average notional amounts of $19,749,223 and $20,735,535 on interest rate swaps which pay a fixed rate and interest rate swaps which receive a fixed rate, respectively.
Additional associated risks to the Fund include counterparty credit risk and liquidity risk.
Total Return Swap Contracts. A total return swap is an agreement between counterparties to exchange periodic payments based on the value of asset or non-asset references. One cash flow is typically based on a non-asset reference (such as an interest rate) and the other on the total return of a reference asset (such as a security or a basket of securities or securities index). The total return of the reference asset typically includes appreciation or depreciation on the reference asset, plus any interest or dividend payments.
Total return swap contracts are exposed to the market risk factor of the specific underlying financial instrument or index. Total return swaps are less standard in structure than other types of swaps and can isolate and/or include multiple types of market risk factors including equity risk, credit risk, and interest rate risk.
The Fund has entered into total return swaps on various equity securities or indexes to increase exposure to equity risk. These equity risk related total return swaps require the Fund to pay a floating reference interest rate, and an amount equal to the negative price movement of securities or an index (expressed as a percentage) multiplied by the notional amount of the contract. The Fund will receive payments equal to the positive price movement of the same securities or index (expressed as a percentage) multiplied by the notional amount of the contract and, in some cases, dividends paid on the securities.
The Fund has entered into total return swaps on various equity securities or indexes to decrease exposure to equity risk. These equity risk related total return swaps require the Fund to pay an amount equal to the positive price movement of securities or an index (expressed as a percentage) multiplied by the notional amount of the contract and, in some cases, dividends paid on the securities. The Fund will receive payments of a floating reference interest rate and an amount equal to the negative price movement of the same securities or index (expressed as a percentage) multiplied by the notional amount of the contract.
The Fund has entered into total return swaps to increase exposure to the credit risk of various indexes or basket of securities. These credit risk related total return swaps require the Fund to pay to, or receive payments from, the counterparty based on the movement of credit spreads of the related indexes or securities.
The Fund has entered into total return swaps to decrease exposure to the credit risk of various indexes or basket of securities. These credit risk related total return swaps require the fund to pay to, or receive payments from, the counterparty based on the movement of credit spreads of the related indexes or securities.
For the reporting period, the Fund had ending monthly average notional amounts of $166,573,688 and $35,289,655 on total return swaps which are long the reference asset and total return swaps which are short the reference asset, respectively.
Additional associated risks to the Fund include counterparty credit risk and liquidity risk.
Volatility Swap Contracts. A volatility swap is an agreement between counterparties to exchange periodic payments based on the measured volatility of a reference security, index, currency or other reference investment over a specified time frame. One cash flow is typically based on the realized volatility of the reference investment as measured by changes in its price or level over the specified time period while the other cash flow is based on a specified rate representing expected volatility for the reference investment at the time the swap is executed, or the measured volatility
40 OPPENHEIMER GLOBAL MULTI-ALTERNATIVES FUND/VA
6. Use of Derivatives (Continued)
of a different reference investment over the specified time period. The appreciation or depreciation on a volatility swap will typically depend on the magnitude of the reference investment’s volatility, or size of the movements in its price, over the specified time period, rather than general directional increases or decreases in its price.
Volatility swaps are less standard in structure than other types of swaps and provide pure, or isolated, exposure to volatility risk of the specific underlying reference investment. Volatility swaps are typically used to speculate on future volatility levels, to trade the spread between realized and expected volatility, or to decrease the volatility exposure of investments held by the Fund.
Variance swaps are a type of volatility swap where counterparties agree to exchange periodic payments based on the measured variance (or the volatility squared) of a reference security, index, or other reference investment over a specified time period. At payment date, a net cash flow will be exchanged based on the difference between the realized variance of the reference investment over the specified time period and the specified rate representing expected variance for the reference investment at the time the swap is executed multiplied by the notional amount of the contract.
The Fund has entered into volatility swaps to increase exposure to the volatility risk of various reference investments. These types of volatility swaps require the Fund to pay the measured volatility and receive a fixed rate payment. If the measured volatility of the related reference investment increases over the period, the swaps will depreciate in value. Conversely, if the measured volatility of the related reference investment decreases over the period, the swaps will appreciate in value.
The Fund has entered into volatility swaps to decrease exposure to the volatility risk of various reference investments. These types of volatility swaps require the Fund to pay a fixed rate payment and receive the measured volatility. If the measured volatility of the related reference investment increases over the period, the swaps will appreciate in value. Conversely, if the measured volatility of the related reference investment decreases over the period, the swaps will depreciate in value.
The Fund has entered into variance swaps to increase exposure to the volatility risk of various reference investments. These types of volatility swaps require the Fund to make a payment if the measured price variance of the reference investment exceeds the specified fixed rate. If the measured variance of the related reference investment increases over the period, the swaps will depreciate in value. Conversely, if the measured variance of the related reference investment decreases over the period, the swaps will appreciate in value.
The Fund has entered into variance swaps to decrease exposure to the volatility risk of various reference investments. These types of volatility swaps require the Fund to make a payment if the measured price variance of the reference asset is less than the specified fixed rate. If the measured variance of the related reference investment increases over the period, the swaps will appreciate in value. Conversely, if the measured variance of the related reference investment decreases over the period, the swaps will depreciate in value.
For the reporting period, the Fund had ending monthly average notional amounts of $47,802 and $24,469 on volatility swaps which pay measured volatility/variance and volatility swaps which receive measured volatility/variance, respectively.
Additional associated risks to the Fund include counterparty credit risk and liquidity risk.
Swaption Transactions
The Fund may enter into a swaption contract which grants the purchaser the right, but not the obligation, to enter into a swap transaction at preset terms detailed in the underlying agreement within a specified period of time. The purchaser pays a premium to the swaption writer who bears the risk of unfavorable changes in the preset terms on the underlying swap.
Purchased swaptions are reported as a component of investments in the Consolidated Statement of Investments and the Consolidated Statement of Assets and Liabilities. Written swaptions are reported on a schedule following the Consolidated Statement of Investments and their value is reported as a separate asset or liability line item in the Consolidated Statement of Assets and Liabilities. The net change in unrealized appreciation or depreciation on written swaptions is separately reported in the Consolidated Statement of Operations. When a swaption is exercised, the cost of the swap is adjusted by the amount of premium paid or received. Upon the expiration or closing of an unexercised swaption contract, a gain or loss is reported in the Consolidated Statement of Operations for the amount of the premium paid or received.
The Fund generally will incur a greater risk when it writes a swaption than when it purchases a swaption. When the Fund writes a swaption it will become obligated, upon exercise of the swaption, according to the terms of the underlying agreement. Swaption contracts written by the Fund do not give rise to counterparty credit risk prior to exercise as they obligate the Fund, not its counterparty, to perform. When the Fund purchases a swaption it only risks losing the amount of the premium it paid if the swaption expires unexercised. However, when the Fund exercises a purchased swaption there is a risk that the counterparty will fail to perform or otherwise default on its obligations under the swaption contract.
The Fund has purchased swaptions which gives it the option to enter into an interest rate swap in which it pays a floating interest rate and receives a fixed interest rate in order to increase exposure to interest rate risk. A purchased swaption of this type becomes more valuable as the reference interest rate decreases relative to the preset interest rate.
The Fund has purchased swaptions which gives it the option to enter into an interest rate swap in which it pays a fixed interest rate and receives a floating interest rate in order to decrease exposure to interest rate risk. A purchased swaption of this type becomes more valuable as the reference interest rate increases relative to the preset interest rate.
During the reporting period, the Fund had an ending monthly average market value of $364,271 on purchased swaptions.
Counterparty Credit Risk. Derivative positions are subject to the risk that the counterparty will not fulfill its obligation to the Fund. The Fund intends to enter into derivative transactions with counterparties that the Manager believes to be creditworthy at the time of the transaction.
The Fund’s risk of loss from counterparty credit risk on OTC derivatives is generally limited to the aggregate unrealized gain netted against any collateral held by the Fund. For OTC options purchased, the Fund bears the risk of loss of the amount of the premiums paid plus the positive change
41 OPPENHEIMER GLOBAL MULTI-ALTERNATIVES FUND/VA
| | |
NOTES TO CONSOLIDATED FINANCIAL STATEMENTS Continued |
6. Use of Derivatives (Continued)
in market values net of any collateral held by the Fund should the counterparty fail to perform under the contracts. Options written by the Fund do not typically give rise to counterparty credit risk, as options written generally obligate the Fund and not the counterparty to perform.
To reduce counterparty risk with respect to OTC transactions, the Fund has entered into master netting arrangements, established within the Fund’s International Swap and Derivatives Association, Inc. (“ISDA”) master agreements, which allow the Fund to make (or to have an entitlement to receive) a single net payment in the event of default (close-out netting) for outstanding payables and receivables with respect to certain OTC positions in swaps, options, swaptions, and forward currency exchange contracts for each individual counterparty. In addition, the Fund may require that certain counterparties post cash and/or securities in collateral accounts to cover their net payment obligations for those derivative contracts subject to ISDA master agreements. If the counterparty fails to perform under these contracts and agreements, the cash and/or securities will be made available to the Fund.
At period end, the Fund has required certain counterparties to post collateral of $7,182,841.
ISDA master agreements include credit related contingent features which allow counterparties to OTC derivatives to terminate derivative contracts prior to maturity in the event that, for example, the Fund’s net assets decline by a stated percentage or the Fund fails to meet the terms of its ISDA master agreements, which would cause the Fund to accelerate payment of any net liability owed to the counterparty.
For financial reporting purposes, the Fund does not offset derivative assets and derivative liabilities that are subject to netting arrangements in the Consolidated Statement of Assets and Liabilities. Bankruptcy or insolvency laws of a particular jurisdiction may impose restrictions on or prohibitions against the right of offset in bankruptcy, insolvency or other events.
The Fund’s risk of loss from counterparty credit risk on exchange-traded derivatives cleared through a clearinghouse and for centrally cleared swaps is generally considered lower than as compared to OTC derivatives. However, counterparty credit risk exists with respect to initial and variation margin deposited/paid by the Fund that is held in futures commission merchant, broker and/or clearinghouse accounts for such exchange-traded derivatives and for centrally cleared swaps.
With respect to centrally cleared swaps, such transactions will be submitted for clearing, and if cleared, will be held in accounts at futures commission merchants or brokers that are members of clearinghouses. While brokers, futures commission merchants and clearinghouses are required to segregate customer margin from their own assets, in the event that a broker, futures commission merchant or clearinghouse becomes insolvent or goes into bankruptcy and at that time there is a shortfall in the aggregate amount of margin held by the broker, futures commission merchant or clearinghouse for all its customers, U.S. bankruptcy laws will typically allocate that shortfall on a pro-rata basis across all the broker’s, futures commission merchant’s or clearinghouse’s customers, potentially resulting in losses to the Fund.
There is the risk that a broker, futures commission merchant or clearinghouse will decline to clear a transaction on the Fund’s behalf, and the Fund may be required to pay a termination fee to the executing broker with whom the Fund initially enters into the transaction. Clearinghouses may also be permitted to terminate centrally cleared swaps at any time. The Fund is also subject to the risk that the broker or futures commission merchant will improperly use the Fund’s assets deposited/paid as initial or variation margin to satisfy payment obligations of another customer. In the event of a default by another customer of the broker or futures commission merchant, the Fund might not receive its variation margin payments from the clearinghouse, due to the manner in which variation margin payments are aggregated for all customers of the broker/futures commission merchant.
Collateral and margin requirements differ by type of derivative. Margin requirements are established by the broker, futures commission merchant or clearinghouse for exchange-traded and cleared derivatives, including centrally cleared swaps. Brokers, futures commission merchants and clearinghouses can ask for margin in excess of the regulatory minimum, or increase the margin amount, in certain circumstances.
Collateral terms are contract specific for OTC derivatives. For derivatives traded under an ISDA master agreement, the collateral requirements are typically calculated by netting the mark to market amount for each transaction under such agreement and comparing that amount to the value of any collateral currently pledged by the Fund or the counterparty.
For financial reporting purposes, cash collateral that has been pledged to cover obligations of the Fund, if any, is reported separately on the Consolidated Statement of Assets and Liabilities as cash pledged as collateral. Non-cash collateral pledged by the Fund, if any, is noted in the Consolidated Statement of Investments. Generally, the amount of collateral due from or to a party must exceed a minimum transfer amount threshold (e.g. $250,000) before a transfer has to be made. To the extent amounts due to the Fund from its counterparties are not fully collateralized, contractually or otherwise, the Fund bears the risk of loss from counterparty nonperformance.
The following table presents by counterparty the Fund’s OTC derivative assets net of the related collateral pledged by the Fund at period end:
| | | | | | | | | | | | | | | | | | | | |
| | | | | | Gross Amounts Not Offset in the Consolidated Statement of
Assets & Liabilities | | | | |
| Counterparty | | Gross Amounts Not Offset
in the Consolidated
Statement of Assets &
Liabilities* | | | Financial Instruments
Available for Offset | | | Financial Instruments
Collateral Received** | | | Cash Collateral
Received** | | | Net Amount | |
Bank of America NA | | $ | 1,527,443 | | | $ | (525,990) | | | $ | (1,001,453) | | | $ | – | | | $ | – | |
Barclays Bank plc | | | 5,602 | | | | (5,602) | | | | – | | | | – | | | | – | |
BNP Paribas | | | 11,151 | | | | – | | | | – | | | | – | | | | 11,151 | |
Citibank NA | | | 1,441,183 | | | | (316,768) | | | | (1,124,415) | | | | – | | | | – | |
Deutsche Bank AG | | | 217,022 | | | | (217,022) | | | | – | | | | – | | | | – | |
Goldman Sachs Bank USA | | | 1,060,156 | | | | (862,367) | | | | (197,789) | | | | – | | | | – | |
Goldman Sachs International | | | 1,253,558 | | | | – | | | | (814,469) | | | | – | | | | 439,089 | |
HSBC Bank USA NA | | | 1,607,698 | | | | (121,291) | | | | – | | | | (1,486,407) | | | | – | |
42 OPPENHEIMER GLOBAL MULTI-ALTERNATIVES FUND/VA
| | |
6. Use of Derivatives (Continued) |
| | | | | | | | | | | | | | | | | | | | |
| | | | | | Gross Amounts Not Offset in the Consolidated Statement of
Assets & Liabilities | | | | |
| Counterparty | | Gross Amounts Not Offset
in the Consolidated
Statement of Assets &
Liabilities* | | | Financial Instruments
Available for Offset | | | Financial Instruments
Collateral Received** | | | Cash Collateral
Received** | | | Net Amount | |
JPMorgan Chase Bank NA | | $ | 1,820,699 | | | $ | (369,863) | | | | $ (1,450,836) | | | $ | – | | | $ | – | |
Morgan Stanley | | | 4,315 | | | | – | | | | – | | | | – | | | | 4,315 | |
Morgan Stanley Capital Services, Inc. | | | 79,020 | | | | (17,384) | | | | – | | | | – | | | | 61,636 | |
Toronto Dominion Bank | | | 42,441 | | | | (42,347) | | | | – | | | | – | | | | 94 | |
| | | | |
| | $ | 9,070,288 | | | $ | (2,478,634) | | | $ | (4,588,962) | | | $ | (1,486,407) | | | $ | 516,285 | |
| | | | |
*OTC derivatives are reported gross on the Consolidated Statement of Assets and Liabilities. Exchange traded options and margin related to centrally cleared swaps and futures, if any, are excluded from these reported amounts.
**Reported collateral posted for the benefit of the Fund within this table is limited to the net outstanding amount due from an individual counterparty. The collateral posted for the benefit of the Fund may exceed these amounts.
The following table presents by counterparty the Fund’s OTC derivative liabilities net of the related collateral pledged by the Fund at period end:
| | | | | | | | | | | | | | | | | | | | | | | | | | | | |
| | | | | | | | Gross Amounts Not Offset in the Consolidated Statement of Assets & Liabilities | | | | | | |
| Counterparty | | Gross Amounts Not Offset
in the Consolidated
Statement of Assets
& Liabilities* | | Financial Instruments
Available
for Offset | | Financial Instruments
Collateral
Pledged** | | Cash Collateral Pledged** | | | Net Amount |
Bank of America NA | | $ | (525,990) | | | | | $ | 525,990 | | | | | $ | – | | | | | | $– | | | $ | – | | | |
Barclays Bank plc | | | (63,505) | | | | | | 5,602 | | | | | | – | | | | | | – | | | | (57,903) | | | |
Citibank NA | | | (316,768) | | | | | | 316,768 | | | | | | – | | | | | | – | | | | – | | | |
Deutsche Bank AG | | | (834,953) | | | | | | 217,022 | | | | | | 617,931 | | | | | | – | | | | – | | | |
Goldman Sachs Bank USA | | | (862,367) | | | | | | 862,367 | | | | | | – | | | | | | – | | | | – | | | |
Goldman Sachs Group, Inc. (The) | | | (721,388) | | | | | | – | | | | | | – | | | | | | – | | | | (721,388) | | | |
HSBC Bank USA NA | | | (121,291) | | | | | | 121,291 | | | | | | – | | | | | | – | | | | – | | | |
JPMorgan Chase Bank NA | | | (369,863) | | | | | | 369,863 | | | | | | – | | | | | | – | | | | – | | | |
Morgan Stanley Capital Services, Inc. | | | (17,384) | | | | | | 17,384 | | | | | | – | | | | | | – | | | | – | | | |
Nomura Global Financial Products, Inc. | | | (383,100) | | | | | | – | | | | | | 383,100 | | | | | | – | | | | – | | | |
Toronto Dominion Bank | | | (42,347) | | | | | | 42,347 | | | | | | – | | | | | | – | | | | – | | | |
| | $ | (4,258,956) | | | | | $ | 2,478,634 | | | | | $ | 1,001,031 | | | | | $ | – | | | $ | (779,291) | | | |
| | | | | | | | | | | | | | | | | | | | | | | | | | | | |
*OTC derivatives are reported gross on the Consolidated Statement of Assets and Liabilities. Exchange traded options and margin related to centrally cleared swaps and futures, if any, are excluded from these reported amounts.
**Reported collateral pledged within this table is limited to the net outstanding amount due from the Fund. The securities pledged as collateral by the Fund as reported on the Consolidated Statements of Investments may exceed these amounts.
The following table presents the valuations of derivative instruments by risk exposure as reported within the Consolidated Statement of Assets and Liabilities at period end:
| | | | | | | | | | | | |
| | | Asset Derivatives | | | Liability Derivatives | |
Derivatives Not Accounted for as Hedging Instruments | | Consolidated Statement of Assets and Liabilities Location | | Value | | | Consolidated Statement of Assets and Liabilities Location | | Value | |
Credit contracts | | Swaps, at value | | $ | 15,466 | | | Swaps, at value | | $ | 360,411 | |
Equity contracts | | Swaps, at value | | | 2,077,250 | | | Swaps, at value | | | 512,972 | |
Volatility contracts | | Swaps, at value | | | 19,382 | | | Swaps, at value | | | 73,115 | |
Credit contracts | | Centrally cleared swaps, at value | | | 520,990 | | | Centrally cleared swaps, at value | | | 1,991,821 | |
Interest rate contracts | | Centrally cleared swaps, at value | | | 691,517 | | | Centrally cleared swaps, at value | | | 286,207 | |
Commodity contracts | | Variation margin receivable | | | 16,763 | * | | Variation margin payable | | | 91,742 | * |
Equity contracts | | Variation margin receivable | | | 109,024 | * | | Variation margin payable | | | 169,012 | * |
Interest rate contracts | | Variation margin receivable | | | 27,282 | * | | Variation margin payable | | | 111,919 | * |
| | Unrealized appreciation on | | | | | | Unrealized depreciation on | | | | |
Forward currency | | forward currency exchange | | | | | | forward currency exchange | | | | |
exchange contracts | | contracts | | | 4,565,950 | | | contracts | | | 1,280,866 | |
Forward currency exchange contracts | | | | | | | | Options written, at value | | | 2,031,592 | |
Equity contracts | | Investments, at value | | | 3,640 | ** | | | | | | |
Forward currency exchange contracts | | Investments, at value | | | 2,031,992 | ** | | | | | | |
Interest rate contracts | | Investments, at value | | | 360,248 | ** | | | | | | |
43 OPPENHEIMER GLOBAL MULTI-ALTERNATIVES FUND/VA
| | |
NOTES TO CONSOLIDATED FINANCIAL STATEMENTS Continued |
6. Use of Derivatives (Continued)
| | | | | | | | | | | | |
| | | Asset Derivatives | | | Liability Derivatives | |
Derivatives Not Accounted for as Hedging Instruments | | Consolidated Statement of Assets and Liabilities Location | | Value | | | Consolidated Statement of Assets
and Liabilities
Location | | Value | |
Total | | | | $ | 10,439,504 | | | | | $ | 6,909,657 | |
| | | | | | | | | | | | |
*Includes only the current day’s variation margin. Prior variation margin movements have been reflected in cash on the Consolidated Statement of Assets and Liabilities upon receipt or payment.
**Amounts relate to purchased option contracts and purchased swaption contracts, if any.
The effect of derivative instruments on the Consolidated Statement of Operations is as follows:
| | | | | | | | | | | | | | | | | | | | | | | | |
Amount of Realized Gain or (Loss) Recognized on Derivatives | |
| Derivatives Not Accounted for as Hedging Instruments | | Investment
from
unaffiliated
companies
(including
premiums on
options
exercised)* | | | Closing and
expiration of
option contracts
written | | | Closing
and
expiration
of futures contracts | | | Foreign
currency
transactions | | | Swap contracts | | | Total | |
Commodity contracts | | $ | — | | | $ | — | | | $ | 612,819 | | | $ | — | | | $ | — | | | $ | 612,819 | |
Credit contracts | | | — | | | | — | | | | — | | | | — | | | | (2,069,356) | | | | (2,069,356) | |
Equity contracts | | | (782,951) | | | | — | | | | (9,336,056) | | | | — | | | | 4,729,506 | | | | (5,389,501) | |
| Forward currency exchange contracts | | | (551,815) | | | | 6,379,729 | | | | — | | | | (4,536,524) | | | | — | | | | 1,291,390 | |
Interest rate contracts | | | (407,472) | | | | — | | | | 243,838 | | | | — | | | | 378,122 | | | | 214,488 | |
Volatility contracts | | | — | | | | — | | | | 565,778 | | | | — | | | | (431,910) | | | | 133,868 | |
| | | | |
Total | | $ | (1,742,238) | | | $ | 6,379,729 | | | $ | (7,913,621) | | | $ | (4,536,524) | | | $ | 2,606,362 | | | $ | (5,206,292) | |
| | | | |
*Includes purchased option contracts, purchased swaption contracts, written option contracts exercised and written swaption contracts exercised, if any.
| | | | | | | | | | | | | | | | | | | | | | | | |
| Amount of Change in Unrealized Gain or (Loss) Recognized on Derivatives | |
| |
Derivatives Not Accounted for as Hedging Instruments | | Investments* | | | Option contracts
written | | | Futures contracts | | | Translation
of assets and
liabilities
denominated
in foreign
currencies | | | Swap contracts | | | Total | |
Commodity contracts | | $ | — | | | $ | — | | | $ | 116,314 | | | $ | — | | | $ | — | | | $ | 116,314 | |
Credit contracts | | | — | | | | — | | | | — | | | | — | | | | 520,531 | | | | 520,531 | |
Equity contracts | | | 190,109 | | | | 51,594 | | | | 932,537 | | | | — | | | | 3,058,424 | | | | 4,232,664 | |
| Forward currency exchange contracts | | | 493,965 | | | | (237,337) | | | | — | | | | (863,245) | | | | — | | | | (606,617) | |
Interest rate contracts | | | 167,174 | | | | — | | | | 93,927 | | | | — | | | | 295,360 | | | | 556,461 | |
Volatility contracts | | | — | | | | — | | | | 152,019 | | | | — | | | | 129,133 | | | | 281,152 | |
| | | | |
Total | | $ | 851,248 | | | $ | (185,743) | | | $ | 1,294,797 | | | $ | (863,245) | | | $ | 4,003,448 | | | $ | 5,100,505 | |
| | | | |
*Includes purchased option contracts and purchased swaption contracts, if any.
7. Shares of Beneficial Interest
The Fund has authorized an unlimited number of $0.001 par value shares of beneficial interest of each class. Transactions in shares of beneficial interest were as follows:
| | | | | | | | | | | | | | | | | | | | |
| | | Year Ended December 31, 2016 | | Year Ended December 31, 2015 |
| | | Shares | | Amount | | Shares | | Amount |
Non-Service Shares | | | | | | | | | | | | | | | | | | | | |
Sold | | | | 133,545 | | | | $ | 1,338,377 | | | | | 15,762,717 | | | | $ | 159,728,797 | |
Dividends and/or distributions reinvested | | | | 560,049 | | | | | 5,544,486 | | | | | 143,442 | | | | | 1,382,778 | |
Redeemed | | | | (2,232,493) | | | | | (22,255,753) | | | | | — | | | | | — | |
Net increase (decrease) | | | | (1,538,899) | | | | $ | (15,372,890) | | | | | 15,906,159 | | | | $ | 161,111,575 | |
| | | | | | | | | | | | | | | | | | | | |
44 OPPENHEIMER GLOBAL MULTI-ALTERNATIVES FUND/VA
7. Shares of Beneficial Interest (Continued)
| | | | | | | | | | | | | | | | |
| | | Year Ended December 31, 2016 | | | Year Ended December 31, 2015 | |
| | | Shares | | | Amount | | | Shares | | | Amount | |
| |
Service Shares | | | | | | | | | | | | | | | | |
Sold | | | 103,428 | | | $ | 1,019,688 | | | | 145,309 | | | $ | 1,456,569 | |
Dividends and/or distributions reinvested | | | 2,972 | | | | 29,364 | | | | 203 | | | | 1,954 | |
Redeemed | | | (39,783 | ) | | | (391,520 | ) | | | (87,055 | ) | | | (871,516 | ) |
| | | | |
Net increase | | | 66,617 | | | $ | 657,532 | | | | 58,457 | | | $ | 587,007 | |
| | | | |
8. Purchases and Sales of Securities
The aggregate cost of purchases and proceeds from sales of securities, other than short-term obligations and investments in IGMMF, for the reporting period were as follows:
| | | | | | | | | | | | |
| | | Purchases | | | | | | Sales | |
Investment securities | | $ | 202,793,882 | | | | | | | $ | 230,803,831 | |
9. Fees and Other Transactions with Affiliates
Management Fees. Under the investment advisory agreement, the Fund pays the Manager a management fee based on the daily net assets of the Fund at an annual rate as shown in the following table:
| | |
| Fee Schedule | | |
Up to $500 million | | 1.00% |
Next $500 million | | 0.95 |
Next $4 billion | | 0.90 |
Over $5 billion | | 0.88 |
The Manager also provides investment management related services to the Subsidiary. The Subsidiary pays the Manager a monthly management fee at an annual rate according to the above schedule. The Subsidiary also pays certain other expenses including custody and directors’ fees.
The Fund’s effective management fee for the reporting period was 1.00% of average annual net assets before any Subsidiary management fees or any applicable waivers.
Sub-Adviser Fees. The Manager has retained the Sub-Adviser to provide the day-to-day portfolio management of the Fund and the Subsidiary. Under the Sub-Advisory Agreement, the Manager pays the Sub-Adviser an annual fee in monthly installments, equal to a percentage of the investment management fee collected by the Manager from the Fund and the Subsidiary, which shall be calculated after any investment management fee waivers. The fee paid to the Sub-Adviser is paid by the Manager, not by the Fund.
Sub-Sub-Adviser Fees. The Sub-Adviser retains the Sub-Sub-Adviser to provide the day-today portfolio management of the Fund. Under the Sub-Sub-Advisory Agreement, the Sub-Adviser pays the Sub-Sub-Adviser an annual fee in monthly installments, based on the average daily net assets of the Fund. The fee paid to the Sub-Sub-Adviser under the Sub-Sub-Advisory agreement is paid by the Sub-Adviser, not by the Fund.
Transfer Agent Fees. OFI Global (the “Transfer Agent”) serves as the transfer and shareholder servicing agent for the Fund. The Fund pays the Transfer Agent a fee based on annual net assets. Fees incurred and average net assets for each class with respect to these services are detailed in the Consolidated Statement of Operations and Consolidated Financial Highlights, respectively.
Sub-Transfer Agent Fees. The Transfer Agent has retained Shareholder Services, Inc., a wholly-owned subsidiary of OFI (the “Sub-Transfer Agent”), to provide the day-to-day transfer agent and shareholder servicing of the Fund. Under the Sub-Transfer Agency Agreement, the Transfer Agent pays the Sub-Transfer Agent an annual fee in monthly installments, equal to a percentage of the transfer agent fee collected by the Transfer Agent from the Fund, which shall be calculated after any applicable fee waivers. The fee paid to the Sub-Transfer Agent is paid by the Transfer Agent, not by the Fund.
Trustees’ Compensation. The Fund’s Board of Trustees (“Board”) has adopted a compensation deferral plan for Independent Trustees that enables Trustees to elect to defer receipt of all or a portion of the annual compensation they are entitled to receive from the Fund. For purposes of determining the amount owed to the Trustees under the plan, deferred amounts are treated as though equal dollar amounts had been invested in shares of the Fund or in other Oppenheimer funds selected by the Trustees. The Fund purchases shares of the funds selected for deferral by the Trustees in amounts equal to his or her deemed investment, resulting in a Fund asset equal to the deferred compensation liability. Such assets are included as a component of “Other” within the asset section of the Consolidated Statement of Assets and Liabilities. Deferral of Trustees’ fees under the plan will not affect the net assets of the Fund and will not materially affect the Fund’s assets, liabilities or net investment income per share. Amounts will be deferred until distributed in accordance with the compensation deferral plan.
Distribution and Service Plan for Service Shares. The Fund has adopted a Distribution and Service Plan (the “Plan”) pursuant to Rule 12b-1 under the 1940 Act for Service shares to pay OppenheimerFunds Distributor, Inc. (the “Distributor”), for distribution related services, personal service and account maintenance for the Fund’s Service shares. Under the Plan, payments are made periodically at an annual rate of 0.25% of the daily net assets of
45 OPPENHEIMER GLOBAL MULTI-ALTERNATIVES FUND/VA
| | |
NOTES TO CONSOLIDATED FINANCIAL STATEMENTS Continued |
9. Fees and Other Transactions with Affiliates (Continued)
Service shares of the Fund. The Distributor currently uses all of those fees to compensate sponsors of the insurance product that offers Fund shares, for providing personal service and maintenance of accounts of their variable contract owners that hold Service shares. These fees are paid out of the Fund’s assets on an on-going basis and increase operating expenses of the Service shares, which results in lower performance compared to the Fund’s shares that are not subject to a service fee. Fees incurred by the Fund under the Plan are detailed in the Consolidated Statement of Operations.
Waivers and Reimbursements of Expenses. The Manager has contractually agreed to waive fees and/or reimburse expenses to limit the Fund’s “Expenses after payments, waivers and/or reimbursements and reduction to custodian expenses” (excluding any applicable dividends tied to short sales expense, taxes, interest and fees from borrowing, any subsidiary expenses, Acquired Fund Fees and Expenses, brokerage commissions, unusual and infrequent expenses and certain other Fund expenses) so that, as percentages of average daily net assets, those expenses will not exceed the annual rate of 1.20% for Non-Service shares and 1.45% for Service shares. During the reporting period, the Manager waived fees and/or reimbursed the Fund $5,013 and $66 for Non-Service and Service shares, respectively.
The Manager has contractually agreed to waive the management fee it receives from the Fund in an amount equal to the management fee it receives from the Subsidiary. During the reporting period, the Manager waived $114,747.
The Manager will waive fees and/or reimburse Fund expenses in an amount equal to the indirect management fees incurred through the Fund’s investment in IGMMF. During the reporting period, the Manager waived fees and/or reimbursed the Fund $33,403 for IGMMF management fees.
Waivers and/or reimbursements may be modified or terminated as set forth according to the terms in the prospectus.
10. Borrowings and Other Financing
Securities Sold Short. The Fund sells securities that it does not own, and it will therefore be obligated to purchase such securities at a future date. Upon entering into a short position, the Fund is required to segregate cash or securities at its custodian which are pledged for the benefit of the lending broker and/or to deposit and pledge cash directly at the lending broker, with a value equal to a certain percentage, exceeding 100%, of the value of the securities that it sold short. Cash that has been segregated and pledged for this purpose will be disclosed on the Consolidated Statement of Assets and Liabilities; securities that have been segregated and pledged for this purpose are disclosed as such in the Consolidated Statement of Investments. The aggregate market value of such cash and securities at period end is $53,878,429. The value of the open short position is recorded as a liability, and the Fund records an unrealized gain or loss to the extent of the difference between the proceeds received and the change in value of the open short position. The Fund records a realized gain or loss when the short position is closed out. By entering into short sales, the Fund bears the market risk of increases in value of the security sold short in excess of the proceeds received. Until the security is replaced, the Fund is required to pay the lender any dividend or interest earned. Dividend expense on short sales is treated as an expense in the Consolidated Statement of Operations.
Joint Credit Facility. A number of mutual funds managed by the Manager participate in a $1.3 billion revolving credit facility (the “Facility”) intended to provide short-term financing, if necessary, subject to certain restrictions in connection with atypical redemption activity. Expenses and fees related to the Facility are paid by the participating funds and are disclosed separately or as other expenses on the Consolidated Statement of Operations. The Fund did not utilize the Facility during the reporting period.
11. Prior Period Reclassification
An adjustment to reflect a prior period reclassification between net investment income and net change in unrealized appreciation (depreciation) on investments and/or net realized gain (loss) on investments during the years ending December 31, 2014 and 2015 has been made to properly reflect income distributions received by the Fund from two of its investments.
The following adjustments are reflected in the respective fiscal years per the Consolidated Statements of Changes in Net Assets and the Consolidated Financial Highlights:
| | | | | | | | |
| | | 2014 | | | 2015 | |
Net investment income (loss) | | | $3,699 | | | | $696,112 | |
Net realized gain (loss) | | | 360 | | | | 3,812 | |
Net change in unrealized appreciation/depreciation | | | (4,059) | | | | (699,924) | |
The cumulative impact of these adjustments are also reflected in the respective component of net assets on the Consolidated Statement of Assets and liabilities and had no impact on total net assets or net asset values per share of the Fund.
12. Pending Litigation
In 2009, several putative class action lawsuits were filed and later consolidated before the U.S. District Court for the District of Colorado in connection with the investment performance of Oppenheimer Rochester California Municipal Fund (the “California Fund”), a fund advised by OppenheimerFunds, Inc. (“OFI”) and distributed by OppenheimerFunds Distributor, Inc. (“OFDI”). The plaintiffs asserted claims against OFI, OFDI and certain present and former trustees and officers of the California Fund under the federal securities laws, alleging, among other things, that the disclosure documents of the California Fund contained misrepresentations and omissions and the investment policies of the California Fund were not followed. An amended complaint and a motion to dismiss were filed, and in 2011, the court issued an order which granted in part and denied in part the defendants’ motion
46 OPPENHEIMER GLOBAL MULTI-ALTERNATIVES FUND/VA
12. Pending Litigation (Continued)
to dismiss. In October 2015, following a successful appeal by defendants and a subsequent hearing, the court granted plaintiffs’ motion for class certification and appointed class representatives and class counsel.
OFI and OFDI believe the suit is without merit; that it is premature to render any opinion as to the likelihood of an outcome unfavorable to them in the suit; and that no estimate can yet be made as to the amount or range of any potential loss. Furthermore, OFI believes that the suit should not impair the ability of OFI or OFDI to perform their respective duties to the Fund and that the outcome of the suit should not have any material effect on the operations of any of the Oppenheimer funds.
47 OPPENHEIMER GLOBAL MULTI-ALTERNATIVES FUND/VA
REPORT OF INDEPENDENT REGISTERED PUBLIC ACCOUNTING FIRM
The Board of Trustees and Shareholders of Oppenheimer Variable Account Funds:
We have audited the accompanying consolidated statement of assets and liabilities of Oppenheimer Global Multi-Alternatives Fund/VA (a separate series of Oppenheimer Variable Account Funds) and subsidiary, including the consolidated statement of investments, as of December 31, 2016, and the related consolidated statement of operations for the year then ended, the consolidated statements of changes in net assets for each of the years in the two-year period then ended, and the consolidated financial highlights for each of the years or periods in the four-year period then ended. These consolidated financial statements and consolidated financial highlights are the responsibility of the Fund’s management. Our responsibility is to express an opinion on these consolidated financial statements and consolidated financial highlights based on our audits.
We conducted our audits in accordance with the standards of the Public Company Accounting Oversight Board (United States). Those standards require that we plan and perform the audit to obtain reasonable assurance about whether the financial statements and financial highlights are free of material misstatement. An audit includes examining, on a test basis, evidence supporting the amounts and disclosures in the financial statements. Our procedures included confirmation of securities owned as of December 31, 2016, by correspondence with the custodian, transfer agent and brokers, or by other appropriate auditing procedures where replies from brokers were not received. An audit also includes assessing the accounting principles used and significant estimates made by management, as well as evaluating the overall financial statement presentation. We believe that our audits provide a reasonable basis for our opinion.
In our opinion, the consolidated financial statements and consolidated financial highlights referred to above present fairly, in all material respects, the financial position of Oppenheimer Global Multi-Alternatives Fund/VA and subsidiary as of December 31, 2016, the results of their operations for the year then ended, the changes in their net assets for each of the years in the two-year period then ended, and the consolidated financial highlights for each of the years or periods in the four-year period then ended, in conformity with U.S. generally accepted accounting principles.
KPMG LLP
Denver, Colorado
February 24, 2017
48 OPPENHEIMER GLOBAL MULTI-ALTERNATIVES FUND/VA
FEDERAL INCOME TAX INFORMATION Unaudited
In early 2017, if applicable, shareholders of record received information regarding all dividends and distributions paid to them by the Fund during calendar year 2016.
Dividends, if any, paid by the Fund during the reporting period which are not designated as capital gain distributions should be multiplied by the maximum amount allowable but not less than 18.18% to arrive at the amount eligible for the corporate dividend-received deduction.
The foregoing information is presented to assist shareholders in reporting distributions received from the Fund to the Internal Revenue Service. Because of the complexity of the federal regulations which may affect your individual tax return and the many variations in state and local tax regulations, we recommend that you consult your tax advisor for specific guidance.
49 OPPENHEIMER GLOBAL MULTI-ALTERNATIVES FUND/VA
BOARD APPROVAL OF THE FUND’S INVESTMENT ADVISORY, SUB-ADVISORY AND SUB-SUB ADVISORY AGREEMENTS Unaudited
The Fund has entered into an investment advisory agreement with OFI Global Asset Management, Inc. (“OFI Global” or the “Adviser”), a wholly-owned subsidiary of OppenheimerFunds, Inc. (“OFI” or the “Sub-Adviser”). OFI Global has entered into a sub-advisory agreement with OFI whereby OFI provides investment sub-advisory services to the Fund, and OFI has entered into sub-sub-advisory agreements with Cornerstone Real Estate Advisers LLC1 (“Cornerstone”) and OFI SteelPath, Inc. (“OFI SteelPath”) whereby OFI SteelPath and Cornerstone provide investment sub-sub-advisory services to the Fund (collectively, all the investment advisory agreements are referred to as the “Agreements”, “OFI Global” and “OFI” are referred to as the “Managers” and “OFI SteelPath” and “Cornerstone” are referred to as the “Sub-Sub Advisers”). Each year, the Board of Trustees (the “Board”), including a majority of the independent Trustees, is required to determine whether to approve the terms of the Agreements and the renewal thereof. The Investment Company Act of 1940, as amended, requires that the Board request and evaluate, and that the Managers and Sub-Sub Advisers provide, such information as may be reasonably necessary to evaluate the terms of the Agreements. The Board employs an independent consultant to prepare a report that provides information, including comparative information that the Board requests for that purpose. In addition to in-person meetings focused on this evaluation, the Board receives information throughout the year regarding Fund services, fees, expenses and performance.
The Managers and Sub-Sub Advisers and the independent consultant provided information to the Board on the following factors: (i) the nature, quality and extent of the Managers’ and Sub-Sub Advisers’ services, (ii) the comparative investment performance of the Fund and the Managers and Sub-Sub Advisers, (iii) the fees and expenses of the Fund, including comparative fee and expense information, (iv) the profitability of the Managers, Sub-Sub Advisers and their affiliates, including an analysis of the cost of providing services, (v) whether economies of scale are realized as the Fund grows and whether fee levels reflect these economies of scale for Fund investors and (vi) other benefits to the Managers and Sub-Sub Advisers from their relationship with the Fund. The Board was aware that there are alternatives to retaining the Managers and Sub-Sub Advisers.
Outlined below is a summary of the principal information considered by the Board as well as the Board’s conclusions.
Nature, Quality and Extent of Services. The Board considered information about the nature, quality and extent of the services provided to the Fund and information regarding the Managers’ and the Sub-Sub Advisers’ key personnel who provide such services. The Sub-Sub Advisers duties include providing the Fund with the services of the portfolio managers and the Sub-Sub-Advisers’ investment team, who provide research, analysis and other advisory services in regard to the Fund’s investments; and securities trading services. OFI Global is responsible for oversight of other third-party service providers; monitoring compliance with applicable Fund policies and procedures and adherence to the Fund’s investment restrictions; and risk management. OFI Global is also responsible for providing certain administrative services to the Fund. Those services include providing and supervising all administrative and clerical personnel who are necessary in order to provide effective corporate administration for the Fund; compiling and maintaining records with respect to the Fund’s operations; preparing and filing reports required by the U.S. Securities and Exchange Commission; preparing periodic reports regarding the operations of the Fund for its shareholders; preparing proxy materials for shareholder meetings; and preparing the registration statements required by federal and state securities laws for the sale of the Fund’s shares. OFI Global also provides the Fund with office space, facilities and equipment.
The Board also considered the quality of the services provided and the quality of the Managers’ and Sub-Sub Advisers’ resources that are available to the Fund. The Board took account of the fact that the Sub-Adviser has over fifty years of experience as an investment adviser and that its assets under management rank it among the top mutual fund managers in the United States. The Board evaluated the Managers’ advisory, administrative, accounting, legal, compliance and risk management services, and information the Board has received regarding the experience and professional qualifications of the Managers’ key personnel and the size and functions of its staff. In its evaluation of the quality of the portfolio management services provided, the Board considered the experience of Mark Hamilton, Benjamin Rockmuller, Dokyoung Lee and Alessio de Longis, the portfolio managers for the Fund, and the Sub-Sub-Advisers’ investment team and analysts. The Board members also considered the totality of their experiences with the Managers and Sub-Sub Advisers as directors or trustees of the Fund and other funds advised by the Managers and Sub-Sub Advisers. The Board considered information regarding the quality of services provided by affiliates of the Managers, which the Board members have become knowledgeable about through their experiences with the Managers and in connection with the renewal of the Fund’s service agreements. The Board concluded, in light of the Managers’ and Sub-Sub Advisers’ experience, reputation, personnel, operations and resources that the Fund benefits from the services provided under the Agreements.
Investment Performance of the Managers and the Fund. Throughout the year, the Managers provided information on the investment performance of the Fund, the Adviser, the Sub-Adviser and the Sub-Sub-Advisers, including comparative performance information. The Board also reviewed information, prepared by the Managers and by the independent consultant, comparing the Fund’s historical performance to relevant market indices and to the performance of other multialternative funds underlying variable insurance products. The Board considered that the Fund underperformed its performance category median for the one-year period. The Board also considered that the Fund was launched on November 14, 2013 and therefore, has a relatively short performance record. The Board also noted the Adviser’s assertion that the Fund’s performance has improved in 2016, and that the Fund has outperformed its category for the year-to-date and one-year periods ended June 30, 2016.
Fees and Expenses of the Fund. The Board reviewed the fees paid to the Adviser and the other expenses borne by the Fund. The Board noted that the Adviser, not the Fund, pays the Sub-Adviser’s fee under the sub-advisory agreement and the Sub-Adviser pays the Sub-Sub-Advisers’ fees under the sub-sub-advisory agreements. The independent consultant provided comparative data in regard to the fees and expenses of the Fund and other multialternative funds underlying variable insurance products. In reviewing the fees and expenses charged to the Fund, the Board considered the Adviser’s assertion that, because there is much greater disparity in the fees and services that may be provided by a manager to a VA fund as opposed to a retail fund, when comparing the expenses of the Fund to those of retail funds, it is most appropriate to focus on total expenses (rather than on the management fees). Accordingly, while the Board reviewed and considered all expenses, it focused on total expenses. The Board considered that the Fund’s total expenses, net of waivers, were 3 basis points higher than its category median and equal to its peer group median. The Board also considered
1. Subsequent to the renewal of the sub-sub-advisory agreement, Cornerstone changed its name to Barings Real Estate Advisers LLC and then to Barings LLC.
50 OPPENHEIMER GLOBAL MULTI-ALTERNATIVES FUND/VA
BOARD APPROVAL OF THE FUND’S INVESTMENT ADVISORY, SUB-ADVISORY AND SUB-SUB ADVISORY AGREEMENTS Unaudited / Continued
that the Fund’s contractual management fee was lower than its peer group median and category median. The Board further considered that the Adviser has contractually agreed to limit the Fund’s total annual operating expenses so that those expenses, as percentages of daily net assets, will not exceed the annual rate of 1.20% for Non-Service Shares and 1.45% for Service Shares. This waiver and/or reimbursement may not be amended or withdrawn for one year from the date of the Fund’s prospectus, unless approved by the Board.
Economies of Scale and Profits Realized by the Managers. The Board considered information regarding the Managers’ costs in serving as the Fund’s investment adviser, sub-adviser and sub-sub-advisers, including the costs associated with the personnel and systems necessary to manage the Fund, and information regarding the Managers’ profitability from their relationship with the Fund. The Board also considered that the Managers must be able to pay and retain experienced professional personnel at competitive rates to provide quality services to the Fund. The Board reviewed whether the Managers may realize economies of scale in managing and supporting the Fund. The Board noted that the Fund has management fee breakpoints, which are intended to share with Fund shareholders economies of scale that may exist as the Fund’s assets grow.
Other Benefits to the Managers and Sub-Sub Advisers. In addition to considering the profits realized by the Managers and Sub-Sub Advisers, the Board considered information that was provided regarding the direct and indirect benefits the Managers and Sub-Sub Advisers receive as a result of their relationship with the Fund, including compensation paid to the Managers’ affiliates and research provided to the Adviser in connection with permissible brokerage arrangements (soft dollar arrangements).
Conclusions. These factors were also considered by the independent Trustees meeting separately from the full Board, assisted by experienced counsel to the Fund and to the independent Trustees. Fund counsel and the independent Trustees’ counsel are independent of the Managers and Sub-Sub Advisers within the meaning and intent of the Securities and Exchange Commission Rules.
Based on its review of the information it received and its evaluations described above, the Board, including a majority of the independent Trustees, decided to continue the Agreements through August 31, 2017. In arriving at its decision, the Board did not identify any factor or factors as being more important than others, but considered all of the above information, and considered the terms and conditions of the Agreements, including the management fees, in light of all the surrounding circumstances.
51 OPPENHEIMER GLOBAL MULTI-ALTERNATIVES FUND/VA
PORTFOLIO PROXY VOTING POLICIES AND GUIDELINES; UPDATES TO STATEMENTS OF
INVESTMENTS Unaudited
The Fund has adopted Portfolio Proxy Voting Policies and Guidelines under which the Fund votes proxies relating to securities (“portfolio proxies”) held by the Fund. A description of the Fund’s Portfolio Proxy Voting Policies and Guidelines is available (i) without charge, upon request, by calling the Fund toll-free at 1.800.CALL OPP (225.5677), (ii) on the Fund’s website at www.oppenheimerfunds.com, and (iii) on the SEC’s website at www.sec.gov. In addition, the Fund is required to file Form N-PX, with its complete proxy voting record for the 12 months ended June 30th, no later than August 31st of each year. The Fund’s voting record is available (i) without charge, upon request, by calling the Fund toll-free at 1.800.CALL OPP (225.5677), and (ii) in the Form N-PX filing on the SEC’s website at www.sec.gov.
The Fund files its complete schedule of portfolio holdings with the SEC for the first quarter and the third quarter of each fiscal year on Form N-Q. The Fund’s Form N-Q filings are available on the SEC’s website at www.sec.gov. Those forms may be reviewed and copied at the SEC’s Public Reference Room in Washington, D.C. Information on the operation of the Public Reference Room may be obtained by calling 1-800-SEC-0330.
52 OPPENHEIMER GLOBAL MULTI-ALTERNATIVES FUND/VA
DISTRIBUTION SOURCES Unaudited
For any distribution that took place over the last six months of Fund’s reporting period, the table below details on a per-share basis the percentage of the Fund’s total distribution payment amount that was derived from the following sources: net income, net profit from the sale of securities, and other capital sources. This information is based upon income and capital gains using generally accepted accounting principles as of the date of each distribution. For certain securities, such as Real Estate Investment Trusts (“REITs”) and Master Limited Partnerships (“MLPs”), the percentages attributed to each category are estimated using historical information because the character of the amounts received from the REITs and MLPs in which the Fund invests is unknown until after the end of the calendar year. Because the Fund is actively managed, the relative amount of the Fund’s total distributions derived from various sources over the calendar year may change. Please note that this information should not be used for tax reporting purposes as the tax character of distributable income may differ from the amounts used for this notification. You will receive IRS tax forms in the first quarter of each calendar year detailing the actual amount of the taxable and non-taxable portion of distributions paid to you during the tax year.
For the most current information, please go to oppenheimerfunds.com. Select your Fund, then the ‘Detailed’ tab; where ‘Dividends’ are shown, the Fund’s latest pay date will be followed by the sources of any distribution, updated daily.
| | | | | | | | | | | | | | | | |
Fund Name | |
| Pay
Date |
| | | Net Income | | |
| Net Profit
from Sale |
| |
| Other
Capital
Sources |
|
Oppenheimer Global Multi-Alternatives Fund/VA | | | 12/22/16 | | | | 37.0% | | | | 0.0% | | | | 63.0% | |
53 OPPENHEIMER GLOBAL MULTI-ALTERNATIVES FUND/VA
TRUSTEES AND OFFICERS Unaudited
| | |
Name, Position(s) Held with the Fund, Length of
Service, Age | | Principal Occupation(s) During the Past 5 Years; Other Trusteeships/Directorships Held;
Number of Portfolios in the Fund Complex Currently Overseen |
| |
| INDEPENDENT TRUSTEES | | The address of each Trustee in the chart below is 6803 S. Tucson Way, Centennial, Colorado 80112-3924. Each Trustee serves for an indefinite term, or until his or her resignation, retirement, death or removal. |
| |
Robert J. Malone, Chairman of the Board of Trustees (since 2016), Trustee (since 2002) Year of Birth: 1944 | | Chairman - Colorado Market of MidFirst Bank (since January 2015); Chairman of the Board (2012-2016) and Director (August 2005-March 2016) of Jones International University (educational organization); Trustee of the Gallagher Family Foundation (non-profit organization) (2000-2015); Chairman, Chief Executive Officer and Director of Steele Street Bank Trust (commercial banking) (August 2003-January 2015); Board of Directors of Opera Colorado Foundation (non-profit organization) (2008- 2012); Director of Colorado UpLIFT (charitable organization) (1986-2010); Director of Jones Knowledge, Inc. (2006-2010); Former Chairman of U.S. Bank-Colorado (subsidiary of U.S. Bancorp and formerly Colorado National Bank) (July 1996-April 1999); Director of Commercial Assets, Inc. (real estate investment trust) (1993-2000); Director of U.S. Exploration, Inc. (oil and gas exploration) (1997-February 2004); Chairman of the Board (1991-1994) and Trustee (1985-1994) of Regis University; and Chairman of the Board (1990-1991) and Trustee (1984-1999) of Young Presidents Organization. Oversees 47 portfolios in the OppenheimerFunds complex. Mr. Malone has served on the Boards of certain Oppenheimer funds since 2002, during which time he has become familiar with the Fund’s (and other Oppenheimer funds’) financial, accounting, regulatory and investment matters and has contributed to the Boards’ deliberations. |
| |
Jon S. Fossel, Trustee (since 1990) Year of Birth: 1942 | | Chairman of the Board of Jack Creek Preserve Foundation (non-profit organization) (since March 2005); Director of Jack Creek Preserve Foundation (non-profit organization) (March 2005-December 2014); Chairman of the Board (2006-December 2011) and Director (June 2002-December 2011) of UNUMProvident (insurance company); Director of Northwestern Energy Corp. (public utility corporation) (November 2004-December 2009); Director of P.R. Pharmaceuticals (October 1999-October 2003); Director of Rocky Mountain Elk Foundation (non-profit organization) (February 1998-February 2003 and February 2005-February 2007); Chairman and Director (until October 1996) and President and Chief Executive Officer (until October 1995) of OppenheimerFunds, Inc.; President, Chief Executive Officer and Director of the following: Oppenheimer Acquisition Corp. (“OAC”) (parent holding company of OppenheimerFunds, Inc.), Shareholders Services, Inc. and Shareholder Financial Services, Inc. (until October 1995). Oversees 47 portfolios in the OppenheimerFunds complex. Mr. Fossel has served on the Boards of certain Oppenheimer funds since 1990, during which time he has become familiar with the Fund’s (and other Oppenheimer funds’) financial, accounting, regulatory and investment matters and has contributed to the Boards’ deliberations. |
| |
Richard F. Grabish, Trustee (since 2012) Year of Birth: 1948 | | Formerly Senior Vice President and Assistant Director of Sales and Marketing (March 1997-December 2007), Director (March 1987-December 2007) and Manager of Private Client Services (June 1985-June 2005) of A.G. Edwards & Sons, Inc. (broker/dealer and investment firm); Chairman and Chief Executive Officer of A.G. Edwards Trust Company, FSB (March 2001-December 2007); President and Vice Chairman of A.G. Edwards Trust Company, FSB (investment adviser) (April 1987-March 2001); President of A.G. Edwards Trust Company, FSB (investment adviser) (June 2005-December 2007). Oversees 47 portfolios in the OppenheimerFunds complex. Mr. Grabish has served on the Boards of certain Oppenheimer funds since 2001, during which time he has become familiar with the Fund’s (and other Oppenheimer funds’) financial, accounting, regulatory and investment matters and has contributed to the Boards’ deliberations. |
| |
Beverly L. Hamilton, Trustee (since 2002) Year of Birth: 1946 | | Trustee of Monterey Institute for International Studies (educational organization) (2000-2014); Board Member of Middlebury College (educational organization) (December 2005-June 2011); Chairman (2010-2016) of American Funds’ Emerging Markets Growth Fund, Inc. (mutual fund); Director of The California Endowment (philanthropic organization) (April 2002-April 2008); Director (February 2002-2005) and Chairman of Trustees (2006-2007) of the Community Hospital of Monterey Peninsula; Director (October 1991-2005) and Vice Chairman (2006-2009) of American Funds’ Emerging Markets Growth Fund, Inc. (mutual fund); President of ARCO Investment Management Company (February 1991-April 2000); Member of the investment committees of The Rockefeller Foundation (2001-2006) and The University of Michigan (since 2000); Advisor at Credit Suisse First Boston’s Sprout venture capital unit (venture capital fund) (1994-January 2005); Trustee of MassMutual Institutional Funds (investment company) (1996-June 2004); Trustee of MML Series Investment Fund (investment company) (April 1989-June 2004); Member of the investment committee of Hartford Hospital (2000-2003); and Advisor to Unilever (Holland) pension fund (2000-2003). Oversees 47 portfolios in the OppenheimerFunds complex. Ms. Hamilton has served on the Boards of certain Oppenheimer funds since 2002, during which time she has become familiar with the Fund’s (and other Oppenheimer funds’) financial, accounting, regulatory and investment matters and has contributed to the Boards’ deliberations. |
| |
Victoria J. Herget, Trustee (since 2012) Year of Birth:1951 | | Board Chair (2008-2015) and Director (2004-Present), United Educators (insurance company); Trustee (since 2000) and Chair (since 2010), Newberry Library (independent research library); Trustee, Mather LifeWays (senior living organization) (since 2001); Independent Director of the First American Funds (mutual fund family) (2003-2011); former Managing Director (1993-2001), Principal (1985-1993), Vice President (1978-1985) and Assistant Vice President (1973-1978) of Zurich Scudder Investments (investment adviser) (and its predecessor firms); Trustee (1992-2007), Chair of the Board of Trustees (1999-2007), Investment Committee Chair (1994-1999) and Investment Committee member (2007-2010) of Wellesley College; Trustee, BoardSource (non-profit organization) (2006-2009) and Chicago City Day School (K-8 School) (1994-2005). Oversees 47 portfolios in the OppenheimerFunds complex. Ms. Herget has served on the Boards of certain Oppenheimer funds since 2012, during which time she has become familiar with the Fund’s (and other Oppenheimer funds’) financial, accounting, regulatory and investment matters and has contributed to the Boards’ deliberations. |
54 OPPENHEIMER GLOBAL MULTI-ALTERNATIVES FUND/VA
| | |
| |
F. William Marshall, Jr., Trustee (since 2000) Year of Birth: 1942 | | Trustee Emeritus of Worcester Polytech Institute (WPI) (private university) (since 2009); Trustee of MassMutual Select Funds (formerly MassMutual Institutional Funds) (investment company) (1996-2015), MML Series Investment Fund (investment company) (1996-2015) and Mass Mutual Premier Funds (investment company) (January 2012-December 2015); President and Treasurer of the SIS Fund (private charitable fund) (January 1999-March 2011); Former Trustee of WPI (1985-2008); Former Chairman of the Board (2004-2006) and Former Chairman of the Investment Committee of WPI (1994-2008); Chairman of SIS Family Bank, F.S.B. (formerly SIS Bank) (commercial bank) (January 1999-July 1999); Executive Vice President of Peoples Heritage Financial Group, Inc. (commercial bank) (January 1999-July 1999); and Former President and Chief Executive Officer of SIS Bancorp. (1993-1999). Oversees 47 portfolios in the OppenheimerFunds complex. Mr. Marshall has served on the Boards of certain Oppenheimer funds since 2000, during which time he has become familiar with the Fund’s (and other Oppenheimer funds’) financial, accounting, regulatory and investment matters and has contributed to the Boards’ deliberations. |
| |
Karen L. Stuckey, Trustee (since 2012) Year of Birth: 1953 | | Member (since May 2015) of Desert Mountain Community Foundation Advisory Board (non-profit organization); Partner (1990-2012) of PricewaterhouseCoopers LLP (professional services firm) (held various positions 1975-1990); Trustee (1992- 2006), member of Executive, Nominating and Audit Committees and Chair of Finance Committee (1992-2006), and Emeritus Trustee (since 2006) of Lehigh University; and member, Women’s Investment Management Forum (professional organization) since inception. Oversees 47 portfolios in the OppenheimerFunds complex. Ms. Stuckey has served on the Boards of certain Oppenheimer funds since 2012, during which time she has become familiar with the Fund’s (and other Oppenheimer funds’) financial, accounting, regulatory and investment matters and has contributed to the Boards’ deliberations. |
| |
James D. Vaughn, Trustee (since 2012) Year of Birth:1945 | | Retired; former managing partner (1994-2001) of Denver office of Deloitte & Touche LLP, (held various positions 1969- 1993); Trustee and Chairman of the Audit Committee of Schroder Funds (2003-2012); Board member and Chairman of Audit Committee of AMG National Trust Bank (since 2005); Trustee and Investment Committee member, University of South Dakota Foundation (since 1996); Board member, Audit Committee Member and past Board Chair, Junior Achievement (since 1993); former Board member, Mile High United Way, Boys and Girls Clubs, Boy Scouts, Colorado Business Committee for the Arts, Economic Club of Colorado and Metro Denver Network. Oversees 47 portfolios in the OppenheimerFunds complex. Mr. Vaughn has served on the Boards of certain Oppenheimer funds since 2012, during which time he has become familiar with the Fund’s (and other Oppenheimer funds’) financial, accounting, regulatory and investment matters and has contributed to the Boards’ deliberations. |
| INTERESTED TRUSTEE AND OFFICER | | Mr. Steinmetz is an “Interested Trustee” because he is affiliated with the Manager and the Sub-Adviser by virtue of his positions as Chairman and director of the Sub-Adviser and officer and director of the Manager. Both as a Trustee and as an officer, Mr. Steinmetz serves for an indefinite term, or until his resignation, retirement, death or removal. Mr. Steinmetz’s address is 225 Liberty Street, New York, New York 10281-1008. |
| |
Arthur P. Steinmetz, Trustee (Since 2015), President and Principal Executive Officer (since 2014) Year of Birth: 1958 | | Chairman of OppenheimerFunds, Inc. (since January 2015); CEO and Chairman of OFI Global Asset Management, Inc. (since July 2014), President of OFI Global Asset Management, Inc. (since May 2013), a Director of OFI Global Asset Management, Inc. (since January 2013), Director of OppenheimerFunds, Inc. (since July 2014), President, Management Director and CEO of Oppenheimer Acquisition Corp. (OppenheimerFunds, Inc.‘s parent holding company) (since July 2014), and President and Director of OFI SteelPath, Inc. (since January 2013). Chief Investment Officer of the OppenheimerFunds advisory entities from (January 2013-December 2013); Executive Vice President of OFI Global Asset Management, Inc. (January 2013-May 2013); Chief Investment Officer of OppenheimerFunds, Inc. (October 2010-December 2012); Chief Investment Officer, Fixed- Income, of OppenheimerFunds, Inc. (April 2009-October 2010); Executive Vice President of OppenheimerFunds, Inc. (October 2009-December 2012); Director of Fixed Income of OppenheimerFunds, Inc. (January 2009-April 2009); and a Senior Vice President of OppenheimerFunds, Inc. (March 1993-September 2009). An officer of 103 portfolios in the OppenheimerFunds complex. |
| OTHER OFFICERS OF THE FUND | | The addresses of the Officers in the chart below are as follows: for Messrs. Hamilton, Lee, Rockmuller, de Longis, Mss. Lo Bessette, Foxson and Picciotto, 225 Liberty Street, New York, New York 10281-1008, for Mr. Petersen, 6803 S. Tucson Way, Centennial, Colorado 80112-3924. Each Officer serves for an indefinite term or until his or her resignation, retirement, death or removal. |
| |
Mark Hamilton, Vice President (since 2013) Year of Birth: 1965 | | Chief Investment Officer, Asset Allocation of the Sub-Adviser (since April 2013) and a Senior Vice President of the Sub-Adviser (since April 2013). Mr. Hamilton served at AllianceBernstein L.P. (from 1994-2013), as an Investment Director of Dynamic Asset Allocation (from 2010-2013), Head of North American Blend Team (from 2009-2010), and Senior Portfolio Manager of Blend Strategies (from 2006-2010). A portfolio manager and officer of other portfolios in the OppenheimerFunds complex. |
| |
Dokyoung Lee, Vice President (since 2014) Year of Birth: 1965 | | Director of Research, Global Multi-Asset Group (since October 2013) and a Senior Vice President of the Sub-Adviser (since October 2013). Mr. Lee served at Alliance Bernstein L.P. (1994-2013): Director of Research for Strategic Asset Allocation (2011-2013), Director of Research for Blend Strategies (2008-2011), Head of Asia Pacific Blend Strategies (2005-2008), Head of Quantitative Research and Senior Portfolio Manager for Japan Value Equities (2001-2005), Portfolio Manager for Emerging Markets Value Equities (1997-2001), and Quantitative Analyst for US Value Equities (1994-1997). A portfolio manager and officer of other portfolios in the OppenheimerFunds complex. |
| |
Benjamin H. Rockmuller, Vice President (since 2014) Year of Birth: 1979 | | Vice President of the Sub-Adviser (since September 2010); Assistant Vice President of the Sub-Adviser (January 2010-August 2010); Portfolio Manager of the Sub-Adviser (since July 2010); Senior Analyst of the Sub-Adviser for the Global Debt Team (January 2010-July 2010); Intermediate Analyst of the Sub-Adviser for the Global Debt Team (January 2007-January 2010); Junior Analyst of the Sub-Adviser for the Global Debt Team (April 2004-January 2007) and Junior Analyst of the Sub-Adviser for the High Yield Team (June 2003-April 2004). A portfolio manager and an officer in the OppenheimerFunds complex. |
| |
Alessio de Longis, Vice President (since 2016) Year of Birth: 1978 | | Vice President of the Sub-Adviser (since June 2010); Assistant Vice President of the Sub-Adviser (May 2009-June 2010); Senior Research Analyst of the Sub-Adviser (January 2008-June 2010); Intermediate Research Analyst of the Sub-Adviser (January 2006-January 2008); Junior Analyst of the Sub-Adviser (February 2004-January 2006). A portfolio manager and an officer in the OppenheimerFunds complex. |
55 OPPENHEIMER GLOBAL MULTI-ALTERNATIVES FUND/VA
TRUSTEES AND OFFICERS Unaudited / Continued
| | |
| |
Cynthia Lo Bessette, Secretary and Chief Legal Officer (since 2016) Year of Birth: 1969 | | Executive Vice President, General Counsel and Secretary of the Manager (since February 2016); Chief Legal Officer of the Sub-Adviser and the Distributor (since February 2016); Vice President, General Counsel and Secretary of Oppenheimer Acquisition Corp. (since February 2016); General Counsel of OFI SteelPath, Inc., VTL Associates, LLC and Index Management Solutions, LLC (since February 2016); Chief Legal Officer of OFI Global Institutional, Inc., HarbourView Asset Management Corporation, OFI Global Trust Company, Oppenheimer Real Asset Management, Inc., OFI Private Investments Inc., Shareholder Services, Inc. and Trinity Investment Management Corporation (since February 2016); Senior Vice President and Deputy General Counsel (March 2015-February 2016) and Executive Vice President, Vice President, Corporate Counsel (February 2012-March 2015) and Deputy Chief Legal Officer (April 2013-March 2015) of Jennison Associates LLC; Assistant General Counsel (April 2008-September 2009) and Deputy General Counsel (October 2009-February 2012) of Lord Abbett & Co. LLC. An officer of 103 portfolios in the OppenheimerFunds complex. |
| |
Jennifer Foxson, Vice President and Chief Business Officer (since 2014) Year of Birth: 1969 | | Senior Vice President of OppenheimerFunds Distributor, Inc. (since June 2014); Vice President of OppenheimerFunds Distributor, Inc. (April 2006-June 2014); Vice President of the Sub-Adviser (January 1998-March 2006); Assistant Vice President of the Sub-Adviser (October 1991-December 1998). An officer of 103 portfolios in the OppenheimerFunds complex. |
| |
Mary Ann Picciotto, Chief Compliance Officer and Chief Anti-Money Laundering Officer (since 2014) Year of Birth: 1973 | | Senior Vice President and Chief Compliance Officer of the Manager (since March 2014); Chief Compliance Officer of the Sub- Adviser, OFI SteelPath, Inc., OFI Global Trust Company, OFI Global Institutional, Inc., Oppenheimer Real Asset Management, Inc., OFI Private Investments, Inc., Harborview Asset Management Corporation, Trinity Investment Management Corporation, and Shareholder Services, Inc. (since March 2014); Managing Director of Morgan Stanley Investment Management Inc. and certain of its various affiliated entities; Chief Compliance Officer of various Morgan Stanley Funds (May 2010-January 2014); Chief Compliance Officer of Morgan Stanley Investment Management Inc. (April 2007-January 2014). An officer of 103 portfolios in the OppenheimerFunds complex. |
| |
Brian S. Petersen, Treasurer and Principal Financial & Accounting Officer (since 2016) Year of Birth: 1970 | | Vice President of the Manager (since January 2013); Vice President of the Sub-Adviser (February 2007-December 2012); Assistant Vice President of the Sub-Adviser (August 2002-2007). An officer of 103 portfolios in the OppenheimerFunds complex. |
The Fund’s Statement of Additional Information contains additional information about the Fund’s Trustees and Officers and is available without charge, upon request, by calling 1.800.988.8287.
56 OPPENHEIMER GLOBAL MULTI-ALTERNATIVES FUND/VA
THIS PAGE INTENTIONALLY LEFT BLANK.
57 OPPENHEIMER GLOBAL MULTI-ALTERNATIVES FUND/VA
THIS PAGE INTENTIONALLY LEFT BLANK.
58 OPPENHEIMER GLOBAL MULTI-ALTERNATIVES FUND/VA
THIS PAGE INTENTIONALLY LEFT BLANK.
59 OPPENHEIMER GLOBAL MULTI-ALTERNATIVES FUND/VA
OPPENHEIMER GLOBAL MULTI-ALTERNATIVES FUND/VA
A Series of Oppenheimer Variable Account Funds
| | |
| Manager | | OFI Global Asset Management, Inc. |
| |
Sub-Adviser | | OppenheimerFunds, Inc. |
| |
Distributor | | OppenheimerFunds Distributor, Inc. |
| |
| Transfer and Shareholder Servicing Agent | | OFI Global Asset Management, Inc. |
| |
Sub-Transfer Agent | | Shareholder Services, Inc.
DBA OppenheimerFunds Services |
| |
Independent Registered
Public
Accounting
Firm | | KPMG LLP |
| |
Legal Counsel | | Ropes & Gray LLP |
| |
| | Before investing in any of the Oppenheimer funds, investors should carefully consider a fund’s investment objectives, risks, charges and expenses. Fund prospectuses and summary prospectuses contain this and other information about the funds, and may be obtained by asking your financial advisor, or calling us at 1.800.988.8287. Read prospectuses and summary prospectuses carefully before investing. |
| |
| | © 2017 OppenheimerFunds, Inc. All rights reserved. Oppenheimer funds are distributed by OppenheimerFunds Distributor, Inc. |

| | | | |
| | 
| | |
| | |
| | | December 31, 2016 | | |
| | | Oppenheimer | | |
| | International Growth Fund/VA | | Annual Report |
| | A Series of Oppenheimer Variable Account Funds | | |
| | | |
| | ANNUAL REPORT | | |
| | |
| | Listing of Top Holdings | | |
| | |
| | Fund Performance Discussion | | |
| | |
| | Financial Statements | | |
PORTFOLIO MANAGERS: George R. Evans, CFA, and Robert B. Dunphy, CFA
AVERAGE ANNUAL TOTAL RETURNS FOR THE PERIODS ENDED 12/31/16
| | | | | | | | | | | | | | | | |
| | | Inception
Date | | | 1-Year | | | 5-Year | | | 10-Year | |
Non-Service Shares | | | 5/13/92 | | | | -2.12% | | | | 7.64% | | | | 3.31 | % |
Service Shares | | | 3/19/01 | | | | -2.72 | | | | 7.33 | | | | 3.04 | |
MSCI AC World ex-U.S. Index | | | | | | | 4.50 | | | | 5.00 | | | | 0.96 | |
Performance data quoted represents past performance, which does not guarantee future results. The investment return and principal value of an investment in the Fund will fluctuate so that an investor’s shares, when redeemed, may be worth more or less than their original cost. Current performance and expense ratios may be lower or higher than the data quoted. For performance data current to the most recent month end, call us at 1.800.988.8287. The Fund’s total returns should not be expected to be the same as the returns of other funds, whether or not both funds have the same portfolio managers and/or similar names. The Fund’s total returns include changes in share price and reinvested distributions but do not include the charges associated with the separate account products that offer this Fund. Such performance would have been lower if such charges were taken into account.
TOP HOLDINGS AND ALLOCATIONS
TOP TEN COMMON STOCK HOLDINGS
| | |
Infineon Technologies AG | | 2.1% |
Dollarama, Inc. | | 2.0 |
Nippon Telegraph & Telephone Corp. | | 1.7 |
Valeo SA | | 1.7 |
Continental AG | | 1.5 |
Temenos Group AG | | 1.5 |
Carnival Corp. | | 1.5 |
SAP SE | | 1.5 |
Nidec Corp. | | 1.4 |
SEB SA | | 1.4 |
Portfolio holdings and allocations are subject to change. Percentages are as of December 31, 2016, and are based on net assets. For more current Fund holdings, please visit oppenheimerfunds.com.
REGIONAL ALLOCATION
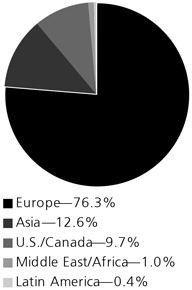
Portfolio holdings and allocations are subject to change. Percentages are as of December 31, 2016, and are based on the total market value of investments.
2 OPPENHEIMER INTERNATIONAL GROWTH FUND/VA
Fund Performance Discussion
In a volatile market environment, the Fund’s Non-Service shares generated a total return of -2.12% over the one-year reporting period ended December 31, 2016, underperforming the MSCI AC World ex-U.S. Index (the “Index”), which returned 4.50% during the same period.
On a sector basis, the Fund’s underperformance versus the Index stemmed primarily from underweight positions in materials and energy, and stock selection in consumer discretionary and information technology. The Fund outperformed in the consumer staples sector due to stock selection and in utilities, where our lack of exposure benefited as the sector declined.
Currency was also a factor. Slightly over 20% of our portfolio was invested in UK-domiciled companies at period end, significantly more than the roughly 13% it comprises of the Index, so the British pound’s decline was an immediate drag on relative performance. However, most of our UK-domiciled companies are global businesses with revenues from around the world. Translating those revenues into cheaper pounds should flatter their earnings over time. Moreover, as very long-term investors, we find it impractical to engage in currency hedging. We leave that to the management of our companies themselves, as they are better placed to do it, should they deem it necessary.
MARKET OVERVIEW
2016 opened up with market volatility, due largely to China’s slowing economy, falling crude oil prices, and the aggressive interest rate hike path indicated by the Federal Reserve (the “Fed”) in its December 2015 communication. Equity markets bottomed in February, though interest rates continued to decline. In June, the British referendum to leave the European Union (Brexit) provided a temporary shock to equity markets. They then proceeded to rebound nearly as swiftly over the third quarter of 2016. Investors clearly focused on the fundamental earnings effects and determined that they were relatively minimal in the near term. The most lasting Brexit effect was on the British currency, which fell sharply against the U.S. dollar through the reporting period’s end.
International equities experienced further declines over the fourth quarter of 2016. During this time, markets were largely driven by a turn in expectations. The catalyst was the outcome of the presidential election in the U.S. and a reassessment of electoral dynamics elsewhere. Stocks generally did well in local currency terms. However, the U.S. Dollar Index (DXY) also rose in the quarter, which meaningfully reduced those returns in U.S. dollars. Reflation, a cyclical theme if there ever was one, was the market theme of the fourth quarter.
TOP INDIVIDUAL CONTRIBUTORS
Top contributors to performance this period included CP All Public Co. Ltd., Saputo, Inc. and Dollarama, Inc.
CP All Public Co. Ltd. is the exclusive operator of over 9,200 7-Eleven stores in Thailand. During the period, the company announced its second quarter net profit was up over 30% year over year, handily beating the consensus expectation. CP All’s convenience store business was strong, with same store sales growth of 5% and year over year sales growth of 15%. Management also voiced it sees no slowdown threat to its store expansion plan and revised its target from 10,000 convenience stores by 2018 to 12,000 stores in the next three years. CP All opened 420 stores in the first half of the year, on track for its 700 new store target for this year.
Saputo is a Canadian dairy processor, and ranks among the world’s largest producers of mozzarella cheese, largely distributed in wholesale channels. The company posted solid fiscal year quarterly results during the reporting period despite a generally weak environment for global dairy prices. We continue to view Saputo as a long term consolidator in a highly fragmented world dairy market. It is well managed and has a strong financial profile.
Dollarama, Inc. is the largest dollar store chain in Canada with more than 1,000 locations, with plans to expand well beyond that over the next several years. The stock price rose more than 20% after the company announced fiscal fourth quarter sales rose 32% year over year, and same store sales rose 7.9% year over year. The company increased both its dividend and stock buyback program. Given the weakness of the Canadian economy we believe consumers will remain highly value conscious. Dollarama is well positioned for this.
3 OPPENHEIMER INTERNATIONAL GROWTH FUND/VA
TOP INDIVIDUAL DETRACTORS
Top detractors from performance included Essentra plc, Travis Perkins plc and Novo Nordisk A/S.
Essentra plc is an international supplier of specialty plastic packaging for health and personal care products, of fiber filters, and of customized protective components for use with industrial equipment. It also has a distribution business. Shares plunged in early June when the company issued a profit warning, and declined again at the end of July after announcing a profit decline for the first half of the year and departure of the CEO in early 2017. While it experienced declines this period, we are positive on the longer-term outlook for the company.
Travis Perkins, a UK-based company, is a leading company in the builders’ merchant and home improvement markets there and is the UK’s largest product supplier to the building and construction market. Shares of the company traded down significantly following the Brexit decision given its focus on the UK housing market and in sympathy with some of the home builders. The stock price saw a rebound towards the end of the summer, but slumped back near Brexit-lows as the company announced it would close 30 branches and issued a profit warning. Travis Perkins has historically executed very well operationally and we believe the Brexit-related share price hit was overdone.
Novo Nordisk A/S, a Danish company, is the world market leader in diabetes treatment. As the world becomes more affluent, particularly in emerging markets, the incidence of obesity and diabetes is rising, and therefore so is demand for Novo Nordisk’s products. Despite this long-term demand trend, there are some pricing pressures in some of the company’s key markets, particularly in the U.S. During the reporting period, the company lowered forward guidance for 2017 and the stock reacted unfavorably.
STRATEGY & OUTLOOK
It looks like there is at least the possibility that significant reforms to tax and regulatory policy may come out of the new Trump Administration early in the new term. The U.S. is by far the most important economy in the world, and if it can successfully introduce reforms which stimulate aggregate activity, the rest of the world may find it more palatable as well. Beyond that, one can observe that many of the world’s currencies have been falling versus the U.S. dollar. While it has caused some distress this year, it is likely to prove stimulative to the laboring economies of Europe and Japan. Alongside U.S. reforms, this might surprise skeptics with faster growth and higher inflation than we have seen in some time. Both would be welcome. All that said, it doesn’t really influence our positioning, which is of a structural nature, not a cyclical one. The rationale is that the returns from owning equities, particularly high-quality equities, will flow to owners with a view well beyond 2017, 2018, or even 2019. Part of our success has been to invest in superior business models at rational prices, taking advantage of short-term market participants.
Investors should consider the Fund’s investment objective, risks, charges and expenses carefully before investing. The Fund’s prospectus and summary prospectus contain this and other information about the Fund, and may be obtained by asking your financial advisor or calling us at 1.800.988.8287. Read prospectuses and summary prospectuses carefully before investing.
Total returns include changes in share price and reinvestment of dividends and capital gains distributions in a hypothetical investment for the periods shown, but do not include the charges associated with the separate account products that offer this Fund.
The Fund’s investment strategy and focus can change over time. The mention of specific Fund holdings does not constitute a recommendation by OppenheimerFunds, Inc. or its affiliates.
Shares of Oppenheimer funds are not deposits or obligations of any bank, are not guaranteed by any bank, are not insured by the FDIC or any other agency, and involve investment risks, including the possible loss of the principal amount invested.
Comparing the Fund’s Performance to the Market. The graphs that follow show the performance of a hypothetical $10,000 investment in each share class of the Fund held until December 31, 2016. Performance is measured over a ten-fiscal-year period for both Classes. Performance information does not reflect charges that apply to separate accounts investing in the Fund. If these charges were taken into account, performance would be lower. The graphs assume that all dividends and capital gains distributions were reinvested in additional shares.
The Fund’s performance is compared to the performance of the MSCI AC World ex-U.S. Index. The MSCI AC World ex-U.S. Index is designed to measure the equity market performance of developed and emerging markets and excludes the U.S. The Index is unmanaged and cannot be purchased directly by investors. While index comparisons may be useful to provide a benchmark for the Fund’s performance, it must be noted that the Fund’s investments are not limited to the
4 OPPENHEIMER INTERNATIONAL GROWTH FUND/VA
investments comprising the Index. Index performance includes reinvestment of income, but does not reflect transaction costs, fees, expenses or taxes. Index performance is shown for illustrative purposes only as a benchmark for the Fund’s performance, and does not predict or depict performance of the Fund. The Fund’s performance reflects the effects of the Fund’s business and operating expenses.
COMPARISON OF CHANGE IN VALUE OF $10,000 HYPOTHETICAL INVESTMENTS IN:
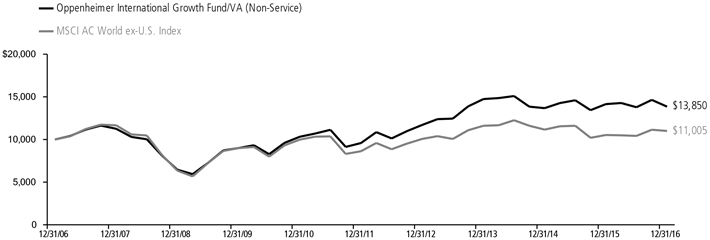
COMPARISON OF CHANGE IN VALUE OF $10,000 HYPOTHETICAL INVESTMENTS IN:
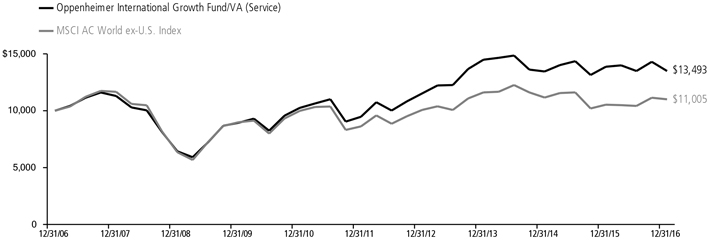
Performance data quoted represents past performance, which does not guarantee future results. The investment return and principal value of an investment in the Fund will fluctuate so that an investor’s shares, when redeemed, may be worth more or less than their original cost. Current performance may be lower or higher than the performance quoted. For performance data current to the most recent month end, call us at 1.800.988.8287. The Fund’s total returns should not be expected to be the same as the returns of other funds, whether or not both funds have the same portfolio managers and/or similar names. The Fund’s total returns include changes in share price and reinvested distributions but do not include the charges associated with the separate account products that offer this Fund. Such performance would have been lower if such charges were taken into account.
5 OPPENHEIMER INTERNATIONAL GROWTH FUND/VA
Fund Expenses
Fund Expenses. As a shareholder of the Fund, you incur two types of costs: (1) transaction costs and (2) ongoing costs, including management fees; distribution and service fees; and other Fund expenses. These examples are intended to help you understand your ongoing costs (in dollars) of investing in the Fund and to compare these costs with the ongoing costs of investing in other mutual funds.
The examples are based on an investment of $1,000.00 invested at the beginning of the period and held for the entire 6-month period ended December 31, 2016.
Actual Expenses. The first section of the table provides information about actual account values and actual expenses. You may use the information in this section for the class of shares you hold, together with the amount you invested, to estimate the expense that you paid over the period. Simply divide your account value by $1,000.00 (for example, an $8,600.00 account value divided by $1,000.00 = 8.60), then multiply the result by the number in the first section under the heading entitled “Expenses Paid During 6 Months Ended December 31, 2016” to estimate the expenses you paid on your account during this period.
Hypothetical Example for Comparison Purposes.
The second section of the table provides information about hypothetical account values and hypothetical expenses based on the Fund’s actual expense ratio for each class of shares, and an assumed rate of return of 5% per year for each class before expenses, which is not the actual return. The hypothetical account values and expenses may not be used to estimate the actual ending account balance or expenses you paid for the period. You may use this information to compare the ongoing costs of investing in the Fund and other funds. To do so, compare this 5% hypothetical example for the class of shares you hold with the 5% hypothetical examples that appear in the shareholder reports of the other funds.
Please note that the expenses shown in the table are meant to highlight your ongoing costs only and do not reflect any charges associated with the separate accounts that offer this Fund. Therefore, the “hypothetical” lines of the table are useful in comparing ongoing costs only, and will not help you determine the relative total costs of owning different funds. In addition, if these separate account charges were included your costs would have been higher.
| | | | | | | | | | | | | | | | |
| Actual | | Beginning Account Value July 1, 2016 | | | Ending Account Value December 31, 2016 | | | Expenses Paid During 6 Months Ended
December 31, 2016 | |
Non-Service shares | | | $ 1,000.00 | | | | $ 1,004.80 | | | | $ 5.05 | | | | | |
Service shares | | | 1,000.00 | | | | 1,000.00 | | | | 6.30 | | | | | |
| | | | |
| Hypothetical | | | | | | | | | | | | |
| (5% return before expenses) | | | | | | | | | | | | |
Non-Service shares | | | 1,000.00 | | | | 1,020.11 | | | | 5.09 | | | | | |
Service shares | | | 1,000.00 | | | | 1,018.85 | | | | 6.36 | | | | | |
Expenses are equal to the Fund’s annualized expense ratio for that class, multiplied by the average account value over the period, multiplied by 184/366 (to reflect the one-half year period). Those annualized expense ratios, excluding indirect expenses from affiliated funds, based on the 6-month period ended December 31, 2016 are as follows:
| | | | | | | | |
| Class | | Expense Ratios | | | | |
Non-Service shares | | | 1.00% | | | | | |
Service shares | | | 1.25 | | | | | |
The expense ratios reflect voluntary and/or contractual waivers and/or reimbursements of expenses by the Fund’s Manager. Some of these undertakings may be modified or terminated at any time, as indicated in the Fund’s prospectus. The “Financial Highlights” tables in the Fund’s financial statements, included in this report, also show the gross expense ratios, without such waivers or reimbursements and reduction to custodian expenses, if applicable.
6 OPPENHEIMER INTERNATIONAL GROWTH FUND/VA
STATEMENT OF INVESTMENTS December 31, 2016
| | | | | | |
| | | Shares | | | Value |
|
Common Stocks—97.6% | | | | | | |
|
| Consumer Discretionary—24.2% | | | |
|
| Auto Components—3.7% | | | |
|
| Continental AG | | | 37,404 | | | $ 7,281,223 |
|
| Koito Manufacturing Co. Ltd. | | | 41,500 | | | 2,191,410 |
|
| Valeo SA | | | 143,233 | | | 8,230,108 |
| | | | | | |
| | | | | | 17,702,741 |
|
|
| Automobiles—2.1% | | | |
|
| Bayerische Motoren Werke AG | | | 35,373 | | | 3,311,719 |
|
| Hero MotoCorp Ltd. | | | 150,020 | | | 6,702,469 |
| | | | | | |
| | | | | | 10,014,188 |
|
|
| Diversified Consumer Services—0.6% | | | |
|
| Dignity plc | | | 101,707 | | | 3,093,322 |
|
|
| Hotels, Restaurants & Leisure—4.0% | | | |
|
| Carnival Corp. | | | 136,250 | | | 7,093,175 |
|
| Domino’s Pizza Group plc | | | 1,054,134 | | | 4,672,671 |
|
| Whitbread plc | | | 74,839 | | | 3,478,844 |
|
| William Hill plc | | | 1,061,616 | | | 3,783,755 |
| | | | | | |
| | | | | | 19,028,445 |
|
|
| Household Durables—1.4% | | | |
|
| SEB SA | | | 49,630 | | | 6,724,983 |
|
|
| Media—3.6% | | | |
|
| Grupo Televisa SAB, Sponsored ADR | | | 82,680 | | | 1,727,185 |
|
| ProSiebenSat.1 Media SE | | | 110,964 | | | 4,289,623 |
|
| SES SA, Cl. A, FDR | | | 187,990 | | | 4,139,760 |
|
| Sky plc | | | 241,326 | | | 2,936,008 |
|
| Technicolor SA | | | 715,790 | | | 3,871,870 |
| | | | | | |
| | | | | | 16,964,446 |
|
|
| Multiline Retail—2.6% | | | |
|
| Dollarama, Inc. | | | 128,630 | | | 9,425,106 |
|
| Hudson’s Bay Co. | | | 309,963 | | | 3,045,032 |
| | | | | | |
| | | | | | 12,470,138 |
|
|
| Specialty Retail—0.9% | | | |
|
| Industria de Diseno Textil SA | | | 119,983 | | | 4,094,479 |
|
|
| Textiles, Apparel & Luxury Goods—5.3% | | | |
|
| Burberry Group plc | | | 255,080 | | | 4,701,809 |
|
| Cie Financiere Richemont SA | | | 63,945 | | | 4,233,914 |
|
| Hermes International | | | 12,576 | | | 5,157,464 |
|
| LVMH Moet Hennessy Louis Vuitton SE | | | 27,210 | | | 5,188,328 |
|
| Pandora AS | | | 46,647 | | | 6,092,661 |
| | | | | | |
| | | | | | 25,374,176 |
|
|
| Consumer Staples—12.7% | | | |
|
| Beverages—3.0% | | | |
|
| Anheuser-Busch InBev SA/NV | | | 33,018 | | | 3,486,931 |
|
| Diageo plc | | | 91,722 | | | 2,372,949 |
|
| Heineken NV | | | 74,040 | | | 5,545,834 |
|
| Pernod Ricard SA | | | 28,590 | | | 3,097,214 |
| | | | | | |
| | | | | | 14,502,928 |
|
|
| Food & Staples Retailing—3.1% | | | |
|
| Alimentation Couche-Tard, Inc., Cl. B | | | 105,825 | | | 4,798,440 |
|
| CP ALL PCL | | | 3,264,400 | | | 5,688,663 |
|
| Spar Group Ltd. (The) | | | 311,518 | | | 4,497,206 |
| | | | | | |
| | | | | | 14,984,309 |
|
|
| Food Products—4.9% | | | |
|
| Aryzta AG1 | | | 100,588 | | | 4,429,057 |
|
| Barry Callebaut AG1 | | | 3,839 | | | 4,698,324 |
|
| Danone SA | | | 48,486 | | | 3,068,937 |
|
| Saputo, Inc. | | | 189,567 | | | 6,707,875 |
|
| Unilever plc | | | 106,033 | | | 4,289,048 |
| | | | | | |
| | | | | | 23,193,241 |
|
|
| Household Products—1.1% | | | |
|
| Reckitt Benckiser Group plc | | | 59,110 | | | 4,996,823 |
| | | | | | | | |
| | | Shares | | | Value | |
| |
| Tobacco—0.6% | | | | | |
| |
| Swedish Match AB | | | 87,400 | | | $ | 2,776,743 | |
|
| |
| Energy—2.1% | | | | | |
| |
| Energy Equipment & Services—1.1% | | | | | |
| |
| Technip SA | | | 74,841 | | | | 5,310,898 | |
|
| |
| Oil, Gas & Consumable Fuels—1.0% | | | | | |
| |
| Koninklijke Vopak NV | | | 95,781 | | | | 4,518,417 | |
|
| |
| Financials—3.5% | | | | | |
| |
| Capital Markets—2.0% | | | | | |
| |
| NEX Group plc1 | | | 472,852 | | | | 2,706,840 | |
| |
| TP ICAP plc | | | 648,271 | | | | 3,458,077 | |
| |
| UBS Group AG | | | 197,340 | | | | 3,089,345 | |
| | | | | | | | |
| | | | | | | 9,254,262 | |
|
| |
| Commercial Banks—0.5% | | | | | |
| |
| ICICI Bank Ltd., Sponsored ADR | | | 337,955 | | | | 2,531,283 | |
|
| |
| Insurance—1.0% | | | | | |
| |
| Prudential plc | | | 240,231 | | | | 4,791,684 | |
|
| |
| Health Care—10.0% | | | | | |
| |
| Biotechnology—2.2% | | | | | |
| |
| CSL Ltd. | | | 72,000 | | | | 5,201,286 | |
| |
| Grifols SA | | | 256,841 | | | | 5,103,175 | |
| | | | | | | | |
| | | | | | | 10,304,461 | |
|
| |
| Health Care Equipment & Supplies—3.4% | | | | | |
| |
| Coloplast AS, Cl. B | | | 72,930 | | | | 4,907,625 | |
| |
| Essilor International SA | | | 37,613 | | | | 4,249,340 | |
| |
| Sonova Holding AG | | | 31,753 | | | | 3,841,820 | |
| |
| William Demant Holding AS1 | | | 188,136 | | | | 3,271,236 | |
| | | | | | | | |
| | | | | | | 16,270,021 | |
|
| |
| Health Care Providers & Services—0.7% | | | | | |
| |
| Sonic Healthcare Ltd. | | | 217,482 | | | | 3,356,361 | |
|
| |
| Life Sciences Tools & Services—1.0% | | | | | |
| |
| Lonza Group AG1 | | | 28,632 | | | | 4,950,003 | |
|
| |
| Pharmaceuticals—2.7% | | | | | |
| |
| Galenica AG | | | 3,466 | | | | 3,902,566 | |
| |
| Novo Nordisk AS, Cl. B | | | 111,502 | | | | 4,005,096 | |
| |
| Roche Holding AG | | | 22,730 | | | | 5,179,104 | |
| | | | | | | | |
| | | | | | | 13,086,766 | |
|
| |
| Industrials—20.8% | | | | | |
| |
| Aerospace & Defense—2.0% | | | | | |
| |
| Airbus Group SE | | | 93,210 | | | | 6,151,726 | |
| |
| Rolls-Royce Holdings plc1 | | | 398,126 | | | | 3,274,130 | |
| | | | | | | | |
| | | | | | | 9,425,856 | |
|
| |
| Air Freight & Couriers—0.8% | | | | | |
| |
| Royal Mail plc | | | 696,335 | | | | 3,962,008 | |
|
| |
| Commercial Services & Supplies—2.6% | | | | | |
| |
| Aggreko plc | | | 166,157 | | | | 1,877,248 | |
| |
| Edenred | | | 232,234 | | | | 4,602,348 | |
| |
| Prosegur Cia de Seguridad SA | | | 918,540 | | | | 5,733,640 | |
| | | | | | | | |
| | | | | | | 12,213,236 | |
|
| |
| Construction & Engineering—1.4% | | | | | |
| |
| Boskalis Westminster | | | 91,453 | | | | 3,171,321 | |
| |
| CIMIC Group Ltd. | | | 134,385 | | | | 3,378,539 | |
| | | | | | | | |
| | | | | | | 6,549,860 | |
|
| |
| Electrical Equipment—3.7% | | | | | |
| |
| ABB Ltd.1 | | | 98,939 | | | | 2,082,801 | |
| |
| Legrand SA | | | 75,980 | | | | 4,302,922 | |
| |
| Nidec Corp. | | | 80,200 | | | | 6,897,204 | |
| |
| Schneider Electric SE | | | 64,530 | | | | 4,484,037 | |
| | | | | | | | |
| | | | 17,766,964 | |
|
| |
| Machinery—3.2% | | | | | | | | |
| |
| Aalberts Industries NV | | | 188,680 | | | | 6,114,795 | |
| |
| Atlas Copco AB, Cl. A | | | 194,079 | | | | 5,899,516 | |
7 OPPENHEIMER INTERNATIONAL GROWTH FUND/VA
STATEMENT OF INVESTMENTS Continued
| | | | | | | | | | | | |
| | | Shares | | | Value | | | | |
| | | | | |
| Machinery (Continued) | | | | | | | | | |
| | | | | |
| Kubota Corp. | | | 91,900 | | | | $ 1,308,264 | | | | | |
| | | | | |
| Weir Group plc (The) | | | 84,777 | | | | 1,964,191 | | | | | |
| | | | | | | | | | | | |
| | | | | | | 15,286,766 | | | | | |
| |
| | | | | |
| Professional Services—2.6% | | | | | | | | | |
| | | | | |
| Experian plc | | | 261,155 | | | | 5,054,966 | | | | | |
| | | | | |
| Intertek Group plc | | | 102,140 | | | | 4,357,765 | | | | | |
| | | | | |
| SGS SA | | | 1,552 | | | | 3,151,764 | | | | | |
| | | | | | | | | | | | |
| | | | | | | 12,564,495 | | | | | |
| |
| | | | | |
| Trading Companies & Distributors—4.5% | | | | | | | | | |
| | | | | |
| Brenntag AG | | | 109,465 | | | | 6,065,888 | | | | | |
| | | | | |
| Bunzl plc | | | 223,293 | | | | 5,778,282 | | | | | |
| | | | | |
| Travis Perkins plc | | | 239,688 | | | | 4,284,092 | | | | | |
| | | | | |
| Wolseley plc | | | 89,337 | | | | 5,457,973 | | | | | |
| | | | | | | | | | | | |
| | | | | | | 21,586,235 | | | | | |
| |
| | | | | |
| Information Technology—13.7% | | | | | | | | | |
| | | | | |
| Communications Equipment—0.9% | | | | | | | | | |
| | | | | |
| Nokia OYJ | | | 911,537 | | | | 4,383,778 | | | | | |
| |
| | | | | |
| Electronic Equipment, Instruments, & Components—2.9% | | | | | |
| | | | | |
| Hoya Corp. | | | 103,993 | | | | 4,358,530 | | | | | |
| | | | | |
| Keyence Corp. | | | 9,506 | | | | 6,513,309 | | | | | |
| | | | | |
| Spectris plc | | | 95,964 | | | | 2,732,205 | | | | | |
| | | | | | | | | | | | |
| | | | | | | 13,604,044 | | | | | |
| |
| | | | | |
| Internet Software & Services—0.6% | | | | | | | | | |
| | | | | |
| United Internet AG | | | 78,140 | | | | 3,041,460 | | | | | |
| |
| | | | | |
| IT Services—1.3% | | | | | | | | | | | | |
| | | | | |
| Amadeus IT Group SA, Cl. A | | | 133,817 | | | | 6,079,208 | | | | | |
| |
| | | | | |
| Semiconductors & Semiconductor Equipment—3.2% | | | | | |
| | | | | |
| ASML Holding NV | | | 46,413 | | | | 5,200,281 | | | | | |
| | | | | |
| Infineon Technologies AG | | | 587,235 | | | | 10,177,863 | | | | | |
| | | | | | | | | | | | |
| | | | | | | 15,378,144 | | | | | |
| |
| | | | | |
| Software—4.8% | | | | | | | | | |
| | | | | |
| Dassault Systemes SE | | | 65,227 | | | | 4,969,038 | | | | | |
| | | | | |
| Gemalto NV | | | 65,184 | | | | 3,763,507 | | | | | |
| | | | | |
| SAP SE | | | 80,225 | | | | 7,011,272 | | | | | |
| | | | | |
| Temenos Group AG1 | | | 104,301 | | | | 7,263,338 | | | | | |
| | | | | | | | | | | | |
| | | | | | | 23,007,155 | | | | | |
| | | | | | |
| | | Shares | | | Value |
|
| Materials—4.8% | | | |
|
| Chemicals—2.3% | | | |
|
| Essentra plc | | | 451,670 | | | $ 2,557,995 |
|
| Novozymes AS, Cl. B | | | 113,401 | | | 3,902,870 |
|
| Sika AG | | | 949 | | | 4,558,530 |
|
| Syngenta AG1 | | | 479 | | | 189,749 |
| | | | | | |
| | | | | | 11,209,144 |
|
|
| Construction Materials—1.3% | | | |
|
| James Hardie Industries plc | | | 382,600 | | | 6,058,116 |
|
|
| Containers & Packaging—1.2% | | | |
|
| CCL Industries, Inc., Cl. B | | | 28,790 | | | 5,656,576 |
|
|
| Telecommunication Services—5.8% | | | |
|
| Diversified Telecommunication Services—4.7% |
|
| BT Group plc | | | 936,857 | | | 4,242,412 |
|
| Iliad SA | | | 21,310 | | | 4,093,266 |
|
| Inmarsat plc | | | 289,474 | | | 2,670,188 |
|
| Nippon Telegraph & Telephone Corp. | | | 196,300 | | | 8,251,626 |
|
| Telstra Corp. Ltd. | | | 906,697 | | | 3,332,319 |
| | | | | | |
| | | | | | 22,589,811 |
|
|
| Wireless Telecommunication Services—1.1% |
|
| Vodafone Group plc | | | 2,034,355 | | | 5,003,447 |
| | | | | | |
| Total Common Stocks (Cost $344,131,955) | | | 465,661,421 |
|
|
Preferred Stock—0.0% | | | |
|
| Zee Entertainment Enterprises Ltd., 6% Cum. Non-Cv. (Cost $12,272) | | | 599,541 | | | 86,481 |
| | |
| | | Units | | | |
|
Rights, Warrants and Certificates—0.0% |
|
| MEI Pharma, Inc. Wts., Strike Price $1.19, Exp. 5/10/171 (Cost $35,548) | | | 151,358 | | | — |
| | |
| | | Shares | | | |
|
Investment Company—2.0% |
|
| Oppenheimer Institutional Government Money Market Fund, Cl. E, 0.43%2,3 (Cost $9,483,349) | | | 9,483,349 | | | 9,483,349 |
|
Total Investments, at Value
(Cost $353,663,124) | | | 99.6% | | | 475,231,251 |
|
| Net Other Assets (Liabilities) | | | 0.4 | | | 1,961,210 |
| | | |
| Net Assets | | | 100.0% | | | $ 477,192,461 |
| | | |
Footnotes to Statement of Investments
1. Non-income producing security.
2. Rate shown is the 7-day yield at period end.
3. Is or was an affiliate, as defined in the Investment Company Act of 1940, as amended, at or during the reporting period, by virtue of the Fund owning at least 5% of the voting securities of the issuer or as a result of the Fund and the issuer having the same investment adviser. Transactions during the reporting period in which the issuer was an affiliate are as follows:
| | | | | | | | | | | | | | | | |
| | | Shares
December 31, 2015 | | | Gross
Additions | | | Gross
Reductions | | | Shares
December 31, 2016 | |
| |
| Oppenheimer Institutional Government Money Market Fund, Cl. Ea | | | 4,009,537 | | | | 82,902,643 | | | | 77,428,831 | | | | 9,483,349 | |
| | | | |
| | | | | | | | | Value | | | Income | |
| |
| Oppenheimer Institutional Government Money Market Fund, Cl. Ea | | | | | | | | | | $ | 9,483,349 | | | $ | 28,378 | |
| | a. | Prior to September 28, 2016, this fund was named Oppenheimer Institutional Money Market Fund. |
Distribution of investments representing geographic holdings, as a percentage of total investments at value, is as follows:
| | | | | | | | | | | | |
| Geographic Holdings (Unaudited) | | Value | | | Percent | | | | |
| |
| United Kingdom | | | $ 98,498,730 | | | | 20.7 | % | | | | |
| France | | | 77,642,238 | | | | 16.3 | | | | | |
| Switzerland | | | 51,570,315 | | | | 10.8 | | | | | |
| Germany | | | 41,179,050 | | | | 8.7 | | | | | |
| Canada | | | 29,633,030 | | | | 6.2 | | | | | |
| Japan | | | 29,520,343 | | | | 6.2 | | | | | |
| Netherlands | | | 28,314,155 | | | | 6.0 | | | | | |
| Denmark | | | 22,179,488 | | | | 4.7 | | | | | |
| Spain | | | 21,010,502 | | | | 4.4 | | | | | |
| United States | | | 16,576,524 | | | | 3.5 | | | | | |
8 OPPENHEIMER INTERNATIONAL GROWTH FUND/VA
| | | | | | | | | | | | |
| Geographic Holdings (Unaudited) (Continued) | | Value | | | Percent | | | | |
| |
| Australia | | | $ 15,268,506 | | | | 3.2 | % | | | | |
| India | | | 9,320,233 | | | | 2.0 | | | | | |
| Sweden | | | 8,676,259 | | | | 1.8 | | | | | |
| Ireland | | | 6,058,115 | | | | 1.3 | | | | | |
| Thailand | | | 5,688,663 | | | | 1.2 | | | | | |
| South Africa | | | 4,497,206 | | | | 1.0 | | | | | |
| Finland | | | 4,383,778 | | | | 0.9 | | | | | |
| Belgium | | | 3,486,931 | | | | 0.7 | | | | | |
| Mexico | | | 1,727,185 | | | | 0.4 | | | | | |
| | | | |
| Total | | | $ 475,231,251 | | | | 100.0 | % | | | | |
| | | | |
See accompanying Notes to Financial Statements.
9 OPPENHEIMER INTERNATIONAL GROWTH FUND/VA
STATEMENT OF ASSETS AND LIABILITIES December 31, 2016
| | |
|
Assets | | |
| Investments, at value—see accompanying statement of investments: | | |
| Unaffiliated companies (cost $344,179,775) | | $ 465,747,902 |
| Affiliated companies (cost $9,483,349) | | 9,483,349 |
| | |
| | 475,231,251 |
|
| Cash | | 506,497 |
|
| Cash—foreign currencies (cost $8) | | 8 |
|
| Receivables and other assets: | | |
| Dividends | | 1,672,781 |
| Shares of beneficial interest sold | | 363,793 |
| Investments sold | | 13,143 |
| Other | | 31,030 |
| | |
| Total assets | | 477,818,503 |
|
|
Liabilities | | |
| Payables and other liabilities: | | |
| Foreign capital gains tax | | 317,299 |
| Shares of beneficial interest redeemed | | 205,552 |
| Distribution and service plan fees | | 36,540 |
| Trustees’ compensation | | 23,578 |
| Legal, auditing and other professional fees | | 21,109 |
| Shareholder communications | | 6,488 |
| Other | | 15,476 |
| | |
| Total liabilities | | 626,042 |
|
|
Net Assets | | $ 477,192,461 |
| | |
|
|
Composition of Net Assets | | |
| Par value of shares of beneficial interest | | $ 226,555 |
|
| Additional paid-in capital | | 357,631,433 |
|
| Accumulated net investment income | | 4,952,410 |
|
| Accumulated net realized loss on investments and foreign currency transactions | | (6,768,770) |
|
| Net unrealized appreciation on investments and translation of assets and liabilities denominated in foreign currencies | | 121,150,833 |
| | |
| Net Assets | | $ 477,192,461 |
| | |
|
|
Net Asset Value Per Share | | |
| Non-Service Shares: | | |
| Net asset value, redemption price per share and offering price per share (based on net assets of $301,559,115 and 145,305,148 shares of beneficial interest outstanding) | | $2.08 |
|
| |
Service Shares: | | |
| Net asset value, redemption price per share and offering price per share (based on net assets of $175,633,346 and 81,249,431 shares of beneficial interest outstanding) | | $2.16 |
See accompanying Notes to Financial Statements.
10 OPPENHEIMER INTERNATIONAL GROWTH FUND/VA
STATEMENT OF OPERATIONS For the Year Ended December 31, 2016
| | |
|
Investment Income | | |
|
| Dividends: | | |
Unaffiliated companies (net of foreign withholding taxes of $957,855) | | $ 10,753,361 |
Affiliated companies | | 28,378 |
| | |
Total investment income | | 10,781,739 |
|
|
Expenses | | |
Management fees | | 4,574,327 |
|
Distribution and service plan fees - Service shares | | 437,066 |
|
| Transfer and shareholder servicing agent fees: | | |
Non-Service shares | | 305,525 |
Service shares | | 174,983 |
|
| Shareholder communications: | | |
Non-Service shares | | 18,337 |
Service shares | | 10,643 |
|
Custodian fees and expenses | | 48,542 |
|
Trustees’ compensation | | 22,073 |
|
Borrowing fees | | 8,581 |
|
Other | | 90,995 |
| | |
Total expenses | | 5,691,072 |
Less reduction to custodian expenses | | (229) |
Less waivers and reimbursements of expenses | | (439,820) |
| | |
Net expenses | | 5,251,023 |
|
Net Investment Income | | 5,530,716 |
|
|
Realized and Unrealized Gain (Loss) | | |
Net realized gain (loss) on: | | |
| Investment transactions in unaffiliated companies (net of foreign capital gains tax of $53,711) | | 84,274 |
Foreign currency transactions | | (105,589) |
| | |
Net realized loss | | (21,315) |
|
Net change in unrealized appreciation/depreciation on: | | |
Investment transactions (net of foreign capital gains tax of $247,663) | | (15,775,957) |
Translation of assets and liabilities denominated in foreign currencies | | (18,890) |
| | |
Net change in unrealized appreciation/depreciation | | (15,794,847) |
|
Net Decrease in Net Assets Resulting from Operations | | $ (10,285,446) |
| | |
See accompanying Notes to Financial Statements.
11 OPPENHEIMER INTERNATIONAL GROWTH FUND/VA
STATEMENTS OF CHANGES IN NET ASSETS
| | | | | | |
| | | Year Ended
December 31, 2016 | | | Year Ended
December 31, 2015 |
|
Operations | | | | | | |
Net investment income | | $ | 5,530,716 | | | $ 5,013,190 |
|
| Net realized gain (loss) | | | (21,315) | | | 12,349,329 |
|
| Net change in unrealized appreciation/depreciation | | | (15,794,847) | | | (2,159,966) |
| | | |
Net increase (decrease) in net assets resulting from operations | | | (10,285,446) | | | 15,202,553 |
|
|
Dividends and/or Distributions to Shareholders | | | | | | |
Dividends from net investment income: | | | | | | |
Non-Service shares | | | (3,398,644) | | | (4,005,137) |
Service shares | | | (1,459,515) | | | (1,505,303) |
| | | |
| | | (4,858,159) | | | (5,510,440) |
|
|
| Distributions from net realized gain: | | | | | | |
Non-Service shares | | | (7,229,895) | | | (24,445,588) |
Service shares | | | (4,021,530) | | | (11,368,323) |
| | | |
| | | (11,251,425) | | | (35,813,911) |
|
|
Beneficial Interest Transactions | | | | | | |
Net increase (decrease) in net assets resulting from beneficial interest transactions: | | | | | | |
Non-Service shares | | | 788,912 | | | (24,199,401) |
Service shares | | | 15,959,227 | | | 32,889,329 |
| | | |
| | | 16,748,139 | | | 8,689,928 |
|
|
Net Assets | | | | | | |
Total decrease | | | (9,646,891) | | | (17,431,870) |
|
Beginning of period | | | 486,839,352 | | | 504,271,222 |
| | | |
End of period (including accumulated net investment of $4,952,410 and $4,495,293, respectively) | | $ | 477,192,461 | | | $ 486,839,352 |
| | | |
See accompanying Notes to Financial Statements.
12 OPPENHEIMER INTERNATIONAL GROWTH FUND/VA
FINANCIAL HIGHLIGHTS
| | | | | | | | | | | | | | | | | | |
| Non-Service Shares | | Year Ended
December 31,
2016 | | | Year Ended
December 31,
2015 | | | Year Ended
December 31,
2014 | | | Year Ended
December 31,
2013 | | | Year Ended
December 31,
2012 |
|
Per Share Operating Data | | | | | | | | | | | | | | | | | | |
Net asset value, beginning of period | | | $2.20 | | | | $2.31 | | | | $2.57 | | | | $2.07 | | | $1.72 |
|
Income (loss) from investment operations: | | | | | | | | | | | | | | | | | | |
Net investment income1 | | | 0.03 | | | | 0.03 | | | | 0.03 | | | | 0.03 | | | 0.03 |
Net realized and unrealized gain (loss) | | | (0.08) | | | | 0.06 | | | | (0.21) | | | | 0.50 | | | 0.35 |
| | | |
Total from investment operations | | | (0.05) | | | | 0.09 | | | | (0.18) | | | | 0.53 | | | 0.38 |
|
Dividends and/or distributions to shareholders: | | | | | | | | | | | | | | | | | | |
Dividends from net investment income | | | (0.02) | | | | (0.03) | | | | (0.03) | | | | (0.03) | | | (0.03) |
Distributions from net realized gain | | | (0.05) | | | | (0.17) | | | | (0.05) | | | | 0.00 | | | 0.00 |
| | | |
Total dividends and/or distributions to shareholders | | | (0.07) | | | | (0.20) | | | | (0.08) | | | | (0.03) | | | (0.03) |
|
Net asset value, end of period | | | $2.08 | | | | $2.20 | | | | $2.31 | | | | $2.57 | | | $2.07 |
| | | |
| | | | | | | | | | | | | | | | | | |
|
Total Return, at Net Asset Value2 | | | (2.12)% | | | | 3.43% | | | | (7.22)% | | | | 25.87% | | | 22.22% |
| | | | | | | | | | | | | | | | | | | |
|
Ratios/Supplemental Data | | | | | | | | | | | | | | | | | | |
Net assets, end of period (in thousands) | | | $301,559 | | | | $317,547 | | | | $358,756 | | | | $458,038 | | | $348,449 |
|
Average net assets (in thousands) | | | $305,269 | | | | $343,347 | | | | $400,556 | | | | $404,859 | | | $332,018 |
|
Ratios to average net assets:3 | | | | | | | | | | | | | | | | | | |
Net investment income | | | 1.24% | | | | 1.08% | | | | 1.13% | | | | 1.24% | | | 1.68% |
Expenses excluding specific expenses listed below | | | 1.09% | | | | 1.08% | | | | 1.07% | | | | 1.09% | | | 1.13% |
Interest and fees from borrowings | | | 0.00%4 | | | | 0.00%4 | | | | 0.00% | | | | 0.00% | | | 0.00% |
| | | |
Total expenses5 | | | 1.09% | | | | 1.08% | | | | 1.07% | | | | 1.09% | | | 1.13% |
| Expenses after payments, waivers and/or reimbursements and reduction to custodian expenses | | | 1.00% | | | | 1.00% | | | | 1.00% | | | | 1.00% | | | 1.00% |
|
Portfolio turnover rate | | | 15% | | | | 24% | | | | 41% | | | | 32% | | | 22% |
1. Per share amounts calculated based on the average shares outstanding during the period.
2. Assumes an initial investment on the business day before the first day of the fiscal period, with all dividends and distributions reinvested in additional shares on the reinvestment date, and redemption at the net asset value calculated on the last business day of the fiscal period. Total returns are not annualized for periods less than one full year. Total return information does not reflect expenses that apply at the separate account level or to related insurance products. Inclusion of these charges would reduce the total return figures for all periods shown. Returns do not reflect the deduction of taxes that a shareholder would pay on fund distributions or the redemption of fund shares.
3. Annualized for periods less than one full year.
4. Less than 0.005%.
5. Total expenses including indirect expenses from affiliated fund fees and expenses were as follows:
| | | | |
Year Ended December 31, 2016 | | | 1.09 | % |
Year Ended December 31, 2015 | | | 1.08 | % |
Year Ended December 31, 2014 | | | 1.07 | % |
Year Ended December 31, 2013 | | | 1.09 | % |
Year Ended December 31, 2012 | | | 1.13 | % |
See accompanying Notes to Financial Statements.
13 OPPENHEIMER INTERNATIONAL GROWTH FUND/VA
FINANCIAL HIGHLIGHTS Continued
| | | | | | | | | | | | | | | | | | |
| Service Shares | | Year Ended
December 31,
2016 | | | Year Ended
December 31,
2015 | | | Year Ended
December 31,
2014 | | | Year Ended
December 31,
2013 | | | Year Ended
December 31,
2012 |
|
Per Share Operating Data | | | | | | | | | | | | | | | | | | |
Net asset value, beginning of period | | | $2.29 | | | | $2.40 | | | | $2.66 | | | | $2.14 | | | $1.78 |
|
Income (loss) from investment operations: | | | | | | | | | | | | | | | | | | |
Net investment income1 | | | 0.02 | | | | 0.02 | | | | 0.02 | | | | 0.02 | | | 0.03 |
Net realized and unrealized gain (loss) | | | (0.08) | | | | 0.06 | | | | (0.21) | | | | 0.53 | | | 0.35 |
| | | |
Total from investment operations | | | (0.06) | | | | 0.08 | | | | (0.19) | | | | 0.55 | | | 0.38 |
|
Dividends and/or distributions to shareholders: | | | | | | | | | | | | | | | | | | |
Dividends from net investment income | | | (0.02) | | | | (0.02) | | | | (0.02) | | | | (0.03) | | | (0.02) |
Distributions from net realized gain | | | (0.05) | | | | (0.17) | | | | (0.05) | | | | 0.00 | | | 0.00 |
| | | |
Total dividends and/or distributions to shareholders | | | (0.07) | | | | (0.19) | | | | (0.07) | | | | (0.03) | | | (0.02) |
|
Net asset value, end of period | | | $2.16 | | | | $2.29 | | | | $2.40 | | | | $2.66 | | | $2.14 |
| | | |
| | | | | | | | | | | | | | | | | | |
|
Total Return, at Net Asset Value2 | | | (2.72)% | | | | 3.11% | | | | (7.15)% | | | | 25.71% | | | 21.68% |
| | | | | | | | | | | | | | | | | | | |
|
Ratios/Supplemental Data | | | | | | | | | | | | | | | | | | |
Net assets, end of period (in thousands) | | | $175,633 | | | | $169,292 | | | | $145,515 | | | | $118,060 | | | $68,997 |
|
Average net assets (in thousands) | | | $174,834 | | | | $165,226 | | | | $128,694 | | | | $88,647 | | | $63,118 |
|
Ratios to average net assets:3 | | | | | | | | | | | | | | | | | | |
Net investment income | | | 0.99% | | | | 0.79% | | | | 0.85% | | | | 0.89% | | | 1.43% |
Expenses excluding specific expenses listed below | | | 1.34% | | | | 1.33% | | | | 1.32% | | | | 1.34% | | | 1.38% |
Interest and fees from borrowings | | | 0.00%4 | | | | 0.00%4 | | | | 0.00% | | | | 0.00% | | | 0.00% |
| | | |
Total expenses5 | | | 1.34% | | | | 1.33% | | | | 1.32% | | | | 1.34% | | | 1.38% |
| Expenses after payments, waivers and/or reimbursements and reduction to custodian expenses | | | 1.25% | | | | 1.25% | | | | 1.25% | | | | 1.25% | | | 1.25% |
|
Portfolio turnover rate | | | 15% | | | | 24% | | | | 41% | | | | 32% | | | 22% |
1. Per share amounts calculated based on the average shares outstanding during the period.
2. Assumes an initial investment on the business day before the first day of the fiscal period, with all dividends and distributions reinvested in additional shares on the reinvestment date, and redemption at the net asset value calculated on the last business day of the fiscal period. Total returns are not annualized for periods less than one full year. Total return information does not reflect expenses that apply at the separate account level or to related insurance products. Inclusion of these charges would reduce the total return figures for all periods shown. Returns do not reflect the deduction of taxes that a shareholder would pay on fund distributions or the redemption of fund shares.
3. Annualized for periods less than one full year.
4. Less than 0.005%.
5. Total expenses including indirect expenses from affiliated fund fees and expenses were as follows:
| | | | |
Year Ended December 31, 2016 | | | 1.34 | % |
Year Ended December 31, 2015 | | | 1.33 | % |
Year Ended December 31, 2014 | | | 1.32 | % |
Year Ended December 31, 2013 | | | 1.34 | % |
Year Ended December 31, 2012 | | | 1.38 | % |
See accompanying Notes to Financial Statements.
14 OPPENHEIMER INTERNATIONAL GROWTH FUND/VA
NOTES TO FINANCIAL STATEMENTS December 31, 2016
1. Organization
Oppenheimer International Growth Fund/VA (the “Fund”), is a separate series of Oppenheimer Variable Account Funds, which is registered under the Investment Company Act of 1940 (“1940 Act”), as amended, as a diversified open-end management investment company. The Fund’s investment objective is to seek capital appreciation. The Fund’s investment adviser is OFI Global Asset Management, Inc. (“OFI Global” or the “Manager”), a wholly-owned subsidiary of OppenheimerFunds, Inc. (“OFI” or the “Sub-Adviser”). The Manager has entered into a sub-advisory agreement with OFI. Shares of the Fund are sold only to separate accounts of life insurance companies.
The Fund offers two classes of shares. Both classes are sold at their offering price, which is the net asset value per share, to separate investment accounts of participating insurance companies as an underlying investment for variable life insurance policies, variable annuity contracts or other investment products. The class of shares designated as Service shares is subject to a distribution and service plan. Both classes of shares have identical rights and voting privileges with respect to the Fund in general and exclusive voting rights on matters that affect that class alone. Earnings, net assets and net asset value per share may differ due to each class having its own expenses, such as transfer and shareholder servicing agent fees and shareholder communications, directly attributable to that class.
The following is a summary of significant accounting policies followed in the Fund’s preparation of financial statements in accordance with accounting principles generally accepted in the United States (“U.S. GAAP”).
2. Significant Accounting Policies
Security Valuation. All investments in securities are recorded at their estimated fair value, as described in Note 3.
Foreign Currency Translation. The books and records of the Fund are maintained in U.S. dollars. Any foreign currency amounts are translated into U.S. dollars on the following basis:
(1) Market value of investment securities, other assets and liabilities — at the exchange rates prevailing at Market Close as described in Note 3.
(2) Purchases and sales of investment securities, income and expenses — at the rates of exchange prevailing on the respective dates of such transactions.
Although the net assets and the market values are presented at the foreign exchange rates at Market Close, the Fund does not isolate the portion of the results of operations resulting from changes in foreign exchange rates on investments from the fluctuations arising from changes in market prices of securities held. Such fluctuations are included with the net realized and unrealized gains or losses from investments shown in the Statement of Operations.
For securities, which are subject to foreign withholding tax upon disposition, realized gains or losses on such securities are recorded net of foreign withholding tax.
Reported net realized foreign exchange gains or losses arise from sales of foreign currencies, currency gains or losses realized between the trade and settlement dates on securities transactions, the difference between the amounts of dividends, interest, and foreign withholding tax reclaims recorded on Fund’s books, and the U.S. dollar equivalent of the amounts actually received or paid. Net unrealized foreign exchange gains and losses arise from changes in the value of assets and liabilities other than investments in securities, resulting from changes in the exchange rate.
Allocation of Income, Expenses, Gains and Losses. Income, expenses (other than those attributable to a specific class), gains and losses are allocated on a daily basis to each class of shares based upon the relative proportion of net assets represented by such class. Operating expenses directly attributable to a specific class are charged against the operations of that class.
Dividends and Distributions to Shareholders. Dividends and distributions to shareholders, which are determined in accordance with income tax regulations and may differ from U.S. GAAP, are recorded on the ex-dividend date. Income and capital gain distributions, if any, are declared and paid annually or at other times as deemed necessary by the Manager.
Investment Income. Dividend income is recorded on the ex-dividend date or upon ex-dividend notification in the case of certain foreign dividends where the ex-dividend date may have passed. Non-cash dividends included in dividend income, if any, are recorded at the fair market value of the securities received. Interest income is recognized on an accrual basis. Discount and premium, which are included in interest income on the Statement of Operations, are amortized or accreted daily.
Custodian Fees. “Custodian fees and expenses” in the Statement of Operations may include interest expense incurred by the Fund on any cash overdrafts of its custodian account during the period. Such cash overdrafts may result from the effects of failed trades in portfolio securities and from cash outflows resulting from unanticipated shareholder redemption activity. The Fund pays interest to its custodian on such cash overdrafts, to the extent they are not offset by positive cash balances maintained by the Fund, at a rate equal to the Federal Funds Rate plus 0.50%. This rate will increase to 2.00% effective January 1, 2017. The “Reduction to custodian expenses” line item, if applicable, represents earnings on cash balances maintained by the Fund during the period. Such interest expense and other custodian fees may be paid with these earnings.
Security Transactions. Security transactions are recorded on the trade date. Realized gains and losses on securities sold are determined on the basis of identified cost.
Indemnifications. The Fund’s organizational documents provide current and former Trustees and officers with a limited indemnification against
15 Oppenheimer International Growth Fund/VA
NOTES TO FINANCIAL STATEMENTS Continued
2. Significant Accounting Policies (Continued)
liabilities arising in connection with the performance of their duties to the Fund. In the normal course of business, the Fund may also enter into contracts that provide general indemnifications. The Fund’s maximum exposure under these arrangements is unknown as this would be dependent on future claims that may be made against the Fund. The risk of material loss from such claims is considered remote.
Federal Taxes. The Fund intends to comply with provisions of the Internal Revenue Code applicable to regulated investment companies and to distribute substantially all of its investment company taxable income, including any net realized gain on investments not offset by capital loss carryforwards, if any, to shareholders. Therefore, no federal income or excise tax provision is required. The Fund files income tax returns in U.S. federal and applicable state jurisdictions. The statute of limitations on the Fund’s tax return filings generally remains open for the three preceding fiscal reporting period ends. The Fund has analyzed its tax positions for the fiscal year ended December 31, 2016, including open tax years, and does not believe there are any uncertain tax positions requiring recognition in the Fund’s financial statements.
The tax components of capital shown in the following table represent distribution requirements the Fund must satisfy under the income tax regulations, losses the Fund may be able to offset against income and gains realized in future years and unrealized appreciation or depreciation of securities and other investments for federal income tax purposes.
| | | | | | | | | | | | |
Undistributed Net Investment Income | | Undistributed
Long-Term
Gain | | | Accumulated
Loss
Carryforward1,2,3
| | | Net Unrealized
Appreciation
Based on cost of
Securities and
Other Investments
for Federal Income
Tax Purposes | |
| |
$7,257,792 | | | $— | | | | $417,148 | | | | $112,517,406 | |
1. At period end, the Fund had $417,148 of net capital loss carryforward available to offset future realized capital gains, if any, and thereby reduce future taxable gain distributions. Details of the capital loss carryforwards are included in the table below. Capital loss carryovers with no expiration, if any, must be utilized prior to those with expiration dates.
| | | | |
| Expiring | | | |
| |
No expiration | | $ | 417,148 | |
2. During the reporting period, the Fund did not utilize any capital loss carryforward.
3. During the previous reporting period, the Fund did not utilize any capital loss carryforward.
Net investment income (loss) and net realized gain (loss) may differ for financial statement and tax purposes. The character of dividends and distributions made during the fiscal year from net investment income or net realized gains are determined in accordance with federal income tax requirements, which may differ from the character of net investment income or net realized gains presented in those financial statements in accordance with U.S. GAAP. Also, due to timing of dividends and distributions, the fiscal year in which amounts are distributed may differ from the fiscal year in which the income or net realized gain was recorded by the Fund.
Accordingly, the following amounts have been reclassified for the reporting period. Net assets of the Fund were unaffected by the reclassifications.
| | | | | | | | |
Increase to Paid-in Capital | | Reduction
to Accumulated
Net Investment
Income | | | Reduction
to Accumulated Net
Realized Loss on Investments | |
| |
$11,688 | | | $215,440 | | | | $203,752 | |
The tax character of distributions paid during the reporting periods:
| | | | | | | | |
| | | Year Ended
December 31, 2016 | | | Year Ended
December 31, 2015 | |
| |
Distributions paid from: | | | | | | | | |
Ordinary income | | $ | 4,858,159 | | | $ | 6,531,547 | |
Long-term capital gain | | | 11,251,425 | | | | 34,792,804 | |
| | | | |
Total | | $ | 16,109,584 | | | $ | 41,324,351 | |
| | | | |
The aggregate cost of securities and other investments and the composition of unrealized appreciation and depreciation of securities and other investments for federal income tax purposes at period end are noted in the following table. The primary difference between book and tax appreciation or depreciation of securities and other investments, if applicable, is attributable to the tax deferral of losses or tax realization of financial statement unrealized gain or loss.
16 ��Oppenheimer International Growth Fund/VA
2. Significant Accounting Policies (Continued)
| | | | |
Federal tax cost of securities | | $ | 362,296,550 | |
Federal tax cost of other investments | | | 8 | |
| | | | |
Total federal tax cost | | $ | 362,296,558 | |
| | | | |
Gross unrealized appreciation | | $ | 169,970,819 | |
Gross unrealized depreciation | | | (57,453,413) | |
| | | | |
Net unrealized appreciation | | $ | 112,517,406 | |
| | | | |
Certain foreign countries impose a tax on capital gains which is accrued by the Fund based on unrealized appreciation, if any, on affected securities. The tax is paid when the gain is realized.
Use of Estimates. The preparation of financial statements in conformity with U.S. GAAP requires management to make estimates and assumptions that affect the reported amounts of assets and liabilities and disclosure of contingent assets and liabilities at the date of the financial statements and the reported amounts of increases and decreases in net assets from operations during the reporting period. Actual results could differ from those estimates.
3. Securities Valuation
The Fund calculates the net asset value of its shares as of 4:00 P.M. Eastern time, on each day the New York Stock Exchange (the “Exchange”) is open for trading, except in the case of a scheduled early closing of the Exchange, in which case the Fund will calculate net asset value of the shares as of the scheduled early closing time of the Exchange.
The Fund’s Board has adopted procedures for the valuation of the Fund’s securities and has delegated the day-to-day responsibility for valuation determinations under those procedures to the Manager. The Manager has established a Valuation Committee which is responsible for determining a “fair valuation” for any security for which market quotations are not “readily available.” The Valuation Committee’s fair valuation determinations are subject to review, approval and ratification by the Fund’s Board at its next regularly scheduled meeting covering the calendar quarter in which the fair valuation was determined.
Valuation Methods and Inputs
Securities are valued using unadjusted quoted market prices, when available, as supplied primarily by third party pricing services or dealers.
The following methodologies are used to determine the market value or the fair value of the types of securities described below:
Equity securities traded on a securities exchange (including exchange-traded derivatives other than futures and futures options) are valued based on the official closing price on the principal exchange on which the security is traded, as identified by the Manager, prior to the time when the Fund’s assets are valued. If the official closing price is unavailable, the security is valued at the last sale price on the principal exchange on which it is traded. If the official closing price or last sales price for a foreign security is not available, the security is valued at the mean between the bid and asked price per the exchange or, if not available from the exchange, obtained from two dealers. If bid and asked prices are not available from either the exchange or two dealers, the security is valued by using one of the following methodologies (listed in order of priority): (1) a bid from the exchange, (2) the mean between the bid and asked price as provided by a single dealer, or (3) a bid from a single dealer.
Shares of a registered investment company that are not traded on an exchange are valued at that investment company’s net asset value per share.
Corporate and government debt securities (of U.S. or foreign issuers) and municipal debt securities, event-linked bonds, loans, mortgage-backed securities, collateralized mortgage obligations, and asset-backed securities are valued at the mean between the “bid” and “asked” prices utilizing evaluated prices obtained from third party pricing services or broker-dealers who may use matrix pricing methods to determine the evaluated prices.
Short-term money market type debt securities are valued at the mean between the “bid” and “asked” prices utilizing evaluated prices obtained from third party pricing services or broker-dealers.
A description of the standard inputs that may generally be considered by the third party pricing vendors in determining their evaluated prices is provided below.
| | |
| Security Type | | Standard inputs generally considered by third-party pricing vendors |
| Corporate debt, government debt, municipal, mortgage- backed and asset-backed securities | | Reported trade data, broker-dealer price quotations, benchmark yields, issuer spreads on comparable securities, the credit quality, yield, maturity, and other appropriate factors. |
|
| Loans | | Information obtained from market participants regarding reported trade data and broker-dealer price quotations. |
|
| Event-linked bonds | | Information obtained from market participants regarding reported trade data and broker-dealer price quotations. |
If a market value or price cannot be determined for a security using the methodologies described above, or if, in the “good faith” opinion of the Manager, the market value or price obtained does not constitute a “readily available market quotation,” or a significant event has occurred that would materially affect the value of the security, the security is fair valued either (i) by a standardized fair valuation methodology applicable to the security type or the significant event as previously approved by the Valuation Committee and the Fund’s Board or (ii) as determined in good faith by the Manager’s Valuation Committee. The Valuation Committee considers all relevant facts that are reasonably available, through either public information
17 Oppenheimer International Growth Fund/VA
NOTES TO FINANCIAL STATEMENTS Continued
3. Securities Valuation (Continued)
or information available to the Manager, when determining the fair value of a security. Fair value determinations by the Manager are subject to review, approval and ratification by the Fund’s Board at its next regularly scheduled meeting covering the calendar quarter in which the fair valuation was determined. Those fair valuation standardized methodologies include, but are not limited to, valuing securities at the last sale price or initially at cost and subsequently adjusting the value based on: changes in company specific fundamentals, changes in an appropriate securities index, or changes in the value of similar securities which may be further adjusted for any discounts related to security-specific resale restrictions. When possible, such methodologies use observable market inputs such as unadjusted quoted prices of similar securities, observable interest rates, currency rates and yield curves. The methodologies used for valuing securities are not necessarily an indication of the risks associated with investing in those securities nor can it be assured that the Fund can obtain the fair value assigned to a security if it were to sell the security.
To assess the continuing appropriateness of security valuations, the Manager, or its third party service provider who is subject to oversight by the Manager, regularly compares prior day prices, prices on comparable securities, and sale prices to the current day prices and challenges those prices exceeding certain tolerance levels with the third party pricing service or broker source. For those securities valued by fair valuations, whether through a standardized fair valuation methodology or a fair valuation determination, the Valuation Committee reviews and affirms the reasonableness of the valuations based on such methodologies and fair valuation determinations on a regular basis after considering all relevant information that is reasonably available.
Classifications
Each investment asset or liability of the Fund is assigned a level at measurement date based on the significance and source of the inputs to its valuation. Various data inputs are used in determining the value of each of the Fund’s investments as of the reporting period end. These data inputs are categorized in the following hierarchy under applicable financial accounting standards:
1) Level 1-unadjusted quoted prices in active markets for identical assets or liabilities (including securities actively traded on a securities exchange)
2) Level 2-inputs other than unadjusted quoted prices that are observable for the asset or liability (such as unadjusted quoted prices for similar assets and market corroborated inputs such as interest rates, prepayment speeds, credit risks, etc.)
3) Level 3-significant unobservable inputs (including the Manager’s own judgments about assumptions that market participants would use in pricing the asset or liability).
The inputs used for valuing securities are not necessarily an indication of the risks associated with investing in those securities.
The Fund classifies each of its investments in investment companies which are publicly offered as Level 1. Investment companies that are not publicly offered are measured using net asset value as a practical expedient, and are not classified in the fair value hierarchy.
The table below categorizes amounts that are included in the Fund’s Statement of Assets and Liabilities at period end based on valuation input level:
| | | | | | | | | | | | | | | | |
| | | Level 1— Unadjusted Quoted Prices | | | Level 2— Other Significant
Observable Inputs | | | Level 3— Significant
Unobservable Inputs | | | Value | |
| |
Assets Table | | | | | | | | | | | | | | | | |
Investments, at Value: | | | | | | | | | | | | | | | | |
Common Stocks | | | | | | | | | | | | | | | | |
Consumer Discretionary | | $ | 21,290,498 | | | $ | 94,176,420 | | | $ | — | | | $ | 115,466,918 | |
Consumer Staples | | | 11,506,315 | | | | 48,947,729 | | | | — | | | | 60,454,044 | |
Energy | | | — | | | | 9,829,315 | | | | — | | | | 9,829,315 | |
Financials | | | 5,238,123 | | | | 11,339,106 | | | | — | | | | 16,577,229 | |
Health Care | | | — | | | | 47,967,612 | | | | — | | | | 47,967,612 | |
Industrials | | | — | | | | 99,355,420 | | | | — | | | | 99,355,420 | |
Information Technology | | | — | | | | 65,493,789 | | | | — | | | | 65,493,789 | |
Materials | | | 5,656,576 | | | | 17,267,260 | | | | — | | | | 22,923,836 | |
Telecommunication Services | | | — | | | | 27,593,258 | | | | — | | | | 27,593,258 | |
Preferred Stock | | | 86,481 | | | | — | | | | — | | | | 86,481 | |
Rights, Warrants and Certificates | | | — | | | | — | | | | — | | | | — | |
Investment Company | | | 9,483,349 | | | | — | | | | — | | | | 9,483,349 | |
| | | | |
Total Assets | | $ | 53,261,342 | | | $ | 421,969,909 | | | $ | — | | | $ | 475,231,251 | |
| | | | |
Forward currency exchange contracts and futures contracts, if any, are reported at their unrealized appreciation/depreciation at measurement date, which represents the change in the contract’s value from trade date. All additional assets and liabilities included in the above table are reported at their market value at measurement date.
4. Investments and Risks
Risks of Foreign Investing. The Fund may invest in foreign securities which are subject to special risks. Securities traded in foreign markets may be less liquid and more volatile than those traded in U.S. markets. Foreign issuers are usually not subject to the same accounting and disclosure requirements that U.S. companies are subject to, which may make it difficult for the Fund to evaluate a foreign company’s operations or financial condition. A change in the value of a foreign currency against the U.S. dollar will result in a change in the U.S. dollar value of investments denominated in that foreign currency and in the value of any income or distributions the Fund may receive on those investments. The value of foreign investments
18 Oppenheimer International Growth Fund/VA
4. Investments and Risks (Continued)
may be affected by exchange control regulations, foreign taxes, higher transaction and other costs, delays in the settlement of transactions, changes in economic or monetary policy in the United States or abroad, expropriation or nationalization of a company’s assets, or other political and economic factors. In addition, due to the inter-relationship of global economies and financial markets, changes in political and economic factors in one country or region could adversely affect conditions in another country or region. Investments in foreign securities may also expose the Fund to time-zone arbitrage risk. Foreign securities may trade on weekends or other days when the Fund does not price its shares. At times, the Fund may emphasize investments in a particular country or region and may be subject to greater risks from adverse events that occur in that country or region. Foreign securities and foreign currencies held in foreign banks and securities depositories may be subject to limited or no regulatory oversight.
Investments in Affiliated Funds. The Fund is permitted to invest in other mutual funds advised by the Manager (“Affiliated Funds”). Affiliated Funds are open-end management investment companies registered under the 1940 Act, as amended. The Manager is the investment adviser of, and the Sub-Adviser provides investment and related advisory services to, the Affiliated Funds. When applicable, the Fund’s investments in Affiliated Funds are included in the Statement of Investments. Shares of Affiliated Funds are valued at their net asset value per share. As a shareholder, the Fund is subject to its proportional share of the Affiliated Funds’ expenses, including their management fee. The Manager will waive fees and/or reimburse Fund expenses in an amount equal to the indirect management fees incurred through the Fund’s investment in the Affiliated Funds.
Each of the Affiliated Funds in which the Fund invests has its own investment risks, and those risks can affect the value of the Fund’s investments and therefore the value of the Fund’s shares. To the extent that the Fund invests more of its assets in one Affiliated Fund than in another, the Fund will have greater exposure to the risks of that Affiliated Fund.
Investments in Money Market Instruments. The Fund is permitted to invest its free cash balances in money market instruments to provide liquidity or for defensive purposes. The Fund may invest in money market instruments by investing in Class E shares of Oppenheimer Institutional Government Money Market Fund (“IGMMF”), formerly known as Oppenheimer Institutional Money Market Fund, which is an Affiliated Fund. IGMMF is regulated as a money market fund under the 1940 Act, as amended. The Fund may also invest in money market instruments directly or in other affiliated or unaffiliated money market funds.
Equity Security Risk. Stocks and other equity securities fluctuate in price. The value of the Fund’s portfolio may be affected by changes in the equity markets generally. Equity markets may experience significant short-term volatility and may fall sharply at times. Different markets may behave differently from each other and U.S. equity markets may move in the opposite direction from one or more foreign stock markets. Adverse events in any part of the equity or fixed-income markets may have unexpected negative effects on other market segments.
The prices of individual equity securities generally do not all move in the same direction at the same time and a variety of factors can affect the price of a particular company’s securities. These factors may include, but are not limited to, poor earnings reports, a loss of customers, litigation against the company, general unfavorable performance of the company’s sector or industry, or changes in government regulations affecting the company or its industry.
Shareholder Concentration. At period end, one shareholder owned 20% or more of the Fund’s total outstanding shares.
The shareholder is a related party of the Fund. Related parties may include, but are not limited to, the investment manager and its affiliates, affiliated broker dealers, fund of funds, and directors or employees. The related party owned 40% of the Fund’s total outstanding shares at period end.
5. Market Risk Factors
The Fund’s investments in securities and/or financial derivatives may expose the Fund to various market risk factors:
Commodity Risk. Commodity risk relates to the change in value of commodities or commodity indexes as they relate to increases or decreases in the commodities market. Commodities are physical assets that have tangible properties. Examples of these types of assets are crude oil, heating oil, metals, livestock, and agricultural products.
Credit Risk. Credit risk relates to the ability of the issuer of debt to meet interest and principal payments, or both, as they come due. In general, lower-grade, higher-yield debt securities are subject to credit risk to a greater extent than lower-yield, higher-quality securities.
Equity Risk. Equity risk relates to the change in value of equity securities as they relate to increases or decreases in the general market.
Foreign Exchange Rate Risk. Foreign exchange rate risk relates to the change in the U.S. dollar value of a security held that is denominated in a foreign currency. The U.S. dollar value of a foreign currency denominated security will decrease as the dollar appreciates against the currency, while the U.S. dollar value will increase as the dollar depreciates against the currency.
Interest Rate Risk. Interest rate risk refers to the fluctuations in value of fixed-income securities resulting from the inverse relationship between price and yield. For example, an increase in general interest rates will tend to reduce the market value of already issued fixed-income investments, and a decline in general interest rates will tend to increase their value. In addition, debt securities with longer maturities, which tend to have higher yields, are subject to potentially greater fluctuations in value from changes in interest rates than obligations with shorter maturities.
Volatility Risk. Volatility risk refers to the magnitude of the movement, but not the direction of the movement, in a financial instrument’s price over a defined time period. Large increases or decreases in a financial instrument’s price over a relative time period typically indicate greater volatility risk, while small increases or decreases in its price typically indicate lower volatility risk.
19 Oppenheimer International Growth Fund/VA
NOTES TO FINANCIAL STATEMENTS Continued
6. Shares of Beneficial Interest
The Fund has authorized an unlimited number of $0.001 par value shares of beneficial interest of each class. Transactions in shares of beneficial interest were as follows:
| | | | | | | | | | | | | | | | | | | | | | |
| | | | | | | | Year Ended December 31, 2016 | | | Year Ended December 31, 2015 | |
| | | | | | | | Shares | | | Amount | | | Shares | | | Amount | |
| |
| Non-Service Shares | | | | | | | | | | | | | | | | | | | | | | |
| Sold | | | | | | | | | 22,953,697 | | | $ | 47,962,883 | | | | 25,785,184 | | | $ | 60,862,122 | |
| Dividends and/or distributions reinvested | | | | | | | | | 4,989,924 | | | | 10,628,539 | | | | 12,263,244 | | | | 28,450,725 | |
| Redeemed | | | | | | | | | (27,048,722) | | | | (57,802,510) | | | | (48,734,993) | | | | (113,512,248) | |
| | | |
| Net increase (decrease) | | | | | | | | | 894,899 | | | $ | 788,912 | | | | (10,686,565) | | | $ | (24,199,401) | |
| | | |
| | | | | | | | | | | | | | | | | | | | | | |
| |
| Service Shares | | | | | | | | | | | | | | | | | | | | | | |
| Sold | | | | | | | | | 20,232,575 | | | $ | 45,018,434 | | | | 20,290,959 | | | $ | 49,094,495 | |
| Dividends and/or distributions reinvested | | | | | | | | | 2,468,939 | | | | 5,481,045 | | | | 5,341,754 | | | | 12,873,626 | |
| Redeemed | | | | | | | | | (15,460,315) | | | | (34,540,252) | | | | (12,264,866) | | | | (29,078,792) | |
| | | |
| Net increase | | | | | | | | | 7,241,199 | | | $ | 15,959,227 | | | | 13,367,847 | | | $ | 32,889,329 | |
| | | |
7. Purchases and Sales of Securities
The aggregate cost of purchases and proceeds from sales of securities, other than short-term obligations and investments in IGMMF, for the reporting period were as follows:
| | | | | | | | |
| | | Purchases | | | Sales | |
| |
Investment securities | | $ | 70,980,651 | | | $ | 72,767,052 | |
8. Fees and Other Transactions with Affiliates
Management Fees. Under the investment advisory agreement, the Fund pays the Manager a management fee based on the daily net assets of the Fund at an annual rate as shown in the following table:
| | | | |
| Fee Schedule | | | | |
| |
Up to $250 million | | | 1.00% | |
Next $250 million | | | 0.90 | |
Next $500 million | | | 0.85 | |
Over $1 billion | | | 0.82 | |
The Fund’s effective management fee for the reporting period was 0.95% of average annual net assets before any applicable waivers.
Sub-Adviser Fees. The Manager has retained the Sub-Adviser to provide the day-to-day portfolio management of the Fund. Under the Sub-Advisory Agreement, the Manager pays the Sub-Adviser an annual fee in monthly installments, equal to a percentage of the investment management fee collected by the Manager from the Fund, which shall be calculated after any investment management fee waivers. The fee paid to the Sub-Adviser is paid by the Manager, not by the Fund.
Transfer Agent Fees. OFI Global (the “Transfer Agent”) serves as the transfer and shareholder servicing agent for the Fund. The Fund pays the Transfer Agent a fee based on annual net assets. Fees incurred and average net assets for each class with respect to these services are detailed in the Statement of Operations and Financial Highlights, respectively.
Sub-Transfer Agent Fees. The Transfer Agent has retained Shareholder Services, Inc., a wholly-owned subsidiary of OFI (the “Sub-Transfer Agent”), to provide the day-to-day transfer agent and shareholder servicing of the Fund. Under the Sub-Transfer Agency Agreement, the Transfer Agent pays the Sub-Transfer Agent an annual fee in monthly installments, equal to a percentage of the transfer agent fee collected by the Transfer Agent from the Fund, which shall be calculated after any applicable fee waivers. The fee paid to the Sub-Transfer Agent is paid by the Transfer Agent, not by the Fund.
Trustees’ Compensation. The Fund’s Board of Trustees (“Board”) has adopted a compensation deferral plan for Independent Trustees that enables Trustees to elect to defer receipt of all or a portion of the annual compensation they are entitled to receive from the Fund. For purposes of determining the amount owed to the Trustees under the plan, deferred amounts are treated as though equal dollar amounts had been invested in shares of the Fund or in other Oppenheimer funds selected by the Trustees. The Fund purchases shares of the funds selected for deferral by the Trustees in amounts equal to his or her deemed investment, resulting in a Fund asset equal to the deferred compensation liability. Such assets are included as a component of “Other” within the asset section of the Statement of Assets and Liabilities. Deferral of Trustees’ fees under the plan will not affect the net assets of the Fund and will not materially affect the Fund’s assets, liabilities or net investment income per share. Amounts will be deferred until distributed in accordance with the compensation deferral plan.
Distribution and Service Plan for Service Shares. The Fund has adopted a Distribution and Service Plan (the “Plan”) pursuant to Rule 12b-1 under the 1940 Act for Service shares to pay OppenheimerFunds Distributor, Inc. (the “Distributor”), for distribution related services, personal service and
20 Oppenheimer International Growth Fund/VA
8. Fees and Other Transactions with Affiliates (Continued)
account maintenance for the Fund’s Service shares. Under the Plan, payments are made periodically at an annual rate of 0.25% of the daily net assets of Service shares of the Fund. The Distributor currently uses all of those fees to compensate sponsors of the insurance product that offers Fund shares, for providing personal service and maintenance of accounts of their variable contract owners that hold Service shares. These fees are paid out of the Fund’s assets on an on-going basis and increase operating expenses of the Service shares, which results in lower performance compared to the Fund’s shares that are not subject to a service fee. Fees incurred by the Fund under the Plan are detailed in the Statement of Operations.
Waivers and Reimbursements of Expenses. The Manager has contractually agreed to limit the Fund’s expenses after payments, waivers and/or reimbursements and reduction to custodian expenses, excluding any applicable dividend expense, taxes, interest and fees from borrowing, any subsidiary expenses, Acquired Fund Fees and Expenses, brokerage commissions, unusual and infrequent expenses and certain other Fund expenses; so that those expenses, as percentages of daily net assets, will not exceed the annual rate of 1.00% for Non-Service shares and 1.25% for Service shares. During the reporting period, the Manager waived fees and/or reimbursed the Fund $274,928 and $157,676 for Non-Service and Service shares, respectively.
The Manager will waive fees and/or reimburse Fund expenses in an amount equal to the indirect management fees incurred through the Fund’s investment in IGMMF. During the reporting period, the Manager waived fees and/or reimbursed the Fund $7,216 for IGMMF management fees.
Waivers and/or reimbursements may be modified or terminated as set forth according to the terms in the prospectus.
9. Borrowings and Other Financing
Joint Credit Facility. A number of mutual funds managed by the Manager participate in a $1.3 billion revolving credit facility (the “Facility”) intended to provide short-term financing, if necessary, subject to certain restrictions in connection with atypical redemption activity. Expenses and fees related to the Facility are paid by the participating funds and are disclosed separately or as other expenses on the Statement of Operations. The Fund did not utilize the Facility during the reporting period.
10. Pending Litigation
In 2009, several putative class action lawsuits were filed and later consolidated before the U.S. District Court for the District of Colorado in connection with the investment performance of Oppenheimer Rochester California Municipal Fund (the “California Fund”), a fund advised by OppenheimerFunds, Inc. (“OFI”) and distributed by OppenheimerFunds Distributor, Inc. (“OFDI”). The plaintiffs asserted claims against OFI, OFDI and certain present and former trustees and officers of the California Fund under the federal securities laws, alleging, among other things, that the disclosure documents of the California Fund contained misrepresentations and omissions and the investment policies of the California Fund were not followed. An amended complaint and a motion to dismiss were filed, and in 2011, the court issued an order which granted in part and denied in part the defendants’ motion to dismiss. In October 2015, following a successful appeal by defendants and a subsequent hearing, the court granted plaintiffs’ motion for class certification and appointed class representatives and class counsel.
OFI and OFDI believe the suit is without merit; that it is premature to render any opinion as to the likelihood of an outcome unfavorable to them in the suit; and that no estimate can yet be made as to the amount or range of any potential loss. Furthermore, OFI believes that the suit should not impair the ability of OFI or OFDI to perform their respective duties to the Fund and that the outcome of the suit should not have any material effect on the operations of any of the Oppenheimer funds.
21 Oppenheimer International Growth Fund/VA
REPORT OF INDEPENDENT REGISTERED PUBLIC ACCOUNTING FIRM
The Board of Trustees and Shareholders of Oppenheimer Variable Account Funds:
We have audited the accompanying statement of assets and liabilities of Oppenheimer International Growth Fund/VA (a separate series of Oppenheimer Variable Account Funds), including the statement of investments, as of December 31, 2016, and the related statement of operations for the year then ended, the statements of changes in net assets for each of the years in the two-year period then ended, and the financial highlights for each of the years in the five-year period then ended. These financial statements and financial highlights are the responsibility of the Fund’s management. Our responsibility is to express an opinion on these financial statements and financial highlights based on our audits.
We conducted our audits in accordance with the standards of the Public Company Accounting Oversight Board (United States). Those standards require that we plan and perform the audit to obtain reasonable assurance about whether the financial statements and financial highlights are free of material misstatement. An audit includes examining, on a test basis, evidence supporting the amounts and disclosures in the financial statements. Our procedures included confirmation of securities owned as of December 31, 2016, by correspondence with the custodian and transfer agent. An audit also includes assessing the accounting principles used and significant estimates made by management, as well as evaluating the overall financial statement presentation. We believe that our audits provide a reasonable basis for our opinion.
In our opinion, the financial statements and financial highlights referred to above present fairly, in all material respects, the financial position of Oppenheimer International Growth Fund/VA as of December 31, 2016, the results of its operations for the year then ended, the changes in its net assets for each of the years in the two-year period then ended, and the financial highlights for each of the years in the five-year period then ended, in conformity with U.S. generally accepted accounting principles.
KPMG LLP
Denver, Colorado
February 15, 2017
22 Oppenheimer International Growth Fund/VA
FEDERAL INCOME TAX INFORMATION Unaudited
In early 2017, if applicable, shareholders of record received information regarding all dividends and distributions paid to them by the Fund during calendar year 2016.
Capital gain distributions of $0.05114 per share were paid to Non-Service and Service shareholders, respectively, on June 21, 2016. Whether received in stock or in cash, the capital gain distribution should be treated by shareholders as a gain from the sale of the capital assets held for more than one year (long-term capital gains).
None of the dividends paid by the Fund during the reporting period are eligible for the corporate dividend-received deduction.
The foregoing information is presented to assist shareholders in reporting distributions received from the Fund to the Internal Revenue Service. Because of the complexity of the federal regulations which may affect your individual tax return and the many variations in state and local tax regulations, we recommend that you consult your tax advisor for specific guidance.
23 Oppenheimer International Growth Fund/VA
BOARD APPROVAL OF THE FUND’S INVESTMENT ADVISORY AND SUB-ADVISORY AGREEMENTS Unaudited
The Fund has entered into an investment advisory agreement with OFI Global Asset Management, Inc. (“OFI Global” or the “Adviser”), a wholly-owned subsidiary of OppenheimerFunds, Inc. (“OFI” or the “Sub-Adviser”) (“OFI Global” and “OFI” together the “Managers”) and OFI Global has entered into a sub-advisory agreement with OFI whereby OFI provides investment sub-advisory services to the Fund (collectively, the “Agreements”). Each year, the Board of Trustees (the “Board”), including a majority of the independent Trustees, is required to determine whether to approve the terms of the Agreements and the renewal thereof. The Investment Company Act of 1940, as amended, requires that the Board request and evaluate, and that the Managers provide, such information as may be reasonably necessary to evaluate the terms of the Agreements. The Board employs an independent consultant to prepare a report that provides information, including comparative information that the Board requests for that purpose. In addition to in-person meetings focused on this evaluation, the Board receives information throughout the year regarding Fund services, fees, expenses and performance.
The Managers and the independent consultant provided information to the Board on the following factors: (i) the nature, quality and extent of the Managers’ services, (ii) the comparative investment performance of the Fund and the Managers, (iii) the fees and expenses of the Fund, including comparative fee and expense information, (iv) the profitability of the Managers and their affiliates, including an analysis of the cost of providing services, (v) whether economies of scale are realized as the Fund grows and whether fee levels reflect these economies of scale for Fund investors and (vi) other benefits to the Managers from their relationship with the Fund. The Board was aware that there are alternatives to retaining the Managers.
Outlined below is a summary of the principal information considered by the Board as well as the Board’s conclusions.
Nature, Quality and Extent of Services. The Board considered information about the nature, quality and extent of the services provided to the Fund and information regarding the Managers’ key personnel who provide such services. The Managers’ duties include providing the Fund with the services of the portfolio managers and the Sub-Adviser’s investment team, who provide research, analysis and other advisory services in regard to the Fund’s investments; and securities trading services. OFI Global is responsible for oversight of third-party service providers; monitoring compliance with applicable Fund policies and procedures and adherence to the Fund’s investment restrictions; risk management; and oversight of the Sub-Adviser. OFI Global is also responsible for providing certain administrative services to the Fund. Those services include providing and supervising all administrative and clerical personnel who are necessary in order to provide effective corporate administration for the Fund; compiling and maintaining records with respect to the Fund’s operations; preparing and filing reports required by the U.S. Securities and Exchange Commission; preparing periodic reports regarding the operations of the Fund for its shareholders; preparing proxy materials for shareholder meetings; and preparing the registration statements required by federal and state securities laws for the sale of the Fund’s shares. OFI Global also provides the Fund with office space, facilities and equipment.
The Board also considered the quality of the services provided and the quality of the Managers’ resources that are available to the Fund. The Board took account of the fact that the Sub-Adviser has over fifty years of experience as an investment adviser and that its assets under management rank it among the top mutual fund managers in the United States. The Board evaluated the Managers’ advisory, administrative, accounting, legal, compliance and risk management services, and information the Board has received regarding the experience and professional qualifications of the Managers’ key personnel and the size and functions of its staff. In its evaluation of the quality of the portfolio management services provided, the Board considered the experience of George Evans and Robert Dunphy, the portfolio managers for the Fund, and the Sub-Adviser’s investment team and analysts. The Board members also considered the totality of their experiences with the Managers as directors or trustees of the Fund and other funds advised by the Managers. The Board considered information regarding the quality of services provided by affiliates of the Managers, which the Board members have become knowledgeable about through their experiences with the Managers and in connection with the renewal of the Fund’s service agreements. The Board concluded, in light of the Managers’ experience, reputation, personnel, operations and resources that the Fund benefits from the services provided under the Agreements.
Investment Performance of the Managers and the Fund. Throughout the year, the Managers provided information on the investment performance of the Fund, the Adviser and the Sub-Adviser, including comparative performance information. The Board also reviewed information, prepared by the Managers and by the independent consultant, comparing the Fund’s historical performance to relevant market indices and to the performance of other foreign large growth funds underlying variable insurance products. The Board noted that the Fund outperformed its performance category median during the one-, three-, five- and ten-year periods.
Fees and Expenses of the Fund. The Board reviewed the fees paid to the Adviser and the other expenses borne by the Fund. The Board noted that the Adviser, not the Fund, pays the Sub-Adviser’s fee under the sub-advisory agreement. The independent consultant provided comparative data in regard to the fees and expenses of the Fund and other foreign large growth funds underlying variable insurance products. In reviewing the fees and expenses charged to the VA funds, the Board considered the Adviser’s assertion that, because there is much greater disparity in the fees and services that may be provided by a manager to a VA fund as opposed to a retail fund, when comparing the expenses of the various VA funds to those of retail funds, it is most appropriate to focus on total expenses (rather than on the management fees). Accordingly, while the Board reviewed and considered all expenses, it focused on total expenses. The Board considered that the Fund’s total expenses, net of waivers, were equal to its peer group median and higher than its category median. The Board also considered that the Fund’s contractual management fee was also equal to its peer group median and higher than its category median. The Board noted that the Adviser has contractually agreed to limit the Fund’s total annual operating expenses so that those expenses, as percentages of daily net assets, will not exceed the annual rate of 1.00% for Non-Service Shares and 1.25% for Service Shares. This contractual expense limitation may not be amended or withdrawn until one year from the date of the Fund’s prospectus, unless approved by the Board.
Economies of Scale and Profits Realized by the Managers. The Board considered information regarding the Managers’ costs in serving as the Fund’s investment adviser and sub-adviser, including the costs associated with the personnel and systems necessary to manage the Fund, and information regarding the Managers’ profitability from their relationship with the Fund. The Board also considered that the Managers must be able to pay and retain experienced professional personnel at competitive rates to provide quality services to the Fund. The Board reviewed whether the Managers may realize economies of scale in managing and supporting the Fund. The Board noted that the Fund currently has management fee breakpoints, which are intended to share with Fund shareholders economies of scale that may exist as the Fund’s assets grow.
Other Benefits to the Managers. In addition to considering the profits realized by the Managers, the Board considered information that was
24 OPPENHEIMER INTERNATIONAL GROWTH FUND/VA
BOARD APPROVAL OF THE FUND’S INVESTMENT ADVISORY AND SUB-ADVISORY AGREEMENTS Unaudited / Continued
provided regarding the direct and indirect benefits the Managers receive as a result of their relationship with the Fund, including compensation paid to the Managers’ affiliates and research provided to the Adviser in connection with permissible brokerage arrangements (soft dollar arrangements).
Conclusions. These factors were also considered by the independent Trustees meeting separately from the full Board, assisted by experienced counsel to the Fund and to the independent Trustees. Fund counsel and the independent Trustees’ counsel are independent of the Managers within the meaning and intent of the Securities and Exchange Commission Rules.
Based on its review of the information it received and its evaluations described above, the Board, including a majority of the independent Trustees, decided to continue the Agreements through August 31, 2017. In arriving at its decision, the Board did not identify any factor or factors as being more important than others, but considered all of the above information, and considered the terms and conditions of the Agreements, including the management fees, in light of all the surrounding circumstances.
25 OPPENHEIMER INTERNATIONAL GROWTH FUND/VA
PORTFOLIO PROXY VOTING POLICIES AND GUIDELINES; UPDATES TO STATEMENTS OF INVESTMENTS Unaudited
The Fund has adopted Portfolio Proxy Voting Policies and Guidelines under which the Fund votes proxies relating to securities (“portfolio proxies”) held by the Fund. A description of the Fund’s Portfolio Proxy Voting Policies and Guidelines is available (i) without charge, upon request, by calling the Fund toll-free at 1.800.525.7048, (ii) on the Fund’s website at www.oppenheimerfunds.com, and (iii) on the SEC’s website at www.sec.gov. In addition, the Fund is required to file Form N-PX, with its complete proxy voting record for the 12 months ended June 30th, no later than August 31st of each year. The Fund’s voting record is available (i) without charge, upon request, by calling the Fund toll-free at 1.800.525.7048, and (ii) in the Form N-PX filing on the SEC’s website at www.sec.gov.
The Fund files its complete schedule of portfolio holdings with the SEC for the first quarter and the third quarter of each fiscal year on Form N-Q. The Fund’s Form N-Q filings are available on the SEC’s website at www.sec.gov. Those forms may be reviewed and copied at the SEC’s Public Reference Room in Washington, D.C. Information on the operation of the Public Reference Room may be obtained by calling 1-800-SEC-0330.
26 OPPENHEIMER INTERNATIONAL GROWTH FUND/VA
TRUSTEES AND OFFICERS Unaudited
| | |
Name, Position(s) Held with the Fund, Length of Service, Age | | Principal Occupation(s) During the Past 5 Years; Other Trusteeships/Directorships
Held; Number of Portfolios in the Fund Complex Currently Overseen |
| |
| INDEPENDENT TRUSTEES | | The address of each Trustee in the chart below is 6803 S. Tucson Way, Centennial, Colorado 80112-3924. Each Trustee serves for an indefinite term, or until his or her resignation, retirement, death or removal. |
| |
Robert J. Malone, Chairman of the Board of Trustees (since 2016), Trustee (since 2002) Year of Birth: 1944 | | Chairman - Colorado Market of MidFirst Bank (since January 2015); Chairman of the Board (2012-2016) and Director (August 2005-March 2016) of Jones International University (educational organization); Trustee of the Gallagher Family Foundation (non-profit organization) (2000-2015); Chairman, Chief Executive Officer and Director of Steele Street Bank Trust (commercial banking) (August 2003-January 2015); Board of Directors of Opera Colorado Foundation (non-profit organization) (2008- 2012); Director of Colorado UpLIFT (charitable organization) (1986-2010); Director of Jones Knowledge, Inc. (2006-2010); Former Chairman of U.S. Bank-Colorado (subsidiary of U.S. Bancorp and formerly Colorado National Bank) (July 1996-April 1999); Director of Commercial Assets, Inc. (real estate investment trust) (1993-2000); Director of U.S. Exploration, Inc. (oil and gas exploration) (1997-February 2004); Chairman of the Board (1991-1994) and Trustee (1985-1994) of Regis University; and Chairman of the Board (1990-1991) and Trustee (1984-1999) of Young Presidents Organization. Oversees 47 portfolios in the OppenheimerFunds complex. Mr. Malone has served on the Boards of certain Oppenheimer funds since 2002, during which time he has become familiar with the Fund’s (and other Oppenheimer funds’) financial, accounting, regulatory and investment matters and has contributed to the Boards’ deliberations. |
| |
Jon S. Fossel, Trustee (since 1990) Year of Birth: 1942 | | Chairman of the Board of Jack Creek Preserve Foundation (non-profit organization) (since March 2005); Director of Jack Creek Preserve Foundation (non-profit organization) (March 2005-December 2014); Chairman of the Board (2006-December 2011) and Director (June 2002-December 2011) of UNUMProvident (insurance company); Director of Northwestern Energy Corp. (public utility corporation) (November 2004-December 2009); Director of P.R. Pharmaceuticals (October 1999-October 2003); Director of Rocky Mountain Elk Foundation (non-profit organization) (February 1998-February 2003 and February 2005-February 2007); Chairman and Director (until October 1996) and President and Chief Executive Officer (until October 1995) of OppenheimerFunds, Inc.; President, Chief Executive Officer and Director of the following: Oppenheimer Acquisition Corp. (“OAC”) (parent holding company of OppenheimerFunds, Inc.), Shareholders Services, Inc. and Shareholder Financial Services, Inc. (until October 1995). Oversees 47 portfolios in the OppenheimerFunds complex. Mr. Fossel has served on the Boards of certain Oppenheimer funds since 1990, during which time he has become familiar with the Fund’s (and other Oppenheimer funds’) financial, accounting, regulatory and investment matters and has contributed to the Boards’ deliberations. |
| |
Richard F. Grabish, Trustee (since 2012) Year of Birth: 1948 | | Formerly Senior Vice President and Assistant Director of Sales and Marketing (March 1997-December 2007), Director (March 1987-December 2007) and Manager of Private Client Services (June 1985-June 2005) of A.G. Edwards & Sons, Inc. (broker/dealer and investment firm); Chairman and Chief Executive Officer of A.G. Edwards Trust Company, FSB (March 2001-December 2007); President and Vice Chairman of A.G. Edwards Trust Company, FSB (investment adviser) (April 1987-March 2001); President of A.G. Edwards Trust Company, FSB (investment adviser) (June 2005-December 2007). Oversees 47 portfolios in the OppenheimerFunds complex. Mr. Grabish has served on the Boards of certain Oppenheimer funds since 2001, during which time he has become familiar with the Fund’s (and other Oppenheimer funds’) financial, accounting, regulatory and investment matters and has contributed to the Boards’ deliberations. |
| |
Beverly L. Hamilton, Trustee (since 2002) Year of Birth: 1946 | | Trustee of Monterey Institute for International Studies (educational organization) (2000-2014); Board Member of Middlebury College (educational organization) (December 2005-June 2011); Chairman (2010-2016) of American Funds’ Emerging Markets Growth Fund, Inc. (mutual fund); Director of The California Endowment (philanthropic organization) (April 2002-April 2008); Director (February 2002-2005) and Chairman of Trustees (2006-2007) of the Community Hospital of Monterey Peninsula; Director (October 1991-2005) and Vice Chairman (2006-2009) of American Funds’ Emerging Markets Growth Fund, Inc. (mutual fund); President of ARCO Investment Management Company (February 1991-April 2000); Member of the investment committees of The Rockefeller Foundation (2001-2006) and The University of Michigan (since 2000); Advisor at Credit Suisse First Boston’s Sprout venture capital unit (venture capital fund) (1994-January 2005); Trustee of MassMutual Institutional Funds (investment company) (1996-June 2004); Trustee of MML Series Investment Fund (investment company) (April 1989-June 2004); Member of the investment committee of Hartford Hospital (2000-2003); and Advisor to Unilever (Holland) pension fund (2000-2003). Oversees 47 portfolios in the OppenheimerFunds complex. Ms. Hamilton has served on the Boards of certain Oppenheimer funds since 2002, during which time she has become familiar with the Fund’s (and other Oppenheimer funds’) financial, accounting, regulatory and investment matters and has contributed to the Boards’ deliberations. |
| |
Victoria J. Herget, Trustee (since 2012) Year of Birth:1951 | | Board Chair (2008-2015) and Director (2004-Present), United Educators (insurance company); Trustee (since 2000) and Chair (since 2010), Newberry Library (independent research library); Trustee, Mather LifeWays (senior living organization) (since 2001); Independent Director of the First American Funds (mutual fund family) (2003-2011); former Managing Director (1993-2001), Principal (1985-1993), Vice President (1978-1985) and Assistant Vice President (1973-1978) of Zurich Scudder Investments (investment adviser) (and its predecessor firms); Trustee (1992-2007), Chair of the Board of Trustees (1999-2007), Investment Committee Chair (1994-1999) and Investment Committee member (2007-2010) of Wellesley College; Trustee, BoardSource (non-profit organization) (2006-2009) and Chicago City Day School (K-8 School) (1994-2005). Oversees 47 portfolios in the OppenheimerFunds complex. Ms. Herget has served on the Boards of certain Oppenheimer funds since 2012, during which time she has become familiar with the Fund’s (and other Oppenheimer funds’) financial, accounting, regulatory and investment matters and has contributed to the Boards’ deliberations. |
27 OPPENHEIMER INTERNATIONAL GROWTH FUND/VA
TRUSTEES AND OFFICERS Unaudited / Continued
| | |
F. William Marshall, Jr., Trustee (since 2000) Year of Birth: 1942 | | Trustee Emeritus of Worcester Polytech Institute (WPI) (private university) (since 2009); Trustee of MassMutual Select Funds (formerly MassMutual Institutional Funds) (investment company) (1996-2015), MML Series Investment Fund (investment company) (1996-2015) and Mass Mutual Premier Funds (investment company) (January 2012-December 2015); President and Treasurer of the SIS Fund (private charitable fund) (January 1999-March 2011); Former Trustee of WPI (1985-2008); Former Chairman of the Board (2004-2006) and Former Chairman of the Investment Committee of WPI (1994-2008); Chairman of SIS Family Bank, F.S.B. (formerly SIS Bank) (commercial bank) (January 1999-July 1999); Executive Vice President of Peoples Heritage Financial Group, Inc. (commercial bank) (January 1999-July 1999); and Former President and Chief Executive Officer of SIS Bancorp. (1993-1999). Oversees 47 portfolios in the OppenheimerFunds complex. Mr. Marshall has served on the Boards of certain Oppenheimer funds since 2000, during which time he has become familiar with the Fund’s (and other Oppenheimer funds’) financial, accounting, regulatory and investment matters and has contributed to the Boards’ deliberations. |
| |
Karen L. Stuckey, Trustee (since 2012) Year of Birth: 1953 | | Member (since May 2015) of Desert Mountain Community Foundation Advisory Board (non-profit organization); Partner (1990-2012) of PricewaterhouseCoopers LLP (professional services firm) (held various positions 1975-1990); Trustee (1992- 2006), member of Executive, Nominating and Audit Committees and Chair of Finance Committee (1992-2006), and Emeritus Trustee (since 2006) of Lehigh University; and member, Women’s Investment Management Forum (professional organization) since inception. Oversees 47 portfolios in the OppenheimerFunds complex. Ms. Stuckey has served on the Boards of certain Oppenheimer funds since 2012, during which time she has become familiar with the Fund’s (and other Oppenheimer funds’) financial, accounting, regulatory and investment matters and has contributed to the Boards’ deliberations. |
| |
James D. Vaughn, Trustee (since 2012) Year of Birth:1945 | | Retired; former managing partner (1994-2001) of Denver office of Deloitte & Touche LLP, (held various positions 1969- 1993); Trustee and Chairman of the Audit Committee of Schroder Funds (2003-2012); Board member and Chairman of Audit Committee of AMG National Trust Bank (since 2005); Trustee and Investment Committee member, University of South Dakota Foundation (since 1996); Board member, Audit Committee Member and past Board Chair, Junior Achievement (since 1993); former Board member, Mile High United Way, Boys and Girls Clubs, Boy Scouts, Colorado Business Committee for the Arts, Economic Club of Colorado and Metro Denver Network. Oversees 47 portfolios in the OppenheimerFunds complex. Mr. Vaughn has served on the Boards of certain Oppenheimer funds since 2012, during which time he has become familiar with the Fund’s (and other Oppenheimer funds’) financial, accounting, regulatory and investment matters and has contributed to the Boards’ deliberations. |
INTERESTED TRUSTEE AND OFFICER | | Mr. Steinmetz is an “Interested Trustee” because he is affiliated with the Manager and the Sub-Adviser by virtue of his positions as Chairman and director of the Sub-Adviser and officer and director of the Manager. Both as a Trustee and as an officer, Mr. Steinmetz serves for an indefinite term, or until his resignation, retirement, death or removal. Mr. Steinmetz’s address is 225 Liberty Street, New York, New York 10281-1008. |
| |
Arthur P. Steinmetz, Trustee (Since 2015), President and Principal Executive Officer (since 2014) Year of Birth: 1958 | | Chairman of OppenheimerFunds, Inc. (since January 2015); CEO and Chairman of OFI Global Asset Management, Inc. (since July 2014), President of OFI Global Asset Management, Inc. (since May 2013), a Director of OFI Global Asset Management, Inc. (since January 2013), Director of OppenheimerFunds, Inc. (since July 2014), President, Management Director and CEO of Oppenheimer Acquisition Corp. (OppenheimerFunds, Inc.‘s parent holding company) (since July 2014), and President and Director of OFI SteelPath, Inc. (since January 2013). Chief Investment Officer of the OppenheimerFunds advisory entities from (January 2013-December 2013); Executive Vice President of OFI Global Asset Management, Inc. (January 2013-May 2013); Chief Investment Officer of OppenheimerFunds, Inc. (October 2010-December 2012); Chief Investment Officer, Fixed- Income, of OppenheimerFunds, Inc. (April 2009-October 2010); Executive Vice President of OppenheimerFunds, Inc. (October 2009-December 2012); Director of Fixed Income of OppenheimerFunds, Inc. (January 2009-April 2009); and a Senior Vice President of OppenheimerFunds, Inc. (March 1993-September 2009). An officer of 103 portfolios in the OppenheimerFunds complex. |
OTHER OFFICERS OF THE FUND | | The addresses of the Officers in the chart below are as follows: for Messrs. Evans, Dunphy, Mss. Lo Bessette, Foxson and Picciotto, 225 Liberty Street, New York, New York 10281-1008, for Mr. Petersen, 6803 S. Tucson Way, Centennial, Colorado 80112-3924. Each Officer serves for an indefinite term or until his or her resignation, retirement, death or removal. |
| |
George R. Evans, Vice President (since 1999) Year of Birth: 1959 | | CIO Equities of the Sub-Adviser (since January 2013); Senior Vice President of the Sub-Adviser (since July 2004). Director of International Equities of the Sub-Adviser (since July 2004); Director of Equities of the Sub-Adviser (October 2010-December 2012); Vice President of HarbourView Asset Management Corporation (July 1994-November 2001) and Vice President of the Sub-Adviser (October 1993-July 2004). A portfolio manager and officer of other portfolios in the OppenheimerFunds complex. |
| |
Robert B. Dunphy, Vice President (since 2012) Year of Birth: 1979 | | Vice President of the Sub-Adviser (since January 2011); Senior Portfolio Manager (since May 2011); Senior Research Analyst and Assistant Vice President of the Sub-Adviser (May 2009-January 2011), and an Intermediate Research Analyst of the Sub- Adviser (January 2006-May 2009). A portfolio manager of other portfolios in the OppenheimerFunds complex |
| |
Cynthia Lo Bessette, Secretary and Chief Legal Officer (since 2016) Year of Birth: 1969 | | Executive Vice President, General Counsel and Secretary of the Manager (since February 2016); Chief Legal Officer of the Sub-Adviser and the Distributor (since February 2016); Vice President, General Counsel and Secretary of Oppenheimer Acquisition Corp. (since February 2016); General Counsel of OFI SteelPath, Inc., VTL Associates, LLC and Index Management Solutions, LLC (since February 2016); Chief Legal Officer of OFI Global Institutional, Inc., HarbourView Asset Management Corporation, OFI Global Trust Company, Oppenheimer Real Asset Management, Inc., OFI Private Investments Inc., Shareholder Services, Inc. and Trinity Investment Management Corporation (since February 2016); Senior Vice President and Deputy General Counsel (March 2015-February 2016) and Executive Vice President, Vice President, Corporate Counsel (February 2012-March 2015) and Deputy Chief Legal Officer (April 2013-March 2015) of Jennison Associates LLC; Assistant General Counsel (April 2008-September 2009) and Deputy General Counsel (October 2009-February 2012) of Lord Abbett & Co. LLC. An officer of 103 portfolios in the OppenheimerFunds complex. |
| |
Jennifer Foxson, Vice President and Chief Business Officer (since 2014) Year of Birth: 1969 | | Senior Vice President of OppenheimerFunds Distributor, Inc. (since June 2014); Vice President of OppenheimerFunds Distributor, Inc. (April 2006-June 2014); Vice President of the Sub-Adviser (January 1998-March 2006); Assistant Vice President of the Sub-Adviser (October 1991-December 1998). An officer of 103 portfolios in the OppenheimerFunds complex. |
28 OPPENHEIMER INTERNATIONAL GROWTH FUND/VA
| | |
| |
Mary Ann Picciotto, Chief Compliance Officer and Chief Anti-Money Laundering Officer (since 2014) Year of Birth: 1973 | | Senior Vice President and Chief Compliance Officer of the Manager (since March 2014); Chief Compliance Officer of the Sub- Adviser, OFI SteelPath, Inc., OFI Global Trust Company, OFI Global Institutional, Inc., Oppenheimer Real Asset Management, Inc., OFI Private Investments, Inc., Harborview Asset Management Corporation, Trinity Investment Management Corporation, and Shareholder Services, Inc. (since March 2014); Managing Director of Morgan Stanley Investment Management Inc. and certain of its various affiliated entities; Chief Compliance Officer of various Morgan Stanley Funds (May 2010-January 2014); Chief Compliance Officer of Morgan Stanley Investment Management Inc. (April 2007-January 2014). An officer of 103 portfolios in the OppenheimerFunds complex. |
| |
Brian S. Petersen, Treasurer and Principal Financial & Accounting Officer (since 2016) Year of Birth: 1970 | | Vice President of the Manager (since January 2013); Vice President of the Sub-Adviser (February 2007-December 2012); Assistant Vice President of the Sub-Adviser (August 2002-2007). An officer of 103 portfolios in the OppenheimerFunds complex. |
The Fund’s Statement of Additional Information contains additional information about the Fund’s Trustees and Officers and is available without charge, upon request, by calling 1.800.988.8287.
29 OPPENHEIMER INTERNATIONAL GROWTH FUND/VA
THIS PAGE INTENTIONALLY LEFT BLANK.
30 OPPENHEIMER INTERNATIONAL GROWTH FUND/VA
THIS PAGE INTENTIONALLY LEFT BLANK.
31 OPPENHEIMER INTERNATIONAL GROWTH FUND/VA
OPPENHEIMER INTERNATIONAL GROWTH FUND/VA
A Series of Oppenheimer Variable Account Funds
| | |
| Manager | | OFI Global Asset Management, Inc. |
| |
| Sub-Adviser | | OppenheimerFunds, Inc. |
| |
| Distributor | | OppenheimerFunds Distributor, Inc. |
| |
| Transfer and | | OFI Global Asset Management, Inc. |
Shareholder | | |
Servicing Agent | | |
| |
| Sub-Transfer Agent | | Shareholder Services, Inc. |
| | DBA OppenheimerFunds Services |
| |
| Independent | | KPMG LLP |
Registered | | |
Public | | |
Accounting | | |
Firm | | |
| |
| Legal Counsel | | Ropes & Gray LLP |
| |
| | Before investing in any of the Oppenheimer funds, investors should carefully consider a fund’s investment objectives, risks, charges and expenses. Fund prospectuses and summary prospectuses contain this and other information about the funds, and may be obtained by asking your financial advisor, or calling us at 1.800.988.8287. Read prospectuses and summary prospectuses carefully before investing. |
| |
| | © 2017 OppenheimerFunds, Inc. All rights reserved. Oppenheimer funds are distributed by OppenheimerFunds Distributor, Inc. |

Item 2. Code of Ethics.
The registrant has adopted a code of ethics that applies to the registrant’s principal executive officer, principal financial officer, principal accounting officer or controller or persons performing similar functions.
Item 3. Audit Committee Financial Expert.
The Board of Trustees of the registrant has determined that Karen L. Stuckey, the Chairwoman of the Board’s Audit Committee, is the audit committee financial expert and that Ms. Stuckey is “independent” for purposes of this Item 3.
Item 4. Principal Accountant Fees and Services.
The principal accountant for the audit of the registrant’s annual financial statements billed $473,600 in fiscal 2016 and $438,300 in fiscal 2015.
The principal accountant for the audit of the registrant’s annual financial statements billed $84,100 in fiscal 2016 and no such fees in fiscal 2015.
The principal accountant for the audit of the registrant’s annual financial statements billed $232,185 in fiscal 2016 and $467,159 in fiscal 2015 to the registrant’s investment adviser or any entity controlling, controlled by, or under common control with the adviser that provides ongoing services to the registrant.
Such services include: Internal control reviews, GIPS attestation procedures, system conversion testing, and additional audit services.
The principal accountant for the audit of the registrant’s annual financial statements billed $20,375 in fiscal 2016 and $28,745 in fiscal 2015.
The principal accountant for the audit of the registrant’s annual financial statements billed $645,284 in fiscal 2016 and $720,026 in fiscal 2015 to the registrant’s investment adviser or any entity controlling, controlled by, or under common control with the adviser that provides ongoing services to the registrant.
Such services include: tax compliance, tax planning and tax advice. Tax compliance generally involves preparation of original and amended tax returns, claims for a refund and tax payment-planning services. Tax planning and tax advice includes assistance with tax audits and appeals, tax advice related to mergers and acquisitions and requests for rulings or technical advice from taxing authorities.
The principal accountant for the audit of the registrant’s annual financial statements billed no such fees in fiscal 2016 and no such fees in fiscal 2015.
The principal accountant for the audit of the registrant’s annual financial statements billed no such fees in fiscal 2016 and no such fees in fiscal 2015 to the registrant’s investment adviser or any entity controlling, controlled by, or under common control with the adviser that provides ongoing services to the registrant.
Such fees would include the cost to the principal accountant of attending audit committee meetings and consultations regarding the registrant’s retirement plan with respect to its Trustees.
| (e) | (1) During its regularly scheduled periodic meetings, the registrant’s audit committee will pre-approve all audit, audit-related, tax and other services to be provided by the principal accountants of the registrant. |
| | The audit committee has delegated pre-approval authority to its Chairman for any subsequent new engagements that arise between regularly scheduled meeting dates provided that any fees such pre-approved are presented to the audit committee at its next regularly scheduled meeting. |
| | Under applicable laws, pre-approval of non-audit services may be waived provided that: 1) the aggregate amount of all such services provided constitutes no more than five percent of the total amount of fees paid by the registrant to its principal accountant during the fiscal year in which services are provided 2) such services were not recognized by the registrant at the time of engagement as non-audit services and 3) such services are promptly brought to the attention of the audit committee of the registrant and approved prior to the completion of the audit. |
| (f) | Not applicable as less than 50%. |
| (g) | The principal accountant for the audit of the registrant’s annual financial statements billed $981,944 in fiscal 2016 and $1,215,930 in fiscal 2015 to the registrant and the registrant’s investment adviser or any entity controlling, controlled by, or under common control with the adviser that provides ongoing services to the registrant related to non-audit fees. Those billings did not include any prohibited non-audit services as defined by the Securities Exchange Act of 1934. |
| (h) | The registrant’s audit committee of the board of Trustees has considered whether the provision of non-audit services that were rendered to the registrant’s investment adviser, and any entity controlling, controlled by, or under common control with the investment adviser that provides ongoing services to the registrant that were not pre-approved pursuant to paragraph (c)(7)(ii) of Rule 2-01 of Regulation S-X is compatible with maintaining the principal accountant’s independence. No such services were rendered. |
Item 5. Audit Committee of Listed Registrants
Not applicable.
Item 6. Schedule of Investments.
a) Not applicable. The complete schedule of investments is included in Item 1 of this Form N-CSR.
b) Not applicable.
Item 7. Disclosure of Proxy Voting Policies and Procedures for Closed-End Management Investment Companies.
Not applicable.
Item 8. Portfolio Managers of Closed-End Management Investment Companies.
Not applicable.
Item 9. Purchases of Equity Securities by Closed-End Management Investment Company and Affiliated Purchasers.
Not applicable.
Item 10. Submission of Matters to a Vote of Security Holders.
The Fund’s Governance Committee Provisions with Respect to Nominations of Directors/Trustees to the Respective Boards
None
Item 11. Controls and Procedures.
Based on their evaluation of the registrant’s disclosure controls and procedures (as defined in rule 30a-3(c) under the Investment Company Act of 1940 (17 CFR 270.30a-3(c)) as of 12/31/2016, the registrant’s principal executive officer and principal financial officer found the registrant’s disclosure controls and procedures to provide reasonable assurances that information required to be disclosed by the registrant in the reports that it files under the Securities Exchange Act of 1934 (a) is accumulated and communicated to registrant’s management, including its principal executive officer and principal financial officer, to allow timely decisions regarding required disclosure, and (b) is recorded, processed, summarized and reported, within the time periods specified in the rules and forms adopted by the U.S. Securities and Exchange Commission.
There have been no changes in the registrant’s internal controls over financial reporting that occurred during the registrant’s second fiscal quarter of the period covered by this report that have materially affected, or are reasonably likely to materially affect, the registrant’s internal control over financial reporting.
Item 12. Exhibits.
| (a) | (1) Exhibit attached hereto. |
| | (2) Exhibits attached hereto. |
| (b) | Exhibit attached hereto. |
SIGNATURES
Pursuant to the requirements of the Securities Exchange Act of 1934 and the Investment Company Act of 1940, the registrant has duly caused this report to be signed on its behalf by the undersigned, thereunto duly authorized.
| | |
| Oppenheimer Variable Account Funds |
| |
| By: | | /s/ Arthur P. Steinmetz |
| | Arthur P. Steinmetz |
| | Principal Executive Officer |
| Date: | | 2/17/2017 |
Pursuant to the requirements of the Securities Exchange Act of 1934 and the Investment Company Act of 1940, this report has been signed below by the following persons on behalf of the registrant and in the capacities and on the dates indicated.
| | |
| By: | | /s/ Arthur P. Steinmetz |
| | Arthur P. Steinmetz |
| | Principal Executive Officer |
| Date: | | 2/17/2017 |
| |
| By: | | /s/ Brian S. Petersen |
| | Brian S. Petersen |
| | Principal Financial Officer |
| Date: | | 2/17/2017 |